Non-nutritional factors affecting lactation persistency in dairy ewes: a review

AT-1 BLOCKADE DURING LACTATION AS A MODEL OF CHRONIC
NEPHROPATHY: MECHANISMS OF RENAL INJURY
Flavia Gomes Machado, Elizabete Pereira Barros Poppi, Camilla Fanelli, Denise
Maria Avancini Costa Malheiros, Roberto Zatz and Clarice Kazue Fujihara
Laboratory of Renal Pathophysiology (LIM-16), Renal Division, Department of
Clinical Medicine, Faculty of Medicine, University of São Paulo, São Paulo, Brazil.
Mailing address:Roberto Zatz, MD, Ph.D.Laboratório de Fisiopatologia RenalAv. Dr. Arnaldo, 455, 3-s/334201246-903 São Paulo SPBrazilTel No. 55-11-3068-9428Fax. No. 55-11-3083-1693E-mail address: [email protected]
Running head: Neonatal losartan as a model of chronic kidney disease
Page 1 of 40Articles in PresS. Am J Physiol Renal Physiol (April 9, 2008). doi:10.1152/ajprenal.00020.2008
Copyright © 2008 by the American Physiological Society.

ABSTRACT
Suppression of the renin-angiotensin system during lactation causes
irreversible renal structural changes. In this study we investigated 1) the time
course and the mechanisms underlying the chronic kidney disease caused by
administration of the AT1 receptor blocker, losartan, during lactation, and 2)
whether this untoward effect can be used to engender a new model of chronic
kidney disease. Male Munich-Wistar pups were divided into two Groups: C, whose
mothers were untreated; and LLact, whose mothers received oral Losartan, 250
mg/kg/day, during the first 20 days after delivery. At 3 months of life, both nephron
number and the GFR were reduced in LLact rats, whereas glomerular pressure was
elevated. Unselective proteinuria and decreased expression of the ZO-1 protein
were also observed, along with modest glomerulosclerosis, significant interstitial
expansion and inflammation, and wide glomerular volume variation, with a stable
subpopulation of exceedingly small glomeruli. In addition, the urine osmolality was
persistently lower in LLact rats. At 10 months of age, LLact rats exhibited systemic
hypertension, heavy albuminuria, substantial glomerulosclerosis, severe renal
interstitial expansion and inflammation, and creatinine retention. Conclusions: 1)
Oral losartan during lactation can be used as a simple and easily reproducible
model of chronic kidney disease in adult life, associated with low mortality and no
arterial hypertension until advanced stages; 2) The mechanisms involved in the
progression of renal injury in this model include glomerular hypertension,
glomerular hypertrophy, podocyte injury and interstitial inflammation.
Keywords: Chronic kidney disease; nephrogenesis; angiotensin II
Page 2 of 40

1
INTRODUCTION
Stimulation of AT-1 receptors (AT-1R) by angiotensin II (AII) has long been
known to exert diverse important biological effects in adult mammals. Depending
on which intracellular downstream system is activated, AII binding to AT-1R can
promote renal and systemic vasoconstriction, blood pressure elevation and sodium
conservation, on one hand, or enhance the immune response and inflammatory
events, favoring the development of chronic kidney disease, on the other (21;28).
Accordingly, suppression of the renin-angiotensin system (RAS) with ACE
inhibitors and/or AT-1R blockers has become a mainstay of treatment of chronic
progressive nephropathies.
More recently, it has been shown that, beside its hemodynamic and
proinflammatory effects, AII and AT-1R play an important role in the final phases of
nephrogenesis, participating both in the process of nephron maturation and in the
formation of the ureters (11). In rodents, nephrogenesis is completed in the first
two weeks after birth (32). During this period, ACE activity, AII concentration and
the density of AT1-R are all increased in the renal tissue (8). Accordingly, several
research groups have shown that suppression of the RAS at this phase causes
irreversible renal structural and functional changes in adult life, affecting the
maturation of nephrons and renal vessels and leading to a substantial reduction in
the nephron number (8;32;35).
The aim of the present study was to investigate 1) the time course, the long
term outcome and the pathogenesis of the chronic kidney disease that develops in
Page 3 of 40

2
rats given AT-1R blockers during the final phase of nephrogenesis; 2) the
possibility that such treatment be employed to construct an experimental model of
chronic kidney disease, that could mimic more closely than current models the
development and outcome of the corresponding human disease.
MATERIALS AND METHODS
Experimental groups
21 adult female Munich-Wistar rats, 10-12 weeks of age and weighing 160
to 200g, obtained from a local facility at University of São Paulo, were housed in
individual plastic boxes after mating, fed regular rodent chow containing 0.5 Na
and 22% protein (Nuvital Labs, Curitiba, Brazil), and given tap water. Rats were
maintained at 23±1 °C and 60±5% relative air humidity, under an artificial 12-12
hour light/dark cycle. After delivery, 6 pups were kept with each dam until weaning.
During the first 20 days of lactation, the dams received the AT-1R antagonist,
Losartan, 250 mg/kg/day dissolved in the drinking water. In preliminary
experiments, this was found to be the highest dose not causing death or severe
growth stunting of the pups. After being weaned on Day 25 after birth, the male
offspring were housed in cages in groups of no more than four and given
unrestrained access to food and water. Only male pups were utilized in this study,
since a marked gender difference exists regarding the effect of angiotensin II
receptor blockers and angiotensin converting enzyme inhibitors, females being
Page 4 of 40

3
much less susceptible (17). Thirty-three male offspring from Losartan-treated dams
(Group LLact) and thirty-three age-matched control rats never exposed to Losartan
(Group C) were utilized in these studies. To avoid biasing, no group received more
than 2 pups from the same litter. In this manner, groups were homogeneous
regarding the origin of the animals. All experimental procedures were approved by
the local Research Ethics Committee (CAPPesq, process nº 0166/07), and
developed in strict conformity with our institutional guidelines and with international
standards for manipulation and care of laboratory animals.
Functional studies
At 3 months of age, 5 C and 5 LLact were anesthetized with Inactin, 100
mg/Kg ip, and prepared for renal functional studies, as described earlier (3), to
measure mean arterial pressure (MAP), glomerular filtration rate (GFR), renal
plasma flow (RPF), and renal vascular resistance (RVR) using conventional
clearance techniques (3). The glomerular hydraulic pressure (PGC) was determined
by performing direct micropuncture measurements on superficial glomeruli (3).
Glomerular counting
At 3 months of age, 5 rats from each group were anesthetized with i.p.
ketamine (50 mg/kg) and xylazine (10 mg/kg) and the kidneys were rapidly
perfused retrogradely through the abdominal aorta with a 20% India ink solution as
described previously (5). Thereafter, the right kidney was gently decapsulated,
sliced and kept in a 50% hydrochloric acid solution at 37oC for 1 hour, then in
saline solution at 4oC overnight. After the material was ressuspended in 15 mL of
Page 5 of 40

4
saline, a 1-mL aliquot was examined under a stereomicroscope at 50×
magnification for glomerular counting. Counting was performed independently by
two observers (FGM and CF). The glomerular count attributed to each rat was the
average of the two countings thus obtained. The procedure was repeated if a
discrepancy of more than 10% between the two observers occurred.
Renal morphology: short term studies
Ten rats from each group were anesthetized with ketamine, 50 mg/kg, and a
300-µL blood sample was collected from the abdominal aorta for measurement of
the circulating concentrations of creatinine (SCreat), sodium (PNa) and potassium
(PK). The kidneys were then retrogradely perfusion-fixed through the abdominal
aorta with Dubosq-Brazil solution after a brief washout with saline to remove blood
from the renal microcirculation. After weighing, two midcoronal renal slices were
postfixed in buffered 4% formaldehyde, then embedded in paraffin using
conventional sequential techniques, and 4-µm-thick sections were examined for
assessment of glomerular size, the extent of glomerular injury and the fractional
interstitial area, as well as for immunohistochemical detection of macrophages, AII
positive cells and glomerular zonula occludens-1 (ZO-1) protein.
Renal morphology and time course of renal disease: long term studies
Thirteen rats from each group were followed from 3 to 10 months of age
with determination of tail-cuff pressure (TCP) and 24-h urine albumin excretion rate
(UalbV) at 3, 6 and 10 months of age. TCP was assessed using a commercially
Page 6 of 40

5
available (Visitech Systems, Apex, NC) automated method (13), under light
restraining and after light warming. To avoid any interference of stress, all rats
were preconditioned to the procedure, and were invariably calm at the time of TCP
determination. In addition, TCP values were always taken as the average of at
least three consecutive measurements that varied by no more than 2 mmHg, that
is, after stabilization of blood pressure.
At the end of the study period, rats were anesthetized and blood and renal
tissue were obtained and processed as described for the short-term experiments
Histomorphometric analysis
All morphometric evaluations were performed in 4-µm-thick sections by a
single observer (DMACM) blinded to the groups. For each rat, the extent of
glomerular injury (GS) was estimated, in sections stained by the periodic acid-
Schiff (PAS) reaction, by attributing to each glomerulus a score corresponding to
the sclerosed fraction of the tuft area, and deriving a glomerulosclerosis index
(GSI) for each rat as described previously (3). At least 120 glomeruli were
examined per rat. The percentage of the renal cortical area occupied by interstitial
tissue (%INT), used as a measure of the degree of interstitial expansion, was
estimated in Masson-stained sections by a point counting technique (12).
Mean glomerular random cross sectional area (AG) was determined by
averaging individual values for 50 consecutive glomerular tuft profiles in a section
from the left kidney of each rat by counting points falling within the tuft profiles.
Glomeruli were examined at 200× under a 144-point grid, covering a 64,900-µm2
Page 7 of 40

6
area. The average glomerular tuft volume (VG) for each rat was then calculated as
VG = 1.25 (AG)3/2 (10).
Immunohistochemical analysis
Immunohistochemistry was performed on 4-µm-thick sections, mounted on
glass slides coated with 2% silane. Sections were deparaffinized and rehydrated
by conventional techniques, then heated in citrate buffer for antigen retrieval.
Incubation with the primary antibody was carried out overnight at 4oC, and omitted
in the negative control experiments.
For ED-1 detection, sections were preincubated with 5% normal rabbit
serum to prevent nonspecific binding, then incubated overnight at 4oC with a
monoclonal mouse anti-rat ED-1 antibody (Serotec, Oxford, United Kingdom)
diluted in bovine serum albumin (BSA) at 0.5%. After being rinsed with Tris-
buffered saline (TBS), sections were incubated with a 2% solution of rabbit anti-
mouse immunoglobulin (Dako, Glostrup, Denmark) in BSA, then with an alkaline
phosphatase anti-alkaline phosphatase (APAAP) complex (Dako, Glostrup,
Denmark). Sections were then developed with a fast-red dye solution (Sigma-
Aldrich, Saint Louis, MO), counterstained with Mayer’s hemalaum, and covered
with a glycerin-gelatin mixture.
To detect cells staining positively for AII, an indirect streptavidin-biotin
alkaline phosphatase (SBAP) technique was employed. Sections were
preincubated with avidin and biotin solutions (Biotin Blocking System, Dako, CA) to
block nonspecific binding of these compounds, and with horse serum diluted at 2%
Page 8 of 40

7
in a 2% solution of nonfat milk in TBS to avoid nonspecific protein binding.
Sections were then incubated overnight at 4oC with a polyclonal rabbit anti-human
AII antibody (Peninsula Lab., San Carlos, CA) diluted at 0.25% in BSA. Thereafter,
sections were incubated during 45 minutes at room temperature with biotinylated
anti-rabbit IgG (Vector Labs, Burlingame, CA) diluted at 0.1% in BSA, then with a
SBAP complex (Dako, Glostrup, Denmark) for an additional 30 minutes, and finally
developed, counterstained and mounted as described above.
The ZO-1 molecule was detected using a rabbit polyclonal antibody (Zymed
Laboratories, San Francisco, CA) and a commercially available kit (Novocastra
Labs, UK). Sections were otherwise processed as described above.
The extent of renal infiltration by macrophages or AII-positive cells (in
cells/mm2) was evaluated in a blinded manner at ×200 magnification. For each
section, 25 microscopic fields (corresponding to a total area of 1.6 mm2) were
examined. To estimate the intensity of the glomerular expression of ZO-1, the
fraction of the tuft area staining positively for this molecule was determined by an
adapted point-counting technique (12) in 50 consecutive glomerular profiles,
examined at 200× under a 144-point graticulate.
Analytical techniques
UalbV was determined by radial immunodiffusion (18). Screat, PNa, PK and
urine osmolality (Uosm) were assessed by conventional laboratory techniques.
Fractionation of urinary proteins was performed by SDS-PAGE electrophoresis,
utilizing an adaptation of the discontinuous system described by Laemmli (15). A
selectivity index (SI) was calculated as the ratio of the 180 kD to the 68 kD band.
Page 9 of 40

8
Statistical analysis
Statistical differences were assessed by two-way ANOVA, with treatment
and time as intervening factors and with pairwise posttest comparisons according
to the Bonferroni method (34). Student’s unpaired t test was used in the functional
studies and in nephron number analysis, which involved only simple comparisons
between Groups LLact and C. Since Screat, UalbV, GSI and the density of interstitial
AII-positive cells exhibited non-Gaussian distributions, the corresponding data
were subjected to log transformation prior to statistical analysis. To assess
deviations from Gaussian distribution of AG, the Kolmogorov-Smirnov test was
performed using GraphPad Prism version 4.00 for Windows, GraphPad Software,
San Diego CA, www.graphpad.com. Results are expressed as Mean ± SE.
RESULTS
Functional studies
Functional parameters measured at 3 months of age are shown in Table 1.
No difference in BW was observed between groups. In agreement with earlier
reports (35), the number of nephrons was reduced by nearly 33% in Group LLact
compared to C (p<0.05). MAP was similar between LLact and C. However, GFR and
RPF were reduced by nearly 1/3 in Group LLact, whereas RVR was increased by
46%. Although LLact rats were normotensive, PGC was 10 mmHg above control in
this group (p<0.05).
Page 10 of 40

9
Long term studies
Renal and functional parameters obtained at 3 and 10 months of age are
represented in Table 2. BW was similar between C and LLact at 3 months, and also
at 10 months of age. Left kidney weight (LKW) did not differ between groups, but
increased with time in C. No differences between groups or effect of time were
observed regarding PNa or PK. Screat was similar between groups at 3 months of
age, but rose significantly at 10 months in Group LLact only. No statistically
significant difference was observed regarding urine flow at 3 months of age. Urine
flow was markedly elevated in LLact rats at 10 months of age, attaining a mean
value over twice as high as in age-matched controls (p<0.05). Accordingly, urine
osmolality was 30% lower in LLact than in control at 3 months, and reduced by more
than 50% compared to control at 10 months of age (p<0.05 for both differences).
The time course of tail-cuff pressure is described in Fig. 1A. As in the
functional studies, LLact rats were normotensive at 3 months of age. TCP remained
at normal levels at 6 months of age. However, TCP rose by almost 40 mmHg in
Group LLact at 10 months of age, while little variation was observed in controls
(P<0.05 LLact vs. C). Fig. 1B depicts the time course of urine albumin excretion rate.
Albuminuria was always higher in Group LLact, and exhibited a clearly progressive
nature, reaching values ninefold higher than control at 10 months of age.
Data on the integrity of the glomerular barrier are given in Fig. 2. The SI was
markedly increased in LLact at 3 months of age, denoting loss of the ability of the
glomerular barrier to retain high-molecular-weight proteins. This difference
persisted at 10 months of age, although the difference between values for 3 and 10
months of age in LLact did not reach statistical significance. The quantitative
Page 11 of 40

10
immunohistochemical expression of the ZO-1 molecule was lower than control in
Group LLact at 3 months. This difference persisted at 10 months, with a further
decrease of this parameter in Group LLact, while the control value remained stable.
As described previously (7), rats in Group LLact exhibited variable degrees of
papillary atrophy under macroscopic examination. The analysis of renal structural
injury and inflammation is detailed in Figs. 3 and 4. Glomerular segmental sclerotic
lesions, which were infrequent in LLact rats at 3 months of age, were abundant at 10
months of age (Figs. 3A and 4A). Expansion and inflammation of the interstitial
tissue were already observed at 3 months in LLact rats, and were drastically
increased at 10 months of age (Figs 3B and 4B). Infiltration of the renal interstitium
by macrophages (Figs. 3C and 4C) and by cells staining positively for AII (Figs. 3D
and 4D) followed a similar pattern, with intensity roughly proportional to that of
interstitial expansion.
A statistical analysis of the glomerular dimensions is shown in Fig. 5. At 3
months of age, glomerular areas followed a pattern not significantly different from a
Gaussian distribution in normal controls (Figs. 5A and 5B), the calculated
glomerular volume averaging 0.90±0.03 x 10⁶ um3. In Group LLact, a large number
of unusually small glomerular profiles were observed. The appearance of these
glomeruli was inconspicuous (Fig. 5A), whereas in several of them the hilum was
clearly visible (inset in Fig. 5A), ruling out the possibility that these profiles
represented solely glomeruli sectioned close to a pole. The presence of these
small glomeruli skewed the frequency distribution of glomerular areas to the left,
promoting a significant deviation from normality. Accordingly, the percentage of
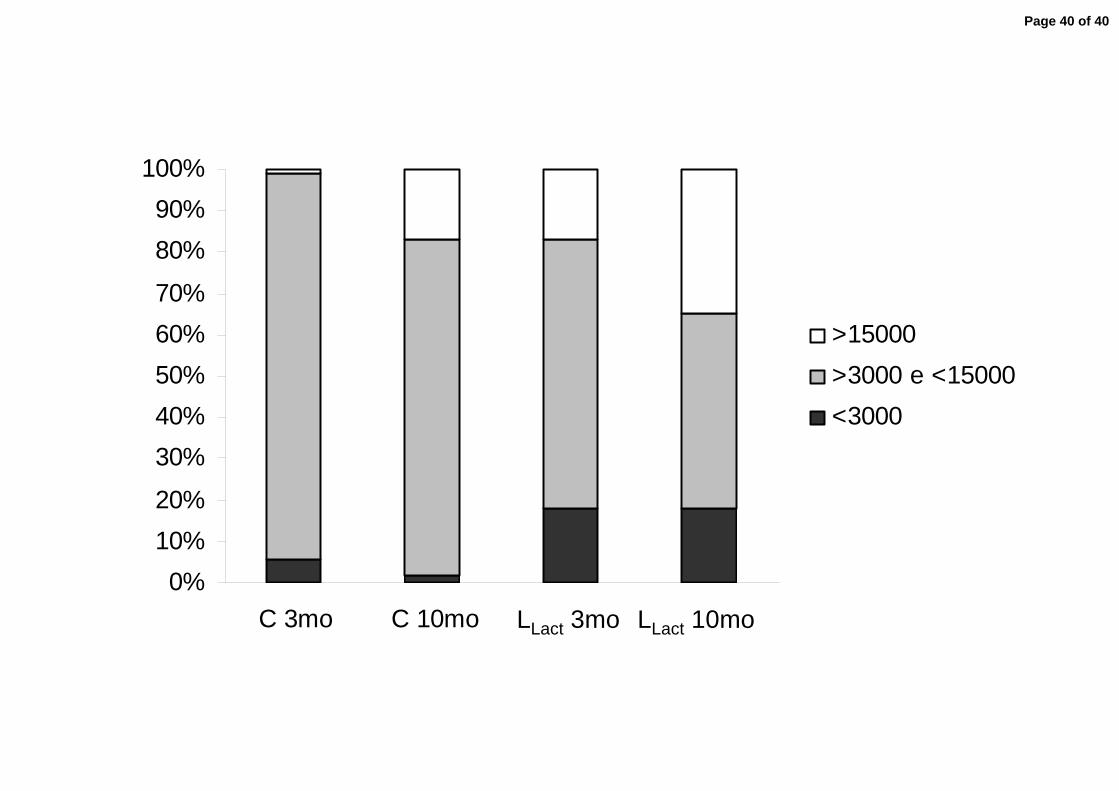
profiles with areas under 3,000 µm2 was 18±3% in Group LLact rats, compared to
Page 12 of 40

11
only 6±1% in control (p<0.05). The mean glomerular volume in Group LLact at 3
months of age was 1.18±0.06×106 µm3, (p<0.05 vs. control). When the profiles with
areas under 3,000 µm2 were excluded from the calculation, the average glomerular
volume for Group LLact was even higher (1.50±0.08×106 µm3), further underlining
the occurrence of glomerular compensatory growth in Group LLact. In agreement
with this concept, the fraction of glomerular profiles with areas exceeding 15,000
µm2 was 17±3% in Group LLact, compared with only 1±1% in controls (p<0.05). At
10 months of age, the distribution of glomerular areas in normal controls was
skewed to the right, indicating that a substantial number of glomeruli underwent
hypertrophy. Indeed, the mean glomerular volume (excluding the profiles
measuring less than 3,000 µm2) was increased at this time in C (1.56±0.05×10⁶
µm3) compared to the value obtained at 3 months of age (p<0.05), whereas the
percentage of glomerular profiles with areas greater than 15,000 µm2 was 15±2
(p<0.05 vs. the corresponding 3-month value). In Group LLact, the distribution of
areas was also shifted to the right, whereas the mean glomerular volume (again
excluding profiles with areas below 3,000 µm2) was 2.03±0.08×106 µm3 (p<0.05 vs.
10-month C and 3-month LLact) and the proportion of profiles larger than 15,000
µm2 was 35±2 % (p<0.05 vs. 10-month C and 3-month LLact), indicating additional
glomerular hypertrophy in these rats. The percentage of small glomeruli (profile
area < 3,000 µm2) remained constant with time in Group LLact (18±2%, p>0.05 vs.
the 3-month value), suggesting that this population of hypotrophic glomeruli is
relatively stable.
Page 13 of 40

12
DISCUSSION
As described previously, blockade of the AT-1R during lactation resulted in a
30% reduction in the number of nephrons, confirming previous reports (29;32;35),
although some discordant findings have been described (19), and corroborating
the concept that the presence of AII is essential for adequate nephron maturation
(8;32). The molecular mediators and the cellular signaling pathways that may be
responsible for this salutary action of AII on nephrogenesis are presently unclear,
although evidence has been reported that activation of insulin-like growth factor
(IGF) and of its receptor may play a crucial role (24).
Confirming previous reports (2;7;9;32;35), LLact rats developed severe and
progressive renal functional and structural changes, that were nevertheless
associated with zero mortality, making it possible to follow these rats until very
advanced stages. This behavior was remarkably homogeneous: at 3 months of
age all rats in Group LLact were diseased, and low coefficients of variation were
observed for parameters such as albuminuria and tail-cuff pressure It must be
emphasized that in the present study the teratogenic effect of losartan was
obtained by offering the drug to the dams in the drinking water, taking advantage of
the fact that losartan crosses easily the blood-milk barrier (31). It was thus possible
to obviate the need for individual intraperitoneal injections, utilized in many
previous studies.
At 3 months of age, GFR was diminished by 30% in rats that received
losartan during lactation, compared to controls. This finding is in agreement with
Page 14 of 40

13
most previous reports (7;8;29;35), despite a few discordant observations (17).
Since the reduction in GFR and in RPF was proportional to the reduction in the
number of nephrons, it is tempting to conclude that no compensatory
hyperperfusion or hyperfiltration, such as observed in rats with uninephrectomy or
5/6 renal ablation (3;33), occurs in this model. However, it must be noted that a
substantial fraction of glomeruli in LLact rats was found to be hypotrophic, a
proportion likely underestimated since, unlike normal glomeruli, hypotrophic
glomeruli are easily overlooked if sectioned close to one of the poles. Since these
hypotrophic glomeruli, which probably result from nephron malformation, are
expected to contribute little to the overall GFR and may even have lost their
connection with the respective tubules (4), some compensatory hyperfiltration must
have occurred in the remaining nephrons. On the other hand, the finding that a
substantial number of glomeruli in LLact rats exhibited mean cross-sectional areas
in excess of 15,000 µm2 (the frequency of such glomeruli was negligible in
controls) indicates that compensatory glomerular hypertrophy also occurred in
these animals.
The intimate mechanisms underlying the compensatory increase in single
nephron GFR in LLact rats are not entirely clear. Part of the compensatory response
likely involved an elevation of PGC, at least at 3 months of age (unfortunately, the
severe deformation of the renal surface due to interstitial expansion/inflammation
precluded the determination of PGC by micropuncture at 10 months of age). Since
systemic hypertension was absent in these rats at the time the functional studies
were performed, glomerular hypertension, at least at this phase, must have
Page 15 of 40

14
resulted from afferent arteriolar dilatation and/or efferent arteriolar vasoconstriction.
It is unclear whether this arteriolar dysfunction is merely part of a compensatory
response or whether arteriolar malfunctioning in adult life constitutes another ill
effect of losartan administration during nephrogenesis. It should be noted that the
number of litters (21) and the number of functional observations (5 per group) were
both relatively small and, although differences between groups were almost
invariably statistically significant, the present functional measurements inevitably
carry some degree of uncertainty. Thus, the results of the present functional
studies should be interpreted with caution, and definitive conclusions in this regard
will have to await confirmation by future studies.
LLact rats developed several aspects of chronic glomerular structural and
functional injury. Albuminuria was already evident at 3 months of age and exhibited
a clearly progressive nature, reaching levels one order of magnitude higher than in
controls at 10 months of age. Albuminuria was associated with limitation of the
size-selective properties of the glomerular walls, as assessed by the increase in a
selectivity index, already observed at 3 months of age. However, since the
selectivity index was not further increased at 10 months of age, the aggravation of
albuminuria observed at this time must have resulted from factors in addition to a
size defect, such as rarefaction of the negative surface charge of the glomerular
walls. The reduced expression of the ZO-1 molecule suggests that podocyte injury
may explain at least in part the development of albuminuria in LLact rats. Since
podocytes are responsible for the synthesis of part of the negatively charged
molecules that contribute to limit the passage of polyanions through the glomerular
Page 16 of 40

15
walls, podocyte damage can explain the development of proteinuria by a combined
defect in the size- and charge-selective properties of the glomerular wall.
Although albuminuria was already present at 3 months of age, glomerular
injury at this time was only mild, though significant, in LLact rats compared to
controls. Glomerulosclerosis was much more pronounced at 10 months of age, the
GSI reaching levels over fiftyfold higher, whereas serum creatinine was
significantly elevated, compared to age-matched controls. Although the exact
mechanisms leading to the development of glomerular injury in this model are not
entirely clear, an obvious possibility is that the maladaptive glomerular
hypertension and hypertrophy represented important pathogenic factors.
Glomerular hypertension and/or hypertrophy have been postulated to initiate and
maintain progressive glomerular injury in several experimental models (22;36) by
promoting mechanical stretch to the glomerular walls according to La Place’s law
(26) and, as a consequence, podocyte injury with formation of synechiae with
Bowman’s capsule (20;30), mesangial expansion (25) and infiltration by
inflammatory cells (27). This process tends to acquire a progressive nature as a
growing number of glomeruli drop out due to severe sclerosis, and additional
burden is imposed to the remaining nephrons. Absence of early renal
hemodynamic changes may be one of the reasons why female rats fail to develop
progressive nephropathy after neonatal exposure to angiotensin II receptor
blockers or angiotensin converting enzyme inhibitors (17)
Progressive increase of the fractional cortical interstitial area was, along with
glomerular injury, a prominent feature of the nephropathy that developed in the
LLact group. Interstitial expansion was associated with clear signs of chronic
Page 17 of 40

16
inflammation, such as interstitial fibrosis and infiltration by mononuclear cells, a
large fraction of which were macrophages. Curiously, many of these inflammatory
cells stained positively for AII, suggesting that, although its presence during
nephrogenesis is essential for adequate nephron maturation, AII exerts in this
model a similar proinflammatory role as in other experimental models of
progressive nephropathy (6). The pathogenesis of interstitial
expansion/inflammation in this model is unclear. Interstitial injury could be a direct
consequence of glomerular injury due to propagation of tuft inflammation through
synechiae with Bowman’s capsule and direct passage of circulating inflammatory
mediators to the periglomerular interstitium (14). In addition, the exaggerated
filtration of proteins due to impairment of the glomerular barrier might induce the
synthesis of cytokines, chemokines and growth factors by proximal tubular cells in
association with augmented protein endocytosis (1). However, interstitial
expansion and inflammation were already evident in LLact rats at 3 months of age,
when albuminuria and glomerular injury were still mild. Therefore, the development
of marked interstitial injury in LLact rats cannot have resulted exclusively from
glomerular injury, and must have been influenced by other factors. One speculative
explanation could be that the tubular cells associated with hypotrophic glomeruli
might, as postulated for other experimental models, undergo epithelial-
mesenchymal transformation and originate myofibroblasts, which are known to
actively synthesize components of the interstitial matrix (23).
In addition to the severe structural changes observed at the glomeruli and
the interstitium, which led to GFR reduction and creatinine retention, LLact rats
exhibited evidence of tubular dysfunction. At 3 months of age, when albuminuria,
Page 18 of 40

17
interstitial expansion and glomerulosclerosis were still mild, urine osmolality was
nearly 25% lower than in controls, while urine flow was correspondingly increased.
This abnormality was aggravated at 10 months of age, when urine flow more than
doubled, and urine osmolality was reduced to less than 50%, compared with age-
matched controls. These findings, which corroborate previous reports (9), suggest
that the concentrating ability of LLact rats is impaired in disproportion to renal
structural injury. The reasons for this abnormality are unclear. One possible
explanation is that the delicate operation of the countercurrent mechanism is
exquisitely dependent on the complex anatomical arrangement of tubular and
vascular structures at the renal medulla, and might be disrupted by papillary
atrophy or even by mild expansion of the renal interstitium (9). The renal
concentrating ability could be further compromised by depletion of aquaporin 2,
which has been described in rats treated with an ACE inhibitor during lactation (9).
Depletion of the Na-K-2Cl cotransporter at the thick ascending limb of Henle has
also been described in these rats (16), and might lead to a salt-losing state, with
polyuria and diminished concentrating ability.
It is noteworthy that, even in the presence of a chronic, progressive
nephropathy, with substantial reduction of the nephron number and of the GFR,
systemic hypertension did not develop in LLact rats until after 6 months of life, when
renal injury had already attained an advanced state. The reasons for this
unexpected finding are not immediately apparent. However, it must be noted that,
as discussed earlier, tubular function may be impaired in these rats, which may be
prone to salt loss (7). Such abnormality would compensate for the inevitable trend
toward salt retention imposed by the development of chronic kidney injury, and
Page 19 of 40

18
prevent blood pressure elevation until nephron loss and interstitial inflammation
were severely aggravated by progression of the disease.
In view of the characteristics and the time course of the ensuing
nephropathy, administration of losartan during lactation constitutes a suitable
model of chronic progressive nephropathy, easily reproducible and requiring no
surgery or special preparation. An additional advantage of this model is its low
mortality, likely associated with the absence of hypertension during its initial
stages, allowing the progression of the nephropathy at a relatively slow rate and,
consequently, the development of progressive renal insufficiency and of the
adaptations and maladaptations that characterize human chronic nephropathies.
Page 20 of 40

19
ACKNOWLEDGMENTS
Preliminary results of this study were presented at the American Society of
Nephrology Meeting, San Diego, CA, November 14-19, 2006, and published in
abstract form (J. Am. Soc. Nephrol. 17: 655A, 2006). We thank Bianca Helena
Fernandes, Claudia Ramos Sena and Luciana Faria de Carvalho for expert
technical assistance.
Supported by grant 05/56066-3 from the State of São Paulo Foundation for
Research Support (FAPESP). CKF and RZ are recipients of Research Awards
(Nos. 304039/2006-3 and 326.429/81, respectively) from the Brazilian Council of
Scientific and Technologic Development (CNPq).
Page 21 of 40

20
REFERENCES
1. Abbate, M., Zoja C., and Remuzzi G. How does proteinuria cause
progressive renal damage? J Am Soc Nephrol 17: 2974-2984, 2006.
2. Friberg, P., Sundelin B., Bohman S. O., Bobik A., Nilsson H., Wickman A.,
Gustafsson H., Petersen J., and Adams M. A. Renin-angiotensin system in
neonatal rats: induction of a renal abnormality in response to ACE inhibition
or angiotensin II antagonism. Kidney Int 45: 485-492, 1994.
3. Fujihara, C. K., Malheiros D. M. A. C., Zatz R., and Noronha I. L.
Mycophenolate mofetil attenuates renal injury in the rat remnant kidney.
Kidney Int 54: 1510-1519, 1998.
4. Gandhi, M., Olson J. L., and Meyer T. W. Contribution of tubular injury to
loss of remnant kidney function. Kidney Int 54: 1157-1165, 1998.
5. Gilbert, J. S., Lang A. L., Grant A. R., and Nijland M. J. Maternal nutrient
restriction in sheep: hypertension and decreased nephron number in
offspring at 9 months of age. J Physiol 565: 137-147, 2005.
6. Goncalves, A. R., Fujihara C. K., Mattar A. L., Malheiros D. M. A. C.,
Noronha I. L., De Nucci G., and Zatz R. Renal expression of COX-2, ANG II,
and AT1 receptor in remnant kidney: strong renoprotection by therapy with
Page 22 of 40

21
losartan and a nonsteroidal anti-inflammatory. Am.J.Physiol Renal Physiol
286: F945-F954, 2004.
7. Guron, G., Adams M. A., Sundelin B., and Friberg P. Neonatal angiotensin-
converting enzyme inhibition in the rat induces persistent abnormalities in
renal function and histology. Hypertension 29: 91-97, 1997.
8. Guron, G. and Friberg P. An intact renin-angiotensin system is a
prerequisite for normal renal development. J Hypertens. 18: 123-137, 2000.
9. Guron, G., Nilsson A., Nitescu N., Nielsen S., Sundelin B., Frokiaer J., and
Friberg P. Mechanisms of impaired urinary concentrating ability in adult rats
treated neonatally with enalapril. Acta Physiol Scand. 165: 103-112, 1999.
10. Hirose, K., Osterby R., Nozawa M., and Gundersen H. J. Development of
glomerular lesions in experimental long-term diabetes in the rat. Kidney Int
21: 889-895, 1982.
11. Iosipiv, I. V. and Schroeder M. A role for angiotensin II AT1 receptors in
ureteric bud cell branching. Am J Physiol Renal Physiol 285: F199-F207,
2003.
Page 23 of 40

22
12. Jepsen, F. L. and Mortensen P. B. Interstitial fibrosis of the renal cortex in
minimal change lesion and its correlation with renal function. A quantitative
study. Virchows Arch A Pathol Anat Histol 383: 265-270, 1979.
13. Krege, J. H., Hodgin J. B., Hagaman J. R., and Smithies O. A noninvasive
computerized tail-cuff system for measuring blood pressure in mice.
Hypertension 25: 1111-1115, 1995.
14. Kriz, W., Hosser H., Hahnel B., Gretz N., and Provoost A. P. From
segmental glomerulosclerosis to total nephron degeneration and interstitial
fibrosis: a histopathological study in rat models and human
glomerulopathies. Nephrol Dial Transplant 13: 2781-2798, 1998.
15. Laemmli, U. Cleavage of structural proteins during the assembly of the head
of bacteriophage T4. Nature 227: 680-685, 1970.
16. Lasaitiene, D., Friberg P., Sundelin B., and Chen Y. Neonatal RAS inhibition
changes the phenotype of the developing thick ascending limb of Henle. Am
J Physiol Renal Physiol 286: F1144-F1153, 2004.
17. Loria, A., Reverte V., Salazar F., Saez F., Llinas M. T., and Salazar F. J.
Sex and age differences of renal function in rats with reduced ANG II activity
during the nephrogenic period. Am J Physiol Renal Physiol 293: F506-F510,
2007.
Page 24 of 40

23
18. Mancini, G., Carbonara A. O., and Heremans J. F. Immunochemical
quantitation of antigens by single radial immunodiffusion. Immunochemistry
2: 235-254, 1965.
19. McCausland, J. E., Bertram J. F., Ryan G. B., and Alcorn D. Glomerular
number and size following chronic angiotensin II blockade in the postnatal
rat. Exp Nephrol 5: 201-209, 1997.
20. Mundel, P. and Shankland S. J. Podocyte biology and response to injury. J
Am Soc Nephrol 13: 3005-3015, 2002.
21. Nataraj, C., Oliverio M. I., Mannon R. B., Mannon P. J., Audoly L. P.,
Amuchastegui C. S., Ruiz P., Smithies O., and Coffman T. M. Angiotensin II
regulates cellular immune responses through a calcineurin-dependent
pathway. J Clin Invest 104: 1693-1701, 1999.
22. Neuringer, J. R. and Brenner B. M. Hemodynamic theory of progressive
renal disease: a 10-year update in brief review. Am J Kidney Dis 22: 98-104,
1993.
23. Ng, Y. Y., Huang T. P., Yang W. C., Chen Z. P., Yang A. H., Mu W., Nikolic-
Paterson D. J., Atkins R. C., and Lan H. Y. Tubular epithelial-myofibroblast
transdifferentiation in progressive tubulointerstitial fibrosis in 5/6
nephrectomized rats. Kidney Int 54: 864-876, 1998.
Page 25 of 40
24
24. Nilsson, A. B., Nitescu N., Chen Y., Guron G. S., Marcussen N., Matejka G.
L., and Friberg P. IGF-I treatment attenuates renal abnormalities induced by
neonatal ACE inhibition. Am J Physiol Regul.Integr.Comp Physiol 279:
R1050-R1060, 2000.
25. Riser, B. L., Cortes P., Heilig C., Grondin J., Ladson-Wofford S., Patterson
D., and Narins R. G. Cyclic stretching force selectively up-regulates
transforming growth factor-beta isoforms in cultured rat mesangial cells. Am
J Pathol 148: 1915-1923, 1996.
26. Riser, B. L., Cortes P., Zhao X., Bernstein J., Dumler F., and Narins R. G.
Intraglomerular pressure and mesangial stretching stimulate extracellular
matrix formation in the rat. J Clin Invest 90: 1932-1943, 1992.
27. Riser, B. L., Varani J., Cortes P., Yee J., Dame M., and Sharba A. K. Cyclic
Stretching of Mesangial Cells Up-Regulates Intercellular Adhesion
Molecule-1 and Leukocyte Adherence : A Possible New Mechanism for
Glomerulosclerosis. Am J Pathol 158: 11-17, 2001.
28. Ruiz-Ortega, M., Lorenzo O., Ruperez M., Esteban V., Suzuki Y., Mezzano
S., Plaza J. J., and Egido J. Role of the renin-angiotensin system in vascular
diseases: expanding the field. Hypertension 38: 1382-1387, 2001.
Page 26 of 40
25
29. Saez, F., Castells M. T., Zuasti A., Salazar F., Reverte V., Loria A., and
Salazar F. J. Sex differences in the renal changes elicited by angiotensin II
blockade during the nephrogenic period. Hypertension 49: 1429-1435, 2007.
30. Schwartz, M. M. and Lewis E. J. Focal segmental glomerular sclerosis: the
cellular lesion. Kidney Int 28: 968-974, 1985.
31. Spence, S. G., Zacchei A. G., Lee L. L., Baldwin C. L., Berna R. A., Mattson
B. A., and Eydelloth R. S. Toxicokinetic analysis of losartan during gestation
and lactation in the rat. Teratology 53: 245-252, 1996.
32. Tufro-McReddie, A., Romano L. M., Harris J. M., Ferder L., and Gomez R.
A. Angiotensin II regulates nephrogenesis and renal vascular development.
Am J Physiol 269: F110-F115, 1995.
33. Utimura, R., Fujihara C. K., Mattar A. L., Malheiros D. M., Noronha I. L., and
Zatz R. Mycophenolate mofetil prevents the development of glomerular
injury in experimental diabetes. Kidney Int. 63: 209-216, 2003.
34. Wallenstein, S., Zucker C. L., and Fleiss J. L. Some statistical methods
useful in circulation research. Circ Res 47: 1-9, 1980.
Page 27 of 40

26
35. Woods, L. L. and Rasch R. Perinatal ANG II programs adult blood pressure,
glomerular number, and renal function in rats. Am J Physiol 275: R1593-
R1599, 1998.
36. Zatz, R. Haemodynamically mediated glomerular injury: the end of a 15-
year-old controversy? Curr Opin Nephrol Hypertens 5: 468-475, 1996.
Page 28 of 40

27
FIGURE LEGENDS
Figure 1 – Time course of tail-cuff pressure (TCP, A) and urine albumin excretion
rate (UalbV, B) in control rats (C, n=13) and in rats treated with losartan
during lactation (LLact, n=13). a p<0.05 vs. respective control value; b
p<0.05 10-month vs. respective 3-month value ; c p<0.05 10-month vs.
respective 6-month value.
Figure 2 – Selectivity index of proteinuria (SI, left panel) and expression of the ZO-
1 protein (right panel) in control (clear bars) and LLact (filled bars). a
p<0.05 LLact vs C.
Figure 3 – Representative micrographs of the renal tissue in C and LLact at 3 and
10 months of age, showing glomerulosclerosis (A); renal cortical
interstitial expansion/inflammation (B); and renal cortical infiltration by
macrophages (C) and cells staining positively for AII (D). To enhance
the visibility of cells staining positively for ED-1 or AII (both originally in
red), the images shown in Figures 3C and 3D were processed using
Adobe® PhotoShop, version 5.0, to dim the structures staining in blue
(basically nuclei of cells negative for the relevant molecules), then
converted to grayscale.
Page 29 of 40

28
Figure 4 – Bargraph representation of the intensity of glomerulosclerosis (A); renal
cortical interstitial expansion/inflammation (B); and renal cortical
infiltration by macrophages (C) and cells staining positively for AII (D) in
control (clear bars, n=10 at 3 months and n=13 at 10 months of age)
and LLact (filled bars, n=10 at 3 months and n=13 at 10 months of age). a
p<0.05 vs. respective control value; b p<0.05 10-month vs. respective 3-
month value.
Figure 5 – A) Representative micrographs of renal tissue showing the variability of
glomerular areas in C and LLact at 3 and 10 months of age. A population
of exceedingly small glomeruli is seen in LLact. That these are indeed
small glomeruli and not normal glomeruli sectioned close to a pole is
shown in the inset, in which the hilum of one of these glomeruli can be
easily seen. B) Frequency distribution of glomerular areas in C (upper
panels) and LLact (lower panels) at 3 months (left) and 10 months (right).
Distribution was strongly non-Gaussian in LLact, showing a subpopulation
of small glomeruli at both 3 (n=10/group) and 10 (n=13/group) months of
age. C) Bargraph showing the proportion of small, medium-sized and
large glomerular areas in C and LLact. Both glomerular tuft profiles with
small areas (indicating hypotrophy) and with large areas (indicating
compensatory hypertrophy) were much more numerous in LLact than in C
(p<0.05).
Page 30 of 40

29
Table 1 – Renal function study at 3 months of age
BW NN MAP GFR RPF RVR PGC
g ×103 mmHg ml/min mmHg/ml/min mmHg
C ( n=5) 323±18 27±1 108±2 1.42±0.07 4.13±0.24 14.3±0.7 53±1
LLact (n=5) 285±14 18±1a 104±1 0.94±0.06a 2.77±0.27a 20.9±2.3a 63±2a
Results expressed as mean ± SE. BW, body weight; NN, nephron number (per one
kidney); MAP, mean arterial pressure; GFR, glomerular filtration rate; RPF, renal
plasma flow; RVR, renal vascular resistance; PGC, glomerular hydraulic pressure.
ap<0.05 vs. C.
Page 31 of 40

30
Table 2 - Renal functional and systemic parameters at 3 and 10 months of age
3 months 10 months
C
(n=10)
LLact
(n=10)
C
(n=13)
LLact
(n=13)
BW (g) 278±9 264±10 417±7b 393±11b
LKW (g) 1.49±0.06 1.67±0.05 1.97±0.05 b 1.82±0.06
PNa (mmol/L) 139±2 141±2 142±2 140±1
PK (mmol/L) 3.7±0.1 3.9±0.2 4.3±0.2 4.3±0.2
Screat (mg/dL) 0.64±0.11 0.70±0.09 0.68±0.04 0.94±0.06ab
VU24h (ml/24h) 23±2.2 31±1.5 29±1.7 64±7.1ab
Uosm (mOsm/Kg) 1210±116 921±45a 1111±83 543±58ab
Results expressed as mean ± SE. BW, body weight; LKW, left kidney weight; PNa,
plasma sodium concentration; PK, plasma potassium concentration; Screat, serum
creatinine concentration; VU24h, daily urinary volume; Uosm, urine osmolality.
ap<0.05 vs. C, bp<0.05 vs. respective 3-month value.
Page 32 of 40

Tail-cuff pressure
0 2 4 6 8 10100
110
120
130
140
150
160
170
180
months
LLact
C
abc
b
mm
Hg
Page 33 of 40

Urinary albumin excretion
0 2 4 6 8 100
25
50
75
100
125
150
175
months
LLact
C
abc
ab
abc
mg/
24h
Page 34 of 40

0
10
20
30
40
50
60
70
a
a
CLLact LLactC3 mo 10 mo
ZO-1
%0.00
0.05
0.10
0.15
0.20
0.25
0.30
a
a
CLLact LLactC3 mo 10 mo
SI
Page 35 of 40

C
D
C 3mo LLact 3mo LLact 10moC 10mo
B
A
100 μm
100 μm
100 μm
100 μm
Page 36 of 40

% cortical interstitial area
0
1
2
3
4
5
6
7
8
9
10
a
ab
C 3mo LLact 10moLLact 3mo C 10mo
%
Cortical interstitial infiltration by macrophages
0
50
100
150
200
250
ab
a
C 3mo LLact 10moLLact 3mo C 10mo
cells
/mm
2
Cortical interstitial infiltration by AII + cells
0
5
10
15
20
25
30
35
ab
C 3mo LLact 10moLLact 3mo C 10mo
cells
/mm
2
a
Glomerulosclerosis index
0
10
20
30
40
50
60
70ab
C 3mo LLact 10moLLact 3mo C 10mo
a
GS
I
A B
DC
Page 37 of 40

C 3mo LLact3mo LLact10moC 10mo
100 μm
50 μm
Page 38 of 40

0
5
10
15
20
25
0-1500
1501-3000
3001-4500
4501-6000
6001-7500
7501-9000
9001-10500
10501-12000
12001-13500
13501-15000
15001-16500
16501-18000
18001-19500
19501-21000
21001-22500
22501-24000
24001-25500
25501-27000
27001-28500
28501-30000
30001-31500
31501-33000
33001-34500
34501-36000
Section area
Glo
mer
uli,
%
0
5
10
15
20
25
0-1500
1501-3000
3001-4500
4501-6000
6001-7500
7501-9000
9001-10500
10501-12000
12001-13500
13501-15000
15001-16500
16501-18000
18001-19500
19501-21000
21001-22500
22501-24000
24001-25500
25501-27000
27001-28500
28501-30000
30001-31500
31501-33000
33001-34500
34501-36000
Glo
mer
uli,
%
Section area
Page 39 of 40
0%10%20%
30%40%50%60%70%
80%90%
100%
C 3mo C 10mo LNB 3 mo LNB 10 mo
>15000>3000 e <15000<3000
LLact 3mo LLact 10mo
Page 40 of 40
Copyright © 2022 FDOKUMEN