Diabetes nephropathy in the Netherlands: a cost effectiveness analysis of national clinical...
13
Health Policy 51 (2000) 135–147 Diabetes nephropathy in the Netherlands: a cost effectiveness analysis of national clinical guidelines Nicole van Os a , Louis W. Niessen a, *, Henk J.G. Bilo c , Anton F. Casparie b , Ben A. van Hout a a Institute for Medical Technology Assessment, Erasmus Uni6ersity Rotterdam, PO Box 1738, 3000 DR, Rotterdam, Netherlands b Institute for Health Policy and Management, Erasmus Uni6ersity Rotterdam, PO Box 1738, 3000 DR, Rotterdam, Netherlands c Isala clinics, Hospital ‘De Weezenlanden’, Zwolle, Netherlands Received 11 September 1999; accepted 20 November 1999 Abstract Background: In the Netherlands a program on quality assurance in medical care has started in 1996. Clinical professionals, patient organizations and health services researchers formulate evidence based guidelines with a concomitant cost-effectiveness analysis. Objec - ti6es: To examine the cost-effectiveness of guideline recommendations for prevention of nephropathy in diabetes mellitus type 1 and 2. Research design: A semi – Markov compart- ment model was developed. Data from international publications on epidemiological surveys and randomized trials, together with national data on health care use and costs, were used to feed the model. A cohort of diabetes patients without renal disease enters the model. Measures: Complication (end-stage renal disease) free years, QALY’s, and life-time medical costs per patient treated according to guideline recommendations or current anti-diabetic strategy. Results: Guideline treatment for type 1 diabetes yields 4.2 complication free life years, at a cost-effectiveness ratio of 13 500 (Dutch guilders) NLG per QALY. Type 2 diabetes patients gain 0.2 complication free life years at a cost-effectiveness ratio of 31 000 NLG per QALY. Conclusion: Guideline development for diabetes nephropathy, with concomitant cost-effectiveness calculations, has resulted in a transparent guideline with explicit information on long term cost and effects. The project has brought health care www.elsevier.com/locate/healthpol * Corresponding author. Tel.: +31-10-4088525; fax: +31-10-4526086. E-mail address: [email protected] (L.W. Niessen) 0168-8510/00/$ - see front matter © 2000 Elsevier Science Ireland Ltd. All rights reserved. PII:S0168-8510(00)00063-4
-
Upload
independent -
Category
Documents
-
view
1 -
download
0
Transcript of Diabetes nephropathy in the Netherlands: a cost effectiveness analysis of national clinical...

Health Policy 51 (2000) 135–147
Diabetes nephropathy in the Netherlands: acost effectiveness analysis of national clinical
guidelines
Nicole van Os a, Louis W. Niessen a,*, Henk J.G. Bilo c,Anton F. Casparie b, Ben A. van Hout a
a Institute for Medical Technology Assessment, Erasmus Uni6ersity Rotterdam, PO Box 1738, 3000 DR,Rotterdam, Netherlands
b Institute for Health Policy and Management, Erasmus Uni6ersity Rotterdam, PO Box 1738, 3000 DR,Rotterdam, Netherlands
c Isala clinics, Hospital ‘De Weezenlanden’, Zwolle, Netherlands
Received 11 September 1999; accepted 20 November 1999
Abstract
Background: In the Netherlands a program on quality assurance in medical care hasstarted in 1996. Clinical professionals, patient organizations and health services researchersformulate evidence based guidelines with a concomitant cost-effectiveness analysis. Objec-ti6es: To examine the cost-effectiveness of guideline recommendations for prevention ofnephropathy in diabetes mellitus type 1 and 2. Research design: A semi–Markov compart-ment model was developed. Data from international publications on epidemiological surveysand randomized trials, together with national data on health care use and costs, were usedto feed the model. A cohort of diabetes patients without renal disease enters the model.Measures: Complication (end-stage renal disease) free years, QALY’s, and life-time medicalcosts per patient treated according to guideline recommendations or current anti-diabeticstrategy. Results: Guideline treatment for type 1 diabetes yields 4.2 complication free lifeyears, at a cost-effectiveness ratio of 13 500 (Dutch guilders) NLG per QALY. Type 2diabetes patients gain 0.2 complication free life years at a cost-effectiveness ratio of 31 000NLG per QALY. Conclusion: Guideline development for diabetes nephropathy, withconcomitant cost-effectiveness calculations, has resulted in a transparent guideline withexplicit information on long term cost and effects. The project has brought health care
www.elsevier.com/locate/healthpol
* Corresponding author. Tel.: +31-10-4088525; fax: +31-10-4526086.E-mail address: [email protected] (L.W. Niessen)
0168-8510/00/$ - see front matter © 2000 Elsevier Science Ireland Ltd. All rights reserved.
PII: S0168 -8510 (00 )00063 -4
N. 6an Os et al. / Health Policy 51 (2000) 135–147136
providers and health services researchers together. © 2000 Elsevier Science Ireland Ltd. Allrights reserved.
Keywords: Cost-effectiveness analysis; Guidelines; Diabetes nephropathy; Consensus
1. Introduction
The principles of managed care and shared financial risks in health care, urge forthe integration of medical care and health economics in policy making [1]. Over thepast decades guideline development has changed from opinion based to evidence-based guidelines, with increasing attention for health-economics in the guidelinedevelopment process [2]. Ideally cost-effectiveness data should be incorporated inthe process of developing recommendations on treatment measures. In practicethere is no clear manner to incorporate cost-effectiveness data in the guidelinedevelopment process. A national project ‘Quality Assurance In Medical Care’ waslaunched in the Netherlands in January 1998. The program is a joint effort from(para)medical professional organizations, patient organizations, health economistsand other health services researchers, to formulate evidence based guidelines with aconcomitant cost-effectiveness analysis (CEA) and a strategy for implementation indaily medical practice [3]. The project has been initiated by the Dutch Ministry ofHealth and implemented by the National Organization for Quality Assurance inHospitals, the WHO Collaborating Center for Quality Assurance in Health Careand the Institute for Medical Technology Assessment. Although the project has anational character, international collaboration and sharing of information has beenexploited. Not a single country can conduct all MTA studies on its own [4].
Quality assurance in integrated diabetes care is one of the first subjects to havebeen dealt with in the project. After literature searches on effectiveness of interven-tions, (para)medical professionals and patient organizations formulate guidelines onprevention of diabetes nephropathy, through informal consensus meetings [3]. Draftversions of the guideline were submitted to cost effectiveness analyses at an earlystage. This setting has supported the interaction of health scientists and medicalprofessionals in promoting cost consciousness in diabetes care [3].
Diabetic nephropathy is a micro-vascular complication of both insulin dependent(type 1) and non–insulin dependent (type 2) diabetes mellitus. In diabetes patients,development of nephropathy is a gradual process with distinct stages of micro- andmacro-albuminuria, before end stage renal disease (ESRD) might develop. Withoutintervention the cumulative incidence of diabetic nephropathy after 25 years is25–35% [5,6]. Randomized trials have shown that diabetic nephropathy in bothtype 1 and type 2 diabetes patients can be prevented, or progression slowed downby optimal glycemic control, blood-pressure control and the use of ACE-inhibitors[7–9]. The annual incidence of end stage renal disease due to diabetic nephropathy,needing dialysis, in the Netherlands is 11.2 per million inhabitants [10]. Thiscontrasts with an incidence of 58.9 per million inhabitants in the United States. Inthe latter country, 30% of the dialysis patients are due to diabetic nephropathy. In
N. 6an Os et al. / Health Policy 51 (2000) 135–147 137
1996 in the Netherlands, 15.5% of the 1332 new dialysis patients were due todiabetic nephropathy [6,10].
In the national quality assurance project, guidelines for primary and secondaryprevention of nephropathy, retinopathy and neuropathy in diabetes mellitus type 1and type 2 have been formulated. Focus-points of the new guidelines are: intensiveinsulin treatment and complication specific care. Annual screening of urine formicro-albuminuria, ACE inhibitors in advanced micro-albuminuria, treatment ofhypertension and reinforcement of a healthy lifestyle, are recommended to preventdiabetes nephropathy [11]. In this paper the long-term costs and effects of currenttreatment strategies are compared with the long-term costs and effects of treatmentfollowing guidelines.
2. Materials and methods
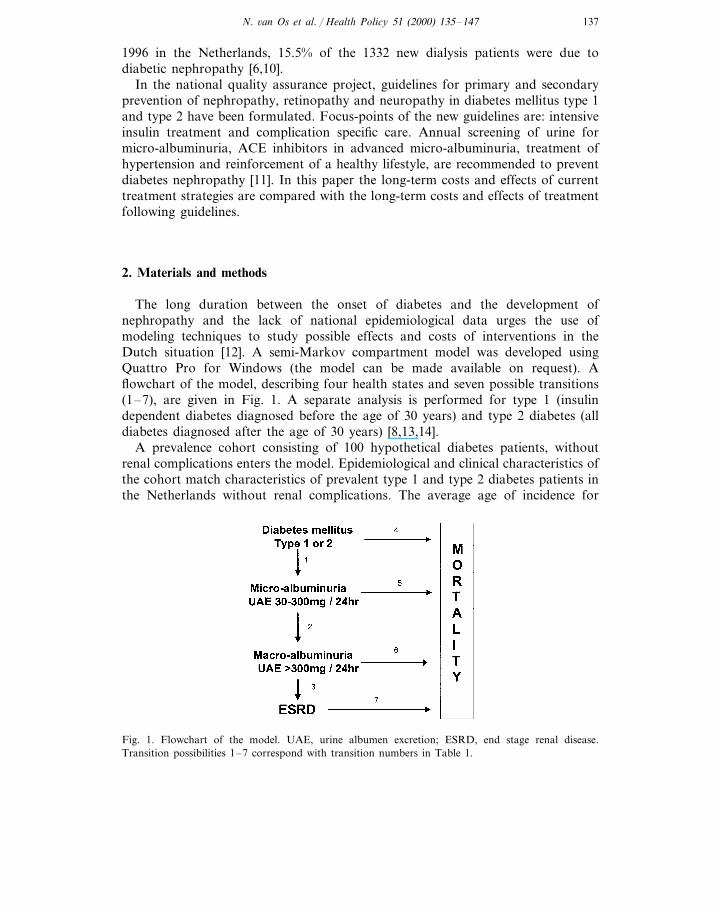
The long duration between the onset of diabetes and the development ofnephropathy and the lack of national epidemiological data urges the use ofmodeling techniques to study possible effects and costs of interventions in theDutch situation [12]. A semi-Markov compartment model was developed usingQuattro Pro for Windows (the model can be made available on request). Aflowchart of the model, describing four health states and seven possible transitions(1–7), are given in Fig. 1. A separate analysis is performed for type 1 (insulindependent diabetes diagnosed before the age of 30 years) and type 2 diabetes (alldiabetes diagnosed after the age of 30 years) [8,13,14].
A prevalence cohort consisting of 100 hypothetical diabetes patients, withoutrenal complications enters the model. Epidemiological and clinical characteristics ofthe cohort match characteristics of prevalent type 1 and type 2 diabetes patients inthe Netherlands without renal complications. The average age of incidence for
Fig. 1. Flowchart of the model. UAE, urine albumen excretion; ESRD, end stage renal disease.Transition possibilities 1–7 correspond with transition numbers in Table 1.
N. 6an Os et al. / Health Policy 51 (2000) 135–147138
diabetes (clinical diagnosis) in the Netherlands is 15 years for type 1 diabetes and55 years for type 2 diabetes. The average age of the prevalence cohort entering themodel is 21 years for the type 1 diabetes and 62 years type 2 diabetes [7,15,16].The model simulates the course of the disease in steps of 1 year. At the end of eachyear, cohort members can progress to the next health state or die, or they remainin the same health state. Albuminuria health states are defined laboratory testoutcome conditions. End stage renal disease is a health state defined by the need ofrenal replacement therapy; continuous peritoneal dialysis (CAPD), hemodialysis orrenal transplant.
Disease progression and mortality are quantified by annual transition probabili-ties representing an average chance on progression or mortality. Transition proba-bilities (Table 1) are derived from international studies and national statistics[8,10,14,17–21]. Transitions 1 and 2 are adjusted to the Dutch situation, bymultiplying them with a HbA1c related converting factor, as used by Eastman et al[18]. In the United States the average HbA1c value for patients on regulartreatment is 9.0% for type 1 and 10.0% for type 2 diabetes [18,22]. Studies in theNetherlands report an average HbA1c of 8.27% among type 1 diabetes patientsand 7.6% among type 2 diabetes patients [23–25]. In daily practice, effectiveness oftreatment measures recommended in guidelines, will improve the HbA1c levels to7.2% and 7.0% respectively [18,22]. Disease progression in patients receivingcurrent treatment, differs from disease progression in patients receiving intensiveblood glucose treatment and ACE-inhibitors. In the model this difference indisease progression results in different transition probabilities between healthstates, for current and guideline treatment modalities.
In comparing the current level of care with intensive blood glucose treatmentand ACE-inhibitors, we use a health care perspective. This means only directmedical cost and direct health effects — defined as complication (ESRD) fee lifeyears gained — are considered. The costs and effects of the guideline treatmentare modeled through costs and effects of intensive treatment and ACE-inhibitorsin macro-albuminuria. To reflect the intensity of blood glucose control, the averageHbA1c level is used. Data on the present use of ACE-inhibitors by diabetespatients in the Netherlands are not available; we have assumed that no ACE-in-hibitors are being used in the current treatment scenario. A summary of cost dataused in the study is given in Table 2. For type 1 diabetes the cost incurred bystandard treatment, are based on actual expenditure data derived from a Dutchsurvey [17]. Unit prices under guideline care are the same as unit prices in currentcare. For guideline treatment, follow-up frequency during the first year is 16specialist visits. In later years four to six follow-up visits will be necessary tomonitor intensive insulin treatment and the effect of ACE-inhibitors [17]. Data onservice use by type 2 diabetes patients are derived from studies comparing standardtreatment with intensive treatment protocols, in general practices in the Nether-lands [23,24]. To calculate the costs for ESRD patients a weighted average ofactual costs incurred for hemodialysis, peritoneal dialysis and renal transplantpatients was used [10,26].

N.6an
Os
etal./
Health
Policy
51(2000)
135–
147139
Table 1Transition probabilities used in the model
Diabetes type 1 module annual transition rates Diabetes type 2 module annual transition ratesTransition Description ofnumber the transition
Current care Guideline care Ref.Current care Guideline care Ref.
0.0126a [14,18] 0–1 years 0.0232 b0–2 years 0.0232b1 [18,19]0.0198aNormo- to0.0327 0.0209 2–4 years 0.0155 0.0119micro 3–5 years0.0436 0.0278 5–8 years 0.0226 0.0173albuminuria 6–9 years
9–13 years 0.0518 0.03979–10 years 0.03250.0510\14 years 0.0109 0.0084\10 years 0.0368 0.0234
2 0.0102aMicro- to [14,18] 1st year 0.0474 b 0.0474b [18,19]All years 0.0306a
Later years 0.0177 0.0092macro-albuminuria
0.0097 [8,17] 0–11 years 0.0042 0.00210.0200 [18,19]Macro- 1st year30.0750 0.0195 12–19 years 0.0385 0.01932nd yearalbuminuria
0.0453 ]20 years 0.0740 0.03703rd yearto ESRD 0.02810.00050.06274th year0.0047\4 years 0.0119
0.0042 No change [20] 1st year 0.0305Annual No change [21]1st year4Later years *1.07� (t) Laters yearsc 1.07� (t)mortality rate
normoalb.patients
No change [20] 1st year 0.0715Annual mortal- No change [21]1st year 0.01675*1.07� (t) Later years 1.07� (t)Later yearsity rate mi-
croalb. patients

N.6an
Os
etal./
Health
Policy
51(2000)
135–
147140
Table 1 (Continued)
Diabetes type 2 module annual transition ratesDescription ofTransition Diabetes type 1 module annual transition ratesnumber the transition
Guideline care Ref. Current care Guideline care Ref.Current care
No change [20] 1st year 0.15011st year No change0.0406 [21]Annual mortal-6Later years *1.07� (t) *1.07� (t)ity rate macro
alb. patients
No change [10,17] 1st year 0.3000Annual mortal- No change [10,17]All years 0.20007ity rate ESRD \1 year 0.2000patients
a (HbA1c type 1 diabetes/9.0%)�b.b (HbA1c type 2 diabetes/10%)�b; ß, is 3.25 for the unconditioned transition rate from normo- to micro-albuminuria and 7.95 for the conditioned
transition rate from micro- to macro-albuminuria.c Annual increase in mortality because of ageing: mortality rate first year *1.07� (t)

N. 6an Os et al. / Health Policy 51 (2000) 135–147 141
Table 2Estimated annual costs per patient for diabetes type 1 and type 2
Type 2 diabetesType 1 diabetesSubject of costRef. Estimated annualEstimated annual Ref.
costs (NLG)costs (NLG)
Current care[17]General practitioner visits; 32 12864 [23]
NLG/unit144144 [23][17]Specialist visits (fixed annual fee)
192a [17] 40b [23]Laboratory[17][17]OPD running cost
14Nurses; 14 NLG/unit 6449Overhead cost (fixed annual cost) 49
1860 72c [23]Insulin, materials and self controlExtra care following guidelines
–General practitioner visits; 32 64 [23]NLG/unit
35dTelephone consultation [23]–– [11][11]50eLaboratory–OPD running cost first year †
Nurses; 14 NLG/unit 168–OPD running cost later years †
28Nurses; 14 NLG/unit117 [23]Insulin, materials and self control 1100 [11]395 [8][8,11]ACE inhibitors 395
Renal replacement138300 [26][26]133400Dialysisf
[17,26]90400 90400 [17,26]Renal transplantation first yearRenal transplantation later years [17,26] 36600 [17,26]36600
a 4×HbA1c, blood glucose, electrolytes, creatinine, urea, 1× lipid spectrum.b 4×blood glucose control, 1× micro-albuminuria screening.[29].c Weighted average of diet only, oral hyperglycaemic treatment and insulin/self control.d 2 Calls/week with a diabetes nurse, 3 min/call.e 8×blood glucose, 1× screening micro-albuminuria.f Weighted average of active hemodialysis, passive hemodialysis and peritoneal dialysis.† Written communication from the diabetes nephropathy guideline development committee.
3. Results
Results with and without discounting are presented in Table 3. After 10 years ofguideline treatment a health effect becomes evident. The health effect accumulatesto a maximum over a lifetime, which is 50 years for type 1 diabetes cohort and 30years for type 2 diabetes cohort. At this time virtually all members of the type 1andtype 2 diabetes cohort will have died. In the type 1 diabetes cohort of 100 patientswithout renal complications, introduction of intensive insulin treatment results in2.9 complication free life years and ACE inhibitors in 0.4 complication free lifeyears extra per patient in a lifetime. The cost-effectiveness ratio improves as thecohort ages and the effect increases (Fig. 2). Introduction of intensive blood glucose
N. 6an Os et al. / Health Policy 51 (2000) 135–147142
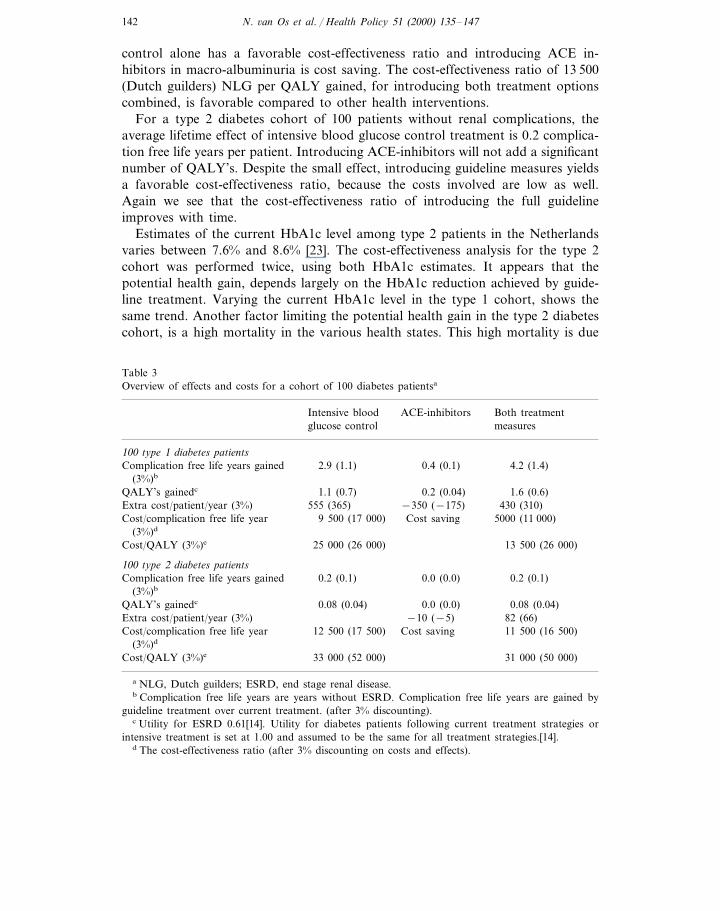
control alone has a favorable cost-effectiveness ratio and introducing ACE in-hibitors in macro-albuminuria is cost saving. The cost-effectiveness ratio of 13 500(Dutch guilders) NLG per QALY gained, for introducing both treatment optionscombined, is favorable compared to other health interventions.
For a type 2 diabetes cohort of 100 patients without renal complications, theaverage lifetime effect of intensive blood glucose control treatment is 0.2 complica-tion free life years per patient. Introducing ACE-inhibitors will not add a significantnumber of QALY’s. Despite the small effect, introducing guideline measures yieldsa favorable cost-effectiveness ratio, because the costs involved are low as well.Again we see that the cost-effectiveness ratio of introducing the full guidelineimproves with time.
Estimates of the current HbA1c level among type 2 patients in the Netherlandsvaries between 7.6% and 8.6% [23]. The cost-effectiveness analysis for the type 2cohort was performed twice, using both HbA1c estimates. It appears that thepotential health gain, depends largely on the HbA1c reduction achieved by guide-line treatment. Varying the current HbA1c level in the type 1 cohort, shows thesame trend. Another factor limiting the potential health gain in the type 2 diabetescohort, is a high mortality in the various health states. This high mortality is due
Table 3Overview of effects and costs for a cohort of 100 diabetes patientsa
Intensive blood ACE-inhibitors Both treatmentmeasuresglucose control
100 type 1 diabetes patients0.4 (0.1)Complication free life years gained 4.2 (1.4)2.9 (1.1)
(3%)b
0.2 (0.04)1.1 (0.7) 1.6 (0.6)QALY’s gainedc
−350 (−175) 430 (310)Extra cost/patient/year (3%) 555 (365)5000 (11 000)9 500 (17 000)Cost/complication free life year Cost saving
(3%)d
13 500 (26 000)Cost/QALY (3%)e 25 000 (26 000)
100 type 2 diabetes patientsComplication free life years gained 0.2 (0.1) 0.0 (0.0) 0.2 (0.1)
(3%)b
0.08 (0.04)QALY’s gainedc 0.0 (0.0) 0.08 (0.04)Extra cost/patient/year (3%) −10 (−5) 82 (66)Cost/complication free life year 11 500 (16 500)12 500 (17 500) Cost saving
(3%)d
33 000 (52 000) 31 000 (50 000)Cost/QALY (3%)e
a NLG, Dutch guilders; ESRD, end stage renal disease.b Complication free life years are years without ESRD. Complication free life years are gained by
guideline treatment over current treatment. (after 3% discounting).c Utility for ESRD 0.61[14]. Utility for diabetes patients following current treatment strategies or
intensive treatment is set at 1.00 and assumed to be the same for all treatment strategies.[14].d The cost-effectiveness ratio (after 3% discounting on costs and effects).

N. 6an Os et al. / Health Policy 51 (2000) 135–147 143
Fig. 2. Cost-effectiveness ratio during the years after the start of diabetes for guideline treatment in ahypothetical diabetes cohort without renal complications.
Table 4Validation results for type 1 and type 2 diabetes
Empirical value (1994)Epidemiological Values generated by the models currenttreatment scenariovariable used for validation
DialysisDiabetesDiabetesincidenceprevalence prevalence
Type 1 diabetes900 295–Diabetes prevalence 35 000 [16]
1500 [30] 54 000 – 460Diabetes incidence700 –27 000231 [10]Dialysis prevalence
Type 2 diabetes14 000Diabetes prevalence 177250 000 [27] –
– 260370 000Diabetes incidence 21 000 [30]Dialysis prevalence 190 000 11 000 –136 [10]
to high age and high cardiovascular mortality. The mortality does not improve byguideline treatment [9].
Validation of the model was done using diabetes and dialysis prevalence datafrom national statistics. External validation results are presented in Table 4. Fortype 1 diabetes the number of prevalent dialysis patients calculated by the model(295 cases), using empirical data on diabetes prevalence from the Netherlands in1994 (35 000), is comparable with the number of prevalent patients reported in thenational dialysis register (231 cases). The number of prevalent dialysis patients,

N. 6an Os et al. / Health Policy 51 (2000) 135–147144
calculated using empirical data on diabetes incidence, is higher (460 cases). For type2 diabetes the number of prevalent dialysis patients under the current treatmentscenario calculated by the model, is higher than the number of prevalent dialysispatients reported by the national register (136 cases) [10,16,27].
4. Discussion
The objective of the guideline formulation project in the Netherlands is toenhance appropriate clinical decision making and better informed priority setting inresource allocation at various levels in health care management. The project is acommon effort from (para)medical experts, patient representatives, health carefinanciers and research institutes and was started in January 1998. Development ofguidelines to prevent diabetes nephropathy, is one of the first topics to have beencovered. Cost-effectiveness calculations of proposed treatment measures did notgive any reason for changing guideline proposals on prevention of diabetes nefropa-thy. A combined effort to incorporate data on cost-effectiveness early in theguideline development process has resulted in an evidence based and transparentguideline with explicit information on costs and effects. An alliance and a commonbody of knowledge has been created which will serve future health care policymaking. The final version of the guideline will get a supplement on the performedcost-effectiveness analysis.
Using cost-effectiveness analysis as a tool in health care policy and decisionmaking, requires results that are comparable across interventions. As a standardmeasure of effect we used quality (QALYs), which were calculated using interna-tional data on utilities for ESRD, i.e. 0.61 [14]. For the other disease states nouniform utilities, other than 1.00 could be found. Costs and benefits of a healthintervention occur at different points in time. For treatment measures to preventdiabetes nephropathy, the costs will precede the effects. Calculating present valuesof both costs and effects of a health intervention, by discounting costs and effects,is another step in standardizing results and enabling policy makers to make anobjective comparison between different interventions, with different time lagsbetween costs and effects. Discount rates were based on expected economic growthin the Netherlands and future elasticities in the social utility function [28]. Adiscount rate of 3% on both costs and effects was used in this study.
From a health economic point of view, a cost-effectiveness analysis using asocietal perspective would be more complete. From a practical point of view, theanalysis has to be timely and within the budget set for the guideline developmentproject. In this study, the tremendous health care costs of renal replacement therapyin elderly diabetes patients, largely influence the cost-effectiveness ratio. Indirectcosts and effects are unlikely to change the cost-effectiveness ratio significantly. Toserve the goal of developing an evidence-based, transparent guideline with data oncost and effects, a health care perspective was considered sufficient by all partiesinvolved.
N. 6an Os et al. / Health Policy 51 (2000) 135–147 145
Validation of the model was done, using national diabetes prevalence andincidence data, and comparing model outcome with empirical data on dialysisprevalence from the Netherlands. Dialysis prevalence calculated by the model issomewhat different from prevalence data in the dialysis register. One explanationfor the discrepancy in both type 1 and type 2 diabetes, is the absence of a historicaltime dimension in the Markov-model. To calculate ESRD prevalence for 1994, wewould have to use diabetes incidence data from some decades ago. These data arenot available since accurate registration is from 1980 onwards. Diabetes incidencein the past however, will be lower than the 1994 incidence figures, as diabetesincidence in the Netherlands has shown an annual increase of 1–3% [13]. Usingdiabetes prevalence data to calculate an ESRD prevalence, ignores the historicaltime dimension. For type 1 diabetes, the model produces dialysis prevalence figuresresembling actual dialysis prevalence data, when diabetes prevalence data are used.For type 2 diabetes dialysis incidence calculated by the model somewhat higher.This can partially be explained by an underestimation of actual ESRD prevalenceby the national dialysis register [10]. Elderly diabetes patients developing renalfailure often do not start dialysis. We constructed a model that is consistent withexisting Dutch data on diabetes. Additional calibration we consider unnecessary.Most likely, the assumption that no patients are taking ACE-inhibitors is notcorrect. There are no data available yet on over- and under-prescribing of thisrecommended drug. On the whole, our Markov-model does offer a valid tool todraw conclusions on incremental costs and effects of guideline treatment overcurrent anti-diabetic treatment.
5. Conclusion
Guideline measures on prevention of diabetic nephropathy are considered cost-effective for both type 1 and type 2 diabetes. Intensive blood glucose control iscost-effective whereas the use of ACE-inhibitors in macro-albuminuria is costsaving. When we take into account that intensive blood glucose control has effecton other diabetes complications (neuropathy and retinopathy) as well, intensivetreatment will resort in more effects and become even more cost-effective. Evidence-based guidelines, formulated in a standardized way with a simultaneous cost-effec-tiveness analysis, will enable various stakeholders at different levels in health carepolicy making and decision making, to come to better informed decisions andresource utilization. Development of the diabetes nephropathy guideline with aconcomitant cost-effectiveness analysis, has brought health care providers andhealth services researchers in the Netherlands together.
Acknowledgements
The authors like to acknowledge the many contributions made to the evaluationof the diabetes guidelines program by the other members of the Dutch Diabetes

N. 6an Os et al. / Health Policy 51 (2000) 135–147146
Health Economics Team: Dr H. Crijns, Dr M. Koopmanschap and Professor F.H.Rutten. The Ministry of Health in the Netherlands granted funding of the study.Preliminary results of the study were presented at a conference ‘Economic Aspectsof Diabetes — The Next Steps’’ held in Barcelona (Spain) from 6–8 September1998, and at a national meeting organized by the National Organization for QualityAssurance in Hospitals and the Institute for Medical Technology Assessment on‘Guidelines in Health Care — The Various Steps, Development, Implementationand Evaluation’ held in Utrecht (The Netherlands) on 25 November 1998 and 27March 1999.
References
[1] Power E, Eisenberg J. Are we ready to use cost-effectiveness analysis in health care decisionmaking? Medical Care 1998;36:MS10–7.
[2] Mason F, Eccles M, Freemantle N, Drummond M. A framework for incorporating cost-effective-ness in evidence-based clinical practice guidelines. Health Policy 1999;47:37–52.
[3] Casparie AF. The costs of efficiency in health care-the example of diabetes guidelines. MedischContact 1999;54:1129–33 in Dutch.
[4] Borst-Eilers E, National Assembly Report on Medical Technology Assesment and Quality Assur-ance in Medical care. The Hague, 1997.
[5] Ballard D, Humphrey L, Frohnert P, Chu C, O’Fallon W, Palumbo P. Epidemiology of persistentproteinuria in Type II diabetes mellitus. Annual International Medicine 1988;111:788–96.
[6] Nelson RG, Knowler WC, Pettitt DJ, Bennet PH. Diabetes in America. In: Harris MI, Cowie CC,Stern MP, Boyko EJ, Reiber GE, Bennet PH, editors. Diabetes in America. USA: NationalInstitutes of Health, 1995:349–400.
[7] DCCT. The effect of intensive treatment of diabetes on the development and progression oflong-term complications in insulin dependent diabetes mellitus. New England Journal Medicine1993;329:977–85.
[8] Lewis EJ, Hunsicker LG, Bain RP, Rohde RD. The effect of angiotensin-converting-enzymeinhibition on diabetic nephropathy. New England Journal of Medicine 1993;329:1456–62.
[9] UKPDS SG. Intensive blood-glucose control with sulphonylureas or insulin compared withconventional treatment and risk of complications in patients with type 2 diabtes (UKPDS 33). TheLancet 1998;352:837–53.
[10] Renin E. Statistical Report RENINE. Rotterdam, Netherlands: Registration Renal ReplacementTherapy, 1998:1998 in Dutch.
[11] CBO/NDF. Guidelines retinopathy, nephropathy, neuropathy, cardio-vascular diseases in diabetesmellitus. Utrecht: CBO/NDF, 1998 in Dutch.
[12] Buxton MJ, Drummond MF, Hout BAv, et al. Modelling in economic evaluation: an unavoidablefact of life. Health Economics 1997;6:217–27.
[13] Ruwaard D. Diabetes mellitus; from epidemiology to health policy. iBMG, Rotterdam: ErasmusUniversity, 1996:171.
[14] DCCT. Lifetime benefits and costs of intensive therapy as practised in the diabetes control andcomplications trial. JAMA 1996;276:1409–15.
[15] Klein R. Hyperglycaemia and microvascular and macrovascular disease in diabetes. Diabetes Care1995;18:258–68.
[16] VTV. Health of the Nation, an exploration of the future. part 1. Bilthoven: RIVM, 1997. (in Dutch)[17] Bilo HJG. Effectiveness and cost-effectiveness of treatment in diabetes mellitus. In: Bilo HJG,
editor. De Weezenlanden Series, vol. 11. Zwolle: De Weezenlanden, 1996:112 in Dutch.[18] Eastman RC, Javitt JC, Herman WH, Hasbach EJ, Dong F. Model of complications; analysis of
the health benefits and cost-effectiveness of treating NIDDM with the goal of normoglycaemia.Diabetes Care 1997;20:735–44.

N. 6an Os et al. / Health Policy 51 (2000) 135–147 147
[19] Eastman RC, Javitt JC, Herman WH, Hasbach EJ, Dong F. Model of complications of NIDDM;model construction and assumptions. Diabetes Care 1997;20:725–34.
[20] Rossing P, Hougaard P, Borch-Johnsen K, Parving HH. Predictors of mortality in insulindependent diabetes: 10 year observational follow-up study. British Medical Journal 1996;313:779–84.
[21] Schmitz A, Vaeth M. Microalbuminuria: A major risk factor in non insulin dependent diabetes: a10-year follow-up study of 503 patients. Diabetes Medicine 1988;5:126–34.
[22] Dcc T. The relationship of glycaemic exposure (HbA1c) to the risk of development and progressionof retinopathy in the diabetes control and complications trial. Diabetes 1995;44:968–83.
[23] Sonnaville JJJd, Bouma M, Deville W, Wijkel D, Heine RJ. Sustained good glycaemic control inNIDDM patients by implementation of structured care in general practice: 2-year follow-up study.Diabetologia 1997;40:1334–40.
[24] Bilo HJG, Jong BM-d, Ballegooie Ev. Transmural care in diabetes mellitus: an exploration of thesituation in the Netherlands. In: Bilo HJG, editor. De Weeezenlanden Series, vol. 10. Zwolle: DeWeezenlanden, 1996:280 in Dutch.
[25] Assink JH. Oxidative stress and health status in patients with insulin-dependent diabetes mellitus.Rotterdam, Netherlands: Erasmus university, 1997:149.
[26] Wit AGd, Charro FTd. Cost of dialysis. Rotterdam, Netherlands: Centre for Health Policy andLaw, 1997 in Dutch.
[27] Baan CA, Bonneux L, Ruwaard D, Feskens EJM. The prevalence of diabetes mellitus in theNetherlands: a quantitative review. European Journal of Public Health 1998;8:210–6.
[28] Gold MR, Siegel JE, Russel LB, Weinstein MC. In: Gold MR, Siegel JE, Russel LB, WeinsteinMC, editors. Cost-effectiveness in health and medicine. Oxford: Oxford University Press, 1996.
[29] Cromme PVM, Mulder JD, Rutten GEHM, Zuideweg J, Thomas S. General Practitioner guidelineson diabetes mellitus. Utrecht, Netherlands: Huisartsen Genootschap, 1989 in Dutch.
[30] Ruwaard D, Gijsen R, Bartelds AIM, Hirasing RA, verkley H, Kromhout D. Is the incidence ofDiabetes increasing in all age-groups in the Netherlands? Diabetes Care 1996;19:214–8.
.