
Frozen fish and cephalopod molluscs for fish bait - Ministry for ...
Upload
independentCategory
view
1download
0
POPULATION ECOLOGY
D. P. Croft Æ R. James Æ A. J. W. Ward Æ M. S. Botham
D. Mawdsley Æ J. Krause
Assortative interactions and social networks in fish
Received: 13 September 2004 / Accepted: 30 November 2004 / Published online: 29 January 2005� Springer-Verlag 2005
Abstract The mechanisms underpinning the structure ofsocial networks in multiple fish populations were inves-tigated. To our knowledge this is the first study to pro-vide replication of social networks and thereforeprobably the first that allows general conclusions to bedrawn. The social networks were all found to have anon-random structure and exhibited ‘social cliquish-ness’. A number of factors were observed to contributeto this structuring. Firstly, social network structure wasinfluenced by body length and shoaling tendency, withindividuals interacting more frequently with conspecificsof similar body length and shoaling tendency. Secondly,individuals with many social contacts were found tointeract with each other more often than with otherconspecifics, a phenomenon known as a ‘positive degreecorrelation’. Finally, repeated interactions between pairsof individuals occurred within the networks more oftenthan expected by random interactions. The observednetwork structures will have ecological and evolutionaryimplications. For example, the occurrence of positivedegree correlations suggests the possibility that patho-gens and information (that are socially transmitted)could spread very fast within the populations. Further-more, the occurrence of repeated interactions betweenpairs of individuals fulfils an important pre-requisite forthe evolution of reciprocal altruism.
Keywords Guppies Æ Sticklebacks Æ Group living ÆSocial organisation
Introduction
Understanding the social organisation of animal socie-ties has been of interest to biologists for some time.Previous investigations have generally considered thenature of dyadic interactions between individuals (seeWhitehead and Dufault 1999 for a review). However,social interactions rarely occur in isolation; so, to trulyunderstand sociality, we need to consider the structureof the social network within which dyadic interactionsoccur. For example, co-operation, information anddisease transmission cannot be fully understood in socialspecies without considering the social network structureover which such processes occur (Abramson andKuperman 2001; Latora and Marchiori 2001; Mooreand Newman 2000; Watts and Strogatz 1998). Very fewinvestigations have quantified social network structurefor animal populations (Croft et al. 2004a; Lusseau2003) and virtually nothing is known about factorsinfluencing social network structure.
Social interactions between animals are often char-acterised by non-random partner selection (see White-head and Dufault 1999 for a review of the literature),and may be influenced by a number of phenotypic,behavioural and ecological factors. For example, infishes, shoals frequently assort by phenotype character-istics including; body-length, species, colour and parasiteload (see Krause et al. 2000 for a review). Such assor-tative interactions may confer important adaptive ben-efits, including reduced predation risk through predatorconfusion (Theodorakis 1989). Phenotypic assortmentby size may also have implications for foraging efficiency(Krause 1994; Ranta et al. 1994). There may also beadaptive benefits of associating with familiar individu-als, including reducing the risk of predation (Chiverset al. 1995), and increasing food intake through reducedcompetition (Utne-Palm and Hart 2000). Accordingly,active preference for familiars has been documented in anumber of fish species (see Griffiths 2003; Ward andHart 2003 for reviews), though little is known about how
D. P. Croft (&) Æ M. S. Botham Æ J. KrauseSchool of Biology, University of Leeds,Leeds, LS2 9JT, UKE-mail: [email protected]: +44-113-2332835
R. James Æ D. MawdsleyDepartment of Physics, University of Bath,Bath, BA2 7AY, UK
A. J. W. WardDepartment of Biology, University of Leicester,Leicester, LE1 7RH, UK
Oecologia (2005) 143: 211–219DOI 10.1007/s00442-004-1796-8

inter-individual interactions on a local scale link withlarger scale population structure.
Social network theory can help bridge the gap be-tween social interactions at the local and global level andprovides a framework for the study of sociality. Socialnetworks can be constructed from information on inter-individual interactions (see Newman 2003 for a review),with individual animals (nodes) inter-connected by theirsocial ties (edges) (Fig. 1). From such a network, stan-dard measures can be calculated including path length(L), clustering coefficient (C) and mean degree of con-nectedness (k) (Albert and Barabasi 2002; Newman2003), characterising network structure. L is calculatedas the mean number of connections in the shortest pathbetween two individuals in the network (see Newman2003). L describes a global property of the network, andmay be used to give a simple indicator of how quicklysocial information and socially transmissible diseaseswill spread in an animal population (e.g. in a populationof a given size, disease can be expected to spread morequickly for lower values of L). C is a measure of thecliquishness of the network, calculated as the meanfraction of all possible connections that occur in thelocal neighbourhood (see Newman 2003). C describes an
average local property of the network, and is of partic-ular interest because it measures the extent to which twoof one’s network neighbours are themselves neighbours;in social animals this local structure may be due to activeassociations (e.g. phenotype assortment or associationsbetween familiar individuals). The degree of an indi-vidual (from which k is derived) is simply the number ofdirect social connections (edges) that an individual has(Fig. 1). The mean degree for the network (k) is thencalculated as the average of the individual degrees. To-gether values of L, C and k can be used to describe thestructural properties of the network (see Watts andStrogatz 1998).
Recent work on both fish (guppies, Poecilia reticula-ta) (Croft et al. 2004a) and dolphins (Tursiops truncates)(Lusseau 2003), suggests that wild animal populationsare characterised by non-random social network struc-ture. In particular, networks appear to have relativelyshort path lengths (small L values) whilst being highlystructured (large C values) (Croft et al. 2004a). Verylittle is known about the factors underlying this struc-turing. For example, the extent to which assortativeinteractions based on phenotype (e.g. size and sex)influence network structure in animal populations re-mains largely unexplored. Individuals in social networksmay also assort by their social tendencies; it is welldocumented that social networks in humans are gener-ally characterised by a positive degree correlation(Newman 2003), whereby individuals with a high degreeare connected to others with a high degree, and vice-versa (see Fig. 2). However it is largely unknown towhat extent animals assort by degree. The nature of thedegree correlation within a population will have poten-tially important implications for the transmission ofinformation and disease. For example, a pathogen canbe expected to spread very quickly between all individ-uals with high degree in a population with positive
Fig. 1 Building a network from mark-recapture data in a group-living animal species. Animals are represented as dots (nodes) andinterconnected by a line (edge) if they were found together in thesame group. In a population of 6 marked and released individuals,two groups are caught on day 1 and one group on day 2.Superimposing the data from day 2 onto day 1 interconnects thewhole population. As pairs of individuals are recaptured in thesame group their AS increases. For example, individuals 1 and 2were captured in the same group on both days 1 and 2, giving theman AS of two on day 2. The values of the associated networkdescriptors are displayed. Day 1:2 groups, (1 2 3) (4 5 6), L=1,C=1, k=2. Day 2: 2 Groups, (1 2 4), L=1.6, C=0.778, k=2.667
Fig. 2 A toy network that exhibits a positive degree correlation,whereby individuals directly interact with others with a similardegree (filled circle degree=3 (i.e. individuals are connected tothree other individuals), open circle degree=2, k (meandegree)=2.5)
212

degree correlation, leading to an extremely virulentepidemic.
A major constraint with previous investigations intothe structure of social networks in wild animal popula-tions (e.g. Croft et al. 2004a; Lusseau 2003) is that theylack replication, making it difficult, if not impossible, todraw any general conclusions. In the current investiga-tion, we present data on the network structure of mul-tiple populations of the guppy and one population ofthree-spined stickleback (Gasterosteus aculeatus), givinginsight into the generality of social network structure infish populations.
To probe the role of assortative mixing in influencingnetwork structure, we investigate assortative interactionsboth as a function of body length and individual degree inthe fish networks. Given the adaptive benefits of pheno-typic assortment (see above), we predict that individualswill directly associate in the network with others of asimilar body length. We investigate assortative mixing bydegree by plotting the degree correlation (in which thedegree of each individual is correlated with the mean de-gree of its immediate network neighbours (Pastor-Saorraset al. 2001)) (see Fig. 2). However, as the mechanismsunderlying assortative mixing by degree are not trulyunderstood (Newman 2003), no directional predictioncan be made in this regard for these populations.
Finally, we investigate how the composition of thenetwork changes with increasing ‘‘association-strength’’(AS, defined below) between pairs of animals, both as afunction of body length and sex. Male guppies areknown to move between pools (populations) more thanfemales (Croft et al. 2003b), and this movement isthought to be adaptive allowing males to search formating opportunities with novel females that are morereceptive to their mating attempts (Farr 1977; Hugheset al. 1999). Thus, we predict that if we construct net-works in which edges exist only if their AS exceeds somechosen threshold, the fish involved in these networks willbecome female-biased as the threshold is raised. Fur-thermore, we investigate the tendency for individuals toform persistent pair-wise interactions, predicting thatsocial interactions between individuals will be stable,thus facilitating the development of familiarity (and itsassociated benefits, see above).
To test these predictions, we conducted a number ofmark release and recapture investigations, individuallytagging fish and recording their shoal companions on adaily basis. From this information we were able toconstruct social networks for the populations that allowus to extract information on the social organisation ofthe populations.
Materials and methods
Study species
Both guppies and sticklebacks are particularly suitableas models for the application of network theory to
describe social structure for several reasons. Firstly,both are classic models in evolutionary and behaviouralbiology (Magurran et al. 1995; Milinski 1987; Ranta andLindstrom 1990; Ward et al. 2002) and as a result muchis known about their behaviour and ecology (see Belland Foster 1994; Houde 1997). Furthermore, both spe-cies can be given individual identification marks, exhibitlimited spatial movement and are easily recaptured(Croft et al. 2003a; Ward et al. 2002), allowing us tomonitor social interactions over extended time periods.
Population sampling
Guppies
All adult guppies were captured from four pools(Table 1) in the Arima river (within 500 m of VerdantVale Village, 10�41¢N, 61�17¢W) in the NorthernMountain Range of Trinidad during May 2002 (pools 1and 2) and 2003 (pools 3 and 4). Adult fish were cap-tured by making three passes in each pool using a 2-mbeach seine (mesh size=2 mm). In a previous investi-gation Croft et al. (2003a) demonstrated that this sam-pling technique was highly effective, with populationestimates using MICROFISH 3.0, (Van Deventer andPlatts 1983; 1985) not differing from the total catch infive pools after three sampling passes. After capture,each population was kept in a separate holding pool(diameter=160 cm, water depth=15 cm) for markingpurposes. Guppies were given individual identity marksby injecting different colours of visible implant fluores-cent elastomer (VIE) in two of six positions on thedorsal area (for details of marking technique see Croftet al. 2003a). In a control experiment guppies markedwith VIE exhibited 1.25% (one fish) tag loss and lowmortality (6.25%, five fish) over an 8-day period (seeCroft et al. 2003a). Furthermore, the presence of theidentification mark did not have a significant effect onshoal choice behaviour (Croft et al. 2004a).
All fish from a pool were simultaneously released intothe centre of their original pool 24 h after capture.Resampling began 24 h after release and was under-taken once per day between 1000 and 1400 hours for aperiod of 7 days. However, for population 1 it was notpossible to carry out the resampling procedure on one ofthe days (day 5) because the river was flooded. During
Table 1 Pool dimensions for each of the four populations of gup-pies. Also presented are the number of males and females capturedper pool
Population Length(m)
Width(m) (max)
Depth(m) (max)
$ #
Guppy pool 1 10 5.3 0.31 72 75Guppy pool 2 14.6 6 0.48 77 46Guppy pool 3 14 6.6 0.54 81 29Guppy pool 4 23 6.9 0.56 77 66
213

each resampling event entire shoals were captured fromthe pools using a 2-m beach seine (see Croft et al. 2003bfor details). Shoals were only released back into the poolafter the composition of all shoals had been recorded.
Sticklebacks
Nine shoals of three-spine sticklebacks were capturedduring September 2001, using a two-person beach seine(see Ward et al. 2002 for details), from a 90-m straightstretch of the main inflow channel to Morice Lake (nearSackville, New Brunswick, Canada, 45�55¢N, 64�21¢W)(see Ward et al. 2002 for further details of the study site).Shoals were visually identified prior to capture and onlyshoals where both observers were satisfied that the entireshoal had been captured were used in the investigation.All fish in the nine shoals (N=101) were individuallymarked in the field using the method described by Wardet al. (2002), whereby fish were tagged with unique tagsusing a small section of Tygon laboratory tubing placedon the anterior dorsal spine. Fish were released at thepoint of capture immediately after all fish in the shoalhad been tagged. In a control experiment, sticklebacksmarked with the above method exhibited 0% tag lossand no mortality over a 5-day period (Ward et al. 2002).The presence of the tubing tag did not have a significanteffect on shoal choice behaviour, with untagged test fishexhibiting no preference when presented with a choicebetween a tagged and an untagged stimulus fish(Wilcoxon test, N=12, z= �0.39, P=0.695).
Shoals were recaptured over a 5-day period between0900 and 1600 hours, within a 15-m long stretch of themain inflow channel, where shoals frequently encountereach other (Ward et al. 2002), creating the potential forconsiderable exchange of individuals between shoals.The identities of all tagged fish captured in a shoal wererecorded, and shoals were released back into theexperimental area only after the composition of allshoals had been recorded.
Building social networks
The social networks we considered were constructedfrom the membership of the recaptured shoals (where ashoal is defined as two or more fish within four bodylengths (see Croft et al. 2003b)), and accumulated overthe 7 days of the experiment (Fig. 1). A direct networkedge was taken to exist between a given pair of fish ifthose fish were ever caught together in the same shoal(see Croft et al. 2004a). The AS of each pair (edge) wasdefined as the number of days on which that pair werecaught together in a shoal (Fig. 1).
Characterising social network structure
Most conventional measures of network structure(Albert and Barabasi 2002) have been developed for the
analysis of unweighted networks, in which the AS of allexisting pair-wise connections between fish is given unitstrength, irrespective of how many times that pair wasfound together. In the interests of consistency, weconstructed unweighted networks for each of our fivepopulations. From these networks we calculated stan-dard network measures, including path length (L)clustering coefficient (C) and mean degree of connect-edness (k) (see above). We compared the observednetwork values of L and C to the values calculated fora network containing the same number of social con-nections, but with the connections placed randomlybetween agents (see Watts and Strogatz 1998), high-lighting the extent to which the observed networkdeviated from that expected by random interactionsbetween individuals.
Assortative interactions in social networks
We investigated the extent of assortative mixing in thenetworks both as a function of degree and body length.We measured the degree correlation in our fish popu-lation by correlating the degree of each individual withthe mean degree of its network neighbours (Pastor-Saorras et al. 2001) (see Fig. 2). Similarly, we investi-gated the role of body length in structuring socialinteractions in the network by correlating the mean bodylength of the network neighbours of an individual withthe body length of that individual.
The standard network measures described above arebased on unweighted ties between individuals and thusdo not allow us to analyse features of the network as afunction of association-strength. Initially, we investi-gated if the composition of the network changes as afunction of AS. For example, it may be that associationsat a higher strength are largely the result of individualsof a certain size or sex interacting together. To investi-gate this, we calculated the median body length ofindividuals and sex composition of the network (per-centage males) at AS‡1, ‡2 and ‡3.
Repeated pair-wise interactions
To calculate the persistence of pair-wise interactions,we denote all pairs with AS‡3 as ‘‘persistent’’ (AS=7 isthe maximum value when defining persistent pairs inthe current investigation). To test for the repeated co-occurrence of pairs of fish, we compared the observednumber of persistent pairs (AS‡3) in each populationto the expected value from a null model of shoalmembership. To generate these expected values,marked fish were reallocated at random to the observedrecaptured daily shoal sizes (see Ward et al. 2002), andthe weighted social network for each ‘‘random catch’’constructed and analysed. This operation was repeated1,000 times to provide expected frequency distributionsof our test statistic. P-values were obtained by
214

comparing the expected values for pair-wise interac-tions with three or more ties with the observed ones(see Crowley 1992).
Results
Characterising social network structure
Substantial proportions of fish were recaptured at leastonce in each population (between 60% and 90%Table 2). Unweighted networks were constructed foreach population. As an example, the social network forguppy population 1 consists of a giant connected com-ponent (GCC) containing N=134 of 136 fish recap-tured, plus one isolated network (consisting of two fish).The GCC network is sparse, containing 1,465 differentconnections (E) out of a possible 8,911 (Emax), yet highlystructured, a trend that is consistent across all fivepopulations (Table 2).
From the GCCs, standard network measures werecalculated for each population (Table 2). For example,in guppy population 1, L=2.04 (i.e. on average any twofish out of N=134 can be connected via 2.04 others),C=0.64 indicating high cliquishness, and k (the averagenumber of conspecifics a fish is directly connected to, seeFig 1) is 21.9. Values of L and C are consistent acrosspopulations and between species with L‡2 and C‡0.5(Table 2).
Also shown in Table 2 are the values of L and C thatwould be expected of networks with the same N, k andnumber of pair-wise connections, but with E connec-tions entirely randomised between fish. In each popu-lation the observed values of L are close to randomwhilst the observed values of C are substantially largerthan random.
Assortative interactions in social networks
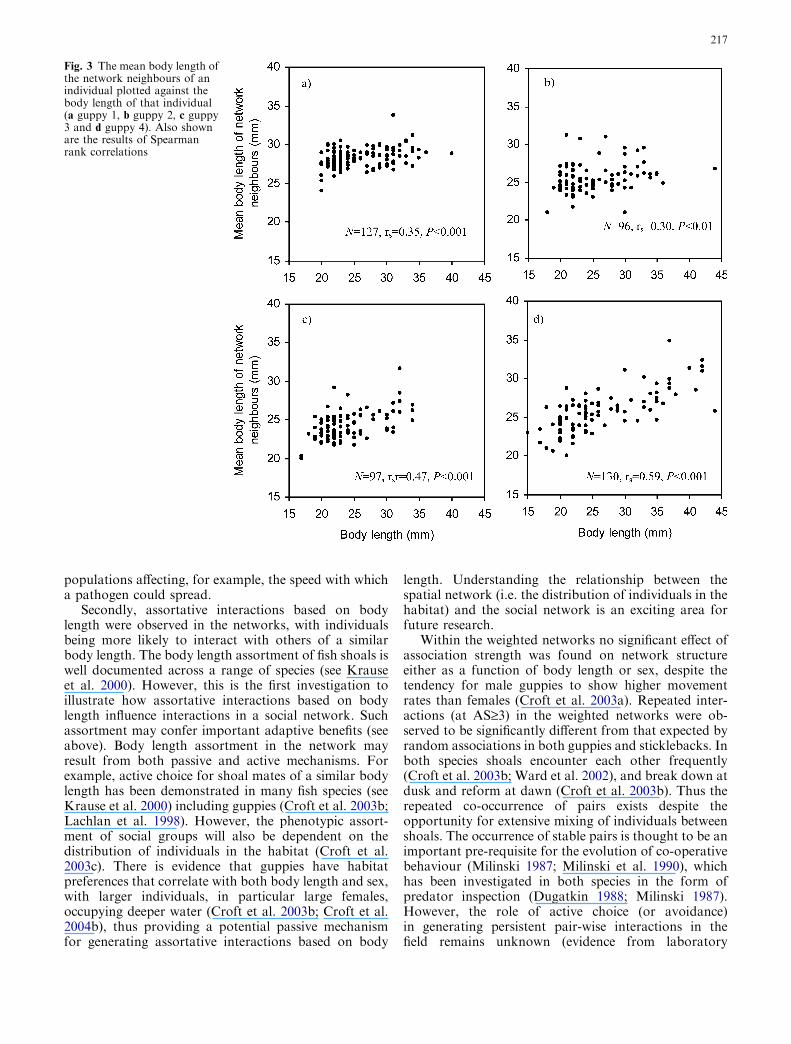
The degree correlation was positive for all five popula-tions (Table 3). Note, however, that k was also posi-tively correlated with the recapture frequency of fish andtheir shoaling tendency (Table 3). A positive correlationwas also observed between the body length of an indi-vidual and the mean body length of its network neigh-bours in all four guppy populations (Fig. 3). However, itshould be noted that body length data was unavailablefor some individuals (population 1: N=6, population 2:N=3, population 4: N=3). This trend was not analysedfor the population of sticklebacks due to a large pro-portion of body length data missing (N=25).
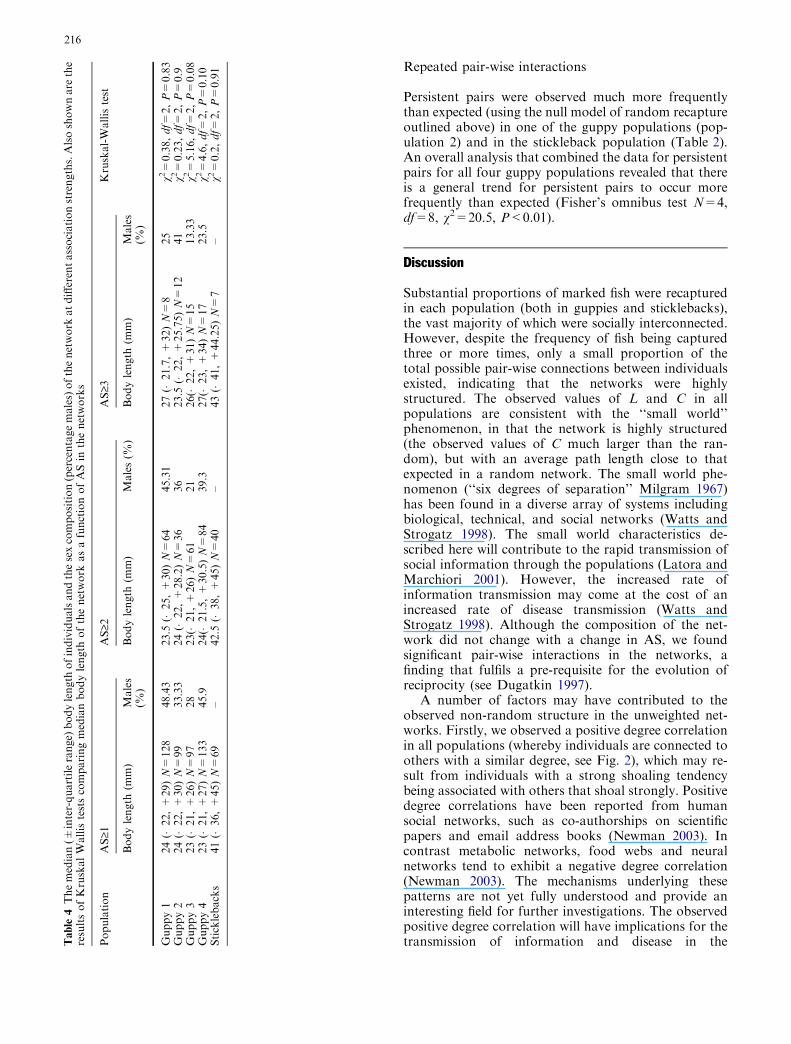
Association strength did not have a significant effecton the body length composition of the network in anypopulation (see Table 4). Furthermore, overall AS didnot have a significant effect on the sex composition ofthe network across the guppy populations (FriedmanTest df=2, v2=2, P=0.37, see Table 4).
Table 2 Standard network values for each population. Ntotal is thenumber of individuals marked and released. %recap is the propor-tion of individuals recaptured one or more times. N is the totalnumber of fish connected in the GCC. Emax is the maximumnumber of possible connections in the network (Emax=1/2 N(N�1)) and E is the observed number of different connections inthe network. L is mean path length, C is the clustering coefficientand k is the mean degree (mean number of total connections per
individual). Also presented are the expected values of L (Lrand) andC (Crand) assuming random interactions between individuals in thenetwork (see Watts and Strogatz 1998 for details). NP is the ob-served number of pairs caught 3 or more times per populations.Also presented is the probability (P) that the observed number ofpairs caught 3 or more times was greater than the expected value,based on a null model built on random shoal membership
Population Ntotal %recap N Emax E k L Lrand C Crand NP P
Guppy 1 147 92 134 8,911 1,465 21.9 2.04 1.59 0.64 0.16 5 0.62Guppy 2 123 82 99 4,851 726 14.7 2.34 1.71 0.77 0.15 29 <0.01Guppy 3 110 96 97 4,656 837 17.3 2.00 1.61 0.57 0.18 9 0.11Guppy 4 143 93 133 8,778 1,511 22.7 2.01 1.60 0.60 0.17 9 0.07Sticklebacks 110 67 94 4,371 1,325 28.2 2.05 1.36 0.87 0.3 6 0.02
Table 3 The recapture profile of each population, showing thefrequency at which individuals were captured. Also shown are theresults of Spearman correlations of the degree of each individualwith the mean degree of its network neighbours (see Fig. 2), their
respective recapture frequency (no. of times a fish was re-caughtover the 7 days) and the shoaling tendency (mean shoal size a fishwas found in over the sampling period)
Population Number of times recaptured N Mean degree Recapturefrequency
Mean shoal size
1 2 3 4 5 6 7
Guppy 1 32 26 28 29 11 8 134 rs=0.66 P<0.001 rs=0.48 P<0.001 rs=0.74 P<0.001Guppy 2 43 32 5 4 7 7 1 99 rs=0.70 P<0.001 rs=0.84 P<0.001 rs=0.67 P<0.001Guppy 3 14 19 22 16 13 9 4 97 rs=0.28 P<0.005 rs=0.79 P<0.001 rs=0.50 P<0.001Guppy 4 20 34 24 36 15 3 1 133 rs=0.50 P<0.001 rs=0.80 P<0.001 rs=0.62 P<0.001Sticklebacks 40 30 16 8 94 rs=0.66 P<0.001 rs=0.43 P<0.001 rs=0.76 P<0.001
215
Repeated pair-wise interactions
Persistent pairs were observed much more frequentlythan expected (using the null model of random recaptureoutlined above) in one of the guppy populations (pop-ulation 2) and in the stickleback population (Table 2).An overall analysis that combined the data for persistentpairs for all four guppy populations revealed that thereis a general trend for persistent pairs to occur morefrequently than expected (Fisher’s omnibus test N=4,df=8, v2=20.5, P<0.01).
Discussion
Substantial proportions of marked fish were recapturedin each population (both in guppies and sticklebacks),the vast majority of which were socially interconnected.However, despite the frequency of fish being capturedthree or more times, only a small proportion of thetotal possible pair-wise connections between individualsexisted, indicating that the networks were highlystructured. The observed values of L and C in allpopulations are consistent with the ‘‘small world’’phenomenon, in that the network is highly structured(the observed values of C much larger than the ran-dom), but with an average path length close to thatexpected in a random network. The small world phe-nomenon (‘‘six degrees of separation’’ Milgram 1967)has been found in a diverse array of systems includingbiological, technical, and social networks (Watts andStrogatz 1998). The small world characteristics de-scribed here will contribute to the rapid transmission ofsocial information through the populations (Latora andMarchiori 2001). However, the increased rate ofinformation transmission may come at the cost of anincreased rate of disease transmission (Watts andStrogatz 1998). Although the composition of the net-work did not change with a change in AS, we foundsignificant pair-wise interactions in the networks, afinding that fulfils a pre-requisite for the evolution ofreciprocity (see Dugatkin 1997).
A number of factors may have contributed to theobserved non-random structure in the unweighted net-works. Firstly, we observed a positive degree correlationin all populations (whereby individuals are connected toothers with a similar degree, see Fig. 2), which may re-sult from individuals with a strong shoaling tendencybeing associated with others that shoal strongly. Positivedegree correlations have been reported from humansocial networks, such as co-authorships on scientificpapers and email address books (Newman 2003). Incontrast metabolic networks, food webs and neuralnetworks tend to exhibit a negative degree correlation(Newman 2003). The mechanisms underlying thesepatterns are not yet fully understood and provide aninteresting field for further investigations. The observedpositive degree correlation will have implications for thetransmission of information and disease in theT
able
4Themedian(±
inter-quartilerange)
bodylength
ofindividualsandthesexcomposition(percentagemales)ofthenetwork
atdifferentassociationstrengths.Alsoshownare
the
resultsofKruskalWallistestscomparingmedianbodylength
ofthenetwork
asafunctionofASin
thenetworks
Population
AS
‡1AS
‡2AS
‡3Kruskal-Wallistest
Bodylength
(mm)
Males
(%)
Bodylength
(mm)
Males(%
)Bodylength
(mm)
Males
(%)
Guppy1
24(�
22,+
29)N=
128
48.43
23.5
(�25,+
30)N=
64
45.31
27(�
21.7,+
32)N=
825
v2=
0.38,df=
2,P=
0.83
Guppy2
24(�
22,+
30)N=
99
33.33
24(�
22,+
28.2)N=
36
36
23.5
(�22,+
25.75)N=
12
41
v2=
0.23,df=
2,P=
0.9
Guppy3
23(�
21,+
26)N=
97
28
23(�
21,+
26)N=
61
21
26(�
22,+
31)N=
15
13.33
v2=
5.16,df=
2,P=
0.08
Guppy4
23(�
21,+
27)N=
133
45.9
24(�
21.5,+
30.5)N=
84
39.3
27(�
23,+
34)N=
17
23.5
v2=
4.6,df=
2,P=
0.10
Sticklebacks
41(�
36,+
45)N=
69
–42.5
(�38,+
45)N=
40
–43(�
41,+
44.25)N=
7–
v2=
0.2,df=
2,P=
0.91
216
populations affecting, for example, the speed with whicha pathogen could spread.
Secondly, assortative interactions based on bodylength were observed in the networks, with individualsbeing more likely to interact with others of a similarbody length. The body length assortment of fish shoals iswell documented across a range of species (see Krauseet al. 2000). However, this is the first investigation toillustrate how assortative interactions based on bodylength influence interactions in a social network. Suchassortment may confer important adaptive benefits (seeabove). Body length assortment in the network mayresult from both passive and active mechanisms. Forexample, active choice for shoal mates of a similar bodylength has been demonstrated in many fish species (seeKrause et al. 2000) including guppies (Croft et al. 2003b;Lachlan et al. 1998). However, the phenotypic assort-ment of social groups will also be dependent on thedistribution of individuals in the habitat (Croft et al.2003c). There is evidence that guppies have habitatpreferences that correlate with both body length and sex,with larger individuals, in particular large females,occupying deeper water (Croft et al. 2003b; Croft et al.2004b), thus providing a potential passive mechanismfor generating assortative interactions based on body
length. Understanding the relationship between thespatial network (i.e. the distribution of individuals in thehabitat) and the social network is an exciting area forfuture research.
Within the weighted networks no significant effect ofassociation strength was found on network structureeither as a function of body length or sex, despite thetendency for male guppies to show higher movementrates than females (Croft et al. 2003a). Repeated inter-actions (at AS‡3) in the weighted networks were ob-served to be significantly different from that expected byrandom associations in both guppies and sticklebacks. Inboth species shoals encounter each other frequently(Croft et al. 2003b; Ward et al. 2002), and break down atdusk and reform at dawn (Croft et al. 2003b). Thus therepeated co-occurrence of pairs exists despite theopportunity for extensive mixing of individuals betweenshoals. The occurrence of stable pairs is thought to be animportant pre-requisite for the evolution of co-operativebehaviour (Milinski 1987; Milinski et al. 1990), whichhas been investigated in both species in the form ofpredator inspection (Dugatkin 1988; Milinski 1987).However, the role of active choice (or avoidance)in generating persistent pair-wise interactions in thefield remains unknown (evidence from laboratory
Fig. 3 The mean body length ofthe network neighbours of anindividual plotted against thebody length of that individual(a guppy 1, b guppy 2, c guppy3 and d guppy 4). Also shownare the results of Spearmanrank correlations
217

experiments suggests that pair-wise persistence could bebased on active choice (Croft et al. 2004a)). Futureinvestigations should explicitly test for active partnerpreference between persistent pairs that occur in thefield. For example, by using a binary choice test,whereby a test fish is giving a choice between its observedpartner and a phenotypically similar partner from thesame location with which it rarely or never associates.
The potential for individual recognition may beconstrained by the total population size. For example,Griffiths and Magurran (1997) demonstrated that gup-pies appear to remember approximately 30 other indi-viduals. Although in the current investigationpopulation size exceeded 30 individuals in each case,guppies directly interacted with a limited number ofothers in the network, between 15 and 22 (Table 2).Thus it is possible that all guppies that are directlyconnected in the networks are familiar with each other.However, further work is required to establish if thisnumber remains stable over longer time periods.
The application of network theory to the social net-works of animal populations is an exciting area for fu-ture research. Here, we show how network theory maybe used to investigate assortative interactions in animalpopulations, an understanding of which will haveimplications for a variety of important issues. Forexample, an understanding of the topology of socialnetworks in wild populations may allow us to makepredictions regarding patterns of co-operative behaviour(Abramson and Kuperman 2001), and the social trans-mission of information (Latora and Marchiori 2001)and disease (Watts and Strogatz 1998) through popu-lations.
Acknowledgements We would like to thank Bethany Arrowsmithand Michael Webster for their assistance in collecting the data inthe field and Christina Prell for advice on social network analysis.We would also like to thank Ronnie Hernandez and the board ofAsa Wright Nature Centre, Trinidad, for their continued supportand assistance in the field. D.P.Croft would like to acknowledgefunding from the Frank Parkinson scholarship (University ofLeeds), FSBI and the Leverhulme trust.
References
Abramson G, Kuperman M (2001) Social games in a social net-work. Phys Rev E 6303:art. no. 030901
Albert R, Barabasi AL (2002) Statistical mechanics of complexnetworks. Rev Mod Phys 74:47–97
Bell MA, Foster SA (eds) (1994) The evolutionary biology of thethreespine stickleback. Oxford University Press, Oxford
Chivers DP, Brown GE, Smith RJF (1995) Familiarity and shoalcohesion in fathead minnows (Pimephales promelas)—implica-tions for antipredator behaviour. Can J Zool 73:955–960
Croft DP et al (2003a)Mechanisms underlying shoal composition inthe Trinidadian guppy (Poecilia reticulata). Oikos 100:429–438
Croft DP, Albanese B, Arrowsmith BJ, Botham M, Webster M,Krause J (2003b) Sex biased movement in the guppy (Poeciliareticulata). Oecologia 137:62–68
Croft DP, Krause J, Couzin ID, Pitcher TJ (2003c) When fishshoals meet: outcomes for evolution and fisheries. Fish Fish-eries 4:138–146
Croft DP, Krause J, James R (2004a) Social networks in the guppy(Poecilia reticulata). Proc R Soc Lond Biol Lett 271:516–519
Croft DP, Botham MS, Krause J (2004b) Is sexual segregation inthe guppy, Poecilia reticulata, consistent with the predation riskhypothesis? Environ Biol Fishes 71:127–133
Crowley PH (1992) Resampling methods for computation-intensivedata-analysis in ecology and evolution. Annu Rev Ecol Syst23:405–477
Dugatkin LA (1988) Do guppies play tit for tat during predatorinspection visits. Behav Ecol Sociobiol 23:395–399
Dugatkin LA (1997) Cooperation among animals: an evolutionaryperspective. Oxford University Press, New York
Farr JA (1977) Male rarity of novelty, female choice behaviour,and sexual selection in the guppy Poecilia reticulata (Pisces:Poeciliidae). Evolution 31:162–168
Griffiths SW (2003) Learned recognition of conspecifics by fishes.In: Brown C, Laland KN, Krause J (eds) Fish are smarter thanyou think: learning in fishes. Fish Fisheries (Spec Edn) 4:256–268
Griffiths SW, Magurran AE (1997) Schooling preferences forfamiliar fish vary with group size in a wild guppy population.Proc R Soc Lond Ser B Biol Sci 264:547–551
Houde AE (1997) Sex, color, and mate choice in guppies. PrincetonUniversity Press, Princeton
Hughes KA, Du L, Rodd FH, Reznick DN (1999) Familiarityleads to female mate preference for novel males in the guppy,Poecilia reticulata. Anim Behav 58:907–916
Krause J (1994) Differential fitness returns in relation to spatialpositions in groups. Biol Rev 69:187–206
Krause J, Butlin R, Peuhkuri N, Pritchard VL (2000) The socialorganisation of fish shoals: a test of the predictive power oflaboratory experiments for the field. Biol Rev 75:477–501
Lachlan RF, Crooks L, Laland KN (1998) Who follows whom?Shoaling preferences and social learning of foraging informa-tion in guppies. Anim Behav 56:181–190
Latora V, Marchiori M (2001) Efficient behavior of small-worldnetworks. Phys Rev Lett 8719:art. no.198701
Lusseau D (2003) The emergent properties of a dolphin socialnetwork. Proc R Soc Lond Ser B Biol Sci 270:S186–S188
Magurran AE, Seghers BH, Shaw PW, Carvalho GR (1995) Thebehavioural diversity and evolution of guppy, Poecilia reticu-lata, populations in Trinidad. Adv Stud Behav 24:155–202
Milgram S (1967) The small-world problem. Psychol Today 2:60–67
Milinski M (1987) TIT FOR TAT in sticklebacks and the evolutionof co-operation. Nature 325:433–435
Milinski M, Pfluger D, Kulling D, Kettler R (1990) Do sticklebackscooperate repeatedly in reciprocal pairs? Behav Ecol Sociobiol27:17–21
Moore C, Newman MEJ (2000) Epidemics and percolation insmall-world networks. Phys Rev E 61:5678–5682
Newman MEJ (2003) The structure and function of complex net-works. SIAM Rev 45:167–256
Pastor-Saorras R, Vazquez A, (2001) Dynamical and correlationproperties of the Internet. Phys Rev Lett:art. no. 258701
Ranta E, Lindstrom K (1990) Assortative schooling in 3-spinedsticklebacks. Ann Zool Fenn 27:67–75
Ranta E, Peuhkuri N, Laurila A (1994) A theoretical exploration ofantipredatory and foraging factors promoting phenotype-as-sorted fish schools. Ecoscience 1:99–106
Theodorakis CW (1989) Size segregation and the effects of oddityon predation risk in minnow schools. Anim Behav 38:496–502
Utne-Palm AC, Hart PJB (2000) The effects of familiarity oncompetitive interactions between threespined sticklebacks. Oi-kos 91:225–232
Van Deventer JS, Platts WS (1983) Sampling and estimating fishpopulations from streams.TransNAmWildNatRes 48:349–354
Van Deventer JS, Platts WS (1985) A computer software system forentering, managing, and analyzing fish capture data fromstreams. Research Note INT-352. Ogden, UT: U.S. Depart-ment of Agriculture, Forest Service. Intermountain Forest andRange Experiment Station
218

Ward AJW et al (2002) Association patterns and shoal fidelity inthe three-spined stickleback. Proc R Soc Lond Ser B Biol Sci269:2451–2455
Ward AJW, Hart PJB (2003) The effects of kin and familiarity oninteractions between fish. Fish Fisheries 4:348–358
Watts DJ, Strogatz SH (1998) Collective dynamics of ‘small-world’networks. Nature 393:440–442
Whitehead H, Dufault S (1999) Techniques for analyzing verte-brate social structure using identified individuals: review andrecommendations. In: Advances in the study of behavior, vol28. Academic, San Diego, pp 33–74
219
Copyright © 2022 FDOKUMEN