
Diet and Prey Selection by Lake Superior Lake Trout during Spring, 1986–2001
Upload
independentCategory
view
2download
0
Sustainability of the Lake SuperiorFish Community: Interactions in a
Food Web Context
James F. Kitchell,1* Sean P. Cox,1 Chris J. Harvey,1 Timothy B. Johnson,1
Doran M. Mason,1 Kurt K. Schoen,1 Kerim Aydin,2 Charles Bronte,3
Mark Ebener,4 Michael Hansen,5 Michael Hoff,3 Steve Schram,6
Don Schreiner,7 and Carl J. Walters8
Center for Limnology, 680 N. Park Street, University of Wisconsin–Madison, Madison, Wisconsin, USA 53706; 2School ofFisheries, University of Washington, Seattle, Washington, USA; 3United States Geological Survey, Great Lakes Science Center,
Lake Superior Biological Station, Ashland, Wisconsin, USA; 4Chippewa–Ottawa Treaty Fishery Management Authority, Sault Ste.Marie, Michigan, USA; 5College of Natural Resources, University of Wisconsin–Stevens Point, Stevens Point, Wisconsin, USA;6Wisconsin Department of Natural Resources, Bayfield, Wisconsin, USA; Minnesota Department of Natural Resources, Duluth,
Minnesota, USA; and 8Fisheries Centre, University of British Columbia, Vancouver, British Columbia, Canada
ABSTRACTThe restoration and rehabilitation of the native fishcommunities is a long-term goal for the LaurentianGreat Lakes. In Lake Superior, the ongoing restora-tion of the native lake trout populations is nowregarded as one of the major success stories in fish-eries management. However, populations of thedeepwater morphotype (siscowet lake trout) haveincreased much more substantially than those ofthe nearshore morphotype (lean lake trout), andthe ecosystem now contains an assemblage of ex-otic species such as sea lamprey, rainbow smelt, andPacific salmon (chinook, coho, and steelhead).Those species play an important role in defining theconstraints and opportunities for ecosystem man-agement. We combined an equilibrium mass bal-ance model (Ecopath) with a dynamic food webmodel (Ecosim) to evaluate the ecological conse-quences of future alternative management strate-gies and the interaction of two different sets of lifehistory characteristics for fishes at the top of thefood web. Relatively rapid turnover rates occuramong the exotic forage fish, rainbow smelt, and itsprimary predators, exotic Pacific salmonids. Slowerturnover rates occur among the native lake troutand burbot and their primary prey—lake herring,
smelt, deepwater cisco, and sculpins. The abun-dance of forage fish is a key constraint for all sal-monids in Lake Superior. Smelt and Mysis play aprominent role in sustaining the current trophicstructure. Competition between the native laketrout and the exotic salmonids is asymmetric. Re-ductions in the salmon population yield only amodest benefit for the stocks of lake trout, whereasincreased fishing of lake trout produces substantialpotential increases in the yields of Pacific salmon torecreational fisheries. The deepwater or siscowetmorphotype of lake trout has become very abun-dant. Although it plays a major role in the structureof the food web it offers little potential for therestoration of a valuable commercial or recreationalfishery. Even if a combination of strong manage-ment actions is implemented, the populations oflean (nearshore) lake trout cannot be restored topre-fishery and pre-lamprey levels. Thus, manage-ment strategy must accept the ecological constraintsdue in part to the presence of exotics and choosealternatives that sustain public interest in the re-sources while continuing the gradual progress to-ward restoration.
Key words: fishes; fisheries; ecosystem; food web;Lake Superior; Great Lakes; modeling; Ecosim; Eco-path; trophic interactions.
Received 10 December 1999; accepted 13 June 2000.*Corresponding author: e-mail: [email protected]
Ecosystems (2000) 3: 545–560DOI: 10.1007/s100210000048 ECOSYSTEMS
© 2000 Springer-Verlag
545
INTRODUCTION
A new ecosystem perspective is emerging based onthe growing recognition that fishery exploitation isa major force in the structure of aquatic systems(NRC 1998; NMFS 1999). In fact, the ecosystemapproach has a long and substantial history in theLaurentian Great Lakes. The restoration, rehabilita-tion, and sustainability of native fish communitieshas been the primary focus of Great Lakes fisheriesmanagers (Burkett and others 1995). The goal is toestablish fish communities based on levels of self-sustaining stocks similar to those that existed priorto the major declines in fish populations due tooverexploitation, habitat loss, and invasion of thesea lamprey. Following the implementation of thesea lamprey control program in the 1950s (Smithand others 1974) and close regulation of commer-cial fisheries, the downward trends reversed andthe principal species began to recover (Dryer andKing 1968; MacCallum and Selgeby 1987; Hansenand others 1995a). Achieving these goals requiresthe recognition that the Lake Superior system nowincludes exotic species and that public interests arenow very different from those in the past. Thesefactors represent major constraints on the rehabili-tation and full restoration of native species. In ad-dition, some of these new exotics (for example,Pacific salmon) are also valuable renewable re-sources and thus represent new opportunities. At-taining an understanding of the balance betweensuch constraints and opportunities is the key pre-requisite to establishing realistic, sustainable man-agement strategies. Negus (1995) summarized theproblem succinctly:
Because of limited forage biomass, enhancementof lake trout may come at the expense of othersalmonine stocks. Such constraints will undoubt-edly raise opposition from anglers who have be-come accustomed to thinking of Lake Superior asan unlimited resource.
Of all the Laurentian Great Lakes, Lake Superioris the only one to retain significant native stocksrepresentative of its ancestral state (Burkett andothers 1995). Recent reports of the Great LakesFisheries Commission indicate that the Lake Supe-rior fish community continues to change in waysthat reflect the general goals of restoration andrehabilitation (Hansen 1994). For example, laketrout (Salmonidae) have established self-sustainingpopulations (Hansen 1995a, 1995b). As a result,resource managers have decided to eliminate stock-ing of lake trout from the Apostle Islands, Wiscon-sin, eastward to Grand Marais, Michigan (Anony-
mous 1996). In addition, members of the nativeCoregonus group (whitefish, lake herring, and deep-water cisco or chub, family Salmonidae) have recov-ered from their formerly low levels. Nevertheless,the system is and will remain different from that ofthe ancestral state.
The fish community now contains many exoticspecies (Table 1). Sea lamprey, rainbow smelt, Eur-asian ruffe, round goby, and naturalized, self-sus-taining populations of exotic Pacific salmon (pink,coho, chinook, and steelhead) plus Europeanbrown trout are major additions to an assemblageformerly dominated by lake trout, ciscoes, white-fish, sculpins (Cottidae), suckers (Catastomidae), andburbot (Gadidae). In addition, this system now sup-ports a variety of commercial and treaty rights fish-ery activities and a substantial tenor of interests inrecreational fisheries. The food web of Lake Supe-rior includes a diversity of interactions unknown acentury ago. Thus, there are significant and con-tinuing challenges to the effective definition of sus-tainable resource management goals (Kitchell 1991;Koonce and Jones 1994).
A general review of the current conditions inLake Superior reveals that food web interactions arestrongly expressed by trends in fish populations. A
Table 1. Common and Scientific Names ofFishes and Invertebrates
Common Name Scientific Name
Lake trout Salvelinus namaycushBrook trout (coaster) Salvelinus fontinalisSea lamprey Petromyzon marinusCoho salmon Oncorhynchus kisutchChinook salmon Oncorhynchus tshawytschaRainbow (steelhead)
trout Oncorhynchus mykissPink salmon Oncorhynchus gorbuschaBrown trout Salmo truttaBurbot Lota lotaDeepwater cisco
(bloater chub) Coregonus hoyiLake herring Coregonus artediiLake whitefish Coregonus clupeaformisEurasian ruffe Gymnocephalus cernuusRound goby Neogobius melanostomusRainbow smelt Osmerus mordaxSlimy sculpin Cottus cognatusDeepwater sculpin Myoxocephalus quadricornusSuckers Catastomus spp.Lake sturgeon Acipenser fulvescensWalleye Stizostedion vitreumMysids Mysis relicta
546 J. F. Kitchell and others

25-year record of stock assessment by the UnitedStates Geological Survey, Great Lakes Science Cen-ter (formerly the National Biological Service) indi-cates that the stock of lake herring—formerly thedominant prey of lake trout—is now 10 times thatobserved in the early 1980s and that their biomassis five to six times that of the dominant foragespecies, rainbow smelt (MacCallum and Selgeby1987; Conner 1991, Selgeby and others 1994;Bronte and Hoff 1999). Smelt biomass is now 25%of that observed 2 decades ago, and the age struc-ture has changed to strong dominance by juveniles(MacCallum and Selgeby 1987). As in Lake Michi-gan, these changes can be attributed largely to pre-dation effects (Stewart and Ibarra 1991). The de-cline in stocks of deepwater cisco follows much thesame pattern observed for smelt. This decline can beattributed to increased predation by the expandingpopulation of siscowet (deepwater form) lake trout(Selgeby and others 1994). As in Lake Michigan,commercial fisheries for whitefish have seen con-tinued increases or sustained levels in total yield.Lake trout comprise 90% of total salmonine yieldsin the recreational fishery (Peck and others 1994).In the most recent estimates (1990–92), lake troutharvests were at about 33% of fish communitygoals. Siscowet stocks began to recover after theimplementation of lamprey control and continuedto increase through the early 1980s. Stocks of near-shore lake trout (leans) have also increased, but lessdramatically so. The proportion of large mature fishincreased during the early 1980s but remains un-changed today. Wild (naturally reproduced) stocksdominate in the eastern regions and are generallyincreasing throughout the lake, although plantedfish continue to be more abundant than wild fish inMinnesota waters. Lamprey-induced mortality re-mains at about 15% per year for the preferredhosts, large lake trout. The growth rates of laketrout show no consistent lakewide trend over thepast 15 years; however, growth rates appear to bedeclining in the eastern regions of the lake, wherenative stocks are best established. The size and agestructure of the lake trout stocks suggest that mor-tality due to fishery harvests and lamprey predationhas yielded mortality rates at or near the targettotal.
Historically, lake trout preyed upon the abundantcoregonines (Coregonus spp.) (Dryer and others1965), but they switched to rainbow smelt aftersevere declines in the population of both the laketrout and coregonines and the exponential increasein rainbow smelt during the mid 1950s (Lawrie andRahrer 1972; Selgeby 1982). The diets of lake troutand the introduced salmonids contained up to 90%
rainbow smelt through the 1980s and early 1990s,even though the stocks of rainbow smelt declineddramatically during that period (Conner 1991; Con-ner and others 1993; Bronte and others 1994). Re-cent evidence suggests a shift in the diet of laketrout to a larger complement of Coregonus spp. andan increase in the occurrence of Mysis in the diets offish from the eastern waters of the lake (Bronte andothers 1994). A latitudinal gradient in diet compo-sition is also likely (Bronte and others 1994), similarto the north–south trend in Lake Michigan (Millerand Holey 1992) and Lake Huron (Diana 1990).
The remaining 10% of the recreational fisheryharvest derives largely from populations of steel-head, brown trout, coho, and chinook salmon. Al-though initially established by hatchery plantings,each of these anadromous species has since estab-lished some naturalized reproducing populations.The extent of their recruitment success and contri-bution to the fishery varies with time and differsamong regions of the lake (Peck and others 1999).This is a subject of substantial concern because at-tempts to restore lake trout stocks and the anadro-mous form of brook trout (‘coaster‘ brook trout)may be impeded if natal stream habitats are denselypopulated by other salmonids and/or if the forageresources available to the native stocks are alsoheavily preyed upon by exotic salmonids.
In this paper, we develop and apply a modelingapproach as one way to clarify the opportunitiesand constraints that must be addressed in develop-ing realistic plans for sustainable fishery manage-ment in Lake Superior. A second set of questionsaddressed herein relates to the variations in the lifehistory characteristics of exotic and native species asa factor in forecasting the outcome of restorationpractices in an ecological setting that is fundamen-tally different from that of the original condition. Aconfounding component of the latter issue is thateach of the exotic species has life history character-istics that make it apparently more r-selected thanits ecologically equivalent native species. For exam-ple, Pacific salmon grow more rapidly than laketrout, then typically mature and reproduce at agesof 2–4 years whereas native lake trout grow slowlyand mature at 6–7 years of age. Among the preyfishes, the exotic rainbow smelt matures at age 2 or3, whereas the native Coregonus spp. mature at ages3–5. Those characteristics make the exotics morelikely to respond quickly to perturbations—their lifehistories are among the ‘fast‘ variables in this foodweb. That response capacity is in contrast to the‘slow‘ variables expressed in the life histories of thenative apex predators, lake trout and burbot, andthe native prey, sculpins and Coregonus spp. Under
Lake Superior Food Web 547
ceteris paribus conditions, any increase in the abun-dance of limited prey resources would be first ex-pressed in the growth and survival rates for exoticsalmonids. Any management practice that in-creased the stocking rate of exotic salmonids wouldreduce the availability of food resources for thenearshore (lean) stocks of lake trout. Any manage-ment practice that altered mortality rates due tofisheries for salmonids would be expressed in pre-dation rates imposed on both exotic and native preyfishes.
In other words, this paper attempts to addresstwo of the most difficult problems faced by resourcemanagers and applied ecologists—the restoration ofecological systems and dealing with the perturba-tions caused by exotics. The structures of both thefood web and the management systems must ac-count for the fast variable responses that favor ex-otics and enhance the slow variable responses thatencourage the restoration of native species.
METHODS
Our analyses are based on the Ecosim model thatderives from the initial conditions estimated in ourdevelopment of an Ecopath model for the systemunder study. The Ecopath model was initially de-veloped by Polovina (1984) and subsequently mod-ified (Christensen and Pauly 1992) in applicationsto scores of ecosystems (Christensen and Pauly1993). At this writing, Ecopath models have beendeveloped for approximately 90 different systems(D. Pauly personal communication). Recent appli-cations include analyses of the linkage betweenprimary production and fish production for theworld’s oceans (Pauly and Christensen 1995) andestimates of changes in trophic structure due tofishery exploitation in both marine and freshwatersystems (Pauly and others 1998).
The derivation of the Ecopath models and theirapplication are detailed in Pauly and others (1993)and will be only briefly summarized herein. Thepertinent software and documentation are availablewithout cost at http//www.fisheries.com. The corecomponent of an Ecopath model is the balance ofproduction and losses for each component of anecosystem. It is expressed in the following equation:
Production 1 Immigration–
Predatory losses–Nonpredatory mortality–
Harvest–Emigration 5 0 (1)
In other words, the system is set to steady statebased on estimates of rates for each of the terms in
Eq. (1). This equilibrium condition allows analysesof flows between trophic levels and a means forestimating the relative importance of individualstate variables (for instance, species) or processes(for example, detritivory, selective predation, tar-geted fisheries, and so on). An important aspect ofthis process is that the ratio of production to bio-mass (P/B) is equal to the sum of all sources ofmortality—those due to predation, exploitation,and other causes. Thus, the system is set to equilib-rium based on the current levels of mortality, bio-mass, and production. Those parameters are basedon empirical estimates that include both the scaleand the context of the ecosystem under consider-ation. Thus, an Ecopath model represents a verystrongly data-based estimate of the current state ofthe system based on the principles of thermody-namics and a balanced budget at the ecosystemscale. Any change in inputs, exports, or exploitationrates will therefore be reflected in the developmentof a new steady-state condition.
Walters and others (1997) developed the Ecosimmodel to allow for dynamic simulation of the effectsof changes in the initial steady-state condition foran Ecopath model. User inputs to Ecosim can alterthe initial conditions for exploitation rates, preda-tor–prey interactions, and/or external changes inthe environment as applied to any of the statevariables in the Ecopath model. Ecosim then calcu-lates the time course for consequent change in allother state variables for the ecosystem and the newequilibrium condition. Derivation of the Ecosimmodel is detailed in Walters and others (1997), andan example of applications is presented in Kitchelland others (1999). The software is available athttp//www.fisheries.com, and a version with den-sity-dependent or compensatory responses in indi-vidual fish growth rates is now available (Waltersand others 2000).
The master equation for Ecosim allows changesin the balanced budget for any state variable (B):
dB/dt 5 Production–Predatory losses–
Nonpredatory losses–Harvest (2)
Because all Ecopath variables are embedded in afood web, the effects of changes in one variable maybe expressed in any and all others. Their dynamicsdepend on the linkages stated in the trophic flowmatrix and in the parameters that are used to defineeach. For example, organisms with large P/B values(for example, phytoplankton, zooplankton, or Pa-cific salmon species) respond rapidly to perturba-tion and achieve new steady-state values quickly.Those with low P/B values (for instance, lake trout),
548 J. F. Kitchell and others
which are indicative of K-strategy life histories orlow turnover rates, respond slowly and with sub-stantial lags.
Both Ecopath and Ecosim have a diversity ofoptions and alternative functions that are availableto the user. In both cases, we employed the initialor default conditions provided with the software.
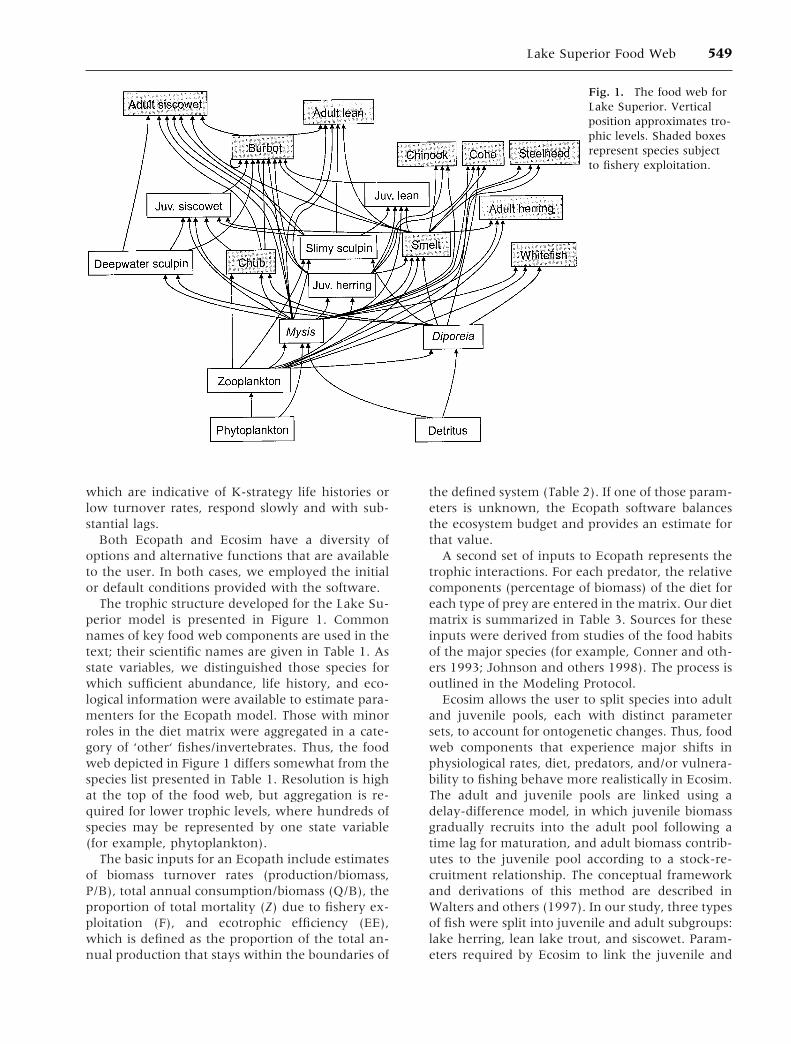
The trophic structure developed for the Lake Su-perior model is presented in Figure 1. Commonnames of key food web components are used in thetext; their scientific names are given in Table 1. Asstate variables, we distinguished those species forwhich sufficient abundance, life history, and eco-logical information were available to estimate para-menters for the Ecopath model. Those with minorroles in the diet matrix were aggregated in a cate-gory of ‘other‘ fishes/invertebrates. Thus, the foodweb depicted in Figure 1 differs somewhat from thespecies list presented in Table 1. Resolution is highat the top of the food web, but aggregation is re-quired for lower trophic levels, where hundreds ofspecies may be represented by one state variable(for example, phytoplankton).
The basic inputs for an Ecopath include estimatesof biomass turnover rates (production/biomass,P/B), total annual consumption/biomass (Q/B), theproportion of total mortality (Z) due to fishery ex-ploitation (F), and ecotrophic efficiency (EE),which is defined as the proportion of the total an-nual production that stays within the boundaries of
the defined system (Table 2). If one of those param-eters is unknown, the Ecopath software balancesthe ecosystem budget and provides an estimate forthat value.
A second set of inputs to Ecopath represents thetrophic interactions. For each predator, the relativecomponents (percentage of biomass) of the diet foreach type of prey are entered in the matrix. Our dietmatrix is summarized in Table 3. Sources for theseinputs were derived from studies of the food habitsof the major species (for example, Conner and oth-ers 1993; Johnson and others 1998). The process isoutlined in the Modeling Protocol.
Ecosim allows the user to split species into adultand juvenile pools, each with distinct parametersets, to account for ontogenetic changes. Thus, foodweb components that experience major shifts inphysiological rates, diet, predators, and/or vulnera-bility to fishing behave more realistically in Ecosim.The adult and juvenile pools are linked using adelay-difference model, in which juvenile biomassgradually recruits into the adult pool following atime lag for maturation, and adult biomass contrib-utes to the juvenile pool according to a stock-re-cruitment relationship. The conceptual frameworkand derivations of this method are described inWalters and others (1997). In our study, three typesof fish were split into juvenile and adult subgroups:lake herring, lean lake trout, and siscowet. Param-eters required by Ecosim to link the juvenile and
Fig. 1. The food web forLake Superior. Verticalposition approximates tro-phic levels. Shaded boxesrepresent species subjectto fishery exploitation.
Lake Superior Food Web 549
adult groups (von Bertalanffy K, age at recruitment,mass at recruitment, and average adult mass) werederived from studies by Ebener (1995) and Bronte(unpublished) and are shown in Table 4. Recruit-ment was assumed to be knife-edge.
Modeling Protocol
Parameter estimates for the Ecopath model werederived by a three-step process. First, a subgroup ofthe coauthors (those based in Madison, Wisconsin)consulted the available literature to develop theinitial estimates for P/B, Q/B, Z, F, and EE. Shortlythereafter, we convened a workshop that includedthe coauthors who represented the Lake SuperiorTechnical Committee and the full spectrum of rep-resented institutions. This meeting produced a sec-ond iteration of the parameter estimates and a con-sensus about the kinds of simulation studies thatmight be most instructive. The third step was agradual process of incorporating the workshop sug-gestions and subsequent improvements, such asgreater detail and updated results, as inputs to thediet matrix used to characterize the Ecopath model.
The first version of the model emphasized the use
of EE as the Ecopath unknown because the work-shop participants had some confidence in their es-timates of the other inputs. In its strict definition,EE represents the amount of biomass accounted forthrough the combination of within-system pro-cesses (for example, mortality due to predation orharvest). In most Ecopath applications, the value ofEE is assumed to be about 0.9. In this case, our EEvalues are highly variable. Some of that variabilityis due to uncertainty; some is probably due to error.We cannot distinguish between the two sources atthis stage. We can, however, accommodate thatuncertainty by setting generous margins in our in-terpretation of modeling results. For example, if astate variable changes less than about 25% in re-sponse to a manipulation, then we view it as gen-erally unresponsive and interpret the change con-servatively.
We focused our simulations on the actions mostlikely to be taken through fishery agencies—that is,the constraint or enhancement of exploitation pro-cesses. We also addressed the question of how amajor environmental forcing function such as theinterannual variability in climate conditions—for
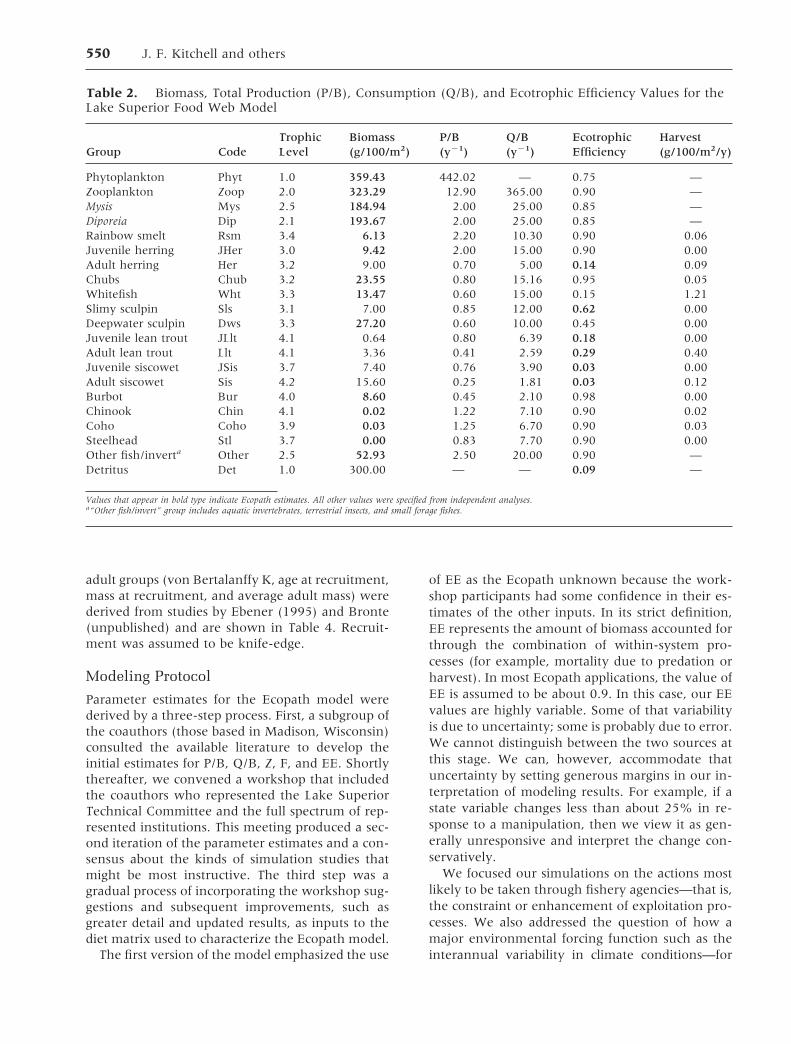
Table 2. Biomass, Total Production (P/B), Consumption (Q/B), and Ecotrophic Efficiency Values for theLake Superior Food Web Model
Group CodeTrophicLevel
Biomass(g/100/m2)
P/B(y21)
Q/B(y21)
EcotrophicEfficiency
Harvest(g/100/m2/y)
Phytoplankton Phyt 1.0 359.43 442.02 — 0.75 —Zooplankton Zoop 2.0 323.29 12.90 365.00 0.90 —Mysis Mys 2.5 184.94 2.00 25.00 0.85 —Diporeia Dip 2.1 193.67 2.00 25.00 0.85 —Rainbow smelt Rsm 3.4 6.13 2.20 10.30 0.90 0.06Juvenile herring JHer 3.0 9.42 2.00 15.00 0.90 0.00Adult herring Her 3.2 9.00 0.70 5.00 0.14 0.09Chubs Chub 3.2 23.55 0.80 15.16 0.95 0.05Whitefish Wht 3.3 13.47 0.60 15.00 0.15 1.21Slimy sculpin Sls 3.1 7.00 0.85 12.00 0.62 0.00Deepwater sculpin Dws 3.3 27.20 0.60 10.00 0.45 0.00Juvenile lean trout JLlt 4.1 0.64 0.80 6.39 0.18 0.00Adult lean trout Llt 4.1 3.36 0.41 2.59 0.29 0.40Juvenile siscowet JSis 3.7 7.40 0.76 3.90 0.03 0.00Adult siscowet Sis 4.2 15.60 0.25 1.81 0.03 0.12Burbot Bur 4.0 8.60 0.45 2.10 0.98 0.00Chinook Chin 4.1 0.02 1.22 7.10 0.90 0.02Coho Coho 3.9 0.03 1.25 6.70 0.90 0.03Steelhead Stl 3.7 0.00 0.83 7.70 0.90 0.00Other fish/inverta Other 2.5 52.93 2.50 20.00 0.90 —Detritus Det 1.0 300.00 — — 0.09 —
Values that appear in bold type indicate Ecopath estimates. All other values were specified from independent analyses.a“Other fish/invert” group includes aquatic invertebrates, terrestrial insects, and small forage fishes.
550 J. F. Kitchell and others

Tab
le3.
Die
tco
mposi
tion
esti
mat
esfo
rLak
eSu
per
ior
Eco
pat
h
Pre
y
Pre
dat
or
Zoop
Mys
Dip
Rsm
JHer
Her
Ch
ub
Wh
tS
lsD
ws
JLlt
Llt
JSis
Sis
Bu
rC
hin
Co
ho
Stl
Oth
er
Ph
yt1
0.2
5—
——
——
——
——
——
——
——
——
Zoop
—0.5
0.1
0.1
50.9
50.7
0.6
50.1
0.0
1—
——
——
——
—0
.10
.5M
ys—
——
0.6
50.0
50.2
50.3
0.1
0.0
60.4
0.1
50.0
20.4
20
.03
0.0
10
.10
.05
0.0
1—
Dip
——
—0.1
5—
—0.0
50.3
0.9
0.6
——
0.0
9—
——
0.0
5—
—R
sm—
——
——
0.0
5—
——
—0.3
50.3
20.0
40
.06
0.1
40
.55
0.4
50
.25
—JH
er—
——
0.0
5—
——
——
—0.3
50.4
5—
0.1
0.3
0.2
50
.05
——
Her
——
——
——
——
——
——
——
——
——
—C
hu
b—
——
——
——
——
——
—0.0
10
.49
0.2
——
——
Wh
t—
——
——
——
——
——
——
——
——
——
Sls
——
——
——
——
——
0.1
20.0
50.0
70
.02
0.0
1—
——
—D
ws
——
——
——
——
——
——
0.1
50
.10
.01
——
——
JLlt
——
——
——
——
——
——
——
0.0
1—
——
—Llt
——
——
——
——
——
——
——
——
——
—JS
is—
——
——
——
——
——
——
—0
.01
——
——
Sis
——
——
——
——
——
——
——
——
——
—B
ur
——
——
——
——
——
—0.0
6—
0.1
0.0
3—
——
—C
hin
——
——
——
——
——
——
——
——
——
—C
oh
o—
——
——
——
——
——
——
——
——
——
Stl
——
——
——
——
——
——
——
——
——
—O
ther
——
——
——
—0.5
0.0
3—
0.0
30.1
0.2
20
.10
.29
0.1
0.4
0.6
4—
Det
—0.2
50.9
——
——
——
——
——
——
——
—0.5
Val
ues
indi
cate
prop
orti
ons
ofth
eto
tal
diet
ofpr
edat
orgr
oup
j(r
owh
eade
r)th
atco
nsi
sts
ofpr
eygr
oup
i(c
olu
mn
hea
der)
.G
rou
pco
des
are
give
nin
Tab
le2.
Lake Superior Food Web 551

instance, those due to El Niño–La Niña oscilla-tions—might alter the ecological processes repre-sented in this model of trophic interactions. Wesimulated the interannual variance in primary pro-duction based on estimated temperature depen-dence for algal growth rates and long-term records forsurface water temperatures (Watson and others1996). We coupled that with a stochastic effect on thefood web by simulating a major decade-long declinein smelt abundance. Lastly, we created a scenariobased on the invasion of another exotic (the quaggamussel) and its possible effects on native species.
When the responses of a group of species aresimilar (for example, chinook, coho, and steelheadsalmon) or highly correlated (for instance, phyto-plankton and zooplankton), only one of thosegroups may be included as representative. In somecases, we simulated a 10-year period of some man-agement action followed by its removal. This allowsevidence of the rate of response to a change and therate of recovery or evidence of hysteresis when thechange is removed. We confined our simulations toa 50-year interval. Forecasts beyond that horizonseem overly optimistic.
The real test of adequacy for this type of modelingapproach is in its ability to present logical conse-quences that would not be apparent unless onecould reason through the complexity of a largeconnected set of food web interactions. In otherwords, the model should teach us something wedidn’t know. In addition, the result should makesense after we have seen it and after we have de-veloped an understanding of how the interactionscaused the result.
RESULTS
Modeling Scenarios
Each scenario, its background rationale, and its in-terpretation is detailed here. Figures are scaled sothat biomass is normalized to the initial estimates(Table 2) as a value of 1, then depicted as relativedepartures from the initial condition in response tothe simulated manipulation. Manipulations are ini-
tiated at about year 10. In each case, state variablesrepresented in the accompanying graphic are thosethat exhibited important responses, including thosethat showed an unanticipated absence of change.
Scenario 1: Close all fisheries for lean lake trout Ra-tionale: The recovery of lean lake trout stocks seemsto be impeded by the continuing high levels ofmortality. The closure of fisheries that target adultlean lake trout would allow us to evaluate thepotential for restoration of the leans to their formerabundance and a greater sustainable yield for futurefisheries when they are allowed to reopen.
Simulation Results (Figure 2): Lean lake trout bio-mass increased about 50% during the 10-year pe-riod after fishery closure and leveled off at about60% of former abundance within 15 years. Thebiomass of its major prey (herring) declined. Pacificsalmon (coho, chinook, and steelhead) and burbotall declined as lake trout increased. Rates of declinewere approximately in proportion to the P/B esti-mate of turnover rates for each.
Unexpected Results: Juvenile lean trout biomassrose and then declined, indicating an ecologicalconstraint to recruitment. Smelt responded verylittle to increased lean lake trout, and siscowet (not
Fig. 2. Simulated responses of selected food web com-ponents to sustained closure of current fisheries for leanlake trout after year 10.
Table 4. Parameters Used to Link Juvenile and Adult Pools in the Ecosim Delay-Difference Function
Speciesvon BertalanffyK
Age at R(y)
Mass at R(g)
Avg. Adult Mass(g)
Herring 0.167 4 200 315Lean lake trout 0.142 5 590 1250Siscowet 0.053 8 590 1250
552 J. F. Kitchell and others
shown) was unaffected. A 10-year closure wouldreveal much of the potential recovery for lean laketrout and its ecological consequences.
Scenario 2: Encourage fisheries for siscowet lake troutRationale: Targeted removal of the undesirabledeepwater siscowet (a 10-fold increase in F for 10years) would release forage resources that can en-hance the lean lake trout stocks, while allowingcontinued exploitation of lean trout and herring atthe present rates. This strategy would appease ex-isting fishery interests (both commercial and recre-ational) and address issues raised by treaty rightsfisheries.
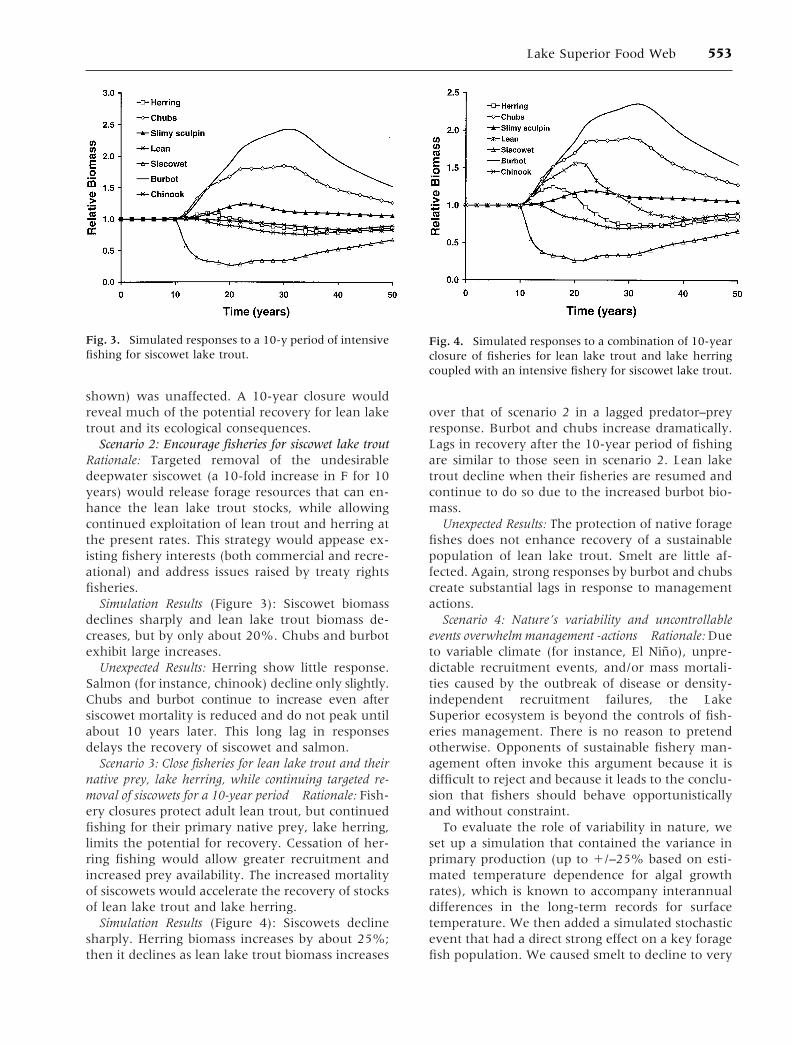
Simulation Results (Figure 3): Siscowet biomassdeclines sharply and lean lake trout biomass de-creases, but by only about 20%. Chubs and burbotexhibit large increases.
Unexpected Results: Herring show little response.Salmon (for instance, chinook) decline only slightly.Chubs and burbot continue to increase even aftersiscowet mortality is reduced and do not peak untilabout 10 years later. This long lag in responsesdelays the recovery of siscowet and salmon.
Scenario 3: Close fisheries for lean lake trout and theirnative prey, lake herring, while continuing targeted re-moval of siscowets for a 10-year period Rationale: Fish-ery closures protect adult lean trout, but continuedfishing for their primary native prey, lake herring,limits the potential for recovery. Cessation of her-ring fishing would allow greater recruitment andincreased prey availability. The increased mortalityof siscowets would accelerate the recovery of stocksof lean lake trout and lake herring.
Simulation Results (Figure 4): Siscowets declinesharply. Herring biomass increases by about 25%;then it declines as lean lake trout biomass increases
over that of scenario 2 in a lagged predator–preyresponse. Burbot and chubs increase dramatically.Lags in recovery after the 10-year period of fishingare similar to those seen in scenario 2. Lean laketrout decline when their fisheries are resumed andcontinue to do so due to the increased burbot bio-mass.
Unexpected Results: The protection of native foragefishes does not enhance recovery of a sustainablepopulation of lean lake trout. Smelt are little af-fected. Again, strong responses by burbot and chubscreate substantial lags in response to managementactions.
Scenario 4: Nature’s variability and uncontrollableevents overwhelm management -actions Rationale: Dueto variable climate (for instance, El Niño), unpre-dictable recruitment events, and/or mass mortali-ties caused by the outbreak of disease or density-independent recruitment failures, the LakeSuperior ecosystem is beyond the controls of fish-eries management. There is no reason to pretendotherwise. Opponents of sustainable fishery man-agement often invoke this argument because it isdifficult to reject and because it leads to the conclu-sion that fishers should behave opportunisticallyand without constraint.
To evaluate the role of variability in nature, weset up a simulation that contained the variance inprimary production (up to 1/–25% based on esti-mated temperature dependence for algal growthrates), which is known to accompany interannualdifferences in the long-term records for surfacetemperature. We then added a simulated stochasticevent that had a direct strong effect on a key foragefish population. We caused smelt to decline to very
Fig. 3. Simulated responses to a 10-y period of intensivefishing for siscowet lake trout.
Fig. 4. Simulated responses to a combination of 10-yearclosure of fisheries for lean lake trout and lake herringcoupled with an intensive fishery for siscowet lake trout.
Lake Superior Food Web 553
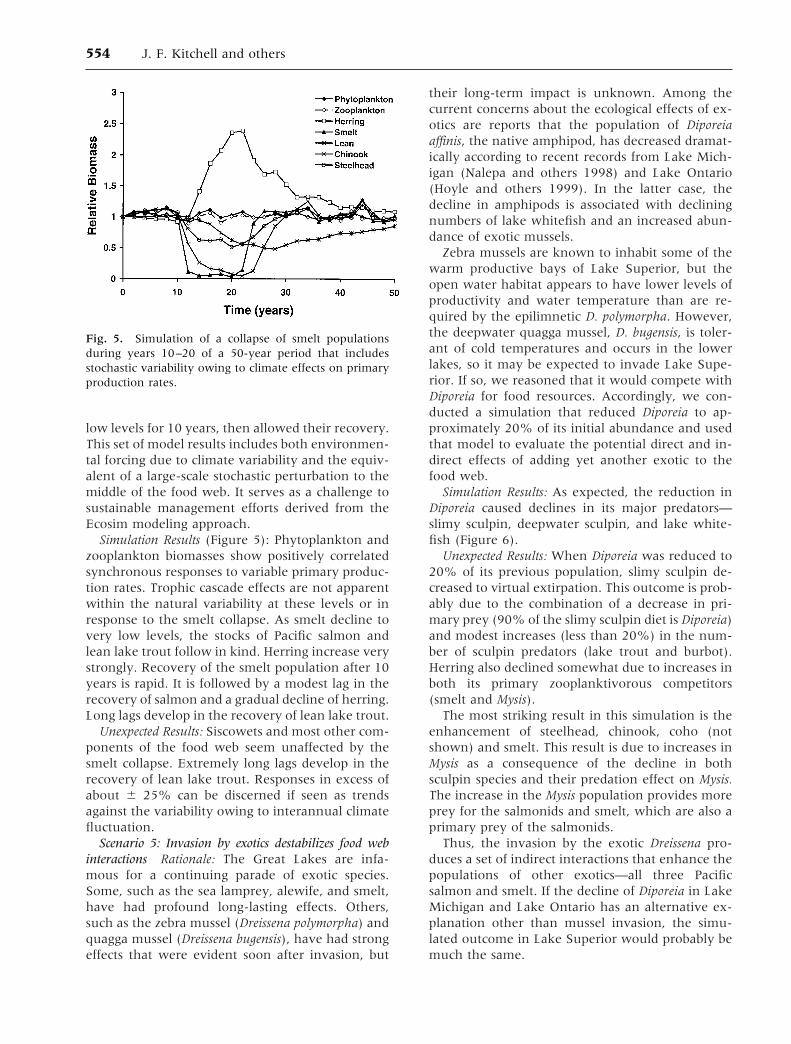
low levels for 10 years, then allowed their recovery.This set of model results includes both environmen-tal forcing due to climate variability and the equiv-alent of a large-scale stochastic perturbation to themiddle of the food web. It serves as a challenge tosustainable management efforts derived from theEcosim modeling approach.
Simulation Results (Figure 5): Phytoplankton andzooplankton biomasses show positively correlatedsynchronous responses to variable primary produc-tion rates. Trophic cascade effects are not apparentwithin the natural variability at these levels or inresponse to the smelt collapse. As smelt decline tovery low levels, the stocks of Pacific salmon andlean lake trout follow in kind. Herring increase verystrongly. Recovery of the smelt population after 10years is rapid. It is followed by a modest lag in therecovery of salmon and a gradual decline of herring.Long lags develop in the recovery of lean lake trout.
Unexpected Results: Siscowets and most other com-ponents of the food web seem unaffected by thesmelt collapse. Extremely long lags develop in therecovery of lean lake trout. Responses in excess ofabout 6 25% can be discerned if seen as trendsagainst the variability owing to interannual climatefluctuation.
Scenario 5: Invasion by exotics destabilizes food webinteractions Rationale: The Great Lakes are infa-mous for a continuing parade of exotic species.Some, such as the sea lamprey, alewife, and smelt,have had profound long-lasting effects. Others,such as the zebra mussel (Dreissena polymorpha) andquagga mussel (Dreissena bugensis), have had strongeffects that were evident soon after invasion, but
their long-term impact is unknown. Among thecurrent concerns about the ecological effects of ex-otics are reports that the population of Diporeiaaffinis, the native amphipod, has decreased dramat-ically according to recent records from Lake Mich-igan (Nalepa and others 1998) and Lake Ontario(Hoyle and others 1999). In the latter case, thedecline in amphipods is associated with decliningnumbers of lake whitefish and an increased abun-dance of exotic mussels.
Zebra mussels are known to inhabit some of thewarm productive bays of Lake Superior, but theopen water habitat appears to have lower levels ofproductivity and water temperature than are re-quired by the epilimnetic D. polymorpha. However,the deepwater quagga mussel, D. bugensis, is toler-ant of cold temperatures and occurs in the lowerlakes, so it may be expected to invade Lake Supe-rior. If so, we reasoned that it would compete withDiporeia for food resources. Accordingly, we con-ducted a simulation that reduced Diporeia to ap-proximately 20% of its initial abundance and usedthat model to evaluate the potential direct and in-direct effects of adding yet another exotic to thefood web.
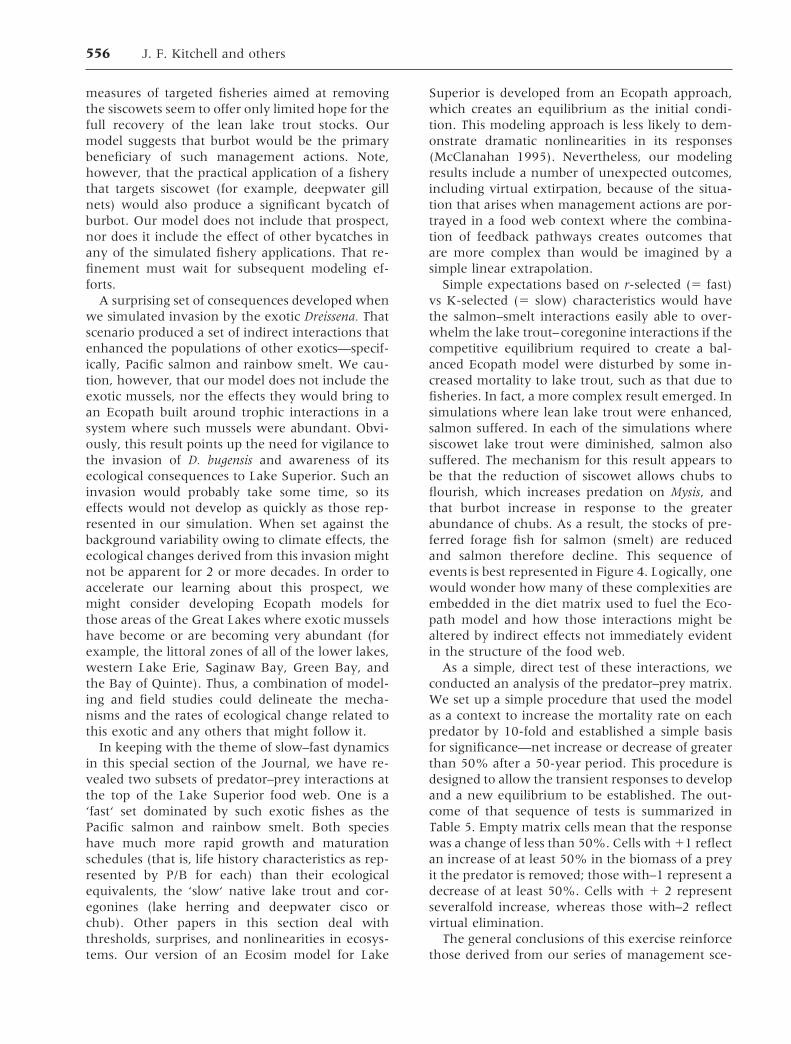
Simulation Results: As expected, the reduction inDiporeia caused declines in its major predators—slimy sculpin, deepwater sculpin, and lake white-fish (Figure 6).
Unexpected Results: When Diporeia was reduced to20% of its previous population, slimy sculpin de-creased to virtual extirpation. This outcome is prob-ably due to the combination of a decrease in pri-mary prey (90% of the slimy sculpin diet is Diporeia)and modest increases (less than 20%) in the num-ber of sculpin predators (lake trout and burbot).Herring also declined somewhat due to increases inboth its primary zooplanktivorous competitors(smelt and Mysis).
The most striking result in this simulation is theenhancement of steelhead, chinook, coho (notshown) and smelt. This result is due to increases inMysis as a consequence of the decline in bothsculpin species and their predation effect on Mysis.The increase in the Mysis population provides moreprey for the salmonids and smelt, which are also aprimary prey of the salmonids.
Thus, the invasion by the exotic Dreissena pro-duces a set of indirect interactions that enhance thepopulations of other exotics—all three Pacificsalmon and smelt. If the decline of Diporeia in LakeMichigan and Lake Ontario has an alternative ex-planation other than mussel invasion, the simu-lated outcome in Lake Superior would probably bemuch the same.
Fig. 5. Simulation of a collapse of smelt populationsduring years 10–20 of a 50-year period that includesstochastic variability owing to climate effects on primaryproduction rates.
554 J. F. Kitchell and others

DISCUSSION
Our five scenarios focus on the restoration objec-tives that dominate contemporary fishery manage-ment for the Great Lakes. The progression of thosescenarios approximates the sequence of fisherymanagement actions most likely to be followed tosupport of the current restoration goals. One im-portant conclusion is immediately obvious—the en-hancement of stocks of lean lake trout is a goal thatis not easy to accomplish. To the extent that thismodel portrays a reasonable picture of the currentstate of system productivity and food web interac-tions, substantial increases in native fish popula-tions may not be possible because they are con-strained by the existing structure of the systemand/or by the prospect that the system is at or nearcarrying capacity. In other words, it seems possiblethat the current state of Lake Superior is as close aswe can get to the restored state.
We have not presented a simulation of the out-come of an obvious management alternative—en-hancement of the Pacific salmon stocks throughintensified hatchery production and stocking. Thatresult is surprisingly dull in that the biomass ofPacific salmon is a very small part of the biomass atthe apex of this food web. Actions that would in-crease salmon by two- or threefold are of littleconsequence to the dynamics of native fishes. Thatconclusion must be regarded with caution, becausethere is a substantial and unexplored spatial dimen-
sion to the interactions between salmon, the near-shore lean lake trout stocks, and the forage fishpopulations that support them. The next generationof this type of modeling effort should include aspatial context that distinguishes between the lit-toral community and that of the offshore zone. Itshould also recognize the habitat heterogeneity rep-resented in this, the largest of the world’s lakes.Spatially explicit analyses should also explore theutility of providing zones where fishing is prohib-ited, as an experimental approach that could estab-lish a better understanding of the outcome of real-world management actions. A recent analysis ofstable isotope distribution in the western arm ofLake Superior showed that some fishes are highlymobile, whereas others are relatively sedentary(Harvey and Kitchell 2000). Therefore, manage-ment actions aimed at the geographic restriction offish exploitation would have complex spatial ef-fects.
Of greater immediate consequence is the hithertounrecognized effect of an enormous biomass of sis-cowet lake trout. The recovery of siscowet popula-tions is an important achievement for fishery man-agers because they are indeed the evidence ofrestoration through natural reproduction. On theother hand, their ecological inertia (resistance tochange) creates a major constraint for fishery man-agers because the nearshore lean lake trout aremuch more highly desired. Even the very stringent
Fig. 6. Simulation of eco-logical effects derived fromreduction in abundance ofthe benthic amphipod, Di-poreia affinis.
Lake Superior Food Web 555
measures of targeted fisheries aimed at removingthe siscowets seem to offer only limited hope for thefull recovery of the lean lake trout stocks. Ourmodel suggests that burbot would be the primarybeneficiary of such management actions. Note,however, that the practical application of a fisherythat targets siscowet (for example, deepwater gillnets) would also produce a significant bycatch ofburbot. Our model does not include that prospect,nor does it include the effect of other bycatches inany of the simulated fishery applications. That re-finement must wait for subsequent modeling ef-forts.
A surprising set of consequences developed whenwe simulated invasion by the exotic Dreissena. Thatscenario produced a set of indirect interactions thatenhanced the populations of other exotics—specif-ically, Pacific salmon and rainbow smelt. We cau-tion, however, that our model does not include theexotic mussels, nor the effects they would bring toan Ecopath built around trophic interactions in asystem where such mussels were abundant. Obvi-ously, this result points up the need for vigilance tothe invasion of D. bugensis and awareness of itsecological consequences to Lake Superior. Such aninvasion would probably take some time, so itseffects would not develop as quickly as those rep-resented in our simulation. When set against thebackground variability owing to climate effects, theecological changes derived from this invasion mightnot be apparent for 2 or more decades. In order toaccelerate our learning about this prospect, wemight consider developing Ecopath models forthose areas of the Great Lakes where exotic musselshave become or are becoming very abundant (forexample, the littoral zones of all of the lower lakes,western Lake Erie, Saginaw Bay, Green Bay, andthe Bay of Quinte). Thus, a combination of model-ing and field studies could delineate the mecha-nisms and the rates of ecological change related tothis exotic and any others that might follow it.
In keeping with the theme of slow–fast dynamicsin this special section of the Journal, we have re-vealed two subsets of predator–prey interactions atthe top of the Lake Superior food web. One is a‘fast‘ set dominated by such exotic fishes as thePacific salmon and rainbow smelt. Both specieshave much more rapid growth and maturationschedules (that is, life history characteristics as rep-resented by P/B for each) than their ecologicalequivalents, the ‘slow‘ native lake trout and cor-egonines (lake herring and deepwater cisco orchub). Other papers in this section deal withthresholds, surprises, and nonlinearities in ecosys-tems. Our version of an Ecosim model for Lake
Superior is developed from an Ecopath approach,which creates an equilibrium as the initial condi-tion. This modeling approach is less likely to dem-onstrate dramatic nonlinearities in its responses(McClanahan 1995). Nevertheless, our modelingresults include a number of unexpected outcomes,including virtual extirpation, because of the situa-tion that arises when management actions are por-trayed in a food web context where the combina-tion of feedback pathways creates outcomes thatare more complex than would be imagined by asimple linear extrapolation.
Simple expectations based on r-selected (5 fast)vs K-selected (5 slow) characteristics would havethe salmon–smelt interactions easily able to over-whelm the lake trout–coregonine interactions if thecompetitive equilibrium required to create a bal-anced Ecopath model were disturbed by some in-creased mortality to lake trout, such as that due tofisheries. In fact, a more complex result emerged. Insimulations where lean lake trout were enhanced,salmon suffered. In each of the simulations wheresiscowet lake trout were diminished, salmon alsosuffered. The mechanism for this result appears tobe that the reduction of siscowet allows chubs toflourish, which increases predation on Mysis, andthat burbot increase in response to the greaterabundance of chubs. As a result, the stocks of pre-ferred forage fish for salmon (smelt) are reducedand salmon therefore decline. This sequence ofevents is best represented in Figure 4. Logically, onewould wonder how many of these complexities areembedded in the diet matrix used to fuel the Eco-path model and how those interactions might bealtered by indirect effects not immediately evidentin the structure of the food web.
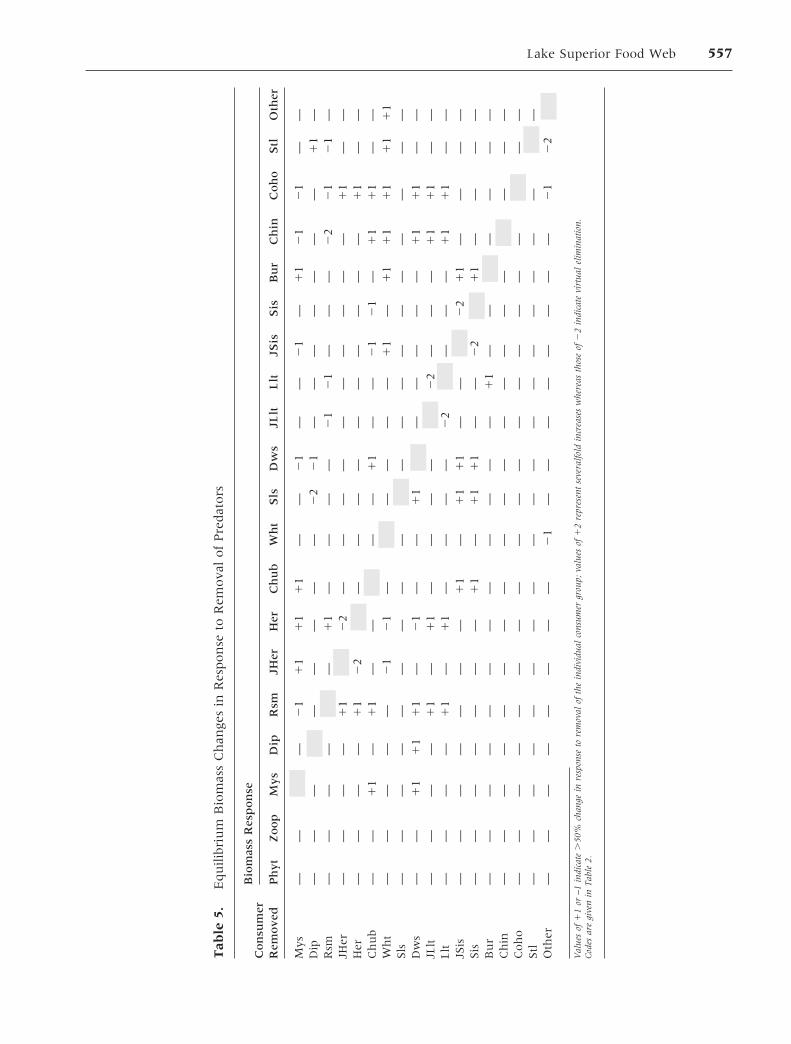
As a simple, direct test of these interactions, weconducted an analysis of the predator–prey matrix.We set up a simple procedure that used the modelas a context to increase the mortality rate on eachpredator by 10-fold and established a simple basisfor significance—net increase or decrease of greaterthan 50% after a 50-year period. This procedure isdesigned to allow the transient responses to developand a new equilibrium to be established. The out-come of that sequence of tests is summarized inTable 5. Empty matrix cells mean that the responsewas a change of less than 50%. Cells with 11 reflectan increase of at least 50% in the biomass of a preyit the predator is removed; those with–1 represent adecrease of at least 50%. Cells with 1 2 representseveralfold increase, whereas those with–2 reflectvirtual elimination.
The general conclusions of this exercise reinforcethose derived from our series of management sce-
556 J. F. Kitchell and others
Tab
le5.
Equ
ilib
riu
mB
iom
ass
Ch
ange
sin
Res
pon
seto
Rem
ova
lof
Pre
dat
ors
Con
sum
erR
emoved
Bio
mas
sR
esp
on
se
Ph
yt
Zoop
Mys
Dip
Rsm
JHer
Her
Ch
ub
Wh
tS
lsD
ws
JLlt
Llt
JSis
Sis
Bu
rC
hin
Co
ho
Stl
Oth
er
Mys
——
—2
11
11
11
1—
—2
1—
—2
1—
11
21
21
——
Dip
——
——
——
——
22
21
——
——
——
—1
1—
Rsm
——
——
—1
1—
——
—2
12
1—
——
22
21
21
—JH
er—
——
—1
12
2—
——
——
——
——
—1
1—
—H
er—
——
—1
12
2—
——
——
——
——
—1
1—
—C
hu
b—
—1
1—
11
——
——
11
——
21
21
—1
11
1—
—W
ht
——
——
—2
12
1—
——
——
11
—1
11
11
11
11
1Sls
——
——
——
——
——
——
——
——
——
—D
ws
——
11
11
11
—2
1—
—1
1—
——
——
11
11
——
JLlt
——
——
11
—1
1—
——
—2
2—
——
11
11
——
Llt
——
——
11
—1
1—
——
—2
2—
——
11
11
——
JSis
——
——
——
—1
1—
11
11
——
22
11
——
——
Sis
——
——
——
—1
1—
11
11
——
22
11
——
——
Bu
r—
——
——
——
——
——
—1
1—
——
——
—C
hin
——
——
——
——
——
——
——
——
——
—C
oh
o—
——
——
——
——
——
——
——
——
——
Stl
——
——
——
——
——
——
——
——
——
—O
ther
——
——
——
——
21
——
——
——
——
21
22
Val
ues
of1
1or
–1in
dica
te.
50%
chan
gein
resp
onse
tore
mov
alof
the
indi
vidu
alco
nsu
mer
grou
p;va
lues
of1
2re
pres
ent
seve
ralf
old
incr
ease
sw
her
eas
thos
eof
22
indi
cate
virt
ual
elim
inat
ion
.C
odes
are
give
nin
Tab
le2.
Lake Superior Food Web 557

narios. First, the removal of lean lake trout has fewnegative effects. The positive effects are simple andexpected—an increase in smelt, herring, and someother apex predators (coho and chinook salmon)but little effect on siscowet and burbot. Other ef-fects are also as expected; the removal of smelt hasnegative effects on the number of juvenile andadult lean lake trout and on each of the salmon,particularly chinook. On the other hand, the re-moval of siscowet has positive effects on nativefishes such as chubs, sculpins, and burbot. The ex-otic salmon have little impact—positive or nega-tive—on any of their prey or competitors, probablydue to their relatively small biomass in our currentestimates for the entire Lake Superior system. Inaddition, the diets of some of the salmon (for ex-ample, steelhead) include a very large proportion ofterrestrial insects. In our diet matrix, these insectsare external to the system, in that they are repre-sented as ‘other‘ prey. Even so, it is interesting tonote that reductions in many of these species arereflected in positive or negative responses bysalmon. In a general sense, anything that enhancessmelt (such as the removal of their predators orcompetitors) will have a positive effect on salmon.Any interpretation of these results should includethe caution that Ecopath predator–prey interactionsare represented by a static diet composition. Inother words, predators do not switch to alternateprey when one or more of their primary prey arereduced due to changes in the dynamics of the foodweb.
For managers, this modeling analysis offers somesimple but instructive lessons:
1. To increase the abundance of lean lake trout,both their stocks and that of their primary prey(herring) must be protected from exploitation.This increase will occur more rapidly if sis-cowets are the focus of an aggressive targetedfishery that is sustained for many years. Thefailure to protect leans and herring in the pres-ence of a targeted siscowet fishery or a fisheryof short duration will allow burbot to flourish,and salmon will decline. The matrix test indi-cates that there is no scheme for competitor orpredator removal that will allow leans to in-crease on a sustainable basis. All of the re-sponses of lean lake trout to reductions inother species are neutral or negative, exceptfor removal of burbot. However, a fishery thattargets burbot is unlikely because of its associ-ated bycatch of lake trout. Alternatively, thecurrent and perhaps increasing abundance of
the native self-sustaining siscowet lake troutand burbot may represent evidence of successin the restoration effort.
2. Management strategy for increasing stocks ofPacific salmon requires special attention to thefood web interactions that have adverse effectson smelt. Smelt have declined in Lake Supe-rior. Thus, the trade-offs associated with a lim-ited forage base must always be taken intoaccount in terms of their critical linkages withother ecosystem responses to future manage-ment actions.
3. Our analyses suggest that Lake Superior offersless opportunity for the enhancement of nativefish stocks than had been assumed in the mostrecent statement of restoration goals. This im-portant conclusion must be tempered by cer-tain caveats due to the limitations of the Eco-path/Ecosim modeling approach. First, themodeling process starts with the componentsof a balanced budget based on our estimates ofcurrent biomasses and trophic interactions.The general goal of increased biomass for eachof the native species may not be well repre-sented in the current model structure. A sec-ond notable limitation to this model is its lackof spatial resolution. There is strong evidencefrom a variety of sources that regional andlocal variability has a significant influence onecosystem dynamics. A spatially explicit ap-proach is now needed to evaluate the signifi-cance of that variability to the overall produc-tion of the Lake Superior ecosystem.
Models such as this one are abstractions and sim-plifications. They should be viewed as learningtools, not prescriptive or empirical devices. Oursimulation of invasion by another exotic (D. bugen-sis) resulted in profound and unanticipated ecolog-ical effects that would provide a positive feedbackand favor the existing exotics. In this case, themodeled process and its ecological expression iswholly inferred. Clearly, a comparative approachbased on field studies and models built for systemsthat do or do not contain the exotic(s) of interestoffers greater potential for understanding and an-ticipating the ecological consequences of yet an-other exotic. The current and growing interest inreestablishing coaster brook trout in Lake Superioroffers an analogous challenge. We believe that Eco-path/Ecosim modeling offers an excellent standard-ized approach to those kinds of analyses, and weencourage the development of similar models forother Great Lakes ecosystems.
558 J. F. Kitchell and others

ACKNOWLEDGMENTS
Primary support for this effort was provided by theUniversity of Wisconsin Sea Grant Institute. Addi-tional support was given by the National ScienceFoundation and the University of Wisconsin Grad-uate School. This is a contribution of the US Geo-logical Survey Great Lakes Science Center, AnnArbor, Michigan. We thank our colleagues from theLake Superior Technical Committee, Great LakesFishery Commission, for participating in discussionsand offering suggestions in response to presenta-tions of this material.
REFERENCES
[Anonymous]. 1996. Lake Superior lake trout restoration pro-claimed a victory. Fisheries (Bethesda) 21(6):47–8.
Bronte CR, Gallinat MP, Donofrio MC, Ebener MP, Schram ST,Schorfhaar RG, Schreiner DR. 1994. Results of the interagencyassessment of the diet of lake trout in Lake Superior, 1991–1993. Presented at the Great Lakes Fishery Commission, LakeSuperior Committee Meeting, Ann Arbor, MI, 22–23 March1994.
Bronte CR, Hoff MH. 1999. Status of forage fish in Lake Superior1978–98. Report of the US Geological Survey, 1999 AnnualLake Superior Committee Meeting minutes, Milwaukee, (WI).Great Lakes Fishery Commission.
Burkett DP, Busch WD, McClain J, Holey M, Busiahn T, FabrizioM. 1995. Great Lakes fishery resources restoration study—executive summary of a report to Congress. Ann Arbor (MI):US Fish and Wildlife Service, Great Lakes Coordination Office.19 p.
Christensen V, Pauly D. 1992. ECOPATH II—a software forbalancing steady-state models and calculating network char-acteristics. Ecol Modelling 61:169–85.
Christensen W, Pauly D, editors. 1993. Trophic models of aquaticecosystems. ICLARM Conf. Proc. 26. Manila: InternationalCenter for Living Aquatic Resources Management. 390 p.
Conner DJ. 1991. Food of salmonines in Western Lake Superior,1984–1986 [thesis]. Duluth (MN): University of Minnesota,33 p.
Conner DJ, Bronte CR, Selgeby JH, Collins HL. 1993. Food ofsalmonine predators in Lake Superior, 1981–1987. Ann Arbor,MI: Great Lakes Fishery Commission tech. rep. 59. 20 p.
Diana JS. 1990. Food habits of angler-caught salmonines inwestern Lake Huron. J Great Lakes Res 16:271–8.
Dryer WR, King CR. 1968. Rehabilitation of lake trout in theApostle Islands region of Lake Superior. J Fish Res Board Can25:1377–403.
Dryer WR, Erkkila LF, Tetzloff CL. 1965. Food of the lake troutin Lake Superior. Trans Am Fish Soc 94:169–76.
Ebener M. 1995. Bioenergetics of predatory fish in Western USwaters of Lake Superior. Report of Red Cliff Band of LakeSuperior Chippewas. Bayfield, MI. 250 pp.
Hansen MJ, editor. 1994. The state of Lake Superior in 1992.Great Lakes Fishery Commission special publication 94-1.110 p.
Hansen MJ, and others. 1995a. Lake trout (Salvelinus namaycush)populations in Lake Superior and their restoration in 1959–1993. J Great Lakes Res 21 Suppl 1: 152–75.
Hansen MJ, Schorfhaar RG, Peck JW, Selgeby JH, Taylor WW.1995b. Abundance indices for determining the status of laketrout restoration in Michigan waters of Lake Superior. N Am JFish Manage 15:830–7.
Harvey CJ, Kitchell JF. 2000. A stable isotope evaluation of thestructure and spatial heterogeneity of a Lake Superior foodweb. Can J Fish Aquat Sci. 57:1395–1403.
Hoyle JA, Shaner JM, Casselman JM, Dermott R. 1999. Changesin lake whitefish (Coregonus clupeaformis) stocks in eastern LakeOntario following Dreissena mussel invasion. Great Lakes ResRev 4:5–10.
Johnson TB, Mason DM, Bronte CR, Kitchell JF. 1998 Estima-tion of invertebrate production from patterns of forage fishconsumption in western Lake Superior. Trans Am Fish Soc127:496–506.
Kitchell JF. 1991. Salmonid carrying capacity: estimates andexperiences in the Great Lakes of North America. In: SvrjcekRS, editor. Marine ranching: proceedings of the seventeenthU.S.–Japan meeting on aquaculture. Washington DC: NOAAtechnical report NMFS 102. p 59–66.
Kitchell JF, Boggs C, He X, Walters CJ. 1999. Keystone pred-ators in the central Pacific. In: Proc. of the 12th WakefieldSymposium on Ecological Considerations in Fisheries Man-agement. Fairbanks (AK): University of Alaska Sea GrantCollege Program. 756 p; p 665– 83.
Koonce JF, Jones ML. 1994. Sustainability of the intensivelymanaged fisheries of Lake Michigan and Lake Ontario—finalreport of the SIMPLE group. Ann Arbor (MI): Great LakesFishery Commission. 10 p.
Lawrie AH, Rahrer JF. 1972. Lake Superior: effects of exploita-tion and introductions on the salmonid community. J Fish ResBoard Can 29:765–76.
MacCallum WR, Selgeby JH. 1987. Lake Superior revisited 1984.Can J Fish Aquat Sci 44 Suppl 2:23–36.
McClanahan TR. 1995. Harvesting in an uncertain world: impactof resource competition on harvesting dynamics. Ecol Model-ling 80:21–6.
Miller MA, Holey ME. 1992. Diets of lake trout inhabiting near-shore and offshore Lake Michigan environments. J GreatLakes Res 18:51–60.
Nalepa TF, Fanslow DL, Lang GA, Harston DJ, Lozano SJ. 1998.Declines in benthic macroinvertebrate populations in south-ern Lake Michigan, 1980–1993. Can J Fish Aquat Sci 55:2402–13.
[NMFS] National Marine Fisheries Service. 1999. Ecosystem-based fishery management: a report to Congress by the Eco-system Principles Advisory Panel. Washington (DC): NOAA.76 p.
[NRC] National Research Council. 1998. Sustaining marine fish-eries. Washington (DC): National Academy Press. 168 p.
Negus MT. 1995. Bioenergetics modeling as a salmonine man-agement tool applied to the Minnesota waters of Lake Supe-rior. N Am J Fish Manage. 15:60–78.
Pauly D, Christensen V. 1995. Primary production required tosustain global fisheries. Nature 374:255–7.
Pauly D, Christensen V, Dalsgaard J, Froese R, Torres F Jr. 1998.Fishing down marine food webs. Science 279:860–3.
Pauly D, Soriano-Bartz ML, Palomares MLD. 1993. Improvedconstruction, parameterization and interpretation of steady-state ecosystem models. In: Christensen V, Pauly D, editors.Trophic models of aquatic ecosystems. ICLARM Conf. Proc.
Lake Superior Food Web 559
26. Manila: International Center for Living Aquatic ResourcesManagement. 390 p; p 1–13.
Peck JW, Jones TS, MacCallum WR, Schram ST. 1999. Contri-bution of hatchery-reared fish to chinook salmon populationsand sport fisheries in Lake Superior. N Am J Fish Manage.19:155–64.
Peck JW, MacCallum WR, Schram ST, Schreiner DR, Shively JD.1994. Other salmonines. In: Hansen MJ, editor. The state ofLake Superior in 1992. Ann Arbor (MI) Great Lakes FisheryCommission spec. pub. 94-1. p 35–51.
Polovina JJ. 1984. Model of a coral reef ecosystem I. The ECO-PATH model and its application to French Frigate Shoals. CoralReefs 3:1–11.
Selgeby JH. 1982. Decline of lake herring (Coregonus artedii) inLake Superior: an analysis of the Wisconsin herring fishery,1936–78. Can J Fish Aquat Sci 39:554–63.
Selgeby JH, Bronte CR, Slade JW. 1994. Forage species. In:Hansen MJ, editor. The state of Lake Superior in 1992. Ann
Arbor (MI) Great Lakes Fishery Commission spec. pub. 94-1. p53–62.
Smith BR, Tibbles JJ, Johnson BGH. 1974. Control of sealamprey (Petromyzon marinus) in Lake Superior, 1953–70. Great Lakes Fishery Commission technical report 26. 60 p.
Stewart DJ, Ibarra M. 1991. Predation and production by salmo-nine fishes in Lake Michigan, 1978–88. Can J Fish Aquat Sci48:909–22.
Walters CJ, Christensen V, Pauly D. 1997. Structuring dynamicmodels of exploited ecosystems from trophic mass–balanceassessments. Rev Fish Biol Fisheries 7:1–37.
Walters CJ, Pauly D, Kitchell J. 2000. Representing density-dependent consequences of life history strategies in aquaticecosystems: EcoSim II. Ecosystems 3:70–83.
Watson RT, Zinvowera MC, Moss RH, editors. 1996. Climatechange, 1995: impacts, adaptations and Mitigation of climatechange: scientific-technical analyses. Cambridge (UK): Cam-bridge University Press. 878 p.
560 J. F. Kitchell and others
Copyright © 2022 FDOKUMEN