Association of education with incidence of cognitive impairment in three established populations for...
12
Pergamon J CIin Epidemiol Vol. 47, No. 4, pp. 363-374. 1994 Copyright 0 1994 Elsevier Science Ltd 0895-4356(93)EOO22-4 Printed in Great Britain. All rights reserved 0895-4356/94 $7.00 + 0.00 ASSOCIATION OF EDUCATION WITH INCIDENCE OF COGNITIVE IMPAIRMENT IN THREE ESTABLISHED POPULATIONS FOR EPIDEMIOLOGIC STUDIES OF THE ELDERLY LON WHITE, ROBERTKATZMAN, KATALIN LOSONCZY,* MARCEL SALIVE, ROBERT WALLACE, LISA BERKMAN, JAMESTAYLOR, GERDA FILLENBAUM and RICHARD HAVLIK Epidemiology, Demography, and Biometry Program, National Institute on Aging, Bethesda, MD 20892, U.S.A. (Received in revised form 4 May 1993) Abstract-We analyzed the association of education, occupation, and ‘XX with incidence of cognitive impairment using data from three communities in the Established Popu- lations for Epidemiologic Studies of the Elderly (EPESE) projects (New Haven, East Boston, and Iowa). Participants were initially interviewed in 1981-1983, with follow-up 3 and 6 years later. Incident cognitive impairment was defined on the basis of either: (1) increase in the number of errors in Short Portable Mental Status Questionnaire (SPMSQ) (i.e. from a baseline level below the cutoff value to a score above the cutoff), or (2) inability to respond to interview questions at a follow-up contact (requiring a proxy informant), or (3) death with a recorded diagnosis of a dementing illness. In multiple logistic regression models, the major factors predicting the development of cognitive impairment were advanced age, any errors on baseline SPMSQ, 8 or fewer years of education, and occupation. Education and occupation remained significant predictors after controlling for age, site, sex, stroke, and baseline SPMSQ score. Education Aging Incidence Cognitive impairment Dementia Occupation INTRODUCTION Although advancing age has long been recog- nized as the major determinant of the preva- lence and incidence of cognitive impairment and dementia, recent reports indicate that other demographic factors such as education (or lack thereof) and occupation may also play an im- portant role [l-3]. The Established Populations for Epidemiologic Studies of the Elderly *All correspondence should he addressed to: Katalin Loson- czy, Epidemiology, Demography and Biometry Pro- gram, National Institute on Aging, Gateway Building, Room 3C309, 7201 Wisconsin Avenue, Bethesda, MD 20892, U.S.A. (EPESE) project, initiated and coordinated by the National Institute on Aging (NIA) in the 198Os, is a series of parallel community studies of health and aging. Because of their longitudi- nal design, size, and cross-site demographic differences, the EPESE represent a special re- source for examining the relationship of cogni- tive changes to demographic variables. During the course of the study at the three original EPESE sites, a short mental status test was administered at intervals over a 6-year period to 9174 elderly subjects at baseline, 7674 three years later, and 5580 six years later. In this report we identify subjects who showed a de- terioration in cognitive test performance over 363
-
Upload
independent -
Category
Documents
-
view
0 -
download
0
Transcript of Association of education with incidence of cognitive impairment in three established populations for...
Pergamon
J CIin Epidemiol Vol. 47, No. 4, pp. 363-374. 1994 Copyright 0 1994 Elsevier Science Ltd
0895-4356(93)EOO22-4 Printed in Great Britain. All rights reserved 0895-4356/94 $7.00 + 0.00
ASSOCIATION OF EDUCATION WITH INCIDENCE OF COGNITIVE IMPAIRMENT IN THREE ESTABLISHED
POPULATIONS FOR EPIDEMIOLOGIC STUDIES OF THE ELDERLY
LON WHITE, ROBERT KATZMAN, KATALIN LOSONCZY,* MARCEL SALIVE, ROBERT WALLACE, LISA BERKMAN, JAMES TAYLOR, GERDA FILLENBAUM
and RICHARD HAVLIK
Epidemiology, Demography, and Biometry Program, National Institute on Aging, Bethesda, MD 20892, U.S.A.
(Received in revised form 4 May 1993)
Abstract-We analyzed the association of education, occupation, and ‘XX with incidence of cognitive impairment using data from three communities in the Established Popu- lations for Epidemiologic Studies of the Elderly (EPESE) projects (New Haven, East Boston, and Iowa). Participants were initially interviewed in 1981-1983, with follow-up 3 and 6 years later. Incident cognitive impairment was defined on the basis of either: (1) increase in the number of errors in Short Portable Mental Status Questionnaire (SPMSQ) (i.e. from a baseline level below the cutoff value to a score above the cutoff), or (2) inability to respond to interview questions at a follow-up contact (requiring a proxy informant), or (3) death with a recorded diagnosis of a dementing illness. In multiple logistic regression models, the major factors predicting the development of cognitive impairment were advanced age, any errors on baseline SPMSQ, 8 or fewer years of education, and occupation. Education and occupation remained significant predictors after controlling for age, site, sex, stroke, and baseline SPMSQ score.
Education Aging
Incidence Cognitive impairment Dementia Occupation
INTRODUCTION
Although advancing age has long been recog- nized as the major determinant of the preva- lence and incidence of cognitive impairment and dementia, recent reports indicate that other demographic factors such as education (or lack thereof) and occupation may also play an im- portant role [l-3]. The Established Populations for Epidemiologic Studies of the Elderly
*All correspondence should he addressed to: Katalin Loson- czy, Epidemiology, Demography and Biometry Pro- gram, National Institute on Aging, Gateway Building, Room 3C309, 7201 Wisconsin Avenue, Bethesda, MD 20892, U.S.A.
(EPESE) project, initiated and coordinated by the National Institute on Aging (NIA) in the 198Os, is a series of parallel community studies of health and aging. Because of their longitudi- nal design, size, and cross-site demographic differences, the EPESE represent a special re- source for examining the relationship of cogni- tive changes to demographic variables. During the course of the study at the three original EPESE sites, a short mental status test was administered at intervals over a 6-year period to 9174 elderly subjects at baseline, 7674 three years later, and 5580 six years later. In this report we identify subjects who showed a de- terioration in cognitive test performance over
363

364 Lt3N WHITE el al.
the study period, and examine the association of such changes with education, occupation, and other factors known to influence cognitive functioning in later life.
METHODS
Study populations The data reported here were collected during
the course of three cooperative longitudinal studies of aging referred collectively as the EPESE. The EPESE studies were funded as intramural research contracts by the Epidemiol- ogy, Demography and Biometry Program of the NIA. Data collection occurred in East Boston, Massachusetts; New Haven, Connecticut; and in Washington and Iowa counties in Iowa. Informed consent was obtained from all sub- jects and the study was approved by local human-subjects review boards at the three par- ticipating institutions (Brigham and Women’s Hospital, Yale University, and the University of Iowa). A description of the information col- lected during the course of the initial interview, including data on mental status test scores, has been presented in detail elsewhere [4,5]. History of stroke was included in analyses because of a known relationship with cognitive impairment. Because of disproportionately missing data on income among those with education of less than 8 years, this economic variable could not be used in the analysis. Some of the participants included in the data presented here were in- cluded among the subjects of previous publi- cations on the prevalence of dementia among older residents of East Boston [6--g], and on memory functioning in Iowa [lo].
Between 1981 and 1983, trained interviewers conducted household interviews at the three EPESE sites. Proxy informants were utilized only when the primary participant could not be interviewed, usually for reasons of incapacita- tion, except in Iowa at baseline when un- availability was an acceptable reason. Although only non-institutionalized subjects were in- cluded in the baseline survey, subsequent par- ticipation did not depend on residence; only those persons who became totally inaccessible through migration to a remote location, or who declined to continue their participation were dropped. For East Boston and the two Iowa counties, the target population for the survey was the full 65 and older non-institutionalized population. At New Haven the study popu-
lation was a stratified probability sample, defined according to sex (to yield approximately equal numbers of men and women), and hous- ing type (public, private, or community). Base- line interviews were completed by 84% of East Boston’s eligible respondents (N = 3809), 80% of the eligible Iowa respondents (N = 3673), and 82% of the eligible New Haven sample (N = 2812). Among those initially interviewed who survived to the time of next follow-up, subsequent response rates were greater than 95% at all sites. Follow-up household inter- views were conducted 3 years (FU3) and 6 years (FU6) after the date of the baseline interview. Death certificate diagnoses, coded by a single nosologist, were obtained for nearly all subjects who died.
Occupation We examined the influence of the person’s
usual lifetime occupation using U.S. Census occupational codes, which were reclassified into secondary hierarchical categories using two different methods, one based on an established prestige scale (the NORC system) [l 11, and the other on relative educational attainment. Although the NORC system for categorizing occupations according to socioeconomic status is rather closely associated with educational attainment, it is also influenced by social pres- tige and other factors not directly reflecting the intellectual and knowledge requirements, or the cognitive activities of the occupation. We created a hierarchical 5-category occupation/ educational attainment scale based on the per- centage of persons who reported 12 or more years of education per occupation. Occupations were grouped in order of decreasing educational attainment as follows: l-professional, techni- cal, and clerical occupations; 2-managers, ad- ministrators, and farm managers; 3-house- wives; 4--craftsmen, kindred workers, farmers (owners and tenants), and farm laborers; 5- equipment operators, laborers (except farm), domestics. The major differences between these two classifications is that farmers are ranked very low in the older prestige scale; indeed, farm managers today clearly are of much higher prestige in Iowa and Washington counties. This is taken into account in the education-based occupational ladder. Also, farm managers had higher educational attainment than farm owners in this population and so were placed in separ- ate categories for the education-based occu- pational groupings. Moreover, housewives are
Education and Incidence of Cognitive Impairment 365
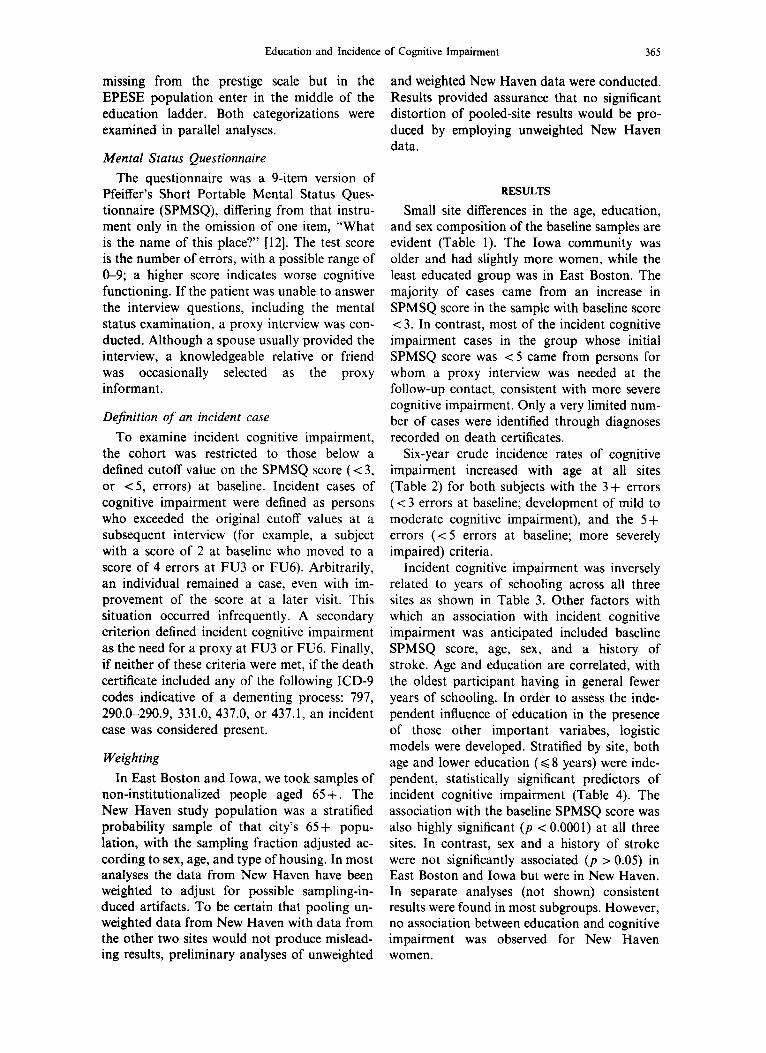
missing from the prestige scale but in the EPESE population enter in the middle of the education ladder. Both categorizations were examined in parallel analyses.
Mental Status Questionnaire
The questionnaire was a 9-item version of Pfeiffer’s Short Portable Mental Status Ques- tionnaire (SPMSQ), differing from that instru- ment only in the omission of one item, “What is the name of this place?” [12]. The test score is the number of errors, with a possible range of O-9; a higher score indicates worse cognitive functioning. If the patient was unable to answer the interview questions, including the mental status examination, a proxy interview was con- ducted. Although a spouse usually provided the interview, a knowledgeable relative or friend was occasionally selected as the proxy informant.
Definition of an incident case
To examine incident cognitive impairment, the cohort was restricted to those below a defined cutoff value on the SPMSQ score (< 3, or ~5, errors) at baseline. Incident cases of cognitive impairment were defined as persons who exceeded the original cutoff values at a subsequent interview (for example, a subject with a score of 2 at baseline who moved to a score of 4 errors at FU3 or FU6). Arbitrarily, an individual remained a case, even with im- provement of the score at a later visit. This situation occurred infrequently. A secondary criterion defined incident cognitive impairment as the need for a proxy at FU3 or FU6. Finally, if neither of these criteria were met, if the death certificate included any of the following ICD-9 codes indicative of a dementing process: 797, 290.0-290.9, 331.0, 437.0, or 437.1, an incident case was considered present.
Weighting
In East Boston and Iowa, we took samples of non-institutionalized people aged 65 + . The New Haven study population was a stratified probability sample of that city’s 65+ popu- lation, with the sampling fraction adjusted ac- cording to sex, age, and type of housing. In most analyses the data from New Haven have been weighted to adjust for possible sampling-in- duced artifacts. To be certain that pooling un- weighted data from New Haven with data from the other two sites would not produce mislead- ing results, preliminary analyses of unweighted
and weighted New Haven data were conducted. Results provided assurance that no significant distortion of pooled-site results would be pro- duced by employing unweighted New Haven data.
RESULTS
Small site differences in the age, education, and sex composition of the baseline samples are evident (Table 1). The Iowa community was older and had slightly more women, while the least educated group was in East Boston. The majority of cases came from an increase in SPMSQ score in the sample with baseline score ~3. In contrast, most of the incident cognitive impairment cases in the group whose initial SPMSQ score was <5 came from persons for whom a proxy interview was needed at the follow-up contact, consistent with more severe cognitive impairment. Only a very limited num- ber of cases were identified through diagnoses recorded on death certificates.
Six-year crude incidence rates of cognitive impairment increased with age at all sites (Table 2) for both subjects with the 3+ errors (< 3 errors at baseline; development of mild to moderate cognitive impairment), and the 5+ errors (< 5 errors at baseline; more severely impaired) criteria.
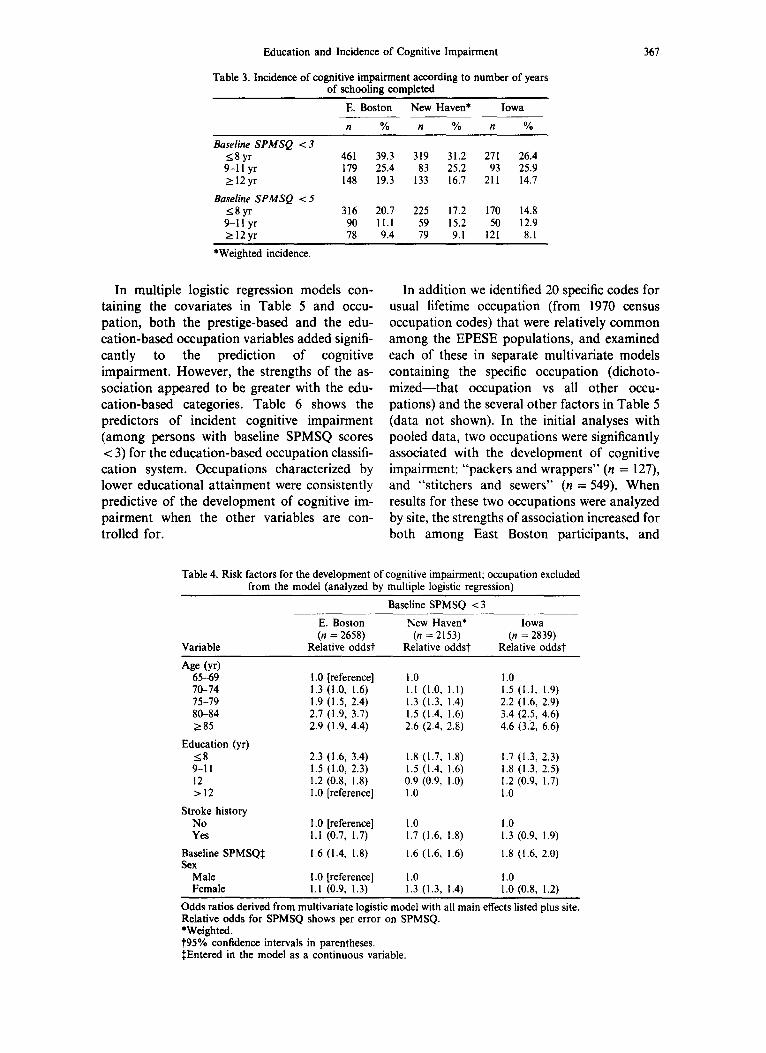
Incident cognitive impairment was inversely related to years of schooling across all three sites as shown in Table 3. Other factors with which an association with incident cognitive impairment was anticipated included baseline SPMSQ score, age, sex, and a history of stroke. Age and education are correlated, with the oldest participant having in general fewer years of schooling. In order to assess the inde- pendent influence of education in the presence of those other important variabes, logistic models were developed. Stratified by site, both age and lower education (< 8 years) were inde- pendent, statistically significant predictors of incident cognitive impairment (Table 4). The association with the baseline SPMSQ score was also highly significant (p < 0.0001) at all three sites. In contrast, sex and a history of stroke were not significantly associated (p > 0.05) in East Boston and Iowa but were in New Haven. In separate analyses (not shown) consistent results were found in most subgroups. However, no association between education and cognitive impairment was observed for New Haven women.

366 h3N WHITE et al.
Table I. Baseline study population; characteristics of the two overlapping subpopulations used for defining incident cases of cognitive impairment,
and criteria for incidence
Characteristic
Site
E. Boston New Haven Iowa
Baseline Population Total baseline population (no.) with available SPMSQ <3
I. with baseline SPMSQ <3 II. with baseline SPMSQ <5
3809 2812 3673 3337 2745 3092 2658 2153 2839 3183 2559 3047
I. Baseline SPMSQ ~3 Age: 65-74 (%)
75-84 285
Sex: (%) women) Education: (yr)
<9 (%) 9-12 > 12
Stroke hx (% yes) Incident cases (no.)
Declining SPMSQ (%) Proxy Death certificate Dx
II. Baseline SPMSQ ~5 Age: 65-74 (%)
75-84 285
Sex: (%) women) Education: (yr)
<9 (%) 9-12 >I2
Stroke hx (% yes) Incident cases (no.)
Declining SPMSQ (%) Proxy Death certificate Dx
70.0 62.7 57.2 25.9 30.9 35.4 4.1 6.4 7.5
60.2 62.6 63.1
44.3 43.5 36.4 48.0 37.0 42.9
7.6 19.5 20.7 4.0 5.6 5.7
792 546 580 78 76 21 22 :: 0.5 2 2
66.6 60.5 55.7 28.1 31.2 36.1
5.3 7.8 8.2 60.7 63.2 63.1
48.1 46.8 37.9 45.1 35.4 42.3
6.8 17.8 19.5 4.2 6.0 5.9
489 372 343 42 47 32 57 49 63
1 4 6
Although there is a concern about possible methodologic or population differences among the sites, the consistency of the principal find- ings reported here (education and occupation)
Table 2. Three NIA EPESE populations: 6-year incidence of cognitive impairment according to baseline SPMSQ score
and age
E. Boston New Haven* Iowa % % %
Baseline SPMSQ ~3 Age: 65-69 21.7
-70-74 27.1 75-79 38.9 SO-84 285
All ages
Baseline SPMSQ ~5 Age: 65-69
70-74 15-79 SO-84 ~85
All ages
48.4 50.5 29.8
8.6 12.0 18.9 31.7 38.2 15.4
20.3 11.4 22.6 16.2 27.0 23.3 30.5 32.7 43.6 41.0 25.0 20.4
8.8 4.1 12.3 7.2 16.1 11.5 20.2 19.4 28.2 34.8 14.3 11.3
*Weighted incidence.
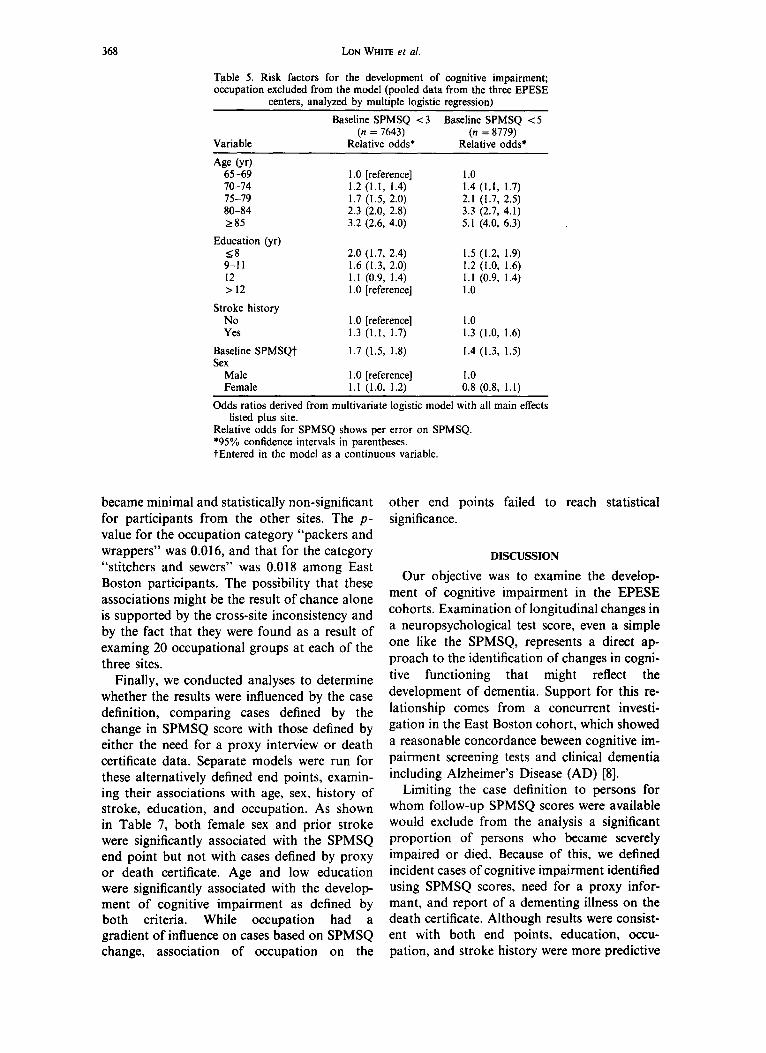
justifies a pooled analysis of data. We con- sidered site an independent variable along with age, education, sex, the baseline SPMSQ, and history of stroke. The logistic regression model for persons with baseline SPMSQ scores ~3 is shown in Table 5. With the added power afforded by the pooled data, a history of stroke became a statistically significant predictor of cognitive impairment. Sex was weakly predictive of incident cognitive impairment but not statistically significant (p = 0.06).
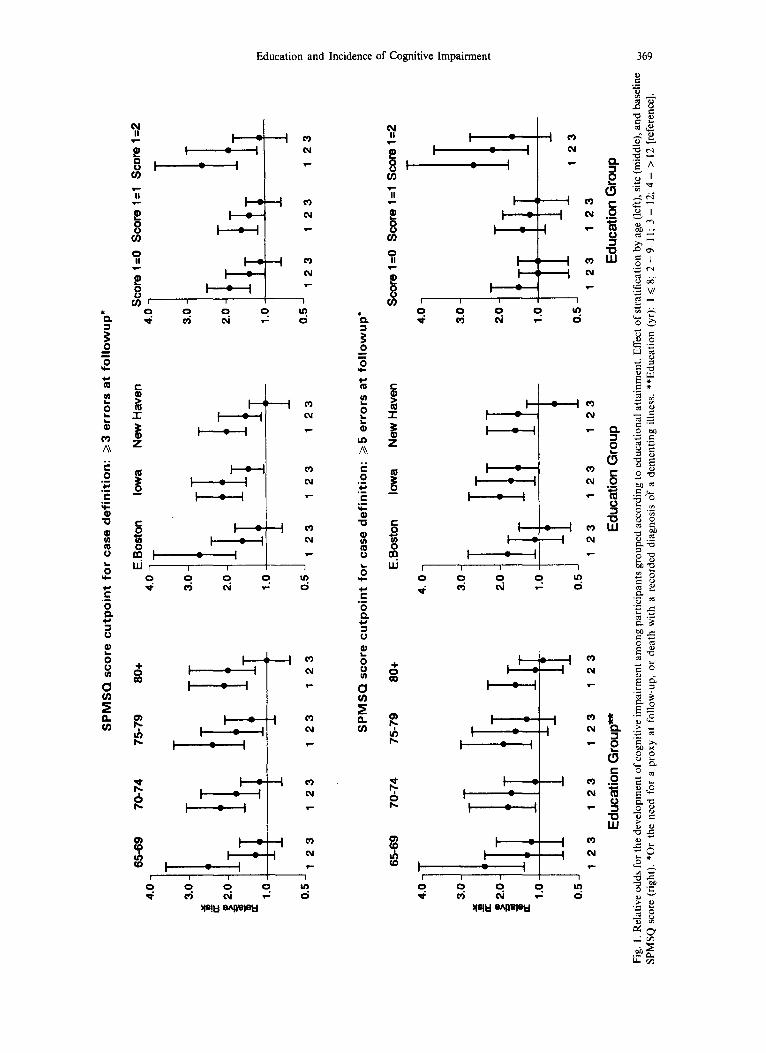
In order to be certain that the education association that remained was not simply due to failure to account fully for age and baseline score, we performed logistic regression analyses on samples stratified by five-year age group, site, and baseline SPMSQ score (0, 1, or 2 for impairment defined on the basis of SPMSQ >, 3 and 0, 1, 2, 3, or 4 for SPMSQ > 5). Low education remained a significant predictor in all of these analyses (Fig. 1).
Education and Incidence of Cognitive Impairment 367
Table 3. Incidence of cognitive impairment according to number of years of schooling completed
Baseline SPMSQ ~3 <8yr 9-l 1 yr 212yr
Baseline SPMSQ ~5 <8yr 9-1 I yr 112yr
E. Boston
n %
461 39.3 179 25.4 148 19.3
316 20.7 225 17.2 170 14.8 90 11.1 59 15.2 50 12.9 78 9.4 79 9.1 121 8.1
New Haven*
n %
319 31.2 83 25.2
133 16.7
Iowa
n %
271 26.4 93 25.9
211 14.7
*Weighted incidence.
In multiple logistic regression models con- In addition we identified 20 specific codes for taining the covariates in Table 5 and occu- usual lifetime occupation (from 1970 census pation, both the prestige-based and the edu- occupation codes) that were relatively common cation-based occupation variables added signifi- among the EPESE populations, and examined cantly to the prediction of cognitive each of these in separate multivariate models impairment. However, the strengths of the as- containing the specific occupation (dichoto- sociation appeared to be greater with the edu- mized-that occupation vs all other occu- cation-based categories. Table 6 shows the pations) and the several other factors in Table 5 predictors of incident cognitive impairment (data not shown). In the initial analyses with (among persons with baseline SPMSQ scores pooled data, two occupations were significantly < 3) for the education-based occupation classifi- associated with the development of cognitive cation system. Occupations characterized by impairment: “packers and wrappers” (n = 127), lower educational attainment were consistently and “stitchers and sewers” (n = 549). When predictive of the development of cognitive im- results for these two occupations were analyzed pairment when the other variables are con- by site, the strengths of association increased for trolled for. both among East Boston participants, and
Table 4. Risk factors for the development of cognitive impairment; occupation excluded from the model (analyzed by multiple logistic regression)
Baseline SPMSQ ~3
Variable
E. Boston New Haven* Iowa (n = 2658) (n = 2153) (n = 2839)
Relative oddst Relative oddsi Relative oddst
Age 64 65-69 IO-74 75-79 80-84 285
Education (yr) 18 9-11 12 >I2
Stroke history No Yes
Baseline SPMSQJ Sex
Male Female
I .O [reference] I.0 1.0 1.3 (1.0, 1.6) I.1 (1.0, 1.1) 1.5 (1.1, 1.9) 1.9 (1.5, 2.4) 1.3 (1.3, 1.4) 2.2 (1.6, 2.9) 2.7 (1.9, 3.7) 1.5 (1.4, 1.6) 3.4 (2.5, 4.6) 2.9 (1.9, 4.4) 2.6 (2.4, 2.8) 4.6 (3.2, 6.6)
2.3 (1.6, 3.4) 1.8 (1.7, 1.8) 1.7 (1.3, 2.3) 1.5 (1.0, 2.3) 1.5 (1.4, 1.6) 1.8 (1.3, 2.5) 1.2 (0.8, I .8) 0.9 (0.9, 1.0) 1.2 (0.9, 1.7) 1 .O [reference] I.0 1.0
I .O [reference] 1.0 I.0 1.1 (0.7, 1.7) 1.7 (1.6, 1.8) I .3 (0.9, 1.9)
1.6 (1.4, 1.8) 1.6 (1.6, 1.6) 1.8 (1.6, 2.0)
I .O [reference] I.0 1.0 I.1 (0.9. 1.3) 1.3 (1.3, 1.4) 1.0 (0.8. 1.2)
Odds ratios derived from multivariate logistic model with all main effects listed DIUS site. Relative odds for SPMSQ shows per error on SPMSQ. *Weighted. t95% confidence intervals in parentheses. IEntered in the model as a continuous variable.
368 b3N WHITE et al.
Table 5. Risk factors for the development of cognitive impairment; occupation excluded from the model (pooled data from the three EPESE
centers, analyzed by multiple logistic regression)
Variable
Baseline SPMSQ <3 Baseline SPMSQ <5 (n = 7643) (n = 8779)
Relative odds* Relative odds*
Age W 65-69 70-74 75-79 80-84 285
Education (yr) 18 9-11 12 > 12
Stroke history No Yes
Baseline SPMSQt Sex
Male Female
1 .O [reference] 1.2 (1.1, 1.4) 1.7 (1.5, 2.0) 2.3 (2.0, 2.8) 3.2 (2.6, 4.0)
2.0 (1.7, 2.4) 1.5 (1.2, 1.9) 1.6 (1.3, 2.0) 1.2 (1.0, 1.6) 1.1 (0.9, 1.4) 1.1 (0.9, 1.4) 1 .O [reference] 1.0
1 .O [reference] 1.0 1.3 (1.1, 1.7) 1.3 (1.0, 1.6)
1.7 (1.5, 1.8) 1.4 (1.3, 1.5)
1 .O [reference] 1.0 1.1 (1.0, 1.2) 0.8 (0.8, 1.1)
I: (1.1, 1.7) 2.1 (1.7, 2.5) 3.3 (2.7, 4.1) 5.1 (4.0, 6.3)
Odds ratios derived from multivariate logistic model with all main effects listed plus site.
Relative odds for SPMSQ shows per error on SPMSQ. ‘95% confidence intervals in parentheses. tEntered in the model as a continuous variable.
became minimal and statistically non-significant for participants from the other sites. The p- value for the occupation category “packers and wrappers” was 0.016, and that for the category “stitchers and sewers” was 0.018 among East Boston participants. The possibility that these associations might be the result of chance alone is supported by the cross-site inconsistency and by the fact that they were found as a result of examing 20 occupational groups at each of the three sites.
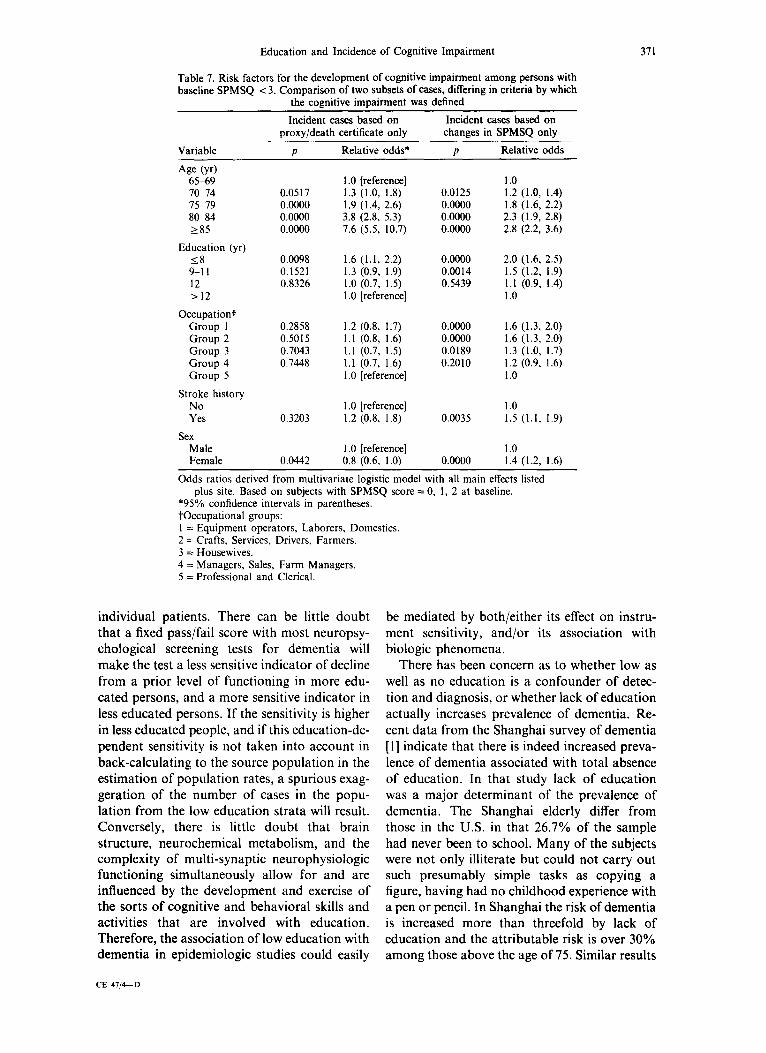
Finally, we conducted analyses to determine whether the results were influenced by the case definition, comparing cases defined by the change in SPMSQ score with those defined by either the need for a proxy interview or death certificate data. Separate models were run for these alternatively defined end points, examin- ing their associations with age, sex, history of stroke, education, and occupation. As shown in Table 7, both female sex and prior stroke were significantly associated with the SPMSQ end point but not with cases defined by proxy or death certificate. Age and low education were significantly associated with the develop- ment of cognitive impairment as defined by both criteria. While occupation had a gradient of influence on cases based on SPMSQ change, association of occupation on the
other end points failed to reach statistical significance.
DISCUSSION
Our objective was to examine the develop- ment of cognitive impairment in the EPESE cohorts. Examination of longitudinal changes in a neuropsychological test score, even a simple one like the SPMSQ, represents a direct ap- proach to the identification of changes in cogni- tive functioning that might reflect the development of dementia. Support for this re- lationship comes from a concurrent investi- gation in the East Boston cohort, which showed a reasonable concordance beween cognitive im- pairment screening tests and clinical dementia including Alzheimer’s Disease (AD) [8].
Limiting the case definition to persons for whom follow-up SPMSQ scores were available would exclude from the analysis a significant proportion of persons who became severely impaired or died. Because of this, we defined incident cases of cognitive impairment identified using SPMSQ scores, need for a proxy infor- mant, and report of a dementing illness on the death certificate. Although results were consist- ent with both end points, education, occu- pation, and stroke history were more predictive
SPM
SQ
scor
e cu
tpoi
nt
for
case
def
initi
on:
>3 e
rrors
at
follo
wup
”
0.5
J 12
3 12
3 12
3 12
3 0.
5 J 1
23
123
123
0.5 J
12
3 12
3 12
3
4.0
3.0
.#
a 8 2.
0
$ 1.
0
0.5 J
65-6
9 70
-74
J”
c.
&
SPM
SQ
scor
e cu
tpoi
nt
for
case
def
initi
on:
25 e
rrors
at
follo
wup
’ !! 0,
75
-79
80+
E.Bo
ston
Io
wa
New
Hav
en
scor
e l=
O sc
ore
l=l
scor
e 1=
2 C
4. 0
T T
3.0
h--k
I
123
123
123
Edu
catio
n G
roup
*
123
2.0
1.0
0.5 I I I 12
3 12
3 12
3 E
duca
tion
Gro
up
4.0
3.0
2.0
1.0
123
123
Edu
catio
n G
roup
Fig.
1.
Rel
ativ
e od
ds
for
the
deve
lopm
ent
of c
ogni
tive
impa
irmen
t am
ong
parti
cipa
nts
grou
ped
acco
rdin
g to
edu
catio
nal
atta
inm
ent.
Effe
ct
of s
tratif
icat
ion
by a
ge
(left)
, si
te (
mid
dle)
, an
d ba
selin
e SP
MSQ
sc
ore
(rig
ht).
*Or
the
need
fo
r a
prox
y at
fo
llow
-up,
or
de
ath
with
a
reco
rded
di
agno
sis
of
a de
men
ting
illne
ss.
**Ed
ucat
ion
(yr)
: I <
8;
2 =
9-11
; 3
= 12
; 4
= >
12 [
refe
renc
e].
g VJ
370 bN WHITE ef al.
of the end point that was restricted to changes in mental status score only.
A cross-sectional relationship between edu- cation and mental status tests was first noted in 1960 by Kahn ef al. [ 131 using the original Mental Status Questionnaire. Similar findings have been reported by many investigators who have employed the Mini Mental Status Examin- ation (MMSE) [14-161. In a study of cognitive impairment in East Baltimore utilizing the MMSE [17], Kramer et al. reported the highest rates of severe cognitive impairment for persons with the lowest levels of education. Among persons aged 65 years and older with less than 6 years of education the prevalence was 12.5%, decreasing to 1.6% for persons with 12 or more years of education. Consistent findings come from a study by Holzer et al. [18]. Although some of the higher prevalence of cognitive im- pairment in persons of lesser education may be mediated by an association between low edu-
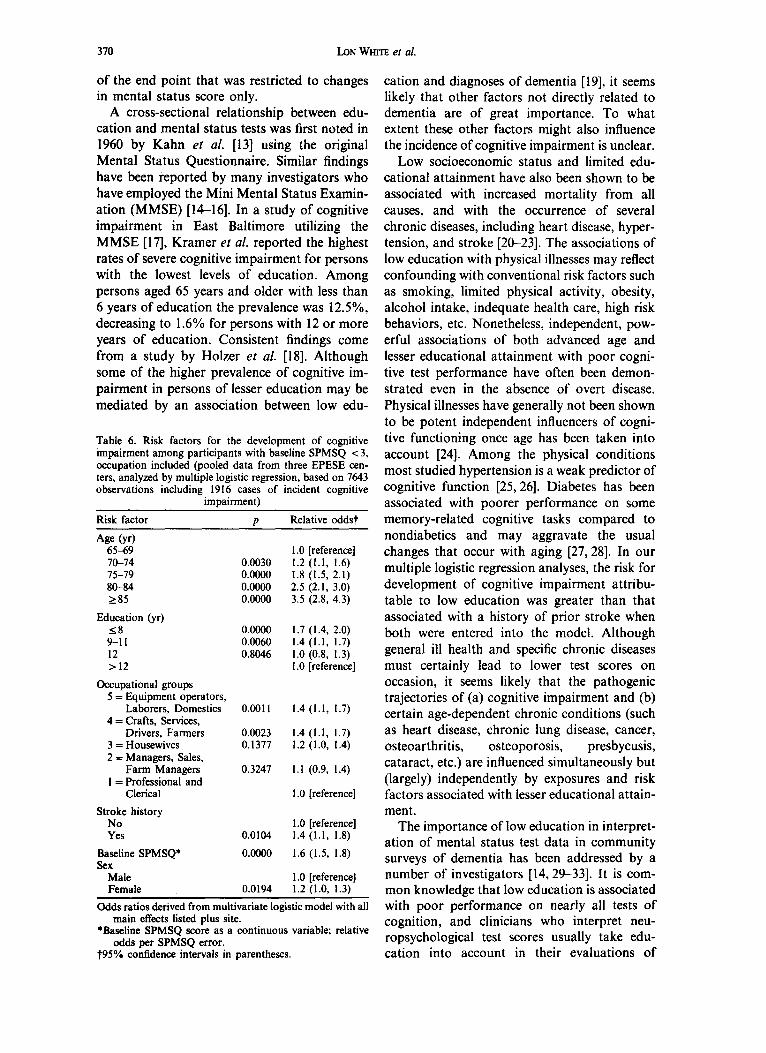
Table 6. Risk factors for the development of cognitive impairment among participants with baseline SPMSQ < 3, occupation included (pooled data from three EPESE cen- ters, analyzed by multiple logistic regression, based on 7643 observations including 1916 cases of incident cognitive
Risk factor
impairment)
P Relative oddst
Age (v) 65-69 70-74 0.0030
1 .O [reference] 1.2 (1.1. 1.6)
75-79 80-84 285
Education (yr)
0.0000 1.8 (1.5; 2.lj 0.0000 2.5 (2.1, 3.0) 0.0000 3.5 (2.8, 4.3)
18 0.0000 1.7 (1.4, 2.0) 9-11 0.0060 1.4 (1.1. 1.7) 12 0.8046 1.0 (0.8; I.3j >12 I .O [reference]
Occupational groups 5 = Equipment operators,
Laborers, Domestics 0.0011 1.4 (1.1, 1.7) 4 = Crafts, Services,
Drivers, Farmers 0.0023 1.4 (1.1, 1.7) 3 = Housewives 0.1377 1.2 (1.0, 1.4) 2 = Managers, Sales,
Farm Managers 0.3247 1.1 (0.9, 1.4) I = Professional and
Clerical 1 .O [reference]
Stroke history No 1.0 [reference] Yes 0.0104 1.4 (1.1, 1.8)
Baseline SPMSQ* 0.0000 1.6 (1.5, 1.8) Sex
Male 1 .O [reference] Female 0.0194 1.2 (1.0, 1.3)
odds ratios derived from multivariate logistic model with all main effects listed plus site.
*Baseline SPMSQ score as a continuous variable: relative odds per SPMSQ error.
t95% confidence intervals in parentheses.
cation and diagnoses of dementia [19], it seems likely that other factors not directly related to dementia are of great importance. To what extent these other factors might also influence the incidence of cognitive impairment is unclear.
Low socioeconomic status and limited edu- cational attainment have also been shown to be associated with increased mortality from all causes, and with the occurrence of several chronic diseases, including heart disease, hyper- tension, and stroke [20-231. The associations of low education with physical illnesses may reflect confounding with conventional risk factors such as smoking, limited physical activity, obesity, alcohol intake, indequate health care, high risk behaviors, etc. Nonetheless, independent, pow- erful associations of both advanced age and lesser educational attainment with poor cogni- tive test performance have often been demon- strated even in the absence of overt disease. Physical illnesses have generally not been shown to be potent independent influencers of cogni- tive functioning once age has been taken into account [24]. Among the physical conditions most studied hypertension is a weak predictor of cognitive function [25,26]. Diabetes has been associated with poorer performance on some memory-related cognitive tasks compared to nondiabetics and may aggravate the usual changes that occur with aging [27,28]. In our multiple logistic regression analyses, the risk for development of cognitive impairment attribu- table to low education was greater than that associated with a history of prior stroke when both were entered into the model. Although general ill health and specific chronic diseases must certainly lead to lower test scores on occasion, it seems likely that the pathogenic trajectories of (a) cognitive impairment and (b) certain age-dependent chronic conditions (such as heart disease, chronic lung disease, cancer, osteoarthritis, osteoporosis, presbycusis, cataract, etc.) are influenced simultaneously but (largely) independently by exposures and risk factors associated with lesser educational attain- ment.
The importance of low education in interpret- ation of mental status test data in community surveys of dementia has been addressed by a number of investigators [14,29-331. It is com- mon knowledge that low education is associated with poor performance on nearly all tests of cognition, and clinicians who interpret neu- ropsychological test scores usually take edu- cation into account in their evaluations of
Education and Incidence of Cognitive Impairment
Table 7. Risk factors for the development of cognitive impairment among persons with baseline SPMSQ <3. Comparison of two subsets of cases, differing in criteria by which
the cognitive imDairment was defined
371
Variable
Incident cases based on Incident cases based on proxy/death certificate only changes in SPMSQ only
P Relative odds* P Relative odds
Age W 65-69 I .O [reference] 1.0 70-74 0.0517 1.3 (1.0, 1.8). 0.0125 1.2 (1.0, 1.4) 75-79 0.0000 1.9 (1.4, 2.6) 0.0000 1.8 (1.6, 2.2) 80-84 0.0000 3.8 (2.8, 5.3) 0.0000 2.3 (1.9, 2.8) 285 0.0000 7.6 (5.5, 10.7) 0.0000 2.8 (2.2, 3.6)
Education (yr) 18 0.0098 1.6 (1.1, 2.2) 0.0000 2.0 (1.6, 2.5) 9-11 0.1521 1.3 (0.9, 1.9) 0.0014 1.5 (1.2, 1.9) 12 0.8326 1.0 (0.7, 1.5) 0.5439 1.1 (0.9, 1.4) >I2 I .O [reference] 1.0
Occupationi Group I 0.2858 1.2 (0.8, 1.7) 0.0000 1.6 (1.3, 2.0) Group 2 0.5015 1.1 (0.8, 1.6) 0.0000 1.6 (1.3, 2.0) Group 3 0.7043 I.1 (0.7, 1.5) 0.0189 1.3 (1.0, 1.7) Group 4 0.7448 1.1 (0.7, 1.6) 0.2010 1.2 (0.9, 1.6) Group 5 I .O [reference] 1.0
Stroke history No I .O [reference] 1.0 Yes 0.3203 1.2 (0.8, 1.8) 0.0035 1.5 (1.1, 1.9)
Sex Male 1 .O [reference] 1.0 Female 0.0442 0.8 (0.6, 1.0) 0.0000 1.4 (1.2, 1.6)
Odds ratios derived from multivariate logistic model with all main effects listed plus site. Based on subjects with SPMSQ score = 0, 1, 2 at baseline.
*95% confidence intervals in parentheses. toccupational groups: 1 = Equipment operators, Laborers, Domestics. 2 = Crafts, Services, Drivers, Farmers. 3 = Housewives. 4 = Managers, Sales, Farm Managers. 5 = Professional and Clerical.
individual patients. There can be little doubt that a fixed pass/fail score with most neuropsy- chological screening tests for dementia will make the test a less sensitive indicator of decline from a prior level of functioning in more edu- cated persons, and a more sensitive indicator in less educated persons. If the sensitivity is higher in less educated people, and if this education-de- pendent sensitivity is not taken into account in back-calculating to the source population in the estimation of population rates, a spurious exag- geration of the number of cases in the popu- lation from the low education strata will result. Conversely, there is little doubt that brain structure, neurochemical metabolism, and the complexity of multi-synaptic neurophysiologic functioning simultaneously allow for and are influenced by the development and exercise of the sorts of cognitive and behavioral skills and activities that are involved with education. Therefore, the association of low education with dementia in epidemiologic studies could easily
CE 47/&D
be mediated by both/either its effect on instru- ment sensitivity, and/or its association with biologic phenomena.
There has been concern as to whether low as well as no education is a confounder of detec- tion and diagnosis, or whether lack of education actually increases prevalence of dementia. Re- cent data from the Shanghai survey of dementia [l] indicate that there is indeed increased preva- lence of dementia associated with total absence of education. In that study lack of education was a major determinant of the prevalence of dementia. The Shanghai elderly differ from those in the U.S. in that 26.7% of the sample had never been to school. Many of the subjects were not only illiterate but could not carry out such presumably simple tasks as copying a figure, having had no childhood experience with a pen or pencil. In Shanghai the risk of dementia is increased more than threefold by lack of education and the attributable risk is over 30% among those above the age of 75. Similar results
372 bN WHITE et al.
have been obtained in recent community sur- veys by Bonaiuto et al. [34] in Italy, by Evans et al. in an incidence study in East Boston [7,9], a prevalence study in Bordeaux [2], and a preva- lence study of severe dementia in Finland [35] but not in an incidence study in Framingham [361.
Low education as a predictor or “risk factor” for progressive cognitive impairment and de- mentia appears to meet the epidemiological criteria of consistency and temporal relation. In the present report there was also a gradient of influence: the incidence of cognitive impairment in persons with 8 or fewer years of schooling completed was greater than those with 9-l 1 years, which was, in turn, greater than that in high school graduates. There was, however, no difference between high school graduates and those with additional years of college. In the Shanghai survey [I] (where over one-third of the subjects had no education and another third had no more than 6th grade) there was a definite gradient that was consistent across three strata (noneducated > elementary school > middle school or more). In a Minnesota study of func- tional impairment in a convent [37], there was less impairment in those with a bachelor’s de- gree or more compared to those without such a degree even among sisters who had the same occupation, teaching. In the Sulkava et al. study [35] the greatest prevalence of AD was in those with grade school or less, but there was the anomalous finding that the prevalence of AD was greater in high school graduates than in those with a “low intermediate” education. It should be noted, however, that there were ony 64 cases in that series.
The recognition that education influences cognitive decline and impairment in late life raises a number of questions. It is possible that low or no education is a surrogate for a prior exposure, such as nutritional deprivation or other socioeconomic factors early in life. The lifelong effects of illiteracy or low education certainly could include increased exposure to many environmental, occupational, nutritional, and social factors, compared with people of higher education and socioeconomic status. Such influences might lead directly to lower levels of cognitive performance (test scores) during adult life, or they might affect brain structure and function and thereby limit the person’s cognitive resilience and functional re- serves in the face of challenge by disease, aging, or other processes that disrupt or erode the
structural and functional integrity of the central nervous system. It is unclear if the association of education with dementia is due to differences in cognitive activity throughout life, or to the educational process per se. In this regard it is pertinent to consider the effect of occupation and its relationship with education. For example, there are little data bearing on the mechanism by which the influence of education is mediated, and on the interval over which that influence is applied.
Occupation has been reported to be associ- ated with both the prevalence (in Bordeaux, France [38] and in Appignano, Italy [3]), and incidence of cognitive impairment (in an analy- sis of East Boston data using a different marker of cognitive decline [7]). We considered two alternative occupational scaling systems: the NORC scale, commonly used in studies of socioeonomic status, is largely based on pres- tige; the second, created for these analyses using EPESE data, was based exclusively on edu- cational attainment. A major difference between these two classifications is that farmers were ranked very low in the older prestige scale; however, farm owners today are probably of much higher prestige and in fact are typically managers of their farms in the geographical region of Iowa which was surveyed. This was reflected in the education-based scale. Housewives, for whom there is no NORC code, are in the middle of the educational attainment scale.
Low education and occupation were both independent, significant predictors of cognitive decline in an analyses controlled for age, stroke, site, sex, and the baseline SPMSQ. In these models containing both education and occu- pation, the relative odds ratio patterns for both factors were substantially less impressive than in models containing either one or the other. This was interpreted as evidence that large parts of both of their influences are mediated through some common underlying factor. It seems likely that neither the years spent sitting in a class- room, nor one’s occupation directly influence cognitive decline, but that both serve as surro- gates for other factors, events, exposures, and/or experiences that directly affect the devel- opment of cognitive impairment.
The effect of adding occupation to the models can be noted by comparing Table 6 with the left half of Table 5 (incident cognitive impairment in persons with baseline SPMSQ scores ~3). The model used to generate Table 6 included an
Education and Incidence of Cognitive Impairment 373
additional group of independent variables-5 strata of occupation. With occupation in the model, the strengths of association with cogni- tive impairment increased slightly for advancing age, increased minimally for female sex and history of stroke, decreased minimally for baseline SPMSQ, and decreased for lower education.
The association of level of cognitive function- ing with occupation (hierarchically ordered ac- cording to average years of schooling) suggests a non-specific mechanism possibly related to self-selection and/or exercise of intellectual fa- cilities. Our second observation--that two specific occupations were significantly associ- ated (at p < 0.05) with incident cognitive im- pairment at one site but not at the others resulted from an examination of 20 distinct occupations.
Female sex barely increased the risk for the development of cognitive impairment in the data reported here. This differs from the finding in the Shanghai survey [l] and several other studies [31] of a significantly greater prevalence of dementia among women, but is consistent with similar distributions of baseline SPMSQ scores in EPESE men and women [5]. In a study of neuropsychological test performance in the Framingham population, a weak association of sex was seen for only one of eight tests (paired associate learning of words) [39]. This was in contrast to the overall strong associations of age, education, occupation, and baseline score.
It is likely that the biological basis of edu- cation as a risk factor may be quite different from that of other risk factors for dementia. Several groups have recently reported that one of the consistent events in AD is loss of synapses [40-421. There is now strong evidence that the severity of dementia in AD is a function of the loss of neocortical synapses; for example, Terry and colleagues [43] have found that the corre- lation of midfrontal synapse density, measured with an antibody to synaptophysin, correlates well with scores on three mental status tests. Also, cases of individuals with normal cognitive function during life but in whom the number of neocortical neuritic plaques counted at autopsy meet diagnostic criteria for the pathological diagnosis of AD [44] have higher than normal brain weights and numbers of large neurons, suggests that a large neuronal reserve protected those individuals from clinical signs of dementia [31,41,43]. It can be conjectured that if lack of education or other developmental stressors or
insults led to a lower reserve of neurons or synapses, there might be an earlier expression of symptoms in’ the course of development of AD. Because of the steep age dependence of demen- tia and AD, if clinical symptoms were present 3-4 years earlier in persons with educational deprivation, the prevalence of dementia could be increased by as much as 50%, perhaps accounting for the findings in this study.
The new findings from these population- based studies suggest that educational and/or occupational factors may play an important role in the pathogenesis of cognitive impairment and dementia. An understanding of the mechanisms underlying such relationships could help differ- entiate whether cognitive impairment as an indi- cator of AD is associated with low education because of resulting diminished brain capacity or because it is a surrogate for a separate exposure to environmental factors or insults in an occupational setting. Further elucidation of these complex pathways is necessary.
REFERENCES
1.
2.
3.
4.
5.
6.
7.
8
Zhang M, Katzman R, Jin H, Cai G, Wang Z, Qu G, Grant I. Yu E. Levv P. Liu WT. The orevalence of dementia and Alzheime;‘s disease (AD)‘in Shanghai, China. Ann Neurol 1990; 27: 428-437. Dartiques JF, Messier C, Gagnon M, Salamon R, Barberger-Gateau P, Orogogozo M. Correlates of dementia: An epidemiological study in the area of Bordeaux (France). Society Neurosci Ahstr 1989; 15: 863. Rocca WA, Bonaiuto S, Lippi A, Luciani P, Turtu F, Cavarzeran F, Amaducci L. Prevalence of clinically diagnosed Alzheimer’s disease and other dementing disorders: A door-to-door survey in Appignano, Macerata Province, Italy. Neurology 1990; 40: 626-63 I. Cornoni-Huntley .I, Foley DJ, White LR, Suzman R, Berkman LF, Evans DA, Wallace RB. Epidemiology of disabilty in the oldest old: Methodologic issues and preliminary findings. Milbank Mem Fund Q 1985; 63: 350-375. White LR, Kohout F, Evans DA, Cornoni-Huntley J, Ostfeld AM. Related Health Problems. In: Coroni- Huntley J, Brock DB, Ostfeld AM, Taylor JO, Wallace RB, Eds. Established Populations for Epidemiologic Studies of the Elderly, Resource Data Rook. Washing- ton, DC: U.S. Government Printing Office, 1986: 129-165. Evans DA, Funkenstein H, Albert MS, Scherr PA, Cook NR, Chown MJ, Hebert LE. Hennekens CH, Taylor JO. Prevalence of Alzheimer’s disease in a community population of older person. JAMA 1989; 262: 2551-2556. Evans DA, Smith LA, Albert MS. Hebert LE, Scherr PA, Funkenstein HH, Taylor JO. Level of education and change in cognitive function in a community population of older persons. Ann Epidemiol 1993; 3: 71-17. Albert M, Smith LA, Scherr PA, Taylor JO, Evans DA, Funkenstein HH. Use of brief cognitive tests to identify individuals in the community with clinically
374 L0N WHITE et ai.
9.
10.
II.
12.
13.
14.
15.
16.
17.
18.
19.
20.
21.
22.
23.
24.
25.
26.
diagnosed Alzheimer’s disease. Intern J Neurosci 1991; 5: 167-178. Hebert LE, Scherr PA, Beckett LA, Funkenstein HH, Albert MS, Chown MJ, Evans DA. Relation of smok- ing and alcohol consumption to incident Alzheimer’s disease. Am J Epidemiol 1992; 135: 347-355. Colsher PL, Wallace RB. Longitudinal application of cognitive function measures in a defined population of community-dwelling elders. Ann Epidemiol 1991; 1: 215-230. Hauser RM, Featherman DL. The measurement of Occupation in Social Surveys. In: Winsborough HH, Ed. The Process of Stratification, Trends and Analyses. New York: Academic Press; 1977: 51-80. Pfeiffer E. A short portable mental status question- naire for the assessment of organic brain deficit in elderly patients. J Am Geriatr Sot 1975; 23: 433-441. Kahn RL, Goldfarb AI, Pollack M, Peck A. Brief objective measures for the determination of mental status in the aged. Am J Psychiatry 1960; 117: 326-328. Folstein MF, Anthony JC, Parhat I, Duffy B, Gruen- berg E. The meaning of cognitive impairment in the elderly. J Am Ceriatr Sot 1985; 33: 228-235. Fillenbaum GG, Hughes DC, Heyman A, George LK, Blazer DG. Relationship of health and demographic characteristics to Mini-Mental State Examination score among community residents. Psycho1 Med 1988; 18: 719-726. Weissman MM, Myers JK, Tischler GL, Holzer CE, Leaf PJ, Orvaschel H, Brody JA. Psychiatric disorders (DSMIII) and cognitive impairment among the elderly in a US urban community. Acta Psychiatr Stand 1985; 71: 366-374. Kramer M, German PS, Anthony JC, Von Korff M, Skinner EA. Patterns of mental disorders among the elderly residents of Eastern Baltimore. J Am Geriatr Sot 1985; 33: 236-245. Holzer CE, Tischler GL, Leaf PJ, Myers JK. An epidemiologic assessment of cognitive impairment in a community. Pop Res Community Mental Health 1984; 4: 3-32. O’Connor DW, Pollitt PA, Treasure FP. The influence of education and social class on the diagnosis of dementia in a community population. Psycho1 Mad 1991; 21: 219-224. Kittagawa EM, Hauser PM. Differential Mortality in the United States. Cambridge: Harvard University Press; 1973. Marmot MG, Kogevinas M, Elston MA. So- cial/economic status and disease. Ann Rev Public HeaIth 1987; 8: 111-135. Ruberman W, Weinblatt E, Goldberg JD, Chaudhary BS. Psychosocial influences on mortality after myocar- dial infarction. N Engl J Med 1984; 311: 552-559. Pincus T, Callahan LF, Burkhauser RV. Most chronic diseases are reported more frequently by individuals with fewer than 12 years of formal education in the age 18-64 United States population. J Chron Dis 1987: 40: 865-874. Stewart RB, Moore MT, Mat FE, Marks RG, Hale WE. Correlates of cognitive dysfunction in an ambu- latory elderly population. Gerontology 1991; 37: 272-280. Farmer ME, White LR, Abbott RD, Kittner SJ, Kaplan E, Wolz MM, Brody JA, Wolf PA. Blood pressure and cognitive performance. The Framingham Study. Am J Epidemiol 1987; 126: 1103-I 114. Elias MF, Robbins M, Schultz NR Jr, Pierce TW. Is blood pressure an important variable in research on aging and neuropsychological test performance? J Cerontol: Psycho1 Sci Special Issue 1990; 45: 128-135.
27.
28.
29.
30.
31.
32.
33.
34.
35.
36.
37.
38.
39.
40.
41.
42.
43.
44.
Tun PA, Nathan DM, Perlmuter LC. Cognitive and affective disorders in elderly diabetics. Clin Geriatr Med 1990; 6: 731-145. Perlmuter L. Choice enhances performance in non-in- sulin dependent diabetics and controls. J Gerontol 1991; 46: 218-223. Gurland BJ. The borderlands of dementia; the influ- ence of sociocultural characteristics on rates of demen- tia occurring in the senium. In: Miller NE, Cohen GD, Eds. Clinical Aspects of AIzheimer’s Disease and Senile Dementia (Aging, Vol. 15). New York: Raven Press; 1991: 61-84. Kittner SJ, White LR, Farmer ME, Wolz M, KaDIan E. Moes E. Brodv JA. Feinleib M. Methodo- Iogi’cal isshes in scieening for’dementia: the problem of education adjustment. J Chronic Dis 1985; 39: 163-170. Katzman R, Zhang M, Qu W-Y, Wang Z, Liu WT, Yu E, Wong S-C, Salmon D, Grant I. A Chinese version of the mini-mental state examination: Impact of illiter- acy in a Shanghai dementia survey. J CIin Epidemiol 1988; 41: 971-978. Berkman LF. The association between educational attainment and mental status examinations: Of etio- logic significance for senile dementias or not? J Chronic Dis 1986; 39(3): 171-174. Yu ES, Liu WT, Levy PS et al. Cognitive impairment among the elderly in Shanghai, China. J Gerontol Sot Sci 1989; 44: S97-S106. Bonaiuto S, Rocca WA, Lippi A, Luciani P, Turtu F, Cavarzeran F, Amaducci L. Impact of education and occupation on the prevalence of Alzheimer’s disease (AD) and multi-infarct dementia (MID) in Appig- nano, Macerata Province, Italy. Neurology 1990; 40 (Suppl. I): 346. Sulkava R, Wikstrom J, Aroma A et al. Prevalence of severe dementia in Finland. Neurology 1985; 35: -_ 1025-1029. Knoefel JE, Wolf PA, Linn RT, Bachman DL, Cobb J, Belanger A, D’Agostino R. Education has no effect on incidence of dementia and Alzheimer’s disease in the Framingham study. Neurology 1991; 41 (Suppl.): 322. Snowdon DA, Ostwald SK, Kane RL. Education, survival and independence in elderly Catholic Sis- ters, 1936-1988. Am J Epidemiol 1989; 130: 999-1012. Dartiques FF, Gagnon M, Barberger-Gateau P, Mazaux JM, Commenges D, Letenneur L, Orgogozo JM. Occupation during life and memory performance in the elderly: Results of the Paquid program. Neurol- ogy 1991; 41 (Suppl. 1): 322. Farmer ME, White LR, Kittner SJ, Kaplan E e/ al. Neuropsychological test performance in Framingham: a descriptive study. Psycho1 Reports 1987; 60: 1023-1040. Hamos JE, DeGennaro LJ, Drachman DA. Synaptic loss in Alzheimer’s disease and other dementias. Neu- rology 1989; 39: 355-361. DeKosky ST, Scheff SW. Synapse loss in frontal cortex biopsies in Alzheimer’s disease: correlation with cogni- tive severity. Ann Neurol 1990; 27: 457-464. Masliah E, Terry RD. DeTeresa R, Hansen LA. Immunohistochemical quantification of the synapse related protein synaptophysin in Alzheimer disease. Neurosci L&t 1989; 103: 234-238. Terry RD. Masliah E, Salmon DP et al. Physical basis of cognitive alterations in Alzheimer disease: synapse loss is the major correlate of cognitive impairment. Ann Neural 1991; 30: 572-580. Khachaturian ZS. Diagnosis of Alzheimer’s disease. Arch Neural 1985; 42: 1097-I 105.