Learning and novelty of innovation in established manufacturing SMEs

New treatments compared to established treatments in
randomized trials (Review)
Djulbegovic B, Kumar A, Glasziou PP, Perera R, Reljic T, Dent L, Raftery J, Johansen M, Di
Tanna GL, Miladinovic B, Soares HP, Vist GE, Chalmers I
This is a reprint of a Cochrane review, prepared and maintained by The Cochrane Collaboration and published in The Cochrane Library2012, Issue 10
http://www.thecochranelibrary.com
New treatments compared to established treatments in randomized trials (Review)
Copyright © 2012 The Cochrane Collaboration. Published by John Wiley & Sons, Ltd.

T A B L E O F C O N T E N T S
1HEADER . . . . . . . . . . . . . . . . . . . . . . . . . . . . . . . . . . . . . . .
1ABSTRACT . . . . . . . . . . . . . . . . . . . . . . . . . . . . . . . . . . . . . .
2PLAIN LANGUAGE SUMMARY . . . . . . . . . . . . . . . . . . . . . . . . . . . . . .
3BACKGROUND . . . . . . . . . . . . . . . . . . . . . . . . . . . . . . . . . . . .
3OBJECTIVES . . . . . . . . . . . . . . . . . . . . . . . . . . . . . . . . . . . . .
4METHODS . . . . . . . . . . . . . . . . . . . . . . . . . . . . . . . . . . . . . .
7RESULTS . . . . . . . . . . . . . . . . . . . . . . . . . . . . . . . . . . . . . . .
Figure 1. . . . . . . . . . . . . . . . . . . . . . . . . . . . . . . . . . . . . . 8
Figure 2. . . . . . . . . . . . . . . . . . . . . . . . . . . . . . . . . . . . . . 10
Figure 3. . . . . . . . . . . . . . . . . . . . . . . . . . . . . . . . . . . . . . 11
Figure 4. . . . . . . . . . . . . . . . . . . . . . . . . . . . . . . . . . . . . . 12
Figure 5. . . . . . . . . . . . . . . . . . . . . . . . . . . . . . . . . . . . . . 12
Figure 6. . . . . . . . . . . . . . . . . . . . . . . . . . . . . . . . . . . . . . 14
Figure 7. . . . . . . . . . . . . . . . . . . . . . . . . . . . . . . . . . . . . . 15
Figure 8. . . . . . . . . . . . . . . . . . . . . . . . . . . . . . . . . . . . . . 16
17DISCUSSION . . . . . . . . . . . . . . . . . . . . . . . . . . . . . . . . . . . . .
18AUTHORS’ CONCLUSIONS . . . . . . . . . . . . . . . . . . . . . . . . . . . . . . .
18ACKNOWLEDGEMENTS . . . . . . . . . . . . . . . . . . . . . . . . . . . . . . . .
18REFERENCES . . . . . . . . . . . . . . . . . . . . . . . . . . . . . . . . . . . . .
21CHARACTERISTICS OF STUDIES . . . . . . . . . . . . . . . . . . . . . . . . . . . . .
26DATA AND ANALYSES . . . . . . . . . . . . . . . . . . . . . . . . . . . . . . . . . .
Analysis 1.1. Comparison 1 New versus established treatment: main analysis including one comparison, Outcome 1
Primary outcome. . . . . . . . . . . . . . . . . . . . . . . . . . . . . . . . . 27
Analysis 1.2. Comparison 1 New versus established treatment: main analysis including one comparison, Outcome 2 Overall
survival. . . . . . . . . . . . . . . . . . . . . . . . . . . . . . . . . . . . . 28
Analysis 1.3. Comparison 1 New versus established treatment: main analysis including one comparison, Outcome 3
Primary outcome. . . . . . . . . . . . . . . . . . . . . . . . . . . . . . . . . 29
Analysis 2.1. Comparison 2 New versus established treatment: sensitivity analysis including all comparisons, Outcome 1
Primary outcome. . . . . . . . . . . . . . . . . . . . . . . . . . . . . . . . . 30
Analysis 2.2. Comparison 2 New versus established treatment: sensitivity analysis including all comparisons, Outcome 2
Overall survival. . . . . . . . . . . . . . . . . . . . . . . . . . . . . . . . . . 31
Analysis 2.3. Comparison 2 New versus established treatment: sensitivity analysis including all comparisons, Outcome 3
Primary outcome. . . . . . . . . . . . . . . . . . . . . . . . . . . . . . . . . 32
32ADDITIONAL TABLES . . . . . . . . . . . . . . . . . . . . . . . . . . . . . . . . . .
39APPENDICES . . . . . . . . . . . . . . . . . . . . . . . . . . . . . . . . . . . . .
Figure 9. . . . . . . . . . . . . . . . . . . . . . . . . . . . . . . . . . . . . . 42
Figure 10. . . . . . . . . . . . . . . . . . . . . . . . . . . . . . . . . . . . . . 44
Figure 11. . . . . . . . . . . . . . . . . . . . . . . . . . . . . . . . . . . . . . 45
Figure 12. . . . . . . . . . . . . . . . . . . . . . . . . . . . . . . . . . . . . . 45
Figure 13. . . . . . . . . . . . . . . . . . . . . . . . . . . . . . . . . . . . . . 46
Figure 14. . . . . . . . . . . . . . . . . . . . . . . . . . . . . . . . . . . . . . 47
Figure 15. . . . . . . . . . . . . . . . . . . . . . . . . . . . . . . . . . . . . . 48
48WHAT’S NEW . . . . . . . . . . . . . . . . . . . . . . . . . . . . . . . . . . . . .
49HISTORY . . . . . . . . . . . . . . . . . . . . . . . . . . . . . . . . . . . . . . .
49CONTRIBUTIONS OF AUTHORS . . . . . . . . . . . . . . . . . . . . . . . . . . . . .
49DECLARATIONS OF INTEREST . . . . . . . . . . . . . . . . . . . . . . . . . . . . . .
49SOURCES OF SUPPORT . . . . . . . . . . . . . . . . . . . . . . . . . . . . . . . . .
50DIFFERENCES BETWEEN PROTOCOL AND REVIEW . . . . . . . . . . . . . . . . . . . . .
iNew treatments compared to established treatments in randomized trials (Review)
Copyright © 2012 The Cochrane Collaboration. Published by John Wiley & Sons, Ltd.
[Methodology Review]
New treatments compared to established treatments inrandomized trials
Benjamin Djulbegovic1 , Ambuj Kumar2, Paul P Glasziou3 , Rafael Perera4, Tea Reljic5, Louise Dent6, James Raftery7, Marit Johansen8, Gian Luca Di Tanna9, Branko Miladinovic2 , Heloisa P Soares10, Gunn E Vist11, Iain Chalmers12
1USF Clinical Translational Science Institute, Dpts of Medicine, Hematology and Health Outcome Research, USF and H. Lee
Moffitt Cancer Center, USF Health Clinical Research, University of South Florida, Tampa, Florida, USA. 2Center for Evidence Based
Medicine and Health Outcomes Research, University of South Florida, Tampa, Florida, USA. 3Centre for Research in Evidence Based
Practice, Bond University, Gold Coast, Australia. 4Department of Primary Care Health Sciences, University of Oxford, Oxford, UK.5Department of Internal Medicine, Center for Evidence Based Medicine and Health Outcomes Research, University of South Florida,
Tampa, Florida, USA. 6University of Southampton Clinical Trials Unit, Southampton General Hospital, Southampton, UK. 7NIHR
Evaluation, Trials and Studies Coordinating Centre, University of Southampton, Southampton, UK. 8Global Health Unit, Norwegian
Knowledge Centre for the Health Services, Oslo, Norway. 9Public Health and Infectous Diseases, Sapienza University of Rome, Rome,
Italy. 10Mount Sinai Medical Center, Miami Beach, Florida, USA. 11Prevention, Health Promotion and Organisation Unit, Norwegian
Knowledge Centre for the Health Services, Oslo, Norway. 12James Lind Initiative, Oxford, UK
Contact address: Benjamin Djulbegovic, USF Clinical Translational Science Institute, Dpts of Medicine, Hematology and Health
Outcome Research, USF and H. Lee Moffitt Cancer Center, USF Health Clinical Research, University of South Florida, 12901 Bruce
B. Downs Boulevard, CMS 3057, Tampa, Florida, 33612, USA. [email protected]. [email protected].
Editorial group: Cochrane Methodology Review Group.
Publication status and date: New, published in Issue 10, 2012.
Review content assessed as up-to-date: 24 March 2010.
Citation: Djulbegovic B, Kumar A, Glasziou PP, Perera R, Reljic T, Dent L, Raftery J, Johansen M, Di Tanna GL, Miladinovic
B, Soares HP, Vist GE, Chalmers I. New treatments compared to established treatments in randomized trials. Cochrane Database ofSystematic Reviews 2012, Issue 10. Art. No.: MR000024. DOI: 10.1002/14651858.MR000024.pub3.
Copyright © 2012 The Cochrane Collaboration. Published by John Wiley & Sons, Ltd.
A B S T R A C T
Background
The proportion of proposed new treatments that are ’successful’ is of ethical, scientific, and public importance. We investigated how
often new, experimental treatments evaluated in randomized controlled trials (RCTs) are superior to established treatments.
Objectives
Our main question was: “On average how often are new treatments more effective, equally effective or less effective than established
treatments?” Additionally, we wanted to explain the observed results, i.e. whether the observed distribution of outcomes is consistent
with the ’uncertainty requirement’ for enrollment in RCTs. We also investigated the effect of choice of comparator (active versus no
treatment/placebo) on the observed results.
Search methods
We searched the Cochrane Methodology Register (CMR) 2010, Issue 1 in The Cochrane Library (searched 31 March 2010); MEDLINE
Ovid 1950 to March Week 2 2010 (searched 24 March 2010); and EMBASE Ovid 1980 to 2010 Week 11 (searched 24 March 2010).
Selection criteria
Cohorts of studies were eligible for the analysis if they met all of the following criteria: (i) consecutive series of RCTs, (ii) registered at
or before study onset, and (iii) compared new against established treatments in humans.
1New treatments compared to established treatments in randomized trials (Review)
Copyright © 2012 The Cochrane Collaboration. Published by John Wiley & Sons, Ltd.

Data collection and analysis
RCTs from four cohorts of RCTs met all inclusion criteria and provided data from 743 RCTs involving 297,744 patients. All four
cohorts consisted of publicly funded trials. Two cohorts involved evaluations of new treatments in cancer, one in neurological disorders,
and one for mixed types of diseases. We employed kernel density estimation, meta-analysis and meta-regression to assess the probability
of new treatments being superior to established treatments in their effect on primary outcomes and overall survival.
Main results
The distribution of effects seen was generally symmetrical in the size of difference between new versus established treatments. Meta-
analytic pooling indicated that, on average, new treatments were slightly more favorable both in terms of their effect on reducing the
primary outcomes (hazard ratio (HR)/odds ratio (OR) 0.91, 99% confidence interval (CI) 0.88 to 0.95) and improving overall survival
(HR 0.95, 99% CI 0.92 to 0.98). No heterogeneity was observed in the analysis based on primary outcomes or overall survival (I2 = 0%). Kernel density analysis was consistent with the meta-analysis, but showed a fairly symmetrical distribution of new versus
established treatments indicating unpredictability in the results. This was consistent with the interpretation that new treatments are
only slightly superior to established treatments when tested in RCTs. Additionally, meta-regression demonstrated that results have
remained stable over time and that the success rate of new treatments has not changed over the last half century of clinical trials. The
results were not significantly affected by the choice of comparator (active versus placebo/no therapy).
Authors’ conclusions
Society can expect that slightly more than half of new experimental treatments will prove to be better than established treatments
when tested in RCTs, but few will be substantially better. This is an important finding for patients (as they contemplate participation
in RCTs), researchers (as they plan design of the new trials), and funders (as they assess the ’return on investment’). Although we
provide the current best evidence on the question of expected ’success rate’ of new versus established treatments consistent with a priori
theoretical predictions reflective of ’uncertainty or equipoise hypothesis’, it should be noted that our sample represents less than 1% of
all available randomized trials; therefore, one should exercise the appropriate caution in interpretation of our findings. In addition, our
conclusion applies to publicly funded trials only, as we did not include studies funded by commercial sponsors in our analysis.
P L A I N L A N G U A G E S U M M A R Y
New treatments versus established treatments in randomized trials
Random allocation to different groups to compare the effects of treatments is used in fair tests to find out which among the treatment
options is preferable. Random allocation is only ethical, however, if there is genuine uncertainty about which of the treatment options
is preferable. If a patient or their healthcare provider is certain which of the treatments being compared is preferable they should not
agree to random allocation, because this would involve the risk that they would be assigned to a treatment they believed to be inferior.
Decisions about whether to participate in randomized trials are made more difficult because of the widespread belief that new treatments
must inevitably be superior to existing (standard) treatments. Indeed, it is understandable that people hope that this will be the case.
If this was actually so, however, the ethical precondition of uncertainty would often not apply. This Cochrane methodology review
addresses this important question: “What is the likelihood that new treatments being compared to established treatments in randomized
trials will be shown to be superior?” Four cohorts of consecutive, publicly funded, randomized trials, which altogether included 743
trials that enrolled 297,744 patients, met our inclusion criteria for this review. We found that, on average, new treatments were very
slightly more likely to have favorable results than established treatments, both in terms of the primary outcomes targeted and overall
survival. In other words, when new treatments are compared with established treatments in randomized trials we can expect slightly
more than half will prove to be better, and slightly less than half will prove to be worse than established treatments. This conclusion
applies to publicly funded trials as we did not include studies funded by commercial sponsors in our analysis.The results are consistent
with the ethical preconditions for random allocation - when people are enrolled in randomized trials, the results cannot be predicted in
advance as there is genuine uncertainty about which of the treatments being compared in randomized trials will prove to be superior.
2New treatments compared to established treatments in randomized trials (Review)
Copyright © 2012 The Cochrane Collaboration. Published by John Wiley & Sons, Ltd.

B A C K G R O U N D
When uncertainty exists about which among alternative treat-
ments is preferable for a given health problem, a randomized con-
trolled trial (RCT) is often proposed to resolve this dilemma. In-
deed, Sir Austin Bradford Hill, one of the fathers of modern clini-
cal trials methodology, suggested that when we are uncertain about
the relative value of one treatment over another, it is time for a
trial (Bradford Hill 1963).
Recognition of the importance of uncertainty in the design of
RCTs has reached the status of a principle. This ’uncertainty prin-
ciple’ states that patients should be enrolled in such trials only
if there is substantial uncertainty (Atkins 1966; Bradford Hill
1963; Bradford Hill 1987; Edwards 1998; Freedman 1987; Peto
1998; Weijer 2000) about which of the trial treatments would be
preferable. Some authors prefer the term equipoise to refer to the
required uncertainty before the trial is conducted (Djulbegovic
2001; Weijer 2000). Although not identical, these concepts are
similar (Lilford 2001); the main distinction relates to the locus of
uncertainty, i.e. ’whose uncertainty is morally relevant’: researchers
(clinical equipoise), community (community equipoise), patients
(’indifference principle’), or patients and researchers (’uncertainty
principle’) (Djulbegovic 2007; Djulbegovic 2011). In this review
we will use the term ’uncertainty’ to refer to this fundamental sci-
entific and ethical requirement for conducting randomized trials.
This principle is important for this review, because we have previ-
ously hypothesized that there is a predictable relationship between
the uncertainty, that is, the moral principle, upon which random-
ized trials are based, and the ultimate outcomes of randomized
trials (Djulbegovic 2007; Djulbegovic 2009). That is, if the uncer-
tainty requirement is observed, we would expect, over time, to find
no significant difference between the proportion of randomized
trials that favor new treatments and those that favor established
treatments (Djulbegovic 2001; Djulbegovic 2008; Kumar 2005a;
Soares 2005).
In 1997, one of the authors of this review, Chalmers asked “What
is the prior probability of a proposed new treatment being supe-
rior to established treatments?” (Chalmers 1997). He referred to
a small number of reports suggesting that new treatments assessed
in randomized trials were just as likely to be inferior as they were to
be superior to the established treatments. Since then, several addi-
tional studies have been reported which are relevant to this ques-
tion (Colditz 1989; Djulbegovic 2000a; Djulbegovic 2008; Joffe
2004; Kumar 2005a; Machin 1997; Soares 2005). In an analysis of
published reports of trials, Djulbegovic et al (Djulbegovic 2000a)
found that, within research sponsored by government and not-
for-profit organizations, the results showed a fairly even split: 44%
of randomized trials favored established treatments while 56% of
the trials favored new treatments. However, when research was
sponsored by for-profit organizations, new treatments were signif-
icantly favored over established treatments (74% versus 26%; P =
0.004). The source of sponsorship appears to be associated with
estimates of treatment effects (Lexchin 2003). Other research has
indicated that methodological quality can also affect estimates of
treatment effects (Gluud 2006).
In assessing whether new or established treatments are favored on
average, an important potential bias that needs to be heeded re-
lates to the fact that investigators frequently fail to publish their
research findings (Dickersin 1997; Hopewell 2009; Krzyzanowska
2003). This, in itself, may not create a problem if research is
randomly unpublished. In that case, there would simply be less
information available, but that information would be unbiased
(Dickersin 1997). However, failure to publish is not a random
event; rather publication is dramatically influenced by the direc-
tion and strength of research findings (Dickersin 1997; Hopewell
2009). If one were to examine a distribution of outcomes from the
cohorts of all trials from inception regardless of publication status,
this would constitute an unbiased assessment of the effects of new
versus established treatments. That is, the unbiased assessment of
comparison of new versus established treatment (’treatment suc-
cess’) can only be done if one has accurate data on both the nu-
merator (estimates of treatment effect comparing new versus es-
tablished treatment) and denominator (list of trials/comparisons)
that were performed (Djulbegovic 2002).
Indeed, research over the past decade has identified several fac-
tors that may affect a trial’s results and their availability - pub-
lication rate (Dickersin 1992; Dickersin 1997; Hopewell 2007;
Hopewell 2009), methodological quality (Altman 1994; Altman
1995; Higgins 2011; Schulz 1995; Wood 2008), and the choice
of control interventions (Djulbegovic 2000c; Djulbegovic 2001;
Djulbegovic 2003; Mann 2012). To address the question posed by
Chalmers (Chalmers 1997), therefore, we need to try to account
for all these factors.
We should note here that in this review we are not focused on
the related but distinct question: “How often are new treatments,
assessed in systematic reviews, better than established treatments”
(Djulbegovic 2000b). Rather, we undertook a systematic review
to identify studies that had assembled a set of consecutively con-
ducted randomized trials (’cohort’) - by funder or trial registry or
other mechanism that would avoid publication bias - and analyzed
all trials irrespective of publication status. We will refer to the trials
within these cohorts as the ’component trials’.
O B J E C T I V E S
• To summarize the evidence from cohorts of randomized
trials that were established before or soon after the start of each
trial, to describe the distribution of estimates of treatment effect
in relation to direction (in favor of the new or of established
treatments), magnitude (size of the effect), and statistical
significance (or confidence interval).
3New treatments compared to established treatments in randomized trials (Review)
Copyright © 2012 The Cochrane Collaboration. Published by John Wiley & Sons, Ltd.
• To answer the question, “What is the probability of new
treatments being more effective, equally effective or less effective
than established treatments?”
• To explore the extent to which methodological and other
factors, including sponsorship of the research, might explain
differences in the proportion of randomized trials with results
that favor new treatments.
• To test the hypothesis if the observed distribution of
outcomes is consistent with the ’uncertainty requirement/
hypothesis’.
M E T H O D S
Criteria for considering studies for this review
Types of studies
Cohort analyses of consecutive series of randomized trials, regis-
tered at onset, which compared new versus established treatments
in humans were eligible for analysis. We deemed all other types
of studies not eligible for this review. Originally, we planned to
include cohort analyses which included non-randomized compo-
nent studies or component studies comparing two or more new
treatments, but it soon became apparent that it was not possi-
ble to analyze randomized components of new with established
treatments separately from non-randomized comparisons; there-
fore, these studies were not considered in our analysis. Likewise,
all other studies, in which the impact of publication bias could
not be excluded, were deemed ineligible for this review. Typically,
these were studies that relied only on published studies (Lathyris
2010; Yanada 2007) and hence there was no way to ensure that the
cohorts of studies are not affected by publication bias (unless the
authors clearly took into consideration the results of unpublished
studies in their report, in which case these studies would have been
eligible for our review).
We also excluded the studies which were based on information
from research protocols and other resources (e.g. studies that are
based on trials’ registers) but which did not report outcomes on
superiority of new versus established treatments (Chan 2004). Co-
horts based on equivalence and non-inferiority trials would have
also been ineligible and, in fact, the RCTs in all four cohorts that
were analyzed in this review (see below) were all superiority trials.
Types of data
We analyzed data on primary outcome and overall survival from
randomized trials of any type of disease/intervention. Data on pri-
mary outcomes were chosen according to the authors’ definitions
in published articles. Because we did not have the protocols avail-
able for three out of four cohorts, we did not attempt to verify if
the definitions of primary outcomes changed between the studies
original design and their final reports (Dwan 2011)
Types of methods
We originally planned to assess the impact of the methodological
quality on all results. However, we could extract data for one cohort
only (Djulbegovic 2008), which detected no effect of methodolog-
ical quality on the results. The study by Dent and Raftery (Dent
2011) also detected no impact of the quality on the results but
these data were not available for pooling in this analysis. Given that
all cohorts included in our review came from large public funders,
in which trial protocol development passes several rigorous reviews
(Soares 2004), we assumed the impact of methodological quality
in other cohorts was also negligible and therefore did not formally
include it in this review. However, we did evaluate the effect of
comparator (active versus no therapy/placebo) on the distribution
of the results.
Types of outcome measures
Types of outcome measures included the direction, size and statis-
tical significance of the results for the primary outcome and most
important outcomes (i.e. survival) that are reported in the cohort
analyses (excluding surrogate outcomes). An outcome was consid-
ered to be a primary outcome if it met the following criteria in
hierarchical order: (i) it was explicitly defined as a primary or main
outcome by the trialists, (ii) it was the outcome used for power
and sample size calculation, or (iii) it is listed as the main outcome
in the trials’ objectives.
Search methods for identification of studies
Electronic searches
We searched the following databases without time or language
limits to identify relevant published cohort analyses of RCTs:
Cochrane Methodology Register (CMR) 2010, Issue 1, part of TheCochrane Library (searched 31 March 2010); MEDLINE Ovid
1950 to March Week 2 2010 (searched 24 March 2010), and EM-
BASE Ovid 1980 to 2010 Week 11 (searched 24 March 2010).
See Appendix 1 for the search strategies.
4New treatments compared to established treatments in randomized trials (Review)
Copyright © 2012 The Cochrane Collaboration. Published by John Wiley & Sons, Ltd.

Searching other resources
We also checked the reference lists to all included studies in this
review, checked a Cochrane Review on publication bias (Hopewell
2009) for references that may have provided the appropriate com-
parison of new versus established treatments, and contacted peo-
ple we deemed knowledgeable about our review question to try to
obtain additional studies.
Data collection and analysis
Selection of studies
Given the large number of hits produced by the literature search,
we divided the list of retrieved studies into manageable parts
among several authors (BD, AK, PG, RP, HS, GV) who screened
the titles and abstracts of all retrieved records to identify reports
that should definitely be excluded. Every record that was not re-
jected was assessed by at least two of the authors independently
to see if it was likely to meet the inclusion criteria. We finally had
a conference call to review the list of all eligible studies. The final
list of included studies was created through the discussion on the
conference call held on 20 July 2011.
Data extraction and management
Our final data set consisted of four cohorts (see Results below).
Data from two cohorts were already extracted for separate publi-
cations (Dent 2011; Djulbegovic 2008). Two authors (AK, TR)
independently extracted data for the remaining cohorts (Johnston
2006; Machin 1997). Global checking of data extraction was per-
formed by the first author (BD) and a statistician (RP) before data
were ready for the final analysis.
Assessment of risk of bias in included studies
We used the following criteria to assess the methodological quality
of included studies:
A) Cohorts
1. Was the cohort of studies properly described and identified
(i.e. the quality of search strategies described in the study was
appropriate)?
• Yes
• No
• Unclear
2. Were inclusion criteria of each study in the relevant cohort of
studies adequately described?
• Yes
• No
• Unclear
3. Did two or more investigators screen the records retrieved by
the searches to identify relevant studies?
• Yes
• No
• Unclear
See Table 1 for a summary of the study characteristics.
B) Component trials included in the cohort analyses
For each component study, we extracted the following data (see
Table 1):
• design (e.g. parallel, cross-over, factorial), sponsorship
(public (not-for-profit) versus for profit), method of allocation
concealment (if applicable) (centralized versus local), inclusion
and exclusion criteria of cohort of trials, interventions and
recorded outcomes for each study;
• descriptive data about each component study (study
population and design, intervention, comparators (placebo
versus active treatments; outcomes, etc.)).
Originally, we planned to perform an assessment of methodologi-
cal quality of individual studies for those domains that are known
to affect results due to a variety of possible biases and random
errors listed below, with a plan to assess the following domains to
determine risk of bias:
1. generation of allocation sequence;
2. measures taken for allocation concealment;
3. measures taken to preserve blinding;
4. extent of attrition;
5. selective reporting (our original plan was to perform
comparison of selective outcomes reporting between
unpublished and published data if the information is available);
6. other topic-specific issues (e.g. difference in interventions,
diseases, etc.).
We planned to use the following domains to address the issue of
random error:
1. effect size (i.e. postulated estimate in differences in the
effects between tested interventions);
2. sample size and a power analysis.
The same methodological approach has been used previously (
Djulbegovic 2008; Soares 2004), paying particular attention to
those factors that are shown to affect the results of randomized
trials: publication bias (Hopewell 2009), methodologic quality
(Higgins 2011; Juni 1999), and the choice of control intervention
(Djulbegovic 2000c; Mann 2012).
The quality assessment from the appraisal of cohorts and individ-
ual component trials would have been combined in our overall
quality evaluation, in order to provide judgments on the extent
of potential bias that may have affected the results. As there is no
agreed upon method for doing this, we hoped to approach this in
two ways:
a) Categorize quality using the authors’ assessment of the reports
eligible for inclusion in our review.
5New treatments compared to established treatments in randomized trials (Review)
Copyright © 2012 The Cochrane Collaboration. Published by John Wiley & Sons, Ltd.

b) Because the authors of papers eligible for our study may not
have uniformly assessed the quality of component trials using con-
temporary criteria listed above, we planned to perform the ’com-
ponent-oriented’ approach to quality assessment (Gluud 2006;
Higgins 2011; Juni 1999; Wood 2008) in which the results would
have been evaluated according to each of the quality dimensions
listed above. We planned to categorize the quality categories em-
ployed by the original authors as ’high’ (low risk for bias), ’moder-
ate’ (moderate risk for bias) and ’low’ (high risk for bias) (Higgins
2011) and employ these categorizations in the sensitivity/subgroup
analysis (see below).
Unfortunately, as explained above, we could extract data for one
cohort only (Djulbegovic 2008), in which no effect of method-
ological quality on the results was detected. Dent and Raftery
(Dent 2011) also reported no impact of the methodological qual-
ity on their results, but these data were not available for the anal-
ysis performed herein.
Analysis and reporting
Originally, we planned to report the success rate in the following
ways:
• according to the investigators’ judgment (how many of the
component trials in each of the cohort analyses we included were
considered by trialists of those component studies to favor new
or established treatments);
• statistical significance favoring new versus established
treatments;
• quantitative pooling (meta-analysis) of data from the cohort
analyses, if possible and sensible; and
• subgroup/sensitivity analysis according to: 1) the field of
the study (i.e. oncology, cardiology etc.) (we considered this
important because the effects of treatments and a distribution of
outcomes may differ between health areas); 2) sponsorship (for
profit versus not-for-profit); 3) publication status (the results
from the cohorts based on all studies versus published studies
only); 4) methodological quality (the results from the cohorts
with high versus moderate versus low quality as well as according
to each quality domain - see above); 5) comparator intervention
(active versus placebo/no therapy).
Unfortunately, most subgroup analyses were not possible because
of the limited domains and data of the available cohorts. In this
review, we report the quantitative pooling (meta-analysis) of data
according to primary outcomes and overall survival. Arguably, this
is the least biased approach to answer the question of “how often
new treatments are superior to established ones” (Chalmers 1997).
Comparing effects of treatments according to statistical signifi-
cance is based on ’vote counting methods’ in which effect size,
number of patients, and time-to-event data are not taken into ac-
count (Hedges 1985). Assessing treatment success by the attempt
to deduce the original trialists’ views about superiority of new ver-
sus established treatments, while useful, is also possibly fraught by
bias because such assessments cannot exclude the potential con-
flicts of interest of the original investigators (Als-Nielsen 2003).
We used three methods to pool the data from the four cohorts of
studies:
a) Kernel density
Our aim was to obtain a description of the empirical distribution
for the primary outcome of a trial. We therefore estimated this dis-
tribution using Gaussian kernel density methods which are based
on a smoothing histogram given a predefined bandwidth and with
the potential of giving different weights to each trial (similar to
meta-analysis) (Silverman 1986). The choice of bandwidth is a
compromise between obtaining a smooth density while identify-
ing variations in the distribution peaks (e.g. multimodality). We
constructed the probability density function for the odds or hazard
ratios on the log scale using a two-stage adaptive weighted kernel
density estimation (Gisbert 2003). We calculated the weights fol-
lowing the random-effects assumption as the inverse of the sum of
the within-study variance for a trial plus the between-study vari-
ance Tau2 for all trials. We performed the estimation using the
computational software Maple (version 14) (Maple 2009).
b) Meta-analysis
We used hazard or odds ratios (HR/ORs) to summarize the overall
studies’ data expressed with 99% confidence intervals (CIs). We
used the more conservative 99% CIs to decrease chance of random
error. We used a random-effects model. The unit of analysis was
comparison within each trial. In the case of studies with continu-
ous outcome data, we converted the results into dichotomous data
using standard methods (Higgins 2011). For trials/reports that in-
cluded more than one new treatment group, we used the following
approach: to avoid issues with correlations and double counting,
we first excluded multi-arm comparisons from the main analysis.
We selected only one comparison which was associated with the
largest effect size favoring experimental treatments. This way we
purposefully provide the best-case scenario in terms of treatment
success favoring new treatments. In sensitivity analysis we, how-
ever, included all comparisons (see Effects of methods). As it can
be seen, the results between these two analyses only marginally dif-
fer. Note that we could not apply other methods suggested in the
literature to conduct meta-analysis that included multiple com-
parisons such as splitting a control arm to match corresponding
experimental arms (Higgins 2011) because we did not have data
on the number of patients and events in all cohorts.
c) Meta-regression
Using the year of publication as a co-variate, we performed a meta-
regression to assess the change in treatment effect over time.
6New treatments compared to established treatments in randomized trials (Review)
Copyright © 2012 The Cochrane Collaboration. Published by John Wiley & Sons, Ltd.
Sensitivity analysis
Trials which used placebo/no therapy as a comparator (see Table 1
for comparator) were included in the main analysis. The rationale
for this is that placebo does not replace established treatments but,
in fact, always represents an ’add-on’ intervention to the standard
treatments (Senn 2000). As the mechanism for violation of the
’uncertainty principle’ relates to the choice of inferior comparator
(Djulbegovic 2000c; Mann 2012), we also performed a sensitivity
analysis by evaluating the results according to placebo/no therapy
versus active control comparisons.
R E S U L T S
Description of studies
See: Characteristics of included studies; Characteristics of excluded
studies.
Results of the search
A total of 8792 records were retrieved. Figure 1 shows a flow dia-
gram of all included studies. Table 1 shows the characteristics of
the studies. In total, we identified 11 cohorts of RCTs, of which
four were eligible for this review. Three papers reported results
of smaller cohorts (Joffe 2004; Kumar 2005; Soares 2004) which
were all included within a final, large analysis published by Djulbe-
govic and colleagues (Djulbegovic 2008) and hence were included
in this review via this larger cohort. Two other papers were based
on published trials only (Lathyris 2010; Yanada 2007) and there-
fore were excluded from our analysis. Two other cohorts which ex-
plored the effect of funding source on study outcome but only in-
cluded data from published studies were also excluded (Bekelman
2003; Lexchin 2003).
7New treatments compared to established treatments in randomized trials (Review)
Copyright © 2012 The Cochrane Collaboration. Published by John Wiley & Sons, Ltd.
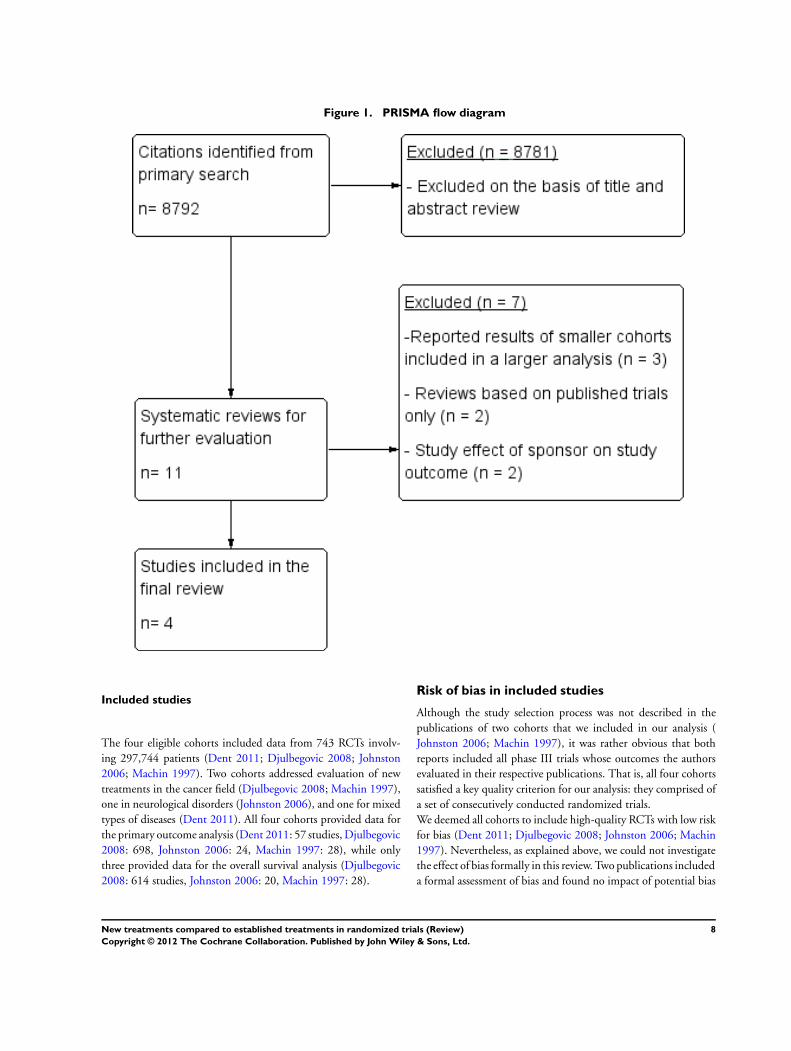
Figure 1. PRISMA flow diagram
Included studies
The four eligible cohorts included data from 743 RCTs involv-
ing 297,744 patients (Dent 2011; Djulbegovic 2008; Johnston
2006; Machin 1997). Two cohorts addressed evaluation of new
treatments in the cancer field (Djulbegovic 2008; Machin 1997),
one in neurological disorders (Johnston 2006), and one for mixed
types of diseases (Dent 2011). All four cohorts provided data for
the primary outcome analysis (Dent 2011: 57 studies, Djulbegovic
2008: 698, Johnston 2006: 24, Machin 1997: 28), while only
three provided data for the overall survival analysis (Djulbegovic
2008: 614 studies, Johnston 2006: 20, Machin 1997: 28).
Risk of bias in included studies
Although the study selection process was not described in the
publications of two cohorts that we included in our analysis (
Johnston 2006; Machin 1997), it was rather obvious that both
reports included all phase III trials whose outcomes the authors
evaluated in their respective publications. That is, all four cohorts
satisfied a key quality criterion for our analysis: they comprised of
a set of consecutively conducted randomized trials.
We deemed all cohorts to include high-quality RCTs with low risk
for bias (Dent 2011; Djulbegovic 2008; Johnston 2006; Machin
1997). Nevertheless, as explained above, we could not investigate
the effect of bias formally in this review. Two publications included
a formal assessment of bias and found no impact of potential bias
8New treatments compared to established treatments in randomized trials (Review)
Copyright © 2012 The Cochrane Collaboration. Published by John Wiley & Sons, Ltd.

on the results (Dent 2011; Djulbegovic 2008). (See ’Sensitivity
analysis’ below regarding the effect of comparator on the results).
Effect of methods
a) Kernel density estimation
Figure 2 and Figure 3 show kernel density estimation of the effects
of new treatments compared to established ones for both primary
outcomes (see Table 1 for the list of primary outcomes used in the
included studies) and overall survival. The analysis according to
primary outcomes is considered important as it reflects the orig-
inal design and the trialists’ ’best bets’ that new treatments may
prove to be superior to established ones (see also Discussion) while
the analysis according to overall survival relates to pooling data on
most important outcomes for patients. As it can be seen, there is
a fairly symmetrical distribution of new versus established treat-
ments centered near ’no effect’ (a log hazard ratio of 0) indicating
that experimental treatments are about equally superior or inferior
to standard treatments although, on average, new treatments are
slightly more superior to old ones.
9New treatments compared to established treatments in randomized trials (Review)
Copyright © 2012 The Cochrane Collaboration. Published by John Wiley & Sons, Ltd.
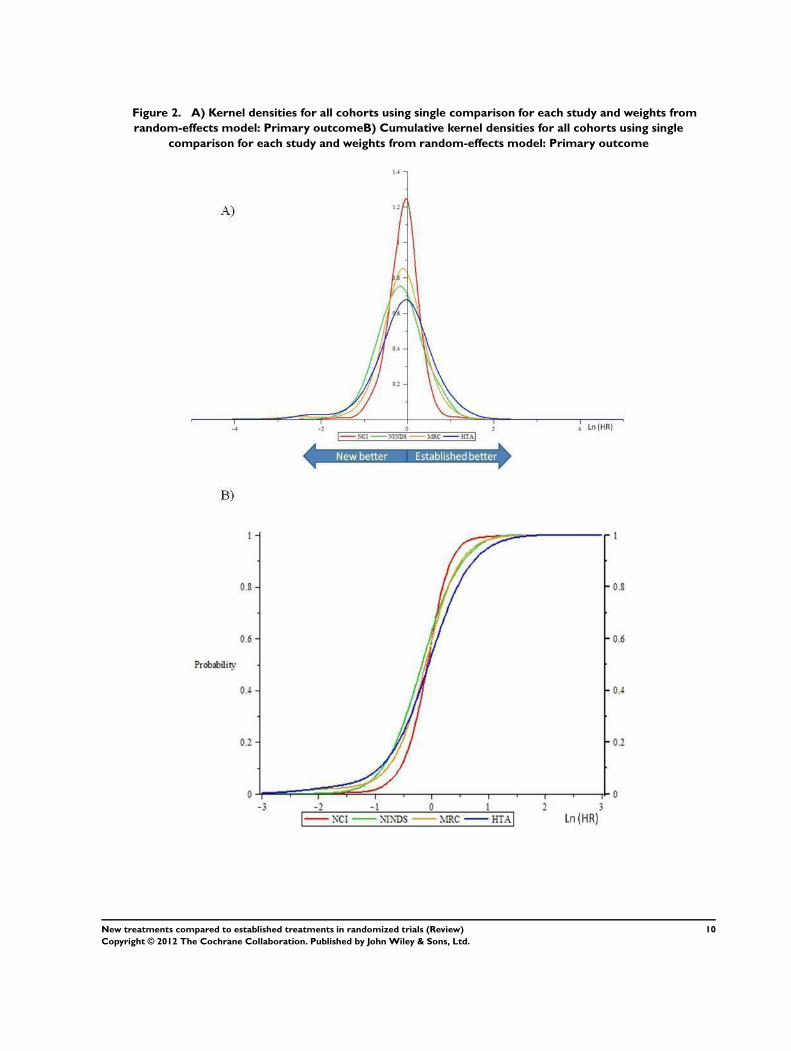
Figure 2. A) Kernel densities for all cohorts using single comparison for each study and weights from
random-effects model: Primary outcomeB) Cumulative kernel densities for all cohorts using single
comparison for each study and weights from random-effects model: Primary outcome
10New treatments compared to established treatments in randomized trials (Review)
Copyright © 2012 The Cochrane Collaboration. Published by John Wiley & Sons, Ltd.
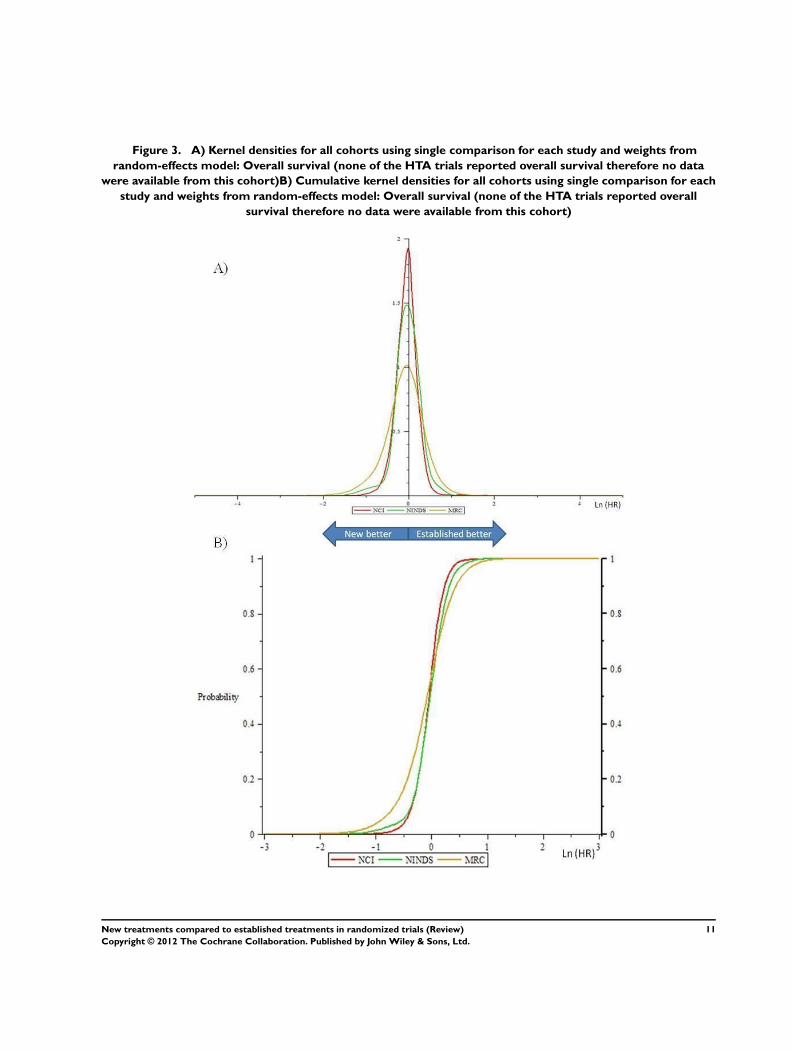
Figure 3. A) Kernel densities for all cohorts using single comparison for each study and weights from
random-effects model: Overall survival (none of the HTA trials reported overall survival therefore no data
were available from this cohort)B) Cumulative kernel densities for all cohorts using single comparison for each
study and weights from random-effects model: Overall survival (none of the HTA trials reported overall
survival therefore no data were available from this cohort)
11New treatments compared to established treatments in randomized trials (Review)
Copyright © 2012 The Cochrane Collaboration. Published by John Wiley & Sons, Ltd.

b) Meta-analysis
Figure 4 and Figure 5 show the forest plots of estimates for primary
outcomes and survival, respectively. New treatments are slightly
more favored both in terms of their effect on primary outcomes
(hazard ratio (HR)/odds ratio (OR) 0.91, 99% confidence interval
(CI) 0.88 to 0.95) and overall survival (HR 0.95, 99% CI 0.92
to 0.98). No heterogeneity in treatment effects was observed in
the analysis based on primary outcomes (I2 = 0%) (Figure 4) or
survival outcomes (I2 = 0%) (Figure 5).
Figure 4. Forest plot of comparison: New versus established treatment, outcome: 1.1 Primary outcome.
Figure 5. Forest plot of comparison: New versus established treatment, outcome: 1.2 Overall survival
(none of the HTA trials reported overall survival therefore no data were available from this cohort)
c) Meta-regression
Table 2 and Table 3 show a meta-regression evaluating the effect
of cohort and the year of publication on the stability of results.
As it can be seen, the results remain stable over time, indicating
that new types of treatment tested in randomized controlled trials
(RCTs) seem to continue to have about the same probability of
being superior to established therapies.
Sensitivity analysis according to type of comparator
a) Kernel density estimation
Figure 6 and Figure 7 show kernel density estimation of the ef-
fects of new treatments compared to established ones for primary
outcomes (see Table 1 for the list of primary outcomes used in
the included studies) in trials using active therapy as established
12New treatments compared to established treatments in randomized trials (Review)
Copyright © 2012 The Cochrane Collaboration. Published by John Wiley & Sons, Ltd.

treatment and placebo/no therapy as established treatment respec-
tively. As it can be seen, there is a fairly symmetrical distribution
of new versus established treatments centered near ’no effect’ (a
log hazard ratio of 0) indicating that experimental treatments are
about equally superior or inferior to standard treatments although,
on average, new treatments are slightly more superior to old ones
regardless of comparator treatment used.
13New treatments compared to established treatments in randomized trials (Review)
Copyright © 2012 The Cochrane Collaboration. Published by John Wiley & Sons, Ltd.

Figure 6. A) Kernel densities for all cohorts using single comparison for each study with active comparator
and weights from random-effects model: Primary outcomeB) Cumulative kernel densities for all cohorts using
single comparison for each study with active comparator and weights from random-effects model: Primary
outcome
14New treatments compared to established treatments in randomized trials (Review)
Copyright © 2012 The Cochrane Collaboration. Published by John Wiley & Sons, Ltd.
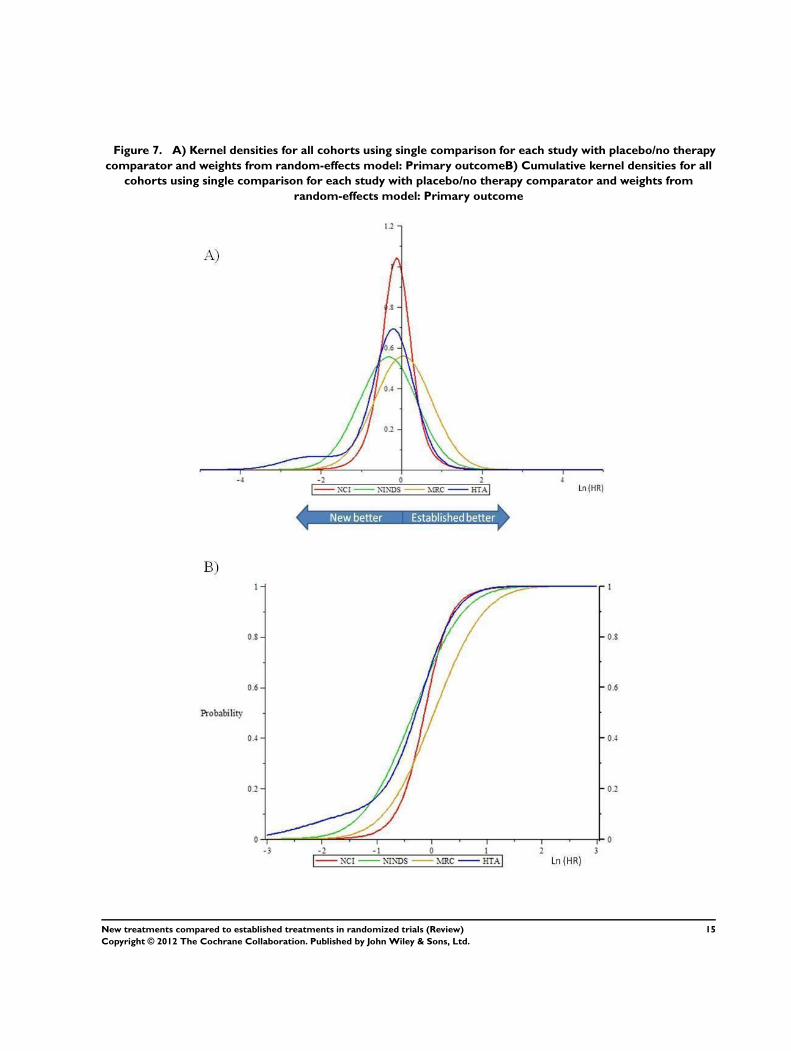
Figure 7. A) Kernel densities for all cohorts using single comparison for each study with placebo/no therapy
comparator and weights from random-effects model: Primary outcomeB) Cumulative kernel densities for all
cohorts using single comparison for each study with placebo/no therapy comparator and weights from
random-effects model: Primary outcome
15New treatments compared to established treatments in randomized trials (Review)
Copyright © 2012 The Cochrane Collaboration. Published by John Wiley & Sons, Ltd.

b) Meta-analysis
Figure 8 shows the forest plot of estimates for primary outcome ac-
cording to type of established treatment used as comparator (active
therapy or placebo/no therapy). New treatments are slightly more
favored in trials which employed an active comparator (HR/OR
0.92, 99% CI 0.89 to 0.96) while in trials which used a placebo/no
therapy as a comparator new treatments resulted in HR 0.79 (99%
CI 0.61 to 1.02). The test of interactions between two subgroups
was, however, not significant (P = 0.13). At the subgroup level,
no heterogeneity in treatment effects was observed in the analysis
based on primary outcomes in studies which used an active com-
parator (I2 = 0%). However, in studies which employed placebo/
no therapy as a comparator, high heterogeneity in treatment ef-
fects was observed in the analysis based on primary outcomes (I2 =
69%) (Figure 8). The heterogeneity substantially decreased (from
69% to 40%) in this subgroup, when the UK Health Technology
Assessment (HTA) cohort (Dent 2011) was excluded from this
analysis. This cohort, which included two true placebo compara-
tors and 13 ’no treatment’ comparisons, evaluated a mixture of
clinical and cost-effectiveness endpoints, typically without ’blind-
ing’ patients or providers to patient outcomes and, therefore, it is
not surprising that we observed relatively high inconsistency (I2 =
69%) in this subgroup.
Figure 8. Forest plot of comparison: New versus established treatment according to comparator, outcome:
1.3 Primary outcome.
c) Meta-regression
Table 4 and Table 5 show a meta-regression evaluating the effect
of cohort and the year of publication on the stability of results
in studies which used active comparator and placebo/no therapy
comparator, respectively. As it can be seen, the results has not
changed over time when the comparator was an active control.
However, when the control was placebo/no therapy a slight, signif-
icant drop in treatment success was observed, most likely due the
trial cohort effect. When the UK HTA cohort was excluded from
the analysis, the association became non-significant (Table 6). As
alluded to above, this cohort included patients with a variety of
health-related problems and variety of health interventions, which
often consisted of assessing the optimal aspect of clinical care and
cost/effectiveness. Conceivably, the investigators may have been
less uncertain about superiority of a given clinical strategy (such as
the uptake of HIV testing, or the usefulness of testing of change
in the quality of life, etc. (see Characteristics of included studies)
in these pragmatic trials (Dent 2011) than about the efficacy of
new cancer drugs. Even so, the results are far from predictable in
advance as displayed in Figure 6 and Figure 7 - the observed dis-
tribution of the treatment effects is fairly symmetrical with new
16New treatments compared to established treatments in randomized trials (Review)
Copyright © 2012 The Cochrane Collaboration. Published by John Wiley & Sons, Ltd.

treatments being only slightly superior to standard ones.
Similar results were obtained when based on all comparisons (
Appendix 2) (see also Table 7; Table 8; Table 9; Table 10; Table
11).
D I S C U S S I O N
This comprehensive assessment of comparisons of new, exper-
imental treatments against established therapies in randomized
controlled trials (RCTs) shows that, while on average, new treat-
ments are associated with a 5% or 10% improvement in relative
survival or primary outcomes (Figure 4; Figure 5), the effects seen
are generally in a symmetrical distribution between new versus
established treatments (Figure 2; Figure 3). This near-symmetry
indicates an unpredictability of new treatment effects, and sug-
gests that investigators cannot predict the trial results in advance.
These results have shown remarkable stability over time (stretch-
ing over five decades), and are not influenced by the inventions of
new treatments or new chemical moieties. This stability is impor-
tant to note as many authors believe that the results will become
more predictable in the era of targeted therapy (Mandrekar 2009).
While that is plausible, there is no historical trend for improved
understanding in biology disease to lead to greater certainty of
effects when tested in RCTs.
We believe that the observed results are not coincidental, but
rather reflect the uncertainty requirement, or clinical equipoise,
as a driver of discovery of new therapies as they undergo clin-
ical testing (Djulbegovic 2001; Djulbegovic 2007; Djulbegovic
2009). According to this hypothesis, the higher the level of un-
certainty before a RCT is undertaken, the less chance that the in-
vestigators will be able to predict the effects of treatment in ad-
vance (Djulbegovic 2001; Djulbegovic 2007; Djulbegovic 2009).
As a result, sometimes new treatments will be better than standard
therapies, sometimes the reverse will be true, and sometimes there
will be no difference between two treatments (Djulbegovic 2001;
Djulbegovic 2007; Djulbegovic 2009). However, the uncertainty
hypothesis needs to be combined with the researchers’ preferences
toward one of the alternative treatments (typically, new ones) that
are being tested (Djulbegovic 2008). Investigators invest a lot of
time and effort in the development and testing of new treatments.
They do bring their accumulated knowledge into the design of
RCTs with the hope they will prove that the new treatments will
be successful. This probably partly explains why new therapies
are, on average, superior to standard therapies. However, if this
accumulated knowledge indicates that the proposed experimental
treatment is clearly superior to established treatment (i.e. that there
is no uncertainty about the competing treatment effects), then
such a RCT would probably be impossible on ethical grounds:
during the rigorous peer review process that these trials undergo,
someone would probably object, at least in the publicly funded
trials, which our analysis dealt with. It is this interplay between re-
searchers’ hope that they have developed treatment which is better
than established treatments and the requirement for uncertainty
to enroll patients in RCTs that can explain the results we observed
(Djulbegovic 2007; Djulbegovic 2009; Djulbegovic 2011). De-
spite these strong theoretical predictions of the observed results,
it should be noted that our sample represents less than 1% of all
available randomized trials; therefore, one should exercise the ap-
propriate caution in interpretation of our findings.
We believe that the question asked by one of us almost 15 years ago
(Chalmers 1997) is now reliably answered at least when treatments
are tested in publicly funded trials. Society can expect that when
new experimental treatments are tested against established treat-
ments in RCTs in publicly funded trials, slightly more than half
will prove to be better, and slightly less than half will prove to be
worse. As we discussed elsewhere (Djulbegovic 2008; Djulbegovic
2007; Djulbegovic 2009; Kumar 2005; Soares 2005), this finding
represents good news. Achieving higher predictability in the re-
sults would likely lead to the collapse of the current RCT system,
as most clinicians and patients would refuse randomization (with
typical a 50:50 chance of allocation to successful treatment) if in-
vestigators can be certain, say, at 80% or above about the effects
of treatments they propose to test.
Our review has some limitations. First, we included only RCTs
funded by public agencies. The commercially sponsored trials are
believed to have higher success rates as industry invest heavily in
treatment development and have more meticulous trial execution
(Fries 2004), or their seemingly higher success rates are derived
from possibly biased execution linked to the commercial interests
(Gluud 2006; Lexchin 2003). To date, however, all reports on
treatment outcomes in industry-sponsored trials relied solely on
published studies, making it impossible to discern the impact of
publication bias on the results (Lexchin 2003). Second, we may
have missed some eligible cohorts. However, we believe this is un-
likely due to our extensive, broad literature search, and our ex-
perience investigating this question for almost 15 years now. It
would therefore be unlikely that we had missed some important
published reports. Third, we have not addressed the ’efficiency’ of
answering the questions, as some of RCTs may have been incon-
clusive (Djulbegovic 2008). Nevertheless, while the inconclusive
results may represent a waste of resources, they still had about an
equal chance of generating results in favor of experimental ther-
apy (Dent 2011; Djulbegovic 2008). Fourth, the distribution of
observed outcomes could have been affected by bias, such as the
choice of inferior or suboptimal established treatments (Mann
2012), or other types of biases that may plague many randomized
trials (Higgins 2011). However, as discussed in the Results section,
we believe that all included trials were of high quality without
evidence of the effect of comparator bias, or other types of biases.
Fifth, we analyzed data according to the year of publication. As
there is always a delay between time of publication and time when
17New treatments compared to established treatments in randomized trials (Review)
Copyright © 2012 The Cochrane Collaboration. Published by John Wiley & Sons, Ltd.
the study was conceived and recruited patients, the year of publi-
cation does not necessarily represent uncertainty about treatment
effects of the period when the trial was designed. Sixth, the lim-
ited domains and descriptive data in the available cohorts made
most of our planned subgroup analyses (public versus commer-
cial; specialty area; methodological quality) impossible. Indeed,
the majority of the data come from publicly funded trials in on-
cology. Although the two non-cancer cohorts included had similar
results (see Figure 2; Figure 3; Figure 4; Figure 5) we could not
fully test the robustness of our conclusions across other disease
domains. Finally, this review reflects the search last performed in
March of 2010. Originally, we planned to report the aggregate
data as described in the cohorts of published trials. However, we
soon realized that this would not allow us to generate the quantita-
tive assessment of treatment success. We have, therefore, extracted
all data from all individual trials in each of four cohorts. This,
however, proved a very time-consuming task, with the result that
our review reflects best evidence at the time when the search was
completed. Nevertheless, as of this time (August 2012) we are not
aware of any new published cohorts of trials comparing the effects
of new versus established treatments.
However, we believe that our results are generalizable at least to
publicly funded trials. This is because a central principle in the
evaluation of the effects of new versus established therapies is that,
when uncertain, the investigators’ ’bets’ on the effect of treatment
on primary outcomes will not be predictably materialized in any
individual RCT. That is, a similar distribution of treatment suc-
cess should be observed regardless of a type of treatment, disease,
or the choice of primary outcomes. This, as repeatedly discussed,
applies only to the analyses that are not affected by the factors such
as selection of inferior comparator, poor methodologically quality,
or selective publication. Indeed, the requirement for a consecutive
series of high-quality randomized trials in which publication and
outcome reporting bias is accounted for is a key to conducting
the accurate evaluation of the effects of new treatments compared
to established treatments in randomized trials. As long as these
requirements are met, we believe that our results are generaliz-
able to all randomized trials, although further studies are needed
to address the distribution of treatment success in commercially
sponsored trials.
A U T H O R S ’ C O N C L U S I O N SImplication for systematic reviews andevaluations of healthcare
Society can expect that slightly more than half of new experimental
treatments will prove to be better than established treatments when
tested in randomized controlled trials (RCTs), but few will be
substantially better. This is an important finding for patients (as
they contemplate participation in RCTs), researchers (as they plan
design of the new trials), and funders (as they assess the ’return
on investment’). As our analysis did not include commercially
sponsored studies, this conclusion applies to publicly sponsored
trials.
Implication for methodological research
Future research should focus on assessing the ’efficiency’ of an-
swering the questions tested in RCTs, as well as the role of com-
mercial sponsorship.
A C K N O W L E D G E M E N T S
We thank Andy Oxman and Elizabeth Paulson for their help in
writing the original protocol. We also thank Mike Clarke for de-
tailed and constructive feedback on the earlier version of the re-
view.
R E F E R E N C E S
References to studies included in this review
Dent 2011 {published data only}
Dent L, Raftery J. Treatment success in pragmatic
randomised controlled trials: a review of trials funded by
the UK Health Technology Assessment programme. Trials
2011;12(109):1–10.
Djulbegovic 2008 {published data only}
Djulbegovic B, Kumar A, Soares HP, Hozo I, Bepler G,
Clarke M, et al.Treatment success in cancer: new cancer
treatment successes identified in phase 3 randomized
controlled trials conducted by the National Cancer
Institute-sponsored cooperative oncology groups, 1955 to
2006. Archives of Internal Medicine 2008;168(6):632–42.
Johnston 2006 {published data only}
Johnston SC, Rootenberg JD, Katrak S, Smith WS, Elkins
JS. Effect of a US National Institutes of Health programme
of clinical trials on public health and costs. Lancet 2006;
367:1319–27.
Machin 1997 {published data only}
Machin D, Stenning S, Parmar M, Fayers P, Girling D,
Stephens R, et al.Thirty years of medical research council
randomized trials in solid tumours. Clinical Oncology 1997;
9:100–14.
References to studies excluded from this review
Bekelman 2003 {published data only}
Bekelman JE, Li Y, Gross CP. Scope and impact of financial
18New treatments compared to established treatments in randomized trials (Review)
Copyright © 2012 The Cochrane Collaboration. Published by John Wiley & Sons, Ltd.

conflicts of interest in biomedical research. JAMA 2003;
289(4):454–65.
Joffe 2004 {published data only}
Joffe S, Harrington DP, George SL, Emanuel EJ, Budzinski
LA, Weeks JC. Satisfaction of the uncertainty principle in
cancer clinical trials: retrospective cohort analysis. BMJ
2004;328(4754):1463.
Kumar 2005 {published data only}
Kumar A, Soares H, Wells R, Clarke M, Hozo I, Bleyer
A, et al.Are experimental treatments for cancer in children
superior to established treatments? Observational study of
randomised controlled trials by the Children’s Oncology
Group. BMJ 2005;331(7528):1295.
Lathyris 2010 {published data only}
Lathyris DN, Patsopoulos NA, Salanti G, Ioannidis JPA.
Industry sponsorship and selection of comparators in
randomized clinical trials. European Journal of Clinical
Investigation 2010;40(2):172–82.
Lexchin 2003 {published data only}
Lexchin J, Bero LA, Djulbegovic B, Clark O. Pharmaceutical
industry sponsorship and research outcome and quality:
systematic review [Original pharmaceutical industry
sponsorship and research outcome and quality: systematic
review]. BMJ 2003;326(7400):1167–70.
Soares 2004 {published data only}
Soares HP, Daniels S, Kumar A, Clarke M, Scott C,
Swann S, et al.Bad reporting does not mean bad methods
for randomised trials: observational study of randomised
controlled trials performed by the Radiation Therapy
Oncology Group. BMJ 2004;328:22–5.
Yanada 2007 {published data only}
Yanada M, Narimatsu H, Suzuki T, Matsuo K, Naoe T.
Randomized controlled trials of treatments for hematologic
malignancies: study characteristics and outcomes. Cancer
2007;110(2):334–9.
Additional references
Als-Nielsen 2003
Als-Nielsen B, Chen W, Gluud C, Kjaergard LL. Association
of funding and conclusions in randomized drug trials: a
reflection of treatment effect or adverse events?. JAMA
2003;290(7):921–8.
Altman 1994
Altman D. The scandal of poor medical research. BMJ
1994;308:283–4.
Altman 1995
Altman D, Bland M. Absence of evidence is not evidence of
absence. BMJ 1995;311:485.
Atkins 1966
Atkins H. Conduct of a controlled clinical trial. BMJ 1966;
2:377–9.
Bradford Hill 1963
Bradford Hill A. Medical ethics and controlled trials. BMJ
1963;2:1043–9.
Bradford Hill 1987
Bradford Hill A. Clinical trials and the acceptance of
uncertainty. BMJ 1987;294:1419.
Chalmers 1997
Chalmers I. What is the prior probability of a proposed new
treatment being superior to established treatments?. BMJ
1997;314:74–5.
Chan 2004
Chan AW, Haahr MT, Hróbjartsson A, Gøtzsche PC,
Altman DG. Empirical evidence for selective reporting of
outcomes in randomized trials: comparison of protocols to
published articles. JAMA 2004;291:2547–65.
Colditz 1989
Colditz GA, Miller JN, Mosteller F. How study design
affects outcomes in comparisons of therapy.I:medical.
Statistics in Medicine 1989;8:441–54.
Dickersin 1992
Dickersin K. Why register clinical trials?-Revisited.
Controlled Clinical Trials 1992;13:170–7.
Dickersin 1997
Dickersin K. How important is publication bias? A
synthesis of available data. AIDS Education and Prevention
1997;9:15–21.
Djulbegovic 2000a
Djulbegovic B, Bennet CL, Adams JR, Lyman GH.
Industry-sponsored research. Lancet 2000;356:2193–4.
Djulbegovic 2000b
Djulbegovic B, Lacevic M, Macy T, Adams J, Lyman GH.
What is the probability that results of meta-analyses will
favor innovative treatments?. VIII Cochrane Colloquium:
Evidence for Action. Cape Town, South Africa, 2000.
Djulbegovic 2000c
Djulbegovic B, Lacevic M, Cantor A, Fields K, Bennett
C, Adams J, et al.The uncertainty principle and industry-
sponsored research. Lancet 2000;356:635–8.
Djulbegovic 2001
Djulbegovic B. Acknowledgment of uncertainty: a
fundamental means to ensure scientific and ethical validity
in clinical research. Current Oncology Reports 2001;3:
389–95.
Djulbegovic 2002
Djulbegovic B. Denominator problem needs to be
addressed. BMJ 2002;325:1420.
Djulbegovic 2003
Djulbegovic B, Cantor A, Clarke M. The importance
of preservation of the ethical principle of equipoise
in the design of clinical trials: relative impact of the
methodological quality domains on the treatment effect
in randomized controlled trials. Accountability in Research
2003;10(4):301–15.
Djulbegovic 2007
Djulbegovic B. Articulating and responding to uncertainties
in clinical research. Journal of Medicine and Philosophy
2007;32(2):79–98.
19New treatments compared to established treatments in randomized trials (Review)
Copyright © 2012 The Cochrane Collaboration. Published by John Wiley & Sons, Ltd.

Djulbegovic 2009
Djulbegovic B. The paradox of equipoise: the principle that
drives and limits therapeutic discoveries in clinical research.
Cancer Control 2009;16(4):342–7.
Djulbegovic 2011
Djulbegovic B. Uncertainty and equipoise: at interplay
between epistemology, decision making and ethics.
American Journal of the Medical Sciences 2011;342(4):
282–9.
Dwan 2011
Dwan K, Altman DG, Creswell L, Blundell M, Gamble
CL, Williamson PR. Comparison of protocols and registry
entries to published reports for randomised controlled
trials. Cochrane Database of Systematic Reviews 2011, Issue
1. [DOI: 10.1002/14651858.MR000031.pub2]
Edwards 1998
Edwards SJL, Lilford RJ, Braunholtz DA, Jackson JC,
Hewison J, Thornton J. Ethical issues in the design and
conduct of randomized controlled trials. Health Technology
Assessment 1998;2(15):1–130.
Freedman 1987
Freedman B. Equipoise and the ethics of clinical research.
New England Journal of Medicine 1987;317:141–5.
Fries 2004
Fries JF, Krishnan E. Equipoise, design bias, and randomized
controlled trials: the elusive ethics of new drug development.
Arthritis Research & Therapy 2004;6(3):R250–5.
Gisbert 2003
Gisbert F, Goerlich J. Weighted samples, kernel density
estimators and convergence. Empirical Economics 2003;28:
335–51.
Gluud 2006
Gluud LL. Bias in clinical intervention research. American
Journal of Epidemiology 2006;163(3):493–501.
Hedges 1985
Hedges LV, Olkin I. Statistical Methods for Meta-analysis.
San Diego, CA: Academic Press, 1985.
Higgins 2011
Higgins JPT, Green S, editors. Cochrane Handbook for
Systematic Reviews of Interventions Version 5.1.0 [updated
March 2011]. Chichester, UK: John Wiley & Sons Ltd,
2011.
Hopewell 2007
Hopewell S, Clarke M, Stewart L, Tierney J. Time to
publication for results of clinical trials. Cochrane Database
of Systematic Reviews 2007, Issue 2. [DOI: 10.1002/
14651858.MR000011.pub2]
Hopewell 2009
Hopewell S, Loudon K, Clarke MJ, Oxman AD, Dickersin
K. Publication bias in clinical trials due to statistical
significance or direction of trial results. Cochrane Database
of Systematic Reviews 2009, Issue 1. [DOI: 10.1002/
14651858.MR000006.pub3]
Juni 1999
Juni P, Witschi A, Bloch R, Egger M. The hazards of scoring
the quality of clinical trials for meta-analysis. JAMA 1999;
282:1054–60.
Krzyzanowska 2003
Krzyzanowska MK, Pintilie M, Tannock IF. Factors
associated with failure to publish large randomized trials
presented at an oncology meeting. JAMA 2003;290(4):
495–501.
Kumar 2005a
Kumar A, Soares H, Serdarevic F. Totality of evidence: one
of the keys to better oncology management. Journal of
Oncology Management 2005;14(1):12–4.
Lexchin 2003
Lexchin J, Bero LA, Djulbegovic B, Clark O. Pharmaceutical
industry sponsorship and research outcome and quality:
systematic review. BMJ 2003;326:1167–70.
Lilford 2001
Lilford RJ, Djulbegovic B. Equipoise is essential principle
of human experimentation. BMJ 2001;322:299–300.
Mandrekar 2009
Mandrekar SJ, Sargent DJ. Clinical trial designs for
predictive biomarker validation: theoretical considerations
and practical challenges. Journal of Clinical Oncology 2009;
27(24):4027–34.
Mann 2012
Mann H, Djulbegovic B. Comparator bias: why
comparisons must address genuine uncertainties. James
Lind Library (http://www.jameslindlibrary.org/illustrating/
articles/comparator-bias-why-comparisons-must-address-
genuine-uncertaint) 2012.
Maple 2009
Monagan MB, Geddes KO, Heal KM, Labahn G,
Vorkoetter Sm, McCarron J, et al.Maple 14 Programming
Guide. Waterloo ON, Canada: Maplesoft, 2009.
Peto 1998
Peto R, Baigent C. Trials: the next 50 years. Large scale
randomised evidence of moderate benefits. BMJ 1998;317:
1170–1.
Schulz 1995
Schulz KF. Subverting randomization in controlled trials.
JAMA 1995;274:1456–8.
Senn 2000
Senn S. Placebo confusion. BMJ eletters 15 August 2000.
Silverman 1986
Silverman BW. Density estimation for statistics and data
analysis. Monographs on Statistics and Applied Probability.
London: Chapman and Hall, 1986.
Soares 2004
Soares HP, Daniels S, Kumar A, Clarke M, Scott C,
Swann S, et al.Bad reporting does not mean bad methods
for randomised trials: observational study of randomised
controlled trials performed by the Radiation Therapy
Oncology Group. BMJ 2004;328(7430):22–4.
20New treatments compared to established treatments in randomized trials (Review)
Copyright © 2012 The Cochrane Collaboration. Published by John Wiley & Sons, Ltd.

Soares 2005
Soares HP, Kumar A, Daniels S, Swann S, Cantor A, Hozo
I, et al.Evaluation of new treatments in radiation oncology:
are they better than standard treatments?. JAMA 2005;293
(8):970–8.
Weijer 2000
Weijer C, Shapiro SH, Cranley Glass K. For and against:
clinical equipoise and not the uncertainty principle is the
moral underpinning of the randomised controlled trial.
BMJ 2000;321(7263):756–8.
Wood 2008
Wood L, Egger M, Gluud LL, Schulz KF, Juni P, Altman
DG, et al.Empirical evidence of bias in treatment effect
estimates in controlled trials with different interventions
and outcomes: meta-epidemiological study. BMJ 2008;336
(7644):601–5.∗ Indicates the major publication for the study
21New treatments compared to established treatments in randomized trials (Review)
Copyright © 2012 The Cochrane Collaboration. Published by John Wiley & Sons, Ltd.

C H A R A C T E R I S T I C S O F S T U D I E S
Characteristics of included studies [ordered by study ID]
Dent 2011
Methods Included all trials conducted by the UK Health Technology Programme from 1999 to 2008
63 superiority trials, 94 comparisons and data on 54,027 patients
Included are patients with a variety of health-related problems: diseases of the musculoskeletal and
connective tissue; diseases of the nervous system; diseases of the circulatory system; health status
and contact with health services; mental and behavioral disorders; pregnancy, childbirth, and the
puerperium; diseases of the digestive system; diseases of the genitourinary system; neoplasms;
diseases of skin and subcutaneous tissue; conditions emerging in the perinatal period; and injury
and consequences of external causes
Data Original cohort analysis reported data for component studies with a 95% confidence interval for
primary outcome. For the purposes of the current study, we re-extracted data from additional
studies identified which did not provide the 95% confidence interval in the publication, but
provided ample information from which effect size and standard error could be derived (i.e. from
reported number of events/non-events)
Comparisons Interventions evaluated include: service delivery; surgery; psychological therapy; physical ther-
apies; diagnostic; drug; devices; social care; education and training; complementary therapies;
vaccines and biologicals; diet
Outcomes Primary outcomes included: symptom score measurement; quality of life measures; positive event
rate; adverse event rate; survival/mortality; measurement of function; other
Notes
Risk of bias
Item Authors’ judgement Description
Component study identification? Yes Used the HTA website to identify all studies
initiated by the sponsor
Inclusion criteria? Yes Included all superiority trials which reported
outcomes according to prespecified criteria (i.e.
95% confidence interval for primary outcome)
Study selection? Yes Although study selection process was not de-
scribed in the publication, all consecutive trials
were included in the analysis
22New treatments compared to established treatments in randomized trials (Review)
Copyright © 2012 The Cochrane Collaboration. Published by John Wiley & Sons, Ltd.
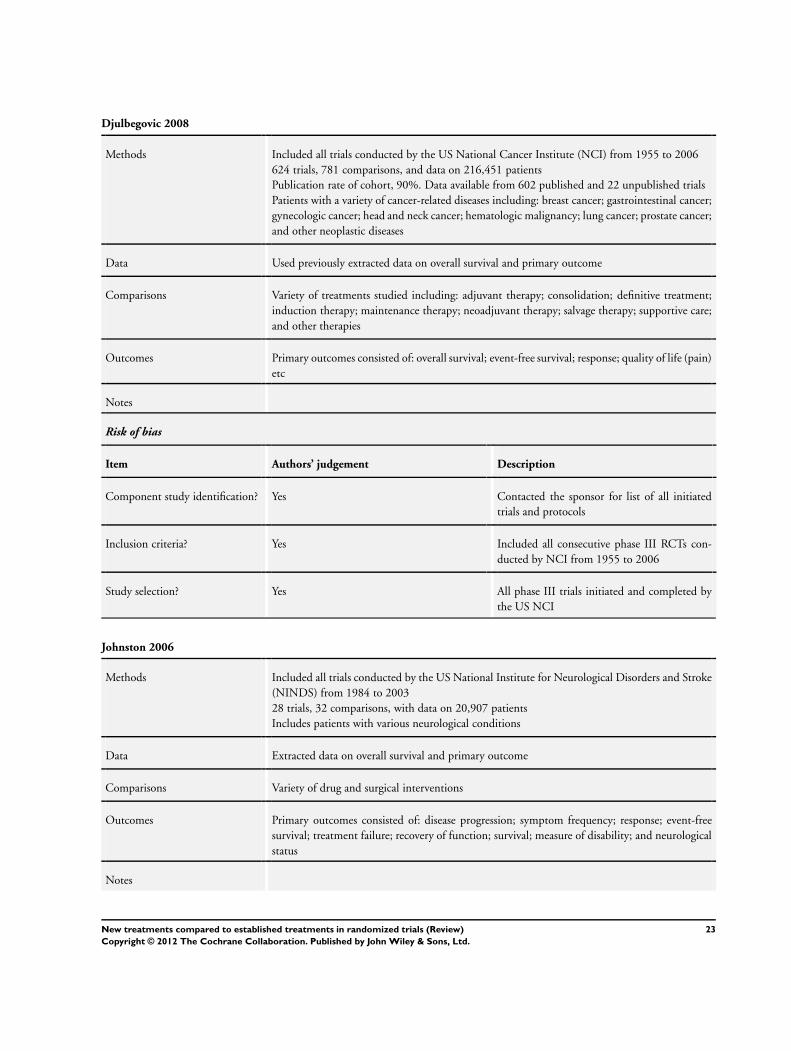
Djulbegovic 2008
Methods Included all trials conducted by the US National Cancer Institute (NCI) from 1955 to 2006
624 trials, 781 comparisons, and data on 216,451 patients
Publication rate of cohort, 90%. Data available from 602 published and 22 unpublished trials
Patients with a variety of cancer-related diseases including: breast cancer; gastrointestinal cancer;
gynecologic cancer; head and neck cancer; hematologic malignancy; lung cancer; prostate cancer;
and other neoplastic diseases
Data Used previously extracted data on overall survival and primary outcome
Comparisons Variety of treatments studied including: adjuvant therapy; consolidation; definitive treatment;
induction therapy; maintenance therapy; neoadjuvant therapy; salvage therapy; supportive care;
and other therapies
Outcomes Primary outcomes consisted of: overall survival; event-free survival; response; quality of life (pain)
etc
Notes
Risk of bias
Item Authors’ judgement Description
Component study identification? Yes Contacted the sponsor for list of all initiated
trials and protocols
Inclusion criteria? Yes Included all consecutive phase III RCTs con-
ducted by NCI from 1955 to 2006
Study selection? Yes All phase III trials initiated and completed by
the US NCI
Johnston 2006
Methods Included all trials conducted by the US National Institute for Neurological Disorders and Stroke
(NINDS) from 1984 to 2003
28 trials, 32 comparisons, with data on 20,907 patients
Includes patients with various neurological conditions
Data Extracted data on overall survival and primary outcome
Comparisons Variety of drug and surgical interventions
Outcomes Primary outcomes consisted of: disease progression; symptom frequency; response; event-free
survival; treatment failure; recovery of function; survival; measure of disability; and neurological
status
Notes
23New treatments compared to established treatments in randomized trials (Review)
Copyright © 2012 The Cochrane Collaboration. Published by John Wiley & Sons, Ltd.

Johnston 2006 (Continued)
Risk of bias
Item Authors’ judgement Description
Component study identification? Yes Contacted the sponsor for list of all initiated
trials
Inclusion criteria? Yes Included all consecutive phase III trials funded
by NINDS and initiated prior to 2000
Study selection? Unclear Study selection process was not described in the
publication but it appears that all phase III trials
sponsored by NINDS were included
Machin 1997
Methods Included all trials conducted by UK Medical Research Council (MRC) from 1973 to 1994
28 trials, 31 comparisons and data on 6359 patients
Includes patients with a variety of cancer-related diseases including: bladder; bone; brain; cervix;
colorectal; head and neck; lung; melanoma; nephroblastoma; ovary; pelvic; and prostate cancer
Data Used previously extracted data on overall survival. Additional data extracted for primary outcome
Comparisons Variety of treatments studied including: radiotherapy; chemotherapy; surgery; and supportive
care
Outcomes Primary outcomes consisted of overall survival and response
Notes
Risk of bias
Item Authors’ judgement Description
Component study identification? Yes Contacted various groups in UK concerned
with conducting of phase III trials on behalf of
the MRC for a list of trials and protocols
Inclusion criteria? Yes All phase III trials conducted by the MRC
which reached recruitment targets
Study selection? Unclear Study selection process was not described in the
publication but it appears that all phase III solid
cancer trials conducted by MRC were included
MRC: Medical Research Council
24New treatments compared to established treatments in randomized trials (Review)
Copyright © 2012 The Cochrane Collaboration. Published by John Wiley & Sons, Ltd.

NCI: National Cancer Institute
RCT: randomized controlled trial
Characteristics of excluded studies [ordered by study ID]
Study Reason for exclusion
Bekelman 2003 Analysis compares outcomes of studies funded by variety of industry and non-industry sources rather than success
of new versus established treatments. Relies on published data only
Joffe 2004 Reports on a smaller cohort of studies included in a larger included analysis (Djulbegovic 2008)
Kumar 2005 Reports on a smaller cohort of studies included in a larger included analysis (Djulbegovic 2008)
Lathyris 2010 Only published studies included in analysis
Lexchin 2003 Analysis compares outcomes of studies funded by variety of industry and non-industry sources rather than success
of new versus established treatments. Only published studies included in analysis
Soares 2004 Reports on a smaller cohort of studies included in a larger included analysis (Djulbegovic 2008)
Yanada 2007 Only published studies included in analysis
25New treatments compared to established treatments in randomized trials (Review)
Copyright © 2012 The Cochrane Collaboration. Published by John Wiley & Sons, Ltd.

D A T A A N D A N A L Y S E S
Comparison 1. New versus established treatment: main analysis including one comparison
Outcome or subgroup titleNo. of
studies
No. of
participants Statistical method Effect size
1 Primary outcome 4 Odds / Hazard Ratio (Random, 99% CI) 0.91 [0.88, 0.95]
2 Overall survival 3 Hazard Ratio (Random, 99% CI) 0.95 [0.92, 0.98]
3 Primary outcome 4 Odds / Hazard Ratio (Random, 99% CI) 0.88 [0.79, 0.97]
3.1 Active comparator 4 Odds / Hazard Ratio (Random, 99% CI) 0.92 [0.89, 0.96]
3.2 Placebo/no therapy
comparator
4 Odds / Hazard Ratio (Random, 99% CI) 0.79 [0.61, 1.02]
Comparison 2. New versus established treatment: sensitivity analysis including all comparisons
Outcome or subgroup titleNo. of
studies
No. of
participants Statistical method Effect size
1 Primary outcome 4 Odds / Hazard Ratio (Random, 99% CI) 0.90 [0.85, 0.94]
2 Overall survival 3 Hazard Ratio (Random, 99% CI) 0.95 [0.93, 0.97]
3 Primary outcome 4 Odds / Hazard Ratio (Random, 99% CI) 0.86 [0.77, 0.97]
3.1 Active comparator 4 Odds / Hazard Ratio (Random, 99% CI) 0.93 [0.89, 0.96]
3.2 Placebo/no therapy
comparator
4 Odds / Hazard Ratio (Random, 99% CI) 0.78 [0.55, 1.09]
26New treatments compared to established treatments in randomized trials (Review)
Copyright © 2012 The Cochrane Collaboration. Published by John Wiley & Sons, Ltd.
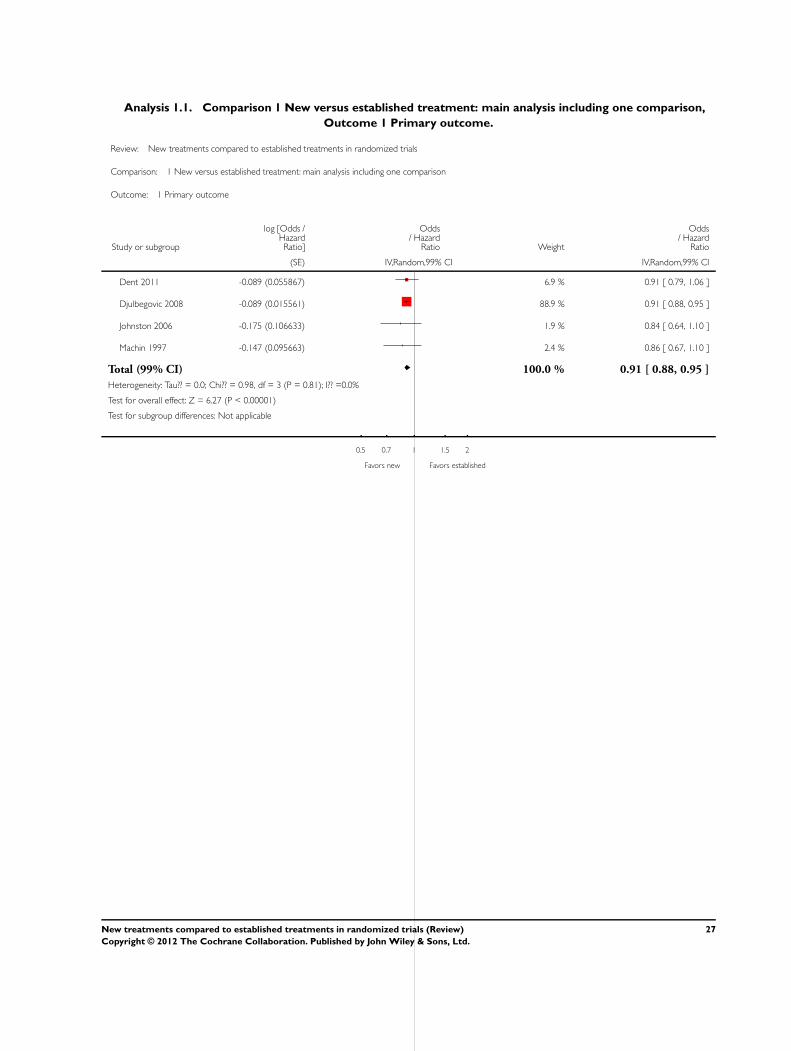
Analysis 1.1. Comparison 1 New versus established treatment: main analysis including one comparison,
Outcome 1 Primary outcome.
Review: New treatments compared to established treatments in randomized trials
Comparison: 1 New versus established treatment: main analysis including one comparison
Outcome: 1 Primary outcome
Study or subgroup
log [Odds /HazardRatio]
Odds/ Hazard
Ratio Weight
Odds/ Hazard
Ratio
(SE) IV,Random,99% CI IV,Random,99% CI
Dent 2011 -0.089 (0.055867) 6.9 % 0.91 [ 0.79, 1.06 ]
Djulbegovic 2008 -0.089 (0.015561) 88.9 % 0.91 [ 0.88, 0.95 ]
Johnston 2006 -0.175 (0.106633) 1.9 % 0.84 [ 0.64, 1.10 ]
Machin 1997 -0.147 (0.095663) 2.4 % 0.86 [ 0.67, 1.10 ]
Total (99% CI) 100.0 % 0.91 [ 0.88, 0.95 ]
Heterogeneity: Tau?? = 0.0; Chi?? = 0.98, df = 3 (P = 0.81); I?? =0.0%
Test for overall effect: Z = 6.27 (P < 0.00001)
Test for subgroup differences: Not applicable
0.5 0.7 1 1.5 2
Favors new Favors established
27New treatments compared to established treatments in randomized trials (Review)
Copyright © 2012 The Cochrane Collaboration. Published by John Wiley & Sons, Ltd.

Analysis 1.2. Comparison 1 New versus established treatment: main analysis including one comparison,
Outcome 2 Overall survival.
Review: New treatments compared to established treatments in randomized trials
Comparison: 1 New versus established treatment: main analysis including one comparison
Outcome: 2 Overall survival
Study or subgroup log [Hazard Ratio] Hazard Ratio Weight Hazard Ratio
(SE) IV,Random,99% CI IV,Random,99% CI
Djulbegovic 2008 -0.051 (0.0125) 93.4 % 0.95 [ 0.92, 0.98 ]
Johnston 2006 -0.023 (0.060204) 4.0 % 0.98 [ 0.84, 1.14 ]
Machin 1997 -0.097 (0.075) 2.6 % 0.91 [ 0.75, 1.10 ]
Total (99% CI) 100.0 % 0.95 [ 0.92, 0.98 ]
Heterogeneity: Tau?? = 0.0; Chi?? = 0.59, df = 2 (P = 0.74); I?? =0.0%
Test for overall effect: Z = 4.23 (P = 0.000024)
Test for subgroup differences: Not applicable
0.5 0.7 1 1.5 2
Favors new Favors established
28New treatments compared to established treatments in randomized trials (Review)
Copyright © 2012 The Cochrane Collaboration. Published by John Wiley & Sons, Ltd.
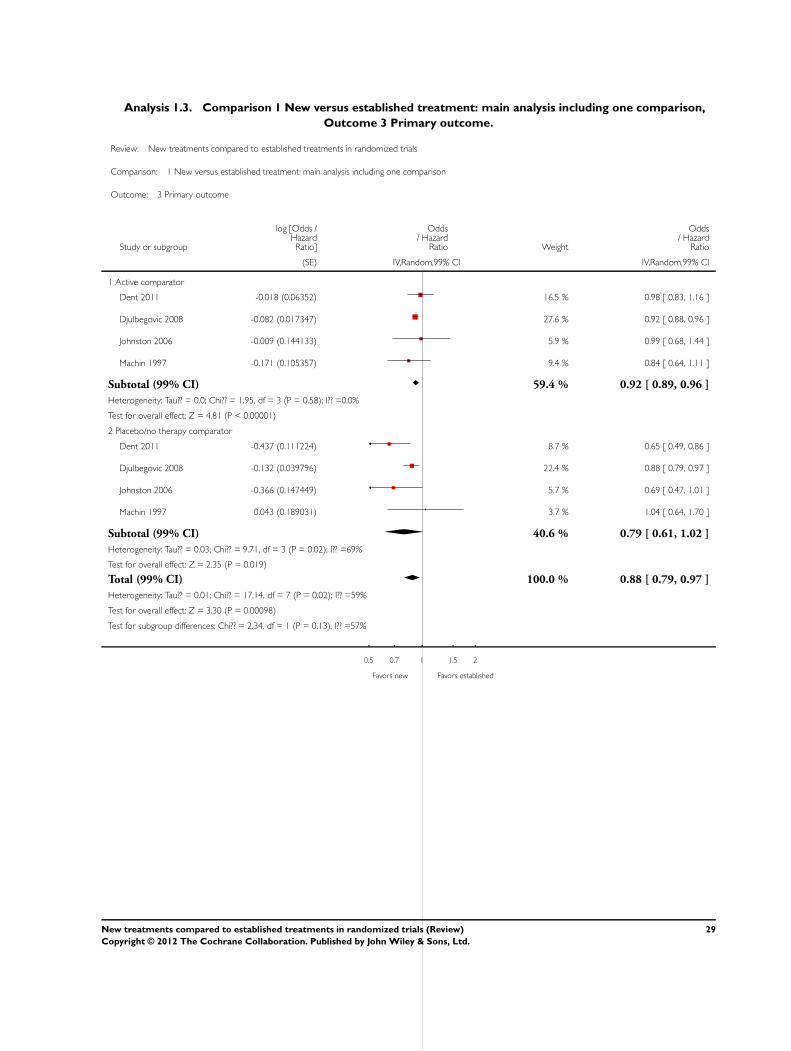
Analysis 1.3. Comparison 1 New versus established treatment: main analysis including one comparison,
Outcome 3 Primary outcome.
Review: New treatments compared to established treatments in randomized trials
Comparison: 1 New versus established treatment: main analysis including one comparison
Outcome: 3 Primary outcome
Study or subgroup
log [Odds /HazardRatio]
Odds/ Hazard
Ratio Weight
Odds/ Hazard
Ratio
(SE) IV,Random,99% CI IV,Random,99% CI
1 Active comparator
Dent 2011 -0.018 (0.06352) 16.5 % 0.98 [ 0.83, 1.16 ]
Djulbegovic 2008 -0.082 (0.017347) 27.6 % 0.92 [ 0.88, 0.96 ]
Johnston 2006 -0.009 (0.144133) 5.9 % 0.99 [ 0.68, 1.44 ]
Machin 1997 -0.171 (0.105357) 9.4 % 0.84 [ 0.64, 1.11 ]
Subtotal (99% CI) 59.4 % 0.92 [ 0.89, 0.96 ]
Heterogeneity: Tau?? = 0.0; Chi?? = 1.95, df = 3 (P = 0.58); I?? =0.0%
Test for overall effect: Z = 4.81 (P < 0.00001)
2 Placebo/no therapy comparator
Dent 2011 -0.437 (0.111224) 8.7 % 0.65 [ 0.49, 0.86 ]
Djulbegovic 2008 -0.132 (0.039796) 22.4 % 0.88 [ 0.79, 0.97 ]
Johnston 2006 -0.366 (0.147449) 5.7 % 0.69 [ 0.47, 1.01 ]
Machin 1997 0.043 (0.189031) 3.7 % 1.04 [ 0.64, 1.70 ]
Subtotal (99% CI) 40.6 % 0.79 [ 0.61, 1.02 ]
Heterogeneity: Tau?? = 0.03; Chi?? = 9.71, df = 3 (P = 0.02); I?? =69%
Test for overall effect: Z = 2.35 (P = 0.019)
Total (99% CI) 100.0 % 0.88 [ 0.79, 0.97 ]
Heterogeneity: Tau?? = 0.01; Chi?? = 17.14, df = 7 (P = 0.02); I?? =59%
Test for overall effect: Z = 3.30 (P = 0.00098)
Test for subgroup differences: Chi?? = 2.34, df = 1 (P = 0.13), I?? =57%
0.5 0.7 1 1.5 2
Favors new Favors established
29New treatments compared to established treatments in randomized trials (Review)
Copyright © 2012 The Cochrane Collaboration. Published by John Wiley & Sons, Ltd.

Analysis 2.1. Comparison 2 New versus established treatment: sensitivity analysis including all
comparisons, Outcome 1 Primary outcome.
Review: New treatments compared to established treatments in randomized trials
Comparison: 2 New versus established treatment: sensitivity analysis including all comparisons
Outcome: 1 Primary outcome
Study or subgroup
log [Odds /HazardRatio]
Odds/ Hazard
Ratio Weight
Odds/ Hazard
Ratio
(SE) IV,Random,99% CI IV,Random,99% CI
Dent 2011 -0.134 (0.02678749) 30.2 % 0.87 [ 0.82, 0.94 ]
Djulbegovic 2008 -0.085 (0.01087029) 59.1 % 0.92 [ 0.89, 0.94 ]
Johnston 2006 -0.184 (0.07570377) 5.9 % 0.83 [ 0.68, 1.01 ]
Machin 1997 -0.128 (0.08469) 4.8 % 0.88 [ 0.71, 1.09 ]
Total (99% CI) 100.0 % 0.90 [ 0.85, 0.94 ]
Heterogeneity: Tau?? = 0.00; Chi?? = 4.49, df = 3 (P = 0.21); I?? =33%
Test for overall effect: Z = 5.60 (P < 0.00001)
Test for subgroup differences: Not applicable
0.5 0.7 1 1.5 2
Favors new Favors established
30New treatments compared to established treatments in randomized trials (Review)
Copyright © 2012 The Cochrane Collaboration. Published by John Wiley & Sons, Ltd.
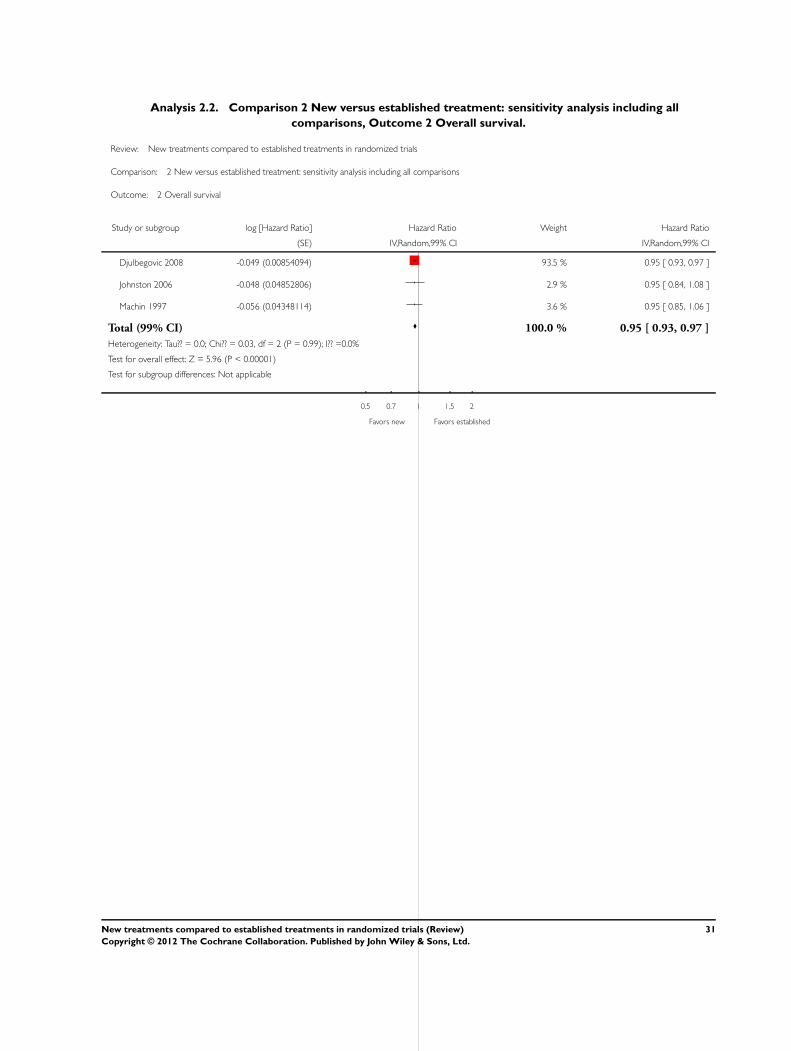
Analysis 2.2. Comparison 2 New versus established treatment: sensitivity analysis including all
comparisons, Outcome 2 Overall survival.
Review: New treatments compared to established treatments in randomized trials
Comparison: 2 New versus established treatment: sensitivity analysis including all comparisons
Outcome: 2 Overall survival
Study or subgroup log [Hazard Ratio] Hazard Ratio Weight Hazard Ratio
(SE) IV,Random,99% CI IV,Random,99% CI
Djulbegovic 2008 -0.049 (0.00854094) 93.5 % 0.95 [ 0.93, 0.97 ]
Johnston 2006 -0.048 (0.04852806) 2.9 % 0.95 [ 0.84, 1.08 ]
Machin 1997 -0.056 (0.04348114) 3.6 % 0.95 [ 0.85, 1.06 ]
Total (99% CI) 100.0 % 0.95 [ 0.93, 0.97 ]
Heterogeneity: Tau?? = 0.0; Chi?? = 0.03, df = 2 (P = 0.99); I?? =0.0%
Test for overall effect: Z = 5.96 (P < 0.00001)
Test for subgroup differences: Not applicable
0.5 0.7 1 1.5 2
Favors new Favors established
31New treatments compared to established treatments in randomized trials (Review)
Copyright © 2012 The Cochrane Collaboration. Published by John Wiley & Sons, Ltd.

Analysis 2.3. Comparison 2 New versus established treatment: sensitivity analysis including all
comparisons, Outcome 3 Primary outcome.
Review: New treatments compared to established treatments in randomized trials
Comparison: 2 New versus established treatment: sensitivity analysis including all comparisons
Outcome: 3 Primary outcome
Study or subgroup
log [Odds /HazardRatio]
Odds/ Hazard
Ratio Weight
Odds/ Hazard
Ratio
(SE) IV,Random,99% CI IV,Random,99% CI
1 Active comparator
Dent 2011 -0.052 (0.03699) 17.6 % 0.95 [ 0.86, 1.04 ]
Djulbegovic 2008 -0.077 (0.016071) 19.5 % 0.93 [ 0.89, 0.97 ]
Johnston 2006 -0.017 (0.130867) 7.5 % 0.98 [ 0.70, 1.38 ]
Machin 1997 -0.173 (0.10102) 10.1 % 0.84 [ 0.65, 1.09 ]
Subtotal (99% CI) 54.7 % 0.93 [ 0.89, 0.96 ]
Heterogeneity: Tau?? = 0.0; Chi?? = 1.54, df = 3 (P = 0.67); I?? =0.0%
Test for overall effect: Z = 5.13 (P < 0.00001)
2 Placebo/no therapy comparator
Dent 2011 -0.605 (0.098469) 10.3 % 0.55 [ 0.42, 0.70 ]
Djulbegovic 2008 -0.126 (0.03648) 17.7 % 0.88 [ 0.80, 0.97 ]
Johnston 2006 -0.379 (0.1375) 7.1 % 0.68 [ 0.48, 0.98 ]
Machin 1997 0.06 (0.09949) 10.2 % 1.06 [ 0.82, 1.37 ]
Subtotal (99% CI) 45.3 % 0.78 [ 0.55, 1.09 ]
Heterogeneity: Tau?? = 0.06; Chi?? = 28.62, df = 3 (P<0.00001); I?? =90%
Test for overall effect: Z = 1.93 (P = 0.054)
Total (99% CI) 100.0 % 0.86 [ 0.77, 0.97 ]
Heterogeneity: Tau?? = 0.01; Chi?? = 37.71, df = 7 (P<0.00001); I?? =81%
Test for overall effect: Z = 3.26 (P = 0.0011)
Test for subgroup differences: Chi?? = 1.84, df = 1 (P = 0.17), I?? =46%
0.5 0.7 1 1.5 2
Favors new Favors established
32New treatments compared to established treatments in randomized trials (Review)
Copyright © 2012 The Cochrane Collaboration. Published by John Wiley & Sons, Ltd.

A D D I T I O N A L T A B L E S
Table 1. Study characteristics
Study cohort Years of con-
duct
Number of tri-
als
(comparisons)
Total patients
enrolled
Disease popula-
tion
Comparator Primary
outcomes
US National
Cancer Institute
(Djulbegovic
2008)
1955 to 2000 624
(781)
216,451 Cancer Active (651)
Placebo (42)
No therapy (91)
Overall survival
(294)
Event-free
survival (270)
Response
(134)
Other (86)
US National In-
stitute for Neu-
rological
Disorders and
Stroke
(Johnston 2006)
1984 to 2003 28
(32)
20,907 Cerebrovascular
disease
Active (17)
Placebo (15)
No therapy (0)
Overall survival
(0)
Event-free
survival (0)
Response
(0)
Other (32)
UK Medical Re-
search Council
(Machin 1997)
1973 to 1994 28
(31)
6359 Cancer Active (27)
Placebo (2)
No therapy (2)
Overall survival
(23)
Event-free
survival (2)
Response
(1)
Other (4)
UK
Health Technol-
ogy Assessment
(Dent 2011)
1999 to 2008 63
(94)
54,027 Various Active (79)
Placebo (2)
No therapy (13)
Overall survival
(0)
Event-free
survival (0)
Response
(0)
Other (94)
Table 2. Meta-regression: effects over time for primary outcome
Meta-regression Number of observations = 729
REML estimate of between-study variance Tau2 = 0.08863
% residual variation due to heterogeneity I2 res = 83.74%
Proportion of between-study variance explained Adj R2 = -0.29%
33New treatments compared to established treatments in randomized trials (Review)
Copyright © 2012 The Cochrane Collaboration. Published by John Wiley & Sons, Ltd.
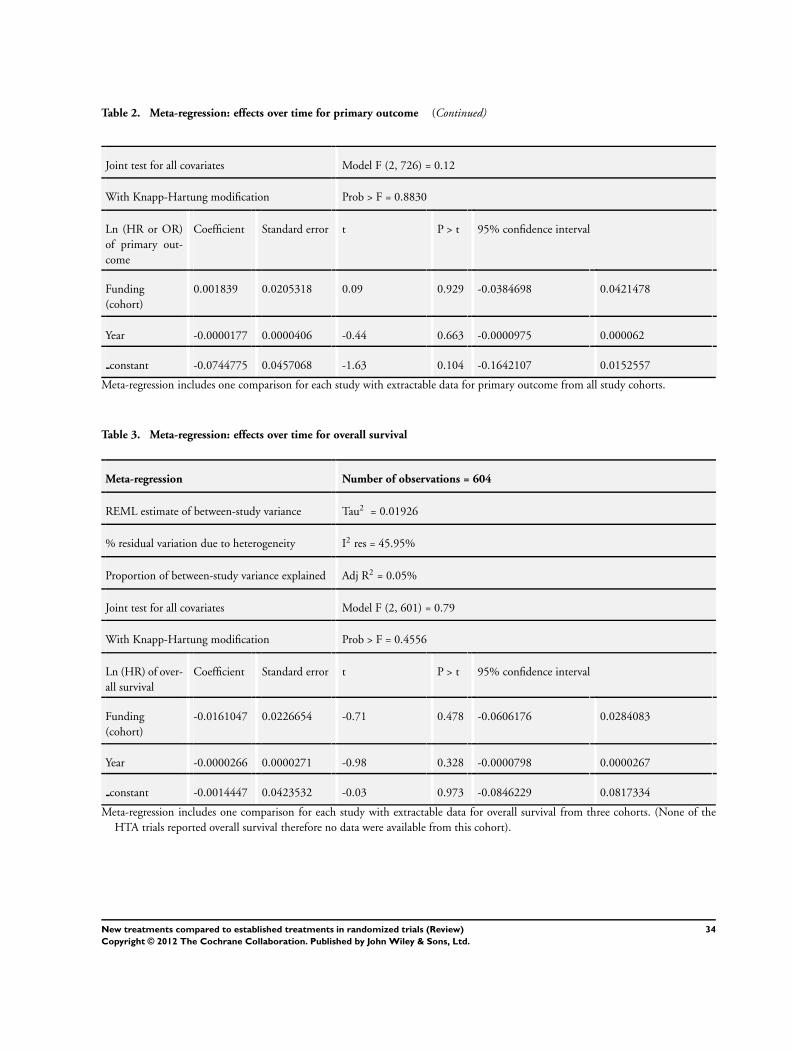
Table 2. Meta-regression: effects over time for primary outcome (Continued)
Joint test for all covariates Model F (2, 726) = 0.12
With Knapp-Hartung modification Prob > F = 0.8830
Ln (HR or OR)
of primary out-
come
Coefficient Standard error t P > t 95% confidence interval
Funding
(cohort)
0.001839 0.0205318 0.09 0.929 -0.0384698 0.0421478
Year -0.0000177 0.0000406 -0.44 0.663 -0.0000975 0.000062
constant -0.0744775 0.0457068 -1.63 0.104 -0.1642107 0.0152557
Meta-regression includes one comparison for each study with extractable data for primary outcome from all study cohorts.
Table 3. Meta-regression: effects over time for overall survival
Meta-regression Number of observations = 604
REML estimate of between-study variance Tau2 = 0.01926
% residual variation due to heterogeneity I2 res = 45.95%
Proportion of between-study variance explained Adj R2 = 0.05%
Joint test for all covariates Model F (2, 601) = 0.79
With Knapp-Hartung modification Prob > F = 0.4556
Ln (HR) of over-
all survival
Coefficient Standard error t P > t 95% confidence interval
Funding
(cohort)
-0.0161047 0.0226654 -0.71 0.478 -0.0606176 0.0284083
Year -0.0000266 0.0000271 -0.98 0.328 -0.0000798 0.0000267
constant -0.0014447 0.0423532 -0.03 0.973 -0.0846229 0.0817334
Meta-regression includes one comparison for each study with extractable data for overall survival from three cohorts. (None of the
HTA trials reported overall survival therefore no data were available from this cohort).
34New treatments compared to established treatments in randomized trials (Review)
Copyright © 2012 The Cochrane Collaboration. Published by John Wiley & Sons, Ltd.
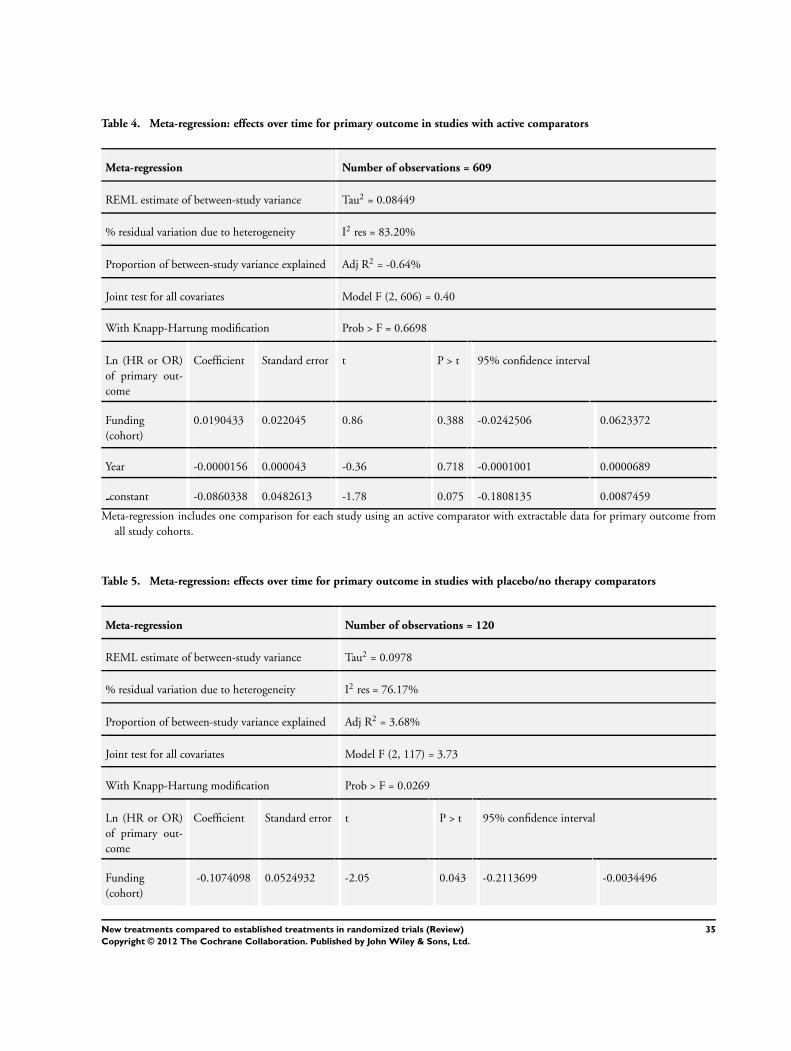
Table 4. Meta-regression: effects over time for primary outcome in studies with active comparators
Meta-regression Number of observations = 609
REML estimate of between-study variance Tau2 = 0.08449
% residual variation due to heterogeneity I2 res = 83.20%
Proportion of between-study variance explained Adj R2 = -0.64%
Joint test for all covariates Model F (2, 606) = 0.40
With Knapp-Hartung modification Prob > F = 0.6698
Ln (HR or OR)
of primary out-
come
Coefficient Standard error t P > t 95% confidence interval
Funding
(cohort)
0.0190433 0.022045 0.86 0.388 -0.0242506 0.0623372
Year -0.0000156 0.000043 -0.36 0.718 -0.0001001 0.0000689
constant -0.0860338 0.0482613 -1.78 0.075 -0.1808135 0.0087459
Meta-regression includes one comparison for each study using an active comparator with extractable data for primary outcome from
all study cohorts.
Table 5. Meta-regression: effects over time for primary outcome in studies with placebo/no therapy comparators
Meta-regression Number of observations = 120
REML estimate of between-study variance Tau2 = 0.0978
% residual variation due to heterogeneity I2 res = 76.17%
Proportion of between-study variance explained Adj R2 = 3.68%
Joint test for all covariates Model F (2, 117) = 3.73
With Knapp-Hartung modification Prob > F = 0.0269
Ln (HR or OR)
of primary out-
come
Coefficient Standard error t P > t 95% confidence interval
Funding
(cohort)
-0.1074098 0.0524932 -2.05 0.043 -0.2113699 -0.0034496
35New treatments compared to established treatments in randomized trials (Review)
Copyright © 2012 The Cochrane Collaboration. Published by John Wiley & Sons, Ltd.

Table 5. Meta-regression: effects over time for primary outcome in studies with placebo/no therapy comparators (Continued)
Year -7.14e-06 0.0001133 -0.06 0.950 -0.0002315 0.0002172
constant -0.0169207 0.1319165 -0.13 0.898 -0.2781745 0.2443331
Meta-regression includes one comparison for each study using placebo/no therapy as comparator with extractable data for primary
outcome from all study cohorts.
Table 6. Sensitivity analysis: meta-regression: effects over time for primary outcome in studies with placebo/no therapy
comparators
Meta-regression Number of observations = 111
REML estimate of between-study variance Tau2 = 0.05048
% residual variation due to heterogeneity I2 res = 63.82%
Proportion of between-study variance explained Adj R2 = -6.35%
Joint test for all covariates Model F (2, 108) = 0.26
With Knapp-Hartung modification Prob > F = 0.7741
Ln (HR or OR)
of primary out-
come
Coefficient Standard error t P > t 95% confidence interval
Funding
(cohort)
-0.027118 0.0756636 -0.36 0.721 -0.1770963 0.1228603
Year -0.0000469 0.0000959 -0.49 0.626 -0.0002371 0.0001433
constant -0.0507566 0.1364634 -0.37 0.711 -0.3212507 0.2197374
Meta-regression includes data from three cohorts (NCI, NINDS, and UK MRC) using one comparison for each study utilizing placebo/
no therapy as comparator with extractable data for primary outcome from all study cohorts. HTA cohort was excluded from analysis.
Table 7. Sensitivity analysis: meta-regression: effects over time for primary outcome
Meta-regression Number of observations = 872
REML estimate of between-study variance Tau2 = 0.1117
% residual variation due to heterogeneity I2 res = 87.35%
Proportion of between-study variance explained Adj R2 = 0.19%
36New treatments compared to established treatments in randomized trials (Review)
Copyright © 2012 The Cochrane Collaboration. Published by John Wiley & Sons, Ltd.

Table 7. Sensitivity analysis: meta-regression: effects over time for primary outcome (Continued)
Joint test for all covariates Model F (2, 869) = 0.57
With Knapp-Hartung modification Prob > F = 0.5657
Ln (HR or OR)
of primary out-
come
Coefficient Standard error t P > t 95% confidence interval
Funding
(cohort)
-0.0118142 0.0188867 -0.63 0.532 -0.048883 0.0252546
Year -4.65e-06 0.0000408 -0.11 0.909 -0.0000848 0.0000754
constant -0.0729165 0.0439442 -1.66 0.097 -0.1591657 0.0133327
Meta-regression includes all comparisons for each study with extractable data for primary outcome from all study cohorts.
Table 8. Sensitivity analysis: meta-regression: effects over time for overall survival
Meta-regression Number of observations = 666
REML estimate of between-study variance Tau2 = 0.01745
% residual variation due to heterogeneity I2 res = 44.69%
Proportion of between-study variance explained Adj R2 = 0.53%
Joint test for all covariates Model F (2, 663) = 1.27
With Knapp-Hartung modification Prob > F = 0.2826
Ln (HR) of over-
all survival
Coefficient Standard error t P > t 95% confidence interval
Funding
(cohort)
-0.0131063 0.0206881 -0.63 0.527 -0.0537284 0.0275158
Year -0.0000357 0.0000255 -1.40 0.161 -0.0000857 0.0000143
constant 0.0097909 0.0392104 0.25 0.803 -0.0672005 0.0867824
Meta-regression includes all comparisons for each study with extractable data for overall survival from all study cohorts.
37New treatments compared to established treatments in randomized trials (Review)
Copyright © 2012 The Cochrane Collaboration. Published by John Wiley & Sons, Ltd.
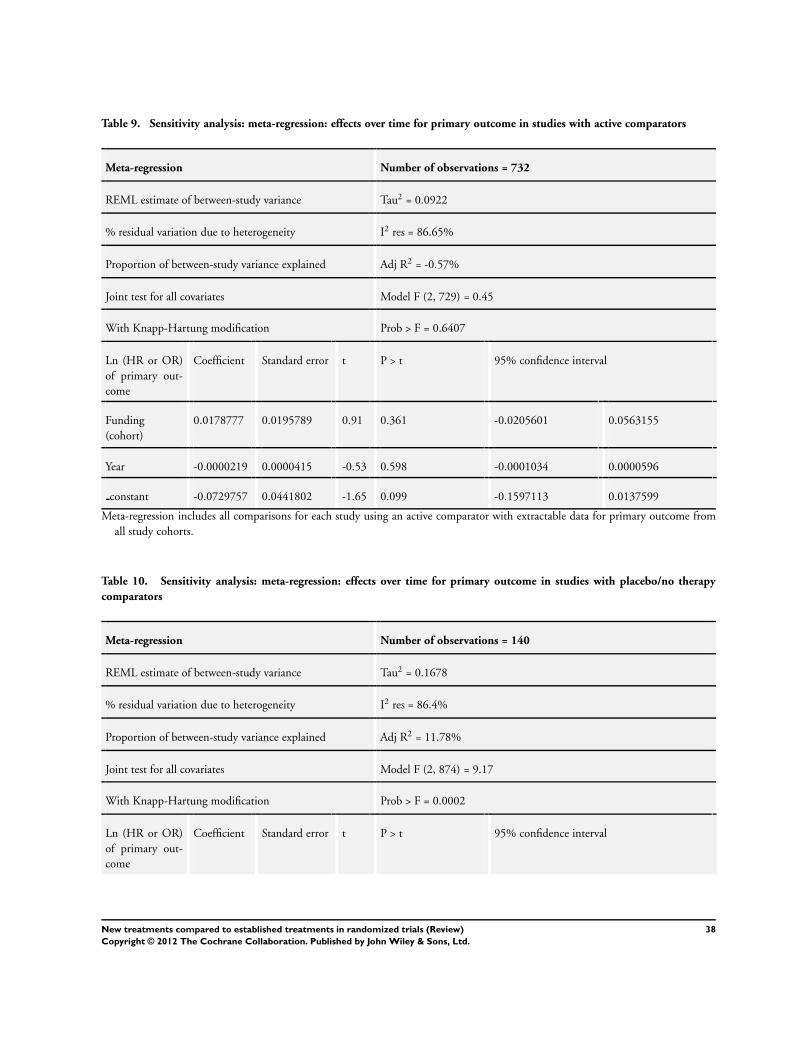
Table 9. Sensitivity analysis: meta-regression: effects over time for primary outcome in studies with active comparators
Meta-regression Number of observations = 732
REML estimate of between-study variance Tau2 = 0.0922
% residual variation due to heterogeneity I2 res = 86.65%
Proportion of between-study variance explained Adj R2 = -0.57%
Joint test for all covariates Model F (2, 729) = 0.45
With Knapp-Hartung modification Prob > F = 0.6407
Ln (HR or OR)
of primary out-
come
Coefficient Standard error t P > t 95% confidence interval
Funding
(cohort)
0.0178777 0.0195789 0.91 0.361 -0.0205601 0.0563155
Year -0.0000219 0.0000415 -0.53 0.598 -0.0001034 0.0000596
constant -0.0729757 0.0441802 -1.65 0.099 -0.1597113 0.0137599
Meta-regression includes all comparisons for each study using an active comparator with extractable data for primary outcome from
all study cohorts.
Table 10. Sensitivity analysis: meta-regression: effects over time for primary outcome in studies with placebo/no therapy
comparators
Meta-regression Number of observations = 140
REML estimate of between-study variance Tau2 = 0.1678
% residual variation due to heterogeneity I2 res = 86.4%
Proportion of between-study variance explained Adj R2 = 11.78%
Joint test for all covariates Model F (2, 874) = 9.17
With Knapp-Hartung modification Prob > F = 0.0002
Ln (HR or OR)
of primary out-
come
Coefficient Standard error t P > t 95% confidence interval
38New treatments compared to established treatments in randomized trials (Review)
Copyright © 2012 The Cochrane Collaboration. Published by John Wiley & Sons, Ltd.

Table 10. Sensitivity analysis: meta-regression: effects over time for primary outcome in studies with placebo/no therapy
comparators (Continued)
Funding
(cohort)
-0.1595504 0.0510799 -3.12 0.002 -0.2605575 -0.0585433
Year 0.0000129 0.0001267 0.10 0.919 -0.0002377 0.0002635
constant 0.0194778 0.1480208 0.13 0.896 -0.2732231 0.3121788
Meta-regression includes all comparisons for each study using placebo/no therapy as comparator with extractable data for primary
outcome from all study cohorts (see Results, Section c) and Tables 6 and 11) .
Table 11. Sensitivity analysis: meta-regression: effects over time for primary outcome in studies with placebo/no therapy
comparators
Meta-regression Number of observations = 122
REML estimate of between-study variance Tau2 = 0.04473
% residual variation due to heterogeneity I2 res = 62.39%
Proportion of between-study variance explained Adj R2 = -4.23%
Joint test for all covariates Model F (2, 119) = 0.19
With Knapp-Hartung modification Prob > F = 0.8267
Ln (HR or OR)
of primary out-
come
Coefficient Standard error t P > t 95% confidence interval
Funding
(cohort)
0.0115189 0.0565173 0.20 0.839 -0.1003909 0.1234287
Year -0.0000538 0.0000879 -0.61 0.542 -0.0002279 0.0001203
constant -0.0761236 0.1275878 -0.60 0.552 -0.3287601 0.1765129
Meta-regression includes data from three cohorts (NCI, NINDS, and UK MRC) using all comparisons for each study utilizing placebo/
no therapy as comparator with extractable data for primary outcome from all study cohorts. HTA cohort was excluded from analysis.
39New treatments compared to established treatments in randomized trials (Review)
Copyright © 2012 The Cochrane Collaboration. Published by John Wiley & Sons, Ltd.
A P P E N D I C E S
Appendix 1. Search strategies
Cochrane Methodology Register (CMR)
#1 (standar* or usual or old or conventional or establish*) NEAR/3 (treatment* or therap* or technolog* or strateg* or arm or
intervention* or method*):ti OR (standar* or usual or old or conventional or establish*) NEAR/3 (treatment* or therap* or technolog*
or strateg* or arm or intervention* or method*):ab
#2 (innovat* or new or novel or experiment* or investigat*) NEAR/3 (treatment* or therap* or technolog* or strateg* or arm or
intervention* or method*):ti OR (innovat* or new or novel or experiment* or investigat*) NEAR/3 (treatment* or therap* or technolog*
or strateg* or arm or intervention* or method*):ab
#3 (multicenter NEXT stud*):ti OR (multicenter NEXT stud*):ab
#4 (multi NEXT center NEXT stud*):ti OR (multi NEXT center NEXT stud*):ab
#5 (rct*):ti or (rct*):ab
#6 (clinical NEAR/2 trial*):ti OR (clinical NEAR/2 trial*):ab
#7 (controlled NEAR/2 trial*):ti OR (controlled NEAR/2 trial*):ab
#8 (random*):ti OR (random*):ab
#9 (uncertainty NEXT principle):ti OR (uncertainty NEXT principle):ab
#10 (equipoise):ti OR (equipoise):ab
#11 (#1 AND #2)
#12 (#3 OR #4 OR #5 OR #6 OR #7 OR #8)
#13 (#11 AND #12)
#14 (#9 OR #10)
#15 (#13 OR #14)
#16 (bias in trials) next general:kw
#17 (#15 OR #16)
MEDLINE Ovid
1. ((standar$ or usual or old or conventional or establish$) adj4 (treatment? or therap$ or technolog$ or strateg$ or arm or intervention?
or method?)).tw.
2. ((innovat$ or new or novel or experiment$ or investigat$) adj4 (treatment? or therap$ or technolog$ or strateg$ or arm or intervention?
or method?)).tw.
3. Therapies, Investigational/
4. 1 and (2 or 3)
5. Clinical Trials as Topic/
6. Clinical Trials, Phase I as Topic/
7. Clinical Trials, Phase II as Topic/
8. Clinical Trials, Phase III as Topic/
9. Clinical Trials, Phase IV as Topic/
10. Controlled Clinical Trials as Topic/
11. Randomized Controlled Trials as Topic/
12. Multicenter Studies as Topic/
13. multicenter stud$.tw.
14. multi center stud$.tw.
15. rct?.tw.
16. (clinical adj3 trial?).tw.
17. (controlled adj3 trial?).tw.
18. Random Allocation/
19. random$.tw.
40New treatments compared to established treatments in randomized trials (Review)
Copyright © 2012 The Cochrane Collaboration. Published by John Wiley & Sons, Ltd.

20. or/5-19
21. 4 and 20
22. Uncertainty/
23. 22 and 20
24. uncertainty principle.tw.
25. equipoise.tw.
26. 24 or 25
27. 21 or 23 or 26
EMBASE Ovid
1. ((standar$ or usual or old or conventional or establish$) adj4 (treatment? or therap$ or technolog$ or strateg$ or arm or intervention?
or method?)).tw.
2. ((innovat$ or new or novel or experiment$) adj4 (treatment? or therap$ or technolog$ or strateg$ or arm or intervention? or method?
)).tw.
3. Experimental Therapy/
4. 1 and (2 or 3)
5. Clinical Trial/
6. Multicenter Study/
7. multicenter stud$.tw.
8. multi center stud$.tw.
9. Phase 1 Clinical Trial/
10. Phase 2 Clinical Trial/
11. Phase 3 Clinical Trial/
12. Phase 4 Clinical Trial/
13. Randomized Controlled Trial/
14. rct?.tw.
15. (clinical adj3 trial?).tw.
16. (controlled adj3 trial?).tw.
17. Randomization/
18. random$.tw.
19. or/5-18
20. 4 and 19
21. Uncertainty/
22. 21 and 19
23. uncertainty principle.tw.
24. equipoise.tw.
25. or/23-24
26. 20 or 22 or 25
Appendix 2. Sensitivity analysis using all comparisons of multi-arm trials
Kernel densities and cumulative kernel densities for all cohorts using all comparisons for each study with extractable data for primary
outcome using weights from random-effect model (Figure 9).
41New treatments compared to established treatments in randomized trials (Review)
Copyright © 2012 The Cochrane Collaboration. Published by John Wiley & Sons, Ltd.

Figure 9. A) Kernel densities for all cohorts using all comparisons for each study and weights from random-
effects model: Primary outcomeB) Cumulative kernel densities for all cohorts using all comparisons for each
study and weights from random-effects model: Primary outcome
42New treatments compared to established treatments in randomized trials (Review)
Copyright © 2012 The Cochrane Collaboration. Published by John Wiley & Sons, Ltd.

Kernel densities and cumulative kernel densities for three cohorts with extractable data for overall survival using all comparisons for
each study using weights from random-effects model (Figure 10). None of the HTA trials reported overall survival therefore no data
were available from this cohort.
43New treatments compared to established treatments in randomized trials (Review)
Copyright © 2012 The Cochrane Collaboration. Published by John Wiley & Sons, Ltd.

Figure 10. A) Kernel densities for three cohorts using all comparisons for each study and weights from
random-effects model: Overall survival (none of the HTA trials reported overall survival therefore no data
were available from this cohort)B) Cumulative kernel densities for three cohorts using all comparisons for
each study and weights from random-effects model: Overall survival (none of the HTA trials reported overall
survival therefore no data were available from this cohort)
44New treatments compared to established treatments in randomized trials (Review)
Copyright © 2012 The Cochrane Collaboration. Published by John Wiley & Sons, Ltd.
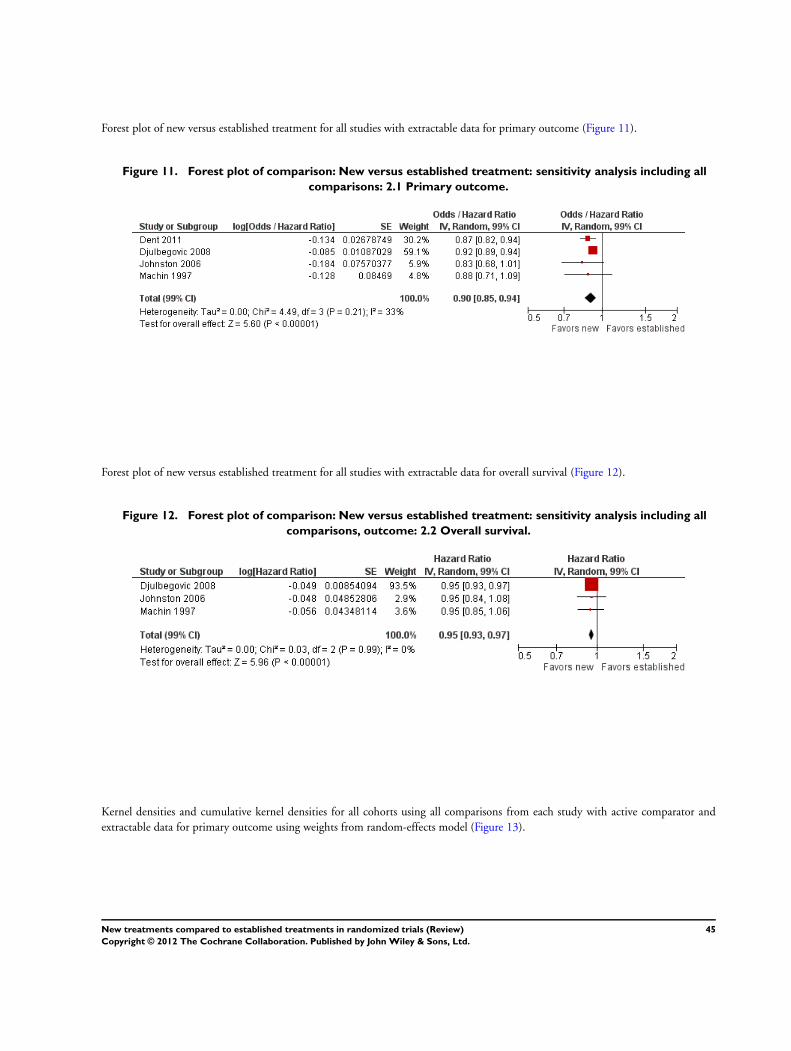
Forest plot of new versus established treatment for all studies with extractable data for primary outcome (Figure 11).
Figure 11. Forest plot of comparison: New versus established treatment: sensitivity analysis including all
comparisons: 2.1 Primary outcome.
Forest plot of new versus established treatment for all studies with extractable data for overall survival (Figure 12).
Figure 12. Forest plot of comparison: New versus established treatment: sensitivity analysis including all
comparisons, outcome: 2.2 Overall survival.
Kernel densities and cumulative kernel densities for all cohorts using all comparisons from each study with active comparator and
extractable data for primary outcome using weights from random-effects model (Figure 13).
45New treatments compared to established treatments in randomized trials (Review)
Copyright © 2012 The Cochrane Collaboration. Published by John Wiley & Sons, Ltd.
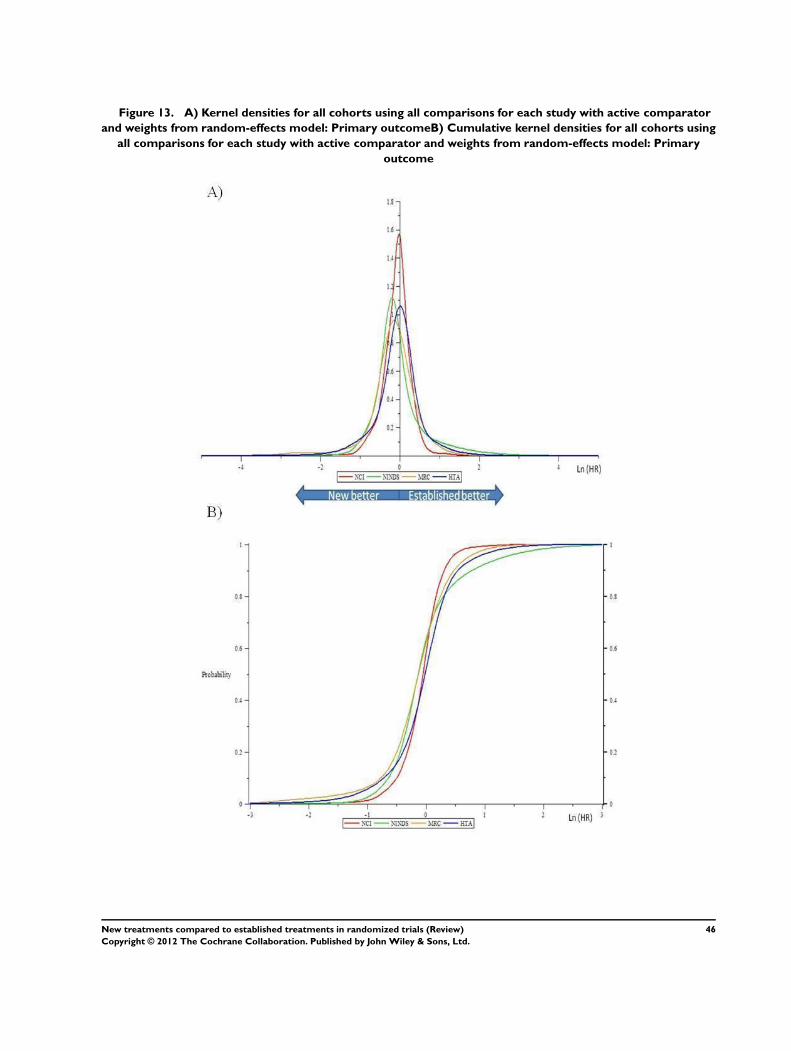
Figure 13. A) Kernel densities for all cohorts using all comparisons for each study with active comparator
and weights from random-effects model: Primary outcomeB) Cumulative kernel densities for all cohorts using
all comparisons for each study with active comparator and weights from random-effects model: Primary
outcome
46New treatments compared to established treatments in randomized trials (Review)
Copyright © 2012 The Cochrane Collaboration. Published by John Wiley & Sons, Ltd.
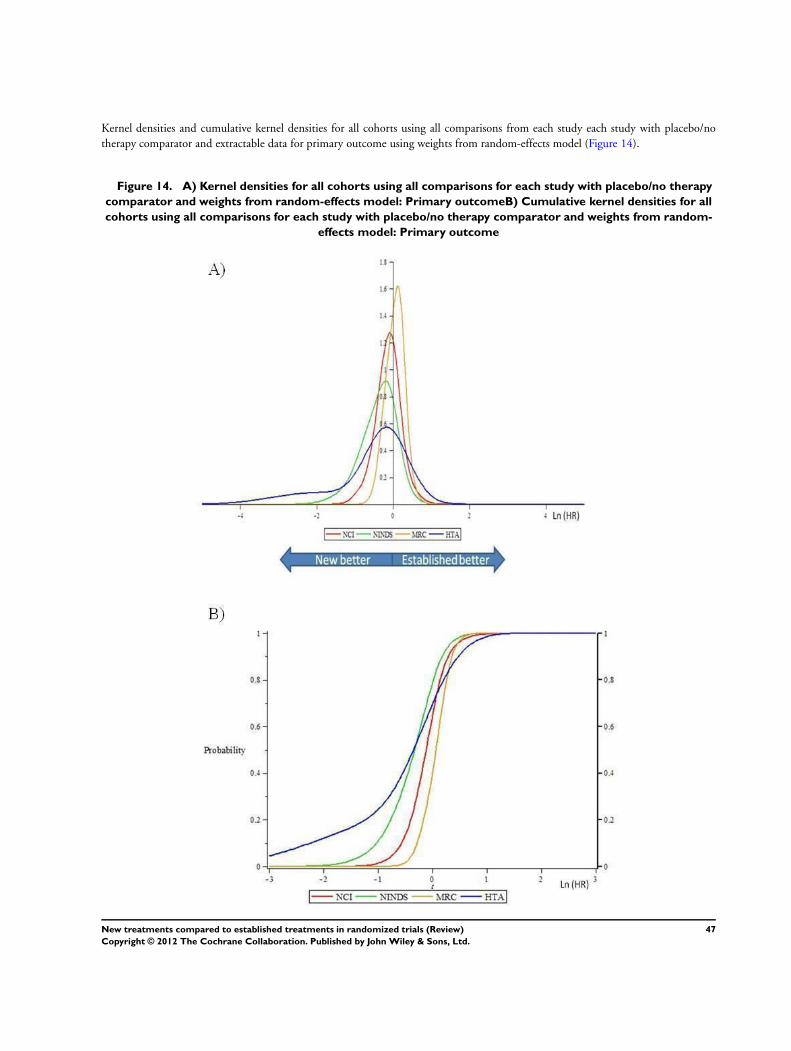
Kernel densities and cumulative kernel densities for all cohorts using all comparisons from each study each study with placebo/no
therapy comparator and extractable data for primary outcome using weights from random-effects model (Figure 14).
Figure 14. A) Kernel densities for all cohorts using all comparisons for each study with placebo/no therapy
comparator and weights from random-effects model: Primary outcomeB) Cumulative kernel densities for all
cohorts using all comparisons for each study with placebo/no therapy comparator and weights from random-
effects model: Primary outcome
47New treatments compared to established treatments in randomized trials (Review)
Copyright © 2012 The Cochrane Collaboration. Published by John Wiley & Sons, Ltd.

Forest plot of new versus established treatment for all studies with extractable data for primary outcome evaluating results for active
versus placebo/no therapy comparator (Figure 15).
Figure 15. Forest plot of comparison: New versus established treatment according to comparator:
sensitivity analysis including all comparisons, outcome: 2.3 Primary outcome.
Meta-regression including all comparisons for each study with extractable data for primary outcome from all study cohorts (Table 7).
Meta-regression including all comparisons for each study with extractable data for overall survival from all study cohorts (Table 8).
None of the HTA trials reported overall survival therefore no data were available from this cohort.
Meta-regression including all comparisons for each study using an active comparator with extractable data for primary outcome from
all study cohorts (Table 9).
Meta-regression includes all comparisons for each study using placebo/no therapy as comparator with extractable data for primary
outcome from all study cohorts (Table 11).
W H A T ’ S N E W
Last assessed as up-to-date: 24 March 2010.
Date Event Description
1 February 2012 Amended New authors were added to the original protocol (PPG, RP, GLDT, TR, BM); two authors from the
original protocol (ADO, EP) withdrew
48New treatments compared to established treatments in randomized trials (Review)
Copyright © 2012 The Cochrane Collaboration. Published by John Wiley & Sons, Ltd.

(Continued)
8 October 2011 Amended Converted to new review format
20 July 2011 Amended Update in Methods (Kernel density and meta-regression analyses were added)
H I S T O R Y
Protocol first published: Issue 3, 2006
Review first published: Issue 10, 2012
Date Event Description
20 February 2007 New citation required and major changes Substantive amendment
C O N T R I B U T I O N S O F A U T H O R S
BD, AO, HS, GV, and IC drafted the original protocol. PPG helped revised the protocol. PPG and RP screened studies for eligibility.
RP, GCL, and BM performed statistical analyses. AK and TR extracted data. BD wrote the first draft of the paper, which was then
revised by all authors. All authors approved the final version of the paper.
D E C L A R A T I O N S O F I N T E R E S T
The corresponding author (BD) and some of the collaborators (AK, HPS, IC, LD, JR) have published studies that were included in
this systematic review.
S O U R C E S O F S U P P O R T
Internal sources
• USF, Clinical Translational Science Institute, Center for Evidence-based Medicine & Health Outcomes, USA.
Intramural support
49New treatments compared to established treatments in randomized trials (Review)
Copyright © 2012 The Cochrane Collaboration. Published by John Wiley & Sons, Ltd.

External sources
• US National Institute of Health (grants no. 1R01NS044417-01, 1 R01 NS052956-01 and 1R01CA133594-01 NIH/ORI),
USA.
Partial support to BD.
• NHMRC grant 0527500, Australia.
Partial support to PPG.
• National Institute of Health Research (through the James Lind Initiative), UK.
Partial support for IC.
D I F F E R E N C E S B E T W E E N P R O T O C O L A N D R E V I E W
The major difference between the protocol and the review is the introduction of the kernel density analyses to assess the distribution of
treatment outcomes. Other differences, which reflect the lack of sufficient data in the included studies, are described in the Methods
section above
50New treatments compared to established treatments in randomized trials (Review)
Copyright © 2012 The Cochrane Collaboration. Published by John Wiley & Sons, Ltd.
Copyright © 2022 FDOKUMEN