Asset Performance Management application for power system ...
102
Asset Performance Management application for power system condition monitoring in an Internet of Things platform Janne Lappi School of Electrical Engineering Thesis submitted for examination for the degree of Master of Science in Technology. Espoo 31.3.2019 Supervisor Prof. Matti Lehtonen Advisor MSc Juhani Tammi
-
Upload
khangminh22 -
Category
Documents
-
view
0 -
download
0
Transcript of Asset Performance Management application for power system ...
Asset Performance Managementapplication for power systemcondition monitoring in an Internetof Things platform
Janne Lappi
School of Electrical Engineering
Thesis submitted for examination for the degree of Master ofScience in Technology.Espoo 31.3.2019
Supervisor
Prof. Matti Lehtonen
Advisor
MSc Juhani Tammi

Aalto University, P.O. BOX 11000, 00076 AALTOwww.aalto.fi
Abstract of the master’s thesis
Author Janne LappiTitle Asset Performance Management application for power system condition
monitoring in an Internet of Things platformDegree programme Automation and Electrical EngineeringMajor Electrical Power and Energy Engineering Code of major ELEC3024Supervisor Prof. Matti LehtonenAdvisor MSc Juhani TammiDate 31.3.2019 Number of pages 96 Language EnglishAbstractFingrid is making the transition from time-based maintenance to condition-basedmaintenance in order to increase the cost-efficiency of substation asset conditionmanagement and to prevent equipment failures. Digitalization improves real-timevisibility to asset condition as Fingrid is developing an Internet of Things (IoT)concept for online asset condition monitoring.
The objective of this Thesis was to specify Fingrid’s requirements for assetcondition data visualization in an Asset Performance Management (APM) application.A secondary objective was to document Fingrid’s IoT concept and existing conditionmonitoring practices. Asset maintenance strategies, digitalization and Internet ofThings were discussed as a background. For the IoT data of switchgear, simpleillustrations of dashboards were drawn to show how the data could be visualized inan APM application. Regarding power transformers, the necessary basic elementsfor condition data visualization were reviewed. Specifications for visualization of allthe available condition data were listed in Appendices.
Online condition monitoring is currently concentrated on switchgear, powertransformers and substation buildings. The IoT solution for switchgear consists oflow-cost sensor units installed in switchgear control cabinets and bay marshallingcabinets. Power transformers are equipped with online DGA (Dissolved Gas Analysis)instruments which is a well-established practice. In substation buildings, the climateis monitored with low-cost IoT sensors.
The conclusion of the study was that there are two types of condition datathat determine Fingrid’s requirements for data visualization in an APM application:time series data and event data. Monitoring of continuous processes produces alarge amount of continuous time series data. A tool with efficient functionalities fortime series data presentation and analysis is needed. Switchgear operations and oilsampling produce event data that require visualization in forms of data reportingand special analyses. The amount of event data is small even though it will increasedue to IoT.Keywords IoT, Internet of Things, Condition Monitoring, Switchgear, Asset
Performance Management, Data Visualization

Aalto-yliopisto, PL 11000, 00076 AALTOwww.aalto.fi
Diplomityön tiivistelmä
Tekijä Janne LappiTyön nimi Sähkönsiirtoverkko-omaisuuden kunnonvalvontajärjestelmä Esineiden
Internet -alustallaKoulutusohjelma Automaatio ja SähkötekniikkaPääaine Sähköenergiatekniikka Pääaineen koodi ELEC3024Työn valvoja Prof. Matti LehtonenTyön ohjaaja DI Juhani TammiPäivämäärä 31.3.2019 Sivumäärä 96 Kieli EnglantiTiivistelmäFingrid on siirtymässä aikaperusteisesta sähköasemien kunnossapidosta kuntoperus-teiseen kunnossapitoon kustannustehokkuuden parantamiseksi ja laitevikojen ennaltaehkäisemiseksi. Reaaliaikaista näkyvyyttä omaisuuden kuntoon parannetaan kehit-tämällä "Esineiden Internet"(engl. Internet of Things, IoT ) -konsepti omaisuudenkäytönaikaiseen kunnonvalvontaan.
Tämän diplomityön tavoitteena oli laatia määrittelyt kunnonvalvontadatan visua-lisoinnille omaisuuden kunnonvalvontajärjestelmässä. Toisena tavoitteena oli doku-mentoida Fingridin IoT-konsepti ja käytössä olevat perinteiset kunnonvalvontamene-telmät. Taustana työlle esiteltiin omaisuuden kunnonhallintamalleja, digitalisaatiotaja Esineiden Internetiä. Kytkinlaitteiden IoT-datan visualisoinnin tarpeiden hahmot-tamiseksi laadittiin luonnoksia kunnonvalvontajärjestelmän näkymistä. Muuntajienkunnonvalvonnan tarpeelliset osa-alueet kunnonvalvontajärjestelmässä käytiin lä-pi käytössä olevia ratkaisuja tutkimalla. Määrittelyt kaiken käytettävissä olevankunnonvalvontadatan visualisoinnille listattiin työn liitteissä.
Käytönaikainen kunnonvalvonta keskittyy tällä hetkellä kytkinlaitteisiin, muun-tajiin ja sähköasemarakennuksiin. Kytkinlaitteiden IoT-ratkaisu koostuu kytkinlait-teen ohjainkaappiin sekä kytkinkentän jakokaappiin asennetuista kustannustehok-kaista sensoriyksiköistä. Muuntajat on varustettu jatkuva-aikaisella vikakaasujenseurannalla, mikä on toimivaksi todettu ja vakiintunut kunnonvalvontamenetelmä.Asemarakennusten olosuhteita valvotaan huoneisiin sijoitetuilla IoT-sensoriyksiköillä.
Työn johtopäätöksenä voidaan todeta kunnonvalvontadatan jakaantuvan pää-asiassa kahteen muotoon, jotka määrittelevät Fingridin tarpeet kunnonvalvontajär-jestelmälle. Jatkuva-aikaisten prosessien valvonta tuottaa suuren määrän jatkuvaaaikasarjadataa, minkä vuoksi tehokkaat työkalut aikasarjadatan esittämiselle ovattarpeen. Kytkinlaitteiden ohjaukset ja muuntajien öljynäytteet puolestaan tuottavattapahtumaperusteista dataa, jonka visualisointi muistuttaa datan raportointimene-telmiä. Tarvitaan erilaisia datan esitystapoja ja mukautettuja analysointimenetelmiä.Tapahtumadatan määrä on pieni siitä huolimatta, että sen määrä kasvaa huomatta-vasti IoT:n myötä.Avainsanat IoT, Esineiden Internet, kunnonvalvonta, kytkinlaite, omaisuuden
hallinta, datan visualisointi

iv
PrefaceThis Thesis was made for the Transmission System Operator of Finland, FingridOyj, as a Master’s Thesis of the School of Electrical Engineering in Aalto University.I want to thank Professor Matti Lehtonen for supervision and academic overviewof this Thesis. I want to thank my Thesis advisor Juhani Tammi and his colleagueTuomas Laitinen for their guidance.
This Thesis was a great opportunity to familiarize with industrial asset conditionmanagement, Internet of Things and technology of high voltage equipment. Fingrid’sdevelopment of IoT solutions for online condition monitoring is pioneering work inthe field of power systems. I will be interested in contributing the work in the futureto find out how the potential of this promising concept can be realized.
Espoo, 31.3.2019
Janne Lappi

v
ContentsAbstract ii
Abstract (in Finnish) iii
Preface iv
Contents v
Abbreviations vii
1 Introduction 11.1 Background . . . . . . . . . . . . . . . . . . . . . . . . . . . . . . . . 11.2 Objective of the Thesis . . . . . . . . . . . . . . . . . . . . . . . . . . 2
2 Substation Asset Condition Management 32.1 Maintenance strategies . . . . . . . . . . . . . . . . . . . . . . . . . . 32.2 Condition monitoring . . . . . . . . . . . . . . . . . . . . . . . . . . . 4
3 Digitalization 63.1 Digital substation . . . . . . . . . . . . . . . . . . . . . . . . . . . . . 63.2 Internet of Things in Asset Condition Management . . . . . . . . . . 10
4 Fingrid’s Condition Monitoring Solutions 184.1 Switchgear . . . . . . . . . . . . . . . . . . . . . . . . . . . . . . . . . 184.2 Gas-Insulated Switchgear . . . . . . . . . . . . . . . . . . . . . . . . . 254.3 Power transformers . . . . . . . . . . . . . . . . . . . . . . . . . . . . 274.4 Instrument transformers . . . . . . . . . . . . . . . . . . . . . . . . . 334.5 Substation buildings . . . . . . . . . . . . . . . . . . . . . . . . . . . 354.6 Primary circuit temperature . . . . . . . . . . . . . . . . . . . . . . . 364.7 Future development . . . . . . . . . . . . . . . . . . . . . . . . . . . . 37
5 Asset Performance Management application for Fingrid 395.1 User groups of asset condition information . . . . . . . . . . . . . . . 395.2 Data sources . . . . . . . . . . . . . . . . . . . . . . . . . . . . . . . . 415.3 Asset hierarchy . . . . . . . . . . . . . . . . . . . . . . . . . . . . . . 435.4 Dashboard levels . . . . . . . . . . . . . . . . . . . . . . . . . . . . . 455.5 Performance quantities of switchgear . . . . . . . . . . . . . . . . . . 465.6 Switchgear data visualization . . . . . . . . . . . . . . . . . . . . . . 495.7 Power transformer data visualization . . . . . . . . . . . . . . . . . . 605.8 Substation building data visualization . . . . . . . . . . . . . . . . . . 685.9 Asset health and risk assessment . . . . . . . . . . . . . . . . . . . . 695.10 Summary dashboards . . . . . . . . . . . . . . . . . . . . . . . . . . . 745.11 Alarm functionalities . . . . . . . . . . . . . . . . . . . . . . . . . . . 775.12 Mobile application . . . . . . . . . . . . . . . . . . . . . . . . . . . . 79

vi
6 Conclusions and further work 806.1 Conclusions . . . . . . . . . . . . . . . . . . . . . . . . . . . . . . . . 806.2 Further work . . . . . . . . . . . . . . . . . . . . . . . . . . . . . . . 81
7 Summary 82
References 83
A Fingrid’s substation condition data 90
B Specifications for condition data visualization 91
C Dashboard for performance values from online switchgear inspec-tion 94

vii
AbbreviationsAC Alternating CurrentAI Artificial IntelligenceAIS Air-Insulated SwitchgearAPM Asset Performance ManagementBI Business IntelligenceCIC Customer Interruption CostsDB DatabaseDBFS Databricks File SystemDC Direct CurrentEAM Enterprise Asset ManagementFOCS Fiber optic current sensorGIS Gas-Insulated SwitchgearGW GatewayGPRS General Packet Radio ServiceHMI Human-Machine InterfaceHVDC High Voltage Direct CurrentIED Intelligent Electronic DeviceIoT Internet of ThingsLAN Local Area NetworkLoRaWAN Long Range Wide Area NetworkMPLS Multiprotocol Label SwitchingMPLS-TP Multiprotocol Label Switching - Transport ProfileMSM Modular Switchgear MonitoringOLTC On-Load Tap ChangerPD Partial DischargeQR Quick ResponseRFI Radio-Frequency InterferenceRMS Root Mean SquareSCADA Supervisory Control And Data AcquisitionSF6 Sulfur HexafluorideSFRA Sweep Frequency Response AnalysisTDCG Total Dissolved Combustible GasesTSO Transmission System OperatorUI User InterfaceWiFi Technology for wireless local area networking of devicesWTI Winding Temperature Indicator

1 Introduction
1.1 BackgroundFingrid is the Transmission System Operator (TSO) of Finland. It operates at voltagelevels of 400 kV, 220 kV, and 110 kV. Fingrid’s asset fleet consists of over 14 000kilometers of transmission lines and more than 100 substations. Fingrid manages itsassets aiming to provide reliable and cost-effective electricity transmission betweenproduction facilities and distribution networks.
Failures of the high voltage primary equipment in electricity transmission substa-tions are relatively rare but one may result in high costs and in a significant impact onthe electricity supply. Thus, a preventive maintenance strategy is preferred, meaningthat the equipment is overhauled prior to a failure. Until now it has been mostlytime-based maintenance which refers to maintenance actions executed at pre-definedregular time intervals. Occasionally this results in unnecessary maintenance actionsfor healthy assets. Respectively, emerging faults may not be detected in time becauseof long maintenance periods. This may lead to equipment failures.
Equipment in high voltage substations is expensive assets of a long lifecycle.Fingrid’s substations are designed for a lifespan of 40 years. A long asset renewalcycle leads to slow penetration of new technologies. Accordingly, no major reformationof asset maintenance techniques has taken place during the past decades. In themodern World changes are fast and considering a major challenge, the climatechange, there is a demand for rapid actions. As a part of the energy sector, electricitytransmission plays a major role in climate change mitigation. It is time to revise theasset maintenance techniques and take them to a new level in terms of cost-efficiencyand equipment reliability. To respond to the challenge, Fingrid is currently makingthe transition from time-based maintenance to condition-based maintenance.
It is cost-effective to overhaul equipment only when it is technically necessary.Preventive maintenance based on asset condition optimizes the lifecycle of an asset.The implementation of the condition-based maintenance technique requires up-to-date information on asset condition. [1] Current time-based substation inspectionsdispatched by service personnel don’t provide frequent enough data. Online conditionmonitoring is not a recent innovation but it is still at a primitive level in electricitytransmission. Online condition monitoring solutions are necessary to provide real-timecondition data for preventive maintenance decision-making.
"The upcoming five years will bring more change in terms of maintenance thanthe previous 50 because of digitalization," stated Marcus Stenstrand, Fingrid’sDigitalization Manager [2]. Fingrid is running a project "Digital Substation". Asa part of it, Fingrid is developing an Internet of Things (IoT) concept for onlineasset condition monitoring. Using low-cost sensor technology, commercial cloudservices and edge computing, the IoT system is completely separated from theLocal Area Network (LAN) of a substation, referring to the critical substationcontrol environment. Measurement data is transferred to the cloud to be analysedand visualized. The main idea behind this approach is low-cost retrofitting in oldsubstations and thus completing the transition to condition-based maintenance in a

2
timespan of years instead of several decades.The asset condition data needs to be efficiently visualized. Pinpointing outliers,
detecting alarming trends and assessing the overall health of asset groups is essen-tial regarding efficient maintenance decision-making. This thesis will specify therequirements of an Asset Performance Management (APM) application in terms ofasset condition data visualization. It will allow Fingrid to evaluate the feasibility ofcommercially available products or to implement a custom solution.
1.2 Objective of the ThesisThe objective of this Thesis is to specify requirements for asset condition datavisualization in an Asset Performance Management (APM) application. It is ageneral term of an application that is dedicated for condition data visualization andhealth assessment of industrial assets. There are competing commercial productsavailable that are at early stages of development. To evaluate the feasibility of anAPM application it is necessary to figure out first what kind of functionalities arerequired to meet the user’s needs. This Thesis is made for Fingrid but it will beuseful also for other electricity transmission companies willing to improve their assetcondition management and online condition monitoring. The emphasis of this Thesisis on visualization of switchgear and power transformer condition data. Successfullydesigned dashboards in an APM application allow efficient usability and data-baseddecision-making in asset condition management. Some other relevant functionalitiesare studied, too. Important aspects are for example alarm functionalities, asset riskassessment and integration of multiple data sources.
An important objective of this Thesis is also to document Fingrid’s IoT conceptand involved online measurement solutions as well as existing condition monitoringpractices. Globally, IoT is a new developing trend at its early stages in onlinecondition monitoring of industrial assets. Fingrid’s development of an IoT concept forswitchgear is pioneering work in the field of power systems. In general, digitalizationis currently a hot topic in heavy industry.
The nature of substation maintenance and the motives behind Fingrid’s IoTconcept have to be understood in order to succeed in specifying the requirements ofcondition data visualization. Thus, these topics are discussed in the beginning.
Chapter 1 is an introduction providing background for this Thesis. In Chapter2 asset maintenance and condition monitoring are discussed in general. Chapter 3introduces a digital high voltage substation and Fingrid’s IoT concept for onlineasset condition monitoring. Chapter 4 reviews condition monitoring solutions andpractices of different asset types, including new IoT solutions and existing conventionalsolutions. The focus is on condition data acquisition. In Chapter 5, visualizationof the new IoT condition monitoring data is planned and necessary elements of theexisting data visualization solutions are specified. Other essential functionalities ofan APM application are specified, too. Finally, Chapter 6 concludes the study. Inaddition, specifications of condition data visualization in an APM application forFingrid are summarized in Appendix B.
3
2 Substation Asset Condition Management
2.1 Maintenance strategiesMaintenance is defined as a set of activities or tasks used to restore an item to astate in which it can perform its designated functions. It can be classified into twomain strategies: Corrective Maintenance and Preventive Maintenance. Correctivemaintenance is reacting to an equipment failure once it has happened. This resultsin equipment downtime and costs of repair or replacement. Preventive maintenanceinvolves performance of maintenance actions prior to an equipment failure. Preventivemaintenance reduces the failure rate, failure costs and equipment downtime. [1]
The equipment in electricity transmission substations are expensive assets of along lifecycle. Fingrid’s substations are designed for a lifespan of 40 years. Failuresare relatively rare but one may result in high costs and in a significant impact onthe electricity supply. In case of the power system, the downtime is an importantquantity to be minimized from the end-user’s point of view. An equipment failure mayalso lead to destruction of the equipment and further damages to other equipment,whereas reasonable maintenance activities might have extended the lifespan of theequipment for even decades. Thus, regarding both aspects, transmission systemreliability and cost efficiency, preventive maintenance is preferable over correctivemaintenance.
Time-Based Maintenance is the preventive maintenance technique traditionallyused for electricity transmission equipment. Fingrid’s substations are visually in-spected several times in a year. Maintenance actions are performed according to thedetected defects such as oil leakages or fragmented insulators. [3] Equipment-specificmeasurements and periodic maintenance are performed at pre-defined time intervals,regardless of equipment condition. The time intervals depend on the asset model,varying between several years and two decades for example in case of the switchgear.[4],[5]. However, a Master’s Thesis conducted in 2007 concluded that Fingrid’sswitchgear is mainly in a good condition at the end of the maintenance period [3].Time-based maintenance inevitably results in unnecessary maintenance actions forhealthy assets. Respectively, emerging faults may not be detected in time because oflong maintenance periods. This may lead to equipment failures.
Condition-Based Maintenance is preventive maintenance based on asset condition.It is cost-effective to overhaul equipment only when it is technically necessary. [1]Fingrid’s primary equipment is mostly under a light load in respect of the loadabilitylimits whereas in many countries the transmission network is heavily loaded. TheNordic weather conditions are harsh and the equipment must be able to operate atlow temperatures, even at -50 degrees Celsius. The operations count of a circuitbreaker switching a regulating shunt reactor is multiple compared to one switchinga transmission line [3]. These are examples of factors that contribute to the assetlifecycle. It is not possible to determine an optimal asset renewal time or maintenanceperiod by default which would apply even to all assets of an equal model. Therefore thekey to improve the lifecycle optimization of an asset is condition-based maintenance.
In condition-based maintenance, the decision-making is based on information on

4
asset condition [1]. The four key steps of the condition-based maintenance strategyare presented in Figure 1.
Figure 1: Four steps of the Condition-Based Maintenance strategy. Modified from[6].
In 99 per cent of equipment failures cases in industrial applications, certainindications occur prior to a failure [1]. To detect these indications, which may beeither of a short-term nature or longer-term trends, appropriate condition monitoringsolutions are required. Thus the first step of the process is condition data acquisition.The second step is data processing. The raw data must be analysed in order to revealphenomena that might be indications of emerging faults [6]. The third step, datavisualization, is the tool that a maintenance specialist uses for the final step, thedecision-making. Efficient decisions to allocate maintenance actions can be madeaccording to the data only if the data is visualized in a manner that clearly highlightsall the relevant information included in the data.
The condition-based maintenance technique is already used in some industries,for example in elevator industry and forestry [7], [8]. It has been discussed sincea long time in electricity transmission, too, but it has never been comprehensivelyimplemented [3]. The challenge is the lack of real-time visibility to asset condition,in other words condition monitoring. More accurately the root cause is the first stepin Figure 1, data acquisition. Conventional high-voltage equipment is mostly notequipped with sensors for condition monitoring.
Fingrid is currently making the transition from conventional time-based main-tenance to condition-based maintenance. To overcome the challenge of conditionmonitoring, Fingrid is developing an IoT concept which is introduced in Section 3.2.First, condition monitoring is briefly discussed in general.
2.2 Condition monitoringCondition monitoring is a process which intends to indicate the actual state of anasset. It collects condition data that reveals equipment failure mechanisms anddeterioration patterns. Condition monitoring can be either online or offline. Onlinemonitoring takes place while the monitored equipment is operating whereas offlinemonitoring is carried out when the equipment is not in use. [1]
Electricity transmission equipment is operating all the time and outages arebasically avoided. Therefore, the focus must be on online monitoring. However,current online monitoring methods for high voltage equipment are quite limited. Themost expensive single component of a high voltage substation is a power transformer
5
which is worth several millions of euros. They are equipped with real-time onlinecondition monitoring systems, measuring oil and winding temperatures and analysingdissolved gases. In the switchyard, the only online condition monitoring feature isgas pressure monitoring of SF6 (Sulfur Hexafluoride) circuit breakers. Old circuitbreakers are only equipped with low pressure alarm systems that cannot provideactual monitoring data.
General inspections are performed in a substation several times in a year. [4]For switchgear, offline measurements are performed at time intervals of 8-10 years.Some circuit breakers can be test-operated online at a time interval of 5 years butall measurements cannot be performed online. The online inspections require aconsiderable number of work hours even though it is more efficient than an offlineinspection. [9] In conclusion, manual work is currently needed frequently and onlythe most critical processes are automatically monitored online.
In industrial applications the challenge with continuous online monitoring is oftenthe cost of special monitoring devices and solutions [1]. This is the case for a TSO asthe number of monitored equipment would be high. For example Fingrid has morethan 10 000 high voltage primary equipment in unmanned substations spread allover the country [10]. Technically, online condition monitoring of switchgear andinstrument transformers could have been already implemented. In addition to thecosts, another inconvenience of a conventional solution would have been extensiveamount of cabling required across a switchyard. Thus, a wireless online conditionmonitoring concept is needed and the main priority is low-cost scalability.

6
3 Digitalization
3.1 Digital substationSubsystems and components of electricity transmission substations have been grad-ually digitalized over time. Figure 2 shows a simple illustration of the differencebetween a digital and a conventional substation. Data communications in a substa-tion have been changed from manufacturer-specific hard-wired communication tobuses using communication protocols standardized in the international standard IEC61850.
Figure 2: Fingrid’s illustration about the difference between a conventional and adigital substation in terms of data communications design. [11]
Station level refers to the communication between protection relays and otherautomation systems in the substation building. Process level refers to the communi-cation between primary equipment and secondary equipment, in other words betweenthe outdoor switchyard and the substation building. [12]
Because of the long lifespan of a substation, Fingrid’s substations are at differentstages of digitalization. Figure 3 presents more detailed illustrations of the substationevolution from conventional to digital. Fingrid’s substations are similar to theconventional design or the modern design of Figure 3, or a combination of both [13].Old substations still have hard-wired systems in the station level whereas systems inmodern substations communicate using IEC 61850 station buses [13].
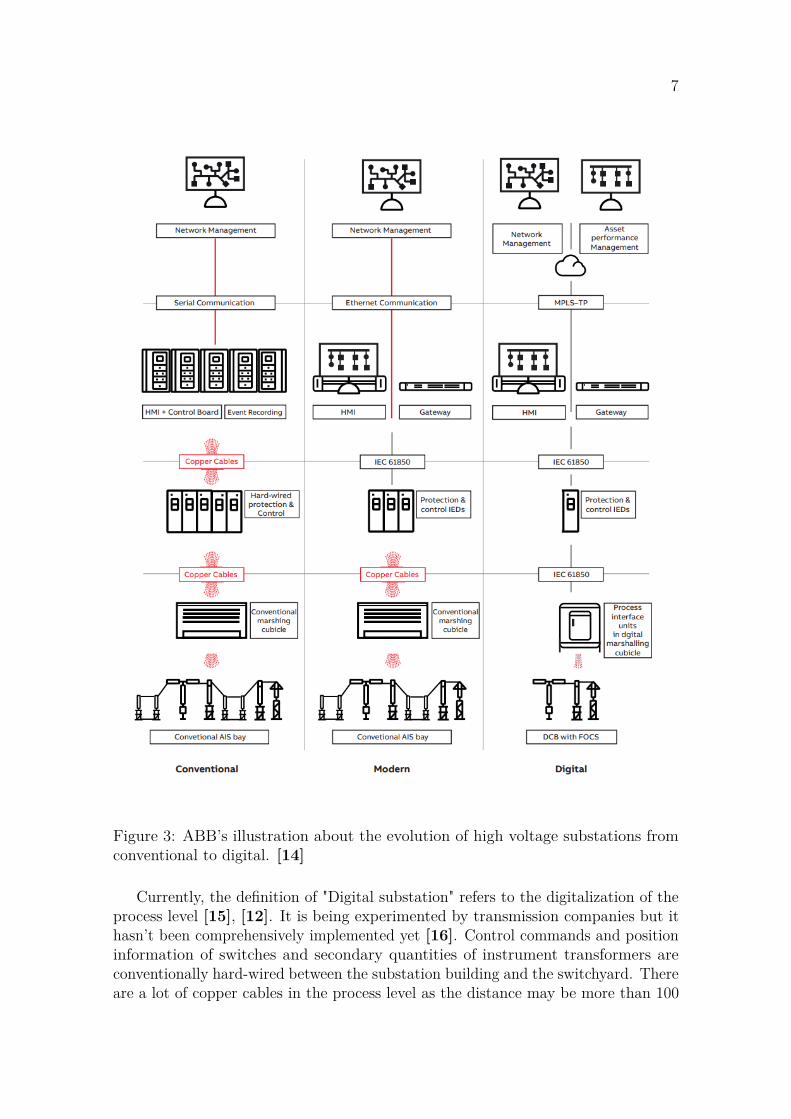
7
Figure 3: ABB’s illustration about the evolution of high voltage substations fromconventional to digital. [14]
Currently, the definition of "Digital substation" refers to the digitalization of theprocess level [15], [12]. It is being experimented by transmission companies but ithasn’t been comprehensively implemented yet [16]. Control commands and positioninformation of switches and secondary quantities of instrument transformers areconventionally hard-wired between the substation building and the switchyard. Thereare a lot of copper cables in the process level as the distance may be more than 100
8
meters in a high voltage substation. A digital process bus connects the switchyardand the secondary equipment via fiber optics. Intelligent Electronic Devices (IED)in the marshalling cabinet of each bay are the interface between the process bus andthe primary equipment. According to IEC 61850, the process bus and the stationbus shall be separated. [12]
Fingrid is currently running a project called "Digital substation" which consistsof digitalization of two 110 kV bays in Pernoonkoski substation. It is a pilot projectin order to gain experience of new digital substation technology. Thus, a digitalprocess bus is implemented in parallel with the conventional hard-wired system.Control and protection functions are primarily operated in the conventional systemto avoid possible unexpected malfunctions. Circuit breaker tripping commands willbe monitored in the digital process bus to ensure appropriate operation of the newsystem regarding protection.
Another special feature in the project is the experiment with optical currenttransformers. They are connected in series with the conventional ones, with asimilar idea to the digital process bus parallel with a conventional hard-wired system.There are several benefits which make an optical current transformer superior to aconventional one. Firstly, there is no insulation oil or gas which eliminates the riskof an environmental damage. A fault in a conventional current transformer may alsoincrease the oil temperature and pressure, possibly resulting in an explosion. It canno longer occur with optical current transformers. An improvement from functionalpoint of view is that magnetic saturation followed by protection misoperation cannotoccur due to the optical technology. Physically, an optical current transformer ismore compact. Concerning work safety, there is no secondary circuit to induce adangerous open circuit voltage. [17], [18]
In general, primary equipment compatible with a digital process bus will beable to communicate a lot of data to the substation building and to cloud. Onlinecondition monitoring can be a built-in feature in a digital substation in the futurewhereas the currently developed IoT concept presented in Section 3.2 is designed forretrofitting to existing primary equipment.
The benefits and challenges of a digital substation according to Fingrid arepresented in Figures 4 and 5. This Chapter is only an introduction to digitalizationand digital substation is not further discussed in this Thesis.

9
Figure 4: Benefits of a digital substation [16]. Modified from [19], [20], [21], [22].
Figure 5: Challenges of a digital substation [16]. Modified from [23], [24], [25].

10
3.2 Internet of Things in Asset Condition Management
Internet of ThingsThere is no established and clear definition for Internet of Things (IoT). Despite itsmeaning to private consumers and industrial business may be different, the core ideais to bring together the physical and digital worlds. [20] IoT is a network whichenables physical objects to connect, collect data and exchange data [26].
Figure 6: The three interconnected "worlds" of IoT. [20]
Figure 6 presents the three interconnected "worlds" of IoT. A physical object,a product, has a unique digital identifier linking it to digital information thatrepresents the location, the condition and the properties of the object. Sensorsmeasure physical phenomena and communicate the collected information to bedigitally stored. Remotely controlled actuators will physically affect the real worldaccording to algorithms making use of collected data. [20] There is nothing newin any of these three aspects in itself, but IoT enables efficient up-scaling of theircombination [27], [20]. The number of connected devices in 2020 is estimated to be50 billion. [20]
In industry, the disruption of business models originated from IoT will remarkablyenhance productivity. From this point of view, a definition of IoT could be as follows:

11
"The Internet of Things is a digital representation of the real world, enabling pro-ductivity enhancement through optimal use of real-world assets." [20] An electricitytransmission company does not produce a physical product. Instead, productivity isefficiency of the activities such as asset management. A step towards the "Optimaluse of real-world assets" is the condition-based asset maintenance technique discussedin Chapter 2.
Fingrid’s Internet of Things conceptFingrid is developing an online condition monitoring system in an IoT platform.Figure 7 illustrates the system that covers the first three steps of Figure 1 in Chapter2, from Data Acquisition to Data Visualization.
Figure 7: Fingrid’s IoT concept. [11]
Referring to the first step of Figure 1, substation assets are being equipped withsensor units developed in cooperation with external partners specialized in meter-ing. Current, temperature, humidity and vibration sensors, microphones, thermalcameras, etc. are used. The sensor units measuring the primary equipment is in-stalled in switchgear control cabinets, bay marshalling cabinets and directly attachedto the external surface of the equipment. Measurements are either continuous orevent-based, depending on the nature of the measured phenomenon. For exam-ple temperature measurement is continuous whereas microphones record distinctoperations of switchgear.
Regarding the high voltage primary equipment, the focus is primarily on switchgear,the largest asset group in number of equipment. Switches consist of moving mechani-cal parts that wear out over time. Each operation of a circuit breaker or a switchis recorded by using multiple sensor technologies. The measurement data of eachsensor unit is transferred wirelessly to a router or a gateway for further transfer to acommercial cloud service. WiFi and Long Range Wide Area Network (LoRaWAN)are experimented as wireless communication technologies between the sensor unitsand the gateways. 4G mobile network is used for the cloud transfer.

12
Fingrid’s IoT platform is built on Microsoft Azure cloud service. It is a cloudplatform with a great number of optional components that the user can include inits solution and customize for its needs [28]. The current architecture of Fingrid’sIoT platform is presented in Figure 8.
Figure 8: The current architecture of Fingrid’s IoT platform.
The sensor data is received by an "IoT Hub" component. "BLOB Storage" and"SQL DB" are data storages, each having different capabilities in terms of real-timeaccessibility and supported data formats [28]. The component "Function" offerserverless computing resources for custom programs that can be coded by the user,for example for data processing and transfer in this case [28]. As the second stepof Figure 1, the sensor data is processed and analysed in the cloud by customalgorithms to reveal the phenomena that will be visualized. For example start andend timestamps of event phenomena like switchgear operations can be obtained froma sound spectrogram to quantify the time duration of the event.
Databricks is an Apache Spark -based analytics service. It takes programs writtenin high-level languages, distribute the execution onto many machines and optimizesthe usage of databases. [29] Databricks is used in Fingrid’s IoT platform to allowfast data processing.
The third step of Figure 1, Data Visualization, will be implemented using anAsset Performance Management (APM) application which is the User Interface (UI)to asset condition monitoring, asset health assessment and asset risk assessment.All Fingrid’s sources of condition monitoring data, including the new IoT platform,existing online monitoring systems and existing offline measurement databases, will

13
be integrated to an APM application. Additional value of condition data is gainedby combining data from many sources [20]. By using an APM application, gridmaintenance responsibles will be able to comprehensively monitor and evaluate thecondition of the asset fleet. In Figure 8, the section "UI" represents the componentfor data visualization that can be an APM application or a custom solution. Acustom solution could make use of a Business Intelligence (BI) reporting applicationsuch as Microsoft Power BI.
An important element of IoT is "Edge". Edge computing is defined as performingcomputation on device nodes that are usually geographically distributed [30]. It isalso the idea of another current hot topic, the Blockchains [31]. In IoT, edge is theendpoints where sensors measure the physical world [32]. IoT edge is illustrated inFigure 9.
Figure 9: IoT Edge in a complete IoT system. [32]
Computing, meaning data processing and analysis in this case, could be performedin a substation gateway instead of the cloud platform. This is something that willprobably be experimented later in the IoT project. For the time being however,the edge is used for the remote management of the IoT devices. Only a bay in aswitchyard will be equipped with a few dozens of sensor units. The number of baysin Fingrid’s substation ranges from a few to a few dozens. The resulting number ofdevices in the entire IoT system will be in a scale of thousands. The managementof software updates, device drivers, and sensor settings needs to be performed inan efficient way. It is currently being studied what kind of a remote managementsolution for IoT devices would be appropriate and cost-efficient. "Azure IoT Edge"component could be used but there are also systems available outside Fingrid’s IoTplatform that could manage the operating systems of IoT devices [33], [34].
The key elements of the conceptThe ultimate goal is to create a low-cost IoT concept for condition monitoring in orderto improve the cost-efficiency of asset management. The key elements of Fingrid’sIoT concept are listed below and explained in this subsection.
• Low-cost sensor technology available.
• IoT platform built on a commercial cloud service by using available components.

14
• Private platform combining promising solutions of different providers.
• IoT platform isolated from substation LAN to ensure information security.
• Retrofitting of IoT sensor units into existing substation equipment.
• Quick online installation and commissioning of a large number of IoT sensorunits.
Sensor technology and cloud services have evolved rapidly. There are a lotof low-cost sensors available and several giant IT companies are competing in cloudservice business. There are companies, including startups, that are specialized insensors and metering. Data analytics is a vast market today and there is a growingnumber of asset performance management tools available, too. A wide range of newinteresting products are being developed in these fields. IoT business is at earlystages especially in electricity transmission, meaning that the leading manufacturersin the field don’t have yet a lot of finished products in their catalogues. Thus,the development of an efficient IoT concept requires an open-minded approach andability to involve numerous parties in the project. It is essential to combine themost promising innovations of different providers instead of relying on a single majorservice provider. Technical limitations due to manufacturer dependency has to beavoided. It has proved to be a challenge that major manufacturers aim to providea complete IoT service including sensors, a cloud platform and data management.Besides being expensive, this idea is not compatible with Fingrid’s concept of aprivate platform combining competitive solutions of different parties.
Information security plays a major role in the IT architecture of power systems.Crucial information for power system control is transferred in Fingrid’s privatetelecommunications network basically consisting of fiber optic cables all around thecountry. This network must be kept secure and reliable. Commercial cloud servicesand common wireless communication technologies offer efficient and flexible solutionsfor data management and transfer but they are more vulnerable to informationsecurity threats. One of the most important characteristics of Fingrid’s IoT conceptin Figure 2 is the isolation from the substation LAN. To ensure security, conditiondata is not transferred in the same channels with crucial control data and the IoTplatform is not connected to the SCADA (Supervisory Control And Data Acquisition)environment where the power system is controlled. In the worst case, manipulationof condition data could lead to unnecessary planned outages as equipment indicatinga false emerging fault would be disconnected from the primary circuit. However, thescenario is unlikely because credible manipulation of condition data requires a majoreffort and solid professional knowledge of high voltage equipment.
Retrofitting is another fundamental driving force for Fingrid’s IoT concept.Fingrid’s substations are designed for a lifespan of 40 years. There are conditionmonitoring features available for switchgear in the market today, but the asset renewalcycle being very long, new technologies will penetrate into the asset fleet slowly. Thetransition from time-based maintenance to condition-based maintenance is realisticin a timespan of years only provided that the existing equipment can be efficientlyretrofitted with an online condition monitoring system.
15
A quick on-site installation and commissioning routine for the monitoringequipment is being designed. Hall-effect current sensor clamps, electret and contactmicrophones, temperature sensors with adhesive, etc. make the battery-poweredsensor units a completely external setup in respect of the primary equipment itself.The installation is quick and it is supposed to be performed online, without anoutage of the primary circuit. A custom mobile application making use of QR(Quick Response) codes is developed for managing the commissioning of the sensorunits that need to be mapped to corresponding primary equipment. To make theIoT concept cost-efficient, a lot of effort is put into the implementation of an easycommissioning and maintenance routine. In addition, thousands of new devicesin the power system are a major concern regarding their maintenance over time.Allocation of maintenance actions based on asset condition and possible reductionin the number of equipment failures improve cost-efficiency. It is however essentialto ensure that this improvement is not negatively compensated by the maintenanceload of the new monitoring equipment. Quick installation of low-cost sensor units atcommissioning leads to cost-efficient maintenance in the way that the replacement ofunits is cheap, too, regarding required work hours and costs of the physical product.
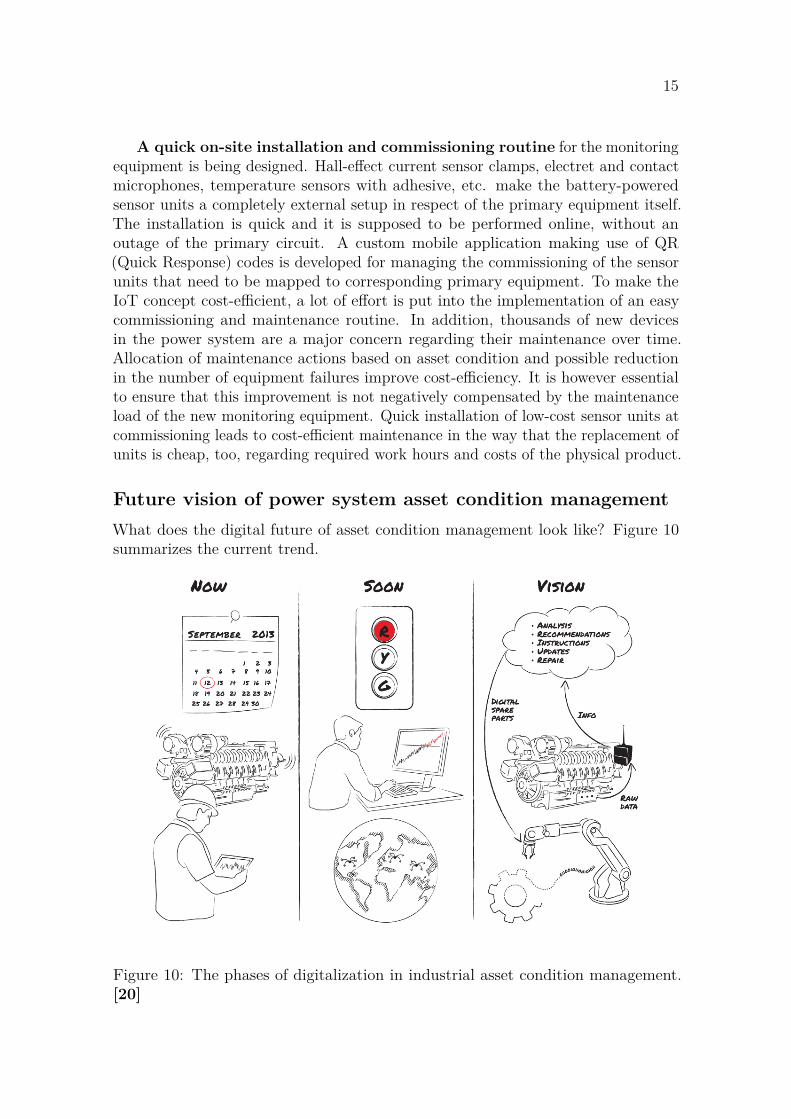
Future vision of power system asset condition managementWhat does the digital future of asset condition management look like? Figure 10summarizes the current trend.
Figure 10: The phases of digitalization in industrial asset condition management.[20]
16
In electricity transmission, the next step is the ability to remotely monitorthe geographically distributed asset fleet and reveal indications of emerging faults.Service personnel is deployed to perform maintenance to equipment of alarmingcondition, instead of time-based inspections and maintenance. A long term visioncould incorporate robotics and Artificial Intelligence (AI) for automatic maintenance.3D printing or similar small-scale manufacturing technologies could be used for quicklocal production of spare parts [20].
What are the benefits Fingrid is aiming to gain with the IoT concept and onlinecondition monitoring? The following list of aspects are answers to this question.
• Real-time visibility to asset condition.
• Efficient allocation of maintenance work hours and reduction of time-basedmaintenance costs.
• Less planned outages.
• Improved work safety in substations.
Real-time visibility to asset condition allows efficient maintenance planning,as it was discussed in Chapter 2. Work hours form a major portion of maintenancecosts. Cutting out unnecessary time-based work on site, which may be at a remotelocation, will bring savings.
Another main benefit of real-time visibility to asset condition is presented in thecolumn "Soon" in Figure 10. The ability to detect and prevent a fault is stronglylinked to cost-efficiency, too. Besides social impacts, a network disturbance due to anequipment failure may cause significant losses to the society in a short time. A currenttransformer failure in summer 2018 incurred costs of more than 5 million euros toFingrid, mostly because of reserve power production and countertrade [35]. Thecosts were very high even though the power supply of customers was not interrupted.Prevention of even one or a few such failures would save a TSO costs that may bewell more than the cost of implementing an efficient online condition monitoringsystem.
The third benefit of real-time visibility to asset condition is optimization of assetlifecycle. At the end of the predicted substation lifespan, a major refurbishmentis performed in case the substation is still necessary in the transmission network.Primary and secondary equipment is mostly replaced, depending on the situation andon the age of equipment. Fingrid has more than 100 substations which sometimesleads to a situation where multiple major refurbishment projects are scheduled tooverlap. With limited work resources, projects have to be prioritized. Up-to-dateinformation on asset condition enhances the decision-making and lowers the risk ofequipment failures when the priorities of refurbishment projects are scheduled basedon asset condition.
Reduction of planned outages is an obvious benefit gained by cutting downtime-based maintenance. In a normal state, the synchronous transmission system isable to withstand a failure of any single component without collapsing. Equipment

17
downtime, however, reduces transmission capacity and redundancy and thus makesthe transmission system slightly more vulnerable to faults.
Work safety will be improved simply by reducing manual work at substations.Continuous online measurements of switchgear will replace some manual measure-ments which are conventionally performed when switchgear is test-operated. Currentmeasurements inside switchgear control cabinets require physical connection of themeasurement instrument. Online connections are a risk in general but especially anunintentionally opened secondary circuit of an online conventional current transformerexposes the service personnel to a real hazard [36]. Connections will be no longernecessary when test-operations are recorded online using permanently connected IoTsensor units.

18
4 Fingrid’s Condition Monitoring SolutionsSo far Fingrid has been using online condition monitoring for power transformers andSF6 gas in circuit breakers and in Gas-Insulated Switchgear (GIS) substations. Thenew IoT concept widely extends monitoring to other characteristics of switchgear.Substation buildings will be equipped with IoT sensors and solutions for other primaryequipment will be also developed. Conventional offline measurements and inspectionshave been producing condition data for decades.
This Chapter presents Fingrid’s condition monitoring solutions including the newIoT sensor units, existing online monitoring and existing offline measurements.
4.1 SwitchgearSwitchgear is Fingrid’s largest group of primary assets consisting approximately of 8500 operating 3-phase equipment [10]. In this Thesis, the term "switchgear" refers tocircuit breakers, disconnectors and earthing switches. The term "switch" refers onlyto disconnectors and earthing switches. The ten-year average number of major faultsin air-insulated switchgear is 17 in a year and correspondingly 236,8 in case of minorfaults. 4,8 network disturbances in a year are caused by switchgear failures. [37]
Existing online condition monitoringMost of Fingrid’s 1200 air-insulated circuit breakers are SF6 breakers. The remaining140 minimum oil breakers will be replaced in 5 years. [38] SF6 is a dielectric gas usedfor arc-quenching in circuit breakers and as an insulation medium in GIS. A circuitbreaker is no longer able to operate if the gas pressure drops below a critical level.[39] SF6 is also a greenhouse gas with high global warming potential [40]. Thus, itis important to repair leakages as soon as possible. Continuous online monitoringallows early detection of leakages.
All of Fingrid’s SF6 circuit breakers are equipped with a conventional gas densitymonitor with a pointer gauge. An example is presented in Figure 11.
Figure 11: SF6 gas density monitor. [41]

19
A gas density monitor includes a built-in low-pressure alarm feature. When thegas density drops below an alarm level, contacts in the density monitor change thestate to trigger an alarm to SCADA. The locking level is the minimum gas densityrequired for a switching operation. At the locking level, in addition to triggeringan alarm, the circuit breaker locks itself by cutting the control circuit in order toprevent operations. [9]
Fingrid’s modern SF6 circuit breakers are additionally equipped with gas densitysensors. The gas density information is communicated in an analogue milliamperesignal hard-wired to the substation LAN and further to the SCADA environment.Gas pressure is calculated from density at +20 C temperature. [9] Alarms are set toindicate a short-term drop of pressure and a long-term downtrend [42].
Otherwise, no more online monitoring exists for switchgear. Equipment perfor-mance in online operations is not monitored except in the online inspection routinewhich is explained later in this Section.
Offline inspectionsAt a time interval of 8-10 years, an outage is performed for on-site inspection andperformance testing of switchgear. Measurement instruments are manually connectedto primary and secondary circuits of switchgear. A current generator is connectedto the primary contacts of a circuit breaker. [9] Operational values, such as motoroperation time, motor current, circuit breaker operation time, circuit breaker coilcurrent profiles and etc., are measured while the switchgear is test-operated in anoffline state [10],[9]. Alignment and smooth operation of moving mechanical partsare visually inspected. As for static measurements, resistances of primary contactsare measured under a load of 300 A. The measurements are listed in detail inappendix A. The measured values are entered in an Enterprise Asset Management(EAM) database. Work orders for actual maintenance are created in the EAM if themeasurements indicate degraded performance. [9]
Online inspection routineFingrid has created an online inspection routine which allows switchgear performancetesting without an outage. It can be performed in Fingrid’s typical substations wherethe busbar configuration allows closing another connection for the primary currentin parallel with the circuit breaker under inspection. [43] Figures 12 and 13 presenttypical 400 kV and 110 kV busbar configurations in Fingrid’s substations.

20
Figure 12: A typical Fingrid’s 400 kV busbar configuration. [44]
Figure 13: A typical Fingrid’s 110 kV busbar configuration. [44]
One half of a 400 kV full duplex bay can be opened and test-operated once theother half is online and supplying the transmission line. In a 110 kV switchyard theby-pass circuit breaker AE09Q0 in Figure 13 can be closed in parallel with any othercircuit breaker. When a breaker is opened, the load current keeps flowing through theby-pass breaker to supply the transmission line. In addition to the circuit breakers,

21
most of the switches can be test-operated. Performance measurements are carriedout for circuit breakers. In order to minimize the working time and the durationof an exceptional state of a switchyard, appropriate operation of switches is onlyvisually verified by the service personnel. In case of some measurement quantities, likecontact resistance, online measurements are not possible neither for circuit breakersnor switches. [9]
The online inspection routine is performed bay by bay. It saves a lot of workingtime compared to the conventional offline inspection and thus allows more frequentinspections for this asset group. It is scheduled to be performed at a time interval of5 years. The offline inspections are accordingly reduced to be performed only oncein the equipment lifespan, meaning 20 years from commissioning. The switchgear towhich the online inspection routine cannot be applied is inspected as before. [9]
IoT solutionThe IoT solution for online switchgear monitoring is based on microphones andcurrent sensors connected to a sensor unit. The first version of the sensor unit wasdeveloped for 110 kV switchgear in collaboration with a Finnish company specializedin acoustic measurements. 68 units have been monitoring seven 110 kV bays of Kymisubstation in Southern Finland since December 2017. Figure 14 shows the sensorunit and the sensors.
Figure 14: The first version of the IoT sensor unit for switchgear and sensors to beconnected to the unit. [45]
The switchgear sensor unit has four acoustic inputs, a current input and an inputfor temperature and humidity. It is installed inside a switchgear control cabinet.

22
Figure 15 shows a disconnector control cabinet equipped with sensor units and sensors.Normally a control cabinet is equipped with one sensor unit but Figure 15 shows anadditional unit that was installed for experimental purposes.
Figure 15: Sensor units and sensors installed in a disconnector control cabinet. [46]
A hall-effect clamp sensor measures the charging motor current of a circuit breakeror the motor drive current of a switch. Contact microphones are installed on themotor and near the gear train. An electret air microphone records any airbornesound. Motor rpm, gear sound and circuit breaker damper sound are obtained fromsound recordings. Furthermore, all microphones can be used to detect deviations inthe mechanical operation of switchgear. It seems that different microphones detectsame sources of sound such as an arc in a switch. Thus, in the future developmentthe number of microphones may be reduced. In addition, temperature and humidityare measured inside the control cabinet. In the future this information could beused to control heating resistors inside the cabinet instead of built-in thermostats.Heating is required to keep the control mechanics dry and to prevent them fromfreezing in wintertime. Currently without any feedback in the heating system, it isunclear how well the conditions inside the cabinets are maintained.

23
The second version of the sensor unit was developed by another Finnish companyspecialized in industrial IoT solutions. Units were installed in Naantalinsalmi 110kV substation in Southwest Finland. The second version features additional currentchannels to measure circuit breaker control coil currents and auxiliary contacts suchas position indicator. The most important development is an additional sensor unitinstalled in the bay marshalling cabinet. Six current sensors measure secondarycurrents of each current transformer phase and currents in the three control coilsof circuit breaker. The sensor units are presented in Figure 16. The completemeasurement setup is presented in Figure 17.
Figure 16: The second version of the switchgear sensor unit on the left and theadditional sensor unit installed in a bay marshalling cabinet on the right. [46]
Figure 17: The IoT setup of switchgear at the sensor endpoint. Modified from [45],[47], [48], [49]

24
A control command to a circuit breaker energizes a control coil to mechanicallyrelease a spring that actuates the primary contacts [9]. Currents in the control coilcircuits are measured in both sensor units, in the switchgear control cabinet and inthe bay marshalling cabinet. The reason is that, when calculating a time durationbetween timestamps obtained from separate measurements, the measurements have tobe time-synchronized. The timestamp of a circuit breaker control command is used asthe start timestamp of several time-related performance quantities. This timestampis the moment in time when a control coil current starts rising and thus it is obtainedfrom the measurements of control coil currents. The end timestamp is obtained froma measurement taking place in the control cabinet or in the bay marshalling cabinet,depending on which time-related performance quantity is calculated. There is notime-synchronization between the sensor units installed in the control cabinet andin the bay marshalling cabinet. Duplicated measurements of control coil currentsallows utilization of the control command timestamp for many purposes.
Time-synchronization between the two sensor units would eliminate the needfor duplicated measurements of control coil currents. However, the duration of thephysical phenomena of interest are only dozens of milliseconds which would demandhigh accuracy of time-syncronization between the sensor units. Thus, the approachwith duplicated measurements is more simple and reliable.
The sensor units record each and every switchgear operation which is a majorimprovement in condition monitoring. However, excluding inspections high voltageswitchgear is operated rarely [50]. Normally data acquisition for condition monitoringwill be infrequent as switchgear may stay in an open or a closed position even foryears [50]. Thus, the real benefit is gained by combining IoT online monitoringand the principle of the online inspection. The online inspection routine can beperformed very efficiently when no external measurement instruments are required.Performance data flows automatically into the cloud while circuit breakers andswitches are quickly test-operated one by one. An objective is a near real-time mobileaccess to the measurement data which will instantly allow the service personnel tofurther diagnose a piece of equipment with alarming measurement values. The IoTplatform is being developed to allow fast data processing through the whole channelfrom sensor units to the cloud and finally to a visualization tool, all taking minutesin total.
In 2019, switchgear of eight 110 kV substations will be equipped with IoT sensorunits. The current version of sensor unit is designed for switchgear with a commoncontrol cabinet for all the three phases which, in case of Fingrid’s asset fleet, refers to110 kV and lower voltage switchgear [10]. 400 kV switchgear are basically equippedwith a separate control cabinet for each phase [10]. The difference is presented inFigure 18. A different design of IoT sensor unit is required for 400 kV switchgearbecause the sensor units in the three control cabinets have to be time-synchronized.Sensor units for 400 kV switchgear will be developed in the future.

25
Figure 18: Circuit breakers with a common control cabinet (left) and a separatecontrol cabinet (right). [47]
4.2 Gas-Insulated SwitchgearIn Air-Insulated Switchgear (AIS) SF6 gas is only used for arc-quenching inside acircuit breaker whereas Gas-Insulated Switchgear (GIS) are high voltage equipmentfully enclosed in SF6 gas compartments [51]. In Nordic weather conditions GISsubstations are built indoors [9]. The footprint of a GIS can be approximately 30 %of a corresponding AIS switchyard which makes GIS a good solution for urban areasand underground substations [51].
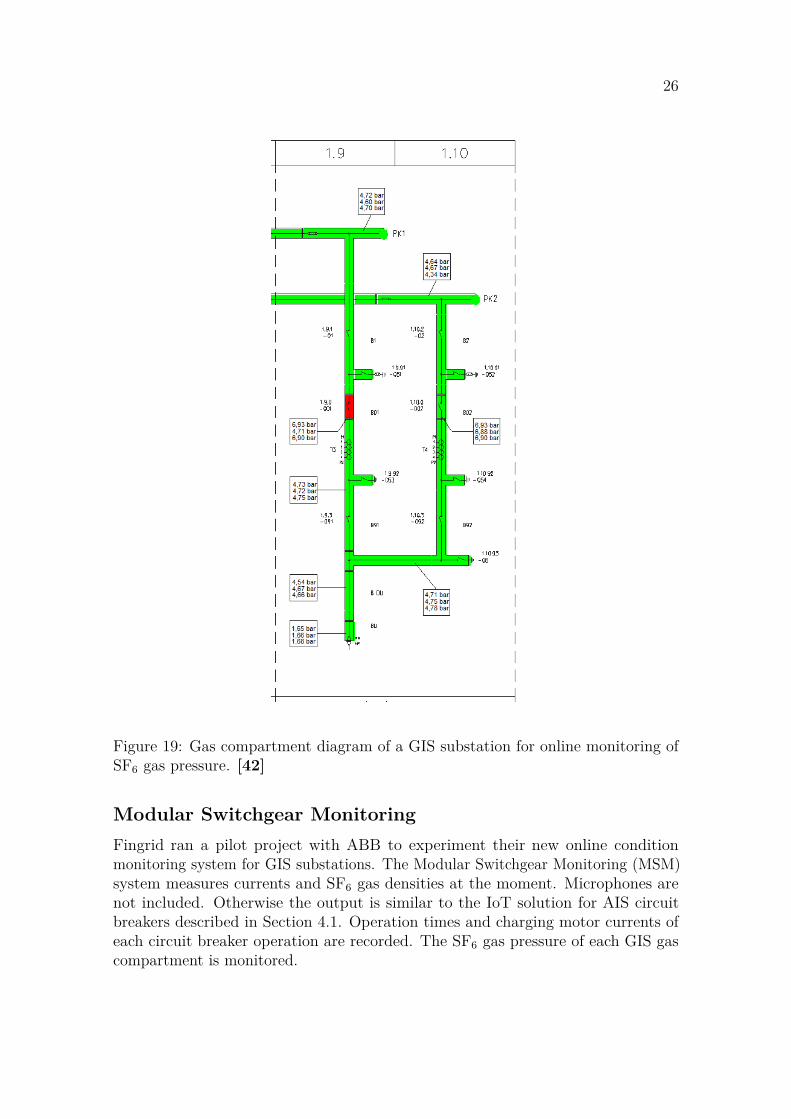
Existing online condition monitoringA GIS consists of a number of separate gas compartments. Gas density of eachcompartment is measured with the same sensors as in AIS circuit breakers. Corre-spondingly to AIS circuit breakers, the GIS gas pressure data is wired in substationLAN. Figure 19 presents a part of a GIS circuit diagram for online monitoring. Itshows there is a low pressure in one of the compartments which can be either due toa leakage or a sensor fault.
26
Figure 19: Gas compartment diagram of a GIS substation for online monitoring ofSF6 gas pressure. [42]
Modular Switchgear MonitoringFingrid ran a pilot project with ABB to experiment their new online conditionmonitoring system for GIS substations. The Modular Switchgear Monitoring (MSM)system measures currents and SF6 gas densities at the moment. Microphones arenot included. Otherwise the output is similar to the IoT solution for AIS circuitbreakers described in Section 4.1. Operation times and charging motor currents ofeach circuit breaker operation are recorded. The SF6 gas pressure of each GIS gascompartment is monitored.

27
Figure 20: The MSM system installed in a Local Control Cabinet of Länsisalmi 400kV GIS substation.
The MSM systems were installed in the Local Control Cabinets (LCC) of eachbay in Länsisalmi 400 kV GIS substation. Circuit breaker control circuits, currenttransformer secondary circuits and SF6 gas density sensors are hard-wired to theMSM modules. Current measurements are carried out by hall sensors inside theMSM modules. There is an edge gateway in the substation that communicates over aWiFi network with the MSM communication units. The gateway is connected to theMPLS (Multiprotocol Label Switching) switch of the substation for internet access.The data is transferred to "ABB Ability" cloud which is ABB’s cloud platform builton Microsoft Azure.
The objective of this project is to experiment the MSM as a new solution for GISonline condition monitoring. There are no current plans to extend this solution toother Fingrid’s existing GIS substations.
4.3 Power transformersBeing worth several millions of euros, a power transformer is the most expensivecomponent in a substation. A power transformer failure would be a major incidentfor several reasons. There are only one or two power transformers in a substationconnecting the voltage levels. Thus, a loss of one would significantly affect thetransmission capacity of the transmission network. An outage could take a long timeas the replacement of such a heavy unit is a major effort. Delivery times of power

28
transformers are also long because they are custom-made and shipping is slow. Inaddition, a fire in a power transformer may lead to severe environmental damage.There are approximately 100 000 kilograms of oil inside that can ignite or spread tonear surroundings [10].
Fingrid has 91 power transformers and in average they cause 4,1 network dis-turbances in a year [10], [37]. It is evident that condition monitoring of powertransformers is necessary. It has been learnt in practice, too, as Fingrid has managedto prevent several power transformer failures during the past 10 years due to onlinecondition monitoring [52]. There are well-established methods for condition moni-toring of power transformers but IoT can bring something new to the table. Thissection presents Fingrid’s condition monitoring practices for power transformers.
Dissolved Gas Analysis and Oil AnalysisDissolved Gas Analysis (DGA) is a well-established condition monitoring methodthat can detect multiple transformer fault types. Degradation of oil and paperinsulation inside a transformer produces different gases in the oil due to chemicalbreakdown of oil and cellulose molecules. [53], [54] Temperature at the fault locationand materials in contact with the fault area determine which gases are formed and towhat extent [54]. The fault type can be diagnosed by studying the ratios of differentfault gases dissolved in the oil. The seven commonly considered fault gases are listedbelow: [53], [54]
• Acetylene (C2H2)
• Carbon Dioxide (CO2)
• Carbon Monoxide (CO)
• Ethane (C2H6)
• Ethylene (C2H4)
• Hydrogen (H2)
• Methane (CH4)
Conventional DGA is performed by sampling the oil in a syringe and dispatchingit to a laboratory. A more advanced method to monitor gas formation is continuousonline DGA. There are single gas and multiple gas online monitoring equipmentavailable [55]. Single-gas equipment measure only hydrogen concentration whilemultiple-gas equipment can measure the three significant ones or even all the faultgases [55].
DGA is not exact science. In a laboratory analysis, the resulting gas concentrationmay vary even dozens of percent depending on the gas extraction procedure. [54] Onthe other hand, the continuous online DGA equipment is prone to faults and single-gasmonitoring cannot detect all types of transformer faults [52], [54]. The advantage

29
of continuous online DGA is the capability to monitor trends, meaning changesin fault gas formation [53]. Each power transformer is a custom-made individualunit with slightly different fault gas formation patterns. The absolute value of afault gas concentration may not be informative when it is low whereas changes in acontinuous trend most likely indicate an emerging fault. [38] Gas formation increasesalong with thermal stresses due to increasing load or temperature [53], [54]. Thus,short-term increase in gas formation may indicate an overloaded condition ratherthan deterioration of the transformer initiated by the transformer itself. Continuousonline DGA data should be considered in correlation with temperature and loading.[54]
The insulation properties of the oil itself can also be measured in a laboratoryanalysis. Dielectric breakdown strength, dissipation factor, interfacial tension, andsome other physical and chemical properties determine the condition of insulationoil [56].
Fingrid is using multi-gas analysers and single-gas analysers for continuous onlineDGA of power transformers [10]. Examples of the equipment is presented in Figure21.
Figure 21: Equipment for continuous online DGA. [10]
Annual laboratory analyses produce trend data that is monitored continuously.There are different scopes of laboratory analysis covering only DGA, oil breakdownstrength and DGA, or all the insulation properties of oil in addition to DGA. Theannual analysis is of a narrow scope whereas wider scope analyses are performedless frequently. Additional analyses can be performed on demand and transformerswith alarming fault gas formation behaviour are sampled more frequently. [38] Analternative for laboratory analysis is a transportable DGA instrument, presented inFigure 22. An oil sample is analysed on site in 30 minutes instead of dispatching itto a remote laboratory facility [55].

30
Figure 22: A transportable DGA instrument. [55]
Sweep Frequency Response AnalysisSweep Frequency Response Analysis (SFRA) is a sensitive analysis technique fordetecting mechanical faults in power transformer windings [57]. An impact intransport or a network fault close to the transformer may cause deformation ordisplacement of windings [52]. In order to detect these faults without opening thetransformer cover, sinusoidal voltages at different frequencies are applied to a terminalof an offline transformer. Amplitude and phase of induced signals obtained fromother terminals are recorded as a function of frequency. [57]
Frequency response of a power transformer is unique due to the fact that eachpower transformer is a custom-made unit. Local conditions and structures connectedto a power transformer also affect the frequency response. Thus, an SFRA fingerprintof each new power transformer is recorded after installation on site. Further SFRAis not performed frequently but in case there are suspicions of a possible damage,for example after an external short circuit fault close to the transformer. A newfingerprint is always recorded after an overhaul. [52]
Analysis and interpretation of SFRA data are difficult. High expertise is requiredas highly developed tools and guidelines do not exist yet. [57]
Dissipation factorDissipation factor, also known as "Tan Delta", is the dielectric loss angle of insulationunder an AC voltage. It is an efficient non-destructive method to measure conditionof solid insulation. However, the dielectric loss angle should not be confused withthe dielectric breakdown strength which cannot be measured without damaging

31
insulation. [58] Dissipation factor is measured offline. It is performed at a timeinterval of 9 years for power transformer windings and bushings [38].
Online condition monitoring solutions of power transformer bushings are alsoavailable [59], [60]. Such equipment estimate the dissipation factor as a result ofbushing leakage current measurements [60]. The equipment can also detect PartialDischarges (PD) inside the transformer tank [59], [60]. An experiment with onlinemonitoring of power transformer bushings has been attempted in one of Fingrid’spower transformers. The experiment was not successful due to problems with datatransfer from the monitoring equipment to Fingrid’s on-premise database. Furtherexperiments will be probably carried out in the future. [38]
Temperatures and loadingPower transformer temperature and loading are basic parameters to be monitored.Overheating accelerates deterioration of insulation and consequently reduces thelifespan of a power transformer [61]. Loadability is determined by the temperature.A power transformer can be overloaded a bit until the temperature reach a criticallevel. Ambient temperature affects power transformer cooling and thus loadability,too. [61]
Power transformers are equipped with several temperature measurements. Tem-perature of each winding is measured separately and oil temperature is measuredat one or two points [42]. Newer power transformers are equipped with fiber optictemperature measurements in addition to conventional Winding Temperature Indi-cators (WTI). Old transformers are only equipped with WTIs. [52] A conventionalWTI determines a winding temperature by using oil temperature and winding cur-rent information. Oil temperature measurement is an indirect measurement systembased on volume changes of a liquid. The secondary current of a bushing currenttransformer is fed to a resistor that heats proportionally to the winding which allowsthe winding temperature to be calculated. [62] For metering purposes the currentand the voltages of a power transformer are measured by instrument transformers inthe switchyard. Powers are calculated accordingly. All power transformer data isconventionally transferred to SCADA. [52]
IoT measurementsThe expected lifespan of a power transformer is approximately 40 years. In orderto extend the lifespan to 60 years, an overhaul can be performed 20-30 years aftercommissioning. Commonly the short circuit strength of a power transformer hasdegraded at that age due to loose windings. To restore the short circuit strengththe cover of power transformer is opened and windings are tightened. Gaskets arereplaced to ensure tightness of the oil tank, bushings are inspected in a laboratory,and the auxiliary equipment is replaced. Paper insulation can be dehydrated ifnecessary. [63]
An early IoT experiment project was run in Tammisto substation at the time ofa power transformer overhaul in 2017. Four vibration sensors were attached on the
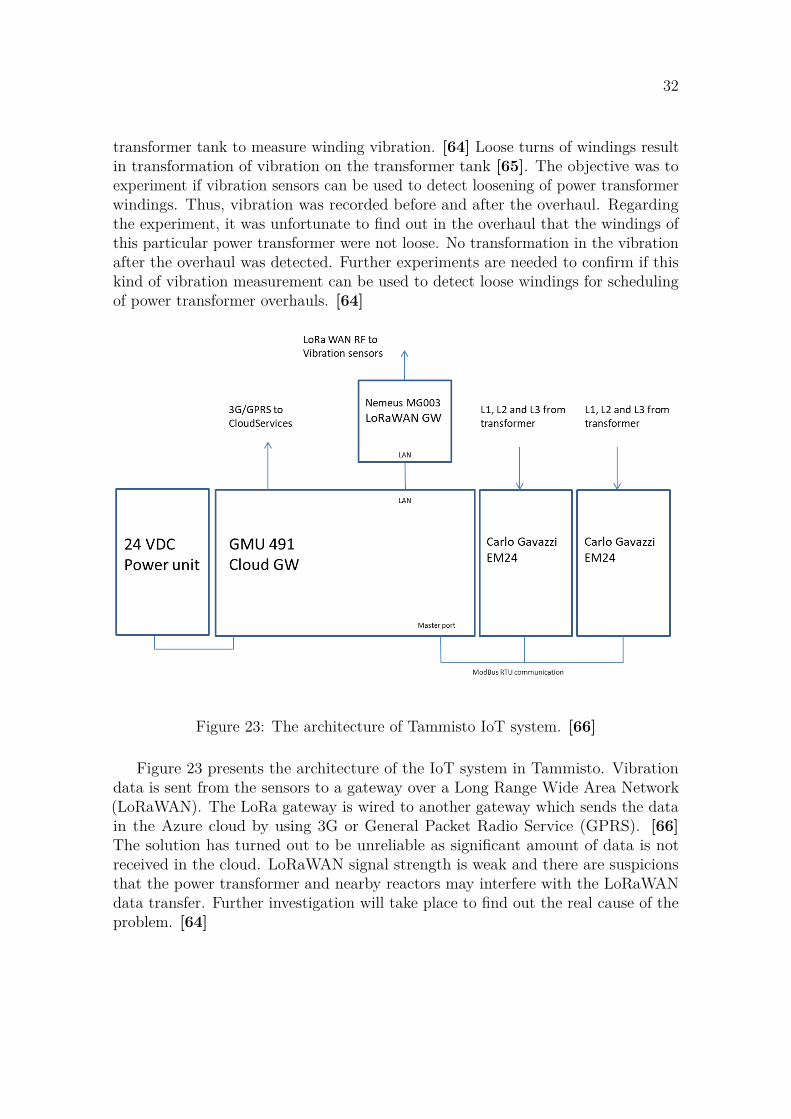
32
transformer tank to measure winding vibration. [64] Loose turns of windings resultin transformation of vibration on the transformer tank [65]. The objective was toexperiment if vibration sensors can be used to detect loosening of power transformerwindings. Thus, vibration was recorded before and after the overhaul. Regardingthe experiment, it was unfortunate to find out in the overhaul that the windings ofthis particular power transformer were not loose. No transformation in the vibrationafter the overhaul was detected. Further experiments are needed to confirm if thiskind of vibration measurement can be used to detect loose windings for schedulingof power transformer overhauls. [64]
Figure 23: The architecture of Tammisto IoT system. [66]
Figure 23 presents the architecture of the IoT system in Tammisto. Vibrationdata is sent from the sensors to a gateway over a Long Range Wide Area Network(LoRaWAN). The LoRa gateway is wired to another gateway which sends the datain the Azure cloud by using 3G or General Packet Radio Service (GPRS). [66]The solution has turned out to be unreliable as significant amount of data is notreceived in the cloud. LoRaWAN signal strength is weak and there are suspicionsthat the power transformer and nearby reactors may interfere with the LoRaWANdata transfer. Further investigation will take place to find out the real cause of theproblem. [64]

33
On-Load Tap ChangerOn-Load Tap Changer (OLTC) is a piece of equipment in a power transformerto control network voltage on the low-voltage side. It changes the turn’s ratio oftransformer windings by switching the high-voltage side to a different turn of theprimary winding. [39] Each of Fingrid’s power transformers is equipped with anOLTC [10].
Being switching equipment, an OLTC has similar operational characteristics toswitchgear. There is a motor drive for charging a spring that switches the primarycontacts from a turn of winding to another. [67] Thus, the IoT sensor unit developedfor switchgear could be possibly used for online condition monitoring of OLTCs,too. Normally an OLTC switches the step daily which would allow frequent dataacquisition for condition monitoring [68]. Adaptation of the IoT sensor unit ofswitchgear to on-load tap changers will be experimented in the future.
4.4 Instrument transformersThe purpose of an instrument transformer is to transform a primary quantity to asmaller scale that can be measured in protection relays and energy meters [69]. Thevalue of a primary quantity can be calculated by applying the transformer ratio tothe secondary quantity of an instrument transformer. Voltage transformers can beeither inductive or capacitive. An inductive voltage transformer is a conventionaltransformer with a primary winding and secondary windings on a common core. Acapacitive voltage transformer contains a stack of capacitors as a capacitive voltagedivider. [70] Current transformers are conventional transformers with several cores.The measurement range has to be a lot wider for current than for voltage becauseof high fault currents. Thus, different cores and windings are needed in currenttransformers for different purposes, referring to protection and load metering. [69]
Instrument transformers have slightly lower fault frequencies than switchgear [37].Fingrid has approximately 2 100 voltage transformers and 4600 current transformers[10]. Instrument transformer failures can lead to severe damages. Pressure build-upin the sealed oil space may lead to an explosion which spreads the oil, and in case ofceramic insulation, heavy fragments of insulation on the switchyard [38]. In 2017 afew voltage transformers exploded and in 2018 a current transformer explosion hadsevere consequences as mentioned in Section 3.2. [37]
Existing condition monitoringCurrently, there is not much condition monitoring for instrument transformers. Oilleakages can be detected in substation inspections when the oil level indicatorsare inspected along with the overall appearance of the equipment. Dissipationfactor measurement and dissolved gas analysis are performed on demand but notfrequently. [38] Oil sampling is generally avoided as instrument transformers arehermetically sealed [69]. Radio-Frequency Interference (RFI) measurements areperformed annually to detect possible partial discharges in insulation of instrumenttransformers and power transformers [71].

34
IoT measurementsA capacitive voltage transformer consists of a number of capacitors connected in series[70]. A short circuit of a capacitor would change the output voltage of the capacitivevoltage divider. This kind of a fault could be possibly detected by monitoring thelong-term trend of secondary voltages. In a short period of time, voltage fluctuationsof a live network and imbalance between phases cause fluctuations of the secondaryvoltages. However, the difference between secondary voltages of different phasesshould not drift over time. If this happens, there is most likely a fault.
Secondary circuits of instrument transformers are connected to protection relaysand to other automation systems. The data is transferred to the SCADA environmentto allow operators in the control centre to monitor network voltages and currentsin real-time. However, only line-to-line voltage data is available which means thatphase voltages are not monitored [72].
Thus, in the first IoT experiment project in Tammisto, standard energy meterspresented in Figure 24 were installed in the substation building to measure thesecondary voltages of two 110 kV voltage transformers, meaning six pieces of primaryequipment in total. [64] The IoT architecture in Tammisto was described in Section4.3.
Figure 24: A regular energy meter used for measuring the secondary current of acurrent transformer. [73]
The voltages of three phases have remained stable in respect of each other andshort-term fluctuations are visible. There were no suspicions of faults in advance inthese particular voltage transformers and detecting a real fault was not a realisticobjective of the project. The main objective was to build and test a first version ofan IoT platform and have some reasonable data for monitoring [64]. The energymeters used in this experiment are expensive considering a large-scale extension ofvoltage transformer monitoring in dozens of substations. In addition, the meters areconventionally hard-wired and thus installation work is not minimized as it shouldbe according to the main principles of Fingrid’s IoT concept described in Section 3.2.

35
For possible extension of this kind of monitoring, it also has to be considered if it isbetter to install a separate meter for voltage measurement or make use of the phasevoltages measured by existing substation automation.
For inductive voltage transformers and current transformers there are no suchstraightforward ways for continuous online condition monitoring. As explained inSection 4.3, online DGA and dissipation factor online measurements are a goodcondition monitoring methods for transformers. They would be useful for instrumenttransformers, too, but the monitoring equipment is too expensive in respect of thecost of an instrument transformer.
4.5 Substation buildingsSubstation automation, telecommunication and auxiliary power systems accommo-dated in a substation building are essential systems for the operation of a substation.Protection, switchgear control, remote connection between a substation and thecontrol centre, and the offline performance of substation automation are all takencare of by these systems. Appropriate conditions in the building ensure the systemsperformance. Risk of overheating applies to cabinets containing automation andtelecommunication equipment whereas performance of batteries degrades at a coldtemperature. The climate in Fingrid’s regular substation building is kept somewhatconstant, close to office conditions. HVDC (High Voltage Direct Current) converterstations include special rooms where maintaining constant conditions is critical forthe operation of primary equipment [74]. However, there is currently no visibility tobuilding conditions and thus it is not possible to know how they fluctuate in reality.
As stated in Chapter 2, an objective of the IoT project is to reduce time-based workon site. This will reduce visual inspections of the substation building. Thus, morereal-time visibility to substation buildings is demanded to ensure the performance ofcritical secondary systems.
Indoor climate and water leakagesIn 2018 the first substation buildings were equipped with Haltian Thingsee POD 2sensor units presented in Figure 25.
Figure 25: The sensor unit for climate measurements. [75]

36
They are simple and low-cost sensor units measuring ambient temperature, hu-midity, air pressure, light level, movement and vibration [75]. The former threequantities are used in this case. The sensor units are placed in different rooms and indifferent spaces in the building structure. One sensor unit is measuring outdoors, too.In addition, separate sensors are used to detect water leakages on surfaces based onthe electrical conductivity of water. Two copper contacts are galvanically connectedby water to indicate moisture on a surface.
Data is transferred from the sensor units to a gateway and further to Haltian’sThingsee Operations Cloud which is built on AWS (Amazon Web Services) cloudplatform. From Thingsee cloud the data is replicated to Fingrid’s Azure cloud. In afuture scenario, the data flow will be redirected to Fingrid’s Azure cloud. However,it will be a considerable task to configure the Azure platform to communicate withthe Thingsee hardware as they were originally developed for AWS platform.
Equipment monitoringIn addition to monitoring of the ambient conditions, specific equipment inside thebuildings could be monitored. Current sensors and vibration sensors could possiblybe used to measure the operation of air-source heat pumps and air ventilation fans.Thingsee POD 2 sensor units could be additionally placed inside relay racks or otherautomation cabinets in case overheating is suspected. Once the cloud platformhas been established, new sensors can be easily added wherever it seems necessary,although provided that the costs of sensors are low.
4.6 Primary circuit temperatureTemperatures of structures in the primary circuit are measured with custom sensorunits. They are attached with double-sided tape to the outer surfaces of primaryequipment, to joints and close to contacts or switches. Figure 26 shows installedtemperature sensors.
Figure 26: Custom temperature sensor units installed on primary circuits. [46]

37
Faults in conventional oil-insulated instrument transformers sometimes ignite afire or even make them explode [38]. The idea of measuring surface temperature isto detect these faults early enough to prevent fire and explosions. However, thereis no proof if surface temperature gives an early enough warning of such faults inreality. It will be discovered in the future.
Loose joints increase resistance which leads to energy losses and excess heatingin structures carrying high currents. Temperature sensors attached to joints willprobably make it possible to detect loose joints by analysis of temperature andcurrent in similar joints. If the price of a sensor is low enough, all joints can beequipped with a sensor to have a full coverage of monitoring.
Overheating may occur also in primary contacts of disconnectors. Figure 27 is areal-life example of an overheating 20 kV disconnector.
Figure 27: A 20 kV disconnector with excessively heating primary contacts. [46]
High contact resistance makes the temperature rise to more than 100 degreesCelsius whereas the temperature in a healthy phase is only 23 degrees Celsius. Thus,temperature sensors are attached close to the primary contacts.
A challenge with the temperature sensors is heat transfer from the primarystructures to the sensor. In the first tests the sensors were strongly affected by windand outside temperature. The internal design of the temperature sensor was changedaccordingly. The adherence of the tape attachment is another uncertain aspect.The sensors have remained attached during several months of harsh winter weatherconditions but there is not yet longer-time experience.
Usage of fixed low-resolution thermal cameras is also experimented in the IoTproject. The advantage is that a few cameras can monitor the overall primarystructures instead of specific measurement points.
4.7 Future developmentThere will be a lot of use cases for low-cost online measurements in the future. Thealready developed solutions can be adapted to new use cases and new solutions willbe developed. Online condition monitoring will be deployed to other asset types

38
and substation surveillance and work safety will be considered, too. Some futurepossibilities are listed below:
• Post insulator monitoring: Acoustic emission for detection of cracks
• Busbar vibration monitoring
• Reactor vibration monitoring
• SF6 pressure monitoring: An IoT solution to replace conventional
• Surge arrester monitoring: Surge count and leakage current
• Instrument transformer monitoring: Cameras and image recognition for oilleakages and oil level indicators
• Auxiliary battery monitoring: Automatization of capacity testing, cell voltagesand resistances
• Sliding gate monitoring: Motor drive and mechanics
• Substation area surveillance: Cameras and drones
• Working safety: Sensors in working clothes

39
5 Asset Performance Management application forFingrid
According to Gartner, "Asset performance management (APM) encompasses thecapabilities of data capture, integration, visualization and analytics tied togetherfor the explicit purpose of improving the reliability and availability of physicalassets." [76] An APM application is a software that provides the user with a visualinterface to the process of asset performance management. Most importantly, anAPM application is responsible for the third step of the condition-based maintenancetechnique, Data Visualization, presented in Figure 1. Condition data of assets isvisualized and interpreted in an APM application to support decision-making ofdifferent user groups. This Chapter presents what kind of visualization of conditiondata is necessary in an APM application.
The functional requirements for an APM application depend on the availablecondition data and the end users of the application. To recognize Fingrid’s needs,the condition monitoring solutions were explored in Chapter 4 and the user groupsare classified in this Chapter. As one of the key ideas behind an APM applicationis to include all condition data under a single roof, it is important to understandwhere the data comes from. Several integrations of other applications, platforms anddatabases to an APM application are needed. Thus, this Chapter presents Fingrid’scurrent situation regarding condition data sources.
5.1 User groups of asset condition informationInformation on asset condition is useful for different purposes. On-site fault diag-nostics, maintenance scheduling and investment planning are all dependent on assetcondition. Accordingly, there are different user groups for an APM application. Theneeds of users are different, and thus it is important to understand the user groupsto be able to specify Fingrid’s requirements for condition data visualization in anAPM application. In this Section, the main user groups are presented.
Equipment subject matter expertFingrid has equipment subject matter experts for all the primary equipment: switchgear,power transformers and instrument transformers, reactors, capacitors, surge arresters,GIS substations and HVDC converter substations. An equipment subject matterexpert is responsible for the lifecycle policy of his asset group and defines maintenancepractices and techniques.
An equipment subject matter expert needs to have real-time visibility to assetcondition in order to identify assets in poor condition. He puts these particular assetsunder closer observation and defines what maintenance actions will be performed.He also does fleet analysis amidst the asset group under his responsibility. Commonfailure modes of a certain asset model may reveal a factory defect or indicate ademand for improvements in the maintenance policy.

40
Service providerAll of Fingrid’s grid construction and maintenance work is outsourced. There areseveral service providers, and each of them is responsible for substations in a workarea. A geographical region consists of several work areas. Service providers performmaintenance activities according to the work orders and they are also standby aroundthe clock prepared to react to a failure in a substation.
New IoT solutions will provide vast amount of detailed data, especially onswitchgear. Ideally, an imminent fault is detected and prevented in advance bycondition data analysis. However, it is difficult to foresee all the patterns that haveto be considered alarming as such solutions for condition monitoring haven’t beenexperimented earlier. Nevertheless, faults will inevitably occur. Being the firstpersonnel arriving on site to look for a fault, service providers need access to thedetailed condition data of a single asset for further diagnostics. Studying the datawould ideally speed up the diagnosis and repair, and thus reduce the equipmentdowntime.
As explained in Section 4.1, an important element of the IoT solution for switchgearis the online inspection routine. Despite the switchgear is test-operated remotelyfrom the control centre, the service providers are on site to visually verify appropriateoperation of the switchgear. The service providers need a mobile interface with aninformative summary dashboard to display the measured performance values of eachcircuit breaker and switch in a substation and to pinpoint outliers in the fleet underinspection.
Regional maintenance coordinator and manager of serviceproviderFingrid has divided Finland into several geographical regions in terms of maintenanceresponsibilities. Each region is managed by a regional maintenance coordinator.Correspondingly, a service provider has a manager for a region under its responsibility.Fingrid’s regional maintenance coordinator and a manager of service provider aretogether responsible for scheduling maintenance actions following the maintenancepolicies. Regional maintenance coordinators manage the maintenance work ordersfor service providers that are responsible for the work on site.
Inside his region, a regional maintenance coordinator aims to group maintenanceactions efficiently for each substation. Therefore he is interested in the condition ofeach asset in each asset group. Predictive analysis of future condition trends wouldenhance the decision-making of a regional maintenance coordinator when estimatingwhether maintenance of an asset can be postponed or not. Prioritization of mainte-nance activities is unavoidable because of limited work resources. Besides optimizingthe order of substations to be maintained, a regional maintenance coordinator needsto stay aware of assets currently in poor condition to be able to react quickly to asudden equipment failure.

41
Refurbishments managerThe planned lifespan of a switchyard is 40 years. In case a switchyard is still necessaryas a part of the network after its lifespan, a refurbishment is performed. The scope of arefurbishment depends on equipment condition, suitability of the busbar configurationto future requirements, and other characteristics of each individual substation. Thescope may include replacement of certain or all equipment and structures. Sometimesthe whole substation is replaced with a new one placed in the near surroundings.
The refurbishments manager is responsible for planning refurbishment investments.Referring to Section 3.2 in Chapter 3, refurbishment projects have to be prioritized toavoid having too many overlapping ones. On the other hand, scheduled refurbishmentprojects could be postponed to extend the lifespan of old assets that are still in adecent condition at the end of their expected lifespan, which is sometimes the case asstated in Section 2.1 in Chapter 2. Thus, the refurbishments manager is interestedin the condition of individual assets but also the overall health of a switchyard and asubstation.
Grid operation expertA grid operation expert is responsible for outage planning. He does not monitor assetcondition but he needs to be aware of potentially unreliable switchgear that may failto operate properly when switching is attempted. Automatic highlighting of suchequipment would be useful when creating a switching schedule for a planned outage.
5.2 Data sources
AzureMicrosoft Azure is the cloud service platform of the IoT concept. All the data fromIoT sensor units is stored in cloud databases. Switchgear performance values arecalculated out of the raw data in the cloud and stored there as well. The Azureplatform has to be integrated to an APM application for visualization of the IoTdata.
PIOSIsoft PI is a time series data historian application for recording, analysing andmonitoring industrial processes. It allows looking back at real-time data from dozensof years ago. [77] Separate time series curves can be flexibly displayed in a singlechart for comparison. A scalable infrastructure supports deployment of a largeamount of assets and data from multiple sources [77].
Fingrid uses PI as a historian of SCADA data. Basically all the data transferredfrom substations to SCADA, including existing online monitoring data, can bemonitored and analysed in PI. Custom displays have been built for each monitoredasset group and email alarms are automatically sent in case of abnormal conditionssuch as a low SF6 pressure in a circuit breaker. Assets can be accessed in a hierarchical

42
drill down navigation panel where substations are classified under work areas andassets under substations.
As listed in Appendix A, DGA data, SF6 pressure data and equipment loadingdata are available in PI. An integration from the PI database to an APM applicationis needed. A one-time offline data load has to be performed to include historical PIdata in an APM application or it can alternatively query the data in real-time fromthe PI database.
MaximoIBM Maximo is Fingrid’s Enterprise Asset Management (EAM) application. It is themaster database of transmission network assets where asset hierarchy and nameplatedata are stored. A new asset is created in Maximo which makes it appear in othersystems via interfaces. In addition, it is a tool for work management. Maintenancework orders, equipment fault defects and most of the offline measurement results aremanaged in Maximo.
A bi-directional integration between Maximo and an APM application is required.A new asset should appear in an APM application when it is created in Maximo.Some nameplate data would be useful in an APM application, for example alarm andlocking levels of SF6 pressure for a circuit breaker. In that way some alarms couldbe automatically initiated in an APM application instead of hard-coding or manualconfiguration. Asset hierarchy, which is further discussed in Section 5.3, should beavailable in an APM application. Measurement values from equipment inspectionsshould also flow to an APM application when entered in Maximo. Some measurementresults, such as dissipation factor data from power transformers, are documentsattached to work orders. These measurement results should also be automaticallytransferred to an APM application which may however require standardization ofmeasurement data formats used by service providers.
In the opposite direction, from an APM application to Maximo, there should bea possibility of an automatic trigger for creating fault defects and maintenance workorders in Maximo for equipment in an alarming condition in an APM application.Maintenance history and future maintenance schedules are also useful informationto show in an APM application, which is discussed briefly in Section 5.4. Anotherpossible interesting use case for condition data in Maximo is switching schedules. Aplanned outage is performed according to a switching schedule that is a sequence ofswitchgear operations planned for each outage. A circuit breaker or a switch in apoor condition could be automatically highlighted in a switching schedule to alertcontrol centre operators about the risk of a failing operation.
Transformer Oil AnalystTransformer Oil Analyst (TOA) is a tool for storing and interpreting data on insulatingfluids [78]. Fingrid’s oil samples from power transformers are analysed by a laboratoryor a transportable DGA instrument. The results about dissolved gases and propertiesof oil are entered in the TOA4 database. The TOA4 Online application features

43
visualization and interpretation of data and alarm functionalities [78]. The mostimportant feature for Fingrid is Duval triangles that can be used for diagnosis offault types in a transformer [38]. Duval triangles are explained in Section 5.7.
Laboratory or portable DGA covers always all the fault gases whereas onlyhydrogen or a few fault gases are usually traced in real-time online DGA. [56] Thus,further analysis such as study of Duval triangles or fault gas signature is proceededby using the TOA4 data. The real-time online DGA serves as an early warningfeature. When a deviation is detected, further investigation is done by applying alaboratory or a portable analysis.
The oil analysis data is needed in an APM application for power transformerhealth assessment. It can be replicated to an APM application via an interfacefrom the TOA4 database or the oil analysis results can be directly entered in anAPM application. In the latter case TOA4 database would be no longer needed.Both solutions would be technically feasible. However, the workload of manual dataentry must be minimized so in case of dropping out the usage of TOA4 database thelaboratories have to be given access to enter data in an APM application.
5.3 Asset hierarchyAsset hierarchy is a framework for segmenting assets under logical subsystems in anEAM. As the word "hierarchy" points out, the levels of a hierarchy are of differentmagnitude. The highest level is the entire asset infrastructure while the lowest level isa single physical asset or parts of a physical asset. The general hierarchy of Fingrid’ssubstation asset data model in Maximo is presented in Figure 28.
Figure 28: The substation asset hierarchy in Fingrid’s EAM. Modified from [10]
Asset hierarchy is needed in an APM application for several reasons. An obvioususe case for the end user is navigation in the APM application user interface. Forefficient application usability, navigating between different assets has to be quick and

44
intuitive. It can be obtained by different navigation panel designs. Three examplesare presented in Figure 29.
Figure 29: Alternative layouts of a navigation panel for an APM application.
The navigation panel layout on the left hand side consists of the asset hierarchypresented in Figure 28, from level "Work area" to level "Asset". An alternative layoutmaking use of the hierarchy is presented in the middle. It lacks the level "Bay" asassets are classified under asset types. The asset type is a piece of data linked toeach asset and it is not technically a part of the asset hierarchy. However, it is usefulin this case. This alternative allows the user to move between assets of a certaintype more easily which might be useful when studying a certain asset group in asubstation. The idea of the layout on the right hand side is also easy navigationinside in an asset group. In this case all Fingrid’s assets are visible in a single listinstead of dividing them under work areas and substations. All of the alternativesare useful which means a great navigation solution would allow the user to choosebetween the different navigation panel designs.
In addition, asset hierarchy can be used for fetching data into dashboards dis-playing summaries about a group of assets. For example an average health score ofcircuit breakers in a certain substation can be calculated by fetching health scoresfrom the circuit breakers that are under that specific substation in the hierarchy.Another example could be a real-time list aggregating all active condition alarms ofassets in a substation by using the hierarchy.
Different measurement can be linked to different levels in the asset hierarchy. Ifthe outside temperature is measured at one point in a substation, it is logical to link
45
the measurement to the substation. Current is measured by a current transformerand the same current flows through all the equipment in the same bay. Thus, currentmeasurements are linked to bays. The asset hierarchy makes it possible to bringdata from higher levels down to lower levels such as a current in a bay to a piece ofswitchgear.
The asset hierarchy is structured in Maximo database. It can be either replicatedin an APM application, or queried in real-time from Maximo. The end user of anAPM application is not interested in the implementation. Technically both solutionsare functional.
5.4 Dashboard levelsAn APM application visualizes data for users that have different needs. Separatedashboards aggregate and visualize data in different ways to give users as muchinformation as possible. Dashboards can be logically divided into a few separatelevels. This section presents dashboard levels and their main elements.
Asset levelAsset level dashboards visualize condition monitoring data for one asset. In thesedashboards the user should be able to study all the data related to an asset. Eachasset type has different technical characteristics and related condition monitoringdata. Thus, the asset level dashboards have to be designed separately for each assettype to visualize relevant data in an informative way. The focus in this Chapter ison switchgear and power transformers as they are the most important asset types interms of condition monitoring.
In addition to the actual condition data, alarms and maintenance schedules arenecessary in asset level dashboards. Alarms are discussed in more detail in Section5.11. Briefly, they are notifications saying that there is a problem in the condition ofan asset. Active alarms and alarm history of an asset should be visible in an assetlevel dashboard.
The objective of maintenance actions is to preserve assets in decent conditionor restore faulty assets into operational condition. This means that maintenancechanges performance characteristics of equipment. Such changes are visible in themeasurement data. Maintenance history and future maintenance schedule should bevisible in an asset level dashboard to allow the user to distinguish condition changesdue to maintenance and deterioration or faults.
Summary levelA summary level dashboard shows a summary of an asset group. When viewing asubstation, abnormal measurement values, alarms, past and upcoming maintenanceactivities, asset health indices and asset risk indices are presented. This informationcan be grouped to be visualized for each bay, each asset type or any other informativeclassification.
46
A work area view can show the same information from the assets in the work areabut also aggregated health and risk indices for substations in the area. Similarly, anoverall view can aggregate information to work area level. Comparison of work areasis interesting in terms of the efficiency of different service providers. Comparison ofsubstations is necessary for example for scheduling refurbishment projects.
Fleet analysisMonitoring a trend of a condition measure can reveal that something has changedin the condition of an asset. However, deterioration of equipment over time isunavoidable and normal. The question is what is normal deterioration and whatis not. Online DGA of power transformers is such a well-established conditionmonitoring method that there is a lot of history data and experience. Conditionmodels have been developed for diagnosis and prognosis. Patterns in gas formationtrends are recognized and related to certain fault types. In case of switchgear, it willbe difficult to evaluate new condition monitoring data. No condition models existyet and there is not much experience about interpretation of measurement data inquestion.
Fleet analysis is comparing assets of an equal model to each other. The objectiveis to detect anomalies. Assets of an equal should all have remarkably similar technicalcharacteristics in a normal operating condition. A dashboard is needed for fleetanalysis because the asset level dashboards only display the data of one asset at atime. In a fleet analysis dashboard the user can choose the assets and the parametersto be compared. Data should be visible in graphical formats and also in a tabularformat. Appropriate filters and selections should be available.
5.5 Performance quantities of switchgearRaw data from the IoT sensor units in switchgear is mainly current profiles andsound recordings. Such data can be visually analysed but automated analysis is notas straightforward. Thus, a set of performance quantities have been defined to becalculated out of the data in order to characterize the performance of the equipment.The idea is to have one value of a performance quantity from one switchgear operation.A value does not necessarily need to be very informative as such. Instead, the idea isto look at the trend over time and analyse fleets. If values of a performance quantitystay nearly constant for a great number of operations and then start drifting, thereis a reason to suspect an emerging fault. Naturally some performance quantities areinformative as absolute values, too, such as motor current that is one of the maintechnical specifications of an electric motor.
Usability of some of the performance quantities is obvious, such as operationtimes. However, some of them, especially the ones related to sound spectra, remainrather speculative because there is no prior experience of such analysis for highvoltage switchgear. It is not possible to foresee at this stage what a sound spectrumlooks like in case of a faulty or deteriorating piece of equipment. Further experiencewill show how well the performance quantities indicate real-life changes in equipment
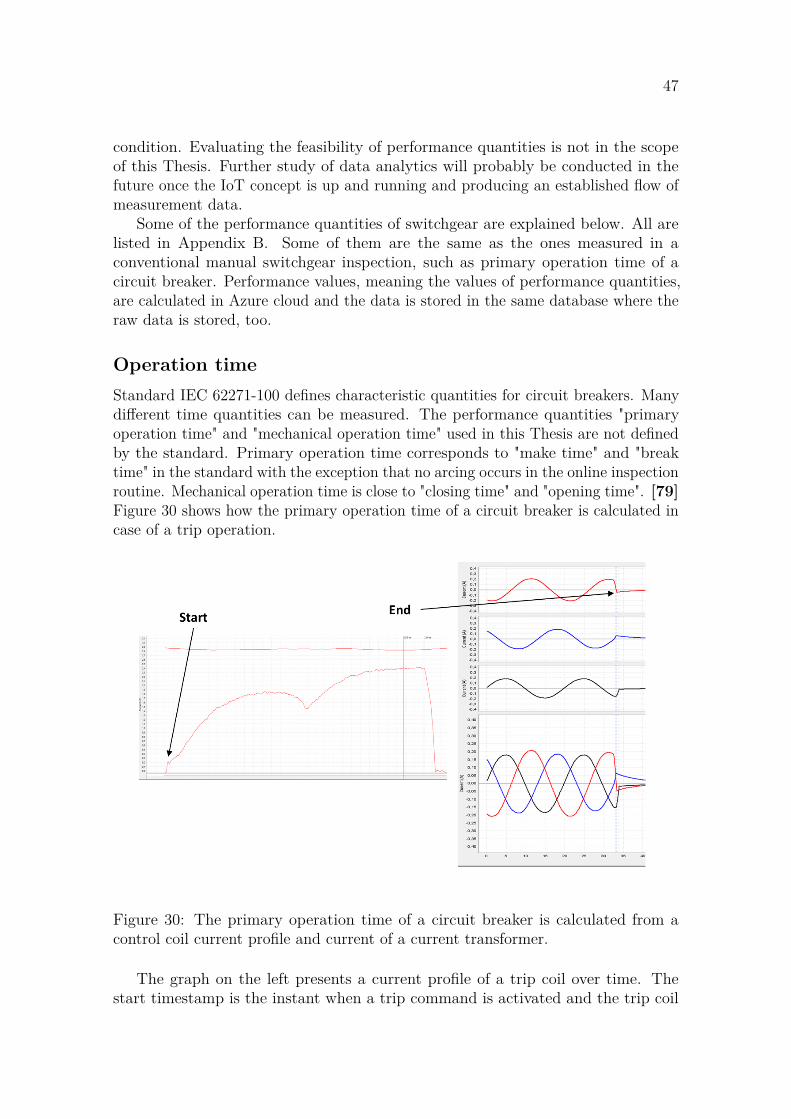
47
condition. Evaluating the feasibility of performance quantities is not in the scopeof this Thesis. Further study of data analytics will probably be conducted in thefuture once the IoT concept is up and running and producing an established flow ofmeasurement data.
Some of the performance quantities of switchgear are explained below. All arelisted in Appendix B. Some of them are the same as the ones measured in aconventional manual switchgear inspection, such as primary operation time of acircuit breaker. Performance values, meaning the values of performance quantities,are calculated in Azure cloud and the data is stored in the same database where theraw data is stored, too.
Operation timeStandard IEC 62271-100 defines characteristic quantities for circuit breakers. Manydifferent time quantities can be measured. The performance quantities "primaryoperation time" and "mechanical operation time" used in this Thesis are not definedby the standard. Primary operation time corresponds to "make time" and "breaktime" in the standard with the exception that no arcing occurs in the online inspectionroutine. Mechanical operation time is close to "closing time" and "opening time". [79]Figure 30 shows how the primary operation time of a circuit breaker is calculated incase of a trip operation.
Figure 30: The primary operation time of a circuit breaker is calculated from acontrol coil current profile and current of a current transformer.
The graph on the left presents a current profile of a trip coil over time. Thestart timestamp is the instant when a trip command is activated and the trip coil

48
current starts rising. The graphs on the right present secondary currents of a currenttransformer. The end timestamp is the instant when the secondary current breakswhich equals the instant of primary circuit opening. The primary operation timeof a circuit breaker is the time duration between these start and end timestamps.Respectively in case of a close operation, the start timestamp is obtained from aclose coil current profile and the end timestamp is the make of primary circuit.Primary operation time is an important performance quantity that indicates howquickly a circuit breaker performs its primary function. It is measured manually in aconventional circuit breaker inspection.
Mechanical operation time is the time duration between the timestamp of acontrol command and the timestamp of a position indicator state change. Theposition of a circuit breaker is indicated by auxiliary contacts mechanically connectedto the primary contacts. When the primary contacts move from the closed positionto the open position or vice versa, the auxiliary contacts change the state indicatingthe current position of the circuit breaker. [9] Measuring the mechanical operationtime indicates the condition of the mechanics related to auxiliary contacts. If theprimary operation time is normal whereas the mechanical operation time is not,there is reason to doubt the condition of auxiliary contact mechanics. The positioninformation is used in SCADA where false information would be a serious issue. Incase of switches, the primary contacts are motor-driven. Thus, the only operationtime to be monitored is the motor drive operation time.
Control coil current profileFigure 31 shows the same trip coil current profile than in Figure 30.
Figure 31: A current profile of a circuit breaker control coil. [46]
The condition of a control coil is assessed by analysing the current profile. Three

49
performance quantities are calculated: maximum current, signal duration and integralof current over time. Maximum current and time integral are supposed to indicatean abnormal shape of the current profile. Signal duration is related to mechanics asthe signal is switched off by a mechanical auxiliary contact which changes its statealong with primary contacts.
Motor current profileThe charging motor of a circuit breaker charges the closing spring after a closingoperation. The energy of the closing spring is used to close the primary contacts andto charge the opening spring that accordingly opens the contacts in a trip operation.[80] Figure 32 shows a current profile of a circuit breaker charging motor operation.
Figure 32: A current profile of a circuit breaker charging motor operation. Thenegative sign of the current is due to the orientation of the installed current sensor.
The motor current profile consists or three main periods. There is an inrush currentpeak at start, a flat period when there is not yet much torque applied and finallya period of increasing current during the actual spring charging. The performancequantities calculated are magnitude of the inrush peak, average magnitude of the flatperiod, time integral of the current profile and time duration of the motor operation.The same performance quantities are applied to motor drive current profiles ofswitches, too. The shape of current profile is different but basically the monitoredcomponent is similar, an electric motor.
5.6 Switchgear data visualizationVisualization of condition monitoring data of switchgear is sketched in this Section.Presentation forms of the data are discussed in the beginning.

50
Data presentation formsOnline condition monitoring of switchgear is mostly based on events, meaningswitchgear operations. Time series presentation is simple and informative visualiza-tion for the performance quantities as there is basically one value of a quantity forone operation. A time series chart shows how the value of a performance quantityfluctuates over time. Data accumulates when a circuit breaker or a switch is operatedand a data point is plotted according to the event timestamp. To limit the numberof separate charts, several performance quantities can be plotted in a single chart.
In addition to event data, there are continuous online measurements: SF6 pressureand related conditions, including control cabinet temperature and humidity, primarycircuit temperature and current. Time series presentation is simple and informative incase of this data, too. For SF6 pressure, the leak rates can be additionally calculatedand visualized in a bar chart. However, time series presentation is necessary to allowviewing history data which is not possible in a bar chart.
Asset level dashboards for trendsThere is no one right solution for the design of dashboards. A set of data can bedivided in pages and tabs in several logical ways. Sketches of dashboards in thissection are created by considering the physical components in switchgear and onthe other hand the data presentation form. The dashboards are neither detailednor finished as the idea is to simply present what content is to be shown and how.Some of the example charts are made in Excel with fictive data and some are chartswith real data. The dashboard sketches in this section are created mainly for circuitbreakers but the main elements and ideas are applicable for switches, too.
Figure 33: A dashboard for trends of circuit breaker motors. Modified from [42]

51
Figure 33 illustrates a dashboard for time series charts of performance quantitiesrelated to circuit breaker charging motor or switch motor drive. Motor operationtime is an important quantity as such, especially for switches [9]. Thus it is plottedin a separate chart from the other quantities. The other three performance quantitiesexplained in Section 5.5 are plotted in a single chart because they characterize thesame current profile. The performance quantities of motor sound are plotted in onechart.
For switches, motor drive operations should be separated into close and openoperations which should not be compared to each other [9]. Thus, for switchdashboards, a few more charts or additional curves in the same charts are needed forperformance quantities related to motor drive operations.
Figure 34: A dashboard for circuit breaker operation times. Modified from [42]
Figure 34 illustrates a dashboard for circuit breaker operation times. Primary andmechanical operation times have the same order of magnitude so it is convenient toplot them in a common time series chart. This dashboard is not needed for switchesas the only operation time to be measured is the motor drive operation time.

52
Figure 35: A dashboard for trends of circuit breaker control coils. Modified from[42]
Figure 35 illustrates a dashboard for performance quantities of circuit breakercontrol coil currents. A circuit breaker is equipped with two trip coils for redundancyin trip operation. Close operation is controlled by a single close coil. The threeperformance values explained in Section 5.5 are plotted in a single time serieschart, separately for each coil. An opposite approach would be plotting the threeperformance quantities in separate charts so that there are data from all coils in eachchart. However, the approach in Figure 35 is more intuitive considering the coils asseparate physical components of a circuit breaker.
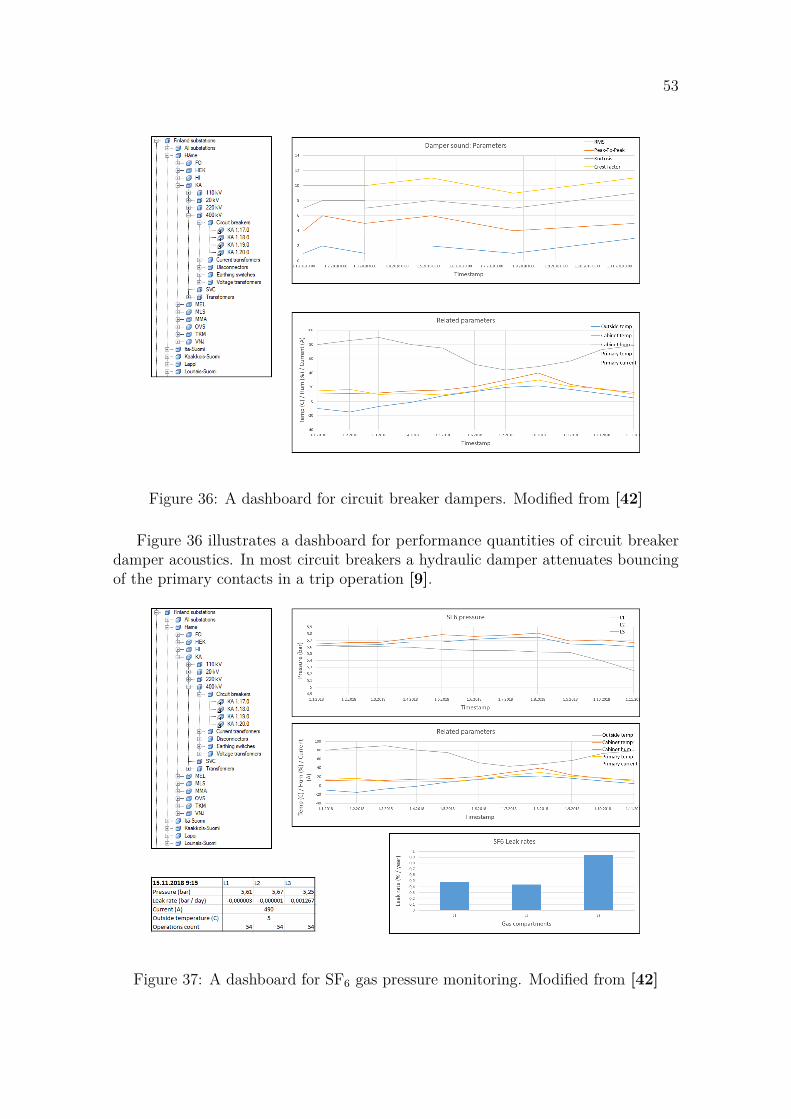
53
Figure 36: A dashboard for circuit breaker dampers. Modified from [42]
Figure 36 illustrates a dashboard for performance quantities of circuit breakerdamper acoustics. In most circuit breakers a hydraulic damper attenuates bouncingof the primary contacts in a trip operation [9].
Figure 37: A dashboard for SF6 gas pressure monitoring. Modified from [42]

54
Figure 37 illustrates a dashboard for SF6 gas pressure of circuit breakers. SF6pressure data is not event-based data. Gas density in the gas compartment ismeasured continuously and it is not dependent on operations. A single time serieschart displays the gas pressure that is calculated from the density. Despite theswitchgear dashboards are designed for 110 kV switchgear in this Thesis, SF6 pressurehas to be visualized also for 400 kV switchgear with separate gas compartments.As the idea of an APM application is to centralize all condition monitoring datain a single application, the existing SF6 pressure monitoring solutions have to beincluded.
Asset level dashboards for eventsIn case an abnormal operation occurs, the user wants to study more closely the eventdata related to that specific operation. Figure 38 shows a profile of circuit breakercoil current and Figure 39 shows a profile of circuit breaker charging motor currentand revolutions per minute. The event selection list displayed on the right allowsthe user to navigate between events.
Figures 38 and 39 illustrate event views for circuit breakers whereas the previouslypresented dashboards in Figures 33-37 are designed for trend monitoring.
Figure 38: A dashboard for current profiles of circuit breaker control coils. Modifiedfrom [42]
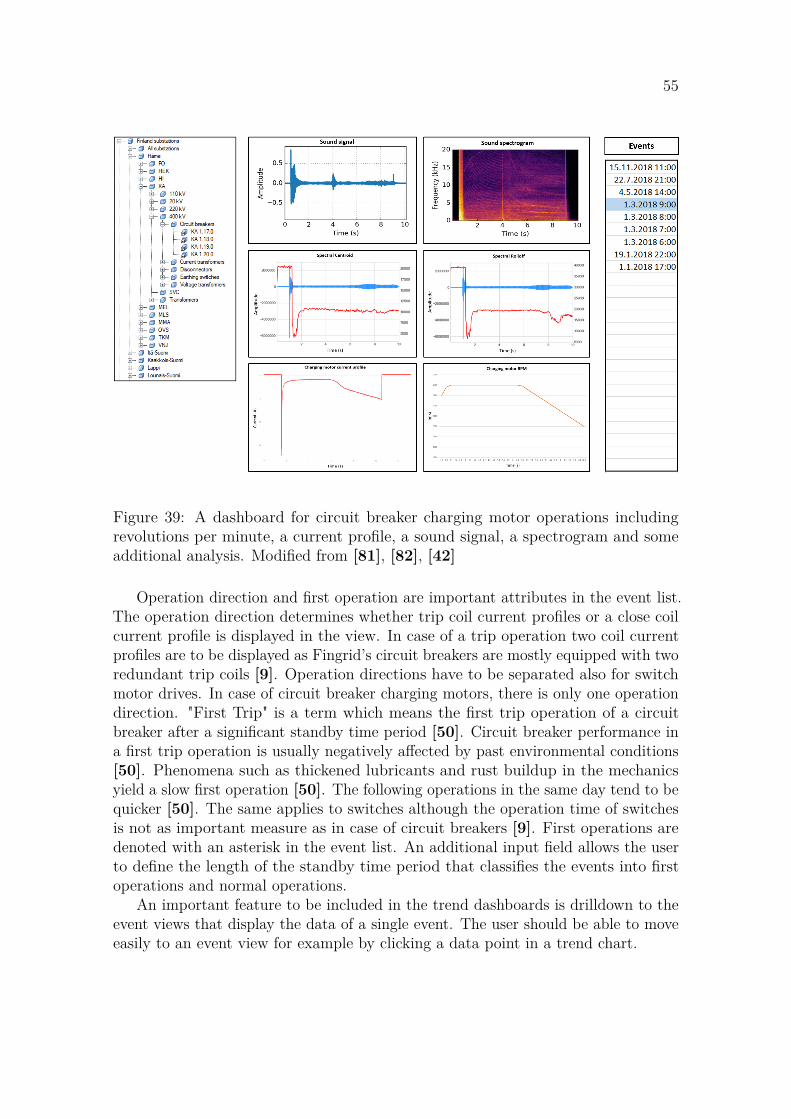
55
Figure 39: A dashboard for circuit breaker charging motor operations includingrevolutions per minute, a current profile, a sound signal, a spectrogram and someadditional analysis. Modified from [81], [82], [42]
Operation direction and first operation are important attributes in the event list.The operation direction determines whether trip coil current profiles or a close coilcurrent profile is displayed in the view. In case of a trip operation two coil currentprofiles are to be displayed as Fingrid’s circuit breakers are mostly equipped with tworedundant trip coils [9]. Operation directions have to be separated also for switchmotor drives. In case of circuit breaker charging motors, there is only one operationdirection. "First Trip" is a term which means the first trip operation of a circuitbreaker after a significant standby time period [50]. Circuit breaker performance ina first trip operation is usually negatively affected by past environmental conditions[50]. Phenomena such as thickened lubricants and rust buildup in the mechanicsyield a slow first operation [50]. The following operations in the same day tend to bequicker [50]. The same applies to switches although the operation time of switchesis not as important measure as in case of circuit breakers [9]. First operations aredenoted with an asterisk in the event list. An additional input field allows the userto define the length of the standby time period that classifies the events into firstoperations and normal operations.
An important feature to be included in the trend dashboards is drilldown to theevent views that display the data of a single event. The user should be able to moveeasily to an event view for example by clicking a data point in a trend chart.

56
Related parametersThere is a chart for related parameters in each of the trend dashboards. The idea isto visualize data of ambient conditions that may affect the performance of switchgearand explain some trend patterns of performance quantities. Outside temperaturedata is already available in PI but an alternative solution is to use data from an IoTsensor unit. One of the units monitoring the substation building is installed outside.Conditions inside a switchgear control cabinet are measured by the IoT sensor units.Primary circuit temperatures are measured by the IoT sensors attached to surfacesand joints of primary equipment. There may be several sensors attached on one pieceof primary equipment so the related parameters chart can include multiple curvesfor that data. Primary current is measured by a current transformer and the data isavailable for each bay in PI.
Implementation of such a related parameters chart requires data from multiplesources. Some of the data in the chart originates from individual pieces of primaryequipment while other data is linked to the substation or to a bay. Asset hierarchycan be used for linking all the data correctly to one asset.
Fleet analysis dashboardAn illustration of a fleet analysis dashboard is presented in Figure 40. There are fourmain elements: A filter panel, an asset selection list, an event list with performancevalues, and charts with multiple curves. Unlike the previous examples, this one is forswitches. However, the main elements are applicable for circuit breakers, too.
Figure 40: A fleet analysis dashboard for comparing measurement results fromdifferent operations and different assets. Modified from [81]

57
Filter panel allows user to select which assets and which parameters are com-pared. Selection could be implemented in a different way, too, such as using an assethierarchy tree combined with filters. The objective of this example is to show whichattributes are necessary for the selection. The attributes of the filter panel are listedand explained in the following list. However, an agile system would allow selectionand filtering by any attribute.
• Substation: To filter assets of certain substations to be displayed in the assetselection list.
• Bays: To filter assets of certain bays to be displayed in the asset selection list.
• Asset types: To filter assets of a certain type to be displayed in the assetselection list. A substation and a bay always include assets of different types.
• Asset models: To filter assets of a certain model to be displayed in the assetselection list. This is necessary especially for fleet analysis.
• Commissioned: To filter assets that have been commissioned in a certain periodof time.
• Voltages: To filter assets of a certain primary and auxiliary voltage level to bedisplayed in the asset selection list. Same equipment is used at different primaryvoltage levels [9]. For example 110 kV rated switchgear are used in 20 kVtertiary systems that include shunt reactors [9]. Auxiliary voltage in Fingrid’ssubstation is either 110 VDC or 220 VDC [69]. A filter for the auxiliaryvoltage is necessary because the auxiliary voltage affects the characteristics ofswitchgear control circuits and motor drives. Performance values at differentauxiliary voltage levels are not comparable.
• Parameters: To select which parameters are shown for selected assets in thecharts.
• Operation: To filter events as open or close operations to be displayed in theevent list.
• First operation: To choose whether first operations are included or excluded inthe event list. It should be also possible to choose only the first operations. Anadditional filter for the standby time allows the user to define which operationsare classified as first operations.
• Temperature: To filter events on a range of ambient temperature to be displayedin the event list. Temperature affects the performance of switchgear mechanics.For example performance values from operations at -30 C are not comparableto an operation at +30 C.
• Months: To filter events on a range of months to be displayed in the event list.

58
• Timestamp: To filter events on a range of timestamps to be displayed in theevent list.
Asset selection list displays assets according to applied filters. Blue colorindicates a selected asset.
Event list displays operations of the switchgear selected in the asset selectionlist. Performance values from each operation are visible in the table.
Charts visualize the selected parameters of the selected assets. The selectedevents are plotted and events or trends can be visually compared. The example inFigure 40 lacks legends but the curves of different colors are supposed to correspondto the selected events. The approach is a bit different for event data and trend data.The case of event data is simple. The profiles from the selected events are plotted asin the example charts in Figure 40. Comparison of trend data is more demanding.The trends of the selected parameters, that are performance quantities, would beplotted for the selected assets. Events in the event list are data points in a trendprofile. The data included in a trend profile could be restricted by the filters andmanual selection in the event list. A challenge of trend data comparison is differenttime frames of trend patterns among a group of assets. Assets of an equal modelmay have been commissioned at different times in the first place and deteriorationappears at different times during the lifespans. Thus, the user needs to have manualcontrol of time frames of different curves separately. Similarity of trend patterns canbe studied by aligning the curves over each other adequately.
Dashboard for online inspection routineThe online inspection routine of switchgear was presented in Section 4.1. TheIoT concept allows performing the online inspection routine very efficiently asmeasurement data is instantly available after test-operations. The service providerin charge of the inspection will verify the measured data in a mobile device on site.Thus, an appropriate dashboard is needed to display the measured performancevalues in a simple format.
An example of a dashboard for switchgear online inspections is presented inAppendix C. It is a tool for service providers that contains an event list with atable including all the performance values similarly to what is shown in Figure 40.The table is filled with a few fictive values. The table in this dashboard includesperformance values for both, circuit breakers and switches, unlike the one in Figure40 that was designed only for switches as an example. The values in parenthesiscould be averages of past years or averages of that particular equipment modelin order to set a baseline for verification of the recent values. In addition, therewould be probably some alarm limits set for the performance quantities in an APMapplication. These limits could be additionally displayed next to the recent valuesand values beyond the limits could be highlighted. There are numerous possibilitiesfor a functional implementation of this dashboard. The main idea is to provide theuser with all the appropriate information to allow efficient verification of recentlyreceived measurement data. In case deviations are detected, the service provider canfurther examine the piece of equipment in question.

59
Gas-Insulated SwitchgearOnline condition monitoring of GIS substations is currently SF6 pressure monitoringas stated in Section 4.2. One GIS substation is equipped with switchgear monitoringsystem as an experiment.
SF6 pressure of a GIS substation can be visualized in the same way as circuitbreaker SF6 pressure. A GIS consists of dozens of gas compartments which meansthat all the pressure data may not fit conveniently in a single time series chart.Measurements can be divided into several charts for example according to bays.
Time series presentation is preferred as it shows the history data. However,additional bar charts for current pressures and leak rates can be implemented toallow the user to check the current situation at a glance. Current pressures and leakrates of all compartments can be fitted into two bar charts. Examples are presentedin Figures 41 and 42.
Figure 41: A bar chart presentation for the current SF6 gas pressure in GIS gascompartments.

60
Figure 42: A bar chart presentation for the current leak rates of SF6 gas in GIS gascompartments.
5.7 Power transformer data visualizationCondition monitoring methods for power transformers are well-established and adecent amount of data is available. The data is distributed in separate systemsand databases and a limited set of basic views have been implemented. An APMapplication could enhance the usability of the available data and get more value outof it in form of more advanced analyses and visualization. The current situationregarding condition data management of power transformers is listed below.
• PI: Online DGA data and dashboards for monitoring.
• TOA4: Oil sample data and tools for analytics, e.g. Duval triangles.
• Cognos: A platform for custom reporting and data analytics. Analysis of TOA4data and dissipation factor data. Visualization on custom dashboards.
In this Section, necessary elements of power transformer condition data visualiza-tion are reviewed. Most of the elements are already used in the existing systems sothey are used as examples.
Fault gasesFormation of fault gases can be visualized in one time series trend chart or in separatecharts for each fault gas. There is a lot of variation in orders of magnitude of differentfault gases [42]. Thus, in case of a single chart implementation there has to be

61
a possibility to manually exclude curves from a chart and control the axes. Faultgas data from online DGA and laboratory DGA can be visualized in an equal waybut separately. Figures 43 and 44 present how the online DGA data is currentlyvisualized in PI.
Figure 43: Fault gas concentrations in a power transformer in a time period of 233days. [42]
Figure 44: Fault gas concentrations in a power transformer in a time period of 233days, excluding carbon dioxide. [42]
The PI implementation features all the previously mentioned functionalities andthus the usability is efficient. Figure 45, however, is a visualization of fault gas datafrom oil analysis.

62
Figure 45: Trends of fault gas concentrations in oil samples extracted from a powertransformer. [83]
Cognos implementation lacks functionalities for efficient usability. There is onlya simple filter for selecting the displayed time period [83]. The chart is not asinformative as the equivalent in PI. Moreover, as stated in the beginning of thisSection, a challenge is distribution of data visualization. Two separate systems areused to visualize data related to the same physical phenomenon. Both, online DGAand laboratory DGA data, should be visualized in time series charts in an asset leveldashboard of power transformers in an APM application.
Fault gas signatureFault gas signature of a transformer is a visualization of fault gas percentages. Theresult of laboratory analyses are displayed in chronological order in a clustered barchart. Fault gas signature does not show absolute concentrations of fault gases. [83]Instead, the idea is to early detect changes in fault gas formation behaviour of atransformer even before the absolute concentrations start increasing significantly.The fault gas signature of a 400 kV power transformer implemented in Cognos ispresented in Figure 46.
Figure 46: Fault gas signature of a power transformer presented in a bar chart. [83]
Such a chart clearly shows changes in the signature. In Figure 46 the signature

63
remained unchanged for two decades. The dominant fault gas was carbon monoxidewhich is an indication of a healthy transformer [38]. The signature changed drasticallyin 2011 which indicates an alarming change in the condition of the transformer. Sincethen the oil has been sampled more frequently and the signature seems to keepchanging. Thus this transformer is kept under closer monitoring.
Fault gas signature is currently visualized only for oil sample data. Most ofFingrid’s transformers are equipped with online DGA instruments that measure onlya few fault gases which makes it pointless to implement a signature chart for onlinedata, too. It would not provide a lot of additional value. Nevertheless, fault gassignature is an important feature in an asset level dashboard of power transformers.
DGA scoreDGA scoring is used for health assessment of power transformers. Asset healthassessment is discussed in general in Section 5.9. Briefly, the worse the fault gasformation behaviour of a transformer is, the higher the DGA score is [83]. A scoreis calculated from each laboratory result and the scores are plotted in a time seriestrend chart. An example is presented in Figure 47.
Figure 47: The trend of a power transformer DGA score. [83]
Dissipation factor and SFRADissipation factors of power transformer bushings can be analysed with the same ideaas the performance quantities of switchgear. Measurement results can be visualizedin time series trend charts despite the number of performed measurements in apower transformer lifespan is not high. In general, graphical visualization is moreinformative than tabular.
SFRA of power transformers is performed so rarely that including the data in anAPM application would not bring additional value. The data can be analysed by anequipment subject matter expert in a specific application if necessary.

64
Temperatures and loadingTemperatures of power transformer windings and oil along with loading are usefuldata to be monitored as such. In addition, fault gas formation in a power transformercorrelates with transformer temperatures and loading, as explained in Section 4.3.Thus, study of temperatures and loading is essential when assessing fault gas trendpatterns.
Power transformer temperature and loading data is available in PI. Figure 48presents a PI dashboard for monitoring of power transformer temperatures andloading.
Figure 48: Loading data and temperature data from a power transformer. [42]
This is a simple and informative dashboard with appropriate usability. Thereare three time series charts for loadings, winding temperatures and oil temperatures.The charts can be maximized by a double-click and the user has control over theaxes, which is a great basic feature in PI.

65
A commonly used presentation to describe transformer loading and capacityutilization is a load duration curve. It shows how much time a transformer has beenunder a certain load or higher. The curve is always descending. The load durationcurve is similar to a chronological load curve but the data is ordered in descendingorder of magnitude instead of a chronological order. [84] Duration curves are usefulalso for winding and oil temperatures. The duration curves of a power transformerare presented in Figure 49. The stars indicate the present condition.
Figure 49: Duration curves of power transformer loading and temperatures. [42]
The duration curves in Figure 49 are built for the past year meaning the past 8760hours, which is a common practice. However, an enhanced implementation wouldinclude the whole history of the transformer and a manual selection of time period.It could be useful to study load duration for example only in summertime or inwintertime. As for temperatures, the validity of the operation of transformer coolingsystems can be estimated. Cooling systems of power transformers are supposed tomaintain appropriate temperatures under high loading. Comparing the correlationof load and temperature duration curves of a transformer to another transformercould reveal inappropriate control settings of a cooling system.

66
Duval trianglesDuval triangles are tools for transformer diagnostics developed by Michel Duval in1974 [85]. Fault type can be diagnosed by applying DGA data to the triangles [86].An example is presented in Figure 50.
Figure 50: A Duval triangle for power transformer diagnostics. [87]
A Duval triangle includes different zones, each referring to a certain fault type.The edges of the triangle are axes for percentage ratios of three different fault gases.A point is plotted on the triangle according to the measured ratios. The zone inwhich the point is located indicates the likely fault type of the transformer. Thereare slightly different versions of Duval triangles for different oil types and fault types.However, Duval triangles cannot be used as the only tool for diagnostics as they donot consider the absolute concentrations of fault gases. A fault is always indicatedbecause only ratios are involved. Duval triangles can only be used after havingan indication of a fault from another analysis, for example simply a high absoluteconcentration of a fault gas. [86]
The dimensions of Duval triangle zones are openly available which allows easyimplementation of this diagnosis method [85]. Duval triangles are necessary in anasset level dashboard for power transformers.
Fault profilesThe ratios of fault gases, in other words the fault gas signature, indicate fault typeand fault location in a transformer as stated in Section 4.3. A fault profile is areference signature of a fault type, for example "Shorted turns in windings". Thefault gas signature of a transformer is compared to different fault profiles in order

67
to find out the most likely fault type. Thus, tabular and graphical presentations offault profile correlations are necessary features in an asset level dashboard of powertransformers. An example is presented in Figure 51.
Figure 51: Fault profile correlations of a set of DGA results. Modified from [83]
In addition to the actual fault profiles it is useful to store data from known realfaults as references. The fault profiles "NJ PM1" and "TO ACT2" are the faultgas signatures of Fingrid’s two failed power transformers. In Figure 51 the samplesignature "Measurement 1" correlates strongly with the fault of the power transformerin substation NJ.
Fleet analysisFleet analysis regarding fault gas formation behaviour is useful, especially for powertransformers of the same production batch, but for all power transformers in general,too. An agile APM application would allow selecting any fault gas trend curves into

68
a time series chart for analysis. Flexible usability of time series is necessary as timeframes of curves has to be adjusted to match the curves in a chart for analysis ofcertain patterns. Both online DGA and laboratory DGA data should be availablefor analysis. In addition, fault gas signatures of any transformers should be availablefor comparison in a similar way as the fault profile correlations in Figure 51.
Fleet analysis is useful also for bushings. Comparing dissipation factor measure-ment results of bushings from the same production batch provides useful information.
Dashboards for power transformersThis section presented the main elements to be included in the asset level dashboardsfor power transformers. They allow efficient condition monitoring. However, theavailable data is rich enough for more advanced analytics. The scope of this Thesisdid not allow further development.
In general, continuous measurement data such as online DGA data can bevisualized only in a time series format. Event data, meaning manual measurementresults such as laboratory DGA of an oil sample, should be additionally presented ina tabular format to allow the user to study closely all the measurement results ofan event. An additional table with present conditions in a numeral format wouldbe useful. As a conclusion, the necessary elements of the dashboards for powertransformer are listed below:
• Online DGA: Time series trends.
• Laboratory DGA: Time series trends, table.
• DGA score: Time series trends, table.
• Fault gas signature chart.
• Fault profiles: correlation table and bar chart.
• Oil analysis: Time series trends and table.
• Dissipation factor results: Time series trends and table.
• Loading: Time series and duration curves for apparent powers of all windings.
• Temperatures: Time series and duration curves for windings and oil.
• Table for present conditions: Temperatures, currents, powers, OLTC step, faultgas concentrations.
5.8 Substation building data visualizationTemperature, air pressure, air humidity and water leakages are measured in substationbuildings. The former three are continuous measurements that produce a constantdata flow like SF6 density and fault gas monitoring. Similarly, time series presentation

69
is simple and informative. For water leakage measurements, there are two states inpractice. A measured value is a resistance between the contacts and it is very highwhen there is no water. The resistance falls low when water connects the contacts.Thus, no visual presentation is necessary for this data. Automatic alarms and a listof water leakage events are sufficient.
Figure 52 presents real temperature data from a substation building.
Figure 52: Temperatures in a substation building.
The lower two curves are temperatures inside a GIS hall and a local controlcentre of a substation. The top curves are temperatures inside cabinets that enclosetelecommunications and remote control equipment. The downward peaks and sharpfluctuations are due to opening of doors during work on site.
Time series charts for temperatures, air pressures and air humidities are neededin an APM application. All measurements of a quantity in a substation building canbe plotted in one chart as in Figure 52. Outside conditions should be included.
5.9 Asset health and risk assessmentAsset health assessment is quantitative scoring of the condition of an asset. [88]Asset specific health indices are essential for asset condition visualization. Healthindices express the absolute condition of an asset to some extent, depending on thevalidity of the condition model. However, more importantly, a health index expressesthe differences in the condition of assets which is useful for comprehensive assetfleet management. There is always a limited budget for asset maintenance so theavailable resources must be allocated in a way that produces most value. A value isfor example the transmission system reliability and the transmission capacity. Thus,it is important to realize the differences of asset condition in an asset fleet to be ableto invest efficiently.
Health indices alone do not lead to the most efficient decisions. Some assets aremore important than others for transmission network operation. An asset causingsignificant consequences in case of a failure should be prioritized in maintenance

70
decision-making over assets of lower importance, even though similar scopes ofmaintenance activities were technically necessary. Thus, an importance classificationis needed.
A high value of maintenance investments is obtained by investing in assets thatare in high risk. Risk index is a combination of health index and importance [89].Health and risk indices are aggregated from down to top in the asset hierarchy whichallows calculating an index for a bay and for a switchyard, too.
Health and risk indices enable informative asset condition visualization and arethus important features in an APM application. Basic principles are presented inthis Section. This subject is not yet topical as the current focus is on implementingan APM application to give real-time visibility to the measurement data. Thus,further study on asset health and risk assessment will be carried out in the futureand it is not in the scope of this Thesis.
Condition models and health indexA condition model is a set of measurable quantities with gradual scales. A scoreis assigned to a measurement value to indicate how "good" the value is. [88] Forexample a rapidly operating circuit breaker gets a better score of operation timethan a slowly operating one.
Condition models can be specific to asset types or asset models. The formercase is simple as only a few models are required and a small number of scalesare to be defined. The latter case allows more accurate modeling. However, asequipment models have different technical characteristics, a great number of modelswith individually configured scales are necessary. This is the case for switchgearwhereas all transformers can be scored with a single model considering fault gases.
Measured quantities are weighted according to their importance in the operationalcondition of the equipment. [88] Other measures such as age and operations countcan be included in the scoring. Finally a total health index is accomplished bycounting the weighted scores. Appropriate weighting is important because deviationsof measurement values are of different severity and urgency. For example a powertransformer with a bad bushing has to be disconnected quickly which is more urgentthan increased fault gas formation in a transformer [52]. Usually the latter case canbe momentarily stabilized by reducing the load of the transformer which gives sometime for further analysis of the situation [52]. Thus, sometimes it may be reasonableto study the subscores separately and assess the situation with specialist expertise.
Health index of power transformers and switchgearFingrid is using health indices for power transformers and switchgear. The conditionmodel of power transformers consists of the following three elements: [83]

71
• DGA
• Dissipation factors
• Oil analysis
The DGA subscore is calculated by making the amount of fault gases proportionalto the Total Dissolved Combustible Gas (TDCG) value [71]. Thus, the DGA score isstrongly linked to the fault gas signature instead of absolute amounts of fault gases.The score of dissipation factor includes bushings and the transformer itself. Thescore of oil analysis is determined by four measured quantities that are interfacialtension, inhibitor content, dielectric breakdown strength and moisture. Weightedsubscores are summed to produce the total value of the health index. [83]
As for switchgear, a more appropriate definition for the health index would be"fault health index" because the condition model is based on fault history. The factorsof the condition model are listed below: [89]
• Age
• Operations count
• Fault history of the asset
• Fault frequency of the asset model with respect to age
Thus, the index is purely statistical and does not reflect the real physical conditionof an individual asset. Instead, condition models based on measurement data fromindividual assets should be implemented. A model should consist of quantities thatare measured frequently. Quantities that are measured only one or a few times inthe 40 year lifespan of an asset are useless and even distort the health indices.
For power transformers Fingrid is using a custom scoring system. The healthindex includes alternatively the subscore of DGA, dissipation factor, oil analysis, acombination of two or even all the three. DGA and dissipation factor measurementsare established practices so condition models based on measurement data have beendeveloped for power transformers. However in case of switchgear, appropriate modelsfor Fingrid’s needs do not exist because the IoT sensor units collect such new datathat conventional measurements haven’t provided before.
Health index serves rather well in condition management of asset fleets when newdata is received frequently and the health score is kept up to date. This is the case forexample for power transformers. Laboratory DGA is performed annually and onlineDGA is continuous. Switchgear is more challenging as measurement data is receivedinfrequently, only after operations. The online inspection routine is performed attime intervals of a few years and other operations are not necessarily performed inthe meantime. Thus, the health index of a circuit breaker or a switch may remainunchanged for years. If its condition has degraded during that time period, thehealth index suddenly changes dramatically when the online inspection routine isperformed for the next time. Then maintenance is performed urgently and the

72
health score recovers back to normal. Thus, it is questionable how much additionalvalue can be gained by applying a health index to switchgear as it actually may notaffect maintenance decision-making significantly. However, if frequent enough datais received, in other words if the online inspection routine is performed often, forexample annually, the health index could be useful.
ImportanceImportance classification of assets is a challenge of multidimensional nature. It canbe partly based on the location of an asset in the network topology but there areother defining aspects, too, for example practices in network operation. In addition,the real importance of an asset is variable because of planned outages, contingenciesand changes in the power system.
Fingrid is using an importance classification of switchgear on bay level. Animportance is assigned to each bay and the switchgear in a bay have the sameimportance due to the fact that the equipment is mostly connected in series. For110 kV bays importance is calculated according to power of the customer connectionpoint, Customer Interruption Costs (CIC), the type of busbar configuration andthe market price of electricity. For 400 kV and 220 kV bays the importance isdefined according to their role in the power system. The difference is due to thefact that all of Fingrid’s 400 kV and 220 kV transmission networks are meshed andcustomers, excluding the nuclear power plants, are connected only to the 110 kVlevel. Importance of power transformer bays are determined according to power dataof the transformers. Importance is assigned also to busbars. [89]
Importance is not likely to be determined in an APM application. Calculationsmaking use of the network topology would be performed in systems where thetopology is available and an EAM is a logical master storage of importance data.Thus, this data would be fetched from other systems to an APM application over aninterface and no specific functionalities for importance classification are required inan APM application.
Risk indexRisk is a combination of health and importance. Health index and importance areset on the axes of a two-dimensional graph and the values are normalized into acommon scale. A line crossing the origin determines how the axes are weighted asthe risk index is the perpendicular distance of a point from the line. The weightof health and importance are equal when the angle of the line is 45 degrees. Theweighting can be adjusted by changing the angle. An example is presented in Figure53. [89]

73
Figure 53: An importance-condition chart where risk is the distance of a point fromthe line crossing the origin. [89]
Figure 54 shows another presentation form. It is an importance-condition graphwith zones indicating the risk level. The edges of the zones are inclined and correspondto the line in the previous example.
Figure 54: An importance-condition chart showing risk as coloured zones. [90]
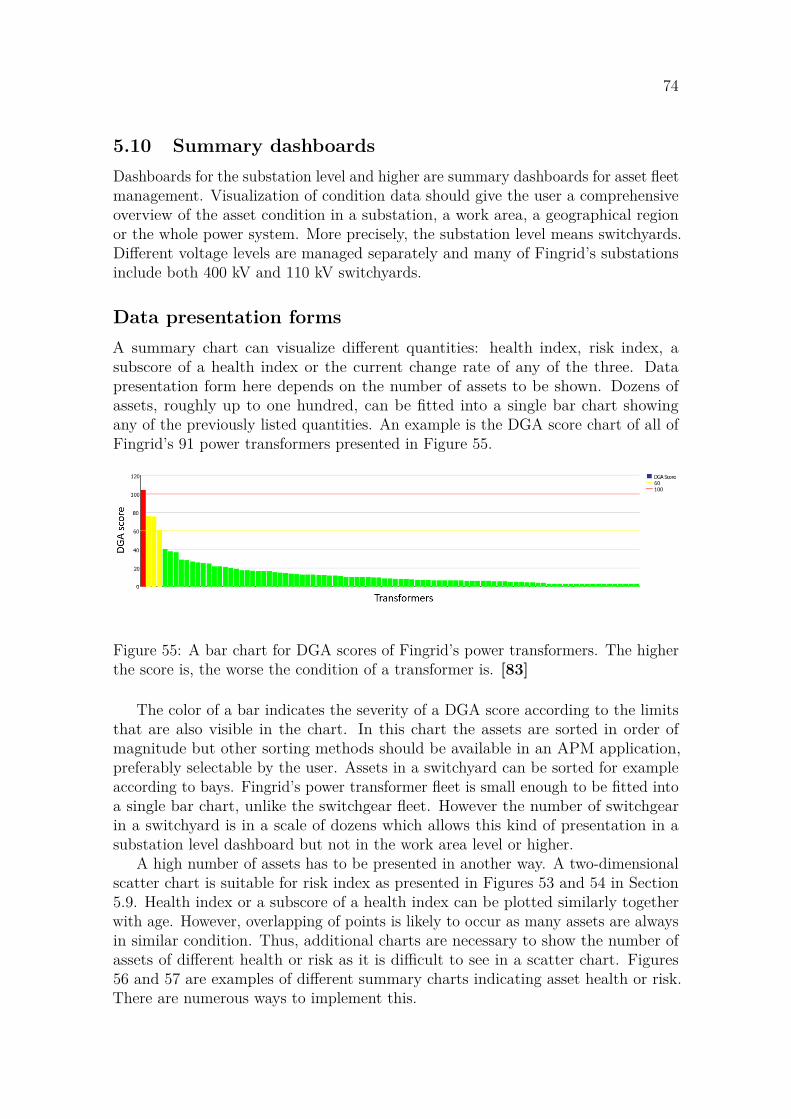
74
5.10 Summary dashboardsDashboards for the substation level and higher are summary dashboards for asset fleetmanagement. Visualization of condition data should give the user a comprehensiveoverview of the asset condition in a substation, a work area, a geographical regionor the whole power system. More precisely, the substation level means switchyards.Different voltage levels are managed separately and many of Fingrid’s substationsinclude both 400 kV and 110 kV switchyards.
Data presentation formsA summary chart can visualize different quantities: health index, risk index, asubscore of a health index or the current change rate of any of the three. Datapresentation form here depends on the number of assets to be shown. Dozens ofassets, roughly up to one hundred, can be fitted into a single bar chart showingany of the previously listed quantities. An example is the DGA score chart of all ofFingrid’s 91 power transformers presented in Figure 55.
Figure 55: A bar chart for DGA scores of Fingrid’s power transformers. The higherthe score is, the worse the condition of a transformer is. [83]
The color of a bar indicates the severity of a DGA score according to the limitsthat are also visible in the chart. In this chart the assets are sorted in order ofmagnitude but other sorting methods should be available in an APM application,preferably selectable by the user. Assets in a switchyard can be sorted for exampleaccording to bays. Fingrid’s power transformer fleet is small enough to be fitted intoa single bar chart, unlike the switchgear fleet. However the number of switchgearin a switchyard is in a scale of dozens which allows this kind of presentation in asubstation level dashboard but not in the work area level or higher.
A high number of assets has to be presented in another way. A two-dimensionalscatter chart is suitable for risk index as presented in Figures 53 and 54 in Section5.9. Health index or a subscore of a health index can be plotted similarly togetherwith age. However, overlapping of points is likely to occur as many assets are alwaysin similar condition. Thus, additional charts are necessary to show the number ofassets of different health or risk as it is difficult to see in a scatter chart. Figures56 and 57 are examples of different summary charts indicating asset health or risk.There are numerous ways to implement this.
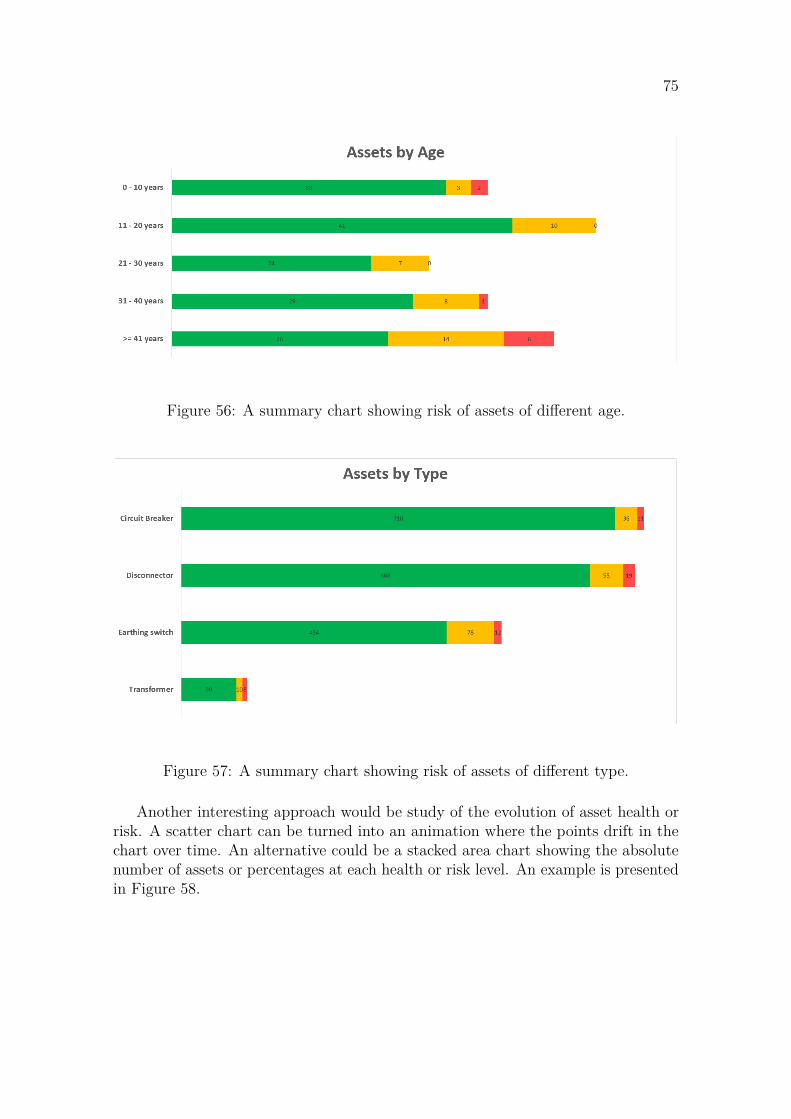
75
Figure 56: A summary chart showing risk of assets of different age.
Figure 57: A summary chart showing risk of assets of different type.
Another interesting approach would be study of the evolution of asset health orrisk. A scatter chart can be turned into an animation where the points drift in thechart over time. An alternative could be a stacked area chart showing the absolutenumber of assets or percentages at each health or risk level. An example is presentedin Figure 58.

76
Figure 58: A stacked area chart showing the evolution of the risk distribution in anasset fleet.
Other featuresSummary dashboards present an overview of asset condition. Some additional featuresrelated to asset condition management and work management are necessary, too. Asdiscussed in Section 5.4, alarm list and maintenance schedules are useful in asset leveldashboards and they can be aggregated to higher level summary dashboards. Forexample a service provider who is working at a substation needs to see all the alarms ofthat substation in a substation level dashboard. A regional maintenance coordinatorneeds to see all the alarms in the geographical region under his responsibility.
Visually an informative feature is a spatial view. Summary dashboards shouldinclude a map showing geographical region, work areas and substations. Drill downto an area or a substation should be possible in a spatial view. Previously presentedsummary charts, alarms and scheduled maintenance activities could be also integratedto a spatial view to provide easily understandable overall information of the currentsituation. Even though condition monitoring of transmission lines in an APMapplication is not considered at this stage, the network model could be integratedfrom another system to a spatial view in an APM application. Fingrid is usingArcGIS for spatial asset data modeling of transmission lines and substations.
Useful features in summary dashboards in addition to the actual condition datavisualization are listed below.
• Alarm list including alarm history
• Maintenance schedules and history
• Spatial view with drill down, summary charts and network model

77
5.11 Alarm functionalitiesAlarms notify the user about abnormal asset conditions as condition data is notsupposed to be manually monitored. The purpose of alarm functionalities overlap withanomaly detection to some extent as the objective of both is to pinpoint deviationsin a data set. However, alarms are more related to the technical implementation ofan APM application whereas anomaly detection is purely processing and analysis ofdata. This section concentrates on what kind of alarm functionalities are necessaryin an APM application. The idea of the trend alarms was learned by studying thecurrent implementation of SF6 gas alarms in PI.
Alarm limitsFor some quantities it is possible to unambiguously define limits within which ameasured value has to be. For example the conventional low-pressure alarms in aSF6 circuit breaker are a built-in feature configured by the manufacturer, as statedin Section 4.1. The alarms in an APM application can be set accordingly. Anotherexample is circuit breaker operation time. The manufacturer of a circuit breakergives limits for the operation time of a healthy circuit breaker. Simple alarm limitscan be used in an APM application for this kind of quantities. The user has to beable to manually set multiple low limits and high limits for measured quantities ofindividual assets and an asset group such as assets of an equal model. Alarm limitsof SF6 pressure can be automatically fetched via an interface from nameplate datain an EAM.
There are no obvious limits for many performance quantities because they haven’tbeen studied so far. In this case the limits should rely on fleet analysis and shouldthus be self-adjusting. The idea is that performance values of all assets of an equalmodel are considered. The majority of the assets are healthy, and thus the alarmlimits should adjust to trigger when a value differing from the majority is detected.
Trend alarmsPrevious sections showed that most condition monitoring data is presented in form oftime series. In addition to continuous online monitoring like SF6 pressure monitoring,performance quantities calculated from more complex data like sound spectra andcurrent profiles allow simple time series presentation. Thus, it is essential to haveappropriate alarms for time series trends. The changes in a trend can be rapidor slow. For example SF6 gas in a circuit breaker may leak at different leak rates.Separate algorithms are needed to detect different slopes of trends.
The idea of a simple algorithm for detecting rapid changes is to calculate thechange of the measured quantity in respect of a past average for example from 30days or a number of switchgear operations [42]. No time frame has to be defined forthe change. Slow changes do not trigger the alarm as the 30 days average changesalong with a slow change and the differences between the average and the measuredvalues remain small. The change can be a drop or an increase of a certain percentage

78
or an absolute quantity. The magnitude of change has to be configured for each assettype. In addition, the direction of change has to be considered for the reasons thatare explained in the following list.
• SF6 pressure: Drop and increase has to be considered. Typically the pressuredrops due to a leakage but an increase is also possible in abnormal conditions.In 2018, an increased pressure was discovered in a gas compartment of a GISprior to a breakdown. Temperature affects the operation of a gas density sensorso it is unclear if the increased pressure was due to a real increase or falsemeasurement results. However, it was an indication of an abnormal conditionthat should have triggered an alarm.
• Fault gases: Fault gas formation increases in a power transformer due todeterioration of insulation. An increase can be caused by an actual fault orincreased loading. However, a sharp increase of fault gas formation is alarmingregardless of the reason and should thus trigger an alarm. A decrease of faultgas formation can be caused by a decrease of transformer loading. An alarm isnot necessary for a decrease.
• Building temperature: A sharp increase of a temperature is alarming. Faultyequipment may overheat which has to be detected. A sharp decrease howevershould not be set to trigger an alarm because opening of doors would be followedby false alarms. A decrease caused by a fault in heating equipment will not besharp because of slow heat transfer in building structures. Such an alarmingdecrease is to be detected by an algorithm made for slow changes.
• Performance quantities: There is no real-life experience yet how changesin condition of switchgear reflect to most of the performance values. Thus,configuring parameters for alarms is challenging. Both directions of changeshould trigger an alarm until a reason to change the implementation appears.
An algorithm for detecting slow changes is based on slopes of trend curves [42].The objective is to detect a change that will lead to a failure if the change continues.A great example is SF6 pressure. A minor leakage decreases the pressure and one dayit will reach a critical level. The idea is to detect the leakage right after it has begun.Sharp bounces should be ignored. For example bright sunshine in a hot day can heata gas density sensor to indicate an increased pressure compared to the previous daythat was cloudy and cold [9]. This is not a changing long-term trend and thereforeit should not trigger a long-time trend alarm.
A linear regression is applied to data in a period of time, for example in 30 or 60days. The slope of the regression line is calculated. If the magnitude of the slopeexceed a defined limit, an alarm is triggered. [42] The challenge here is setting thelimit of the slope. Currently Fingrid has a circuit breaker which is leaking SF6 gasbut it does not trigger the slow alarm because the leak rate, the slope, is minimal.However, the circuit breaker had to be refilled with gas in the past years which meansthe leakage is not negligible either. The leakage will be repaired as soon as the state

79
of the network allows an outage. Too low a limit of the slow alarm would cause falsealarms which is not too serious, though, because the condition monitoring system isnot integrated to switchgear control. Alarming data can be manually analysed andignored if the alarm is proved false.
NotificationsNotifications are email or SMS messages that are automatically sent to a groupof users to inform them about an activated alarm. An APM application shouldallow enabling notifications for user groups at different levels of asset hierarchy andalternatively according to asset type. Basically a user wants to receive notificationsabout assets under his responsibility. For example notifications from assets in a workarea should be sent to the service provider that is responsible for the concerned workarea. The allocation of the main user groups for notifications is as follows:
• Geographical region: Regional maintenance coordinator
• Work area: Service provider
• Asset type: Equipment subject matter expert, Control centre
5.12 Mobile applicationA mobile application of an APM application is necessary for on-site work as conditiondata is useful for inspections and fault diagnostics. Equipment with suspiciousmeasurement results can be inspected with extra care and faulty equipment can bediagnosed with help of the measurement data. A mobile application must be simpleand easy to use because it is used outdoors in variable weather conditions. Onlynecessary content has to be shown. When working on-site, only the data related tothat substation is interesting.
The most necessary element in a mobile application is the dashboard for onlineswitchgear inspections. A service provider works in an outdoor switchyard executingthe test-operations in remote collaboration with the control centre. The serviceprovider needs access to the measurement data in a mobile device shortly after anoperation to verify whether the operation was appropriate or not.
Raw data from switchgear like coil and motor current profiles may be useful formore detailed diagnosis of equipment. In addition, substation level dashboards cangive an overall picture of the situation in a substation. Thus, this content would beuseful for work on site. However, efficiency in usability is not as important as in caseof the online switchgear inspection because the need to access this data is occasional.

80
6 Conclusions and further work
6.1 ConclusionsThis Thesis documented Fingrid’s current situation with online condition monitoringsolutions. The outcome of the study points out that online condition monitoring iscurrently concentrated on switchgear, power transformers and substation buildings.However, the IoT solutions are under intensive development and thus new solutionswill come up in the near future for other asset types, too.
The IoT solutions for switchgear and buildings will produce a lot of new data someof which have however been available before to a small extent. Thus, visualization ofthat data was sketched from scratch for Fingrid’s needs. Necessary condition datafrom power transformers is already available whereas the visualization turned out tobe limited. The most important basic charts and analyses are available but morevalue can be obtained by enhancing the visualization and the usability of the data.The useful elements of the current implementation were reviewed in this Thesis. Thescope did not allow further development of analyses.
There are two types of condition data that determine Fingrid’s requirementsfor data visualization in an APM application: time series data and event data.Measurements of continuous processes, like SF6 pressure, produce continuous timeseries data. Switchgear operations and oil samples and electrical measurements ofpower transformers produce event data. A significant difference is the amount ofdata as events occur only a few times in a year. In terms of visualization techniques,the needs are correspondingly divided into two categories: Time series presentationand reporting formats.
The most important data presentation form is time series. A time series trendindicates how the value of a monitored quantity changes along with aging of equipmentwhich is useful information for preventive maintenance decision-making. Visualizationof time series trend is informative for both, continuous time series data and event data.In case of event data, specific performance quantities have to be calculated out ofthe raw data to allow time series presentation. Similarities in technical performanceof assets and relations between measured quantities can be analysed by comparingtrend patterns. Thus, it is important to have efficient time series functionalities in anAPM application. Analysis of multiple curves in a time series chart requires scalableaxes, cursors and separately adjustable time frames of curves.
In addition to time series presentation, a lot of data can be visualized in othertypes of charts and in tabular formats. This kind of visualization is closer to reportingthan monitoring of a continuous industrial process. Fault gas signatures of powertransformers are visualized in bar charts and fault profile correlations are calculatedin a table. Current measurements from switchgear are in form of profiles and asummary table is needed for performance values of online inspection routines. Ingeneral, all event data should be available in a tabular format in addition to theactual visualization.
An APM application can bring additional value by combining data of differentmeasurements. Data from an asset can be useful when combined with data from

81
other assets in the same bay or in the substation. For example primary current datais stored at bay level, primary circuit temperature is measured on an asset in a bayand outside temperature is measured at the substation building. Linking all the datatogether allows analysis of primary circuit heating behaviour. Combining data ispossible by means of asset hierarchy which should be fetched from an EAM.
It is questionable if any single APM application will fulfill the requirements. Timeseries data management is different business than data reporting. An APM applicationloses its purpose as an all-encompassing system for asset condition management if itcannot respond to the requirements as other supporting applications are needed. Incase a decent APM application is not available, a considerable alternative for Fingridcould be implementing a custom platform that combines separate specific tools fortime series data presentation and reporting. Fingrid needs agile tools that allowefficient usability of data as the IoT development will create new data to be analysedin the near future. The deficiency of such a custom solution is that implementationof asset level dashboards is probably not possible as illustrated in Section 5.6. Datawill divide into the two separate applications according to the form of visualizationinstead of logical division by the context regarding the physical structure of themonitored equipment. A value of an APM application would be integration of allcondition monitoring data to a single application.
6.2 Further workThe IoT solutions will dramatically increase the amount of available condition datain a few upcoming years. The current challenge is finding an APM application orimplementing a custom platform that features efficient usability of data to access theinformation that the data can reveal. In case of switchgear, the interest is findingout what kind of faults the data will reveal in reality and how.
Once some experience has accumulated, switchgear condition modeling by meansof measurement data needs to be studied. Asset health and risk assessment is relevantonly with appropriate condition models that do not exist yet for switchgear.
Data analytics is another subject to be studied in the future. The performancequantities introduced in this Thesis are the starting point. It is certain that anomalydetection needs to be developed. Applying artificial intelligence in form of machinelearning requires a lot of data that is not yet available.
At the sensor endpoint, possibilities for development are wide. IoT sensor unitshave to be developed to fit in 400 kV switchgear with separate control cabinets.There are also many asset types to be monitored in addition to switchgear and powertransformers. Studies can be carried out to find efficient methods of data acquisitionfor online condition monitoring.
Digital substation is another interesting trend that will probably take over thedesign of substations. Online condition monitoring solutions need to be studied fromgreenfield implementation point of view, too. A limiting constraint in the currentdevelopment of IoT solutions is the demand for retrofitting. More sophisticatedsolutions can be implemented to substations in the design phase and factory-fittedin new equipment.

82
7 SummaryFingrid is making the transition from time-based maintenance to condition-basedmaintenance in order to increase the cost-efficiency of substation asset conditionmanagement and to prevent equipment failures. Digitalization improves real-timevisibility to asset condition as Fingrid is developing an Internet of Things conceptfor online asset condition monitoring.
The objective of this Thesis was to specify Fingrid’s requirements for assetcondition data visualization in an Asset Performance Management application. Asecondary objective was to document Fingrid’s IoT concept and existing conditionmonitoring practices. Asset maintenance strategies, digitalization and Internet ofThings were discussed in order to understand the background of this study and thedriving forces behind Fingrid’s IoT concept. The IoT concept was introduced andFingrid’s condition monitoring solutions including the new IoT solutions and theexisting solutions were explained. For the IoT data of switchgear, simple illustrationsof dashboards were drawn to show how the data could be visualized in an APMapplication. Regarding power transformers, the necessary basic elements for conditiondata visualization were reviewed. All the available condition data was listed inAppendix B and specifications for condition data visualization were listed in AppendixC. Asset health and risk assessment and a few other important features of an APMapplication were also discussed.
Online condition monitoring is currently concentrated on switchgear, powertransformers and substation buildings. The IoT solution for switchgear consists oflow-cost sensor units installed in switchgear control cabinets and bay marshallingcabinets. Currents in control circuits and current transformer secondary circuitsare measured and microphones record sound phenomena. The main benefit of theswitchgear IoT solution is gained by combining it with the online inspection routinethat allows switchgear to be frequently test-operated without causing an outage.Power transformers are equipped with online DGA instruments which is a well-established practice. In substation buildings, the climate and water leakages aremonitored with low-cost IoT sensors.
The conclusion of the study was that there are two types of condition datathat determine Fingrid’s requirements for data visualization in an APM application:time series data and event data. Monitoring of continuous processes, like SF6 gaspressure monitoring, produces a large amount of continuous time series data. A toolwith efficient functionalities for time series data presentation and analysis is needed.Switchgear operations and oil sampling produce event data. It is visualized in formsof data reporting and special analyses in addition to time series trend presentation.The amount of event data is small even though it will increase due to IoT.
It is questionable if any single application will fulfill the requirements. Timeseries data management is different business than data reporting. In case a decentAPM application is not available, a considerable alternative for Fingrid could beimplementing a custom platform to combine separate tools for time series datapresentation and reporting. Fingrid needs agile tools that allow efficient usability ofdata as the IoT development will create new data to be analysed in the near future.

83
References[1] Ahmad, R., Kamaruddin, S. An overview of time-based and condition-based
maintenance in industrial application. Computer & Industrial Engineering,online journal, 2012, vol. 63, issue 1, p. 135-149. Accessed on 5.11.2018.
[2] Hinchberger, B. Substations in the digital age. The Maga-zine, Energy, Siemens online magazine, 9.8.2018. Accessed on15.10.2018. Available: https://www.siemens.com/customer-magazine/en/home/energy/power-transmission-and-distribution/digital-electrical-substation.html.
[3] Kuosa, D. Vika- ja kunnossapitotietojen hyödyntäminen suurjännitekytkinlait-teiden kunnonhallinnassa. Master’s Thesis, University of Technology, Electricalengineering and communications, Espoo, 2007.
[4] Fingrid Oyj. S52104 Maintenance of circuit breakers. Internal specification.2018.
[5] Fingrid Oyj. S52105 Maintenance of disconnectors. Internal specification.2018.
[6] Jardine, A., Lin, D., Banjevic, D. A review on machinery diagnostics andprognostics implementing condition-based maintenance. Mechanical Systemsand Signal Processing, online journal, 2006, vol. 20, issue 7, p. 1483-1510.Accessed on 5.11.2018.
[7] Kone Oyj. Intelligent KONE 24/7 Connected Services. Product in-formation. Accessed on 5.12.2018. Available: https://www.kone.com/en/products-and-services/solutions-for-existing-buildings/24-7-connected-services.aspx
[8] Kivilinna-Korhola, T. Fleet management ohjelmistot – Ponsse, Komatsu jaJohn Deere. Thesis, University of Applied Sciences, Forestry, Mikkeli, 2016.
[9] Tammi, J. Specialist. Switchgear. Fingrid Oyj. Helsinki. Interviews [10/2018-2/2019]
[10] Fingrid Oyj. Maximo. Fingrid’s Enterprise Asset Management application anddatabase. 2018.
[11] Fingrid Oyj. Digital substation. Online material. Accessed on 5.11.2018. Avail-able: https://www.fingrid.fi/globalassets/dokumentit/fi/yhtio/toimikunnat/neuvottelukunta/digitaalinen-sahkoasema-9-2018.pdf.
[12] Koivula, P. Digitaalisen sähköaseman toteutus projektitoimittajan näkökul-masta. Master’s Thesis, University of Vaasa, Faculty of Technology, Vaasa,2015.

84
[13] Valkola, A. Expert. Communications, power system monitoring and control.Fingrid Oyj. Helsinki. Interviews [10/2018-2/2019]
[14] ABB. Substation evolution from conventional to digital. Accessedon 5.11.2018. Available: https://new.abb.com/substation-automation/systems/digital-substation/bridging-the-gap.
[15] Kunsman, S. IEC 61850 in Digital Substation and Cyber security. 72ndAnnual Georgia Tech Protective Relaying Conference, Conference presentation.2.-4.5.2018. Atlanta, Georgia Tech Hotel and Conference Center. Accessedon 5.11.2018. Available: https://new.abb.com/substation-automation/systems/digital-substation/bridging-the-gap.
[16] Fingrid Oyj. Digital substation. Project plan, internal document, 2017.
[17] Fingrid Oyj. Pernoonkoski Digitalization. Project plan, internal document,2018.
[18] Arteche. Optical Current Transformer. Product information, manufacturerwebsite. Accessed on 5.11.2018. Available: https://www.arteche.com/en/products/optical-current-transformer.
[19] Trachte. Substation relay protection buildings. Product information. Accessedon 5.2.2019. Available: http://www.trachteusa.com/trachte_building_photos.html
[20] VTT. Productivity Leap with IoT. Visions of the Internet of Things witha special focus on Global Asset Management and Smart Lighting. Onlinepublication. Espoo. 2013. Accessed on 6.11.2018. Available: https://www.vtt.fi/inf/pdf/visions/2013/V3.pdf.
[21] ABB. Feeder protection and control REF615 IEC. Product in-formation. Accessed on 20.2.2019. Available: https://new.abb.com/medium-voltage/distribution-automation/numerical-relays/feeder-protection-and-control/relion-for-medium-voltage/feeder-protection-and-control-ref615-iec
[22] ABB. Free Standing Fiber Optic Current Sensor FOCS-FS for digital substa-tions. Product information. Accessed on 5.2.2019. Available: https://new.abb.com/high-voltage/instrument-transformers/current/FOCS-FS
[23] ABB. Capacitor Voltage Transformer CPB (72-800 kV). Product informa-tion. Accessed on 1.2.2019. Available: https://new.abb.com/high-voltage/instrument-transformers/voltage/cpb
[24] Ross, R.G. Can You Differentiate ‘Knowledge Workers’ by HowMuch Improvising or Innovating is Desired? Online article. Ac-cessed on 5.2.2019. Available: http://www.brsolutions.com/
85
can-you-differentiate-knowledge-workers-by-how-much-improvising-innovating-is-desired
[25] Saravana Switchgears. Bay Marshalling Kiosk. Product informa-tion. Accessed on 5.2.2019. Available: https://www.indiamart.com/saravana-switchgears/products.html
[26] Wikipedia. Internet of Things. Online encyclopedia. Accessed on 6.11.2018.Available: https://en.wikipedia.org/wiki/Internet_of_things
[27] Kone Oyj. Taking services to the next level. Online article. Accessedon 5.12.2018. Available: https://www.kone.com/en/news-and-insights/stories/taking-elevator-services-to-the-next-level.aspx
[28] Microsoft. Azure. Product information. Accessed on 19.2.2019. Available:https://azure.microsoft.com/en-us/
[29] Databricks. Apache Spark. Product information. Accessed on 19.2.2019.Available: https://databricks.com/spark/about
[30] General Electric. What is Edge Computing? Online article. Ac-cessed on 6.11.2018. Available: https://www.ge.com/digital/blog/what-edge-computing
[31] Herlihy, M. Blockchains and the Future of Distributed Computing. ACMSymposium on Principles of Distributed Computing. 25.-27.7.2017, WashingtonDC, USA. DOI: 10.1145/3087801.3087873.
[32] DeBeasi, P. A Guidance Framework for Architecting the Internet of ThingsEdge. Gartner research note. 2017. Available: https://www.gartner.com/doc/3783144/guidance-framework-architecting-internet-things
[33] Microsoft. Azure IoT Edge. Product information. Accessed on 5.12.2018.Available: https://docs.microsoft.com/en-us/azure/iot-edge/
[34] Canonical. Landscape. Product information. Accessed on 5.12.2018. Available:https://landscape.canonical.com/
[35] Lindholm, K. Regional Manager. Hämeenlinna. Interviews [10/2018-2/2019]
[36] Mörsky, J. Relesuojaustekniikka. Hämeenlinna, Otatieto, 1992.
[37] Fingrid Oyj. Equipment failure statistics. 2017.
[38] Mertanen, J. Specialist. Asset condition management. Fingrid Oyj. Helsinki.Interviews [10/2018-2/2019]
[39] Elovaara, J., Haarla, L. Sähköverkot II. Helsinki, Otatieto, 2011.

86
[40] Rabie, M., Frank, C. M. Assessment of Eco-friendly Gases for ElectricalInsulation to Replace the Most Potent Industrial Greenhouse Gas SF6. En-vironmental Science & Technology, online journal, 2018, vol. 52, issue 2, p.369-380. Accessed on 4.3.2019.
[41] Trafag. SF6 Gas Density Monitors. Product information. Ac-cessed on 4.3.2019. Available: https://www.trafag.com/en/products/sf6-gas-density-monitors-and-sensors/sf6-gas-density-monitors/
[42] Fingrid Oyj. PI. SCADA historian application and database.
[43] Fingrid Oyj. S52104-E11 Online inspection of 110 kV circuit breakers. Internalspecification. 2018.
[44] Fingrid Oyj. Substation diagrams. Internal documentation. 2018.
[45] Noiseless Acoustics. Product information. Accessed on 5.12.2018. Available:https://nlacoustics.com/wp-content/uploads/2018/03/Noiseless_NL_Sense_A4_compressed.pdf
[46] Laitinen, T. Expert. Switchgear. Fingrid Oyj. Helsinki. Interviews and emails[10/2018-2/2019]
[47] ABB. Air-insulated switchgear. Product information. Accessed on 5.12.2018.Available: https://new.abb.com/high-voltage/AIS
[48] ABB. High Voltage Instrument Transformers. Product information. Ac-cessed on 19.2.2019. Available: https://new.abb.com/high-voltage/instrument-transformers
[49] Fingrid Oyj. IoT solutions for asset condition management. Project plan,internal document, 2018.
[50] Ylitalo, J. Katkaisijoiden kunnossapito CBA 3000 -katkaisija-analysaattorilla.Thesis, University of Applied Sciences, Electrical Engineering, Satakunta, 2017.
[51] ABB. GIS substations. Product information. Accessed on 5.12.2018. Available:https://new.abb.com/substations/gis-substations
[52] Ojanen, T. Expert. Power transformers. Fingrid Oyj. Helsinki. Interviews[10/2018-2/2019]
[53] Duval, M. Dissolved gas analysis: It can save your transformer. IEEE ElectricalInsulation Magazine, online journal, 1989, vol. 5, issue 6, p. 22-27. Accessedon 4.12.2018.
[54] Leivo, S. Online DGA-monitoring of power transformers. Vaisala online webi-nar material. 2018. Available: https://www.vaisala.com/sites/default/files/documents/Vaisala%20DGA%20webinar_Apr%202018.pdf

87
[55] General Electric. Multiple Gas and Single Gas Transformer DGA. Product in-formation. Accessed on 5.12.2018. Available: https://www.gegridsolutions.com/md.htm
[56] Fingrid Oyj. TOA4 database. Internal database for results from laboratoryanalysis of transformer oil. 2018.
[57] Secue, J.R., Mombello, E. Sweep frequency response analysis (SFRA) for theassessment of winding displacements and deformation in power transformers.Electric Power Systems Research, Elsevier online journal, 2008, vol. 78, issue6, p. 1119-1128. Accessed on 5.12.2018.
[58] Malpure, B.D., Baburao, K. Failure analysis & diagnostics of power trans-former using dielectric dissipation factor. 2008 International Conference onCondition Monitoring and Diagnosis. 21.-24.4.2008, Beijing, China. DOI:10.1109/CMD.2008.4580334.
[59] General Electric. Intellix BMT 330. Product information. Accessedon 5.12.2018. Available: https://www.gegridsolutions.com/md/catalog/BMT330.htm
[60] Camlin Ltd. Intego TM. Product information. Accessed on 5.12.2018. Avail-able: https://www.camlingroup.com/product/intego-tm
[61] Rashid, N. Short-time Overloading of Power Transformers. Master’s Thesis,Royal Institute of Technology, Department of Electrical Engineering, Västerås,2011.
[62] Electrical Baba. Transformer Winding Temperature Indicator. Online ar-ticle. Accessed on 10.1.2018. Available: https://electricalbaba.com/transformer-winding-temperature-indicator/
[63] Ojanen, T. Muuntajien ikääntyminen ja kunnonhallinta. Article in Fingrid’sinternal Wiki on Transmission Network. 2011.
[64] Lyly, T. Loppuraportti: IoT & edistyneen analytiikan hyödyntämisen pilotti.Internal project report. 2018.
[65] Garcia, B., Burgos, J.C., Alonso, A.M. Transformer tank vibration modelingas a method of detecting winding deformations-part I: theoretical foundation.IEEE Transactions on Power Delivery, online journal, 2006, vol. 21, issue 1, p.157-163. Accessed on 4.12.2018.
[66] CGI Group. IoT for Condition Monitoring. Technical Documentation. Internalproject documentation. 2018.
[67] Fingrid Oyj. Kantaverkon käsikirja. 2011. Internal opus.
[68] Itäpää, A., Lindblad, P. Käämikytkimien käyttö jännitteensäätöön. Article inFingrid’s internal Wiki on Transmission Network. 2011.

88
[69] Fingrid Oyj. Kantaverkon peruskoulutus. Internal opus.
[70] Arteche. An approach to instrument transformers. Online article. Ac-cessed on 5.12.2018. Available: https://www.arteche.com/en/products/capacitive-voltage-transformers
[71] Nepola, K. Specialist. FACTS. Interviews [10/2018-2/2019]
[72] Laatikainen, M. Planning engineer. Grid operation. Helsinki. Interviews[10/2018-2/2019]
[73] STK-Tietopalvelu Oy. Sähkönumerot. Carlo Gavazzi - EM24. Number 66040 04. Equipment specifications. Available: https://www.sahkonumerot.fi/6604004/
[74] Nästi, J. Specialist. HVDC. Fingrid Oyj. Helsinki. Interviews [10/2018-2/2019]
[75] Haltian Oy. Thingsee POD 2. Product information. Ac-cessed on 5.12.2018. Available: https://haltian.com/news/thingsee-pod-2-is-ready-for-sales/
[76] Gartner. Asset Performance Management (APM). Online IT glossary. Ac-cessed on 10.1.2019. Available: https://www.gartner.com/it-glossary/asset-performance-management-APMapplication
[77] OSIsoft. PI System. Product information. Accessed on 20.12.2018. Available:https://www.osisoft.com/pi-system/
[78] Delta-X Research. TOA4 Online. Product information. Accessed on 20.12.2018.Available: http://www.deltaxresearch.com/solutions-online-dga/
[79] IEC 62271-100. High-voltage switchgear and controlgear – Part 100:Alternating-current circuit-breakers. International standard. Version 2.0. 2008.
[80] Flurscheim, C. H. Power circuit breaker theory and design. London, PeterPeregrinus Ltd, 1982. P. 341-343.
[81] Laitinen, T., Lyly, T., Stenstrand, M., Tammi, J. Wireless sensor units foracoustic monitoring of switching devices. CIGRE Session papers & proceedings.Study Committee B3. 2018, Paris, France.
[82] Roima, A. Sähköaseman kytkinlaitteista kerätyn anturidatan hyödyntämi-nen ennustavassa kunnossapidossa. Master’s Thesis, Tampere University ofTechnology, Information and Knowledge Management, Tampere, 2018.
[83] Fingrid Oyj. Cognos. Internal reporting platform. 2019.
[84] Wikipedia. Load duration curve. Online encyclopedia. Accessed on 10.1.2018.Available: https://en.wikipedia.org/wiki/Load_duration_curve

89
[85] Akbari, A., Setayeshmehr, A., Borsi, H., Gockenbach, E. A Software Im-plementation of the Duval Triangle Method. 2008 IEEE International Sym-posium on Electrical Insulation. 9.-12.6.2008, Vancouver, Canada. DOI:10.1109/ELINSL.2008.4570294.
[86] Duval M. The duval triangle for load tap changers, non-mineral oils andlow temperature faults in transformers. IEEE Electrical Insulation Magazine,online journal, 2008, vol. 24, issue 6, p. 22-29. Accessed on 10.1.2019. DOI:10.1109/MEI.2008.4665347.
[87] Srinivasan, V., Subathra, B., Srinivasan, S., Kannan, S. Asset Management inSmart Grids Using Improved Dissolved Gas Analysis. International Conferenceon Power and Advanced Control Engineering. 12.-14.8.2015, Bangalore, India.DOI: 10.1109/ICPACE.2015.7274968.
[88] Brown, R.E., Frimpong, G., Willis, H.L. Failure Rate Modeling Using Equip-ment Inspection Data. IEEE Transactions on Power Systems, online journal,2004, vol. 19, issue 2, p. 782-787. Accessed on 10.1.2019. DOI: 10.1109/TP-WRS.2004.825824.
[89] Tammi, J. Sähköasemien tärkeysluokitukset ja kokonaisindeksit. Internalspecification. 2019.
[90] ABB. Asset condition and risk assessment. Product information. Accessedon 1.2.2019. Available: https://new.abb.com/medium-voltage/service/advanced-services/asset-condition-and-risk-assessment
[91] Fingrid Vuosikertomus 2017 Available: https://www.fingrid.fi/globalassets/dokumentit/fi/sijoittajat/taloudelliset-julkaisut/vuoskareita/fingrid_vuosikertomus_2017.pdf
[92] ABB. Ellipse APM application. Product information. Accessedon 5.12.2018. Available: https://new.abb.com/enterprise-software/asset-optimization-management/asset-health-center
[93] Pieniazek, P.E. Condition On-Line Monitoring. Presentation material, VIEngineering. 19.10.2011. Accessed on 12.2.2019. Available: https://www.slideshare.net/vwedelich/electrical-condition-monitoring-part-2

A Fingrid’s substation condition dataThis Appendix lists Fingrid’s condition data in Table 1, including the new IoT dataand the existing data. The table includes the quantities for each asset type, the datasources and information whether the monitored equipment is online or offline at thetime of a measurement.
Table 1: Fingrid’s condition data.
Circuit breaker Online Offline Data source Replaced by IoT / New IoTCharging motor operation time X Maximo ReplaceCharging motor current, open X Maximo ReplaceCharging motor current, close X Maximo ReplaceCharging motor RPM NewPrimary operation time, open X Maximo ReplacePrimary operation time, close X Maximo ReplaceOperation time, open NewOperation time, close NewTrip coil 1 current profile X Local disk ReplaceTrip coil 2 current profile X Local disk ReplaceClose coil current profile X Local disk ReplaceOperations count X Maximo Replace
Gear noise NewDamper noise New
Control cabinet temperature NewControl cabinet humidity NewPrimary circuit temperature New
Contact resistance with connectors X MaximoContact resistance without connectors X MaximoTrip 1 coil minimum voltage X MaximoTrip 2 coil minimum voltage X MaximoClose coil minimum voltage X Maximo
Gas moisture X MaximoGas filled X MaximoGas SF6 density X PI
Disconnector / Earthing switchMotor operation time, open X Maximo ReplaceMotor operation time, close X Maximo ReplaceMotor current, open X Maximo ReplaceMotor current, close X Maximo ReplaceMotor RPM, open NewMotor RPM, close NewOperations count X Maximo Replace
Gear noise New
Control cabinet temperature NewControl cabinet humidity NewPrimary circuit temperature New
Contact resistance with connectors X MaximoContact resistance without connectors X Maximo
Power transformerWinding temperatures X PIOil temperatures X PI
Power X PICurrent X PI
Vibration New
Online DGA X PILaboratory DGA X TOA4Laboratory oil analysis X TOA4SFRA X Local diskDissipation factor X Maximo
Substation buildingOutdoor temperature X PI ReplaceTemperatures NewHumidities NewWater leakages New
Instrument transformersPrimary circuit temperature NewVT secondary voltage New

B Specifications for condition data visualizationThis Appendix lists the visualized data for switchgear, power transformers andsubstation buildings in Table 2. The table includes quantities and data presentationforms. Switchgear data is segmented in accordance with the skecthes of dashboardspresented in Section 5.6. For power transformers and buildings, the necessary elementsof asset level dashboards are listed. They are explained in Sections 5.7 and 5.8.
Table 2: Specifications of visualized quantities and data presentation forms.
SwitchgearTrip 1 coil current profile: Performance quantities
Max Time series TableDuration Time series TableIntegral Time series Table
Trip 2 coil current profile: Performance quantities
Max Time series TableDuration Time series TableIntegral Time series Table
Close coil current profile: Performance quantities
Max Time series TableDuration Time series TableIntegral Time series Table
Related parameters***
Circuit breaker operation timeOpen: Primary Time series TableOpen: Mechanical Time series TableClose: Primary Time series TableClose: Mechanical Time series Table
Related parameters***
Motor operation timeOpen Time series TableClose Time series Table
Motor current profile, Open / Close: Performance quantities
Max Time series TableFlat Time series TableIntegral Time series Table
Motor sound Kurtosis Time series TableCrest factor Time series TablePeak-To-Peak value Time series TableRMS value Time series Table
Related parameters***
Damper soundKurtosis Time series TableCrest factor Time series TablePeak-To-Peak value Time series TableRMS value Time series Table
Related parameters***

92
SF6 pressureL1, L2, L3 Time series
Related parameters***
Related parameters ***Outside temperature Time seriesControl cabinet temperature Time seriesControl cabinet humidity Time seriesPrimary circuit temperature(s) Time seriesPrimary circuit current Time series
Motor RPM profile
Motor current profile
Motor soundSound signalSound spectrogramSpectral rolloffSpectral centroid
Event list****
Damper soundSound signalSound spectrogramSpectral rolloffSpectral centroid
Event list****
Coil current profile
Event list****
Event list ****TimestampOperation directionFirst operation(Related parameters)
Fleet analysisCharts for events and trends
Event listAssetTimestampOperation directionFirst operationPerformance values(Related parameters)
Filters / SelectionsSubstationBaysAsset typesAsset modelsVoltagesParameter to be displayedOperation directionFirst operationTemperatureMonthsTimestamp

93
Power transformersOnline DGA
Moisture Time seriesAll measured fault gases Time series
Laboratory DGAMoisture Time series Table7 fault gases Time series Table
Fault gas signatureLaboratory DGA results Clustered bar chart
Fault profilesLaboratory DGA results TableCorrelation Table Clustered bar chartDistance Table
DGA scoreLaboratory DGA results Time series Table
Duval trianglesLaboratory DGA results Duval Triangles Table
Laboratory oil analysisInhibitor content Time series TableInterfacial tension Time series TableDielectric breakdown strength Time series TableMoisture Time series Table
Dissipation factorTransformer Time series TableBushings Time series Table
LoadingWinding powers Time seriesWinding currents Time series
TemperatureWinding temperatures Time seriesOil temperatures Time series
Duration curvesApparent power Duration curveWinding temperatures Duration curveOil temperatures Duration curve
Present conditions tableTemperaturesCurrentsPowersOLTC stepFault gases
BuildingsRoom conditions
Temperatures Time seriesHumidities Time seriesOil temperatures Time seriesWater leakages Time series Table

C Table for performance values from online switchgearinspectionTable 3 in this Appendix is a part of the asset level dashboards of switchgear. It isa tool for a service provider who performs an online switchgear inspection routine.The performance values appear in the table after each test-operation of a circuitbreaker or a switch.
95
Tabl
e3:
Ada
shbo
ard
for
onlin
esw
itchg
ear
insp
ectio
nro
utin
e.