assessment of major livestock diseases and - UoN Repository
254
ASSESSMENT OF MAJOR LIVESTOCK DISEASES AND ASSOCIATED PRODUCTION CONSTRAINTS IN A SMALLHOLDER PRODUCTION SYSTEM IN MACHAKOS COUNTY, KENYA. FRED DAVID WESONGA BVM (Makerere), MSC (Reading) A thesis submitted in fulfillment of the requirements for the degree of Doctor of Philosophy University of Nairobi Faculty of Veterinary Medicine Department of Public Health, Pharmacology and Toxicology December 2013
-
Upload
khangminh22 -
Category
Documents
-
view
2 -
download
0
Transcript of assessment of major livestock diseases and - UoN Repository

ASSESSMENT OF MAJOR LIVESTOCK DISEASES AND ASSOCIATED PRODUCTION CONSTRAINTS IN A
SMALLHOLDER PRODUCTION SYSTEM IN MACHAKOS COUNTY, KENYA.
FRED DAVID WESONGA BVM (Makerere), MSC (Reading)
A thesis submitted in fulfillment of the requirements for the
degree of
Doctor of Philosophy
University of Nairobi
Faculty of Veterinary Medicine
Department of Public Health, Pharmacology and Toxicology
December 2013

ii
DECLARATION
This thesis is my original work and has not been presented for a degree in any other University.
____________________________________________
Fred David Wesonga, BVM, MSc
This thesis has been submitted for examination with our approval as the University Supervisors.
_____________________________________________
Prof. P.M. Kitala, BVM, MSc, PhD
_____________________________________________
Prof. J.M. Gathuma, B Vet Sc, MSc, PhD
_____________________________________________
Prof. Njenga Munene J, BVM, MSc, PhD

iii
DEDICATION
This thesis is dedicated to the memory of my late son Allan Bwire Wesonga who had keen interest in what ever I did and his chronic illness gave me inspiration to work hard in life.
And
My wife Esther and Children, Sheila, Stella, Sandra and Seith
(Their love, prayers and endurance to my absence while undertaking field work was the driving engine for my perseverance).

iv
ACKNOWLEDGEMENTS
I express my gratitude to my supervisors who made this thesis possible. Prof. Kitala, Prof. Gathuma, Prof. Munene and Dr. Priscilla Ngumi who tirelessly guided me. This work would not have been possible without the assistance of Dr. Gachohi and the team from ILRI who played a leading role in ensuring the serology analysis succeeded. I am greatly indebted to the farmers recruited for the study in Machakos District. They had amazing interest in the study for which I am greatly indebted. I am very grateful to the late Francis Ongadi and Ken Kabiru who greatly assisted in the field work. I am extremely grateful to the chiefs from Kathome, Kiatineni, Kalandini and Katine who mobilized farmers in their respective sub locations. I would also like to thank Dr. Sam Ndungu, Sam Karua and Evans Otieno from the protozoology division, Muguga, who helped in data collection. The data analysis was done with the assistance of Drs. Bernard Bett and John Gachohi of ILRI. The Kenya Agricultural Research Institute (KARI) gave me the fellowship for which I am most appreciative. For all those people and institutions that played any role and not specifically mentioned kindly accept my appreciation for the support.

v
TABLE OF CONTENTS
Page TITLE i DECLARATION ii DEDICATION iii ACKNOWLEDGEMENTS iv TABLE OF CONTENTS v LIST OF TABLES x LIST OF FIGURES xii LIST OF APPENDICES xiii LIST OF ACRONYMS xiv ABSTRACT xvi CHAPTER 1. GENERAL INTRODUCTION1 1 1.1 Constraints to livestock production 1 1.2 Livestock Industry in Kenya 2 1.3 Constraints to livestock production in Kenya 4 1.4 Objectives 6 1.4.1 Broad Objective 6 1.4.2 Specific Objectives 6 1.5 Structure of the thesis 6 CHAPTER 2. LITERATURE REVIEW 8 2.1 Livestock productivity constraints 8 2.2Tick-bornediseases 10 2.2.1 Cattle 11 2.2.2 Small ruminants 11 2.2.3 Theileriosis/ East Coast Fever (ECF) 11 2.2.3.1 Aetiology 12 2.2.3.2 Transmission and life cycles 12 2.2.3.3 The clinical syndrome 13 2.2.3.4 Diagnosis 15 2.2.3.5 Treatment 16 2.2.4 Anaplasmosis 16 2.2.4.1 Aetiology, biology and clinical syndrome 16 2.2.4.2 Diagnosis 17 2.2.4.3 Treatment 18 2.2.5 Babesiosis 18 2.2.5.1 Aetiology, biology and clinical syndrome 18 2.2.5.2 Diagnosis 19 2.2.5.3 Treatment 20 2.2.6Heartwater 20 2.2.6.1 Aetiology, biology and clinical signs 20

vi
2.2.6.2 Diagnosis 21 2.2.6.3 Treatment 21 2.3 Economic impact of ticks and tick-borne diseases 21 2.4 Control strategies for ticks and tick-borne diseases 24 2.4.1 Acaricide tick control 23 2.4.2 Novel methods of tick control 26 2.4.3 Utilization of genetic resistant cattle 26 2.4.4 Immunization against tick-borne diseases 27 CHAPTER 3. CONSTRAINTS TO LIVESTOCK PRODUCTION IN MACHAKOS COUNTY: A RAPID APPRAISAL 30 3.2 Materials and methods 31 3.2.1 Study area 31 3.2.2 Rapid Rural Appraisal 33 3.2.2.1 Key Informant interviews 33 3.2.2.2. Farmer focus group meetings 34 3.2.3 Rapid Rural Appraisal data collection methods 37 3.2.3.1 Ranking procedure 37 3.2.3.2 Construction of seasonal calendars 38 3.2.3.3 Proportional piling 38 3.2.3.4 Transect walks 38 3.2.4 Secondary data 39 3.3 Results 39 3.3.1 Previous cases of tick-borne diseases in cattle 39 3.3.2 Previous disease cases in sheep and goats 40 3.3.3. State of veterinary infrastructure, market access and water availability 41 3.3.4 Disease constraints to livestock production 43 3.3.5 General constraints to livestock production 45 3.3.6 Perceived seasonal occurrence of disease 48 3.3.7 Relative importance of the different livestock species 47 3.4 Discussion 48
CHAPTER 4. SOCIO-ECONOMIC AND DEMOGRAPHIC CHARACTERISTICS OF SMALLHOLDER LIVESTOCK FARMERS IN MACHAKOS COUNTY 53 4.1 Introduction 53 4.2 Materials and methods 54 4.2.1 Study sites 54 4.2.2 Data collection 54 4.2.3 Data handling and analysis 56 4.3 Results 56 4.3.1 Farm characteristics 56 4.3.2 Land resource 57 4.3.2.1 Size of the farms 57 4.3.2.2 Allocation of land to enterprises 58 4.3.2.3 Rented land 59 4.3.2.4 Household characteristics 61 4.3.3 Farm labour profiles 62

vii
4.3.3.1 Farm labour 62 4.3.3.2 Non-family labour 63 4.3.3.3 Cost of hired labour 64 4.3.4 Variable farm inputs 65 4.3.4.1 Application of commercial fertilizers and manure 65 4.3.5 Membership to co-operatives 66 4.3.6 Other Livestock species reared 69 4.3.7 Sale and prices of milk 67 4.3.8 Provision of veterinary services 68 4.3.9 Tick control 69 4.4 Discussion 70 CHAPTER 5. SERO PREVALENCE OF TICK-BORNE DISEASES AND ASSOCIATED RISK FACTORS IN SMALLHOLDER FARMS IN MACHAKOS COUNTY 75 5.1 Introduction 75 5.2 Materials and methods 76 5.2.1 Study population 76 5.2.1.1 Selection of farms for the cross-sectional study 76 5.2.2 Data collection 79 5.2.3 Sample size determination 79 5.2.4 Collection of biological samples 79 5.2.4.1 Sampling 79 5.2.5 Serological testing 81 5.2.5.1 The ELISA procedure for TBDs 81 5.2.6 Tick infestation 82 5.2.7 Data management and analysis 83 5.2.7.1 Data entry and handling 83 5.2.7.2 Data analysis 84 5.3 Results 85 5.3.1 Characteristics of the surveyed farms 85 5.3.2 Livestock species kept and herd size 85 5.3.3 Age and sex distribution of livestock 86 5.3.4 Grazing management 87 5.3.5 Tick control and tick-borne diseases 89 5.3.6 Sero-prevalence of tick borne-diseases in cattle 90 5.3.6.1 Univariate analysis of factors associated with the seroprevalences rates of tick-borne disease 92 5.3.6.2 Multivariate analysis for factors associated with the seroprevalence of tick-borne diseases 95 5.3.6.3 Multivariate analyses without variable “division” for tick-borne diseases 97 5.3.7 Tick challenge 98 5.3.8 Diseases diagnosed during the survey 100 5.4 Discussion 100

viii
CHAPTER 6. MORBIDITY AND PRODUCTIVITY ESTIMATES IN SMALLHOLDER LIVESTOCK FARMS IN MACHAKOS COUNTY 107 6.1 Introduction 107 6.2 Materials and methods 108 6.2.1 Study implementation 108 6.2.1.1 Selection of farms for the longitudinal study 108 6.2.1.2 Recruitment of study animals 108 6.2.2 Monitoring for animal health and productivity 109 6.2.2.1 Data collection 109 6.2.2.2 Disease diagnosis and reporting 110 6.2.2.3 Confirmation of tick-borne infections 112 6.2.2.4 Diagnosis and confirmation of other common infections 113 6.2.2.5 Collection of data on animal productivity and herd dynamics 114 6.2.3 Estimating productivity parameters 115 6.2.3.1 Productivity rate 115 6.2.3.2 Birth weights, weight at weaning and age at weaning 115 6.2.3.3 Estimation of milk production 115 6.2.4 Incidence rates 116 6.2.5 Meteorological data 117 6.3 Data management and analysis 117 6.4 Results 118 6.4.1 Meteorological data 118 6.4.2 Characteristics of the study farms 119 6.4.3 Cohort dynamics 120 6.4.3.1 Cattle cohort dynamics 120 6.4.3.2 Kids and lambs dynamics on the study farms 122 6.4.4 Morbidity rates 125 6.4.4.1 Incidence of East Coast fever 125 6.4.4.2 Incidence of other diseases and conditions 127 6.4.5 Mortality rates 131 6.4.6 Morbidity in sheep and goats 132 6.4.7 Estimating productivity parameters 133 6.4.7.1 Mean daily milk yield 133 6.4.7.2 The annual lactation curves 133 6.4.7.3 Birth weights and age at weaning 134 6.4.7.4 Weaning age 136 6.4.7.5 Bull/ cow ratio 137 6.4.7.6 Female fertility and management 138 6.4.7. 7 Livestock off-takes 138 6.5 Discussion 139

ix
CHAPTER 7. EFFICACY OF EAST COAST FEVER VACCINE AND ECONOMIC ANALYSIS OF A TRADITIONAL SMALLHOLDER CATTLE PRODUCTION FARMING ENTERPRISE IN MACHAKOS COUNTY 148
7.1 Introduction 148 7.2 Materials and methods 151 7.2.1 Trial designs 151 7.2.1.1 Farm and animal selection and sample size determination 151 7.2.1.2 Selection of farms for the trial on the efficacy of the ECF vaccine 151 7.2.1.3 Immunization procedure 153 7.2.1.4 Surveillance for East Coast fever 154 7.2.1.5 Data Collection 156 7.2.2 Data management and analysis 157 7.2.2.1 Estimation of ECF incidence and vaccine efficacy 158 7.2.2.2 Estimation of the cost of application of acaricides and treatment of East Coast fever 158 7.2.2.3 Cost of immunization per herd 159 7.2.2.4 Economic analysis 160 7.2.2.5 Assumptions of the analysis 161 7.2.2.6 Determination of association between vaccination and incidence of ECF 161 7.3 Results 162 7.3.1 Study population 162 7.3.2 Sero-conversions following immunization against ECF 163 7.3.3 Incidence of tick-borne diseases 164 7.3.4 Association between vaccination and incidence of East Coast fever 166 7.3.5 Cost of immunization 167 7.4 Discussion 170 CHAPTER 8 CONCLUSIONS AND RECOMMENDATIONS 179 8.1 Conclusions 179 8.1.1 Constraints limiting livestock production 180 8.1.2 Seroprevalence tick-borne diseases in Machakos county 181 8.1.2.1 Risk of tick-borne diseases 181 8.1.3 Socio-economic and demographic characteristics of the livestock farmers 182 8.1.3.1 Livestock and crop enterprises 182 8.1.4 Morbidity and productivity estimates in smallholder livestock farms in Machakos County 183 8.1.5 Efficacy of the East Coast fever vaccine 185 8.1.5.1 Immunization against ECF 185 8.1.5.2. Association of immunization with incidence of ECF 185 8.2 Recommendations 186 8.2.1 Veterinary infrastructure 186 8.2.2 Acaricide application 186 8.2.3 Formation of co-operative 187 8.2.4 Livestock improvement 187 8.2.5 Artificial insemination services 188 8.2.6 Rearing of small ruminants 188

x
8.2.7 Fodder preservation 189 8.2.8 Further studies 189 8.2.9 Efficacy of the ECF vaccine 190 REFERENCES 191

xi
LIST OF TABLES
Table 3.1 The sampling frame used to select study sub-location and farms in Machakos County 33 Table 3.1 Number of cases of tick-borne diseases reported in cattle in Machakos County between 2000 and 2006 40 Table 3.2 Diseases reported in sheep in Machakos County between 2000 and 2006 41 Table 3.3 Disease reported in goats in Machakos County between 2000 and 2006 41 Table 3.4 Distribution of livestock infrastructure, water sources and livestock markets by division in Machakos County, 2007 42 Table 3.5 Disease constraint identification and ranking by farmers in Machakos County, 2007 44 Table 3.6 Non-disease constraints to livestock production as perceived by farmers in Machakos County, 2007 45 Table 3.7 Relative importance of the different livestock species reared in eight Sub- locations in Machakos County in 2007 48 Table 4.1 Characteristics of 200 smallholder farms surveyed in Machakos County September-November 2007 57 Table 4.2 Average farm and livestock herd size in the four divisions of Machakos County, 2005 58 Table 4.3 Table 4.3 The main food and cash crops grown in the four divisions of Machakos County, 2007 60 Table 4.4 Frequency distribution of 200 study farms in Machakos County by the management personnel other than the head of the household, 2007 63 Table 4.5 Estimated amount of hired farm labour in 128 farms which engaged- out-of-farm labour, in Machakos County, 2007 65 Table 4.6 Fertilizer and manure usage on 200 farms in four divisions of Machakos County, in 2007 66 Table 4.7 Milk sales in four divisions of Machakos County, 2007 68 Table 4.8 Providers of veterinary services at farm level by division in Machakos County, 2007 69 Table 5.1: The sampling frame used to select study sub-location and farms in Machakos County, 2007 77 Table 5.2 Farm characteristics of the 140 farms on which cattle were bled to assess the prevalence of tick-borne diseases in the four divisions of Machakos County, 2007 88 Table 5.3 Herd sizes and breed of sheep and goats in the study sub-locations 88 Table 5.4 Distribution of antibodies to Theileria, Anaplasma and Babesia in cattle sera by division and sub-location in Machakos County, 2007 92 Table 5.5 Univariate analysis of factors associated with testing positive to the tick-borne diseases infections in cattle sampled in Machakos County, Kenya 94 Table 5.6 Multivariate analysis output of factors associated with the seropostivity of

xii
tick-borne diseases in Machakos County, 2007 96 Table 5.7 Multivariable analysis for exposure to the three tick-borne diseases infections without the variable “division” in cattle sampled from Machakos County, Kenya 98 Table 5.8 Tick species and level of tick challenge on cattle, sheep and goats in the selected farms in Machakos County, 2007 99 Table 6.1 Definition of productivity parameters estimated during the longitudinal study of smallholder farms in Machakos County, 2007 116 Table 6.2 Farm characteristics of the 14 farms that participated in the longitudinal study in Machakos County in 2008 to 2009 120 Table 6.3 A cohort of calves and yearlings monitored for 12 month and reasons for exit from the study 122 Table 6.4 A cohort of goats and sheep followed for 12 months in Machakos County, 2008 to 2009 and reasons for exit from the study 124 Table 6.5 The incidence of ECF in Machakos County categorized by animal and farm level factors (Jan 2008 to Jan 2009) 126 Table 6.6 The incidence of malnutrition in Machakos County categorized by animal and farm level factors (Jan 2008 to Jan 2009) 128 Table 6.7 The incidence of mange in Machakos County categorized by animal and farm level factors (Jan 2008 to Jan 2009) 129 Table 6.8 The incidence of diarrhea in Machakos County categorized by animal and farm level factors (Jan 2008 to Jan 2009) 130 Table 6.9 The incidence of mycosis in Machakos County categorized by animal and farm level factors (Jan 2008 to Jan 2009) 131 Table 6.10 Distribution of cases of disease /conditions in sheep and goats during a one- year follow-up period in Machakos County, 2008 -2009 132 Table 6.11 Comparison of the mean daily milk yield between exotic crosses and indigenous breeds of cattle 133 Table 6.12 Distribution of calf birth weights by division, sex and breed in Machakos County, 2008-2009 135 Table 6.13 Distribution of kid and lamb birth weights by division and sex in Machakos County, 2008 to 2009. 135 Table 6.14 Distribution of weaning age and weight by division, sex and breed in Machakos County, 2008 -2009 136 Table 6.15 Goat and sheep weaning age and weight in the four divisions of Machakos County during the observational study 137 Table 7.1 Partial farm budget framework 160 Table 7.2 Parameters and components considered in Partial Budget Analysis of the financial benefits of East Coast Fever immunization using the infection and treatment method in Machakos, County 160 Table 7.3 Division and farm distribution of calves and yearlings in the controlled immunization trial against East Coast fever in Machakos County, 2008-2009 163

xiii
Table 7.4 Serological reactions of cattle in the immunised and control groups in the Immunization trial against East Coast fever in Machakos County, 2008- 2009 164 Table 7.5 Univariate analysis for exposure to Theileria parva infection in a controlled immunization trial against East Coast fever in Machakos County, 2008-2009 165 Table 7.6 Multivariable analysis for exposure toTheileria parva infection in cattle in a controlled immunization trial against East Coast fever in Machakos County, 2008-2009 166 Table 7.7 Estimate cost of the various components in ECF immunization in Kenya, 2008 168 Table 7.8 Inputs used in partial farm budget analysis of the financial benefits of East Coast Fever immunisation by the infections and treatment method in Machakos County, 2007 168 Table 7.9 Net return of immunization against ECF in Machakos County 169

xiv
LIST OF THE FIGURES
Figure 2.1 Life cycle of Theileria parva in cattle and in the vector tick (R. appendiculatus) 14 Figure 3.1 Map of Kenya showing the location of Machakos County, 2007 31 Figure 3.2 Map of Machakos County showing administrative divisions and the Location of the study farms, 2007 32 Figure 3.2 Relative perceived prevalence for East Coast fever in four divisions of Machakos County, 2007 46 Figure 3.4 Relative perceived prevalence for pneumonia in four divisions of Machakos County, 2007 47 Figure 4.1 Frequency distribution of family sizes in 200 farms surveyed in Machakos County, 2007 62 Figure 4.2 Patterns of hiring external labour in 128 farms that engaged non-family labour in Machakos, County, 2007 64 Figure 5.1: Map of Machakos County showing administrative divisions and the Location 78 Figure 6.1: Anaplasma marginale bodies in red blood cell 112 Figure 6.2: Macroschizonts in lymphocytes 113 Figure 6.3 Distribution of rainfall in the study area during the monitoring period (Jan 2008-April 2009) 118 Figure 6.4 Maximum and minimum monthly temperature in the study area during the monitoring period (Jan 2008-April 2009) 119 Figure 6.5 Comparative annual lactation curves for exotic cross breeds, indigenous Zebu and all cows (combined) monitored in the four divisions of Machakos County in 2008 to 2009 134 Figure 7.1 The trend of the total cost per animal on sensitivity analysis of the total number of animals immunized per farm 170
LIST OF APPENDICES
Appendix 4.1 Socio-economic questionnaire 217 Appendix 5.1 Cross-sectional survey questionnaire 223 Appendix 5.2 Cross sectional survey: Individual animal data sheet 230 Appendix 5.3 Disease translation 231 Appendix 6.1 Longitudinal study monthly farm/animal monitoring form 233

xv
ABSTRACT
This thesis describes livestock production constraints in a smallholder production system
in Machakos District with special reference to tick-borne diseases. The objectives of the
study were:
(i) To identify the constraints that limit smallholder livestock production as perceived by
various stakeholders in Machakos District;
(ii) To establish the socio-economic and demographic characteristics of livestock farmers
in the district;
(iii) To estimate the seroprevalences of tick-borne diseases in the district;
(iv) To estimate the morbidity, mortality and productivity parameters of livestock in the
district;
(v) To evaluate the efficacy of East Coast fever immunization of cattle by the infection
and treatment method in the district.
A three-stage cluster sampling method involving (in descending order of size) divisions,
sub-locations, and households was used to select farms for the cross-sectional survey.
A total of 200 farms were selected in four divisions. Farm level and individual animal
data were collected using a standard questionnaire. Blood samples were collected from
cattle in the farms and their sera screened for antibodies to Theileria parva, Babesia
bigemina and Anaplasma marginale using ELISA tests.
Fourteen farms were randomly selected for a one-year follow-up study. Data collected
during follow-up included birth weights, disease occurrence, herd dynamics, weaning
weights and ages, fertility and breeding female management, milk production, tick
challenge, and tick control.
Twenty-eight farms were randomly selected for conducting the controlled trial of the
infection and treatment method of immunization of cattle against East Coast fever. Only
calves and yearlings were recruited into the study. Study animals were randomly
allocated to either the treatment or control group in each of the 28 farms. Animals in the

xvi
treatment group were injected with a long acting tetracycline (30%) followed by injection
of the Marikebuni strain of Theileria parva vaccine stabilate. All the study animals on the
28 farms were followed-up equally via monthly visits for a period of 12 months. Data
were collected on pre and post-immunization serological status of the animals including
morbidity and mortality during the follow-up period.
The main constraints to livestock production identified in order of importance included
livestock diseases (mostly tick-borne diseases), poor access to livestock and livestock
product markets, poor veterinary infrastructure and inadequate feed. The mean antibody
sero-prevalence rates in the study sub-locations for Theileria parva, Anaplasma
marginale and Babesia bigemina were 58.9%, 35% and 41.1%, respectively. East Coast
fever was found to exit in a state of endemic stability characterized by high antibody
prevalence and a constant tick challenge while anaplasmosis and babesiosis appeared to
exist in a state of endemic instability, characterized by low antibody prevalence in all the
four study divisions. In univariate analyses five factors (age, breed, division, grazing
system, and tick infestation) were significantly (p<0.05) associated with testing positive
to Theileria parva infection while age, division, grazing system and tick infestation were
significantly (p<0.05) associated with testing positive to Anaplasma marginale infection;
age, grazing system and division were associated (p<0.05) with testing positive to risk of
exposure to Babesia bigemina infection.
In multivariate analysis the only factors that were associated with testing positive to
T. parva were age, division, grazing system and tick infestation while for anaplasmosis
only age and division were significant. The same factors that were significantly
associated with babesiosis in univariate analysis did not change in the mutltivariate
analysis suggesting that the association was not confounded by any of the considered
factors.
Twenty-six (26) cases of ECF were confirmed on the 14 farms during the longitudinal
study converting to an annual incidence rate of 30.7% per cow-year. Factors that were
significantly (p< 0.05) associated with the risk of infection with by T. parva were age,

xvii
tick control, frequency of acaricide application, season, and division. Four cases of
anaplasmosis were confirmed converting into an annual incidence rate of 4.26%. Other
conditions/infections observed in cattle during follow-up included malnutrition, mange,
mycosis and diarrhoea. Eleven cattle died during the follow-up period converting to an
overall crude mortality rate of 11.6% per cow-year. The cause-specific annual mortality
rates of ECF, non-specific disease condition, and diarrhoea were 6.56%, 8.74% and
2.19% per cow-year, respectively.
The commonest causes of morbidity in sheep and goats were helminthosis and
pneumonia. Diarrhoea due to bacterial infections, severe flea infestations and mange
were the other diseases detected in small ruminants.
Livestock productivity was found to be sub-optimal. Cattle were reared primarily as long-
term investments while goats, sheep and poultry were often sold to meet immediate
family financial needs. The daily mean milk production for cattle was 1.98 litres.
Breeding intervals for goats and sheep were once every 12 month and the mean off- take
rates for cattle and small ruminants were 9% and 4%, respectively.
A high proportion (93.7%) of the cattle sero-converted following immunization against
East Coast fever using the infection and treatment method. The annual incidence rate of
ECF in the control group was 42.2% per cow-year and 7.8% per cow-year in the
vaccinated group. The efficacy of the vaccine was 82%, indicating a significant
protective effect in the study area. Use of the vaccine was found to be financially
profitable and realized a net return of Ksh.2, 838 per animal.
In conclusion, farmers need to be encouraged to keep improved livestock breed,
particularly the exotic dairy (breeds) to address the problem of low milk production in the
district. There is also a need to create awareness on the use of East Coast fever vaccine to
reduce mortality from East Coast fever among calves and also enable more widespread
introduction of exotic breeds of cattle. Co-operatives dealing in livestock and livestock
products should also be formed or existing ones strengthened to assist in the marketing of
livestock and livestock products. There is need to improve on the delivery of animal

xviii
health services particularly the revival of tick control programmes in the district so as to
optimize livestock productivity.

1
CHAPTER 1
GENERAL INTRODUCTION
1.1 Constraints to livestock production
Livestock is an integral part of the livelihood of smallholder farmers in Kenya ranging
from the high potential areas where mixed crop and rearing of various types of livestock
is the main agricultural activity to the arid and semi-arid rangelands where pastoralism
and extensive livestock rearing are the main methods of keeping cattle and small
ruminants.
Inability to feed animals adequately throughout the year is the most widespread technical
constraint to livestock production particularly in the developing world (Winrock
International, 1992). Poor management and diseases have been cited as the most
important constraints to livestock production in sub-Saharan Africa (Brumby and
Scholtens, 1986; De Leew et al., 1995). Inadequate support services in livestock disease
control in Africa are also a significant constraint to livestock production in the region.
This is as a result of the deterioration in the quality of animal health delivery systems, a
consequence of attempts by governments to meet an increasing demand from farmers and
pastoralists for veterinary services with a dwindling set of resources (Curry, 1991). In
Kenya, the smallholder dairy cattle production in particular is beset by many constraints
which are manifested by relatively low milk production per cow, long calving intervals
and high mortality rates (Gitau, 1992; Omore, 1997; Karanja, 2002).

2
There is insufficient data on livestock production constraints and disease incidence in
Kenya especially because the majority of reports have been based on passively derived
data from County, provincial and aggregated annual national reports. These mainly
focused on vector-borne diseases with limited focus on productivity constraints on
Kenyan smallholder livestock farming systems (Gitau, 1992 and 1998; Maloo, 1993;
Odima et al., 1994; Omore, 1997; O’Callaghan, 1998). Studies targeted on identification
of production constraints in various livestock production systems in the country are
largely lacking. Data generated from such studies would be invaluable in the formulation
of appropriate evidence based mitigation measures.
1.2 Livestock Industry in Kenya
Agriculture directly influences rural livelihoods by providing incomes, employment and
products for home consumption. It also directly influences prices of commodities and
labour markets, amongst other farm-non-farm linkages. In Kenya, this sector accounts for
over 27% of Kenya’s gross domestic product (GDP) and 70% of foreign exchange
earnings (Ochieng-Odhiambo, 1998).
Livestock contributes about 43% of the gross domestic product (GDP) and over 30 % of
the farm gate value of agricultural commodities (ILRI, 2011).This sub-sector employs
over 50% of the agricultural labour force (KARI, 1994, ILRI, 2011 ), and it is dominated
by small producers (FAO, 2005). Only twenty percent of the country’s land mass is
suitable for both rainfed arable and livestock farming. The rain-fed arable land consists of
medium and high potential lands mainly in the Central Rift Valley, Nyanza, and Western,

3
Central and Central parts of Eastern provinces. The remaining territory is arid and semi-
arid lands (ASALs) and are mainly located in the Rift Valley, Eastern and North Eastern
Provinces of Kenya. They are the key production areas of animal meat (beef, mutton,
goat and camel meat).
In mixed crop-livestock systems in the high and medium potential lands of Kenya,
livestock provide manure used to improve soil fertility resulting in better crop yield
(GoK, 1997). Traction power from cattle is also useful in land preparation, weeding and
transportation.
In Machakos County livestock are kept for milk, meat, manure and draught power
(Mukhebi and Gituna, 1985). Use of oxen for tilling land is especially important in the
County. Livestock are also kept for investment purposes (Mukhebi and Gituna, 1985) and
are, especially the small ruminants sold in bad times such as drought to raise school fees
and meet other family needs. Sheep and goats also play an important role in the nutrition
and income of smallholders (Mtenga et al., 1986; Connor et al., 1990). They provide
meat, milk, skins and manure and also serve as an investment that can easily be converted
into cash when the need arises (Njombe, 1993). This feature of keeping small ruminants
as a source of emergency family income is a characteristic of smallholder livestock
production systems in the country (Stotz, 1979; Maichomo, 2008). On the other hand,
cattle are sold for cash to pay school fees, pay medical bills and other emergencies that
require relatively considerable amount of money. In 2000, the estimated total farm

4
incomes in the County from livestock sales and livestock products were 72 million and
73 million shillings, respectively (Kinuthia, 2001).
1.3 Constraints to livestock production in Kenya
In Kenya, reports on livestock production constraints are based on passively derived data
from monthly and annual reports from the Ministry of Livestock, Farmer’s Training
Centres (FTCs) and research institutes, mainly the Kenya Agricultural Research Institute
(KARI). Past epidemiological studies on livestock in Kenya narrowed their scope only to
cattle. These include studies by Gitau (1992 and 1998), Maloo (1993), Onchoke (1993),
Maloo et al. (1994), Omore (1997), O’Callaghan (1998), Okuthe and Buyu (2006) and
Gachohi et al. (2010). Little has been done to study all livestock species together to
identify the social and economic importance of each species to the farmers and
constraints to their production. All the studies mentioned above were done in the Coastal
lowlands, Central and Western highlands. Moreover, the studies mainly targeted
smallholder dairy farming systems with exotic or improved breeds of cattle with little or
no attention paid to small ruminants which play a significant role in the livelihood of
many smallholder farming systems (Winrock International, 1992).
In Machakos County, a significant number of smallholder farms keep both cattle and
small ruminants (GoK, 1997; KNBS, 2009). An earlier survey conducted in the County
showed that 90% of the households kept livestock, of which 88% kept both cattle and
small ruminants (Small ruminants-CRSP, 1995). In such a production system, it is
important to assess the constraints that limit production and their effect on the different

5
species. The estimated cattle and small ruminants population in the County is 1,089,376
cattle and small ruminants mainly kept under traditional mixed farming system: 319,911
cattle, 105,731 sheep and 663,734 goats (KNBS, 2009).
Despite having a large livestock population, no detailed studies focusing on animal health
and production have been conducted in Machakos County. The only documented studies
on constraints to livestock productivity in the County were cross-sectional surveys
undertaken by Mukhebi and Gituna (1985) and Emongor et al. (2000). These studies
were very limited in scope and the data collected were largely qualitative. It is essential to
integrate various methodologies in the identification of livestock production constraints
as no methodology offers a universal panacea (Kirsopp-Reed, 1994, Okuthe et al., 2003).
The aim of adopting a holistic approach is to assess and offer solutions which should
show tangible impact to farmers’ problems. Such an approach entails the use of informal
techniques followed by traditional and more formal methods to produce quantifiable
results. The present study used both qualitative and quantitative methods to identify
constraints to livestock production in the County.

6
1.4 Objectives
1.4.1 Broad objective
To determine constraints to livestock production in a smallholder livestock production
system, in Machakos County, Kenya.
1.4.2 Specific objectives
(i) To determine the constraints that limit smallholder livestock production as perceived
by various stakeholders in Machakos County.
(ii) To determine the socio-economic and demographic characteristics of livestock
farmers in the County.
(iii) To estimate the seroprevalence of tick-borne diseases in the County.
(iii) To estimate morbidity, mortality and productivity parameters in livestock
(ruminants) in the County.
(iv) To evaluate the efficacy of East Coast fever immunization of cattle by the infection
and treatment method in the County.
1.5 Structure of the thesis
The thesis has eight Chapters. The first Chapter lays the background of the study
followed by literature review of the main topics addressed in the whole thesis.
Perceptions of the various stakeholders on constraints to livestock production are
described in Chapter 3. Description of the socio-economic and demographic
characteristics of the study farmers are presented in Chapter 4. Chapter 5 covers the
specific objective of quantifying the risk of tick-borne diseases in the study area as

7
assessed from cross-sectional data. Chapter 6 addresses morbidity and livestock
productivity estimates in the smallholder farms. Chapter 7 presents the findings of a
controlled trial, conducted to assess the efficacy of the East Coast fever vaccine in a
smallholder cattle production system. The general conclusions and recommendations
derived from the overall study are outlined in Chapter 8.

8
CHAPTER 2
LITERATURE REVIEW
2.1 Livestock productivity constraints
In the sub-humid zones of sub-Saharan Africa, vector-borne diseases limit the expansion
of cattle production systems (Desai, 1989; Mburu, 1989; Maloo et al., 1994). Disease
sharply reduces the productivity of livestock in all agro-ecological zones (AEZs) and
production systems with trypanosomosis as the most important one in sub-Saharan
Africa. Tick transmitted and tick associated diseases together with those caused by
internal parasites are the next most important group of diseases limiting cattle
productivity (Winrock International, 1992). Past studies in Kenya have enumerated
various cattle productivity constraints. Studies in Kiambu County indicated that the two
main constraints lowering milk production in smallholder dairy farms were limited
availability of feed (Omore, 1994) and high calf mortality (Gitau, 1994b). The high
mortality is worsened by slow growth rate due to underfeeding of calves that result in
delayed puberty and age at first calving (Omore, 1997).
Studies carried out at the Coast Province of Kenya showed that the major vector-borne
disease in smallholder dairy farms that caused substantial losses was East Coast fever
(Maloo et al., 1994). Surveys in Kisii and Homa Bay Countys documented calf mortality,
diseases, poor artificial insemination (AI) services and feed shortages during the dry
season as major constraints to dairy cattle development (Mbugua et al., 1994). Other

9
factors that limit cattle productivity in smallholder livestock production systems include
poor veterinary services, insufficient marketing channels and lack of farm inputs
(ILRAD, 1984; Winrock International, 1992).
Small ruminant production is constrained by biological, technical and social factors. High
mortality (40% pre-weaning) leading to low off-take is considered to be an important
constraint to this class of ruminants with disease as the most important constraint in
Kenya (Devendra, 1982; Shavulimo, 1987). Apart from diseases, poor management and
lack of efficient veterinary clinical and extension services limit productivity of small
ruminants (Devendra, 1982). Cross-sectional studies carried out in Machakos (Mukhebi
and Gituna, 1985; Emongor et al. (2000) identified diseases, lack of adequate veterinary
services, unavailability of water, high costs of animal concentrate feeds and labour
shortages as key constraints to livestock production. However, the studies did not
quantify these constraints in terms of economic losses or their impact on the different
livestock species kept by the farmers. In the survey by Mukhebi and Gituna (1985), Foot
and Mouth Disease (FMD), trypanosomosis, Contagious Bovine Pleuropneumonia
CBPP) and East Coast fever (ECF) were ranked as the main constraints to livestock
production based solely on farmers’ perception. The cross-sectional survey undertaken by
Emongor et al., (2000), lists feed and tick-borne diseases as the main constraints to cattle
production in the County. However, these studies were not designed to determine the
prevalence and incidence of these diseases and the associated mortalities. These are key
parameters with regard to determining disease risk and in the design of appropriate
intervention measures. Measurements of these parameters were the basis of quantification

10
of the risk and economic importance of the tick-borne diseases (TBDs) and other diseases
in the County in the current study.
2.2 Tick-borne diseases
2.2.1 Cattle
In the livestock industry, ticks are the most important vectors leading to global losses of
approximately US $ 7 billion (Griffiths and McCosker, 1990). Ticks are most prevalent
and numerous and exert their greatest impact in disease transmission in the tropical and
subtropical regions (Bram, 1983).The major tick-borne diseases (TBDs) of cattle as
evaluated by the economic impact they exert on the farming communities where they
occur, include ECF caused by the protozoa, Theileria parva, anaplasmosis caused by
ricketssia Anaplasma marginale, babesiosis caused by the protozoan Babesia bigemina
and heartwater caused by the rickettsia Ehrlichia ruminantium. Transmission of these
TBDs is largely influenced by the distribution of the tick vectors (Norval et al., 1992;
Swai et al., 2006; Bazarusanga et al., 2007). Dermatophilosis, which is associated with
Amblyomma variegatum ticks, is also of economic importance in vast areas of sub-Sahara
Africa and the Caribbean region (Brown, 1997). In addition to disease transmission, tick
infestations reduce productivity of cattle, damaging hides and predisposing them to
bacterial and fungal infections and screw worm attack.

11
2.2.2 Small ruminants
Although theileriosis, anaplasmosis and babesiosis have previously been described in
sheep and goats (Wenyon, 1926; Markov and Abromov, 1957; Kreier and Ristic, 1963;
Ngeranwa et al., 1998), heartwater is the only tick-borne disease of economic importance
in small ruminants in Eastern Africa (Uilenberg, 1983).
2.2.3 Theileriosis/ East Coast fever (ECF)
2.2.3.1 Aetiology
Theileriosis refers to a complex of infections caused by several species of protozoan
parasites of the genus Theileria. In Kenya, Theileria parva which causes the classical
syndrome referred to as East Coast fever (ECF), is the most economically important tick-
borne disease. It is widely believed that theileriosis in cattle originated from buffalo
populations in Eastern and Central Africa (Young, 1981; Grootenhuis et al., 1987). The
main species of Theileria which infect cattle include: Theileria annulata, Theileria
mutans, Theileria buffeli, Theileria parva, Theileria taurotragi and Theileria velifera
(Norval et al., 1992).
East Coast fever was first reported in Kenya in 1904 and spread fast from the two main
foci; the Lake Victoria basin and the Coastal strip, as ox transport increased (Norval et
al., 1992). The economic impact of the disease escalated as the more susceptible Bos
Taurus cattle continued to be kept in endemic areas by the European settlers (Norval et
al., 1992). Theileria parva until recently was thought to exist in three sub-species,
namely, T. parva parva, T. parva lawrencei and T. parva bovis causing ECF, Corridor

12
disease and January disease, respectively (Lawrence et al., 1994). However, new methods
of studying the parasites using monoclonal antibodies (Minami et al., 1983; Conrad et al.,
1987) and deoxyribonucleic acid (DNA) characterization (Allsopp and Allsopp, 1988;
Conrad et al., 1987; Allsop et al., 1993) have shown that the three subspecies are not
genetically different. Therefore, the parasite is characterised as either cattle or buffalo
derived T. parva.
2.2.3.2 Transmission and life cycle
The main vector of ECF is Rhipicephalus appendiculatus, a three-host tick, commonly
known as the brown ear tick. Although the vector for T. parva was identified as early as
1904 (Norval et al.,1992) details of the life cycle of the parasite in both the tick and in the
host animals, has been elucidated only recently (Bronwen, 2007). Transmission of
T. parva in the tick vector is transstadial whereby it is passaged through the larval or
nymphal stages to the adult stage as the tick molts. After ingestion of infected blood by
the vector tick, the infected erythrocytes are lysed leading to the release of piroplasms. In
the mid gut of the tick, the piroplasms undergo sexual stages of development leading to
formation of macro-gametes, which then undergo syngamy to form kinetes (Mehlhorn et
al., 1978). The kinetes develop further into motile forms which then infect salivary
glands epithelium (Young et al., 1983). Tick feeding triggers the process of sporogony
where kinetes develop into the infective sporozoites within 3-4 days of feeding (Fawcett
et al., 1985).
13
Following a bite by an infected tick, T. parva sporozoites are injected with the tick’s
saliva, enter the host’s lymphoid cells and initiate a reversible transformation of infected
cells (Ole-Moi Yoi, 1989). This leads to a rapid and exponential increase of infected cells
which infiltrate all lymphoid and other tissues (Irvin et al., 1983). The T. parva
sporozoites develop into spherical schizonts then into merozoites leading to the
destruction of lymphoid cells 12-14 days after infection. The merozoites are then released
and may infect the erythrocytes. In the erythrocytes, merozoites develop into comma or
bar-shaped piroplasms (Young et al., 1978). The life cycle is displayed in Figure 2.1.
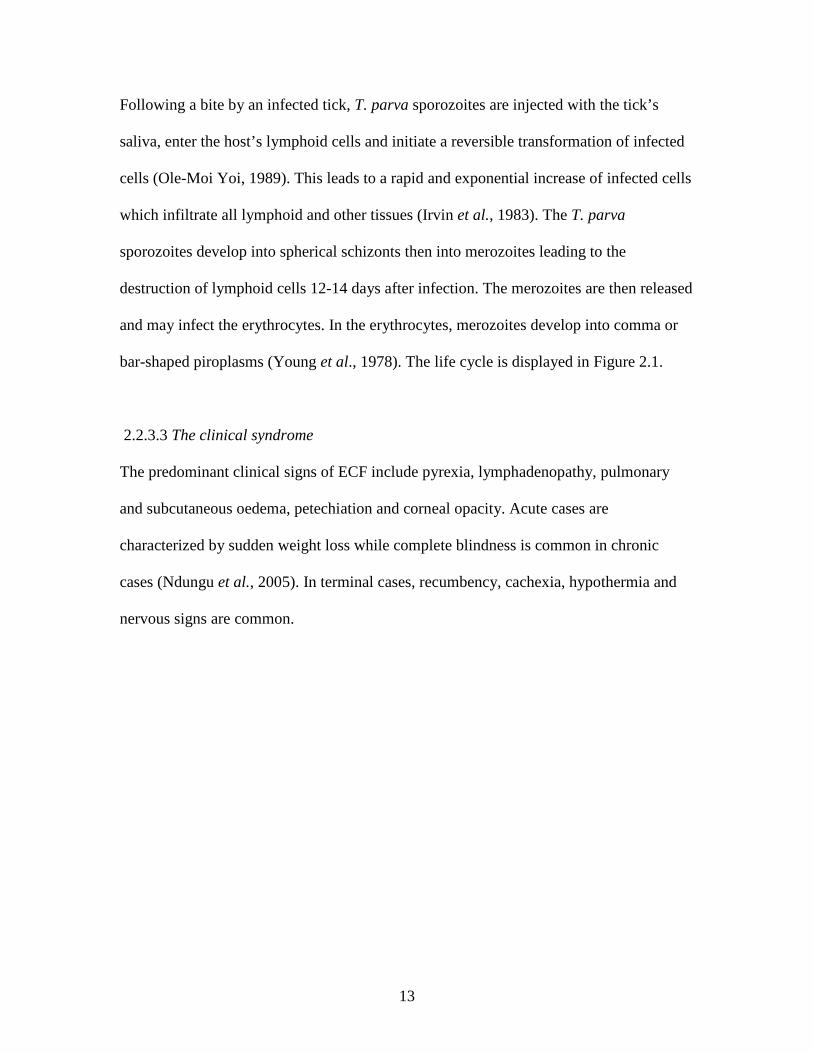
2.2.3.3 The clinical syndrome
The predominant clinical signs of ECF include pyrexia, lymphadenopathy, pulmonary
and subcutaneous oedema, petechiation and corneal opacity. Acute cases are
characterized by sudden weight loss while complete blindness is common in chronic
cases (Ndungu et al., 2005). In terminal cases, recumbency, cachexia, hypothermia and
nervous signs are common.

14
1 Figure 2.1: Life cycle of Theileria parva in cattle and in the vector tick (R. appendiculatus). Source: Norval et al., (1992).

15
2.2.3.4 Diagnosis
Diagnosis of ECF in the field continues to be predominantly based on clinical signs as a
result of inadequate laboratory facilities. The presence of vector ticks feeding on cattle
and knowledge of the distribution and occurrence of the disease contributes towards the
diagnosis. In some rare instances, confirmation of diagnosis is achieved through
examination of stained blood for piroplasms and lymph node biopsy smears for
macroschizonts (Kochs blue bodies). Confirmation of Theileria species on microscopic
morphology is highly dependent on quality of the smears and skill of the operator (FAO,
1984).
Development of serological tests started after it became possible to grow T. parva
schizonts in vitro (Malmquist et al., 1970; Cunningham, 1977) and its immunology was
further elucidated (Morrison et al., 1989 and 1995). The most widely used serum
antibody assay for T. parva is the indirect fluorescent antibody (IFA) test using crude
schizont antigen (Burridge and Kimber, 1972; Gooderis et al., 1982).
Unfortunately, the assay is relatively slow, labour intensive, requires a subjective
assessment of the degree of fluorescence and exhibits cross-reactivity with other).
Confirmation of T. parva infections can be done using laboratory diagnostic tests. An
enzyme- linked immunosorbent assay (ELISA) test was developed using a recombinant
polymorphic immunodominant molecule (PIM) specific to T. parva and has

16
demonstrated sensitivity in excess of 99% and a specificity of between 94% and 98% in
experimental and field sera (Katende et al., 1998).
2.2.3.5 Treatment
Although treatment of ECF was for long attempted using various antibiotic formulations
(Neitz, 1953; Brockleysby and Bailey, 1962; Brown et al. 1977) with variable success, it
was not until naphaquinones menoctone was shown to have antitheilerial activity
(McHardy et al., 1976) that a definitive treatment for ECF was developed. Further
development of this compound and evaluation through laboratory and field studies
(McHardy et al., 1976; Dolan et al., 1984; McHardy and Morgan, 1985;
Chema et al., 1986) culminated in the launching of the first and widely used definitive
drug for ECF, parvaquone (Clexon,® Wellcome Pharmaceutical Ltd, UK) and
buparvaquone (Butalex®, Scheling-Plough Animal Health, UK). The efficacy and
reliability of these compounds is dependent upon early diagnosis and administration of
full therapeutic doses (Muraguri et al., 2006). Unfortunately, the prohibitively high cost
of these drugs has resulted in their limited use by smallholder farmers.
2.2.4 Anaplasmosis
2.2.4.1 Aetiology, biology and clinical syndrome
Anaplasma marginale and A. centrale are the most important anaplasma parasites of
cattle in Africa and are rickettsial organisms which infect erythrocytes of cattle (Ristic,
1968). Anaplasma marginale are found near the margins of the erythrocytes while

17
Anaplasma centrale parasites occupy a more central position. Susceptibility of cattle to
anaplasmosis increases with age and adult cattle of any breed are susceptible. Young
animals often do not exhibit clinical signs of the disease (Magona et al., 2008).
Anaplasmosis presents as an acute, sub-acute or chronic clinical syndrome characterized
by high fever and progressive anaemia manifested as pale mucuos membrane and
jaundice. In chronic cases, debility and emaciation are common. In addition to direct
effects, pathogenicity due to anaplasma infections is mainly related to destruction of
erythrocytes that predisposes the animals to other conditions (Magona et al., 2008).
Although Boophilus decoloratus ticks are incriminated as the main vectors for
anaplasmosis, mechanical transmission and biting flies are also important modes of
transmission. Mechanical transmission through repeated use of hypodermic needles as in
vaccination campaigns is common (Maloo, 1993; Scole et al., 2008).
2.2.4.2 Diagnosis
Diagnosis of anaplasmosis is dependent on clinical signs, case history and microscopic
detection of initial bodies in stained thin blood films. Knowledge of the micro-
distribution of the disease is important in the diagnosis as the clinical signs are not
pathognomonic (Rubaire-Akiiki et al., 2004).

18
Antibody-detection serological tests have been developed and validated in laboratory and
field studies. The main serological tests include card agglutination test, indirect
haemaglutination assay (FAO, 1975) and ELISA (Katende, 1994; Nielsen et al., 1996).
2.2.4.3 Treatment
Anaplasmosis is routinely treated with oxytetracylines based formulations and Imidocarb
. The success of the treatment is, however, variable depending on the stage and severity
of the disease.
2.2.5 Babesiosis
2.2.5.1 Aetiology, biology and clinical syndrome
Babesiosis is caused by babesia parasites that are intra-erythrocyte protozoa with
worldwide distribution. The main species of babesia that infect cattle in Africa are
Babesia bovis and Babesia bigemina. The main tick vector for B. bigemina is Boophilus
decoloratus. Boophilus microplus transmits both B. bovis and B. bigemina. The mode of
transmission between the ticks and hosts is transovarial where either the nymphs or adult
ticks can transmit the disease (Soulsby, 1982).
Clinical manifestations of bovine babesiosis varies from a very mild and often symptom
less infection to acute and often fatal episodes depending on the species of babesia and
the susceptibility of the host animal (Bock et al., 2005). The clinical signs of the acute
form are pyrexia, anorexia, depression, weakness and a fall in milk yield. Pale mucuos
membrane is the main clinical manifestation. As a result of the destruction of

19
erythrocytes (which is mediated by the release of pharmacologically active sustances),
haemoglobinuria and jaundice are the common signs especially in the terminal stages. In
the chronic cases, colic, tenesmus and diarrhea are other common signs. Nervous signs
may be observed in chronic cases of B. bovis infections (Soulsby, 1982).
2.2.5.2 Diagnosis
Babesiosis is diagnosed by clinical signs especially haemoglobinuria, pale mucuos and
jaundice. Examination of Giemsa-stained blood smears from affected animals is essential
for confirmation (Soulsby, 1982).
The complement fixation test (CFT) was the most commonly applied serological test in
the assessment of exposure of animals to the disease before development of ELISA tests.
Card and capillary agglutination tests have also been developed but their specificities are
low.
The ELISA techniques have been improved and validated and standardized methods are
available for detection of antibodies to B. bigemina (Katende, 1994; Nielsen et al., 1996).
There is also increasing use of DNA probes in the diagnosis of babesia infections (Bose
et al., 1995).

20
2.2.5.3 Treatment
Various drugs are available for the management of babesia infections but the response
depends on the parasite species and clinical stage of the disease. Some of the most
commonly used chemotherapeutic compounds include trypan blue, quinoronium
sulphate, phenamidine isothionate, diminazene aceturate and amicarbalide isethionate
(British Veterinary Association, 1976; Dolan, 1991).
2.2.6 Heartwater
2.2.6.1 Aetiology, biology and clinical signs
Heartwater is the second most important tick-borne disease of ruminants in Eastern
Africa, causing substantial economic losses due to mortality and indirectly, through
losses associated with its control (Pegram et al., 1993). It is the most important tick-
borne disease of small ruminants (Uilenberg, 1983). Heartwater affects cattle, sheep,
goats and Asian buffaloes (Camus et al., 1996). Ticks of the genus Amblyomma are the
only known vectors of Ehrlichia ruminantium. Of these A. variegatum is the main vector
species throughout most of sub-Sahara Africa.
The distribution of heartwater in Kenya is not well mapped out as is the case with East
Coast fever. Though the vector is widely distributed in Western, Eastern and parts of the
Rift Valley, the disease is more prevalent in more arid areas of the country such
Machakos, Narok, Baringo and Galana (Ngumi et al., 1997).

21
Clinical signs of which fever and nervous signs are the main ones, range from peracute to
innaparent. Invasion of brain tissues leads to the characteristic nervous symptoms
including a high-stepping unsteady gait, walking in circles, exaggerated blinking of eyes
and chewing movements. Diarrhea and gastro-enteritis may also be observed. Prostration
and death are often preceded by convulsions (Souslby, 1984; Njenga and Mugera, 1989).
2.2.6.2 Diagnosis
Since the disease is characterized by sudden death, provisional diagnosis is based on case
history, clinical signs and postmortem lesions. Confirmation of diagnosis is by
examination of Giemsa-stained brain crush smears where colonies of the organism are
detectable in the cytoplasm of vascular endothelial cells (Purchase, 1945).
Van Vliet et al. (1995) developed the indirect MAP1-B ELISA which detects antibodies
to E. ruminantium. The test has proved to be highly specific and sensitive for use with
experimental and field ovine and caprine sera (de Waal et al., 2000; Peter et al., 2002).
2.2.6.3 Treatment
The sudden death syndrome makes it impossible to treat the majority of cases of
heartwater (Uilenberg, 1983). If diagnosed early, tetracylines formulations are effective
(Purnell and Schroder 1984; Purnell, 1984).
2.3 Economic impact of ticks and tick-borne diseases
There are few reports on the direct effects of ticks and tick-borne diseases on
productivity. There is evidence that tick infestations lead to reduction in body weight and

22
milk production. In Zimbabwe, Norval et al. (1989) showed that Amblyomma hebreum
caused a reduction in weight of 9-19 gm for each engorging tick while
R. appendiculatus caused a reduction of 3-8 gm. In Zambia, Pegram et al.(1991)
estimated the damage coefficient caused by every engorging female of A. variegatum to
be 45 to 60 gm. Data on the direct effects of tick infestation on milk yields are
unavailable.
Transmission of diseases by ticks is considered the most important direct economic
effect. Tick-bone diseases lead either to death of affected cattle, drastic reduction in milk
production, while recovered animals may suffer weight loss (Norval et al., 1992). The
mortality rate due to ECF varies from zero to 50 % in endemically stable conditions
(Staak, 1981; Moll et al., 1986). In endemically unstable conditions, ECF mortality may
be as high as 80-100% (Julla, 1985). Although not fully quantified, milk production
decreases significantly during the clinical and recovery phases of any TBD infection.
Infected animals also provide less draught power and their fertility may be reduced.
Perhaps the main economic losses of TBDs in Kenya have been incurred from control
costs. Importation of chemical acaricides remains a big drain on foreign exchange. The
tick control policy in Kenya was designed based on the need to reduce the risk of ECF
(Cunningham, 1977). Annual expenditure on ticks and TBD control services by the
Kenya government was in excess of Ksh.855 million (GoK, 2009) although this figure
may have decreased following the more recent policy of tick control as a private good.

23
In Kenya, TBDs, especially ECF, are considered a major constraint to the development of
the dairy industry. The diseases not only impede productivity but also limit the area
where high producing cattle can be reared (Kariuki, 1990). The economic impact of ticks
and TBDs is highest in the smallholder dairy farms and hence increase in milk production
from this sector may not reach projected targets (Mbogoh, 1984). Studies to quantify the
risk of TBDs in various production systems have mainly been carried out in Kiambu
(Gitau et al., 1994a, 1994b and 1994c; Gitau et al., 2000) and Muranga Countys (Gitau et
al., 1997; Gitau, 1998) in central Kenya and the Coastal low lands (Deem et al., 1993;
Maloo, 1993).
Information on the prevalence of TBDs in the high potential area of Eastern Kenya is
scanty. Most of the information available on the prevalence of TBDs in Machakos
County in particular is based on annual reports from the Department of Veterinary
Services of the Ministry of Livestock Development (MLD). The figures from these
reports are not reliable as many cases of TBDs may not be reported especially in
instances where farmers seek veterinary services of unqualified personnel. Besides, the
reported cases are largely based on clinical signs alone (Machakos DVO, personal
communication).
The only recently verifiable report on tick-borne diseases in the County was the survey
on the prevalence of ECF in 6 divisions of Machakos County carried out by Ngumi et al.
(2005) (unpublished). In the study the prevalence of Theleria parva was 40.4%.

24
Morbidity and mortality data as well as productivity losses and financial costs associated
with the control of TBDs are lacking. This study aims to generate information that will
address these knowledge gaps.
2.4 Control strategies for ticks and tick-borne diseases
de Castro (1997) has reviewed the methods applied in the control of ticks and TBDs.
Whereas many technically tested packages for ticks and TBDs control are available in
Africa, the main thrust should be to convince policy makers, veterinarians and farmers on
their implementation and impact. In addition, any intervention for ticks and TBD control
needs to match the problem as well as being economically justified, socially acceptable in
the production system, and environmentally friendly (de Castro, 1997).
2.4.1 Acaricide tick control
The main method used to control TBDs in Kenya is application of acaricides to reduce
vector challenge. The methods used for application of the acaricides include plunge
dipping, spray races, hand spraying or hand dressing. Several easier methods of acaricide
application including the use of impregnated ear-tags, neck-bands, tail bands and pour-
ons have been developed (Young et al., 1988). The principle objective is to kill the
infesting ticks in order to break the life cycle and therefore total coverage of all
predilection sites of the various tick species is essential. However, intensive tick control
using acaricides has many inherent problems including high costs (Kariuki, 1990; Ocaido
et al., 2008), increased environmental pollution (de Castro, 1997), development of

25
residues in meat, milk and other products, and eventual development of acaricide
resistance (Wharton, 1976).
Tick control costs are a burden especially to the resource poor farmers. A recent study
undertaken on tick control costs using either cattle dips or hand sprays in an agro-
pastoral farming system in Uganda indicated that the average annual cost of controlling
ticks on an adult cow or bull was USD 4.154. This constitutes 73.8% and 85.6 % of the
total disease control costs on ranches and agro pastoral farming systems, respectively
(Ocaido et al., 2008).
Keating (1983) has reviewed the history of tick control in Kenya using acaricides.
Despite the enactment of the Cattle Cleansing Act (GoK, 1976) which led to the initiation
of a national tick control program, adequate control of ticks and tick-borne diseases is far
from being achieved. Thus, ticks and TBDs continue to be major constraints to the
development of the livestock industry. The escalating costs of acaricides, relevant
infrastructure and monitoring services for intensive tick control strategies advocated by
the Cattle Cleansing Act led the government to suspend the programme. Poor
management of dips by local communities in many ticks and TBD risk zones virtually led
to the collapse of the tick control facilities as a result of inadequate funds, inadequate
technical information and low managerial skills.
In Machakos County, most of the communal cattle dips are not functional and most
farmers rely on hand sprays to control ticks. The problem of tick control in the County is
26
compounded by the fact that there are hardly any veterinary extension services to guide
the farmers on acaricide application (County Veterinary Officer, personal
communication).
2.4.2 Novel methods of tick control
Other novel methods of tick control have been developed but they have not found a wide
application. The most common methods include pasture spelling, rotational burning of
pastures, use of tick-repelling grasses (Mwase et al., 1990), use of tick vaccines
(Willadsen et al., 1995), and restriction of livestock movement. Confinement of animals
as in zero-grazing management systems also reduces the level of tick challenge (Gitau,
1998; Gitau et al., 1999; Gitau et.al., 2000). However, total confinement is seldom
achieved even in smallholder management systems as forage from outside the farms
which may be infested with ticks, is normally fed to the cattle. Confinement of animals
may also lead to the maintenance of highly susceptible populations and hence a shift of
primary infection to older animal groups (O’Callaghan et al., 1998; Gachohi et al., 2012).
2.4.3 Utilization of genetic resistant cattle
Breed variations in genetic resistance to ticks in cattle are well known (Utech et al.,
1978). In general, Bos indicus breeds have higher resistance to ticks than Bos Taurus
breeds (de Castro and Newson, 1993). In Africa, the majority of the indigenous cattle
breeds are resistant to ticks to a large degree and probably also to some TBDs (de Castro,
1997). The N’Dama breed of cattle of West Africa is shown to have a high degree of
genetic resistance to ticks and trypanosomosis (Mattioli and Cassama, 1995). The

27
productivity of these cattle breeds however is low and hence this virtue is normally
disregarded. In Australia, Zebu cattle have been introduced recently in order to utilize
this characteristic (de Castro, 1997). In order to utilize fully the characteristics of
resistance to ticks and high productivity, appropriate crossbreeding programmes need to
be revitalized.
2.4.4 Immunization against tick-borne diseases
The level of immunization of cattle against ECF in Kenya is generally low while
immunization against other TBDs is virtually absent. Development of an effective
attenuated v accine against hearwater has been hampered by limited cross-protection by
different stocks of Ehrlichia ruminantium (Totte et al., 1993; Sumption et al., 2003; Bell-
Sakyi, 2004).
Currently, immunization against ECF using “infection and treatment” is the only method
that has been widely evaluated for application at field level. This method was developed
following observations that animals that recovered from natural infection acquired solid
immunity (Tumusiime, 2007).
The method involves infecting cattle with a predetermined dose of T. parva sporozoites
and simultaneously treating them with tetracylines. The tetracylines reduce the rate of
multiplication of T. parva parasites (Neitz, 1953; Brockley and Bailey, 1962; Di Guillo et
al., 2009; McKeever, 2009).

28
In Kenya field immunization trials against ECF using the infection and treatment method
have been carried out for the last twenty years. This followed the isolation and
subsequent characterization of a broad protecting T. parva stock referred to as T. parva
(Marikebuni) (Irvin et al., 1983). Several immunization trials carried out on calves at
least once month old, have been conducted in the Coastal region (Morzaria et al., 1988),
Central highlands region (Mbogo et al., 1994) and the Rift Valley region (Wesonga et al.,
2000; Wanjohi et al., 2001; Di Giulio et al., 2009). The T. parva (Marikebuni) stock has
been found to be efficacious with protection levels of 80-92%. The level of protection
offered by the stock under field conditions was very similar to that observed under
laboratory conditions (Irvin et al., 1983).
A mild strain of theileria known as T. parva (Lanet) (Mbogo et al., 1996) has been found
to offer protection against a wide spectrum of theileria stocks. It has the advantage over
the other immunizing stocks in that tetracylines are not needed to block the multiplication
of the parasite following immunization. Thus, it is safer as there are usually no reactors,
and also cheaper because tetracylines are not needed. The only drawback that limits wide
future application is that the parasites do not easily multiply both in vivo and vitro thus
limiting bulk preparation of the vaccine (Mbogo and Kariuki, 1995). The economic
viability of the process of immunization has been verified through many analyses
(Nyangito et al., 1994; Mukhebi et al., 1995; Muraguri et al., 1998; Babo Martins et al.,
2010).

29
Machakos County was among the first Countys outside Coast Province to get approval
for national delivery immunization at commercial level (Mbogo et al., 1999). However,
no study or trial has ever been undertaken in the County to determine either the efficacy
of the vaccine or financial impact of immunizing against ECF in a Dual Purpose Cattle
Small Scale farming system (Peeler and Omore, 1997). This was the first time that this
kind of intervention was undertaken in this kind of farming system in the country. All
previous studies mentioned above on immunisation against ECF targeted dairy cattle in
high potential areas.

30
CHAPTER 3
CONSTRAINTS TO LIVESTOCK PRODUCTION IN MACHAKOS COUNTY: A
RAPID APPRAISAL
3.1 INTRODUCTION
Previous studies carried out in Machakos County (Mukhebi and Gituna 1985; Emongor
et al., 2000) identified diseases, lack of adequate veterinary services, unavailability of
water, high costs of animal concentrate feeds and labour shortages as key constraints to
livestock production. Among the tick-borne diseases, ECF and heartwater were identified
as the major constraint to the development of the livestock sector in the County
(Emongor et al., 2000). However, none of the studies quantified these constraints in
terms of economic losses or their impact on the different livestock species kept by the
farmers.
The main objective of the rapid appraisal was to assess the constraints limiting the
development of the livestock sector in Machakos County, as perceived by the farmers and
local veterinary personnel. The farmers’ responses to these constraints especially with
respect to the control of the main tick–borne diseases were also evaluated.

31
3.2 MATERIALS AND METHODS
3.2.1 Study area
The study was conducted in the larger Machakos County, one of the Countys in Eastern
Province. The County has since been subdivided into seven Countys, namely Athi River,
Kangundo, Machakos, Matungulu, Mwala and Yatta. The County lies between latitudes
0.45’S and1.31’S and longitudes 36.45’E and 37.45’E and covers an area of 6,850 km2.
It borders Mwingi and Kitui Countys to the East, Embu to the North, Nairobi and Thika
to the West and Makueni to the South. The County is divided into ten administrative
divisions namely, Athi River, Kathiani, Central, Matungulu, Kangundo, Mwala, Yathui,
Yatta, Ndithini and Masinga. The location of the County in Kenya shown in Fig. 3.1.
The average annual rainfall in the County ranges from 500-1,300 mm. The rains are
normally concentrated in two short seasons: end of March to May, and end of October to
December. The highest rainfall is received in April. The mean temperature range is 18-
250C. The County consists of small hills and plateaus varying in altitude from 1,800 to
2,100 metres above sea level.
The farming system in the area is described as Dual Purpose Cattle Small Scale
(DPCSS)/ Sheep and Goats Small Scale (SGSS) (Peeler and Omore, 1997). Other
livestock kept include donkeys, pigs, poultry, and rabbits. The grazing system is
predominantly traditional free ranging system (Kinuthia, 2001) but a few farmers practice
zero grazing. The majority of cattle reared are the indigenous zebu cattle but some
farmers also keep improved breeds of dairy cattle, especially in Matungulu and
Kangundo Divisions.

32
Figure 3.1: Map of Kenya showing the location of Machakos County, 2007.

33
3.2.2 Rapid Rural Appraisal
The study was conducted between May and October 2007. The tools that were applied
included ranking and key informant interviews, collation of secondary data, formal group
interviews and farm observations. The interviews were conducted in either English (for
DVOs, LPO) or Kiswahili (for the farmers).
Before the start of the informal surveys, the objectives were discussed with the Chief
Field Investigation Officer (CVFIO), the regional Provincial Director of Veterinary
Services (PDVS) and the local County Veterinary Officers. They gave approval of the
work plans. The programme was discussed and circulated to the local administrative
officers (County Officers and chiefs) and the veterinary personnel. The concepts and
objectives of the meetings were communicated in writing to prospective farmers and the
local administrative chiefs two weeks prior to the dates they were to be implemented.
3.2.2.1 Key Informant interviews
Two categories of key informants were interviewed.
Two local veterinarians (the DVO of Machakos County and his deputy based in
Kangundo), one livestock production officer and one animal health assistant (AHA)
operating in the study area were interviewed on the cost of production, livestock and
product prices.
Sixteen local farmers were selected with the assistance of the local chiefs, animal health
assistant and livestock officer. They were selected on the basis of their keen interest and
dedication to livestock rearing. Two farmers were selected from each of the eight study

34
sub-locations where the study took place. A semi-structured interview was conducted to
assess their perceptions on livestock production constraints.
3.2.2.2. Farmer focus group meetings
Gender balanced groups of twenty farmers were selected from each study sub-location
with the assistance of the local AHAs, V.Os and assistant chiefs. Four farmer focus group
meetings were held. The meetings were organized in such a way that separate meetings
were held for each division. The objectives of the focus group interviews were to assess
farmers’ perception on constraints to livestock production, current methods of disease
control and assess farmers’ attitude towards veterinary services.
The first farmer focus group meeting was held at the Kangundo co-operative hall on 28th
June 2007. Ten farmers attended from each of the two sub-locations (Ndunduni and
Kathome). Five of the participants were women. Other participants included the assistant
chiefs from the two sub-locations, the local veterinary officer and the meat inspector. The
two assistant chiefs were women who greatly encouraged other women participants to
contribute to the discussions.
The farmer focus group meeting for Ndithini Division, which comprises of Kiatineni and
Milani sub-locations, was held on 5th July 2007. A total of 12 participants attended the
meeting. Ten of the participants (one of whom was a woman) were from Kiatineni while
only two farmers were able to attend from Milani sub-location. This was due to severe
communication and transport problems prevailing in the area at the time of the study.

35
The farmer focus group meeting in Tala market was held on 19th July 2007. The meeting
brought farmers from Kalandini and Katine sub-locations. A total of 16 participants (10
from Katine and 6 from Kalandini) attended the group meeting. Five of the participants
were women (all from Katine sub-location).
The farmer focus group meeting for Athi River Division was held on the 16th October
2007 at the Agricultural Extension Office in Athi River town. The meeting brought
farmers from Katani and Ngelani sub-locations. A total of 11 participants (7 from Katani
and 4 from Ngelani) attended the group meeting. One of the participants (from Ngelani
sub-location) was a woman.
A standard checklist was prepared for all the farmer focus group meetings. The major
issues that were addressed included:
• Mapping of the sub-locations. The farmers were asked to draw maps of their
respective sub-locations indicating key animal health infrastructures like water
dams, agro vet shops, cattle dips and cattle crushes.
• Source of livelihood of the residents of the sub-location. The participants were
asked to list the main crops grown either for food or sale and reasons for keeping
livestock.
• The farmers were also asked to list the main species of livestock kept.
Proportional piling was used to determine the most important species from the
economic point of view.

36
• Constraints to livestock production. The farmers were asked to list and rank
constraints to livestock production other than diseases. The ranking of the
constraints was done by “pair wise ranking”.
• Disease constraints to livestock production. Farmers were asked to list and rank
disease constraints to livestock production according to perceived economic
importance.
• Institutional linkages (Venn diagram). A Venn diagram was drawn and farmers
asked to draw circles within the Venn diagram representing key veterinary
infrastructure whose size is proportional to the importance that the farmers
attaches to the facility.
• Seasonal calendars to indicate when diseases were most prevalent.
The groups’ general perception of TBDs and other livestock diseases that are common in
the study sites were assessed by semi-structured interviews, guided by a checklist. The
farmers were asked to list all the constraints they faced in keeping livestock. After the
constraints were exhaustively discussed, they were then asked to rank them in order of
their importance. Following the same procedure, disease constraints were listed and
ranked according to their perceived economic losses resulting from mortality, quarantine
measures or cost of treatment. The farmers working as a group then constructed seasonal
calendars for prevalence of TBDs and other diseases that were identified as the main
disease constraints. They were also asked to rank the relative importance of the different
livestock species reared in the study area.
37
3.2.3 Rapid Rural Appraisal data collection methods
3.2.3.1 Ranking procedure
Disease as well as general constraints to livestock production were ranked using the pair
wise ranking technique as described by Catley and Mohamed (1996). The technique
involved farmers listing the key diseases that limit livestock production in their respective
sub-locations. The list of the diseases was then entered into the first row of a Table.
Using the same sequence in which the diseases were listed in the first row, the list of the
diseases was entered into the first column of the Table. Diseases were then compared in
pairs across the table from the left to the right side of the Table. For every comparison
between two diseases, the disease that was perceived to be of more importance in terms
of economic losses resulting from mortality, quarantine measures or cost of treatment
was entered into the Table. The diseases were then ranked based on the frequency with
which they appeared in the Table.
Participants from neighbouring sub-locations undertook the ranking jointly. Using the
results from the farmers’ ranking of diseases, each disease ranking was given scores as
follows:
1st Disease = 6 points
2nd Disease = 5 points
3rd Disease = 4 points
4th Disease = 3 points
5th Disease = 2 points
6th Disease = 1 point.
The same technique was used to rank the general constraints to livestock production.

38
3.2.3.2 Construction of seasonal calendars
Proportionate lengths of sticks were used to represent relative prevalence of the main
diseases against the month of the year. The farmers were allowed to use as many
categories (lengths) as they required. However, all the four groups used a maximum of
three rank categories. The shortest stick used was 3 inches in length. This was used to
denote “low” prevalence. “Medium” prevalence was denoted by a 6 inch long stick and
“high” prevalence by a 9 inch stick.
Data on rainfall and mean temperatures for the year 2007 in each of the four divisions
was obtained from the Meteorological Department station in the County at the Kenya
Agricultural Research Institute (KARI) in Katumani.
3.2.3.3 Proportional piling
The livestock species were ranked in importance using the proportional piling technique
(Catley and Mohamed, 1996) where by a hundred (100) beans were distributed by a
group of farmers over diagrams representing the different livestock species. The livestock
were ranked in terms of economic importance.
3.2.3.4 Transect walks
Transect walks were conducted on two to three randomly selected farms close to each of
the four venues where the focus group meetings were held. The purpose of the walks was
to make independent observations on farming enterprises, estimate the size of the farms,
type of livestock kept and animal husbandry practices.

39
3.2.4 Secondary data
Retrospective data on reported cases of tick-borne diseases in the County were collated
from County Veterinary reports. Although a ten-year time span (1997-2007) was
proposed, only a six year period was analyzed, as records for the period 1997 to 1999
were found to be unreliable as they had many gaps for all the three TBDs (ECF,
anaplasmosis and babesiosis).
3.3 RESULTS
3.3.1 Previous cases of tick-borne diseases in cattle
The number of cases of the main tick-borne diseases reported (based on clinical
diagnosis) in cattle in the County in the previous seven years is shown in Table 3.2.There
were no data on the number of cases of East Coast fever recorded for the period 1997 to
2003. The County Veterinary Officer (DVO) of Machakos County estimated that only
about 30% of the total cases were reported annually due to the few veterinary personnel
and poor veterinary infrastructure in most sub-locations in the County. Thus, the data
were most likely a gross underestimation of the occurence of the diseases. Anaplasmosis
and babesiosis were the most consistently reported tick-borne diseases (Table 3.2).

40
Table 3.1: Number of cases of tick-borne diseases reported in cattle in Machakos County between 2000 and 2006. Year Number of tick-borne diseases reported ECF Anaplasmosis Babesiosis Heartwater 2000 - 827 49 - 2001 - 823 76 - 2002 - 807 58 - 2003 - 635 43 - 2004 624 864 77 80 2005 486 543 128 129 2006 824 840 130 114
3.3.2 Previous disease cases in sheep and goats
Tables 3.3 and 3.4 show the number of cases of diseases reported in sheep and goats
respectively, in the period under review. There were no records on diseases from the year
2000 to 2003 as the record forms could not be retrieved. According to the DVO, farmers
and the field veterinary staff often tended to focus more on cattle when it came to disease
reporting. Thus, the majority of small ruminant diseases were either not reported or
recorded. Helminthosis, pneumonia and diarrhea were the main diseases reported with
helminth infestations and pneumonia occurring more in sheep and goats, respectively. No
tick-borne disease was reported in these two species.

41
Table 3.2: Diseases reported in sheep in Machakos County between 2000 and 2006. Year Number of disease cases Helminthosis Pneumonia Diarrhoea Foot root
2000 - - - - 2001 - - - - 2002 - - - -
2003 - - - - 2004 956 221 210 1 2005 506 232 142 3
2006 503 227 133 6
Table 3.3: Diseases reported in goats in Machakos County between 2000 and 2006.
Year Number of disease cases Helminths Pneumonia Diarrhoea Eye infection Dermatitis 2000 - - - - - 2001 - - - - - 2002 - - - - - 2003 - - - - - 2004 4410 808 419 131 140 2005 2019 598 189 104 30 2006 1975 578 179 93 25
3.3.3 State of veterinary infrastructure, market access and water availability
During the study, there was only one functional communal cattle dip in all the four study
divisions (Table 3.5). There were only two veterinarians (one employed by the
government and the other private), one Animal Health Assistant (AHA) and one
Livestock Production Officer (LPO) in all the four divisions. Agrovet outlets were
available in the study sub-locations of Kangundo and Kalandini Divisions. No Agrovet
shops were present in the study sub-locations of Athi River and Ndithini Divisions (Table
3.5). The two divisions of Kangundo and Matungulu also had active livestock markets.
Apart, from Ndithini Division, which borders the river Tana, all other divisions had very
few permanent natural water sources.

42
Table 3.4: Distribution of livestock infrastructure, water sources and livestock markets by division in Machakos County, 2007.
Veterinary infrastructure Water sources
Availability of livestock market (s)
Division Sub-location
No of functional dips
Animal health personnel
Agrovet shops
Ndunduni 1 1 vet (government vet)
1 1 dam, several seasonal rivers
A market within walking distance.
Kangundo Kathome 0 1 vet
(private) 2 1 bore hole
and a seasonal river
None
Kiatineni 0 1 AHA 0 2 permanent rivers and a dam (Masinga)
None Ndithini
Milani 0 0 0 2 permanent rivers and a dam (Masinga)
None
Katine 0 0 3 1 seasonal river/ three seasonal dams
One active market ,Tala town
Matungulu
Kalandini 0 1 livestock production officer
3 4 seasonal dams
One active market, Tala town
Katani 0 0 0 2 communal dams and 3 bore holes
None Athi River
Ngelani 0 0 0 1 dam None

43
3.3.4 Disease constraints to livestock production
From the list of diseases provided by the farmers, only the first six diseases were ranked
(Table 3.6). Pneumonia, East Coast fever, trypanosomiasis, blackquarter and anthrax
were ranked by the farmers as the most important disease constraints to the rearing of
cattle in the County with respective scores of 22, 20, 7, 7, 5 and 5 (Table 3.6). East Coast
fever and to a less extent anaplasmosis were perceived by the farmers to be the most
mportant tick-borne diseases of cattle in the County. There were also differences in the
disease rankings by divisions for example pneumonia was ranked as the most important
disease in three of the divisions and was ranked third most important in Matungulu
Division (Table 3.6). On the other hand, East Coast fever was ranked first in Matungulu
Division but was ranked second in both Ndithini and Athi River Divisions and third in
Kangundo Division.

44
Table 3.5: Disease constraint identification and ranking by farmers in Machakos County, 2007.
Ranking per division Disease
Ndithini Matungulu
Kangundo
Athi River
Overall Score
Position
Pneumonia 1 3 1 1 22 1 Anaplasmosis 6 6 5 3 7 ECF 2 1 3 2 20 2 Mastitis 8 4 9 3 Heartwater 7 7 8 0 Helminthosis 5 6 3 Rabies 4 5 3 Trypanosomosis 3 4 7 3 Lumpy Skin Disease
5 6 3
Mange 4 3 Eye worm 11 0
Black Quarter 2 5 4 FMD 9 7 0 Brucellosis 10 0 Anthrax 2 5 5
Key: FMD= Foot and Mouth Disease The smaller the numerical value the higher the ranking
3.3.5 General constraints to livestock production
The most important general constraints to livestock production as perceived by the
farmers in order of importance were problems with accessing markets for livestock
products, lack of cattle dips, lack of artificial insemination (AI) services, lack of
adequate feed and shortage of agrovet shops (Table 3.7). The importance of the
constraints differed according to the division. For example absence of AI services was
considered important only in Kalandani/ Katine sub-locations of Matungulu Division and

45
Kathome/ Ndunduni sub-locations of Kangundo Division; it was not even ranked in
Kiatineni/ Milani and Katani/ Ngelani sub-locations of Ndithini and Athi River Divisions,
respectively (Table 3.7). Lack of livestock markets was considered important in all study
divisions, while lack of functional dips and poor veterinary services were considered
important in all divisions except Kangundo. Predation was only ranked as important in
Ndithini Division.
Table 3.6: Non-disease constraints to livestock production as perceived by farmers in Machakos County, 2007.
Ranking by sub-location
Constraint
Ndithini Matungulu
Kangundo
Athi River
Overall Score
Feed 1 4 7 9 Water 7 5 8 2 A.I 3 1 10 Drugs 2 5 Marketing 3 5 3 3 14 Infertility 6 1 Predation 1 6 Agrovet 2 4 8 Dip 4 2 1 14 Vet services 5 6 6 4 Finances 4 3 Livestock thefts 2 5 Poor breeds 5 2
3.3.6 Perceived seasonal occurrence of diseases
Since all groups used a three point ranking system (3 lengths of sticks), it was possible to
represent the seasonal prevalence of two of the main diseases (ECF and pneumonia) in
relative terms as ‘low’, ‘medium’ or ‘high’ and made comparisons between the four

46
divisions (Figures 3.3 and 3.4). The mean monthly rainfall and temperatures for 2007 are
also included.
With the exception of Kangundo Division, the highest perceived prevalence of ECF was
observed between March and July, shortly after the peak rainfall season. In Kangundo
Division, “medium” perceived prevalence was observed between March and July while
the highest prevalence was observed between July and October. The highest perceived
prevalence of pneumonia was observed during the cooler months of the year (May to
September) in all the study divisions.
Figure 3.2: Relative perceived prevalence for East Coast fever in four divisions of Machakos County, 2007.
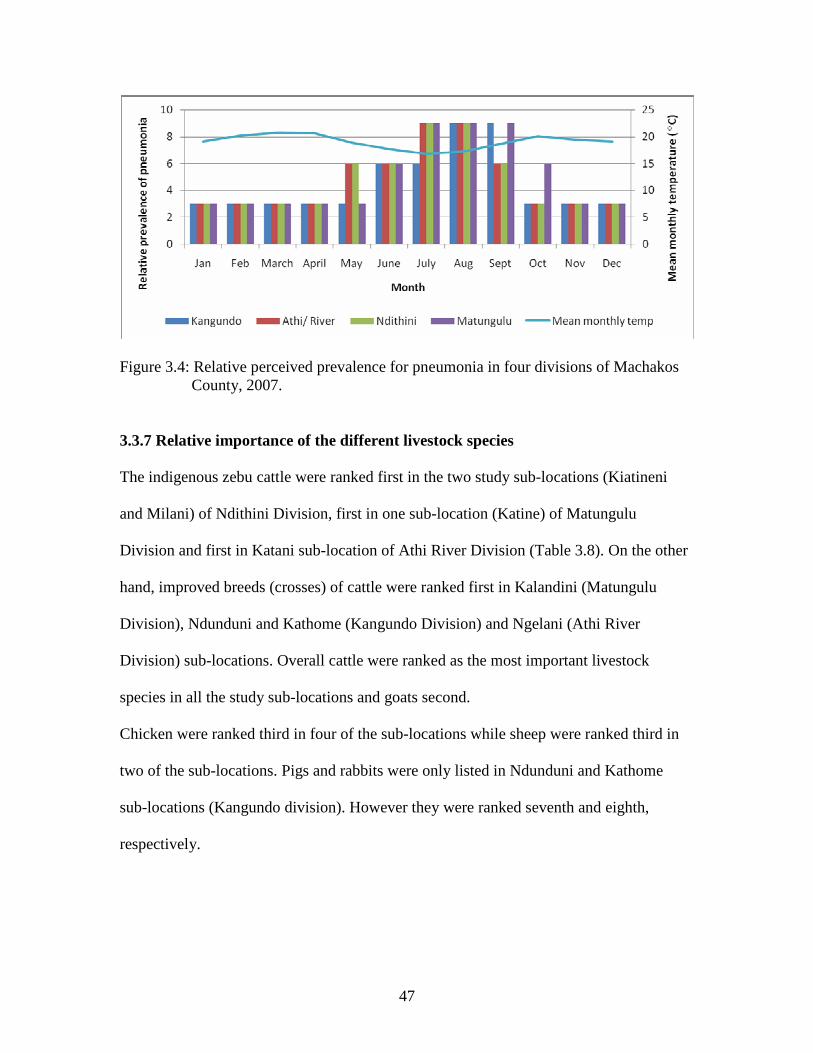
47
Figure 3.4: Relative perceived prevalence for pneumonia in four divisions of Machakos County, 2007.
3.3.7 Relative importance of the different livestock species
The indigenous zebu cattle were ranked first in the two study sub-locations (Kiatineni
and Milani) of Ndithini Division, first in one sub-location (Katine) of Matungulu
Division and first in Katani sub-location of Athi River Division (Table 3.8). On the other
hand, improved breeds (crosses) of cattle were ranked first in Kalandini (Matungulu
Division), Ndunduni and Kathome (Kangundo Division) and Ngelani (Athi River
Division) sub-locations. Overall cattle were ranked as the most important livestock
species in all the study sub-locations and goats second.
Chicken were ranked third in four of the sub-locations while sheep were ranked third in
two of the sub-locations. Pigs and rabbits were only listed in Ndunduni and Kathome
sub-locations (Kangundo division). However they were ranked seventh and eighth,
respectively.

48
Table 3.7: Relative importance of the different livestock species reared in eight sub-locations in Machakos County in 2007.
Ranking by farmer groups in the eight sub-locations Species
Kiatineni
Milani
Kalandini
Katine
Ndunduni
Kathome
Katani
Ngelani
Cattle (Crosses)
4 1 5 1 1 1
Zebu cattle 1 1 5 1 5 2 1 Borancattle 3 Dairy goats 2 4 Galla goats 2 Local goats 2 5 2 2 3 5 2 2 Sheep 3 4 3 4 4 6 4 4 Pigs 7 7 Rabbits 8 8 Chicken 5 4 3 6 3 3 3
3.4 DISCUSSION
Secondary data on disease occurrence obtained from veterinary departments is often
incomplete based on tentative diagnosis and unreliable as was the case in this study. A
similar observation was made by Muraguri (2000) in a study carried out in the Coast
Province of Kenya. The data were often characterised by under reporting presumably due
to a shortage of field staff and limited access to laboratory facilities. In the current study
the secondary data ranked ECF, anaplasmosis, babesiosis and heartwater as the main TBDs
of cattle in Machakos County. The data needs to be treated with caution as diagnosis by
field staff is often based on clinical signs provided by the farmers. Diagnosis of diseases
such as heartwater and ECF can only be confirmed through laboratory examination of
appropriate biological samples. Furthermore, there were gaps in the disease data collected
prior to 2004. It was not possible to establish the reason for the missing data for the period.

49
Nonetheless, the secondary data were most likely a gross underestimate of the true disease
incidence. However, the data can still be useful as indicators of presence of disease trends
over time.
The secondary data on diseases of small ruminant were less comprehensive than for
cattle. This observation was similar to results of earlier studies carried out in the County
(Mukhebi and Gituna, 1985; Emongor et al., 2000). This gross under reporting of small
stock diseases may be a reflection of the little economic importance that farmers attach to
them compared to cattle. The other possibility is that sheep and goats are naturally
resistant to diseases. Indeed sheep and goats were ranked second and third in terms of
economic importance relative to cattle. It is also conceivable that farmers may have
resorted to purchasing drugs from approved agrovet outlets to treat the animals
themselves without consulting government veterinarians. This is a dangerous practice
considering the possibility of drug resistance development in a situation where animals
are given sublethal doses. Farmers need to be sensitized on the importance of a holistic
disease control approach since it has been demonstrated that small stock could be
important sources of diseases such as foot and mouth disease, heartwater and helminths if
ignored in disease control strategies on farms where they are kept alongside cattle
(Lughano and Kambarage, 1996; Barnet and Cox, 1999; Kitching and Hughes, 2002).
The fewer number of qualified veterinarians meant less professional contact while the
presence of only one functional cattle dip meant less tick control. The few available
agrovet shops were located in the main towns as is normally the case and in fact there
were no agrovet shops in four of the study sub-locations. The only active livestock

50
market in the study area was in Tala town, far away from most of the farmers. The poor
state of the veterinary infrastructure and limited access to livestock markets is a major
hindrance to the development of livestock production in the County.
The use of qualitative methods to identify disease constraints to livestock production was
useful in providing an insight into the most important diseases in the County from the
farmers’ perceptive. The farmers identified the main diseases prevalent in the County.
Similar results were obtained in other studies in different livestock production systems in
Kenya where farmers were shown to possess high levels of knowledge on livestock
diseases (Catley and Mohamed, 1996; Muraguri, 2000; Okuthe et al., 2003). The diseases
identified by farmers to be prevalent in Machakos County included ECF, anaplasmosis
and trypanosomiasis. Indeed, the presence of these diseases was confirmed by laboratory
tests in the cross-sectional phase of the study (Chapter 4).
In this study, the farmers were able to indicate the period(s) of the year when the most
important diseases are most prevalent. Seasonal calendars are often used in Rapid Rural
Appraisal studies to highlight temporal patterns of occurrence and changes in human
activities, production and biological events, including diseases (Ghirotti, 1993). The data
on perceived seasonal occurrence of disease were similar in all the four divisions. East
Coast fever reportedly occurred throughout the year but the highest prevalence was
reported between April to September. This peak in ECF corresponded to the period
during and immediately following the long rains season in the County. However, farmers
in Matungulu identified a second peak in the prevalence of ECF in October and

51
November corresponding to the short rains season. The observed prevalence pattern may
have been explained by the fact that temperature and rainfall have a significant influence
on the abundance and longevity of Rhipicephalus appendiculatus, the tick vector of the
disease (Newson and Punyua, 1978; Cumming, 2002; Ocaido et al., 2006).
Pneumonia in livestock was perceived to be more prevalent during the coldest months of
the year (May to September). It was observed that adult animals were kept in open
enclosures at night while calves and small ruminants were kept in sheds that hardly
protected the animals from severe conditions (rain, strong winds and low temperatures)
(Chapter 6). Diseases such as pneumonia as noted by the farmers are likely to occur
under such conditions.
The ability of farmers to identify peaks in the prevalence of disease similar to peaks
observed in formal surveys indicated that farmers have the capacity to conduct their own
research and analyses (Farrington and Martin, 1988; Anon, 1991). Thus, farmers’
indigenous knowledge on animal diseases prevalent in their regions should not be ignored
and can greatly complement conventional surveys especially in the event of outbreaks of
notifiable diseases. It was also interesting to note that some farmers ranked predation as a
major constraint to livestock production. The observation was made on the ranking
prepared by farmers from Ndithini Division, where hyenas and baboons preyed on calves,
kids and lambs. This information is never found in the County or Department of
Veterinary Services annual reports. The ranking of a constraint that was missing from the
conventional annual reports was consistent with the observations by Kumar (1993) that

52
rapid appraisal methods are more flexible than formal surveys and are capable of
exploring new ideas and issues that may not be anticipated. A similar observation was
made during a RRA carried out by Okuthe et al. (2003) in the western highlands of
Kenya. The findings of all these studies further demonstrate that communities within
close proximity to each other may not share the same problems.
Despite its informality, RRA is useful at obtaining a quick, systematic and cost-effective
status of livestock conditions and veterinary problems, particularly in agropastoral
communities (Ghirotti, 1993). In the survey by Okuthe et al. (2003), it was estimated that
a structured survey costs up to twice as much as a RRA. The survey also established that
structured surveys are much more time consuming. Similar results were also reported by
studies undertaken by McCauley et al. (1983) and Perry et al. (1984).
Using the process of triangulation as described in Catley (1999), it was possible to verify
most of the data collected during the RRA studies. For example, the main constraints to
livestock production were identified and confirmed by secondary data, key informants
and farm observations. The farm observations were also useful in understanding the
importance of mixed farming enterprises to the livelihoods of the farmers (Chapte 4).
However, the mostly descriptive data gathered needs to be validated by conducting
exploratory studies that allow comparisons to be made between different study groups.
Only a holistic approach can generate information that can be used to design appropriate
strategies required to improve livestock production in the farming system.

53
CHAPTER 4
SOCIO-ECONOMIC AND DEMOGRAPHIC CHARACTERISTICS OF
SMALLHOLDER LIVESTOCK FARMERS IN MACHAKOS COUNTY
4.1 Introduction
In any livestock or agricultural production system, the interaction between factors of
production, land, human resources and labour significantly influence the levels of
production. In the livestock industry, various socio-economic factors influence the
production systems at various levels. Socio-economic factors such as size of households,
gender, farm level profiles and farm demographic variables do influence the level and
speed of adoption of new production technologies and cattle management practices
(Cicek et al., 2008; Twomlow and Kizito, 2009; Nwakor et al.,2011 ). Farmers also
apportion land to various farm enterprises according to anticipated production. Farming
systems are not static and factors such as climate, agricultural technology, population
pressures and resource availability exert their influence continually (Rushton, 1996). It
was therefore important in this study to identify and quantify farm and human factors
likely to influence livestock production in the study region.
Information on livestock farming systems in Machakos County is scanty. The farming
system in the area has previously been described as Dual Purpose Cattle Small Scale
(DPCSS)/ Sheep and Goats Small Scale (SGSS) (Peeler and Omore, 1997). In the higher
potential areas of the County such as Kangundo, the system has been described as Small
Scale Dairy Meat Production (SSDMP) (Peeler and Omore, 1997).

54
The purpose of this chapter is to describe the characteristics of smallholder livestock
farming systems in Machakos. The farm demographic variables, including the main
methods applied in the control of vector-borne diseases, as well as the socio-economic
characteristics of the households are examined.
4.2 MATERIALS AND METHODS
4.2.1 Study sites
The study area and selection of the study 200 farms are described in
Chapter 5. The farms were visited during the months of September and November 2007.
4.2.2 Data collection
The data on household variables, labour profiles, veterinary practices and farm inputs
were collected using a questionnaire (Appendix 4.1) administered to household heads via
personal interviews. The questionnaire was administered in Kiswahili or translated into
the local Kikamba language in case the respondents had limited knowledge of Kiswahili.
A second questionnaire to gather farm level data (Appendix 5.1) was administered to the
heads of the household or the persons normally in charge of livestock. The questions
were designed to identify and rank various livestock production constraints and the
disease control strategies. Additional data were sought on household information and
demographics, grazing management, delivery of animal health services, occurrence of
diseases and mortality in cattle, sheep and goats.

55
The questionnaires were pretested on ten farms. This was also part of the refresher
training of the technicians who assisted in the administration of the questionnaire. The
field veterinarians were also present to give their opinion and suggestions after which a
consensus on questionnaire administration style was agreed upon. All necessary
corrections to the questionnaire were made at this stage.
Although some of the farmers were literate and could provide English names of the main
livestock diseases on their farms, the majority of the farmers were semi-literate.
One hundred and seventy three of the selected farmers had 6 to 10 years experience of
keeping livestock while the rest (27) had 1 to 5 years experience. Thus, the majority of
the farmers were familiar with the common livestock diseases on their farms. The farmers
listed diseases in the local Kikamba names. The names were then translated into English
with the help of either the local animal health assistant (AHA) or veterinarian who were
fluent in the local Kikamba language. A comprehensive probing of the farmers on the
symptoms, time of the year when disease is common and animal species or breeds
affected by the diseases listed in Kikamba was undertaken before the final translation into
the English names. Details of the Kikamba names and their translation into English are
indicated in Appendix 5.3.
Farm observations were also made to verify some of the information given by the
respondents or to estimate some farm variables. In some instances, transect walks were
made across the farms to estimate some unavailable estimates of parameters or verify
information, for example proportion of land under pastures, main crops grown, cattle
breeds and their numbers.
56
4.2.3 Data handling and analysis
Responses to the questionnaires and animal records were coded and entered into a data
set in Microsoft Access program. After screening, the files were combined and exported
to Statistix® Analytical (Statistix for Windows Version 4.0, 1998, St Paul, MN) program
for generation of descriptive statistic including frequency distribution and means.
Statistical analysis to compare the average household, farm and livestock sizes was
undertaken using the Chisquare Test.
4.3 RESULTS
4.3.1 Farm characteristics
The distribution of various farm characteristics is shown in Table 4.1. The majority
(74%) of the farmers had more than 10 years experience in rearing livestock.
Other than cattle which were the most common species in 70% (147/200) of the surveyed
farms, sheep and goats were found in 30% of the farms. Indigenous chicken, commercial
chicken (improved chicken breeds) and pigs were reared together with cattle or small
ruminants on 32.5% of the farms.
Cattle were managed in zero-grazing units in only 12.5% (25/200) of the study farms.
The majority of cattle (87.5%) were managed under the free grazing system. Of the free-
grazing farms, cattle were occasionally or routinely grazed on pastures outside the
designed farms (roadside, communal or neighbouring farms) in 76.6% (134/175) of the
farms. The vast majority (72.5%) of the farmers kept indigenous cattle.

57
Table 4.1: Characteristics of 200 smallholder farms surveyed in Machakos County September-November 2007. Variable Number of farms Proportion (%) (n=200) Land utilization and apportionment Wholly livestock keeping 13 6.5 Mixed livestock and crops 187 93.5
Experience in keeping livestock Up to 5 years 18 9.0 6-10 years 35 17.5 Over 10 years 147 73.5
Composition of all livestock species aCattle (predominantly) 140 70.0 bSheep and goats 60 30 cCommercial chicken 1 0.5 cFree range chicken 60 30.0 cPigs 4 2.0
Grazing Management Zero grazing 25 12.5 Free grazing 175 87.5
Cattle breeds Indigenous 145 72.5 Crosses 25 12.5 Both Indigenous and crosses 30 15 aNo of farms mainly keeping cattle bNo of farms mainly keeping sheep and goats cNo of farms keeping either chicken or pigs together with cattle or small ruminants
4.3.2 Land resource
4.3.2.1 Size of the farms
The average farm and livestock herd sizes in the four study divisions are shown in Table
4.2. The average farm sizes varied greatly from a low of 4.14 acres in Kangundo Division
to a high of 36.55 acres in Ndithini Division. Two of the selected farms in Ndithini

58
Division were ranches with an average size of 325 acres and an average herd size of 35
cattle.
The overall average number of cattle per farm was 11.9 and was higher than that for
goats (9.4) and sheep (5.2) (Table 4.2). Athi River Division had a significantly (p< 0.05)
higher average number of all the three livestock species compared to the rest of the
divisions.
Table 4.2: Average farm and livestock herd size in the four divisions of Machakos County, 2007.
Division Average farm size (acres)* Average livestock herd size Cattle Goat Sheep
Athi River 22.0 (2.25- 93.0) 23.10 (1-112) 17.8 (0-60) 11.0 (0-70)
Kangundo 4.14 (1-25) 4.10 (1-20) 2.68 (0-26) 1.42 (0-8)
Matungulu 15.83 (0.25-20) 6.70 (1-30) 4.2 (0-20) 2.56 (0-10)
Ndithini 36.55 (1-350) 12.25 (0-50) 13.5 (0-60) 6.8 (0-70)
Overall 21.13 (1-350) 11.9 (1-112) 9.4 (0-60) 5.2 (0-70)
* Figures in brackets indicate range
4.3.2.2 Allocation of land to enterprises
Mixed farming (livestock and crops) was widely practiced in the study area. On average,
it was estimated that approximately 40% of the land was allocated to livestock production
activities and 60% to growing crops.
Coffee was the main cash crop grown in Kangundo and Matungulu Divisions (Table 4.3).
In Ndithini Division, fruits such as mangoes and paw paws were grown as cash crops as
well as for home consumption. A variety of food crops including maize, beans, cowpeas

59
bananas, arrow roots and cassava were also common in the study area. Vegetables were
grown mainly for home consumption.
4.3.2.3 Rented land
In general, renting land was not common in the whole region. During the time of the
survey, only 10.5% (21/200) farmers rented land either for grazing or for cultivation. The
number of farmers with rented land in Athi River, Kangundo, Matungulu and Ndithini
Divisions was 1% (2/200), 2.5% (5/200), 4% (8/200) and 3% (6/200) respectively.
Eighteen (9%) of the farmers rented land for cultivation while 3 rented land for grazing.
Thirteen (6.5%) farmers rented land throughout the year, 1.5% (3/200) during the rainy
season and 2.5% (5/200) during the dry season. The mean rent was Ksh.1, 000 per acre
per year.
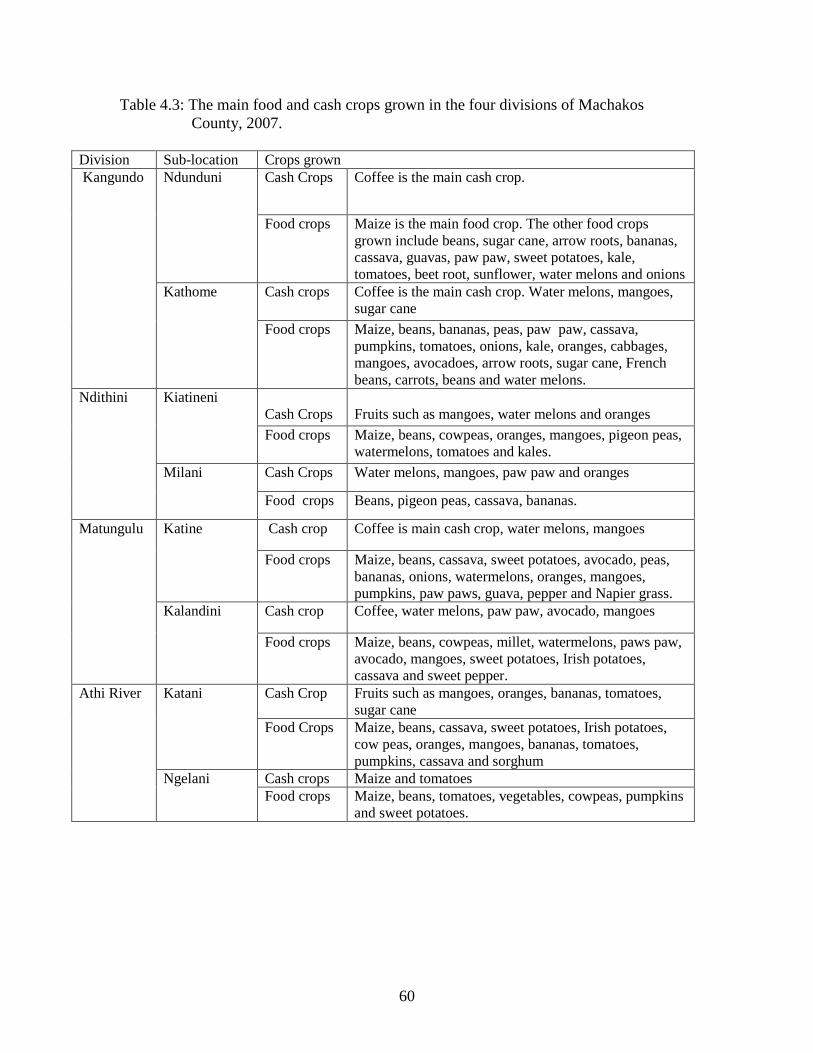
60
Table 4.3: The main food and cash crops grown in the four divisions of Machakos County, 2007.
Division Sub-location Crops grown Cash Crops
Coffee is the main cash crop. Ndunduni
Food crops Maize is the main food crop. The other food crops grown include beans, sugar cane, arrow roots, bananas, cassava, guavas, paw paw, sweet potatoes, kale, tomatoes, beet root, sunflower, water melons and onions
Cash crops Coffee is the main cash crop. Water melons, mangoes, sugar cane
Kangundo
Kathome
Food crops Maize, beans, bananas, peas, paw paw, cassava, pumpkins, tomatoes, onions, kale, oranges, cabbages, mangoes, avocadoes, arrow roots, sugar cane, French beans, carrots, beans and water melons.
Cash Crops
Fruits such as mangoes, water melons and oranges
Kiatineni
Food crops Maize, beans, cowpeas, oranges, mangoes, pigeon peas, watermelons, tomatoes and kales.
Cash Crops Water melons, mangoes, paw paw and oranges
Ndithini
Milani
Food crops Beans, pigeon peas, cassava, bananas.
Cash crop Coffee is main cash crop, water melons, mangoes Katine
Food crops Maize, beans, cassava, sweet potatoes, avocado, peas, bananas, onions, watermelons, oranges, mangoes, pumpkins, paw paws, guava, pepper and Napier grass.
Cash crop Coffee, water melons, paw paw, avocado, mangoes
Matungulu
Kalandini
Food crops
Maize, beans, cowpeas, millet, watermelons, paws paw, avocado, mangoes, sweet potatoes, Irish potatoes, cassava and sweet pepper.
Cash Crop Fruits such as mangoes, oranges, bananas, tomatoes, sugar cane
Katani
Food Crops Maize, beans, cassava, sweet potatoes, Irish potatoes, cow peas, oranges, mangoes, bananas, tomatoes, pumpkins, cassava and sorghum
Cash crops Maize and tomatoes
Athi River
Ngelani Food crops Maize, beans, tomatoes, vegetables, cowpeas, pumpkins
and sweet potatoes.

61
4.3.2.4 Household characteristics
The distribution of family sizes is shown in Figure 4.1. The households had family sizes
ranging from 1 to 20 (mean of 7.1 members). Some of the households had extended
family members staying in the same homestead. Athi River Division had a significantly
(p <0.05) smaller mean number per household (6.5) compared to the other divisions.
Overall 80% of the farms had family sizes in the range 4 to 9 family members (Figure
4.1). Approximately 71% (993/1406) of the household members lived on the farms
indicating low levels of off- farm employment. The mean number of family members
(3.7) living on the farms was significantly (p<0.05) smaller in Katani sub-location
compared to the other sub-locatio of Athi River Division. Katani and Ngelani are newly
settled sub-locations and the majority of homesteads had other homes. The de jure heads
of the households were almost invariably men although 45 % of them either did not live
on the farms or were involved in alternative income activities (employment or as
business) with little or no input into farming activities. In this case, their wives were de-
facto household heads.

62
Figure 4.1: Frequency distribution of family sizes in 200 farms surveyed in Machakos County, 2007.
4.3.3 Farm labour profiles
4.3.3.1 Farm labour
The bulk (97.5%) of the farm labour was provided by members of the family under the
direction of the head of the household. The head of the household discharged all duties
pertaining to farm management including sale and disposal of animals, apportionment of
the farm to various enterprises and utilization of family income. In 46% ( 91/ 200) of the
farms, the head of the household had employment outside the farm and the daily
management of the farm reverted to another member of the family who in most instances
(75.3%) was the wife (Table 4.4). Specified employees only managed the farms in cases
of the owners staying away in towns. The average number of hours spent working on the
farm per day was 5.3 hours. Most of the off–farm employment was on a part time basis
either in nearby towns or neighbouring farms.

63
Table 4.4: Frequency distribution of 200 study farms in Machakos County by the management personnel other than the head of the household, 2007.
Alternative head of farm management Number of farms Proportion (%)
Wife 150 75.3
Son 16 8.0
Daughter 3 1.5
Employee designated as farm manager 25 12.7
Others1 6 2.5
1 Brothers, sisters, father, mother or parents in law
4.3.3.2 Non-family labour
Utilization of hired labour was a common observation among the study farms. Labour
was hired on 64% (128/200) of farms surveyed. Farm workers were hired on either a
permanent or daily casual basis. The farms that hired external labour at any one time of
the year employed 1.9 persons on average throughout the year.
About 34.5% (69/200) of the farms where free-grazing system of cattle was practiced
hired an average of 1.7 people throughout the year. Only 54 (7/13) of the farms that kept
cattle as the main enterprise hired labour throughout the year while 41.1% (77/187)
mixed farms hired labour throughout the year. However, 59% (111/187) of the mixed
farms hired labour at some point of time during the course of the year suggesting hiring
of labour was to some extent influenced by the farming of crops. The distribution pattern
of hiring labour is shown in Figure 4.2 .

64
Figure 4.2: Patterns of hiring external labour in 128 farms that engaged non-family labour in Machakos, County.
4.3.3.3 Cost of hired labour
The cost of labour ranged from Ksh.3,000.00 to Ksh 4,500 .00 per month per employee.
Labour costs were highest in areas close to major urban centres such Athi River (Athi
River Division), Tala (Matungulu Division) and Kangundo (Kangundo Division).
Therefore, on an eight hour working day (five days a week) the cost of farm labour
ranged from Ksh. 18.75 to Ksh.28.13 per man per day equivalent to Ksh. 2.34 to 3.52 per
man–hour. The average number of workers hired during the various farming activities
and the average number of months when such labour was normally engaged is shown in
Table 4.5.

65
Table 4.5: Estimated amount of hired farm labour in 128 farms which engaged out-of- farm labour, in Machakos County, 2007. Season of hiring external labour Mean No. of months hired Mean No. of workers hired
All year round 12 1.8
Harvesting season only 2 2.4
Planting season only 2 2.1
Planting and harvesting seasons 4 2.6
Other activities 4 1.8
4.3.4 Variable farm inputs
Purchase of farm inputs was done throughout the year but in varying intensity depending
on farming activities. The common inputs purchased at farm level included fertilizer,
manure, forage, feed, mineral supplement and various veterinary drugs and acaricides.
4.3.4.1 Application of commercial fertilizers and manure
Commercial fertilizers were used in 55.5% (111/200) of the farms (Table 4.6). The
highest proportion (94%) of commercial fertilizer usage was in Kangundo Division and
the lowest proportion (8%) in Athi River Division. Commercial fertilizers were applied to
both cash crops and food crops. Where routine and consistent application of fertilizer was
practiced, the annual mean cost was Ksh.7,000 per farm with a range of Ksh 5,400 to Ksh
11,000.
A total of 83.5% (167/ 200) farmers used manure on their farms with the majority 93.5%
(157/167 applying it to both subsistence and cash crops (Table 4.6). In 4.1% (7/167) of
the farms, manure was exclusively used on cash crops while on 2.4% (4/167) of the farms

66
fertilizers were exclusively used on food crops. Thirty-two of the farms that used manure
purchased it from other farms within or from outside the County. The annual mean cost
was Ksh. 4,943.50 per farm with a range of Ksh.750.00 to Ksh.32,400.00.
Table 4.6: Fertilizer and manure usage on 200 farms in four divisions of Machakos County, in 2007. Division Proportion (%) using fertilizers Proportion (%) using manure Athi River 4 (8%) 37 (74%)
Matungulu 43 (86%) 48 (96%)
Kangundo 47 (94%) 49 (98%)
Ndithini 17 (34%) 33 (66%)
Overall 111 (55.5) 167 (83.5%)
4.3.5 Membership to co-operatives
Membership to co-operative societies dealing with livestock products was low. Only
14% (28 /200) of the farmers interviewed were co-operative members. There were only
two active co-operatives, all in Kangundo Division, while a third one was in the
formative stages. One of the co-operatives (Ndunduni dairy co-operative) promoted
marketing of dairy products while the Kathome Utuini co-operative promotes the
marketing of coffee.

67
4.3.6 Other Livestock species reared
About 30.5% (61/200) of the surveyed farms reared chicken of which 93.4% were the
free-range indigenous type. The mean number of chicken was 22.1 (range 5-120). Farms
with more than 30 chicken were considered to be commercial enterprises. Only one farm
in Kathome sub-location reared exclusively exotic chicken (120 layers). Three farms
reared both exotic (layers) and free-range indigenous chicken. The main markets for the
sale of live chicken and their products (eggs and meat) were the local market or
neighbours.
Two farms in Athi River kept ducks, geese and turkeys. Only four farms, three of which
were in Athi River Division and the other in Matungulu Division kept pigs.
4.3.7 Sale and prices of milk
The number of farms with milking cows at the time of the survey was 135 of which
68.9% (93/135) sold milk at a mean cost of Ksh. 27.30 per litre (Table 4.7). The main
outlets for milk were neighbours (54 %), co-operatives (16%) and home consumption
(30%). There was no significant (p>0.05) difference in the volume of milk sold in the
four divisions (Table 4.7).

68
Table 4.7: Milk sales in four divisions of Machakos County, 2007.
Division Number of farms selling milk
Mean Milk Sales (litres) per day
95% CI of Mean Milk Sales
Athi River 23 5.02 [3.18, 6.87]
Kangundo 31 6.94 [5.08, 8.80]
Matungulu 17 4.26 [2.74, 5.78]
Ndithini 22 4.83 [2.48, 7.18]
Overall 93 5.45 [4.45, 6.45]
4.3.8 Provision of veterinary services
Delivery of government veterinary services in the study region was reportedly low.
In the four the study divisions, only 22% (44/200) of the farmers had access to
veterinarians and relied on family members to treat sick animals (Table 4.8). Kangundo
Division had the highest 58% (29/50) reported access to trained veterinarians and animal
health assistants. In Ndithini and Matungulu Divisions, 74% and 56% of the farmers
respectively had access either to animal health assistants or veterinarians. Athi River
Division had the lowest (2%; 2/50) access to veterinary personnel where 78% of the
farmers reportedly treated their sick animals. A farmer from the division indicated that he
relied on services of a herbalist to treat his animals. Private veterinarians were reported to
be more available in Kangundo Division. In Matungulu Division, a retired livestock
officer was reported to be providing animal health care services to 36% (18/50) of the
recruited farmers.

69
Table 4.8: Animall health providers of veterinary services at farm level by division in Machakos County, 2007.
Type of personnel that undertakes treatments when animals are sick (No.of house holds per division =50)
Division Family member
Animal Health Assistant
Private Vet
Government Vet
Livestock officer
Traditional herbalist
Ndithini 26% (13) 64% (32) 8% (4) 2% (1) 0 (0%) 0% (0) Matungulu 8% (4) 40% (20) 2% (1) 14% (7) 36% (18) 0% (0) Kangundo 0% (0) 42% (21) 30% 15) 28% (14) 0% (0) 0% (0) Athi River 78% (39) 14% (7) 0% (0) 4% (2) 2% (1) 2% (1)
4.3.9 Tick control
Acaricides were applied on animals to control ticks on 198 farms 99% (198/200) by use
of hand sprays. Tick control generally commenced at the age of 1 month. More than 40%
of the farmers applied acaricides on all the three livestock species by the age of 1 month.
Other farms (1%) applied acaricides only when ticks were observed on the animals.
Acaricides based on amidines were the most (92%) commonly used and the three main
brands were Triatix® (Cooper Kenya Ltd), Alimatix® (Unga Feeds Kenya Ltd) and Tix
Fix® (Twiga). Acaricides based on organo–phosphorus compounds were used in 4%
(8/200) of the farms and included Stelladone® (Norvatis East Africa Ltd) and Supadip®
(Cooper Kenya Ltd). One brand of synthetic pyrethroid, Dominex (FMC chemicals), was
used on 7 3.5% (7/200) of the farms. One farmer was not certain of the brand of
acaricides used on his farm.

70
4.4 DISCUSSION
The study showed that 93.5% (187/200) of the study farms practiced mixed farming. This
proportion was similar to what was observed by Maichomo (2008) in a pastoral livestock
production system in Kajiado County where 95% of pastoralists were found to have other
sources of income besides livestock. Engaging in mixed farming indicated the degree of
diversification of sources of income in order to better manage risks as observed by Little
et al. (2001). The farmers indicated that they sold up to 50% of the food crops such as
maize and beans during bumper harvest. Apart from improved incomes, mixed farming is
of value to the farmers as the crop and livestock enterprises are interdependent. About
83.5% (187/200) of the study farms use livestock manure for growing of cash and food
crops. Some of the large livestock farmers sold surplus manure thus providing an extra
source of income. However, on some of the farms, purchase of manure was part of the
farming expenses, with farms spending on average Ksh.4, 943.00 annually. The growing of
crops and keeping of livestock complemented each other, as livestock were a source of
manure while maize/ sorghum stovers were used as animal fodder.
The proportion of farms in all divisions that used manure was higher than those that used
fertilizers probably because of the higher cost of commercial fertilizers. Moreover, most
farmers who used manure did not have to spend money buying the manure as the
livestock produced sufficient quantities. Kangundo Division, which was the most arable
of the four divisions, had the highest proportion of farmers that used both manure and
commercial fertilizers. The relatively low usage of manure in Athi River and Ndithini
Divisions, which had higher mean livestock populations compared to Kangundo and

71
Matungulu Divisions was rather surprising. A possible explanation could be that the
farmers considered livestock production more reliable in the prevailing environment due
to frequent crop failures. In addition, they sold the manure to farmers outside the
divisions. Athi River and Ndithini were the major sources of manure to farmers outside
the divisions.
The mean size of the farms was 21.83 acres, with a range of 0.25 to 350 acres. This was
considerably larger than the average land size in high potential Countys such as Kiambu
(3.0 acres) (Gitau et al., 1994a), Kisii (1.8 acres) (Waithaka et al., 2000), Bungoma (10.0
acres) (Waithaka et al., 2000), Vihiga (1.24 acres) (Nyangweso et al., 2007) and Uasin
Gishu (8.64 acres) (UG, 2012). Thus, shortage of land was not considered a constraint to
livestock production. This may also explain why only 16.5 % (13/200) of the farmers
rented land for either cultivation or grazing throughout the year. Communal grazing was
practiced in Ndithini. Although the average size of the farms was considered higher than
in many other smallholder farming areas of the country, large tracts of land were
undeveloped in the division with only 10% to 40% of the land being available for
pastures as was onbserved by the author
The mean household size of 7.10 resident members probably explained the low levels of
formal employment outside the region. Thus, labour was easily available at the farm
level. In some of the farms, the head of the household had employment elsewhere. Given
that the households had other off farm employment, there was a likelihood of conflict in
farm level decision making process especially on matters related to animal health. It was
noted that some vital decisions on management, including detection and diagnosis of sick
animals as well as tick control were delayed. However, some farmers had employed at

72
least one worker either on a full time or part time basis all year round. These findings
were consistent with those of Muraguri (2000) in the Coastal lowlands of Kenya.
While cattle were kept as an integral main source of family income, sheep, goats and
chicken were frequently sold to cater for short falls in the family incomes. For example
sheep and goats were commonly sold for school fees, family functions like weddings,
purchase of cloths, repair of houses, payment of medical bills and payment of labour.
Indigenous chicken were mainly kept for home and local consumption. The feature of
keeping various other livestock as a source of emergency family income is characteristic
of smallholder livestock production systems in similar regions of the country (Stotz,
1979; Little et al., 2001; Maichomo, 2008). The findings of the study do further emphasize
the importance of designing studies that encampas all livestock species as each (species)
plays significant social and economic roles in the lives of the smallholder farmer. Nearly all
previous studies in the country have focused on cattle largely ignoring the small ruminants
(Winrock International, 1992).
The amount of labour hired in the study area may have been influenced by herd sizes,
size of farmland and farming of crops. Athi River and Ndithini Divisions had both the
largest average herd and farm sizes while Kangundo was the most arable division in the
study. These characteristics may explain why the three divisions hired the highest
average number of workers per farm and also had the highest proportion of farms that
hired labour. Although the average land and herd size of livestock was smaller in
Kangundo Division than in Athi River and Ndithini Divisions, crop farming was much
more intensive in the division. This made it necessary for a large proportion of farmers in
Kangundo Division to hire external labour all year round. The relatively high cost of

73
hiring labour particularly in Athi River and Kangundo Divisions appears not to have been
a hindrance, underlying the importance the farmers attached to either farming or rearing
livestock.
Milk sales in the four divisions of the County were very low at the time of the survey. In
a national survey on milk production undertaken by Karanja (2002), the County was
ranked very low both in terms of milk production and sales in the country. The main
reason for the low milk production in the County was attributed to the small numbers of
farmers who keep improved dairy cattle breeds and inadequate veterinary extension
services. This was observed during the current study. The other constraint to the poor
marketing of milk in the County was the underdeveloped dairy co-operatives. Inspite of
Kangundo Division having the highest milk sales in the study area, the daily milk
production per farm of 5.45 litres were considerably less than those recorded in the
central highlands regions of the country where the mean daily milk sales can be as high
as 16.6 litres (Staal et al., 1997; Karanja, 2002).. The current poor animal genetic
resources could not sustain an effective dairy cattle production system (Thorpe et al.,
1995). Exploitation of a crossbreeding system between a suitable Bos taurus breed and
local breeds has been identified as one way of improving the genetic potential of local
breeds (Syrstad, 1988; Kang’ethe and Thorpe, 1992). It was however encouraging that
some farmers, particularly in Kangundo and Matungulu Divisions had adopted rearing of
crossbred cattle under an intensive production system.
With the exception of Kangundo Division, animal health delivery was generally poor,
with most of the treatments of sick animals being undertaken by farmers themselves for

74
example in Athi River. The above indiscriminate use of drugs such as antibiotic could
result in drug resistance by microbes or high drug residues in milk and meat. Although
most of the farmers indicated that they undertook tick control on a regular basis it was
likely that few of the farmers applied the acaricides as recommended as ticks could still
be found attached on animals that had been sprayed a day or two prior to the visit.
Of concern was the finding that some of the farmers (3.5%) were already using synthetic
pythrethroids to control ticks on their farms. This was contrary to the current policy of the
Department of Veterinary Services whereby synthetic pyrethyroids are only
recommended to be used in tsetse-infested areas such as parts of the Coast Province,
Narok and Teso Countys. Synthetic pyrethroids are reserved for use as the last line of
“defence” for the control of ticks if widespread resistance against the current
recommended acaricides (Amitraz group of compounds) is confirmed.

75
CHAPTER 5
SERO PREVALENCE OF VECTOR- BORNE DISEASES AND
ASSOCIATED RISK FACTORS IN SMALLHOLDER FARMS IN
MACHAKOS COUNTY
5.1 INTRODUCTION
Relatively few studies on animal health have been carried out in Machakos County
(Mukhebi and Gituna, 1985; Emongor, 2000; Kinuthia, 2001; Ngumi, 2004,
unpublished). These studies were very limited in scope and the data collected were
largely qualitative. The studies identified theileriosis, anaplasmosis, babesiosis and
heartwater as the major tick-borne diseases (TBDs) of livestock as evaluated by the
economic impact they exerted on the farming communities in the County. No published
study has been carried out to assess factors associated with the risk of tick-borne diseases
(TBDs) in the County.
Farmers in the County traditionally practice mixed livestock/crop farming, rearing
predominantly local breeds of cattle and small ruminants (GoK, 2006). However, there is
potential for replacing the indigenous breeds with improved ones as a means of
improving livestock production in the County. There are efforts by some farmers
particularly in Kangundo Division of the County to replace indigenous breeds with
improved breeds such as Friesian crosses. This transition is expected to result into an
upsurge of tick-borne diseases since the latter are more susceptible to ticks and tick-borne
diseases. The current survey was intended to provide information on the risk of tick-

76
borne diseases in the County. Once the risk factors are identified and quantified, they
form the basis upon which appropriate control strategies for TBDs will be formulated.
The present study is the first to be undertaken in the County to determine seroprevalence
of the main tick-borne diseases. In addition the study was designed to assess factors
associated with the risk of the tick-borne diseases. Both farm and animal level factors
associated with prevalence of antibodies to TBDs (T. parva, A. marginale and
B. bigemina) are investigated.
5.2 MATERIALS AND METHODS
5.2.1 Study population
5.2.1.1 Selection of farms for the cross-sectional study
The study population consisted of farms keeping both cattle and small ruminants.
A three-stage cluster sampling method was used to select the study farms. First, four
administrative divisions out of ten were randomly selected using a random -number table.
All the sub-locations in each of the four selected divisions were listed and then two sub-
locations per division randomly selected for eight sub-locations. A list of all livestock
farmers in each selected sub-location was compiled with the assistance of the local
administration chiefs and their assistants. Then twenty-five farmers were randomly
selected from each sub-location for a total of 200 farms. The sampling frame used to
select sub-locations and farms is shown in Table 5.1 and the location of the selected study
farms is shown in Figure 5.1.

77
Table 5.1: The sampling frame used to select study sub-location and farms in Machakos County, 2007.
Administrative Division
Total number of Sub-locations in the division
Name of Selected Sub-location
Total number of farms in sub-location
Kiatineni 107 Ndithini 8 Milani 101 Kalandini 148 Matungulu 29 Katine 200 Ndunduni 211 Kangundo
21
Kathome 65 Katani 34 Athi River
6
Ngelani 39

78
Figure 5.1: Map of Machakos County showing administrative divisions and the location of the study farms, 2007.

79
5.2.2 Data collection
Farm level and individual animal data were collected using a standard questionnaire as
described in Chapter 4 (Appendices 5.1 and 5.2).
5.2.3. Sample size determination
The sample size of animals required to estimate the antibody prevalence of TBDs
infections in the County was determined according to the method described in Martin et
al. (1987):
n= Zα2p (1-p)
L2
Where n = The required sample size, Zα is the normal deviate that provides 95%
confidence interval (the value of Zα is 1.96), p is a priori estimate of the prevalence of
disease (TBD), and L was the level of precision. The antibody prevalence of the TBDs
infections was not known a priori and so, 50% prevalence (p) was assumed. Setting L at
5%, a sample size of 384 animals was obtained.
5.2.4 Collection of biological samples
5.2.4.1 Sampling
A proportional allocation approach was used to sample individual animals in each farm.
Since the farm herd sizes were not known ahead of time, a constant 50% of animals in
each farm were selected using systematic random sampling to ensure that each animal
had the same probability of selection. In herds that had 6 or less animals all animals in the
herd were sampled. Calves less than four months of age were not sampled to minimize

80
the possibility of detecting passively derived colostral antibodies (Burridge and Kimber,
1973; Gitau et al., 1999; Swai et al., 2005).
Cattle were categorised into calves (from birth to 12 months of age), yearlings (13-24
months) and adults (over 2 years of age). In cases where farmers could not recall the
animal’s age, the ages were technically determined by the presence or absence of
permanent incisors (Sisson and Grossman, 1975).
Each animal was ear-tagged and given an individual animal code. The following
parameters were recorded for each animal: age category (calf, yearling or adult), sex,
breed, live weight (estimated by heart girth measurements using weigh bands), level of
tick infestation and any disease manifestation at the time of sampling.
Lymph node and blood smears were made from any animal with a body temperature of
more than 39.40C. The smears were fixed in methanol and stained with Giemsa on site
but were examined for tick-borne diseases parasites (Theileria parva schizonts/
piroplasms, anaplasma and babesia) at VRC-Muguga. Infected animals were treated free
of charge as an incentive to the farmers.
Animals were bled between 0700 and 1100 hours by venopuncture of the jugular vein
and the blood collected in vacutainer tubes (10 ml without anticoagulant; Becton
Dickinson). Each sample was labeled with the individual animal code and kept at room
temperature overnight for serum separation. The serum samples were then placed on ice

81
in a cool box and transported within 48 hours to VRC-Muguga where they were stored in
serum vials at -20 0C in a freezer until laboratory analysis.
5.2.5. Serological testing
5.2.5.1 The ELISA procedure for TBDs
Evaluation of the levels of antibodies to T. parva, gemina and A. marginale were carried
out using ELISA tests as described in Nielsen et al. (1996) and Katende et al. (1998).
Briefly, the specific antigens (the polymorphic immunodominant antigen for
T. parva, p32 kilodalton, antigen for A. marginale and p 200 kilo-dalton antigen for
B. bigemina) were coated in Starwell polysorp micro-ELISA plates (Polysorp, Nunc,
Denmark). The coated plates were incubated for 2 hours at 37o C in an Insel incubator/
shaker. At the end of the incubation, excess antigen was discarded by flicking out the
contents into a sink. The remaining antigen was discarded by flicking out the contents
into a sink. Any remaining antigen was drained by slapping the inverted plate onto hand
paper towels, then leaving the inverted plate on the towels for 15 minutes.
Casein 0.25% was used as the blocking agent. The test sera was diluted 1:200 for
T. parva and 1:100 for B. bigemina and 1:40 for A. marginale in Dulbeco’s phosphate
buffered saline (DPBS) (pH7.4), containing 0.1% Tween 20 and 5% skimmed milk.
Positive and negative sera were used for each parasite. The control sera were
reconstituted using sterile distilled water. The presence of antibodies to specific parasite
antigens was tested by addition of the test sera into wells of the antigen-coated plates in
duplicates. The plates were then incubated for 25 min at 250C to allow antibodies if

82
present to bind to specific antigens. The plates were then washed 5 times with washing
buffer. To detect the antigen–antibody reaction anti-bovine IgG monoclonal antibodies
conjugated to Horse-Radish Peroxidase (HRP) were added. The plates were then
incubated at 370 C for 30 minutes and washed 5 times with washing buffer. The reaction
was then revealed by addition of 1% hydrogen peroxide as substrate and 40nM 2, 2’-
amino-bis (3-ethylbenz-thiazoleline-6-sulphuric acid), diammonium salt (ABTS) as
chromogen in sodium citrate buffer pH 4.0. The plates were incubated at room
temperature in the dark for one hour for colour development.
The intensity of the colour developed (optical density; OD) was determined using an
ELISA reader. Optical density (OD) readings from the reference strongly positive control
sera were used to compute the percent positivity (pp) for the test sera (Wright et al.,
1993), expressed as: pp= (OD of the test serum/ OD of strong positive) X 100). For ease
of interpretation and comparison, animals were classified as seropostive if the pp was
20% for T. parva and 15 % for A. marginale and B. bigemina (Katende et al., 1998;
Morzaria et al. 1999).
5.2.6 Tick infestation
Using the technique of Muraguri (2000), tick challenge was assessed by observing tick
infestation on at least five randomly selected cattle, sheep or goats on each farm. The
species of the infesting ticks were recorded. Ticks collected were stored in methanol and
transported to VRC laboratories at Muguga for identification up to species level

83
according to Kaiser et al. (1988) whenever identification in-situ was doubtful. Tick
challenge was recorded on a four point scale:
None=0 Low = < 10 Moderate = >10-20 High= > 20 ticks
5.2.7 Data management and analysis
5.2.7.1 Data entry and handling
All the data were entered and managed in the Microsoft Access data base (Microsoft
Corporation, USA).
5.2.7.2 Data analysis
Unless otherwise stated in the relevant sections, data were analysed using the STATA,
statistical package (StataCorp, 2007, version 10). The chi-square (χ2) statistic was used to
assess simple associations of both animal level factors (age, disease history, sex, and
breed) and farm level factors (grazing system, tick control and tick infestation) with
seropositivity to the TBDs in univariate analysis. A logistic regression model was later
fitted (controlling for confounding} to assess associations between the potential risk
factors for seropositivity to the TBDs.
The logistic regression model was fitted using the stepwise backward elimination
approach (Hosmer and Lemeshow, 1989). Potential risk factors were screened for
association with seropositivity. In this analysis, an independent variable was retained in
the model when it satisfied a p ≤ 0.1 significance level. After analysis of the main effects,

84
interactions between the significant variables were only tested in the models if they were
deemed biologically plausible.
The logistic models for the probability of pi of the ith animal being positive for any TBD
infection with only one variable was computed as:
Logit (pi) = ßo+ ßXi + ei., where ßo denotes the logit of the probability of disease if all
variables were “absent” (that is equal to zero) whereas ß represented the amount the log
odds of exposure increased (or decreased) when the factor was present. For a categorical
variable with multiple categories, ß represented the effect of that level compared to the
reference category. Xi, represented the variable under analysis and e the random error
with mean 0 and variance σ2. Subsequent to univariate analyses, the significant variables
were tested for multi-collinearity with the phi-coefficient (Ф), if the variables were highly
correlated, demonstrated by a phi-coefficient greater than 0.70 (Fleiss, 1981), the more
biologically plausible variable was left in the model. The multivariable logistic
regressions models were built by extending the univariate models to include other
variables as follows:
Logit (pi) = ßo+ ßiX i + …. + ßkX ki + ei.
The relationship between each TBD infection serostatus and the significant risk factors
was finally examined by fitting mixed effect models with farm as a random effect and the
latter step was done to provide, as much as possible, statistically unbiased estimates of
sero-prevalence with associated uncertainty adjusted for clustering responses within the
farms.

85
5.3 RESULTS
5.3.1 Characteristics of the study farms
The characteristics of the selected farms are displayed in Table 4.1 (Chapter 4). One-
hundred and eighty seven (93.5%) of the farms practiced mixed farming while 6.5%
(13/200) of the farms exclusively kept livestock. Of the 200 farms, 140 had at least two
heads of cattle while the other 60 farms predominantly kept goats, sheep, or both with
only one head of cattle or no cattle. On 15 of the farms that predominantly had small
ruminants at the time of the survey, cattle had been transferred to other farms outside the
study area to ease pressure on the pastures, while five farms did not keep cattle at all.
5.3.2 Livestock species kept and herd sizes
The types of livestock kept in the surveyed farms, their composition and tick control
practices are shown in Tables 5.1 and Table 5.2 for cattle and sheep/goats, respectively.
In all study sub-locations, the red head sheep and the small East African goat were the
predominant species reared. Goat herd sizes were generally larger than sheep ranging
from an average of 1.3 goats per farm in Ndunduni sub-location to 20 in Milani sub-
location (Table 5.2). Sheep herd sizes ranged from a low of 0.8 sheep per farm in both
Ndunduni and Kathome sub-locations to a high of 13.5 sheep per farm in Katani sub-
location.
All the study farms in Ndithini Division kept indigenous zebu cattle while in Kathome
and Ndunduni sub-locations of Kangundo Division, 60% (18/30) kept exotic crosses of
cattle in addition to Zebu breeds.

86
In Kalandini sub-location of Matungulu Division, all the surveyed farms kept zebu cattle
while only 27% (3/11) of the selected farmers in Katine kept exotic crosses.
Zebu cattle were the only breed of cattle kept in Ngelani sub-location of Athi River
Division. Although zebus were the main breed of cattle kept in Katani, 13% (3/23) of the
selected farmers kept Friesian crosses.
5.3.3 Age and sex distribution of livestock
The age and sex distribution of cattle recruited into the study is shown in Table 5.1 as
well as the proportion of calves, yearlings and adults. Overall 50% (200/399) of the
sampled cattle were adults while calves and yearlings accounted for 17.3% (69/399) and
32.6% (130/399), respectively (Table 5.1). Ndunduni, Katani and Kiatineni had the
highest proportion of calves with 26.1% (18/69), 20.2% (14/69) and 14.5% (10/69) of the
calves sampled respectively, from the three sub-locations (Table 5.1). There were no
legible calves (calves more than four months) in the selected farms in Milani while only 2
calves 2.8% were sampled from Kathome.
Kalandini, Kiatineni and Ndunduni had the highest proportions of yearlings sampled with
28.5% (37/130), 15.3% (20/130) and 13.8% (18/130) of the yearlings sampled from the
sub-locations, respectively. Katine and Kathome had the smallest number of yearlings
with 6.9% (9/130) and 5.3% (7/130) of the animals respectively, sampled from the sub-
locations.

87
Kiatineni, Ndunduni and Katani sub-locations had the largest numbers of adult cattle
sampled accounting for 21% (42/200), 19.5% (39/200) and 14.5% (29/200) of the cattle.
Twenty-six (13%) adult cattle each were sampled from Katine and Ngelani sub-locations.
Kalandini and Kathome had the least number of adult cattle sampled with only 9 cattle
each (4.5%) sampled from each of the two sub-locations.
More female 67% (267/399) than male cattle were available on the farms at the time of
the survey (Table 5.1). The same sex pattern was observed in all sub-locations except in
Milani where almost equal numbers of male and female cattle were sampled (16 and 14,
respectively).
5.3.4 Grazing management
The grazing management practices on the study farms are shown in Table 5.1. Cattle
were reared under two grazing systems, namely, free-grazing and zero-grazing.
The vast majority 82% (115/140) of the surveyed farms (Table 5.1) practiced free-
grazing. Zero-grazing was not common with only 5.7 (8/140) of the farms practicing it. It
was however more commonly practiced in Kathome sub-location 62.5% (5/8) of the
surveyed farms) and by only 9.5% (3/33) of the surveyed farms in Katine and Ndunduni
sub-locations.

88
Insert Tables 5.2 and 5.3 here
Table 5.1 Farm characteristics of the 140 farms on which cattle were bled to assess the prevalence of tick-borne diseases in the four divisions of Machakos District, 2007. Division
Sublocation No of farms in each Sublocation
Average cattle herd
size
Sex
(No of animals)
Male Female
Breed
(No of animals) Indigenous Crosses
Age
(No of animals)
Calves Yearlings Adults
Grazing management
(No of farms)
Free Semi free Zero
Tick control frequency
(No of farms) Regular Irregular
Disease History*
(No of farms)
ECF A B
Kiatineni 21 8.3 34 38 72 0 10 20 42 19 2 0 6 15 11 3 1 Ndithini Milani 13 16.5 16 14 30 0 0 10 20 13 0 0 4 9 7 3 1 Kalandini 21 11.1 18 37 55 0 9 37 9 19 2 0 9 12 14 3 5 Matungulu Katine 11 6.3 13 28 9 32 8 7 26 7 3 1 5 6 3 0 0 Ndunduni 22 3.8 17 58 46 29 18 18 39 12 8 2 17 5 6 0 0 Kangundo Kathome 8 4.3 5 15 4 16 2 9 9 2 1 5 4 4 1 0 0 Katani 23 24.2 19 39 49 9 14 15 29 22 1 0 16 7 28 5 0 Athi River Ngelani 21 16.5 10 38 48 0 8 14 26 21 0 0 11 10 12 1 0
Total 140 132 267 313 86 69 130 200 115 17 8 72 68 82 15 7
Table 5.2 Herd sizes and breed of sheep and goats in the study sub-locations Division Sublocation Average herd sizes for the
small ruminants Sheep Goats
Breeds
Sheep Goat
Kiatineni 7.4 7.0 Red head The small East African Goat Ndithini
Milani 6.4 20.0 Red head The mall East African Goat Kalandini 1.1 4.9 Red head The mall East African Goat Matungulu Katine 6.3 3.6 Red head The small East African Goat Ndunduni 0.79 1.3 Red head The mall East African Goat Kangundo Kathome 0.75 4.1 Red head The mall East African Goat Katani 13.5 16.3 Red head The small East African Goat Athi River Ngelani 8.7 19.3 Red head The mall East African Goat

89
5.3.5 Tick control and tick-borne diseases
Regular tick control by acaricide application was reportedly practiced in approximately
half of 51%(72/140) the surveyed farms (Table 5.1) but there were differences by sub-
locations. About 43% (60/140) of the farms practiced regular tick control on all three
livestock species (cattle, goats and sheep). Ndunduni sub-location had the highest
proportion 77% (17/22) of the farms that practiced regular tick control while in Katani
and Ngelani sub-locations, regular tick control was practiced on 70% (16/23) and 52%
(11/21) respectively of the surveyed farms. Tick control was irregular in Kiatineni and
Kalandini sub-locations.
About 74% (104/140) of the survey farms with cattle reported treating at least one or
more clinical cases of tick-borne diseases in the previous 12 months prior to the survey
(Table 5.1). Overall 79% (82/104) of the farmers reported treating at least one clinical
case of East Coast fever, and 14% (15/104) and 7% (7/104) reported treating cases of
anaplasmosis and babesiosis, respectively. Katani, Kalandini and Ngelani sub-locations
had the highest proportion of farms that had had clinical cases of ECF in the previous 12
months; 78% (18/23), 67% (14/21) and 57% (12/21), respectively. Kathome, Katine and
Ndunduni had the lowest proportion of farms that had reported clinical ECF; 4% (1/23),
14 % (3/21) and 29% (6/21), respectively.
Cases of anaplasmosis were reported in Katani sub-location by 22% (5/23) of the survey
farms and in one farm in Ngelani sub-location. The disease was not reported in other sub-
locations.

90
Clinical cases of suspected babesiosis in the last 12 months were mainly reported in
Kalandini sub-location by 24% (5/21) of the farmers. One farm each in Kiatineni and
Milani reported the disease. No cases of babesiosis were reported in the other sub-
locations.
5.3.6 Sero-prevalence of tick borne-diseases in cattle
A total of 399 cattle serum samples collected from cattle were screened for each of the
TBDs infections, namely, Theileria parva, Anaplasma marginale and Babesia marginale.
Antibodies to the three TBDs infections were detected in all the sub-locations and farms
sampled. Overall, theileria antibodies were detected in 58.9% (235/399) of the samples
while those to babesia and anaplasma were detected in 41.1% (164/399) and 35.0%
(140/399) of the samples, respectively (Table 5.3). The highest seroprevalence rates for
ECF were estimated in Katani 87.9% (51/58), Milani 85.7% (36/42) and Ngelani 77.1%
(37/48). The lowest seroprevalence 14.7% (11/75) was estimated in Ndunduni sub-
location. A similar pattern of seropositivity was also observed for anaplasmosis.
However, the seropositivity pattern for babesiosis was different with the highest
prevalence rates estimated in Katine 56.4% (22/39), Kiatineni 46.7% (28/32), Katani
46.5% (27/58) and Ngelani 45.8% (22/48) (Table 5.3).
Overall, the seroprevalence of T. parva was significantly (p<0.05) higher than that of
B.bigemina and A.marginale but there was no significant difference between the
seroprevalence rates of A.marginale and B. bigemina in the County.

91
Table 5.4: Distribution of antibodies to Theileria, Anaplasma and Babesia in cattle sera by division and sub-location in Machakos County, 2007.
Tick-borne diseases
East Coast fever
Anaplasma
Babesiosis
Division
Sub-location
No. of samples tested
No. Positive
(proportion)% Positive
No. Positive
(Proportion) % positive
No positive
(Proportion) % positive
Kiatineni 60 32 53.3 23 38.3 28 46.7 Ndithini Milani 42 36 85.7 22 52.4 9 21.4 Kalandini 57 37 64.9 15 26.3 29 50.1 Matungulu Katine 39 25 64.1 17 43.6 22 56.4 Ndunduni 75 11 14.7 4 5.3 22 29.3 Kangundo Kathome 20 6 30.0 2 10.0 5 25.0 Katani 58 51 87.9 33 56.9 27 46.5 Athi River Ngelani 48 37 77.1 24 50.0 22 45.8
Total/ Average 399 235 58.9 140 35.0 164 41.1
5.3.6.1 Univariate analysis of factors associated with the seroprevalence rates of tick- borne diseases As shown in Table 5.4 there were significant (p< 0.05) differences in the seroprevalence
rates of T.parva across the divisions with Kangundo Division having the lowest rate
(17.9%) and Athi River Division the highest rate (83%). Cattle from Athi River Division
were 25 times (OR=0.04) more likely to test positive to T. parva relative to cattle from
Kangundo. Other factors associated with seropositivity to T. parva included age, breed,
grazing system and tick infestation (Table 5.4). Calves had the lowest prevalence rate
(50.1%) and adult cattle the highest (65.5%). The difference was statistically significant
(p < 0.05). Indigenous cattle had a significantly (p < 0.05) higher seropositivity to T.
parva compared to exotic crosses and were three times (OR=0.35) more likely to test
positive to T. parva relative to exotic cattle. Cattle reared under a free grazing system
were eleven times (OR=0.09) more likely to test positive to T. parva relative to cattle

92
reared under a zero grazing system. Cattle that were infested with Rhipicephallus
appendiculatus at the time of the survey were twice (OR=2.15) more likely to test
positive to T. parva than non-infested cattle. Sex of the animals and frequency of tick
control on the farms were not associated with testing positive for T. parva infection.
Age of animal, tick infestation, grazing system and division were all positively associated
with testing positive to A.marginale infection. Calves had the lowest prevalence rate
(34.8%) and adult cattle the highest (61.5%) (Table 5.4). The difference was statistically
significant (p < 0.05). Adult cattle were thrice (OR=0.33) more likely to test positive to
A.marginale than calves.
Cattle that were infested with R.appendiculatus at the time of the survey had a
significantly (p<0.05) higher prevalence rate (64.4%) of antibodies to A. marginale than
cattle that were not infested (46.3%) and twice (OR=2.1) more likely to test positive to A.
marginale than cattle that there were not infested. Similarly, cattle that were free-grazed
had a significantly (p< 0.05) higher seropositivity (47.6%) to A. marginale than cattle
that were zero-grazed (22%) and were four times (OR=0.23) more likely to test positive
to A. marginale than cattle that were zero-grazed. There was significant (p<0.05)
difference in the seropositivity to A .marginale between the four divisions (Table 5.4).
Cattle in Athi River Division were twice (OR=0.53) and four times (OR=0.24) more
likely to test positive to A. marginale than cattle in Matungulu and Kangundo,
respectively.
Adult cattle had a significantly (p< 0.05) higher prevalence (49%) of antibodies to

93
B.bigemina than calves (29%) (Table 5.4). Adult cattle were twice (0.42) more likely to
test positive to B.bigemina than calves. Also cattle that were free-grazed had a
significantly (p< 0.05) higher (45.5%) prevalence of antibodies to B.bigemina than zero-
grazed (19.5%) cattle.
Division was also associated (p<0.05) with seropositivity to B.bigemina. Cattle in Athi
River Division were one and half (OR=0.66) times and twice (OR=0.46) more likely to
test positive to B.bigemina than cattle in Ndithini and Kangundo Divisions, respectively.
However, cattle in Matungulu Division were about one and half times (OR=1.4) more
likely to test positive to B.bigemina than cattle in Athi River Division.

94
Table 5.5 Risk factors of testing positive to TBDs obtained in univariate analysis in Machakos County, Kenya (to be inserted)
Table 5.4 Univariate analysis of factors associated with testing positive to the tick-borne diseases infections in cattle sampled in Machakos District, Kenya ,2007.
Category T. parva A. marginale B. bigemina Animal-level factors
Level No.of animals Prevalence (%)
OR [95% CI] p-value
Prevalence (%) OR [95% CI] p-value
Prevalence (%)
OR [95% CI] p-value
Breed Cross 86 35.1 0.35 [0.22, 0.58] 0.000 46.5 0.77 [0.48, 1.24] 0.28 43.0 1.1 [0.67, 1.77] 0.72
Indigenous 313 64.9 1 53.0 1 40.9 1
Age Calf 69 50.7 0.54 [0.31, 0.94] 0.04 34.8 0.33 [0.19, 0.59] 0.0001 29.0 0.42 [0.24, 0.77] 0.005
Yearling 130 54.6 0.63 [0.40, 0.99] 45.4 0.52 [0.33, 0.81] 36.2 0.52 [0.37, 0.93]
Adult 200 65.5 1 61.5 1 49.0 1
Sex Male 132 63.6 1.3 [0.85, 2.00] 0.22 57.6 1.4 [0.94, 2.18] 0.09 37.9 0.81 [0.53, 1.23] 0.32
Female 267 57.3 1 48.7 1 43.1
Disease history Present * 63.1 1.4 [0.91, 2.03] 0.13 56.9 1.3 [0.73, 2.24] 0.38 50.0 1.4 [0.09, 22.9] 0.80
Absent * 55.7 50.7 1 50.0
Tick infestation Present 118 69.5 1.9 [1.17, 2.92] 0.007 64.4 2.1 [1.35, 3.28] 0.0009 35.6 0.71 [0.46, 1.11] 0.13
Absent 281 55.2 1 46.3 1 43.8 1
Farm-level factors
Tick control Regular 248 59.3 0.99 [0.65, 1.49] 0.95 54.0 1.3 [0.86, 1.93] 0.22 40.7 0.93 [0.62, 1.41] 0.74
Irregular 151 59.6 1 47.7 1 42.4
Grazing system Zero 41 14.6 0.09 [0.04,0.23] 0.0000 22.0 0.23 [0.11,0.50] 0.0000 19.5 0.31 [0.14,69]
0.003
Free 358 64.7 1 47.6 1 37.5 1 Area-level factor
Division Kangundo 95 17.9 0.04 [0.02, 0.09] 0.000 28.4 0.24 [0.13, 0.43] 0.000 28.4 0.46 [0.26, 0.83] 0.0015
Matungulu 96 66.7 0.41 [0.21, 0.79] 46.9 0.53 [0.30, 0.94] 54.2 1.37 [0.79, 2.39]
//Ndithini 102 66.7 0.41 [0.21, 0.79] 66.7 1.21 [0.69, 2.14] 36.3 0.66 [0.38, 1.15]
Athi River 106 83.0 1 62.3 1 46.2 1
*Disease history values for each infection are different: Respectively, present and absent values are 198 and 201 (T. parva), 58 and 341 (A. marginale), 8 and 361 (B. bigemina).

95
5.3.6.2 Multivariate analysis of factors associated with the seroprevalence of tick-borne diseases
Four factors (age, division, grazing system and tick infestation) were significantly (p<0.05) associated with
the risk of T. pava. The variable cattle breed that was significant in univariate analysis was not retained in
the multivariate analysis suggesting that it was a potential confounder. Cattle were at a higher risk of
exposure to T.parva infection if they came from Athi River Division than if they were from any of the other
three divisions (Table 5.5). Kangundo Division had the least risk (OR=0.05) of exposure to T. parva
followed by Ndithini Division (OR=0.19). Similarly, adult cattle, cattle reared under free-grazing system,
and presence of ticks on cattle were twice, three times, and twice as likely to test positive to T.parva
infection relative to calves, zero-grazed cattle and cattle without ticks, respectively.
Only two factors were significantly (p<0.05) associated with the risk of A. marginale
(Table 5.5). Tick infestation (with R .appendiculatus) and grazing system that were
initially significant in the univariate analysis were not significantly associated with
testing positive to A. marginale in multivariate analysis suggesting that the two variables
were potential confounders. Cattle had a higher risk of exposure to A. marginale if they
came from Athi River Division compared to the other three divisions. Similarly, adult
cattle were twice and three times more likely to test positive to T .parva relative to
yearlings and calves, respectively.
All three factors (age, grazing system and division) that were signficantly associated with
the sero-prevalence of B.bigemina in the univariate analysis remained signficant in the
multivariate analysis. This suggested that none of the three factors was a potential
confounder.
Table 5.6: Multivariate analysis output of factors associated with the seropostivity of

96
tick-borne diseases in Machakos County, 2007. Tick-borne disease Variable Level OR OR 95% CI p-value Theileria parva Age Adult 1 - 0.012 Yearling 0.50 [0.29, 0.85] Calf 0.45 [0.23, 0.89] Tick infestation Present 2.15 [1.02, 4.53] 0.04 Absent 1 - Grazing system Free 1 - 0.02 Zero 0.33 [0.12,0.91] Division Athi 1 - 0.000 Kangundo 0.05 [0.02, 0.11] Matungulu 0.44 [0.22, 0.88] Ndithini 0.19 [0.08,0.47] Anaplasma marginale
Age Adult 1 - 0.0005
Yearling 0.52 [0.32, 0.83] Calf 0.34 [0.19, 0.63]
Division Athi 1 - 0.000
Kangundo 0.23 [0.12, 0.42]
Matungulu 0.57 [0.32, 1.02]
Ndithini 1.09 [0.6,1.96]
Babesia Bigemina
Age Adult 1 - 0.0006
Yearling 0.36 [0.2, 0.67]
Calf 0.49 [0.3, 0.79]
Grazing system Free 1 - 0.013
Zero 0.36 [0.15, 0.88]
Division Athi 1 - 0.002
Kangundo 0.61 [0.32, 1.16]
Matungulu 1.63 [0.91, 2.91]
Ndithini 0.60 [0.33, 1.03]
5.3.6.3 Multivariate analyses without variable “division” for tick-borne diseases
The variable “division” was significantly associated with seropositivity to the three
TBDs. Since divisional boundaries are administrative in nature, it was necessary to
investigate other attributes in the County for their importance in explaining the TBD
seroprevalence variations in the County. Thus, multivariate models without the variable

97
“division” were built with all the significant univariate variables. The purpose of this was
to investigate any (additional) significant effects, which could have been masked by
effects of “division”. The outputs of these models are shown in Table 5.6.
For T. parva seroprevalence age and grazing system remained significant but the variable
“breed” turned significant (p < 0.05) while the variable “tick infestation” was
insignificant (p > 0.05) suggesting that division was a potential confounder in the
association of the two variables with testing positive to T. parva. The same applied to tick
infestation and grazing system for A.marginale. No variable was masked by the effects of
division for B. bigemina.

98
Table 5.7: Multivariable analysis (p≤0.05) for exposure to the three tick-borne diseases infections without the variable “division” in cattle sampled from Machakos County, Kenya.
Variable Level OR 95% CI p-value
Theileria parva Age Adult - - 0.03 Yearling 0.52 [0.3, 0.94] Calf 0.58 [0.37, 0.94] Breed Indigenous - - 0.006 Crosses 0.47 [0.27, 0.81] Grazing system Free - - 0.000 Zero 0.11 [0.05, 0.28] Anaplasma marginale Age Adult - - 0.0003 Yearling 0.53 [0.33, 0.83] Calf 0.35 [0.19.0.63] Tick infestation None - - 0.033 Present 1.64 [1.03,2.62] Grazing system Free 0.0002 Zero 0.24 [0.11,0.54] Babesia Bigemina Age Adult - - 0.004 Yearling 0.59 [0.37, 0.93] Calf 0.42 [0.23, 0.76] Grazing system Free - - 0.002 Zero 0.30 [0.14, 0.68]
5.3.7 Tick Challenge
A total of 155 cattle, 167 goats and 121 sheep were sampled for ticks from 106, 109 and
90 of the survey farms, respectively. The tick challenge was high in all the study sub-

99
locations except in Ndunduni and Kathome. Rhipicephalus appendiculatus was the
commonest tick species found on cattle, sheep and goats in all the sub-locations
(Table 5.7). The other common tick species observed were Boophilus decoloratus,
Rhipicephalus evertsi, Rhipicephalus pulchellus and Amblyomma variegatum. Boophilus
decoloratus was prevalent in all sub-locations except Ndunduni, while Amblyomma
variegatum was observed on animals in four of the study eight sub-locations (Kiatineni,
Milani, Kalandini and Katani). Rhipicephalus evertsi was only prevalent in Milani,
Ndunduni and Katani sub-locations while Rhipicephalus pulchellus was only prevalent in
Katani and Ngelani sub-locations of Athi River Division.
Table 5.8: Tick species and level of tick challenge on cattle, sheep and goats in the selected farms in Machakos County, 2007. No. of farm on which animals were sampled for ticks
Species and No. sampled
Species and No. with ticks Sub –location Cattle Goats Sheep Cattle Goats Sheep Cattle Goats Sheep
Tick challenge
Prevalent tick species
Kiatineni 11 13 10 26 24 20 22 13 11 High R. appendiculatus A.variegatum, B.decoloratus
Milani 13 10 11 19 34 24 16 26 18 High R. appendiculatus, A.variegatum, R. evertsi B.decoloratus
Kalandini 15 20 15 22 20 15 21 15 10 High R. appendiculatus A. variegatum, B. decoloratus
Katine 11 10 10 11 16 10 11 10 7 High R. appendiculatus. B. decoloratus
Ndunduni 12 9 6 14 9 7 2 0 1 Low R.appendiculatus R. evertsi
Kathome 8 6 0 17 6 0 6 2 0 Medium R. appendiculatus B. decoloratus
Katani 16 20 18 16 26 22 15 14 16 High R. appendiculatus, A.variegatum, R.evertsi B.decoloratus R.pulchellus
Ngelani 20 21 20 30 32 23 30 21 16 High R. appendiculatus, B.decoloratus R.pulchellus
Total 106 109 90 155 167 121 123 101 79

100
5.3.8 Diseases diagnosed during the farm visits
During the survey, 14 cattle were clinically sick with elevated temperatures of greater
than 39.4oC. Five of the cattle were found to be infected with Trypanosoma vivax, one
with ECF while the other 8 animals were infected with what was suspected to be bacterial
infections. The ECF case was diagnosed on one of the farms in Kiatineni sub-location.
All the 5 cases of trypanosomiasis were diagnosed in Milani sub-location. Four suspected
bacterial infections were diagnosed in Milani while 2 cases were diagnosed in Ngelani.
One case each of suspected bacterial infection were diagnosed in Katani and Kiatineni
sub-locations.
5.4 DISCUSSION
This study was the first to provide a population-based assessment of serum antibodies
prevalence to Theleria parva, Anaplasma marginale and Babesia bigemina infections in
Machakos County. Variability was observed in serum antibody prevalence to the three
tick-borne diseases, degree of tick infestation across the divisions, grazing systems and
age of animals. In the absence of re-challenge, it has been demonstrated that antibodies
to Theileria parva decline by six months (Lawrence et al., 2004) after infection. During
this study, the relatively high prevalence of the tick-borne diseases suggested recent or
continuous infection by the parasites.
As expected, older animals were at an elevated risk of testing positive to antibodies to the
TBDs because of the longer duration of exposure to infected ticks. Similarly, cattle on
free- grazing systems were continuously exposed to the infected ticks. This was
confirmed when tick counts on cattle were enumerated; high tick challenges was found in

101
three of the study divisions that practised free-range grazing system. The prevalence
estimates of 58.9%,35.0% and 41.1% for T.parva, A. marginale and B.bigemina
respectively robtained in this study were in general agreement with estimates reported for
TBDs by Latif et al. (1994) in western Kenya, Maloo et al. (2001a) in the Coastal region
of Kenya and Okuthe and Buyu (2006) in the western highlands of Kenya. The varying
prevalence rates of the TBDs and tick challenge suggest the existence of different
epidemiological states for the three tick-borne diseases. Endemically stable states
characterized by among other factors high antibody prevalence (>70%) and a constant
tick challenge (Norval et al.,1992; Deem et al., 1993; Perry and Young, 1995; Gitau,
2000; Kivaria et al., 2004) appear to exist for ECF in Katani and Ngelani sub-locations of
Athi River Division and in Milani sub-location of Ndithini Division. On the other hand, a
state of endemic instability characterized by low antibody prevalence of < 30% appeared
to exist in Kangundo and Matungulu Divisions. A low antibody prevalence pattern
observed for anaplasma and babesia suggested endemic instability in all the study
divisions.
Apparently, more cattle were exposed to T. parva compared to the other TBD infections.
This was not surprising as R. appendiculatus, the vector tick of T. parva was the
commonest tick species observed in all the sub-locations. These results were similar to
results reported by Muraguri (2000) in the Coastal lowlands of Kenya. However, the
sero-prevalence to T. parva was much higher than that observed by Gachohi et al. (2010)
in neighbouring Mbeere County. The high level of exposure to ticks observed indicates a
high a risk of ECF in Machakos County. The sero-prevalence results to the three TBDs

102
were consistent with the number of clinical cases of the three TBDs recorded by the
farmers in the 6-12 months period that preceded the current study. East Coast fever was
reported more frequently than anaplasma and babesiosis by the farmers.
Although the tick vectors for anaplasmosis and babesiosis were common in all sub-
locations, the sero-prevalence for the two infections was low. This state of endemic
instability was not supported by data because of the few clinical cases recorded by
farmers. However, it was possible that the recorded cases were an underestimate of the
true incidence of the two diseases in the area probably due to problems of diagnosis or
even recall. The concept of endemic stability/ instability is best investigated through
longitudinal studies where factors such as seasonal abundance of ticks, morbidity and
mortality could be evaluated (Perry et al., 1992). Thus, further studies need to be
undertaken to establish the true endemic state of the two diseases in the study area.
Kathome and Ndunduni sub-locations had low sero-prevalence rates for all the three
TBDs. This may have been attributed to the fact that most farmers in the two sub-
locations practiced zero grazing. In addition, most farmers in the two sub-locations kept
exotic crossbreeds of cattle and they applied acaricides on a regular basis. The farmers
were apparently aware that these cattle breeds were more susceptible to tick-borne
diseases than the indigenous breeds and thus applied tick control more rigorously. On the
other hand, the sero-prevalence of ECF was significantly higher in Athi River Division
(Katani and Ngelani sub-locations) than in other divisions. The two sub-locations also
had relatively higher sero-prevalence rates of anaplasma and babesia than the other sub-
103
locations. This may have been attributed to poor tick control practices reported in the two
sub-locations. Although most farmers in the two sub-locations indicated that they
undertook tick control on a regular basis, it was observed that a few applied the acaricides
as recommended as ticks could still be found attached on animals that had been sprayed
as late as a day or two prior to the farm visit. Poor tick control was also documented in
smallholder cattle production systems in western Kenya in a study carried out by Okuthe
and Buyu (2006). Improper application of acaricides especially the use of under strength
acaricides can result in ticks developing widespread resistance. This is an aspect that
needs further investigation. Indeed, no association was found between frequency of tick
control on the farms and the risk of testing positive to the TBDs. There is need for
enhanced extension services to educate farmers on proper methods of acaricide
application Delivery of veterinary services in Athi River Division was found to be poor
relative to the other divisions.
Small ruminants were found to be important alternative hosts for ticks for farms where
more than one ruminant species was kept. These results were consistent with the
observations by Wesonga et al. (2006) that goats and sheep played an important role in
maintaining tick populations on a ranch. It is therefore important that tick control at farm
level should target all livestock species in order to reduce tick burdens on the pastures.
On farms that practice zero-grazing, small ruminants on the same farms that are freely-
grazed could be a source of tick infestation on cattle if tick control on the small ruminants
is not undertaken on a regular basis (Maloo et al., 2001c).

104
There was no association between cattle breeds and testing positive to anaplasma. This
may be due to the alternative means of transmission of the disease other than ticks. The
disease is also transmitted by biting flies and contaminated needles (Scole et al., 2008).
There was a high probability of transmission by needles in divisions such as Athi River
and Ndithini where there was poor access to veterinary services. As a result, most of the
farmers treated their sick animals and often used unsterilised needles. Biting flies were
also common in all the sub-locations and therefore their role in the transmission of the
disease needs to be studied.
Rhipicephalus appendiculatus was the commonest tick species in all the sub-locations.
This may explain the relatively higher sero-prevalence of Theileria parva compared to
Anaplasma marginale and Babesia bigemina. With the exception of Kathome and
Ndunduni sub-locations where tick control was generally good, there was likely to have
been challenge by R. appendiculatus throughout the year in the other sub-locations. As a
consequence of continuous tick challenge, most calves (≤ 6 months) were exposed to a
low but continuous T. parva challenge leading to a state of endemic stability (Kivaria et
al., 2004). A typical ECF endemic stability state is characterized by rare clinical disease
with low mortality rates that are limited to young stock. This state is found in a few
localized parts of the country where the local Zebu cattle are maintained under extensive
management conditions with little or no efficacious acaricide application and where R.
appendiculatus can undergo at least two generations annually (Perry et al., 1994). Under
such circumstances, greater numbers of cattle are reservoirs of T. parva at low levels of
parasitaemia and thus ticks bear low infection rates. Calves born in these areas become
immune through natural infection before they are three months old (Moll et al., 1986) and

105
therefore little or no clinical disease occurs. Parameters used to characterize endemic
stability are the antibody prevalence of calves (Deem et al., 1993) and age-specific
morbidity and mortality rates (Norval et al., 1992). This state of endemic stability
appeared to occur in Athi River and Ndithini divisions but was absent in Kangundo and
Matungulu Divisions.
Amblyomma variegatum, the vector of Ehrlichia ruminantium (heartwater) was one of the
common tick species in the study area. Blood samples collected from the three livestock
species were not screened due to problems with the standardization of the ELISA kits
used in the screening of Cowdria (Ehrlichia ruminantium,), the main tick-borne disease
of small ruminants in Eastern Africa (Dolan, 1991). It will be necessary to screen the sera
for Ehrlichia ruminantium once the problem with the kits is resolved so as to obtain a
clearer picture of the sero-prevalence of all the major TBDs in the study area as at the
time of the survey. Ehrlichia ruminantium has previously been isolated (Ngumi et al.,
1997) from a sub-location adjacent to the study site.
Generally, the high tick challenge in the study area could largely be attributed to a break
down in tick control services formerly supported by the government not only in the
County, but in the rest of the country. Despite the enactment of the Cattle Cleansing Act
(GoK, 1976) which led to the initiation of a national tick control programme, adequate
control of ticks and TBDs is still far from being achieved. The structural adjustment
programm as advocated by the World Bank in the late 1980s and the escalating costs of
acaricides, relevant infrastructure and monitoring services for the intensive tick control
strategies advocated by the Cattle Cleansing Act led to the inability of the government

106
services to sustain the program. Just like in other parts of the country, poor management
of dips by local committees in the County virtually led to the collapse of the tick control
facilities. As a result, most farmers depend on hand sprays to apply acaricides on the
animals (personal observation).
In conclusion, introduction of exotic breeds, which are highly susceptible to TBD, should
be undertaken with strict tick control. However, inspite of the high level of tick challenge
in the County, it is possible to introduce improved cattle breeds if an integrated approach
to the control of tick-borne diseases is adopted that will lead to the development of
endemic stability. This is feasible with ECF, if a policy of strategic dipping, in
combination with other strategies such as immunization against the disease is adopted. A
similar approach can be eventually adopted with the other TBDs subject to further studies
being conducted on which combination of strategies is most effective.

107
CHAPTER 6
MORBIDITY AND PRODUCTIVITY ESTIMATES IN
SMALLHOLDER LIVESTOCK FARMS IN MACHAKOS COUNTY
6.1 INTRODUCTION
A few epidemiological and socio-economic studies aimed at assessing the risk of TBDs
have been conducted in the Coast, Central and Western regions of Kenya (Maloo, 1993;
Maloo et al., 1994). In Machakos County, and indeed in much of the eastern region of the
country, such data are largely lacking. These data would be invaluable in the design of
appropriate and targeted control programmes of TBDs known to have negative impact on
livestock productivity arising from morbidity and mortality (Minjauw and McLeod,
2003). Data from other regions of the country cannot be extrapolated to the situation in
Machakos County due to differences in climatic and cattle production systems.
Longitudinal studies incorporating intensive monitoring are best suited to reliably
evaluate the risk and impact of these diseases.
In this Chapter, the incidence of ECF and other diseases affecting livestock productivity
in both cattle and small ruminants are assessed.

108
6.2 MATERIALS AND METHODS
6.2.1 Study implementation
6.2.1.1 Selection of farms for the longitudinal study
The study was carried out in seven sub-locations (Kiatineni, Kalandini, Katine,
Ndunduni, Kathome, Katani and Ngelani). Milani sub-location in Ndithini Division was
omitted because of inaccessibility during the rainy season. Four farms from each of the
three divisions (Kangundo, Matungulu and Athi River) and two from Ndithini Division
were randomly selected for the study from a sampling frame described in Chapter 4.
Using random number tables, two farms per study sub-location were randomly selected
from the list of farms that participated in the cross-sectional survey. Milani sub-location
was omitted from the list of selected sub-locations due to concerns about accessibility
during the rainy seasons. Thus, fourteen herds were selected for the study.
The selected farms were then followed up for 12 months.
6.2.1.2 Recruitment of study animals
All young animals (calves, lambs and kids) found on the 14 farms at the time of the first
farm visits in January 2008 were recorded and ear-tagged for ease of identification. Other
young animals (calves, kids and lambs) were recruited as they entered the study
population mainly through births.

109
6.2.2 Monitoring of animal health and productivity
6.2.2.1 Data collection
A notebook was issued to all the study farmers for keeping simple farm records such as
livestock births, deaths, sales and milk production. All the farms were followed- up on
monthly basis for 12 months. During each of the farm monitoring visits, a short
questionnaire (Appendix 6.1) was used to collect and record both farm and animal level
data. The information sought included:
• Birth weights.
• Occurrence of diseases.
• Herd dynamics (births, mortality, culling rates, sales).
• Weaning weights and ages.
• Fertility and breeding female management.
• Milk production of cows calving during the observation period.
• Tick challenge. On every visit all selected animals (cattle, sheep and goats) on the
farms were observed for presence of ticks and categorized as described in
Chapter 5.
• Tick control. Tick control was categorized as follows:
Regular= acaricide (dip, spray or pour- on) applied according to anufacturers’instructions
at 1-2 weeks interval. Irregular= acaricide (dip, spray or pour- on) applied according to
manufacturers’ instructions only at times of high tick challenge.
None= no tick control measures used.
• Other information recorded during the monthly visits were:

110
Veterinary interventions and farm management practices undertaken (such as treatments,
castrations, dehorning, vaccinations and deworming) between visits. Details of the date(s)
when the interventions were undertaken as well as the costs were recorded.
The questionnaires were administered to the designated head of the household or the
person in charge of the management of the farm. For each of the administrative sub-
locations, the local animal health assistant was recruited as an enumerator to perform the
interviews in the local Kikamba language.
6.2.2.2 Disease diagnosis and reporting
Besides monthly visits by the principal investigator, occurrence of disease on the selected
farms was monitored on a daily basis by the livestock owner. Farmers were instructed to
report all suspected cases of disease to either the animal health assistant or the principal
investigator to enhance data collection and recording. In three of the sub-locations
(Katine, Ndithini and Ndunduni), the local animal health assistants were recruited to
monitor the occurrence of diseases. Other farms relied on mobile phone communication
to notify the chief investigator of disease occurrences who then visited such farms within
a period of not more than 24 hours. The animal health assistants were also instructed to
notify the principal investigator of disease conditions of which they could not make a
diagnosis.
To avoid losing any of the recruited animals particularly calves to TBDs, the livestock
owners were also trained in early recognition of clinical signs of TBDs, namely, ECF,
anaplasma, cowdriosis (heartwater) and babesiosis. To enhance reporting and

111
confirmation of diseases, all clinical cases of TBDs in cattle on the study farms were
treated free of charge throughout the trial period.
Cases of ECF were tentatively diagnosed in the field based on clinical assessment. The
key clinical signs of the disease included malaise, lachrymation or corneal opacity,
petechiael haemorrhages on gums and tongue, anorexia, acute respiratory distress, parotid
and pre-scapular lymph node enlargement and a fever (rectal temperature of more than
39.4oC). For anaplasmosis the signs were high fever (40.5oC) progressive anaemia,
jaundice and in some cases passing of hard faeces, and for babesiosis the clinical signs
were an acute onset of high fever (41oC), jaundice and dark red to brown urine.
Cowdriosis was suspected in the event of sudden death and nervous signs being observed
particularly in small ruminants.
A thin and thick blood smear and a lymph node biopsy smear were made from all
reported cases before treatment. Definitive diagnoses were done following examination
of Giemsa-stained samples at the veterinary research laboratories, Muguga.
Arrangements were made to deliver samples that needed to be examined in the laboratory
soon after fixing in alcohol. This was usually done within 24 hours of clinical diagnosis.
Acceptable animal welfare standards were taken into consideration in this study. Hence,
study animals were not unduly left to die in order to monitor mortality. All cattle that
were diagnosed with ECF were treated using buparvaquone (Butalex®, Scheling-Plough
Animal Health, UK) at a dose of 2.5 mg/kg.

112
6.2.2.3 Confirmation of tick-borne infections
The stained thin blood smears were used for examination of haemoparasites either for
general assessment of the prevalence of TBDs or to confirm suspected disease cases.
Each smear was examined for theilerial piroplasms, anaplasma and babesia parasites in
the red blood cells using the oil immersion x 100 objective of the light microscope. At
least three fields were thoroughly examined for each smear. Detection of specific
parasites in blood smears was confirmatory for anaplasmosis, and babesiosis and ECF by
detection of macroshizonts in the lymphocytes on stained lymph node smears (Figures
6.1 and 6.2). Only positively confirmed cases of TBDs were included in the analysis. In
case of death, a postmortem was carried out whenever possible. All information was
recorded in a field sheet.
Figure 6.1: Anaplasma marginale bodies in red blood cell.

113
Figure 6.2: Macroschizonts in lymphocytes.
6.2.2.4 Diagnosis and confirmation of other common infections
General bacterial infections were confirmed on the basis of response to antibiotic
treatment reported by the farmers, three to four days after the treatment.
Mange and mycotic infections were confirmed from the observed lesions and
microscopic examination. Areas of thickened skin in obviously itchy animals were very
suggestive of mites, particularly if there was no evidence of lice. Skin scrapings were
taken from the thickened sections for examination under a microscope in the laboratory.
Helminth infections were confirmed through examination of faecal samples using the
quantative McMaster floatation method (Souslby, 1982) for detection of nematode eggs
and cestode eggs and coccidian oocysts. A simple sedimentation method was used for
detection of trematode eggs. Animals with faecal nematode egg counts of up to 100,000
eggs per gram of faeces (epg) were categorized as suffering from acute nematode
infection while those with faecal egg counts of 2,000 or less were considered to be

114
suffering from chronic nematode infection (Allonby and Urquhart, 1975; Nginyi, 1999).
Diagnosis of helminthosis was done in conjunction with clinical signs such as anemia,
edema in the mandibular region, weakness, unthriftness and emaciation.
The symptoms on which diagnosis of malnutrition was based included weakness with
protrusion of bones of the shoulders, ribs, backbone and hips, sunken eyes and tucked up
abdomens. On postmortem, it was diagnosed based on lack of fat under the skin, very
little body fat around the heart, kidneys and other organs and within the bone marrow,
reduced muscle mass, and shrunken body organs.
6.2.2.5 Collection of data on animal productivity and herd dynamics
The farmers were requested to record in the notebooks births, deaths and animals sold or
brought into the farm. Farmers with lactating animals were asked to record the daily milk
production. In the three sub-locations where AHAs were available, they were asked to
make regular visits to the farms to ensure that farmers made the required entries into the
notebooks. The live weight of all calves was estimated and recorded by the same person
(the chief investigator) using a weight band (Dalton supplies) during the monthly visits.
Live weights of kids and lambs were taken using a spring weigh scale (Hanson® Model
21). Farmers were asked to report animal births (and hence date of calving) as soon as
possible to enable birth weights to be taken. Records were also taken of when calves,
lambs and kids were weaned. Data on cases of infertility in cows and breeding
management were also recorded.

115
6.2.3 Estimating productivity parameters
6.2.3.1 Productivity rate
The productivity rates and the formula used to derive them are summarized in Table 6.1.
The rates were based on the twelve- month follow up period. Data on female infertility
and management were also obtained. Infertility was defined as diminished or lack of
capacity to produce viable offspring.
6.2.3.2 Birth weights, weight at weaning and age at weaning
Birth weights, weight at weaning and age at weaning were obtained for calves, kids and
lambs born during the 12-month observation period. The mean birth weights were
derived only for the animals whose records were taken within 24 hours of birth.
6.2.3.3 Estimation of milk production
Farmers kept records of daily milk output from all cows that calved and those that were
already lactating during the observation period. Measurements were done in litres using
calibrated 1 litre plastic cups, beer bottles (0.5 litres) or soda bottles (0.3 litres). Two milk
production parameters; mean daily yield per cow and annual lactation yield were
estimated. The production estimates were made for three periods categorised as peak (1
to 90 days), declines (91 to 180 days) and late (181 to 365 days) phases of lactation.

116
Table 6.1: Definition of productivity parameters estimated during the longitudinal study of smallholder farms in Machakos County, 2007. Parameter Definition Bull / cow ratio Number of mature bulls
Number of cows Parturition rate Number of parturitions per female per year
Off-take rate Sales/exits x 100
Herd size 6.2.4 Incidence rates
Disease incidence rates were calculated as the ratio of the number of observed events per
unit time to the population at risk (Putt et al., 1987). True rates were calculated to define
the speed of occurrence of TBDs or productivity parameters. The specific rates are
defined in the relevant sections. Generally, the incident rates (IR) for the various diseases
were computed as described in Martin et al. (1987):
IR= Number of events during observation period Animal months at risk
The monthly rates were subsequently converted into annual rates
In order to calculate the true incidence rates of the disease events, the entry and exit
points for the animals was determined. The denominator for estimating incidence was the
number of animal-months between the dates the longitudinal phase of the study began (or
date of recruitment for those animals introduced into the study after commencement) and
detection of infection, withdrawal from the study, or end of the study.
Incidence rates of the various diseases recorded during the observation were computed.
In addition, age- specific rates were also computed. Cattle were categorized as calves

117
(from birth to 12 months of age), yearlings (13-24 months) and adults (over 2 years of
age). Goats and sheep were categorised as kids/ lambs (less than 6 months), weaners
(6 months to less than 1 year) and adults (1 year and above). The categorization of goats
and sheep is as described by SR-CRSP (1992), Abegaz and Awgichew (2009) and
Schoenian (2012). Under this categorization, on average goats and sheep naturally wean
by 6 months and attain sexually maturity by 1 year of age.
6.2.5 Meteorological data
The main meteorological station nearest to the longitudinal sites was Katumani, close to
Machakos town. Rainfall figures, daily minimum and maximum temperatures for the
period of the longitudinal study (Jan 2008 to May 2009) were derived from records kept
at the station. The mean monthly values were then calculated from the daily values.
6.3 Data management and analysis
Three separate dataset files for cattle, sheep and goats were designed in Microsoft Access
(Microsoft Corporation, USA) to store data on individual animal variables (animal
number, age, sex, breed) visit variables (animal number, entries, exits, diseases, tick
counts, applied methods of disease control) and farm level variables (division, location,
farm code). After screening the files for errors, they were exported to STATA Version 10
(StataCorp, 2007) program for analysis. Risk periods for calculation of incidence rates for
various disease events were calculated in Microsoft Excel program (Microsoft
Corporation, USA) after exporting the relevant data files from the Access program.

118
6.4 RESULTS
6.4.1 Meteorological Data
The mean monthly rainfall was 1.25mm (Figure 6.1). A maximum of 4.31 mm was
received during the traditional long rain period of March to June. Hardly any rainfall was
received between May and October.
No major temperature fluctuations were recorded during the study period with the
temperature generally within the normal annual range of 18-25o C for the County (Figure
6.2).
0
1
2
3
4
5
6
2008
Jan
Feb
marc
h A
pril
May
June
2008
july
Aug
Sept
Octobe
rNov
Dec
2009
Jan
Feb
Mar
ch Apr
il
Month
Mea
n R
ain
fall
(m
m)
Fig 6.3: Distribution of rainfall in the study area during the monitoring period (Jan 2008- April 2009).
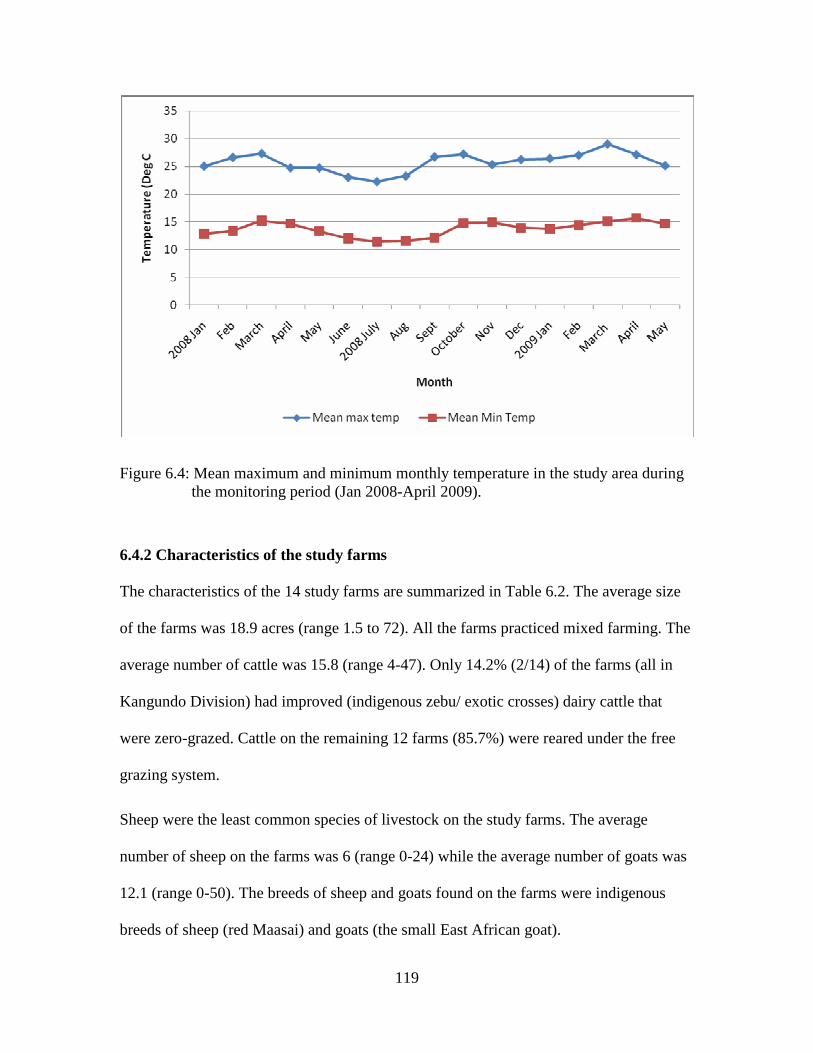
119
Figure 6.4: Mean maximum and minimum monthly temperature in the study area during the monitoring period (Jan 2008-April 2009).
6.4.2 Characteristics of the study farms
The characteristics of the 14 study farms are summarized in Table 6.2. The average size
of the farms was 18.9 acres (range 1.5 to 72). All the farms practiced mixed farming. The
average number of cattle was 15.8 (range 4-47). Only 14.2% (2/14) of the farms (all in
Kangundo Division) had improved (indigenous zebu/ exotic crosses) dairy cattle that
were zero-grazed. Cattle on the remaining 12 farms (85.7%) were reared under the free
grazing system.
Sheep were the least common species of livestock on the study farms. The average
number of sheep on the farms was 6 (range 0-24) while the average number of goats was
12.1 (range 0-50). The breeds of sheep and goats found on the farms were indigenous
breeds of sheep (red Maasai) and goats (the small East African goat).

120
The housing for calves, goats and sheep consisted of simple grass thatched or galvanised
sheets roofs supported by gum or eucalyptus poles. The walls consisted of widely spaced
eucalyptus poles designed to keep the animals confined and keep predators away.
Table 6.2: Farm characteristics of the 14 farms that participated in the longitudinal study in Machakos County in 2008 to 2009.
Division Farm code Farm size (acres)
No of cattle No of sheep No of goats
ATH/07 25 20 5 0 ATH/17 15 14 0 12 NGE/08 70 47 24 43
Athi River
NGE/11 72 40 15 50 KAN/05 9 5 3 0 KAN/15 1.5 5 0 2 KAT/01 10 20 0 26
Kangundo
KAT/08 2 4 0 2 KAL/04 20 30 15 10 KAL/21 4 12 6 0 KNE/05 7 4 12 2
Matungulu
KNE/08 8 4 4 3 ND/11 18 8 0 20 Ndithini ND/13 3 8 0 0
Total 264.5 221 84 170 Average 18.9 15.8 6 12.1
6.4.3 Cohort dynamics
6.4.3.1 Cattle cohort dynamics
Initially, 17 calves and 7 yearlings with birth and disease history records were recruited
(Table 6.3). These calves and yearlings were found on 13 of the farms. Calf entries
resulted mainly from births within the study farms. Out of a total of 65 new entries
observed, 56 (86.2%) were from births with male calves contributing 29 (51.7%) of the
births. No calving took place in one of the farms throughout the study period. Six calves
121
and 3 yearlings entered the farms from other farms as gifts or entrustments. Of the 9
calves and yearlings that were transferred into the selected farms during the study, 6 were
female and 3 were male. Sixty (92.3%) of the new entries were indigenous (zebu) while 5
five (7.7%) were exotic. A total of 26 calves that contributed to the follow–ups exited
from the study cohort before the end of the study due to deaths, sales, theft or transfer out
of farms as gifts or entrustments. Of the exits, 16 (61.5%) were female and the other 10
were male. Twenty-three (88.4%) of the exits were calves or yearlings of indigenous
(Zebu) breed. Fourteen (53.8%) of the exits came from Athi River, Kangundo 5 (19.2%),
Ndithini 2 (7.7%) and 5 (19.2) from Matungulu Division.
No adult cattle were brought into the any of the recruited farms during the study period.
However, five animals, all cows exited during the study period. Three cows died during
the observational period while 1 cow each was given out as a present or sold. No cow or
breeding bull was culled during the study period.

122
Table 6.3: A cohort of calves/ yearlings monitored for 12 months and reasons for exit from the study.
Entries since precious visit
Withdrawals since previous visit
Visit Number
Births Transfers Total Deaths Sales Transfers Theft Total No. calves/yearlings observed
Initial N/A N/A N/A N/A N/A 24
1 6 6 0 0 0 0 0 30
2 6 1 7 2 0 0 0 2 35
3 7 5 12 1 0 3 1 5 42
4 2 1 3 2 2 0 1 5 40
5 3 3 1 2 0 0 3 40
6 2 2 0 0 1 0 1 41
7 4 4 1 0 2 1 4 41
8 7 7 0 0 0 0 0 48
9 3 2 5 1 0 0 0 1 52
10 6 6 1 2 0 0 3 55
11 5 5 0 1 1 0 2 58
12 5 5 0 0 0 0 0 63
Total 56 9* 65 9 7 7 3 26
* Three of the transfers into the study farms were yearlings
6.4.3.2 Kids and lambs dynamics on the study farms
Twenty-eight lambs/kids and 7 weaners were originally recruited into the study (Table
6.4). The kids and lambs were recruited from each of the selected farms while the
weaners were found on 35.7% (5/14) of the farms. The 12 monitoring visits resulted into
632 individual observations for goats and sheep. New entries resulted mainly from births
within the farms. Of the 43 new entries, 79.0% (34/43) were from births. Female kids/
lambs contributed 70.5 % (24/43) of the new births.

123
Eight goats and sheep (4 weaners and 4 adults) were bought and brought into the farms
during the study. One goat (a male adult) entered one of the farms as a gift. Of the new
entries that entered the farms through purchasing or as gifts, 5 were male while 4 were
female.
Twenty one (48.8%) of the new entries were recorded in Athi River Division. Five
(11.6%) new entries were recorded in Kangundo Division. Ndithini had 14.0% (6/43)
while Matungulu Divisions had 25.6% (11/43) new entries.
A total of 14 exits were recorded during the study due to deaths, sales, theft or transfer
out of the farms as gifts or entrustments (Table 6.4). Five of the exits were a result of
death from disease, 4 animals were sold, another 4 were transferred to other farms while
1 animal was stolen from one of the farms.

124
Table 6.4: A cohort of goats and sheep followed up for 12 months in Machakos County, 2008 to 2009 reasons for exit from the study.
Entries since precious visit
Withdrawals since previous visit
Visit Numb
er
Births Purchase Transfers Total Deaths Sales Transfers Theft Total No. kids/lambs observed
Initial
N/A N/A N/A N/A N/A N/A N/A N/A N/A 28
1 2 0 0 2 0 0 2 0 2 28
2 2 1 0 3 0 0 0 0 0 31
3 1 0 0 1 1 0 0 0 1 31
4 4 0 0 4 1 0 0 0 1 34
5 1 0 0 1 1 1 0 1 3 32
6 2 4 1 7 0 0 1 0 1 38
7 6 1 0 7 1 0 0 0 1 44
8 5 0 0 5 0 0 1 0 1 48
9 4 0 0 4 0 0 0 0 0 52
10 2 2 0 4 0 0 0 0 0 56
11 1 0 0 1 1 2 0 0 3 54
12 4 0 0 4 0 1 0 0 1 57
Total 34 8 1 43 5 4 4 1 14

125
6.4.4 Morbidity rates
6.4.4.1 Incidence of East Coast fever
Table 6.5 shows the true annualized incidence rates of confirmed ECF cases distributed
according to both farm and animal level factors. Twenty-six (26) cases of ECF were
confirmed only in the indigenous zebu cattle in the 14 farms during the one-year follow-
up period. This converted to an overall incidence rate of 2.6% per calf-month. The rate
was significantly (p< 0.05) higher in calves (64.1%) than in yearlings (0%) and adults
(6.20%) (Table 6.5). Indeed, adults were 10 times (IRR=0.1) less likely to develop ECF
relative to calves. Similarly, significantly (p<0.05) more cases of ECF occurred in
animals on farms where there was no tick control (incidence rate =60.86%) compared to
farms where tick control was practiced (incidence rate of 9.95%). There was a close
relationship between the incidence of ECF and frequency of acaricide application as
shown by the drastic decrease in the incidence as the frequency increases (Table 6.5).
Season was associated with the occurrence of ECF with significantly (p<0.05) more cases
reported in the rainy season (incidence rate 45.93%) than in the dry season (incidence
rate 20.03%). Division was associated with disease as significantly (p<0.05) more cases
were recorded in Athi River Division compared to the other 3 study divisions (Table 6.5).

126
Table 6.5: The incidence of ECF in Machakos County categorized by animal and farm level factors (Jan 2008 to Jan 2009). Variable Levels No. of
cases Animal months-at-risk
Incidence rate (%) per cow month (95% CI)
Annual incidence rate1
Incidence rate ratio (IRR)
p-value
Division Ndithini 1 133 0.7 (0.0, 4.2) 9.02a 0.14 0.02 Kangundo 1 212 0.4 (0, 2.6) 5.66a 0.09 0.05 Matungulu 3 288 1.0 (0.2, 3.0) 12.5a 0.19 0.01 Athi 21 384 5.5 (3.4, 8.4) 65.63b 1.00 - Breed Indigenous 26 926 2.8 (1.8, 4.1) 33.70 - Exotic 0 91 0 0 - Age Yearling 0 181 0 0 - - Adult 2 387 0.5 (0.0, 1.9) 6.20a 0.10 0.02 Calf 24 449 5.3 (3.4, 8.0) 64.14b 1.00 Sex Female 18 661 2.7 (1.6, 4.3) 32.68a 1.22 0.64 Male 8 356 2.2 (0.9, 4.4) 26.96a 1.00 Tick levels
Low 5 305 1.6 (0.5, 3.8) 19.68a 0.84 0.78
Moderate 5 202 2.5 (0.8, 5.8) 29.70a 1.27 0.69 High 10 203 4.9 (2.4, 9.1) 59.14a 2.53 0.07 None 6 307 2.0 (0.7, 4.3) 23.45b 1.00 Tick control
Yes 5 603 0.8 (0.2, 1.9) 9.95a 0.16 0.00
No 21 414 5.1 (3.1, 7.8) 60.86b 1.00 Tick challenge
No 6 307 2.0 (0.7, 4.3) 23.45a 0.69 0.42
Yes 20 710 2.8 (1.7, 4.4) 33.80a 1.00 Season Wet
(Rainy) 16 418 3.8 (2.2, 6.2) 45.93a 2.30 0.04
Dry 10 599 1.7 (0.8, 3.1) 20.03b 1.00
>8 3 334 0.9 (0.2, 2.6) 10.78a 0.41 0.17 0-4 10 82 12.2 (5.8,
22.4) 146.4b 5.66 0.00
2Dipping frequency
5-8 13 601 2.2 (1.2, 3.7) 26.4c 1.00 1Rates followed by a different superscripts are statistically different (p<0.05) 2 Key to dipping frequency: Categories 0-4, 5-8 and >8 refer to the total number of times that tick control was practiced at farm level during the entire observation period

127
6.4.4.2 Incidence of other diseases and conditions
In the course of the follow-up period, 4 cases of anaplasmosis were confirmed converting
to an annual incidence of 4.26% per cow- year. Of the 4 cases, 2 were in calves and 2 in
yearlings equivalent to annual incidence rates of 4.44% per cow-year and 1.11% per cow-
year, respectively.
Other conditions/ infections observed in cattle included malnutrition (13 cases), mange
(Chorioptes bovis) (9 cases), mycosis (Trichophytan bovis) (7 cases) and diarrhoea
(7 cases). Malnutrition was found in three of the study divisions and the annual incidence
rate ranged from a high of 26.3% in Matungulu Division to 14.5 % per cow-year in Athi
River and 9.2% per cow-year in Ndithini Division (Table 6.6). These rates were not
significantly different at 5% significance level. All the cases of malnutrition were
diagnosed in indigenous cattle and equally in all the age categories and sexes. There was
no association (p>0.05) between malnutrition and season (wet/dry) and any of the other
variables considered (Table 6.6).

128
Table 6.6: The incidence of malnutrition in Machakos County categorized by animal and farm level factors (Jan 2008 to Jan 2009). Variable Levels No. of
cases Animal months-at-risk
Incidence rate (%) per cow month (95% CI)
Annual Incidence rate
Incidence Rate Ratio (IRR)
P-value
Division Ndithini 1 131 0.8 (0, 4.3) 9.17 0.76 0.80 Kangundo 0 223 0 0 0 - Matungulu 6 274 2.2 (0.8, 4.8) 26.28 1.46 0.58 Athi 6 498 1.2 (0.4, 2.6) 14.45 1.00 - Breed Indigenous 13 1035 1.3 (0.7, 2.1) 15.06 - - Exotic 0 91 0 0 - - Age Yearling 2 216 0.9 (0.1, 3.3) 11.11 1.26 0.79 Adult 6 370 1.6 (0.6, 3.5) 11.11 1.47 0.59 Calf 5 540 0.9 (0.3, 2.2) 19.46 1.00 Sex Female 9 761 1.2 (0.5, 2.2) 13.15 1.93 0.40 Male 4 365 1.1 (0.3, 2.8) 14.40 1.00 Season Wet 6 469 1.3 (0.5, 2.8) 15.35 2.11 0.25 Dry 7 657 1.1 (0.4, 2.2) 12.78 1.00
Mange was diagnosed in all the 4 divisions with the highest incidence rate (12.12% per
cow-year) recorded in cattle in Kangundo Division (Table 6.7). However, the rates were
not significantly different between the divisions at 5% significance level. Although the
incidence rates were not significantly different in the three age categories, it was higher
in calves than in yearlings and adults. Of all the variables that were considered only the
variable “tick control” was associated with mange (Table 6.7). Mange was significantly
(p<0.05) higher on farms where tick control was not practiced (incidence of 14.17 per
animal year) compared to farms where tick control was practiced (incidence of 2.61 per
animal year). This was an indication that the acaricides used for tick control were also
effective on mites.

129
Table 6.7: The incidence of mange in Machakos County categorized by animal and farm level factors (Jan 2008 to Jan 2009). Variable Levels No. of
cases Animal months-at-risk
Incidence rate (%) per cow month (95% CI)
Annual incidence
Incidence rate ratio (IRR)
p-value
Division Athi 4 502 0.7 (0.2, 2.0) 9.56 1.00 Ndithini 1 134 0.7 (0.4, 4.2) 8.95 0.94 0.95 Kangundo 2 198 1.0 (0.1, 3.6) 12.12 0.62 0.67 Matungulu 2 301 0.7 (0, 2.4) 7.97 0.84 0.84 Breed Indigenous 9 1044 0.9 (0.4, 1.6) 10.34 - Exotic 0 91 0 0 - Age Calf 7 521 1.3 (0.5, 2.8) 16.12 1.00 Yearling 1 216 0.5 (0, 2.6) 5.56 0.35 0.32 Adult 1 398 0.3 (0, 1.4) 3.21 - Sex Male 2 381 0.5 (0, 1.9) 6.30 0.66 0.61 Female 7 754 0.9 (0.4, 1.9) 11.14 1.00 Tick control Yes 1 458 0.2 (0, 1.2) 14.17 0.10 0.02 No 8 677 1.2 (0.5, 2.3) 2.61 1.00 Season Wet 2 468 0.4 (0, 1.5) 5.13 0.48 0.36 Dry 7 667 1.0 (0.4, 2.2) 12.6 1.00 * Key to dipping frequency: Categories 0-4, 5-8 and >8 refer to the total number of times that tick control was practiced at farm level during the entire observation period.
Cases of non-specific diarrhoea were recorded in Athi River, Kangundo and Ndithini
Divisions and none in Matungulu (Table 6.8). Of all the factors considered, only breed
and season were associated with diarrhea. Exotic cattle were approximately 9 times
(RR=9.19) more likely to have diarrhea relative to indigenous cattle. Similarly, diarrhea
was 8.7 times more likely during the wet season than in the dry season (Table 6.8).

130
Table 6.8: The incidence of diarrhea in Machakos County categorized by animal and farm level factors (Jan 2008 to Jan 2009). Variable Levels No. of
cases Animal months-at-risk
Incidence rate (%) per cow month (95% CI)
Annual incidence rate1
Incidence rate ratio (IRR)
p-value
Division Ndithini 1 124 0.8 (0, 4.5) 9.68 1.33 0.80 Kangundo 3 213 1.4 (0.3, 4.1) 16.90 2.26 0.32 Matungulu 0 312 0 0 - Athi 3 494 0.6 (0.1, 1.8) 7.29 1.00 Breed Exotic 3 81 3.7 (0.8, 10.8) 44.44a 9.19 0.00 Indigenous 4 1062 0.4 (0.1, 1.0) 4.52b 1.00 Age Yearling 0 227 0 0 - Adult 4 367 1.1 (0.3, 2.8) 13.08 2.01 0.36 Calf 3 549 0.5 (0.1, 1.6) 6.56 1.00 Sex Male 3 378 0.8 (0.2, 2.3) 9.52 1.50 0.60 Female 4 765 0.5 (0.1, 1.3) 6.27 1.00 Season Wet 6 470 1.3 (0.5, 2.8) 15.32a 8.66 0.05 Dry 1 673 0.1 (0, 0.8) 1.78b 1.00 1Rates followed by a different superscripts are statistically different (p<0.05).
Mycosis was observed in Athi River, Kangundo and Matungulu divisions. Kangundo
Division had the highest annual incidence rate (17.83%) of the disease during the
observation period (Table 6.9). However, the incidence of the disease was not
significantly different between the three divisions (p>0.05). No case of the disease was
observed in Ndithini Division. The incidence was significantly (p<0.05) higher in exotic
crosses than in the indigenous zebu cattle and was detected only in calves and yearlings.
No association (>0.05) was found between mycosis and the other factors that were
considered (Table 6.9).

131
Table 6.9: The incidence of mycosis in Machakos County categorized by animal and farm level factors (Jan 2008 to Jan 2009).
Variable Levels No. of cases
Animal months-at-risk
Incidence rate (%) per cow month (95% CI)
Annual incidence rate1
Incidence rate ratio (IRR)
p-Value
Division Ndithini 0 135 0 0 - Kangundo 3 202 1.5 (0.3, 4.3) 17.83 2.55 0.25 Matungulu 1 311 0.3 (0, 1.8) 3.86 0.56 0.61
Athi 3 521 0.6 (0.1, 1.7) 6.90 1.00 Breed Exotic 3 70 4.3 (0.9, 12.5) 51.45a 11.35 0.00 Indigenous 4 1099 0.4 (0, 0.9) 4.37b 1.00 Age Yearling 1 222 0.5 (0, 2.5) 5.41 0.40 0.40 Adult 0 413 0 0 - Calf 6 534 1.1 (0.4, 2.4) 13.48 1.00 Sex Male 2 391 0.5 (0, 1.8) 6.14 0.79 0.78 Female 5 778 0.6 (0.2, 1.5) 7.71 1.00 Tick control Yes 6 691 0.9 (0.3, 1.9) 10.42 4.13 0.19 No 1 478 0.2 (0, 1.2) 2.51 1.00 Season Wet 5 486 1.0 (0.3, 2.4) 12.34 3.52 0.13 Dry 2 683 0.3 (0, 1.1) 3.51 1.00 1Rates followed by a different superscripts are statistically different (p<0.05)
6.4.5 Mortality rates
Eleven cattle died during the follow-up period converting to an overall crude mortality
rate of 11.6% per cow-year. Of the 11 that died, 8 were calves and 3 were adults.
Three calves died of ECF, 4 calves died suddenly of a disease condition that could not be
established and 1 calf died of diarrhoea.
The cause specific annual mortality rates for ECF, non-specific disease condition and
diarrhoea were 6.56%, 8.74% and 2.19% respectively per cow year. One cow each died
of milk fever, malnutrition and injuries as a result of falling into a deep pit. This
converted to a cause specific annual mortality rate of 3.27% per cow year for each of the
three conditions.

132
6.4.6 Morbidity in sheep and goats
A variety of diseases/ conditions were observed in both sheep and goats during the
follow-up period. The cases were too few to enable the computation of true rates as was
done for cattle diseases. However, helminthosis had the highest number of cases (8)
detected in both species followed by 7 suspected cases of Contagious Caprine
Pleuropneumonia (CCPP) (Table 6.10). The helminths identified were Trichostrongylus
colubriformis. Pneumonia, diarrhea due to bacterial infections, severe flea infestations
and mange were the other diseases detected in small ruminants. The 7-suspected cases of
CCPP were reported in Ngelani sub-location of Athi River Division. All the goats died
despite attempts by the farmer to treat with antibiotics. Confirmation of diagnosis was not
done as the farmers did not report the outbreak immediately it occurred. The suspected
source of the CCPP outbreak were goats reportedly sourced from North Eastern Kenya.
Table 6.10: Distribution of cases of disease /conditions in sheep and goats during a one- year follow-up period in Machakos County, 2008 -2009.
Disease/ Condition
Species Helminthosis Pneumonia Fleas Mange Diarrhea CCPP
(suspected)
Injuries Non specific diagnosis
Sheep 3 1 0 0 1 0 1 2
Goats 5 3 3 1 3 7 1 1
Total 8 4 3 1 4 7 2 3

133
6.4.7 Estimates of productivity parameters
6.4.7.1 Mean daily milk yield
A total of 44 lactating cows were monitored from February 2008 to March 2009 (Table
6.11). The mean daily milk yield was significantly (p<0.05) higher for the exotic breeds
(6.22 litres) than for the indigenous (1.86 litres) zebu breeds.
Table 6.11: Comparison of the mean daily milk yield between exotic crosses and indigenous breeds of cattle, in Machakos County.
95% CI Breed No. of lactating cows
Mean milk yield (litres) Lower Upper
Exotic crosses
7 6.22 6.17 6.27
Indigenous breed
37 1.86 1.85 1.87
Overall 44 1.97 1.98 1.96
6.4.7.2 The annual lactation curves
The decline of milk yield was more pronounced for exotic breeds but was more gradual
for indigenous cattle (Figure 6.3). The milk yield for the exotic breeds was higher than
for the indigenous breeds for the entire follow-up period. A sharp fall in milk yield was
observed for exotic crosses between the first and sixth month of lactation that coincided
with the onset of a prolonged dry period.

134
Figure 6.5: Comparative annual lactation curves for exotic cross breeds, indigenous zebu and all cows (combined) monitored in the four divisions of Machakos County in 2008 to 2009.
6.4.7.3 Birth weights and age at weaning
A total of 51 calves and a combied total of 34 lambs and kids were recorded within 24
hours of birth (Tables 6.12 and 6.13). The overall estimated mean birth weight for the
calves was 27.45kg (range 18-43). However, the mean birth weights were higher for
exotic cross calves (37 kg) than for the indigenous calves (26kg) and female calves (29
kg) on average weighed more than male calves (26 kg) (Table 6.12). The highest mean
birth weights were recorded for calves in Kangundo Division (32.8kg) and the least in
Matungulu Division (21.8kg). The overall mean birth weight for sheep and goats was
3.73kg (range 2- 6) (Table 6.13). Male goats and sheep (3.97kg) on average weighed
more than female goats and sheep (3.54 kg). The highest mean birth weights were
recorded in Kangundo Division (4.25 kg) and least in Ndithini (2.00kg).

135
Table 6.12: Distribution of calf birth weights by division, sex and breed in Machakos County, 2008-2009.
Variable Level
No of calves Mean birth weight in Kg (range)
28 27.50 (20-38)
9 32.78 (24-43)
8 21.75 (18-28)
Division Athi River
Kangundo
Matungulu
Ndithini 6 26.83 (21-32)
24 25.67 (18-35) Sex Male
Female 27 29.03 (20-43)
46 26.41 (18-38) Breed Indigenous
Exotic 5 37.0 (34-43)
Overall 27.5 (18-43)
Table 6.13: Distribution of kid and lamb birth weights by division and sex in Machakos County, 2008 to 2009. Variable Level No of sheep and
goats Mean birth weight in kg
(range)
Division
Athi River
Kangundo
Matungulu
Ndithini
18
4
10
2
3.61
4.25
3.91
3.54
2-6
3-6
2-6
2-6
Sex Male
Female
10
24
3.97
3.54
2-6
2-6
Overall 3.73 2-6

136
6.4.7.4 Weaning age
The overall mean weaning age for calves in the study sites was 101.24 days (Table 6.14).
Athi River Division had the lowest mean weaning age (76.2 days) while Kangundo had
the highest mean weaning age (140 days). Male calves were weaned at a significantly
(p<0.05) earlier age than the female calves. There was no significant (p>0.05) difference
in the mean weaning age between the indigenous and exotic crossbreeds of cattle. Calves
in Ndithini Division had the highest mean weaning weight (89.2kg). The average mean
weaning weight for the indigenous calves was higher than that of the exotic cross calves.
Table 6.14: Distribution of weaning age and weight by division, sex and breed in Machakos County, 2008 -2009. Variable Level Mean age (days) at weaning Mean weight in kg (range)
Athi River 76.15 (3-361) 67.57 (23-134)
Kangundo 140.00 (11-328) 79.63 (24-154)
Matungulu 116.93 (4-537) 58.46 (18-143)
Division
*Ndithini - -
Male 83.42 (3-361) 70.52 (18-23) Sex
Female 117.69 (7-537) 72.33 (23-143)
Exotic Cross 102.40 (11-283) 67.14 (34-143) Breed
Indigenous 100.95 (3-537) 70.95 (18-154)
Overall 101.24 (3-537 70.52 (18-154)
* Only one calf was weaned on the selected farms during the study period
The average weaning age for goats and sheep was 143 days (Table 6.15). The lowest
weaning age for the small ruminants was recorded in Matungulu Division (122 days) and
the highest in Kangundo Division (163 days). Male goats and sheep were weaned at a
lower mean age (137 days) than the female goats and sheep (155 days).

137
Goats and sheep were weaned at a mean weight of 12.25kg. The lowest mean weaning
weight was recorded in Matungulu Division (11.09kg) and the highest in Ndithini
(16.00kg). Female goats and sheep were weaned at a higher mean weight 13.34kg
compared to the male animals (11.71kg).
Table 6.15: Goat and sheep weaning age and weight in the four divisions of Machakos County during the observational study.
Variable Level Mean age (days) at weaning (range)
Mean weight (kg) at weaning (range)
Athi River 138.42 (28-248) 12.34 (3-20)
Kangundo 163.06 (30-248) 11.97 (3-16)
Matungulu 122.00 (28-235) 11.09 (2-19)
Division
Ndithini 160.33 (128-218)
16.00 (13-16)
Male 136.75 (28-248) 11.71 (3-20)
Sex
Female 154.54 (30-248) 13.34 (2-20)
Overall 143.23 (28-248) 12.25 (2-20)
6.4.7.5 Bull to cow ratio
The number of mature bulls and breeding females was 47 and 70, respectively, equivalent
to a bull/ cow ratio of 1:1.5. However, approximately 50% of the bulls were castrated and
thus the breeding bull/ cow ratio was 1:3.0. The two farms that kept exotic crosses relied
on artificial insemination services for breeding. Most of the farms that reared indigenous

138
cows shared one bull that they considered to be of “superior genetic” make up. The
choice of the suitable breeding bull was based on physical characteristics such as body
size, hump size or “skin” colour.
6.4.7.6 Female fertility and management
Four cases of infertility were reported during the study period, two in Kathome sub-
location and 1 case each in Kalandini and Ndunduni sub-locations. The common practice
was to serve cows 4-5 months after calving. Calves were allowed to suckle up to 2-3
months before cows calved. Goats and sheep on average kidded / lambed once a year.
6.4.7.7 Livestock off-takes
Livestock off-take was defined as the proportion of animals annually leaving the total
herd/flock due to slaughters, sales or other transactions such as exchanges, gifts and
loans. Death was excluded from the definition.
The total number of cattle, sheep and goats on each of the study farms are shown in Table
6.2. The number of cattle that exited the study farms in Athi River, Kangundo, Ndithini
and Matungulu Divisions was 7, 4, 2 and 3 respectively. This converted into off-take
rates of 5.79%, 11.76%, 12.50% and 6.00% respectively.
The corresponding number of sheep and goats that exited the study farms in the four
divisions was 3, 3, 0 and 2 respectively. This converted into off-take rates of 2.01%,
9.10%, 0% and 3.85% respectively.

139
6.5 DISCUSSION
There was a consistently higher entry rate to the study herd compared to the exit rate
resulting into an increase of the originally recruited (calf, kid and lamb) cohorts. Births
contributed the majority of the entries. These results were similar to observations made
by Muraguri (2000) in Kwale and Kilifi Countys in the Coast Province. Majority of the
surveyed farmers had high regard for calves, lambs and kids as they regarded them as
future replacement stock. Generally, good care was taken of the young animals. For
instance in Ndithini and Ngelani sub-locations, the young of all species were housed in
specially constructed units to protect them from predators.
Although farmers often sold adult small ruminants to meet their immediate financial
needs, cattle were rarely sold even during severe dry spells as was the case during the
second half of the study (August 2008 to March 2009) as they were used for long-term
investment options. Similar observations were made by Ngategize (1989) in a review of
livestock farming systems in Sub-Sahara Africa, Little et al. (2001) in northern Kenya
and southern Ethiopia, and Maichomo (2008) in the pastoral Masaai community of
Kajiado County. Small stocks were useful in cushioning against the effects of drought
due to their fast multiplication compared to cattle. The reluctance to sell cattle even when
pastures were inadequate resulted in severe malnutrition and starvation to death of
animals on some farms. The rearing of livestock in the study area is not entirely a
commercial enterprise as may be expected but a combination of source of livelihood and
a status symbol. A similar observation was made by Maichomo (2008) in a study carried
out in Kajiado County. This is an issue that needs to be addressed if livestock production
is to be improved in the County.

140
Concurrent rearing of cattle, sheep and goats can be used to diversify risks associated
with the different species as advocated by Little et al. (2001). This becomes important
especially during prolonged dry spells because it is known that different livestock species
adapt differently to drought (McCabe, 2009). For instance, small ruminants survive on
poor quality forbs and browse, which is the only available foliage during severe droughts.
The rate of multiplication for small ruminants is also faster than that of cattle. Thus, a
herd of small ruminants recovers from losses incurred during droughts faster than for
cattle. The resilience of smallstock in the face of drought has been reported in Tanzania
by Mtenga et al. (1986), Connor et al. (1990), Njombe (1986) and Njombe (1993). Small
ruminants are more easily sold compared to cattle during drought events enabling farmers
to liquidate their herds to avoid further losses.
Misdiagnosis or unconfirmed cases of disease can lead to biased estimates of disease risk.
The current study combined clinical signs and microscopic examination of biopsy smears
as the basis for diagnosis of TBDs. The approach is most suitable for confirmation of
current infections (Irvin and Mwamachi, 1983) and it may have helped to minimise the
incidences of misdiagnosis often associated with the diagnosis of TBDs (O’Callaghan,
1998).
The ability to effectively confirm ECF, as well as other blood parasites on microscopic
morphology depends largely on good sampling and skills of the operator (FAO, 1984) as
was the case in the current study. The intensive monitoring of the study animals and free
treatments offered for the TBDs enhanced both the rate and speed of reporting by the
farmers. The incidence of ECF in calves (28.3%) was similar to what Muraguri (2000)

141
and Okuthe and Buyu (2006) estimated in calves in the Coastal lowlands and western
highlands of Kenya (23.1% and 32.1%, respectively) but much higher than the 3.57%
observed by Swai et al. (2009) in the Tanga region of Tanzania.
Calves had a significantly higher incidence of ECF than adults. This was expected as
susceptibility is known to significantly decrease with age particularly among indigenous
breeds of cattle (Swai et al., 2005; Muraguri et al., 2005; Rubaire-Akiiki et al., 2006;
Swai et al., 2009; Phiri et al., 2010; Gachohi et al., 2012 ).
There was no significant difference (p> 0.05) in the incidence of ECF between female
animals and male cattle. This may be because the management of both sexes was
observed to be relatively similar. Minjauw and McLeod (2003) made similar observations
in India and eastern and southern Africa.
No case of ECF was confirmed in exotic cattle presumably because all the exotic cattle
were zero-grazed and therefore under low tick challenge. In addition, it was observed that
farmers keeping the breeds tended to apply acaricides more regularly than farmers with
indigenous cattle. Exotic cattle are known to be more susceptible to TBDs (Norval et al.,
1992; Ndungu et al., 2005; Gachohi et al., 2012) and apparently the farmers were aware
of this fact.
The incidence of ECF was higher in Athi River Division compared to the other three
divisions. These results were consistent with those from the cross-sectional survey carried
out earlier whereby the division also had the highest prevalence of the disease. These
differences could be attributed to the different environmental conditions since the
distribution of the TBD vectors is influenced by ecological, geographical and climatic
factors (Swai et al., 2006; Bazarusanga et al., 2007; Gachohi et al., 2012). Most farms in

142
Athi River Division experienced high tick challenge throughout the observation period
especially by Rhipicephalus appendiculatus unlike Kangundo Division where most
farmers zero-grazed their animals.
Only three calves died of ECF during the study period. During the earlier cross-sectional
survey, 226 calves were reported to have been treated on 81 of the farms, 12 months prior
to the study. It was observed during the longitudinal study that a number of farmers in the
County, including some recruited into the study, used herbs to treat ECF. This suggested
that the provision of free treatments offered during the trial, could have resulted into a
lower mortality rate due to ECF. The other reason could have been an exaggerated
diagnosis of ECF in anticipation for support given that ECF treatment is expensive.
There were only four confirmed clinical cases of anaplasmosis and no case of babesiosis
in spite of the fact that Boophilus decoloratus, a major vector of the two diseases was
prevalent in three of the study divisions. These results are similar to those of a study
carried out by Swai et al. (2009) in the Tanga region of Tanzania. Despite concerns with
respect to misdiagnosis of the two diseases, it appeared that many cases of the diseases
are routinely reported to the local veterinarian officials (Chapter 3) and there is a need for
further epidemiological investigation to be carried out.
Non-specific diarrhea and tick infestations were the most common causes of morbidity in
cattle. This finding was similar to that of a study carried out by Phiri et al. (2010) in
Zambia. Sheep and goat diseases diagnosed most commonly included helminthosis and
pneumonia. Pneumonia was particularly a problem in goats. Although only 4 cases were
diagnosed on the study farms during the observation period, farmers insisted pneumonia
was the commonest disease problem in small ruminants particularly during the cold

143
period of the year (May to August). Indeed, all the cases during the observation period
were diagnosed during this period. This may perhaps be due to the poor design of
housing for the small stock leading to exposure to cold conditions during the night. The
houses were designed to keep away predators or prevent thefts.
Fleas were a serious problem particularly in Kathome sub-location where farmers
complained of their persistence despite application of acaricides regularly. They applied
amitraz, pyrethroid or organophosphate compounds for fleas control but all were
apparently ineffective. Control of fleas appears to be a problem in Kenya as reported in a
survey conducted in Kajiado County (Mugambi et al., 2012). A plan of action on the
control of fleas in the country needs to be drawn up by the Department of Veterinary
Services to enable farmers deal with the growing menace. Extension messages in the
country on the control of ectoparasites mainly focus on ticks (DVS, personal
communication; KARI, 2012) and largely ignore other ectoparasites some of which are of
public health importance. Livestock harbour fleas which cause dermatitis, allergies or
jiggers in human beings. Some species of bovine fungal and mite infestations can also
infect human beings. Thus, the control of livestock ectoparasites needs to be
comprehensive in the interest of public health and should not be primarily directed at the
control of TBDs.
Contagious Caprine Pleuropneumonia is not known to be endemic in the study area.
However, the outbreak of suspected cases of the disease underlies the problem of
uncontrolled livestock movements between different parts of the country. Although there
is a shortage of veterinary personnel who are tasked with monitoring livestock movement
in the study area, the fact that the animals were transported more than 300 kilometres

144
from the North Eastern Province into the County without any valid documentation
exposes serious weakness with regard to enforcement of laws governing livestock
movement in the country. If the country is to successfully establish the proposed disease
free zone (GoK, 2009), which will enable the country to access the lucrative European
Union market under vision 2030, then the act (CAP 354) governing livestock movement
needs to be strictly enforced. Successful implementation of the disease free zones is
expected to have a spin-off effect that will spur livestock development especially in the
marginal areas such as the study area.
A spell of drought was experienced during the study period. Though much of the County
can be described as being semi arid, the amount of rainfall received was far below the
annual average of 500 mm. In arid and semi arid lands of Kenya, drought is the most
important hazard encountered by households (Huho et al., 2011). Indeed, drought has
been increasing in frequency, especially in Northern Kenya from once every 10 years in
1970 to currently once in every 2-3 years in (Howden, 2009). Prolonged droughts can
lead to gradual changes in rangelands vegetation from palatable to non-palatable species
with the overall effect of diminishing pasture quantity and quality (Huho et al., 1990).
The drought weather spell that was experienced during the study period was the cause of
malnutrition observed on some of the farms.
The average daily milk production was low compared to that reported for high potential
areas in the central region of the country. Although the drought weather conditions
adversely affected milk production especially among the exotic crossbreed of cows, the
overall average daily milk production (1.98 litres) was less than a third of the average
daily milk production of 7.2 litres recorded in the central highlands of Kenya (Staal et al.,

145
1997; Karanja et al., 2002). The low milk production could be attributed to the
predominantly poor breeds of indigenous cattle kept in County, which are not suitable for
a dairy cattle enterprise (Thorpe et al., 1995).
Previous studies in Kiambu County on factors influencing milk production reported
inadequate feeds and poor reproduction management as the key factors (Omore et al.,
1994). Lack of adequate feed was one of the constraints to livestock production that was
ranked highly by the farmers during the rapid appraisal study (Chapter 3). This was
further aggravated by the drought conditions experienced during the last three months of
the study.
Farmers with exotic crosses of cattle had very limited access to artificial insemination
services and relied on “shared” bulls, often of low genetic potential. The resulting
offspring were often of lower genetic potential than the dams. This may have contributed
to the lower than expected milk production on the farms that kept the exotic crosses.
Crossbreeding between suitable Bos Taurus breeds and local breeds can be used to
improve the genetic potential of the local breeds in the study area.
Although the average weaning age for calves was within the recommended range of 3 to
7 months, calves on some farms were allowed to suckle up to 2 months prior to calving.
Studies have shown that cows not being suckled have increased fertility (Larson, 2007).
When artificial insemination is used, the pregnancy rate increases by 63% in cows that
are weaned at 80 days compared to 54% in cows weaned at 215 days (Larson, 2007). In
addition, cows with calves that had been weaned early conceived on average 7 days
earlier than those cows with calves that were not weaned early. In small ruminants early
weaning enables breeding ewes and does to regain condition faster resulting in higher

146
conception rates (MLA, 2011; Geotsch et al., 2011). Early weaning can also help
improve the throughput (rate of giving birth) of calves, lambs and kids and therefore
further improving livestock productivity. It is also advantageous during drought to avoid
rapid deterioration of the body condition of female animals. Livestock productivity in the
study area was found to be unsatisfactory but can substantially be improved by adoption
of good breeding management and animal husbandry practices.
Although the birth weights of calves seemed not to be adversely affected by the sub-
optimal genetic potential of the cattle breeds in the study region, the growth performance
as at the time of weaning was low compared to the performances recorded for dairy cattle
(Trail and Gregory, 1981) and for beef and dual-purpose cattle (Radostitis et al., 1994).
Despite the birth weight of the exotic crosses (37kg) being higher than the 23.7 kg
recorded by Muraguri (2000) in the Coastal lowlands and Omore et al. (1994) in Kiambu
County, the weaning weights for calves weaned at 8 months (143-154kg) were less than
average weight of 170 kg those recorded by Trail and Gregory (1981) for Boran and
Sahiwal calves of similar age. Apart from breed differences, factors that are associated
with daily weight again of calves include pasture condition, season, distance to the
pastures, watering frequency, initial body weight and infection with TBDs (Gitau et al.,
2001; Karimi et al., 2002). The drier climatic conditions in the study area could have
been responsible for the relatively lower average weight attained by the calves at the time
of weaning compared to those recorded in higher potential areas of the country.
Productivity of the small ruminants in the study area was sub-optimal. Under good
breeding management, goats and sheep are expected to give birth on average twice a year
(Schoenian, 2011). None of the breeding ewes or does gave birth more than once during

147
the study period. On all farms, goats and sheep were allowed to mate naturally and this
could have been the main cause of the relatively long inter kidding or lambing intervals.
However, the birth weights for lambs and kids were comparably to those of other studies
(Kiriro, 1986; Goetsch et al., 2011).
Livestock off-take rates were low in all the four study divisions. The off-take rates for
cattle were similar to those recorded by Arasio (2004) in Turkana County (1.30% -
12.00%) while the off-take rates for small ruminants were much lower than the 25%
recorded in the same study. The off-take rates were also much lower than those recorded
by Njoka and Kinyua (2006) on commercial ranches in Machakos (28.7% for cattle and
15.3% for small ruminants) and the average off-take rate of 25% for cattle and small
ruminants in the commercial sector in Africa (Musemia et al., 2006). The off-take rates
for small ruminants in the four divisions were not consistent with those of the socio-
economic study (Chapter 4), whereby farmers indicated that sheep and goats were
frequently sold to cater for short falls in the family incomes. Indeed the off-take rates
were less than those recorded for cattle. This was probably due to drought conditions
experienced at the time of the survey. The farmers were apparently aware of the fact that
small ruminants had a better chance of survival compared to cattle under such conditions
and hence were reluctant to sell or dispose off the animals.
No culling of livestock that were either infertile or past their peak performance with
regard to milk production took place during the study period. Despite the fact that
reproduction is not a highly heritable trait (Miller, 2010), it is important to remove
genetic material (infertile animals) from the herd so as not to proliferate females that are
difficult to breed.

148
CHAPTER 7
EFFICACY OF EAST COAST FEVER VACCINE AND COST
ANALYSIS OF IMMUNIZING CATTLE AGAINST THE DISEASE
IN MACHAKOS COUNTY
7.1 INTRODUCTION
East Coast Fever (ECF) is the most economically important disease of livestock in East
and Central Africa (Norval et al., 1992). The disease puts the lives of more than 25
million cattle at risk in the 11 countries of sub-Saharan Africa where it is endemic (ILRI,
2010) and endangers a further 10 million animals in regions such as southern Sudan,
where it has been spreading at a rate of more than 30 kilometres a year. While decimating
herds of indigenous cattle, East Coast fever is an even greater threat to improved exotic
cattle breeds and is therefore limiting the development of livestock enterprises,
particularly dairy, which often depend on higher milk-yielding crossbred cattle (Muraguri
et al., 2005; Okuthe and Buyu, 2006; Chenyambuga et al., 2010; Gitau et al., 2010). In
Zebu (Bos indicus) calves kept under pastoral management system, ECF is responsible
for annual mortality rates of 40-80% (Homewood et al., 2006; Di Guillo et al., 2009). It
is estimated that an effective ECF vaccine for cattle could save the affected countries at
least a quarter of a million US dollars a year (ILRI, 2010).
An experimental vaccine against East Coast fever was first developed more than 30 years
ago at the Kenyan Agricultural Research Institute (KARI). Cattle were vaccinated using
the ‘infection-and-treatment method’(ITM), so-called because the animals were infected

149
with live Theleiria parva parasites and simultaneously treated with a long- acting
tetracycline to stop development of the disease. The resulting immune response coupled
with sub-lethal natural challenge protected the animals against the disease for the rest of
their lives (Mutugi et al., 1989; Tumusiime, 2007; Di Guillo et al., 2009; McKeever,
2009).
The T. parva Marikebuni stock was isolated and characterized by Irvin et al. (1983) from
the Coast Province of Kenya. Field studies carried out in Coast, Central and Rift Valley
provinces of Kenya have shown that the stock significantly reduces the incidence of ECF
in immunized cattle (Wesonga et al., 2000; Maloo, 2001c; Wanjohi et al., 2001). The
efficacy of T. parva Marikebuni has not been evaluated in Eastern Province of Kenya.
Disease control, especially of the TBDs is a major constraint to livestock production in
the County. If shown to be efficacious, then the use of the infection and treatment method
to control ECF in the County can significantly reduce treatment and tick control costs
(Mukhebi et al., 1989; Muraguri, 1998) and thereby improve farmers’ income (McLeod,
1997) upon adoption of the technology.
Loss in productivity, hence profit, arising from infectious and parasitic diseases reduces
the efficiency of conversion of inputs (water, feed, drugs, labour, land capital and
management) into outputs (meat, milk, skin, manure and traction power) in ruminants
(Tambi and Maina, 1999; Nwafor, 2004). In a livestock production system, disease can
have either direct or indirect effect in the form of additional cost or revenue foregone.
Diseases also affect herd structure, limits access to better markets and lead to suboptimal
use of production technology (Tambi and Maina, 1999; Benett, 2003).

150
Use of animal health economics to support the decision making process is increasingly
gaining importance in the livestock production sector. Economics of livestock production
involves making decisions based on rational choices in the allocation of scarce resources
against competing alternatives (Ackello-Ogutu and Waelti, 1990; Ørskov and Viglizzo,
1994). Numerous economic analysis studies have been undertaken on different farming
systems in Kenya. These include cost analysis of immunization against East Coast fever
on smallholder dairy farms in Central Kenya (Muraguri,1998), a study on the effect of
vector borne diseases on productivity of smallholder cattle in the Coastal lowlands
(Muraguri, 2000), and analysis of productivity of Orma/ Zebu cattle crosses in a pastoral
production system (Maichomo, 2008). Results from studies carried out in Zambia to
assess the impact and financial implications of ITM in traditionally managed Sanga cattle
(crosses between Bos indicus and Bos Taurus) cattle showed that it is a cost effective
strategy for ECF control (Minjauw et al., 1999).
The main objective of this phase of the study was to assess the efficacy of ECF
vaccination in a Dual Purpose Cattle Small Scale (DPCSS) production system in the
context of disease incidence and economic analysis. The vaccine strain was the T. parva
Marikebuni stock 316.

151
7.2 MATERIALS AND METHODS
7.2.1 Design of vaccination trial
7.2.1.1 Farm and animal selection and sample size determination
The minimum age of calves selected for immunization was 1 month (Maloo et al.,
2001b). Only calves and yearlings were selected as they are the most susceptible age
groups to East Coast fever (Swai et al., 2009; Phiri et al., 2010). Besides, the cost of
administering the vaccine significantly increases with animal size (Muraguri et al., 1998).
In addition, the dosages of the long acting tetracylines that are administered concurrently
with the vaccine are computed on the basis of animal body weight and therefore the
smaller the animal, the cheaper the cost of immunisation.
7.2.1.2 Selection of farms for the trial on the efficacy of the ECF vaccine
A list of all farms that had relatively good records on disease history in the seven sub-
locations selected for the longitudinal study was prepared. For a farm to be selected for
the immunisation trial, it had to have at least 2 calves that were at least one month of age
(Maloo et al., 2001b). Only calves and yearlings not previously treated against ECF were
recruited into the trial. Milani sub-location in Ndithini Division was omitted due to
concerns about accessibility during the rainy seasons. Using random number tables, four
farms were randomly selected from each of the seven sub-locations. Based on this
selection criterion, a total of 28 farms with 178 calves were recruited into the trial.

152
To block the effects of farm, control calves and yearlings were selected from the same
farms as the vaccinated calves/yearlings. Each farm was then given a code and all
recruited animals tagged. Calves and yearlings that entered the herds in the course of the
one-year follow-up period and met the selection criteria were recruited into both groups.
The minimum number of calves that needed to be immunised by the end of the study
(assuming that immunising against ECF will result in 50% reduction in incidence of
ECF) was derived from the formula in Dohoo et al. (2003):
n= [Zα (2PQ) 1/2-Zß (PeQe + PcQc) 1/2]2/ (Pe -Pc)
2
Zα = Value of Z (1.96) which provides α/2 in each tail of a normal curve for a two- tailed
test.
Zß = Value of Z (-0.84) which provides ß in lower tail of a normal curve (Zß is negative if
ß < 0.5).
Pe= Estimate of response rate in vaccinated group assuming prevalence of ECF to be
(40%) (Ngumi et al., 2005) = (20%).
Pc = Estimate of response rate in non-vaccinated group (40%)
P= Pe+Pc /2 = (0.30)
Q=1-P = (0.70)
The minimum number of animals for the vaccine trial was
= [1.96 (2 x 0.30 x 0.70)1/2+ 0.84 (0.20 x 0.80 + 0.40 x 0.60) ½]2
(0.20- 0.40)2
(1.270 + 0.563) 2 / 0.202 = 81
Thus, a minimum of 81 animals needed to be immunised with 81 controls.

153
7.2.1.3 Immunisation procedure
Farmers were once again asked about the disease history of eligible calves and yearlings
for the last 1-3 months. A stratified random method was used to allocate cattle to the
treatment and control groups. The study population was stratified by herd and within each
herd the calves and yearlings were randomly (using a random number table) allocated to
each of the two treatment groups.
Clinical examination of the animals was undertaken just prior to the inoculation of the
vaccine. Animals with a rectal temperature > 39.40 C were excluded. Irrespective of
whether the body temperature was normal or not, animals with enlarged superficial
lymph nodes were excluded on suspicion of having been recently infected with ECF.
Animals that appeared malnourished (weakness with protrusion of bones of the
shoulders, ribs, backbone and hips and sunken eyes) were also excluded from the trial.
Based on this criterion, a total of 100 calves and yearlings were initially vaccinated
against ECF while 78 others served as controls.
The immunization procedure was carried out using the method described by Radley
(1978). The T. parva (Marikebuni) stabilate was stored in 0.5ml aliquots in plastic straws
kept under liquid nitrogen canisters. The straws were rapidly thawed by rubbing between
the palms and their contents dispensed into universal bottles. A 1:40 dilution of the
stabilate was done using Eagles Minimum Essential Medium with 3.5% w/v bovine
plasma albumin and 7.5% glycerol. After 30 minutes of equilibration, the stabilate was
inoculated subcutaneously in front of the pre-scapular lymph node. A 30% long acting

154
oxytetracylines (Tetroxy L.A, Bimeda) was administered at a dosage rate of 30 mg per kg
body weight by deep intramuscular injection. Any immunised animal developing clinical
signs of ECF with fever and macroshizonts in lymph node smears for at least three days
was designated as an “ECF reactor” (Wanjohi et al., 2001). However, inspite of using the
30% oxytetracylines formulation, there was regular communication with the farmers just
in case of the odd reactors.
7.2.1.4 Surveillance of East Coast fever
Surveillance of ECF in both the vaccinated group and controls was by determination of
antibody titres and the incidence rate of the disease. Since the tick vector of Theleria
parva had been observed to be prevalent in the study area during the cross-sectional
study, it was expected that some of the calves were already exposed to Theileria parva by
the time they were one month old. Under this scenario, the Indirect Fluorescent Antibody
Test (IFAT) is ideal in monitoring the immune response as it is possible to record the
change in antibody levels for animals that were already exposed to Theleria parva at the
time of immunization. Although immunity to ECF is cell-mediated (McKeever, 2007),
sero-conversion following immunisation can be used as a tool to monitor the viability of
the ECF vaccine. Thus, it is necessary to determine seropositivity to T.parva on the day
that the animals were immunised (day 0) and on the 35th day (day 35) post immunisation.
The IFAT test was carried out as described by Burridge and Kimber (1972). Schizont
antigens were prepared as described by Cakmak (1990). Briefly, cultures containing
schizont antigens were centrifuged at 200g for 20 minutes at 40C.The supernant fluid was

155
removed and the cell pellet was resuspended in 100ml of phosphate buffered saline (PBS)
at 40C (PH 7.2 to 7.4). This was followed by centrifugation at 200 g for 20 minutes. The
washing procedure was repeated three times. After the final wash, the cells were
resuspended in PBS. Thin layers of the cell suspension were spread on Teflon-coated
multisport slides (Glaxo-Welcome, UK) using a 100µl pipette. The slides were dried and
fixed in acetone for 10 minutes. Pre-vaccination and post-vaccination sera were tested at
serial antigen dilutions of 1:40 up to 1:2560. Twenty (20) µl of each serum dilution were
transferred to the antigen (schizont) wells. This was followed by incubation at 370C for
30 minutes. Serum samples were removed from antigen wells by immersing in two
consecutive jars containing PBS for 10 minutes each time. Twenty (20) µl of diluted
anti–bovine immunoglobulin fluorescein isothiocyanate conjugate at a dilution of 1:100
was added. Evans blue at a concentration of 0.01% was added as a counterstain and
incubated at 370C for 30 minutes. This was followed by washing three times in PBS.
Known positive and negative sera were used as controls. The slides were read under a
fluorescent microscope. An animal was considered exposed (positive) if its serum reacted
at titres of 1:160 (Burridge and Kimber, 1972).
Animals were followed for a period of 12 months post vaccination. Each farm was visited
on a monthly basis and the infection status of each animal determined by clinical and
laboratory examination of blood and lymph node smears. Clinical surveillance was kept
on all the cattle in both treatment groups on daily basis. In three of the sub-locations
(Ndithini, Katine and Ndunduni), the local animal health assistants (AHA) were recruited
to monitor the occurrence of disease. In the rest of the sub-locations, farmers were asked

156
to report by phone all suspected cases of disease to the principal investigator. To ensure
rapid reporting of diseases, all clinical cases of TBDs and other infectious disease
conditions in cattle on the selected farms were treated free of charge throughout the trial
period. Early signs of ECF looked for included pyrexia, enlargement of superficial
lymph nodes and dyspnoea. Blood smears and needle biopsies were made from
prescapular lymph nodes of all animals reported ill especially when accompanied by a
rectal temperature of > 39.4o C. The smears were fixed in methanol and taken to the
laboratory at the Veterinary Research Centre, Muguga for staining in Giemsa and
examination under a light microscope. The lymph node smears were examined for the
presence of schizonts and the blood smears for Theileria parva piroplasms, anaplasma
and babesia. Animals found to be suffering from ECF were treated with buparvaquone
(Butalex®, Pitman Moore, UK) and supportive antibiotic drugs while cases of anaplasma
were treated with either imidocarb diproponiate® (Pitman, Moore, UK) or a long acting
tetracycline. Tick challenge was assessed as described in Chapter 5.
7.2.1.5 Data Collection
The parameters recorded soon after immunization and during the regular monthly visits
were:
• Pre and post-immunization serological status.
• Tick challenge levels.
• Cases of ECF and other TBDs.
• Treatments against TBDs.

157
• Mortality due to ECF and other TBDs.
• Expenditure on acaricides.
• Expenditure on disease treatment.
7.2.2 Data management and analysis
Data were entered into an access file. The incidence rates for various disease events were
calculated in Microsoft Excel program (Microsoft Corporation, USA) after exporting the
relevant data files from the Access program. After thorough screening for errors, the files
were exported to STATA Version 10 (StataCorp.2007) statistical program for analysis.
Multivariate analyses were conducted using Poisson regression models that incorporated
general estimating equations to correct for repeated measures in time for antibody titre
determination. Only the first cases of ECF and other TBDs were considered in the
analyses. Animal-level factors taken into consideration included breed, sex, age, tick
challenge/level. The farm level factors included dipping frequency, tick control, and
herd-size. Division and season of the year were also taken into consideration. Dipping
frequency was transformed into a categorical variable with 3 classes (level 1: 0-4 times;
level 2: 5-8 times and level 3: over 8 times) before being fitted in the multivariable
model.

158
7.2.2.1 Estimation of ECF incidence and vaccine efficacy
The incidence rate (IR) of ECF was computed as described in Dohoo et al. (2003):
IR= Number of events during observation period Animal-months at risk
The denominator for estimating incidence was the number of animal-months between the
dates the intervention (immunization) study began (or date of recruitment for those
animals introduced into the study after commencement) and detection of infection,
withdraw from the study, or end of the study.
Vaccine efficacy was calculated as described by Babo Martins et al. (2010):
Efficacy of vaccination = (Incidence rate in control group - Incidence rate immunised in group) Incidence rate in control group
7.2.2.2 Estimation of the cost of application of acaricides and treatment of East Coast
fever
On each visit during the study, information was recorded on disease treatments, the cost
of each treatment (including professional charges if any) undertaken, number of times
acaricides had been applied on the animals since the previous visit and expenditure on
acaricides. The figures derived from these records were used to compute the annual cost
of application of acaricides and ECF treatments. The annual cost of acaricide application
was computed as described by Muraguri (2000) as:
TC = MA * NA (PM) * 12
Where,
TC= Total cost,
MA= Mean application cost per animal, and

159
NA (PM) = mean number of application cost per month.
The mean annual cost of ECF treatment per animal was derived from the formula:
M (AT) = TC (D) /NC
Where, M (AT) is the mean cost of treatment per animal,
TC (D) = Total treatment cost for the disease, and
NC = Number of cases of the disease recorded during the study period.
7.2.2.3 Cost of immunisation per herd
The total cost of immunization per herd (Y (h)) was estimated as described by et al.
(1997):
(Y (h)) =V+ M + α (D + B + C)
Where
V= Veterinary proffesional charges
M= Mean cost of monitoring (transportation and labour) per herd.
α = Mean number of animals per herd.
D= Cost of vaccine per animal (one dose).
B= Cost of the blocking drugs per animal.
C= Mean cost of consumable items per animal.
The detailed figures used to compute the cost of immunization in the trial were based on
the costs of immunizing against ECF derived from Muraguri (1998), Babo Martins
(2010) and VRC (2011).

160
7.2.2.4. Economic analysis
Partial farm budget analysis was used to estimate the profitability level of herd
immunisation against ECF by the infection and treatment method (ITM) in the County.
Partial budgeting provides a simple economic description and comparison of different
disease control measures (Dijkhuizen et al., 1995).
The components and parameters used and the partial budget framework are as shown in
Tables 7.1 and 7.2, respectively.
Table 7.1: Partial farm budget framework. 1. Additional returns 2. Costs no longer incurred 3. Subtotal: 1 + 2 4. Foregone returns 5. Additional costs 6. Subtotal: 4+5 7. Difference: 3 – 6: Derived net return. If net return is negative, then the procedure is not recommended and vice versa.
Table 7.2: Parameters and components considered in Partial Budget Analysis of the financial benefits of East Coast Fever immunisation using the infection and treatment method in Machakos, County. Parameters Components considered Additional returns Extra Calves Sold =ECS x (CP NI Group- CP I Group)
Additional costs incurred 1.Cost of vaccination = VC x NoA I Group 2.Cost of treatment of reactors= TC x (R x NoI) 3.Cost of treatment of infected calves= TC x ECFInc group I x No animals group I 4. Tick control (NI Group and I Group)
Costs No longer incurred 1.Costs with treatment of diseased calves= TC x ECFInc Group NI x No animals Group NI 2. Tick control. It is envisaged that tick control costs will be reduced by 50% among immunised animals (GPI).
Foregone returns None since calves that died had no salvage value Key: CP= Cost per head; ECFInc= East Coast fever Incidence; ECS =Extra calves sold; I = immunised group; NI= Non-immunized group; NoA= Number of calves R= percentage of reactors to vaccination; TC= Treatment cost; VC = Vaccine cost

161
7.2.2.5 Assumptions of the analysis
Only calves and yearlings were selected for immunization to avoid production losses
associated with milk withdrawn for human consumption following injection with long
acting oxytetracylines. It was assumed that as a consequence of ECF vaccination,
immunized calf price/trade would increase (Homewood et al., 2006) and calves would
command a 50% higher price in the market (Di Giulio et al., 2009). The analysis was
performed on assumption that the subsequent immunization in the County would be
carried out by a private veterinarian in line with the government policy of delivery of the
technology by private veterinary practioneers; hence a professional charge of USD 13.33
per farm was included in the analysis. It was also assumed that the veterinarian travelled
on average 50km to supervise the immunization. The analysis was done for the year
2008-the year the immunisation trial was carried out. All the prices and costs are
therefore in 2008 terms when the mean market conversion rate was Ksh.75 to the USD.
7.2.2.6 Determination of association between vaccination and incidence of East Coast Fever Attributable Risk (AR): Since the disease is often observed among vaccinated cattle not
all disease in the non-vaccinated cattle could be attributed to the being non-vaccinated.
The rate of disease in the non-vaccinated group which was attributed to being non-
vaccinated was obtained from the difference in rate of disease among the non-vaccinated
and vaccinated cattle as described by Martin et al. (1987): p(D+/V-) - p(D+/V+) where
p(D+/V-) is the rate of disease among the non-vaccinated cattle and p(D+/V+) is the rate
of disease among the vaccinated cattle.

162
Attributable Fraction (AF): The proportion of disease in the non-vaccinated cattle that
was due to being non-vaccinated was computed as follows: AR/p (D+/V-).
Population Attributable Risk (PAR): is the increase in risk of disease in the entire
population that is attributable to being non-vaccinated. This was computed as the overall
observed risk (combining vaccinated and non-vaccinated groups) in the study population
minus the baseline risk (risk in the vaccinated group): p(D+) - p(D+/V+) where p(D+) is
the rate or proportion of diseased animals in the population and p(D+/V+) is the rate of
disease among the vaccinated cattle.
Population Attributable Fraction (PAF): Indicates proportion of disease in the whole
population that is attributable to being non-vaccinated and can be avoided if all animals
were vaccinated. This was was computed as described by Martin et al. (1987) and
Gachohi et al. (2013):
7.3 RESULTS
7.3.1 Study population
Initially, 178 calves/ yearlings were recruited into the study from the 28 study farms
(Table 7.3). One hundred (57.6%) calves were immunized against ECF while 78 (42.4%)
served as controls. Calves born on the farms during the twelve-month follow-up period
were progressively recruited into the study at the age of 1 month. An additional 34 calves
were born or brought into the study farms during the study period. A total of 29 calves/

163
yearlings were lost to the study through deaths, sales or transfers. By the end of the study,
there was a total of 183 calves and yearlings (Table 7.3).
Table 7.3: Division and farm distribution of calves and yearlings in the controlled immunization trial against East Coast fever in Machakos County, 2008-2009.
No of calves/yearlings present
Start of study End of study
Division No of farms
Immunised
Control
Immunised Control
Athi River 7 58 44 79 45
Kangundo 7 11 12 16 13
Matungulu 9 16 13 19 13
Ndithini 5 15 9 15 12
Total 28 100 78 129 83
7.3.2 Sero-conversions following immunization against ECF
The highest proportion (93.7%) of cattle that sero-converted 35 days post immunization
was recorded in Athi River Division while Kangundo Division had the lowest proportion
(87.5%) (Table 7.4). None of the 13 cattle in the control group in Kangundo Division
sero-converted while Matungulu Division had the highest proportion (15.4%) of control
cattle that sero-converted. Overall, 92.2% of the calves and yearlings sero-converted after
immunisation compared to only 6% that sero-converted in the control group; the
difference was statistically significant (p<0.05). No “reactors” were observed among the
vaccinated animals.

164
Table 7.4: Serological reactions of cattle in the immunised and control groups in the immunization trial against East Coast fever in Machakos County, 2008- 2009.
No. of cattle
No. of cattle with
post- immunization antibody titres > 1:160
Division
Immunised
Control
Immunised
Control
Proportion
of immunized cattle that
sero-converted
Proportion of control cattle that
sero-converted
Athi River 79 45 74 2 93.7 4.4 Kangundo 16 13 14 0 87.5 0 Matungulu 19 13 17 2 89.4 15.4 Ndithini 15 12 14 1 93.3 8.3
Total 129 83 119 5 92.2 6.0
7.3.3 Incidence of tick-borne diseases
A total of 35 clinical cases of ECF were recorded during the one-year study period. Of
these, 9 were in the immunised group and 26 in the control group (Table 7.5). The annual
incidence rate (42.7%) of ECF in the control group was significantly (p<0.05) higher than
the rate in the immunised group (7.8%). Calves and yearlings in the control group were
apparently 6 times more likely to develop ECF relative to those in the immunised group
(Table 7.5). Other factors significantly (p< 0.05) associated with incidence of ECF
included age, sex, tick control on farm, tick challenge, season and dipping frequency
(Table 7.5). After adjusting for effects of confounding in multivariate analysis, only three
variables of the seven that were significant in univariate analysis were retained in the
final model, i.e., immunization, age and sex (Table 7.6). Division, which was not
significant in univariate analysis was significant in the final model indicating that its
effects were confounded by the other variables. This effect was more pronounced in

165
Matungulu Division where the IRR changed from 1.42 (1/0.7, Table 7.5) in univariate
analysis to 3.14 (1/0.32, Table 7.6) in the final model indicating that cattle in the division
were approximately 3 times less likely to develop ECF relative to cattle in Athi River.
The effects of immunisation were not confounded as the IRR changed minimally in the
univariate analysis from 5.5 to 5 (1/0.2, Table 7.6) in multivariate analysis.
The efficacy of the vaccine was 81.7% indicating that the vaccine reduced the incidence
of ECF in vaccinated calves and yearlings by 82%.
Table 7.5: Univariate analysis for exposure to Theileria parva infection in a controlled Immunization trial against East Coast fever in Machakos County, 2008-2009.
Variable Levels No. of ECF cases
Animal months-at-risk
1Incidence rate (%) per cow
month (95% CI)
2IRR (95% CI) Annual Incidence
rate
p-value
ECF immunization
Yes 9 1,391 0.6 (0.3 - 1.2) 1.00 0.078
No 26 730 3.5 (2.3 - 5.2) 5.50 (2.58 – 11.74) 0.427 0.00 Division Athi 23 1,224 2.0 (1.3 – 3.1) 1.00 0.225 Ndithini 5 258 1.9 (0.6 – 4.5) 1.03 (0.39 – 2.71) 0.233 0.95 Kangundo 2 256 0.8 (0.1 – 2.8) 0.42 (0.10, 1.76) 0.094 0.23 Matungulu 5 382 1.3 (0.4 – 3.1) 0.70 (0.26 – 1.83) 0.157 0.46 Breed Indigenous 31 1,605 1.9 (1.3 – 2.7) 1.00 0.232 Exotic 4 517 0.8 (0.0 – 3.2) 0.22 (0.03 – 1.83) 0.093 0.13 Age Calf 29 1,290 2.2 (1.5 – 3.2) 1.00 0.270 Yearling 5 723 0.7 (0.2 – 1.6) 0.31 (0.12 – 0.79) 0.083 0.02 Adult 0 105 0 0 0 0.99 Sex Male 18 658 2.7 (1.6 – 4.3) 1.00 0.328 Female 17 1,463 1.2 (0.7 – 1.9) 0.42 (0.22 – 0.82) 0.139 0.01 Tick control Yes 15 1,643 0.9 (0.5 – 1.5) 1.00 0.110 No 19 472 4.0 (2.4 – 6.3) 4.50 (2.35 – 8.98) 0.483 0.00 Tick challenge
Yes 28 1,123 2.5 (1.7 – 3.6) 1.00 0.299
No 7 998 0.7 (0.3 – 1.4) 0.28 (0.12 – 0.64) 0.084 0.00 Season Wet 21 905 2.3 (1.4 – 3.5) 2.01 (1.03 – 3.96) 0.04 Dry 14 1,216 1.1 (0.6 – 1.9) 1.00 0.138
0 - 4 12 277 4.3 (2.2 – 7.6) 3.35 (1.57 – 7.15) 0.520 0.00 Dipping frequency 5 - 8 8 685 1.2 (0.5 – 2.3) 0.90 (0.38 – 2.12) 0.140 0.81 > 8 15 1159 1.3 (0.7 – 2.1) 1.00 0.155
1IRR Incidence Rate Ratio 2CI Confidence Interval

166
Table 7.6: Multivariable analysis for exposure toTheileria parva infection in cattle in a controlled immunization trial against East Coast fever in Machakos County, 2008-2009.
Variable Level 1IRR 95% 2CI Std. Err. p-value
Immunization Control 0.20 0.09-.44 0.08 0.00
Vaccinated 1.00
Division Kangundo 0.26 0.06-1.19 0.20 0.08
Matungulu 0.32 0.11-0.91 0.17 0.03
Ndithini 0.81 0.29-2.24 0.42 0.68
Athi 1.00
Age Yearling 0.27 0.10-0.73 0.14 0.01
Adult 0.00 0.00 0.00 0.99
Calf 1.00
Sex Female 2.18 1.09-4.36 0.77 0.03
Male 1.00
Season Wet 2.00 0.99-4.02 0.71 0.05
Dry 1.00
1IRR Incidence Rate Ratio 2CI Confidence Interval
7.3.4 Association between vaccination and incidence of East Coast fever
The attributable risk and attributable fractions were 0.24 (24%) and 0.77 (77%)
respectively. Thus, 24% of the incidence of the disease in the non-vaccinated group was
attributed to non-vaccination while 77% of the cases of ECF in the non-vaccinated cattle
were due to non-vaccination against the disease.
The increase in the risk of the disease in the entire population (from which the trial
animals were selected) that was attributable to being non-vaccinated was 0.14 (14%)
(PAR) while the proportion of disease in the whole population (PAF) that was attributed
to being non-vaccination was 0.58 (58%).

167
7.3.5 Cost of immunization
The mean herd size was 20.8 animals comprising of 13.2 adults, 2.5 yearlings and 5.1
calves. However, only calves and yearlings were considered in the estimation of the cost
of the ECF vaccine. The mean number of calves and yearlings on the trial farms was 7.3.
The immunization costs are as shown in Table 7.7. The consumable items included
syringes, hypodermic needles, microscopic slides and staining reagents.
The estimates of the cost of an immunising dose of stabilate were based on the current
production costs of 100,000 doses at VRC Muguga. The current total cost of producing
the stabilate (100,000 doses) is USD 113,300. This included the cost of quality control
processes (cross-immunity trials, titration and screening for pathogens).
The total cost of a dose of the vaccine (inclusive of all costs) was 6.96 USD (Table 7.7)
(equivalent to Ksh. 522 at the average exchange rate Ksh.75 to the dollar at the time of
the trial in 2008).
Based on the data collected from the 28 trial farms, the average cost of treating a calf (up
to 12 month of age) for ECF was Ksh.258 while average annual cost of application of
acaricides per animal was Ksh.205.9 (Table 7.8). East Coast fever was mainly treated by
use of long acting tetracyclines.

168
Table 7.7: Estimated cost of the various components in ECF immunization in Kenya, 2008.
Cost in USD. Item Category*
Per farm Per animal
Percentage of total cost
Stabilate production Variable 8.25 1.13 16.23
Blocking drugs Variable 3.50 0.48 6.90
Consumable items Variable 11.68 1.60 22.99
†Labour (monitoring) Fixed - - -
Transportation Fixed 1.83 0.25 3.59
Professional charges Fixed 25.55 3.50 50.29
Total 50.81 6.96
*Parameters costed per animal (animal-dependent) were termed as “variable” while those costed per whole farm were termed as fixed. †No reactors are expected when 30% oxytetracylines formulation is used. This eliminates the need for monitoring. Table 7.8: Inputs used in partial farm budget analysis of the financial benefits of East Coast Fever immunisation by the infections and treatment method in Machakos County, 2007.
Value Parameter Immunized Non immunized
Source
No of calves (NoA) 129 83 Study data Market value of a calf (CP) *Ksh.6,347 Ksh.6,347 Study data ECF cumulative incidence (CumInc) 7.76 42.74 Study data ECF cumulative mortality (CumMort) 0 5 Study data Vaccine Cost (Ksh) VC Ksh.522 Market price Cost of treatment (Ksh) TC Ksh.258 Ksh.258 Market price Percentage of reactors to vaccination ( R) 0 Study data Market price Cost of tick control Annual basis per animal (TCA)
Ksh.205.9 Ksh.205.9 Study data
*Based on field data from elsewhere, the price of immunised calves is expected to increase by at least 50%

169
Immunization of calves against East Coast fever generated a net output of Ks 559,257.90
which translated into a mean marginal return of Ksh.2, 638.00 per vaccinated calf (Table
7.9).
Table 7.9: Net return of immunization against ECF in Machakos County. Parameter Additional returns: N/B accurate records of extra calves sold as a result of immunization not available Additional costs Cost of vaccination Ksh.67,338.00 Cost of treatment of infected calves-immunised group Ksh. 258,268.30 Tick control Ksh.43,650.80
Costs no longer incurred Treatment of diseased cattle Ksh.915,234.4 ( Non-immunized calves) Tick control Ksh. 13,280.60 Net return = Ksh (915,234.4 + 13,280.6 ) –(67,338.0 +258,268.3 + 43,650.8) = 559,257.90 Average net return per calf = Ksh. 2,638.00
The number of animals immunized per farm had a major influence on the mean cost per
animal, with the total cost of immunization decreasing as the number of cattle per herd
increased (Figure 7.1). In this analysis, the cost of monitoring, the professional fees and
transportation costs were termed as fixed costs, since they were charged uniformly,
irrespective of the number of animals on the farm. These cost contributed 54.9% of the
total cost, hence the high cost when few animals were immunised on the farm.

170
0
5
10
15
20
1 2 3 4 5 6 7 8 9 10 11
No of cattle per herd
Co
st p
er a
nim
al (
US
Do
llar
s)
Figure 7.1: The trend of the total cost per animal on sensitivity analysis of the total number of animals immunized per farm
7.4 DISCUSSION
East Coast fever in cattle is mainly controlled by the frequent application of acaricides.
However, the use of acaricides to control the tick vectors of the disease is unsustainable
due to increasing costs of acaricides, poor maintenance of dips or sprays, water shortages,
tick resistance to the acaricides, illegal cattle movements, and contamination of the
environment or food with toxic residues, and availability of alternative tick hosts (mainly
ungulates) (Wesonga et al., 2006; Ocaido et al., 2008; Mendes et al, 2011). Thus,
immunization against ECF appears attractive as it is expected to reduce the risk of the
disease and reliance on the use of acaricides. The result would be an increase in
productivity.
It is estimated that the ECF vaccine can save affected countries, mainly in sub-Sahara
Africa, up to 315 millionUSD a year in both losses due to mortality and control costs

171
(ILRI, 2010). In herds kept by the pastoral Masaai people, for example, the disease kills
from 20% to over 50% of all unvaccinated calves (DFID, 2009). In a study carried out in
Zambia (Berkvens et al., 1987), ECF incidence rates of 70% to 80% were recorded in
calves less than one year old with corresponding fatality rates of 30-40%. This scenario
makes it difficult and often impossible for the herders to plan for the future, to improve
their livestock enterprises and thus raise their standard of living.
In endemic areas where there is continuous challenge with the infected ticks
(R. appendiculatus), animals only need to be immunised once in their life (Radley et al.,
1975; Mutugi et al., 1989). Calves, the most susceptible age group, can be immunised as
early as 1 month after birth (Maloo et al., 2001b). The technique is growing in popularity
in the East African region with Tanzania taking the lead. For instance, more than 500,000
cattle have been immunised against ECF in the country since 1998 (ILRI, 2010). It is
estimated that calf mortality can be reduced by up to 95% following immunization (ILRI,
2010).
A number of studies have been conducted to establish the efficacy of the ECF vaccine in
the Central, Coastal, South and North Rift Valley regions of Kenya and in the
Ngorongoro region of Tanzania (Young et al., 1981; Radley, 1981; Mutugi et al., 1989;
Mutugi et al., 1991; Wesonga et al., 2000; Wanjohi et al., 2001; Babo Martins et al.,
2010). All these studies demonstrated a significant difference between the number of
cases of ECF observed among immunised cattle compared to the non-immunised ones.
Apart from the study undertaken by Babo Martins et al. (2010) in the Ngorongoro region
of Tanzania, none of the studies evaluated the incidence of the disease among the
172
immunised and non-immunised animals as a criteria for computing the efficacy of the
vaccine. This was the first trial to test the efficacy of the vaccine in the eastern region of
the country.
A high proportion (93.7%) of the cattle sero-converted following immunization. This rate
was within the range (85% to 100%) considered acceptable for a viable vaccine
(Muraguri et al., 2003). The sero-conversion rates were similar those observed in similar
studies (Wesonga et al., 2000; Wanjohi et al., 2001; Oura et al., 2004; Babo Martins et
al., 2010). However, antibody response following natural infection with T. parva or
immunisation does not correlate with immunity to the disease as immunity against
T. parva is cell-mediated (Emery et al., 1981; Morzaria et al., 2000; McKeever, 2007).
The efficacy of the vaccine in this study was (82%) which is lower than the 95% reported
by ILRI (2010) or 97% reported by Babo Martins et al.(2010). This could probably be
attributed to differences in tick challenge between the study sites, differences in the
vector tick infection rates with the T. parva parasite, and environmental factors. It has
been shown that high tick challenge could precipitate immunosuppression (Bock and De
Vos, 2001; Rashid et al., 2009) in the infested animals resulting into clinical ECF. In
addition, high tick infection rates with Theileria parva can result in exposed animals
particularly calves, developing the disease before the vaccine could have had time to
stimulate the body’s immunity (James, 1999; Rashid et al., 2009). It is also known that
tick infection rates with T. parva are greatly influenced by environmental factors such as
climate (Ochinda et al., 2003; Olson and Patz, 2010)and that the parasite thrives in the
tick vector within the environmental temperature range of 18-28oC (Ochonda et al.,

173
2003). The sporozoite stage of the parasite multiplies rapidly within the salivary glands of
the tick vector under high environmental temperatures. An important implication of this
is that the efficacy of the ECF vaccine could be influenced by the prevailing weather
conditions. Thus, there is need to conduct further investigations on the effects of high tick
challenge and T. parva tick infection rates on the efficacy of the ECF vaccine.
The efficacy of the vaccine could have been further affected by the adverse drought
conditions during the trial period as this could have been a major source of stress. Stress
conditions such as drought and poor livestock management practices are known to have
adverse effects on the efficacy of vaccines (Clement et al., 2004; Rashid et al., 2009).
In the study, only 77% of the cases of ECF in the non-vaccinated cattle were attributed to
non-vaccination against the disease. This does suggest that there are indeed other factors
responsible for the occurrence of the disease even among the immunised cattle.
Nevertheless, the results of the immunisation trial in the study area do indicate that the
vaccine had a significant protective effect. The vaccine reduced the incidence of ECF by
82%. Indeed, vaccination of all calves/yearlings in the study area would have reduced
the overall incidence of the disease by 58%. This study does provide evidence that the
vaccine can be used to control the disease in Machakos. Indeed the high number of
clinical cases of ECF that were observed during the study (Chapter 6) was a stong
indicator that the disease is an important constraint to livestock production in the County.
Use of the vaccine in the County can greatly improve livestock productivity as has been
the case in other parts of the country where there has been a roll out of the vaccine

174
(Muraguri and Peeler, 1996; Ndua et al., 1999). Concerns on the possibility of
introduction of vaccine strains following immunization against ECF was one of the
reasons the Department of Veterinary Services introduced the policy of gradual roll out
of the vaccine. Under this policy, commercial use of the vaccine was only permitted in
Coast, Kiambu County and ironically Machakos County where no trials on vaccine had
been carried out.
However, in the last five years, there has been a shift in government policy regarding the
use of the live ECF vaccine. The Department of Veterinary Services is no longer cautious
about the use of the vaccine outside the regions where the initial trials on the vaccine
were carried out. Currently there are no restrictions on where the vaccine can be used in
the country. This has largely been the effect of recent research findings that have allayed
fears over the role of the live ECF vaccine with regard to the introduction of new
Theileria parva strains (Oura, 2004; Oura, 2007; McKeever, 2007). These studies do
confirm that elements of the vaccine establish a carrier state in vaccinated animals and
alleles associated with vaccine strains emerge in co-grazing non-vaccinated cattle.
However, the epidemiological impact of these observations could be tempered by
extensive recombination of co-ingested strains in the tick vector. Besides, widespread
livestock movement, both legal and illegal, probably plays a bigger role in the
introduction of new Theileria parva strains. Ticks with “new” strains of Theileria parva
can also be introduced through fodder or hay brought from other parts of the country
particularly during the drier periods of the year.

175
In view of change in policy on the use of the live vaccine, the “greater” Machakos
County is bound to benefit from the uptake of the technology since the vaccine was
efficacious in the trial and none of the farmers raised any safety concerns that could be
attributed to the vaccine. The vaccine will greatly contribute to the preservation of the
livelihoods of the resource poor farmers in the region as it will greatly reduce the
mortality of calves. Calves are an importance asset as they are the future replacement
stock of the cattle herds.
Apart from reduced mortality from the disease, the other benefits of immunising against
the disease include reduced costs associated with treatment and reduction in acaricide
usage. Tick control in the County following immunisation against ECF was not addressed
by the study. However, previous studies by Wesonga et al. (2000) and Wanjohi et al.
(2001) established that depending on the level of tick challenge, tick control frequency
can be reduced to just once every three or four weeks on farms where all animals are
immunised against the disease without significant increase in the incidence of other tick-
borne diseases.
Studies by Mukhebi et al. (1990), Nyangito et al. (1994), Mukhebi et al. (1995) and
Muraguri et al. (1998) established the cost/ benefits of immunizing against ECF. A
similar study carried out in Zambia to assess the impact and financial implications of
ITM in traditionally managed Sanga cattle (cross between Bos indicus and Bos Taurus
cattle) showed that it is a cost-effective strategy for the control of ECF (Minjauw et al.,
1999).

176
Immunisation of cattle against ECF in the Coast Province of Kenya was found to reduce
economic losses by 24–40% in indigenous zebu cattle populations and by 40–70% in
genetically improved grade cattle (Thornton and Odero, 1998). In the study, it was
estimated that immunisation would yield increases in net income of 24–100%, depending
on the alternative control strategy employed. On the basis of cost-benefit ratio,
immunisation at a cost of Ksh 544 (USD 25, in 1990 values) per animal would be
financially profitable in grade but not in zebu cattle. For the new strategies to be as
financially profitable for zebu cattle, the cost of immunisation would have to be in the
range of Ksh 230–415 per animal, or the farm-gate price of milk would have to increase
by at least 80%. Other studies have estimated the cost of immunisation per animal to
range from USD 2.50 to USD 20 (Radley, 1978; Kiltz, 1985, Mukhebi et al., 1990; Babo
Martins et al., 2010).
The results of the current study fall within this range (USD 6.96) per animal and are
similar to those of a recent study carried out by Babo Martins et al. (2010) in Tanzania
where the cost of immunisation was 6 USD per animal. The relative low cost of
immunisation per animal in the two studies compared to some of the earlier studies is
attributed to the selection of calves and yearling for ITM as opposed to adult cattle. The
other factor that resulted into lower immunisation costs was the use of the 30%
formulation of oxytetracylines as the blocking agent. The higher concentration of the
oxytetracylines (30mg/kg) compared to the conventional (20mg/kg) oxytetracylines has
been observed to have a negligible “reactor” rate (Di Giulio et al., 2009). Treatment of
reactors is a major cost if oxytetracylines formulations of a lower concentration are used
accounting for up to 16% of the total cost (Muraguri, 1998). The cost of the vaccine may

177
seem to be too high for the smallholder farmers in the County. Despite the cost, calves
are only immunised once in their lifetime as the immunity lasts a lifetime if there is
continuous tick challenge. On the other hand, farmers spend between Ksh.220 and
Ksh.500 in treating each indigenous calf and up to Ksh. 4,000 for adult exotic cattle.
Thus farmers who immunise their cattle against the ECF stand to make big savings on
treatment costs.
Partial budgeting provides a simple economic description and comparison of different
disease control measures (Dijkhizen et al., 1995). Partial budget is used to decide whether
it is economically worthwhile to introduce a new technology/change in an enterprise. The
decision is taken if the net returns are positive. Positive net returns are good indicators of
profitability of a new technology. From the results of the study, ITM technology is
financially profitable even when the extra calves sold as a result of reduced mortality and
the expected increase in the price of immunised calves were not taken into consideration.
The ITM realized a net return of Ksh.2, 638.00 per immunized calf. This was significant
in the study area since the average price of a calf was relatively low (Ksh.6, 347.00).
High net returns are indicators of high profitability of immunisation. Thus, it can be
concluded from the study that it is economically worthwhile to immunise calves against
ECF in the Machakos County.
If immunization against the disease is integrated with reduced acaricide usage, then
accrued returns are even much higher. If the tick control frequency is reduced to once

178
every two weeks, this will result into a 50% reduction in acaricide costs. The annual cost
of tick control per animal (cattle) would drop from Ksh.206 to Ksh. 103.
Another benefit that can be derived from immunisation is the increased value of the
immunised cattle. For instance, among the Masaai pastoralists of Tanzania immunised
calves are sold at a price 50% higher than the non-immunised calves (Babo Martins, et
al., 2010).
.

179
CHAPTER 8
CONCLUSIONS AND RECOMMENDATIONS
8.1 CONCLUSIONS
8.1.1 Constraints limiting livestock production
A combination of qualitative and quantitative methods were used in identifying farmers’
constraints to livestock production in the four study divisions of Machakos County.
Qualitative techniques involved rapid appraisal techniques while quantitative methods
included cross-sectional surveys to evaluate the risks of the prevalent tick-borne diseases
of cattle in the County. The longitudinal study was used to further quantify the incidence
of the tick-borne diseases, assess animal health and productivity. Using rapid appraisals,
it was possible to identify and quantify not only the major livestock diseases but also the
other factors that constrained livestock production in Machakos County. The main
constraints identified in order of importance were livestock diseases (mostly tick-borne
diseases), poor access to livestock and livestock product markets, poor veterinary
infrastructure and inadequate feed. In addition, the qualitative techniques unmasked
problems that otherwise would have been missed out if only quantitative methods were
used. For instance, it was possible to identify reasons why poor livestock breeds
(indigenous) have been kept for so long in the County. Rearing of livestock in the County
was not undertaken primarily for commercial reasons but was also a status symbol. The
other reason was the fear of adopting new or unfamiliar animal husbandry practices such
as keeping the more disease prone but improved cattle breeds.
180
Predation was also identified as a major constraint to livestock production in one of the
study divisions (Ndithini Division). Such information is usually not found in the County
or Department of Veterinary Services annual reports.
The main advantages of applying qualitative data collection methods were the relatively
shorter periods for completion and the prompt feedback of results to the farmers. Within
a period of a month and using an average of 4 personnel (author, facilitator, local
veterinarian or AHA and one recorder), it was possible to gather data on all major
constraints, disease risk and control strategies. The prompt feedback of results to the
farmers was particularly useful for continued collaboration as costly incentives were not
necessary. It also helped to gain farmer confidence during the subsequent cross-sectional
surveys. Thus, the informal data collection tools were important in the initial collection of
data and facilitation of researcher entry into the study area.
The main disadvantages of quantitative studies were the high costs and the need for
specialized personnel and equipment during the serological evaluations. The longitudinal
study was also time-consuming. Costly incentives in terms of free veterinary services,
continuous reassurance and feedback were necessary to sustain the study. It costs the
equivalent of 2.5US$ to screen for Theileria parva, Anaplasma marginale and Babesia
bigemina, using the ELISA serological kit. Besides, many disposable and capital items of
equipment were required. Although quantitative study was expensive and time
consuming, it yielded estimates of various animal health and productivity parameters, and
management. Both methods (qualitative and quantitative) complemented each other very

181
well in this study. The study further demonstrated the need to involve farmers in
assessing constraints or problems affecting livestock production. Though farmers’
perceptions on key problems that limit livestock production in a particular farming
system cannot be entirely relied on, their views can expose issues that otherwise would
have been neglected (Omiti et al., 2007). Such issues could be of great significance in
designing appropriate mitigation measures against specific constraints limiting livestock
development or improvement.
8.1.2 Seroprevalence of tick-borne diseases in Machakos County
8.1.2.1 Risk of tick-borne diseases
Tick-borne diseases especially ECF were the main constraints to livestock production in
the study area. Antibodies to the three TBDs infections were detected in all the selected
farms. The overall estimates of T. parva, A. marginale and B. bigemina antibodies in the
County were 58.9% [95% CI: 56.5%, 62.3%],, 35.0% [95% CI: 31.9%,38.8%] , 41.1%
[95% CI: 38.9%,41,4%] respectively. Based on the findings of the cross-sectional
survey, a state of endemic stability characterized by high seroprevalence rates and few
clinical cases was found to possibly exit for ECF in two of the study divisions (Athi River
and Ndithini) while anaplasma and babesia appeared to exist in a state of endemic
instability characterized by low seroprevalnce and high number of clinical cases in all the
study divisions. However, these results were at variance with the findings during the
longitudinal phase of the study as only a few clinical cases of the two diseases were
documented.

182
Although Amblyomma variegatum, the vector of Ehrlichia ruminantium (heartwater) was
one of the commonest tick species in the study area, no case of the disease was
documented during the observational period. These findings are different from those
made by Ngumi et al. (1997) which confirmed the presence of the disease in Machakos
County. Tick challenge was high in three of the study divisions namely, Athi River,
Matungulu and Ndithini. R. appendiculatus, the vector for T. parva was the commonest
tick species observed in the study site. Only 43% of the study farms that kept both cattle
and small ruminants practiced tick control on all the three livestock species. During the
regular visits to the farms small ruminants were often found to be infested with ticks.
Thus, on farms that practice zero-grazing for cattle and also keep small ruminants on free
ranging, the latter could act as important sources of tick infestation to cattle
8.1.3 Socio-economic and demographic characteristics of the livestock farmers
8.1.3.1 Livestock and crop enterprises
One- hundred-and-eighty seven (93.5%) of the 200 study farms practiced mixed farming.
This indicated diversification of sources of income in the drought prone County, in order
to better manage risks associated with either crop or livestock enterprises. Mixed farming
in the County is therefore important as it enhances food security. However, it was noted
during the study that farmers took full advantage of mixed farming to maximize on crop
production as the two enterprises are interdependent. Livestock manure can be used to
supplement fertilizers to enhance crop production and improve on food security. The
majority (84%) of the 200 farmers used manure on their farms. Surplus manure was sold
to provide an extra source of income.

183
Although cattle were kept as the main source of family income, sheep, goats and chicken
also played important roles such as catering for short falls in family incomes. Thus, all
livestock species played a significant role in the social and economic lives of the
smallholder farmers in the County.
.
8.1.4 Morbidity and productivity estimates in smallholder livestock farms in
Machakos County
East Coast fever was the commonest disease diagnosed on the study farms during the
longitudinal study. Twenty-six (26) cases of ECF were confirmed on 14 farms converting
to an annual incidence rate of 30.7% per calf-year. The risk factors of
T. parva infection in cattle were the administrative divisions where the farms were
located (there were more infections in Athi River and Ndithini divisions), age of animal
(more in calves), tick control on the farm (more on farms where tick control was
irregular) and season of the year (more in the rainy seasons).
Malnutrition, mange, mycosis and diarrhoea were the other conditions or infections
observed in cattle. Malnutrtion was not associated with any animal or farm level
variables. Tick control was the only variable that was associated with mange. Mange was
significantly higher on farms where tick control was not practiced compared to farms
where tick control was practiced. Thus, it can be concluded that the acaricides used for
tick control were also effective on mites.

184
Breed was associated with the incidence of non-specifc diarrhoea and mycosis. The
incidence of the two conditions was significantly (p<0.05) higher among the exotic
crosses of cattle (44.4% per cow- year) compared to the indigenous breed (4.5% per cow-
year).
The commonest causes of morbidity in sheep and goats were helminthosis and
pneumonia while diarrhoea due to bacterial infections, severe flea infestations and mange
were the other diseases detected in small ruminants.
Livestock productivity in the study area was found to be sub-optimal. The mean daily
production of milk, in cattle was 1.98 litres which was less than a third of the average
daily milk production recorded in the high potential areas of the country. Milk production
and sales in the four divisions of the County were very low at the time of the survey. This
was mainly attributed to the small number of farmers who keep improved dairy cattle
breeds, inadequate veterinary extension services and poor marketing of milk in the
County due to under developed co-operative societies.
One of the main hindrances to the improvement of livestock production in the study area
is the failure by farmers to fully embrace livestock keeping as a commercial enterprise.
There is therefore need for change in attitude for farmers to adopt new farming practices
and technologies.This can be achieved by provision of extension services to the farmers
on the viability of keeping improved higher producing dairy cattle or goat breeds that
will produce enough milk for both domestic consumption and sale.

185
The breeding intervals for goats and sheep was once every 12 months instead of the
optimal interval of once every 6 months. The mean off- take rates for cattle and small
ruminants were 9% and 4%, respectively.
8.1.5 Efficacy of the East Coast fever vaccine
8.1.5.1 Immunization against ECF
The vaccine against ECF was found to be efficacious against the disease in the study area
as it reduced its incidence by 82% which is lower than the 95% reported by ILRI (2010)
or 97% reported by Babo Martins et al.(2010). The differences in efficacy can be
explained by differences in tick challenge, differences in the vector tick infection rates
with the Theileria parva parasite, and environmental factors.
8.1.5.2. Association of immunisation with incidence of ECF
Twenty four (24) per cent of the incidence of ECF in the non–vaccinated group was
attributed to non-vaccination (Attributable Risk) while 77% of the disease in the non –
vaccinated cattle was due to non –vaccination (Attributable Fraction). The increase in the
risk of ECF in the population that was attributable to being non- vaccinated was 14%
(Population Attributable Risk) while the proportion of the disease in the population that
was attributable to non-vaccination (Population Attributable Fraction) was 58%.
186
8.2 RECOMMENDATIONS
8.2.1 Veterinary infrastructure
Since only one functional dip was operational during the study, it is recommended that
the Veterinary Department provides partial financial support and technical assistance in
reviving the dips. In addition, the farmers should take the responsibility of managing the
dips. Dip management committees should be streamlined to ensure that the right people
are selected to manage them in order to avoid mismanagement. To ensure sustainable
operation of the dips, farmers need to be sensitized on the concept of cost sharing.
However, there should be a level of subsidization possibly with the use of Constituency
Development Funds (CDF). This will lessen the financial burden on the farmers and
encourage regular dipping of the animals. The veterinary department should assist with
extension and supervision services. For instance, the department could assist with
provision of dip attendants.
In the meantime, extension services are necessary to assist farmers who still rely on hand
sprays to control ticks on the right choice of acaricides as well as how to effectively apply
the hand spray technique as it is not as reliable as dips.
8.2.2 Acaricide application
Farmers need to be made aware of the importance of applying acaricides on all livestock
species on their farms in order to reduce tick burdens on the pastures. The information is
of particular importance to farmers who zero-graze cattle while small ruminants on the
same farms were free-grazing.

187
8.2.3 Formation of co-operatives
Farmers need to be encouraged to form groups or associations as a way of enhancing
chances of accessing credit or loans from financial institutions. This will also need
participation of co-operative development officers to advice the farmers on how to
organize themselves into co-operatives. Access to finance will then assist farmers
upgrade livestock as well as expand both livestock and crop production. By being in
organised groups, the farmers will hopefully be able to overcome bottlenecks caused by
brokers in the marketing of livestock, as they will have direct access to markets at better
prices.
8.2.4 Livestock improvement
A shift from keeping indigenous breeds of cattle to keeping improved breeds of livestock
is a prerequisite for improved livestock productivity in the study area. The poor animal
genetic resources cannot sustain an effective dairy cattle production system in the
County. There is a misguided fear of keeping improved cattle breeds in particular. The
perception is that grade animals easily succumb to hot weather conditions and diseases.
Thus, there is need for education on the benefits of keeping improved cattle breeds. The
veterinary and animal production departments as well the local administration officials
need to work together on this. The best approach is to keep improved breeds such as
Friesian crosses that are well adapted to the local conditions. Exchange visits with
farmers from neighbouring Countys who are already experienced with regard to keeping
such breeds will be of great benefit.

188
8.2.5 Artificial insemination services
The farmers should also be actively involved in addressing the issue of provision of
artificial insemination (AI) services, which are the pillar of improving genetic potential.
At the moment, availability of these services in the County is unreliable as they have to
be sourced from Nairobi. The problem can be solved by the farmers coming together to
form co-operatives which can sponsor locally sourced students to be trained at certificate
or diploma level in the field of artificial insemination. In the long run, the farmers should
be able to recoup the money invested in the training. The trainees could be bonded to
serve the community for an agreed period of time. If the farmers opt to use bulls then
they need to be involved in breeding management so as to avoid inbreeding and spread of
sexually transmitted diseases.
8.2.6 Rearing of small ruminants
Rearing of small ruminants should be encouraged as they are better adapted to the
climatic conditions in the County and are a means of diversification of income and
spreading of risks. Improved sheep (e,g Dorper) and goat breeds (German Alpine and
Galla goats) would translate into improved household incomes. Since sheep, goats and
chicken play an important role in the livelihoods of the smallholder farmers, it is
recommended that studies on livestock in smallholder livestock production systems
should be designed to include all livestock species.

189
8.2.7 Fodder preservation
Farmers also need to be trained on storage and preservation of fodder. However,
emphasis should be placed on drought resistant crops such as sorghum, cassava and
millet as the study area has a semi arid climate. A variety of forage seeds are available
that are suitable for the semi arid climate in the County. The fodder should be planted
during the rainy period in preparation for the drier months. This could be practiced as a
drought mitigation practice. Farmers should also be encouraged to construct dams to
harvest water during the rainy seasons. The water could be used to irrigate fodder and
hay.
It was noted during the study that education was lacking on the recommended stocking
rates on the farms for the available feed resources. The stocking rates did not take into
consideration availability of feed especially during the dry seasons. The average stocking
rate was 4.7 adult cattle and 2 sheep/goats per hectare. The recommended stocking rate
for zebu cattle and indigenous goats and sheep is 0.6 ha/TLU or 0.6 ha/250 kg (Jaetzold
and Schmidt, 1983). This is equivalent to approximately 2 adult cattle or 17 sheep/goats
per hectare. To address the problem it is recommended that farmers in the County should
be trained on the importance of keeping smaller but more productive animals.
8.2.8 Further studies
Findings from the cross-sectional survey suggesteds a state of endemic instability for
anaplasmosis and babesiosis in the study area. However, the findings of the longitudinal
study did not support these results. Thus, further studies need to be undertaken to
establish the true endemic state of the two diseases.

190
8.2.9 Efficacy of ECF vaccine
Although the ECF vaccine was found to have a significant protective effect and can be
used to control the disease in Machakos County, the efficacy of the vaccine was lower
than that observed in other parts of the country. In view of these findings, further
investigations need to be conducted on the effect of factors such as climate, level of tick
challenge and T. parva tick infection rates on the efficacy of the ECF vaccine.

191
REFERENCES
Abegaz, S and Awgichew, K. (2009). Estimation of weight and age for sheep and goats Technical bulletin No.23. for Ethiopia sheep and goat improvementproductivity Program. Editors Alemu Yami, Gipson, T.A and Merkel, R.C.
Ackello-Ogutu, C. and Waelti, J.J. (1990). Basic concepts of microeconomics with
Since sheep, goats and chicken play an important role in the livelihoods of the smallholder farmers, it is recommended that studies on livestock in smallholder livestock production systems should be designed to include all livestock species.
special reference to Kenya. Nairobi University press, P.O.Box 30197, Nairobi Kenya. Allonby, E.W. and Urquhart, G.M. (1975). The epidemiology and pathogenic significance of haemonchosis in Merino flock in East Africa. Veterinary Parasitology, 1: 129-143. Allsopp, B.A. and Allsopp, N.T.E.P. (1988). Theileria parva Genomic DNA studies
reveal intra-specific sequence diversity. Molecular and Biochemical Parasitology, 28: 77-84. Allsop, B.A., Baylis, H.A., Allsop, N.T.E.P., Cavelier-Smith, T., Bishop, R.P.,
Carrington, D.M., Sohanpal, B. and Spooner, P. (1993). Discrimination between 6 species of Theileria using oligonucleatide probes which detect small subunit
ribosomal RNA sequences. Parasitology, 107: 157-165. Anon. (1991). Integrated approach to trypanosomiasis and tsetse control in semi-zero grazing units in Kwale County using Samorin prophylaxis and target method. Report of a Research Project by Mariakani VIL, Mombasa, Kenya. Arasio, R.L. (2004). Participatory study of Livestock Marketing Strategy in Loima,Division, Turkana County, Kenya. MSc Thesis, University of Nairobi, Kenya. Babo Martin, S., Di Guilio, G., Lynen, G., Peters, A. and Rushton, J. (2010). Assessing the impact of East Coast Fever immunization by the infection and
treatment method in Tanzania pastoralist systems. Preventive Veterinary Medicine, 97: 175-182.
Barnet, P.V. and Cox, S.J. (1999). The role of small ruminants in the epidemiology and transmission of foot and mouth disease. Veterinary Journal, 158 (1): 6-13. Bazarusanga, T., Geysen, D.Vercruysse, J. and Madder, M. (2007). An update on the ecological distribution of ixodid ticks infesting cattle in Rwanda: country wide cross-sectional survey in the wet and dry season. Experimental and Applied acaralogy, 43: 279-291.

192
Bell-Sakyi, L. 2004. The epidemiology of heratwater in Ghana and growth of Erlichia
ruminantium in tick cell lines. Phd Thesis,, University of Utrecht, The Netherlands
Benett, R.M. (2003). The direct cost of livestock disease: the development of a system of models of analysis of 30 endemic livestock diseases in Great Britain. Journal of Agricultural Economics, 54: 55-72. Berkvens, D.L, Geysen, D.M. and Lynen, G.M. (1987). East Coast fever Immunization in the Eastern Province of Zambia. Belgian Animal Disease Control Project. Bock, R.E. and De Vos. A.J. (2001). Immunity following use of Australian tick fever
Vaccine: a review of the evidence. Australian Veterinary Journal, 79: 832-839. Bock, R., Jackson, L., De Vos, A. and Jorgensen. (2005). Babesiosis of cattle Parasitology, 129: S247-269. Bram, R.A. (1983). Tick-borne-Livestock diseases and their vectors. The global Problem. In: Ticks and tick borne diseases, FAO Animal Production and
Health paper No. 36. FAO, Rome, pp.7-11. British Veterinary Association.1976. Handbook on Animal Diseases in the Tropics. Third Edition. Burgess and Son Ltd., Abington, Oxfordshire, England. pp 303. Bronwen, E.T. (2007) .Occurrence of Theileria parva infection in cattle on a farm in KwaZulu-Natal, South Africa. MSc Thesis, University of Pretoria. Bose, R., Jorgensen W.K., Dagliesh, R.J., Friedhoff, K.T and de Vos, A.J. (1995). Current and future trends in the diagnosis of babesiosis. Veterinary Parasitology, 57: 61-74. Brown, C.G.D.1977, Radley, D.E., Cunningham, M.P., Krimi, I.M., Morzaria. S.P and Musoke, A.J. (1977). Immunization against East Coast fever (Theileria Parva infection of cattle) by infection and treatment. Chemoprophylaxis with N- Pyrolidinomethyl tetracycline. Tropenmedizin and Parasitologie, 28: 342-348. Brockleysby, D.W. and Bailey, K.P. (1962). Oxytetracyline hydrochloride in East Coast fever (Theileria parva) infection. British Veterinary Journal, 118, 81-85. Brown, C.G.D. (1997). Dynamics and impact of tick borne diseases of cattle. Tropical Animal Health and Production, 29: 1s-3s.

193
Brumby, P.J. and Scholtens, R.G. (1986). Management and health constraints of small Scale dairy production in Africa In: ILCA Bulletin: 25.ILCA Addis Ababa. Burridge, M.J and Kimber, C.D. (1972). The indirect fluorescent antibody test for
experimental East Coast fever (Theileria parva infection of cattle): Evaluation of a cell culture schizont antigen. Research in Veterinary Science, 13: 451-455.
Burridge, M.J and Kimber, C.D. (1973). Studies on colostral antibodies to Theilaria parva using the Indirect Fluorescent Antibody Test. Tropenmed, 24: 305. Burridge, M.J., Brown, C.G.D and Kimber, C.D. (1974). Theileria annulata: Cross reactions between a cell culture schizont antigen and antigens of East African species in the indirect fluorescent antibody test. Experimental Parasitology, 35: 374-380. Cakmak. (1990). Untersuchung zur Inzidenz Van Haemo parasite in einer Rinderherde in der provinz Ankara (Turkish). Journal of the Faculty of Veterinary Medicine of Ankara, 37: 632-645. Camus, E., Barre, N., Martinez, D. and Uilenberg, G. (1996). Heartwater (Cowdriosis) a review.2nd edition, O.I.E. Paris: 177 pp. Castro, J.J. (1997). Sustainable tick and tick borne disease control in livestock improvement in developing countries. Veterinary Parasitology: 71: 77-97. Catley, A.P. and Mohammed, A.A. (1996). The use of livestock- disease scoring by a primary animal-health project in Somaliland. Preventive Veterinary Medicine, 28: 175-186. Catley, A.P. (1999). Methods on the move: A review of veterinary uses of Participatory approaches and methods focusing on experiences in dry land Africa. International Institute for Environment and Development, London, U.K. Chema, S., Waghela, S., James, A.D., Dolan, T.T., Young, A.S., Masiga, W.N., Irvin, A.D., Mulela, G.H.M. and Wekesa, L.S (1986). Clinical trial of parvaquone for the treatment of East Coast fever in Kenya. Veterinary Record, 118: 588-599. Chenyambuga, S.W., Waiswa, C., Saimo, M., Ngumi, P. and Gwakisa, P.S. (2010). Knowledge and perceptions of traditional livestock keepers on tick-borne diseases And sero-prevalence of Theileria parva around Lake Victoria Basin. Livestock Research for Rural Development, 22, Art #135. http//www.lrrd.org/lrrd22/7/chen22125.htm. Accessed May 2012 Clement, C.J., Gordon, L.and Lins, J. (2004). Technologies that make administration of vaccines safer. Vaccine, 22: 2054-2058.

194
Cicek, H., Cevger, Y. and Tandogan, M. (2008). Socio-economic factors affecting the adoption of innovations in dairy cattle enterprises. Ankara University Vet Fak Derg, 55: 183-187. Conrad, P.A., Stagg, D.A., Grootenhuis, J.G., Irvin, A.D., Njamunggeh, R.E.G.,
Rossiter, P. B. and Young, A.S. (1987). Isolation of Theileria parasites from the African buffalo and characterization with anti- schizont monoclonal antibodies. Parasitology, 94: 413-423. Connor R J., Munyuku A P., Makyao E. and Halliwell, R .W. (1990). Helminthosis in goats in Southern Tanzania: Investigations on epidemiology and control. Tropical Animal Health and Production, 22: 1-6. Cumming, G.S. (2002). Comparing climate and vegetation limiting factors for species ranges of African ticks. Ecology, 83: 253-268. Cunningham, M.P. (1977). Immunisation of cattle against Theileria parva. In: Theileriosis: Report of a workshop held in Nairobi, 7-9 December, 1976, J.B. Henson and M.Campbell (Eds). International Development Research Centre, Ottawa, pp 112. Curry, J.J., Huss-Asmore, R., Perry, B.D. and Mukhebi, A.W. (1991). A framework for the analysis of gender, intra- household dynamics, and livestock disease control with examples from Uasin Gishu County, Kenya. Human Ecology, ,24: 161-189. de Castro, J.J. (1997). Sustainable tick and tick-borne diseases control in livestock improvement in developing countries. Veterinary Parasitology, 71, 77-97. de Castro, J.J. and Newton, R.M. (1993). Host resistance in tick control. Parasitology Today, 9: 13-17. De Leeuw, P.N., Mc Dermott, J.J. and Lebbie, S.H.B. (1995). Monitoring of animal
health and production in Sub –Sahara Africa. Preventive Veterinary Medicine, 25:195-212.
De Waal, D.T., Matthee, O. and Jongejan, F. (2000). Evaluation of the MAP 1 B ELISA for diagnosis of heartwater in South Africa. Annals of New York Academy of Science, 916: 622-627. Deem, S.L., Perry, B.D., Katende, J.M., McDermott, J.J., Mahan, S.M., Maloo, S.H., Morzaria, S.P., Musoke, A.J. and Rowlands, G.J. (1993). Variations in the prevalence rates of tick borne diseases in Zebu cattle by agro-ecological zone:
Implications for East Coast fever immunization. Preventive Veterinary Medicine, 25: 195-212.

195
Desai, M. 1989. Livestock production and diseases in the tropics. In: Proceedings of 6th Conference of the Institute for Tropical Veterinary Medicine, 28 August -1 September 1989, Wagenigen, and the Netherlands. Devendra, C. (1982). Potential of sheep and goats in less developed countries. Journal of Animal Science, 51: 461-473. Department for International Development (DFID). (2009). A report by the Department
for International Development (DFID) on East Coast fever and how African cattle can be protected by the infection and treatment method of immunisation.
Di Giulio, G., Lynen, G., Morzaria, S., Oura, C. and Bishop, R. (2009). Live immunization against East Coast fever-current status. Trends Parasitology, 25: 85- 92. Dijkhuizen, A.A., Huir, R.B.M., Jalvingh, A.W. (1995). Economic analysis of animal diseases and their control. Preventive Veterinary Medicine, 25: 135-149. Dohoo, I., Martin, W. and Stryhn, H. (2003). Veterinary epidemiologic research. In: Mcpike, S.M. (Ed.), A comprehensive text for the discipline. AVC Inc, Charlottetown, Prince Edward Island, Canada, 706 pp. Dolan, T.T. (1991). Recent Developments in the Control of Anaplasmosis,
Babesiosis and Cowdriosis. Proceedings of a workshop held at ILRAD 13th to 15th May 1991, Nairobi, Kenya.
Dolan, T.T., Young, A.S., Leitch, B.L and Stagg, D.A. (1984). Chemotherapy of East Coast fever. Parvaquone treatment of clinical disease induced by isolates of Theileria parva. Veterinary Parasitology, 15: 103-116. Emery, D.L., Eugui, E.M., Nelson, R.T.and Tenywa, T (1981.Cell-mediated immune responses to Theileria parva (East Coast fever) during immunization and lethal infections in cattle. Immunology, 43(2): 323-36.
Emongor, R.A., Ngichabe, C.K., Mbithi, F.M., Ngumi, P.N. and Soi.K. (2000). Constraints to smallholder cattle production in four Countys in Kenya.
Proceedings of the 9th International symposium on veterinary epidemiology and economics, Breckenridge, Colorado USA.
Farrington, J. and Martin, A. (1988). Farmer participation in agricultural research.
A review of concepts and practices. Agricultural Administration Occasional paper No. 9. Overseas Development Institute, London.
FAO. (1975). Kenya: Epizootiological Survey of Tick-Borne Cattle Diseases. Technical Report No.1 AG: DP/KEN/70/522. Food and Agriculture Organization, Rome, Italy.

196
FAO. (1984). Ticks and Tick-Borne Disease Control. A Practical Field Manual. Volumes I and II. Food and Agricultural Organisation, Rome, Italy. FAO. (2005). Livestock Sector Brief. Food and Agricultural Organisation of the United Nations. FAO and Livestock information. Sector Analysis and Policy Branch, AGAL, Fleiss JL.1981. Statistical methods for rates and proportions. 2nded. New York: John Wiley, pp 225-232. Fawcett, D.W., Buscher, G and Doxey, S. 1985. Salivary gland of the tick vector of East Coast fever. IV. Cell type selectivity and host responsiveness of Theleiria parva. Tissue and Cell, 14: 307-344. Fleiss, J.L. 1981. Statistical methods for rates and proportions, 2nd ed. Wiley, New York. Gachohi, J.M., Ngumi, P.N., Kitala, P.M. and Skilton, R.A. (2010). Estimating seroprevalence and variation to four tick-borne infections and determination of associated risk factors in cattle under traditional mixed farming system in Mbeere County Kenya. Preventive Veterinary Medicine, 95: 208-223. Gachohi, J., Skilton, R., Hansen, R., Ngumi, P and Kitala, P. (2012). Epidemiology of East Coast fever (T. parva infection) in Kenya: Past, Present and the future. Parasites and vectors, 5:194. Gachohi, J.M., Ngumi, P.N., Kitala, P.M., Skilton, R.A. and Bett, B. (2013).
Population attributable fractions of farm vecor tick (Rhipicephalus appendiculatus) presence on Theileria parva infection seroprevalence under endemic instability. Preventive Veterinary Medicine, 108: 103-113
Ghirotti. (1993). Rapid Appraisal. Benefiting from experiences and persepectives of livestock breeders. World Animal Review, 77: 26-37. Gitau, G.K. (1992). Health and productivity of calves in smallholder dairy farms in Kiambu County, Kenya. Msc.Thesis. University of Guelph, Canada. Gitau, G.K., O’Callaghan, C.J., McDermott, J.J. Omore, A.O., Odima, P.A., Mulei, C.M. and Kilungu, J.K. (1994a). Description of smallholder dairy farms in Kiambu County, Kenya. Preventive Veterinary Medicine, 21(2): 155-156. Gitau, G.K., McDermott, J.J., Adam, J.E., Lissemore, K.D. and Waltner-Toews, D.
(1994b).Factors influencing calf growth and daily weight gain on smallholder dairy
farms in Kiambu County, Kenya. Preventive Veterinary Medicine, 21: 179-190.

197
Gitau, G.K., McDermott, J.J., Waltner,-Toews D., Lissemore, K.D., Osumo, J.M. and Muriuki, D. (1994c). Factors affecting calf morbidity and mortality in smallholder dairy farms in Kiambu County of Kenya. Preventive Veterinary Medicine, 21: 167-177. Gitau G. K. (1998). A study of factors influencing endemic stability and instability to Theileriosis and babesiosis on dairy production in Muranga County, Kenya. PhD Thesis. University of Nairobi, Kenya. Gitau, G.K., Perry, B.D. and McDermott, J.J. (1999). The incidence, calf morbidity and mortality due to Theileria parva infection in smallholder dairy farms in Muranga, County Kenya. Preventive Veterinary Medicine, 39: 65-79. Gitau, G.K., McDermott, J.J., Katende, J.M., Perry, B.D., Morzaria, S.P. and Young, A.S. (1997). The prevalence of tick-borne infections in small-holder farms in Muranga County, Kenya: a cross-sectional study. Preventive Veterinary Medicine, 30: 95-107. Gitau, G.K., McDermott, J.J., Katende, J.M.,O’Callaghan, C.J., Brown,, R.N. and Perry, B.D. (2000). Differences in the epidemiology of theileriosis on smallholder dairy Farms in contrasting agro-ecological and grazing strata of highland Kenya. Epidemiology and Infection, 124: 325-335. Gitau, G.K., McDermott, J.J., McDermott, B. and Perry, B. (2001). The impact of T.parva infection and other factors on calf growth in smallholder dairy farms in Muranga County, Kenya. Preventive Veterinary Medicine, 51: 149-160. Gitau, G.K., Aleri, J.W., Mbuthia, P.G.and Mulei, C.M. (2010). Causes of calf mortality in Peri-urban areas of Nairobi, Kenya. Tropical Animal Health and Production Doi: 10.1007/s11250-010-9614-2. Griffiths, R.B. and McCosker, P.J. (1990). Proceedings of the FAO Expert Consultation on Revision of Strategies for Control of Ticks and Tick-borne diseases. Parassitologia, 32: 1-209. Goddeeris, B.M., Katende, J.M., Irvin, A.D., and Chumo, R.S.C. (1982).
The indirect fluorescent antibody test for experimental and epizoological studies of East Coast fever (Theileria parva infection in cattle). Evaluation of a cell culture schizont antigen fixed and stored in suspension. Research in VeterinaryScience,33:360-365.
Geotsch, A.L, Merkel, R.C. and Gipson, T.A. (2011). Factors affecting goat meat production and quality. Small ruminant research, 101 (1-3): 173-181. Government of Kenya. (1976). The Cattle Cleansing Act (Cap 358). Legal Notice No.25. The Government of Printer, Nairobi, Kenya.

198
Government of Kenya. (1997). National Development Plan, 1997-2001, Government printer, Nairobi. pp. 254. Government of Kenya. (2006). Machakos County Annual report for (2006). Government of Kenya. (2009). Ministry of Livestock Website. Veterinary Department Report posted on the website on 13th August 2009. Grootenhuis, J.G., Leitch, B.L., Stagg, D.A., Dolan, T.T. and Young, A.S. (1987). Experimental induction of Theileria parva lawrencei carrier state in the African buffalo (Synancerus caffer). Parasitology, 94: 424-432. Homewood, K., Trench, P., Randall, S., Lynen, G. and Bishop, B. (2006). Livestock health and socio-economic impact of a veterinary intervention in Masaai land: infection and treatment method vaccine against East Coast fever: Agricultural Systems, 89: 248-271. Hosmer, D.W. and Lemeshow, S. (1989). Applied Logistic Regression, John Wiley and Son, USA, p 307. Howden, D. (2009).The great drought in East Africa: No rainfall for 3 years. Infinite Unknown website. (http//www.infinite unknown.net/2008/10/03 the_
great_drought_in_east_africa_no_rainfall_for_three_years). Environmental global news posted on 3rd October 2009.
Huho, J.M., Ngaira, J.K.W.and Oginda. H. (2011). Living with drought: the case of the Masaai pastoralists of northern Kenya. Educational Research, 2 (1): 779-789. ILRAD. (1984). Annual report. International Laboratory for Research on Animal Diseases, Nairobi, Kenya. ILRI. (2010). Livestock vaccine offers lifeline to many. ILRI news, May 2010. www.ilri.org/ilrinews/indexphp/archives/tag/galmed. ILRI. (2011). Livestock contribution to the GDP of Kenya and Ethiopia. ILRI news, November, 2011. www.ilri.org/ilrinews/. Accesed Nov. 2013. Irvin, A.D., Ocama, J.G.R and Spooner, P.R. (1982). Cycle of bovine lymphoblastoid cells parasitized by Theileria parva. Research in Veterinary Science, 33: 289-304. Irvin, A.D and Mwamachi, D.M. 1983. Clinical and diagnositic features of East
Coast fever (Theileria parva) infection in cattle. Veterinary Record, 113: 192-198.

199
Irvin, A.D., Chumo, R.S.C., Dobbelaere, D.A.E., Mwamachi, D.M., Minami, T., Spooner, P.R. and Ocama, J.G.R. (1983). Immunization against East Coast fever: correlation between monoclonal antibody profiles of Theileria parva stocks and cross immunity in vivo. Research in Veterinary Science, 35: 341-346. James, A.R. (1999). Mechanistic bases for adverse vaccine reactions and vaccine failures. Advances in Veterinary Medicine, 41: 681-700. Jaetzold R and Schmidt H. (1983). Farm management handbook of Kenya, Volume II.
Natural conditions and farm management information, Part A, West Kenya, Nyanza and Western Province. Kenya Ministry of Agriculture and the German AgriculturalTeam (OAT) of the German Agency for Technical Cooperation (GTZ), Nairobi,Kenya. 397 pp.
Julla, I.I. (1985).Theileriosis in Southern Sudan. In: Theileriosis in Africa: Proceedings of a joint workshop, Nairobi, 1-5 October, 1984. A.D. Irvin (Ed), International Laboratory for Research on Animal Diseases, Nairobi, pp 19-21. KARI. (1994). National Agricultural Research Project II (NARPII), Kenya Agricultural Research Institute (KARI), Nairobi, Kenya. KARI. (2012). Kenya Agricultural Research Institute website. www.kari.org. Accessed September 2012. Karanja, A. M. (2002). The dairy industry in Kenya: The post liberation agenda. Paper presented at the stakeholders’ workshop in Nairobi, Kenya on August 27th 2002, pp 60. Karimi, S.K., McDermott, J.J., Gitau, G.K., McDermott, B., Gathuma. J.M. and Kinuthia, R.N. (2002). Prevalence of ticks and their effects on the growth rate of calves in Masaai pastoral systems, KARI publications website. www. kari.org/filesadmin/publications. Accessed Sept 2012, Kaiser, M, N., Sutherst, R.W., Bourne, S.A., Gorrison, L. and Floyd, R.B. (1988).
Population dynamics of ticks on Ankole cattle in five ecological zones in Burundi and strategies for their control, Preventive Veterinary Medicine, 6: 199-222. Kang’ethe, P and Thorpe, W. (1992). Genotype and production level interactions for reproductive performance of crosses between Ayrshire, Brown Swiss and Sahiwal cattle in the lowland tropics. In: Proceedings of the Scientific Conference of the Kenya Agricultural Research Institute, 1992, Kenya.

200
Kariuki, D.P. (1990). Current status of theileriosis in Kenya. In: A.S. Young, J.J. Mutugi and A.C Maritim (Eds). Progress towards the control of East Coast fever (Theileriosis) in Kenya. Kenya Agricultural Research Institute, Nairobi, Kenya pp 17- 26. Katende, J.M. (1994). Protocols for the antibody and or/ antigen detection ELISA for Theileria parva, Theileria mutans, Babesia bigemina and Anaplasma marginale, ILRI, Kenya. pp 27 Katende, J.M., Morzaria, S.P., Toye, P., Skilton, R.A., Nene, V., Nkonge, C. and Musoke, A.J. (1998). An enzyme- linked immunosorbent assay for detection of Theileria parva anti bodies in cattle using a recombinant polymorphic immunodominant molecule. Parasitology Research, 84: 408-416. Keating, M.I. (1983).Tick control by chemical ixodicides in Kenya: A review, 1912 to 1981. Tropical Animal Health and Production, 15: 1-6. Kiltz, H.H. (1985). Theileriosis in Burundi. In Irvin, A.D (Ed). Immunization against Theileriosis in Africa. Proceedings of a joint workshop, 1-5 October, 1984 International Laboratory for Research on Animals Diseases, Nairobi, pp 12-15 Kinuthia, N.R. (2001). Climate and forecast information: the status, needs and expectations among smallholder agro-pastoralists in Machakos County, Kenya. International Research Institute for Climate and Society Technical Report. Kiriro, P.M.M. (1986). Estimate of genetic and phenotypic parameters for Dorper, Red Masaai and their crosses in Naivasha (Ol Magogo, Kenya). Msc. Thesis Texas University, Texas, USA Kirsopp-Reed, K. (1994). Rapid Rural Appraisal notes (RRA). (1994). Issue 20 pp 11-36 IIED London. Kitching, R.P. and Hughes, G.J. (2002). Clinical variation in Foot and Mouth Disease: Sheep and goats. Revue Scientifique et Technique, 21(3): 505-512. Kivaria, F.M., Heuer, C., Jongejan, F., Okello-Onen, J., Rutagwenda, T., Unger, and Boehle, W. (2004). Endemic stability for Theileria parva infections in Ankole calves of the Ankole ranching scheme, Uganda. Onderstepoort Journal of Veterinary Research, 71,189-195. KNBS (Kenya National Burea of Statistics): The Kenya population census and housing for 2009, Vol II. Kenya National Bureau of Statistics, Ministry of State for Planning, National Development and Vision 2030, Government of Kenya; 2010.

201
Kreier, J.P., Ristic, M. (1963). Anaplasmosis. XII. The growth and survival in deer and sheep of the parasites in the blood of calves infected with Oregon strain of Anaplasma marginale. American Journal of Veterinary Research, 24: 697-702. Kumar, K. (1993). Rapid appraisal methods: World Bank Regional and Sectorial Studies. Larson, J. (2007). Why wean early? The University of Minnesota Extension Beef Centre. The Cattle Web Site (TheCattleSite.com). Accessed January 2013 Latif, A.A., Rowlands, G.J., Punyua, D.K., Hassan, S.M. and Capstick, P.B. (1994). An Epidemiological study of tick-borne diseases and their effects on productivity of zebu cattle under traditional management on Rusinga island, western Kenya. Preventive Veterinary Medicine, 22: 168-181. Lawrence, J.A, De Vos, A.J and Irvin. A.D. (1994). Theileriosis. In: J.A.W.Coetzer, N.P.J.Kriek, G.R. Thompson and R.C. Tustin (Eds), Infectious diseases of livestock with special reference to Southern Africa. Oxford University Press, Cape Town, Republic of South Africa. Lawrence J.A., Perry B D. and Williamson, S. M. (2004). East Coast fever. In: Coetzer J. A. W and Tustin R C (editors). Infectious diseases of livestock. Volume I Oxford University Press Southern Africa, Cape Town, pp 448-467. Little, P.D., Smith, K., Cellarius, B.S., Coppock, D.L. and Barnett, C.B. (2001). Avoiding Disaster: Diversification and risk management among East African Herders. Development and Change, 32: 401-433. Lughano, K. and Kambarage, D. (1996). Diseases of small ruminants: A handbook. Edited by Vet Aid. Magona, J.W., Walubengo, J., Olaho-Mukani, W., Johnsson, N.N., Welburn, S.C. and Eisler, M.C.( 2008). Clinical signs associated with seroconversion to Anaplasma marginale, Babesia bigemina and Theileria parva in African cattle under natural challenge. Veterinary Parasitology, 55: 273-280. Maichomo, M.A. (2008). Comparative productivity and performance of Orma/ Zebu Cross Breed Cattle under Trypanosomosis, Tick-Borne Diseases, Anaplasmosis and Helminthosis Challenge in Kajiado County, Kenya. PhD Thesis. University of Nairobi, Kenya. Malmquist, W.A., Nyindo, M.B.A and Brown, C.G.D. (1970). East Coast fever: cultivation in vitro of bovine spleen cell lines infected and transformed by Theileria parva. Tropical Animal Health and Production, 2: 139-145.

202
Maloo, S.H. (1993). Epidemiological study of vector borne diseases with consequent development of preventive veterinary programmes for smallholder dairy farms in coastal Kenya. PhD. Thesis, University of Glasgow, UK. Maloo, S.H., Thorpe, W., Ngumi, P.N. and Perry, B.D. (1994). Systemic epidemiological studies to identify and resolve health constraints to the small holder dairy production in the Coastal lowlands. In: Proceedings of the 7th ISVEE. Symposium 15th -19th Aug 1994, Nairobi, Kenya. Kenya Veterinarian, 18 (2): 359-361. Maloo, S.H., Thorpe, W., Kioo, G., Ngumi, P.N., Rowlands. G.J. and Perry, B.D. (2001a).Sero-prevalence of vector-transmitted infections of smallholder dairy cattle in coastal Kenya. Preventive Veterinary Medicine, 52: 1-16. Maloo, S.H., Ngumi, P., Mbogo, S., Williamson, S., Thorpe, W., Rowland, G.J. and Perry, B.D. (2001b). Identification of a target population for immunization against East Coast fever in Coastal Kenya. Preventive Veterinary Medicine, 52 (1): 31-41. Maloo, S.H., Rowland, G.J., Thorpe, W., Gettinby, G. and Perry, B.D. (2001c). A longitudinal study of disease incidence and case fatality on smallholder dairy farms in coastal Kenya. Preventive Veterinary Medicine, 52: 17-29. Markov, A.A.and Abramov, I.V. (1957). Peculiarities of circulation of Babesia ovis (Babes, 1892) in the tick Rhipicephalus bursa Can.et Fanz. 1877. Veterinariya Moscow, 34: 27-30. Martin, S.W., Meek, A.H. and Willeberg, P. (1987). Veterinary Epidemiology Principles and Methods. Iowa State University Press, Ames, Iowa, USA. Mattioli, R.C. and Cassama, M. (1995). Comparison of the characteristics of the life cycle in female ticks collected on N’dama and Zebu cattle. Tropical Animal Health and Production, 27: 150-154. Mbogoh, S.G. (1984). Dairy development and internal marketing in Sub- Saharan Africa: Performance and policies and options. LPU Working paper No.5. International Livestock Centre for Africa. Addis Ababa, Ethiopia. Mbogo, S.K., Kariuki, D.P., Ngumi, P.N., Rumberia, R.M., Linyoyi, A., Wanjohi, J.M. and Lesan, A.C. (1994). Immunization of smallholder cattle against East Coast fever in Kiambu County, Kenya. East African Agricultural and Forestry Journal, 60 (1): 41-44.

203
Mbogo, S.K. and Kariuki, D.P. 1995. Immunization of cattle against East Coast Fever using Theileria parva parasite stocks of low pathogenicity. Tick-borne Pathogens at the host-vector interface: A global perspective. Vol 1. Proceedings of the 2nd International Conference on Tick-borne Pathogens, 28 Aug - 1 Sep 1995, Kruger National Park (South Africa), Coons, L. Rothschild, M. (Eds.). Mbogo, S.K., Kariuki, D.P., Ngumi, P.N. and McHardy, N. 1996. A mild Theileria parva strain with potential for immunization against East Coast fever. Veterinary Parasitology, 6: 41-47.
Mbogo, S. K., Rumberia, R. M., Kariuki, D. P., Muraguri, G. R., Wanjohi, Wesonga, Ngeranwa, J. J. N. and Ndungu S. G.(1999). Immunization against East Coast fever in Kenya. Proceedings of the conference towards increased use of demand driven technology end of project conference, KARI Headquarters 23rd to 26th March 1999, pp 251- 252. Edited by J.A. Sunderland. Mbugua, D.M., Njue, E.K and Mogaka, L.M. (1994). Survey report on livestock feeds, feeding and management practices in South Western Kenya. In: KARI Bi-annual conference, 1994, Nairobi, Kenya . Mburu, J.W. (1989). Achievements, difficulties and future prospects in small scale dairy production in East Africa. In: proceedings of the 6th Conference of the Institute of Tropical Veterinary Medicine, 28th August to 1st September 1989, Wagenigen, the Netherlands. 61-65. McCabe, T.J. (2009). Food and Turkana in Kenya. In cultural survival. Cambridge, New York. McCauley, E.H., Taye, A. and Majid, A.A. (1983). Owner schistosomiasis in Sudanese Cattle. Tropical Animal Health Production, 15: 277-233*. McHardy, N., Haigh, A.J and Dolan, T.T. (1976) Chemotherapy of Theileria parva infection. Nature, 261: 698-699. McHardy, N. and Morgan, D.W.T. (1985). Treatment of Theileria annulata infection in calves with parvaquone. Research in Veterinary Science, 34: 1-4. McLeod, A. (1997). Financial and economic analysis of East Coast fever immunization and treatment. A report prepared for the Kenya Agricultural Research Institute and ODA.16 pp. McKeever, D.J. (2007). Live immunization against T. parva containing or spreading the disease. Trends Parasitology, 23 (12-3): 565-568. McKeever, D.J. (2009). Bovine immunity- a driver for diversity in Theileria parasites. Trends Parasitology, 25: 269-276.

204
Mehlhorn, H.Schein, E. and Warneke, M. (1978). Electron microscopic studies on the development of kinetes of Theileria parva in the gut of the vector tick Rhipicephalus appendiculatus. Acta Tropica, 35: 123-136. Mendes, M.C., Lima, C.K.P., Nogueira, A.H.C., Yoshihara, E., Chiebao, D.P., Gabriel, F.H.L,Ueno,T.E.H., Namindome, A. and Klajke, G.M. (2011). Resistance to cypermethrin, deltamethrin and chlorpyriphos in populations of Rhipicephalus
(Boophilus) microplus (Acari: Ixodidae) from small farms of the state of São Paulo, Brazil. Veterinary Parasitology, 173: 383-388. Miller, P. (2010). The economic importance of culling open cows. The cattle management Blog. Minami, T., Spooner, P.R., Irvin, A.D., Ocama, J.G.R., Dobbelaere, D.A.E. and Fujinaga, T. (1983). Characterization of stocks of Theileria parva by monoclonal antibody \ profiles. Research in veterinary Science, 35: 334-340. Minjauw, B., Rushton, J., James, A.D. and Upton, M. (1999). Financial analysis of East Coast fever control strategies in traditionally managed Sanga cattle in Central Province of Zambia. Preventive Veterinary Medicine, 38: 35-45. Minjauw, R. and McLeod. A. (2003). Tick-borne diseases and poverty. The impact of tick-borne diseases and on the livelihood of small scale and marginal livestock keepers in India and eastern and southern Africa. Research Report DFID Animal Health Programme. Centre for Tropical Veterinary Medicine, University of Edinburgh, UK, pp 124. Meat and Livestock Australia. (2011). Implications of early weaning. Marketing and, research and development services company Australia (Website www.Mla.com.au). Accessed November 2011 Moll, G., Lohding, A., Young, A.S. and Leitch, B.L. (1986). Epidemiology of Theileriosis in calves in an endemic area of Kenya. Veterinary Parasitology,19: 255-273. Morrison, W.I., Goddeeris, B.M., Brown, W.C., Baldwin, C.L. and Teale, A.J. (1989). Theileria parva in cattle: Characterization of infected lymphocytes and the immune response they evoke. Veterinary Immunology and Immunopathology, 20: 213-217. Morrison, WI., Taracha, E.I.N. and McKeever, D.J. (1995). Contribution of T cell responses to immunity and pathogenesis in infections with Theileria parva. Parasitology Today, 1: 14-18.

205
Morzaria, S.P., Irvin, A.D., Wathanga, J., D’Souza, D., Katende, J., Young, A. S., Scott, J.and Gettinby, G. (1988). The effect of East Coast fever immunization and different acaricidal treatments on the productivity of beef cattle. Veterinary record, 123: 313-320. Morzaria, S.P., Katende, J., Musoke, A., Nene, R., Skilton, R. and Bishop, R. (1999). Development of sero-diagnostic and molecular tools for the control of important tick-borne pathogens of cattle in Africa. Parassitologia, 41: 73-80. Morzaria, S., Nene, V., Bishop, R. and Musoke, A. (2000). Vaccines against Theileria parva, Annals of New York Academy of Sciences, pp 464-473. Mtenga, L. A., Ndemanisho, E. E. and Sarwatt, S. V. (1986). System of small ruminant production in Tanzania. Proceedings of 4th Tanzania Veterinary Association Scientific Conference, 2-4 December 1986, Arusha, Tanzania, pp. 115-128. Mugambi, J.M., Wesonga, F.D. and Ndungu, S.G. (2012). Ticks and tick-borne diseases control in a pastoral and an agro-pastoral farming systems in Kenya. Livestock Research for Rural Development, 24 (05): Mukhebi, A.W and Gituna, A.M. (1985). Identification and ranking of production constraints in agro pastoral systems of Machakos County, Kenya. SR-CRSP, annual report, 1985. Mukhebi, A.W., Wathanga, J., Perry, .D., Irvin, A.D. and Morzaria, S.P. (1989). Financial analysis of East Coast fever control strategies on beef production under farm condition. Veterinary Records, 125: 456-459.
Mukhebi, A.W., Morzaria, S.P., Perry, B.D., Dolan, T.T. and Norval, R.A.I. (1990). Cost analysis of immunization against East Coast fever by the infection and treatment method. Preventive Veterinary Medicine, 9: 207-219.
Mukhebi, A.W., Kariuki, D.P., Mussukuya, E., Mullins, G., Ngumi, P., Thorpe, W. and Perry, B.D. (1995). Assessment of the economic impact of immunization against East Coast fever: a case study in Coast Province of Kenya. Veterinary Record, 137: 17-22. Muruguri, G.R. and Peeler, E. (1996). Ex-post impact assessment of the ITM technology for control of East Coast fever in Kenya Ex-post impact assessment of the ITM technology for control of East Coast fever in Kenya. http://www.ifad.org/lrkm/tans/13.htm

206
Muraguri, G.R., Mbogo, S.K., Mchardy, N. and Kariuki, D.P. (1998). Cost analysis of immunization against East Coast fever on smallholder dairy farms in Kenya. Preventive Veterinary Medicine, 34: 307-316. Muraguri R.G. (2000). Epidemiological and Financial Impact of Vector-Borne Diseases on Productivity of Small Holder Cattle in Coastal Lowlands of Kenya. PhD Thesis. University of Reading, England. Muraguri, R.G. Ngumi, P.N. and Wesonga, D, Wanjohi, J.M. and Ndungu, S.G.(2003). Up-scaling of ECF and heartwater immunisation and strategic tick control in the Nairobi-Meru milk corridor. NVRC Annual Report 2003 pp. 10. Muraguri, G.R., Mcleaod, A., McDermott, J.J. and Taylor, N. (2005). The incidence of calf morbidity and mortality due to vector- borne infections in smallholder farms in Kwale, County, Kenya. Veterinary Parasitology,130: 305-315. Muraguri, G.R., Ngumi, P.N., Wesonga, D., Nungu, S.G., Wanjohi, J.M., Bang, K., Fox, A.Dunnie, J. and McHardy, N. (2006). Clinical efficacy and plasma concentrations of two formulations of buparvaquone in cattle infected with East Coast fever (Theileria parva infection). Research in Veterinary Science, 81: 119-126. Musemia, L., Mushunje, A., Chimonyo, M.and Mapiye, C. (2006). Low cattle market off-take rates in commercial production systems of South Africa: cause and mitigation measure strategies. Journal of Sustainable Development in Africa, 12 (5): 209-225. Mutugi, J.J., Young, A.S., Linyonyi, A., Mining, S.K, Maritim, A. C, Ngumi P.N., Lesan, A.C., Stagg, D.A., Ndungu, S.G, and Leitch, B.L. (1989). In: Young, A.S, Mutugi, J.J., Maritim, A.C (Eds). Progress towards the control of East Coast Fever (Theileriosis) in Kenya. Proceedings of a workshop, 17- 18 July 1989. Kenya Agricultural Research Institute, Nairobi pp 40. Mwase, E.T., Pegram, R.G. and Mathers, T.N. (1990). New strategies for controlling ticks. In: C.F. Curtis (Eds). Appropriate technology in Vector Control. Boca Raton FL, USA. Pp 93-102. Mutugi, J.J., Young ,A.S., Maritim, A.C., Mining, S.K., Linyonyi, A., Ngumi P.N., Leitch, B.L., Morzaria, S.P. and Dolan, T.T. (1989). Immunization of cattle against theileriosis in Coast Province, Kenya: laboratory evaluation of a Theileria parva stabilate for use in infection and treatment immunization in the field. Research in Veterinary Science, 47: 170–179.
Mutugi, J.J., Ndungu S.G., Linyonyi A., Maritim A.C., Mining S.K., Ngumi P.N., Kariuki D.P., Leitch B.L., D’Souza D., Maloo S. and Lohr K.F. (1991). Response to a vaccine trial for East Coast fever in two cattle herds at the Kenya coast. Preventive Veterinary Medicine, 10: 173–183.

207
Ndua, M., Wanyangu, S., Kariuki, B., Odago, P. and Sumption, K. (1999). Assessment of the Impact of Infection and Treatment Method (ECFiM) on the Control of East Coast Fever in Kiambu County, Kenya’. Unpublished report, KARI. Ndungu, S.G., Brown, C.G.D. and Dolan, T.T. (2005). Some preliminary observations on the susceptibility and resistance of different cattle breeds to Theleria parva infection. Onderstepoort Journal of Veterinary Research, 72: 7-11.
Ngategize, P. K. (1989). Constraint identification and analysis in African small ruminant systems. In: Wilson R T and Azeb Melaku (Eds), African small ruminant research and development. Proceedings of a conference held at Bamenda, Cameroon, 18-25 January 1989. ILCA (International Livestock Centre for Africa), Addis Ababa, Ethiopia. pp. 7-22. Ngeranwa, J.J., Venter, E.H., Penzhorn, B.L., Soi, R.K., Mwanzia, J. and Nyongesa. (1998). Characterization of Anaplasma isolates from eland (Taurotragus oryx). Pathogenicity in cattle and sheep and DNA profiles analysis. Veterinary Parasitology, 31 74(2-4): 109-22. Newson, R.M and Punyua, D.K. (1978). The life-cycle of Rhipicephalus appendiculatus and related species in an ecologically marginal situation. In: Tick-borne disease and their vectors: Proceedings of an international Conference held in Edinburgh, 27 September to October 1976. J.K.H Wilde (Eds), Centre for Tropical Veterinary Medicine, University of Edinburgh, pp 51-55. Nginyi, J.M. (1999). An Epidemiological investigation of ruminant helminthoses in smallholder farms in Central Kenya. Phd Thesis, University of Glasgow, UK. Ngumi, P.N. Wesonga, F.D, Muraguri, R.G. Wanjohi, J. Nudge, S.G. (2005). Evaluation of inactivated Cowdria ruminantium vaccine to protect livestock against heartwater in different farming systems. National Veterinary Research Centre Annual Report 2005 pp. 6-8. Ngumi, P.N., Rumberia, R.M., Williamson, S.M., Sumption, K.J., Lesan, A.C. and Kariuki, D.P. (1997). Isolation of the causative agent of heartwater (Cowdria ruminantium) from three Amblyomma species in eight Countys of Kenya. The Veterinary Record, 140: 13-16. Neitz, W.O. (1953). Auromycin in Theileria parva infection. Nature, 171: 34-35. Nielsen, K., Smith, P., Gall, D., de Eshaide, S.T., Wagner, G and Dajer, A. (1996). Development and validation of an indirect enzyme immunoassay for detection of antibody to Anaplasma marginale in bovine sera. Preventive Veterinary Medicine, 67 (3-4): 133-142.

208
Njenga, M.J. and Mugera, G.M. (1989). Diagnosis of heartwater. A review. Bulletin of Animal Health and Production in Africa. (Special issue), 167-171. Njoka, J.T and Kinyua, P.I.D. (2006). Africa Journal of Range and Forage Science, 23 (2): 99-106*. Njombe A P. (1986). Small ruminant production in Tanzania. In: K O Adeniji and J. A Kalegile (editors), Proceedings of the Workshop on Improvement of Small Ruminants in Eastern and Southern Africa; Nairobi, Kenya. pp. 343-351. Njombe, A.P. (1993). Small ruminant production in Tanzania. Proceedings of the Tanzania Society of Animal Production. Vol. 20: 130-145. Norval, R.A.I., Sutherst, R.W., Jorgensen, O.G., Gibson, J.D. and Kerry, J.D. (1989). The effect of the bont tick (Amblyomma hebreum) on live weight gain of Africander steers. Veterinary Parasitology, 33: 329-314. Norval, R.A.I., Perry, B.D. and Young, A.S. (1992). The epidemiology of Theileriosis in Africa. Academic Press, London. Nwafor, C.U. (2004). Antihelmintic use for small ruminant production in The Gambia: a participatory and economic benefit-analysis. Livestock Research for Rural Development. 16: (9) Nwakor, F.N., Ifenkwe, G.E, Okoye, B.C., Onummdu, F.N., Anyaegbuman, H.N., Ekedo, T.O and Onyia, C.E. (2011). Socio-economic factors affecting adoption of improved cassava varieties among farmers in Abia state. Journal of Agriculture and Social Research, 11(1) Nyangito, H.O., Richardson, J.W., Mukhebi, A.W., Mundy, D.S., Zimmel, P., Namken, J. and Perry, B.D. (1994). Whole farm economic analysis of East Africa fever Impugnation in Kilifi County, Kenya. Preventive Veterinary Medicine, 21: 215-235. Nyangweso, P.M., Odhiambo, M.O., Odunga, P., Korir, M.K., Kipsat, M.J. and Serem, A.K. (2007). Household food security in Vihiga County, Kenya. Determinants of dietary diversity. African Crop Science Conference Proceedings Vol 8: pp 1383-1389. Ocaido, M., Siefert, L., Muwazi, R. and Opuda-Asibo. (2006). Tick populations and tick-borne diseases dynamics in a mixed game and livestock grazing areas around lake Mburo national park, Uganda. African Journal of Animal Biomedical Science, 1: 19-29.

209
Ocaido, M., Muwazi, R.T. and Asibo Opuda. (2008). Economic impact of tick borne-diseases on cattle production systems around lake Mburo national Park in South West Uganda. Tropical Animal health and Production, 41 No 5: 731-739. O’Callaghan, C, J. (1998). A study of the epidemiology of Theileriosis on Smallholder dairy farms in Kiambu County, Kenya. PhD Thesis. University of Guelph, Canada. O’Callaghan, C. J., Medley, G.H., Peter, T.F.and Perry, B.D.1998. Investigating the epidemiology of heartwater (Cowdria ruminantium infection) by means of transmission dynamics model. Parasitology, 117: 49-61. Ochanda, H., Young, A.S. and Graham, M. (2003). Survival of Theileria parva in its Nymphal tick vector Rhipicephallus appendiculatus under laboratory and quasi natural conditions. Parasitology, 126 (6): 571-576. Ochieng-Odhiambo, M. (1998). Liberalization, law and management of public land and forests in Kenya. In: Common Poverty Resource Management in East Africa, Ed.Gibson Clark, Banana Abwoli and Ntarambirweki J. Proceedings of the regional Symposium on Common Property Resource Management in East Africa held in Kampala, March 26-28 1996 under the auspices of Makerere Institute of Social Research (MISR) sponsored by the Ford foundation of United Nations. Pp 1-27. Odima, P.A., McDermott, J.J. and Mutiga, E.R. (1994). Reproductive performance of dairy cows on smallholder farms in Kiambu County, Kenya. Design, Methodology and Development Constraints. In: Proceedings of the 7th Iinternational Symposium on Veterinary Epidemiology and Economic 15th to19th August 1994, The Kenya Veterinarian, 18: 366-368. Ole- Moi Yoi. (1989). Theleria parva. An intracellular protozoan parasite that induces lymphocyte transmission. Experimental Parasitology, 69: 204-210. Olson, S.H. and Patz, J.A. (2010). Global environment change and tick-borne disease incidence. In: Proceedings of the workshop on critical needs and gaps in understanding prevention, Amelioration and resolution of lyme and other tick-borne diseases. The short and long-term outcomes. Washington, D.C. October 11-12, 2010. Omiti, J., Otieno, D., McCullough, E. and Nyanambu, T. (2007). Strategies to promote market oriented smallholder Agriculture in developing countries: A case study in Kenya. Proceedings of the American Association for Agricultural Education (AAAE) Ghana Conference 2007, pp 259-264. Omore, A.O., McDermott, J.J. and Carles, A.D. (1994). Comparison of productivity of cattle grazing systems in smallholder dairy farms in Kiambu County. The Kenya Veterinarian, 18 ( 2): 121-123.

210
Omore, A.O. (1997). Epidemiology of and economics of mastitis in the smallholder dairy sector of Kiambu County, Kenya. Ph.D. Thesis. University of Nairobi, Kenya. Okuthe, O S. Macleod, A. Otte, J.M. and Buyu.G.E. (2003). Use of rapid rural appraisal and cross-sectional studies in the assessment of constraints in smallholder cattle production systems in western Kenya highlands. Onderstepoort Journal of Veterinary Research, 70: 237-242. Okuthe, O S and Buyu G.E. (2006). Prevalence and incidence of tick borne diseases in smallholder farming systems in Western Kenya highlands. Veterinary Parasitology, 141(Issue 3-4): 307-312. Onchoke, D.G. (1993). Assessing alternative strategy options for the delivery of tick- borne disease control: a case study of East Coast fever delivery of tick-borne disease control in Uasin Gishu County, Kenya. Msc. Thesis. University of Nairobi, Kenya. Ørskov, E.R and Viglizzo, E.F. (1994). The role of animals in spreading pastoralists risks: a new paradigm for science outlook on agriculture. Agriculture,23,81-89. Oura, C.A. (2004). The persistence of component Theileria parva stocks in cattle immunized with the Muguga cocktail live vaccine against ECF in Uganda. Parasitology,129: 27-42. Oura, C.A. (2007).Theileria parva live vaccination: parasite transmission, persistence and heterologous challenge in the field. Parasitology, 134: 1205–1213. Peeler, E.J and Omore, A.O. (1997). Manual of Livestock Production System in Kenya. 2nd edition. Peeler, E.J and Wanyangu, W. (1998). Infectious causes of small ruminant mortality in Kenya. A review. Journal of Small ruminant Research Vol 29, Issue 1: page 1-11. Pegram, R.G., James, A.D., Ooterwijk, G.P.M., Killorn, K.J., Lemche, J., Ghirotti, M., Tekle, Z., Chizyuka, H.J.B., Mwase, E.T. and Chizyuka, F. (1991). Studies on the economics of ticks in Zambia. Experimental and Applied Acarology, 12: 9-26. Pegram, R.G., James, A.D., Bamhare, C., Dolan, T.T., Hove, T. and Kanhai, G.K. (1993). Effect of immunization against Theleria parva on beef cattle productivity and economics of control options. Tropical Animal Health and Production, 28: 99-111.

211
Perry, B.D., Deem, S.L., Medley, G.F., Morzaria, S.P. and Young, A.S. (1992). The ecology of Theileria parva infections of cattle and development of endemic stability In: Munderloh, U.G. and Kurtti, T.J. (Eds). Host vector interphase, An agenda for research. Proceedings of the first international conference on tick-borne pathogens. University of Minnesota College of Agriculture, Department of Entomology and Minessota Extension Service. Sain Paul Minnesota, USA. Perry, B.D. (1994). Modeling vector-borne disease. Epidemiology and the impact of control programs, in modeling vector-borne and other parasitic diseases, edited by B.D. Perry & J.W. Hansen. Proceedings of a Workshop organized by ILRAD in Collaboration with FAO, ILRAD, Nairobi, Kenya, 23-27 November 1992. Nairobi: ILRI. Perry, B. and Young, A.S. (1995). The past and future role of epidemiology and economics in the control of tick-borne diseases of livestock in Africa: the case of theileriosis. Preventive Veterinary Medicine, 25: 107-120. Peter, T.F., Burridge, M.J. and Mahan, S.M. (2002). Ehrlichia Ruminantium infection (heartwater) in wild animals. Trend Parasitology, 18: 214-218. Phiri, B.J., Benschop, J. and French, N.P. (2010). Systematic review of causes and factors associated with morbidity and mortality on smallholder dairy farms in Eastern and Southern Africa. Preventive Veterinary Medicine, 94 (1-2): 1-6. Purchase, H.S. (1945). A simple and rapid method of demonstrating Rickettsia ruminantium (Cowdry, 1925) in heartwater brains. The Veterinary Record, 36: 413-414. Purnell, R.E. (1984). Control of heartwater in Southern Africa using Terramycin/ LA. Preventive Veterinary Medicine, 2: 239-254. Purnell, R.E. and Schroder, J. (1984). Herd prophylaxis of tick-borne diseases in susceptible cattle in South Africa using Terramycin/ LA. Proceedings of the 13th World Congress on Diseases of Cattle, Durban, South Africa, 488-494. Putt, S.N.H, Shaw, A.P.M., Woods, A.J., Tyler, L. and James, A.D. (1987). Veterinary epidemiology and economics in Africa. International Livestock Centre or Africa, Addis Ababa, 130 pp. Radley, D.E., Brown, C.G.D., Burridge, M.J., Cunningham, M.P., Kirimi.S.K., Purnell., R.E. and Young, AS. (1975). East Coast fever:1, Chemotherapeutic immunization of calves against Theileria parva Muguga and five theilerial strains. Veterinary Parasitology,1: 35-41.

212
Radley, D.E. (1978). ECF chemoprophylactic immunization of cattle using oxytetracylines and a combination of Theileria strains. Veterinary Parasitology ,1:1-60. Radley, D.E. (1981). Infection and treatment method of immunization against Theileriosis, In: Advances in the control of theileriosis, edited by A.D. Irvin, M.P Cunningham and A.S. Young. The Hague: Martinus Nijhoff: 227-237. Radostitis, O.M., Leslie, K.E. and Fetrow, J. (1994). Herd health: Food Animal Production, Second Edition, W.B. Saunders Company, pp 229-276. Rashid, A., Rasheed, K. and Akhtar, M. (2009). Factor influencing vaccine efficacy; a general review. Journal of Animal and Plant Science, 19: 22-25. Ristic, M. (1968). Anaplasmosis. In: D.Weinman and M. Ristic (Editors). Infectious diseases of man and animals, pp 473-542. Rubaire-Akiiki, C., Okello-Onen J., Nasinyama, G. W., Vaarst, M., Kabagambe, E. K., Mwayi, W., Musunga, D. and Wandukwa, W. (2004). The prevalence of serum antibodies to tick-borne infections in Mbale County, Uganda: The effect of Agro-ecological zone, grazing management and age of cattle. Journal of Insect Science, 4: 8-15. Rubaire-Akiiki, C., Okello-Onen J., Musunga, D, Vaarst, M., Kabagambe, E., Okello, D, Opolot, C., Bisagaya, A., Okori, C., Ongyera, S. and Mwayi, M.T. (2006). Effect of agro-ecological zone and grazing system on incidence of East Coast fever in calves in Mbale and Sironko Countys of Eastern Uganda. Preventive Veterinary Medicine, 75: 251-266. Rushton, J. (1996). Quantitative methods of economic assessment of smallholder crop-livestock farming systems. PhD thesis, University of Reading, UK. Schoenian, S. (2011). Sheep facts website. www.cals.ncsu.edu/an_sci/extension/animals Schoenian, S. (2012). Sheep 201. A beginner’s guide to raising sheep. Sheep 101.info/201/weaning.html Scole, G.A., Miller, G.A. and Foil, L.D.(2008). Comparison of the efficiency of biological transmission of Anaplasma marginale (Rickettsiales: Anaplasmataceae) by Dermacenter anderson Stiles (Acari: Ixodidae) with mechanical transmission by horse fly Jabanus fuscicostatus (Diptera: Muscidae). Journal of Medical Entomology, 45 (1): 109-114 Small Ruminant-CRSP. (1992). On farm research and technology for dual purpose goats. A manual prepared by the Small Ruminant Collaborative Research Support Program. Editors Semenye, P. and Hutch croft, T.

213
Small Ruminant-CRSP Project, Annual Report. (1995). Animal Health Management Through Biotechnology Research. Shavulimo, R. (1987). Control of endo- parasites in small ruminants-an overview. In: Proceedings of the sixth Kenya Veterinary Association/ Small ruminant CRSP Workshop.44-52. Sisson, S. and Grossman, J.D. (1975). The Anatomy of the Domestic Animals. Saunders, Philadelphia, P.A 972 pp. Souslby, E.J.L (1982). Helminths, Athropods and Protozoa of domesticated animals (Published by Bailerrie Tindall), 752-758. Staak, C. (1981). Summary of a discussion on tick-borne disease. In: J.E Huhn (Ed), Impact of Animal Disease Research and Control of Livestock Production in Africa. German Foundation for International Development, Berlin, 195 pp. Staal, S.J., Chege, L., Kenyanjui, M., Kimari, A., Lukuyu, B., Njubi, D., Owayi, M. Tanner, J., Thorpe., W. and Wambungu, M. (1997). Characterization of dairy system supplying the Nairobi market. KARI/ MOA/ ILRI Collaborative Research Project. Stotz, D. (1979). Small dairy development in the past, present and future in Kenya. PhD Thesis. Hohenhein Universit, Germany.
150.Sumption, K.J., Paxton, E.A. and Bell-Sakyi, L. (2003). Development of a polyclonal competitive enzyme- linked immunosorbent assay for detection of antibodies to Ehrlichia ruminantium Clin.Diagn.Lab.Immunol.10, 910-916.
Swai, E.S., French, N.P., Beauchamp, G., Fitzpatrick, J.I, Bryant, M.J., Kambarage, D and Ogden, N.H. (2005). A longitudinal study of seroconversion to tick-borne pathogens in smallholder dairy young stock in Tanzania. Veterinary Parasitology, 131: 129-137. Swai, E.S., Karimuribo, E.D., Rugaimukamu, E.A. and Kambarage, D.M. (2006). Factors affecting the distribution of questing ticks and the prevalence estimation of T. parva infection in the brown ear ticks in the Tanga region of Tanzania. Journal of Vector Ecology, 31: 224-228. Swai, E.S., Karimuribo, E.D., Kambarage, D.M., Moshy, W.E. (2009). A longitudinal study on morbidity and mortality in youngstock smallholder dairy cattle with special reference tick borne infections in Tanga region Tanzania. Veterinary Parasitology, 160: 34-42. Syrstad, O. (1988). Crossbreeding for increased milk production in the tropics. Norwegian Agricultural Society, 2: 179.

214
Trail, J.C.M. and Gregory, K.E. (1981). Comparative weight characteristision of the Boran and Sahiwal breeds of cattle for economic characters. Journal of animal science 52: 1286-1293. Tambi, N.E., Maina, O.W. and Maina, W.O. (1999). Manuals for Economic Impact Assessment of Rinderpest Control. ILRI series. Thornton, P.K and Odero, A.N. (1998). Compendium of ILRI research, impact and adoption, 1975-1998. ILRI impact assessment series 1. ILRI (International Livestock Research Institute) Nairobi, Kenya, pp 21-23. Thorpe, W., Chabari, F., Muinga, R., Mullings, G., Mureithi, J., Nyambaka, R. and Otieno, L. (1991). Smallholder agriculture in coastal lowland Kenya: a farming system survey in Kaloleni Division. Draft working document No.3 Mtwapa Kenya. Kenya Agricultural Research Institute and International Livestock Centre for Africa. Thorpe, W., Chabari, F., Maloo, S., Munga, R., Mukhebi, A., Mullins, G., Mureithi, J., Mussukuya, E., Nyambuka, R. Ole Make, M., Otieno, L., Perry, B., Rugema, E. and Wekesa, E. (1995). Smallholder dairy cattle production in coastal Kenya; Resource based assessment and constraint identification. In: Animal Production in developing countries. Proceedings of the meeting held 2-4 September 1991, Ashford, U.K. British Society for Animal Production, Penicuik, Scotland, U.K, pp 167-168. Totte, P., Blankaert, D., Marique, T., Kirkpatrick, C., van Vooren, J, P. and Werenne, J. (1993). Bovine and human endothelial cell growth on collagen microspheres and their infection with rickettsia Cowdria ruminantium: prospects for cells and vaccine production. Revue d Elevage et de Medecine Veterinaire des Pays Tropicaux, 46: 153-156. Tumusiime, M. (2007). Immune responses of selected Bos Taurus and Bos indicus Cattle following immunization against East Coast Fever (ECF) using the Infection and treatment method. Msc Thesis, Makerere University. Uganda. Twomlow, S. and Kizito, M. (2009). Socioeconomic and institutional factors influencing adoption of conservation farming by vulnerable households in Zimbabwe. Agricultural Systems, 101: (1) 20-29. Uasin Gishu. (2012). Uasin Gishu County Forum 2012. Website.www. uasingishu.co.ke Uilenberg, G. (1983). Heartwater (Cowdria ruminantium infection): current status. Advances in Veterinary Science and Comparative Medicine, 27: 427-480. Utech, K.B.W, Wharton, R.H and Kerr, J.D. (1978). Resistance to Boophilus microplus (Casterini) in different breeds of cattle. Australian Journal of Agricultural Research, 29: 885-895.

215
Van Vliet, A.H.M., Van Der Zeijst, B.A.M. Camus, E., Mahan, S.M., Martinez, D.and Jongejan, F. (1995). Use of a specific immunogenic region on the Cowdria ruminantium MAP1 protein in a serological assay. Journal of Clinical Microbiology, 33: 2405-2410. Veterinary Research Centre (VRC), Muguga Annual Report (2011). Report on East Coast fever immunization and commercialization unit at the Veterinary Research Centre Page 29-34. Young, A.S., Grootenhuius, J.G., Smith, K., Flowers, M.J., Dolan, T.T. and Brocklesby, D.W.1978. Structures associated with Theileria infection of eland erythrocytes. Annals of Tropical Medicine and Parasitology, 72: 413-453. Young, A.S., Leitch, B.L., Dolan, T.T. and Newson, R.M. (1981).The occurrence of Theleria parva carrier state in cattle from an East Coast fever endemic area of Kenya. In Irvin, A,D., Cunningham, M.P, and Young, A.S.(eds). Advances in the control of Theileriosis. Martinus Nijihoff Publishers. The Hague, pp 60-66. Young, A.S., Leitch, B.L., Dolan, T.T., Newson, R.M., Ngumi, P.N. and Omwoyo, P.L. (1983). Transmission of Theleria parva by a population of Rhipicephalus appendiculatus under simulated natural conditions. Parasitology, 86: 255-267. Young, A.S., Groocock, C.M. and Kariuki, D.P. (1988). Integrated control of ticks and tick- borne diseases of cattle in Africa. Parasitology, 96: 403-432. Young, A S., Mutugi, J J. and Maritim, A. C. (1989). Progress towards the control of East Coast fever (Theileriosis) in Kenya. Proceedings of the East Coast fever planning workshop held at the National Veterinary Research Centre, Muguga on the 17th and 18th July 1989. Waithaka, M., Wokabi. A., Nyangaga, J., Ouma, E., Tineke de Wolf., Biwott, J., Staal, S., Ojowi, M., Ogidi, R., Njarro, I. and Mudavadi, P. (2000). A Participatory Rapid Appraisal of Farming Systems in Western Kenya. Smallholder Dairy Project Collaborative Research Report of a PRA dairy and crop activities in Western Kenya. Wanjohi, J.M., Ngeranwa, J.N., Rumberia, R.M., Muraguri, G.R. and Mbogo, S.K. (2001). Immunization of cattle against East Coast fever using Theileria parva (Marikebuni) and relaxation of tick control in North Rift Kenya. Onderstepoort Journal of Veterinary Research, 68: 217-223. Wenyon, C.M. 1926. Protozooology, 2 vol. London: Baillere, Tindall and Cox. Wharton, R.H. 1976. Tick-borne livestock diseases and their vectors: 5. Acaricide resistance and alternative methods of tick control. World Animal Review, 20: 8-15.

216
Wesonga, F.D., Ndungu, S.G., Muraguri, G., Rumberia, J.J., Mbogo, S.G. and Kariuki, D.P. (2000). Strategic tick control following immunization of cattle against East Coast fever in the central Rift Valley Region of Kenya. Bulletin of Animal Health and Production in Africa, 48: 63-70. Wesonga, F.D., Orinda, G.O. and Ngae, G.N. (2006). Comparative tick counts on game, cattle and sheep on a working game ranch in Kenya. Tropical animal Health and Production, 38: 35-42. Wharton, R.H. (1976).Tick-borne livestock diseases and their vectors: Acaricide Resistance and alternative methods for tick control. World Animal Review, 20: 8-15. Williamson, S.M., Lesan, A.C. and Awich, J.R. (1990). Immunological and molecular tools for use in ECF immunization and assessment of other tick-borne diseases. In: A.S. Young, J.J. Mutugi and A.C. Maritim (Eds). Progress towards the Control of East Coast fever (Theleriosis) in Kenya. KARI, Nairobi, pp.17-26. Willadsen, P., Cobon, G., Hungerford, J. and Smith D. (1995). The role Vaccination in the current and future strategies for tick control. In: S.Rodrigues Camarillo and H.Fragoso Sanchez (Eds). Tercer Seminario Internacianol. Winrock International (1992). Assessment of Animal Agriculture in Sub-Sahara Africa. Winrock International (1992). Assesement of Animal Agriculture in Sub-Sahara Africa Wright, P.F., Nilsson., E.A.M., Vanrooij, M. and Lelenta Jeggo, M.H. (1993). Standardization and validation of enzyme linked immunosorbent assay techniques for the detection of antibody in infectious disease diagnosis. Revue Scientifique et Technique, 12: 435-450.

217
Appendix 4.1: Socio-economic questionnaire Section 1: Farm indentification 1) Name of farmer ………………………………………………………………… 2) Farm code ……………………………………………………………… 3) Location ………………………………………………………………… 4) Date of interview ………………………………………………………………… 5 Interviewer ………………………………………………………………… Section 2: Household characteristics and labour 6) How many people are there in the household? ……………………………………… 7).How many members of your family presently live on the farm………………………? 8) Other than farming, do you engage in other income generating activities ? 1) No 2) Yes 9) If yes, how many hours on average does he/ she work on the farm?....................hours per day. 10) In the absence of the farm owner, who is responsible for farm labour and management? 1) Wife 2) Son 3) Daughter 4) Employee 5) Other (specify)……………….. 11) Do you employ non-family members on the farm? 1) No 2) Yes 12. Which period of the year do you hire this labour? 1) Not applicable 2) All year round 3) Harvest season only 3) Other (specify) ………………………………………………………………… 13. How many people on average do you hire for labour during this period? None/ not applicable Number………………………………………………. 14. Which are the main crops that you grow and what area of the farm does each cover? 1)………………………………………Acres/Hectares…………………………… 2) …………………………………Acres/Hectares……………………………… 3) …………………………………Acres/Hectares……………………………….

218
4) ………………………………….Acres/Hectares………………………………. 5) ………………………………….Acres/Hectares………………………………. 15. For those crops that you normally grow, please estimate the fraction that is sold per year? Crop (1)………………….. Crop (2)………………….. Crop (3)………………….. Crop (4) …………………. Crop (5) 16. Do you rent any land for agriculture? If yes, how big is the land you rent? 1) No 2) Yes, ……………………………………………Acres 17. Which time of the year do you normally rent the land? 1) N/A, land not rented 2) All year round 3) Rainy season only 4) Dry season only 5) Other …………………………………………………… Section 2. Farm inputs. 18. Do you ever purchase fertilizer for farm use? (1) Yes (2) No 19. If yes, which crops do you apply it? 1) All crops 2) Cash crops only 3) Cattle forage 4) Other: Specify ……………………………………………………………… 20. Do you ever apply manure to your crops? (1) Yes (2) No 21. If yes, to which crops do you apply? 2) All crops 3) Cash crops only 4) Cattle forage 5) Other: Specify ………………………………………………………………… 22. If manure is ever applied, are there occasions that you buy it from other farms 23. How much do you normally buy per year?

219
24. State how much you spend on it. 25. Do you ever purchase forage from outside your farm? (1) Yes (2) No. 26. If Yes which forage is purchased---------------? 27. Which period of the year do you normally buy the forage?
1) N/A 2) All year round 3) Rainy season only 4) Dry season only 5) Other…………………………………………………………………
28. How much forage on average do you buy per year---------------? How much do you spend on it per year-------------------? 29. Do you feed concentrates to your cattle/sheep/goat? Cattle (1) Yes (2) No Sheep (1) Yes (2) No Goat (1) Yes (2) No 30. If yes, to which animals do you offer it? 1) N/A 2) All cows 3) Lactating cows, throughout lactation 4) Lactating cows, early lactation only 5) Dry cows only 6) Weaned heifers 7) Weaned bulls 8) Un-weaned calves 9) Other Specify (…………………………………)*indicate here if given to sheep or goats. 31. If yes, which concentrates do you normally offer? 1) Not offered 2) Specify ………………………………………………………… 32. How much feed concentrates do you give per animal per day? Specify ……………………………………………………Kg/day 33. When are the feed concentrates fed to cattle?
1) N/A 2) All year round

220
3) During the dry season only. 4) When cows have calved 5) Other …………………………………………………………………
34. What is the source of the concentrates you feed? 1) N/A 2) Purchased from local retailers 3) Home grown and mixed 4) Other ………………………………………………………………… 35. Do you offer your animals any nutritional supplements? If yes, which ones? 1) None 2) Molasses 3) Salt lick 4) Mineral and salt mix 5) Other (specify…………………………………………………………………) 36. If you feed nutritional supplements, to which animals do you feed them? 1) N/A 2) All cows 3) Lactating cows, throughout lactation 4) Lactating cows, early lactation. 5) Weaned heifers 6) Weaned bulls 7) Unweaned calves 8) Other specifies. (…………………)* indicate here if given to sheep or goats 37. When are the nutritional supplements fed to the cattle?
1) N/A 2) All year round 3) During the dry season only. 4) Other (………………………)*indicate here if given to sheep or goats
Section 3: Veterinary Practises 38. Do you normally deworm your cattle/ sheep/goats?
Cattle (1) Yes (2) No Sheep (1) Yes (2) No Goats (1) Yes (2) No
39. If yes, which animals do you normally deworm? 1) No deworming done. 2) All animals (cattle/sheep/goats) 3) Only adults (specify species………………….) 4) Only weaned animals (specify species……………..) 5) Only calves/lambs/kids (specify……………….)

221
6) Other ………………………………………………………………….. 40. If yes, what product (dewormer) did you use during the last deworming? ………………………………………………………………… 41. If yes, how often do you normally deworm? 1) Once a year (Specify for each species……………….) 2) Twice a year (Specify for each species……………….) 3) Three times a year (Specify for each species……………….) 4) Four times a year (Specify for each species……………….) 5) Other………………………………………………………………… 42. If yes, does your frequency of deworming vary between the adults and calves/lambs/kids? 1) Not differ 2) Differs, describe………………………………………………………………… 43. In the last 12 months, which vaccinations have been offered to your cattle? How much were you charged for it? Against which disease Cost per animal Vaccine 1 ---------------------------- ------------------------ Vaccine 2 ----------------------------- ------------------------ Vaccine 3 ----------------------------- ------------------------ 44. Which other veterinary practices have you carried out on your cattle in the last 12 months. Species Cost per Animal (1) Dehorning ------------ ------------------ (2) Caesarian ------------- ------------------ (3) Castration -------------- ------------------ (4) Artificial Insemination --------------- ------------------- (5) Other ---------------(specify) --------------- -------------------- 45. Section 4. Livestock commodity prices Are you a member of any co-operative dealing with livestock production activities
1) No 2) Yes, Name of Co-
operative………………………………………………………………… 46. How many cows are you milking presently? 1) None 2) Cows in milk………………………………………………………………… 47. Do you ever sell milk? If yes, how much on average do you sell per day 1) No milk sold 2) ……………………………………………litres/ bottles sold per day.

222
48. If you sell milk, to whom do you sell? 1) No milk sold (N/A) 2) Local Co-operative 3) Neighbours/ local consumers 4) Other ………………………………………………………………… 49. For how much are you currently selling the milk per Litre/Bottle (tick)………………? 50. Does the price of milk change at any period or season of the year? (1)Yes 2) No (If yes specify when------------------------) 51. If an animal dies on the farm, what do you normally do with the carcass? 1) Buried- no salvage value 2) Skinned and hide sold 3) Other (specify) ………………………………………………………………… 52. If the skin is sold, how much on average is it worthy according to the age of the animal? Calf………………………………………………………………… Weaned cattle……………………………………………………… Adult cattle………………………………………………………… Kid…………………………………………………………………. Weaned goat………………………………………………………… Adult goat…………………………………………………………... Lamb………………………………………………………………... Weaned sheep……………………………………………………….. Adult sheep…………………………………………………………. 53 Have you sold any animals in the last one year? (1) Yes (2) No 54. If yes, give animal species sold
(1) Cattle…………………… No. sold………………………….. (2) Sheep…………………… No sold…………………………... (3) Goat…………………… No sold………………………….....
55 Reasons for selling…………………………………………………
1) Pay school fees……………………………… 2) Daily needs………………………………….. 3) Others (specify)
56. Price range for each species………………………….. (1) Cattle…………………………………………. (2) Sheep………………………………………….
Goats…………………………………

223
Appendix 5.1: Cross-sectional survey questionnaire Section 1: Farm identification 1a Name of interviewer 1b contact address 2. Date 3. Division 4. Location 5. Sublocation 6.GPS reading South (S)
East (E) Altitude
Format S00.01217 Format E35.22283 Format 2489 m
7. Name of farmer 8. Sex of respondent Male □ Female □ 9. Relation of respondent to the household head Section 2 Farm characteristics and livestock production
10. Total acreage of farm------------------------------------ 11. Would you characterize your farming activities as? (1) Mainly livestock □ (2) Mixed livestock/crop □ (3) Mainly crop □ 12. For how long have you have been keeping cattle? --------------------years. (1) 1-5 years (2) 6-10 years (3) over 10 years 13. Which of the following livestock do you keep? How many do you have presently? Livestock Number (1) Cattle ------------- (2) Sheep` ------------- (3) Goats ------------- (4) Camels ------------- (5) Donkeys ------------- (6) Chicken ------------- (7) Pigs ------------- (8) Other (Specify_____________) -------------

224
14. For cattle, which of the following types do you keep? (1) Improved (exotic or crosses) dairy cattle only. (2) Only local (indigenous) cattle. (3) Both improved and indigenous (local zebu). 15. How do your cattle get access to forage (grazing system)? (1) Cut/purchased feeds transported to animals (zero grazing)-----specify source. (2) Free grazing on pasture (3) Combination of grazing and stall-feeding (Semi zero-grazing) 16. If your cattle are on pasture, do they ever graze off farm (away from farm)? 1) No 2) Sometimes 3) Always. Section 3: Animal Health 17. Which problems do you face when keeping animals? Rank the disease (1 Most important and 5 least important).
Cattle Sheep Goat 1)Disease 2)Lack of feeds and water 3)Poor type of cattle breeds 4)Lack of credit facilities 5)Other (specify----------)
18. Which are the most important diseases affecting your animals (in terms of economic loses)? Rank the diseases (1 Most important and 3 least important). Cattle Sheep Goat 19. Who normally treats your animals when they are sick? 1) The farmer or other family member 2) The local government veterinarian 3) The local animal health assistant 4) Private veterinarian 5) Community Animal Health Worker (CAHW) 6) Other (specify________________________)

225
20. In the last 12 months, did any of your cattle get ECF (Ngai)? 1) No 2) Yes 21. If yes, which age groups were affected and how many cases were encountered? 1) Calves (cases----------------------------) 2) Weaners (cases--------------------------) 3) Adults (cases----------------------------) 22. Which of the cases of ECF that occurred on your farm were treated? 1) None 2) All cases 3) Affected calves only 4) Affected weaners only 5) Affected adults only 6) Other (_________________) 23. Did you lose any animal from ECF (Ngai) in the last 12 months? 1) No 2) Yes (how many________________) 24. Approximately how much money do you have to spend per treatment of a case of ECF? _____________________________________________Ksh. 25. In the last 12 months, did any of your cattle get Anaplamosis (Ndigana)? 1) No 2) Yes 26. If yes, which age groups were affected and how many cases were encountered? 1) Calves (cases______________________) 2) Weaners (cases_____________________) 3) Adults (cases_______________________) 27. Which of the cases of anaplasmosis that occurred on your farm were treated? 1) None. 2) All cases 3) Affected calves only. 4) Affected weaners only 5) Affected adults only 6) Other (________________)

226
28. Did you lose any animal from anaplasmosis (Ndigana) in the last 12 months? 1) No 2) Yes (how many?____________) 29. Approximately how much do you have to spend per treatment of a case of anaplasmosis? _________________________________Ksh. 30 In the last 12 months, did any of your cattle get Babesiosis? 31. If yes, which age groups were affected and how many cases were encountered? 1) Calves (cases__________________) 2) Weaners (cases ____________________) 3) Adults (cases______________________) 32. Which cases of babesios that occurred on your farm were treated? 1) All cases 2) Affected calves only. 3) Affected weaners only 4) Affected adults only 5) Other (________________) 33. Did you lose any animal from Babesiosis in the last 12 months? 1) No 2) Yes (how many____________) 34. Approximately how much do you have to spend per treatment of a case of Babesiosis? _________________________________Ksh. 35. In the last 12 months, did any of your cattle/ sheep/ goats get heartwater? 1) No 2) Yes (how many?____________) 36. If yes, which age groups were affected and how many cases were encountered? 1) Calves/Lambs/Kids (cases__________________) 2) Weaners (cases ____________________) 3) Adults (cases______________________) 37. Did you lose any animal from heartwater in the last 12 months?

227
1) No 2) Yes (how many____________) 38.. Approximately how much money do you have to spend per treatment of a case heatwater? _____________________________________________Ksh. Section 4: Tick Control 38. Do you control ticks on your farm? 1) No 2) Yes 39. If yes, which method do you use? 1) Dipping, private dip 2) Dipping, communal dip 3 Hand spraying 4) Spray race 5) Hand dressing 6) Other (specify________________) 40. If yes, in which livestock do you regularly control (once or twice a month? 1) Cattle 2) Sheep/ Goats 3) Donkeys 4) Camels 5) Other: specify________________________ 41. If yes for cattle, which types (breed) of cattle do you normally treat? 1) All animals 2) Grade only 3) Local breeds only 4) Other: specify____________ 42. At what age do you start tick control on calves/lamb/kids?
Frequency of tick control calves lambs kids 1) Below two weeks 2) Two weeks to 1 month 3) Over1 month 4) Other (specify________)
43. How often do you normally control for ticks for each species (cattle/sheep/goat)
Frequency of tick control calves lambs kids 1) Twice a week 2) Once a week

228
3) Once per two weeks 4) Once every 3 weeks 5) Once a month 6) Other ( specify--------)
44. Are there times that you change this frequency? 1) No 2) Yes 45. If yes, what time of the year do you control ticks? 1) Wet season 2) Dry season 3) Other: specify_________________ 46. If yes, what is the reason for changing frequency? 1) Cannot afford all the time. 2) Unavailability at times 3) No tick problems 4) Other: specify_____________________ 47. Which chemicals do you use for tick control? 1) Triatix 2) Almatix 3) Tikfix 4) Supadip 5) Other: Specify___________ 48. Do you ever change the acaricides at times? 1) No. 2) Yes 49. If you have ever changed acaricides, what were the reasons for changing? (____________________________________)
Section 5: Constraints to livestock production.
49. Ask the farmer about factors that he/she feels are constraints to current livestock production. Read the list of constraints at least twice, then ask respondent if there are others he or she would wish to add. Score the following constraints to live stock production from 5 to 0 (5=very important, 0=completely unimportant). Constraints not listed can be added. Elaboration of the constraints will be noted in the “probing check list”. The responses to the probing should be recorded on a separate sheet of paper attached to the questionnaire.

229
Constraints Cattle Sheep Goats Probing check list Disease Specify the diseases Feed (i)What time of the year is when feed is unavailable
(ii) Quality of feed and sources. Water (i) Sources and reliability of the supply.
(ii) Quality. Low genetic potential (i) Time taken to weaning
(ii) Age at weaning weights (iii) Breeding practices A.I or bull? (iv) Selection qualities
Poor fertility (i) Heat detection-method used (ii) Effect of availability of feed. (iii) In breeding (iv) Tracking of sires if natural mated (v) In breeding
Marketing of livestock and livestock products
(i) Availability of market (ii) Long distance to market (iii) Low prices (iv) Unreliable customers (v) Constraints in the marketing of meat, milk hides and skins and honey.
Lack of access to livestock services(including vet services)
(i) What kind of services are available (ii)If not available why? Distance? Terrain? Cost?
Finance (i) Sources (ii) How accessible are the finances (iii) Guarantees/ security on borrowing
51. Interest in vaccination. If you could obtain a vaccine against any disease of cattle, which disease would you want to vaccinate your cattle against? ______________________________________________________________________________

230
Appendix 5.2: Cross sectional survey: Individual animal data sheet
Name of farmer Farm code Sub-location
District Division Recorder
Date of visit Location
Animal ID Age1
Calf =1 Yearling=2 Adult=3
Sex Female=1 Male=2
Breed, Bos Taurus=1 Bos indicus=2 Mixed=3
Weight (Kg)
Temp (°c)
Body score Very poor=1 Fair=2 Good=3 Very good=4
Disease history ECF=1 Anap=2 Babesiosis=3 Heartwater=4
Tick infestation1 No ticks=0 Low=1 (<10) Moderate=2 (10-20) High=3(>20)
Serum blood taken (Tick)
Thin blood smear(tick)
Lymph node biopsy (tick)
1 Indicate the main tick species beside the tick infestation level.

231
Appendix 5.3: Disease Translation
Disease Local Name Direct translation Interpretation Anaplasmosis Kithatia/ Nthiana Kithatia refers to
hardened feaces often observed in the animals with anaplasmosis. Nthiana is generally used to refer to the disease by the community
Though this is not a pathognomic sign of the disease (hardened faeces), the field veterinary personnel who attended the interviews confirmed that in most instances cattle reported to have this as one of the key symptoms were often positive for anaplasmosis.
Anthrax Ndulu Something that kills very fast associated with oozing of blood from body orifices.
Translated directly to mean anthrax.
Babesiosis Kumaa Nthakame Kumaa Nthakame. Means to urinate blood.
Haematuria is one o f the key symptoms of the disease. The community derived the name of the disease from the symptom. Though mentioned, it was not ranked
Black quarter Ikene A swelling Swelling associated with disease areas such as upper parts of affected limbs, brisket and psoas muscle. Rapid onset and high mortality reported by the farmers.
Brucellosis Kuvuna Abortion Abortion, a symptom associated with the disease in late pregnancy. Infertility was reported to follow the abortion. Local veterinarians verified that sporadic cases do occur.
ECF Ngai Lymph node Term used in central Kenya and parts of eastern Kenya to refer to enlarged lymph nodes, one of the key signs of ECF. Normally the term directly refers to ECF.
Eye worm Kiinyu Kya Yiitho Worm of the eye The term refers to infection of the eye whereby the farmers describe a worm like organism in the eye.
Foot and Mouth Disease Muthingithu / Kuvu Muthingithu means wobbling movement/unsteady gait. Kuvu means rot between
The wobbling or unsteady gait is as result of the lameness caused by the vesicles on feet (in the cleft) and painful swelling of the coronet. Farmers were also able to describe other symptoms such lesions in the mouth and abundant

232
toes salivation. Outbreaks invariably confirmed by vet department whenever disease outbreak is suspected. Disease known for the quarantine measures put in place following confirmation
Heartwater Muthyuuku Move in circles (circling) Name associated with circling; one of the main symptoms of heartwater. Circumstantial evidence provided by description of excess “water” in the thorax and in a sac around the heart (Hydrothorax / hydropericardium)
Lumpy Skin Disease (LSD) Nthunthua wa Kikonde
Skin or hide lumps Multiple nodules on the skin, one of the key symptoms of LSD. Rapid spread described as a feature of the disease.
Mastitis Uwau wa Mikami or Uwau wa nondo
Disease of udder or teats Inflammation of the mammary gland irrespective of the cause.
Mites Mbanguule Translated directly to mean mites. Pneumonia Mavui Lungs Disease affecting lungs. Reported to be associated with
difficulty in breathing, coughing and most common during the cold months. Occurrence confirmed by local vet personnel
Rabies Mung’ethya Open mouth in readiness to bite or snarl
A symptom of rabies whereby infected animal bite objects. Farmers reported other key symptoms like aggressiveness. Disease is known to be endemic in the district.
Trypanosomiasis Uwau wa matungua (or Kisiko)
Disease caused by tsetse flies
Disease transmitted by tsetse flies.
Worms Minyoo Swahili word for helminths
Universally used word referring to helminth infection in livestock

233
Appendix 6.1: Longitudinal study monthly farm/animal monitoring form Section 1 Farm ID Name of farmer Farm code Location Date of visit Name of Enumerators Exits since last visit (cattle/sheep/goats removed from herd) (Specify the species___________________)
Animal No. Died (tick) Sold Slaughtered on farm (tick)
Given out/ transferred out (tick)
Date of exit
Entries since last visit (cattle added into the herd)
Age/category Sex Purchased Transfer into farm Other ,specify Date No. given C Y A C Y A C Y A C Y A
C=Calves, Y=Yearlings, A=Adults.

234
Entries since last visit (sheep/ goats added into the herd) Age/category Sex Purchased Transfer into
farm Other ,specify Date No. given
<6months 6months-1yr >1yr <6months 6months-1yr >1yr <6months 6months-1yr >1yr <6months 6months-1yr >1yr
Births since last visit (animals must be tagged, check last no. on list (specify the species)
No of female calved Date of calving/lambing Given tag No. Sex (male or female)
Diseases since last visit
Animal No. Diseases Date detected Treated? Y/N
Treated by Drugs administered Outcome died/recovered
Farm management practices since last visit (cattle)
Activity NO/YES Date(s) of activity Animals covered Brand (chem.)used Tick control C Y A Dewormings C Y A Other (_________) C Y A
C=Calves, Y=Yearlings, A=Adults.

235
Farm management practices since last visit (sheep/goats)
Activity NO/YES Date(s) of activity Animals covered Brand (chem.)used Tick control <6months 6months-1yr >1yr Dewormings <6months 6months-1yr >1yr Other (_______) <6months 6months-1yr >1yr
Cattle vaccination since last visit
VACCINATION No/Yes Date of Vacc Animals covered (tick Cost per animal (Sh)
FMD RINDERPEST Other (________)
C=Calves, Y=Yearlings, A=Adults. Section 2. For all cattle calving within the study period, administer this section every visit until the end of the study. Milk offtake Cow No. Date of calving if
after last visit Morning yield Kgs/bottle
Evening yield/Kgs/ bottle
Total yield per day Kgs/bottles

236
Section 3: For all calves/lambs/kids less than 1 year examine thoroughly and sample as follows Weight and samples
Animal no. Date of birth if borne after last visit
Weaned? Yes /No Weight (nearest 0.5kg)
Blood sample(tick when taken)
Tick challenge/species