Scultura barocca romana in Slesia. Un busto di Bernardino Fioriti nella cattedrale di Breslavia
Journal of Archaeological Science 34 (2007) 222e232http://www.elsevier.com/locate/jas
Assessment of fractures in some columns inside the crypt of theCattedrale di Otranto using integrated geophysical methods
Giovanni Leucci*, Rosella Cataldo, Giorgio De Nunzio
Department of Materials Science, University of Lecce, Via Arnesano, 73100 Lecce, Italy
Received 9 January 2006; received in revised form 13 April 2006; accepted 21 April 2006
Abstract
We investigate the problem of internal fracturing of the columns of a building of cultural importance (the Crypt of the ‘‘Cattedrale diOtranto’’, Apulia, Italy), using a multi-disciplinary approach, integrating different non-destructive techniques (Microclimatic and Geophysical).In fact historic buildings, over centuries, may accumulate a high concentration of water and/or moisture that increases significantly the deteri-oration rate, diminishing the mechanical resistance.
It is well known that the distribution of moisture within stone strongly depends on ambient conditions, i.e. temperature and relative humidity.No suitable environmental condition in the Crypt and the presence of wet buried structures in the ground involved in the process of deteriorationhave been indeed assessed in previous surveys.
Actually we perform a ground penetrating radar (GPR) investigation, in reflection mode, in order to reveal the existence of fractures insidethe columns, because of the important rising of water from pavement.
The reconstruction of the fracture distribution is fundamental to plan the safeguard and the restoration of the columns themselves and also thestability of the Crypt and of the uppermost Cathedral. Such survey was performed on seven columns using GPR technique. Moreover the elec-trical resistivity tomography (ERT) and GPR traveltime tomography (TT) methods were applied on the most damaged column.
The results obtained with these different methodologies are in good agreement, however, the 2D electrical resistivity tomography seems to beless resolutive than GPR. While the GPR traveltime tomography is more time expensive than GPR reflection mode method. The GPR method, inreflection mode, allows to reconstruct the main fractures inside the columns also in virtue of its penetration power.
We think that the joining of different methodologies permits to better understand the complex physical mechanisms in the phenomenon ofdeterioration of the cultural heritage, in order to achieve useful information for possible, future, restoration works.� 2006 Elsevier Ltd. All rights reserved.
Keywords: Deterioration of cultural heritage; Fractures; GPR and ERT survey; Microclimatic investigation
1. Introduction
In the last few decades, the deterioration of stone buildingshas particularly drawn the attention of scientists due to theneed for protection, especially in polluted environments.Numerous studies have shown the complexity of relationshipbetween different agents (biological, chemical and physical)
* Corresponding author. Tel.: þ39 832 297549; fax: þ39 832 297548.
E-mail address: [email protected] (G. Leucci).
0305-4403/$ - see front matter � 2006 Elsevier Ltd. All rights reserved.
doi:10.1016/j.jas.2006.04.012
of degradation, pointing out the issue of a necessary interac-tion among the various disciplines involved [1,3,4].
Some causes of the phenomenon of deterioration of thestone were studied with previous different, non-destructivebiological and physical researches [6,18] in the Crypt of the‘‘Cattedrale di Otranto’’ (Apulia, Italy) (Fig. 1). First of all,no suitable microclimatic conditions in the Crypt wereevidenced. Furthermore the presence was argued of buriedwet structures that could be involved in the process of deteri-oration, and then a localisation of some discontinuities wasperformed.

223G. Leucci et al. / Journal of Archaeological Science 34 (2007) 222e232
Fig. 1. Localisation of the Crypt of ‘‘Cattedrale di Otranto’’.
Following the results and the suggestions of the above re-searches, we conducted other geophysical investigations fordetecting and imaging fractures, voids, etc., in order to deter-mine their influence on the structure stability, as described bymany authors [2,25,15,12,5,7,22,17].
The methodologies adopted to estimate the integrity degreeof the columns were as follows:
� the back-scattered energy in GPR survey;� the electromagnetic (EM) wave velocity by GPR travel-
time tomography (TT);� the resistivity values from 2D electrical resistivity tomog-
raphy (ERT).
Comparing the results of geophysical survey to microcli-matic survey, we draw a more realistic scenario of the deteri-oration inside the Crypt.
This common approach produces a meaningful map of thecondition of the cultural heritage, making possible more effec-tive suggestions in order to obtain suitable conditions for theconservation of works of art.
2. The columns of the crypt of the‘‘Cattedrale di Otranto’’
The Crypt (Fig. 1) of the ‘‘Cattedrale di Otranto’’ is anhypogeum structure, founded in 1080, built in the middle ofXII century, partially rebuilt in 1481. It contains 42 columnswithin the interior, different for size of diameters; of variousmaterials such as polychromatic different marbles, graniteand breccias. These rocks do not outcrop in the Apulia region.When the Crypt was built, it was common to reemploymaterials coming from preceding structures, destroyed forcarelessness or for natural or war events.
The columns exhibit specific peculiarities; they arecrowned by capitals of historical and geographical differentorigin (from the Classical Age to the Romanesque one),with a discard in the date of their construction of about 10centuries.
Due to their different origin, epoch and material, they pres-ent different problems derived by the structural chemical andphysical origin and by the constructive and traumatic eventsthat characterised the Crypt.

224 G. Leucci et al. / Journal of Archaeological Science 34 (2007) 222e232
Scientific researches on the properties in the mechanismof deterioration of marble began in the late 18th centuryand it has still not been possible to model the behaviour ofmarble resulting from anisotropy of the mineral grains[1,9,23].
Marble has been formed under very high heat and pressure,and generally has an intense tectonicemetamorphic stresshistory. Pure marble is composed of either calcite or dolomiteor a combination of the two; some marble incorporate clay;this results in a considerable increase in water absorption,detected also in presence of micron sized microfractures [9].
Breccia is coarse grained clastic rock, composed of angularbroken rock fragments held together by a mineral cement, orin a fine-grained matrix. It differs from conglomerates forthe sharp edges of the fragments, may be the result ofprocesses such as talus accumulation (sedimentary breccia),igneous processes (explosive) (volcanic breccia), collapse ofrock material (solution or collapse breccia), tectonic processes(fault breccia).
Granite is a rock of magmatic origin, in nature it is presentweathered and broken, so the areas of rock free from all kindsof fracturing are not easily found. In minerals of granites thedecomposition is due to chemical alterations and/or to temper-ature fluctuation.
Every mineral shows a particular behaviour, depended onthe environmental temperature changes, because of the differ-ent thermal coefficient. The repetition of this phenomenoncauses the decomposition and the loosening of the tight fabricof the mineral increasing the porosity and decreasing thestrength. Pore water activity accelerates the decompositionprocess by shrinking-fusion phenomena (expansion and freez-ing). Moreover percolating water strengthens the weatheringof feldspars resulting the loosening of granites, by passingthrough the fractures [23].
Deterioration of these materials, in which the permeabilityis due to the occurrence of microfracturations, is mainly attrib-uted to the presence of water that can enter the material eitheras a liquid or vapour. If it moves as a liquid, it will be able totransport salts; if as a vapour, it may be retained through hy-groscopicity [1,23,3].
The distribution of moisture within stone depends also onenvironmental condition [3,4]. The maximum of moisture con-tent resulting from wetedry cycling is closer to the surface indenser stones, and deeper and broader in coarse, porousmaterials.
While moisture may also substantially diminish the me-chanical resistance of some stones, its distribution within thematerial determines where deterioration occurs. This area cor-responds to the zone of maximum moisture content [3,4,18].
Finally we want to pointed out also that moisture seems tobe a necessary factor for bowing to occur [9]. Moisture re-duces the equivalent viscosity far enough to make bowing pos-sible within a few decades. A high humidity on one side ofa stone will lead to expansion and thus to bowing. Bowingof marble is possible also with no particularly high tempera-ture, a modest number of temperature cycles are enough,and coarse grained marble are the most susceptible [9].
In the next section we will discuss the presence of condi-tions that causes deterioration on the columns.
3. Results of the microclimatic investigation
A detailed description of the experimental apparatus andthe results of a microclimatic investigation on the Crypt(performed from February 2003 to March 2004) is given inRef. [6]. The methodology used to study the dynamics ofthe internal microclimate is well known and it has largelybeen described in literature [3,4].
The main thermo-hygrometric parameters, i.e. air (T ) andsurface (Tsur) temperature, relative humidity (RH), specifichumidity (SH), dew point (DP), dew-point spread (DDP), airvelocity were continuously measured at different times, ona 59 points grid, at about 1.30 m from the ground of the Crypt(equally spaced by 3 m), every 3 h since the opening of theCrypt (08:00 am) until its evening closing time.
In particular T, and air velocity were continuously recordednear visibly particularly damaged walls (on the SE side), orrich in moulds columns (B1 and C5). In Ref. [6] we gavealso a percentage of moulds distribution on the columns, a spa-tial representation of these concentrations and some examplesof deterioration on the capitals and the shafts.
Temperature was continuously measured in three points,1 m spaced, at about 1.30 m from the ground of the Crypt,along a vertical line near the apse, in order to study verticalair stability and dust/pollutant transport [6].
Other details are available in Ref. [6]; the microclimaticresearch put in evidence that the Crypt is weakly affected bythe external environment, from which it is separated by thickwalls. The conditions in the Crypt look quite stable, during thewhole year, due to the absence of any heating system, toa moderate heating by sun radiation and to a negligible contri-bution of artificial lighting.
As quite normal the main source of variation for thermo-hygrometric parameters is the rare opening of the windowsW1 and W2 and the door P3 towards the outside (Fig. 2),which causes a strong flow of air, with different temperatureand moisture content.
The Crypt shows large RH values in all seasons, a typicaldistribution is shown in Fig. 3. This fact, coupled with highair temperature and a poor air flow through the environment,not only in the summer, cause for example moulds prolifera-tion. These phenomena are extensively described by Camuffo[3,4].
Looking accurately at Fig. 3 we notice that the SE side haslarger values of RH than the NW one. Another factor thatcould be involved in the mechanism of deterioration of thestone, especially of the columns, could be the presence ofburied cavities containing water (or wet materials). Actuallywith ground penetrating radar explorations we assessed thispresence. In particular the volumetric water content was deter-mined from the dielectric properties of subsurface material,using properly relations [6,18].
This fact suggests us the existence of an important rising ofwater from the underground causing visible effects of

225G. Leucci et al. / Journal of Archaeological Science 34 (2007) 222e232
deterioration in the Crypt [6,18]. Now we investigate the inter-nal state of conservation of some columns focusing our atten-tion on the influence of this evidence on the mechanics offracturing of the columns itself.
4. Geophysical investigations
We investigated six columns with geophysical methodolo-gies (Fig. 2). The columns are listed in Table 1, and theywere chosen with the following criteria:
Fig. 2. Map of the Crypt, black point represent the investigated columns.
Fig. 3. Spatial distribution of relative humidity (%) (08 April 2003, 12:00
hours).
� two columns for each different material,� possibly in apparent different state of conservation,� located in zones with different values of relative humidity.
Table 1 shows the state of conservation of the columnschose in the Crypt and the range of relative humidity (%)near them.
Because of the very small thickness of the fractures, specialcare in the acquisition of both the ERT and GPR data (elec-trode array, electrode type, parameters of acquisition, geome-try of acquisition) was required.
The results of the ERT and GPR survey will be discussed inthe following section.
5. The test survey
The column C5 is the most damaged, therefore, it waschosen as a sample in order to test the geophysical methodsemployed in this paper.
5.1. Electrical resistivity tomography survey
The resistivity method is based on measuring the electricalpotential which results from an applied direct electrical currentflowing in the investigated medium. The distribution of theelectrical potential field depends in turn on the resistivity ofthe medium. In a multi-electrode array the measured resultis displayed as a two-dimensional variation of apparentresistivity.
Apparent resistivity data were collected with Syscal-R1Resistivity-meter and 19 electrodes spaced at 0.1 m, to givea total length of the line of 1.8 m (Fig. 4a). Multi-electrodedata collection was done in the dipoleedipole array. The dipoleedipole array provides both lateral and vertical coverage of theinvestigated medium [20]. To avoid to damage the column theelectrocardiogram electrodes were used. To guarantee a goodcoupling between electrode and surface of the column a con-ductive gel, generally employed in medicine, was used. Thisgel has allowed to obtain resistances of contact of about8e10 kU.
The Syscal-R1 Resistivity-meter allow to set automaticallythe applied current based on the measured spontaneous poten-tial values. The maximum current applied was 210 mA whilethe maximum voltage was 1004 mV.
The measured data were processed by means of 2D inversemodelling software (Res2Dinv) applying Loke and Barkerinversion methods [20].
Table 1
State of conservation of the columns chose in the Crypt and the range of rel-
ative humidity (%) near them
Column RH (%) Material and damage
A1 65e66 Breccia-No visible fractures
D8 61e2 Breccia-No visible fractures
A8 62 Marble-Micro fractures
C5 63 Marble-Multiple deep fractures
B7 62 Granite-Fracture on the top
G6 66e67 Granite-No visible fractures

226 G. Leucci et al. / Journal of Archaeological Science 34 (2007) 222e232
electro
ca
rd
io
gram
electro
de
s
Tx
1500 MHz
antenna
Rx
1000 MHz
antenna
Sir2 System
unit control
Position 1
Position 2
Position 3
Position 10
Sir2 System
unit control
1000 MHz
antenna
Iris Syscal R1
unit control
a b c
Fig. 4. Schemes of data acquisition: (a) resistivity profile; (b) ground penetrating radar traveltime tomography mode; (c) ground penetrating radar in reflection mode.
The software employs a quasi-Newton technique to reducethe numerical calculations [20]. Quasi-Newton method isa non-linear optimization method which seeks to approxi-mate the Jacobian at each iteration instead of calculating itfrom scratch. Therefore, it is a rapid least squares data inver-sion method. Usually the inversion procedure begins witha starting model of the medium (homogeneous medium)and a resistivity correction model is found in every iteration.This correction vector is then added to the previous model.Thus, at the end of every inversion an upgraded model ofthe medium is received and finally the procedure will stopwhen the root-mean-square (RMS) error between real andcalculated apparent resistivities is practically stable (formore see Ref. [17]). Loke and Barker’s [20] technique of in-version has the advantage of being automatic and not requir-ing a prior model.
Fig. 5 shows the resulting ERT image from the survey con-ducted on the C5 column. The presence of the central longitu-dinal fracture manifests itself in the output image in the formof two basin shaped zones (F1 and F2) of relatively high resis-tivity (between electrode positions 1 and 4, and positions 6 and15). The depth extent of these two zones appears to be 0.24 m.The resistivity values for these zones are in the range40e60 U m, compared to a background resistivity in the range5e20 U m. These zones are interpreted to be highly fracturedmarble zones. The fractures could be partially air filled. Thereare some low resistivity zones (labelled H). The resistivityvalues for these zones are in the range 5e20 U m. These zonesare interpreted to by highly water content marble zones.
5.2. GPR traveltime tomography survey
A GSSI SIR2 radar with 1000 and 1500 MHz antennas,having frequency bands partially overlapping [9], was usedfor the survey on the C5 column. GPR data were collectedusing multi-offset gathers with the 1500 MHz antenna astransmitter and 1000 MHz antenna as receiver (Fig. 4b).
In GPR traveltime tomography (TT), one important target isthe resolution of the field velocity that we need. The resolutiondepends on the dimensions of the cells in which the investigatedarea is divided. This parameter is linked to the fundamental fre-quency of the EM wave that travels in the investigated area. Infact, the Fresnel ray theory [8] suggests the minimum dimensionof the object that we can detect by
RF¼ 1
2
ffiffiffiffiffidv
f
sð1Þ
where d is the distance between the transmitter and receiverantennas, v is the mean EM velocity of the investigated area,f is the central frequency of the transmitter antenna, and RFis the Fresnel’s ray. For this reason the minimum dimensionof cell that we can consider will be equal to RF.
Data were acquired by positioning the transmitting antennaon the left side of the column, and collecting data at severalreceiver depths in the right side of the column. The transmit-ting antenna was then moved to a new position, and the datawere collected in the same manner. Repeating this process

227G. Leucci et al. / Journal of Archaeological Science 34 (2007) 222e232
Fig. 5. Resistivity model related to the ERT profile acquired on the C5 column. The photo evidenced the high moisture zones.
creates a dense array of intersecting raypaths, where each ray-path represents the shortest path from the source to thereceiver, and is perpendicular to the EM wave front. The TTdata were collected at source and receiver intervals of0.05 m along the sides of the column. To track any fluctuationsin the GPR transmitter output during data collection, a time-zero calibration was conducted every 8 transmitter depths.This involves placing the transmitting and receiving antennaa known distance apart in the air, which allows the user todetermine the arrival time and to correct for system error.
First-arrival time was used as data to invert for EM wavevelocity propagation. The inversion domain consists of a dis-crete grid of 2D cells that are 0.05 m on both sides. Thesecell dimensions are a good choice because the source andreceiver interval are 0.05 m higher than RF.
The Reflexw software [24] was used to produce images ofvelocity. Reflexw employs a simultaneous iterative reconstruc-tion techniques (SIRT) [21] and ray tracing methods to generatetomographic images. The reference model consists of a homoge-neous full-spacewith a dielectric permittivityof3r¼ 7,a magneticpermeability of m¼ 1, and a conductivity of s¼ 0.1 mS/m. Theseelectric material properties are typical for a marble [19]. Raytracing is performed through this model using the Dijkstraalgorithm [13]. This algorithm calculates raypaths by minimiz-ing the traveltime between each transmitterereceiver pair.The resulting raypath satisfies Snell’s law. Velocities are
iteratively updated by adjustments that move the calculated timestowards the observed times. After each iteration, the velocitymodel was smoothed and the raypaths were recalculated usingthe updated velocity model. These two steps were repeated untilthe traveltime residuals were no longer decreased.
Since EM waves tend to travel through high-velocityregions rather than low-velocity regions, the raypaths in aninhomogeneous media tend to curve around the low-velocityregions and thus they are no longer straight lines. Thereforethe curved ray inversion was used.
The inversion results for the data set (Fig. 6a) show a major highdielectric constant (3r) (low velocity) zone (labelled H and F3).
In the zones labelled F1 and F2 the 3r decreases (EM wavevelocity increase). In this zone is clearly evident the fractureon column C5 (Fig. 6c).
The dielectric constant 3r plays an important role in defin-ing shallow subsurface water content. 3r for pure water is about80; while for the common dry geological material variesbetween 4 and 10. If only a small amount of water is containedin the material, the 3r value increases considerably and,conversely, the EM wave velocity will significantly decrease.Thus the measure of 3r is a good measure of the water contentin the investigated material.
Several formulae have been both theoretically and empiri-cally developed for the dielectric response of heterogeneousmixtures such as water-saturated soils. Topp et al. [26] used

228 G. Leucci et al. / Journal of Archaeological Science 34 (2007) 222e232
Fig. 6. GPR traveltime tomography: (a) electromagnetic velocity (v) and dielectric constant (3r) model distribution in the C5 column; (b) water content (w) model
distribution in the C5 column; photo of the C5 column with the evidence of the longitudinal fracture F.
a wide range of soil samples with varying degrees of watersaturation to derive the following relationship between therelative dielectric constant 3r and the water content w:
w¼�5:3� 10�2þ 2:92� 10�2ð3rÞ � 5:5� 10�4ð3rÞ2þ 4:3
� 10�6ð3rÞ3 ð2Þ
This was found to be nearly independent of soil texture, soilbulk density, temperature and soil salinity [26,14].
Applying then the empirical Topp formula (Eq. (2)) weobtain an estimation of the average volumetric water content,which varies from about 15% to about 40% (Fig. 6b).
The zones labelled H and F3, which represent higher 3r,corresponds most likely to higher water content (about40%). The F1 and F2 zones correspond to lower 3r, and thusto lower water content (about 20%).
Moreover, comparing Fig. 5 with Fig. 6b, we notice a signif-icant correspondence between:
the higher volumetric water content and the lower resistiv-ity zones (H and F3);the lower volumetric water content and higher resistivityzones (F1 and F2).
Furthermore, comparing Fig. 3 with Fig. 6b we noticea good correspondence between the spatial distribution ofthe relative humidity values in the Crypt and the higher volu-metric water content.
The lower water content zones (labelled F1 and F2) arerelated to the longitudinal fracture of the column and confirmthat the fracture is filled with air. The high volumetric watercontent zone, labelled F3, is related to the longitudinal fractureof the column and indicates that the fracture, in this zone, isfilled with moist material.
5.3. The GPR reflection mode survey
The GPR survey was carried out with a georadar System-2(SIR 2) and a 1000 MHz (centre frequency) antenna.
The following acquisition parameters were selected:
� data word length: 16 bit;� samples per scan: 1024;� recording time window: 12 ns;� gain function: manual;
In order to compare the results, it was chosen to overlapcompletely the GPR profile with ERT and TT profiles (Fig. 4c).
229G. Leucci et al. / Journal of Archaeological Science 34 (2007) 222e232
Note that if fractures are sufficiently open and filled with airor water a high amount of radar energy will be scattered back[15]. Since the fractures will be identified by the properties oftheir content (air, water) and by their size, radar wave propa-gation is influenced by the relative dielectric permittivity (3),and the electrical conductivity (s) of the material throughwhich the radar energy passes [10]. So radar signal attenuationis commonly expressed as function of 3 and s parameters. Thesimplified relationship proposed by Ref. [11] provides a roughestimate of the radar signal attenuation a in a material:
a¼ 1:69� 103sffiffiffiffi3rp ðdB=mÞ ð3Þ
Hence 3r can be determined directly from the TT results.Using the relationship (3) and the results of the ERT and TT
surveys (Figs. 5 and 6b), the value a¼ 6.4 dB/m of the atten-uation were estimated.
Data processing is an important task in order to enhance thesignal returned from the small discontinuities representingfractures.
The transmitted EM energy is mainly diffracted from thesediscontinuities, essentially representing voids filled with air,water and ‘‘break up material’’.
The radar data were processed using the software Reflexw,produced by Sandmeier software [24]. The processing stepswere as follows:
� gain function removal;� amplitude compensation; in this case the function g(t) is
applied on the radar section.
The function g(t) consists of a linear and an exponentialpart [16,24]
gðtÞ ¼ ð1þ atÞebt ð4Þ
with
a¼ a0
pulse widthð5Þ
b¼ av
8:69ð6Þ
The pulse width is automatically taken from the nominalfrequency. The two parameters a0 (linear gain, not dimen-sional) and a (exponential gain, in dB/m) represent the geo-metrical spreading and the attenuation energy compensation.
� background removal filter; the average trace was sub-tracted to remove the background;� Kirchhoff migration;� envelopes; due to the amount of diffracted arrivals com-
pared to reflected ones, amplitude envelopes were plottedversus time;� setting to zero the amplitude range; the filter allows to set
to 0 all data values lying in the given amplitude range(0e35% of max EM energy amplitude). This allows to
emphasize the high amplitude values related to the back-scattered energy.
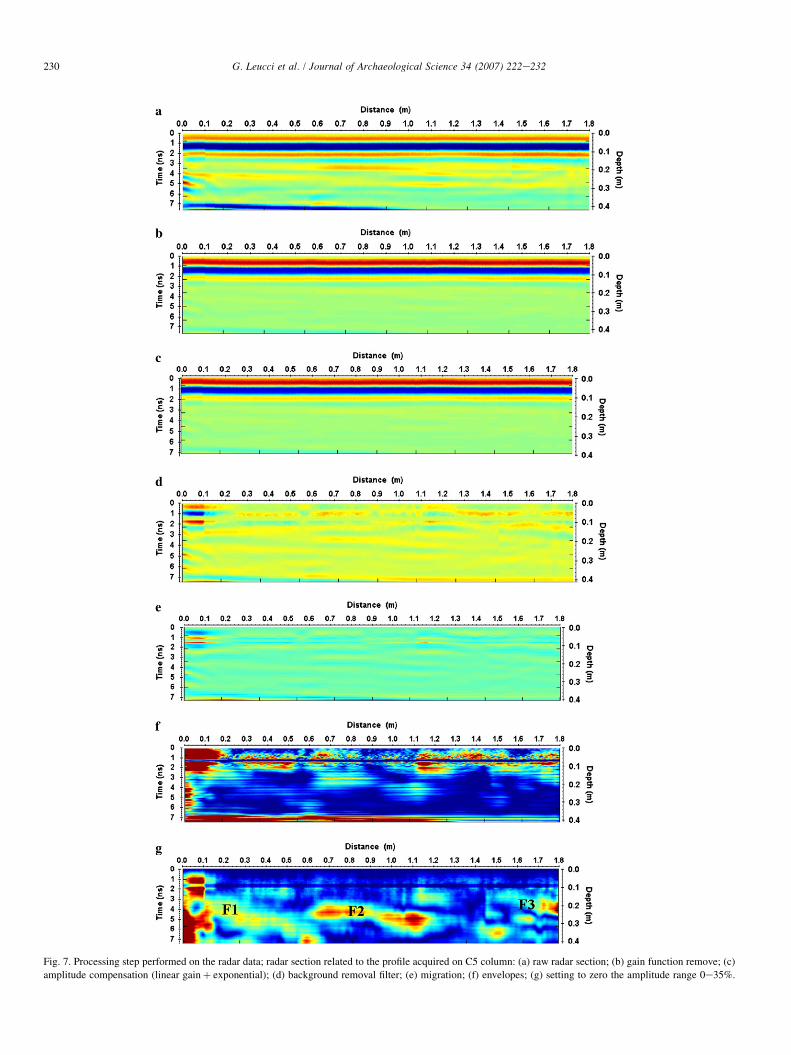
Fig. 7 shows the processed data. In Fig. 7g it is possible tonote the zones (labelled F1, F2 and F3) that clearly indicatea longitudinal fracture.
Now, comparing the fracture distributions obtained fromGPR measurements and the results of the ERT and TT mea-surements, we note that the use of GPR data, collected inreflection mode, to estimate the fracture distribution is reli-able and can replace more extensive sample analysis. Theresults obtained with the 2D electrical resistivity tomographyare in good agreement with the GPR studies (Figs. 5 and7g); however, the 2D electrical resistivity tomography seemsto be less resolutive than GPR. In fact the ERT profile(Fig. 5) shows a longitudinal fracture larger than its realdimension.
The results obtained with the GPR traveltime tomographyare in good agreement with the GPR reflection studies (Figs.6a and 7g); however, the GPR traveltime tomography modeis more time expensive than GPR reflection mode.
Because of the above considerations the GPR reflectionmode method was chosen to investigate the other columns,and the conductivity average values (about 15 mS/m) obtainedfrom the ERT data (Fig. 5) were used to estimate the radarenergy attenuation in the column.
6. GPR survey on the columns
The GPR data were acquired using the same acquisitionparameters fixed in the test measurements, and they wereprocessed using the sequence described in the previousparagraph.
6.1. Columns G6 and B7
Columns G6 and B7 are constituted by granite material. G6is located in a zone with high RH values while B7 is located ina zone with a lower RH (Table 1).
The analysis of the radar sections (Fig. 8) shows:
� for column G6 (Fig. 8a), some zones (labelled F) clearlyindicate fractured zones;� for column B7 (Fig. 8b), no fractured zones were noted.
6.2. Columns A1 and D8
Columns A1 and D8 are constituted by breccia. A1 islocated in a zone with high RH values while D8 is locatedin a zone with lower RH (Table 1).
The analysis of the radar sections (Fig. 9) shows:
� for column A1 (Fig. 9a), some zones (labelled F) clearlyindicate fractured zones;� for column D8 (Fig. 9b), more zones (labelled F) clearly
indicate fractured zones.
230 G. Leucci et al. / Journal of Archaeological Science 34 (2007) 222e232
Fig. 7. Processing step performed on the radar data; radar section related to the profile acquired on C5 column: (a) raw radar section; (b) gain function remove; (c)
amplitude compensation (linear gainþ exponential); (d) background removal filter; (e) migration; (f) envelopes; (g) setting to zero the amplitude range 0e35%.

231G. Leucci et al. / Journal of Archaeological Science 34 (2007) 222e232
Fig. 8. (a) Processed radar section related to the profile acquired on G6 column; (b) processed radar section related to the profile acquired on B7 column.
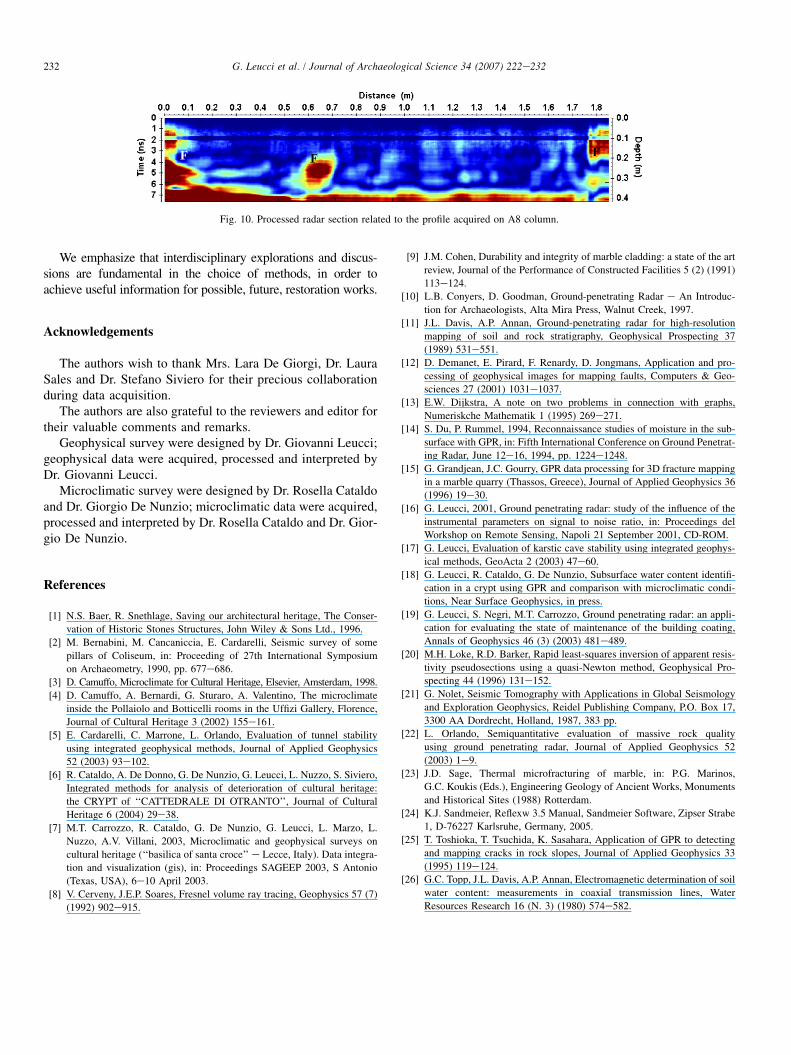
6.3. Column A8
Column A8 is constituted by marble (the same material ofColumn C5). A8 is located in a zone with relatively lower RHthan C5 (Table 1).
The analysis of the radar section (Fig. 10) shows somezones (labelled F) that clearly indicate fractured zones.
7. Conclusions
Integrated geophysical methods were used to asses thepresence of fractures in porous materials, i.e. the columns inthe Crypt of the ‘‘Cattedrale di Otranto’’. The results of geo-physical survey were compared with the microclimaticinvestigations.
The microclimatic investigation has shown that the left sideof the Crypt exhibits values of RH larger than the right one.
Therefore we investigated the internal state of conservationof the columns choosing couples of columns of the same ma-terial in the left and right side of the Crypt in order to obtainuseful information about the damage of columns itself.
Column C5 was chosen as sample to perform GPR, in reflec-tion and traveltime tomography mode, and ERT profiles in orderto compare and integrate the results with these methodologies.
The results obtained are in good agreement (Figs. 5, 6a and7g), however, the 2D electrical resistivity tomography seemsto be less resolutive than GPR. In fact the ERT profile(Fig. 5) shows a longitudinal fracture larger than its real di-mension. While GPR traveltime tomography mode is moretime expensive than GPR reflection mode.
Therefore the GPR method, in reflection mode, was chosento investigate the other columns.
These integrated researches clearly indicate that thepresence of a high water content causes both effects of biode-terioration in most of the columns of the Crypt and of decom-position and loosening of the tight fabric of the mineral. In factthe geophysical data pointed out that the columns located inthe left side of the Crypt are more fractured than the columnslocated in the right side.
Moreover, the case studied in this paper confirms the feasi-bility of GPR methodology for the location of fractured zones.Compared to other methods, this technique is very fast andalso suitable for small-scale reconnaissance surveys.
Fig. 9. (a) Processed radar section related to the profile acquired on A1 column; (b) processed radar section related to the profile acquired on D8 column.
232 G. Leucci et al. / Journal of Archaeological Science 34 (2007) 222e232
Fig. 10. Processed radar section related to the profile acquired on A8 column.
We emphasize that interdisciplinary explorations and discus-sions are fundamental in the choice of methods, in order toachieve useful information for possible, future, restoration works.
Acknowledgements
The authors wish to thank Mrs. Lara De Giorgi, Dr. LauraSales and Dr. Stefano Siviero for their precious collaborationduring data acquisition.
The authors are also grateful to the reviewers and editor fortheir valuable comments and remarks.
Geophysical survey were designed by Dr. Giovanni Leucci;geophysical data were acquired, processed and interpreted byDr. Giovanni Leucci.
Microclimatic survey were designed by Dr. Rosella Cataldoand Dr. Giorgio De Nunzio; microclimatic data were acquired,processed and interpreted by Dr. Rosella Cataldo and Dr. Gior-gio De Nunzio.
References
[1] N.S. Baer, R. Snethlage, Saving our architectural heritage, The Conser-
vation of Historic Stones Structures, John Wiley & Sons Ltd., 1996.
[2] M. Bernabini, M. Cancaniccia, E. Cardarelli, Seismic survey of some
pillars of Coliseum, in: Proceeding of 27th International Symposium
on Archaeometry, 1990, pp. 677e686.
[3] D. Camuffo, Microclimate for Cultural Heritage, Elsevier, Amsterdam, 1998.
[4] D. Camuffo, A. Bernardi, G. Sturaro, A. Valentino, The microclimate
inside the Pollaiolo and Botticelli rooms in the Uffizi Gallery, Florence,
Journal of Cultural Heritage 3 (2002) 155e161.
[5] E. Cardarelli, C. Marrone, L. Orlando, Evaluation of tunnel stability
using integrated geophysical methods, Journal of Applied Geophysics
52 (2003) 93e102.
[6] R. Cataldo, A. De Donno, G. De Nunzio, G. Leucci, L. Nuzzo, S. Siviero,
Integrated methods for analysis of deterioration of cultural heritage:
the CRYPT of ‘‘CATTEDRALE DI OTRANTO’’, Journal of Cultural
Heritage 6 (2004) 29e38.
[7] M.T. Carrozzo, R. Cataldo, G. De Nunzio, G. Leucci, L. Marzo, L.
Nuzzo, A.V. Villani, 2003, Microclimatic and geophysical surveys on
cultural heritage (‘‘basilica of santa croce’’ e Lecce, Italy). Data integra-
tion and visualization (gis), in: Proceedings SAGEEP 2003, S Antonio
(Texas, USA), 6e10 April 2003.
[8] V. Cerveny, J.E.P. Soares, Fresnel volume ray tracing, Geophysics 57 (7)
(1992) 902e915.
[9] J.M. Cohen, Durability and integrity of marble cladding: a state of the art
review, Journal of the Performance of Constructed Facilities 5 (2) (1991)
113e124.
[10] L.B. Conyers, D. Goodman, Ground-penetrating Radar e An Introduc-
tion for Archaeologists, Alta Mira Press, Walnut Creek, 1997.
[11] J.L. Davis, A.P. Annan, Ground-penetrating radar for high-resolution
mapping of soil and rock stratigraphy, Geophysical Prospecting 37
(1989) 531e551.
[12] D. Demanet, E. Pirard, F. Renardy, D. Jongmans, Application and pro-
cessing of geophysical images for mapping faults, Computers & Geo-
sciences 27 (2001) 1031e1037.
[13] E.W. Dijkstra, A note on two problems in connection with graphs,
Numeriskche Mathematik 1 (1995) 269e271.
[14] S. Du, P. Rummel, 1994, Reconnaissance studies of moisture in the sub-
surface with GPR, in: Fifth International Conference on Ground Penetrat-
ing Radar, June 12e16, 1994, pp. 1224e1248.
[15] G. Grandjean, J.C. Gourry, GPR data processing for 3D fracture mapping
in a marble quarry (Thassos, Greece), Journal of Applied Geophysics 36
(1996) 19e30.
[16] G. Leucci, 2001, Ground penetrating radar: study of the influence of the
instrumental parameters on signal to noise ratio, in: Proceedings del
Workshop on Remote Sensing, Napoli 21 September 2001, CD-ROM.
[17] G. Leucci, Evaluation of karstic cave stability using integrated geophys-
ical methods, GeoActa 2 (2003) 47e60.
[18] G. Leucci, R. Cataldo, G. De Nunzio, Subsurface water content identifi-
cation in a crypt using GPR and comparison with microclimatic condi-
tions, Near Surface Geophysics, in press.
[19] G. Leucci, S. Negri, M.T. Carrozzo, Ground penetrating radar: an appli-
cation for evaluating the state of maintenance of the building coating,
Annals of Geophysics 46 (3) (2003) 481e489.
[20] M.H. Loke, R.D. Barker, Rapid least-squares inversion of apparent resis-
tivity pseudosections using a quasi-Newton method, Geophysical Pro-
specting 44 (1996) 131e152.
[21] G. Nolet, Seismic Tomography with Applications in Global Seismology
and Exploration Geophysics, Reidel Publishing Company, P.O. Box 17,
3300 AA Dordrecht, Holland, 1987, 383 pp.
[22] L. Orlando, Semiquantitative evaluation of massive rock quality
using ground penetrating radar, Journal of Applied Geophysics 52
(2003) 1e9.
[23] J.D. Sage, Thermal microfracturing of marble, in: P.G. Marinos,
G.C. Koukis (Eds.), Engineering Geology of Ancient Works, Monuments
and Historical Sites (1988) Rotterdam.
[24] K.J. Sandmeier, Reflexw 3.5 Manual, Sandmeier Software, Zipser Strabe
1, D-76227 Karlsruhe, Germany, 2005.
[25] T. Toshioka, T. Tsuchida, K. Sasahara, Application of GPR to detecting
and mapping cracks in rock slopes, Journal of Applied Geophysics 33
(1995) 119e124.
[26] G.C. Topp, J.L. Davis, A.P. Annan, Electromagnetic determination of soil
water content: measurements in coaxial transmission lines, Water
Resources Research 16 (N. 3) (1980) 574e582.
Copyright © 2022 FDOKUMEN