Effects of high fat fish oil and high fat corn oil diets on initiation of AOM-induced colonic...
184
Effects of n-6 and n-3 polyunsaturated fatty acids on colorectal carcinogenesis Yvonne Dommels
-
Upload
independent -
Category
Documents
-
view
0 -
download
0
Transcript of Effects of high fat fish oil and high fat corn oil diets on initiation of AOM-induced colonic...

Effects of n-6 and n-3 polyunsaturated
fatty acids on colorectal carcinogenesis
Yvonne Dommels

Promotor:
Prof. dr. P.J van Bladeren
Hoogleraar in de Toxicokinetiek en Biotransformatie
Wageningen Universiteit
Copromotoren:
Dr. G.M Alink
Universitair Hoofddocent, Sectie Toxicologie
Wageningen Universiteit
Dr. ir. B van Ommen
Senior research fellow nutritional systems biology
TNO Nutrition and Food Research
Promotiecommissie:
Prof. dr. M Müller
Wageningen Universiteit
Prof. dr. ir. I.M.C.M Rietjens
Wageningen Universiteit
Prof. dr. ir. G.J Schaafsma
Wageningen Universiteit / TNO Nutrition and Food Research
Prof. dr. F.J van Schooten
Universiteit Maastricht
Effects of n-6 and n-3 polyunsaturated
fatty acids on colorectal carcinogenesis
Yvonne Elisabeth Maria Dommels
Proefschrift
ter verkrijging van de graad van doctor
op gezag van de rector magnificus
van Wageningen Universiteit,
Prof. dr. ir. L Speelman,
in het openbaar te verdedigen
op vrijdag 12 september 2003
des namiddags te vier uur in de Aula.

Title Effects of n-6 and n-3 polyunsaturated fatty acids on colorectal
carcinogenesis
Author Yvonne Elisabeth Maria Dommels
Thesis Wageningen University, Wageningen, The Netherlands (2003)
with abstract – with references – with summary in Dutch
ISBN 90-5808-853-7

‘The best research comes from asking
Nature simple questions, one at a time’
Pennie et al., Toxicological sciences, 2000

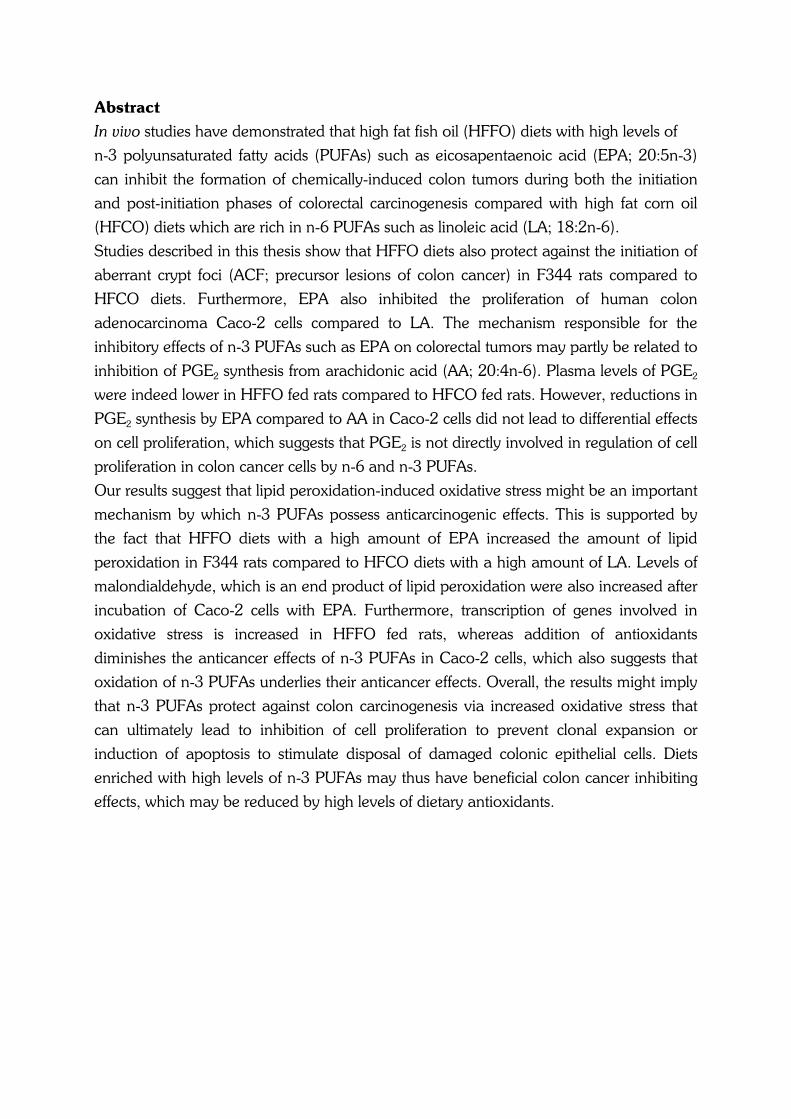
Abstract
In vivo studies have demonstrated that high fat fish oil (HFFO) diets with high levels of
n-3 polyunsaturated fatty acids (PUFAs) such as eicosapentaenoic acid (EPA; 20:5n-3)
can inhibit the formation of chemically-induced colon tumors during both the initiation
and post-initiation phases of colorectal carcinogenesis compared with high fat corn oil
(HFCO) diets which are rich in n-6 PUFAs such as linoleic acid (LA; 18:2n-6).
Studies described in this thesis show that HFFO diets also protect against the initiation of
aberrant crypt foci (ACF; precursor lesions of colon cancer) in F344 rats compared to
HFCO diets. Furthermore, EPA also inhibited the proliferation of human colon
adenocarcinoma Caco-2 cells compared to LA. The mechanism responsible for the
inhibitory effects of n-3 PUFAs such as EPA on colorectal tumors may partly be related to
inhibition of PGE2 synthesis from arachidonic acid (AA; 20:4n-6). Plasma levels of PGE2
were indeed lower in HFFO fed rats compared to HFCO fed rats. However, reductions in
PGE2 synthesis by EPA compared to AA in Caco-2 cells did not lead to differential effects
on cell proliferation, which suggests that PGE2 is not directly involved in regulation of cell
proliferation in colon cancer cells by n-6 and n-3 PUFAs.
Our results suggest that lipid peroxidation-induced oxidative stress might be an important
mechanism by which n-3 PUFAs possess anticarcinogenic effects. This is supported by
the fact that HFFO diets with a high amount of EPA increased the amount of lipid
peroxidation in F344 rats compared to HFCO diets with a high amount of LA. Levels of
malondialdehyde, which is an end product of lipid peroxidation were also increased after
incubation of Caco-2 cells with EPA. Furthermore, transcription of genes involved in
oxidative stress is increased in HFFO fed rats, whereas addition of antioxidants
diminishes the anticancer effects of n-3 PUFAs in Caco-2 cells, which also suggests that
oxidation of n-3 PUFAs underlies their anticancer effects. Overall, the results might imply
that n-3 PUFAs protect against colon carcinogenesis via increased oxidative stress that
can ultimately lead to inhibition of cell proliferation to prevent clonal expansion or
induction of apoptosis to stimulate disposal of damaged colonic epithelial cells. Diets
enriched with high levels of n-3 PUFAs may thus have beneficial colon cancer inhibiting
effects, which may be reduced by high levels of dietary antioxidants.


Contents
Chapter 1 General introduction 11
Chapter 2 Effects of n-6 and n-3 polyunsaturated fatty 43
acids on gap junctional intercellular communication
during spontaneous differentiation of the human
colon adenocarcinoma cell line Caco-2
Chapter 3 The role of cyclooxygenase in n-6 and n-3 59
polyunsaturated fatty acid-mediated effects on cell
proliferation, PGE2 synthesis and cytotoxicity in
human colorectal carcinoma cell lines
Chapter 4 Effects of high fat fish oil and high fat corn oil diets 83
on initiation of AOM-induced colonic aberrant crypt
foci in male F344 rats
Chapter 5 High fat fish oil diets modulate expression of genes 105
involved in oxidative stress, cell growth, acute phase
response and lipid metabolism in normal colonic
epithelium of male F344 rats
Chapter 6 n-6 and n-3 polyunsaturated fatty acid-induced 135
transcriptome changes in Caco-2 cells
Chapter 7 Summary and general discussion 155
Nederlandse samenvatting 167
Curriculum Vitae and List of publications 173
Dankwoord 177


Introduction
11
Chapter 1
General introduction
based on: Yvonne EM Dommels, Gerrit M Alink, Peter J van Bladeren and Ben van
Ommen. (2002) Dietary n-6 and n-3 polyunsaturated fatty acids and colorectal
carcinogenesis: results from cultured colon cells, animal models and human studies.
Environmental Toxicology and Pharmacology, 12(4), 233-244
Chapter 1
12
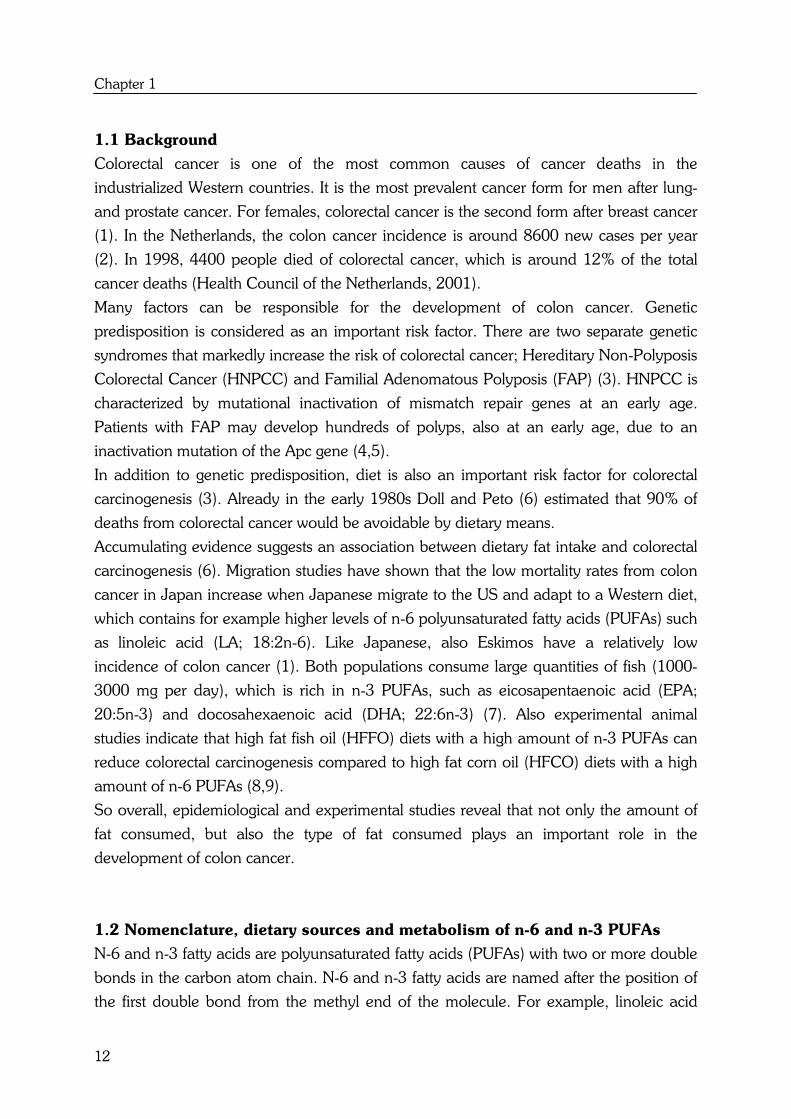
1.1 Background
Colorectal cancer is one of the most common causes of cancer deaths in the
industrialized Western countries. It is the most prevalent cancer form for men after lung-
and prostate cancer. For females, colorectal cancer is the second form after breast cancer
(1). In the Netherlands, the colon cancer incidence is around 8600 new cases per year
(2). In 1998, 4400 people died of colorectal cancer, which is around 12% of the total
cancer deaths (Health Council of the Netherlands, 2001).
Many factors can be responsible for the development of colon cancer. Genetic
predisposition is considered as an important risk factor. There are two separate genetic
syndromes that markedly increase the risk of colorectal cancer; Hereditary Non-Polyposis
Colorectal Cancer (HNPCC) and Familial Adenomatous Polyposis (FAP) (3). HNPCC is
characterized by mutational inactivation of mismatch repair genes at an early age.
Patients with FAP may develop hundreds of polyps, also at an early age, due to an
inactivation mutation of the Apc gene (4,5).
In addition to genetic predisposition, diet is also an important risk factor for colorectal
carcinogenesis (3). Already in the early 1980s Doll and Peto (6) estimated that 90% of
deaths from colorectal cancer would be avoidable by dietary means.
Accumulating evidence suggests an association between dietary fat intake and colorectal
carcinogenesis (6). Migration studies have shown that the low mortality rates from colon
cancer in Japan increase when Japanese migrate to the US and adapt to a Western diet,
which contains for example higher levels of n-6 polyunsaturated fatty acids (PUFAs) such
as linoleic acid (LA; 18:2n-6). Like Japanese, also Eskimos have a relatively low
incidence of colon cancer (1). Both populations consume large quantities of fish (1000-
3000 mg per day), which is rich in n-3 PUFAs, such as eicosapentaenoic acid (EPA;
20:5n-3) and docosahexaenoic acid (DHA; 22:6n-3) (7). Also experimental animal
studies indicate that high fat fish oil (HFFO) diets with a high amount of n-3 PUFAs can
reduce colorectal carcinogenesis compared to high fat corn oil (HFCO) diets with a high
amount of n-6 PUFAs (8,9).
So overall, epidemiological and experimental studies reveal that not only the amount of
fat consumed, but also the type of fat consumed plays an important role in the
development of colon cancer.
1.2 Nomenclature, dietary sources and metabolism of n-6 and n-3 PUFAs
N-6 and n-3 fatty acids are polyunsaturated fatty acids (PUFAs) with two or more double
bonds in the carbon atom chain. N-6 and n-3 fatty acids are named after the position of
the first double bond from the methyl end of the molecule. For example, linoleic acid
Introduction
13
(LA; 18:2n-6) has 18 C-atoms and two double bonds, with the first double bond at the
6th carbon atom counted from the methyl end. Linoleic acid is the parent compound of
the n-6 family, whereas α-linolenic acid (ALA; 18:3n-3) is the parent compound of the
n-3 fatty acid family. These two PUFA families are considered as essential and must be
derived from the diet (10). Linoleic acid is mostly found in vegetable seeds and oils such
as safflower, soybeans, corn and sunflower oil. Perilla oil from the Asian beefsteak plant
(Perilla frutescens), linseed oil, rapeseed, walnuts and blackcurrant oil are rich in α-
linolenic acid. α-Linolenic acid is also present in dark green leafy plants (11).
Linoleic acid and α-linolenic acid can be metabolized to more polyunsaturated fatty acids
by the combined action of desaturation and elongation enzymes (10). Desaturation
enzymes introduce a new double bond in the carbon atom chain and elongation
enzymes introduce two new C-atoms. Arachidonic acid (AA; 20:4n-6) is the major long-
chain n-6 PUFA. Eicosapentaenoic acid (EPA; 20:5n-3) and docosahexaenoic acid
(DHA; 22:6n-3) are the major PUFAs of the n-3 family.
The marine food chain is based on n-3 fatty acids, which are present in plankton and
algae on which fish feed (11). Fatty fish such as salmon, tuna, herring, mackerel and
anchovy are rich sources of EPA and DHA (12). Although lean meats and meat fat are
direct dietary AA sources, dietary LA is considered to be the main source of tissue AA
(12).
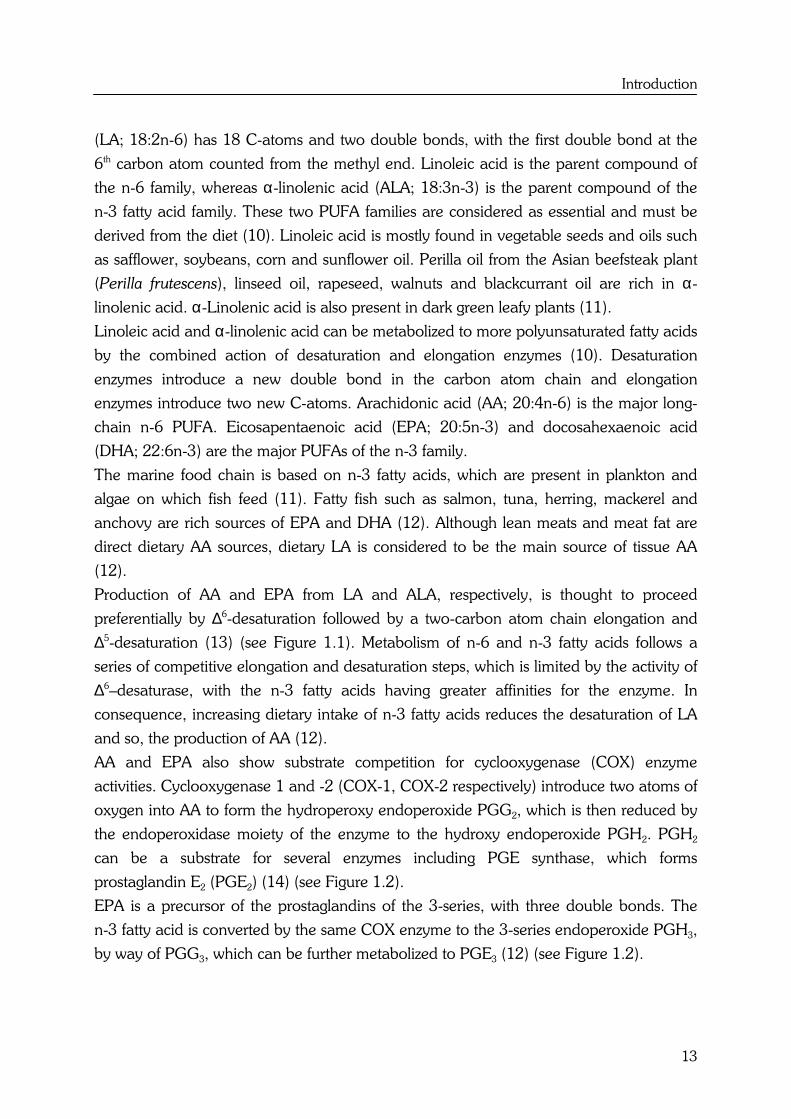
Production of AA and EPA from LA and ALA, respectively, is thought to proceed
preferentially by ∆6-desaturation followed by a two-carbon atom chain elongation and
∆5-desaturation (13) (see Figure 1.1). Metabolism of n-6 and n-3 fatty acids follows a
series of competitive elongation and desaturation steps, which is limited by the activity of
∆6–desaturase, with the n-3 fatty acids having greater affinities for the enzyme. In
consequence, increasing dietary intake of n-3 fatty acids reduces the desaturation of LA
and so, the production of AA (12).
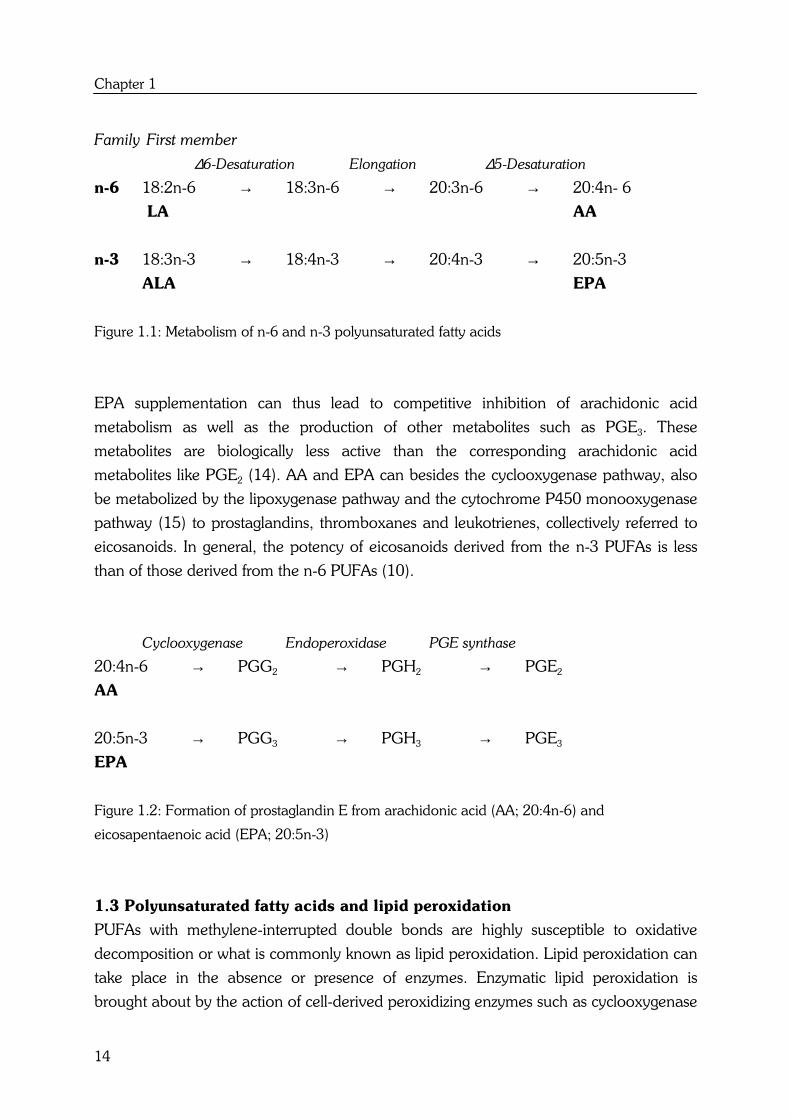
AA and EPA also show substrate competition for cyclooxygenase (COX) enzyme
activities. Cyclooxygenase 1 and -2 (COX-1, COX-2 respectively) introduce two atoms of
oxygen into AA to form the hydroperoxy endoperoxide PGG2, which is then reduced by
the endoperoxidase moiety of the enzyme to the hydroxy endoperoxide PGH2. PGH2
can be a substrate for several enzymes including PGE synthase, which forms
prostaglandin E2 (PGE2) (14) (see Figure 1.2).
EPA is a precursor of the prostaglandins of the 3-series, with three double bonds. The
n-3 fatty acid is converted by the same COX enzyme to the 3-series endoperoxide PGH3,
by way of PGG3, which can be further metabolized to PGE3 (12) (see Figure 1.2).
Chapter 1
14
Family First member
∆6-Desaturation Elongation ∆5-Desaturation
n-6 18:2n-6 → 18:3n-6 → 20:3n-6 → 20:4n- 6
LA AA
n-3 18:3n-3 → 18:4n-3 → 20:4n-3 → 20:5n-3
ALA EPA
Figure 1.1: Metabolism of n-6 and n-3 polyunsaturated fatty acids
EPA supplementation can thus lead to competitive inhibition of arachidonic acid
metabolism as well as the production of other metabolites such as PGE3. These
metabolites are biologically less active than the corresponding arachidonic acid
metabolites like PGE2 (14). AA and EPA can besides the cyclooxygenase pathway, also
be metabolized by the lipoxygenase pathway and the cytochrome P450 monooxygenase
pathway (15) to prostaglandins, thromboxanes and leukotrienes, collectively referred to
eicosanoids. In general, the potency of eicosanoids derived from the n-3 PUFAs is less
than of those derived from the n-6 PUFAs (10).
Cyclooxygenase Endoperoxidase PGE synthase
20:4n-6 → PGG2 → PGH2 → PGE2
AA
20:5n-3 → PGG3 → PGH3 → PGE3
EPA
Figure 1.2: Formation of prostaglandin E from arachidonic acid (AA; 20:4n-6) and
eicosapentaenoic acid (EPA; 20:5n-3)
1.3 Polyunsaturated fatty acids and lipid peroxidation
PUFAs with methylene-interrupted double bonds are highly susceptible to oxidative
decomposition or what is commonly known as lipid peroxidation. Lipid peroxidation can
take place in the absence or presence of enzymes. Enzymatic lipid peroxidation is
brought about by the action of cell-derived peroxidizing enzymes such as cyclooxygenase
Introduction
15
(COX). Non-enzymatic lipid peroxidation is initiated by free radicals, requires oxygen
and has the characteristics of a chain reaction (13). The process begins when a free
radical abstracts a hydrogen atom from a PUFA, thus forming a lipid radical (see Figure
1.3). The lipid radical (R•) quickly reacts with oxygen to form a lipid peroxyl radical
(ROO•), which in turn either forms a lipid endoperoxide or abstracts a hydrogen atom
from another PUFA to form a new lipid radical and a lipid hydroperoxide (ROOH) (13).
Decomposition of lipid hydroperoxides and endoperoxides eventually gives rise to end
products including alcohols, ketones, ethers and aldehydes. Some end products, such as
malondialdehyde (MDA) and 4-hydroxy-2-nonenal are biologically very active and
possess cytotoxic potential (13).
A method commonly used to assess lipid peroxidation is the determination of MDA or a
derivative of MDA, by its reaction with thiobarbituric acid (TBA) (16). Ito et al. (17)
measured serum concentrations of fatty acids and lipid peroxides among Japanese in
Japan and Japanese and Caucasians in the US. They concluded that serum
thiobarbituric acid-reactive substances (TBARS) were highest among Japanese in Japan,
followed by Japanese in the US and Caucasians in the US. A significant positive
correlation was observed between serum values of TBARS and n-3 PUFAs among
Japanese both in Japan and in the US. These findings suggest that high serum TBARS
values among Japanese might depend in part on the induction of lipid peroxidation of
n-3 PUFAs due to the Japanese diet which is rich in fish oil (17).
Peroxidation products, such as MDA, can however damage the cell membrane and DNA
resulting in cytotoxic effects (18). MDA is found to be mutagenic in bacterial and
mammalian cells and carcinogenic in rats (19). MDA can also react with DNA,
predominantly deoxyguanosine, to form pyrimidopurinone-deoxyguanosine adducts
(M1G) (19). M1G seems to be present in human colorectal tissue. The relationship
between MDA-DNA damage and the risk of adenomatous polyps in the colon is however
still unclear (20).

Chapter 1
16
Figure 1.3: Schematic view of lipid peroxidation
1.4 Intermediate biomarkers of colorectal carcinogenesis used in this thesis
1.4.1 Colonic cell proliferation, differentiation and cell death
The colon is a self-renewing tissue with a high cellular turnover rate (48-72 hour) (21). In
the colonic crypt, cell proliferation is confined to the lower two third of the crypt. As cells
migrate upwards in the crypt, the cells differentiate into absorptive enterocytes, mucous
secreting goblet cells or enteroendocrine cells (22). This migration of cells in the colonic
crypt is tightly coupled to differentiation. Exfoliation at the top of the crypt could be due
to passive sloughing off of cells, expulsion by mechanical forces from neighboring cells or
due to programmed cell death (apoptosis) (22).
Tissue homeostasis in the colonic crypt relies on a balance between proliferation,
differentiation and apoptosis. Disruption of the balance between proliferation,
differentiation and apoptosis, for example by dietary factors can lead to colorectal
Introduction
17
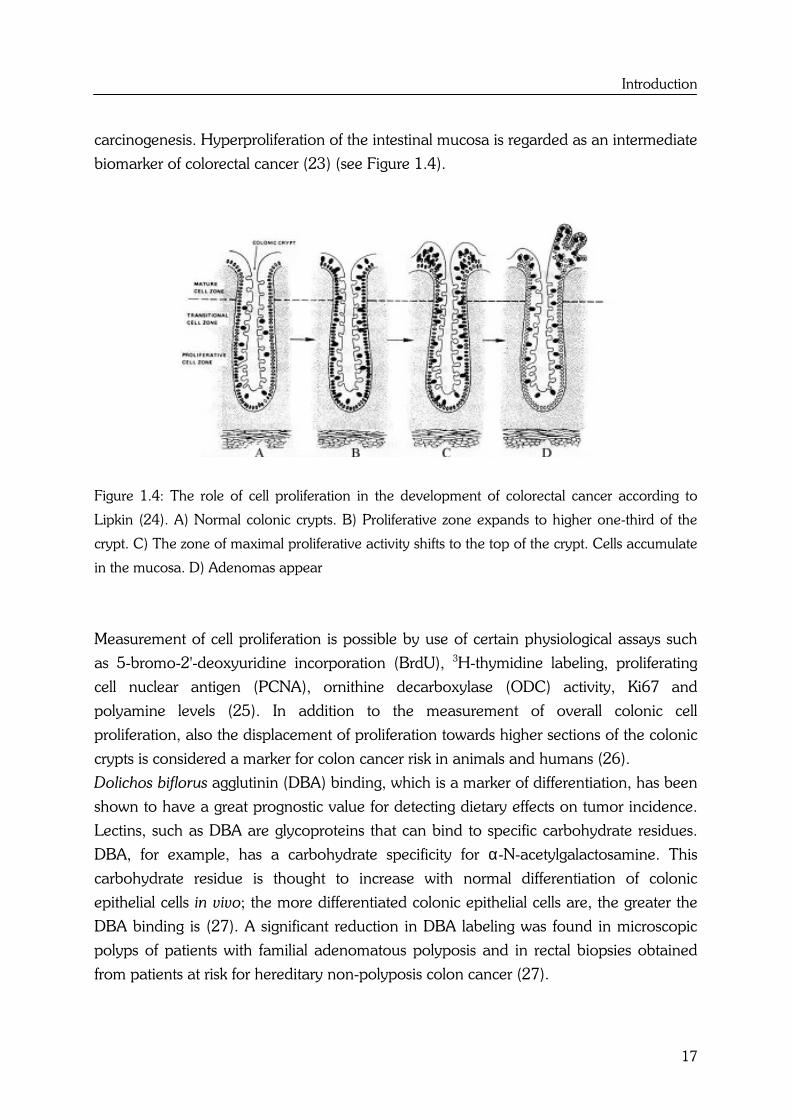
carcinogenesis. Hyperproliferation of the intestinal mucosa is regarded as an intermediate
biomarker of colorectal cancer (23) (see Figure 1.4).
Figure 1.4: The role of cell proliferation in the development of colorectal cancer according to
Lipkin (24). A) Normal colonic crypts. B) Proliferative zone expands to higher one-third of the
crypt. C) The zone of maximal proliferative activity shifts to the top of the crypt. Cells accumulate
in the mucosa. D) Adenomas appear
Measurement of cell proliferation is possible by use of certain physiological assays such
as 5-bromo-2'-deoxyuridine incorporation (BrdU), 3H-thymidine labeling, proliferating
cell nuclear antigen (PCNA), ornithine decarboxylase (ODC) activity, Ki67 and
polyamine levels (25). In addition to the measurement of overall colonic cell
proliferation, also the displacement of proliferation towards higher sections of the colonic
crypts is considered a marker for colon cancer risk in animals and humans (26).
Dolichos biflorus agglutinin (DBA) binding, which is a marker of differentiation, has been
shown to have a great prognostic value for detecting dietary effects on tumor incidence.
Lectins, such as DBA are glycoproteins that can bind to specific carbohydrate residues.
DBA, for example, has a carbohydrate specificity for α-N-acetylgalactosamine. This
carbohydrate residue is thought to increase with normal differentiation of colonic
epithelial cells in vivo; the more differentiated colonic epithelial cells are, the greater the
DBA binding is (27). A significant reduction in DBA labeling was found in microscopic
polyps of patients with familial adenomatous polyposis and in rectal biopsies obtained
from patients at risk for hereditary non-polyposis colon cancer (27).
Chapter 1
18
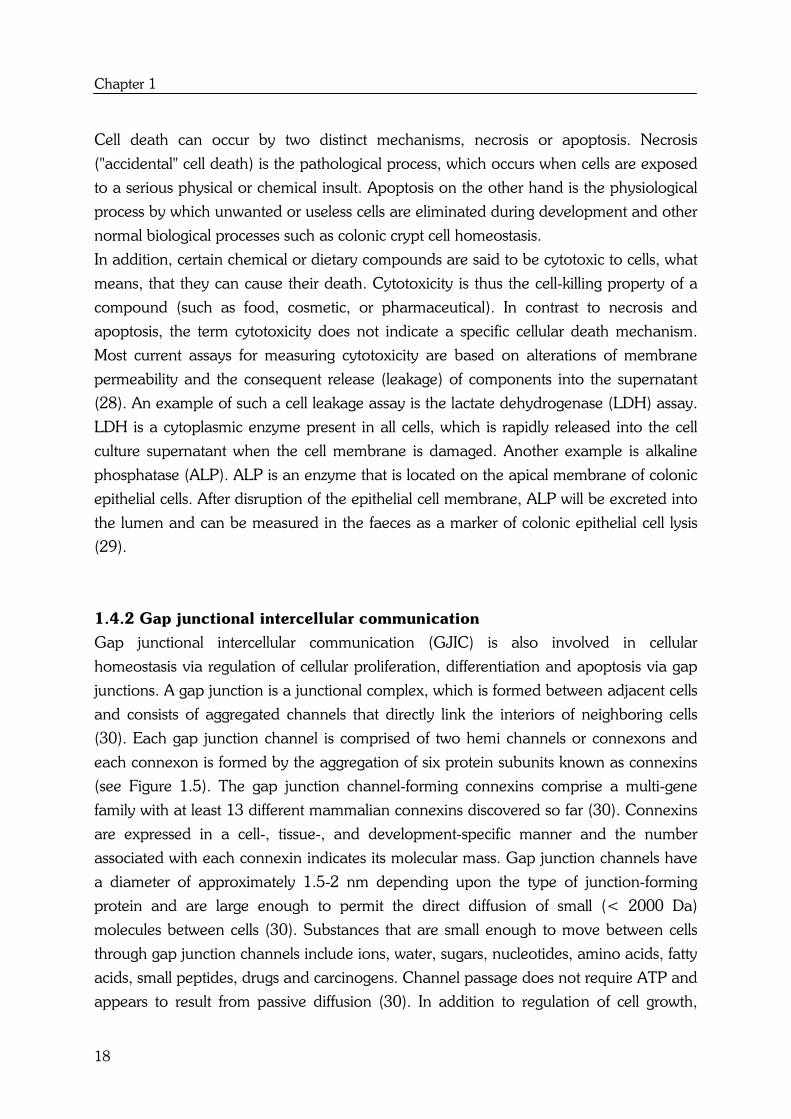
Cell death can occur by two distinct mechanisms, necrosis or apoptosis. Necrosis
("accidental" cell death) is the pathological process, which occurs when cells are exposed
to a serious physical or chemical insult. Apoptosis on the other hand is the physiological
process by which unwanted or useless cells are eliminated during development and other
normal biological processes such as colonic crypt cell homeostasis.
In addition, certain chemical or dietary compounds are said to be cytotoxic to cells, what
means, that they can cause their death. Cytotoxicity is thus the cell-killing property of a
compound (such as food, cosmetic, or pharmaceutical). In contrast to necrosis and
apoptosis, the term cytotoxicity does not indicate a specific cellular death mechanism.
Most current assays for measuring cytotoxicity are based on alterations of membrane
permeability and the consequent release (leakage) of components into the supernatant
(28). An example of such a cell leakage assay is the lactate dehydrogenase (LDH) assay.
LDH is a cytoplasmic enzyme present in all cells, which is rapidly released into the cell
culture supernatant when the cell membrane is damaged. Another example is alkaline
phosphatase (ALP). ALP is an enzyme that is located on the apical membrane of colonic
epithelial cells. After disruption of the epithelial cell membrane, ALP will be excreted into
the lumen and can be measured in the faeces as a marker of colonic epithelial cell lysis
(29).
1.4.2 Gap junctional intercellular communication
Gap junctional intercellular communication (GJIC) is also involved in cellular
homeostasis via regulation of cellular proliferation, differentiation and apoptosis via gap
junctions. A gap junction is a junctional complex, which is formed between adjacent cells
and consists of aggregated channels that directly link the interiors of neighboring cells
(30). Each gap junction channel is comprised of two hemi channels or connexons and
each connexon is formed by the aggregation of six protein subunits known as connexins
(see Figure 1.5). The gap junction channel-forming connexins comprise a multi-gene
family with at least 13 different mammalian connexins discovered so far (30). Connexins
are expressed in a cell-, tissue-, and development-specific manner and the number
associated with each connexin indicates its molecular mass. Gap junction channels have
a diameter of approximately 1.5-2 nm depending upon the type of junction-forming
protein and are large enough to permit the direct diffusion of small (< 2000 Da)
molecules between cells (30). Substances that are small enough to move between cells
through gap junction channels include ions, water, sugars, nucleotides, amino acids, fatty
acids, small peptides, drugs and carcinogens. Channel passage does not require ATP and
appears to result from passive diffusion (30). In addition to regulation of cell growth,

Introduction
19
many other physiological roles have been proposed for GJIC, for example homeostasis
of nutrients, ions and fluids between cells; electrical coupling; tissue response to
hormones and regulation of embryonic development.
Once formed, gap junction channels can open and close and this 'gating' is controlled by
several mechanisms including connexin phosphorylation. Other mechanisms regulating
channel gating include intracellular levels of hydrogen and calcium ions, transjunctional
voltage and free radicals (30). Decreased pH or pCa induce channel closure in a cell-
and connexin-specific manner. Excessive intracellular levels of free radicals can also
decrease gap junction channel permeability. The radicals may directly attack connexins
or other plasma membrane components (e.g. fatty acids) or may induce changes in
Figure 1.5: Schematic view of gap junctions, connexons and connexins (31)
intracellular calcium levels or redox status. GJIC can be seen as another intermediate
biomarker of colorectal carcinogenesis because cancer cells, which do not contact inhibit,
do not have growth control, do not terminally differentiate and usually have an abnormal
apoptosis response, do not appear to have functional GJIC (30). The vast majority of
tumor cells have fewer and smaller gap junctions, express less connexins and have
Gap junction
Channel
Connexin
Connexon
Cytoplasm
Cytoplasm
Plasma
membrane
Extracellular
space
Plasma
membrane
Chapter 1
20
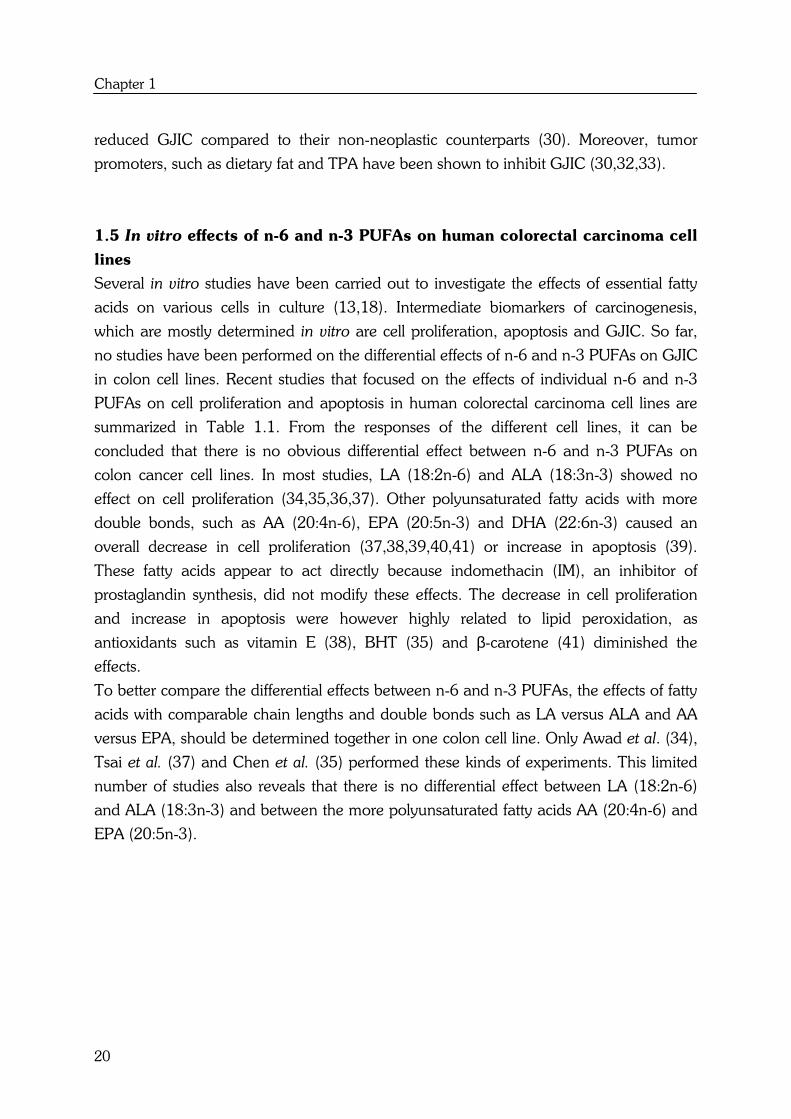
reduced GJIC compared to their non-neoplastic counterparts (30). Moreover, tumor
promoters, such as dietary fat and TPA have been shown to inhibit GJIC (30,32,33).
1.5 In vitro effects of n-6 and n-3 PUFAs on human colorectal carcinoma cell
lines
Several in vitro studies have been carried out to investigate the effects of essential fatty
acids on various cells in culture (13,18). Intermediate biomarkers of carcinogenesis,
which are mostly determined in vitro are cell proliferation, apoptosis and GJIC. So far,
no studies have been performed on the differential effects of n-6 and n-3 PUFAs on GJIC
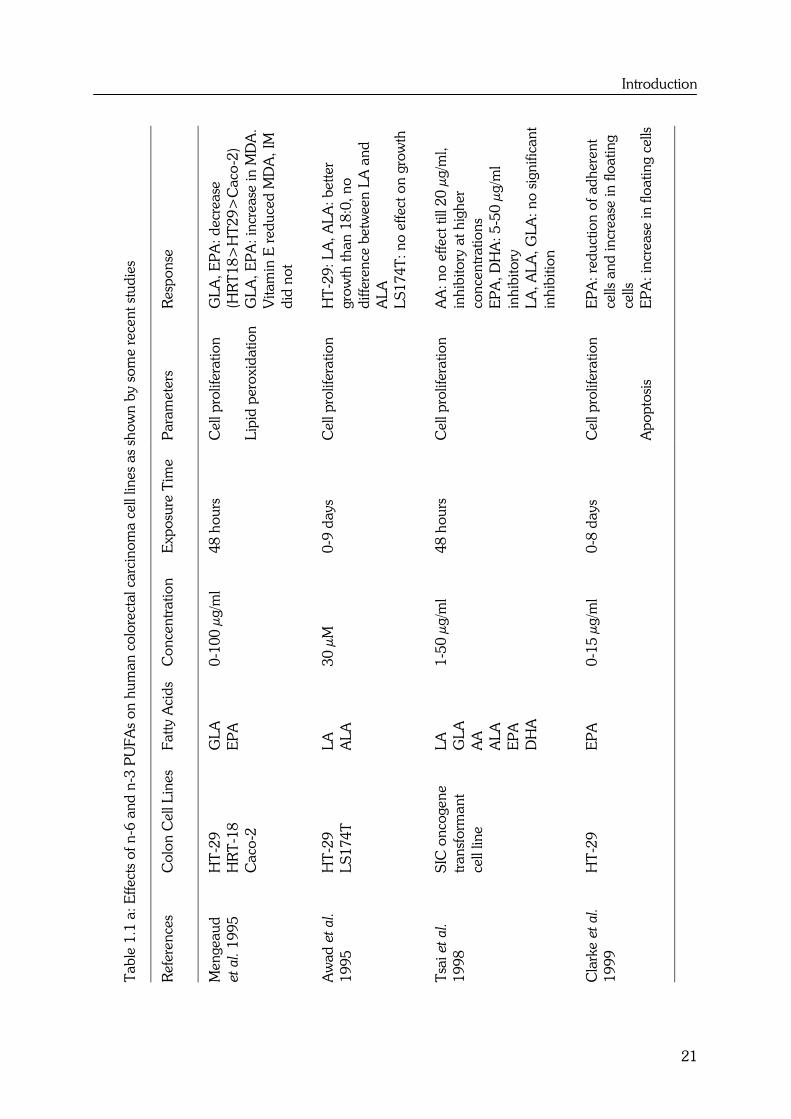
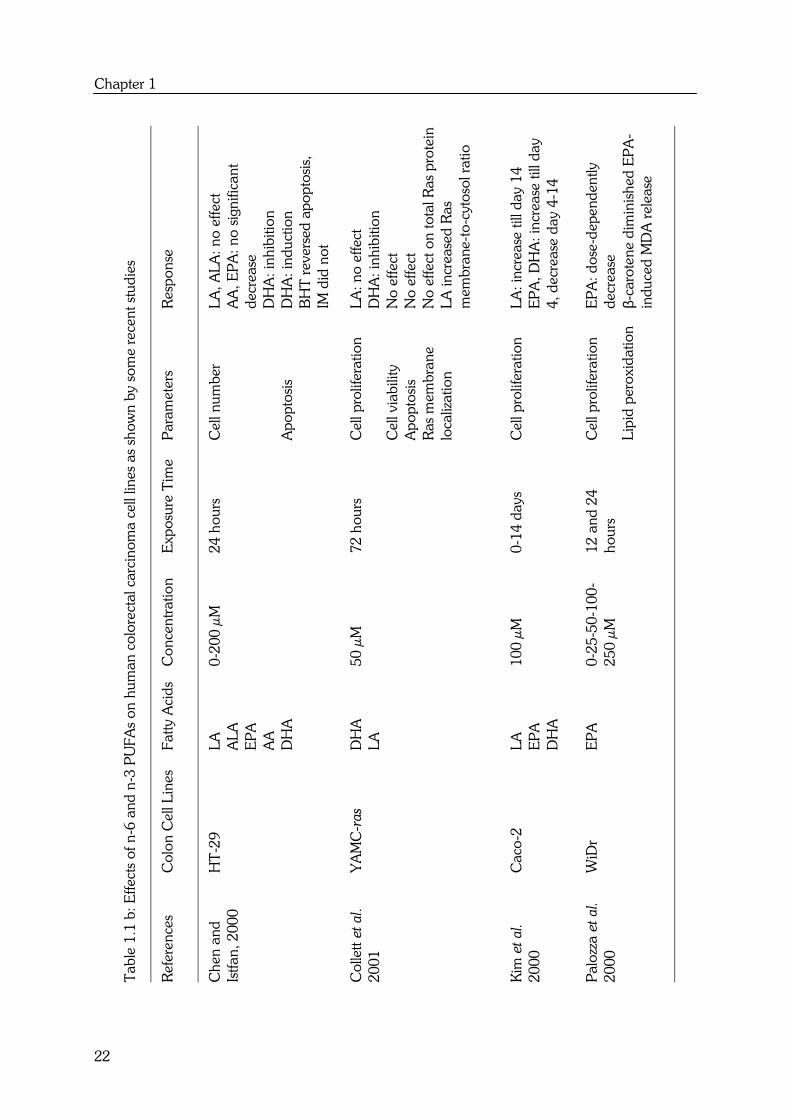
in colon cell lines. Recent studies that focused on the effects of individual n-6 and n-3
PUFAs on cell proliferation and apoptosis in human colorectal carcinoma cell lines are
summarized in Table 1.1. From the responses of the different cell lines, it can be
concluded that there is no obvious differential effect between n-6 and n-3 PUFAs on
colon cancer cell lines. In most studies, LA (18:2n-6) and ALA (18:3n-3) showed no
effect on cell proliferation (34,35,36,37). Other polyunsaturated fatty acids with more
double bonds, such as AA (20:4n-6), EPA (20:5n-3) and DHA (22:6n-3) caused an
overall decrease in cell proliferation (37,38,39,40,41) or increase in apoptosis (39).
These fatty acids appear to act directly because indomethacin (IM), an inhibitor of
prostaglandin synthesis, did not modify these effects. The decrease in cell proliferation
and increase in apoptosis were however highly related to lipid peroxidation, as
antioxidants such as vitamin E (38), BHT (35) and β-carotene (41) diminished the
effects.
To better compare the differential effects between n-6 and n-3 PUFAs, the effects of fatty
acids with comparable chain lengths and double bonds such as LA versus ALA and AA
versus EPA, should be determined together in one colon cell line. Only Awad et al. (34),
Tsai et al. (37) and Chen et al. (35) performed these kinds of experiments. This limited
number of studies also reveals that there is no differential effect between LA (18:2n-6)
and ALA (18:3n-3) and between the more polyunsaturated fatty acids AA (20:4n-6) and
EPA (20:5n-3).
Introduction
21
Resp
on
se
GL
A, E
PA
: d
ecr
ease
(HR
T1
8>
HT
29
>C
aco
-2)
GL
A, E
PA
: in
crease
in
MD
A.
Vitam
in E
red
uce
d M
DA
, IM
did
no
t
HT
-29
: L
A,
AL
A: b
ett
er
gro
wth
th
an
18
:0,
no
diffe
ren
ce b
etw
een
LA
an
d
AL
A
LS
17
4T
: n
o e
ffect
on
gro
wth
AA
: n
o e
ffect
till
20
µg/m
l,
inh
ibito
ry a
t h
igh
er
con
cen
tratio
ns
EP
A, D
HA
: 5
-50
µg/m
l
inh
ibito
ry
LA
, A
LA
, G
LA
: n
o s
ign
ific
an
t
inh
ibitio
n
EP
A: re
du
ctio
n o
f ad
here
nt
cells
an
d in
crease
in
flo
atin
g
cells
EP
A: in
crease
in
flo
atin
g c
ells
Para
mete
rs
Cell
pro
lifera
tio
n
Lip
id p
ero
xid
atio
n
Cell
pro
lifera
tio
n
Cell
pro
lifera
tio
n
Cell
pro
lifera
tio
n
Ap
op
tosi
s
Exp
osu
re T
ime
48
ho
urs
0-9
days
48
ho
urs
0-8
days
Co
nce
ntr
atio
n
0-1
00
µg/m
l
30
µM
1-5
0 µ
g/m
l
0-1
5 µ
g/m
l
Fatt
y A
cid
s
GL
A
EP
A
LA
AL
A
LA
GL
A
AA
AL
A
EP
A
DH
A
EP
A
Co
lon
Cell
Lin
es
HT
-29
HR
T-1
8
Caco
-2
HT
-29
LS
17
4T
SIC
on
cogen
e
tran
sfo
rman
t
cell
line
HT
-29
Tab
le 1
.1 a
: E
ffect
s o
f n
-6 a
nd
n-3
PU
FA
s o
n h
um
an
co
lore
ctal ca
rcin
om
a c
ell
lines
as
sho
wn
by s
om
e r
ece
nt st
ud
ies
Refe
ren
ces
Men
geau
d
et al. 1
99
5
Aw
ad
et al.
19
95
Tsa
i et
al.
19
98
Cla
rke e
t al.
19
99
Chapter 1
22
Resp
on
se
LA
, A
LA
: n
o e
ffect
AA
, E
PA
: n
o s
ign
ific
an
t
decr
ease
DH
A: in
hib
itio
n
DH
A: in
du
ctio
n
BH
T r
evers
ed
ap
op
tosi
s,
IM d
id n
ot
LA
: n
o e
ffect
DH
A: in
hib
itio
n
No
eff
ect
No
eff
ect
No
eff
ect
on
to
tal R
as
pro
tein
LA
in
crease
d R
as
mem
bra
ne-t
o-c
yto
sol ra
tio
LA
: in
crease
till
day 1
4
EP
A, D
HA
: in
crease
till
day
4, d
ecr
ease
day 4
-14
EP
A: d
ose
-dep
en
den
tly
decr
ease
β-ca
rote
ne d
imin
ish
ed
EP
A-
ind
uce
d M
DA
rele
ase
Para
mete
rs
Cell
nu
mb
er
Ap
op
tosi
s
Cell
pro
lifera
tio
n
Cell
via
bili
ty
Ap
op
tosi
s
Ras
mem
bra
ne
loca
lizatio
n
Cell
pro
lifera
tio
n
Cell
pro
lifera
tio
n
Lip
id p
ero
xid
atio
n
Exp
osu
re T
ime
24
ho
urs
72
ho
urs
0-1
4 d
ays
12
an
d 2
4
ho
urs
Co
nce
ntr
atio
n
0-2
00
µM
50
µM
10
0 µ
M
0-2
5-5
0-1
00
-
25
0 µ
M
Fatt
y A
cid
s
LA
AL
A
EP
A
AA
DH
A
DH
A
LA
LA
EP
A
DH
A
EP
A
Co
lon
Cell
Lin
es
HT
-29
YA
MC
-ras
Caco
-2
WiD
r
Tab
le 1
.1 b
: E
ffect
s o
f n
-6 a
nd
n-3
PU
FA
s o
n h
um
an
co
lore
ctal ca
rcin
om
a c
ell
lines
as
sho
wn
by s
om
e r
ece
nt st
ud
ies
Refe
ren
ces
Ch
en
an
d
Istf
an
, 2
00
0
Co
llett e
t al.
20
01
Kim
et al.
20
00
Palo
zza e
t al.
20
00
Introduction
23
1.6 Effects of n-6 and n-3 PUFAs in animal models of colorectal
carcinogenesis
Many in vivo studies have been performed to evaluate the effects of n-6 and n-3 PUFAs
on colorectal carcinogenesis. In a review of 1992, Reddy (42) concluded that the
chemically-induced colon tumor incidence was increased in rats fed diets containing 23%
corn oil as compared to those fed 5% corn oil diets. Diets containing high levels of
dietary fish oil (FO) inhibited the colon tumor incidence, compared to high fat corn oil
diets, during both the initiation and postinitiation phases of colorectal carcinogenesis.
This was mediated by an effect of FO on ornithine decarboxylase activity (ODC), colonic
secondary bile acids and/or prostaglandin synthesis. In the present paragraph the recent
state of the art knowledge of n-6 and n-3 PUFAs on colorectal carcinogenesis in animal
models will be described.
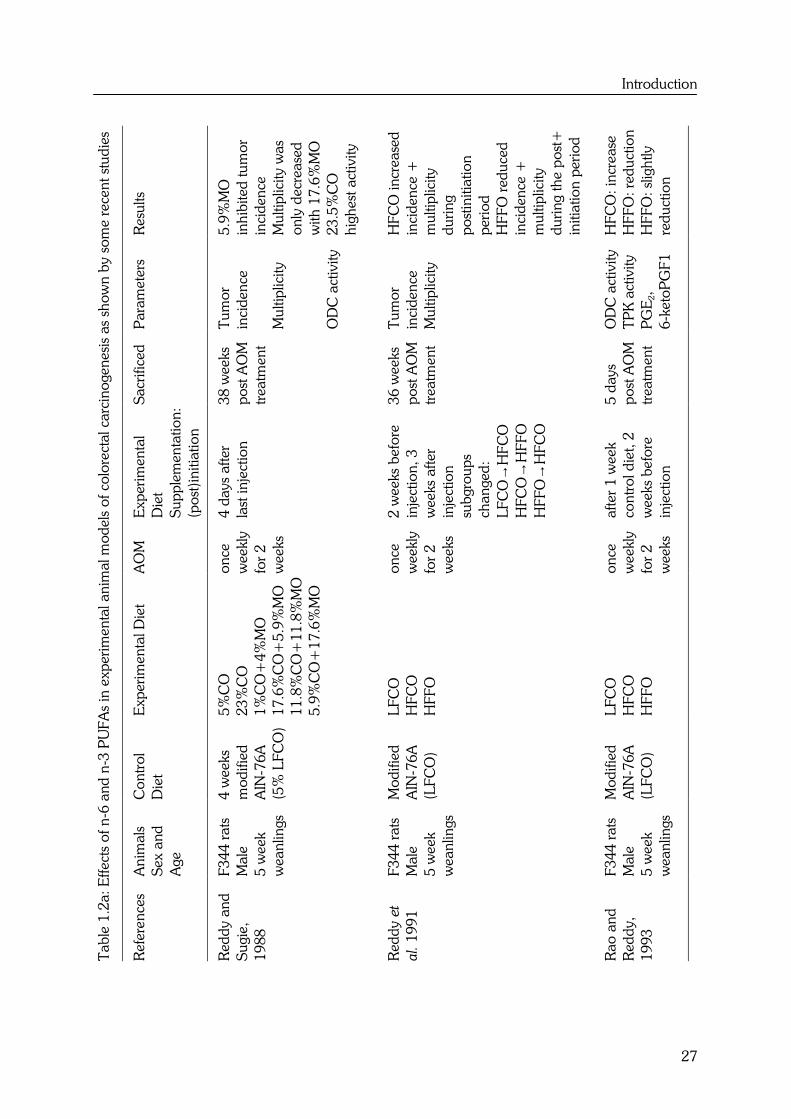
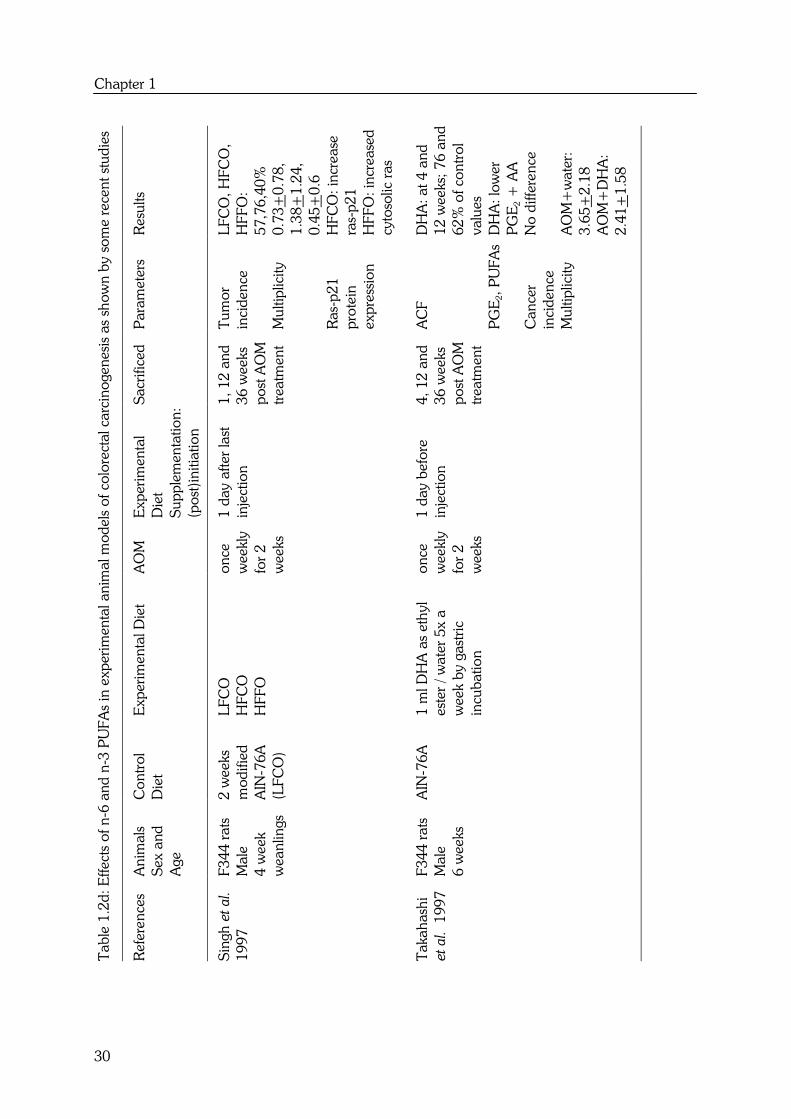
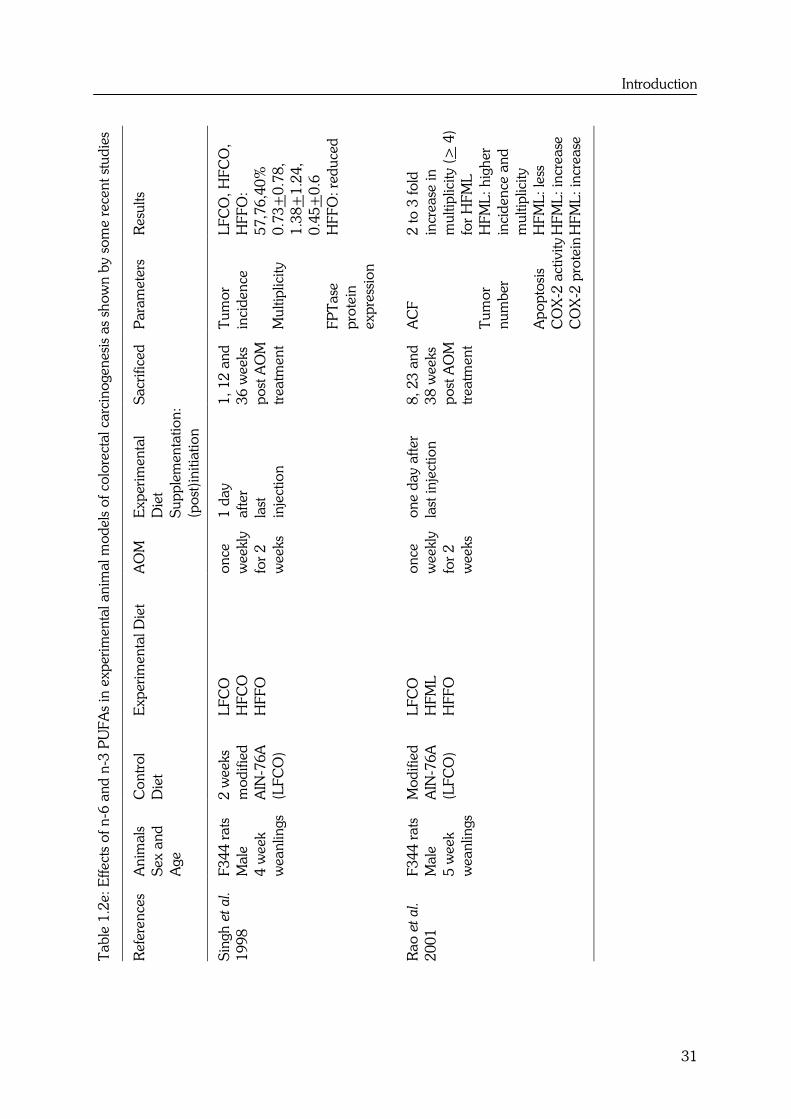
In Table 1.2 several recent experimental animal studies on the effects of n-6 and n-3
PUFAs on colorectal carcinogenesis are summarized. From these studies it became
indeed clear that corn oil (CO) enhances colon tumorigenesis during the postinitiation
phase, whereas FO inhibits colon tumorigenesis during both the initiation and
postinitiation phases of colorectal carcinogenesis (9). Moreover, Singh et al. (43) revealed
that animals fed a high fat fish oil (HFFO) diet have a lower colon tumor incidence and
multiplicity compared to those fed high fat corn oil (HFCO) or low fat corn oil (LFCO)
diets. Not only FO with a high amount of EPA and DHA but also perilla oil (44) with
high levels of ALA and individual n-3 fatty acids such as DHA (45,46) can inhibit
colorectal carcinogenesis.
Reddy and Sugie (8) performed a study to investigate the modulating effects of varying
levels of n-6 and n-3 fatty acids during the promotional phase of colon carcinogenesis in
order to determine the optimum dietary levels of these fatty acids that elicit maximum
inhibition of colon tumors. Inhibition of colon tumor incidence by decreasing the level of
dietary corn oil in the high fat diets or increasing the ratio of n-3 to n-6 fatty acids in the
diet was however not dose-dependent. A 23.5% high fat diet with only 5.9% Menhaden
fish oil and 17.6% corn oil had no enhancing effect on the incidence of total colon
tumors and colon adenocarcinomas as compared to a low fat 5% corn oil diet, whereas
the incidence of total colon tumors and adenocarcinomas was increased in animals fed a
high fat diet containing only 23.5% corn oil compared to a low fat 5% corn oil diet.
These results indicate that a high fat intake is a necessary but not a sufficient condition
for colon tumor promotion, and that the relative proportions of n-3 and n-6 fatty acids in
the diet are determinants of the high fat effects (8).
Besides chemically-induced colon tumors, effects of n-6 and n-3 PUFAs have been
investigated on the development of chemically-induced aberrant crypt foci (ACF) and in
Chapter 1
24
transgenic mice. Oshima et al. (46) have investigated the effects of DHA on mouse
intestinal polyposis using Apc gene knockout mice. Dietary DHA decreased tumor
number in female, but not in male mice. This was the first study that demonstrated that
DHA also inhibits intestinal polyposis induced by an Apc mutation. According to the
authors, this may open a possibility for chemopreventive intervention of familial
adenomatous polyposis (FAP) by dietary supplementation with DHA. In addition, Petrik
et al. (47) were the first to report that dietary EPA also has anti-tumorigenic properties in
the ApcMin/+ mice.
ACF have been used as intermediate biomarkers of colon cancer development in animal
studies (5). Aberrant crypts are crypts, which appear to be larger, thicker and darker than
normal crypts and cluster in aggregates, foci. There are relatively few studies on effects of
n-6 and n-3 PUFAs on ACF formation. Those that have been performed show a
decrease in total ACF incidence and multiplicity by perilla oil (44), DHA (45) and HFFO
(48). These studies only focused on the protecting effect of n-3 PUFAs during the
postinitiation phase of colorectal carcinogenesis. However, the experimental design of
these studies superimposes effects on initiation such as carcinogen metabolism.
It has been demonstrated that fish oil (FO) reduced azoxymethane (AOM)-induced K-ras
mutations and decreased membrane ras expression (49) when given for and after
initiation. These results suggest that FO may protect against colon carcinogenesis by
either decreasing DNA adduct formation and/or enhancing DNA repair. Hong et al. (7)
determined the ability of FO and corn oil (CO) to simultaneously modulate O6-
methylguanine DNA adduct formation (DNA damage), removal by O6-methylguanine-
DNA-methyltransferase (repair) and deletion (apoptosis). No main effect of diet on O6-
methylguanine-DNA-methyltransferase was found. However, FO enhanced apoptosis
combined with a reduction in adduct formation. This may account, in part, for the
observed protective effect of n-3 PUFAs against experimentally-induced colon cancer
during the initiation phase (9). The protective effect could also be explained by
modulation of biotransformation enzymes related to carcinogen activation, thereby
altering the amounts and activities of oxidative (phase I) and conjugative (phase II)
xenobiotic metabolizing enzymes (7,42).
Various mechanisms have been postulated to explain the enhancing effect of a high fat
corn oil diet and the protecting effect of a high fat fish oil diet during the promotion
phase of carcinogenesis. These mechanisms include as stated at the beginning of this
paragraph, modulation of colonic mucosal ODC activity, colonic secondary bile acids
and/or PGE2 synthesis. Secondary bile acids can increase ODC activity and cell
proliferation and act as tumor promoters (50). It has been shown that arachidonic acid
metabolites are involved in increased secondary bile acid production and the induction
Introduction
25
of tissue ODC activity (51,52). It is possible that diets rich in n-3 fatty acids result in
decreased levels of arachidonic acid and its metabolites and thereby inhibits tissue ODC
activity and cell proliferation.
N-3 PUFAs have indeed been reported to inhibit the production of the type-2 series of
eicosanoids, including PGE2, from arachidonic acid (44). Endogenous PGE2 has been
shown to promote rat colon tumors and COX-inhibitors that prevent prostaglandin
production such as indomethacin (IM) can block the development of colon carcinomas
(53). Therefore, the mechanism responsible for the inhibitory effects of n-3 PUFAs on
colorectal tumors may also partly be related to inhibition of PGE2 synthesis from AA and
reduction of the AA levels itself (45). Overexpression of COX-2 has been reported in
90% of colon tumors and premalignant colorectal adenomas. Singh et al. (43) observed
that n-3 PUFAs inhibit AOM-induced expression of COX-2, whereas n-6 PUFAs enhance
levels of AOM-induced COX-2 expression. Also Rao et al. (48) found that n-3 PUFAs in
a high fat fish oil (HFFO) diet inhibited the levels of COX-2 and AA metabolites
(eicosanoids). They suggested that HFFO diets enhance apoptosis via modulation of AA
metabolism and inhibition of COX-2 expression, since overexpression of COX-2 in
intestinal epithelial cells can result in inhibition of apoptosis (54).
Chang et al. (27) investigated whether the protective effect of dietary fish oil during the
promotion phase of tumorigenesis is mediated through changes in proliferation,
differentiation or apoptosis, all intermediate biomarkers for colon tumor development.
Dolichos biflorus agglutinin (DBA) binding (marker of differentiation) was higher for fish
oil versus corn oil fed animals in both proximal and distal colon. There were also a
greater number of apoptotic cells per crypt column in both proximal and distal colon after
feeding with fish oil compared with corn oil, as determined by a combination of the
TUNEL assay and apoptosis morphological identification. However, changes in cell
proliferation (BrdU incorporation) did not explain the beneficial effect of fish oil versus
corn oil. Though, Onogi et al. (44) found that perilla oil significantly reduced silver-
stained argyrophilic nucleolar organizer regions (AgNORs), suggesting that perilla oil
decreased the number of cells in S-phase and thus decreased cell proliferation.
Another inconsistent relationship exists between fish oil and farnesyl protein transferase
(FPTase) expression. FPTase is an enzyme which catalyses the biological activation of ras
proteins. The first step in this process is the transfer of a 15-carbon isoprene, farnesyl, to
the cysteine residue of the C-terminal tetrapeptide sequence, -CAAX, of ras precursors,
which is catalyzed by FPTase. Farnesylation of ras precursors is a critical step during
post-translational modification of ras oncoproteins, thereby enabling their anchorage to
the plasma membrane. Singh et al. (55) demonstrated that consumption of high amounts
of fish oil reduced the levels of FPTase comparing to high corn oil levels, thus inhibiting
Chapter 1
26
post-translational processing of ras precursors resulting in decreased ras functioning.
Davidson et al. (49) found indeed that expression of ras in the mucosal membrane was
13% lower for animals fed fish oil compared with corn oil feeding. They reported
however that perturbation in the farnesylation of ras is not a decisive factor regulating
membrane localization during malignant transformation in the colon, because no
differences in FPTase activity and prenylation state of ras were found between tumors
and uninvolved mucosa.
Overall results from the animal models suggest that n-3 fatty acids protect against
colorectal carcinogenesis during both the initiation and promotion phase and that n-6
fatty acids enhance the risk of colorectal carcinogenesis during the promotion phase. The
mechanisms behind the molecular, cellular and biochemical effects of these fatty acid
families on the complex and multistage process of carcinogenesis are however not clear
and cannot easily be explained by one mechanism.
Introduction
27
Resu
lts
5.9
%M
O
inh
ibited
tu
mo
r
inci
den
ce
Mu
ltip
licity w
as
on
ly d
ecr
ease
d
with
17
.6%
MO
23.5
%C
O
hig
hest
act
ivity
HF
CO
in
crease
d
inci
den
ce +
mu
ltip
licity
du
rin
g
po
stin
itia
tio
n
peri
od
HF
FO
red
uce
d
inci
den
ce +
mu
ltip
licity
du
rin
g th
e p
ost
+
initia
tio
n p
eri
od
HF
CO
: in
crease
HF
FO
: re
du
ctio
n
HF
FO
: sl
igh
tly
red
uct
ion
Para
mete
rs
Tu
mo
r
inci
den
ce
Mu
ltip
licity
OD
C a
ctiv
ity
Tu
mo
r
inci
den
ce
Mu
ltip
licity
OD
C a
ctiv
ity
TP
K a
ctiv
ity
PG
E2,
6-k
eto
PG
F1
Sacr
ific
ed
38
weeks
po
st A
OM
treatm
en
t
36
weeks
po
st A
OM
treatm
en
t
5 d
ays
po
st A
OM
treatm
en
t
Exp
eri
men
tal
Die
t
Su
pp
lem
en
tatio
n:
(po
st)i
nitia
tio
n
4 d
ays
aft
er
last
in
ject
ion
2 w
eeks
befo
re
inje
ctio
n,
3
weeks
aft
er
inje
ctio
n
sub
gro
up
s
chan
ged
:
LF
CO
→H
FC
O
HF
CO
→H
FF
O
HF
FO
→H
FC
O
after
1 w
eek
con
tro
l d
iet, 2
weeks
befo
re
inje
ctio
n
AO
M
on
ce
weekly
for
2
weeks
on
ce
weekly
for
2
weeks
on
ce
weekly
for
2
weeks
Exp
eri
men
tal D
iet
5%
CO
23%
CO
1%
CO
+4%
MO
17.6
%C
O+
5.9
%M
O
11
.8%
CO
+1
1.8
%M
O
5.9
%C
O+
17
.6%
MO
LF
CO
HF
CO
HF
FO
LF
CO
HF
CO
HF
FO
Co
ntr
ol
Die
t
4 w
eeks
mo
difie
d
AIN
-76
A
(5%
LF
CO
)
Mo
difie
d
AIN
-76
A
(LF
CO
)
Mo
difie
d
AIN
-76
A
(LF
CO
)
An
imals
Sex a
nd
Age
F3
44
rats
Male
5 w
eek
wean
lings
F3
44
rats
Male
5 w
eek
wean
lings
F3
44
rats
Male
5 w
eek
wean
lings
Tab
le 1
.2a:
Eff
ect
s o
f n
-6 a
nd
n-3
PU
FA
s in
exp
eri
men
tal an
imal m
od
els
of
colo
rect
al ca
rcin
ogen
esi
s as
sho
wn
by s
om
e r
ece
nt
stu
die
s
Refe
ren
ces
Red
dy a
nd
Su
gie
,
19
88
Red
dy e
t
al. 1
99
1
Rao
an
d
Red
dy,
19
93

Chapter 1
28
Resu
lts
DH
A: n
o e
ffect
in m
ale
s,
decr
ease
in
fem
ale
s
Peri
lla o
il: less
AC
F (
do
se-
dep
en
dan
t)
P1
2: le
ss P
GE
2
red
uce
d b
y
peri
lla o
il
red
uce
d b
y
peri
lla o
il
LF
CO
, H
FF
O:
decr
ease
HF
FO
: d
ecr
ease
HF
FO
: in
crease
in p
rim
ary
an
d
decr
ease
in
seco
nd
ary
bile
aci
ds
Para
mete
rs
Po
lyp
nu
mb
er
AC
F
PG
E2
Cell
pro
lifera
tio
n
C-H
-ras
Exp
ress
ion
Bact
eri
al 7α-
deh
yd
roxyla
se
PI-
PL
C
Feca
l bile
aci
ds
Sacr
ific
ed
after
7
weeks
die
t
4 w
eeks
after
firs
t
inje
ctio
n
1,
12
an
d
36
weeks
po
st A
OM
treatm
en
t
Exp
eri
men
tal
Die
t
Su
pp
lem
en
tatio
n:
(po
st)i
nitia
tio
n
7 w
eeks
1 w
eek b
efo
re
firs
t in
ject
ion
1 d
ay a
fter
last
inje
ctio
n
AO
M
on
ce
weekly
for
3
weeks
on
ce
weekly
for
2
weeks
Exp
eri
men
tal D
iet
3%
DH
A a
s
eth
yl est
er
+ A
IN-7
6A
O12:
12
% o
live o
il
S1
2:
12
%
safflo
wer
oil
P12
: 1
2%
peri
lla o
il
P6O
6: 6%
peri
lla o
il
+ 6
% o
live o
il
P3O
9: 3%
peri
lla o
il
+ 9
% o
live o
il
LF
CO
HF
CO
HF
FO
Co
ntr
ol
Die
t
AIN
-76
A
basa
l
labo
rato
ry
die
t
2 w
eeks
mo
difie
d
AIN
-76
A
(LF
CO
)
An
imals
Sex a
nd
Age
Ap
c∆ 716
mic
e
Male
+
Fem
ale
3 w
eeks
F3
44
rats
Male
5-6
weeks
F3
44
rats
Male
Wean
lings
Tab
le 1
.2b
: E
ffect
s o
f n
-6 a
nd
n-3
PU
FA
s in
exp
eri
men
tal an
imal m
od
els
of
colo
rect
al ca
rcin
ogen
esi
s as
sho
wn
by s
om
e r
ece
nt
stu
die
s
Refe
ren
ces
Osh
ima e
t
al. 1
99
5
On
ogi et
al. 1
99
6
Red
dy e
t
al. 1
99
6

Introduction
29
Resu
lts
PL
A2
: n
o
diffe
ren
ce
PI-
PL
C: d
ecr
ease
by L
FC
O,
HF
FO
HF
FO
: d
ecr
ease
CO
: h
igh
er
FO
: h
igh
er
FO
: h
igh
er
CO
: 7
0.3
%
FO
: 5
6.1
%
LF
CO
, H
FC
O,
HF
FO
:
57
,76
,40
%
0.7
3+
0.7
8,
1.3
8+
1.2
4,
0.4
5+
0.6
CO
X-1
: n
o
diffe
ren
ces
CO
X-2
: h
igh
er
in
HF
CO
Para
mete
rs
PL
A2
+ P
I-
PL
C a
ctiv
ity
CO
X a
ctiv
ity
Cell
pro
lifera
tio
n
Cell
diffe
ren
tiatio
n
Ap
op
tosi
s
Ad
en
oca
rcin
o
ma in
cid
en
ce
Tu
mo
r
inci
den
ce
Mu
ltip
licity
CO
X-1
an
d
CO
X-2
pro
tein
exp
ress
ion
Sacr
ific
ed
1,
12
an
d
36
weeks
po
st A
OM
treatm
en
t
16
an
d 3
4
weeks
po
st
AO
M
treatm
en
t
1,
12
an
d
36
weeks
po
st A
OM
treatm
en
t
Exp
eri
men
tal
Die
t
Su
pp
lem
en
tatio
n:
(po
st)i
nitia
tio
n
1 d
ay a
fter
last
inje
ctio
n
1 w
eek b
efo
re
inje
ctio
n
1 d
ay a
fter
last
inje
ctio
n
AO
M
on
ce
weekly
for
2
weeks
on
ce
weekly
for
2
weeks
on
ce
weekly
for
2
weeks
Exp
eri
men
tal D
iet
LF
CO
HF
CO
HF
FO
CO
FO
LF
CO
HF
CO
HF
FO
Co
ntr
ol
Die
t
Mo
difie
d
AIN
-76
A
(LF
CO
)
Sta
nd
ard
rat ch
ow
2 w
eeks
mo
difie
d
AIN
-76
A
(LF
CO
)
An
imals
Sex a
nd
Age
F3
44
rats
Male
5 w
eek
wean
lings
Sp
ragu
e-
Daw
ley
rats
Male
21
days
wean
lings
F3
44
rats
Male
4 w
eek
wean
lings
Tab
le 1
.2c:
Eff
ect
s o
f n
-6 a
nd
n-3
PU
FA
s in
exp
eri
men
tal an
imal m
od
els
of
colo
rect
al ca
rcin
ogen
esi
s as
sho
wn
by s
om
e r
ece
nt
stu
die
s
Refe
ren
ces
Rao
et al.
19
96
Ch
an
g e
t
al. 1
99
7
Sin
gh
et al.
19
97
Chapter 1
30
Resu
lts
LF
CO
, H
FC
O,
HF
FO
:
57
,76
,40
%
0.7
3+
0.7
8,
1.3
8+
1.2
4,
0.4
5+
0.6
HF
CO
: in
crease
ras-
p2
1
HF
FO
: in
crease
d
cyto
solic
ras
DH
A: at
4 a
nd
12
weeks;
76
an
d
62%
of co
ntr
ol
valu
es
DH
A: lo
wer
PG
E2 +
AA
No
diffe
ren
ce
AO
M+
wate
r:
3.6
5+
2.1
8
AO
M+
DH
A:
2.4
1+
1.5
8
Para
mete
rs
Tu
mo
r
inci
den
ce
Mu
ltip
licity
Ras-
p2
1
pro
tein
exp
ress
ion
AC
F
PG
E2,
PU
FA
s
Can
cer
inci
den
ce
Mu
ltip
licity
Sacr
ific
ed
1,
12
an
d
36
weeks
po
st A
OM
treatm
en
t
4,
12
an
d
36
weeks
po
st A
OM
treatm
en
t
Exp
eri
men
tal
Die
t
Su
pp
lem
en
tatio
n:
(po
st)i
nitia
tio
n
1 d
ay a
fter
last
inje
ctio
n
1 d
ay b
efo
re
inje
ctio
n
AO
M
on
ce
weekly
for
2
weeks
on
ce
weekly
for
2
weeks
Exp
eri
men
tal D
iet
LF
CO
HF
CO
HF
FO
1 m
l D
HA
as
eth
yl
est
er
/ w
ate
r 5
x a
week b
y g
ast
ric
incu
batio
n
Co
ntr
ol
Die
t
2 w
eeks
mo
difie
d
AIN
-76
A
(LF
CO
)
AIN
-76
A
An
imals
Sex a
nd
Age
F3
44
rats
Male
4 w
eek
wean
lings
F3
44
rats
Male
6 w
eeks
Tab
le 1
.2d
: E
ffect
s o
f n
-6 a
nd
n-3
PU
FA
s in
exp
eri
men
tal an
imal m
od
els
of
colo
rect
al ca
rcin
ogen
esi
s as
sho
wn
by s
om
e r
ece
nt
stu
die
s
Refe
ren
ces
Sin
gh
et al.
19
97
Takah
ash
i
et al.
19
97
Introduction
31
Resu
lts
LF
CO
, H
FC
O,
HF
FO
:
57
,76
,40
%
0.7
3+
0.7
8,
1.3
8+
1.2
4,
0.4
5+
0.6
HF
FO
: re
du
ced
2 to
3 f
old
incr
ease
in
mu
ltip
licity (
> 4
)
for
HF
ML
HF
ML
: h
igh
er
inci
den
ce a
nd
mu
ltip
licity
HF
ML
: le
ss
HF
ML
: in
crease
HF
ML
: in
crease
Para
mete
rs
Tu
mo
r
inci
den
ce
Mu
ltip
licity
FP
Tase
pro
tein
exp
ress
ion
AC
F
Tu
mo
r
nu
mb
er
Ap
op
tosi
s
CO
X-2
act
ivity
CO
X-2
pro
tein
Sacr
ific
ed
1,
12
an
d
36
weeks
po
st A
OM
treatm
en
t
8,
23
an
d
38
weeks
po
st A
OM
treatm
en
t
Exp
eri
men
tal
Die
t
Su
pp
lem
en
tatio
n:
(po
st)i
nitia
tio
n
1 d
ay
after
last
inje
ctio
n
on
e d
ay a
fter
last
in
ject
ion
AO
M
on
ce
weekly
for
2
weeks
on
ce
weekly
for
2
weeks
Exp
eri
men
tal D
iet
LF
CO
HF
CO
HF
FO
LF
CO
HF
ML
HF
FO
Co
ntr
ol
Die
t
2 w
eeks
mo
difie
d
AIN
-76
A
(LF
CO
)
Mo
difie
d
AIN
-76
A
(LF
CO
)
An
imals
Sex a
nd
Age
F3
44
rats
Male
4 w
eek
wean
lings
F3
44
rats
Male
5 w
eek
wean
lings
Tab
le 1
.2e:
Eff
ect
s o
f n
-6 a
nd
n-3
PU
FA
s in
exp
eri
men
tal an
imal m
od
els
of
colo
rect
al ca
rcin
ogen
esi
s as
sho
wn
by s
om
e r
ece
nt
stu
die
s
Refe
ren
ces
Sin
gh
et al.
19
98
Rao
et al.
20
01
Chapter 1
32
1.7 Possible mechanisms of the (anti)-carcinogenic effects of n-3 and n-6
PUFAs on colorectal carcinogenesis; the role of PGE2 and oxidative stress
PUFAs (n-6 and n-3) are released from phospholipids in the cell membrane by
phospholipase A2 and can be further metabolized via cyclooxygenase (COX) to form
prostaglandins (PG). Two isoforms of COX have been identified, COX-1 and COX-2.
COX-1 is responsible for 'housekeeping' prostaglandin biosynthesis and is constitutively
expressed in most tissues in the body. COX-2 on the other hand is inducible by growth
factors, cytokines and tumor promoters (56).
Prostaglandins act in an autocrine or paracrine fashion at nanomolar levels via binding to
G-protein-coupled nuclear or cell-surface receptors (57). Although eight prostanoid
receptor subtypes have been identified, four of them (the EP receptors EP1, EP2, EP3
and EP4) are specific for PGE2 signaling (56,58). Activation of the EP-receptors by PGE2
leads to changes in intracellular cAMP or calcium. These changes serve as second
messengers that can activate signaling mechanisms that have profound effects on
transcription factor function and attribute to changes in gene expression (see Figure 1.6).
A few reports have documented a pro-carcinogenic effect of PGE2 in cultured colorectal
cancer cells. Sheng et al. (59) reported that PGE2 might stimulate an increase in
proliferation and motility of colorectal carcinoma cells via activation of the PI3/Akt
pathway, an effect likely due to activation of the PGE2 receptor subtype EP4. Increased
levels of PGE2 have been found in colon tumors (60) and moreover overexpression of
COX-2 has been reported in 90% of colon tumors and premalignant colorectal
adenomas (61).
The n-6 fatty acid arachidonic acid (AA; 20:4n-6) is the precursor of the 2-series of
prostaglandins, including PGE2. The n-3 fatty acid eicosapentaenoic acid (EPA; 20:5n-3)
can compete with AA, both at the level of incorporation into the cell membrane
phospholipids as well as at the level of substrate for the COX pathway generating the 3-
series of prostaglandins, including PGE3. Although similar in structure and stability, PGE2
is thought to be more mitogenic compared with PGE3. It is hypothesized that AA could
enhance colorectal carcinogenesis via increased production of PGE2. The mechanism
responsible for the inhibitory effects of n-3 PUFAs such as EPA on colorectal tumors may
partly be related to inhibition of PGE2 synthesis from AA. However, the exact role of
PGE2 in the colon cancer modulating effects of AA and EPA is not known. Moreover,
studies directly comparing the effects of AA and EPA on colon tumor cell growth have
not been reported.

Introduction
33
Figure 1.6: Prostaglandin and oxidative stress related hypothesis regarding the (anti)-colon
carcinogenic effects of n-3 and n-6 PUFAs
In addition to the place of the double bond in PUFAs, which determines the type of
prostaglandin formation, also the number of double bonds in the carbon atom chain of
PUFAs may play an important role in the (anti)-colon carcinogenic effects of n-3 and n-6
PUFAs. The number of double bonds will affect the susceptibility to lipid peroxidation.
Increased lipid peroxidation can lead to oxidative stress, which is an imbalance between
the production of oxidizing molecular species (oxidants) and the presence of cellular
antioxidants (62). This imbalance can lead to potential cell damage, including oxidative
DNA damage, that can lead to mutations and eventually tumors (63).
More recently newer concepts about oxidative stress have gained broad acceptance.
These concepts imply that oxidative stress in a cell not only modifies target
macromolecules but also alerts a number of ‘redox sensors’ that can alter cell signaling
which ultimately leads to specific gene activation.
corn oil
LA
↓AA
PGE2
EPA
fish oil
COX-2
PGE2
PGE2
EP++Ca2+or
cAMP
COLON CELL
GROWTH
nucleus
PK
ACF
--
EP
PGE3
OXIDATIVE
STRESS
ALA
↓
Chapter 1
34
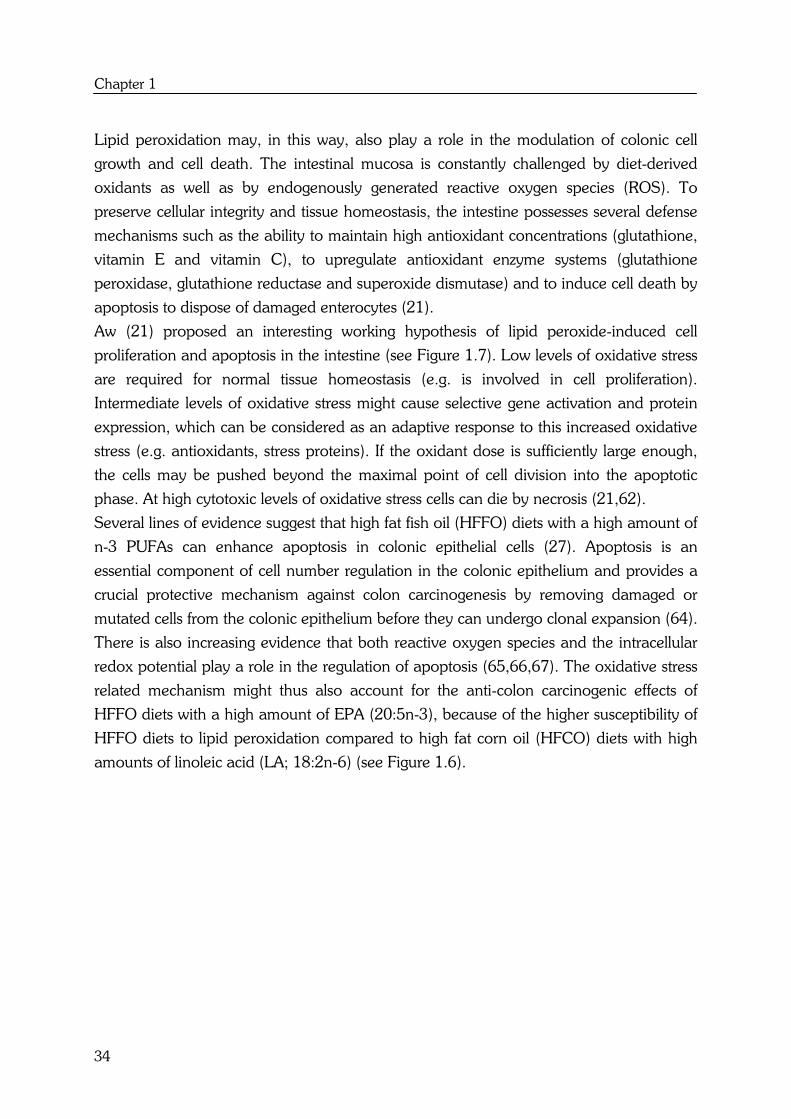
Lipid peroxidation may, in this way, also play a role in the modulation of colonic cell
growth and cell death. The intestinal mucosa is constantly challenged by diet-derived
oxidants as well as by endogenously generated reactive oxygen species (ROS). To
preserve cellular integrity and tissue homeostasis, the intestine possesses several defense
mechanisms such as the ability to maintain high antioxidant concentrations (glutathione,
vitamin E and vitamin C), to upregulate antioxidant enzyme systems (glutathione
peroxidase, glutathione reductase and superoxide dismutase) and to induce cell death by
apoptosis to dispose of damaged enterocytes (21).
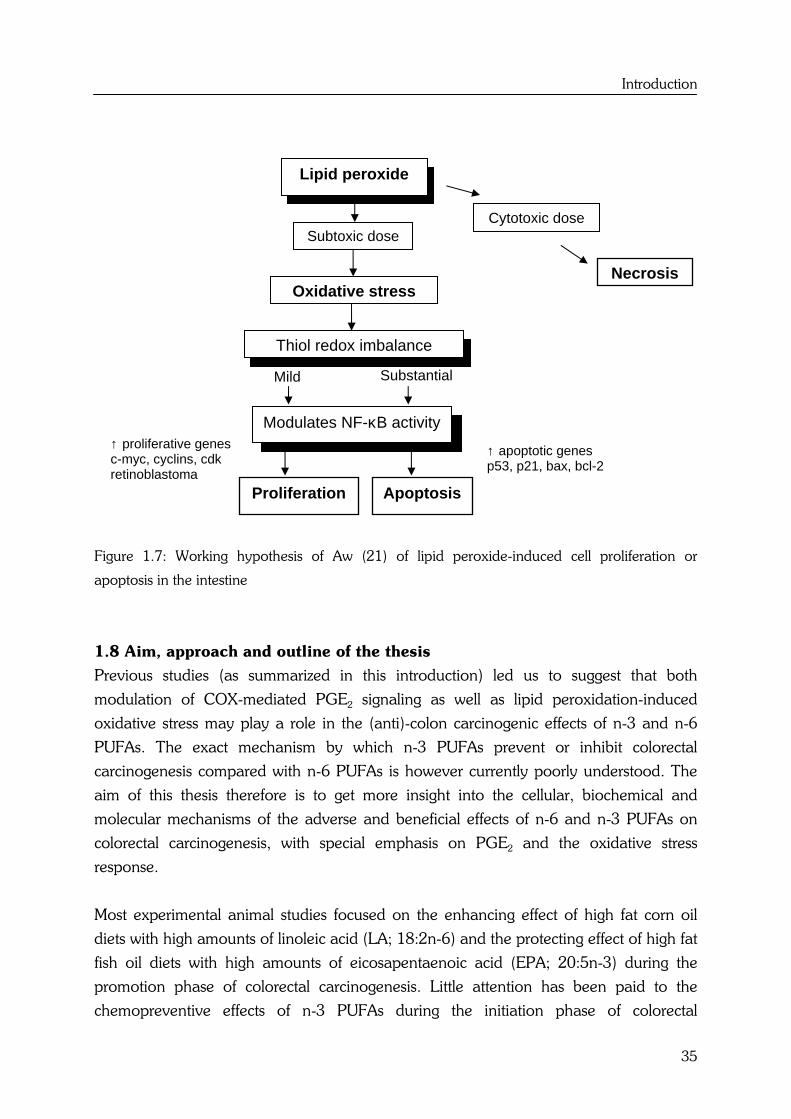
Aw (21) proposed an interesting working hypothesis of lipid peroxide-induced cell
proliferation and apoptosis in the intestine (see Figure 1.7). Low levels of oxidative stress
are required for normal tissue homeostasis (e.g. is involved in cell proliferation).
Intermediate levels of oxidative stress might cause selective gene activation and protein
expression, which can be considered as an adaptive response to this increased oxidative
stress (e.g. antioxidants, stress proteins). If the oxidant dose is sufficiently large enough,
the cells may be pushed beyond the maximal point of cell division into the apoptotic
phase. At high cytotoxic levels of oxidative stress cells can die by necrosis (21,62).
Several lines of evidence suggest that high fat fish oil (HFFO) diets with a high amount of
n-3 PUFAs can enhance apoptosis in colonic epithelial cells (27). Apoptosis is an
essential component of cell number regulation in the colonic epithelium and provides a
crucial protective mechanism against colon carcinogenesis by removing damaged or
mutated cells from the colonic epithelium before they can undergo clonal expansion (64).
There is also increasing evidence that both reactive oxygen species and the intracellular
redox potential play a role in the regulation of apoptosis (65,66,67). The oxidative stress
related mechanism might thus also account for the anti-colon carcinogenic effects of
HFFO diets with a high amount of EPA (20:5n-3), because of the higher susceptibility of
HFFO diets to lipid peroxidation compared to high fat corn oil (HFCO) diets with high
amounts of linoleic acid (LA; 18:2n-6) (see Figure 1.6).
Introduction
35
Figure 1.7: Working hypothesis of Aw (21) of lipid peroxide-induced cell proliferation or
apoptosis in the intestine
1.8 Aim, approach and outline of the thesis
Previous studies (as summarized in this introduction) led us to suggest that both
modulation of COX-mediated PGE2 signaling as well as lipid peroxidation-induced
oxidative stress may play a role in the (anti)-colon carcinogenic effects of n-3 and n-6
PUFAs. The exact mechanism by which n-3 PUFAs prevent or inhibit colorectal
carcinogenesis compared with n-6 PUFAs is however currently poorly understood. The
aim of this thesis therefore is to get more insight into the cellular, biochemical and
molecular mechanisms of the adverse and beneficial effects of n-6 and n-3 PUFAs on
colorectal carcinogenesis, with special emphasis on PGE2 and the oxidative stress
response.
Most experimental animal studies focused on the enhancing effect of high fat corn oil
diets with high amounts of linoleic acid (LA; 18:2n-6) and the protecting effect of high fat
fish oil diets with high amounts of eicosapentaenoic acid (EPA; 20:5n-3) during the
promotion phase of colorectal carcinogenesis. Little attention has been paid to the
chemopreventive effects of n-3 PUFAs during the initiation phase of colorectal
Substantial Mild
Subtoxic dose Cytotoxic dose
Necrosis Oxidative stress
Thiol redox imbalance
↑ apoptotic genes p53, p21, bax, bcl-2
Lipid peroxide
Modulates NF-κB activity ↑ proliferative genes c-myc, cyclins, cdk retinoblastoma Proliferation Apoptosis
Chapter 1
36
carcinogenesis, such as carcinogen metabolism and initiation of aberrant crypt foci
(ACF). Therefore we studied the differential effects of n-3 and n-6 PUFAs and the role of
PGE2 and oxidative stress in the (anti)-colon carcinogenic effects of n-3 and n-6 PUFAs
in different stages (tumor, ACF, normal) of colorectal carcinogenesis:
- human colon adenocarcinoma cells (in vitro)
- AOM-induced aberrant crypt foci (ACF; precursor lesions of colon cancer) in rat
- normal rat colonic epithelium
Different intermediate biomarkers of colorectal carcinogenesis such as GJIC, cellular
proliferation, cellular differentiation and cell death or cytotoxicity may be involved in the
(anti)-colon carcinogenic effects of n-3 and n-6 PUFAs. The role of GJIC in the
carcinogenic and anticarcinogenic effects of n-6 and n-3 PUFAs during spontaneous
proliferation and differentiation of the human colon adenocarcinoma cell line Caco-2 is
described in chapter 2. Chapter 3 describes the role of enzymatic and spontaneous lipid
peroxidation and the role of PGE2 in n-6 and n-3 PUFA-mediated effects on cellular
proliferation and cell death. The experiments described in this chapter have been
performed in vitro in human colon adenocarcinoma cell lines.
Chapter 4 deals with an animal experiment that has been carried out to investigate the
role of lipid peroxidation and PGE2 in high fat fish oil (HFFO) and high fat corn oil
(HFCO)-mediated effects on rat colon carcinogenesis. Because so far little attention has
been paid to the chemopreventive effects of n-3 PUFAs, differential effects of HFFO and
HFCO diets on AOM-induced aberrant crypt foci (ACF), precursor lesions of colon
cancer were studied. In order to investigate the modulating effects of these diets on the
initiation of ACF, differential effects on metabolic activation and detoxification of AOM
were also analyzed in this chapter.
In chapter 5 and 6 transcriptomics experiments are described that were carried out to get
more insight into the molecular mechanisms behind the physiological effects described in
this thesis and to provide new mechanistic insights underlying the differential effects of
n-6 and n-3 PUFAs on colorectal carcinogenesis (chapter 5) and tumor cell growth
(chapter 6). In chapter 7, main findings are summarized and discussed.

Introduction
37
References
1. Woutersen, R.A., Appel M.J., van Garderen-Hoetmer A. and Wijnands M.V.
(1999) Dietary fat and carcinogenesis. Mutat Res, 443, 111-27.
2. Visser, O., Coebergh J., Schouten L. and Van Dijck J. (2001) Incidence of Cancer
in The Netherlands. Vereniging van Integrale Kankercentra, Utrecht, pp. 86.
3. WCRF-AICR (1997) Food, nutrition and the prevention of cancer: a global
perspective, Washington DC.
4. Kinzler, K.W. and Vogelstein B. (1998) Colorectal Tumors. In Vogelstein, B. and
Kinzler, K.W. (eds), The genetic basis of human cancer. Mc Graw Hill, Baltimore.
5. Roncucci, L., Pedroni M., Vaccina F., Benatti P., Marzona L. and De Pol A.
(2000) Aberrant crypt foci in colorectal carcinogenesis. Cell and crypt dynamics.
Cell Prolif, 33, 1-18.
6. Doll, R. and Peto R. (1981) The causes of cancer: quantitative estimates of
avoidable risks of cancer in the United States today. J Natl Cancer Inst, 66, 1191-
308.
7. Hong, M.Y., Lupton J.R., Morris J.S., Wang N., Carroll R.J., Davidson L.A., Elder
R.H. and Chapkin R.S. (2000) Dietary fish oil reduces O6-methylguanine DNA
adduct levels in rat colon in part by increasing apoptosis during tumor initiation.
Cancer Epidemiol Biomarkers Prev, 9, 819-26.
8. Reddy, B.S. and Sugie S. (1988) Effect of different levels of omega-3 and omega-
6 fatty acids on azoxymethane-induced colon carcinogenesis in F344 rats. Cancer
Res, 48, 6642-7.
9. Reddy, B.S., Burill C. and Rigotty J. (1991) Effect of diets high in omega-3 and
omega-6 fatty acids on initiation and postinitiation stages of colon carcinogenesis.
Cancer Res, 51, 487-91.
10. Gurr, M. (1996) Fats. In Garrow, J.S. and James, W.P.T. (eds), Human Nutrition
and Dietetics. (nine edn). Churchill Livingstone, London, pp. 77-102.
11. Bartsch, H., Nair J. and Owen R.W. (1999) Dietary polyunsaturated fatty acids
and cancers of the breast and colorectum: emerging evidence for their role as risk
modifiers. Carcinogenesis, 20, 2209-18.
12. Rose, D.P. and Connolly J.M. (1999) Omega-3 fatty acids as cancer
chemopreventive agents. Pharmacol Ther, 83, 217-44.
13. Grammatikos, S.I., Subbaiah P.V., Victor T.A. and Miller W.M. (1994) Diverse
effects of essential (n-6 and n-3) fatty acids on cultured cells. Cytotechnology, 15,
31-50.
14. Fischer, S.M. (1997) Prostaglandins and Cancer. Front Biosci, 2, d482-500.
Chapter 1
38
15. Krause, W. and DuBois R.N. (2000) Eicosanoids and the large intestine.
Prostaglandins Other Lipid Mediat, 61, 145-61.
16. Buege, J.A. and Aust S.D. (1978) Microsomal lipid peroxidation. Methods
Enzymol, 52, 302-10.
17. Ito, Y., Shimizu H., Yoshimura T., Ross R.K., Kabuto M., Takatsuka N., Tokui N.,
Suzuki K. and Shinohara R. (1999) Serum concentrations of carotenoids, alpha-
tocopherol, fatty acids, and lipid peroxides among Japanese in Japan, and
Japanese and Caucasians in the US. Int J Vitam Nutr Res, 69, 385-95.
18. Jiang, W.G., Bryce R.P. and Horrobin D.F. (1998) Essential fatty acids: molecular
and cellular basis of their anti- cancer action and clinical implications. Crit Rev
Oncol Hematol, 27, 179-209.
19. Sharma, R.A., Gescher A., Plastaras J.P., Leuratti C., Singh R., Gallacher-Horley
B., Offord E., Marnett L.J., Steward W.P. and Plummer S.M. (2001)
Cyclooxygenase-2, malondialdehyde and pyrimidopurinone adducts of
deoxyguanosine in human colon cells. Carcinogenesis, 22, 1557-60.
20. Leuratti, C., Watson M.A., Deag E.J., Welch A., Singh R., Gottschalg E., Marnett
L.J., Atkin W., Day N.E., Shuker D.E. and Bingham S.A. (2002) Detection of
malondialdehyde DNA adducts in human colorectal mucosa: relationship with
diet and the presence of adenomas. Cancer Epidemiol Biomarkers Prev, 11, 267-
73.
21. Aw, T.Y. (1999) Molecular and cellular responses to oxidative stress and changes
in oxidation-reduction imbalance in the intestine. Am J Clin Nutr, 70, 557-65.
22. Williams, A.C., Hague A., Elder D.J. and Paraskeva C. (1996) In vitro models for
studying colorectal carcinogenesis: cellular and molecular events including APC
and Rb cleavage in the control of proliferation, differentiation and apoptosis.
Biochim Biophys Acta, 1288, F9-19.
23. Owen, R.W. (2001) Biomarkers in colorectal cancer. IARC Sci Publ, 154, 101-
11.
24. Lipkin, M. (1974) Phase 1 and phase 2 proliferative lesions of colonic epithelial
cells in diseases leading to colonic cancer. Cancer, 34, 878-888.
25. Mori, H., Sugie S., Yoshimi N., Hara A. and Tanaka T. (1999) Control of cell
proliferation in cancer prevention. Mutat Res, 428, 291-8.
26. Dolara, P., Caderni G. and Luceri C. (2000) Surrogate endpoint biomarkers for
human colon carcinogenesis. Toxicol Lett, 112-113, 415-20.
27. Chang, W.C., Chapkin R.S. and Lupton J.R. (1997) Predictive value of
proliferation, differentiation and apoptosis as intermediate markers for colon
tumorigenesis. Carcinogenesis, 18, 721-30.
Introduction
39
28. Boehringer Mannheim. (1998) Cytotoxicity assay methods. Apoptosis and cell
proliferation. 2nd edition, Germany.
29. Thomas, D.W. and Henton D.H. (1982) The use of fecal alkaline phosphatase as
an indicator of intestinal damage. Digestion, 31, 82-88.
30. Trosko, J.E. and Ruch R.J. (1998) Cell-cell communication in carcinogenesis.
Front Biosci, 3, D208-36.
31. Yamasaki, H. (1996) Role of disrupted gap junctional intercellular communication
in detection and characterization of carcinogens. Mutat Res, 365, 91-105.
32. Tateno, C., Ito S., Tanaka M., Oyamada M. and Yoshitake A. (1994) Effect of
DDT on hepatic gap junctional intercellular communication in rats.
Carcinogenesis, 15, 517-21.
33. Ren, P., Mehta P.P. and Ruch R.J. (1998) Inhibition of gap junctional intercellular
communication by tumor promoters in connexin43 and connexin32-expressing
liver cells: cell specificity and role of protein kinase C. Carcinogenesis, 19, 169-
75.
34. Awad, A.B., Kamei A., Horvath P.J. and Fink C.S. (1995) Prostaglandin synthesis
in human cancer cells: influence of fatty acids and butyrate. Prostaglandins Leukot
Essent Fatty Acids, 53, 87-93.
35. Chen, Z.Y. and Istfan N.W. (2000) Docosahexaenoic acid is a potent inducer of
apoptosis in HT-29 colon cancer cells. Prostaglandins Leukot Essent Fatty Acids,
63, 301-8.
36. Collett, E.D., Davidson L.A., Fan Y.Y., Lupton J.R. and Chapkin R.S. (2001) n-6
and n-3 polyunsaturated fatty acids differentially modulate oncogenic Ras
activation in colonocytes. Am J Physiol Cell Physiol, 280, C1066-75.
37. Tsai, W.S., Nagawa H., Kaizaki S., Tsuruo T. and Muto T. (1998) Inhibitory
effects of n-3 polyunsaturated fatty acids on sigmoid colon cancer transformants. J
Gastroenterol, 33, 206-12.
38. Mengeaud, V., Nano J.L., Fournel S. and Rampal P. (1992) Effects of
eicosapentaenoic acid, gamma-linolenic acid and prostaglandin E1 on three
human colon carcinoma cell lines. Prostaglandins Leukot Essent Fatty Acids, 47,
313-9.
39. Clarke, R.G., Lund E.K., Latham P., Pinder A.C. and Johnson I.T. (1999) Effect
of eicosapentaenoic acid on the proliferation and incidence of apoptosis in the
colorectal cell line HT29. Lipids, 34, 1287-95.
40. Kim, E., Kim W., Hang Y., Ha Y., Bach L. and Park J. (2000) Inhibition of Caco-
2 cell proliferation by (n-3) fatty acids: possible mediation by increased secretion
of insulin-lie growth factor binding protein-6. Nutrition Research, 20, 1409-1421.

Chapter 1
40
41. Palozza, P., Calviello G., Maggiano N., Lanza P., Raneletti F.O. and Bartoli G.M.
(2000) Beta-carotene antagonizes the effects of eicosapentaenoic acid on cell
growth and lipid peroxidation in WiDr adenocarcinoma cells. Free Radical
Biology & Medicine, 28, 228-234.
42. Reddy, B.S. (1992) Dietary fat and colon cancer: animal model studies. Lipids,
27, 807-13.
43. Singh, J., Hamid R. and Reddy B.S. (1997) Dietary fat and colon cancer:
modulation of cyclooxygenase-2 by types and amount of dietary fat during the
postinitiation stage of colon carcinogenesis. Cancer Res, 57, 3465-70.
44. Onogi, N., Okuno M., Komaki C., Moriwaki H., Kawamori T., Tanaka T., Mori H.
and Muto Y. (1996) Suppressing effect of perilla oil on azoxymethane-induced
foci of colonic aberrant crypts in rats. Carcinogenesis, 17, 1291-6.
45. Takahashi, M., Fukutake M., Isoi T., Fukuda K., Sato H., Yazawa K., Sugimura T.
and Wakabayashi K. (1997) Suppression of azoxymethane-induced rat colon
carcinoma development by a fish oil component, docosahexaenoic acid (DHA).
Carcinogenesis, 18, 1337-42.
46. Oshima, M., Takahashi M., Oshima H., Tsutsumi M., Yazawa K., Sugimura T.,
Nishimura S., Wakabayashi K. and Taketo M.M. (1995) Effects of
docosahexaenoic acid (DHA) on intestinal polyp development in Apc delta 716
knockout mice. Carcinogenesis, 16, 2605-7.
47. Petrik, M.B., McEntee M.F., Chiu C.H. and Whelan J. (2000) Antagonism of
arachidonic acid is linked to the antitumorigenic effect of dietary eicosapentaenoic
acid in Apc(Min/+) mice. J Nutr, 130, 1153-8.
48. Rao, C.V., Hirose Y., Indranie C. and Reddy B.S. (2001) Modulation of
experimental colon tumorigenesis by types and amounts of dietary fatty acids.
Cancer Res, 61, 1927-33.
49. Davidson, L.A., Lupton J.R., Jiang Y.H. and Chapkin R.S. (1999) Carcinogen
and dietary lipid regulate ras expression and localization in rat colon without
affecting farnesylation kinetics. Carcinogenesis, 20, 785-91.
50. Rao, C.V. and Reddy B.S. (1993) Modulating effect of amount and types of
dietary fat on ornithine decarboxylase, tyrosine protein kinase and prostaglandins
production during colon carcinogenesis in male F344 rats. Carcinogenesis, 14,
1327-33.
51. Reddy, B.S., Simi B., Patel N., Aliaga C. and Rao C.V. (1996) Effect of amount
and types of dietary fat on intestinal bacterial 7 alpha-dehydroxylase and
phosphatidylinositol-specific phospholipase C and colonic mucosal diacylglycerol
Introduction
41
kinase and PKC activities during stages of colon tumor promotion. Cancer Res,
56, 2314-20.
52. Rao, C.V., Zang E. and Reddy B.S. (1993) Effect of high fat corn oil, olive oil and
fish oil on phospholipid fatty acid composition in male F344 rats. Lipids, 28, 441-
7.
53. Inaba, A., Uchiyama T. and Oka M. (1999) Role of prostaglandin E2 in rat colon
carcinoma. Hepatogastroenterology, 46, 2347-51.
54. Llor, X., Pons E., Roca A., Alvarez M., Mane J., Fernandez-Banares F. and
Gassull M.A. (2003) The effects of fish oil, olive oil, oleic acid and linoleic acid on
colorectal neoplastic processes. Clin Nutr, 22, 71-9.
55. Singh, J., Hamid R. and Reddy B.S. (1998) Dietary fish oil inhibits the expression
of farnesyl protein transferase and colon tumor development in rodents.
Carcinogenesis, 19, 985-9.
56. Gupta, R. and DuBois R.N. (2001) Colorectal cancer prevention and treatment by
inhibition of cyclooxygenase-2. Nature Reviews, 1, 11-21.
57. Jump, D.B. and Clarke S.D. (1999) Regulation of gene expression by dietary fat.
Annu Rev Nutr, 19, 63-90.
58. Noguchi, K., Iwasaki K., Shitashige M., Endo H., Kondo H. and Ishikawa I. (2000)
Cyclooxygenase-2-dependent prostaglandin E2 down-regulates intercellular
adhesion molecule-1 expression via EP2/EP4 receptors in interleukin-1beta-
stimulated human gingival fibroblasts. J Dent Res, 79, 1955-61.
59. Sheng, H., Shao J., Washington M.K. and DuBois R.N. (2001) Prostaglandin E2
increases growth and motility of colorectal carcinoma cells. J Biol Chem, 276,
18075-81.
60. Eberhart, C.E. and Dubois R.N. (1995) Eicosanoids and the gastrointestinal tract.
Gastroenterology, 109, 285-301.
61. Eberhart, C.E., Coffey R.J., Radhika A., Giardiello F.M., Ferrenbach S. and
DuBois R.N. (1994) Up-regulation of cyclooxygenase 2 gene expression in
human colorectal adenomas and adenocarcinomas. Gastroenterology, 107,
1183-8.
62. Boelsterli, U.A. (2003) Xenobiotic-induced oxidative stress: cell injury, signaling,
and gene regulation. Mechanistic toxicology: the molecular basis of how chemicals
disrupt biological targets. Taylor & Francis, London and New York.
63. Bruce, W.R., Giacca A. and Medline A. (2000) Possible mechanisms relating diet
and risk of colon cancer. Cancer Epidemiol Biomarkers Prev, 9, 1271-9.
64. Johnson, I.T. (2002) Anticarcinogenic effects of diet-related apoptosis in the
colorectal mucosa. Food Chem Toxicol, 40, 1171-8.
Chapter 1
42
65. Herbst, U., Toborek M., Kaiser S., Mattson M.P. and Hennig B. (1999) 4-
Hydroxynonenal induces dysfunction and apoptosis of cultured endothelial cells.
J Cell Physiol, 181, 295-303.
66. Ji, C., Amarnath V., Pietenpol J.A. and Marnett L.J. (2001) 4-Hydroxynonenal
Induces Apoptosis via Caspase-3 Activation and Cytochrome c Release. Chem
Res Toxicol, 14, 1090-6.
67. Latham, P., Lund E.K., Brown J.C. and Johnson I.T. (2001) Effects of cellular
redox balance on induction of apoptosis by eicosapentaenoic acid in HT29
colorectal adenocarcinoma cells and rat colon in vivo. Gut, 49, 97-105.
n-6 and n-3 PUFAs and GJIC
43
Chapter 2
Effects of n-6 and n-3 polyunsaturated fatty acids on gap junctional intercellular communication during
spontaneous differentiation of the human colon adenocarcinoma cell line Caco-2
Nutrition and Cancer, 42(1), 125-130, 2002
Yvonne E.M. Dommels1,2
Gerrit M. Alink2
Jozef P.H. Linssen3
Ben van Ommen4
1 WUR/TNO Centre for Food Toxicology 2 Division of Toxicology, Wageningen University, Wageningen, The Netherlands 3 Laboratory of Food Chemistry, Wageningen University, Wageningen, The Netherlands 4TNO Nutrition and Food Research, Department of Biomolecular Sciences, Zeist, The
Netherlands

Chapter 2
44
Abstract
Gap junctional intercellular communication (GJIC) which modulates cell growth and
differentiation may play an important role in tumor growth. Cancer cells have
dysfunctional GJIC, but it is not known whether GJIC is mechanistically involved in the
carcinogenic and anticarcinogenic effects of n-6 and n-3 polyunsaturated fatty acids
(PUFAs) on colon tumor cells. Caco-2 cells were used as an in vitro model to study the
effects of PUFAs on differentiated as well as undifferentiated human colon cells. The
GJIC capacity of this cell line increased during spontaneous differentiation. However, no
differential effects between n-6 and n-3 PUFAs on GJIC were observed. Short-term
incubation with linoleic acid (18:2n-6), α-linolenic acid (18:3n-3), arachidonic acid (AA;
20:4n-6) and eicosapentaenoic acid (EPA; 20:5n-3) did not influence GJIC, while long-
term incubation (> 10 days) with linoleic acid and α-linolenic acid inhibited GJIC of
these colon cells. Long-chain metabolites such as AA and EPA were not formed after
incubation with linoleic and α-linolenic acid, thus excluding the involvement of
prostaglandins in the observed effects. Although the exact mechanism of GJIC inhibition
is unclear, cytotoxicity probably mediated by lipid peroxidation products seems to be
related because incubation with more polyunsaturated fatty acids (AA and EPA)
completely abolished GJIC.
n-6 and n-3 PUFAs and GJIC
45
Introduction
Human colon adenocarcinoma Caco-2 cells spontaneously differentiate into polarized
intestinal epithelial cells during approximately three weeks of cell culture. Characteristic
markers of differentiation, including brush border membrane alkaline phosphatase (ALP)
activity and dome formation in cell monolayers, increase after cells reach confluency (1).
Hara et al. (2) proposed that the Caco-2 cell line could be used as an in vitro model to
study molecular alterations during spontaneous differentiation of colon cancer cells. This
can provide more insight into the multistep process from adenoma to carcinoma in the
colon (i.e. de-differentiation). Hara et al. (2) found that Caco-2 cells spontaneously
switch from a proliferative state with a high c-myc oncogene expression to a
differentiated phenotype with a low c-myc expression. We determined proteome changes
during Caco-2 differentiation to identify novel proteins involved in differentiation and
possibly colon carcinogenesis (R.H. Stierum et al. in press).
Gap junctional intercellular communication (GJIC) is important in the control of colonic
cell proliferation and differentiation. Low molecular weight growth regulatory molecules
stay in equilibrium among GJIC-connected cells (3). Because GJIC is considered to play
an essential role in homeostasis maintenance, it is assumed that its disruption will result
in a variety of diseases. Several studies have shown that aberrant GJIC is often found in
tumors and that many tumor-promoting agents inhibit GJIC (4).
Accumulating evidence exists that a high dietary fat intake is associated with an increased
risk of colorectal cancer. Moreover, epidemiological studies and studies with animal
models have demonstrated that not only the amount but also the type of fat consumed is
important (5). Polyunsaturated fatty acids can be divided into two families of essential
fatty acids, namely the n-6 and n-3 PUFAs. N-6 PUFAs in corn oil, such as linoleic acid,
enhance colon tumorigenesis in rodents, whereas n-3 PUFAs like eicosapentaenoic acid,
present in fish oil, can reduce colorectal carcinogenesis (6,7). Several related mechanisms
have been proposed for the effects of dietary n-6 and n-3 PUFAs on colorectal
carcinogenesis, such as differences in prostaglandin production, COX-2 expression, cell
proliferation, apoptosis and bile acid formation (6,8,9). However, the precise
mechanisms by which n-6 and n-3 fatty acids exert their carcinogenic and anti-
carcinogenic action are unknown (10,11).
PUFAs have been shown to be strong modulators of GJIC (12-15). De Haan et al. (12)
reported that linoleic acid was the most potent inhibitor of GJIC in human smooth
muscle cells. However, it is not known whether GJIC is mechanistically involved in the
differential effects of n-6 and n-3 PUFAs on colon tumor cells. Mesnil et al. (16)
demonstrated the GJIC capacity of a panel of human colorectal adenocarcinoma cell
lines isolated from different stages of tumor progression. The aim of our study was to
Chapter 2
46
investigate the effects of two long-chain PUFAs that naturally exist in the colon lumen
(17), linoleic acid (18:2n-6) and α-linolenic acid (18:3n-3) and two more
polyunsaturated fatty acids, arachidonic acid (AA; 20:4n-6) and eicosapentaenoic acid
(EPA; 20:5n-3), on GJIC of human colon adenocarcinoma Caco-2 cells during
proliferation and differentiation.
Materials and methods
Chemicals
Bovine serum albumin (BSA; essential fatty acid-free), Lucifer Yellow, linoleic acid,
α-linolenic acid, arachidonic acid and eicosapentaenoic acid were obtained from Sigma
Chemical Company (St Louis, MO, USA). Triton X-100 was obtained from Merck AG
(Germany). Fetal calf serum (FCS), non-essential amino acids, penicillin-streptomycin,
Ca2+ and Mg2+-free Dulbecco's phosphate buffered saline (PBS) and Dulbecco's modified
eagle medium (DMEM) were obtained from Life Technologies (Breda, The Netherlands).
Cell culture
Caco-2 cells, obtained from the American Type Culture Collection (Rockville, MD, USA)
were grown in DMEM, supplemented with 10% heat-inactivated FCS, 1% non-essential
amino acids, 2% penicillin-streptomycin, in an atmosphere of 5% CO2 / 95% air at 37
°C. Cells were sub-cultured at a ratio of 2:10, after they had reached 70-90% confluence
in 75 cm2 culture flasks (Costar, Cambridge, MA, USA). Cells at passages between 32
and 45 were used for the experiments.
Treatment of cells with PUFAs
Short-term exposure
Caco-2 cells were plated at a concentration of 30 x 104 cells/ml in 35 mm petridishes in a
medium volume of 2 ml. Cells were used for experiments at day 3 or 20 after plating,
representing respectively undifferentiated and differentiated cells. Medium was refreshed
three times a week. At day 3 or day 20, medium was replaced by serum-free DMEM,
supplemented with 1 mg/ml fatty acid-free BSA and the different fatty acids. Cells were
cultured in this medium for 24 hours.
For the GJIC experiments linoleic acid, α-linolenic acid, AA and EPA were used at a
concentration of 300 µM, while 100 µM linoleic and α-linolenic acid were used for the
fatty acid uptake studies. Fatty acids were dissolved in ethanol with a final concentration
in the medium of 0.5%. Control wells received serum-free medium supplemented with 1
mg/ml fatty acid-free BSA plus 0.5% ethanol. Before addition to the cultures, the fatty
n-6 and n-3 PUFAs and GJIC
47
acids and ethanol were preincubated in the BSA-containing medium for 30 minutes at
37 °C.
Long-term exposure
Caco-2 cells were plated at a concentration of 30 x 104 cells/ml in 35 mm petridishes in a
medium volume of 2 ml. After 24 hours, the medium was replaced by fresh medium with
serum, supplemented with 1 mg/ml fatty acid-free BSA and 100 µM fatty acids. Control
wells received medium with serum, supplemented with 1 mg/ml fatty acid-free BSA plus
0.5% ethanol. The incubation medium with the various fatty acids or ethanol was
replaced every 72 hours. Cells were grown until 4, 10, 16 and 22 days after seeding.
Gap junctional intercellular communication assay
Gap junctional intercellular communication was determined after injection of a 10%
Lucifer Yellow CH solution (in 0.33 M lithium chloride) in about 20 single Caco-2 cells
per 35 mm petridish. Cells were microinjected using a vertical injection system
(Narishige, Tokyo, Japan) with a dye-filled capillary glass tip (Clark, Pangbourne, UK).
The glass capillary tip with a diameter of 1 µm was prepared by an automatic magnetic
puller (Narishige, Tokyo, Japan). The number of communicating cells was determined
using fluorescence microscopy between 10-15 minutes after the first injection.
Cell growth
During the long-term exposure experiments, Caco-2 cells were washed with 2 ml PBS
supplemented with 0.022% EDTA, harvested using trypsin and counted with a
hematocytometer (Bürker-Türk, Emergo, Landsmeer, The Netherlands) at day 4, 10 16
and 22 after seeding.
Enzyme and protein assays
Caco-2 cells were washed with 2 ml PBS supplemented with 0.022% EDTA and scraped
into 1 ml of PBS. Cell homogenates were sonicated for 1 minute (3 x 20 seconds) in ice-
cold PBS. Activity of alkaline phosphatase was determined according to Tietz (18), on
the BM/Hitachi 911 using p-nitrophenol as a substrate. Protein was measured according
to Bradford (19).
Cytotoxicity assay
Caco-2 cells were plated at a concentration of 3.54 x 10⁵ cells/ml in 0.5 ml of medium
into 24 well tissue culture plates. After treatment the media was collected from each well
and centrifuged for 10 minutes at 8000 rpm. Cells were scraped into 500 µl 0.5% Triton
Chapter 2
48
X-100 in 0.1 M potassium phosphate buffer (pH 7.5). After sonification (Vibra Cell,
Sonics & Materials Inc, Danbury, USA) of the cells for 1 min (3 x 20 seconds) and
centrifugation (10 minutes, 8000 rpm), lactate dehydrogenase activity was measured
spectrophotometrically at 340 nm in both medium and cell supernatant, with pyruvate as
a substrate (20).
Analysis of fatty acid composition
After 24 hours exposure to 100 µM linoleic acid or α-linolenic acid on day 3 and day 20
after seeding, medium was collected. The cells were washed with an ice-cold solution of
1% BSA in DMEM for 5 minutes to remove extracellular free fatty acids (20). Cell
monolayers were then washed twice with 2 ml PBS supplemented with 0.022% EDTA
and scraped into 1 ml PBS with a rubber policeman. Cell suspensions were centrifuged
for 5 minutes at 400 g. The cell pellet was resuspended in 200 µl PBS and stored under
nitrogen at -80 °C until analysis of fatty acid composition. Total cellular lipids were
extracted from the cell pellet by the method of Bligh and Dyer (21). Total extracted lipids
were methylated according to Morrison and Smith (22). The methyl esters of the fatty
acids were analyzed on a Carlo Erba 5160 megaseries gas chromatograph (Interscience,
Breda, The Netherlands) using cold-on-column-injection and flame ionization detection
(temperature detection 260 °C). Temperature program starts at 80 °C, followed by a
temperature increase of 20 °C/min until 180 °C and 5 °C/min until 240 °C with a final
hold for 2 minutes. Samples were analyzed on an OMEGAWAXTM 320 fused silica
capillary column, 30 m x 0.32 mm; 0.25 µm film thickness (Supelco, Bellefonte, USA).
Individual fatty acids were identified by comparison with two standard fatty acid
mixtures, PUFA nr. 2 Animal source and PUFA nr. 3 Menhaden oil (Supelco, Bellefonte,
USA) and reported as a percentage of the total fatty acids identified.
Statistics
Correlation between ALP, GJIC, cell number and days in culture for control cells were
tested by Pearson R correlation coefficients. Statistical differences between group means
were determined with one-way analysis of variance. A probability level of p < 0.05 was
considered significant. The differences in fatty acid composition were analyzed by the
Student's t-test.
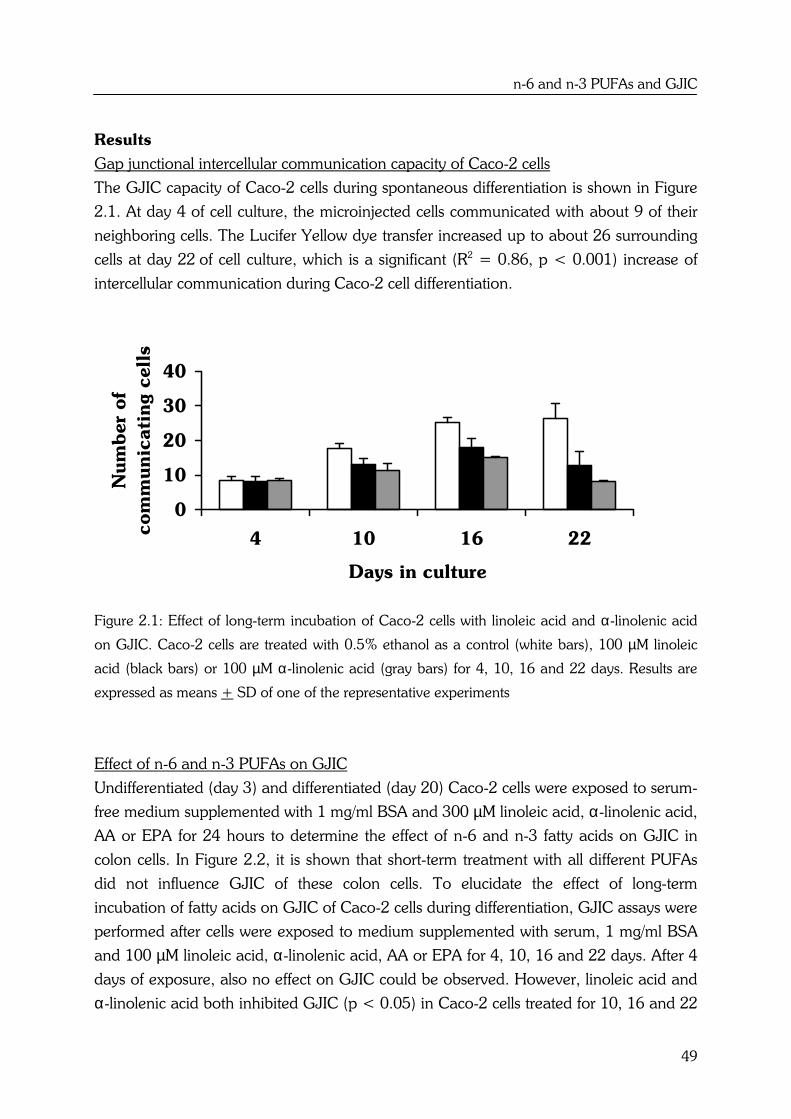
n-6 and n-3 PUFAs and GJIC
49
Results
Gap junctional intercellular communication capacity of Caco-2 cells
The GJIC capacity of Caco-2 cells during spontaneous differentiation is shown in Figure
2.1. At day 4 of cell culture, the microinjected cells communicated with about 9 of their
neighboring cells. The Lucifer Yellow dye transfer increased up to about 26 surrounding
cells at day 22 of cell culture, which is a significant (R2 = 0.86, p < 0.001) increase of
intercellular communication during Caco-2 cell differentiation.
Figure 2.1: Effect of long-term incubation of Caco-2 cells with linoleic acid and α-linolenic acid
on GJIC. Caco-2 cells are treated with 0.5% ethanol as a control (white bars), 100 µM linoleic
acid (black bars) or 100 µM α-linolenic acid (gray bars) for 4, 10, 16 and 22 days. Results are
expressed as means + SD of one of the representative experiments
Effect of n-6 and n-3 PUFAs on GJIC
Undifferentiated (day 3) and differentiated (day 20) Caco-2 cells were exposed to serum-
free medium supplemented with 1 mg/ml BSA and 300 µM linoleic acid, α-linolenic acid,
AA or EPA for 24 hours to determine the effect of n-6 and n-3 fatty acids on GJIC in
colon cells. In Figure 2.2, it is shown that short-term treatment with all different PUFAs
did not influence GJIC of these colon cells. To elucidate the effect of long-term
incubation of fatty acids on GJIC of Caco-2 cells during differentiation, GJIC assays were
performed after cells were exposed to medium supplemented with serum, 1 mg/ml BSA
and 100 µM linoleic acid, α-linolenic acid, AA or EPA for 4, 10, 16 and 22 days. After 4
days of exposure, also no effect on GJIC could be observed. However, linoleic acid and
α-linolenic acid both inhibited GJIC (p < 0.05) in Caco-2 cells treated for 10, 16 and 22
0
10
20
30
40
4 10 16 22
Days in culture
Num
ber
of
com
munic
ati
ng c
ell
s
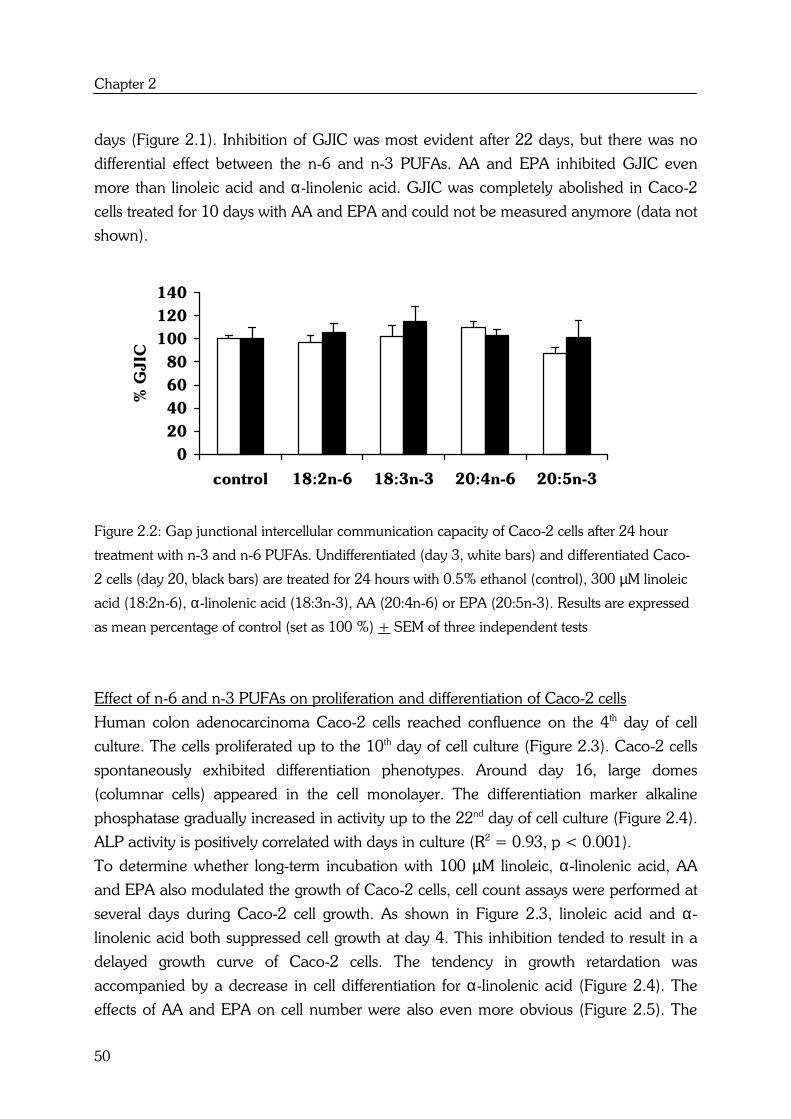
Chapter 2
50
days (Figure 2.1). Inhibition of GJIC was most evident after 22 days, but there was no
differential effect between the n-6 and n-3 PUFAs. AA and EPA inhibited GJIC even
more than linoleic acid and α-linolenic acid. GJIC was completely abolished in Caco-2
cells treated for 10 days with AA and EPA and could not be measured anymore (data not
shown).
Figure 2.2: Gap junctional intercellular communication capacity of Caco-2 cells after 24 hour
treatment with n-3 and n-6 PUFAs. Undifferentiated (day 3, white bars) and differentiated Caco-
2 cells (day 20, black bars) are treated for 24 hours with 0.5% ethanol (control), 300 µM linoleic
acid (18:2n-6), α-linolenic acid (18:3n-3), AA (20:4n-6) or EPA (20:5n-3). Results are expressed
as mean percentage of control (set as 100 %) + SEM of three independent tests
Effect of n-6 and n-3 PUFAs on proliferation and differentiation of Caco-2 cells
Human colon adenocarcinoma Caco-2 cells reached confluence on the 4th day of cell
culture. The cells proliferated up to the 10th day of cell culture (Figure 2.3). Caco-2 cells
spontaneously exhibited differentiation phenotypes. Around day 16, large domes
(columnar cells) appeared in the cell monolayer. The differentiation marker alkaline
phosphatase gradually increased in activity up to the 22nd day of cell culture (Figure 2.4).
ALP activity is positively correlated with days in culture (R2 = 0.93, p < 0.001).
To determine whether long-term incubation with 100 µM linoleic, α-linolenic acid, AA
and EPA also modulated the growth of Caco-2 cells, cell count assays were performed at
several days during Caco-2 cell growth. As shown in Figure 2.3, linoleic acid and α-
linolenic acid both suppressed cell growth at day 4. This inhibition tended to result in a
delayed growth curve of Caco-2 cells. The tendency in growth retardation was
accompanied by a decrease in cell differentiation for α-linolenic acid (Figure 2.4). The
effects of AA and EPA on cell number were also even more obvious (Figure 2.5). The
0
20
40
60
80
100
120
140
control 18:2n-6 18:3n-3 20:4n-6 20:5n-3
% G
JIC

n-6 and n-3 PUFAs and GJIC
51
abolishment of GJIC by AA and EPA after 10 days in culture was accompanied by a
strong inhibition of cell number.
Figure 2.3: Effect of long-term incubation with linoleic acid and α-linolenic acid on cell
proliferation of Caco-2 cells. Caco-2 cells are treated with 0.5% ethanol as a control (white bars),
100 µM linoleic acid (black bars) or 100 µM α-linolenic acid (gray bars) for 4, 10, 16 and 22
days. Results are expressed as means + SD of one of the representative experiments
Determination of cytotoxicity
Release of lactate dehydrogenase in the culture medium was measured as an indicator of
cytotoxicity. Both short-term incubation (24 hours) with concentrations up to 300 µM
and long-term incubation (4, 10, 16 and 22 days) up to 100 µM linoleic acid and α-
linolenic acid showed no increase in LDH release in the medium of Caco-2 cells
compared to control wells (data not shown). However, AA and EPA were highly
cytotoxic during long-term incubation. Lactate dehydrogenase release in the medium of
Caco-2 cells treated for 10 days with 100 µM AA (32.6%) or EPA (20.8%) was
significantly higher than lactate dehydrogenase release in control cells (13.7%).
Fatty acid uptake in undifferentiated and differentiated Caco-2 cells
As shown in Table 2.1, treatment with linoleic acid and α-linolenic acid changed the fatty
acid composition of Caco-2 cells. Linoleic acid as well as α-linolenic acid increased the
levels of both respective fatty acids (p < 0.05). However, the uptake of both types of
fatty acids was lower in differentiated cells compared to the undifferentiated cells.
Incubation with linoleic acid (18:2n-6) as well as α-linolenic acid (18:3n-3) did not
0
1
2
3
4
5
6
4 10 16 22
Days in culture
Num
ber
of
cell
s
(x 1
06/ 3
5 m
m d
ish)
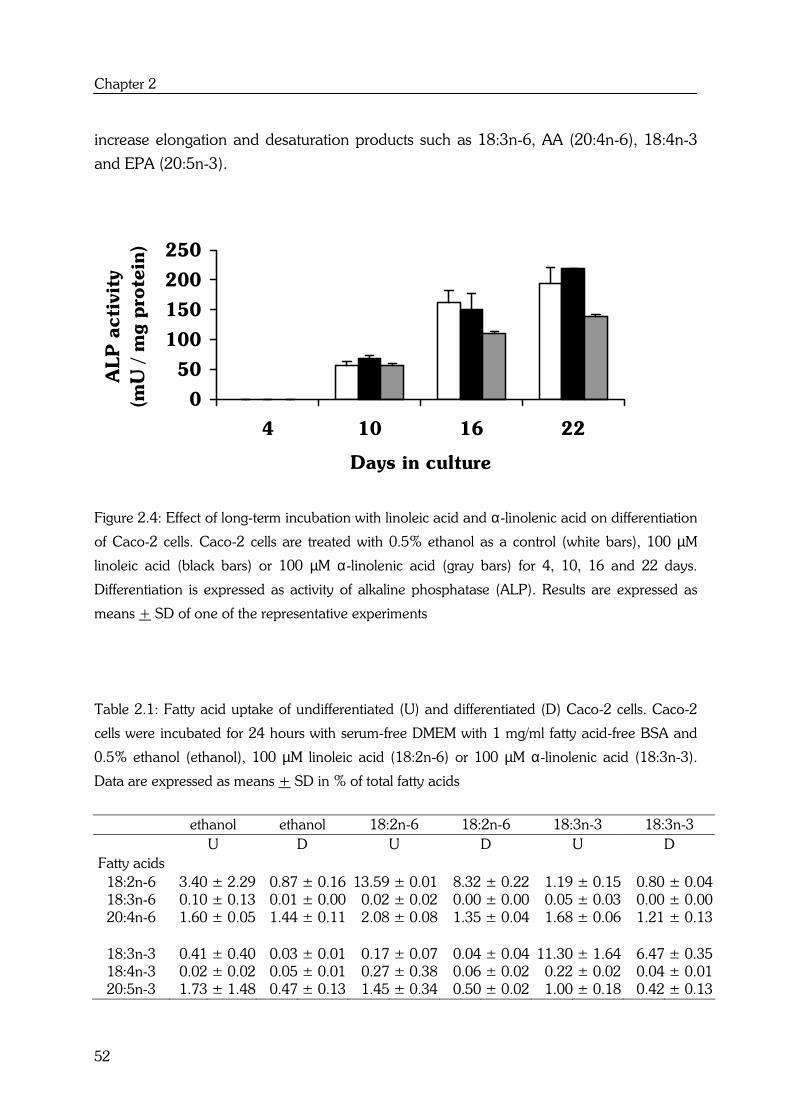
Chapter 2
52
increase elongation and desaturation products such as 18:3n-6, AA (20:4n-6), 18:4n-3
and EPA (20:5n-3).
Figure 2.4: Effect of long-term incubation with linoleic acid and α-linolenic acid on differentiation
of Caco-2 cells. Caco-2 cells are treated with 0.5% ethanol as a control (white bars), 100 µM
linoleic acid (black bars) or 100 µM α-linolenic acid (gray bars) for 4, 10, 16 and 22 days.
Differentiation is expressed as activity of alkaline phosphatase (ALP). Results are expressed as
means + SD of one of the representative experiments
Table 2.1: Fatty acid uptake of undifferentiated (U) and differentiated (D) Caco-2 cells. Caco-2
cells were incubated for 24 hours with serum-free DMEM with 1 mg/ml fatty acid-free BSA and
0.5% ethanol (ethanol), 100 µM linoleic acid (18:2n-6) or 100 µM α-linolenic acid (18:3n-3).
Data are expressed as means + SD in % of total fatty acids
ethanol ethanol 18:2n-6 18:2n-6 18:3n-3 18:3n-3
U D U D U D
Fatty acids
18:2n-6 3.40 ± 2.29 0.87 ± 0.16 13.59 ± 0.01 8.32 ± 0.22 1.19 ± 0.15 0.80 ± 0.04
18:3n-6 0.10 ± 0.13 0.01 ± 0.00 0.02 ± 0.02 0.00 ± 0.00 0.05 ± 0.03 0.00 ± 0.00
20:4n-6 1.60 ± 0.05 1.44 ± 0.11 2.08 ± 0.08 1.35 ± 0.04 1.68 ± 0.06 1.21 ± 0.13
18:3n-3 0.41 ± 0.40 0.03 ± 0.01 0.17 ± 0.07 0.04 ± 0.04 11.30 ± 1.64 6.47 ± 0.35
18:4n-3 0.02 ± 0.02 0.05 ± 0.01 0.27 ± 0.38 0.06 ± 0.02 0.22 ± 0.02 0.04 ± 0.01
20:5n-3 1.73 ± 1.48 0.47 ± 0.13 1.45 ± 0.34 0.50 ± 0.02 1.00 ± 0.18 0.42 ± 0.13
0
50
100
150
200
250
4 10 16 22
Days in culture
ALP
acti
vit
y
(mU
/ m
g p
rote
in)
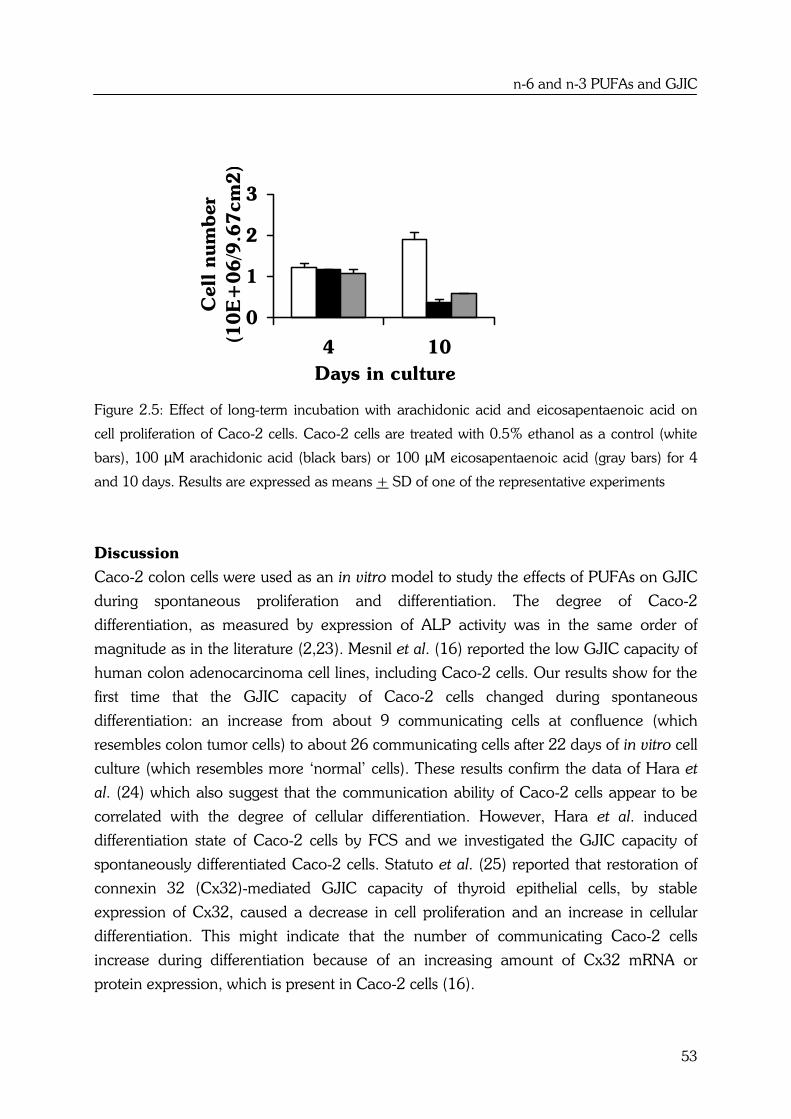
n-6 and n-3 PUFAs and GJIC
53
Figure 2.5: Effect of long-term incubation with arachidonic acid and eicosapentaenoic acid on
cell proliferation of Caco-2 cells. Caco-2 cells are treated with 0.5% ethanol as a control (white
bars), 100 µM arachidonic acid (black bars) or 100 µM eicosapentaenoic acid (gray bars) for 4
and 10 days. Results are expressed as means + SD of one of the representative experiments
Discussion
Caco-2 colon cells were used as an in vitro model to study the effects of PUFAs on GJIC
during spontaneous proliferation and differentiation. The degree of Caco-2
differentiation, as measured by expression of ALP activity was in the same order of
magnitude as in the literature (2,23). Mesnil et al. (16) reported the low GJIC capacity of
human colon adenocarcinoma cell lines, including Caco-2 cells. Our results show for the
first time that the GJIC capacity of Caco-2 cells changed during spontaneous
differentiation: an increase from about 9 communicating cells at confluence (which
resembles colon tumor cells) to about 26 communicating cells after 22 days of in vitro cell
culture (which resembles more ‘normal’ cells). These results confirm the data of Hara et
al. (24) which also suggest that the communication ability of Caco-2 cells appear to be
correlated with the degree of cellular differentiation. However, Hara et al. induced
differentiation state of Caco-2 cells by FCS and we investigated the GJIC capacity of
spontaneously differentiated Caco-2 cells. Statuto et al. (25) reported that restoration of
connexin 32 (Cx32)-mediated GJIC capacity of thyroid epithelial cells, by stable
expression of Cx32, caused a decrease in cell proliferation and an increase in cellular
differentiation. This might indicate that the number of communicating Caco-2 cells
increase during differentiation because of an increasing amount of Cx32 mRNA or
protein expression, which is present in Caco-2 cells (16).
0
1
2
3
4 10
Days in culture
Cell
num
ber
(10E
+06/9
.67cm
2)
Chapter 2
54
We examined the effect of short-term as well as long-term exposure of PUFAs on GJIC of
Caco-2 cells. After 24 hours of exposure, no effect of linoleic acid, α-linolenic acid, AA
and EPA on GJIC in both undifferentiated and differentiated Caco-2 cells was observed.
This clearly indicates that PUFAs at a concentration of 300 µM do not affect the short-
term modulation of GJIC in Caco-2 cells. In addition, de Haan et al. (12) found that both
linoleic acid and α-linolenic acid, in the same concentration and exposure time inhibited
GJIC in human smooth muscle cells. Also others have demonstrated the ability of α-
linolenic acid (15) and AA (26) to down regulate GJIC after short-term incubation. So
there appears to be a tissue-specific sensitivity to inhibition of GJIC by n-6 and n-3
PUFAs.
Distinct from our short-term incubation results, we measured an effect of long-term
incubation of n-6 and n-3 PUFAs on GJIC. Linoleic acid and α-linolenic acid inhibited
GJIC in Caco-2 cells treated for 10, 16 and 22 days. AA and EPA completely abolished
GJIC after less than 10 days of incubation. However, no differential effect between n-6
and n-3 PUFAs was observed, thus excluding the possibility that GJIC would be
mechanistically involved in the carcinogenic and anticarcinogenic effects of n-6 and n-3
PUFAs on colon tumor cells.
Because Chen and Nilsson (27) and Huang et al. (20) found different results in the ∆-6
desaturase ability of Caco-2 cells, we also tested the ability of Caco-2 cells to metabolize
linoleic acid and α-linolenic acid into AA and EPA. Our results clearly demonstrated that
Caco-2 cells could readily absorb linoleic acid and α-linolenic acid and that no increase
in ∆6-desaturation products was observed. This is in agreement with Huang et al. (20),
who also suggested that Caco-2 cells possess a low ∆6-desaturation activity. Inhibition of
GJIC after long-term incubation with linoleic acid and α-linolenic acid is thus caused by
these long-chain fatty acids and not by metabolites such as AA, EPA or even
prostaglandins.
Hayashi et al. (28) found that linoleic acid inhibited GJIC in WB-F344 cells treated for 6
days in a dose-dependent manner. Long-term treatment with linoleic acid caused
hyperphosphorylation of Cx43 protein, which correlated with loss of gap junction
plaques from the plasma membrane and apparent internalization of Cx43. Cx43 mRNA
levels also decreased following long-term incubation. The inhibition of GJIC in Caco-2
cells after long-term exposure to linoleic acid and α-linolenic acid, as observed in this
study, can probably also be explained by long-term modulation of gap junctions, such as
connexin transcription, phosphorylation and internalization.
Besides an inhibition in GJIC capacity of Caco-2 cells after incubation with linoleic acid
and α-linolenic acid, we also noticed a tendency in growth retardation for both fatty
acids. Abolishment of GJIC by AA and EPA after 10 days of culture was also
n-6 and n-3 PUFAs and GJIC
55
accompanied by a strong inhibition of cell number. Inhibition of GJIC can thus probably
better be explained by a general effect on cell growth and differentiation.
Rozenkranz et al. (29) observed that inhibitors of GJIC are significantly related to toxicity.
Lipid peroxidation products may have played an important role in mediating the
inhibitory effects of linoleic acid and α-linolenic acid on GJIC. Lipid peroxidation
products of unsaturated fatty acids can cause dysfunction of gap junction structures,
thereby reducing GJIC (14). This might also explain why long-term incubation with AA
and EPA completely inhibited GJIC of Caco-2 cells. AA and EPA became highly
cytotoxic, because these polyunsaturated fatty acids are even more prone to lipid
peroxidation. De Haan et al. (12) indeed showed that 4-hydroxynonenal, which is a
product of lipid peroxidation, inhibited GJIC in a dose-dependant way, also at non-
cytotoxic concentrations.
In conclusion, our results show that the GJIC capacity of human colon adenocarcinoma
Caco-2 cells increased during spontaneous differentiation. Short-term incubation of
linoleic acid, α-linolenic acid, AA and EPA had no effect on GJIC. After 10 to 22 days of
treatment, linoleic acid (18:2n-6) and α-linolenic acid (18:3n-3) inhibited GJIC of Caco-2
cells. More polyunsaturated fatty acids, AA (20:4n-6) and EPA (20:5n-3) completely
inhibited GJIC. However, no differential effects between n-6 and n-3 PUFAs were
observed. We suggest that inhibition of GJIC was caused by a general cytotoxic effect
due to the production of intracellular lipid peroxides.
Acknowledgements
This work was supported by the Dutch WUR/TNO Centre for Food Toxicology. The
authors wish to thank Alina Vrieling and Jaap Peters for technical assistance and Prof.
Peter van Bladeren for his helpful suggestions and careful reading of this manuscript.

Chapter 2
56
References
1. Delie, F. and Rubas W. (1997) A human colonic cell line sharing similarities with
enterocytes as a model to examine oral absorption: advantages and limitations of
the Caco-2 model. Crit Rev Ther Drug Carrier Syst, 14, 221-86.
2. Hara, A., Hibi T., Yoshioka M., Toda K., Watanabe N., Hayashi A., Iwao Y.,
Saito H., Watanabe T. and Tsuchiya M. (1993) Changes of proliferative activity
and phenotypes in spontaneous differentiation of a colon cancer cell line. Jpn J
Cancer Res, 84, 625-32.
3. Loewenstein, W.R. (1990) Cell-to-cell communication and the control of growth.
Am Rev Respir Dis, 142, S48-53.
4. Yamasaki, H. (1996) Role of disrupted gap junctional intercellular communication
in detection and characterization of carcinogens. Mutat Res, 365, 91-105.
5. Woutersen, R.A., Appel M.J., van Garderen-Hoetmer A. and Wijnands M.V.
(1999) Dietary fat and carcinogenesis. Mutat Res, 443, 111-27.
6. Singh, J., Hamid R. and Reddy B.S. (1997) Dietary fat and colon cancer:
modulation of cyclooxygenase-2 by types and amount of dietary fat during the
postinitiation stage of colon carcinogenesis. Cancer Res, 57, 3465-70.
7. Reddy, B.S., Burill C. and Rigotty J. (1991) Effect of diets high in omega-3 and
omega-6 fatty acids on initiation and postinitiation stages of colon carcinogenesis.
Cancer Res, 51, 487-91.
8. Chang, W.C., Chapkin R.S. and Lupton J.R. (1997) Predictive value of
proliferation, differentiation and apoptosis as intermediate markers for colon
tumorigenesis. Carcinogenesis, 18, 721-30.
9. Reddy, B.S., Simi B., Patel N., Aliaga C. and Rao C.V. (1996) Effect of amount
and types of dietary fat on intestinal bacterial 7 alpha-dehydroxylase and
phosphatidylinositol-specific phospholipase C and colonic mucosal diacylglycerol
kinase and PKC activities during stages of colon tumor promotion. Cancer Res,
56, 2314-20.
10. Davidson, L.A., Lupton J.R., Jiang Y.H. and Chapkin R.S. (1999) Carcinogen
and dietary lipid regulate ras expression and localization in rat colon without
affecting farnesylation kinetics. Carcinogenesis, 20, 785-91.
11. Rao, C.V. and Reddy B.S. (1993) Modulating effect of amount and types of
dietary fat on ornithine decarboxylase, tyrosine protein kinase and prostaglandins
production during colon carcinogenesis in male F344 rats. Carcinogenesis, 14,
1327-33.
12. Haan, L.H.J.d., Bosselaers I., Jongen W.M.F., Zwijsen R.M.L. and Koeman J.H.
(1994) Effect of lipids and aldehydes on gap-junctional intercellular
n-6 and n-3 PUFAs and GJIC
57
communication between human smooth muscle cells. Carcinogenesis, 15, 253-
256.
13. Aylsworth, C.F., Trosko J.E. and Welsch C.W. (1986) Influence of lipids on gap-
junction-mediated intercellular communication between Chinese hamster cells in
vitro. Cancer Res, 46, 4527-33.
14. Aylsworth, C.F., Welsch C.W., Kabara J.J. and Trosko J.E. (1987) Effects of fatty
acids on gap junctional communication: possible role in tumor promotion by
dietary fat. Lipids, 22, 445-54.
15. Hasler, C.M., Trosko J.E. and Bennink M.R. (1991) Incorporation of n-3 fatty
acids into WB-F344 cell phospholipids inhibits gap junctional intercellular
communication. Lipids, 26, 788-92.
16. Mesnil, M., Piccoli C., Klein J.L., Morand I. and Yamasaki H. (1993) Lack of
correlation between the gap junctional communication capacity of human colon
cancer cell lines and expression of the DCC gene, a homologue of a cell adhesion
molecule (N-CAM). Jpn J Cancer Res, 84, 742-7.
17. Awad, A.B., Kamei A., Horvath P.J. and Fink C.S. (1995) Prostaglandin synthesis
in human cancer cells: influence of fatty acids and butyrate. Prostaglandins Leukot
Essent Fatty Acids, 53, 87-93.
18. Tietz, N.W. (1983) IFCC methods for the measurement of catalytic concentrations
of enzymes, part 5. Clinica Chimica Acta, 339F-367F.
19. Bradford, M.M. (1976) A rapid and sensitive method for the quantitation of
microgram quantities of protein utilizing the principle of protein-dye binding. Anal
Biochem, 72, 248-254.
20. Huang, Y.S., Liu J.W., Koba K. and Anderson S.N. (1995) N-3 and n-6 fatty acid
metabolism in undifferentiated and differentiated human intestine cell line (Caco-
2). Mol Cell Biochem, 151, 121-30.
21. Bligh, E.G. and Dyer W.J. (1959) A rapid method of total lipid extraction and
purification. Can J Biochem Physiol, 37, 911-917.
22. Morrison, W.R. and Smith L.M. (1964) Preparation of fatty acid methyl esters and
dimethylacetals from lipids with boron fluoride-methanol. J Lipid Res, 5, 600-
608.
23. Duizer, E., Penninks A.H., Stenhuis W. and Groten (1997) Comparison of
permeability characteristics of the human colonic Caco-2 and rat small intestinal
IEC-18 cell lines. J Controlled Release, 49, 39-49.
24. Hara, A., Hibi T., Yoshioka M., Hayashi A., Toda K., Suzuki T., Kameda Y., Ueda
F., Watanabe M. and Tsuchiya M. (1992) Quantitative analysis of intercellular
Chapter 2
58
communication in colon cancer cells (Caco-2) by the scrape-loading/dye transfer
assay. Gastroenterol Jpn, 27, 560.
25. Statuto, M., Audebet C., Tonoli H., Selmi-Ruby S., Rousset B. and Munari-Silem
Y. (1997) Restoration of cell-to-cell communication in thyroid cell lines by
transfection with and stable expression of the connexin-32 gene. Impact on cell
proliferation and tissue-specific gene expression. J Biol Chem, 272, 24710-6.
26. Giaume, C., Randriamampita C. and Trautmann A. (1989) Arachidonic acid
closes gap junction channels in rat lacrimal glands. Pflugers Arch, 413, 273-9.
27. Chen, Q. and Nilsson A. (1993) Desaturation and chain elongation of n-3 and n-6
polyunsaturated fatty acids in the human CaCo-2 cell line. Biochim Biophys Acta,
1166, 193-201.
28. Hayashi, T., Matesic D.F., Nomata K., Kang K.S., Chang C.C. and Trosko J.E.
(1997) Stimulation of cell proliferation and inhibition of gap junctional
intercellular communication by linoleic acid. Cancer Lett, 112, 103-11.
29. Rosenkranz, H.S., Pollack N. and Cunningham A.R. (2000) Exploring the
relationship between the inhibition of gap junctional intercellular communication
and other biological phenomena. Carcinogenesis, 21, 1007-11.
n-6 and n-3 PUFAs, PGE2 and lipid peroxidation
59
Chapter 3
The role of cyclooxygenase in n-6 and n-3 polyunsaturated fatty acid-mediated effects on
cell proliferation, PGE2 synthesis and cytotoxicity in human colorectal carcinoma cell lines
Carcinogenesis, 24(3), 385-392, 2003
Yvonne E.M. Dommels1,2
Merel M.G. Haring2
Nynke G.M. Keestra2
Gerrit M. Alink2
Peter J. van Bladeren2,3
Ben van Ommen4
1WUR/TNO Centre for Food Toxicology 2Division of Toxicology, Wageningen University, Wageningen, The Netherlands 3Present address: Nestlé Research Center, Vers-chez-le-blanc, 1000 Lausanne 26,
Switzerland
4TNO Nutrition and Food Research, Department of Biomolecular Sciences, Zeist, The
Netherlands

Chapter 3
60
Abstract
This study was conducted to investigate the role of the enzyme cyclooxygenase (COX)
and its prostaglandin product PGE2 in n-6 and n-3 polyunsaturated fatty acid (PUFA)-
mediated effects on cellular proliferation of two human colorectal carcinoma cell lines.
The long chain PUFAs eicosapentaenoic acid (EPA; 20:5n-3) and arachidonic acid (AA;
20:4n-6) both inhibited cell proliferation of Caco-2 cells comparing to the long chain fatty
acids α-linolenic acid (ALA; 18:3n-3) and linoleic acid (LA; 18:2n-6). Neither incubations
with PGE2 nor reductions in PGE2 synthesis by EPA comparing to AA did lead to
differential effects on cell proliferation in Caco-2 cells. This suggests that n-6 and n-3
PUFA-mediated cell proliferation in Caco-2 cells is not regulated via PGE2 levels. AA and
EPA had no effect on growth of HT-29 colon cancer cells with a low COX activity.
However, stimulation of COX-2 activity by IL-1β resulted in a decrease in cell
proliferation and an induction of cytotoxicity by AA as well as by EPA. Both inhibition of
the COX pathway by indomethacin as well as inhibition of direct lipid peroxidation by
antioxidants such as vitamin E and C diminished the anti-proliferative effects of AA as
well as EPA. Also malondialdehyde, a product of lipid peroxidation and COX-activity
was decreased by addition of vitamin E and partially decreased by indomethacin. These
data support the hypothesis that growth inhibitory and cytotoxic effects of PUFAs with
methylene-interrupted double bonds such as AA and EPA are due to peroxidation
products that are generated during lipid peroxidation and COX activity.
n-6 and n-3 PUFAs, PGE2 and lipid peroxidation
61
Introduction
Colorectal cancer is one of the leading causes of cancer deaths in both men and women
in Western countries (1). Experimental animal studies (2-4) and epidemiological studies
in humans (5,6) suggest that aspirin and other nonsteroidal anti-inflammatory drugs
(NSAIDs) can inhibit colorectal tumorigenesis. One potential mechanism for this
chemopreventive effect is inhibition of the enzyme cyclooxygenase (COX). COX
catalyses a key step in the conversion of arachidonic acid (AA; 20:4n-6) to
prostaglandins, such as prostaglandin E2 (PGE2) (7). Also prostaglandin-independent
mechanisms by which NSAIDs exert their anti-neoplastic effects are being considered
because current studies reveal that NSAIDs inhibit the proliferation rate of colon cancer
cell lines independent of their ability to inhibit PGE2 synthesis (8,9).
Two isoforms of COX have been identified, COX-1 and COX-2. COX-1 is responsible for
'housekeeping' prostaglandin biosynthesis and is constitutively expressed in most tissues
in the body. COX-2 on the other hand is inducible by growth factors, cytokines and
tumor promoters (7). Overexpression of COX-2 has been reported in 90% of colon
tumors and premalignant colorectal adenomas (10), but the enzyme is not always
detected in human colorectal carcinoma cell lines. COX-2 is not expressed in poorly
differentiated colon cancer cell lines including HCT115 (8), HCT116 (11), HCT15,
SW480, SW620, RKO, DLD-1 (12), SW1116, SW948 and SW48 cells (13). The well-
differentiated human colorectal carcinoma cells HCA-7, Moser, LS174(T), HT-29 (8),
Caco-2 (11) and LoVo (14) do express COX-2 mRNA and protein (12,13).
NSAIDs can inhibit both COX-1 and COX-2 enzymes, which can cause adverse side
effects and chemopreventive effects (7). A new class of specific COX-2 inhibitors such as
celecoxib (15) and SC-58125 (16), which do not inhibit COX-1 at therapeutic doses, can
serve as more effective chemopreventive agents. These selective COX-2 inhibitors inhibit
the synthesis of prostaglandins that affect cell proliferation, tumor growth and immune
responsiveness with fewer side effects (16,17).
N-3 polyunsaturated fatty acids (PUFAs) such as eicosapentaenoic acid (EPA; 20:5n-3)
and docosahexaenoic acid (DHA; 22:6n-3), which are present in fish oil, have also been
shown to inhibit COX-mediated arachidonic acid metabolism (18-20). Singh et al. (21)
further demonstrated that a high fat fish oil (HFFO) diet resulted in reduced expression of
AOM-induced COX-2 expression in both colonic mucosa and colon tumors and
decreased colon tumor outcome in rats, comparing to a high fat corn oil (HFCO) diet
with high levels of the n-6 PUFA linoleic acid (LA; 18:2n-6). No significant differences
were observed in expression levels of COX-1. Other animal experiments have also
shown that HFCO diets enhance colon tumorigenesis in rodents, whereas HFFO diets
reduce colon carcinogenesis (22-25). It is hypothesized that n-6 PUFAs enhance
Chapter 3
62
colorectal carcinogenesis via increased production of prostaglandin E2, which can
stimulate cellular proliferation (26) in the colon (27,28). The mechanism responsible for
the inhibitory effects of n-3 PUFAs on colorectal tumors may partly be related to
inhibition of PGE2 synthesis from AA (20).
This study was conducted to investigate the mechanisms responsible for the differential
effects between n-6 and n-3 PUFAs on colon carcinogenesis at a molecular and cellular
level. The role of cyclooxygenase and its prostaglandin product PGE2 in n-6 and n-3
PUFA-mediated effects on cellular proliferation, an intermediate biomarker of colon
cancer risk (29), was studied. Human colon adenocarcinoma cells a.o. Caco-2 and HT-
29 were used in this study, because they express respectively high and lower levels of
COX-2 (12,14) and so may represent different stages of colorectal carcinogenesis.
Material and methods
Reagents
Bovine serum albumin (BSA; essential fatty acid-free), linoleic acid, α-linolenic acid,
arachidonic acid, eicosapentaenoic acid, prostaglandin E2, α-tocopherol (vitamin E),
indomethacin, trichloroacetic acid, 2-thiobarbituric acid and 1,1,3,3-tetramethoxy-
propane (malondialdehyde) were obtained from Sigma Chemical Company (St Louis,
MO, USA). 16,16-dimethyl PGE2 was purchased from Cayman Chemical Company
(Ann Arbor, Michigan, USA). Triton X-100 was obtained from Merck AG (Germany).
Fetal calf serum (FCS), non-essential amino acids, penicillin-streptomycin and all growth
media were obtained from Life Technologies (Breda, The Netherlands). Recombinant
human IL-1β was purchased from ITK diagnostics (Uithoorn, The Netherlands).
Cells and cell culture
Caco-2 and HT-29 cells were purchased from the American Type Culture Collection
(Rockville, MD, USA). LIM1215 cells were a generous gift from Dr. R Whitehead (Ludwig
Institute for Cancer Research, Australia) and HCA-7 Colony 29 cells were kindly
provided by Dr. S Kirkland (University of London, England).
All cells were maintained in an atmosphere of 5% CO2 / 95% air at 37 °C. Cells were
sub-cultured at a ratio of 2:10, after they had reached 70-90% confluence in 75 cm2
culture flasks (Costar, Cambridge, MA, USA).
Caco-2 cells were grown in DMEM, supplemented with 10% heat-inactivated FCS, 1%
non-essential amino acids, 2% penicillin-streptomycin, HT-29 cells were maintained in
10% FCS-containing McCoys 5a medium. LIM1215 cells and HCA-7 cells were grown in
10% FCS-containing DMEM supplemented with 0.11 g/l sodium pyruvate.
n-6 and n-3 PUFAs, PGE2 and lipid peroxidation
63
Cell proliferation
A colorimetric immunoassay kit (Cell proliferation ELISA, BrdU (colorimetric),
Boehringer Mannheim GmbH, Mannheim, Germany) was used for quantification of cell
proliferation. This assay is based on the measurement of BrdU incorporation during DNA
synthesis. For these experiments, cells were plated at a concentration of 5 x 10⁴ cells/ml
in 200 µl of medium into 96 well tissue culture plates. The medium was removed after 24
hours and 100 µl fresh serum-free medium, supplemented with the indicated
concentrations of PGE2 or 1 mg/ml fatty acid-free BSA and the indicated concentrations
of fatty acids with or without IL-1β (10 ng/ml), vitamin E or indomethacin (IM) were
added for 24 or 48 hours. The antioxidant vitamin E was also pre-incubated before fatty
acid treatment during the first 24 hours of cell culture. Fatty acids were dissolved in
ethanol up to a final concentration in the medium of 0.5%. Before addition to the
cultures, the fatty acids and ethanol were pre-incubated in the BSA-containing medium
for 30 minutes at 37 °C. Control wells received serum-free medium supplemented with 1
mg/ml fatty acid-free BSA plus 0.5% ethanol. After incubation the medium was removed
and BrdU was added to the cells for an additional 3 hours. Subsequently the
immunoassay was performed according to the protocol provided by the manufacturer.
Cell proliferation is expressed as mean percentage of control values (set as 100 %).
PGE2 analysis
Cells were plated at a concentration of 3.54 x 10⁵ cells/ml in 400 µl of medium into 24
well tissue culture plates. After 24 hours, the medium was removed and fresh serum-free
medium, supplemented with 1 mg/ml fatty acid-free BSA and the indicated
concentrations of fatty acids with or without IL-1β (10 ng/ml) was added. The medium
was harvested 1, 4, 10 or 24 hours after incubation. Prostaglandin E2 (PGE2) levels were
quantitated using a PGE2 enzyme immunoassay kit (Amersham Pharmacia Biotech UK
limited, Buckinghamshire, England) according to the high sensitivity EIA protocol 2,
recommended by the manufacturer. The results are expressed as picograms of PGE2 per
ml medium (curve range 20-640 pg/ml). The program EZ-Fit(tm), version 5.03 for
Windows (Perella Scientific Inc., NH, USA) is used to determine whether EPA could
reversibly inhibit COX activity in Caco-2 cells.
Cytotoxicity
Release of lactate dehydrogenase (LDH) in the culture medium through membrane
leakage was measured as an indicator of cytotoxicity. Cells were plated and treated with
fatty acids under the same conditions as described in the section cell proliferation. After
treatment the medium was collected from each well and 100 µl 0.5% Triton X-100 in 50

Chapter 3
64
mM potassium phosphate buffer was added to lyse the cells. Lactate dehydrogenase
activity was measured spectrophotometrically at 340 nm, with pyruvate as a substrate
(30). Results are expressed as LDH activity in the media as a percentage of the total LDH
activity in both cells and media, corrected for background leakage from control cells.
Lipid peroxidation
Lipid peroxidation was measured in Caco-2 cells (6-well cell culture dishes; 17.18 x 10⁴
cells/ml in 2 ml) and the culture medium, treated for 48 hours with fatty acids with or
without vitamin E or indomethacin. The thiobarbituric acid assay according to Buege
and Aust (31) was used. This assay is based on the fact that malondialdehyde (MDA),
which is a product of lipid peroxidation, reacts with thiobarbituric acid to give a red
species absorbing at 535 nm. Absorbance was converted to nmol MDA from a standard
curve generated with 1,1,3,3-tetramethoxypropane. Lipid peroxidation was presented as
nmol MDA per mg protein. Protein levels in cell cultures were measured according to
Bradford (32).
Results
Effects of n-6 and n-3 PUFAs on human colon carcinoma cell proliferation
The influence of α-linolenic acid (ALA; 18:3n-3), linoleic acid (LA; 18:2n-6),
eicosapentaenoic acid (EPA; 20:5n-3) and arachidonic acid (AA; 20:4n-6) on cell
proliferation was measured to compare the differential effects of exogenous n-3 and n-6
PUFAs on growth of human colorectal carcinoma cells. ALA and LA had no effect on
proliferation of Caco-2 cells up to exogenous concentrations of 80 µM. At a
concentration of 160 µM, ALA and LA inhibited the proliferation of Caco-2 cells after 48
hours of incubation (Figure 3.1A). The more polyunsaturated fatty acids EPA and AA
showed a dose-dependent decrease in cell proliferation after 48 hours of incubation in
Caco-2 cells (Figure 3.1A).
In comparison, ALA, LA, EPA and AA (0-160 µM) had no effect on cell proliferation of
HT-29 cells (data not shown). Although, induction of prostaglandin synthesis by IL-1β
treatment in HT-29 cells resulted in an AA and EPA-induced dose-dependent decrease in
cell proliferation (Figure 3.1B).

n-6 and n-3 PUFAs, PGE2 and lipid peroxidation
65
Figure 3.1A: Effects of n-6 and n-3 PUFAs on cell proliferation of human colon adenocarcinoma
Caco-2 cells. Cells were treated for 48 hours with α-linolenic acid (ALA; 18:3n-3), linoleic acid
(LA; 18:2n-6), eicosapentaenoic acid (EPA; 20:5n-3) or arachidonic acid (AA; 20:4n-6) at 0, 2.5,
5, 10, 20, 40, 80 and 160 µM. Results are the average of 6 replicate determinations of one of the
representative experiments. The SEM was < 7%
Figure 3.1B: Effects of EPA and AA on cell proliferation of human colon carcinoma HT-29 cells
treated with IL-1β. Cells were treated for 48 hours with 10 ng/ml IL-1β and eicosapentaenoic
acid (EPA; 20:5n-3) or arachidonic acid (AA; 20:4n-6) at 0, 10, 20, 40, 80 and 160 µM. Results
represent the means + SEM of 6 replicate determinations of one of the representative
experiments
0
20
40
60
80
100
120
0 20 40 60 80 100 120 140 160
Fatty Acid [µM]
Cell
pro
life
rati
on (
%)
EPA
AA
0
20
40
60
80
100
120
0 20 40 60 80 100 120 140 160
Fatty Acid [µM]
Cell
pro
life
rati
on (
%)
ALA
LA
EPA
AA

Chapter 3
66
Effects of n-6 and n-3 PUFAs on PGE2 production in human colon carcinoma cell lines
Caco-2 cells were treated with different fatty acids in order to determine the effects of
exogenous n-6 and n-3 PUFAs on PGE2 production. Figure 3.2 demonstrates clearly that
arachidonic acid (AA; 20:4n-6) increased PGE2 production in the medium of Caco-2 cells
after 24 hours of treatment. Basal levels of PGE2 in Caco-2 cells as well as effects of
treatment with linoleic acid (18:2n-6), α-linolenic acid (18:3n-3) or eicosapentaenoic acid
(EPA; 20:5n-3) on basal PGE2 levels could not be detected with the PGE2 EIA used.
Figure 3.2: Effect of exogenous AA on the production of PGE2 in human colon carcinoma Caco-
2 and HT-29 cells. Cells were treated for 24 hours with AA at 0, 10, 20, 40, 80 and 160 µM +/-
10 ng/ml IL-1ß. Results represent the means + SD of duplicate determinations of one of the
representative experiments
Caco-2 cells were also incubated with 20 µM of AA and co-incubated with different
concentrations of EPA for 1, 4, 10 and 24 hours to investigate whether EPA could inhibit
AA-induced PGE2 production in these cells. As shown in Figure 3.3A, EPA inhibited COX
activity in Caco-2 cells, i.e. PGE2 production, already after 1 hour of incubation. In order
to get more insight into the type of reversible enzyme inhibition, different concentrations
of AA were co-incubated with 0, 20 or 40 µM of EPA for 1 hour. The results (see Figure
3.3B) can be described by the Lineweaver-Burk equation, which is a transformation of
the Michaelis-Menten Equation. Competitive kinetic constants were arbitrarily estimated
0
100
200
300
400
500
600
700
800
900
0 10 20 40 80 160
AA [µM]
PG
E2 (
pg/m
l)
HT-29
HT-29 + IL-1ß
Caco-2
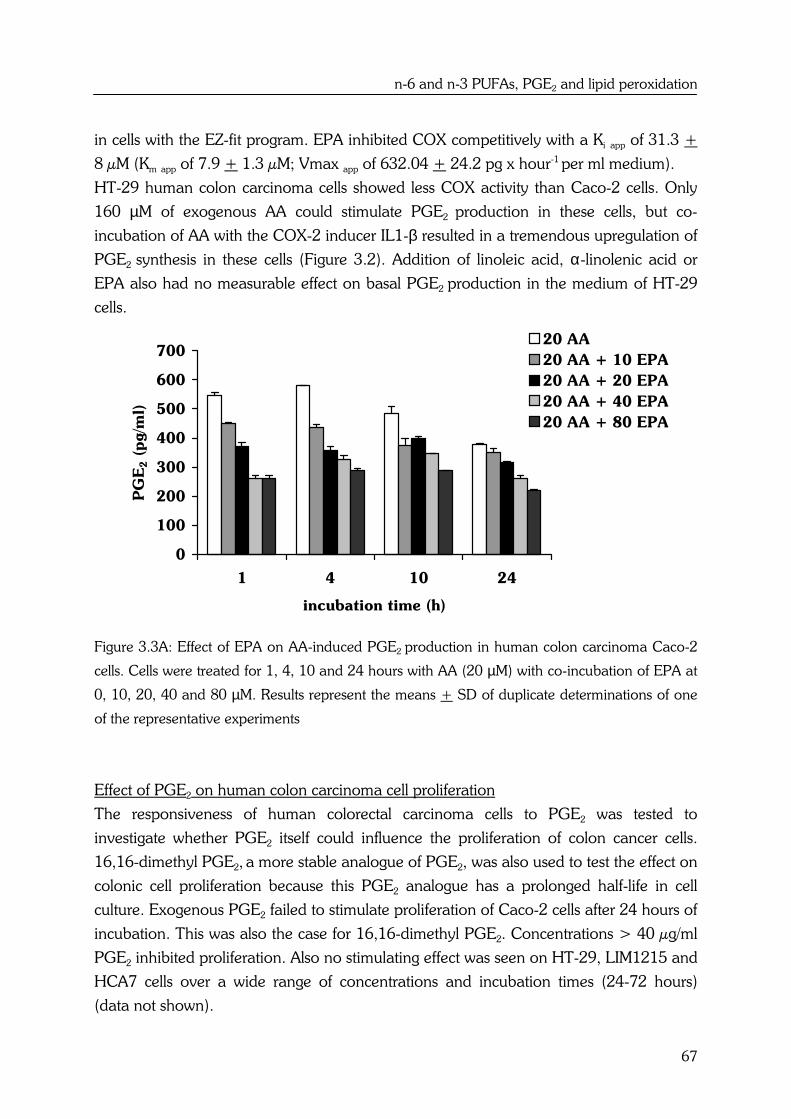
n-6 and n-3 PUFAs, PGE2 and lipid peroxidation
67
in cells with the EZ-fit program. EPA inhibited COX competitively with a Ki app of 31.3 +
8 µM (Km app of 7.9 + 1.3 µM; Vmax app of 632.04 + 24.2 pg x hour-1 per ml medium).
HT-29 human colon carcinoma cells showed less COX activity than Caco-2 cells. Only
160 µM of exogenous AA could stimulate PGE2 production in these cells, but co-
incubation of AA with the COX-2 inducer IL1-β resulted in a tremendous upregulation of
PGE2 synthesis in these cells (Figure 3.2). Addition of linoleic acid, α-linolenic acid or
EPA also had no measurable effect on basal PGE2 production in the medium of HT-29
cells.
Figure 3.3A: Effect of EPA on AA-induced PGE2 production in human colon carcinoma Caco-2
cells. Cells were treated for 1, 4, 10 and 24 hours with AA (20 µM) with co-incubation of EPA at
0, 10, 20, 40 and 80 µM. Results represent the means + SD of duplicate determinations of one
of the representative experiments
Effect of PGE2 on human colon carcinoma cell proliferation
The responsiveness of human colorectal carcinoma cells to PGE2 was tested to
investigate whether PGE2 itself could influence the proliferation of colon cancer cells.
16,16-dimethyl PGE2, a more stable analogue of PGE2, was also used to test the effect on
colonic cell proliferation because this PGE2 analogue has a prolonged half-life in cell
culture. Exogenous PGE2 failed to stimulate proliferation of Caco-2 cells after 24 hours of
incubation. This was also the case for 16,16-dimethyl PGE2. Concentrations > 40 µg/ml
PGE2 inhibited proliferation. Also no stimulating effect was seen on HT-29, LIM1215 and
HCA7 cells over a wide range of concentrations and incubation times (24-72 hours)
(data not shown).
0
100
200
300
400
500
600
700
1 4 10 24
incubation time (h)
PG
E2 (
pg/m
l)
20 AA
20 AA + 10 EPA
20 AA + 20 EPA
20 AA + 40 EPA
20 AA + 80 EPA
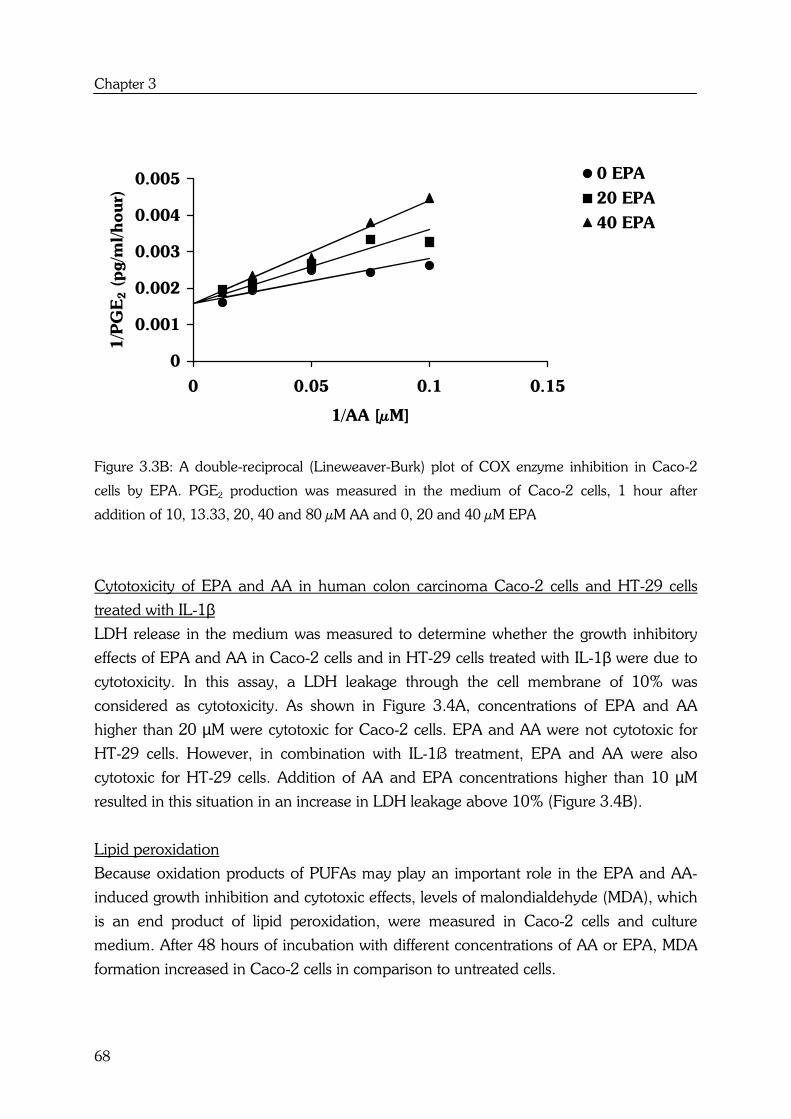
Chapter 3
68
Figure 3.3B: A double-reciprocal (Lineweaver-Burk) plot of COX enzyme inhibition in Caco-2
cells by EPA. PGE2 production was measured in the medium of Caco-2 cells, 1 hour after
addition of 10, 13.33, 20, 40 and 80 µM AA and 0, 20 and 40 µM EPA
Cytotoxicity of EPA and AA in human colon carcinoma Caco-2 cells and HT-29 cells
treated with IL-1β
LDH release in the medium was measured to determine whether the growth inhibitory
effects of EPA and AA in Caco-2 cells and in HT-29 cells treated with IL-1β were due to
cytotoxicity. In this assay, a LDH leakage through the cell membrane of 10% was
considered as cytotoxicity. As shown in Figure 3.4A, concentrations of EPA and AA
higher than 20 µM were cytotoxic for Caco-2 cells. EPA and AA were not cytotoxic for
HT-29 cells. However, in combination with IL-1ß treatment, EPA and AA were also
cytotoxic for HT-29 cells. Addition of AA and EPA concentrations higher than 10 µM
resulted in this situation in an increase in LDH leakage above 10% (Figure 3.4B).
Lipid peroxidation
Because oxidation products of PUFAs may play an important role in the EPA and AA-
induced growth inhibition and cytotoxic effects, levels of malondialdehyde (MDA), which
is an end product of lipid peroxidation, were measured in Caco-2 cells and culture
medium. After 48 hours of incubation with different concentrations of AA or EPA, MDA
formation increased in Caco-2 cells in comparison to untreated cells.
0
0.001
0.002
0.003
0.004
0.005
0 0.05 0.1 0.15
1/AA [µM]
1/P
GE
2 (
pg/m
l/hour)
0 EPA
20 EPA
40 EPA
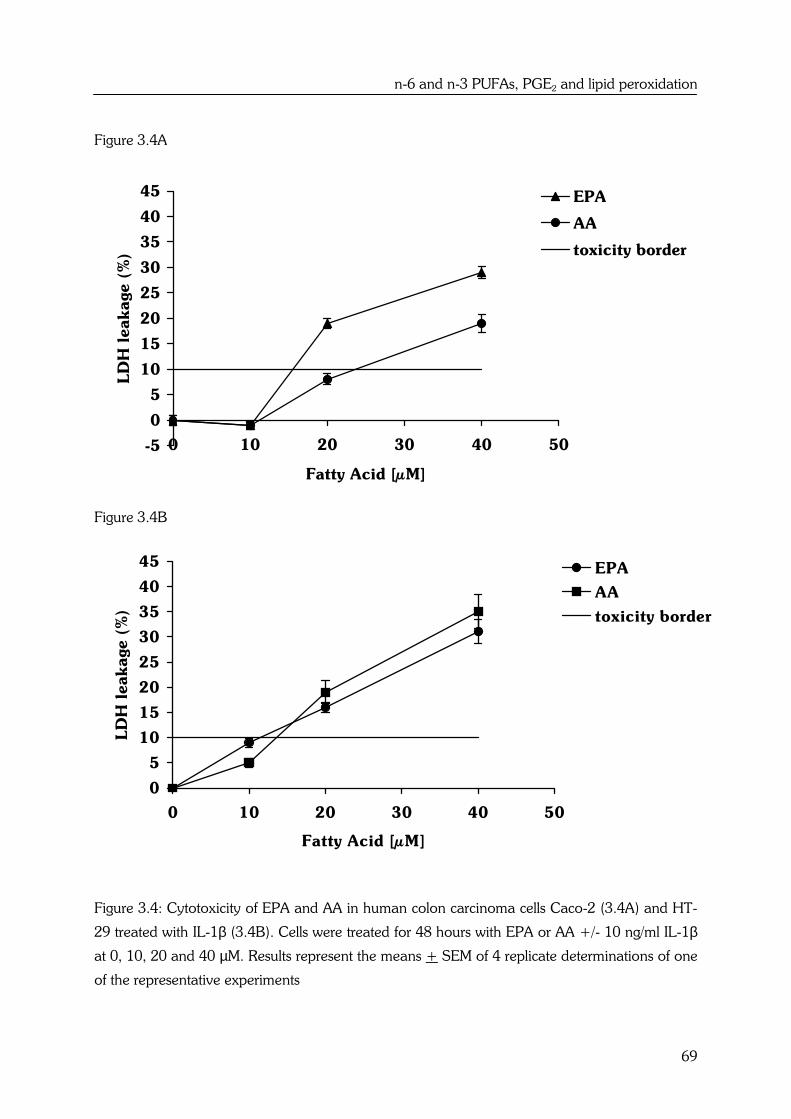
n-6 and n-3 PUFAs, PGE2 and lipid peroxidation
69
Figure 3.4A
Figure 3.4B
Figure 3.4: Cytotoxicity of EPA and AA in human colon carcinoma cells Caco-2 (3.4A) and HT-
29 treated with IL-1β (3.4B). Cells were treated for 48 hours with EPA or AA +/- 10 ng/ml IL-1β
at 0, 10, 20 and 40 µM. Results represent the means + SEM of 4 replicate determinations of one
of the representative experiments
-5
0
5
10
15
20
25
30
35
40
45
0 10 20 30 40 50
Fatty Acid [µM]
LD
H l
eakage (
%)
EPA
AA
toxicity border
0
5
10
15
20
25
30
35
40
45
0 10 20 30 40 50
Fatty Acid [µM]
LD
H l
eakage (
%)
EPA
AA
toxicity border
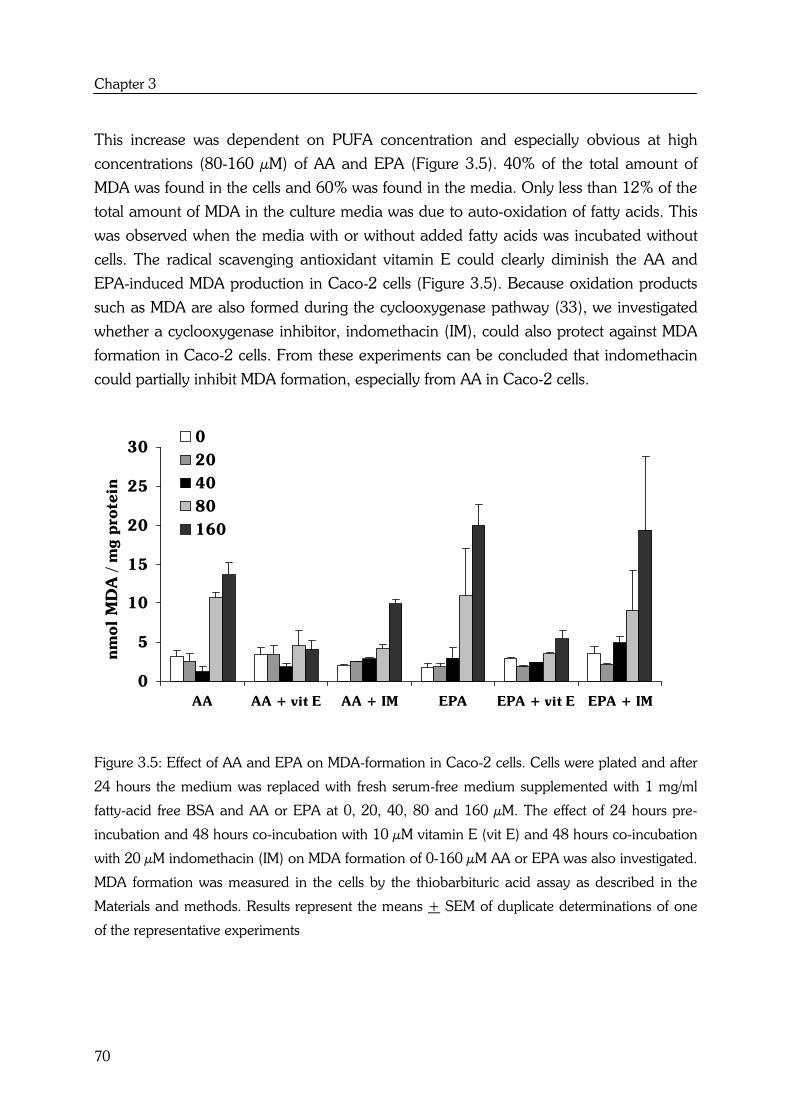
Chapter 3
70
This increase was dependent on PUFA concentration and especially obvious at high
concentrations (80-160 µM) of AA and EPA (Figure 3.5). 40% of the total amount of
MDA was found in the cells and 60% was found in the media. Only less than 12% of the
total amount of MDA in the culture media was due to auto-oxidation of fatty acids. This
was observed when the media with or without added fatty acids was incubated without
cells. The radical scavenging antioxidant vitamin E could clearly diminish the AA and
EPA-induced MDA production in Caco-2 cells (Figure 3.5). Because oxidation products
such as MDA are also formed during the cyclooxygenase pathway (33), we investigated
whether a cyclooxygenase inhibitor, indomethacin (IM), could also protect against MDA
formation in Caco-2 cells. From these experiments can be concluded that indomethacin
could partially inhibit MDA formation, especially from AA in Caco-2 cells.
Figure 3.5: Effect of AA and EPA on MDA-formation in Caco-2 cells. Cells were plated and after
24 hours the medium was replaced with fresh serum-free medium supplemented with 1 mg/ml
fatty-acid free BSA and AA or EPA at 0, 20, 40, 80 and 160 µM. The effect of 24 hours pre-
incubation and 48 hours co-incubation with 10 µM vitamin E (vit E) and 48 hours co-incubation
with 20 µM indomethacin (IM) on MDA formation of 0-160 µM AA or EPA was also investigated.
MDA formation was measured in the cells by the thiobarbituric acid assay as described in the
Materials and methods. Results represent the means + SEM of duplicate determinations of one
of the representative experiments
0
5
10
15
20
25
30
AA AA + vit E AA + IM EPA EPA + vit E EPA + IM
nm
ol
MD
A / m
g p
rote
in
0
20
40
80
160

n-6 and n-3 PUFAs, PGE2 and lipid peroxidation
71
Figure 3.6A
Figure 3.6B
Figure 3.6: Effect of vitamin E (3.6A&B) and indomethacin (3.6C&D) on EPA and AA-induced
decrease in cell proliferation in Caco-2 cells. Cells were plated in medium and pre-incubated with
or without 10 µM vitamin E. After 24 hours, the medium was replaced with fresh serum-free
medium supplemented with 1 mg/ml fatty acid-free BSA and EPA or AA at 0, 20, 40, 80 and 160
µM with or without 10 µM vitamin E or indomethacin (IM) (10 or 20 µM). After 48 hours, cell
proliferation was measured by ELISA as described in Materials and methods. Results represent
the means + SEM of 6 replicate determinations of one of the representative experiments
0
20
40
60
80
100
120
140
0 50 100 150 200
AA [µM]
Cell
pro
life
rati
on (
%)
AA
AA + 10 uM Vit E
0
20
40
60
80
100
120
140
0 50 100 150 200
EPA [mM]
Cell
pro
life
rati
on (
%)
EPA
EPA +10 uM Vit E

Chapter 3
72
Figure 3.6C
Figure 3.6D
0
20
40
60
80
100
120
140
0 50 100 150 200
AA [µM]
Cell
pro
life
rati
on (
%)
AA
AA + 10 uM IM
AA + 20 uM IM
0
20
40
60
80
100
120
140
0 50 100 150 200
EPA [µM]
Cell
pro
life
rati
on (
%)
EPA
EPA + 10 uM IM
EPA + 20 uM IM
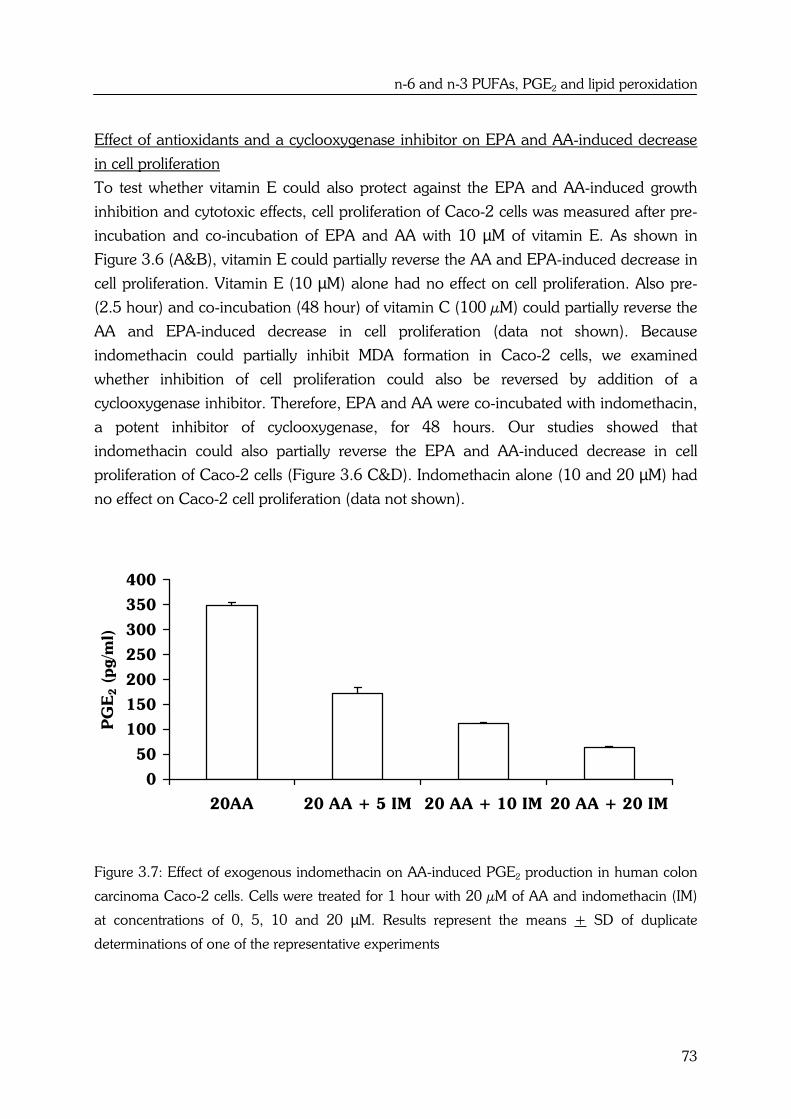
n-6 and n-3 PUFAs, PGE2 and lipid peroxidation
73
Effect of antioxidants and a cyclooxygenase inhibitor on EPA and AA-induced decrease
in cell proliferation
To test whether vitamin E could also protect against the EPA and AA-induced growth
inhibition and cytotoxic effects, cell proliferation of Caco-2 cells was measured after pre-
incubation and co-incubation of EPA and AA with 10 µM of vitamin E. As shown in
Figure 3.6 (A&B), vitamin E could partially reverse the AA and EPA-induced decrease in
cell proliferation. Vitamin E (10 µM) alone had no effect on cell proliferation. Also pre-
(2.5 hour) and co-incubation (48 hour) of vitamin C (100 µM) could partially reverse the
AA and EPA-induced decrease in cell proliferation (data not shown). Because
indomethacin could partially inhibit MDA formation in Caco-2 cells, we examined
whether inhibition of cell proliferation could also be reversed by addition of a
cyclooxygenase inhibitor. Therefore, EPA and AA were co-incubated with indomethacin,
a potent inhibitor of cyclooxygenase, for 48 hours. Our studies showed that
indomethacin could also partially reverse the EPA and AA-induced decrease in cell
proliferation of Caco-2 cells (Figure 3.6 C&D). Indomethacin alone (10 and 20 µM) had
no effect on Caco-2 cell proliferation (data not shown).
Figure 3.7: Effect of exogenous indomethacin on AA-induced PGE2 production in human colon
carcinoma Caco-2 cells. Cells were treated for 1 hour with 20 µM of AA and indomethacin (IM)
at concentrations of 0, 5, 10 and 20 µM. Results represent the means + SD of duplicate
determinations of one of the representative experiments
0
50
100
150
200
250
300
350
400
20AA 20 AA + 5 IM 20 AA + 10 IM 20 AA + 20 IM
PG
E2 (
pg/m
l)
Chapter 3
74
Effect of indomethacin on PGE2 production in human colon carcinoma Caco-2 cells
Addition of the non-selective cyclooxygenase inhibitor indomethacin did not alter cellular
proliferation of human colon carcinoma Caco-2 cells at exogenous concentrations of 10
and 20 µM, as mentioned above. These concentrations produced, on the other hand,
significant decreases in AA-induced PGE2 production in these cells already 1 hour after
incubation, as shown in Figure 3.7.
Discussion
In several in vivo studies, it is hypothesized that corn oil with a high amount of n-6
PUFAs such as linoleic acid (18:2n-6) might enhance colorectal carcinogenesis via
stimulation of colonic cell proliferation (24). Fish oil, on the other hand, with a high
amount of n-3 PUFAs such as eicosapentaenoic acid (20:5n-3) is thought to have
inhibitory effects on tumor cell growth (34,35). By contrast, fewer studies have been
conducted in human colon cancer cell lines. In most in vitro studies performed, the n-3
fatty acid EPA has antitumoral effects through inhibition of cell proliferation (36,37) or
induction of apoptosis (38). However, only a few studies have compared the potency of
various n-3 and n-6 PUFAs in modulating cell growth in the same colon cancer cell line
(39,40).
Therefore, we studied the effect of α-linolenic acid (ALA; 18:3n-3), linoleic acid (LA;
18:2n-6), eicosapentaenoic acid (EPA; 20:5n-3) and arachidonic acid (AA; 20:4n-6) on
cell proliferation in both Caco-2 as well as HT-29 cells to compare the differential effects
of exogenous n-3 and n-6 PUFAs on growth of human colorectal carcinoma cell lines.
From these studies it became clear that the long-chain n-3 and n-6 fatty acids α-linolenic
acid (ALA) and linoleic acid (LA) had no effect on growth of Caco-2 and HT-29 cells. At
a concentration of 160 µM, ALA and LA inhibited the proliferation of Caco-2 cells in
comparison to HT-29 cells, indicating differences in sensitivities among different cell
lines. We indeed found that the more polyunsaturated n-3 fatty acid EPA inhibited the
growth of human colorectal carcinoma Caco-2 cells, but the n-6 fatty acid AA showed
the same growth inhibitory and cytotoxic effects. AA and EPA did not influence the
proliferation rate in HT-29 cells, again indicating differences in sensitivities of different
cell lines to n-6 and n-3 PUFAs. Overall, no differential effect between the long chain n-3
and n-6 fatty acids ALA and LA were observed in both Caco-2 as well as HT-29 cells,
regarding to cell proliferation. Also no differential effects were observed between the
more polyunsaturated long chain n-3 and n-6 fatty acids EPA and AA, even at low non-
toxic concentrations of exogenous PUFAs (< 20 µM). On the other hand, the more
polyunsaturated long chain fatty acids (20:5n-3 and 20:4n-6) did inhibit cell growth in

n-6 and n-3 PUFAs, PGE2 and lipid peroxidation
75
Caco-2 cells comparing to the long chain fatty acids (18:3n-3 and 18:2n-6). This suggests
that the number of double bonds in the carbon atom chain of the fatty acid is more
important for the anti-proliferative and cytotoxic effects of n-3 and n-6 fatty acids than
the place of the double bond.
It is also suggested in in vivo studies that n-6 PUFAs might enhance colorectal
carcinogenesis via increased COX-2 expression and increased production of
prostaglandins, such as PGE2 (21,41). N-3 fatty acids might exert their antitumoral effect
through inhibition of PGE2 synthesis via the cyclooxygenase pathway (19,35). Therefore,
the role of cyclooxygenase and its prostaglandin product PGE2 in n-6 and n-3 PUFA-
mediated effects on cellular proliferation was also investigated in this study. We
demonstrated that human colon adenocarcinoma Caco-2 cells, which express high levels
of COX-2 (14), produce PGE2 upon addition of arachidonic acid. HT-29 colon cells on
the other hand did not produce high levels of PGE2 under the same conditions. PGE2
synthesis in this cell line was rather inducible by IL-1β, a cytokine that is known to
increase COX-2 expression (42,43). Thus, although COX-2 protein is expressed in Caco-
2 as well as HT-29 cells, COX-2 enzyme activity seemed to be variable in the different
cell lines. The observation that the n-6 fatty acid linoleic acid could not increase PGE2
production is in agreement with the finding that the parent essential fatty acid linoleic
acid is not converted to the prostaglandin precursor arachidonic acid in Caco-2 (44) as
well as HT-29 cells.
N-3 PUFAs are precursors of trienoic prostaglandins in stead of dienoic prostaglandins
(45). EPA is converted by COX to the 3-series endoperoxide PGH3, by way of PGG3,
which can be further metabolized to PGE3 (46). Because n-3 and n-6 PUFAs are both
substrates for prostaglandin synthesis, they compete for enzymes such as COX. EPA
indeed competitively inhibited AA-induced PGE2 synthesis in Caco-2 cells. This in vitro
result is thus in agreement with the in vivo studies mentioned above that also show that
n-3 PUFAs such as EPA inhibit COX activity and arachidonic acid metabolism (19,35).
However, regulation of cell proliferation is not directly mediated via PGE2 levels in Caco-
2 cells, since reductions in PGE2 synthesis by EPA comparing to AA did not lead to
differential effects on cell proliferation in human colon adenocarcinoma Caco-2 cells.
Moreover, the causal positive relationship between PGE2 and proliferation of colon
epithelial cells is also questioned through the contrasting results obtained by many
laboratories (9,13,27,28,47). Addition of exogenous PGE2 failed to stimulate cell
proliferation of Caco-2, HT-29, LIM1215 and HCA-7 cells in our experiments. These
findings confirm previous studies in which PGE2 also failed to stimulate proliferation of
human colon adenocarcinoma cells (9,13,47) and support the idea that PGE2 does not
play a direct role in the proliferation of human colon adenocarcinoma cells.
Chapter 3
76
PUFAs with methylene-interrupted double bonds such as EPA and AA are highly
susceptible to enzymatic and non-enzymatic peroxidation (48). Enzymatic peroxidation is
brought about by the action of cell-derived peroxidizing enzymes such as cyclooxygenase
(49). Non-enzymatic peroxidation is initiated by free-radical attack of membrane lipids,
generating large amounts of reactive products (48). Peroxidation products of PUFAs may
have played an important role in the EPA and AA-induced growth inhibition and
cytotoxic effects. Malondialdehyde (MDA) is a product of both spontaneous lipid
peroxidation (48) and of prostaglandin biosynthesis (33,50). Therefore, levels of MDA
were measured in Caco-2 cells to determine the extent of peroxidation reactions in Caco-
2 cells after treatment with either AA or EPA. MDA was indeed increased after incubation
with AA or EPA in Caco-2 cells. Incubation of AA or EPA with vitamin E, an antioxidant
that prevents lipid peroxidation, almost completely abolished MDA formation in Caco-2
cells. Because Gavino et al. (50) showed that cellular uptake of antioxidants is not rapid
enough for inhibition of MDA formation at short incubation time intervals, both the lipid-
soluble vitamin E as well as the water-soluble antioxidant vitamin C were pre- and co-
incubated in the medium. Addition of both vitamin E as well as vitamin C also partially
reversed cell proliferation of Caco-2 cells, especially at low concentrations of AA or EPA.
Overall, these results support the potential role of lipid peroxidation in the AA and EPA-
induced growth inhibition and cytotoxic effects. Also other studies (36,50-52) have
demonstrated the protective role of vitamin E and C against lipid peroxidation and
PUFA-induced inhibition of cell proliferation.
In addition, we are the first to show that indomethacin, a COX inhibitor that clearly
inhibited AA-induced PGE2 synthesis in Caco-2 cells, could also partially reverse the anti-
proliferative effects of both AA and EPA. Also induction of COX-2 activity in HT-29 cells
by IL-1β did not increase cell proliferation by AA, but rather caused a decrease in cell
proliferation and an induction of cytotoxicity by AA as well as EPA. Both results suggest
that in human colon cancer cells, n-6 and n-3 polyunsaturated fatty acid-induced growth
inhibition is also related to COX activity. Because cell-derived peroxidizing enzymes such
as COX can also lead to oxidation of a wide range of compounds and to production of
MDA via enzymatic and non-enzymatic breakdown of PGH2 and PGH3 (49,53), we
measured whether inhibition of COX-activity by indomethacin could also inhibit AA and
EPA-induced MDA formation. Indomethacin partially inhibited AA-induced MDA
formation in Caco-2 cells, with minor effects on EPA. These results suggest though that
the inhibitory effects of PUFAs on cell proliferation could also partially be due to
peroxidation products that are generated during COX activity. Also other COX-derived
products (PUFA-metabolites) may explain the effect that PUFAs have on the extent of
cell proliferation.

n-6 and n-3 PUFAs, PGE2 and lipid peroxidation
77
These effects are intriguing and paradoxical to our current understanding of the role of
COX-2 in cancer cells. However, previous studies only focused on the 'single' effects of
non-specific NSAIDs such as indomethacin, on the proliferation of intestinal epithelial
cells. These studies indicate that high-dose indomethacin reduces the proliferation rate of
colon cancer cells (54,55). Low concentrations of indomethacin (10-8 to 10-4 M) do not
inhibit cell growth, which is in agreement with our result that indomethacin alone (10 and
20 µM) had no effect on Caco-2 cell proliferation. In contrary, we demonstrated that
indomethacin in combination with the polyunsaturated fatty acids AA and EPA thus
supports the growth of colon carcinoma Caco-2 cells, partially through inhibition of
peroxidation products that are generated during COX activity.
Overall our data suggest that the number of double bonds in the carbon atom chain of
the fatty acid is more important for the anti-proliferative and cytotoxic effects of n-3 and
n-6 fatty acids in our in vitro system than the place of the double bond. Non-enzymatic
lipid peroxidation products as well as COX-derived (peroxidation) products were
probably responsible for the growth inhibitory effects of the highly polyunsaturated fatty
acids such as AA and EPA. The extent to which these results are relevant for the in vivo
effects of n-6 and n-3 PUFAs on colorectal carcinogenesis need to be evaluated.
Acknowledgements
The authors wish to thank Jan Bogaards of TNO Nutrition and Food Research, Zeist,
The Netherlands, for determining the kinetic parameters with the EZ-Fit program.
Chapter 3
78
References
1. Visser, O., Coebergh J., Schouten L. and Van Dijck J. (2001) Incidence of Cancer
in The Netherlands. Vereniging van Integrale Kankercentra, Utrecht, pp. 86.
2. Charalambous, D., Farmer C. and O'Brien P.E. (1996) Sulindac and
indomethacin inhibit formation of aberrant crypt foci in the colons of dimethyl
hydrazine treated rats. J Gastroenterol Hepatol, 11, 88-92.
3. Rao, C.V., Rivenson A., Simi B., Zang E., Kelloff G., Steele V. and Reddy B.S.
(1995) Chemoprevention of colon carcinogenesis by sulindac, a nonsteroidal anti-
inflammatory agent. Cancer Res, 55, 1464-72.
4. Reddy, B.S., Rao C.V., Rivenson A. and Kelloff G. (1993) Inhibitory effect of
aspirin on azoxymethane-induced colon carcinogenesis in F344 rats.
Carcinogenesis, 14, 1493-7.
5. Thun, M.J., Namboodiri M.M. and Heath C.W., Jr. (1991) Aspirin use and
reduced risk of fatal colon cancer. N Engl J Med, 325, 1593-6.
6. Giardiello, F.M., Hamilton S.R., Krush A.J., Piantadosi S., Hylind L.M., Celano
P., Booker S.V., Robinson C.R. and Offerhaus G.J. (1993) Treatment of colonic
and rectal adenomas with sulindac in familial adenomatous polyposis. N Engl J
Med, 328, 1313-6.
7. Gupta, R. and DuBois R.N. (2001) Colorectal cancer prevention and treatment by
inhibition of cyclooxygenase-2. Nature Reviews, 1, 11-21.
8. Hanif, R., Pittas A., Feng Y., Koutsos M.I., Qiao L., Staiano-Coico L., Shiff S.I.
and Rigas B. (1996) Effects of nonsteroidal anti-inflammatory drugs on
proliferation and on induction of apoptosis in colon cancer cells by a
prostaglandin- independent pathway. Biochem Pharmacol, 52, 237-45.
9. Coffey, R.J., Hawkey C.J., Damstrup L., Graves-Deal R., Daniel V.C., Dempsey
P.J., Chinery R., Kirkland S.C., DuBois R.N., Jetton T.L. and Morrow J.D. (1997)
Epidermal growth factor receptor activation induces nuclear targeting of
cyclooxygenase-2, basolateral release of prostaglandins, and mitogenesis in
polarizing colon cancer cells. Proc Natl Acad Sci U S A, 94, 657-62.
10. Eberhart, C.E., Coffey R.J., Radhika A., Giardiello F.M., Ferrenbach S. and
DuBois R.N. (1994) Up-regulation of cyclooxygenase 2 gene expression in
human colorectal adenomas and adenocarcinomas. Gastroenterology, 107,
1183-8.
11. Hsi, L.C., Baek S.J. and Eling T.E. (2000) Lack of cyclooxygenase-2 activity in
HT-29 human colorectal carcinoma cells. Exp Cell Res, 256, 563-70.
n-6 and n-3 PUFAs, PGE2 and lipid peroxidation
79
12. Shao, J., Sheng H., Inoue H., Morrow J.D. and DuBois R.N. (2000) Regulation of
constitutive cyclooxygenase-2 expression in colon carcinoma cells. J Biol Chem,
275, 33951-6.
13. Parker, J., Kaplon M.K., Alvarez C.J. and Krishnaswamy G. (1997) Prostaglandin
H synthase expression is variable in human colorectal adenocarcinoma cell lines.
Exp Cell Res, 236, 321-9.
14. Tsuji, S., Kawano S., Sawaoka H., Takei Y., Kobayashi I., Nagano K., Fusamoto
H. and Kamada T. (1996) Evidences for involvement of cyclooxygenase-2 in
proliferation of two gastrointestinal cancer cell lines. Prostaglandins Leukot Essent
Fatty Acids, 55, 179-83.
15. Jacoby, R.F., Seibert K., Cole C.E., Kelloff G. and Lubet R.A. (2000) The
cyclooxygenase-2 inhibitor celecoxib is a potent preventive and therapeutic agent
in the min mouse model of adenomatous polyposis. Cancer Res, 60, 5040-4.
16. Sheng, H., Shao J., Kirkland S.C., Isakson P., Coffey R.J., Morrow J.,
Beauchamp R.D. and DuBois R.N. (1997) Inhibition of human colon cancer cell
growth by selective inhibition of cyclooxygenase-2. J Clin Invest, 99, 2254-9.
17. Reddy, B.S., Hirose Y., Lubet R., Steele V., Kelloff G., Paulson S., Seibert K. and
Rao C.V. (2000) Chemoprevention of colon cancer by specific cyclooxygenase-2
inhibitor, celecoxib, administered during different stages of carcinogenesis. Cancer
Res, 60, 293-7.
18. Onogi, N., Okuno M., Komaki C., Moriwaki H., Kawamori T., Tanaka T., Mori H.
and Muto Y. (1996) Suppressing effect of perilla oil on azoxymethane-induced
foci of colonic aberrant crypts in rats. Carcinogenesis, 17, 1291-6.
19. Rao, C.V. and Reddy B.S. (1993) Modulating effect of amount and types of
dietary fat on ornithine decarboxylase, tyrosine protein kinase and prostaglandins
production during colon carcinogenesis in male F344 rats. Carcinogenesis, 14,
1327-33.
20. Takahashi, M., Fukutake M., Isoi T., Fukuda K., Sato H., Yazawa K., Sugimura T.
and Wakabayashi K. (1997) Suppression of azoxymethane-induced rat colon
carcinoma development by a fish oil component, docosahexaenoic acid (DHA).
Carcinogenesis, 18, 1337-42.
21. Singh, J., Hamid R. and Reddy B.S. (1997) Dietary fat and colon cancer:
modulation of cyclooxygenase-2 by types and amount of dietary fat during the
postinitiation stage of colon carcinogenesis. Cancer Res, 57, 3465-70.
22. Dommels, Y.E.M., Alink G.M., van Bladeren P.J. and van Ommen B. (2002)
Dietary n-6 and n-3 polyunsaturated fatty acids and colorectal carcinogenesis:

Chapter 3
80
results from cultured colon cells, animal models and human studies.
Environmental Toxicology and Pharmacology, 12, 233-244.
23. Reddy, B.S., Burill C. and Rigotty J. (1991) Effect of diets high in omega-3 and
omega-6 fatty acids on initiation and postinitiation stages of colon carcinogenesis.
Cancer Res, 51, 487-91.
24. Chang, W.C., Chapkin R.S. and Lupton J.R. (1997) Predictive value of
proliferation, differentiation and apoptosis as intermediate markers for colon
tumorigenesis. Carcinogenesis, 18, 721-30.
25. Singh, J., Hamid R. and Reddy B.S. (1997) Dietary fat and colon cancer:
modulating effect of types and amount of dietary fat on ras-p21 function during
promotion and progression stages of colon cancer. Cancer Res, 57, 253-8.
26. Hughes-Fulford, M., Chen Y. and Tjandrawinata R.R. (2001) Fatty acid regulates
gene expression and growth of human prostate cancer PC-3 cells. Carcinogenesis,
22, 701-7.
27. Qiao, L., Kozoni V., Tsioulias G.J., Koutsos M.I., Hanif R., Shiff S.J. and Rigas B.
(1995) Selected eicosanoids increase the proliferation rate of human colon
carcinoma cell lines and mouse colonocytes in vivo. Biochim Biophys Acta,
1258, 215-23.
28. Sheng, H., Shao J., Washington M.K. and DuBois R.N. (2001) Prostaglandin E2
increases growth and motility of colorectal carcinoma cells. J Biol Chem, 276,
18075-81.
29. Bartram, H.P., Gostner A., Scheppach W., Reddy B.S., Rao C.V., Dusel G.,
Richter F., Richter A. and Kasper H. (1993) Effects of fish oil on rectal cell
proliferation, mucosal fatty acids, and prostaglandin E2 release in healthy
subjects. Gastroenterology, 105, 1317-22.
30. Mitchell, D.B., Santone K.S. and Acosta D. (1980) Evaluation of cytotoxicity in
cultured cells by enzyme leakage. J Tissue Cult Methods, 6, 113-116.
31. Buege, J.A. and Aust S.D. (1978) Microsomal lipid peroxidation. Methods
Enzymol, 52, 302-10.
32. Bradford, M.M. (1976) A rapid and sensitive method for the quantitation of
microgram quantities of protein utilizing the principle of protein-dye binding. Anal
Biochem, 72, 248-254.
33. Marnett, L.J. (1994) Generation of mutagens during arachidonic acid metabolism.
Cancer Metastasis Rev, 13, 303-8.
34. Latham, P., Lund E.K. and Johnson I.T. (1999) Dietary n-3 PUFA increases the
apoptotic response to 1,2- dimethylhydrazine, reduces mitosis and suppresses the
induction of carcinogenesis in the rat colon. Carcinogenesis, 20, 645-50.
n-6 and n-3 PUFAs, PGE2 and lipid peroxidation
81
35. Zhou, S., Wang G., Chen B. and Wang P. (2000) Effect of dietary fatty acids on
tumorigenesis of colon cancer induced by methyl nitrosourea in rats. J Environ
Pathol Toxicol Oncol, 19, 81-6.
36. Mengeaud, V., Nano J.L., Fournel S. and Rampal P. (1992) Effects of
eicosapentaenoic acid, gamma-linolenic acid and prostaglandin E1 on three
human colon carcinoma cell lines. Prostaglandins Leukot Essent Fatty Acids, 47,
313-9.
37. Palozza, P., Calviello G., Maggiano N., Lanza P., Raneletti F.O. and Bartoli G.M.
(2000) Beta-carotene antagonizes the effects of eicosapentaenoic acid on cell
growth and lipid peroxidation in WiDr adenocarcinoma cells. Free Radical
Biology & Medicine, 28, 228-234.
38. Clarke, R.G., Lund E.K., Latham P., Pinder A.C. and Johnson I.T. (1999) Effect
of eicosapentaenoic acid on the proliferation and incidence of apoptosis in the
colorectal cell line HT29. Lipids, 34, 1287-95.
39. Tsai, W.S., Nagawa H., Kaizaki S., Tsuruo T. and Muto T. (1998) Inhibitory
effects of n-3 polyunsaturated fatty acids on sigmoid colon cancer transformants. J
Gastroenterol, 33, 206-12.
40. Chen, Z.Y. and Istfan N.W. (2000) Docosahexaenoic acid is a potent inducer of
apoptosis in HT-29 colon cancer cells. Prostaglandins Leukot Essent Fatty Acids,
63, 301-8.
41. Rao, C.V., Simi B., Wynn T.T., Garr K. and Reddy B.S. (1996) Modulating effect
of amount and types of dietary fat on colonic mucosal phospholipase A2,
phosphatidylinositol-specific phospholipase C activities, and cyclooxygenase
metabolite formation during different stages of colon tumor promotion in male
F344 rats. Cancer Res, 56, 532-7.
42. Homaidan, F.R., Zhao L., Chakroun I., Martin C.A. and Burakoff R. (1999) The
mechanisms of action of interleukin-1 on rabbit intestinal epithelial cells.
Mediators Inflamm, 8, 189-97.
43. Kim, E.C., Zhu Y., Andersen V., Sciaky D., Cao H.J., Meekins H., Smith T.J. and
Lance P. (1998) Cytokine-mediated PGE2 expression in human colonic
fibroblasts. Am J Physiol, 275, C988-94.
44. Dommels, Y.E.M., Alink G.M., Linssen J.P.H. and van Ommen B. (2002) Effects
of n-6 and n-3 Polyunsaturated Fatty Acids on Gap Junctional Intercellular
Communication (GJIC) During Spontaneous Differentiation of the Human Colon
Adenocarcinoma Cell Line Caco-2. Nutr Cancer, 42, 125-130.
45. Arntzen, K.J., Brekke O.L., Vatten L. and Austgulen R. (1998) Reduced
production of PGE2 and PGF2 alpha from decidual cell cultures supplemented
Chapter 3
82
with N-3 polyunsaturated fatty acids. Prostaglandins Other Lipid Mediat, 56, 183-
95.
46. Rose, D.P. and Connolly J.M. (1999) Omega-3 fatty acids as cancer
chemopreventive agents. Pharmacol Ther, 83, 217-44.
47. Cassano, G., Gasparre G., Susca F., Lippe C. and Guanti G. (2000) Effect of
prostaglandin E(2) on the proliferation, Ca(2+) mobilization and cAMP in HT-29
human colon adenocarcinoma cells. Cancer Lett, 152, 217-22.
48. Grammatikos, S.I., Subbaiah P.V., Victor T.A. and Miller W.M. (1994) Diverse
effects of essential (n-6 and n-3) fatty acids on cultured cells. Cytotechnology, 15,
31-50.
49. Marnett, L.J. (1990) Prostaglandin synthase-mediated metabolism of carcinogens
and a potential role for peroxyl radicals as reactive intermediates. Environ Health
Perspect, 88, 5-12.
50. Gavino, V.C., Miller J.S., Ikharebha S.O., Milo G.E. and Cornwell D.G. (1981)
Effect of polyunsaturated fatty acids and antioxidants on lipid peroxidation in
tissue cultures. J Lipid Res, 22, 763-9.
51. Chajes, V., Sattler W., Stranzl A. and Kostner G.M. (1995) Influence of n-3 fatty
acids on the growth of human breast cancer cells in vitro: relationship to
peroxides and vitamin-E. Breast Cancer Res Treat, 34, 199-212.
52. Chen, Q., Galleano M. and Cederbaum A.I. (1997) Cytotoxicity and apoptosis
produced by arachidonic acid in Hep G2 cells overexpressing human cytochrome
P4502E1. J Biol Chem, 272, 14532-41.
53. Sharma, R.A., Gescher A., Plastaras J.P., Leuratti C., Singh R., Gallacher-Horley
B., Offord E., Marnett L.J., Steward W.P. and Plummer S.M. (2001)
Cyclooxygenase-2, malondialdehyde and pyrimidopurinone adducts of
deoxyguanosine in human colon cells. Carcinogenesis, 22, 1557-60.
54. Erickson, B.A., Longo W.E., Panesar N., Mazuski J.E. and Kaminski D.L. (1999)
The effect of selective cyclooxygenase inhibitors on intestinal epithelial cell
mitogenesis. J Surg Res, 81, 101-7.
55. Kralj, M., Kapitanovic S., Kovacevic D., Lukac J., Spaventi S. and Pavelic K.
(2001) Effect of the nonsteroidal anti-inflammatory drug indomethacin on
proliferation and apoptosis of colon carcinoma cells. J Cancer Res Clin Oncol,
127, 173-9.

Effect of HFFO and HFCO diets on ACF
83
Chapter 4
Effects of high fat fish oil and high fat corn oil diets on initiation of AOM-induced colonic aberrant crypt foci in male F344 rats
Accepted for publication in Food and Chemical Toxicology, 2003
Yvonne E.M. Dommels1,2
Suzanne Heemskerk2
Hans van den Berg2
Gerrit M. Alink2
Peter J. van Bladeren2,3
Ben van Ommen4
1WUR/TNO Centre for Food Toxicology 2Toxicology Group, Wageningen University, Wageningen, The Netherlands 3Present address: Nestlé Research Center, Vers-chez-le-blanc, 1000 Lausanne 26,
Switzerland
4TNO Nutrition and Food Research, Department of Biomolecular Sciences, Zeist, The
Netherlands
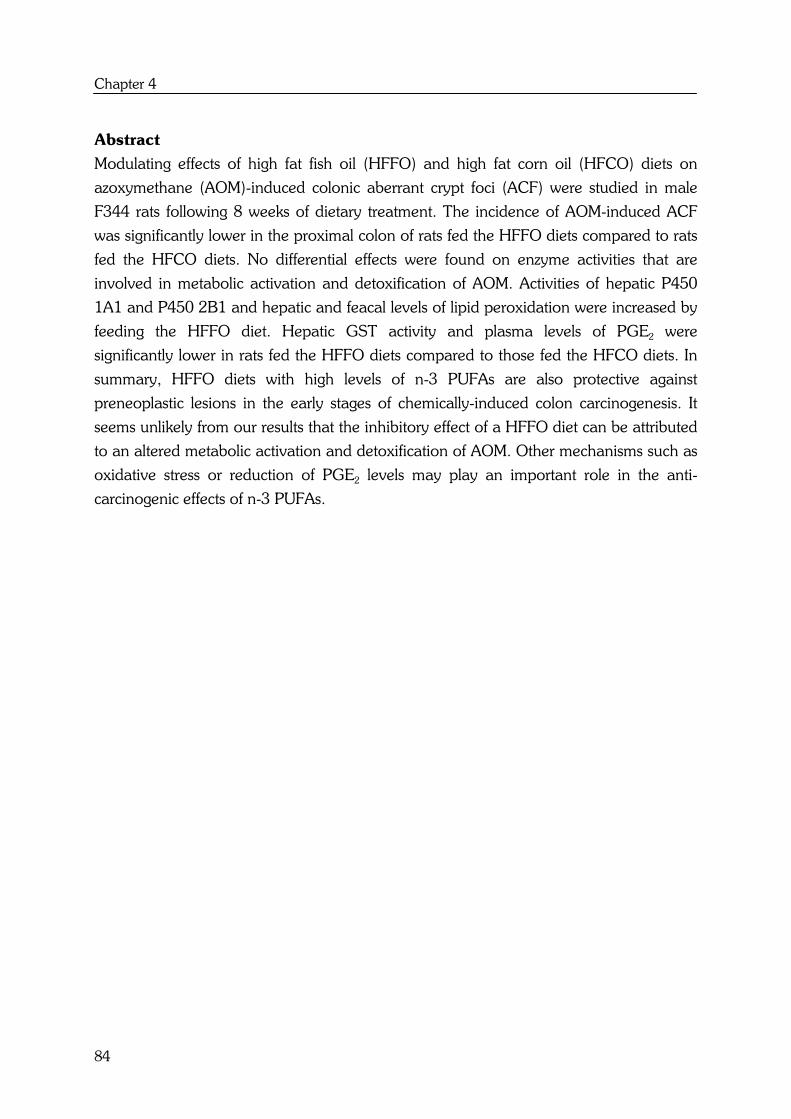
Chapter 4
84
Abstract
Modulating effects of high fat fish oil (HFFO) and high fat corn oil (HFCO) diets on
azoxymethane (AOM)-induced colonic aberrant crypt foci (ACF) were studied in male
F344 rats following 8 weeks of dietary treatment. The incidence of AOM-induced ACF
was significantly lower in the proximal colon of rats fed the HFFO diets compared to rats
fed the HFCO diets. No differential effects were found on enzyme activities that are
involved in metabolic activation and detoxification of AOM. Activities of hepatic P450
1A1 and P450 2B1 and hepatic and feacal levels of lipid peroxidation were increased by
feeding the HFFO diet. Hepatic GST activity and plasma levels of PGE2 were
significantly lower in rats fed the HFFO diets compared to those fed the HFCO diets. In
summary, HFFO diets with high levels of n-3 PUFAs are also protective against
preneoplastic lesions in the early stages of chemically-induced colon carcinogenesis. It
seems unlikely from our results that the inhibitory effect of a HFFO diet can be attributed
to an altered metabolic activation and detoxification of AOM. Other mechanisms such as
oxidative stress or reduction of PGE2 levels may play an important role in the anti-
carcinogenic effects of n-3 PUFAs.
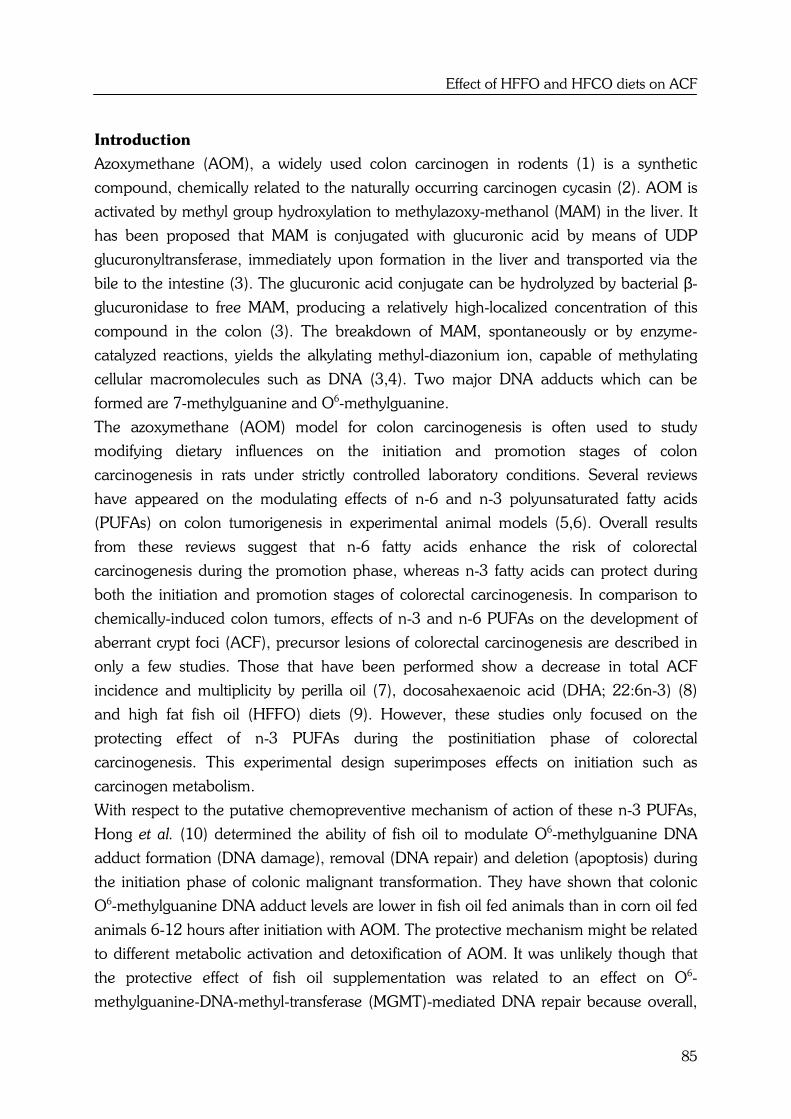
Effect of HFFO and HFCO diets on ACF
85
Introduction
Azoxymethane (AOM), a widely used colon carcinogen in rodents (1) is a synthetic
compound, chemically related to the naturally occurring carcinogen cycasin (2). AOM is
activated by methyl group hydroxylation to methylazoxy-methanol (MAM) in the liver. It
has been proposed that MAM is conjugated with glucuronic acid by means of UDP
glucuronyltransferase, immediately upon formation in the liver and transported via the
bile to the intestine (3). The glucuronic acid conjugate can be hydrolyzed by bacterial β-
glucuronidase to free MAM, producing a relatively high-localized concentration of this
compound in the colon (3). The breakdown of MAM, spontaneously or by enzyme-
catalyzed reactions, yields the alkylating methyl-diazonium ion, capable of methylating
cellular macromolecules such as DNA (3,4). Two major DNA adducts which can be
formed are 7-methylguanine and O6-methylguanine.
The azoxymethane (AOM) model for colon carcinogenesis is often used to study
modifying dietary influences on the initiation and promotion stages of colon
carcinogenesis in rats under strictly controlled laboratory conditions. Several reviews
have appeared on the modulating effects of n-6 and n-3 polyunsaturated fatty acids
(PUFAs) on colon tumorigenesis in experimental animal models (5,6). Overall results
from these reviews suggest that n-6 fatty acids enhance the risk of colorectal
carcinogenesis during the promotion phase, whereas n-3 fatty acids can protect during
both the initiation and promotion stages of colorectal carcinogenesis. In comparison to
chemically-induced colon tumors, effects of n-3 and n-6 PUFAs on the development of
aberrant crypt foci (ACF), precursor lesions of colorectal carcinogenesis are described in
only a few studies. Those that have been performed show a decrease in total ACF
incidence and multiplicity by perilla oil (7), docosahexaenoic acid (DHA; 22:6n-3) (8)
and high fat fish oil (HFFO) diets (9). However, these studies only focused on the
protecting effect of n-3 PUFAs during the postinitiation phase of colorectal
carcinogenesis. This experimental design superimposes effects on initiation such as
carcinogen metabolism.
With respect to the putative chemopreventive mechanism of action of these n-3 PUFAs,
Hong et al. (10) determined the ability of fish oil to modulate O6-methylguanine DNA
adduct formation (DNA damage), removal (DNA repair) and deletion (apoptosis) during
the initiation phase of colonic malignant transformation. They have shown that colonic
O6-methylguanine DNA adduct levels are lower in fish oil fed animals than in corn oil fed
animals 6-12 hours after initiation with AOM. The protective mechanism might be related
to different metabolic activation and detoxification of AOM. It was unlikely though that
the protective effect of fish oil supplementation was related to an effect on O6-
methylguanine-DNA-methyl-transferase (MGMT)-mediated DNA repair because overall,

Chapter 4
86
fish oil feeding had no significant effect on the induction of MGMT in the distal colonic
epithelium. Fish oil feeding also resulted in a significantly higher level of apoptosis in the
upper one-third of the crypt compared with corn oil treatment. The conclusion of this
study was that fish oil reduced O6-methylguanine DNA adduct levels in rat colon in part
by increasing apoptosis during tumor initiation. In addition, Latham et al. (11)
demonstrated that consumption of n-3 PUFAs in the form of fish oil, fed only for a 48
hour period following administration of the colon carcinogen DMH, significantly reduced
the incidence of ACF compared to rats fed a corn oil diet. Consumption of fish oil was
also associated with increased apoptotic cell death and suppression of cell proliferation.
Fish oil raised the levels of apoptosis and suppressed proliferation also in sham-injected
animals, implying that fish oil has the capacity to modulate apoptosis and proliferation
even in the absence of DMH. They assumed that effects of dietary fish oil could be due to
oxidative stress, since fish oil diets may compromise the antioxidant status of the cell via
increased lipid peroxidation, leading to loss of cell viability or selective induction of
apoptosis (11).
Rao and Reddy (12) investigated the effect of high fat diets rich in n-3 and n-6 fatty acids
during the initiation phase on several cellular events that may play a role in colon
tumorigenesis. These results demonstrate that high levels of fish oil in the diet suppress
liver, colon and small intestine mucosal ornithine decarboxylase (ODC) activity, tyrosine-
specific protein kinase (TPK) activities and plasma, liver and colon prostaglandin E2
(PGE2) levels in male F344 rats, 5 days after a second AOM injection, comparing to high
dietary levels of corn oil.
In the present study an animal experiment has also been carried out to investigate the
modulating effects of high fat fish oil (HFFO) and high fat corn oil (HFCO) diets on rat
colon carcinogenesis. Because so far little attention has been paid to the
chemopreventive effects of n-3 PUFAs, differential effects of HFFO and HFCO diets fed
during both the initiation and postinitiation stages of colon carcinogenesis, were studied
on the development of AOM-induced aberrant crypt foci (ACF), precursor lesions of
colon carcinogenesis. Differential effects of fish oil and corn oil feeding on metabolic
activation and detoxification of AOM, plasma PGE2 levels, epithelial cell damage and
levels of lipid peroxidation were also studied in this animal experiment to gain more
insight into the mechanisms by which these fatty acids modulate the early stages of colon
carcinogenesis.

Effect of HFFO and HFCO diets on ACF
87
Material and methods
Animals and diets
Twenty male F344 rats (~ 3 weeks old) were purchased from Charles River Breeding
Laboratory (Someren, The Netherlands) and acclimatized for 1 week. The rats were
housed in plastic cages, 2 rats per cage, in an animal holding room using a 12:12-hour
light-dark cycle. Temperature and humidity were controlled at 20-24 °C and 50-60%,
respectively. Animals were randomly divided into 2 dietary sub-groups of ten animals per
group and had free access to water and food. Fresh food in powder form was
replenished every day. The experimental diets, high fat fish oil (HFFO) and high fat corn
oil (HFCO), were formulated on the basis of a modified AIN-93G diet, as described in
Table 4.1. The HFCO diet contained 25% corn oil (Remia, Den Dolder, The
Netherlands) at the expense of an isocaloric amount of carbohydrates. The HFFO diet
contained 20% OmegapureTM Refined Menhaden Fish oil, which was kindly donated by
Omegaprotein (Houston, TX, USA) and 5% corn oil to prevent any essential fatty acid
deficiency, also at an isocaloric amount of carbohydrates. 1000 ppm Mixed-tocopherols
and 200 ppm tertiary butyl hydroquinone (TBHQ) were added to the OmegapureTM
Refined Menhaden Fish oil to prevent lipid peroxidation of the oil. These antioxidants
were therefore also added to the corn oil before preparation of the HFCO diet. The
amount of L-cystine, cellulose, choline bitartrate, AIN-93 mineral and vitamin mix were
adjusted with a factor 1.24 above the recommended amounts (13) to compensate for the
reduced food intake of high fat diets (14). Diets were prepared freshly at the beginning of
the experiment and after one month. Daily batches were stored in sealed plastic bags in
dark containers at -40 °C until use. The peroxide values of the freshly prepared diets and
of the diets that were stored for one month were measured to determine the amount of in
vitro fatty acid peroxidation.
Experimental procedure
Beginning at 4 weeks of age, rats were fed the experimental diets for 8 weeks. All animals
were given s.c. injections of AOM (Sigma Chemical Company, St Louis, MO, USA), once
weekly for two weeks, at a dose of 15 mg/kg body weight, after two weeks of
experimental diet. Animals were placed in an isolator during this period to prevent
possible health risks. Body weights were recorded three times a week and daily food
intake was measured during three separate periods (day 1-9; day 30-36 and day 48-56).
Rats were housed individually during the second and third period. Fresh faeces was
collected at several days during the experiment to measure feacal enzyme activities and
blood was collected by orbital puncture at day 7 and 29 of the experiment to determine
plasma PGE2 levels. At the end of the experiment (four weeks after the second AOM
Chapter 4
88
injection), blood was collected from the vena cava inferior under anesthesia, which was a
combination of isofluran, O2 and N2O. Also colon, liver and caecum were removed.
Livers and ceacal contents were quickly weighed, snap-frozen in liquid nitrogen and
stored at -80 ºC until further processing. The animal welfare committee of Wageningen
University (The Netherlands) approved the experimental protocol.
Quantification of colonic aberrant crypt foci (ACF)
Colons were rinsed in a 0.9% NaCl solution, slit open lengthwise and fixed flat between
filter paper in 4% formalin in phosphate-buffered saline (Dulbecco `A' Tablets, Oxoid,
Haarlem, The Netherlands). After storage in 70% ethanol, they were stained for 30
seconds in 0.5% methylene blue according to Bird (15). The number of aberrant crypts
per focus (multiplicity) and the total number of ACF were scored in proximal, distal and
total colon, under a light microscope at a 40x magnification.
PGE2 analysis in plasma
PGE2 levels were analyzed in the plasma of all rats after 1, 4 and 8 weeks of dietary
intervention. A PGE2 enzyme immunoassay kit (Amersham Pharmacia Biotech UK
limited, Buckinghamshire, UK) was used according to protocol 5, recommended by the
manufacturer. The results are expressed as picograms of PGE2 per ml plasma.
Measurement of feacal and ceacal enzyme activities
Fresh feacal and frozen ceacal samples were homogenized in 0.9% NaCl using an Ultra
Turrax and centrifuged at 2000 g for 15 minutes at 4 °C. Bacterial β-glucuronidase and
β-glucosidase activities were determined spectrophotometrically in the supernatant by
measuring paranitrophenol (PNP)-β-D-glucuronide and paranitrophenol-β-D-glucoside
(Sigma) hydrolysis, respectively (16). All reactions were performed at 37 °C in 96-wells
plates, containing 75 µl supernatant, 25 µl of a 0.1% substrate solution and 25 µl 50 mM
phosphate buffer (pH 6.5). After 1 hour of incubation, the reactions were stopped by
addition of 0.5% glycine NaOH buffer, 2 mM EDTA (pH 9.5) and the amount of PNP
released was measured at 405 nm (Spectramax 340, Molecular Devices, Menlo Park,
CA, USA).
Intestinal alkaline phosphatase (ALP) activity was also measured spectrophotometrically
in the supernatant by measuring hydrolysis of p-nitrophenolphosphate (17). Release of
PNP was also measured at 405 nm. L-phenylalanine (150 mM) was used as a specific
inhibitor to determine the intestinal isoenzyme activity (18). All enzyme activities were
calculated as µmol PNP released per hour per gram faeces or ceacal content.
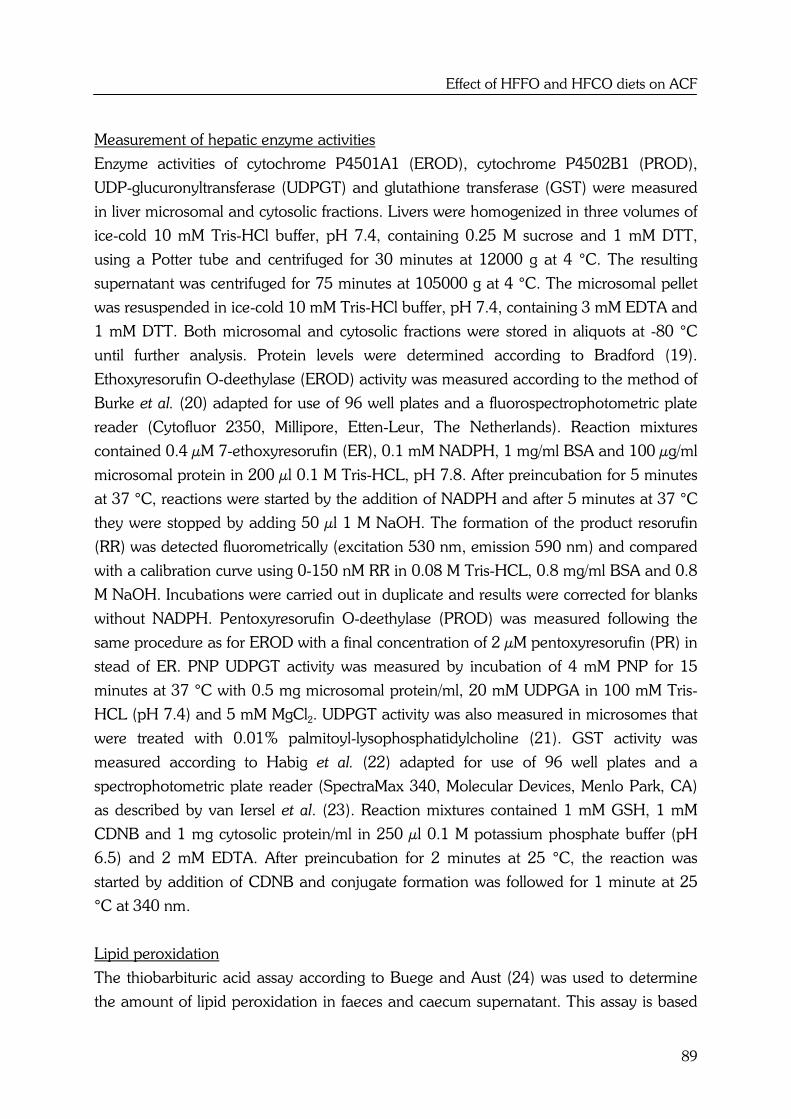
Effect of HFFO and HFCO diets on ACF
89
Measurement of hepatic enzyme activities
Enzyme activities of cytochrome P4501A1 (EROD), cytochrome P4502B1 (PROD),
UDP-glucuronyltransferase (UDPGT) and glutathione transferase (GST) were measured
in liver microsomal and cytosolic fractions. Livers were homogenized in three volumes of
ice-cold 10 mM Tris-HCl buffer, pH 7.4, containing 0.25 M sucrose and 1 mM DTT,
using a Potter tube and centrifuged for 30 minutes at 12000 g at 4 °C. The resulting
supernatant was centrifuged for 75 minutes at 105000 g at 4 °C. The microsomal pellet
was resuspended in ice-cold 10 mM Tris-HCl buffer, pH 7.4, containing 3 mM EDTA and
1 mM DTT. Both microsomal and cytosolic fractions were stored in aliquots at -80 °C
until further analysis. Protein levels were determined according to Bradford (19).
Ethoxyresorufin O-deethylase (EROD) activity was measured according to the method of
Burke et al. (20) adapted for use of 96 well plates and a fluorospectrophotometric plate
reader (Cytofluor 2350, Millipore, Etten-Leur, The Netherlands). Reaction mixtures
contained 0.4 µM 7-ethoxyresorufin (ER), 0.1 mM NADPH, 1 mg/ml BSA and 100 µg/ml
microsomal protein in 200 µl 0.1 M Tris-HCL, pH 7.8. After preincubation for 5 minutes
at 37 °C, reactions were started by the addition of NADPH and after 5 minutes at 37 °C
they were stopped by adding 50 µl 1 M NaOH. The formation of the product resorufin
(RR) was detected fluorometrically (excitation 530 nm, emission 590 nm) and compared
with a calibration curve using 0-150 nM RR in 0.08 M Tris-HCL, 0.8 mg/ml BSA and 0.8
M NaOH. Incubations were carried out in duplicate and results were corrected for blanks
without NADPH. Pentoxyresorufin O-deethylase (PROD) was measured following the
same procedure as for EROD with a final concentration of 2 µM pentoxyresorufin (PR) in
stead of ER. PNP UDPGT activity was measured by incubation of 4 mM PNP for 15
minutes at 37 °C with 0.5 mg microsomal protein/ml, 20 mM UDPGA in 100 mM Tris-
HCL (pH 7.4) and 5 mM MgCl2. UDPGT activity was also measured in microsomes that
were treated with 0.01% palmitoyl-lysophosphatidylcholine (21). GST activity was
measured according to Habig et al. (22) adapted for use of 96 well plates and a
spectrophotometric plate reader (SpectraMax 340, Molecular Devices, Menlo Park, CA)
as described by van Iersel et al. (23). Reaction mixtures contained 1 mM GSH, 1 mM
CDNB and 1 mg cytosolic protein/ml in 250 µl 0.1 M potassium phosphate buffer (pH
6.5) and 2 mM EDTA. After preincubation for 2 minutes at 25 °C, the reaction was
started by addition of CDNB and conjugate formation was followed for 1 minute at 25
°C at 340 nm.
Lipid peroxidation
The thiobarbituric acid assay according to Buege and Aust (24) was used to determine
the amount of lipid peroxidation in faeces and caecum supernatant. This assay is based

Chapter 4
90
on the fact that malondialdehyde (MDA), which is a product of lipid peroxidation, reacts
with thiobarbituric acid to give a red species absorbing at 535 nm. Lipid peroxidation in
liver microsomes was measured at double wavelengths (535 + 520 nm) to avoid
interference according to Uchiyama and Mihara (25). Absorbance was converted to µmol
MDA from a standard curve generated with 1,1,3,3-tetramethoxypropane. Lipid
peroxidation was presented as µmol MDA per gram tissue.
Statistical analysis
Statistical analyses were performed using SPSS version 9.0 for Windows. Data were
analyzed using general factorial analysis of variance after testing for normality and
homogeneity of variance. In case of homogeneity, the Bonferroni test of significance was
used for post-hoc analysis (p < 0.05). In case of non-homogeneity, data were tested on
significance with the Dunnet T3 test (p<0.05). When data were not normally distributed
a Kruskall Wallis test was used.
Table 4.1: Composition of the experimental diets
Diet1
Dietary ingredients HFCO HFFO
Casein 25.00 25.00
L-cystine 0.37 0.37
Wheat starch 37.64 37.64
Cellulose 6.18 6.18
Choline bitartrate 0.25 0.25
AIN-93 minerals 4.32 4.32
AIN-93 vitamins 1.24 1.24
Corn oil2 25.00 5.00
Fish oil3 0.00 20.00
Peroxide values (fresh - stored)4
Batch 1
Batch 2
2.2 - 3.6
2.8 - 3.8
1.8 - 3.2
2.4 - 3.8
1 Values are expressed as percent by weight
2 Corn oil contains 34-62% 18:2n-6
3 OmegapureTM Refined Menhaden fish oil contains ~20-26% n-3 fatty acids (10-17 % EPA and
7-12 % DHA)
4 Peroxide values are expressed in mEq/kg diet in freshly prepared diets - and diets stored for one
month at -40 °C

Effect of HFFO and HFCO diets on ACF
91
Results
OmegapureTM Menhaden Fish oil contains high amounts of long-chain n-3
polyunsaturated fatty acids (PUFAs), such as eicosapentaenoic acid (EPA; 20:5n-3) and
docosahexaenoic acid (DHA; 22:6n-3). Corn oil contains high amounts of long-chain n-6
PUFAs, such as linoleic acid (LA; 18:2n-6) (see Table 4.1). Because PUFAs are
extremely susceptible to auto-oxidation and peroxidation, antioxidants were added to
both of the oils to prevent in vitro lipid peroxidation (26). Peroxide values of the HFCO
and HFFO diets were < 3 mEq/kg diet (Table 4.1). A small increase up to around 4
mEq/kg diet was seen after storage of the diets for one month at -40 °C, but peroxide
values were still below 8-9 mEq/kg, which are found in other normal oils (27). However,
the amount of in vivo lipid peroxidation, as measured by feacal levels of MDA (Table
4.2), was significantly higher in the rats fed the HFFO diet for 9 days than in the rats fed
the HFCO diet for 9 days. This difference was no longer observed in the faeces as well as
the caecum, after 57 days of dietary treatment. MDA levels were also higher in the liver
microsomes of the HFFO diet group comparing to the HFCO diet group, at the end of
the experiment.
Table 4.2: Influence of HFCO and HFFO diets on lipid peroxidation levels in faeces,
caecum and liver after 9 or 57 days of dietary treatment1
Diet
MDA levels2 HFCO HFFO
Faeces, day 9 0.026 + 0.014a 0.054 + 0.031a
Faeces, day 57 0.066 + 0.051 0.062 + 0.020
Ceacal contents 0.026 + 0.007 0.054 + 0.029
Liver microsomes 0.014 + 0.002b 0.025 + 0.002b
1 Values are means + SD per diet group (n=10 per group)
2 MDA levels are expressed as µmol MDA per gram tissue
a,b Means between diet groups sharing the same letter superscripts are significantly different at
p < 0.05
Food intake and body weights of the animals were not affected by the type of dietary
lipid. As seen in Table 4.3, average body weights of the rats in the HFCO and HFFO diet
groups were not significantly different at the end of the experiment. Also the amount of
ceacal contents was not different between the HFCO and HFFO diet groups. However,
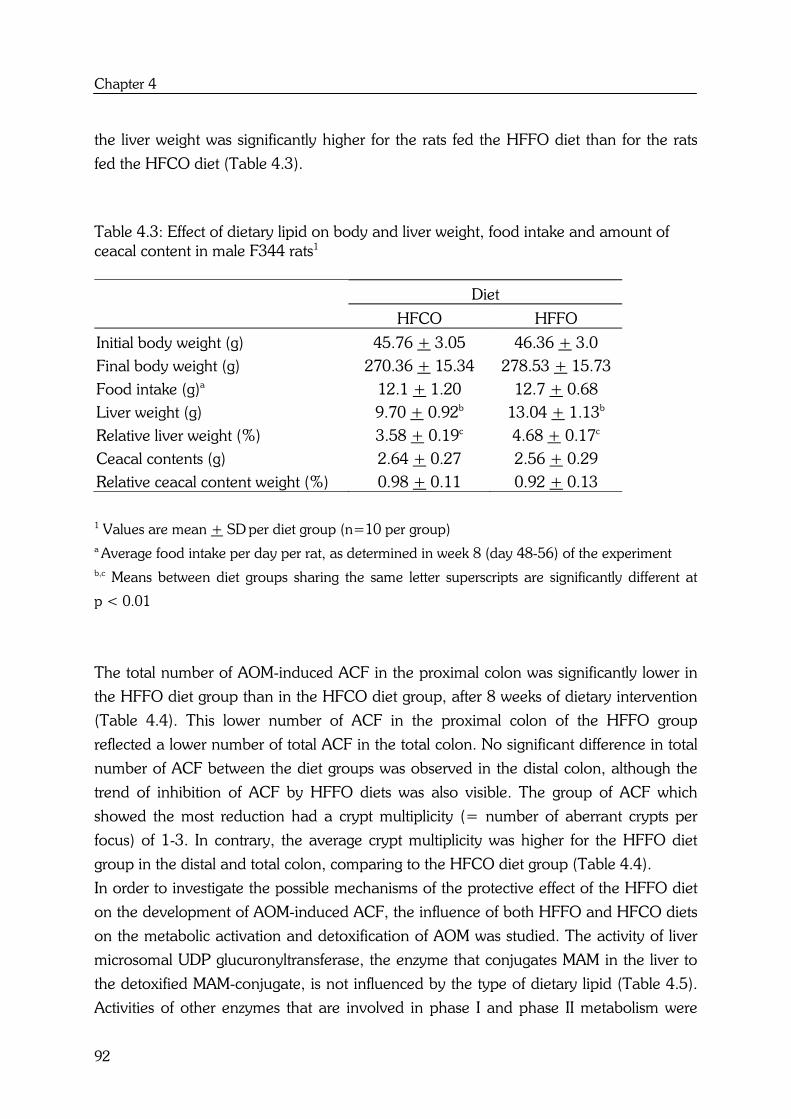
Chapter 4
92
the liver weight was significantly higher for the rats fed the HFFO diet than for the rats
fed the HFCO diet (Table 4.3).
Table 4.3: Effect of dietary lipid on body and liver weight, food intake and amount of
ceacal content in male F344 rats1
Diet
HFCO HFFO
Initial body weight (g) 45.76 + 3.05 46.36 + 3.0
Final body weight (g) 270.36 + 15.34 278.53 + 15.73
Food intake (g)a 12.1 + 1.20 12.7 + 0.68
Liver weight (g) 9.70 + 0.92b 13.04 + 1.13b
Relative liver weight (%) 3.58 + 0.19c 4.68 + 0.17c
Ceacal contents (g) 2.64 + 0.27 2.56 + 0.29
Relative ceacal content weight (%) 0.98 + 0.11 0.92 + 0.13
1 Values are mean + SD per diet group (n=10 per group)
a Average food intake per day per rat, as determined in week 8 (day 48-56) of the experiment
b,c Means between diet groups sharing the same letter superscripts are significantly different at
p < 0.01
The total number of AOM-induced ACF in the proximal colon was significantly lower in
the HFFO diet group than in the HFCO diet group, after 8 weeks of dietary intervention
(Table 4.4). This lower number of ACF in the proximal colon of the HFFO group
reflected a lower number of total ACF in the total colon. No significant difference in total
number of ACF between the diet groups was observed in the distal colon, although the
trend of inhibition of ACF by HFFO diets was also visible. The group of ACF which
showed the most reduction had a crypt multiplicity (= number of aberrant crypts per
focus) of 1-3. In contrary, the average crypt multiplicity was higher for the HFFO diet
group in the distal and total colon, comparing to the HFCO diet group (Table 4.4).
In order to investigate the possible mechanisms of the protective effect of the HFFO diet
on the development of AOM-induced ACF, the influence of both HFFO and HFCO diets
on the metabolic activation and detoxification of AOM was studied. The activity of liver
microsomal UDP glucuronyltransferase, the enzyme that conjugates MAM in the liver to
the detoxified MAM-conjugate, is not influenced by the type of dietary lipid (Table 4.5).
Activities of other enzymes that are involved in phase I and phase II metabolism were

Effect of HFFO and HFCO diets on ACF
93
also measured in livers of HFFO and HFCO treated rats. From these results it became
clear that cytosolic GST activity was decreased in livers of the HFFO treated rats
comparing to the HFCO treated rats. On the other hand, activities of P450 1A1 and
P450 2B1 are elevated in liver microsomes of the HFFO treated rats comparing to the
HFCO treated rats (Table 4.5).
Table 4.4: ACF growth characteristics in male F344 rats after 8 weeks of intervention
with HFCO and HFFO dietsa-c
ACFd
Diet Total ACF
total
CM 1 2 3 4 5 6 7 8
HFCO 108.0 + 28.21 2.22 26.9 43.6 25.6 8.8 2.7 0.1 0.2 0.1
HFFO 70.3 + 29.11 2.52 15.4 24.5 16.3 8.1 5.4 0.6 0.0 0.0
ACFd
Diet Total ACF
proximal
CM 1 2 3 4 5 6 7 8
HFCO 52.3 + 12.33 2.2 13.8 22.3 10.9 4.3 2.2 0.0 2.0 1.0
HFFO 23.9 + 11.73 2.3 7.1 8.5 5.2 1.8 1.6 1.0 0.0 0.0
ACFd
Diet Total ACF
distal
CM 1 2 3 4 5 6 7 8
HFCO 55.7 + 24.9 2.34 13.1 21.3 14.7 5.4 2.3 1.0 0.0 0.0
HFFO 46.5 + 20.7 2.74 8.3 16.0 11.1 6.3 4.3 1.3 0.0 0.0
a Values are means + SD per diet group (n=10 per group)
b Abbreviations are as follows: ACF; aberrant crypt foci, CM; average crypt multiplicity/group
c Animals are terminated after 8 weeks of dietary intervention, 4 weeks after the second AOM
injection
d ACF are categorized by number of aberrant crypts (1-8) per focus
1-4 Statistical analyses were only performed for total number of ACF and the average crypt
multiplicity/group (CM). Means between diet groups sharing the same number superscripts are
significantly different at p < 0.01

Chapter 4
94
Table 4.5: Influence of HFCO and HFFO diets on activity of microsomal UDP
glucuronyltransferase (UDPGT), cytochrome P450 1A1, cytochrome P450 2B1 and
cytosolic glutathione transferase (GST)1-2
Diet
HFCO HFFO
UDPGT (untreated)3 25.49 + 10.28 31.75 + 3.49
UDPGT (treated)3 59.39 + 4.36 57.64 + 8.56
GST 685.34 + 73.11a 533. 37 + 38.56a
P450 1A1 7.88 + 1.06b 10.62 + 1.04b
P450 2B1 1.86 + 0.25c 2.78 + 0.23c
1 Values are means + SD per diet group (n=10 per group)
2 UDPGT and GST activities are expressed as nmol/min per mg protein and activities of P450
1A1 and 2B1 are expressed as pmol/min per mg protein
3 UDPGT activity was measured in untreated microsomes and microsomes treated with 0.01%
palmitoyl-lysophosphatidylcholine
a,b,c Means between diet groups sharing the same letter superscripts are significantly different at
p < 0.01
The activity of bacterial β-glucuronidase, the enzyme that deconjugates the MAM-
conjugate of AOM into free MAM in the colon, was measured in fresh faeces before (day
0, 6, 9) and after (day 31, 42, 43, 55 and 57) AOM injection. At all days, no differences
were noted in the feacal β-glucuronidase activity among the animals fed the different
diets (Table 4.6). Also no differences were observed in β-glucosidase activity, another
intestinal bacterial enzyme that hydrolyzes cycasin, a pre-carcinogen present in plants, to
methylazoxymethanol (MAM)-β-D-glucoside (28). Feacal β-glucuronidase activity was
only significantly higher after 55 days of dietary intervention in the HFFO diet group
compared to the HFCO diet group. Ceacal β-glucuronidase and β-glucosidase activity,
measured at day 57, were not significantly different among the diet groups (data not
shown). ALP is an enzyme that is located on the apical membrane of colonic epithelial
cells. After disruption of the epithelial cell membrane, ALP will be excreted into the
lumen and can be measured in the faeces as a marker of colonic epithelial cell lysis (29).
The type of dietary lipid did not influence colonic epithelial cell damage, as measured by
ALP activity. No differences were observed in feacal (Table 4.6) as well as ceacal (data
not shown) ALP activity between the HFFO and HFCO diet groups at several days
during the experiment.

Effect of HFFO and HFCO diets on ACF
95
Table 4.6: Influence of HFCO and HFFO diets on fresh feacal activities of
β-glucuronidase, β-glucosidase and ALP in Male F344 rats1-2
Diet
Days on
the diet
HFCO HFFO
β-glucuronidase 0
6
9
31
42
43
55
57
11.21 + 26.10
3.23 + 1.18
20.80 + 42.25
7.10 + 9.49
4.78 + 2.63
15.59 + 15.46
9.30 + 2.79a
27.54 + 17.76
5.24 + 7.24
7.51 + 1.85
16.76 + 9.77
6.87 + 2.82
6.84 + 5.75
21.28 + 9.61
15.61 + 6.34a
27.88 + 16.15
β-glucosidase 0
6
9
31
42
43
55
57
9.51 + 22.35
2.06 + 1.05
11.18 + 21.81
3.84 + 4.03
2.89 + 1.59
7.90 + 8.36
4.60 + 1.44
13.69 + 9.37
6.97 + 11.32
3.04 + 1.33
5.16 + 4.86
2.04 + 0.88
1.98 + 1.00
5.77 + 2.79
3.66 + 0.79
5.73 + 2.79
ALP 0
6
9
31
42
43
55
57
278.36 + 217.36
45.69 + 57.37
95.59 + 65.90
34.17 + 17.38
25.59 + 12.03
102.13 + 114.70
30.92 + 9.77
120.81 + 119.08
209.55 + 248.04
76.76 + 65.28
241.04 + 212.95
45.55 + 28.59
45.61 + 21.91
100.17 + 80.34
44.82 + 15.67
144.53 + 112.69
1 Values are means + SD per diet group (n=10 per group)
2 Activities are expressed as µmol PNP released per hour per gram faeces
a Means between diet groups sharing the same letter superscripts are significantly different at
p < 0.01

Chapter 4
96
The effects of HFCO and HFFO diets on PGE2 levels in plasma are shown in Figure 4.1.
High dietary levels of fish oil significantly suppressed PGE2 levels in plasma compared to
high dietary levels of corn oil, after 29 and 57 days of dietary treatment. This trend was
already visible after 7 days of dietary treatment, though not statistically significant.
Figure 4.1: PGE2 levels in plasma of male F344 rats after 1, 4 and 8 weeks of HFCO
(black bars) and HFFO (white bars) diets1
1 Values are means + SD (n=10 per group). Means between diet groups are significantly different
at p < 0.05 at day 29 and 57
Discussion
Experimental data indicate that high dietary fish oil can effectively reduce colon tumor
incidence in comparison with high dietary corn oil when given during the initiation and
postinitiation stages of colorectal carcinogenesis (30). In addition, we have shown in this
study that high fat fish oil (HFFO) diets with a high amount of n-3 PUFAs also reduce the
incidence of AOM-induced colonic ACF in male F344 rats in comparison with high fat
corn oil (HFCO) diets with a high amount of n-6 PUFAs, when fed during both the
initiation and postinitiation stages of colorectal carcinogenesis. This protective effect was
particularly evident on the total number of ACF in the proximal colon.
The group of ACF which showed the most reduction had a crypt multiplicity (= number
of aberrant crypts per focus) of 1-3. These results indicate that high dietary levels of n-3
PUFAs are also protective against preneoplastic lesions in the early stages of chemically-
0
1000
2000
3000
4000
5000
6000
7000
7 29 57
Dietary Treatment (days)
PG
E2 p
lasm
a (
pg/m
l)
Effect of HFFO and HFCO diets on ACF
97
induced colon carcinogenesis. Our results are consistent with the report of Onogi et al.
(7) in which perilla oil, rich in the vegetable n-3 PUFA α-linolenic acid, also suppressed
the development of ACF, even when it was present in small amounts (3%) in the diet.
In the current study, the rats received daily high amounts of fish oil (20%) + 5% of corn
oil for 8 weeks, which provided about 240 mg EPA and 170 mg DHA per day. It must be
recognized that these large intakes do not reflect a human diet, although they could be
consumed by the use of fish oil supplements. In addition, Reddy and Sugie (31) revealed
that feeding high fat diets containing only 5.9% of Menhaden fish oil in combination with
17.6% corn oil significantly inhibited the incidence of colon adenocarcinomas compared
to 23.5% corn oil diets. Thus also lower amounts of n-3 PUFAs in high fat diets are
effective in inhibition of colon carcinogenesis, though these diets were only fed during the
postinitiation phase of colon carcinogenesis.
A possible mechanism to explain the anticancer role of n-3 PUFAs during the initiation
phase of colon carcinogenesis could be related to the ability of n-3 PUFAs to positively
influence the metabolic activation and detoxification of AOM. Therefore we investigated
the effect of a HFFO and a HFCO diet on the activity of rat liver, feacal and ceacal
enzymes that are involved in AOM-induced colon carcinogenesis, i.e. microsomal UDP
glucuronyltransferase and bacterial β-glucuronidase and β-glucosidase. However, no
significant differences in these enzyme activities were observed between the HFFO and
HFCO diet groups. Also Bartram et al. (32) found that feacal activities of β-glucuronidase
and β-glucosidase were not affected by fish oil or corn oil consumption, after four weeks
of supplementation in healthy volunteers. On the basis of these and our results, it seems
unlikely that the inhibitory effect of a HFFO diet can be attributed to an altered metabolic
activation and detoxification of AOM in comparison to what other research groups
suggested (10,30,33).
The different fatty acid diets applied in this study did affect other hepatic enzymes that
are involved in phase I and phase II metabolism of carcinogens and xenobiotics, such as
certain P450 and GST. Activities of P450 1A1 and P450 2B1 are elevated in liver
microsomes of the HFFO treated rats comparing to the HFCO treated rats. These results
are consistent with those of Chen and co-workers (34,35). Rats fed fish oil also had
significantly higher liver weights and relative liver weights compared with those of rats fed
corn oil diets. This also suggests that fish oil can exert a stimulatory effect on hepatic
microsomal enzymes (36). On the other hand, cytosolic GST activity was decreased in
livers of HFFO treated rats in comparison to HFCO treated rats, which is in contrast with
results of Lii et al. (34), Yang et al. (21) and Ko et al. (36). They found that hepatic levels
of antioxidant enzymes such as GSH reductase and GST were significantly greater in rats

Chapter 4
98
fed fish oil than in rats fed corn oil, which implies an increased antioxidant capacity to
defend against oxidative stress.
In the present study, we measured the amount of in vivo lipid peroxidation in faeces,
caecum and livers of HFFO and HFCO fed rats as a marker of oxidative stress. MDA
levels were significantly higher in liver (day 57) and faeces (day 9) of rats fed a HFFO
diet than in rats fed a HFCO diet. This increase in lipid peroxidation was not cytotoxic for
colonic epithelial cells, since the activity of the apical membrane-marker of colonic
epithelial cell lysis ALP was not increased in the faeces and caecum of HFFO fed rats.
The higher lipid peroxidation potential of fish oil diets probably results from the higher
number of double bonds in fish oil compared to corn oil (36). Higher in vivo MDA levels
were not related to in vitro peroxidation because the peroxide values of the HFFO diet
were comparable to those of the HFCO diet.
As stated in the introduction, Latham et al. (11) proposed that fish oil diets compromise
the antioxidant status of the cell via increased lipid peroxidation leading to loss of cell
viability, selective induction of apoptosis and reduction of carcinogen-induced colonic
ACF formation. Also Hong et al. (10) concluded that dietary n-3 fatty acids found in fish
oil confer protection against experimental induced colon carcinogenesis in part by
reducing the level of DNA adducts and by enhancing the deletion of cells through
activation of targeted apoptosis. The question remains whether the anticarcinogenic
effects of n-3 PUFAs found in this study could be ascribed to the higher oxidative stress
caused by the HFFO diets. In this respect it is interesting to note that other in vivo studies
(37,38) have shown that the addition of vitamin E to the diet diminishes the anticancer
effects of n-3 PUFAs in mice bearing mammary tumor or lung carcinoma, suggesting that
in vivo oxidation of n-3 PUFAs underlies their anticancer action. Also in our own in vitro
studies, it was found that the colon cancer cell growth inhibitory effects of PUFAs with
methylene-interrupted double bonds such as in fish oil are due to peroxidation products
that are generated during spontaneous and enzymatic lipid peroxidation (39).
Takahashi et al. (8) and also other investigators (7,12,40) proposed that the mechanism
responsible for the inhibitory effects of n-3 PUFAs on colorectal tumors may partly be
related to inhibition of PGE2 synthesis from arachidonic acid (AA; 20:4n-6) in the colonic
mucosa. We measured plasma levels of PGE2 in stead of colonic PGE2, because also
paracrine effects of basolaterally released prostaglandins could play a role in the
pathogenesis of colorectal neoplasia (41). Our results demonstrate that besides an
increase in in vivo lipid peroxidation, the rats fed the HFFO diets also had significantly
lower plasma levels of PGE2 than the rats fed the HFCO diets.
It is suggested that PGE2 can promote rat colon tumors and that cyclooxygenase-
inhibitors that prevent prostaglandin production such as indomethacin (IM) can block the

Effect of HFFO and HFCO diets on ACF
99
development of colon carcinomas (42). However, in the study of Onogi et al. (7) the
PGE2 concentration in the colonic mucosa of olive oil fed rats did not correlate with the
development of ACF in that diet group. Also Abou-El-Ela et al. (43) found that feeding a
20% corn oil diet containing 0.004% indomethacin, an inhibitor of cyclooxygenase,
significantly reduced prostaglandin synthesis but did not inhibit mammary tumorigenesis
in female Sprague-Dawley rats. These results are also in line with our own in vitro studies
in which reductions in PGE2 synthesis by EPA (20:5n-3) comparing to AA (20:4n-6) did
not lead to differential effects on cell proliferation between these fatty acids in human
colon adenocarcinoma Caco-2 cells (39). Further studies are therefore needed to
elucidate the real causal relation between inhibition of PGE2 levels and inhibitory effects
of n-3 PUFAs in fish oil on the development of ACF.
In summary, our data reveal that HFFO diets with high levels of n-3 PUFAs are also
protective against preneoplastic lesions in the early stages of chemically-induced colon
carcinogenesis compared to HFCO diets. It seems unlikely from our results that the
inhibitory effect of a HFFO diet can be attributed to an altered metabolic activation and
detoxification of AOM. The above mentioned results led us to consider that other
mechanisms such as oxidative stress or reduction of PGE2 levels may play an important
role in the anticarcinogenic effects of n-3 PUFAs.
Acknowledgments
The authors thank Bert Weijers for taking care of the animals.
Chapter 4
100
References
1. Sohn, O.S., Ishizaki H., Yang C.S. and Fiala E.S. (1991) Metabolism of
azoxymethane, methylazoxymethanol and N- nitrosodimethylamine by
cytochrome P450IIE1. Carcinogenesis, 12, 127-31.
2. Fiala, E.S. (1977) Investigations into the metabolism and mode of action of the
colon carcinogens 1,2-dimethylhydrazine and azoxymethane. Cancer, 40, 2436-
45.
3. Fiala, E. (1975) Investigations into the metabolism and mode of action of the
colon carcinogen 1, 2-dimethylhydrazine. Cancer, 36, 2407-12.
4. Takada, H., Hirooka T., Hiramatsu Y. and Yamamoto M. (1982) Effect of beta-
glucuronidase inhibitor on azoxymethane-induced colonic carcinogenesis in rats.
Cancer Res, 42, 331-34.
5. Reddy, B.S. (1992) Dietary fat and colon cancer: animal model studies. Lipids,
27, 807-13.
6. Dommels, Y.E.M., Alink G.M., van Bladeren P.J. and van Ommen B. (2002)
Dietary n-6 and n-3 polyunsaturated fatty acids and colorectal carcinogenesis:
results from cultured colon cells, animal models and human studies.
Environmental Toxicology and Pharmacology, 12, 233-244.
7. Onogi, N., Okuno M., Komaki C., Moriwaki H., Kawamori T., Tanaka T., Mori H.
and Muto Y. (1996) Suppressing effect of perilla oil on azoxymethane-induced
foci of colonic aberrant crypts in rats. Carcinogenesis, 17, 1291-6.
8. Takahashi, M., Fukutake M., Isoi T., Fukuda K., Sato H., Yazawa K., Sugimura T.
and Wakabayashi K. (1997) Suppression of azoxymethane-induced rat colon
carcinoma development by a fish oil component, docosahexaenoic acid (DHA).
Carcinogenesis, 18, 1337-42.
9. Rao, C.V., Hirose Y., Indranie C. and Reddy B.S. (2001) Modulation of
experimental colon tumorigenesis by types and amounts of dietary fatty acids.
Cancer Res, 61, 1927-33.
10. Hong, M.Y., Lupton J.R., Morris J.S., Wang N., Carroll R.J., Davidson L.A., Elder
R.H. and Chapkin R.S. (2000) Dietary fish oil reduces O6-methylguanine DNA
adduct levels in rat colon in part by increasing apoptosis during tumor initiation.
Cancer Epidemiol Biomarkers Prev, 9, 819-26.
11. Latham, P., Lund E.K. and Johnson I.T. (1999) Dietary n-3 PUFA increases the
apoptotic response to 1,2- dimethylhydrazine, reduces mitosis and suppresses the
induction of carcinogenesis in the rat colon. Carcinogenesis, 20, 645-50.
12. Rao, C.V. and Reddy B.S. (1993) Modulating effect of amount and types of
dietary fat on ornithine decarboxylase, tyrosine protein kinase and prostaglandins
Effect of HFFO and HFCO diets on ACF
101
production during colon carcinogenesis in male F344 rats. Carcinogenesis, 14,
1327-33.
13. Reeves, P.G., Nielsen F.H. and Fahey G.C., Jr. (1993) AIN-93 purified diets for
laboratory rodents: final report of the American Institute of Nutrition ad hoc
writing committee on the reformulation of the AIN-76A rodent diet. J Nutr, 123,
1939-51.
14. Appel, M.J., Wijnands M.V. and Woutersen R.A. (1997) Effects of dietary
galactooligosaccharide on azaserine-induced acinar pancreatic carcinogenesis in
male Wistar rats. Nutr Cancer, 29, 35-41.
15. Bird, R.P. (1987) Observation and quantification of aberrant crypts in the murine
colon treated with a colon carcinogen: preliminary findings. Cancer Lett, 37,
147-51.
16. Fishman, W.H. (1974) Methods of enzymatic analysis. In Bergmeyer, H.U. (ed.),
Methods of enzymatic analysis. Vol. 2. Academic Press, New York, London.
17. Lapre, J.A., De Vries H.T., Koeman J.H. and Van Der Meer R. (1993) The
antiproliferative effect of dietary calcium on colonic epithelium is mediated by
luminal surfactants and dependent on the type of dietary fat. Cancer Research,
53, 784-789.
18. Fishman, W.H., Green S. and Inglis N.I. (1962) Organ-specific behavior exhibited
by rat intestine and liver alkaline phosphatase. Biochim Biophys Acta, 62, 363-
75.
19. Bradford, M.M. (1976) A rapid and sensitive method for the quantitation of
microgram quantities of protein utilizing the principle of protein-dye binding. Anal
Biochem, 72, 248-254.
20. Burke, M.D., Prough R.A. and Mayer R.T. (1977) Characteristics of a microsomal
cytochrome P-448-mediated reaction. Drug Metab Dispos, 5, 1-8.
21. Yang, E.K., Radominska A., Winder B.S. and Dannenberg A.J. (1993) Dietary
lipids coinduce xenobiotic metabolizing enzymes in rat liver. Biochim Biophys
Acta, 1168, 52-8.
22. Habig, W.H., Pabst M.J. and Jakoby W.B. (1974) Glutathion S-transferase. The
first enzymatic step in mercapturic acid formation. J Biol Chem, 249, 7130-7139.
23. Iersel, M.L., Ploemen J.P., Struik I., van Amersfoort C., Keyzer A.E., Schefferlie
J.G. and van Bladeren P.J. (1996) Inhibition of glutathione S-transferase activity
in human melanoma cells by alpha,beta-unsaturated carbonyl derivatives. Effects
of acrolein, cinnamaldehyde, citral, crotonaldehyde, curcumin, ethacrynic acid,
and trans-2-hexenal. Chem Biol Interact, 102, 117-32.
Chapter 4
102
24. Buege, J.A. and Aust S.D. (1978) Microsomal lipid peroxidation. Methods
Enzymol, 52, 302-10.
25. Mihara, M. and Uchiyama M. (1978) Determination of malonaldehyde precursor
in tissues by thiobarbituric acid test. Anal Biochem, 86, 271-8.
26. Gonzalez, M.J., Gray J.I., Schemmel R.A., Dugan L., Jr. and Welsch C.W. (1992)
Lipid peroxidation products are elevated in fish oil diets even in the presence of
added antioxidants. J Nutr, 122, 2190-5.
27. Behniwal, P.K., Soni G.L., Vadhera S. and Singh R. (1993) In vitro absorption of
nutrients from small intestine of rats fed peroxidized oil. Indian J Exp Biol, 31,
658-9.
28. Hill, M.J. (1983) Bacterial metabolism and human cancer. In Hill, M.J. (ed.),
Microbial metabolism in the digestive tract. CRC Press, Boca Raton, pp. 221-236.
29. Thomas, D.W. and Henton D.H. (1982) The use of fecal alkaline phosphatase as
an indicator of intestinal damage. Digestion, 31, 82-88.
30. Reddy, B.S., Burill C. and Rigotty J. (1991) Effect of diets high in omega-3 and
omega-6 fatty acids on initiation and postinitiation stages of colon carcinogenesis.
Cancer Res, 51, 487-91.
31. Reddy, B.S. and Sugie S. (1988) Effect of different levels of omega-3 and omega-
6 fatty acids on azoxymethane-induced colon carcinogenesis in F344 rats. Cancer
Res, 48, 6642-7.
32. Bartram, H.P., Gostner A., Kelber E., Dusel G., Weimer A., Scheppach W. and
Kasper H. (1996) Effects of fish oil on fecal bacterial enzymes and steroid
excretion in healthy volunteers: implications for colon cancer prevention. Nutr
Cancer, 25, 71-8.
33. Coleman, L.J., Landstrom E.K., Royle P.J., Bird A.R. and McIntosh G.H. (2002)
A diet containing alpha-cellulose and fish oil reduces aberrant crypt foci formation
and modulates other possible markers for colon cancer risk in azoxymethane-
treated rats. J Nutr, 132, 2312-8.
34. Lii, C.K., Ou C.C., Liu K.L., Liu J.Y., Lin W.L. and Chen H.W. (2000)
Suppression of altered hepatic foci development by a high fish oil diet compared
with a high corn oil diet in rats. Nutr Cancer, 38, 50-9.
35. Chen, H.W., Lii C.K., Wu M.H., Ou C.C. and Sheen L.Y. (1997) Amount and
type of dietary lipid modulate rat hepatic cytochrome P-450 activity. Nutr Cancer,
29, 174-80.
36. Ko, Y.J., Lii C.K., Ou C.C., Liu J.Y., Lin W.L. and Chen H.W. (2000)
Comparison of the effect of fish oil and corn oil on chemical-induced hepatic
enzyme-altered foci in rats. J Agric Food Chem, 48, 4144-50.
Effect of HFFO and HFCO diets on ACF
103
37. Yam, D., Peled A. and Shinitzky M. (2001) Suppression of tumor growth and
metastasis by dietary fish oil combined with vitamins E and C and cisplatin.
Cancer Chemother Pharmacol, 47, 34-40.
38. Cognault, S., Jourdan M.L., Germain E., Pitavy R., Morel E., Durand G.,
Bougnoux P. and Lhuillery C. (2000) Effect of an alpha-linolenic acid-rich diet on
rat mammary tumor growth depends on the dietary oxidative status. Nutr Cancer,
36, 33-41.
39. Dommels, Y.E.M., Haring M.M.G., Keestra N.G.M., Alink G.M., van Bladeren P.J.
and van Ommen B. (2003) The role of cyclooxygenase in n-6 and n-3
polyunsaturated fatty acid mediated effects on cell proliferation, PGE2 synthesis
and cytotoxicity in human colorectal carcinoma cell lines. Carcinogenesis, 24,
385-392.
40. Singh, J., Hamid R. and Reddy B.S. (1997) Dietary fat and colon cancer:
modulation of cyclooxygenase-2 by types and amount of dietary fat during the
postinitiation stage of colon carcinogenesis. Cancer Res, 57, 3465-70.
41. Coffey, R.J., Hawkey C.J., Damstrup L., Graves-Deal R., Daniel V.C., Dempsey
P.J., Chinery R., Kirkland S.C., DuBois R.N., Jetton T.L. and Morrow J.D. (1997)
Epidermal growth factor receptor activation induces nuclear targeting of
cyclooxygenase-2, basolateral release of prostaglandins, and mitogenesis in
polarizing colon cancer cells. Proc Natl Acad Sci USA, 94, 657-62.
42. Inaba, A., Uchiyama T. and Oka M. (1999) Role of prostaglandin E2 in rat colon
carcinoma. Hepatogastroenterology, 46, 2347-51.
43. Abou-el-Ela, S.H., Prasse K.W., Farrell R.L., Carroll R.W., Wade A.E. and Bunce
O.R. (1989) Effects of D,L-2-difluoromethylornithine and indomethacin on
mammary tumor promotion in rats fed high n-3 and/or n-6 fat diets. Cancer Res,
49, 1434-40.

Effect of HFFO and HFCO diets on gene expression
105
Chapter 5
High fat fish oil diets modulate expression of genes involved in oxidative stress, cell growth, acute
phase response and lipid metabolism in normal colonic epithelium of male F344 rats
Submitted
Yvonne E.M. Dommels1,2
Petra J. van den Hil2,3
Jozef P.H. Linssen3
Gerrit M. Alink2
Peter J. van Bladeren2,4
Ben van Ommen5
1WUR/TNO Centre for Food Toxicology 2Toxicology Group, Wageningen University, Wageningen, The Netherlands 3Laboratory of Food Chemistry, Wageningen University, Wageningen, The Netherlands 4Present address: Nestlé Research Center, Vers-chez-le-blanc, 1000 Lausanne 26,
Switzerland
5TNO Nutrition and Food Research, Department of Biomolecular Sciences, Zeist, The
Netherlands
Chapter 5
106
Abstract
Experimental data indicate that dietary fish oil with a high amount of n-3
polyunsaturated fatty acids (PUFAs) such as eicosapentaenoic acid (EPA; 20:5n-3) can
protect against the development of colorectal carcinogenesis. Although the complete
mechanism by which n-3 PUFAs prevent or inhibit colorectal carcinogenesis is currently
not known, it seems likely that the protective effects of fish oil may at least be partly due
to n-3 PUFA-mediated changes in oxidative stress, PGE2 metabolism, apoptosis and cell
proliferation. To identify genes and molecular pathways responsible for the chemo-
preventive effects of n-3 PUFAs, gene expression profiles of normal rat colonic
epithelium of high fat fish oil (HFFO) and high fat corn oil (HFCO) fed rats were
compared using cDNA microarrays. Data analyses reveal that several key genes involved
in oxidative stress response (ferritin; metallothionein; peroxiredoxin 2), cell proliferation
(histone 2b), cytoskeleton (beta-actin; alpha adducin), immune response (lectin; RT1
class Ib gene; interferon, alpha-inducible protein 27-like), acute phase response (albumin;
hemopexin; transthyretin; transferrin; serine proteinase inhibitor; alpha(1)-inhibitor 3),
energy metabolism (cytochrome C oxidase; ATPase inhibitor), lipid metabolism
(apolipoprotein C3 and H) and development of the central nervous system (RNB6) were
differentially expressed. Supportive physiological data reveal that HFFO diets besides an
increase in plasma levels of n-3 PUFAs, a decrease in PGE2 and an increase in oxidative
stress, possibly also could protect against colorectal carcinogenesis through lower total
levels of plasma fatty acids.
Effect of HFFO and HFCO diets on gene expression
107
Introduction
High fat fish oil (HFFO) diets, with a high amount of n-3 polyunsaturated fatty acids
(PUFAs), such as eicosapentaenoic acid (EPA; 20:5n-3) have been shown to inhibit the
initiation of azoxymethane (AOM)-induced colorectal tumors as well as the initiation of
AOM-induced colonic aberrant crypt foci in rats (1,2,3,4) compared to high fat corn oil
(HFCO) diets, with a high amount of n-6 PUFAs such as linoleic acid (LA; 18:2n-6).
Calviello et al. (5) revealed that the growth inhibitory effect of n-3 PUFAs is not specific
for tumor cells, but is a general effect in normal tissues with a high degree of cell
turnover. They observed that dietary administration of EPA inhibited cell proliferation
and enhanced cell differentiation and apoptosis in normal rat colonic mucosa. Bartram et
al. (6) studied the effect of fish oil and corn oil supplementation on rectal cell
proliferation, ornithine decarboxylase (ODC) activity and PGE2 release in 12 healthy
volunteers. They showed that colonic cell proliferation can be reduced by oral fish oil
supplementation even in young healthy volunteers who already have a quiescent
proliferative activity. Concomitantly, mucosal ODC activity and PGE2 release from rectal
biopsy specimens were significantly lower during the fish oil as compared to the corn oil
supplementation period (6). The results of the studies mentioned above support the idea
that dietary fish oil may prevent the initiation of colorectal carcinogenesis and suggests a
possible use of these fatty acids as dietary chemopreventive agents. Although the exact
mechanism by which n-3 PUFAs prevent or inhibit colorectal carcinogenesis is currently
not known, it seems likely that the protective effects of fish oil may at least be partly due
to n-3 PUFA-mediated changes in oxidative stress (7,8), PGE2 metabolism (3), apoptosis
(7,9,10) and cell proliferation (11,12).
Our previous in vitro studies suggest that the number of double bonds in the carbon
atom chain of fatty acids, such as EPA in fish oil, is more important for the anti-
proliferative and cell death-inducing effects in colon tumor cells than the place of the
double bond. The number of double bonds affects the susceptibility for lipid peroxidation
whereas the place of the double bond is important for the formation of different types of
prostaglandins (for example PGE2 from n-6 PUFAs and PGE3 from n-3 PUFAs). Lipid
peroxidation products, but not PGE2 levels seemed to be responsible for the tumor cell
growth inhibitory effects of highly polyunsaturated fatty acids such as EPA in our in vitro
studies (13). Also our previous in vivo data (4) suggest that the anticarcinogenic effects of
n-3 PUFAs in HFFO diets, could be ascribed to a higher level of lipid peroxidation, which
is a marker of oxidative stress.
To study the increased oxidative stress caused by HFFO diets in more detail, another
animal experiment was performed in which different (anti)-oxidant parameters in HFFO
and HFCO fed rats were compared. Gene expression profiles of normal rat colonic

Chapter 5
108
epithelium of HFFO and HFCO fed rats were compared using cDNA microarrays to
identify genes and molecular pathways which are responsible for the chemopreventive
effects of HFFO diets. This comprehensive approach can provide more insight into the
multiple minor changes in genomic responses by n-3 PUFAs governing the modulation of
oxidative stress but also prostaglandin metabolism, apoptosis and cell proliferation.
Furthermore these transcriptomics experiments may also provide new mechanistic
insights into the molecular effects of n-3 PUFAs on normal rat colonic epithelium. Other
biochemical assays were also performed in this study in order to provide additional
physiological data that support the identified changes in gene expression between HFFO
and HFCO fed rats.
Material and methods
All reagents were obtained from Sigma (St Louis, MO, USA), unless otherwise indicated.
Animals and diets
Twenty male F344 rats (~ 3 weeks old) were purchased from Charles River Breeding
Laboratory (Someren, The Netherlands) and acclimatized for 1 week. The rats were
housed in plastic cages, 2 rats per cage, in an animal holding room using a 12:12-hour
light-dark cycle. Temperature and humidity were controlled at 20-24 °C and 50-60%,
respectively. Animals were randomly divided into 2 dietary sub-groups of ten animals per
group and had free access to water and food. Fresh food in powder form was
replenished every day. The experimental diets, high fat fish oil (HFFO) and high fat corn
oil (HFCO), were formulated on the basis of a modified AIN-93G diet, as described in
Table 5.1. The HFCO diet contained 25% corn oil (Remia, Den Dolder, The
Netherlands) at the expense of an isocaloric amount of carbohydrates. The HFFO diet
contained 20% OmegapureTM Refined Menhaden Fish oil, which was kindly donated by
Omegaprotein (Houston, TX, USA) and 5% corn oil to prevent any essential fatty acid
deficiency, also at the expense of an isocaloric amount of carbohydrates. 1000 ppm
Mixed-tocopherols and 200 ppm tertiary butyl hydroquinone (TBHQ) were added to the
OmegapureTM Refined Menhaden Fish oil to prevent lipid peroxidation of the oil. These
antioxidants were therefore also added to the corn oil before preparation of the HFCO
diet. The amount of L-cystine, cellulose, choline bitartrate, AIN-93 mineral and vitamin
mix were adjusted with a factor 1.24 above the recommended amounts (14) to
compensate for the reduced food intake of high fat diets (15). Diets were prepared freshly
at the beginning of the experiment and after one month. Daily batches were stored in
sealed plastic bags in dark containers at -40 °C until use. The peroxide values of the
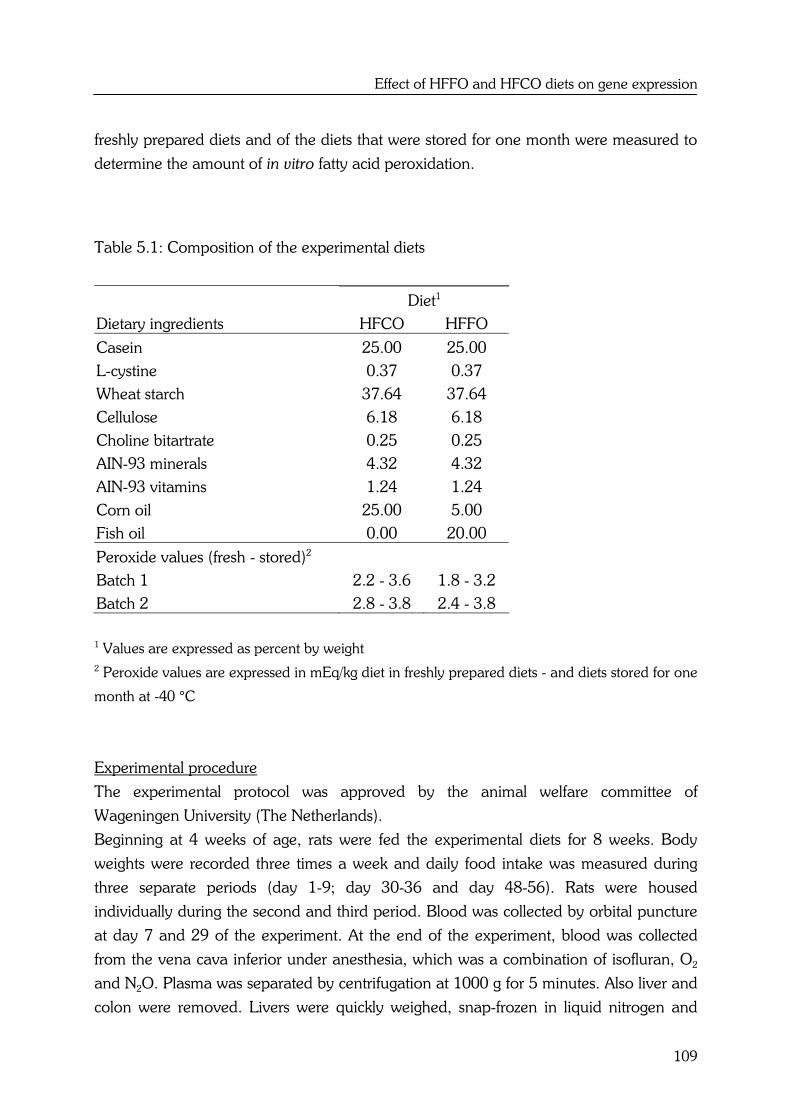
Effect of HFFO and HFCO diets on gene expression
109
freshly prepared diets and of the diets that were stored for one month were measured to
determine the amount of in vitro fatty acid peroxidation.
Table 5.1: Composition of the experimental diets
Diet1
Dietary ingredients HFCO HFFO
Casein 25.00 25.00
L-cystine 0.37 0.37
Wheat starch 37.64 37.64
Cellulose 6.18 6.18
Choline bitartrate 0.25 0.25
AIN-93 minerals 4.32 4.32
AIN-93 vitamins 1.24 1.24
Corn oil 25.00 5.00
Fish oil 0.00 20.00
Peroxide values (fresh - stored)2
Batch 1
Batch 2
2.2 - 3.6
2.8 - 3.8
1.8 - 3.2
2.4 - 3.8
1 Values are expressed as percent by weight
2 Peroxide values are expressed in mEq/kg diet in freshly prepared diets - and diets stored for one
month at -40 °C
Experimental procedure
The experimental protocol was approved by the animal welfare committee of
Wageningen University (The Netherlands).
Beginning at 4 weeks of age, rats were fed the experimental diets for 8 weeks. Body
weights were recorded three times a week and daily food intake was measured during
three separate periods (day 1-9; day 30-36 and day 48-56). Rats were housed
individually during the second and third period. Blood was collected by orbital puncture
at day 7 and 29 of the experiment. At the end of the experiment, blood was collected
from the vena cava inferior under anesthesia, which was a combination of isofluran, O2
and N2O. Plasma was separated by centrifugation at 1000 g for 5 minutes. Also liver and
colon were removed. Livers were quickly weighed, snap-frozen in liquid nitrogen and
Chapter 5
110
stored at -80 ºC until further processing. The colon was laid flat on filter paper and was
opened longitudinally. The colonic epithelium was gently scraped using a spatula after
removal of the faeces. The scrapings were also snap-frozen in liquid nitrogen and stored
at -80 ºC until further processing.
RNA isolation
Total RNA was isolated from colonic epithelial scrapings of 5 rats per group using Trizol
(Life Technologies S.A., Merelbeke, Belgium) according to the manufacturer's protocol.
Total RNA was further purified using the RNeasy Mini Kit (Qiagen, provided by
Westburg, Leusden, The Netherlands) and DNA was digested using the Rnase-Free
Dnase set (Qiagen). RNA was checked for purity and stability by gel electrophoresis and
the concentration was calculated from the extinction at 260 nm as measured
spectrophotometrically.
Reference RNA
To allow comparison of all individual expression patterns of the fish oil and corn oil fed
rats, a batch of common reference RNA was prepared. Dissected organs of several
untreated male rats were flash-frozen in liquid nitrogen and stored at -80 ºC. All tissues
were pooled together and homogenized in liquid nitrogen. RNA was isolated as
described above.
Transcriptomics experimental design
Two animals per group were initially used to assess the difference in colonic epithelial
gene expression between fish oil and corn oil fed rats. Each individual rat colonic
epithelial RNA sample was co-hybridized with the common reference RNA. Dye-swap
replications were used, in which the dye assignments were reversed between the treated
(fish / corn oil) and the reference sample in the second hybridization. At a later time-
point, a second dataset was generated where 6 other rat colonic epithelial RNA samples
(3 fish oil; 3 corn oil) were co-hybridized with the common reference RNA with dye-
swaps in order to increase the biological replicates and to confirm previous results. This
second dataset thus consisted of 12 arrays (3 x 2 x 2).
cDNA microarray preparation
About 3000 different sequence-verified rat cDNA clones from the I.M.A.G.E. consortium
were purchased (Research Genetics, USA) and cDNAs were amplified by PCR using
forward (5'-CTGCAAGGCGATTAAGTTGGGTAAC-3') and reverse (5'-GTGAGCGGA-
TAACAATTTCACA-CAGGAAACAGC-3') primers containing a 5'-C6-aminolinker
Effect of HFFO and HFCO diets on gene expression
111
(Isogen Bioscience, Maarsen, The Netherlands) to facilitate crosslinking to the aldehyde
coated glass microscope slides. PCR products were purified by ethanol precipitation and
checked for purity and fragment size by gel electrophoresis on a 1% agarose gel. Purified
PCR products were dissolved in 3x SSC and clones were arrayed in a controlled
atmosphere on CSS-100 silylated aldehyde glass slides (Telechem, Sunnyvale, CA,
USA). In total, about 3800 cDNAs, including 3000 different rat genes and various control
genes were deposited on the slides. After drying, slides were blocked with borohydride
and stored in a dark and dust-free cabinet until further use. The second dataset was
generated with a new different batch of slides, although the same PCR products as well
as the same type of glass slides were used as for the first dataset.
cDNA synthesis, labeling and hybridization
The CyeScribe First-strand cDNA Labeling Kit of Amersham Biosiences (Freiburg,
Germany) was used for the generation of Cy3 and Cy5 labeled first-strand cDNA probes
utilizing a modified reverse transcriptase CyScriptTM.
Briefly, 25 µg of total RNA was reverse transcribed using oligo(dT) primers. After
annealing of the primers at 70 ºC for 5 minutes, Cy3- or Cy5-labeled dUTP was built
into the cDNA during reverse transcription. After incubating the reaction for 1.5 hours at
42 ºC, RNA was hydrolyzed by adding NaOH. After neutralization, unincorporated
nucleotides were removed with spin column chromatography using Autoseq G-50 spin
columns (Amersham Biosciences, Freiburg, Germany).
Before hybridization, Cy3- and Cy5-labeled cDNAs were mixed and 4 µl yeast tRNA (25
µg/µl) (Life Technologies S.A., Merelbeke, Belgium), 4 µl poly(dA-dT) (5 µg/µl)
(Amersham Biosiences, Freiburg, Germany) and 3 µl Cot-1 DNA (Life Technologies S.A,
Merelbeke, Belgium) were added to avoid non-specific binding. The hybridization mix
was concentrated, dissolved in 55 µl Easyhyb hybridization buffer (Roche Diagnostics,
Mannheim, Germany), denatured for 1.5 minutes at 100 ºC and incubated for 30
minutes at 42 ºC.
Before adding the hybridization mixture to the slides, slides were prehybridized in
prehybridization buffer (1% BSA, 5x SSC and 0.1% SDS, filtered) for 45 minutes at 42
ºC, washed in milliQ water, washed with isopropanol and dried.
After pipetting the hybridization mix onto the slides, the slides were covered with a plastic
coverslip and hybridized overnight in a slide incubation chamber (Corning, Life Sciences,
Schiphol, The Netherlands) submerged in a 42 ºC waterbath. After hybridization, slides
were washed by submersion and agitation in 1x SSC with 0.2% SDS and in 0.5x SSC
wash-solution. Then, slides were washed in a fresh 0.2x SSC wash-solution and shaken
Chapter 5
112
on a rotation plateau for 10 minutes at 300 rpm. This step was repeated once and slides
were dried afterwards by centrifugation at 700 rpm for 5 minutes.
Scanning
Slides were scanned with a ScanArray 4000 (Perkin Elmer Life Sciences, USA) and
Imagene 4.0 (Biodiscovery Inc., Los Angeles, USA) was used to extract data from the
images.
Data analysis
Data were transferred from Imagene into SAS E-guide for analysis. Spots with a
signal/background ratio less than 2 or that were flagged in Imagene were not included in
the data analysis. For each spot, local background intensity was subtracted from mean
signal intensity and the expression ratio was calculated by dividing background corrected
signal intensities of the treated samples (fish oil or corn oil) by the background corrected
signal intensities of the common reference sample. Expression ratios were then log
transformed (base 2) and normalized per slide using an intensity-dependent method
(Lowess) (16).
The group average log ratio in gene expression 2log (fish oil / corn oil) is calculated in
Microsoft Excel 97. As a consequence of the introduction of the reference sample,
comparisons between fish and corn oil fed rats are indirect (the expression levels of corn
oil and fish oil samples are measured separately on different slides). Therefore, the log
ratio 2log (fish oil / corn oil) is calculated by the difference 2log average (fish oil /
reference) - 2log average (corn oil / reference). Group log ratios were calculated for both
the first and the second dataset, only if the expression ratios (fish; corn oil / reference)
were present in 70% of the total arrays used per group. Also group average of fold
changes in gene expression was calculated for both the first and the second dataset.
Principal Component Analysis (PCA), a well-established unsupervised statistical method
for multivariate interpretation of complex data was used to visualize the highest
explained variance in the datasets. This analysis revealed variation, probably technical
variation, between the first and second dataset. Therefore, they were treated as two
independent datasets.
Principal Component-Discriminant Analysis (PCDA), a supervised multivariate statistical
analysis was used to discriminate the genes that contributed most (upper 5%) to the
differences observed between the fish oil and corn oil treated rats. Statistical significance
of the differences in gene expression between the colonic epithelial samples of fish oil
and corn oil fed rats were also analyzed with the univariate two-tailed two-sample
unequal variance based Student's t-test and with SAM (Statistical Analysis of Microarrays)

Effect of HFFO and HFCO diets on gene expression
113
(17). Differences in individual gene expression levels were considered significant in the
Student's t-test if p-value < 0.05 in both the first and the second dataset. SAM uses
repeated permutations of the data to determine if the expressions of any genes are
significantly related to the response. A q-value is generated which is the lowest False
Discovery Rate at which the gene is called significant. Genes that are significant in the
first as well as the second dataset are listed in the results session.
Hepatic lipid peroxidation
The thiobarbituric acid assay according to Uchiyama and Mihara (18) was used to
determine the amount of lipid peroxidation in liver microsomes. This assay is based on
the fact that malondialdehyde (MDA), which is a product of lipid peroxidation, reacts
with thiobarbituric acid to give a red species absorbing at 535 nm. Lipid peroxidation in
liver microsomes was measured at double wavelengths (535 + 520 nm) to avoid
interference. The difference in absorbance was converted to µmol MDA from a standard
curve generated with 1,1,3,3-tetramethoxypropane. Lipid peroxidation was presented as
µmol MDA per gram tissue.
Antioxidant capacity
The trolox equivalent antioxidant capacity (TEAC) assay was used to analyze the in vitro
antioxidant capacity of the plasma samples of both diet groups. The assay used was
originally described by Miller et al. (19) and was adapted according to Van den Berg et
al. (20). Briefly, an ABTS.- solution was prepared by mixing 2.5 mM ABAP (2,2'-azobis-
(2-amidinopropane)HCL) from Polysciences (Warrington, PA, USA) with 20 mM ABTS2-
(2,2'-azinobis-(3-ethylbenzthiazoline-6-sulfonate) stock solution in 100 mM phosphate
buffer (pH 7.4), containing 150 mM NaCl. The solution was heated for 12 minutes at 60
ºC, protected from light and stored at room temperature. For measuring antioxidant
capacity, 40 µl plasma (1:10 dilution) was mixed with 1960 µl of the radical solution. The
absorbance was monitored at 734 nm for 10 seconds ('fast' TEAC) and for 6 minutes
('slow' TEAC). The decrease in absorption at 6 minutes after addition of the plasma
samples was used for calculating the antioxidant capacity, expressed as (+/-)-6-hydroxy-
2,5,7,8-tetramethyl-chroman-2-carboxylic acid (TROLOX) (Aldrich, Milwaukee, WI,
USA) equivalents.
Hepatic antioxidant enzyme activities
Enzyme activities of catalase (CAT), glutathione peroxidase (GSH-Px) and superoxide
dismutase (SOD) were measured in liver cytosolic fractions. Livers were homogenized in
three volumes of ice-cold 10 mM Tris-HCl buffer, pH 7.4, containing 0.25 M sucrose and
Chapter 5
114
1 mM DTT, using a Potter tube and centrifuged for 30 minutes at 12000 g at 4 °C. The
resulting supernatant was centrifuged for 75 minutes at 105000 g at 4 °C. The
microsomal pellet was resuspended in two volumes ice-cold 10 mM Tris-HCl buffer, pH
7.4, containing 3 mM EDTA and 1 mM DTT. Both microsomal and cytosolic fractions
were stored in aliquots at -80 °C until further analysis. Protein levels were determined
according to Bradford (21).
CAT activity was measured according to Aebi (22). The decomposition of H2O2 was
followed directly by the decrease in absorbance at 240 nm in a quartz cuvette. Reaction
mixtures contained 1 ml of 0.1 M H2O2 (Merck, Hohenbrunn, Germany) and 2 ml of liver
cytosol (dilution 1:1000). The blank contained 50 mM phosphate buffer instead of
substrate. Catalase activity is expressed as µmol H2O2 decomposed / min per mg protein.
GSH-Px activity was assayed with a coupled enzyme system in which GSSG is reduced
by glutathione reductase in the presence of an adequate supply of NADPH (23). The
reaction mixture contained 500 µl 0.1 M phosphate buffer (pH 7.0), 100 µl enzyme
sample (1:10 dilution), 100 µl glutathione reductase (0.24 U) and 100 µl of 10 mM GSH
(Acros Organics, New Jersey, USA). This mixture was pre-incubated for 10 minutes at 37
°C. Thereafter, 100 µl NADPH (Roche Diagnostics GmbH, Mannheim, Germany)
solution was added and the H2O2-independent consumption of NADPH was monitored.
The overall reaction was started by adding 100 µl of prewarmed (37 °C) H2O2 and the
decrease in absorbance was monitored at 340 nm. The non-enzymatic reaction rate was
measured by replacing the enzyme sample by buffer. Glutathione peroxidase activity is
expressed as µmol NADPH oxidized / min per mg protein.
SOD activity was measured using the RANSOD Superoxide Dismutase Kit of Randox
(catalog number SD 125). This method employs xanthine and xanthine oxidase (XOD)
to generate superoxide radicals, which react with 2-(4-iodophenyl)-3-(4-nitrophenol)-5-
phenyltetrazolium chloride (I.N.T) to form a red formazan dye. The superoxide
dismutase activity in the liver cytosol samples (1:500 diluted with RANSOD Sample
Diluent, Randox, catalog number SD 124) is then measured by the degree of inhibition
of this reaction as compared to SOD standards. Analyses were done in duplicate at the
Hitachi 911 analysator at 505 nm. Results are expressed as units / mg protein.
Hepatic levels of GSH and GSSG
GSH and GSSG levels were determined in 5% sulfosalicylic acid supernatant solutions of
liver homogenates according to Anderson (24). GSH is oxidized by 5,5'-dithiobis(2-
nitrobenzoic acid) (DTNB) to give GSSG and TNB. The rate of TNB formation is
measured at 405 nm. The amount of GSH is determined from a standard curve. The
same DTNB-GSSG reductase-recycling assay was used to determine hepatic GSSG

Effect of HFFO and HFCO diets on gene expression
115
levels after derivatisation of GSH with 2-vinylpyridine. Results are expressed as µmol /
gram liver.
Determination of vitamin E in plasma
Total lipids in the blood plasma after 8 weeks of dietary intervention were extracted by
the method of Bligh and Dyer (25) and dissolved in ethanol. Vitamin E was measured
fluorometrically in ethanol (excitation and emission wavelengths, 295 nm and 340 nm
respectively) (26). Vitamin E levels were expressed as mmol / l plasma via a standard
curve generated with alpha-tocopherol.
Plasma levels of fatty acids
Total lipids in the blood plasma after 8 weeks of dietary intervention were extracted by
the method of Bligh and Dyer (25) and phospholipids were isolated according to Kaluzny
et al. (27). Total extracted phospholipids were methylated according to Morrison and
Smith (28). The methyl esters of the fatty acids were analyzed on a Carlo Erbal
instruments HRGC 5300 gas chromatograph (Interscience, Breda, The Netherlands)
using cold-on-column-injection and flame ionization detection. The temperature program
starts at 80 °C, followed by a temperature increase of 20 °C/min until 200 °C and 5 °C/min until 240 °C with a final hold for 10 minutes. Samples were analyzed on an
OMEGAWAXTM 320 fused silica capillary column, 30 m x 0.32 mm; 0.25 µm film
thickness (Supelco, Bellefonte, USA). Individual fatty acids were identified by comparison
with two standard fatty acid mixtures, PUFA nr. 2 Animal source (Sigma 47015U) and
PUFA nr. 3 from Menhaden oil (Sigma, 47085U). Identification was verified and
confirmed by GC-MS (Finnigan MAT 95). For fatty acid quantification of plasma
phospholipids, a known amount of the phospholipid 1,2-Dinonadecanoyl-sn-Glycero-3-
Phosphocholine (Avanti Polar Lipids, Alabaster, USA) was added to each plasma sample
as an internal standard. Fatty acid levels in plasma phospholipids are expressed as mg /
ml plasma. The fatty acid composition of the OmegapureTM Refined Menhaden Fish Oil
and the corn oil was checked by the same method as described above. Fatty acid levels
in both of the oils are expressed as % of total fatty acids detected.
PGE2 levels in plasma
PGE2 levels were analyzed in the plasma of all rats after 1, 4 and 8 weeks of dietary
intervention. A PGE2 enzyme immunoassay kit (Amersham Pharmacia Biotech UK
limited, Buckinghamshire, UK) was used according to protocol 5, recommended by the
manufacturer. The results are expressed as picograms of PGE2 per ml plasma.

Chapter 5
116
Statistical analysis
Statistical analyses for the physiological data were performed using SPSS version 10.1
for Windows. Data were analyzed using one-way ANOVA after testing for normality and
homogeneity of variance. When data were not normally distributed the non-parametric
Mann-Whitney U test was used.
Results
Body + liver weight and food intake
The type of dietary lipid did not affect body weights of the rats. As seen in Table 5.2,
average body weights of the HFCO and HFFO diet groups were not significantly different
at the end of the experiment. Also the food intake was not affected by the type of dietary
lipid. Liver weight as well as the liver-to-body weight ratio was significantly higher for the
rats fed the HFFO diet than for the rats fed the HFCO diet, at the end of the experiment.
Table 5.2: Effect of dietary lipid on body and liver weight and food intake in male F344 rats1
Diet
HFCO HFFO
Initial body weight (g) 45.39 + 2.74 46.01 + 3.15
Final body weight (g) 280.17 + 12.83 286.61 + 17.71
Liver weight (g) 10.10 + 0.70a 13.17 + 1.00a
Relative liver weight (%) 3.61 + 0.17b 4.60 + 0.22b
Food intake (g)2 10.19 + 3.13 10.60 + 3.77
1 Values are means + SD per diet group (n=10 per group)
2 Food intake is defined as the average food intake per day per rat, measured during three
separate periods of the experiment (day 1-9, day 30-36 and day 48-56)
a,b Means between diet groups sharing the same letter superscripts are significantly different at
p < 0.01
Transcription profiling results
Several statistical methods were applied to identify differentially expressed genes between
colonic epithelial samples of fish oil and corn oil fed rats, in order to identify genes and
molecular pathways responsible for the anti-colon carcinogenic effects of HFFO diets.

Effect of HFFO and HFCO diets on gene expression
117
Genes that were differentially expressed in the first dataset and that were confirmed as
differentially expressed in the second dataset are reported in Table 5.3.
Table 5.3 summarizes the results of the PCDA analysis, with the different diet groups
used as discriminant. These results indicate that 21 genes belong to the upper 5% of the
genes that contributed most to the differences in group means in both sets of slides.
Biochemical functions of the differential expressed genes are diverse and involve
oxidative stress response (ferritin; metallothionein), cell adhesion/cytoskeleton (actin,
beta; alpha adducin), immune response (lectin; RT1 class Ib gene), acute phase response
(albumin; hemopexin; transthyretin; transferrin; serine proteinase inhibitor; alpha(1)-
inhibitor 3), energy metabolism (cytochrome C oxidase; ATPase inhibitor) and lipid
metabolism (apolipoprotein C3 and H).
Significantly differentially expressed genes, as determined by the Student's t-test (see
Table 5.4) also include genes that are involved in oxidative stress response (ferritin light
chain 1; peroxiredoxin 2) and immune response (interferon, alpha-inducible protein 27-
like). Furthermore, histone 2b, a gene that is involved in cell proliferation is significantly
decreased and RNB6, a gene that is involved in the development of the central nervous
system is significantly increased in the colonic epithelium of HFFO fed rats compared to
HFCO fed rats. SAM also indicated interferon, alpha-inducible protein 27-like as well as
ferritin light chain 1 as significantly differentially expressed genes.
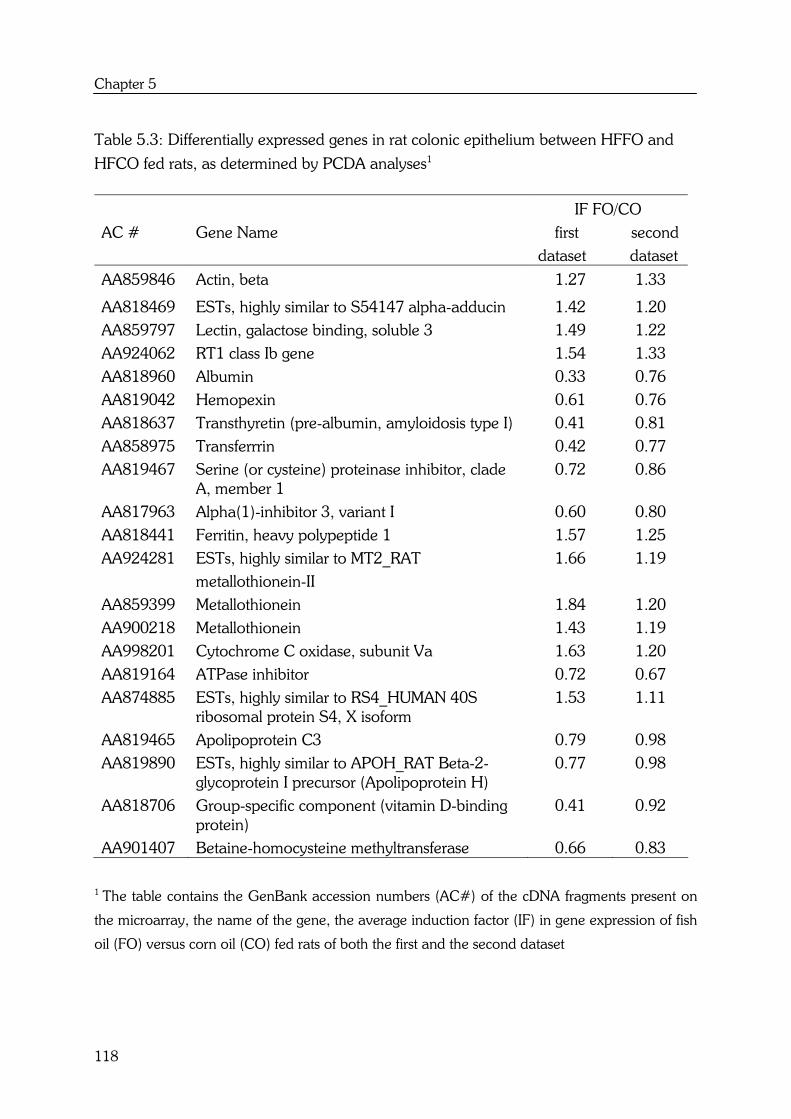
Chapter 5
118
Table 5.3: Differentially expressed genes in rat colonic epithelium between HFFO and
HFCO fed rats, as determined by PCDA analyses1
AC #
Gene Name
IF FO/CO
first second
dataset dataset
AA859846 Actin, beta 1.27 1.33
AA818469 ESTs, highly similar to S54147 alpha-adducin 1.42 1.20
AA859797 Lectin, galactose binding, soluble 3 1.49 1.22
AA924062 RT1 class Ib gene 1.54 1.33
AA818960 Albumin 0.33 0.76
AA819042 Hemopexin 0.61 0.76
AA818637 Transthyretin (pre-albumin, amyloidosis type I) 0.41 0.81
AA858975 Transferrrin 0.42 0.77
AA819467 Serine (or cysteine) proteinase inhibitor, clade A, member 1
0.72 0.86
AA817963 Alpha(1)-inhibitor 3, variant I 0.60 0.80
AA818441 Ferritin, heavy polypeptide 1 1.57 1.25
AA924281 ESTs, highly similar to MT2_RAT
metallothionein-II
1.66 1.19
AA859399 Metallothionein 1.84 1.20
AA900218 Metallothionein 1.43 1.19
AA998201 Cytochrome C oxidase, subunit Va 1.63 1.20
AA819164 ATPase inhibitor 0.72 0.67
AA874885 ESTs, highly similar to RS4_HUMAN 40S ribosomal protein S4, X isoform
1.53 1.11
AA819465 Apolipoprotein C3 0.79 0.98
AA819890 ESTs, highly similar to APOH_RAT Beta-2-glycoprotein I precursor (Apolipoprotein H)
0.77 0.98
AA818706 Group-specific component (vitamin D-binding protein)
0.41 0.92
AA901407 Betaine-homocysteine methyltransferase 0.66 0.83
1 The table contains the GenBank accession numbers (AC#) of the cDNA fragments present on
the microarray, the name of the gene, the average induction factor (IF) in gene expression of fish
oil (FO) versus corn oil (CO) fed rats of both the first and the second dataset

Effect of HFFO and HFCO diets on gene expression
119
Table 5.4: Differentially expressed genes in rat colonic epithelium between HFFO and HFCO fed rats, as determined by the Student's t-test1
AC#
Gene Name
Average
FO/CO
first dataset
p-
IF value
Average
FO/CO
second dataset
p-
IF value
AA955192 Interferon, alpha-inducible protein 27-like
1.33 0.026 1.32 0.001
AA819034 ESTs, weakly similar to interferon, alpha-inducible protein 27-like
2.09 0.003 1.42 0.001
AA817693 Ferritin light chain 1 1.52 0.027 1.39 0.008
AA819472 Ferritin light chain 1 1.58 0.037 1.24 0.015
AA858972
AA964055
Peroxiredoxin 2
Histone 2b
1.34
0.82
0.034
0.003
1.30
0.84
0.042
0.046
AA997968 RNB6 1.31 0.032 1.21 0.044
1 The table contains the GenBank accession numbers (AC#) of the cDNA fragments present on
the microarray, the name of the gene, the average induction factor (IF) in gene expression of fish
oil (FO) versus corn oil (CO) fed rats of both the first and the second dataset, as well as the p-
value of the Student's t-test
Plasma fatty acid + PGE2 levels
OmegapureTM Menhaden Fish oil contains high amounts of long-chain n-3 PUFAs, such
as eicosapentaenoic acid (EPA; 20:5n-3) and docosahexaenoic acid (DHA; 22:6n-3).
Corn oil contains high amounts of long-chain n-6 PUFAs, such as linoleic acid (LA;
18:2n-6) (Table 5.5). These differences in fatty acid composition of the oils reflected the
differences in fatty acid composition of the plasma phospholipids after 8 weeks of dietary
treatment. Table 5.6 shows that fish oil feeding increased the levels of EPA and DHA and
decreased the levels of linoleic acid and arachidonic acid (AA; 20:4n-6) compared to
corn oil feeding, resulting in a lower total n-6 / n-3 ratio. Overall, the total levels of
saturated fatty acids (SFA), monounsaturated fatty acids (MUFA), polyunsaturated fatty
acids (PUFA) as well as the total level of fatty acids in plasma phospholipids were
significantly lower at 8 weeks in the HFFO diet group compared to the HFCO diet group.
Addition of fish oil to the diet also altered the plasma levels of prostaglandins. As shown
in Figure 5.1, high dietary levels of fish oil suppressed PGE2 levels in plasma compared
to high dietary levels of corn oil after 1, 4 and 8 weeks of dietary treatment.
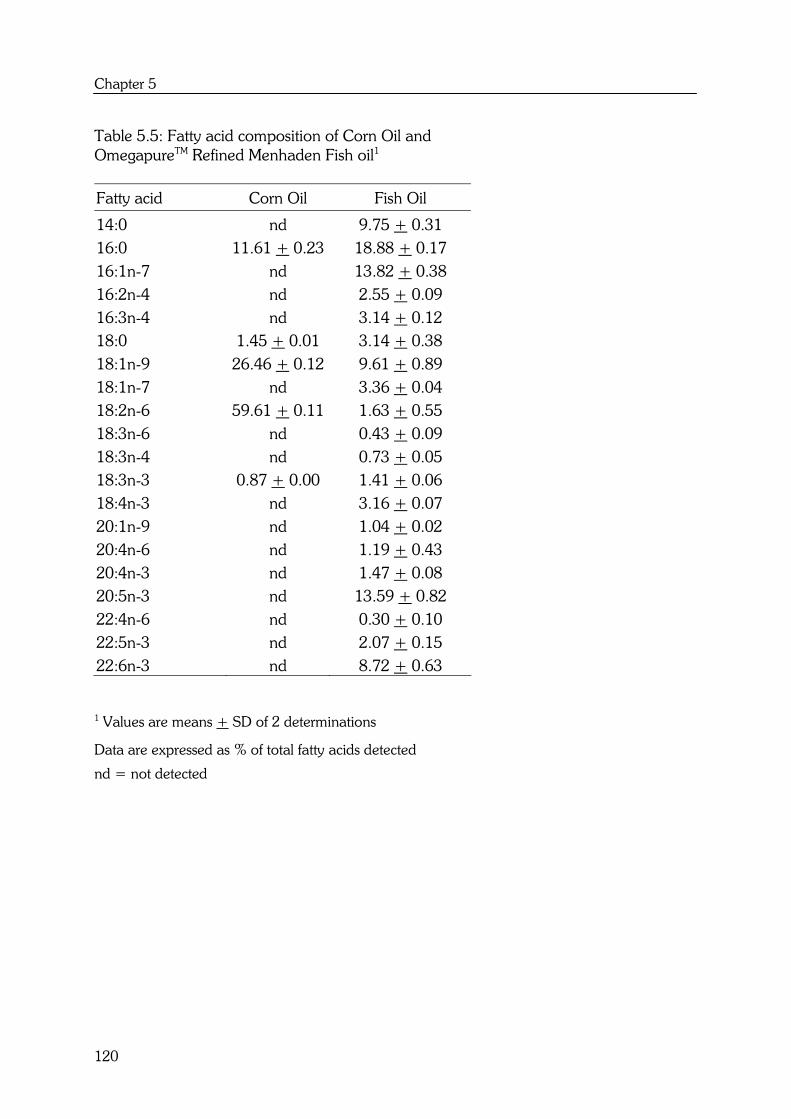
Chapter 5
120
Table 5.5: Fatty acid composition of Corn Oil and OmegapureTM Refined Menhaden Fish oil1
Fatty acid Corn Oil Fish Oil
14:0 nd 9.75 + 0.31
16:0 11.61 + 0.23 18.88 + 0.17
16:1n-7 nd 13.82 + 0.38
16:2n-4 nd 2.55 + 0.09
16:3n-4 nd 3.14 + 0.12
18:0 1.45 + 0.01 3.14 + 0.38
18:1n-9 26.46 + 0.12 9.61 + 0.89
18:1n-7
18:2n-6
nd
59.61 + 0.11
3.36 + 0.04
1.63 + 0.55
18:3n-6 nd 0.43 + 0.09
18:3n-4
18:3n-3
18:4n-3
20:1n-9
20:4n-6
20:4n-3
20:5n-3
22:4n-6
22:5n-3
22:6n-3
nd
0.87 + 0.00
nd
nd
nd
nd
nd
nd
nd
nd
0.73 + 0.05
1.41 + 0.06
3.16 + 0.07
1.04 + 0.02
1.19 + 0.43
1.47 + 0.08
13.59 + 0.82
0.30 + 0.10
2.07 + 0.15
8.72 + 0.63
1 Values are means + SD of 2 determinations
Data are expressed as % of total fatty acids detected
nd = not detected

Effect of HFFO and HFCO diets on gene expression
121
Table 5.6: Influence of HFCO and HFFO diets on plasma levels of fatty acids after 8 weeks of dietary intervention1
Diet
Fatty acids2 HFCO HFFO
14:0 0.036 + 0.018a nda
16:0 0.390 + 0.065a 0.180 + 0.004a
18:0 0.389 + 0.057a 0.140 + 0.007a
18:1n-9 0.196 + 0.066a 0.033 + 0.002a
18:1n-7 0.034 + 0.019a 0.012 + 0.001b
18:2n-6 0.152 + 0.028a 0.088 + 0.005a
20:4n-6 0.234 + 0.031a 0.058 + 0.003a
20:5n-3 nda 0.023 + 0.002a
22:6n-3 0.025 + 0.004a 0.042 + 0.002a
SFA 0.815 + 0.134a 0.320 + 0.010a
MUFA 0.230 + 0.076a 0.045 + 0.002a
PUFA 0.412 + 0.056a 0.210 + 0.008a
Total n-6 0.387 + 0.053a 0.146 + 0.006a
Total n-3
Ratio n-6 / n-3
0.025 + 0.004a
15.82 + 1.15a
0.065 + 0.003a
2.26 + 0.05a
Total 1.458 + 0.242a 0.576 + 0.019a
1 Values are means + SEM per diet group (n=10 per group)
2 Fatty acid levels in plasma phospholipids are expressed as mg / ml plasma
a Means between diet groups sharing the same letter superscripts within a row are significantly
different at p < 0.05
Abbreviations: SFA, saturated fatty acids; MUFA, monounsaturated fatty acids; PUFA,
polyunsaturated fatty acids; nd, not detected
Oxidative stress response
Because PUFAs are very susceptible to auto-oxidation, antioxidants were added to both
oils to prevent in vitro lipid peroxidation (29). Peroxide values of the freshly prepared
HFCO and HFFO diets were < 3 mEq/kg diet (Table 5.1). A small increase up to around
4 mEq/kg diet was observed after storage of the diets for one month at -40 ºC, but
peroxide values were still below 8-9 mEq/kg, which are found in other normal oils (30).
The amount of in vivo lipid peroxidation, as measured by microsomal levels of MDA in
the liver (Table 5.7), was significantly higher in the rats fed the HFFO diet than in the rats
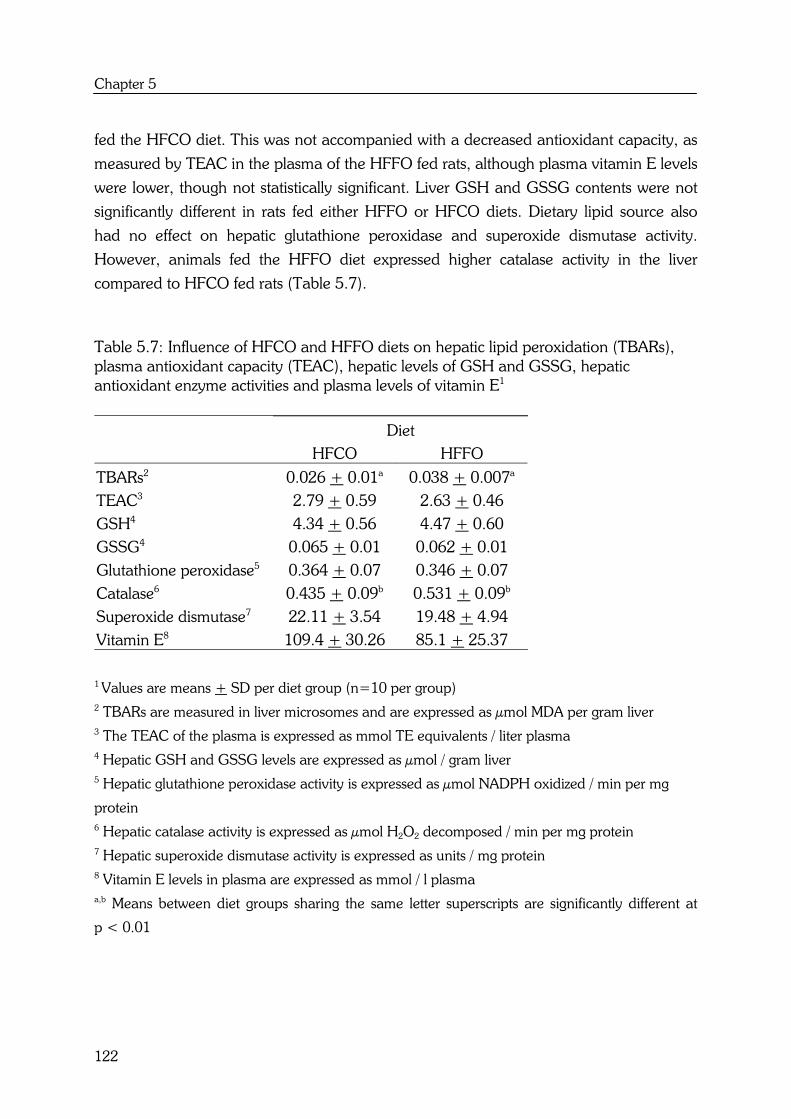
Chapter 5
122
fed the HFCO diet. This was not accompanied with a decreased antioxidant capacity, as
measured by TEAC in the plasma of the HFFO fed rats, although plasma vitamin E levels
were lower, though not statistically significant. Liver GSH and GSSG contents were not
significantly different in rats fed either HFFO or HFCO diets. Dietary lipid source also
had no effect on hepatic glutathione peroxidase and superoxide dismutase activity.
However, animals fed the HFFO diet expressed higher catalase activity in the liver
compared to HFCO fed rats (Table 5.7).
Table 5.7: Influence of HFCO and HFFO diets on hepatic lipid peroxidation (TBARs), plasma antioxidant capacity (TEAC), hepatic levels of GSH and GSSG, hepatic antioxidant enzyme activities and plasma levels of vitamin E1
Diet
HFCO HFFO
TBARs2 0.026 + 0.01a 0.038 + 0.007a
TEAC3 2.79 + 0.59 2.63 + 0.46
GSH4 4.34 + 0.56 4.47 + 0.60
GSSG4
Glutathione peroxidase5
0.065 + 0.01
0.364 + 0.07
0.062 + 0.01
0.346 + 0.07
Catalase6 0.435 + 0.09b 0.531 + 0.09b
Superoxide dismutase7 22.11 + 3.54 19.48 + 4.94
Vitamin E8 109.4 + 30.26 85.1 + 25.37
1 Values are means + SD per diet group (n=10 per group)
2 TBARs are measured in liver microsomes and are expressed as µmol MDA per gram liver
3 The TEAC of the plasma is expressed as mmol TE equivalents / liter plasma
4 Hepatic GSH and GSSG levels are expressed as µmol / gram liver
5 Hepatic glutathione peroxidase activity is expressed as µmol NADPH oxidized / min per mg
protein
6 Hepatic catalase activity is expressed as µmol H2O2 decomposed / min per mg protein
7 Hepatic superoxide dismutase activity is expressed as units / mg protein
8 Vitamin E levels in plasma are expressed as mmol / l plasma
a,b Means between diet groups sharing the same letter superscripts are significantly different at
p < 0.01

Effect of HFFO and HFCO diets on gene expression
123
Figure 5.1: PGE2 levels in plasma of male F344 rats after 1, 4 and 8 weeks of HFCO (black bars) and HFFO (white bars) diets1
1Values are means + SD (n=10 per group). Means between diet groups are significantly different
(p < 0.05) at day 29
Discussion
Fish oil feeding resulted in significantly increased levels of EPA (20:5n-3) and DHA
(22:5n-6) in plasma phospholipids and decreased levels of linoleic acid (18:2n-6) and
arachidonic acid (20:4n-6) compared to corn oil feeding. This increase in EPA and DHA
was accompanied with an increase in oxidative stress, as measured by microsomal levels
of MDA, a decrease in plasma levels of vitamin E and a decrease in plasma levels of
PGE2. These results are in line with our previous in vivo data (4) and agree with a.o. Ko
et al. (31) who also found that fish oil feeding induced changes in fatty acid composition,
hepatic vitamin E and PGE2 content and hepatic lipid peroxidation.
Fish oil is thus an oxidative stress-causing factor, which might enhance antioxidant
capacities to defend against oxidative stress (31,32,33,34,35). This is confirmed by the
fact that the normal liver seems to be able to adapt to the HFFO diet by increasing the
activity of catalase, thereby increasing the decomposition of H2O2 to H2O.
Our gene expression analysis revealed that fish oil feeding also increased the expression
of antioxidant genes in the normal colonic epithelium of male F344 rats compared to
corn oil feeding. The expression of for example ferritin light chain and heavy chain was
induced after fish oil feeding. Ferritin is a 480-kDa intracellular protein that can store up
0
1000
2000
3000
4000
5000
6000
7000
7 29 57
Days on experimental diet
PG
E2 p
lasm
a (
pg/m
l)
Chapter 5
124
to 4500 atoms of iron (36). Because iron functions as a catalyst in the formation of
oxygen free radicals and lipid peroxidation (36), upregulation of ferritin by fish oil may
have a cytoprotective function. Also, metallothionein and peroxiredoxin 2 were
upregulated by fish oil feeding in the rat colonic epithelium. Peroxiredoxins also called
thiol-specific antioxidants or thioredoxin peroxidases play a key role in the antioxidant
defense against hydroperoxides (37). Metallothioneins, a group of proteins characterized
by a high thiol content and that bind Zn2+ and Cu2+, are also involved in the protection
against oxidative stress and are considered to have reactive oxygen scavenging activity
(38,39). Mechanisms responsible for the induction of antioxidant genes in response to
oxidative stress are mediated via an antioxidant-responsive element (ARE); also known
as electrophile-responsive element (EpRE) (36).
Functional EpRE/ARE sequences have been identified in glutathione S-transferase Ya
(GSTYa), glutathione S-transferase P1 (GSTP1), NAD(P)H:quinone oxidoreductase
(NQO1), γ-glutamylcysteine synthetase heavy and light chain subunit, heme oxygenase
(HO), thioredoxin, NF-E2-related factor 2 (Nrf2), ferritin heavy and light chain and
metallothionein (36,38). From these genes, besides ferritin, metallothionein and
peroxiredoxin 2 also NQO1 and GSTP1 were significantly upregulated by fish oil
feeding. This was however only observed in the first dataset and not confirmed in the
second dataset.
The above mentioned results implicate thus indeed that fish oil is an oxidative stress-
causing agent that can enhance antioxidant capacities in normal healthy tissue in order
to defend against oxidative stress. The increased antioxidant capacity seems however
specific for normal cells, because tumor cells have been found to have reduced
antioxidant defense mechanisms (40) and seemed to have lost the ability to upregulate
antioxidant defensive enzymes (32). Deficiencies in antioxidant defense systems in tumor
cells may be responsible for the fact that n-3 PUFAs have been shown to selectively kill
tumor cells. Higher levels of oxidative stress in for example colon tumor cells could cause
these cells to die by apoptosis or necrosis (41), while causing no real harm to normal cells
(42,43,44). Several lines of in vitro and in vivo evidence (44,45) including ours (13)
indeed suggest that lipid peroxidation is involved in cytotoxic and tumor cell-growth
inhibiting effects of PUFAs, such as EPA in fish oil.
Aw (41) proposed an interesting working hypothesis of lipid peroxide-induced cell
proliferation and apoptosis in the intestine. Low levels of oxidative stress are required for
normal tissue homeostasis (e.g. is involved in cell proliferation). Intermediate levels of
oxidative stress might cause selective gene activation and protein expression, which can
be considered as an adaptive response to this increased oxidative stress (e.g.
antioxidants, stress proteins). If the oxidant dose is high enough and antioxidants are not
Effect of HFFO and HFCO diets on gene expression
125
able to sufficiently protect, the cells may be pushed beyond the maximal point of cell
division into the apoptotic phase. At high cytotoxic levels of oxidative stress cells can die
by necrosis.
Our transcriptomics experiments also reveal that genes involved in growth control
pathways such as cell proliferation are significantly altered in colonic epithelium of HFFO
fed rats compared to HFCO fed rats. For example histone 2b, a gene whose expression
has been associated with cellular proliferation is significantly decreased in the normal rat
colon after fish oil feeding. Thompson et al. (46) found that histone 2b mRNA levels
increase during S phase in continuously growing cells and decrease when cell replication
ceases in density-arrested cultures. Lower mRNA levels of histone 2b might thus imply
that the cellular proliferation is decreased in the colonic epithelium of HFFO fed rats
compared to HFCO fed rats. Although the hypothesis that HFFO diets could prevent or
inhibit colorectal carcinogenesis via oxidative stress-related modulation of cell
proliferation and apoptosis is still speculative and only a few genes in these pathways
were differentially expressed in our study, our results do reveal that genes involved in
oxidative stress and cell growth pathways are indeed modulated by a HFFO diet.
Okamura et al. (47) found different genes whose transcription is modulated in the
process of growth arrest induced by wild-type p53. These genes are related to cell cycle
regulation (transferrin), cell respiration (cytochrome C oxidase) and cytoskeleton
structure. We also found differentially expressed genes related to the cytoskeleton (↑ ) and
cell respiration (energy metabolism) (↑ ), but also genes related to the immune response
(↑ ), acute phase response (↑ /↓ ) and lipid metabolism (↓ ) were markedly altered in the
colonic epithelium after fish oil feeding. For example, interferon alpha-inducible protein
27-like is significantly upregulated by fish oil feeding. Upregulation of interferon-alpha
can cause profound physiological changes in the cell, which include induction of an
antiviral state but also inhibition of cellular proliferation and modulation of differentiation
via induction of interferon alpha-stimulated genes (48). Tumor suppressor gene p53,
which is induced by reactive oxygen-induced damage (49), was also increased (IF
FO/CO 1.270, p-value = 0.0589) after fish oil feeding in this study. This was however
also only observed in the first dataset and not confirmed in second dataset.
Fish oil feeding also clearly elicited a response well known as the acute-phase protein
response (APPR). The APPR is a defensive response, seen following various types of
stress including trauma, infection, inflammation and cancer (50). APPR-genes that are
altered in the colonic epithelium after fish oil feeding include the negative acute phase
proteins such as albumin, prealbumin (transthyretin) and transferrin and positive acute
phase proteins such as hemopexin, α-1-inhibitor 3, α-1-antitrypsin (serine proteinase
inhibitor, clade A, member 1), ferritin and metallothioneins. Nuclear transcription factor
Chapter 5
126
κB (NF-κB) is one of the main factors, which is involved in the induction of gene
transcription during the acute-phase response (51). Activation of an APPR by fish oil
might thus be mediated via activation of the oxidant- and redox-sensitive NF-κB.
Another group of genes, which are differentially expressed in the normal rat colonic
epithelium after fish oil feeding are related to lipid metabolism. Both apolipoprotein C3
and H are downregulated after fish oil feeding compared to corn oil feeding.
Apolipoprotein C3 (apoC3) is a 79 amino acid long glycoprotein that is synthesized
predominantly in the liver and to a lesser extent in the intestine (52). It is present on very
low lipoproteins (VLDLs) and chylomicron remnants and to some extent on high-density
lipoproteins (HDLs). Although the precise, function of apoC3 is not clearly understood,
several lines of evidence suggest that increased expression is associated with
hypertriglyceridemia, whereas the absence of the gene in knock out mice lead to reduced
plasma triglyceride (TG) levels (52). β2-Glycoprotein (β2GP), also known as
apolipoprotein H, is a plasma glycoprotein of approximately 50 kDa. It is also associated
with VLDLs, HDLs and chylomicrons. β2GP has been implicated in a variety of
physiological pathways, including blood coagulation and haemostasis (53).
Fish oil thus alters apolipoprotein gene expression, which may lead to lower plasma
triglyceride concentrations (54,55). In this study we also found that fish oil feeding had a
hypolipidemic effect in the plasma of male F344 rats compared to corn oil feeding.
Overall, the total levels of saturated fatty acids (SFA), monounsaturated fatty acids
(MUFA), polyunsaturated fatty acids (PUFA) as well as the total level of fatty acids in
plasma phospholipids were significantly lower at 8 weeks in the HFFO diet group
compared to the HFCO diet group. Besides the n-3 PUFA-induced hypolipidemia in the
circulation also changes in liver metabolism may occur that favor lipid deposition. In
accordance with this, hepatomegaly has been observed in the rats fed the HFFO diets.
This may be caused, at least in part, by excess liver lipid accumulation due to a
decreased capacity of the rat liver to transport triacylglycerol out of the hepatocyte after a
diet rich in fish oil (56).
n-3 PUFA-induced hypolipidemia in the circulation already appeared to have an
important role in the control of coronary heart disease and other atherosclerotic disorders
(57,58). Also experimental animal studies have shown that high dietary fat is a risk factor
in colon cancer and that low fat diets reduce the risk of colon carcinogenesis (59). A
possible mechanism that has been proposed to explain this protective effect of a low fat
diet on colon carcinogenesis includes the lowering of secondary bile acids, which can act
as tumor promoters by inducing cell proliferation (59,60). HFFO diet might thus, besides
an increase in plasma levels of n-3 PUFAs, a decrease of PGE2 and an increase in
oxidative stress possibly also protect against colon carcinogenesis through lower
Effect of HFFO and HFCO diets on gene expression
127
basolateral levels of total fatty acids. The exact role of this hypolipidemic effect in the
chemopreventive effects of HFFO diets on colon cancer however remains still to be
elucidated.
Acknowledgements
The authors thank Bert Weijers and Suzanne Heemskerk for care of the animals, the
research technicians of TNO Nutrition and Food Research for the microarray
experiments and Ana Conesa + Marinus Dansen + Sabina Bijlsma of TNO Nutrition
and Food Research for their assistance with the data analysis.

Chapter 5
128
References
1. Reddy, B.S. and Sugie S. (1988) Effect of different levels of omega-3 and omega-
6 fatty acids on azoxymethane-induced colon carcinogenesis in F344 rats. Cancer
Res, 48, 6642-7.
2. Reddy, B.S., Burill C. and Rigotty J. (1991) Effect of diets high in omega-3 and
omega-6 fatty acids on initiation and postinitiation stages of colon carcinogenesis.
Cancer Res, 51, 487-91.
3. Singh, J., Hamid R. and Reddy B.S. (1997) Dietary fat and colon cancer:
modulation of cyclooxygenase-2 by types and amount of dietary fat during the
postinitiation stage of colon carcinogenesis. Cancer Res, 57, 3465-70.
4. Dommels, Y.E.M., Heemskerk S., Van den Berg H., Alink G.M., Van Bladeren
P.J. and van Ommen B. (2003) Effects of high fat fish oil and high fat corn oil
diets on initiation of AOM-induced colonic aberrant crypt foci in male F344 rats.
Food and Chemical Toxicology, in press.
5. Calviello, G., Palozza P., Maggiano N., Piccioni E., Franceschelli P., Frattucci A.,
Di Nicuolo F. and Bartoli G.M. (1999) Cell proliferation, differentiation, and
apoptosis are modified by n-3 polyunsaturated fatty acids in normal colonic
mucosa. Lipids, 34, 599-604.
6. Bartram, H.P., Gostner A., Scheppach W., Reddy B.S., Rao C.V., Dusel G.,
Richter F., Richter A. and Kasper H. (1993) Effects of fish oil on rectal cell
proliferation, mucosal fatty acids, and prostaglandin E2 release in healthy
subjects. Gastroenterology, 105, 1317-22.
7. Latham, P., Lund E.K. and Johnson I.T. (1999) Dietary n-3 PUFA increases the
apoptotic response to 1,2- dimethylhydrazine, reduces mitosis and suppresses the
induction of carcinogenesis in the rat colon. Carcinogenesis, 20, 645-50.
8. Yam, D., Peled A. and Shinitzky M. (2001) Suppression of tumor growth and
metastasis by dietary fish oil combined with vitamins E and C and cisplatin.
Cancer Chemother Pharmacol, 47, 34-40.
9. Chang, W.C., Chapkin R.S. and Lupton J.R. (1997) Predictive value of
proliferation, differentiation and apoptosis as intermediate markers for colon
tumorigenesis. Carcinogenesis, 18, 721-30.
10. Hong, M.Y., Lupton J.R., Morris J.S., Wang N., Carroll R.J., Davidson L.A., Elder
R.H. and Chapkin R.S. (2000) Dietary fish oil reduces O6-methylguanine DNA
adduct levels in rat colon in part by increasing apoptosis during tumor initiation.
Cancer Epidemiol Biomarkers Prev, 9, 819-26.
11. Anti, M., Armelao F., Marra G., Percesepe A., Bartoli G.M., Palozza P., Parrella
P., Canetta C., Gentiloni N., De Vitis I. and et al. (1994) Effects of different doses
Effect of HFFO and HFCO diets on gene expression
129
of fish oil on rectal cell proliferation in patients with sporadic colonic adenomas.
Gastroenterology, 107, 1709-18.
12. Onogi, N., Okuno M., Komaki C., Moriwaki H., Kawamori T., Tanaka T., Mori H.
and Muto Y. (1996) Suppressing effect of perilla oil on azoxymethane-induced
foci of colonic aberrant crypts in rats. Carcinogenesis, 17, 1291-6.
13. Dommels, Y.E.M., Haring M.M.G., Keestra N.G.M., Alink G.M., van Bladeren P.J.
and van Ommen B. (2003) The role of cyclooxygenase in n-6 and n-3
polyunsaturated fatty acid mediated effects on cell proliferation, PGE2 synthesis
and cytotoxicity in human colorectal carcinoma cell lines. Carcinogenesis, 24,
385-392.
14. Reeves, P.G., Nielsen F.H. and Fahey G.C., Jr. (1993) AIN-93 purified diets for
laboratory rodents: final report of the American Institute of Nutrition ad hoc
writing committee on the reformulation of the AIN-76A rodent diet. J Nutr, 123,
1939-51.
15. Appel, M.J., Wijnands M.V. and Woutersen R.A. (1997) Effects of dietary
galactooligosaccharide on azaserine-induced acinar pancreatic carcinogenesis in
male Wistar rats. Nutr Cancer, 29, 35-41.
16. Yang, Y.H., Dudoit S., Luu P., Lin D.M., Peng V., Ngai J. and Speed T.P. (2002)
Normalization for cDNA microarray data: a robust composite method addressing
single and multiple slide systematic variation. Nucleic Acids Res, 30, e15.
17. Tusher, V.G., Tibshirani R. and Chu G. (2001) Significance analysis of
microarrays applied to the ionizing radiation response. Proc Natl Acad Sci U S A,
98, 5116-21.
18. Mihara, M. and Uchiyama M. (1978) Determination of malonaldehyde precursor
in tissues by thiobarbituric acid test. Anal Biochem, 86, 271-8.
19. Miller, N.J., Rice-Evans C., Davies M.J., Gopinathan V. and Milner A. (1993) A
novel method for measuring antioxidant capacity and its application to
monitoring the antioxidant status in premature neonates. Clin Sci (Lond), 84,
407-12.
20. Van den Berg, R., Haenen G.R.M.M., Van den Berg H. and Bast A. (1999)
Applicability of an improved Trolox equivalent antioxidant capacity (TEAC) assay
for evaluation of antioxidant capacity measurements of mixtures. Food
Chemistry, 66, 511-517.
21. Bradford, M.M. (1976) A rapid and sensitive method for the quantitation of
microgram quantities of protein utilizing the principle of protein-dye binding. Anal
Biochem, 72, 248-254.
22. Aebi, H. (1984) Catalase in vitro. Methods Enzymol, 105, 121-6.
Chapter 5
130
23. Flohe, L. and Gunzler W.A. (1984) Assays of glutathione peroxidase. Methods
Enzymol, 105, 114-21.
24. Anderson, M.E. (1985) Determination of glutathione and glutathione disulfide in
biological samples. Methods Enzymol, 113, 548-55.
25. Bligh, E.G. and Dyer W.J. (1959) A rapid method of total lipid extraction and
purification. Can J Biochem Physiol, 37, 911-917.
26. Duggan, D. (1959) Spectrofluorometric determination of tocopherols. Arch
Biochem Biophys, 84, 116.
27. Kaluzny, M.A., Duncan L.A., Merritt M.V. and Epps D.E. (1985) Rapid separation
of lipid classes in high yield and purity using bonded phase columns. J Lipid Res,
26, 135-40.
28. Morrison, W.R. and Smith L.M. (1964) Preparation of fatty acid methyl esters and
dimethylacetals from lipids with boron fluoride-methanol. J Lipid Res, 5, 600-
608.
29. Gonzalez, M.J., Gray J.I., Schemmel R.A., Dugan L., Jr. and Welsch C.W. (1992)
Lipid peroxidation products are elevated in fish oil diets even in the presence of
added antioxidants. J Nutr, 122, 2190-5.
30. Behniwal, P.K., Soni G.L., Vadhera S. and Singh R. (1993) In vitro absorption of
nutrients from small intestine of rats fed peroxidized oil. Indian J Exp Biol, 31,
658-9.
31. Ko, Y.J., Lii C.K., Ou C.C., Liu J.Y., Lin W.L. and Chen H.W. (2000)
Comparison of the effect of fish oil and corn oil on chemical-induced hepatic
enzyme-altered foci in rats. J Agric Food Chem, 48, 4144-50.
32. Hardman, W.E., Avula C.P., Fernandes G. and Cameron I.L. (2001) Three
percent dietary fish oil concentrate increased efficacy of doxorubicin against
MDA-MB 231 breast cancer xenografts. Clin Cancer Res, 7, 2041-9.
33. Hardman, W.E., Munoz J., Jr. and Cameron I.L. (2002) Role of lipid peroxidation
and antioxidant enzymes in omega 3 fatty acids induced suppression of breast
cancer xenograft growth in mice. Cancer Cell Int, 2, 10.
34. Eder, K., Flader D., Hirche F. and Brandsch C. (2002) Excess dietary vitamin E
lowers the activities of antioxidative enzymes in erythrocytes of rats fed salmon oil.
J Nutr, 132, 3400-4.
35. Ruiz-Gutierrez, V., Perez-Espinosa A., Vazquez C.M. and Santa-Maria C. (1999)
Effects of dietary fats (fish, olive and high-oleic-acid sunflower oils) on lipid
composition and antioxidant enzymes in rat liver. Br J Nutr, 82, 233-41.
Effect of HFFO and HFCO diets on gene expression
131
36. Pietsch, E.C., Chan J.Y., Torti F.M. and Torti S.V. (2003) Nrf2 mediates the
induction of ferritin H in response to xenobiotics and cancer chemopreventive
dithiolethiones. J Biol Chem, 278, 2361-9.
37. Shen, C. and Nathan C. (2002) Nonredundant antioxidant defense by multiple
two-cysteine peroxiredoxins in human prostate cancer cells. Mol Med, 8, 95-102.
38. Sato, M. and Kondoh M. (2002) Recent studies on metallothionein: protection
against toxicity of heavy metals and oxygen free radicals. Tohoku J Exp Med,
196, 9-22.
39. Ding, H.Q., Zhou B.J., Liu L. and Cheng S. (2002) Oxidative stress and
metallothionein expression in the liver of rats with severe thermal injury. Burns,
28, 215-21.
40. Schonberg, S.A., Rudra P.K., Noding R., Skorpen F., Bjerve K.S. and Krokan
H.E. (1997) Evidence that changes in Se-glutathione peroxidase levels affect the
sensitivity of human tumour cell lines to n-3 fatty acids. Carcinogenesis, 18,
1897-904.
41. Aw, T.Y. (1999) Molecular and cellular responses to oxidative stress and changes
in oxidation-reduction imbalance in the intestine. Am J Clin Nutr, 70, 557-65.
42. Cantrill, R.C., Ells G.W., DeMarco A.C. and Horrobin D.F. (1997) Mechanisms of
the selective cytotoxic actions of certain essential fatty acids. Adv Exp Med Biol,
539-44.
43. Ells, G.W., Chisholm K.A., Simmons V.A. and Horrobin D.F. (1996) Vitamin E
blocks the cytotoxic effect of gamma-linolenic acid when administered as late as
the time of onset of cell death--insight into the mechanism of fatty acid induced
cytotoxicity. Cancer Lett, 98, 207-11.
44. Jiang, W.G., Bryce R.P. and Horrobin D.F. (1998) Essential fatty acids: molecular
and cellular basis of their anti- cancer action and clinical implications. Crit Rev
Oncol Hematol, 27, 179-209.
45. Latham, P., Lund E.K., Brown J.C. and Johnson I.T. (2001) Effects of cellular
redox balance on induction of apoptosis by eicosapentaenoic acid in HT29
colorectal adenocarcinoma cells and rat colon in vivo. Gut, 49, 97-105.
46. Thompson, C.B., Challoner P.B., Neiman P.E. and Groudine M. (1985) Levels of
c-myc oncogene mRNA are invariant throughout the cell cycle. Nature, 314, 363-
6.
47. Okamura, S., Ng C.C., Koyama K., Takei Y., Arakawa H., Monden M. and
Nakamura Y. (1999) Identification of seven genes regulated by wild-type p53 in a
colon cancer cell line carrying a well-controlled wild-type p53 expression system.
Oncol Res, 11, 281-5.

Chapter 5
132
48. Veals, S.A., Kessler D.S., Josiah S., Leonard D.G. and Levy D.E. (1991) Signal
transduction pathway activating interferon-alpha-stimulated gene expression. Br J
Haematol, 79 Suppl 1, 9-13.
49. Helt, C.E., Rancourt R.C., Staversky R.J. and O'Reilly M.A. (2001) p53-
dependent induction of p21(Cip1/WAF1/Sdi1) protects against oxygen- induced
toxicity. Toxicol Sci, 63, 214-22.
50. Barber, M.D., Ross J.A., Preston T., Shenkin A. and Fearon K.C. (1999) Fish oil-
enriched nutritional supplement attenuates progression of the acute-phase
response in weight-losing patients with advanced pancreatic cancer. J Nutr, 129,
1120-5.
51. Ceciliani, F., Giordano A. and Spagnolo V. (2002) The systemic reaction during
inflammation: the acute-phase proteins. Protein Pept Lett, 9, 211-23.
52. Chhabra, S., Narang R., Krishnan L.R., Vasisht S., Agarwal D.P., Srivastava L.M.,
Manchanda S.C. and Das N. (2002) Apolipoprotein C3 SstI polymorphism and
triglyceride levels in Asian Indians. BMC Genet, 3, 9.
53. Mehdi, H., Manzi S., Desai P., Chen Q., Nestlerode C., Bontempo F., Strom S.C.,
Zarnegar R. and Kamboh M.I. (2003) A functional polymorphism at the
transcriptional initiation site in beta2-glycoprotein I (apolipoprotein H) associated
with reduced gene expression and lower plasma levels of beta2-glycoprotein I.
Eur J Biochem, 270, 230-8.
54. Asset, G., Bauge E., Fruchart J.C. and Dallongeville J. (2001) Lack of triglyceride-
lowering properties of fish oil in apolipoprotein e-deficient mice. Arterioscler
Thromb Vasc Biol, 21, 401-6.
55. Berger, A., Mutch D.M., Bruce German J. and Roberts M.A. (2002) Dietary effects
of arachidonate-rich fungal oil and fish oil on murine hepatic and hippocampal
gene expression. Lipids Health Dis, 1, 2.
56. Gaiva, M.H., Couto R.C., Oyama L.M., Couto G.E., Silveira V.L., Ribeiro E.B.
and Nascimento C.M. (2003) Diets rich in polyunsaturated fatty acids. Effect on
hepatic metabolism in rats. Nutrition, 19, 144-9.
57. Burr, M.L. (1992) Fish food, fish oil and cardiovascular disease. Clin Exp
Hypertens A, 14, 181-92.
58. Connor, W.E., DeFrancesco C.A. and Connor S.L. (1993) N-3 fatty acids from
fish oil. Effects on plasma lipoproteins and hypertriglyceridemic patients. Ann N Y
Acad Sci, 683, 16-34.
59. Reddy, B.S. (1992) Dietary fat and colon cancer: animal model studies. Lipids,
27, 807-13.
Effect of HFFO and HFCO diets on gene expression
133
60. Reddy, B.S., Simi B., Patel N., Aliaga C. and Rao C.V. (1996) Effect of amount
and types of dietary fat on intestinal bacterial 7 alpha-dehydroxylase and
phosphatidylinositol-specific phospholipase C and colonic mucosal diacylglycerol
kinase and PKC activities during stages of colon tumor promotion. Cancer Res,
56, 2314-20.

n-6 and n-3 PUFAs and gene expression
135
Chapter 6
n-6 and n-3 polyunsaturated fatty acid-induced transcriptome changes in Caco-2 cells
In preparation
Yvonne E.M. Dommels1,2
Gerrit M. Alink2
Peter J. van Bladeren2,3
Ben van Ommen4
1WUR/TNO Centre for Food Toxicology 2Toxicology Group, Wageningen University, Wageningen, The Netherlands 3Present address: Nestlé Research Center, Vers-chez-le-blanc, 1000 Lausanne 26,
Switzerland
4TNO Nutrition and Food Research, Department of Biomolecular Sciences, Zeist, The
Netherlands

Chapter 6
136
Abstract
Transcriptome changes induced in human adenocarcinoma Caco-2 cells, after 48 hour
incubation of two concentrations of linoleic acid (LA; 18:2n-6), arachidonic acid (AA;
20:4n-6) and eicosapentaenoic acid (EPA; 20:5n-3), were studied to identify molecular
mechanisms explaining the physiological differences in cell growth inhibiting and
cytotoxic effects between n-6 and n-3 PUFAs. Incubation of Caco-2 cells with 20 µM LA,
AA or EPA resulted in similar changes in expression of genes involved in oxidative stress,
cell growth, differentiation and apoptosis, cell adhesion, lipid metabolism, immune
system and energy metabolism. No differences in expression of genes involved in COX-
mediated PGE2 signaling such as EP receptor subtypes, prostaglandin E synthase,
phospholipase A2, a prostaglandin transporter and COX-2 were observed between EPA
and AA. Down- and upregulated genes between EPA and LA could be classified in
functional groups related to colon carcinogenesis such as cell proliferation, differentiation
and apoptosis, and extracellular matrix and cell migration. However, although
transcriptomic expression of 17.000 genes was measured, no dramatic and consistent
changes in biological pathways between EPA and LA were observed after 48 hours of
incubation, which makes it difficult to predict the physiological effect. In conclusion,
measuring subtle changes in mRNA expression by microarrays at a single time-point does
not fully explain or predict the mechanism of action of the colon cancer inhibiting effects
of n-3 PUFAs in Caco-2 cells.
n-6 and n-3 PUFAs and gene expression
137
Introduction
Many experimental animal studies have demonstrated that diets containing fish oil with a
high amount of n-3 polyunsaturated fatty acids (PUFAs) have a protective effect on
chemically-induced colon carcinogenesis (1,2,3). N-3 PUFAs also suppress colon tumor
cell growth in vitro (4,5,6).
It has been hypothesized that the suppression of colon tumor cell growth by dietary n-3
PUFAs, as compared with n-6 PUFAs, is mediated through inhibition of cyclooxygenase
(COX)-mediated PGE2 synthesis from arachidonic acid (AA; 20:4n-6). However,
Boudreau et al. (5) demonstrated that proliferation of the colon tumor cell line HCT-116,
which does not express COX, was inhibited by eicosapentaenoic acid (EPA; 20:5n-3),
whereas it was not inhibited by linoleic acid (LA; 18:2n-6). These results of Boudreau et
al. (5) suggest that the inhibitory effects of n-3 PUFAs on tumor cell growth are not
mediated through inhibition of PGE2 synthesis. Also our previous in vitro study
demonstrated that the n-3 fatty acid EPA inhibited proliferation of human colorectal
adenocarcinoma Caco-2 cells compared with the n-6 fatty acid LA (4). Also not PGE2,
but peroxidation products that are generated during lipid peroxidation and COX activity
seemed to be responsible for the colon tumor cell growth inhibitory and cytotoxic effects
of n-3 PUFAs (7).
Compared to functional physiological assays, nutrigenomics experiments can provide
mechanistic insights into the molecular action of nutrients in isolated systems (e.g. cell
culture or in animal models) (8). DNA microarray analyses of normal rat colonic
epithelium of high fat fish oil (HFFO) and high fat corn oil (HFCO) fed rats revealed that
genes involved in oxidative stress and cell growth pathways are differentially modulated
by a HFFO diet with a high amount of EPA compared with a high fat corn oil (HFCO)
diet with a high amount of LA (9). Earlier studies of Narayanan et al. (10) demonstrated
that the n-3 fatty acid docosahexaenoic acid (DHA; 22:6n-3) is capable of modulating a
panel of cell cycle and apoptosis-regulating genes in Caco-2 colon cancer cells.
In the present study, 17.000 element DNA microarrays (oligonucleotide arrays) were
used to get more insight into the molecular mechanisms underlying the in vitro colon
tumor cell growth inhibitory effects of n-3 PUFAs compared with n-6 PUFAs.
Transcriptome changes induced by LA and EPA were compared to identify subsets of
induced or repressed genes that are likely to underlie the physiological differences in cell
growth inhibiting and lipid peroxidation-induced cytotoxic effects between these n-6 and
n-3 PUFAs in Caco-2 cells. The question whether the beneficial effects of n-3 PUFAs
such as EPA are due to modulation of COX-mediated PGE2 signaling or are independent
of such downstream metabolic pathways in Caco-2 cells was also addressed.
Furthermore, the results of this study will reveal whether nutrigenomics experiments can
Chapter 6
138
really predict the mechanism of action of the colon cancer inhibiting effects of n-3 PUFAs
and can thus be used as a screening tool for the selection of chemopreventive nutrients.
Material and methods
Reagents
Bovine serum albumin (BSA; essential fatty acid-free), linoleic acid (LA; 18:2n-6),
arachidonic acid (AA; 20:4n-6) and eicosapentaenoic acid (EPA; 20:5n-3) were obtained
from Sigma Chemical Company (St Louis, MO, USA). Fetal calf serum (FCS), non-
essential amino acids, penicillin-streptomycin, DMEM and Trizol were obtained from Life
Technologies (Breda, The Netherlands).
Cell culture and fatty acid treatment
Caco-2 cells were purchased from the American Type Culture Collection (Rockville, MD,
USA) and maintained in an atmosphere of 5% CO2/95% air at 37 °C. Caco-2 cells were
grown in DMEM, supplemented with 10% heat-inactivated FCS, 1% non-essential amino
acids and 2% penicillin-streptomycin. The cells were sub-cultured at a ratio of 2:10, after
they had reached about 70% confluence in 75 cm2 culture flasks (Costar, Cambridge,
MA, USA).
For the transcriptomics experiments, T-75 cell culture flasks were plated with Caco-2 cells
(passage 38) at a concentration of 3.5 x 10⁴ / cm2 (≅ 2.5 x 10⁶ cells in 10 ml of medium).
After 24 hours, the medium was removed and fresh serum-free medium supplemented
with 1 mg/ml fatty acid-free BSA was added. This medium was supplemented with 10 or
20 µM linoleic acid (LA; 18:2n-6), arachidonic acid (AA; 20:4n-6) or eicosapentaenoic
acid (EPA; 20:5n-3). The concentrations chosen were based on our previous in vitro
study in which 10 µM AA and EPA inhibited the growth of Caco-2 cells compared with
10 µM LA. 20 µM AA and EPA showed both growth inhibitory and cytotoxic effects
compared with 20 µM LA (4).
The polyunsaturated fatty acids (PUFAs) were dissolved in ethanol (EtOH) up to a final
concentration in the medium of 0.5%. Before addition to the cultures, the fatty acids
were pre-incubated in the BSA-containing medium for 30 minutes at 37 °C. Control
samples received serum-free medium supplemented with 1 mg/ml fatty acid-free BSA
plus 0.5% ethanol. Unsupplemented Caco-2 cells (passage 45) were used to make a
batch of reference RNA.

n-6 and n-3 PUFAs and gene expression
139
RNA isolation, purification, probe preparation and hybridization
After 48 hours of incubation, total RNA was isolated from both fatty acid and ethanol
treated Caco-2 cells as well as from the untreated cells using Trizol, according to the
manufacturer's protocol. Total RNA was further purified using the RNeasy Mini Kit
(Qiagen, provided by Westburg, Leusden, The Netherlands) and DNA was digested
using the Rnase-Free Dnase set (Qiagen). RNA was checked for purity and stability by
gel electrophoresis and the concentration was calculated from the extinction at 260 nm
as measured spectrophotometrically.
After purification, total RNA of two fatty acid or ethanol treated T-75 cell culture flasks
was pooled in order to get enough RNA for labeling and hybridization. The total RNA of
15 untreated T-75 Caco-2 cell culture flasks was pooled to create the batch of reference
RNA. Labelings were performed by ServiceXS in Leiden (The Netherlands) according to
the fluorescent direct label kit of Agilent Technologies. RNA samples from PUFA (10 or
20 µM LA, AA or EPA) or ethanol treated Caco-2 cells were converted to fluorescent
labeled Cy5-cDNA. RNA from the untreated Caco-2 cells was converted to fluorescent
labeled Cy3-cDNA and used as the control probe. Cy5 and Cy3-labeled cDNAs were
hybridized in triplo according to the Agilent Oligonucleotide Microarray hybridization
protocol.
Human oligonucleotide array, microarray scanning and data extraction
The effect of PUFAs on Caco-2 gene expression was evaluated using the Human 1A
Oligo Microarray Kit from Agilent Technologies. The Human 1A Oligo Microarray, based
on Agilent’s SurePrint technology, is comprised of 22,575 (60-mer) oligonucleotide
probes representing 17,803 well characterized human genes from the Incyte Genomics
Foundation Database.
Microarray slides were scanned using Agilent’s dual-laser (532 and 633 nm laser lines)
Microarray scanner. Agilent Feature Extraction software with default parameters for
custom oligonucleotide microarrays was used to extract the data from the microarray
images.
Data analysis
The LOWESS normalized data, obtained by the Agilent Feature Extraction software were
transferred into Microsoft Excel for further data analysis. Spots that were flagged in the
Agilent Feature Extraction software were not included in the dataset. As a consequence
Chapter 6
140
of the introduction of the reference control, comparisons between the different PUFAs
and between PUFAs and ethanol treatment are indirect (the expression levels of either 10
or 20 µM LA, AA, EPA and ethanol treated Caco-2 cells compared to the reference
control (untreated Caco-2 cells) are measured on separate slides). The average fold
induction values of PUFAs/ethanol, PUFA/PUFA were determined from the indirect
average log ratios. Genes with an average induction factor (IF) > 2 or < 0.5 were
considered differentially expressed. Genes with a p-value < 0.01 between two different
treatments, as determined by the Student's t-test, were considered significantly
differentially expressed. Also SAM (Statistical Analysis of Microarrays) was used to
determine if the expression of any genes between two different treatments and multiclass
experiments were significantly related to the response. Genes with a p-value < 0.05 in
both AA and EPA and LA versus ethanol treated Caco-2 cells, as determined by the
Student's t-test, were also considered as significantly differentially expressed. The
program Genmapp was used to view and analyze the microarray data into biological
pathways (11).
Results
Effects of LA, AA and EPA on Caco-2 gene expression
Gene expression of 20 µM LA, AA and EPA treated Caco-2 cells were compared with
ethanol treated Caco-2 cells to determine n-6 and n-3 fatty acid-induced changes in gene
expression. Various genes were found significantly differentially (p<0.01) expressed after
48 hours of treatment with the different fatty acids compared to ethanol (EtOH)
treatment: 20 µM LA - EtOH (225 genes); 20 µM AA - EtOH (83 genes) and 20 µM EPA
- EtOH (113 genes) (see Table 6.1). Genes with a p-value < 0.05 in both 20 µM LA and
AA and EPA versus ethanol treated Caco-2 cells, as determined by the Student's t-test
are shown in Table 6.2 as well as the genes that were significantly differentially expressed
as determined by SAM. Also genes with an induction factor (IF) > 2 or < 0.5 in both 20
µM LA and AA and EPA versus ethanol treated Caco-2 cells were selected as
differentially expressed and are listed in Table 6.2. In total, 91 genes fulfilled these
criteria, of which 46 genes could be predefined in functional groups based on reported
gene classifications that are published in PubMed Medline (12).
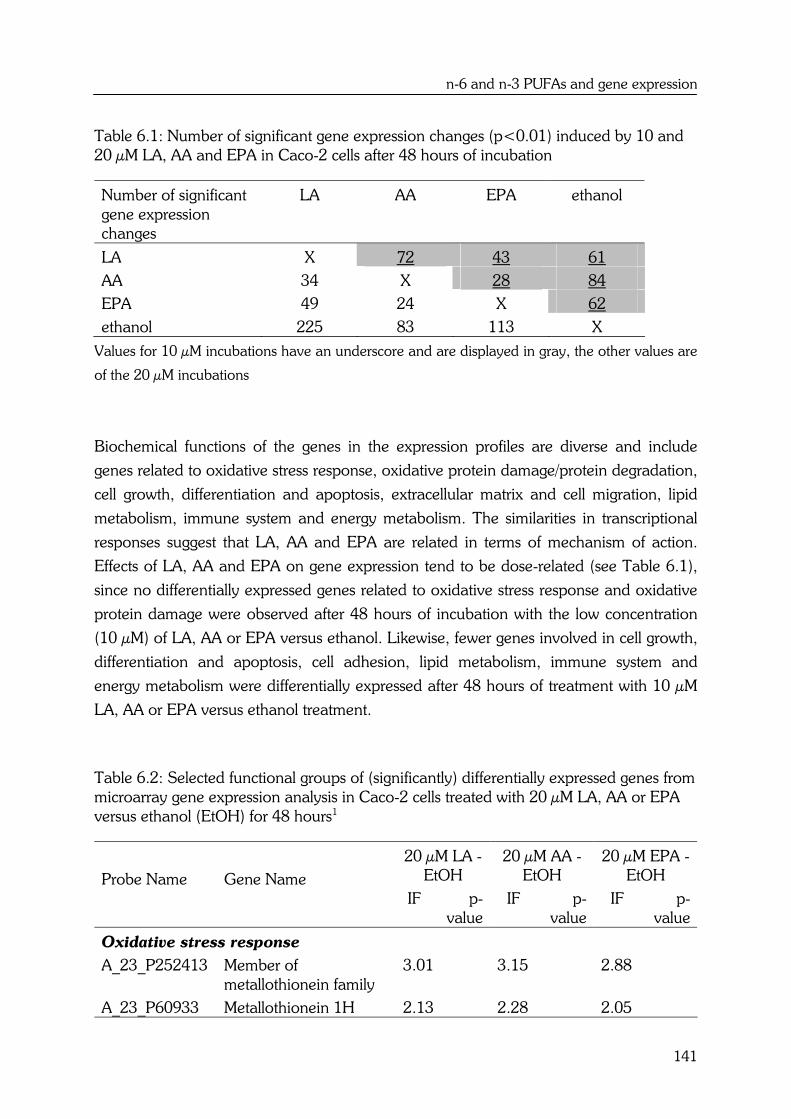
n-6 and n-3 PUFAs and gene expression
141
Table 6.1: Number of significant gene expression changes (p<0.01) induced by 10 and 20 µM LA, AA and EPA in Caco-2 cells after 48 hours of incubation
Number of significant gene expression changes
LA AA EPA ethanol
LA X 72 43 61
AA 34 X 28 84
EPA 49 24 X 62
ethanol 225 83 113 X
Values for 10 µM incubations have an underscore and are displayed in gray, the other values are
of the 20 µM incubations
Biochemical functions of the genes in the expression profiles are diverse and include
genes related to oxidative stress response, oxidative protein damage/protein degradation,
cell growth, differentiation and apoptosis, extracellular matrix and cell migration, lipid
metabolism, immune system and energy metabolism. The similarities in transcriptional
responses suggest that LA, AA and EPA are related in terms of mechanism of action.
Effects of LA, AA and EPA on gene expression tend to be dose-related (see Table 6.1),
since no differentially expressed genes related to oxidative stress response and oxidative
protein damage were observed after 48 hours of incubation with the low concentration
(10 µM) of LA, AA or EPA versus ethanol. Likewise, fewer genes involved in cell growth,
differentiation and apoptosis, cell adhesion, lipid metabolism, immune system and
energy metabolism were differentially expressed after 48 hours of treatment with 10 µM
LA, AA or EPA versus ethanol treatment.
Table 6.2: Selected functional groups of (significantly) differentially expressed genes from microarray gene expression analysis in Caco-2 cells treated with 20 µM LA, AA or EPA versus ethanol (EtOH) for 48 hours1
Probe Name
Gene Name
20 µM LA - EtOH
IF p- value
20 µM AA - EtOH
IF p-value
20 µM EPA - EtOH
IF p-value
Oxidative stress response
A_23_P252413 Member of metallothionein family
3.01 3.15 2.88
A_23_P60933 Metallothionein 1H 2.13 2.28 2.05
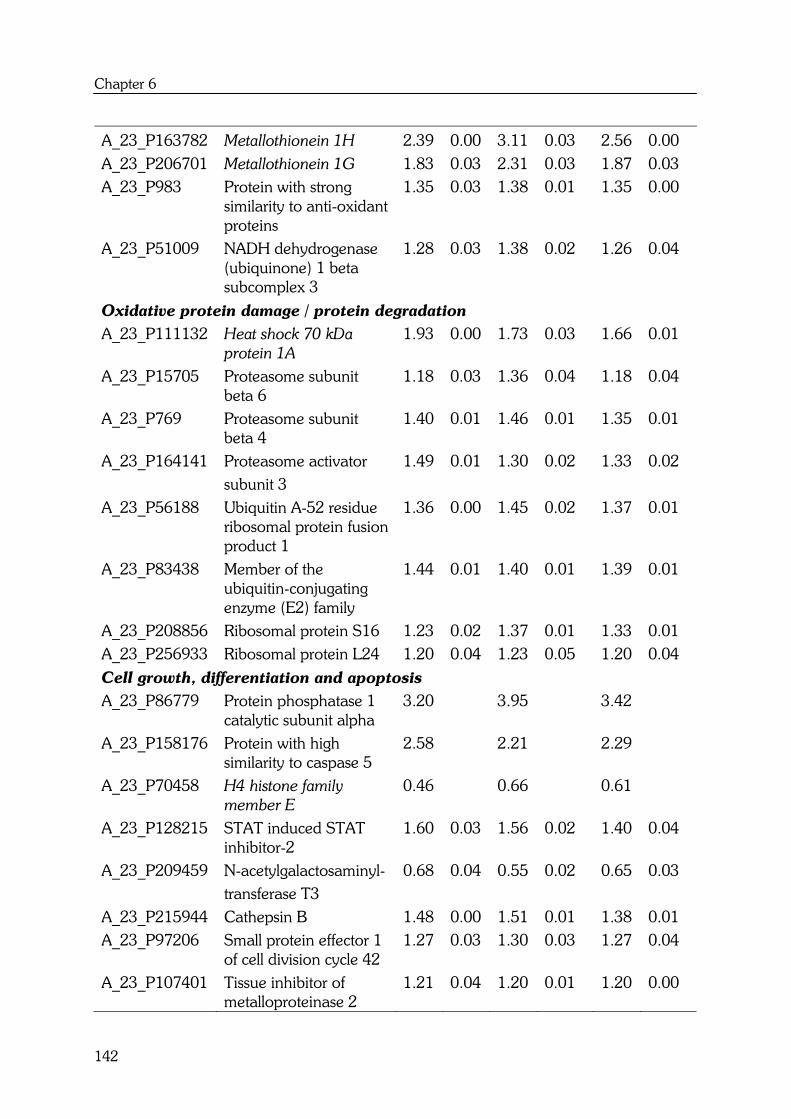
Chapter 6
142
A_23_P163782 Metallothionein 1H 2.39 0.00 3.11 0.03 2.56 0.00
A_23_P206701 Metallothionein 1G 1.83 0.03 2.31 0.03 1.87 0.03
A_23_P983 Protein with strong similarity to anti-oxidant proteins
1.35 0.03 1.38 0.01 1.35 0.00
A_23_P51009 NADH dehydrogenase (ubiquinone) 1 beta subcomplex 3
1.28 0.03 1.38 0.02 1.26 0.04
Oxidative protein damage / protein degradation
A_23_P111132 Heat shock 70 kDa
protein 1A
1.93 0.00 1.73 0.03 1.66 0.01
A_23_P15705 Proteasome subunit beta 6
1.18 0.03 1.36 0.04 1.18 0.04
A_23_P769 Proteasome subunit beta 4
1.40 0.01 1.46 0.01 1.35 0.01
A_23_P164141 Proteasome activator 1.49 0.01 1.30 0.02 1.33 0.02
subunit 3
A_23_P56188 Ubiquitin A-52 residue ribosomal protein fusion product 1
1.36 0.00 1.45 0.02 1.37 0.01
A_23_P83438 Member of the ubiquitin-conjugating enzyme (E2) family
1.44 0.01 1.40 0.01 1.39 0.01
A_23_P208856 Ribosomal protein S16 1.23 0.02 1.37 0.01 1.33 0.01
A_23_P256933 Ribosomal protein L24 1.20 0.04 1.23 0.05 1.20 0.04
Cell growth, differentiation and apoptosis
A_23_P86779 Protein phosphatase 1 catalytic subunit alpha
3.20 3.95 3.42
A_23_P158176 Protein with high similarity to caspase 5
2.58 2.21 2.29
A_23_P70458 H4 histone family
member E
0.46 0.66 0.61
A_23_P128215 STAT induced STAT inhibitor-2
1.60 0.03 1.56 0.02 1.40 0.04
A_23_P209459 N-acetylgalactosaminyl- 0.68 0.04 0.55 0.02 0.65 0.03
transferase T3
A_23_P215944 Cathepsin B 1.48 0.00 1.51 0.01 1.38 0.01
A_23_P97206 Small protein effector 1 of cell division cycle 42
1.27 0.03 1.30 0.03 1.27 0.04
A_23_P107401 Tissue inhibitor of metalloproteinase 2
1.21 0.04 1.20 0.01 1.20 0.00
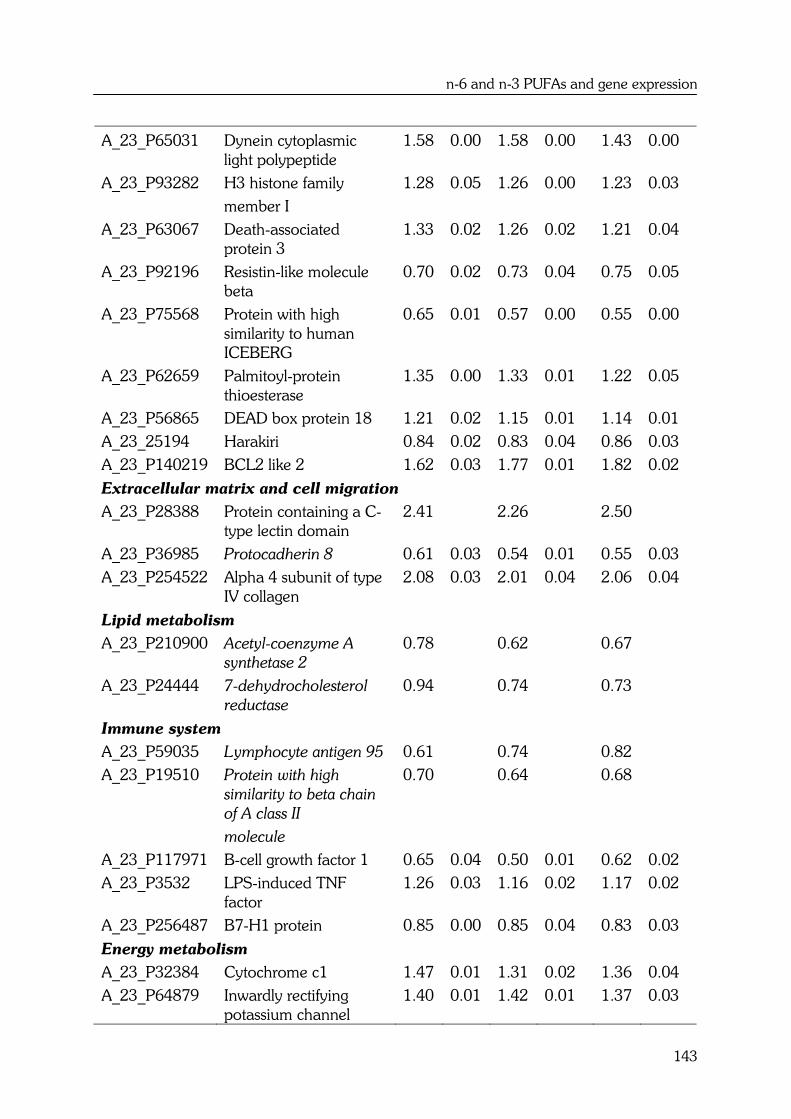
n-6 and n-3 PUFAs and gene expression
143
A_23_P65031 Dynein cytoplasmic light polypeptide
1.58 0.00 1.58 0.00 1.43 0.00
A_23_P93282 H3 histone family
member I
1.28 0.05 1.26 0.00 1.23 0.03
A_23_P63067 Death-associated protein 3
1.33 0.02 1.26 0.02 1.21 0.04
A_23_P92196 Resistin-like molecule beta
0.70 0.02 0.73 0.04 0.75 0.05
A_23_P75568 Protein with high similarity to human ICEBERG
0.65 0.01 0.57 0.00 0.55 0.00
A_23_P62659 Palmitoyl-protein thioesterase
1.35 0.00 1.33 0.01 1.22 0.05
A_23_P56865 DEAD box protein 18 1.21 0.02 1.15 0.01 1.14 0.01
A_23_25194 Harakiri 0.84 0.02 0.83 0.04 0.86 0.03
A_23_P140219 BCL2 like 2 1.62 0.03 1.77 0.01 1.82 0.02
Extracellular matrix and cell migration
A_23_P28388 Protein containing a C-type lectin domain
2.41 2.26 2.50
A_23_P36985 Protocadherin 8 0.61 0.03 0.54 0.01 0.55 0.03
A_23_P254522 Alpha 4 subunit of type IV collagen
2.08 0.03 2.01 0.04 2.06 0.04
Lipid metabolism
A_23_P210900 Acetyl-coenzyme A
synthetase 2
0.78 0.62 0.67
A_23_P24444 7-dehydrocholesterol
reductase
0.94 0.74 0.73
Immune system
A_23_P59035 Lymphocyte antigen 95 0.61 0.74 0.82
A_23_P19510 Protein with high
similarity to beta chain
of A class II
0.70 0.64 0.68
molecule
A_23_P117971 B-cell growth factor 1 0.65 0.04 0.50 0.01 0.62 0.02
A_23_P3532 LPS-induced TNF factor
1.26 0.03 1.16 0.02 1.17 0.02
A_23_P256487 B7-H1 protein 0.85 0.00 0.85 0.04 0.83 0.03
Energy metabolism
A_23_P32384 Cytochrome c1 1.47 0.01 1.31 0.02 1.36 0.04
A_23_P64879 Inwardly rectifying potassium channel
1.40 0.01 1.42 0.01 1.37 0.03
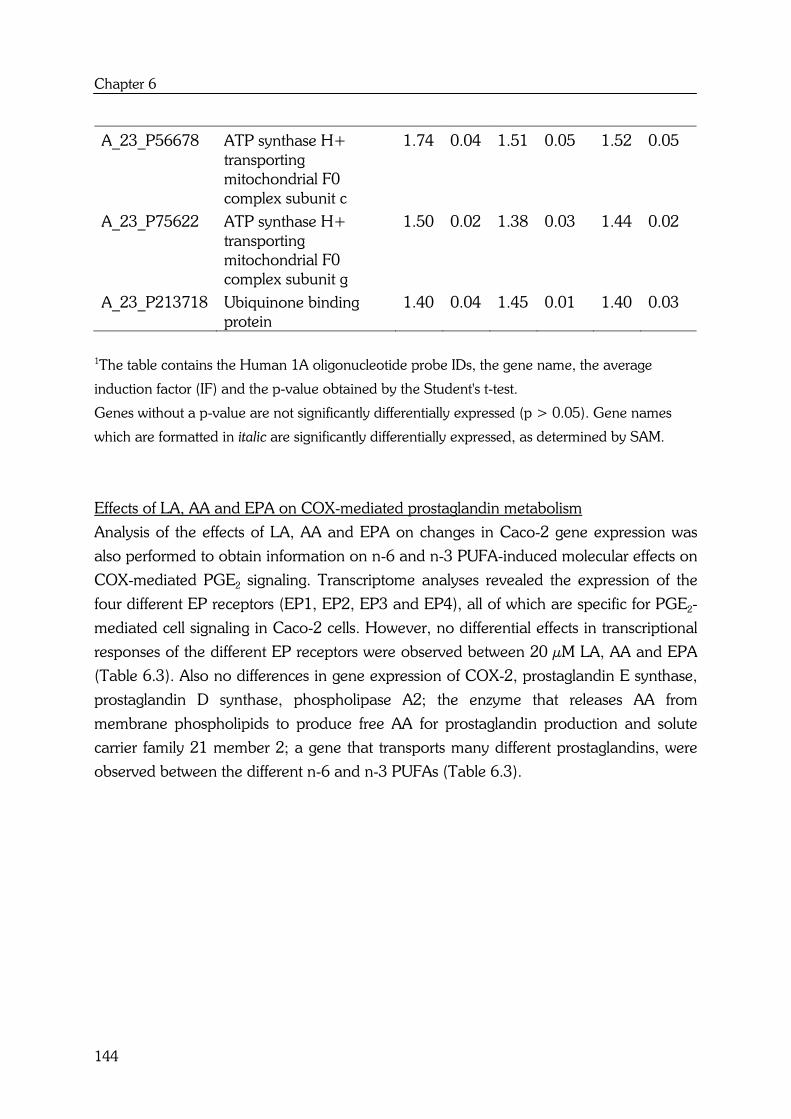
Chapter 6
144
A_23_P56678 ATP synthase H+ transporting mitochondrial F0 complex subunit c
1.74 0.04 1.51 0.05 1.52 0.05
A_23_P75622 ATP synthase H+ transporting mitochondrial F0 complex subunit g
1.50 0.02 1.38 0.03 1.44 0.02
A_23_P213718 Ubiquinone binding protein
1.40 0.04 1.45 0.01 1.40 0.03
1The table contains the Human 1A oligonucleotide probe IDs, the gene name, the average
induction factor (IF) and the p-value obtained by the Student's t-test.
Genes without a p-value are not significantly differentially expressed (p > 0.05). Gene names
which are formatted in italic are significantly differentially expressed, as determined by SAM.
Effects of LA, AA and EPA on COX-mediated prostaglandin metabolism
Analysis of the effects of LA, AA and EPA on changes in Caco-2 gene expression was
also performed to obtain information on n-6 and n-3 PUFA-induced molecular effects on
COX-mediated PGE2 signaling. Transcriptome analyses revealed the expression of the
four different EP receptors (EP1, EP2, EP3 and EP4), all of which are specific for PGE2-
mediated cell signaling in Caco-2 cells. However, no differential effects in transcriptional
responses of the different EP receptors were observed between 20 µM LA, AA and EPA
(Table 6.3). Also no differences in gene expression of COX-2, prostaglandin E synthase,
prostaglandin D synthase, phospholipase A2; the enzyme that releases AA from
membrane phospholipids to produce free AA for prostaglandin production and solute
carrier family 21 member 2; a gene that transports many different prostaglandins, were
observed between the different n-6 and n-3 PUFAs (Table 6.3).
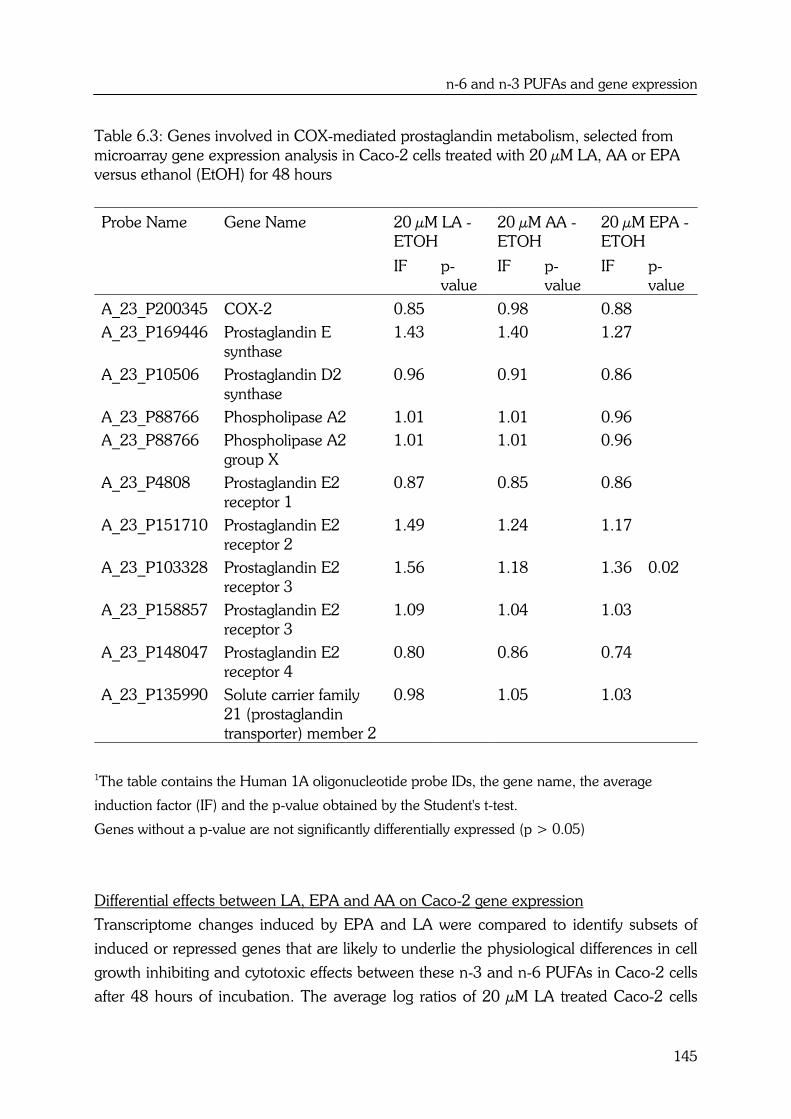
n-6 and n-3 PUFAs and gene expression
145
Table 6.3: Genes involved in COX-mediated prostaglandin metabolism, selected from microarray gene expression analysis in Caco-2 cells treated with 20 µM LA, AA or EPA versus ethanol (EtOH) for 48 hours
Probe Name Gene Name 20 µM LA - ETOH
20 µM AA - ETOH
20 µM EPA - ETOH
IF p-value
IF p-value
IF p-value
A_23_P200345 COX-2 0.85 0.98 0.88
A_23_P169446 Prostaglandin E synthase
1.43 1.40 1.27
A_23_P10506 Prostaglandin D2 synthase
0.96 0.91 0.86
A_23_P88766 Phospholipase A2 1.01 1.01 0.96
A_23_P88766 Phospholipase A2 group X
1.01 1.01 0.96
A_23_P4808 Prostaglandin E2 receptor 1
0.87 0.85 0.86
A_23_P151710 Prostaglandin E2 receptor 2
1.49 1.24 1.17
A_23_P103328 Prostaglandin E2 receptor 3
1.56 1.18 1.36 0.02
A_23_P158857 Prostaglandin E2 receptor 3
1.09 1.04 1.03
A_23_P148047 Prostaglandin E2 receptor 4
0.80 0.86 0.74
A_23_P135990 Solute carrier family 21 (prostaglandin transporter) member 2
0.98 1.05 1.03
1The table contains the Human 1A oligonucleotide probe IDs, the gene name, the average
induction factor (IF) and the p-value obtained by the Student's t-test.
Genes without a p-value are not significantly differentially expressed (p > 0.05)
Differential effects between LA, EPA and AA on Caco-2 gene expression
Transcriptome changes induced by EPA and LA were compared to identify subsets of
induced or repressed genes that are likely to underlie the physiological differences in cell
growth inhibiting and cytotoxic effects between these n-3 and n-6 PUFAs in Caco-2 cells
after 48 hours of incubation. The average log ratios of 20 µM LA treated Caco-2 cells
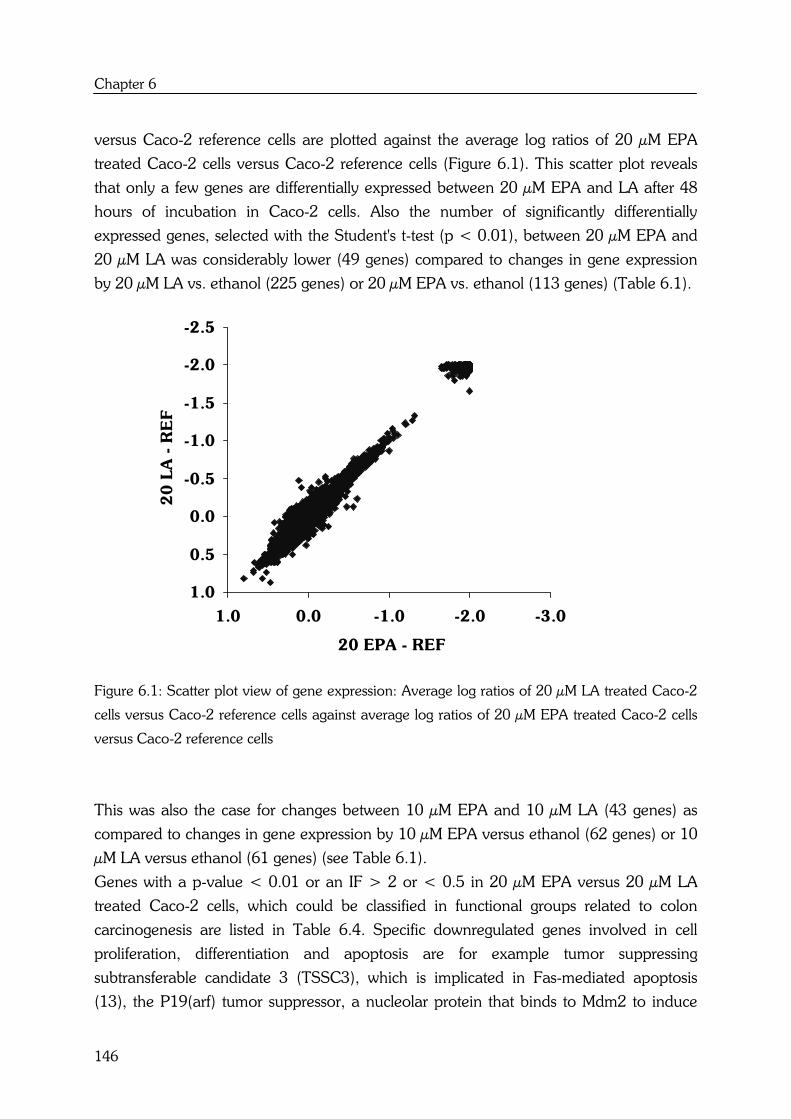
Chapter 6
146
versus Caco-2 reference cells are plotted against the average log ratios of 20 µM EPA
treated Caco-2 cells versus Caco-2 reference cells (Figure 6.1). This scatter plot reveals
that only a few genes are differentially expressed between 20 µM EPA and LA after 48
hours of incubation in Caco-2 cells. Also the number of significantly differentially
expressed genes, selected with the Student's t-test (p < 0.01), between 20 µM EPA and
20 µM LA was considerably lower (49 genes) compared to changes in gene expression
by 20 µM LA vs. ethanol (225 genes) or 20 µM EPA vs. ethanol (113 genes) (Table 6.1).
Figure 6.1: Scatter plot view of gene expression: Average log ratios of 20 µM LA treated Caco-2
cells versus Caco-2 reference cells against average log ratios of 20 µM EPA treated Caco-2 cells
versus Caco-2 reference cells
This was also the case for changes between 10 µM EPA and 10 µM LA (43 genes) as
compared to changes in gene expression by 10 µM EPA versus ethanol (62 genes) or 10
µM LA versus ethanol (61 genes) (see Table 6.1).
Genes with a p-value < 0.01 or an IF > 2 or < 0.5 in 20 µM EPA versus 20 µM LA
treated Caco-2 cells, which could be classified in functional groups related to colon
carcinogenesis are listed in Table 6.4. Specific downregulated genes involved in cell
proliferation, differentiation and apoptosis are for example tumor suppressing
subtransferable candidate 3 (TSSC3), which is implicated in Fas-mediated apoptosis
(13), the P19(arf) tumor suppressor, a nucleolar protein that binds to Mdm2 to induce
-2.5
-2.0
-1.5
-1.0
-0.5
0.0
0.5
1.0
-3.0-2.0-1.00.01.0
20 EPA - REF
20
LA
- R
EF

n-6 and n-3 PUFAs and gene expression
147
p53-dependent cell cycle arrest (14) and a member of the cyclin family, which regulates
the nuclear cell division cycle. Several genes involved in the extracellular matrix and cell
migration, such as two protocadherins, which are suggested to be tumor suppressors, are
upregulated after incubation with EPA compared to LA (15).
Table 6.4: Selected functional groups of (significantly) differentially expressed genes from microarray gene expression analysis in Caco-2 cells treated with 20 µM EPA versus 20 µM LA or 48 hours1
Probe Name Gene Name 20 µM EPA - 20 µM LA
IF p-value
Cell proliferation, differentiation and apoptosis
A_23_P154235 N myc STAT interactor 0.37
A_23_P114185 Transmembrane 4 superfamily member 2
0.48
A_23_P90634 Member of the cyclin family 0.77 0.0038
A_23_P47614 Tumor suppressing subtransferable candidate 3
0.79 0.0051
A_23_P43490 Tumor suppressor P19(Arf) 0.87 0.0081
A_23_P250701 Protein kinase lysine deficient 1, a serine/threonine kinase
0.92 0.0074
A_23_P48807 Galactokinase 2 0.85 0.0098
A_23_P118946 Beta 1-4 galactosyltrans-ferase polypeptide 6
2.11
Extracellular matrix and cell migration
A_23_P156010 Protocadherin beta 12 2.00
A_23_P98640 Protocadherin 16 1.07 0.0074
A_23_P208182 Sialic acid-binding Ig-like lectin-10
2.13
A_23_P168616 Reelin 2.24
Xenobiotic and drug detoxification
A_23_P132644 Protein with moderate similarity to arylacetamide deacetylase
0.75 0.0056
A_23_P48713 Member of the zinc- 0.83 0.0009
containing alcohol dehydrogenase family

Chapter 6
148
Gene translation and degradation
A_23_P152297 DNA directed RNA 0.83 0.0013
polymerase III polypeptide K
A_23_P202844 Putative subunit of the SCF 0.93 0.0023
ubiquitin ligase
A_23_P86182 Mitochondrial ribosomal protein S21
1.06 0.0081
A_23_P_100088 Proteasome subunit alpha 0.85 0.0089
type 4
A_23_P118642 Eukaryotic translation initiation factor 4E
0.85 0.0031
A_23_P45945 Translation initiation factor 1 0.85 0.0047
A_23_P129786 Sterol regulatory element binding transcription factor 1
0.70 0.0059
A_23_P99700 Menage a trois 1 0.92 0.0092
A_23_P42718 Nuclear factor erythroid-derived 2 like 3
0.83 0.0018
Fatty acid and cholesterol metabolism
A_23_P3402 Electron transfer flavoprotein alpha subunit
0.85 0.0072
A_23_P24444 7-dehydrocholesterol reductase
0.77 0.0013
1The table contains the Human 1A oligonucleotide probe IDs, the gene name, the average
induction factor (IF) and the p-value obtained by the Student's t-test.
Genes without a p-value are not significantly differentially expressed (p > 0.01)
Furthermore genes involved in gene translation, transcription and degradation are down-
regulated in 20 µM EPA treated Caco-2 cells compared to 20 µM LA treated Caco-2
cells. Among the downregulated genes is for example the sterol regulatory element
binding transcription factor 1 (SREBF1), which is a transcription factor that plays a key
role in the regulation of fatty acid and cholesterol metabolism. Also other genes involved
in fatty acid and cholesterol metabolism, such as electron transfer flavoprotein alpha
subunit and 7-dehydrocholesterol reductase are down-regulated in Caco-2 cells after
EPA treatment. Up- and downregulated genes, involved in apoptosis, between 20 µM
EPA and LA are shown in Figure 6.2. This figure reveals that although many genes in the
apoptosis pathway are expressed in Caco-2 cells, no consistent differential effect on

n-6 and n-3 PUFAs and gene expression
149
apoptosis related genes is seen between incubations with EPA and LA in this biological
pathway. This was also the case for other biological pathways visualized by means of the
program Genmapp, such as the cell cycle, inflammatory response and proteasome
degradation.
Gene expression changes between EPA and AA in Caco-2 cells were even less compared
to changes between EPA and LA. Only 28 genes were significantly differentially
expressed (p < 0.01) between 10 µM EPA and 10 µM AA (Table 6.1). 24 Genes were
significantly altered (p < 0.01) between 20 µM EPA and 20 µM AA. Among these genes
were a high amount of proteins of unknown function, which made it very difficult to
classify these genes in functional biological pathways (data not shown). Furthermore,
genes involved in COX-mediated PGE2 signaling were not differentially expressed
between AA and EPA, as shown above (see Table 6.3).
Figure 6.2: Biological pathway created by Genmapp (www.Genmapp.org): overview of up- and
downregulated genes involved in apoptosis in 24 hours treated Caco-2 cells with 20 µM EPA
versus 20 µM LA (gene expression ratios are given besides each gene name)
Chapter 6
150
Discussion
In the present study, transcriptome changes induced by LA (18:2n-6), AA (20:4n-6) and
EPA (20:5n-3) were studied in an attempt to link the physiological differences in cell
growth inhibiting and cytotoxic effects between n-3 and n-6 PUFAs observed in human
colon adenocarcinoma Caco-2 cells to genomic and molecular processes. Our results
indicate that the different n-6 and n-3 PUFAs LA, AA and EPA show similarities in
transcriptional responses in Caco-2 cells and thus seem to be related in terms of
mechanism of action. Activation of genes involved in antioxidant defense mechanisms
such as metallothioneins, anti-oxidant proteins and NADH dehydrogenase (ubiquinone)
1 beta subcomplex 3, which is a subunit of NADH-ubiquinone oxidoreductase (NQO1),
suggest for example a role for LA, AA and EPA in stimulation of the oxidative stress
response. Upregulation of repair mechanisms such as heat shock proteins that renature
damaged proteins or resolubilize aggregates of damaged proteins and the proteasome,
that recognizes and degrades oxidatively damaged proteins also supports the role of the
different n-6 and n-3 PUFAs in oxidative stress and cell damage (16). Furthermore genes
involved in cell growth, differentiation and apoptosis, cell adhesion, lipid metabolism,
immune system and energy metabolism were similarly altered after 48 hours of
incubation with 20 µM LA, AA or EPA in Caco-2 cells. These results are in line with our
previous in vivo data that also revealed that genes involved in oxidative stress, cell
growth, cell adhesion, immune response, lipid metabolism and energy metabolism are
modulated by high fat fish oil (HFFO) diets with a high amount of EPA and high fat corn
oil (HFCO) diets with a high amount of LA (9). Also Jump and Clarke (17) demonstrated
that PUFAs have pronounced effects on gene expression involved in carbohydrate and
lipid metabolism, cell differentiation and growth, inflammation and cell adhesion.
Fatty acids can either directly bind to transcription factors such as PPARα, PPARβ,
PPARγ, HNF4α, NFκB and SREBP, modulating gene expression or can modulate cell
signaling via cyclooxygenase (COX) products such as prostaglandins (17). For example,
PGE2, the COX-mediated metabolite of AA, is thought to stimulate proliferation and
motility of colorectal carcinoma cells via activation of the PI3/Akt pathway, an effect likely
due to activation of the PGE2 receptor subtype EP4 (18). It remains however to be
determined whether n-3 PUFA-mediated inhibiting effects on colon tumor cell growth
reflects a decrease in AA content and PGE2 synthesis, or is independent of PGE2
synthesis. Results from our previous in vitro study clearly demonstrated that EPA could
competitively inhibit AA-induced PGE2 synthesis in Caco-2 cells between 1 and 24 hours
of incubation. Reductions in PGE2 synthesis by EPA compared to AA did not lead to
differential effects on cell proliferation in Caco-2 cells. Both AA and EPA inhibited the
growth of Caco-2 cells after 48 hours of incubation. These results suggest that regulation
n-6 and n-3 PUFAs and gene expression
151
of cell proliferation by n-3 and n-6 PUFAs in colon cancer cell lines is not mediated via
PGE2 levels (4).
The transcriptome analysis performed in this study revealed that differences in Caco-2
gene expression between AA and EPA were very minimal, which is in line with the
similarities in physiological effect between AA and EPA. Caco-2 cells express all four EP
receptor subtypes, but no differences in transcriptional responses of the different EP
receptors were observed between AA and EPA. Also no differences in gene expression of
other genes involved in COX-mediated prostaglandin signaling such as prostaglandin E
synthase, prostaglandin D synthase, phospholipase A2, solute carrier family 21 member
2 and COX-2 were observed between the different n-6 and n-3 PUFAs, which further
supports the idea that the colon cancer inhibiting effects of n-3 PUFAs is independent of
COX-mediated PGE2 signaling in Caco-2 cells.
It would be expected that differences between EPA and LA on Caco-2 gene expression
are more pronounced, based on the physiological differences in cell growth inhibiting
and cytotoxic effects between EPA and LA in Caco-2 cells (4). Gene expression profiling
displayed that down- and upregulated genes between EPA and LA could be classified in
functional groups related to cell proliferation, differentiation and apoptosis, extracellular
matrix and cell migration, xenobiotic and drug detoxification, gene translation and
degradation and fatty acid and cholesterol metabolism. However dramatic differences as
well as consistent changes in biological pathways between EPA and LA are not observed
after 48 hours of incubation, which makes it difficult to predict the physiological effect. A
possible explanation could be that the physiological in vitro effect not primarily originates
from differences in cell signaling resulting in transcriptome changes, but is more
influenced by direct cytotoxic cell damage or post-translational modifications.
Furthermore, individual responsive genes could vary considerably in the kinetics of their
regulation and gene expression changes proceed as a function of time. Therefore,
profiling gene expression changes at multiple time points could greatly help to reveal
patterns of consistent changes in biological pathways, or clusters of genes that show
similarities in their time-dependent response (19,20).
In summary, besides the fact that LA, AA and EPA show similarities in transcriptional
responses and that several genes involved in different biological pathways are altered
after 48 hours of incubation with EPA or LA, it is still very difficult to predict the
mechanism of action of the colon cancer inhibiting effects of n-3 PUFAs from measuring
subtle changes in mRNA expression by means of microarrays at a single time-point. So
far, the use of nutrigenomics as a screening tool for the selection of chemopreventive
nutrients as a superior alternative to traditional in vitro and in vivo physiological assays is
still in its infancy. Therefore, it is very important that experience, especially in

Chapter 6
152
experimental design and bio-informatics, will be extended and shared to advance the
utility of gene expression profiling in predictive and mechanistic nutrigenomics.
n-6 and n-3 PUFAs and gene expression
153
References
1. Dommels, Y.E.M., Alink G.M., van Bladeren P.J. and van Ommen B. (2002)
Dietary n-6 and n-3 polyunsaturated fatty acids and colorectal carcinogenesis:
results from cultured colon cells, animal models and human studies.
Environmental Toxicology and Pharmacology, 12, 233-244.
2. Singh, J., Hamid R. and Reddy B.S. (1997) Dietary fat and colon cancer:
modulation of cyclooxygenase-2 by types and amount of dietary fat during the
postinitiation stage of colon carcinogenesis. Cancer Res, 57, 3465-70.
3. Reddy, B.S., Burill C. and Rigotty J. (1991) Effect of diets high in omega-3 and
omega-6 fatty acids on initiation and postinitiation stages of colon carcinogenesis.
Cancer Res, 51, 487-91.
4. Dommels, Y.E.M., Haring M.M.G., Keestra N.G.M., Alink G.M., van Bladeren P.J.
and van Ommen B. (2003) The role of cyclooxygenase in n-6 and n-3
polyunsaturated fatty acid mediated effects on cell proliferation, PGE2 synthesis
and cytotoxicity in human colorectal carcinoma cell lines. Carcinogenesis, 24,
385-392.
5. Boudreau, M.D., Sohn K.H., Rhee S.H., Lee S.W., Hunt J.D. and Hwang D.H.
(2001) Suppression of tumor cell growth both in nude mice and in culture by n-3
polyunsaturated fatty acids: mediation through cyclooxygenase-independent
pathways. Cancer Res, 61, 1386-91.
6. Tsai, W.S., Nagawa H., Kaizaki S., Tsuruo T. and Muto T. (1998) Inhibitory
effects of n-3 polyunsaturated fatty acids on sigmoid colon cancer transformants. J
Gastroenterol, 33, 206-12.
7. Dommels, Y.E.M., Alink G.M., Linssen J.P.H. and van Ommen B. (2002) Effects
of n-6 and n-3 Polyunsaturated Fatty Acids on Gap Junctional Intercellular
Communication (GJIC) During Spontaneous Differentiation of the Human Colon
Adenocarcinoma Cell Line Caco-2. Nutr Cancer, 42, 125-130.
8. van Ommen, B. and Stierum R. (2002) Nutrigenomics: exploiting systems biology
in the nutrition and health arena. Curr Opin Biotechnol, 13, 517-21.
9. Dommels, Y.E.M., van den Hil P.J., Linssen J.P.H., Alink G.M., van Bladeren P.J.
and van Ommen B. (2003) High fat fish oil diets modulate expression of genes
involved in oxidative stress, cell growth, acute phase response and lipid
metabolism in normal rat colonic epithelium of male F344 rats. Submitted.
10. Narayanan, B.A., Narayanan N.K. and Reddy B.S. (2001) Docosahexaenoic acid
regulated genes and transcription factors inducing apoptosis in human colon
cancer cells. Int J Oncol, 19, 1255-62.
Chapter 6
154
11. Dahlquist, K.D., Salomonis N., Vranizan K., Lawlor S.C. and Conklin B.R. (2002)
GenMAPP, a new tool for viewing and analyzing microarray data on biological
pathways. Nat Genet, 31, 19-20.
12. Mariadason, J.M., Arango D., Corner G.A., Aranes M.J., Hotchkiss K.A., Yang W.
and Augenlicht L.H. (2002) A gene expression profile that defines colon cell
maturation in vitro. Cancer Res, 62, 4791-804.
13. Muller, S., van den Boom D., Zirkel D., Koster H., Berthold F., Schwab M.,
Westphal M. and Zumkeller W. (2000) Retention of imprinting of the human
apoptosis-related gene TSSC3 in human brain tumors. Hum Mol Genet, 9, 757-
63.
14. Sugimoto, M., Kuo M.L., Roussel M.F. and Sherr C.J. (2003) Nucleolar Arf tumor
suppressor inhibits ribosomal RNA processing. Mol Cell, 11, 415-24.
15. Okazaki, N., Takahashi N., Kojima S., Masuho Y. and Koga H. (2002)
Protocadherin LKC, a new candidate for a tumor suppressor of colon and liver
cancers, its association with contact inhibition of cell proliferation. Carcinogenesis,
23, 1139-48.
16. Boelsterli, U.A. (2003) Xenobiotic-induced oxidative stress: cell injury, signaling,
and gene regulation, Mechanistic toxicology: the molecular basis of how chemicals
disrupt biological targets. Taylor & Francis, London and New York.
17. Jump, D.B. and Clarke S.D. (1999) Regulation of gene expression by dietary fat.
Annu Rev Nutr, 19, 63-90.
18. Sheng, H., Shao J., Washington M.K. and DuBois R.N. (2001) Prostaglandin E2
increases growth and motility of colorectal carcinoma cells. J Biol Chem, 276,
18075-81.
19. Mariadason, J.M., Corner G.A. and Augenlicht L.H. (2000) Genetic
reprogramming in pathways of colonic cell maturation induced by short chain
fatty acids: comparison with trichostatin A, sulindac, and curcumin and
implications for chemoprevention of colon cancer. Cancer Res, 60, 4561-72.
20. Pennie, W.D., Tugwood J.D., Oliver G.J. and Kimber I. (2000) The principles and
practice of toxigenomics: applications and opportunities. Toxicol Sci, 54, 277-83.

Summary and general discussion
155
Chapter 7
Summary and general discussion
Chapter 7
156
7.1 Summary of results
Previous studies (as summarized in the introduction) led us to suggest that both
modulation of COX-mediated PGE2 signaling as well as lipid peroxidation-induced
oxidative stress may play a role in the (anti)-colon carcinogenic effects of n-3 and n-6
PUFAs. The exact mechanisms by which n-3 PUFAs prevent or inhibit colorectal
carcinogenesis compared with n-6 PUFAs is however currently poorly understood. The
aim of this thesis therefore was to investigate the cellular, biochemical and molecular
mechanisms of the adverse and beneficial effects of n-6 and n-3 PUFAs on colorectal
carcinogenesis, with special emphasis on PGE2 and the oxidative stress response.
Effects of n-6 and n-3 PUFAs on PGE2 synthesis and cell proliferation
The n-6 fatty acid arachidonic acid (AA; 20:4n-6) is the precursor fatty acid of the 2-
series of prostaglandins, including PGE2. In chapter 3, experiments are described
demonstrating that human colon adenocarcinoma Caco-2 cells, which express high levels
of cyclooxygenase 2 (COX-2), produce PGE2 upon addition of AA. HT-29 colon tumor
cells on the other hand did not produce high levels of PGE2 under the same conditions.
However, PGE2 synthesis in this cell line was inducible by IL-1β, a cytokine that is known
to increase COX-2 expression. The observation that linoleic acid (LA; 18:2n-6) did not
increase PGE2 production in Caco-2 as well as in HT-29 cells is in agreement with the
finding that the parent essential fatty acid LA is not converted to the prostaglandin
precursor AA in these colon cancer cell lines (chapter 2).
The n-3 fatty acid eicosapentaenoic acid (EPA; 20:5n-3) is the precursor fatty acid of the
3-series of prostaglandins, including PGE3. Because EPA and AA are both substrates for
prostaglandin synthesis, they can compete for COX enzyme activity. In chapter 3 is
shown that EPA competitively inhibited AA-induced PGE2 synthesis in Caco-2 cells. The
in vivo studies described in chapter 4 and 5 also show that high fat fish oil (HFFO) diets
with a high amount of EPA result in lower levels of PGE2 in the plasma of F344 rats
compared with high fat corn oil (HFCO) diets with a high amount of LA.
In order to investigate the hypothesis that the inhibitory effects of n-3 PUFAs such as
EPA on colon tumor cell growth may partly be related to inhibition of PGE2 synthesis
from AA, differential effects of AA and EPA on colon tumor cell proliferation were
compared (chapter 3). Reductions in PGE2 synthesis by EPA compared to AA did
however not lead to differential effects on cell proliferation in human colon
adenocarcinoma Caco-2 cells. EPA inhibited the cell division of Caco-2 cells, but the n-6
fatty acid AA showed the same growth inhibitory and cytotoxic effects. Also differences in
transcriptome changes induced by AA and EPA were minimal in Caco-2 cells. No
differential expression of genes involved in COX-mediated PGE2 signaling such as
Summary and general discussion
157
prostaglandin receptors (EP1, EP2, EP3 and EP4), prostaglandin E synthase,
phospholipase A2, a prostaglandin transporter and COX-2 were observed between EPA
and AA (chapter 6).
In addition, AA and EPA did not influence the proliferation rate of HT-29 cells. Induction
of COX-2 expression and PGE2 synthesis in HT-29 cells by IL-1β did not result in an
increased cell proliferation, but on the contrary a decrease in cell proliferation by both AA
and EPA was observed (chapter 3).
Moreover the causal relationship between PGE2 and colonic epithelial cell proliferation is
also questioned because direct addition of exogenous PGE2 failed to stimulate
proliferation of Caco-2, HT-29, LIM1215 and HCA-7 colon cancer cells (chapter 3).
These negative results could for example be due to the absence of EP receptors in these
cell lines, but based on the results described in chapter 6 (detectable gene expression of
all four EP receptors subtypes in Caco-2 cells), this seems not to be very likely.
Thus, based on the results of our studies, regulation of cell proliferation in colon cancer
cell lines seems not to be mediated via PGE2 levels. These results are not in line with the
above-mentioned hypothesis and thus question the role of PGE2 in the (anti)-colon
carcinogenic effects of n-3 and n-6 PUFAs.
Effects of n-6 and n-3 PUFAs on oxidative stress response
Human colon adenocarcinoma Caco-2 cells were used as an in vitro model to study the
effects of n-3 and n-6 PUFAs on gap junctional intercellular communication (GJIC)
during spontaneous proliferation and differentiation (chapter 2). The GJIC capacity
increased during spontaneous Caco-2 cell growth and differentiation. However, no
differential effects between n-6 and n-3 PUFAs on GJIC were observed. Short-term
incubation (24 hours) with linoleic acid (LA; 18:2n-6), α-linolenic acid (ALA; 18:3n-3),
arachidonic acid (AA; 20:4n-6) or eicosapentaenoic acid (EPA; 20:5n-3) did not
influence GJIC capacity, while long-term incubation during differentiation (> 10 days of
incubation) with LA or ALA inhibited GJIC of these colon cells. Long-chain metabolites
such as AA and EPA were not formed after incubation with LA and ALA, thus excluding
the involvement of prostaglandins in the observed effects (chapter 2).
Although the exact mechanism of GJIC inhibition is unclear, cytotoxicity probably
mediated by lipid peroxidation products seems to affect GJIC because incubation with
more polyunsaturated fatty acids (AA and EPA) completely abolished GJIC after only a
few days (chapter 2). The more polyunsaturated fatty acids AA (20:4n-6) and EPA
(20:5n-3) also inhibited proliferation of Caco-2 cells and increased cytotoxicity compared
to the longer chain fatty acids LA (18:2n-6) and ALA (18:3n-3) (chapter 3). This suggests

Chapter 7
158
that the number of double bonds in the carbon atom chain of fatty acids is more
important for the anti-proliferative and cytotoxic effects of n-6 and n-3 PUFAs on colon
tumor cells than the place of the double bond.
PUFAs with methylene-interrupted double bonds, such as AA and EPA, are highly
susceptible to enzymatic and non-enzymatic peroxidation. Peroxidation products of
PUFAs may have played an important role in the AA and EPA-induced anti-proliferative
and cytotoxic effects, because levels of malondialdehyde (MDA), which is an end product
of lipid peroxidation, were increased after incubation of Caco-2 cells with AA and EPA.
Addition of antioxidants, such as vitamin E reduced MDA formation in Caco-2 cells and
also partially reversed the cell proliferation inhibiting effects of both AA and EPA (chapter
3). In addition, indomethacin, a COX enzyme inhibitor that clearly inhibited AA-induced
PGE2 synthesis in Caco-2 cells, also partially reversed the anti-proliferative effects of both
AA and EPA. Furthermore, induction of COX-2 expression and PGE2 synthesis in HT-29
cells by IL-1β did not result in an increased cell proliferation but rather caused a decrease
in cell proliferation and an induction of cytotoxicity by both AA and EPA. Both results
suggest that besides spontaneous oxidation, the inhibitory effects of AA and EPA on cell
proliferation found in the in vitro studies (chapter 3) could also be due to peroxidation
products, generated during the peroxidase activity of the COX enzyme.
The in vivo study, described in chapter 4, reveals that high fat fish oil (HFFO) diets with a
high amount of EPA inhibit the initiation of AOM-induced colonic aberrant crypt foci
(ACF; precursor lesions of colon cancer) compared to high fat corn oil (HFCO) diets with
a high amount of LA, when fed during both the initiation and postinitiation stages of
colorectal carcinogenesis. This chemopreventive effect could possibly also be related to
higher levels of oxidative stress caused by HFFO diets. Levels of MDA, which is a marker
of oxidative stress, were increased in livers (chapter 4+5) and faeces (chapter 4) of
HFFO fed F344 rats compared to HFCO fed rats, which proves that HFFO diets can
indeed cause an increase in tissue levels of lipid peroxidation. Also lower levels of
vitamin E were found in the plasma of HFFO fed rats compared to HFCO fed rats
(chapter 5), possibly because of higher vitamin E consumption to protect the HFFO fed
rats against the increased levels of oxidative stress caused by these diets. Fish oil is an
oxidative stress-causing factor that also enhanced the activity of the antioxidant enzyme
catalase to defend against the increased levels of oxidative stress that were e.g. found in
the liver (chapter 5).
HFFO diet induced-oxidative stress is probably also involved in signal transduction and
the regulation of gene expression via redox-sensitive mechanisms. Mechanisms
responsible for the induction of antioxidant genes in response to oxidative stress are
mediated via an antioxidant-responsive element (ARE), also known as electrophile-

Summary and general discussion
159
responsive element (EpRE). Functional EpRE/ARE sequences have been identified in
glutathione S-transferase Ya (GSTYa), glutathione S-transferase P1 (GSTP1),
NAD(P)H:quinone oxidoreductase (NQO1), γ-glutamylcysteine synthetase heavy and
light chain subunit, heme oxygenase (HO), thioredoxin, NF-E2-related factor 2 (Nrf2),
ferritin heavy and light chain and metallothionein (1,2). From these genes, ferritin and
metallothionein, but also peroxiredoxin 2, NQO1 and GSTP1 were significantly
upregulated by fish oil feeding compared with corn oil feeding (chapter 5). Also the in
vitro study, described in chapter 6, demonstrates that antioxidant genes, such as
metallothioneins and NADH dehydrogenase (ubiquinone) 1 beta subcomplex 3, which is
a subunit of NQO1, are significantly upregulated by higher levels of PUFAs (20 µM). Also
repair mechanisms such as heat shock proteins that renature damaged proteins or
resolubilize aggregates of damaged proteins and the proteasome, that recognizes and
degrades oxidatively damaged proteins (3) are significantly upregulated in Caco-2 cells
after incubation with n-3 and n-6 PUFAs (chapter 6). Induction of antioxidant and stress
proteins in both the in vivo and in vitro studies could be considered as an adaptive
response to the increased oxidative stress, i.e. a cytoprotective function.
If the oxidant dose is however large enough and antioxidants and repair proteins are not
able anymore to sufficiently protect against the oxidative stress-induced cytotoxicity,
proliferation of for example colon cells may become inhibited or apoptosis induced to
prevent clonal expansion and stimulate disposal of damaged colonic epithelial cells (4).
The transcriptomics experiments revealed that genes involved in growth control
pathways such as cell proliferation and apoptosis are indeed modulated by HFFO diets
(chapter 5) as well as by single PUFAs in the in vitro experiments (chapter 6). For
example histone 2b, a gene whose expression has been associated with cellular
proliferation (5) is significantly decreased in the normal rat colon after fish oil feeding.
Lower mRNA levels of histone 2b might imply that the cellular proliferation is indeed
decreased in the colonic epithelium of HFFO fed rats compared to HFCO fed rats. A
gene involved in the induction of apoptosis is caspase 5. This pro-apoptotic gene is
upregulated by 10 and 20 µM LA, AA and EPA after 48 hours of incubation in human
colon adenocarcinoma Caco-2 cells.
Although the oxidative stress related hypothesis is still speculative and only a few genes
in these pathways were differentially expressed, the transcriptomics results do reveal that
genes involved in oxidative stress and cell growth pathways are indeed modulated in the
in vivo as well as the in vitro microarray studies. Overall, the results might imply that n-3
PUFAs could protect against colon carcinogenesis via increased levels of oxidative stress
that can ultimately lead to higher levels of apoptosis and decreased levels of cell
proliferation in for example the colonic epithelium.
Chapter 7
160
7.2 General discussion
Fatty acids from the diet are absorbed in the small intestine in the form of mixed micelles
and transported via the lymph into the plasma as chylomicrons (6). Consumption of
HFFO diets can in this way lead to increased levels of EPA and DHA in the plasma,
whereas consumption of HFCO diets can lead to increased plasma levels of LA and AA.
Plasma phospholipids and triglycerides can be hydrolyzed by the enzyme lipoprotein
lipase which enables free fatty acids to enter target cells through membrane-associated
fatty acid transporters. In this way basolateral free fatty acids can be taken up by colon
cells, but also other organs such as liver, breast, heart, brain, prostate, lung and adipose
tissue (7,8), where they can influence important body processes. Besides the protective
effects of n-3 PUFAs on colorectal carcinogenesis (the subject of this thesis), it is
published that consumption of n-3 PUFAs may also contribute to a lower risk of breast
cancer, prostate cancer and liver cancer (9,10,11). Also anti-inflammatory, anti-
thrombotic, anti-arrhythmic, hypolipidemic and vasodilatory properties of n-3 PUFAs
have been described (12).
It was generally believed that n-3 PUFAs as well as nonsteroidal anti-inflammatory drugs
(NSAIDs) protect against colorectal carcinogenesis through inhibition of COX-mediated
PGE2 synthesis. However, our results and those of others (13,14) question the dominant
role of PGE2 in the colon cancer inhibiting effects of n-3 PUFAs. Also recent studies on
selective COX-2 inhibitors demonstrated that much higher doses of these compounds
were required to achieve inhibition of colon tumor cell growth than to inhibit PGE2
production (15). New insights reveal that NSAIDs as well as n-3 fatty acids can act via
prostaglandin-independent pathways for example by direct activation of the peroxisome
proliferator-activated receptor-γ (PPARγ) (15). PPARγ is expressed in rodent colon
tumors (16) and in selected colon cancer cell lines including HT-29 (15), HCA-7 (17) and
Caco-2 (18) and selective PPARγ ligands have been shown to cause growth inhibiting
and apoptosis-inducing effects both in vitro and in vivo (10,19). Another potential
mechanism of the chemopreventive effects of NSAIDs not related to a reduction in
prostaglandins is related to an elevation of free AA in the medium. Chan et al. (20) have
shown that NSAID treatment of colon tumor cells results in a dramatic increase in free AA
that in turn stimulates the conversion of sphingomyelin to ceramide, a known mediator
of apoptosis. This could also be a possible reason for the AA-induced inhibition of Caco-
2 cell growth, found in our studies.
However, the findings described above are based on mechanistic studies in colon cancer
cell lines. Lack of interaction in vitro with other cell systems and systemic effects involved
in the process of carcinogenesis could lead to oversimplification of the observed effects.
Cutler et al. (17) for example have demonstrated that PGI2, another COX-mediated
Summary and general discussion
161
prostaglandin, produced by fibroblast cells in the colonic stroma, promotes survival of
surrounding colonic epithelial cells through PPARδ. Chapple et al. (21) have shown that
COX-2 is predominantly expressed in macrophages within colorectal adenomas. Also
besides PGE2 and PGE3, AA and EPA can be metabolized by COX into various
prostaglandins, thromboxanes and leukotrienes, collectively called eicosanoids. These
eicosanoids possess a broad spectrum of biological activities. For example, AA can be
metabolized to leukotriene B4, which has considerable inflammatory potential, while EPA
is metabolized to leukotriene B5, which is one to two orders of magnitude less
inflammatory (6). Also PGI2 and TXA2 which are primarily synthesized by vascular
endothelial cells have important roles in cancer biology because they are involved in
tumor cell-vascular endothelial cell and tumor cell-platelet interactions (8). Overall, these
observations reveal that oxidative metabolism of AA and EPA by the cyclooxygenase
pathway can lead to a variety of intercellular and intracellular signals and suggest that
COX-2 mediated paracrine signaling between other cell types in the colon such as
macrophages, endothelial cells or fibroblasts, and colonic epithelial cells could also play
an important role in the colon cancer modulating effects of n-6 and n-3 PUFAs.
Furthermore our results suggest that lipid peroxidation-induced oxidative stress which
could lead to higher levels of apoptosis and decreased levels of colonic cell proliferation
could be an important pathway for the anti-colon carcinogenic effects of PUFAs. HFFO
diets with a high amount of EPA increased lipid peroxidation compared to HFCO diets
with a high amount of LA, not only locally in the colon, as measured by feacal levels of
MDA, but also in other organs such as the liver. In this respect it is interesting to note that
other in vivo studies (22,23,24) have shown that the addition of vitamin E to the diet
diminishes the anticancer effects of n-3 PUFAs in mice bearing mammary tumor or lung
carcinoma, suggesting that in vivo oxidation of n-3 PUFAs also underlies the
chemopreventive effects in other types of cancer.
In summary, the oxidative stress related pathway seems to be more important for the
anti-colon carcinogenic effects of n-3 PUFAs than modulation of PGE2 synthesis.
However, complete understanding of the molecular, cellular and biochemical
mechanisms of the adverse and beneficial effects of n-6 and n-3 PUFAs on the multistage
process of colorectal carcinogenesis seems to be a lot more complicated.
7.3 Implications of n-3 PUFA consumption for humans
Epidemiological studies have also suggested an inverse relation between fish and n-3
PUFA intake and the risk of colorectal carcinogenesis. Migration studies have shown that
the low mortality rates from colon cancer in Japan increase when Japanese migrate to
Chapter 7
162
the US and adapt to a Western diet, which contains for example higher levels of n-6
PUFAs, such as linoleic acid. Like Japanese, also Eskimos have a relatively low incidence
of colon cancer (25). Both populations consume large quantities of n-3 PUFAs (1-3 gram
per day) due to a high intake of marine foods, including fish, whereas the average
consumption of n-3 PUFAs in Western countries is only 100 mg per day (26). The rats in
our in vivo experiments also received daily high amounts of fish oil (20%) for 8 weeks,
which provided about 0.24 gram EPA and 0.17 gram DHA per 100-200 gram rat per
day. It must be recognized that these large intakes, adjusted to the weight of humans, do
not reflect a human Western diet, although they could be consumed by the use of fish oil
supplements. Reddy and Sugie (27) revealed though that also lower amounts of n-3
PUFAs in high-fat diets (only 5.9% of Menhaden fish oil in combination with 17.6% corn
oil) are effective in inhibition of incidence as well as multiplicity of adenocarcinomas in
the rat colon.
Data on the role of n-3 PUFA intake in the etiology of human colorectal cancer are
however inconclusive. In a study of Hursting et al. (28), fish n-3 PUFAs showed a
negative association, although not-significant, with the incidence of cancers of the breast,
prostate, lung, cervix and colon. Terry et al. (29) on the other hand found no clear
association between specific fatty acids, such as α-linolenic acid, EPA, DHA or the sum
of n-6 fatty acids or n-3 fatty acids and the development of colorectal cancer in Sweden.
Daily consumption of n-3 PUFAs (EPA + DHA) seems however to be very low in this
study (EPA: 0.03-0.09 gram / DHA: 0.08-0.18 gram) (29) when compared to the daily
intake of n-3 PUFAs in Japanese female dietitians (EPA: 0.19-0.49 gram / DHA: 0.36 -
0.87 gram) (30). The low level of n-3 PUFA intake in the Swedish study was probably
insufficient to exert anti-colon carcinogenic effects and may have caused the negative
results in their study. The efficacy of dietary n-3 PUFAs may depend on the levels of n-6
PUFAs that are also found in mixed diets and may account for some of the variability of
results observed among studies using human subjects (31). Bartram et al. (32,33) clearly
demonstrated that the dietary n-6/n-3 ratio is indeed an important determinant of the
beneficial effects of n-3 PUFAs on colorectal carcinogenesis. Two human studies were
carried out in which fish oil supplementation (4.4 gram / day) was given in order to
suppress rectal epithelial cell proliferation and PGE2 synthesis. This was only achieved
when the dietary n-6/n-3 ratio was 2.5/1 but not with the same absolute level of fish oil
intake and an n-6/n-3 ratio of 4/1.
The Dutch Health Council (2001) has advised an average daily intake of 0.2 gram n-3
PUFAs, which can be provided by consumption of one portion of fatty fish, such as
herring or mackerel per week. These levels should be adequate to decrease the risk of
Summary and general discussion
163
cardiovascular diseases. It can however not be excluded that a higher intake of n-3
PUFAs is necessary to profit from the beneficial effects on colorectal carcinogenesis.
If oxidative stress is indeed involved in the anti-colon carcinogenic effects of n-3 PUFAs
in HFFO diets, as already seems reasonable from the results of our studies and others
(22,23,24), this would implicate that attention should be paid to the amount of
antioxidants that are also consumed in addition to HFFO diets. So, in contrary to the
reported beneficial protective effects of vitamin E on colon cancer (34), controversial
results are observed upon antioxidant supplementation and the anticancer activity of n-3
PUFAs (22,23).
In summary, human diets enriched with high levels of n-3 PUFAs may have beneficial
colon cancer inhibiting effects, in particular when containing only basal essential amounts
of n-6 PUFAs and antioxidants, such as vitamin E or C.
Chapter 7
164
References
1. Pietsch, E.C., Chan J.Y., Torti F.M. and Torti S.V. (2003) Nrf2 mediates the
induction of ferritin H in response to xenobiotics and cancer chemopreventive
dithiolethiones. J Biol Chem, 278, 2361-9.
2. Sato, M. and Kondoh M. (2002) Recent studies on metallothionein: protection
against toxicity of heavy metals and oxygen free radicals. Tohoku J Exp Med,
196, 9-22.
3. Boelsterli, U.A. (2003) Xenobiotic-induced oxidative stress: cell injury, signaling,
and gene regulation, Mechanistic toxicology: the molecular basis of how chemicals
disrupt biological targets. Taylor & Francis, London and New York.
4. Aw, T.Y. (1999) Molecular and cellular responses to oxidative stress and changes
in oxidation-reduction imbalance in the intestine. Am J Clin Nutr, 70, 557-65.
5. Thompson, C.B., Challoner P.B., Neiman P.E. and Groudine M. (1985) Levels of
c-myc oncogene mRNA are invariant throughout the cell cycle. Nature, 314, 363-
6.
6. Gurr, M. (1996) Fats. In Garrow, J.S. and James, W.P.T. (eds), Human Nutrition
and Dietetics. (nine edn). Churchill Livingstone, London, pp. 77-102.
7. Jump, D.B. and Clarke S.D. (1999) Regulation of gene expression by dietary fat.
Annu Rev Nutr, 19, 63-90.
8. Rose, D.P. and Connolly J.M. (1999) Omega-3 fatty acids as cancer
chemopreventive agents. Pharmacol Ther, 83, 217-44.
9. de Deckere, E.A. (1999) Possible beneficial effect of fish and fish n-3
polyunsaturated fatty acids in breast and colorectal cancer. Eur J Cancer Prev, 8,
213-21.
10. Terry, P.D., Rohan T.E. and Wolk A. (2003) Intakes of fish and marine fatty acids
and the risks of cancers of the breast and prostate and of other hormone-related
cancers: a review of the epidemiologic evidence. Am J Clin Nutr, 77, 532-43.
11. Lii, C.K., Ou C.C., Liu K.L., Liu J.Y., Lin W.L. and Chen H.W. (2000)
Suppression of altered hepatic foci development by a high fish oil diet compared
with a high corn oil diet in rats. Nutr Cancer, 38, 50-9.
12. Simopoulos, A.P. (1999) Essential fatty acids in health and chronic disease. Am J
Clin Nutr, 70, 560S-569S.
13. Boudreau, M.D., Sohn K.H., Rhee S.H., Lee S.W., Hunt J.D. and Hwang D.H.
(2001) Suppression of tumor cell growth both in nude mice and in culture by n-3
polyunsaturated fatty acids: mediation through cyclooxygenase-independent
pathways. Cancer Res, 61, 1386-91.
Summary and general discussion
165
14. McEntee, M.F. and Whelan J. (2002) Dietary polyunsaturated fatty acids and
colorectal neoplasia. Biomed Pharmacother, 56, 380-7.
15. Yamazaki, R., Kusunoki N., Matsuzaki T., Hashimoto S. and Kawai S. (2002)
Selective cyclooxygenase-2 inhibitors show a differential ability to inhibit
proliferation and induce apoptosis of colon adenocarcinoma cells. FEBS Lett,
531, 278-84.
16. DuBois, R.N., Gupta R., Brockman J., Reddy B.S., Krakow S.L. and Lazar M.A.
(1998) The nuclear eicosanoid receptor, PPARgamma, is aberrantly expressed in
colonic cancers. Carcinogenesis, 19, 49-53.
17. Cutler, N.S., Graves-Deal R., LaFleur B.J., Gao Z., Boman B.M., Whitehead
R.H., Terry E., Morrow J.D. and Coffey R.J. (2003) Stromal production of
prostacyclin confers an antiapoptotic effect to colonic epithelial cells. Cancer Res,
63, 1748-51.
18. Wachtershauser, A., Loitsch S.M. and Stein J. (2000) PPAR-gamma is selectively
upregulated in Caco-2 cells by butyrate. Biochem Biophys Res Commun, 272,
380-5.
19. Lee, J.Y. and Hwang D.H. (2002) Docosahexaenoic acid suppresses the activity
of peroxisome proliferator- activated receptors in a colon tumor cell line. Biochem
Biophys Res Commun, 298, 667-74.
20. Chan, T.A., Morin P.J., Vogelstein B. and Kinzler K.W. (1998) Mechanisms
underlying nonsteroidal antiinflammatory drug-mediated apoptosis. Proc Natl
Acad Sci USA, 95, 681-6.
21. Chapple, K.S., Cartwright E.J., Hawcroft G., Tisbury A., Bonifer C., Scott N.,
Windsor A.C., Guillou P.J., Markham A.F., Coletta P.L. and Hull M.A. (2000)
Localization of cyclooxygenase-2 in human sporadic colorectal adenomas. Am J
Pathol, 156, 545-53.
22. Yam, D., Peled A. and Shinitzky M. (2001) Suppression of tumor growth and
metastasis by dietary fish oil combined with vitamins E and C and cisplatin.
Cancer Chemother Pharmacol, 47, 34-40.
23. Cognault, S., Jourdan M.L., Germain E., Pitavy R., Morel E., Durand G.,
Bougnoux P. and Lhuillery C. (2000) Effect of an alpha-linolenic acid-rich diet on
rat mammary tumor growth depends on the dietary oxidative status. Nutr Cancer,
36, 33-41.
24. Hardman, W.E., Munoz J., Jr. and Cameron I.L. (2002) Role of lipid peroxidation
and antioxidant enzymes in omega 3 fatty acids induced suppression of breast
cancer xenograft growth in mice. Cancer Cell Int, 2, 10.
Chapter 7
166
25. Woutersen, R.A., Appel M.J., van Garderen-Hoetmer A. and Wijnands M.V.
(1999) Dietary fat and carcinogenesis. Mutat Res, 443, 111-27.
26. Hong, M.Y., Lupton J.R., Morris J.S., Wang N., Carroll R.J., Davidson L.A., Elder
R.H. and Chapkin R.S. (2000) Dietary fish oil reduces O6-methylguanine DNA
adduct levels in rat colon in part by increasing apoptosis during tumor initiation.
Cancer Epidemiol Biomarkers Prev, 9, 819-26.
27. Reddy, B.S. and Sugie S. (1988) Effect of different levels of omega-3 and omega-
6 fatty acids on azoxymethane-induced colon carcinogenesis in F344 rats. Cancer
Res, 48, 6642-7.
28. Hursting, S.D., Thornquist M. and Henderson M.M. (1990) Types of dietary fat
and the incidence of cancer at five sites. Prev Med, 19, 242-53.
29. Terry, P., Bergkvist L., Holmberg L. and Wolk A. (2001) No association between
fat and fatty acids intake and risk of colorectal cancer. Cancer Epidemiol
Biomarkers Prev, 10, 913-4.
30. Tokudome, S., Imaeda N., Tokudome Y., Kuriki K., Cheng J., Fujii T., Goto C.,
Nagaya T., Ichikawa H. and Okuyama H. (2002) Correspondence re: Terry et al.,
No association between fat and fatty acids intake and risk of colorectal cancer.
Cancer Epidemiol Biomarkers Prev, 11, 217-218.
31. Whelan, J. (1996) Antagonistic effects of dietary arachidonic acid and n-3
polyunsaturated fatty acids. J Nutr, 126, 1086S-91S.
32. Bartram, H.P., Gostner A., Scheppach W., Reddy B.S., Rao C.V., Dusel G.,
Richter F., Richter A. and Kasper H. (1993) Effects of fish oil on rectal cell
proliferation, mucosal fatty acids, and prostaglandin E2 release in healthy
subjects. Gastroenterology, 105, 1317-22.
33. Bartram, H.P., Gostner A., Reddy B.S., Rao C.V., Scheppach W., Dusel G.,
Richter A., Richter F. and Kasper H. (1995) Missing anti-proliferative effect of fish
oil on rectal epithelium in healthy volunteers consuming a high-fat diet: potential
role of the n- 3:n-6 fatty acid ratio. Eur J Cancer Prev, 4, 231-7.
34. Shivapurkar, N., Tang Z., Frost A. and Alabaster O. (1995) Inhibition of
progression of aberrant crypt foci and colon tumor development by vitamin E and
beta-carotene in rats on a high-risk diet. Cancer Lett, 91, 125-32.

Nederlandse samenvatting
167
Nederlandse samenvatting

Nederlandse samenvatting
168
Samenvatting van de resultaten
Eerder uitgevoerde wetenschappelijke onderzoeken suggereren dat zowel modulatie van
cyclooxygenase (COX)-gemedieerde synthese van prostaglandine E2 (PGE2) als lipide
peroxidatie-geïnduceerde oxidatieve stres een rol kunnen spelen in de remming van
colonkanker door n-3 meervoudig onverzadigde vetzuren (MOV). Het exacte
werkingsmechanisme waarop n-3 vetzuren colonkanker kunnen voorkomen of remmen
ten opzichte van n-6 vetzuren is echter tot op heden nog niet goed bekend. Het doel van
dit promotieonderzoek was daarom de cellulaire, biochemische en moleculaire
mechanismen van de gunstige effecten van n-3 MOV en de nadelige effecten van n-6
MOV op de ontwikkeling van colorectaal kanker te onderzoeken, met speciale aandacht
voor PGE2 en de oxidatieve stres respons.
Effecten van n-6 en n-3 meervoudig onverzadigde vetzuren op PGE2 synthese
en celproliferatie
Het n-6 vetzuur arachidonzuur (AA; 20:4n-6) is het precursor vetzuur van de
prostaglandines van de 2-serie, zoals PGE2. In hoofdstuk 3 van dit proefschrift staan
experimenten beschreven waaruit blijkt dat humane coloncarcinoma Caco-2 cellen, die
veel COX-2 tot expressie brengen, PGE2 kunnen produceren na blootstelling aan AA.
HT-29 coloncarcinoma cellen produceren daarentegen bijna geen PGE2 onder dezelfde
condities. De PGE2 synthese kan echter wel geïnduceerd worden in deze cellijn door
toevoeging van IL-1β, een cytokine waarvan bekend is dat het de COX-2 expressie kan
verhogen. Het gegeven dat linolzuur (LA; 18:2n-6) de PGE2 productie in zowel Caco-2
als HT-29 cellen niet kan verhogen is in overeenstemming met het feit dat linolzuur, de
voorloper van de n-6 vetzuurfamilie niet omgezet wordt in de prostaglandine precursor
arachidonzuur in deze humane coloncarcinoma cellijnen (zie hoofdstuk 2).
Het n-3 vetzuur eicosapentaeenzuur (EPA; 20:5n-3) is het precursor vetzuur van de
prostaglandines van de 3-serie, zoals PGE3. EPA en AA kunnen competitie aangaan voor
COX enzymactiviteit omdat ze beide substraten zijn voor de prostaglandine synthese. In
hoofdstuk 3 staan experimenten beschreven waaruit blijkt dat EPA de AA-geïnduceerde
PGE2 synthese competatief remt in Caco-2 cellen. De dierproeven die beschreven staan
in zowel hoofdstuk 4 als hoofdstuk 5 laten ook zien dat hoog vet visolie diëten met een
hoog gehalte aan EPA resulteren in lagere hoeveelheden PGE2 in het bloedplasma van
F344 ratten, vergeleken met hoog vet maisolie diëten met een hoog gehalte aan
linolzuur.
Om de hypothese te kunnen onderzoeken dat n-3 MOV zoals EPA de groei van colon-
tumorcellen kunnen remmen via remming van AA-geïnduceerde PGE2 synthese zijn de
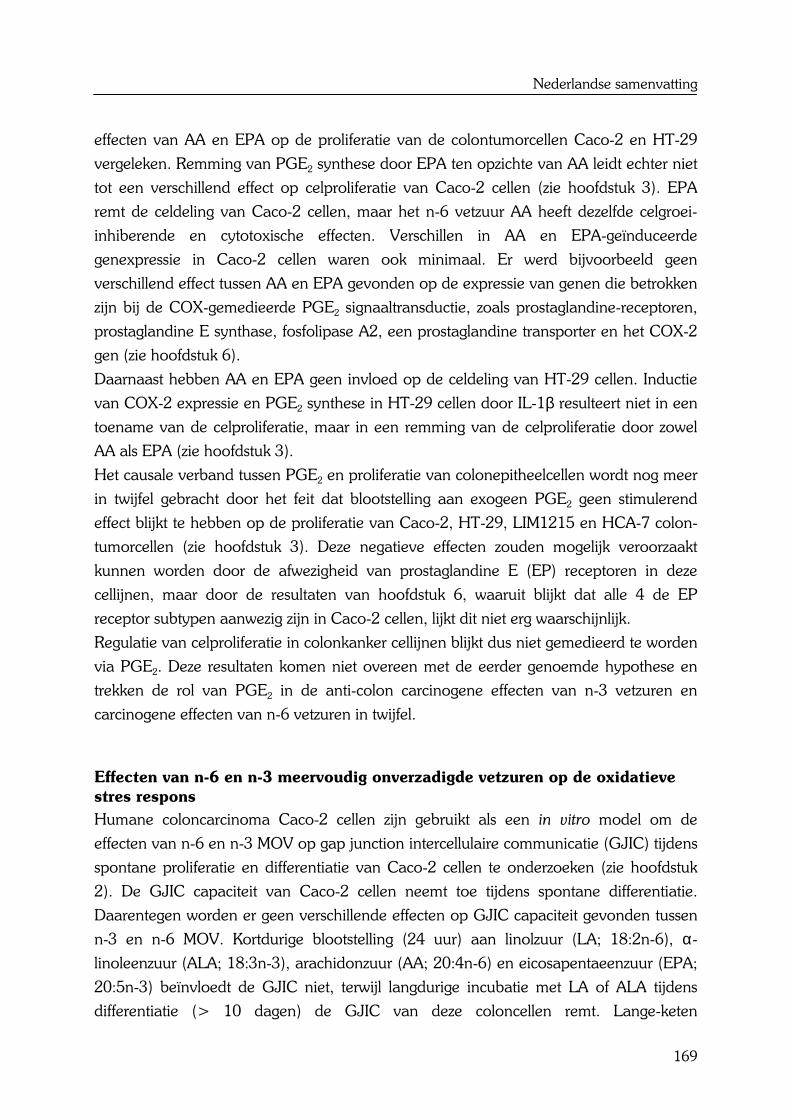
Nederlandse samenvatting
169
effecten van AA en EPA op de proliferatie van de colontumorcellen Caco-2 en HT-29
vergeleken. Remming van PGE2 synthese door EPA ten opzichte van AA leidt echter niet
tot een verschillend effect op celproliferatie van Caco-2 cellen (zie hoofdstuk 3). EPA
remt de celdeling van Caco-2 cellen, maar het n-6 vetzuur AA heeft dezelfde celgroei-
inhiberende en cytotoxische effecten. Verschillen in AA en EPA-geïnduceerde
genexpressie in Caco-2 cellen waren ook minimaal. Er werd bijvoorbeeld geen
verschillend effect tussen AA en EPA gevonden op de expressie van genen die betrokken
zijn bij de COX-gemedieerde PGE2 signaaltransductie, zoals prostaglandine-receptoren,
prostaglandine E synthase, fosfolipase A2, een prostaglandine transporter en het COX-2
gen (zie hoofdstuk 6).
Daarnaast hebben AA en EPA geen invloed op de celdeling van HT-29 cellen. Inductie
van COX-2 expressie en PGE2 synthese in HT-29 cellen door IL-1β resulteert niet in een
toename van de celproliferatie, maar in een remming van de celproliferatie door zowel
AA als EPA (zie hoofdstuk 3).
Het causale verband tussen PGE2 en proliferatie van colonepitheelcellen wordt nog meer
in twijfel gebracht door het feit dat blootstelling aan exogeen PGE2 geen stimulerend
effect blijkt te hebben op de proliferatie van Caco-2, HT-29, LIM1215 en HCA-7 colon-
tumorcellen (zie hoofdstuk 3). Deze negatieve effecten zouden mogelijk veroorzaakt
kunnen worden door de afwezigheid van prostaglandine E (EP) receptoren in deze
cellijnen, maar door de resultaten van hoofdstuk 6, waaruit blijkt dat alle 4 de EP
receptor subtypen aanwezig zijn in Caco-2 cellen, lijkt dit niet erg waarschijnlijk.
Regulatie van celproliferatie in colonkanker cellijnen blijkt dus niet gemedieerd te worden
via PGE2. Deze resultaten komen niet overeen met de eerder genoemde hypothese en
trekken de rol van PGE2 in de anti-colon carcinogene effecten van n-3 vetzuren en
carcinogene effecten van n-6 vetzuren in twijfel.
Effecten van n-6 en n-3 meervoudig onverzadigde vetzuren op de oxidatieve
stres respons
Humane coloncarcinoma Caco-2 cellen zijn gebruikt als een in vitro model om de
effecten van n-6 en n-3 MOV op gap junction intercellulaire communicatie (GJIC) tijdens
spontane proliferatie en differentiatie van Caco-2 cellen te onderzoeken (zie hoofdstuk
2). De GJIC capaciteit van Caco-2 cellen neemt toe tijdens spontane differentiatie.
Daarentegen worden er geen verschillende effecten op GJIC capaciteit gevonden tussen
n-3 en n-6 MOV. Kortdurige blootstelling (24 uur) aan linolzuur (LA; 18:2n-6), α-
linoleenzuur (ALA; 18:3n-3), arachidonzuur (AA; 20:4n-6) en eicosapentaeenzuur (EPA;
20:5n-3) beïnvloedt de GJIC niet, terwijl langdurige incubatie met LA of ALA tijdens
differentiatie (> 10 dagen) de GJIC van deze coloncellen remt. Lange-keten

Nederlandse samenvatting
170
metabolieten van LA en ALA zoals AA en EPA worden niet gevormd na blootstelling aan
LA en ALA. Het kan daarom worden uitgesloten dat prostaglandines een rol hebben
gespeeld in de waargenomen effecten van zowel LA als ALA op de GJIC (zie hoofdstuk
2).
Alhoewel het precieze mechanisme van GJIC remming bij langdurige blootstelling van
Caco-2 cellen aan LA en ALA onduidelijk is, lijkt het waarschijnlijk dat cytotoxiciteit,
vermoedelijk gemedieerd door vetzuuroxidatie producten, een rol speelt omdat
blootstelling aan vetzuren met meerdere dubbele bindingen in de koolstofketen zoals AA
en EPA de GJIC capaciteit van Caco-2 cellen al na een paar dagen volledig remt (zie
hoofdstuk 2). De meervoudig onverzadigde vetzuren AA en EPA remmen ook de
proliferatie van Caco-2 cellen en verhogen de cytotoxiciteit ten opzichte van de langere
keten vetzuren LA (18:2n-6) en ALA (18:3n-3) (zie hoofdstuk 3). Dit suggereert dat het
aantal dubbele bindingen in de koolstofketen van vetzuren belangrijker is voor de anti-
proliferatieve en cytotoxische effecten op colontumorcellen dan de plaats van de dubbele
binding in de koolstofketen.
MOV zoals AA en EPA zijn erg gevoelig voor enzymatisch- en niet-enzymatisch-
geïnduceerde vetzuuroxidatie. Peroxidatieprodukten van MOV hebben waarschijnlijk
een belangrijke rol gespeeld in AA en EPA-geïnduceerde anti-proliferatieve en
cytotoxische effecten, omdat malondialdehyde (MDA), één van de eindprodukten van
vetzuuroxidatie, verhoogd is in Caco-2 cellen na blootstelling aan AA en EPA. Simultane
blootstelling aan MOV en antioxidanten, zoals vitamine E, vermindert de MDA vorming
in Caco-2 cellen. Ook de celgroei remmende effecten van zowel AA als EPA worden
gedeeltelijk opgeheven door co-incubatie van vetzuren met antioxidanten (zie hoofdstuk
3). Daarnaast heeft blootstelling aan indomethacine (IM), een COX enzym-remmer die
de AA-geïnduceerde PGE2 synthese in Caco-2 cellen duidelijk remt, ook tot gevolg dat
de anti-proliferatieve effecten van zowel AA en EPA gedeeltelijk worden opgeheven.
Verder resulteert verhoging van de COX-2 expressie en PGE2 synthese in HT-29 cellen
door toevoeging van IL-1β niet in een toename van de proliferatie, maar wordt de
celproliferatie juist geremd en neemt de cytotoxiciteit van zowel AA als EPA toe. Beide
resultaten suggereren dat naast spontane vetzuuroxidatie, de remmende effecten van AA
en EPA op de groei van colontumorcellen ook veroorzaakt kunnen worden door
peroxidatieprodukten die gegenereert worden tijdens COX activatie.
De dierproef die beschreven staat in hoofdstuk 4 laat zien dat hoog vet visolie diëten
(HFFO) met een hoog gehalte aan EPA de initiatie van AOM-geïnduceerde aberrante
crypt foci (ACF; beginstadium van colonkanker) in het colon kunnen remmen ten
opzichte van hoog vet maisolie diëten met een hoog gehalte aan LA, wanneer deze
diëten gevoerd worden tijdens de initiatie- en postinitiatie fase in de ontwikkeling van

Nederlandse samenvatting
171
colonkanker. Dit beschermende effect van HFFO diëten op colonkanker wordt mogelijk
ook veroorzaakt door een hoger gehalte aan oxidatieve stres. De hoeveelheid MDA, een
indicator van de hoeveelheid oxidatieve stres in het lichaam, is namelijk verhoogd in de
lever (zie hoofdstuk 4+5) en de ontlasting (zie hoofdstuk 4) van HFFO gevoerde F344
ratten ten opzichte van HFCO gevoerde ratten. Dit geeft aan dat HFFO diëten de
hoeveelheid vetzuuroxidatie in het lichaam inderdaad kunnen verhogen. Ook lagere
gehalten aan vitamine E in het plasma van HFFO gevoerde ratten kunnen er op duiden
dat HFFO gevoerde ratten meer vitamine E verbruikt hebben om zich te beschermen
tegen de hogere gehalten aan oxidatieve stres die door deze diëten veroorzaakt worden.
Ook de verhoogde activiteit van het antioxidant enzym catalase in de lever van HFFO
gevoerde ratten kan mogelijk toegeschreven worden aan de beschermende reactie tegen
deze hogere gehalten aan oxidatieve stres in onder andere de lever (zie hoofdstuk 5).
HFFO-geïnduceerde oxidatieve stres speelt waarschijnlijk ook een rol in signaal-
transductie en regulatie van genexpressie via redox-gevoelige mechanismen.
Mechanismen die verantwoordelijk zijn voor inductie van antioxidant genen als reactie
op oxidatieve stres worden gemedieerd via een antioxidant-responsief element (ARE),
ook wel een electrofiel-responsief element (EpRE) genoemd. Functionele EpRE/ARE
sequenties zijn aangetoond in glutathion S-transferase Ya (GSTYa), glutathion S-
transferase P1 (GSTP1), NAD(P)H:chinon oxidoreductase (NQO1), γ-glutamylcysteine
synthetase (de zware en de lichte subeenheid), heme oxygenase (HO), thioredoxine, NF-
E2-gerelateerde factor 2 (Nrf2), ferritine (zware en lichte keten) en metallothioneïnes.
Van deze genen zijn naast ferritine en metallothioneïne, ook peroxiredoxine 2, NQO1 en
GSTP1 significant verhoogd in rat colon epitheel na een hoog vet visolie dieet in
vergelijking tot een hoog vet maisolie dieet. Ook het Caco-2 genexpressie experiment
beschreven in hoofdstuk 6 laat zien dat de expressie van antioxidant genen zoals
metallothioneïnes en NADH dehydrogenase (ubichinon 1) beta subcomplex 3, wat een
onderdeel is van NQO1, significant verhoogd kan worden door hoge gehalten aan MOV
(20 µM). Ook herstelmechanismen zoals heat shock eiwitten die beschadigde eiwitten
herstellen of stukjes van beschadigde eiwitten opruimen en het proteasoom dat
oxidatieve schade aan eiwitten herkent en opruimt zijn significant verhoogd in Caco-2
cellen na blootstelling aan n-3 en n-6 MOV (zie hoofdstuk 6). Inductie van antioxidant-
en stres-eiwitten in zowel de in vitro als in vivo experimenten kan worden gezien als een
adaptatie aan de toegenomen hoeveelheid oxidatieve stres, met andere woorden een
soort celbeschermend vermogen.
Wanneer de hoeveelheid oxidatieve stres echter te groot wordt en antioxidanten en
hersteleiwitten niet langer voldoende bescherming bieden tegen de oxidatieve stres-
geïnduceerde cytotoxiciteit, kan de proliferatie van bijvoorbeeld coloncellen geremd

Nederlandse samenvatting
172
worden of de apoptose (geprogrammeerde celdood) verhoogd worden om op deze
manier verdere uitgroei van beschadigde cellen te voorkomen en dood en verwijdering
van deze cellen te stimuleren. De microarray experimenten laten zien dat genen die
betrokken zijn bij de regulering van celgroei en celdood inderdaad gemoduleerd worden
door HFFO diëten (zie hoofdstuk 5) en MOV in de celkweek-experimenten (zie
hoofdstuk 6). Bijvoorbeeld histon 2b, een gen dat betrokken is bij celproliferatie, is
significant verlaagd in de gezonde dikke darm van de rat na consumptie van visolie. Een
lager mRNA niveau van histon 2b kan impliceren dat de celdeling in het colonepitheel
van hoog vet visolie gevoerde ratten inderdaad lager is dan in hoog vet maisolie
gevoerde ratten. Een gen dat betrokken is bij de inductie van apoptose is bijvoorbeeld
caspase 5. Dit pro-apoptotisch gen wordt verhoogd door zowel 10 als 20 µM LA, AA en
EPA na 48 uur blootstelling in humane coloncarcinoma Caco-2 cellen.
Alhoewel de oxidatieve stres gerelateerde hypothese nog speculatief is en slechts van een
paar genen in dit proces de expressie verandert, geven de transcriptoom analyses wel
aan dat genen die een rol spelen bij oxidatieve stres en cel-groei en dood inderdaad
gemoduleerd worden in ratten en Caco-2 cellen.
Over het algemeen suggereren de resultaten dat n-3 vetzuren kunnen beschermen tegen
het ontstaan en de ontwikkeling van dikke darmkanker via verhoging van oxidatieve
stres, wat een verhoging van apoptose en een vermindering van de celproliferatie in het
colon tot gevolg kan hebben.

Curriculum Vitae and List of publications
173
Curriculum Vitae and List of publications

Curriculum Vitae
174
Curriculum Vitae
Yvonne Elizabeth Maria Dommels werd geboren op 18 juni 1975 te Geldrop. Na het
behalen van het VWO diploma op het Hertog Jan College te Valkenswaard in 1993, is ze
begonnen aan de studie Gezondheidswetenschappen (afstudeerrichting Biologische
Gezondheidkunde) aan de Universiteit van Maastricht. Tijdens deze studie heeft ze 2
stage onderzoeken verricht, waarvan de eerste is uitgevoerd in Maastricht op de afdeling
Humane Biologie in samenwerking met de afdeling Interne Geneeskunde van het
academisch ziekenhuis in Maastricht. Voor de tweede stage is ze 8 maanden naar Boston
(USA) geweest om onderzoek te doen op de afdeling Toxicologie van het Massachusetts
Institute of Technology. In augustus 1998 behaalde zij haar doctoraal diploma.
Vanaf november 1998 werd ze voor 4 maanden aangesteld bij TNO Voeding te Zeist om
het onderzoeksvoorstel voor haar promotieonderzoek te schrijven. Dit promotie-
onderzoek, beschreven in dit proefschrift, werd vanaf februari 1999 uitgevoerd bij de
leerstoelgroep Toxicologie van de Wageningen Universiteit in het kader van het TNO-
WUR Centrum voor Voedingstoxicologie. In dezelfde periode heeft Yvonne de
certificaten ‘Stralingshygiene, deskundigheidsniveau 5b’ en ‘Proefdierkunde op grond
van art.9 van de Wet op Proefdieren’ behaald. Daarnaast heeft ze enkele modules van
de Postdoctorale Opleiding Toxicologie gevolgd om voor erkenning als toxicoloog in
aanmerking te komen.
Sinds half augustus 2003 is Yvonne werkzaam als wetenschappelijk onderzoeker op het
Rikilt Instituut voor Voedselveiligheid in Wageningen, in de onderzoeksunit ‘Effects of
Food Bioactives’.
List of publications
175
List of publications
Yvonne E.M. Dommels, Gerrit M. Alink, Peter J. van Bladeren and Ben van Ommen.
(2002) Dietary n-6 and n-3 polyunsaturated fatty acids and colorectal carcinogenesis:
results of cultured colon cells, animal models and human studies. Environmental
Toxicology and Pharmacology, 12(4), 233-244
Yvonne E.M. Dommels, Gerrit M. Alink, Jozef P.H. Linssen and Ben van Ommen.
(2002) Effects of n-6 and n-3 polyunsaturated fatty acids on gap junctional intercellular
communication during spontaneous differentiation of the human colon adenocarcinoma
cell line Caco-2. Nutrition and Cancer, 42(1), 125-130
Yvonne E.M. Dommels, Merel M.G. Haring, Nynke G.M. Keestra, Gerrit M. Alink, Peter
J. van Bladeren and Ben van Ommen. (2003) The role of cyclooxygenase in n-6 and n-3
polyunsaturated fatty acid mediated effects on cell proliferation, PGE2 synthesis and
cytotoxicity in human colorectal carcinoma cell lines. Carcinogenesis, 24(3), 385-392
Yvonne E.M. Dommels, Suzanne Heemskerk, Hans van den Berg, Gerrit M. Alink, Peter
J. van Bladeren and Ben van Ommen. (2003) Effects of high fat fish oil and high fat corn
oil diets on initiation of AOM-induced colonic aberrant crypt foci in male F344 rats.
Accepted for publication in Food and Chemical Toxicology
Yvonne E.M. Dommels, Petra van den Hil, Jozef P.H. Linssen, Gerrit M. Alink, Peter J
van Bladeren and Ben van Ommen. (2003) High fat fish oil diets modulate expression of
genes involved in oxidative stress, cell growth, acute phase response and lipid
metabolism in normal rat colonic epithelium of male F344 rats. Submitted
Yvonne E.M. Dommels, Gerrit M. Alink, Peter J. van Bladeren and Ben van Ommen.
(2003) n-6 and n-3 polyunsaturated fatty acid-induced transcriptome changes in Caco-2
cells. In preparation
Rob Stierum, Marco Gaspari, Yvonne Dommels, Taoufik Quatas, Helma Pluk, Sonja
Jespersen, Jack Vogels, Kitty Verhoeckx, John Groten and Ben van Ommen. (2003)
Proteome analysis reveals novel proteins associated with proliferation and differentiation
of the colorectal cancer cell line Caco-2. Accepted for publication in Biochimica et
Biophysica Acta
List of publications
176
Harald Moonen, Yvonne Dommels, Marloes van Zwam, Marcel van Herwijnen, Gerrit
Alink, Jos Kleinjans and Theo de Kok. (2003) Effects of polyunsaturated fatty acids on
DNA adduct formation by heterocyclic aromatic amines in human adenocarcinoma
colon cells. Submitted
Abstracts
Yvonne Dommels, Gerrit Alink, Peter van Bladeren and Ben van Ommen. The Caco-2
cell line as an in vitro model to study the influence of n-6 and n-3 polyunsaturated fatty
acids on colorectal carcinogenesis. Proceedings of the scientific meeting of The
Netherlands Society of Toxicology, p38, Kerkrade, The Netherlands, 2000
Yvonne EM Dommels, Rob H Stierum, Marlou LPS van Iersel, Gerrit M Alink, Peter J
van Bladeren and Ben van Ommen. The Caco-2 cell line as an in vitro model to study
the influence of n-6 and n-3 polyunsaturated fatty acids on colorectal carcinogenesis. 91st
Annual Meeting of the American Association for Cancer Research, p343, AACR, San
Francisco, USA, 2000
Yvonne EM Dommels, Gerrit M Alink, Peter J van Bladeren and Ben van Ommen.
Colon cell lines as in vitro models to study the influence of n-6 and n-3 polyunsaturated
fatty acids on colorectal carcinogenesis. 7th International Conference on Eicosanoids &
other Bioactive Lipids in Cancer, Inflammation and Related Diseases, p108, Nashville,
Tennessee, USA, 2001
Yvonne EM Dommels, Gerrit M Alink, Peter J van Bladeren and Ben van Ommen.
Colon cell lines as in vitro models to study the influence of n-6 and n-3 polyunsaturated
fatty acids on colorectal carcinogenesis. Proceedings of the scientific meeting of The
Netherlands Society of Toxicology, p12, Nijmegen, The Netherlands, 2001
HJJ Moonen, YEM Dommels, M van Zwam, MHM van Herwijnen, GM Alink, IMCM
Rietjens, JCS Kleinjans and TMCM de Kok. Effects of polyunsaturated fatty acids on
DNA adduct formation by heterocyclic amines in HCA-7 cells. Proceedings of the
scientific meeting of The Netherlands Society of Toxicology, p19, De Bilt, The
Netherlands, 2003

Dankwoord
177
Dankwoord
Dankwoord
178
Dankwoord
Ja, en dan nu het laatste en waarschijnlijk meest gelezen hoofdstuk van mijn proefschrift.
Het boekje is af en dat geeft een erg goed gevoel. Ookal is het toch ook wel raar om er
na zo’n 4.5 jaar een punt achter te zetten. Dat geeft wel aan dat ik een ontzettend leuke
en leerzame tijd achter de rug heb, die ik voor geen goud zou hebben willen missen
(ondanks de dipjes die er heus wel waren !!). Ik wil daarom dan ook iedereen die heeft
bijgedragen aan de tot stand koming van dit boekje enorm bedanken. In het bijzonder
wil ik mijn promotor Peter van Bladeren noemen. Peter, in navolging op de goede
ervaringen met Marlou als Maastrichtse student heb jij mij aangenomen om in het
Wageningse AIO te worden. Bedankt voor deze mogelijkheid en bedankt voor je altijd
kritische noot, op het laatst zelfs nog regelmatig via de email vanuit Zwitserland. Ook wil
ik mijn copromotoren Ben van Ommen en Gerrit Alink noemen. Gerrit, bedankt voor je
relativeringsvermogen en de deur die altijd open stond, als ik het weer even niet zag
zitten en advies nodig had. Ben, je motto ‘maak je geen zorgen, alles komt goed’ is
inderdaad uitgekomen !! Het is nu echt tijd geworden om je werkelijk op TAART te
tracteren, je hebt het verdiend, bedankt. Speciaal aandacht gaat ook uit naar Ivonne
Rietjens. Vanaf de zijlijn heb jij altijd je vertrouwen in mij laten blijken, waardoor ik
gemotiveerd bleef om de klus te klaren.
Ik moest in het begin wel even wennen in Wageningen, maar alle mede-TOXers hebben
er toe bijgedragen dat ik me al snel erg ‘thuis’ voelde op de vakgroep. Marlou, bedankt
voor je hulp en steun bij het wegwijs worden op TOX. Eric, onze kamerdiscussies heb ik
erg gewaardeerd. Ook alle andere ex-(AIO)collega’s, Gerlienke, Simone, Daphne,
Carolien, Timo, Ilonka, Harry, Peter, Arno, Andrea, Astrid, Pim, Magda, Juliette en
Aukje, bedankt voor de gezelligheid. Ook mijn huidige collega’s Irene, Gré, Annemarie
(bedankt voor het inbinden van mijn leesversies en het vele stickeren van epjes), Bert,
Ineke, Jac, Liesbeth, Laura, Marelle (bedankt voor je chemdraw plaatjes), Hans (bedankt
voor je assistentie bij de dierproeven en het scoren van de ACF), Ans, Mieke, Bas, Letty
en Tinka, bedankt voor jullie hulp en adviezen, gezellige koffie-pauzes, kerstlunches en
labuitjes. Niet te vergeten ook mijn mede-AIOs bij TOX, Anne-Marie, Maaike, Hester,
Jelmer, Marjan (leuk dat je mijn paranimf wil zijn), Barry, Merijn, Suzanne en Marcel. Ik
zal de WE-day, bucket billy en de vrijdagmiddag borrels niet snel vergeten. Succes ook
met jullie boekje en nodigen jullie me nog een keer uit voor het jonge honden eten ?
Ook wil ik graag Jozef Linssen en Dirk Martens (WUR) en Theo de Kok en Harald
Moonen (UM) bedanken voor de prettige samenwerking en alle mensen van het CKP
voor alle hulp bij mijn dierproeven. Verder ook alle studenten die bij mij een
Dankwoord
179
afstudeervak gedaan hebben, super bedankt. Alina, Nynke, Joanne, Rianne, Pol, Petra,
Hester, Merel, Suzanne, Marloes, Jan, Frederik en Jaap, zonder jullie harde arbeid op het
lab had dit boekje nooit zo dik kunnen worden !!
Omdat mijn AIO-onderzoek deel uit maakte van het TNO/WUR Centrum voor
Voedselveiligheid was ik ook af en toe op TNO te vinden. Alle collega’s van ABMS,
bedankt voor de vele tips en suggesties die ik altijd bij jullie kon krijgen. In het bijzonder
wil ik het genomics-clubje bedanken voor de voor mij erg nuttige data-analyse
overleggen; Michelle, Marjan, Rob, Wilbert (voor je adviezen bij de data-analyse), Ana
(ik kom echt nog een keertje bij je op bezoek in Valencia), Ashwin, Anne, Marinus (voor
de normalisaties) en Cyrille (voor het gebruik mogen maken van ‘jouw’ lettertype). Naast
de collega’s van ABMS, maakten ook vele andere TNOers vaak tijd voor mij. Met naam
wil ik hierbij noemen Ruud (bedankt voor je hulp bij het schrijven van mijn
onderzoeksvoorstel), Marcel en Joost (jullie histologisch advies heb ik zeer gewaardeerd),
Marko (je advies over het maken van de proefdierdiëten kwam erg goed van pas), Karin
(bedankt voor het beoordelen van de vetcoupes). Ook Wouter en Robin, bedankt voor
de samenwerking en adviezen op het gebied van de oxidatieve stres metingen.
Naast alle collega’s wil ik natuurlijk ook al mijn vrienden en vriendinnen bedanken. Het
ski-clubje, Marjan, Annelies (leuk dat je mijn paranimf wil zijn), Pien, Isa en Janneke;
bedankt voor jullie interesse in mijn onderzoek en de vele gezellige telefoontjes en
ontspannende dagjes/weekendjes weg. Ariella, Annelieke en Harmke; bedankt voor het
sporten, eten en AIO-frustraties delen. Mariska, Irene en Martine; ik vind het heel
speciaal dat jullie nog steeds mijn vriendinnen zijn. Judith, Vanessa, Wendy, Martine en
Annemarie, leuk dat we nog steeds af en toe afspreken. HeeHallo, ik heb nu geen excuus
meer om niet mee op wintersport te gaan !! Het Maastrichtse DD en Desideratus, ik word
jullie eerste doctor, wie volgt ?? En natuurlijk ook mijn (ex)-huisgenoten in Wageningen
Bas, Erik, Bart, Christa, Alice en Harry, Jasperien, Elly, Stephen, Dolf, Nynke, Wijnand,
Alice en aanhang; door jullie ben ik me echt ‘thuis’ gaan voelen in Wageningen, bedankt
hiervoor.
Lieve Papa, Mama, Marianne en Stephan, ik weet dat het soms moeilijk voor jullie te
begrijpen is wat ik allemaal heb uitgespookt de afgelopen 4.5 jaar, maar jullie interesse
en steun hebben mij zeker geholpen. Ik ben trots op jullie.
En ten slotte niet te vergeten, Bert. Lievie, bedankt voor je geduld, liefde en steun de
afgelopen jaren. Jouw adviezen en de woorden, ‘dat lukt je wel’ hebben er toe geleidt
dat het ook inderdaad gelukt is. Muchas gracias ☺


List of abbreviations
181
AA arachidonic acid (20:4n-6)
ACF aberrant crypt foci
ALA alpha-linolenic acid (18:3n-3)
ALP alkaline phosphatase
AOM azoxymethane
ApoC3 apolipoprotein C3
APPR acute phase protein response
ARE antioxidant responsive element
BrdU 5-bromo-2'-deoxyuridine
BSA bovine serum albumin
CAT catalase
COX cyclooxygenase
DBA Dolichos biflorus agglutinin
DHA docosahexaenoic acid (22:6n-3)
DMH 1,2-dimethylhydrazine
EPA eicosapentaenoic acid (20:5n-3)
EpRE electrophile responsive element
EROD ethoxyresorufin O-deethylase
EtOH ethanol
FAP familial adenomatous polyposis
FCS fetal calf serum
FPTase farnesyl protein transferase
GJIC gap junctional intercellular
communication
GLA gamma-linolenic acid
β2GP β2 glycoprotein
GSH-Px glutathione peroxidase
GST glutathione transferase
GSTP1 glutathione S-transferase P1
GSTYa glutathione S-transferase Ya
HDL high density lipoprotein
HFCO high fat corn oil
HFFO high fat fish oil
HNPCC hereditary non-polyposis
colorectal cancer
HO heme oxygenase
IF induction factor
IL-1β interleukin 1β
IM indomethacin
LA linoleic acid (18:2n-6)
LDH lactate dehydrogenase
LFCO low fat corn oil
MAM methylazoxy-methanol
MDA malondialdehyde
MGMT O6-methylguanine-DNA-
methyltransferase
MUFA monounsaturated fatty acids
NQO1 NAD(P)H:quinone
oxidoreductase
Nrf2 NF-E2-related factor 2
NSAID nonsteroidal anti-inflammatory
drug
ODC ornithine decarboxylase
PCA principal component analysis
PCDA principal component
discriminant analysis
PCNA proliferating cell nuclear antigen
PGE prostaglandine E
PNP paranitrophenol
PPAR peroxisome proliferator
activated receptor
PROD pentoxyresorufin O-deethylase
PUFA polyunsaturated fatty acids
ROS reactive oxygen species
SAM statistical analysis of
microarrays
SFA saturated fatty acids
SOD superoxide dismutase
TBARS thiobarbituric acid reactive
substances
TBHQ tertiary butyl hydroquinone
TEAC trolox equivalent antioxidant
capacity
TG triglyceride
TPK tyrosine protein kinase
TSSC3 tumor suppressing
subtransferable candidate 3
UDPGT UDP-glucuronyltransferase
Vit E vitamin E
VLDL very low density lipoprotein


This PhD project was part of the research program of Graduate School VLAG
(Food Technology, Agrobiotechnology, Nutrition and Health Sciences) of Wageningen
University.
Printed by Ponsen & Looijen bv, Wageningen, The Netherlands