Does Warfare Matter? Severity, Duration, and Outcomes of Civil Wars
Upload
independentCategory
view
0download
0
Aw
PAD
a
ARR2A
KPPM
1
(cw(
Dfif
0d
Preventive Veterinary Medicine 98 (2011) 19–28
Contents lists available at ScienceDirect
Preventive Veterinary Medicine
journa l homepage: www.e lsev ier .com/ locate /prevetmed
ssessment and quantification of post-weaning multi-systemicasting syndrome severity at farm level
ablo Alarcon ∗, Martina Velasova, Dirk Werling, Katharina D.C. Stärk, Yu-Mei Chang,manda Nevel, Dirk U. Pfeiffer, Barbara Wieland
epartment of Veterinary Clinical Sciences, Royal Veterinary College, Hatfield AL9 7TA, United Kingdom
r t i c l e i n f o
rticle history:eceived 18 May 2010eceived in revised form7 September 2010ccepted 30 September 2010
eywords:MWS severityCV2 PCRorbidity
a b s t r a c t
Post-weaning multi-systemic wasting syndrome (PMWS) causes major economic lossesfor the English pig industry and severity of clinical signs and economic impact vary con-siderably between affected farms. We present here a novel approach to quantify severityof PMWS based on morbidity and mortality data and presence of porcine circovirus type2 (PCV2). In 2008–2009, 147 pig farms across England, non-vaccinating for PCV2, wereenrolled in a cross-sectional study. Factor analysis was used to generate variables repre-senting biologically meaningful aspects of variation among qualitative and quantitativemorbidity variables. Together with other known variables linked to PMWS, the resultingfactors were included in a principal component analysis (PCA) to derive an algorithm forPMWS severity. Factor analysis resulted in two factors: Morbidity Factor 1 (MF1) repre-senting mainly weaner and grower morbidity, and Morbidity Factor 2 (MF2) which mainlyreflects variation in finisher morbidity. This indicates that farms either had high morbiditymainly in weaners/growers or mainly in finishers. Subsequent PCA resulted in the extractionof one component representing variation in MF1, post-weaning mortality and percentage
of PCV2 PCR positive animals. Component scores were normalised to a value range from 0to 10 and farms classified into: non or slightly affected farms with a score <4, moderatelyaffected farms with scores 4–6.5 and highly affected farms with a score >6.5. The identifiedfarm level PMWS severities will be used to identify risk factors related to these, to assessthe efficacy of PCV2 vaccination and investigating the economic impact of potential controlmeasures.. Introduction
Post-weaning multi-systemic wasting syndrome
PMWS) is a multi-factorial pig disease with porcineircovirus type-2 (PCV2) as a necessary causal agent, buthose presence is not sufficient to trigger clinical signsNayar et al., 1997; Allan et al., 1998; Ellis et al., 1998).
∗ Corresponding author at: Centre of Emerging, Endemic and Exoticiseases, Royal Veterinary College, Hawkshead Lane, North Mymms, Hat-eld AL9 7TA, Hertfordshire, United Kingdom. Tel.: +44 1707666024;
ax: +44 1707667051.E-mail address: [email protected] (P. Alarcon).
167-5877/$ – see front matter © 2010 Elsevier B.V. All rights reserved.oi:10.1016/j.prevetmed.2010.09.022
© 2010 Elsevier B.V. All rights reserved.
PCV2 has also been associated with porcine dermatitisand nephropathy syndrome (PDNS), porcine respiratorydisease complex and reproductive disorders. However,since being first reported in 1991 in Canada (Clark, 1996;Harding, 1996), PMWS has been the most frequent PCV2disease and over the last decade has caused very higheconomic losses for the pig industry worldwide. Typically,the disease affects pigs aged between 8 and 15 weeks and
the most frequent clinical signs are wasting, skin pallor,respiratory distress, diarrhoea, jaundice and enlargedlymph nodes (Harding and Clark, 1997). Economic lossesare caused through increase in post-weaning mortal-ity, reduced growth rates, increased feed conversion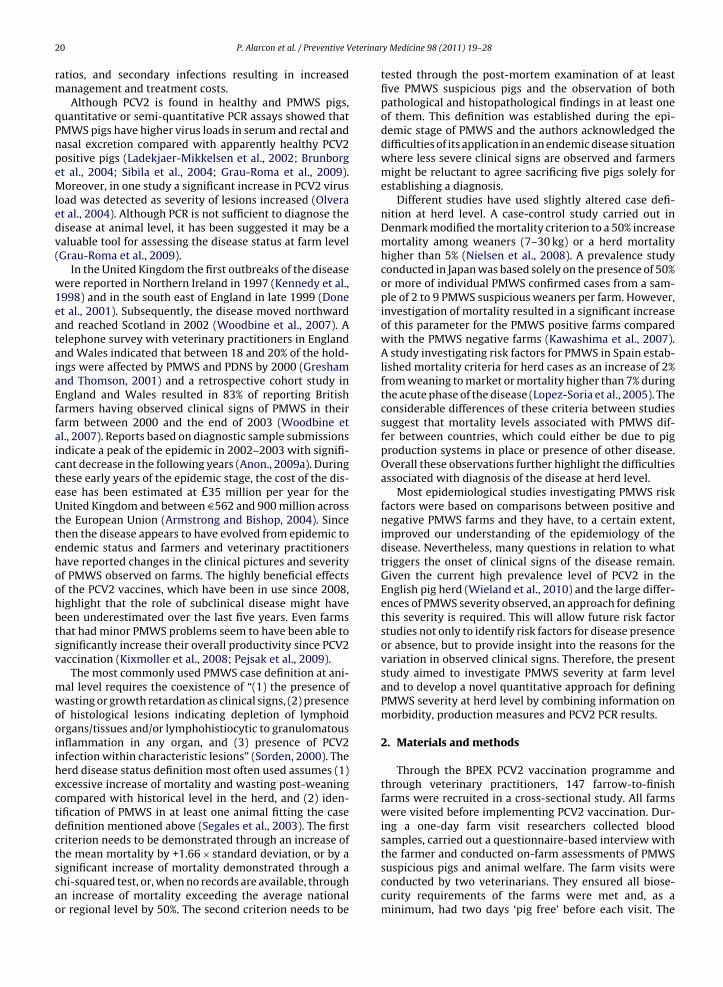
eterinar
20 P. Alarcon et al. / Preventive Vratios, and secondary infections resulting in increasedmanagement and treatment costs.
Although PCV2 is found in healthy and PMWS pigs,quantitative or semi-quantitative PCR assays showed thatPMWS pigs have higher virus loads in serum and rectal andnasal excretion compared with apparently healthy PCV2positive pigs (Ladekjaer-Mikkelsen et al., 2002; Brunborget al., 2004; Sibila et al., 2004; Grau-Roma et al., 2009).Moreover, in one study a significant increase in PCV2 virusload was detected as severity of lesions increased (Olveraet al., 2004). Although PCR is not sufficient to diagnose thedisease at animal level, it has been suggested it may be avaluable tool for assessing the disease status at farm level(Grau-Roma et al., 2009).
In the United Kingdom the first outbreaks of the diseasewere reported in Northern Ireland in 1997 (Kennedy et al.,1998) and in the south east of England in late 1999 (Doneet al., 2001). Subsequently, the disease moved northwardand reached Scotland in 2002 (Woodbine et al., 2007). Atelephone survey with veterinary practitioners in Englandand Wales indicated that between 18 and 20% of the hold-ings were affected by PMWS and PDNS by 2000 (Greshamand Thomson, 2001) and a retrospective cohort study inEngland and Wales resulted in 83% of reporting Britishfarmers having observed clinical signs of PMWS in theirfarm between 2000 and the end of 2003 (Woodbine etal., 2007). Reports based on diagnostic sample submissionsindicate a peak of the epidemic in 2002–2003 with signifi-cant decrease in the following years (Anon., 2009a). Duringthese early years of the epidemic stage, the cost of the dis-ease has been estimated at £35 million per year for theUnited Kingdom and between D562 and 900 million acrossthe European Union (Armstrong and Bishop, 2004). Sincethen the disease appears to have evolved from epidemic toendemic status and farmers and veterinary practitionershave reported changes in the clinical pictures and severityof PMWS observed on farms. The highly beneficial effectsof the PCV2 vaccines, which have been in use since 2008,highlight that the role of subclinical disease might havebeen underestimated over the last five years. Even farmsthat had minor PMWS problems seem to have been able tosignificantly increase their overall productivity since PCV2vaccination (Kixmoller et al., 2008; Pejsak et al., 2009).
The most commonly used PMWS case definition at ani-mal level requires the coexistence of “(1) the presence ofwasting or growth retardation as clinical signs, (2) presenceof histological lesions indicating depletion of lymphoidorgans/tissues and/or lymphohistiocytic to granulomatousinflammation in any organ, and (3) presence of PCV2infection within characteristic lesions” (Sorden, 2000). Theherd disease status definition most often used assumes (1)excessive increase of mortality and wasting post-weaningcompared with historical level in the herd, and (2) iden-tification of PMWS in at least one animal fitting the casedefinition mentioned above (Segales et al., 2003). The firstcriterion needs to be demonstrated through an increase of
the mean mortality by +1.66 × standard deviation, or by asignificant increase of mortality demonstrated through achi-squared test, or, when no records are available, throughan increase of mortality exceeding the average nationalor regional level by 50%. The second criterion needs to bey Medicine 98 (2011) 19–28
tested through the post-mortem examination of at leastfive PMWS suspicious pigs and the observation of bothpathological and histopathological findings in at least oneof them. This definition was established during the epi-demic stage of PMWS and the authors acknowledged thedifficulties of its application in an endemic disease situationwhere less severe clinical signs are observed and farmersmight be reluctant to agree sacrificing five pigs solely forestablishing a diagnosis.
Different studies have used slightly altered case defi-nition at herd level. A case-control study carried out inDenmark modified the mortality criterion to a 50% increasemortality among weaners (7–30 kg) or a herd mortalityhigher than 5% (Nielsen et al., 2008). A prevalence studyconducted in Japan was based solely on the presence of 50%or more of individual PMWS confirmed cases from a sam-ple of 2 to 9 PMWS suspicious weaners per farm. However,investigation of mortality resulted in a significant increaseof this parameter for the PMWS positive farms comparedwith the PMWS negative farms (Kawashima et al., 2007).A study investigating risk factors for PMWS in Spain estab-lished mortality criteria for herd cases as an increase of 2%from weaning to market or mortality higher than 7% duringthe acute phase of the disease (Lopez-Soria et al., 2005). Theconsiderable differences of these criteria between studiessuggest that mortality levels associated with PMWS dif-fer between countries, which could either be due to pigproduction systems in place or presence of other disease.Overall these observations further highlight the difficultiesassociated with diagnosis of the disease at herd level.
Most epidemiological studies investigating PMWS riskfactors were based on comparisons between positive andnegative PMWS farms and they have, to a certain extent,improved our understanding of the epidemiology of thedisease. Nevertheless, many questions in relation to whattriggers the onset of clinical signs of the disease remain.Given the current high prevalence level of PCV2 in theEnglish pig herd (Wieland et al., 2010) and the large differ-ences of PMWS severity observed, an approach for definingthis severity is required. This will allow future risk factorstudies not only to identify risk factors for disease presenceor absence, but to provide insight into the reasons for thevariation in observed clinical signs. Therefore, the presentstudy aimed to investigate PMWS severity at farm leveland to develop a novel quantitative approach for definingPMWS severity at herd level by combining information onmorbidity, production measures and PCV2 PCR results.
2. Materials and methods
Through the BPEX PCV2 vaccination programme andthrough veterinary practitioners, 147 farrow-to-finishfarms were recruited in a cross-sectional study. All farmswere visited before implementing PCV2 vaccination. Dur-ing a one-day farm visit researchers collected bloodsamples, carried out a questionnaire-based interview with
the farmer and conducted on-farm assessments of PMWSsuspicious pigs and animal welfare. The farm visits wereconducted by two veterinarians. They ensured all biose-curity requirements of the farms were met and, as aminimum, had two days ‘pig free’ before each visit. The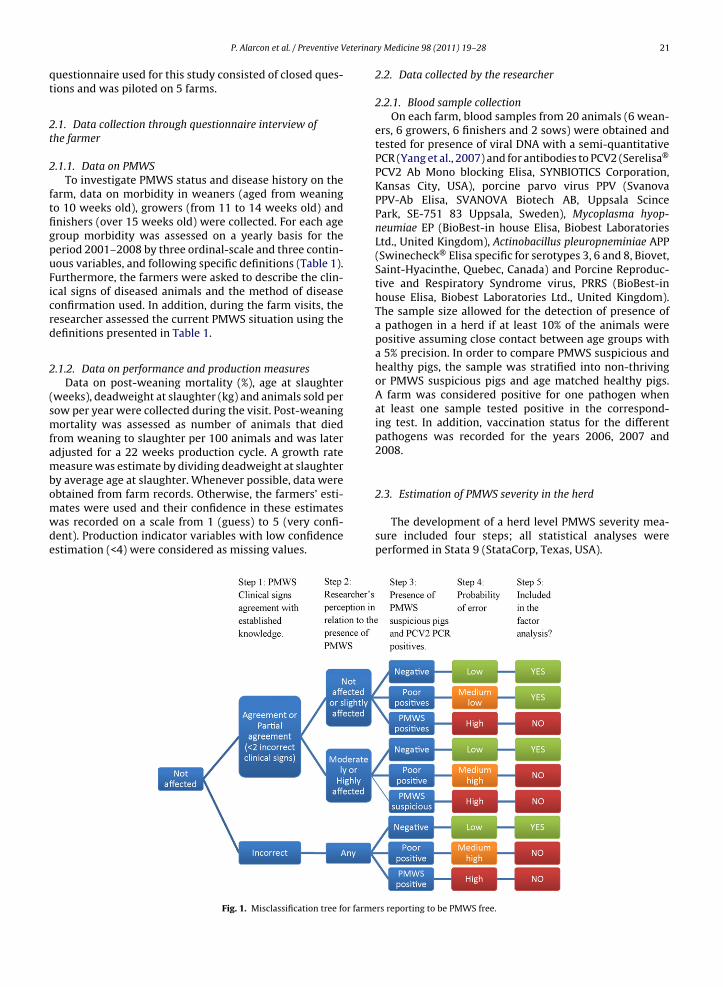
eterinar
qt
2t
2
ftfigpuFicrd
2
(smfambomwde
P. Alarcon et al. / Preventive V
uestionnaire used for this study consisted of closed ques-ions and was piloted on 5 farms.
.1. Data collection through questionnaire interview ofhe farmer
.1.1. Data on PMWSTo investigate PMWS status and disease history on the
arm, data on morbidity in weaners (aged from weaningo 10 weeks old), growers (from 11 to 14 weeks old) andnishers (over 15 weeks old) were collected. For each ageroup morbidity was assessed on a yearly basis for theeriod 2001–2008 by three ordinal-scale and three contin-ous variables, and following specific definitions (Table 1).urthermore, the farmers were asked to describe the clin-cal signs of diseased animals and the method of diseaseonfirmation used. In addition, during the farm visits, theesearcher assessed the current PMWS situation using theefinitions presented in Table 1.
.1.2. Data on performance and production measuresData on post-weaning mortality (%), age at slaughter
weeks), deadweight at slaughter (kg) and animals sold perow per year were collected during the visit. Post-weaningortality was assessed as number of animals that died
rom weaning to slaughter per 100 animals and was laterdjusted for a 22 weeks production cycle. A growth rateeasure was estimate by dividing deadweight at slaughter
y average age at slaughter. Whenever possible, data were
btained from farm records. Otherwise, the farmers’ esti-ates were used and their confidence in these estimatesas recorded on a scale from 1 (guess) to 5 (very confi-ent). Production indicator variables with low confidencestimation (<4) were considered as missing values.Fig. 1. Misclassification tree for farme
y Medicine 98 (2011) 19–28 21
2.2. Data collected by the researcher
2.2.1. Blood sample collectionOn each farm, blood samples from 20 animals (6 wean-
ers, 6 growers, 6 finishers and 2 sows) were obtained andtested for presence of viral DNA with a semi-quantitativePCR (Yang et al., 2007) and for antibodies to PCV2 (Serelisa®
PCV2 Ab Mono blocking Elisa, SYNBIOTICS Corporation,Kansas City, USA), porcine parvo virus PPV (SvanovaPPV-Ab Elisa, SVANOVA Biotech AB, Uppsala ScincePark, SE-751 83 Uppsala, Sweden), Mycoplasma hyop-neumiae EP (BioBest-in house Elisa, Biobest LaboratoriesLtd., United Kingdom), Actinobacillus pleuropneminiae APP(Swinecheck® Elisa specific for serotypes 3, 6 and 8, Biovet,Saint-Hyacinthe, Quebec, Canada) and Porcine Reproduc-tive and Respiratory Syndrome virus, PRRS (BioBest-inhouse Elisa, Biobest Laboratories Ltd., United Kingdom).The sample size allowed for the detection of presence ofa pathogen in a herd if at least 10% of the animals werepositive assuming close contact between age groups witha 5% precision. In order to compare PMWS suspicious andhealthy pigs, the sample was stratified into non-thrivingor PMWS suspicious pigs and age matched healthy pigs.A farm was considered positive for one pathogen whenat least one sample tested positive in the correspond-ing test. In addition, vaccination status for the differentpathogens was recorded for the years 2006, 2007 and2008.
2.3. Estimation of PMWS severity in the herd
The development of a herd level PMWS severity mea-sure included four steps; all statistical analyses wereperformed in Stata 9 (StataCorp, Texas, USA).
rs reporting to be PMWS free.
22 P. Alarcon et al. / Preventive Veterinary Medicine 98 (2011) 19–28
Table 1Definitions to assess the farmer’s and researcher’s perception of PMWS occurrence in the herd.
Definition and categories
Farmer’s perception 3 ordinal variablesWeanersGrowersFinishers
Not affected: Nocases present
Slightly affected:Few cases presentand no increase inmortality
Moderately affected:Regular cases observed
Highly affected: Highnumber of cases andincrease in mortality
3 continuous variablesWeanersGrowersFinishers
Proportion of cases in each age group within herd
Researcher’s perception 1 ordinal variable Not affected: Nocases present
Slightly affected:Few cases present(less
Moderately affected:Detection of cases in
Seriously affected: Highnumber of cases (many
in the farm atthe time of thevisit
2.3.1. 1st step: assessment of herd misclassification dueto false morbidity estimates by farmers to exclude farmsfrom the analysis
To identify farmers’ with potentially erroneous diagno-sis of PMWS morbidity, two misclassification trees wereused, one for farmers who considered their herd to be freefrom the disease and one for affected herds (Figs. 1 and 2).Only farms that successfully passed this misclassificationprocess were included in the further analysis.
2.3.2. 2nd step: factor analysis of morbidity variablesAn unrotated factor analysis using a principal fac-
toring method was performed to identify biologicallymeaningful latent factors that explain morbidity based onfarmers’ perception in relation to PMWS occurrence intheir herd. Although this technique has been designed forthe analysis of continuous variables, several authors jus-tified the use of ordinal scale variables when measuring
an underlying scale through the estimation of polychoriccorrelations (Joreskog and Moustaki, 2001; Moustaki,2001; Bartholomew et al., 2002; Flora and Curran, 2004;Kolenikov and Angeles, 2009). Therefore, based on the factthat the qualitative morbidity variables are ordinal-scalesFig. 2. Misclassification tree for farmers r
than 1%) most of the buildingsand in several pens ORhigh number of casesdetected in the sick pen
cases detected within apen and in severalpens)
variables measuring underlying continuous variables,polychoric correlations were estimated (The polychoriccorrelation package version 1.4 written by Kolenikovs,S., http://web.missouri.edu/∼kolenikovs/stata) and theresulting matrix was the input into the factor analysis (fac-tormat command). Only factors with eigenvalues higherthan 1 were considered and factors loading higher than 0.4were retained. Factors scores were estimated (predict com-mand) through the calculation of regression coefficientsthat were applied to standardised morbidity variables, withmean of 0 and standard deviation of 1.
2.3.3. 3rd step: principal component analysis includingall relevant variables
To identify the component which measures PMWSseverity in the herd, a principal component analysis (pcacommand) with all relevant production variables, labora-tory variables and identified morbidity factors (step 2) was
performed. Resulting components with eigenvalues higherthan 1 were considered and only components loadingshigher than 0.4 were retained in the final model. The finalcomponent is then predicted using only variables with rel-evant loadings. This component will be referred as PMWSc.eporting to be affected by PMWS.
P. Alarcon et al. / Preventive Veterinary Medicine 98 (2011) 19–28 23
Table 2Summary statistics of production indicator variables and PCV2 serological results from English pig farms in 2008–2009.
Exposure variable N Mean (S.D.) Min Max
Growth rates (deadweight in kg/age in weeks 135 3.34 (0.31) 2.30 4.36Finishers sold/sow/year 132 20.05 (2.84) 8.57 26.51
2a
mmPsvwsutoa
3
sFaet
3
b1sh6Etts1i
FP
Post-weaning mortality (%) 133PCV2 PCR +ve/farm (%) 147PCV2 Ab +ve/farm (%)a 147
a Se = 0.99, Sp = 0.96, true mean = 47.2.
.3.4. 4th step: description of the final PMWS severitynd identification of possible cut-offs
To have an easily understandable and communicableeasure, components scores were transformed to a nor-ally distributed scale from 0 to 10. In order to categorise
MWS severity in three severity rank-order groups (non orlightly affected, moderately affected and highly affected),alues from the predicted component obtained in step 3ere plotted against the different variables composing the
cale. Visual (graphical) analysis of the different plots wassed to identify apparent cut-offs for the classification ofhe farms into the different PMWS severity groups. Meansf the different production variables, morbidity variablesnd PCV2 PCR results were then described for each group.
. Results
In total, 147 farrow-to-finish farms were eligible for thistudy and were visited between April 2008 and April 2009.or two farms the interview questionnaire was incompletend therefore excluded from the analysis. Three farms werexcluded because not all age groups were represented inhe blood sampling.
.1. Brief description of the farms
The median size of all the farms recruited was 300reeding sows with the majority of them (62%) between80 and 500 sows. Only 22 farms (15%) had less than 150ows and 33 farms (23%) had more than 500 with the largestaving 2000 sows. The sum of all sows from each farm was5,093 corresponding to approximately 17% of the totalnglish sow population. Fifty-seven percent of farms kept
heir pigs at a single site, while 23% of farms had their pigs atwo different sites and 20% at more than two sites. Seventy-even percent of farms were operating an all indoor and0% an all outdoor production system with the remain-ng 13% having sows and/or weaners outdoors and using
0
20
40
60
01 (N=126)
02 (N=124)
03 (N=126)
04 (N=128)
% o
f far
ms
Not affected Slightly affected
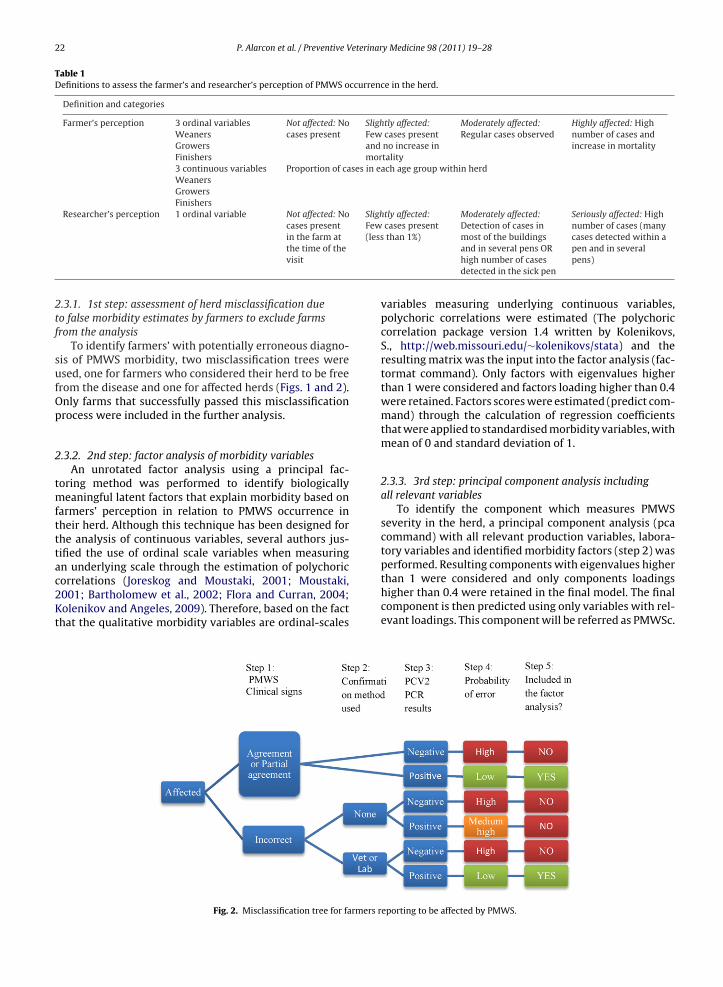
ig. 3. Overall morbidity history reported by English pig farmers for the period 20MWS affected depending on the highest score among the ordinal-scales variable
7.51 (4.89) 1.01 3229.79 (21.21) 0 8748.84 (22.83) 0 95
indoor accommodation for their finishing pigs. The studyfarms were spread geographically across England with twoclusters of high density of farms in North-Yorkshire andEast-Anglia, reflecting the herd density distribution of pigfarms in England.
3.2. Descriptive analysis of production indicatorvariables and serological results
Summary statistics for production indicator variablesand serological results are shown in Table 2. PCV2 viruswas detected in 131 farms (88.51%) through PCV2 PCRresults. Almost all farms tested positive for PCV2 antibodies(99.36%) and the only negative farm had PCV2 PCR posi-tive pigs. Most of the farms in the study were vaccinatedagainst PPV (80%) and EP (69%), and less than half of thefarms against PRRS (44%).
3.3. Assessment of PMWS misclassification (1st step)
The majority of farmers correctly described PMWS clini-cal signs, with only 26 farms (18%) reporting more than twoincorrect clinical signs. Of affected farms, 50% reported thattheir disease status had been confirmed by their veterinar-ian and 37% reported confirmation by further laboratorydiagnosis. Based on the misclassification trees, a total of21 farms were identified as being misclassified and weretherefore excluded from subsequent analysis.
3.4. Analysis of morbidity variables (2nd step)
3.4.1. Descriptive analysisOf 142 farms, 100 (70.04%) reported having ongoing
PMWS problems, while 30 farms (21.13%) declared them-selves to be free from the disease. In 12 farms (8.16%)wasting animals were reported, but farmers were not sureif clinical signs were caused by PMWS. A descriptive anal-ysis of overall historic qualitative morbidity assessment by
05 (N=131)
06 (N=134)
07 (N=140)
08 (N=141)
Moderately affected Highly affected
01–2008. Each farm was classified as non, slightly, moderately or highlys for each year.
24 P. Alarcon et al. / Preventive Veterinary Medicine 98 (2011) 19–28
020406080
100
01 02 03 04 05 06 07 08 01 02 03 04 05 06 07 08 01 02 03 04 05 06 07 08%
of f
arm
s
Not affected Slightly affected Moderately affected Highly affected
FinsishersGrowersWeaners
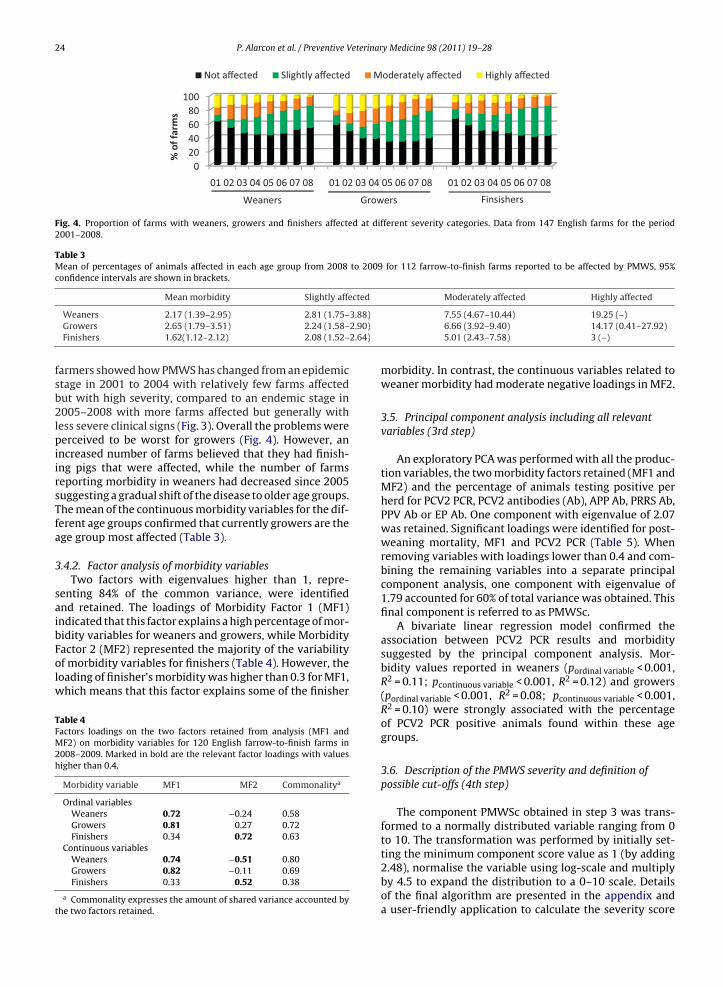
Fig. 4. Proportion of farms with weaners, growers and finishers affected at different severity categories. Data from 147 English farms for the period2001–2008.
Table 3Mean of percentages of animals affected in each age group from 2008 to 2009 for 112 farrow-to-finish farms reported to be affected by PMWS, 95%confidence intervals are shown in brackets.
Mean morbidity Slightly affected Moderately affected Highly affected
3.88)2.90)2.64)
Weaners 2.17 (1.39–2.95) 2.81 (1.75–Growers 2.65 (1.79–3.51) 2.24 (1.58–Finishers 1.62(1.12–2.12) 2.08 (1.52–
farmers showed how PMWS has changed from an epidemicstage in 2001 to 2004 with relatively few farms affectedbut with high severity, compared to an endemic stage in2005–2008 with more farms affected but generally withless severe clinical signs (Fig. 3). Overall the problems wereperceived to be worst for growers (Fig. 4). However, anincreased number of farms believed that they had finish-ing pigs that were affected, while the number of farmsreporting morbidity in weaners had decreased since 2005suggesting a gradual shift of the disease to older age groups.The mean of the continuous morbidity variables for the dif-ferent age groups confirmed that currently growers are theage group most affected (Table 3).
3.4.2. Factor analysis of morbidity variablesTwo factors with eigenvalues higher than 1, repre-
senting 84% of the common variance, were identifiedand retained. The loadings of Morbidity Factor 1 (MF1)indicated that this factor explains a high percentage of mor-
bidity variables for weaners and growers, while MorbidityFactor 2 (MF2) represented the majority of the variabilityof morbidity variables for finishers (Table 4). However, theloading of finisher’s morbidity was higher than 0.3 for MF1,which means that this factor explains some of the finisherTable 4Factors loadings on the two factors retained from analysis (MF1 andMF2) on morbidity variables for 120 English farrow-to-finish farms in2008–2009. Marked in bold are the relevant factor loadings with valueshigher than 0.4.
Morbidity variable MF1 MF2 Commonalitya
Ordinal variablesWeaners 0.72 −0.24 0.58Growers 0.81 0.27 0.72Finishers 0.34 0.72 0.63
Continuous variablesWeaners 0.74 −0.51 0.80Growers 0.82 −0.11 0.69Finishers 0.33 0.52 0.38
a Commonality expresses the amount of shared variance accounted bythe two factors retained.
7.55 (4.67–10.44) 19.25 (–)6.66 (3.92–9.40) 14.17 (0.41–27.92)5.01 (2.43–7.58) 3 (–)
morbidity. In contrast, the continuous variables related toweaner morbidity had moderate negative loadings in MF2.
3.5. Principal component analysis including all relevantvariables (3rd step)
An exploratory PCA was performed with all the produc-tion variables, the two morbidity factors retained (MF1 andMF2) and the percentage of animals testing positive perherd for PCV2 PCR, PCV2 antibodies (Ab), APP Ab, PRRS Ab,PPV Ab or EP Ab. One component with eigenvalue of 2.07was retained. Significant loadings were identified for post-weaning mortality, MF1 and PCV2 PCR (Table 5). Whenremoving variables with loadings lower than 0.4 and com-bining the remaining variables into a separate principalcomponent analysis, one component with eigenvalue of1.79 accounted for 60% of total variance was obtained. Thisfinal component is referred to as PMWSc.
A bivariate linear regression model confirmed theassociation between PCV2 PCR results and morbiditysuggested by the principal component analysis. Mor-bidity values reported in weaners (pordinal variable < 0.001,R2 = 0.11; pcontinuous variable < 0.001, R2 = 0.12) and growers(pordinal variable < 0.001, R2 = 0.08; pcontinuous variable < 0.001,R2 = 0.10) were strongly associated with the percentageof PCV2 PCR positive animals found within these agegroups.
3.6. Description of the PMWS severity and definition ofpossible cut-offs (4th step)
The component PMWSc obtained in step 3 was trans-formed to a normally distributed variable ranging from 0to 10. The transformation was performed by initially set-
ting the minimum component score value as 1 (by adding2.48), normalise the variable using log-scale and multiplyby 4.5 to expand the distribution to a 0–10 scale. Detailsof the final algorithm are presented in the appendix anda user-friendly application to calculate the severity score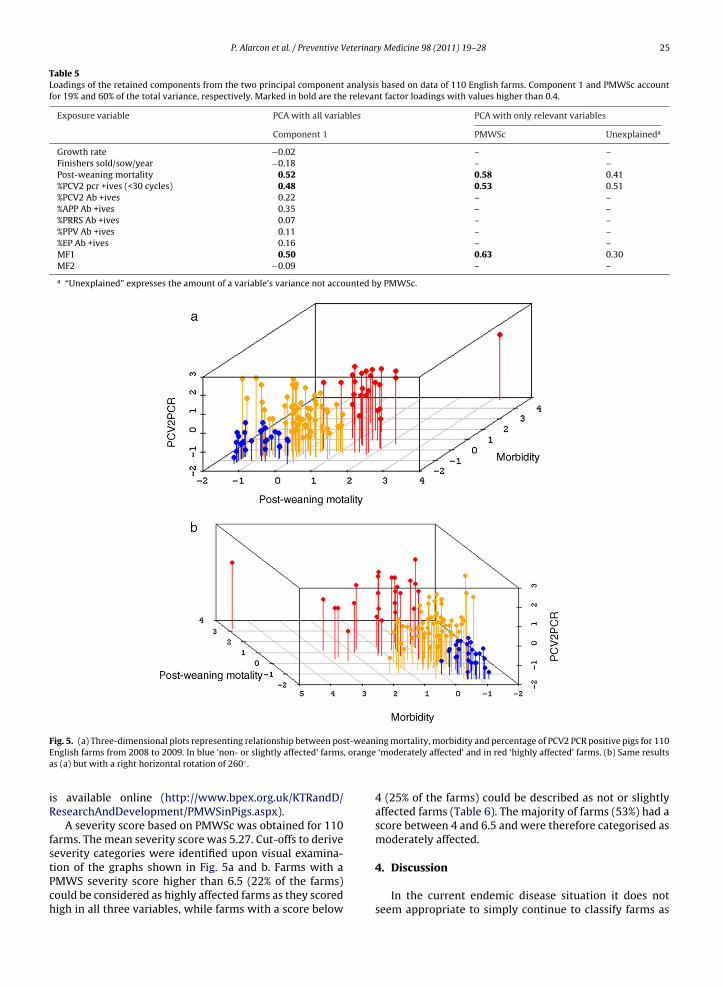
P. Alarcon et al. / Preventive Veterinary Medicine 98 (2011) 19–28 25
Table 5Loadings of the retained components from the two principal component analysis based on data of 110 English farms. Component 1 and PMWSc accountfor 19% and 60% of the total variance, respectively. Marked in bold are the relevant factor loadings with values higher than 0.4.
Exposure variable PCA with all variables PCA with only relevant variables
Component 1 PMWSc Unexplaineda
Growth rate −0.02 – –Finishers sold/sow/year −0.18 – –Post-weaning mortality 0.52 0.58 0.41%PCV2 pcr +ives (<30 cycles) 0.48 0.53 0.51%PCV2 Ab +ives 0.22 – –%APP Ab +ives 0.35 – –%PRRS Ab +ives 0.07 – –%PPV Ab +ives 0.11 – –%EP Ab +ives 0.16 – –MF1 0.50 0.63 0.30MF2 −0.09 – –
a “Unexplained” expresses the amount of a variable’s variance not accounted by PMWSc.
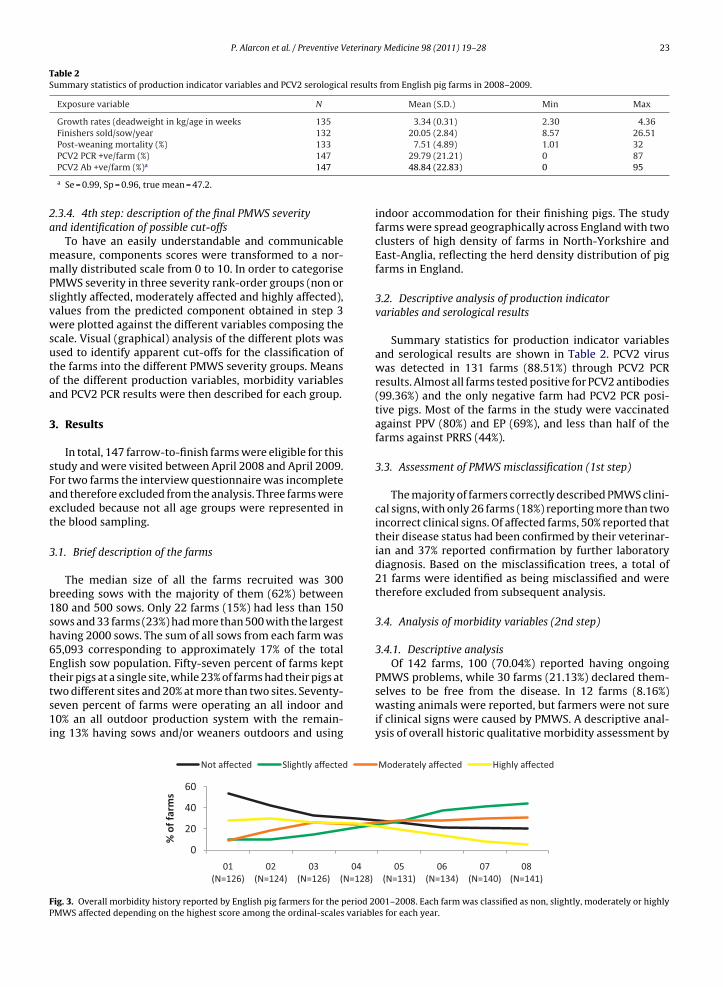
F t-weanE , orangea
iR
fstPch
ig. 5. (a) Three-dimensional plots representing relationship between posnglish farms from 2008 to 2009. In blue ‘non- or slightly affected’ farmss (a) but with a right horizontal rotation of 260◦ .
s available online (http://www.bpex.org.uk/KTRandD/esearchAndDevelopment/PMWSinPigs.aspx).
A severity score based on PMWSc was obtained for 110arms. The mean severity score was 5.27. Cut-offs to derive
everity categories were identified upon visual examina-ion of the graphs shown in Fig. 5a and b. Farms with aMWS severity score higher than 6.5 (22% of the farms)ould be considered as highly affected farms as they scoredigh in all three variables, while farms with a score belowing mortality, morbidity and percentage of PCV2 PCR positive pigs for 110‘moderately affected’ and in red ‘highly affected’ farms. (b) Same results
4 (25% of the farms) could be described as not or slightlyaffected farms (Table 6). The majority of farms (53%) had ascore between 4 and 6.5 and were therefore categorised asmoderately affected.
4. Discussion
In the current endemic disease situation it does notseem appropriate to simply continue to classify farms as
26 P. Alarcon et al. / Preventive Veterinary Medicine 98 (2011) 19–28
Table 6Suggested cut-offs for PMWS severity and descriptive statistics of its underlying variables. Data from 110 English farms for the period 2008–2009.
Severity category PMWS score N Mortality PCV2 +ve MF1
Not or slightly affected <4 27 <8% <30% <−0.06Mean = 3.72% Mean = 15% Mean = −0.75
Moderately affected 4–6.5 58 1.36–16.5% 10–80% −0.99 to 1.08
Severely affected >6.5 25
PMWS affected or not, but studies investigating why thedisease causes more problems in some farms than othersare warranted. In this study we present a novel quantita-tive tool allowing farmers, veterinarians and researchersto determine PMWS severity on the farm. The severity isbased on the prevalence of clinical cases, PCV2 PCR resultsand post-weaning mortality levels. As morbidity and someof the post-weaning mortality measures are based on farm-ers’ perception, and the number of pigs sampled per farmwas relatively small, various methods were use to addressthese limitations and to minimise the resulting errors. Theuse of misclassification trees, triangulation to assess mor-bidity perception, and the use of confidence of answer ortargeting PMWS suspicious pigs during the sampling pro-tocol proved useful.
To avoid sampling bias towards affected farms whichmight have occurred through the recruitment of farmsas part of the BPEX PCV2 vaccination programme, about20% of farms enrolled were recruited through veterinarypractitioners. These latter farms tended to be free or onlyslightly affected by PMWS. Given the number of farms andthe diversity of types of farms included in the sample, theauthors considered data used for this study to be represen-tative of the English pig herd population.
The advantages of participatory epidemiology havebeen widely acknowledged in studies in developing coun-tries, but have only rarely been used in developed countries(Bett et al., 2009). The difficulty for researchers to obtaina complete understanding of the farm morbidity during asingle farm visit made the use of participatory epidemi-ology a useful approach to include the farmer’s view onthe impact of the disease on his farm. Several questionsaddressing the same topic and qualitative and quantitativeways to measure PMWS allowed differences in farmer’sperception and measurement errors to be accounted for.Error due to misclassification of the disease by the farmerwas minimised through the use of the specific criteriaincluding clinical signs, initial confirmation of the disease,researcher’s perception on morbidity on the farm and PCV2laboratory results. All this information was then used inthe misclassification trees to identify farms that shouldbe excluded in developing the method to assess PMWSseverity. Several causes could lead to a misclassificationof PMWS by the farmer, such as a lack of knowledge ofthe disease or incorrect classification of other disease signs
as PMWS. Nevertheless, the high impact the disease hashad on the English pig industry since 1999 seems to haveraised the awareness and knowledge of the farmers, whichis reflected by the fact that only 14% of them failed duringthe misclassification process. Although the misclassifica-Mean = 7.36% Mean = 36% Mean = −0.10
>5.78% >25% >0.07Mean = 13.47% Mean = 52% Mean = 1.35
tion trees are mainly based on farmer’s perception and donot include PMWS case confirmation through histopatho-logical findings, but included the presence of PCV2 instead,the diagnostic error is considered to be minimal. A longitu-dinal study in Denmark and Spain concluded that althoughPCV2 PCR results should not be considered for individualPMWS diagnosis because of the lack of sensitivity of thetest, the use of PCV2 PCR was considered a valuable tool todifferentiate PMWS status at herd level (Grau-Roma et al.,2009). On the other hand, as presence of PCV2 in animals isnot sufficient to cause the disease, in farms believed PMWS-free more importance was given to the confirmation ofabsence of clinical signs during the farm visits.
Some recording bias could have occurred in the produc-tion data because of inadequate records on some farms.However, the mean post-weaning mortality found in oursample is similar to the mean mortality reported by BPEXfor 2007 (Anon., 2009b). Also, the use of confidence ofanswer reduced the perception bias for these variables.
Results of this study illustrate how PMWS has evolvedfrom an epidemic to an endemic stage over the last eightyears, with 2004/05 being the inflection point for this tran-sition. These results seem to be in agreement with theVeterinary Investigation Surveillance Report performed bythe VLA which shows that sample submission for PMWSdiagnostics peaked in 2002/03 but have remained stablesince 2005 (Anon., 2009a).
Factor analysis (FA) and principal component analysis(PCA) are powerful multivariables techniques to identifylatent factors or components that are present in a biolog-ical process and it has been widely use in psychologicalstudies to develop scales that measure the degree of somepathological conditions such as depression, dementia, anx-iety and many others (Radloff, 1977; Parnetti et al., 1997).However, the use of these techniques to measure severityof an infectious disease process is novel but is justified bythe complexity of the disease and the way the syndrome ismanifest on farms. In this study FA was used on morbid-ity variables as a dimensional reduction technique and toidentify the factors explaining the morbidity observed forthe different age groups. PCA was used in the final modelto identify and assess the relationship between variablesexplaining PMWS and to develop a PMWS severity scale.
The results of the factor analysis indicated that mor-bidity in weaners and growers are explained by one factor
(MF1) while morbidity in finishers is explained by anotherfactor (MF2). The two factors were uncorrelated. There-fore a disassociation in morbidity at farm level is occurringfor most of the farms, which means that farms either havecases in weaners/growers or only in finishers.
eterinar
ptsswmpses
‘maatPAmstopmitatitfPdpp
iAsFawtehfdhafhcap
saait
P. Alarcon et al. / Preventive V
For this herd level study, the crude within herd PCV2revalence estimate proved to be an appropriate measureo assess the level of PMWS severity in the farm. The preci-ion and power could be increased by increasing the sampleize on farm. Nevertheless, the sampling protocol, whichas targeting non-thriving and age-matched healthy ani-als in each age group, helps to increase detection of
ositive animals and its use as an indicator of severity. Totandardise the sample size recommended per herd, mod-ls will need to be developed to investigate how the sampleize affects the overall severity score.
The principal component obtained (PMWSc) hadpercentage of PCV2 PCR positive pigs’, ‘post-weaning
ortality’ and ‘MF1’ with loadings higher than 0.45 andccounted for 60% of the total variance of these three vari-bles. The fact that PCV2 and none of the other pathogensested were relevant in this component supports thatMWSc indeed is measuring a PCV2 associated disease.s farmers were asked specifically about PMWS and theisclassification process accounted for errors in clinical
igns for this syndrome, the component described hereends to measure PMWS and none or very few of thether PCV2 diseases. The presence and the high loading ofost-weaning mortality in this factor indicate the measure-ent of severity of the disease and include this variable
n the diagnostic procedure as required in the conven-ional definition. The age groups affected by the diseasend represented by MF1 in PMWSc are in agreement withhe existing literature and our data do not support thedea of a shift in morbidity to finisher pigs. During addi-ional univariate analysis, no evidence of association wasound between morbidity in finishers (MF2) and PCV2CR results. Further investigation should therefore be con-ucted to assess the possible causative role of PCV2 or otherathogens and/or husbandry factors for wasting in finisherigs.
PMWSc was normalised to a scale from 0 to 10 to facil-tate communication and for its use in future projects.lthough establishment of cut-offs values in this scale isubjective, some clear values could easily be determined.arms presenting a score higher than 6.5 were considereds highly affected while farms with a score lower than 4ere considered as not or slightly affected. The majority of
he farms were classified in the middle category. The cat-gorisation allows identification of the extreme farms, theighly or non-/slightly affected farms, but the resolution
or moderately affected farms is limited. Nevertheless, theistribution reflects the severity of PMWS in the Englisherd population before the use of the PCV2 vaccinationnd enabled us to differentiate between differently affectedarms. The authors believe that the algorithm presentedere could potentially be used to compare severity betweenountries, although presence of other diseases affectingverage mortality levels should be assessed prior to com-arison.
The severity scale presented here provides the basis to
tudy risk factors for PMWS severity, to identify husbandrynd environmental factors affecting severity, and it willlso be used to assess the efficacy of vaccination in reduc-ng PMWS severity. Ultimately these findings will feed intohe development of economic models which aim to iden-y Medicine 98 (2011) 19–28 27
tify the most cost-efficient option of PMWS control for aspecific farm.
Acknowledgments
The work was funded by a grant (BB/FO18394/1) fromthe BBSRC CEDFAS initiative, BPEX Ltd., BioBest Labora-tories Ltd. and Pfizer Animal Health Ltd. We thank BPEXfor the collaboration in this study through their PCV2vaccination programme, the numerous veterinarians whohelped with the collection of blood samples and most ofall the farmers who participated in this study. Furtherwe acknowledge Leandra Catignano and Beatriz AlvarezCampos for their help with data entry and organisation oflogistics for the farm visits.
Appendix A. Supplementary data
Supplementary data associated with this article canbe found, in the online version, at doi:10.1016/j.prevetmed.2010.09.022.
References
Allan, G., Meehan, B., Todd, D., Kennedy, S., McNeilly, F., Ellis, J., Clark, E.G.,Harding, J., Espuna, E., Botner, A., Charreyre, C., 1998. Novel porcinecircoviruses from pigs with wasting disease syndromes. Vet. Rec. 142,467–468.
Anon., 2009a. GB surveillance Pig diseases quarterly report, Q1.Veterinary Laboratories Agency. [online] http://www.defra.gov.uk/vla/reports/docs/rep survrep qtlyp0109.pdf (consulted 12 of April2010).
Anon., 2009b. Pig Yearbook 2009. British Pig Executive.Armstrong, D., Bishop, S.C., 2004. Does genetics or litters effect influence
mortality in PMWS. In: Proceedings of the 18th International Pig Vet-erinary Society (IPVS) Congress, Hamburg, Germany, p. 809.
Bartholomew, D.J., Steele, F., Moustaki, I., Galbraith, J.I. (Eds.), 2002. TheAnalysis and Interpretation of Multivariate Data for Social Scientists.Chapman & Hall/CRC.
Bett, B., Jost, C., Allport, R., Mariner, J., 2009. Using participatory epi-demiological techniques to estimate the relative incidence and impacton livelihoods of livestock diseases amongst nomadic pastoralists inTurkana South District, Kenya. Prev. Vet. Med. 90, 194–203.
Brunborg, I.M., Moldal, T., Jonassen, C.M., 2004. Quantitation of porcinecircovirus type 2 isolated from serum/plasma and tissue samples ofhealthy pigs and pigs with postweaning multisystemic wasting syn-drome using a TaqMan-based real-time PCR. J. Virol. Methods 122,171–178.
Clark, E.G., 1996. Post-weaning Multisystemic Wasting Syndrome. In:Proceedings West-Canadian Association of Swine Practitionners, pp.19–20.
Done, S., Gresham, A., Potter, R., Chennells, D., 2001. PMWS and PDNS—tworecently recognised diseases of pigs in the UK. Practice 23, 14–21.
Ellis, J., Hassard, L., Clark, E., Harding, J., Allan, G., Willson, P., Strokappe, J.,Martin, K., McNeilly, F., Meehan, B., Todd, D., Haines, D., 1998. Isola-tion of circovirus from lesions of pigs with postweaning multisystemicwasting syndrome. Can. Vet. J. 39, 44–51.
Flora, D.B., Curran, P.J., 2004. An empirical evaluation of alternative meth-ods of estimation for confirmatory factor analysis with ordinal data.Psychol. Methods 9, 466–491.
Grau-Roma, L., Hjulsager, C.K., Sibila, M., Kristensen, C.S., Lopez-Soria, S.,Enoe, C., Casal, J., Botner, A., Nofrarias, M., Bille-Hansen, V., Fraile,L., Baekbo, P., Segales, J., Larsen, L.E., 2009. Infection, excretion andseroconversion dynamics of porcine circovirus type 2 (PCV2) inpigs from post-weaning multisystemic wasting syndrome (PMWS)
affected farms in Spain and Denmark. Vet. Microbiol. 135, 272–282.Gresham, A., Thomson, J., 2001. PMWS and PDNS in Great Britain. Vet. Rec.148, 387.
Harding, J., Clark, E.G., 1997. Recognizing and diagnosing postweaningmultisystemic wasting syndrome (PMWS). J. Swine Health Prod. 5,201–203.
eterinar
28 P. Alarcon et al. / Preventive VHarding, J.C., 1996. Post-weaning Multisystemic Wasting Syndrome: pre-liminary epidemiology and clinical findings. In: Proceedings of theWest Can. Association of Swine Practitioners, p. 21.
Joreskog, K.G., Moustaki, I., 2001. Factor analysis of ordinal variables: acomparison of three approaches. Multivar. Behav. Res. 36, 347–387.
Kawashima, K., Katsuda, K., Tsunemitsu, H., 2007. Epidemiological inves-tigation of the prevalence and features of postweaning multisystemicwasting syndrome in Japan. J. Vet. Diagn. Invest. 19, 60–68.
Kennedy, S., Allan, G., McNeilly, F., Adair, B.M., Hughes, A., Spillane, P.,1998. Porcine circovirus infection in Northern Ireland. Vet. Rec. 142,495–496.
Kixmoller, M., Ritzmann, M., Eddicks, M., Saalmuller, A., Elbers, K.,Fachinger, V., 2008. Reduction of PMWS-associated clinical signs andco-infections by vaccination against PCV2. Vaccine 26, 3443–3451.
Kolenikov, S., Angeles, G., 2009. Socioeconomic status measurement withdiscrete proxy variables: is principal component analysis a reliableanswer? Rev. Income Wealth 55, 128–165.
Ladekjaer-Mikkelsen, A.S., Nielsen, J., Stadejek, T., Storgaard, T., Krakowka,S., Ellis, J., McNeilly, F., Allan, G., Botner, A., 2002. Reproduc-tion of postweaning multisystemic wasting syndrome (PMWS) inimmunostimulated and non-immunostimulated 3-week-old pigletsexperimentally infected with porcine circovirus type 2 (PCV2). Vet.Microbiol. 89, 97–114.
Lopez-Soria, S., Segales, J., Rose, N., Vinas, M.J., Blanchard, P., Madec, F.,Jestin, A., Casal, J., Domingo, M., 2005. An exploratory study on riskfactors for postweaning multisystemic wasting syndrome (PMWS) inSpain. Prev. Vet. Med. 69, 97–107.
Moustaki, I., 2001. A review of exploratory factor analysis for ordinalcategorical variables. In: Cudeck, R., Du Toit, S., Sorborn, D. (Eds.),Structural Equation Modeling: Present and Future. Scientific SoftwareInternational.
Nayar, G.P., Hamel, A., Lin, L., 1997. Detection and characterization of
porcine circovirus associated with postweaning multisystemic wast-ing syndrome in pigs. Can. Vet. J. 38, 385–386.Nielsen, E.O., Enoe, C., Jorsal, S.E., Barfod, K., Svensmark, B., Bille-Hansen,V., Vigre, H., Botner, A., Baekbo, P., 2008. Postweaning multisystemicwasting syndrome in Danish pig herds: productivity, clinical signs andpathology. Vet. Rec. 162, 505–508.
y Medicine 98 (2011) 19–28
Olvera, A., Sibila, M., Calsamiglia, M., Segales, J., Domingo, M., 2004. Com-parison of porcine circovirus type 2 load in serum quantified by areal time PCR in postweaning multisystemic wasting syndrome andporcine dermatitis and nephropathy syndrome naturally affected pigs.J. Virol. Methods 117, 75–80.
Parnetti, L., Brooks, J.O., Pippi, M., Caputo, N., Chionne, F., Senin, U., 1997.Diagnosing Alzheimer’s disease in very elderly patients. Int. J. Exp.Clin. Behav. Regener. Technol. Gerontol. 43, 334–335.
Pejsak, Z., Podgorska, K., Truszczynski, M., Karbowiak, P., Stadejek, T.,2009. Efficacy of different protocols of vaccination against porcinecircovirus type 2 (PCV2) in a farm affected by postweaning multisys-temic wasting syndrome (PMWS). Comp. Immunol. Microbiol. Infect.Dis. doi:10.1016/j.cimid.2009.09.006.
Radloff, L.S., 1977. The CES-D scale applied psychological. Measurement1, 385–401.
Segales, J., Calsamiglia, M., Domingo, M., 2003. How we diagnose post-weaning multisystemic wasting syndrome. In: Proceedings of the 4thInternational Symposium on Emerging and Re-emerging Pig Diseases,Rome.
Sibila, M., Calsamiglia, M., Segales, J., Blanchard, P., Badiella, L., Le Dimna,M., Jestin, A., Domingo, M., 2004. Use of a polymerase chain reactionassay and an ELISA to monitor porcine circovirus type 2 infection inpigs from farms with and without postweaning multisystemic wast-ing syndrome. Am. J. Vet. Res. 65, 88–92.
Sorden, S.D., 2000. Update on porcine circovirus and postweaning multi-systemic wasting syndrome (PMWS). Swine Health Prod. 8, 133–136.
Wieland, B., Alarcon, P., Velasova, M., Nevel, A., Towrie, H., Pfeiffer, D.U.,Wathes, C., Werling, D., 2010. Prevalence of endemic pig diseases inEngland: an overview six months into a large-scale cross-sectionalstudy on Post-Weaning Multi-systemic Wasting Syndrome (PMWS).Pig J. 63, 20–23.
Woodbine, K.A., Medley, G.F., Slevin, J., Kilbride, A.L., Novell, E.J., Turner,
M.J., Keeling, M.J., Green, L.E., 2007. Spatiotemporal patterns and risksof herd breakdowns in pigs with postweaning multisystemic wastingsyndrome. Vet. Rec. 160, 751–762.Yang, Z.Z., Habib, M., Shuai, J.B., Fang, W.H., 2007. Detection of PCV2 DNAby SYBR green I-based quantitative PCR. J. Zhejiang Univ. Sci. B 8,162–169.
Copyright © 2022 FDOKUMEN