Measurement of digestive disorders in the piglet at weaning and related risk factors
20
Ž . Preventive Veterinary Medicine 35 1998 53–72 Measurement of digestive disorders in the piglet at weaning and related risk factors F. Madec ) , N. Bridoux, S. Bounaix, A. Jestin CNEVA-PLOUFRAGAN, B.P.53, Zoopole Beaucemaine-Les Croix, 22440, Ploufragan, France ˆ Accepted 23 March 1997 Abstract A cohort study was carried out in France about postweaning digestive disorders in the piglet. One hundred and six farrow-to-finish farms were involved. In each of them, a batch of contemporary piglets was considered. A total of 12 034 piglets were ear-notched, evaluated during the suckling phase and weighed at weaning, at 14 and 28 days postweaning. Postweaning diarrhoea and mortality were recorded daily. Data were collected about diet composition and feed intake, housing and husbandry throughout the period. Weaning weight was 8.1 kg and weaning age was 27.2 days on average. Diarrhoea occurred in the pens after a 3–4-day latency period. Prevalence was maximun around 7 to 9 days after weaning and remained high until 21 days after Ž . weaning. Mortality was moderate 1.9% . Average daily gains were 283 and 489 g for the two subsequent 14-day periods postweaning. Descriptive multivariate methods indicated a strong pattern between diarrhoea, mortality and growth. The main risk factors associated with the Ž digestive disorders were determined. The hygiene level at the reception of the piglets cleanliness, . Ž level of temperature , management and husbandry level air quality, group size and stocking . procedure were found to be important factors leading to risky or secure profiles. In addition, the feed intake of the piglet during the first week postweaning was strongly associated with the severity of the digestive disorders over the whole 28-day postweaning period of observation. It is concluded that prevention of postweaning digestive disorders could be based on the control of zootechnical conditions. q 1998 Elsevier Science B.V. Keywords: Pig-dietary factors; Weaning; Feeding and nutrition ) Corresponding author. Tel.: q33 2 76 01 30; fax: q33 2 78 68 61. 0167-5877r98r$19.00 q 1998 Elsevier Science B.V. All rights reserved. Ž . PII S0167-5877 97 00057-3
-
Upload
independent -
Category
Documents
-
view
1 -
download
0
Transcript of Measurement of digestive disorders in the piglet at weaning and related risk factors
Ž .Preventive Veterinary Medicine 35 1998 53–72
Measurement of digestive disorders in the piglet atweaning and related risk factors
F. Madec ), N. Bridoux, S. Bounaix, A. JestinCNEVA-PLOUFRAGAN, B.P.53, Zoopole Beaucemaine-Les Croix, 22440, Ploufragan, Franceˆ
Accepted 23 March 1997
Abstract
A cohort study was carried out in France about postweaning digestive disorders in the piglet.One hundred and six farrow-to-finish farms were involved. In each of them, a batch ofcontemporary piglets was considered. A total of 12 034 piglets were ear-notched, evaluated duringthe suckling phase and weighed at weaning, at 14 and 28 days postweaning. Postweaningdiarrhoea and mortality were recorded daily. Data were collected about diet composition and feedintake, housing and husbandry throughout the period. Weaning weight was 8.1 kg and weaningage was 27.2 days on average. Diarrhoea occurred in the pens after a 3–4-day latency period.Prevalence was maximun around 7 to 9 days after weaning and remained high until 21 days after
Ž .weaning. Mortality was moderate 1.9% . Average daily gains were 283 and 489 g for the twosubsequent 14-day periods postweaning. Descriptive multivariate methods indicated a strongpattern between diarrhoea, mortality and growth. The main risk factors associated with the
Ždigestive disorders were determined. The hygiene level at the reception of the piglets cleanliness,. Žlevel of temperature , management and husbandry level air quality, group size and stocking
.procedure were found to be important factors leading to risky or secure profiles. In addition, thefeed intake of the piglet during the first week postweaning was strongly associated with theseverity of the digestive disorders over the whole 28-day postweaning period of observation. It isconcluded that prevention of postweaning digestive disorders could be based on the control ofzootechnical conditions. q 1998 Elsevier Science B.V.
Keywords: Pig-dietary factors; Weaning; Feeding and nutrition
) Corresponding author. Tel.: q33 2 76 01 30; fax: q33 2 78 68 61.
0167-5877r98r$19.00 q 1998 Elsevier Science B.V. All rights reserved.Ž .PII S0167-5877 97 00057-3
( )F. Madec et al.rPreÕentiÕe Veterinary Medicine 35 1998 53–7254
1. Introduction
The piglet does not differ from the young mammal in general in that digestiveŽ .disorders are a common threat Snyder and Merson, 1982 . The high susceptibility of the
young to digestive disorders is mainly related to the relatively immature defensemechanisms of the digestive tract to cope with the proliferation of toxin-producing
Ž .microorganisms Mezoff et al., 1991; Chu and Walker, 1993 . Unlike for the newborn,vaccination is rather inefficient in protecting the weanling piglet against Escherichia
Ž .coli-induced disorders Moon and Bunn, 1993 . As a result, digestive disorders areŽ .frequently observed during the postweaning period Svendsen et al., 1974 . Growth rate
is more or less impaired. Mortality may occur from dehydration. Sometimes theprevalence of diarrhoea is low but physical losses are excessively high, due to oedema
Ž .disease Bertschinger et al., 1992 . Despite E. coli is most often involved, the digestiveŽdisorders at weaning are thought to be of multifactorial origin Hampson and Kidder,
.1986 . However, available data concerning risk factors and hence practical preventivemeasures are scarce. Based on close collaboration with the pig industry, a researchproject was undertaken in France in 1994–1995. Preliminary works were carried out and
Ž .these included field-case studies and trials in our experimental facilities Madec, 1994 .The outcome of this preliminary study could be summarised as it follows.
A given feeding diet could be related to a wide range of clinical pictures. Theextreme situations were severe disorders with mortality in certain farms and the absenceof troubles in others.
The status of the piglet prior to weaning and the environment offered at weaningwere presumed to play the most important roles. Piglets taken from affected farms onweaning day and weaned on the same diet within our facilities did not fall ill in contrastto their littermates kept on the affected farms. Nevertheless, their growth was impairedrelative to that of piglets born and weaned in our facilities.
E. coli needed to be considered as a contributing factor in the disorders rather than asthe primary and exclusive initiating agent.
Subsequently, a cohort study was designed in order, first, to describe and to make aquantitative evaluation of the syndrome as it could occur in a sample of farms; second,to assess related risk factors. The analysis was aimed to describe risk profiles rather thanto draw out factors taken in isolation. The present paper reports on this cohort study.
2. Materials and method
2.1. The farm selection
The study relied heavily on the good will and motivation of the farmers and theirŽ .veterinarians or technicians ‘investigators’ . Therefore, the recruitment of the farmers
and of the investigators was based on volunteers. Prior to the data collection theŽinvestigators were trained by us on how to carry out the measurements with special

( )F. Madec et al.rPreÕentiÕe Veterinary Medicine 35 1998 53–72 55
.emphasis on certain points like diarrhoea measurement and they were also givenrecommendations for the farm selection:
The selected farms had to be of the intensive confinement type and involved in aproduction monitoring scheme. Furthermore, they had to be managed using the batch
Žprocedure, traditional in France weaning of a whole batch of sows on the same day,usually on thursday every three weeks in case of 7 batches or every week for the largest
.units .We asked investigators to focus on farrow-to-finish operations since this is by far the
most frequent system in the country.More than one feed company or farm organisation was involved and more than one
farm was affiliated to each of them. The investigators were asked to choose herds whichlikely would have a range in the severity of postweaning digestive disorders.
One hundred and six farms were selected. Eighty five investigators were involved.The selected farms were spread over the national territory but most of them were located
Ž .in Brittany region 77% where more than half of the national pig herd is kept. Since thistype of recruitment is not random sampling and does not guarantee ‘representativeness’of the target population, the recruited sample of farms was compared retrospectively to abroad data base. The comparison was of course limited to parameters available thatwould give a good overview of the size and productivity of the farms.
2.2. The cohort study design
In each farm, a batch of contemporary piglets was considered. The piglets wereindividually identified with an ear tag and submitted to detailed measurements frombirth to 28 days postweaning. More general data were also collected about the farmsthemselves and their health in particular. On-farm data collection was made by thefarmers and by the investigator.
2.2.1. The measurements during lactationThe piglets born alive were individually identified at birth. During lactation the
Ž .technical interventions of the farmer were recorded cross-fostering, etc. . Healthdisorders were also recorded daily by the farmer. Special attention was paid todiarrhoea, to locomotor disorders in the piglet and to farrowing and post-farrowingdisorders in the sow. Over the last week of lactation, the amount of starter feed providedwas measured for each litter. On weaning day, all the piglets were individually weighed.Once per week, the investigator made a clinical observation of the batch of piglets. Theinvestigator also described the farrowing facilities.
2.2.2. The measurements during postweaning phaseOn weaning day, the investigator came onto the farm and described the room where
Žthe weaned piglets were to be located. This description focused on material aspects type.of floor, of feeders, of waterers, of ventilation, etc. and also on hygienic conditions
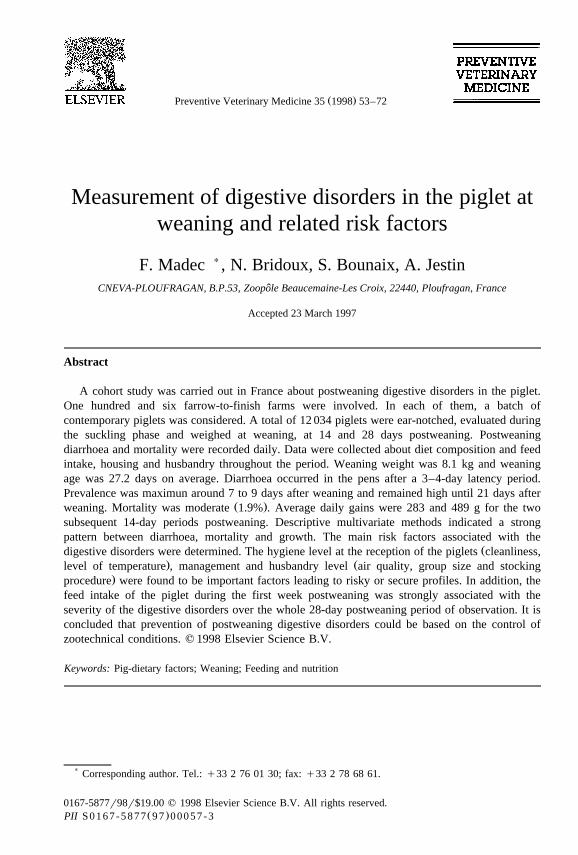
Ž .using a standard method Table 1 . From weaning onwards, a detailed observation wascarried out. The population of each pen was noticed and the litters of origin could be
( )F. Madec et al.rPreÕentiÕe Veterinary Medicine 35 1998 53–7256
Table 1ŽThe scale used to assess hygiene status at the arrival of the piglets in the weaning facilities 106 French farms,
.1994 to 1995
Ž .1. No. of days between cleaning after previous batch and the arrival of the piglets followed for the surveyŽ . Ž .2. Disinfection: Scores0 no disinfection , 2 yes
Ž . Ž .3. Dryness of the floor at the arrival of the piglets: Scores0 humid, more or less , 2 dryŽ . Ž . Ž .4. Cleanliness of the floor and of the wall between pens: Scores0 dirty , 1 "clean , 2 clean
Ž .5. Distance between the level of the slurry in the pit below the floor and the floor surface:Ž . Ž . Ž . Ž .Scores0 -40 cm , 1 40– -70 cm , 2 70–90 cm , 3 )90
Ž .6. Hygiene of the pit after removal of the previous batch of piglets :Ž . Ž .Scores0 no emptyingqno washingqno disinfection , 1 emptyingqno washingqno disinfection ,
Ž .2 emptyingqwashing"no disinfectionŽ . Ž . Ž . Ž .7. Ambient temperature at the arrival of the piglets: Scores0 -188C , 1 18–20 , 2 21–24 , 3 )24
Index valuesTotal of scores obtained
recovered through the ear tags. The farmer looked daily at the pens and he scored thediarrhoea on a scale: 0sabsence; 1spresence.
He also had to record daily other obvious problems like mortality. In the case ofmortality, he was asked to call for the veterinarian investigator. Ambient temperaturewas continuously recorded on a time scale. Feed intake was measured for each pen on aweekly basis. When he came in, once a week, the investigator also scored the diarrhoea,pen by pen, using the same scale as the farmer. He also had to record other healthproblems in the followed piglets with a special care paid to respiratory troubles.Furthermore, he had to make several measurements about the environmental conditionsprevailing in the room such as air quality, water flow and water temperature at thedrinkers. The piglets were weighed collectively at their pen level on day 14 postweaning
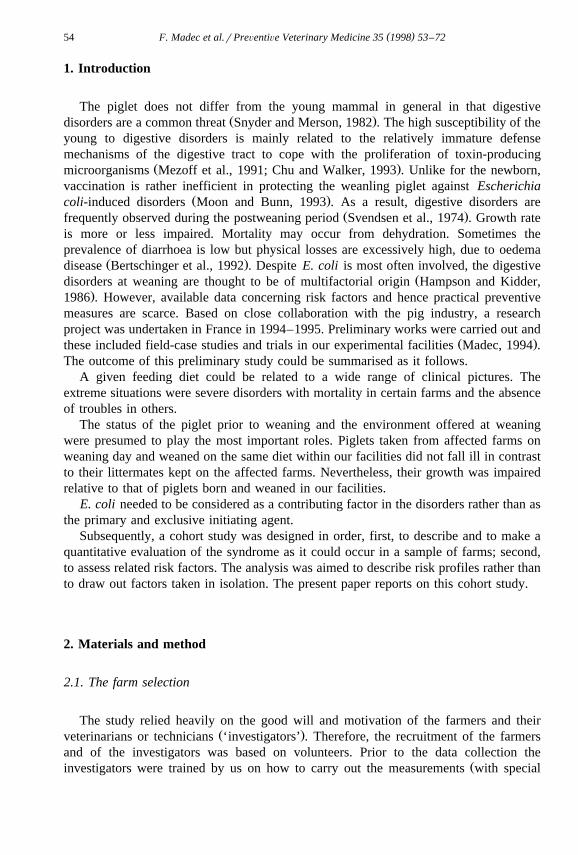
Ž .and at the end of the research period day 28 postweaning . The scales used to assesshygiene status, overall farm health level and air quality, and to score clinical signs ofrespiratory disorders are given in Tables 1–4, respectively. Data collection phase ranfrom September 1994 to January 1995.
Table 2ŽThe scale used to assess the overall farm pig health status for the 12 months prior to the survey 106 French
.farms, 1994 to 1995
Ž . Ž . Ž . Ž .1. Influenza-like syndromes clinical episodes : Scores0 absence , 1 one episode , 2 two episodesŽ .2. PRRS infection serology, Porcine Respiratory and Reproductive Syndrome :
Ž . Ž .Scores0 negative , 2 positiveŽ . Ž . Ž . Ž . Ž .3. Sow mortality %, 1-yr period : Scores1 - 1% , 2 1.5–2.5% , 3 2.5–5% , 4 )5%
Ž .4. Mortality during fattening phase 30–105 kg live weight, 1-yr period :Ž . Ž . Ž . Ž .Scores1 -1.5% , 2 1.5–2.5% , 3 2.5–3.5% , 4 )3.5%
Ž .5. Mortality during postweaning phase from weaning to 30 kg live weight, 1-yr period :Ž . Ž . Ž .Scores1 -1.5% , 2 1.5–3% , 3 )3%
Ž . Ž .6. Outbreak of neonatal diarrhoea: Scores0 no , 1 yesŽ . Ž .7. Outbreak of non haemorrhagic diarrhoea in fatteners: Scores0 no , 1 yes
Ž . Ž .8. Haemorrhagic syndromes in fattening pig: Scores0 no , 2 yesIndex valuesTotal of scores obtained
( )F. Madec et al.rPreÕentiÕe Veterinary Medicine 35 1998 53–72 57
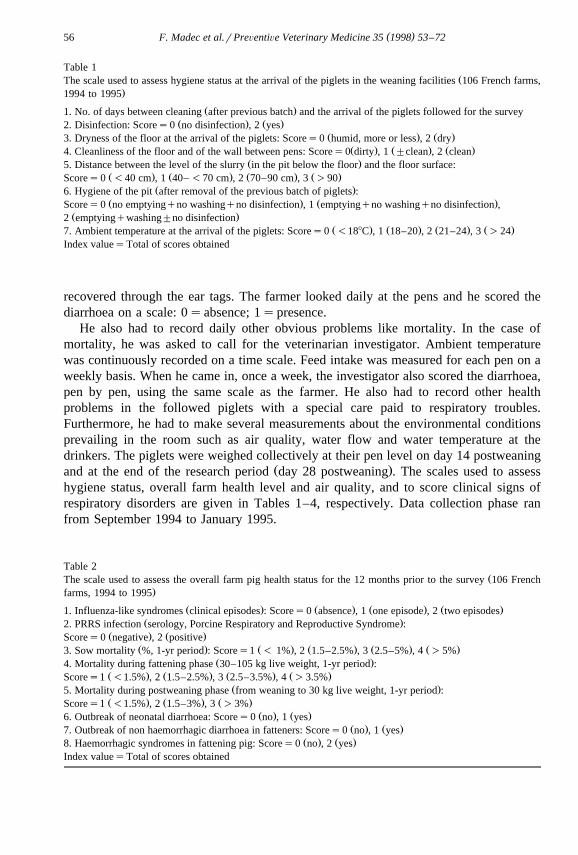
Table 3Ž .The scale used to assess ventilation quality within the postweaning rooms 106 French farms, 1994 to 1995
Agreement of the flow inside the room to the building designŽ . Ž .Air inlet: Scores0 no agreement , 1 yesŽ . Ž .Air outlet: Scores0 no agreement , 1 yes
Ž . Ž .Air presently flowing out of the slatted floor: Scores0: yes , 1 noŽ . Ž .Turbulence of the flow: Scores0 yes , 1 no
Ž . Ž .Falling down of cold air onto the lying area: Scores0 yes , 1 noŽ . Ž .Average air speed on the lying area: Scores0 G0.4 mrs , 1 -0.4 mrs
Ž . Ž .Draughts: Scores0 yes , 1 noŽ . Ž .Level of NH3: Scores0 G10 ppm , 1 -10 ppmŽ . Ž .Level of CO : Scores0 G0.15% , 1 -0.15%2
Ž . Ž .Relative humidity: Scores0 G85% , 1 -85%Index valuesTotal of scores obtained
2.3. The data set and the statistical process
2.3.1. The data setFor each farm, data were collected at different levels. They are listed in Table 5.
Ž .First is the individual level the piglet level . A total of 14 310 piglets were identifiedat birth and 12 034 piglets were individually weighed at weaning and considered fromweaning onwards. The number of descriptors available at this level is limited to five.
A second level is the litter level during suckling phase. A number of 1375 litters wereconsidered and the number of descriptors recorded at this collective level is 15.
A third level is the pen during postweaning phase. A total of 616 pens wereconsidered and 46 descriptors recorded for each.
A fourth level is the farm. The related descriptors were common for the whole batchof piglets followed from birth to 28 days postweaning. There were 106 farms involvedand 213 descriptors were used. These variables described the herd, in general, thefarrowing and postweaning facilities and their working order especially with respect to
Ž .climate temperature and air quality recordings , to hygiene procedure, to feed composi-tion and to drinking water characteristics. During the analysis several new variables
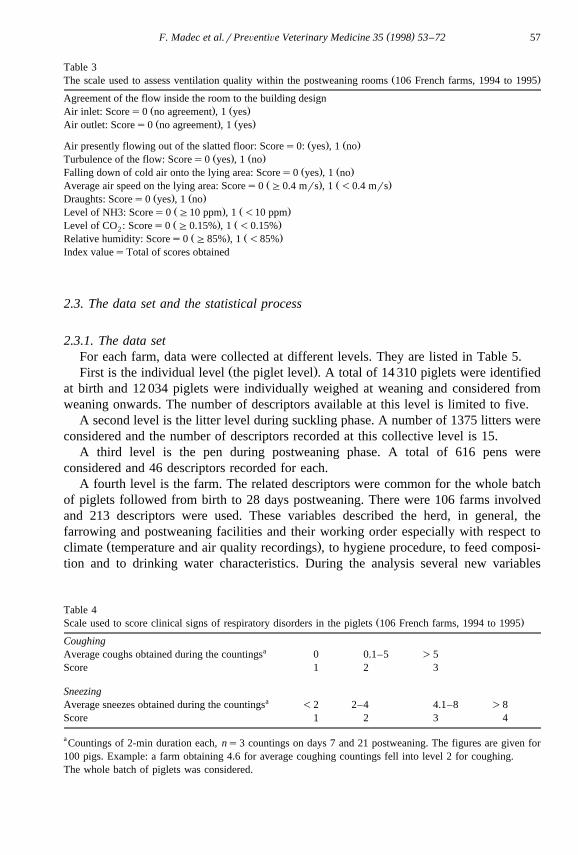
Table 4Ž .Scale used to score clinical signs of respiratory disorders in the piglets 106 French farms, 1994 to 1995
CoughingaAverage coughs obtained during the countings 0 0.1–5 )5
Score 1 2 3
SneezingaAverage sneezes obtained during the countings -2 2–4 4.1–8 )8
Score 1 2 3 4
aCountings of 2-min duration each, ns3 countings on days 7 and 21 postweaning. The figures are given for100 pigs. Example: a farm obtaining 4.6 for average coughing countings fell into level 2 for coughing.The whole batch of piglets was considered.
( )F. Madec et al.rPreÕentiÕe Veterinary Medicine 35 1998 53–7258
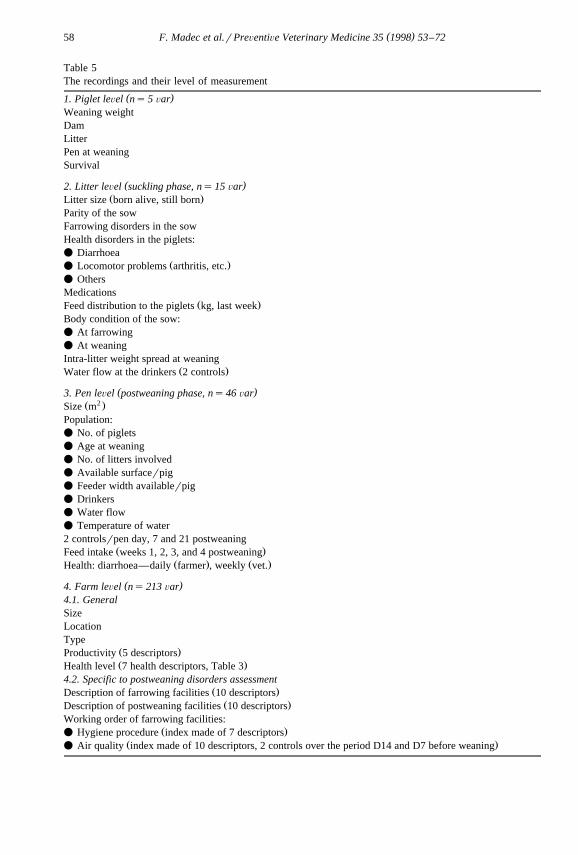
Table 5The recordings and their level of measurement
( )1. Piglet leÕel ns 5 ÕarWeaning weightDamLitterPen at weaningSurvival
( )2. Litter leÕel suckling phase, ns15 ÕarŽ .Litter size born alive, still born
Parity of the sowFarrowing disorders in the sowHealth disorders in the piglets:v Diarrhoea
Ž .v Locomotor problems arthritis, etc.v OthersMedications
Ž .Feed distribution to the piglets kg, last weekBody condition of the sow:v At farrowingv At weaningIntra-litter weight spread at weaning
Ž .Water flow at the drinkers 2 controls
( )3. Pen leÕel postweaning phase, ns46 Õar2Ž .Size m
Population:v No. of pigletsv Age at weaningv No. of litters involvedv Available surfacerpigv Feeder width availablerpigv Drinkersv Water flowv Temperature of water2 controlsrpen day, 7 and 21 postweaning
Ž .Feed intake weeks 1, 2, 3, and 4 postweaningŽ . Ž .Health: diarrhoea—daily farmer , weekly vet.
( )4. Farm leÕel ns 213 Õar4.1. GeneralSizeLocationType
Ž .Productivity 5 descriptorsŽ .Health level 7 health descriptors, Table 3
4.2. Specific to postweaning disorders assessmentŽ .Description of farrowing facilities 10 descriptors
Ž .Description of postweaning facilities 10 descriptorsWorking order of farrowing facilities:
Ž .v Hygiene procedure index made of 7 descriptorsŽ .v Air quality index made of 10 descriptors, 2 controls over the period D14 and D7 before weaning

( )F. Madec et al.rPreÕentiÕe Veterinary Medicine 35 1998 53–72 59
Ž .Table 5 continued
Working order of postweaning facilities:Ž .v Hygiene procedure 7 descriptors, Table 2
Ž .v Air quality 10 descriptors=2 controls, days, 7 and 21 postweaning, Table 4Ž .v Temperature recordings continuous, daily minrmax
Ž . Ž .Feed composition: Starter diet 30 descriptors , weaner diet 30 descriptorsŽ .Water quality 8 descriptors
Ž .Piglet health diseases other than digestiveRespiratory signs countings: Coughing, sneezing, 2 controls days, 7 and 21 postweaning
5. Others, in case of submission of piglets to the laboratoryŽ .Standard form for necropsy 30 descriptorsrpig
Ž .Standard form for investigations 24 descriptorsrpig
were calculated. As an example, ambient temperature was recorded daily. From thesefigures, the average minimal daily temperature could be calculated per week, perfortnight or for the whole period. The result is a large number of variables and inclusive,overlapping levels of measurements. The statistical process we used has been described
Ž .elsewhere Fourichon and Madec, 1990 and the general process has also been publishedŽ .Grange and Lebart, 1993 .
2.3.2. The first phase of data processingA preliminary phase was devoted to the preparation of a working data file from the
initial set of recordings. During this phase, new variables were calculated. Most of themare ‘summarised’ groups of the original data such as those described in Tables 1–4.After such calculations the original data could be set aside. Furthermore, for all thequantitative variables, histograms were drawn and the distributions were describedŽ .mean, standard deviation, median, quantiles . Accordingly, each variable was split into
Ž .classes categories so that ordinal variables were obtained. The general rule was to cutthe distributions so as to obtain approximately the same number of subjects in eachclass.
2.3.3. The measurement of postweaning digestiÕe disorders through an indexThe description of postweaning digestive disorders was based on three outcomes:
growth rate, diarrhoea and mortality. For growth and diarrhoea, the 28-day postweaningwere split into two 14-day periods. It was checked that pens and farms vary inlongitudinal prevalence and that the outcomes were interrelated. Therefore beyondclassical correlation tests, a multivariate analysis was undertaken. The process involvedthe multiple correspondence analysis and a cluster analysis also named ‘Ascending
Ž .Hierarchical Classification’ Lebart et al., 1984; Benzecri, 1992; Greenacre, 1993 . Thetwo methods were performed in combination using a specific software 1 and according
Ž .to Grange and Lebart 1993 . The classification is calculated in order to help interpreta-tion of the factorial maps coming out of the correspondence analysis. The clusters of
1 SPAD-N Version 2-5; CISIA 94160, St. Mande, France.

( )F. Madec et al.rPreÕentiÕe Veterinary Medicine 35 1998 53–7260
subjects are based on the degree of similarity of the individuals regarding the variables.The more similar the profiles of the subjects are, the closer they will appear on the
Ž .dendogram also called the classification tree, Lebart et al., 1984; Greenacre, 1993 . Thepens and the farms were successively classified and given a score on a scale, an overallindex of severity which integrated the different descriptors of the disorders. For each
Ž .level pen, farm , the index value obtained at this stage was the dependent variable forfurther calculations.
2.3.4. The search for risk factorsThe relationships between the synthetic variable obtained, the overall index for
Ž .digestive disorders and each of the putative risk factors explanatory variables of thedata set were assessed in two-by-two tables and were tested. The factors statistically
Ž .associated pF0.15 with the overall index were retained. At the end of this firstscreening stage, 10 and 65 explanatory variables were kept at pen and farm levels,respectively.
In a second stage, the multivariate statistical methods were again performed. Theobjective was now to discriminate the index values with the most relevant combinationof the up to there selected explanatory variables. The process was carried out separatelyfor the farms and the pens. The variables were offered to multiple correspondence andcluster analysis 6 to 15 at a time. The dependent variable was also included into thecalculation. A sequence of computations was performed. Among the incorporatedexplanatory variables only those that contributed positively to discriminate the overallindex values were retained for the next computation. Beyond the usefulness of thecluster analysis, the software provides outcomes such as ‘absolute’ and ‘relative’contributions that help selection. The ‘quality’ of display is given by the percentage of
Ž .inertia Greenacre, 1993 . The sequence was stopped when we could not further improvethe discrimination of farms or pens.
ŽThe dependent variable was dichotomised and this ‘final’ set 8 and 6 explanatory.variables for farm and pen levels, respectively was submitted to a logistic regression
Ž .SAS System with the aim to select the most prevailing factors. A model was builtŽ 2backward elimination, likelihood ratio X , as0.05 and the goodness-of-fit was tested
Ž .using the Hosmer and Lemeshow test Hosmer and Lemeshow, 1989 .
3. Results
3.1. An oÕerÕiew of the farm sample
The profile of the 106 farms selected is close to that of the group taken as referenceŽ .Table 6 . The average herd size was 146 sows. On average the piglets which were
Ž .followed were weaned at 27.2 days SDs2.3 and 9.8 piglets were weaned per litterŽ . Ž .SDs1.6 . Weaning weight was 8.1 kg on average SDs1.7 and average litter weight
Ž .at weaning was 79.4 kg SDs17 . The parity of the sows ranged from 1 to 11Ž .means3.5 . The average number of piglets in the postweaning rooms and in the pens

( )F. Madec et al.rPreÕentiÕe Veterinary Medicine 35 1998 53–72 61
Table 6Ž .Sample profile compared to a reference group of French pig farms 1994 to 1995
Ž . Ž .Survey sample ns106 Reference group ns1594
Mean Sd Mean Sd
Ž .Size of the herds number of sows 146 75 144 77Ž .Prolificacy Piglets born aliverlitter, 1 yr 11 0.6 11 0.6
Ž .Age at weaning days, 1 yr 27.2 1.4 27.4 1.6Piglets weanedrsowryr 23.3 1.4 23.3 1.9
Ž .Postweaning mortality %, 1 yr 2.4 1.6 2.1 1.2
Ž .Reference group source: Techni-Porc, 17, September–October 1994 ITP edn., France .
Ž . Ž .were 130 SDs30 and 19.4 SDs9 , respectively. The floor was most often totallyŽ .slatted 83% ; bedding material was never used and the rooms were ventilated with fans
Ž . 2 Ž98% . Stocking density in the postweaning pens was 0.30 m rpig on average SDs.0.07 . Over the 28 day-postweaning period, the average of the minimum temperature
Ž . Ž .daily recorded was 258C SDs1.6 whereas the maximum reached 27.28C SDs1.9 .Waterflow at the drinkers in the postweaning rooms was 1.7 lrmin on averageŽ .SDs0.9 at day 7 postweaning and it remained nearly the same at day 21. Thetemperature of the drinking water varied depending on the localisation of the pipes
Ž .within the facilities means20.68C, SDs3.2 . The piglets were ad libitum fedŽ . Ž .postweaning 90% with a pelleted diet 92% . The diet compositions were confiden-
tially obtained from the companies. Several chemical analysis were also performed.Ž .Average protein contents of the creep feed and weaner diet were 20.2% SDs1 and
Ž .18.7 SDs1 , respectively. None of the diets contained zinc above the limit of 300Ž .mgrkg. Nearly all the creep diets were medicated 94% and colistine was the most
Ž .common antibiotic 89% . Creep feed diet was in every case given through out weaning,Ž .until day 13 postweaning on average SDs3 days . Then the piglets were progressively
provided with weaner diet. All the farms were free of pseudorabies and of transmissibleŽ .gastroenteritis TGE . About 92% of the rooms had been washed and disinfected, but
spots of dirt remained in 40% of the rooms. The pit below the floor was emptied in 56%of the farms and washed in 7%. An ambient temperature lower than 188C was measuredin 20% of the rooms at the moment of populating.
3.2. Measurement of postweaning digestiÕe disorders
3.2.1. DiarrhoeaThere was relatively good agreement in the scoring of diarrhoea made by the farmer
Ž .and that made by the investigator on the day of the latter’s visit kappas0.65 .Accordingly the daily scoring made by the farmers was only considered for the latercalculations. Prevalence of diarrhoea was low over the first postweaning days; a latencyperiod of 3 to 4 days was noticed. From day 4 onwards, prevalence rised quickly and the
Ž .maximum )35% pen prevalence was reached around days 7–9 postweaning. A totalof 25% of the pens still had diarrhoea on day 22 and nearly 10% at the end of the
Ž .period. The pen-level longitudinal prevalences total days with diarrhoea scores)0

( )F. Madec et al.rPreÕentiÕe Veterinary Medicine 35 1998 53–7262
Fig. 1. Distribution of the farms on the average longitudinal prevalence obtained for diarrhoea over the 28 daysŽ .postweaning 106 French farms, 1994 to 1995 .
showed wide variation. A total of 23.7% of the pens remained safe, whereas 20% of theŽ .pens showed diarrhoea during 10 days or more medians3.6 days . Since the number
Ž .of pens considered varied from one farm to another averages6.4 pens, SDs2.6 , theaverage daily pen score was calculated for each farm. A longitudinal diarrhoea preva-lence was subsequently calculated at the farm level by simple addition of the averaged
Ž .daily values. There was a wide range in this medians4.2, Fig. 1 . There was a strongfarm effect in the sense that on affected farms diarrhoea was observed in all the pens.However, the starting day and longitudinal prevalence differed from pen-to-pen within a
Ž .postweaning room data not shown .
3.2.2. MortalityŽ .Out of the whole sample of piglets, 227 died or were euthanatised 1.9% in the first
28 days postweaning. The losses were spread all over the period but weeks 3 and 4 werethe most concerned. Necropsy examination and clinical observations indicated that 58%of the losses were due exclusively to digestive disorders. The remaining either had
Ž .severe damage to different organs in addition to the digestive tract 24% or were notŽ .concerned by digestive tract disorders 18% .
3.2.3. Growth rateŽ .Average weaning weight was 8.1 kg SDs1.7 for an average age of 27.2 days
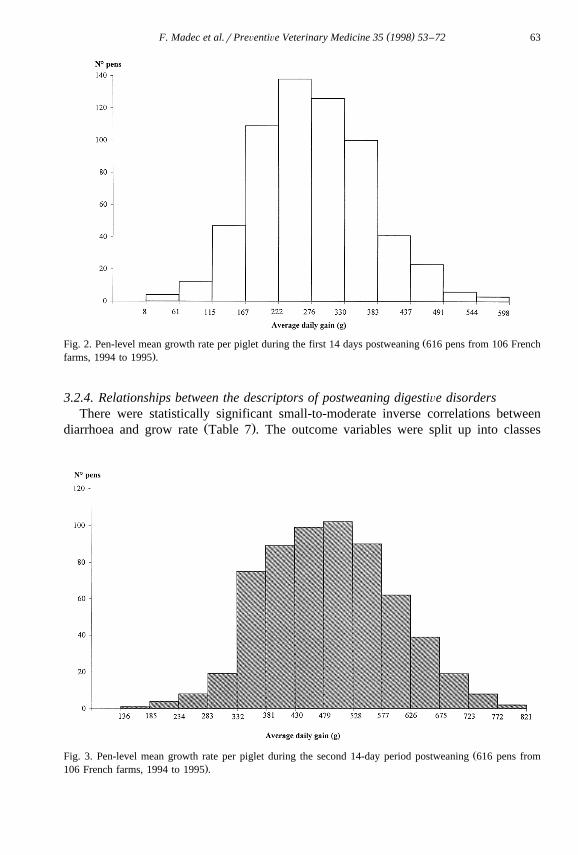
Ž .SDs2.4 . During the first 14-day postweaning phase, 20% of the pens obtained a dailyweight gain below 200 grpiglet whereas a similar proportion gained 350 g or more per
Ž .piglet Fig. 2 . The average values were 283 and 489 grpiglet for the two phasesŽ . Ž .SDs100 and 106 g , respectively Figs. 2 and 3 .
( )F. Madec et al.rPreÕentiÕe Veterinary Medicine 35 1998 53–72 63
ŽFig. 2. Pen-level mean growth rate per piglet during the first 14 days postweaning 616 pens from 106 French.farms, 1994 to 1995 .
3.2.4. Relationships between the descriptors of postweaning digestiÕe disordersThere were statistically significant small-to-moderate inverse correlations between
Ž .diarrhoea and grow rate Table 7 . The outcome variables were split up into classes
ŽFig. 3. Pen-level mean growth rate per piglet during the second 14-day period postweaning 616 pens from.106 French farms, 1994 to 1995 .

( )F. Madec et al.rPreÕentiÕe Veterinary Medicine 35 1998 53–7264
Table 7ŽCorrelations between diarrhoea score and weight gain ns616 pens, 12034 piglets in 106 French farms, 1994
.to 1995
DG1 DG2 DI1
DG1 1 y yaDG2 0.55 1 ya aDI1 y0.47 y0.23 1a a aDI2 y0.24 y0.39 0.51
aP -0.05 Spearman’s rank correlation test.DG1sDaily weight gain per piglet from weaning to day 14 postweaning.DG2sDaily weight gain per piglet from day 15 postweaning to day 28 postweaning.DI1sDiarrhoea score per pen from weaning to day 14 postweaning.DI2sDiarrhoea score per pen from day 15 postweaning to day 28 postweaning.
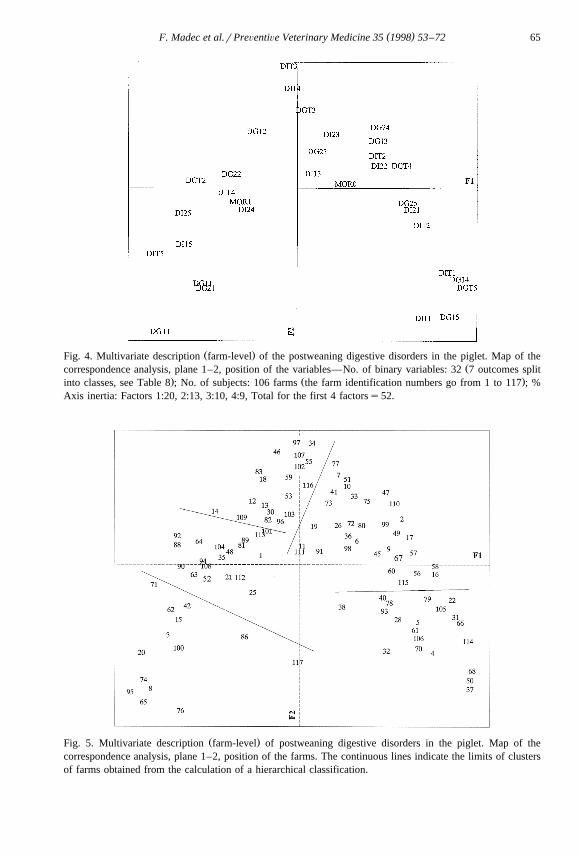
Ž .Table 8 and submitted to the descriptive multivariate methods. Factorial plane 1–2Ž .from the correspondence analysis was retained for the presentation Fig. 4 .The total
inertia was 33%. The simplest way to interpret such a map is to examine the proximities:the closer two levels of variables are plotted to each other on the map, the more oftenthey were found together in the subjects. The closer two or more farms are plotted toeach other, the more they are similar on the considered variables.
For example, on the bottom right side of Fig. 4, the highest weight gain during thew x w x w xfirst 14 days postweaning, DG15 , DG14 and during the whole 28 days DGT5 are
plotted. In this area are also plotted the lowest total prevalence of diarrhoea during thew x w xfirst fortnight DI11 and during the whole period DIT1 . That means that when the
farms had little diarrhoea, they obtained the best daily gains. The reverse situation is
Table 8Table submitted to the correspondence analysis to examine clustering of longitudinal prevalence of diarrhoeaand piglet average daily gain in order to calculate an overall index of severity of postweaning digestive
Ždisorders at the farm level Mortality was also considered despite not shown in this table: symbol MOR isŽ . Ž . .equal to 0 ns74 or 1 ns32 in the absence or presence, respectively, of losses due to digestive disorders
Levels and limitsaSymbol 1 2 3 4 5
( )AÕerage daily gain grday, per pigŽ . Ž . Ž . Ž . Ž . Ž .Postweaning days 0–14 n DG1 -200 17 200–299 40 300–349 25 350–399 13 G400 11Ž . Ž . Ž . Ž . Ž . Ž .Postweaning days 15–28 n DG2 400 18 400–449 21 450–499 24 500–549 20 G550 23Ž . Ž . Ž . Ž . Ž . Ž .Postweaning days 0–28 n DGT 300 13 300–349 21 350–399 30 400–449 29 G450 13
( )AÕerage longitudinal preÕalence of diarrhoea daysŽ . Ž . Ž . Ž . Ž . Ž .Postweaning days 0–14 n DI1 -0,1 15 0.1–0.99 17 1–1.99 19 2–4.99 33 G5 22Ž . Ž . Ž . Ž . Ž . Ž .Postweaning days 15–28 n DI2 -0,1 26 0.1–0.99 15 1–1.99 23 2–4.99 21 G5 21Ž . Ž . Ž . Ž . Ž .Postweaning days 0–28 n DIT -2 23 2–3.99 26 4–6.99 22 7–9.99 15 G10 20
a Ž .Symbols on the map Fig. 4. Examples of reading: i DG11 means an average daily gainrpiglet of less thanŽ .200 g during postweaning days 0–14; and ii DG12 means an average daily gainrpiglet between 200 and
299 g, etc.
( )F. Madec et al.rPreÕentiÕe Veterinary Medicine 35 1998 53–72 65
Ž .Fig. 4. Multivariate description farm-level of the postweaning digestive disorders in the piglet. Map of theŽcorrespondence analysis, plane 1–2, position of the variables—No. of binary variables: 32 7 outcomes split
. Ž .into classes, see Table 8 ; No. of subjects: 106 farms the farm identification numbers go from 1 to 117 ; %Axis inertia: Factors 1:20, 2:13, 3:10, 4:9, Total for the first 4 factorss52.
Ž .Fig. 5. Multivariate description farm-level of postweaning digestive disorders in the piglet. Map of thecorrespondence analysis, plane 1–2, position of the farms. The continuous lines indicate the limits of clustersof farms obtained from the calculation of a hierarchical classification.

( )F. Madec et al.rPreÕentiÕe Veterinary Medicine 35 1998 53–7266
found progressively when moving from right to left through the top of the map. It hasw x Ž .also to be mentioned that in contrast to MOR 0 absence of cause specific losses ,
w x Ž .MOR 1 presence of such losses is plotted rather on the left side area close to the zonewhere the variables attesting the most severely affected situations are plotted. Fig. 5shows the distribution of the farms on the map. The superimposition of Figs. 4 and 5allows us to characterise the farms regarding all 7 parameters simultaneously. The farms
Žplotted on the bottom at the right side are not affected by the disorders farms no. 37, 50,.68, etc. .
Advancing towards the left following the crescent-shaped distribution, the farms.become more severely affected until farms 20, 95, 74, 8, etc. . The calculation of the
hierarchical classification was undertaken in order to split up the distribution of theŽ .farms into groups clusters of homogenous profiles. The borders between the clusters
could be drawn down and they were reported on Fig. 5. Consequently, a new variablew xwas created: the overall index of severity of postweaning digestive disorders OIS . All
the farms belonging to the same cluster were given the same value for this index. Fivew x Ž .groups were made so that OIS took 5 levels from OIS1 healthy situation to OIS5
Table 9The risk factors to postweaning digestive disorders at the farm level obtained at the end of the multivariate
Ž . Ž .screening phase 106 French farms, 1994 to 1995 ; n snumber of farms
Risk factors Class order and limitsaSymbol 1 2 3 4
Ž . Ž . Ž . Ž .Hygiene status HYG -8 22 8–10 29 11–12 18 )12 37in postweaning roomat the arrival of the pigletsŽ .score, cf. Table 1
Ž . Ž . Ž . Ž .Air quality AIR -7 27 7 19 8 27 )8 33in postweaning roomŽ .score, Table 3
Ž . Ž . Ž . Ž .Overall farm OFH )16 11 12–16 35 8–11 41 -8 19health levelŽ .score, Table 2
Ž . Ž . Ž . Ž .Creep-feed CFI -190 26 190–300 27 300–470 26 )470 27intakerpiglet,last week prior
Ž .to weaning gŽ . Ž . Ž .Available manpower SrP )110 37 80–110 38 -80 31 y
Ž .sowrpersonŽ . Ž . Ž . Ž .Feed intakerpiglet FI1 -1 27 1 0–1.36 23 1.37–1.72 30 )1.72 26
during 1st weekŽ .postweaning kg
Ž . Ž . Ž .Level of concurrent RES )5 29 4–5 40 -4 37 yrespiratory disordersin the weaned pigletŽ .score, Table 4
Ž . Ž . Ž . Ž .Age at weaning days AGE -26.5 27 26.5–28.2 51 )28.2 28 y
a Examples of reading Fig. 6: HYG1 means a hygiene score of less than 8, HYG2s8FscoreF10, etc.; andFI11 means a feed intake of less than 1 kgrpiglet on the first week postweaning, etc.

( )F. Madec et al.rPreÕentiÕe Veterinary Medicine 35 1998 53–72 67
Ž .severe problem . A similar process was implemented at the pen level and clusters ofŽ .pens were obtained data not shown .
3.3. The search for risk factors
3.3.1. At the farm leÕelThe set of explanatory variables that passed through the first screening step was
submitted to a sequence of multivariate analysis. The combination of explanatoryvariables which gave the best discriminations between the farms ordered according tothe overall index they obtained is given Table 9. The map of the risk factors is notreported but the dendogram of the variables is shown Fig. 6. An overall simple principleto interpret the figure is to compare it to a sort of tree. The variables held by the samebranch are linked. The relationship is especially strong if the branch holding the
Ž .variables is ‘small,’ close to the ‘top’ where the symbols are written . For example,
Fig. 6. The farm-level dendogram of the hierarchical classification of the risk factors and the outcome variable.Ž . Ži OIS1, OIS2, . . . ,OIS5: Different levels of the outcome variable overall index of severity of postweaning
. Ž .digestive disorders . ii FI14, AGE3, AIR4, HYG4, etc.: Different levels of the risk factors.

( )F. Madec et al.rPreÕentiÕe Veterinary Medicine 35 1998 53–7268
Table 10The risk factors to postweaning digestive disorders at the farm level: the variables retained in the final logisticregression model. Conditional Odds ratio and 95% confidence interval
Variable Odds ratio 95% Confidence interval
( )Feed intaker piglet during 1st week postweaning kg-1 33.6 5.8–1921–1.36 18.6 3.0–1151.36–1.72 1.1 0.3–5
Hygiene status in postweaning rooms at the arriÕal of the piglets-8 7.8 1.1–568–10 2.6 0.5–1211–12 0.8 0.1–9.4
Air quality in postweaning rooms-7 6.8 1.1–417 2.0 0.2–218 4.3 0.7–26
( )Age at weaning days-26.5 8.5 1.1–6726.5–28.2 0.7 0.1–4.0
w x w xOIS1 and FI14 on the same small branch implies that feed intake during the firstweek postweanning is most critical regarding digestive disorders as defined over the28-day postweaning period. A special comment can also be made about the position ofw x w xOIS1 and OIS2 —healthy situation or mild disease—on the same branch coming firstfrom the trunk and forming a dense cluster thus close related to some classes of risk
Ž .factors CFJ14, HYG4, AIR4, AGE3, etc. . The limits of these desirable conditions canbe obtained by looking at Table 9.
w x ŽFinally, the dependent variable OIS was dichotomised OIS1qOIS2s reference;.OIS4qOIS5scases; OIS3sdeleted and Table 9 was offered to logistic regression. In
Ž .the final logistic model, only four explanatory variables were kept Table 10 . Thesewere: feed intake during the first week of the postweaning period, hygiene level,
Table 11The risk factors to postweaning digestive disorders at the pen level obtained at the end of the multivariate
Ž .screening phase 616 pens from 106 French farms, 1994 to 1995
Class order and limits
1 2 3 4
Ž .Liveweight of the piglets at weaning kg -7.2 7.2–8.1 8.11–9 )9Number of piglets per pen -13 13–16 17–23 )23Number of litters of origin per pen -4 4–6 7–9 )9
Ž .Feeder width available per pig at weaning cm -4.5 4.5–5.7 5.8–8.4 )8.42Ž .Stocking density m rpig at weaning -0.25 0.25–0.30 0.31–0.37 )0.37
Ž .Feed intakerpig during 1st week postweaning kg -1 1–1.34 1.35–1.8 )1.8
( )F. Madec et al.rPreÕentiÕe Veterinary Medicine 35 1998 53–72 69
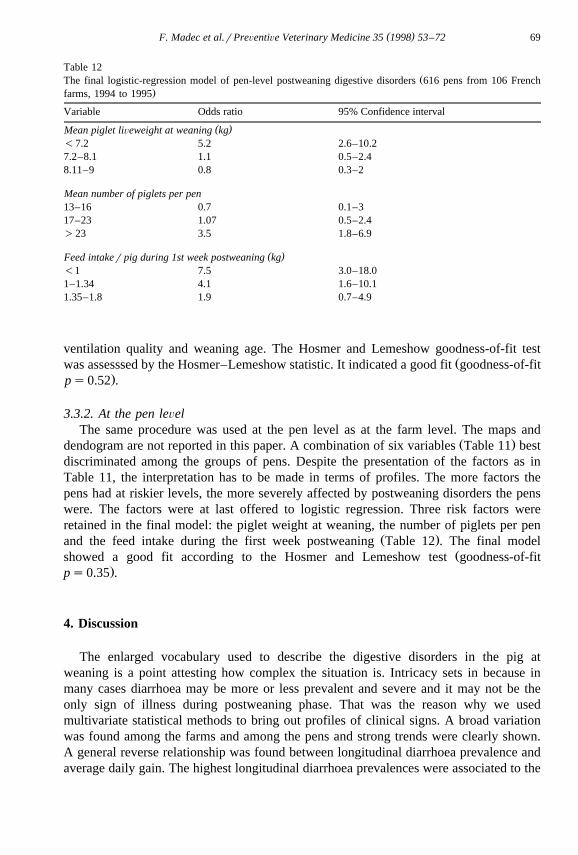
Table 12ŽThe final logistic-regression model of pen-level postweaning digestive disorders 616 pens from 106 French
.farms, 1994 to 1995
Variable Odds ratio 95% Confidence interval
( )Mean piglet liÕeweight at weaning kg-7.2 5.2 2.6–10.27.2–8.1 1.1 0.5–2.48.11–9 0.8 0.3–2
Mean number of piglets per pen13–16 0.7 0.1–317–23 1.07 0.5–2.4)23 3.5 1.8–6.9
( )Feed intaker pig during 1st week postweaning kg-1 7.5 3.0–18.01–1.34 4.1 1.6–10.11.35–1.8 1.9 0.7–4.9
ventilation quality and weaning age. The Hosmer and Lemeshow goodness-of-fit testŽwas assesssed by the Hosmer–Lemeshow statistic. It indicated a good fit goodness-of-fit
.ps0.52 .
3.3.2. At the pen leÕelThe same procedure was used at the pen level as at the farm level. The maps and
Ž .dendogram are not reported in this paper. A combination of six variables Table 11 bestdiscriminated among the groups of pens. Despite the presentation of the factors as inTable 11, the interpretation has to be made in terms of profiles. The more factors thepens had at riskier levels, the more severely affected by postweaning disorders the penswere. The factors were at last offered to logistic regression. Three risk factors wereretained in the final model: the piglet weight at weaning, the number of piglets per pen
Ž .and the feed intake during the first week postweaning Table 12 . The final modelŽshowed a good fit according to the Hosmer and Lemeshow test goodness-of-fit
.ps0.35 .
4. Discussion
The enlarged vocabulary used to describe the digestive disorders in the pig atweaning is a point attesting how complex the situation is. Intricacy sets in because inmany cases diarrhoea may be more or less prevalent and severe and it may not be theonly sign of illness during postweaning phase. That was the reason why we usedmultivariate statistical methods to bring out profiles of clinical signs. A broad variationwas found among the farms and among the pens and strong trends were clearly shown.A general reverse relationship was found between longitudinal diarrhoea prevalence andaverage daily gain. The highest longitudinal diarrhoea prevalences were associated to the

( )F. Madec et al.rPreÕentiÕe Veterinary Medicine 35 1998 53–7270
lowest daily gains and cause-specific losses in the piglets were also mainly located inthese farms. Hence, an overall index of severity of postweaning digestive disorderscombining three outcomes could be calculated. Experimental results have shown a
Ž .significant reduction in growth rate in case of diarrhoea Pajor et al., 1991 . Our workcorroborates this finding. However, our data also suggest that additional reasons are
Ž .involved since correlation was only moderate rsy0.47 . A detailed data investigationshowed that in some farms, daily gain was low despite a moderate prevalence ofdiarrhoea. On the other hand, persistent signs of scouring could be seen without adramatic impairment in daily gain. In the latter case, weeks 3 and 4 postweaning weremainly concerned, the disorders taking there a chronic, less detrimental form. Clearly,though the best growth rates were obtained in the pens free from diarrhoea. Mortality
Ž . Žrisk over the 28-day period was moderate 1.9% . In a survey in Denmark Svensmark et.al., 1989 , average mortality was 2.4% but for somewhat a longer postweaning phase. In
this Danish study, digestive disorders due to E. coli infections were thought to beinvolved in 70% of the losses which is not far from 82% of cause-specific losses in ourstudy.
Despite considerable means have been devoted throughout the world trying to get abetter understanding of the postweaning digestive problem, it remains unresolved to alarge extent. An objective of our study was to assess the practical zootechnicalconditions predisposing to the disorders on the farms. Due to the presumed connectionsbetween putative risk factors, multivariate methods were used again aiming at findingout profiles associated with the different levels of the overall index of severity of thedisorders. In the protocol of the survey, an emphasis was put on diet composition. Butthis potential risk factor was incapable of discriminating between farms according toweaning disorders. Piglet at weaning can widely differ physically and physiologicallydepending on weaning age and preweaning health. Beyond an obvious influence onpiglet weanling weight, the farmer’s decision about weaning age has other conse-quences. Creepfeed intake in the suckling piglet is really effective only after 3 weeks of
Ž .age Pajor et al., 1991; Appleby et al., 1992 . Creepfeed in turn influences digestive-tractŽstructure at the time of weaning Appleby et al., 1992; Nabuurs et al., 1993; Fraser et al.,
.1994 . In our survey, the level of creepfeed supply during the last week of sucklingphase from 20 to 27 days was 360 g on average per piglet. This value is lower than
Ž .those reported in the literature Appleby et al., 1992; Boe and Jensen, 1995 . On theother hand, the results of experimental trials have led to divergent suggestions regardingthe role of creepfeed intake ‘per se’ in the onset of postweaning digestive disordersŽ .Barnett et al., 1989; Aumaitre et al., 1995 . In a sense, litter liveweight and intra-litterhomogeneity at weaning are indicators of successful lactation. A serious issue is to knowto what extent piglet postweaning health depends on early-life events. Piglets whose
Žbirthweight or creepfeed intake were higher tended to gain more after weaning Boe and.Jensen, 1995 . Our survey has shown that average weaning weights from farm to farm
Ž .could easily vary from 6.6 to 8.4 kg means8 kg, SDs1.4 for a standard 27 days ofage. Our results suggest that it is least risky to wean piglets more than 26 days old. Buton the other hand, since reasoning in terms of profiles is wise, it becomes also evidentthat early weaning remains advisable at the condition that the other at-risk factors arenot present or in a very low number.

( )F. Madec et al.rPreÕentiÕe Veterinary Medicine 35 1998 53–72 71
Feed intake over the first week postweaning is strongly correlated to the risk ofdisease occurrence over postweaning period. A spontaneous low intake placed piglets,especially when intake was less than 1 kg over the first week postweaning in an at-riskposition. Feeding behaviour is highly variable in the piglet in the immediate postwean-
Žing period Aumaitre and Seve, 1984; Vantrimponte and Meunier-Salaun, 1989; Pajor et.al., 1991 . An irregular feed intake at this moment have consequences on digestive tractŽ .function Bolduan et al., 1988 . The hygiene status at the reception of the piglets in the
postweaning room and air quality ‘at large’ during the postweaning phase were otherimportant components of the risk profile suggesting a bridge between these parametersand feed intake. Furthermore, from experimental results, environmental conditions have
Žbeen thought to influence piglet behaviour and diarrhoea Scheepens et al., 1991; le.Dividich and Herpin, 1994 .These results are in the same line as our findings. Part of
explanation may also come from the diet that may rapidly become less palatable and lessattractive to the piglet in a polluted environment leading to a reduced spontaneousintake. On-farm conditions are such that harmful profiles combining different riskfactors can easily occur and the farmer’s skill is of paramount importance. It can beconcluded that prevention should be primarily directed towards the provision of zootech-nical profiles that reduce the risk of disease. The results of our study by drawing outlimits for each of the risk factors, limits found to be either risky or secure levels, couldbe of help. However, those results cannot be universal. Even in the country where theyhave been obtained, they have to be periodically updated.
Acknowledgements
We gratefully acknowledge the assistance provided by D. Haquin, E. Eveno and J.F.Pansart. We also thank JADE Sty for the data processing. Finally, we thank the Frenchpig industry representatives for their active participation and for the funds through theSypram organisation.
References
Appleby, M.C., Pajor, E.A., Fraser, D., 1992. Individual variation in feeding and growth of piglets: effects ofincreased access to creep food. Anim. Prod. 55, 147–152.
Aumaitre, A., Seve, B., 1984. Adaptations digestives chez le jeune porcelet. In: Physiologie et PathologiePerinatales chez les Animaux de Ferme, INRA edn. Versailles, pp. 143–151.´
Aumaitre, A., Peiniau, Madec, F., 1995. Digestive adaptation after weaning and nutritional consequences inthe piglet. Pigs News Info. 16, 373N–379N.
Barnett, K.L., Kornegay, E.T., Risley, C.R., Lindeman, M.D., Schurig, G.G., 1989. Characterisation of creepfeed consumption and its subsequent effects on immune response, scouring index and performance ofweanling pigs. J. Anim. Sci. 67, 2698–2708.
Benzecri, J.P., 1992. Correspondence Analysis Handbook. Marcel Dekker, New York.Bertschinger, H.U., Fairbrother, J.M., Nielsen, N.O., Pohlenz, J.F., 1992. Escherichia coli infections. In:
Ž .Leman et al. Eds. , Disease of Swine, 7th edn. PP 4876510. Iowa State Univ. Press, AMES.Boe, K., Jensen, P., 1995. Individual differences in suckling and solid food intake by piglets. Appl. Anim.
Behav. Sci. 42, 183–192.
( )F. Madec et al.rPreÕentiÕe Veterinary Medicine 35 1998 53–7272
Bolduan, G., Jung, H., Schnabel, E., Schneider, R., 1988. Recent advances in the nutrition of weaner piglets.Pigs News Info. 9, 381–385.
Chu, S.H.W., Walker, W.A., 1993. Bacterial toxin interaction with the developing intestine. Gastroenterology104, 916–925.
Fourichon, C., Madec, F., 1990. The application of some multivariate statistical methods in epidemiology. Anexample: a cohort study of respiratory diseases in pigs. Proc. 5th Vet. Epid. Prev. Med. Belfast, pp.153–166.
Fraser, D., Feddes, J.J.R., Pajor, E.A., 1994. The relationship between creep feeding behaviour of piglets andadaptation to weaning: effect of diet quality. Can. J. Anim. Sci. 74, 1–6.
Grange, G., Lebart, L., 1993. Traitements statistiques des enquetes, DUNOD edn. Paris.ˆGreenacre, M.J., 1993. Correspondence analysis in practice. Academic Press, London.Hampson, D.J., Kidder, D.E., 1986. Influence of creep feeding and weaning on brush border enzyme activities
in the piglet small intestine. Res. Vet. Sci. 40, 24–31.Hosmer, D.W., Lemeshow, S., 1989. Applied Logistic Regression. Wiley, New York.le Dividich, J., Herpin, P., 1994. Effects of climatic conditions on the performance, metabolism and health
status of weaned piglets: a review. Livestock Prod. Sci. 38, 79–90.Lebart, L., Morineau, A., Warwick, K.W., 1984. Multivariate descriptive statistical analysis. Correspondence
analysis and related techniques for large matrices. Wiley, New York.Madec, F., 1994. Utility of obtaining descriptors prior to ecopathological studies. Vet. Res. 25, 92–97.Mezoff, A.G., Jensen, N.J., Cohen, M.B., 1991. Mechanisms of increased susceptibility of immature and
weaned pigs to Escherichia coli heat-stable enterotoxin. Pediatr. Res. 29, 424–428.Moon, H.W., Bunn, T.O., 1993. Vaccines for preventing enterotoxigenic Escherichia coli infections in farm
animals. Vaccine 11, 213–220.Nabuurs, M.J.A., Hoogendoorn, A., van der Molen, E.J., van Osta, A.L.M., 1993. Villus height and creep
depth in weaned and unweaned pigs, reared under various circumstances in the Netherlands. Res. Vet. Sci.55, 78–84.
Pajor, E.A., Fraser, D., Kramer, D.L., 1991. Consumption of solid food by suckling pigs: individual variationand relation to postweaning performance. Appl. Anim. Behav. Sci. 32, 139–155.
Scheepens, C.J.M., Hessing, M.J.C., Laaraker, E., Schouten, W.G.P., Tielen, M.J.M., 1991. Influences ofintermittent daily draught on the behaviour of weaned pigs. Appl. Anim. Behav. Sci. 34, 69–82.
Snyder, J.D., Merson, M.H., 1982. The magnitude of the global problem of acute diarrhoeal disease: a reviewof active surveillance data. Bull. WHO 60, 605–613.
Svendsen, J., Larsen, J.L., Bille, N., 1974. Outbreaks of postweaning E. coli diarrhoea in pigs. Nord. Vet.Med. 26, 314–322.
Svensmark, B., Nielsen, K., Willeberg, P., Jorsal, S.E., 1989. Epidemiological studies of piglet diarrhoea inintensively managed danish sow herds. Acta Vet. Scand. 30, 55–62.
Vantrimponte, M.N., Meunier-Salaun, M.C., 1989. Activite alimentaire des porcelets allaites et sevres en´ ´ ´relation avec l’environnement en maternite. J. Rech. Porcine France 21, 301–308.´