The Greater Yellowstone Ecosystem: Challenges for Regional Ecosystem Management
Upload
khangminh22Category
view
2download
0
Article
Assessing the Long-Term Ecosystem ProductivityBenefits and Potential Impacts of ForestsRe-Established on a Mine Tailings Site
Juha M. Metsaranta 1,*, Suzanne Beauchemin 2, Sean Langley 2, Bryan Tisch 2 and Phyllis Dale 3
1 Natural Resources Canada, Canadian Forest Service, Northern Forestry Centre, 5320-122 Street,Edmonton, AB T6H 3S5, Canada
2 Natural Resources Canada, CanmetMINING, 555 Booth Street, Ottawa, ON K1A 0G1, Canada;[email protected] (S.B.); [email protected] (S.L.); [email protected] (B.T.)
3 Natural Resources Canada, Canadian Forest Service, 580 Booth Street, Ottawa, ON K1A 0E4, Canada;[email protected]
* Correspondence: [email protected]; Tel.: +1-343-292-8562
Received: 27 September 2018; Accepted: 7 November 2018; Published: 14 November 2018 �����������������
Abstract: Restoring sites disturbed by industrial activity to a forested condition can ensure thecontinued provision of economic and ecosystem services from these areas. Impounded mine tailingsare particularly challenging sites, and positive benefits of establishing trees must be balanced againstrisks associated with metal contamination, ongoing tailings stability, and the possibility of acidmine drainage. We used a hybrid biometric modelling approach based on dendrochronologicalreconstruction to retrospectively (1980–2015) quantify productivity and carbon dynamics of pineplantations growing on impounded mine tailings at the Vale waste management facility nearSudbury, Canada. Historical reclamation practices had remediated conditions sufficiently to allowconifer plantation establishment in the late 1970s. The revegetated sites were highly productive,when compared to reference conditions based on site index, wood volume growth, and ecosystemproduction, congruent with other studies showing that forests on revegetated post mining sites can behighly productive. However, metal concentrations in the forest floor were high, and further researchis warranted to evaluate ecosystem impacts. Due to the requirement for energy-intensive inputs,we estimated that it took 12 years or more to recover the emissions associated with the revegetationprocess through C accumulated in biomass and soil at the revegetated sites.
Keywords: mine reclamation; acidic tailings; climate change mitigation; tree-ring analysis;CBM-CFS3; dendrochronology; wood production; ecosystem production; carbon stocks
1. Introduction
Canada’s forested regions contain significant mineral and energy resources, the extraction ofwhich contributes to the fulfillment of society’s needs for goods and services and makes a significantcontribution to the national economy. Large amounts of minable resources have been and will continueto be extracted. One of the consequences of this is that the areas on which this activity takes place aresubject to severe disturbance, which will require reclamation or restoration in order to be returned to aproductive forested state and ensure the continuation of social license [1,2]. Returning industriallydisturbed sites to a forested condition is critical to ensuring that these sites continue to provide avariety of both economic and ecosystem services. However, successful revegetation in boreal forestscan take decades [3] and must take into account that forests are complex ecosystems consisting oflong-lived plants where successional changes, through multiple pathways, can often take decadesor centuries [4]. Revegetation must also be resilient to future changes in climate that will influence
Forests 2018, 9, 707; doi:10.3390/f9110707 www.mdpi.com/journal/forests
Forests 2018, 9, 707 2 of 23
many ecosystem processes in Canadian boreal forests [5]. Activities undertaken in the forest sector areone of a potential suite of actions that could be undertaken to mitigate the potential effects of climatechange [6]. The rehabilitation of industrially disturbed forest lands has been recognized as one possibleactivity to achieve these goals, but the potential of forests established on revegetated industrial sites tocontribute has not been adequately quantified [7].
Impounded mine tailings are an example of an industrially disturbed site that presentsrevegetation challenges. Such sites are typically carbon (C) and nutrient depleted, have a massive soilstructure, contain high concentrations of metal contaminants and can be acid-generating [8]. An exampleof such a site, which also has a long and rich history of revegetation trials, can be found on the Valewaste management facility within the city of Greater Sudbury, Ontario, Canada [9–14]. In the regionsurrounding the city of Greater Sudbury, smelting activities in the 20th century created large areas ofmetal-contaminated, phytotoxic land, which have in many cases been successfully revegetated [15,16],a process that continues to be implemented through a regreening program. The long-term effects of thisprogram on ecosystem recovery continue to be evaluated and improved [17,18]. Similar to industriallydamaged forests in the region, the historical reclamation practices on these impounded mine tailingsconsisted mainly of adding inorganic fertilizers, lime and/or mulch as needed to establish pioneerplant communities of grass and legume [10,11]. By the mid-1970s, conditions had been sufficientlyremediated in some parts of the Vale waste management facility to enable a tree planting program toestablish conifer plantations [10,11]. Additional considerations with any activity to revegetate tailingsin humid and cold climates are maintenance of the stability of the tailings, prevention of acid minedrainage, and minimizing the transfer of metal contaminants to the surrounding environment [19,20].
In this paper, we evaluate wood volume production, accumulated ecosystem C stock in bothbiomass and soil, and annual rates of ecosystem production at 35- to 40-year-old jack pine (Pinusbanksiana Lamb.) plantations established at the Vale waste management facility. Ecosystem Csequestration was examined in terms of three key ecosystem C fluxes: net primary production(NPP), net ecosystem production (NEP), and heterotrophic respiration (Rh). We used a hybridbiometric-modelling approach that relies on dendrochronological stand reconstruction data [21–23]to generate inputs to an ecosystem model, the Carbon Budget Model of the Canadian Forest Sector(CBM-CFS3, [24]) to perform these evaluations. We also compared the restored plantation sites tovarious validation and reference conditions. These included, (1) control sites at similar pine plantationslocated in managed forests in the Sudbury region, (2) average expected growth trajectories for jack pineforests in the province of Ontario as used in forestry management planning, (3) annual net ecosystemproduction estimates for jack pine forests regenerating after fire and harvest disturbance, as determinedby eddy covariance studies, and (4) measurements of total soil organic C stock at the revegetated sites.The main objective of the study was to demonstrate that the productivity of restored forest stands,where typically few sites are available for generating estimates, can successfully be recovered usingtree-ring approaches, and to determine how these compare to reference conditions. An additionalobjective was to provide insight into the distribution of metal contaminants (mainly Cu and Ni) in therevegetated tailings profile, and to determine if there was any evidence that forest restoration activitywas generating risks to the stability of the tailings or increasing the possibility of acid mine drainage.Finally, we also comment on the question of whether there is any reasonable potential that forestrestoration activities on highly disturbed industrial lands could result in any climate mitigation benefitwhen considering the GHG emissions of the amendments and the management activities needed toundertake the revegetation.
2. Materials and Methods
2.1. Study Region
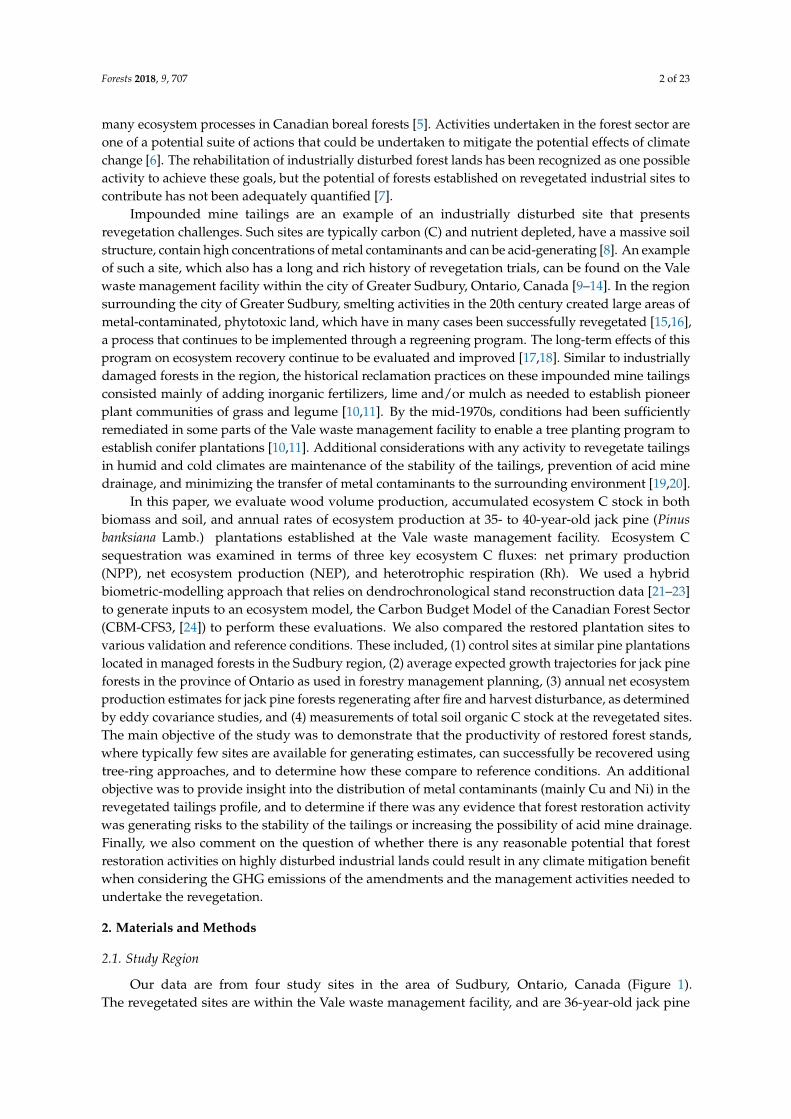
Our data are from four study sites in the area of Sudbury, Ontario, Canada (Figure 1).The revegetated sites are within the Vale waste management facility, and are 36-year-old jack pine
Forests 2018, 9, 707 3 of 23
plantations characterized by an organic layer that has accumulated over the years at the surface ofoxidized, acid-generating Cu-Ni mine tailings. The tailings’ surface is relatively flat, lying at an averageelevation of about 320 MASL and covering an area of approximately 2500 ha. About half of the totalarea (1300 ha) is currently inactive (i.e., no longer receiving deposits of fresh tailings) and undergoingremediation. The total depth of tailings varies within the inactive impoundment from less than 1 m upto dozens of metres deep, depending on location. The water table varies seasonally, with lower-lyingareas of the tailings being fully saturated during spring. In summer, the water table typically dropsto about 2 m below the surface. At higher elevations (e.g., localized mounds of tailings), the upper,oxidized strata of the tailings remain unsaturated throughout the year.
Forests 2018, 9, x FOR PEER REVIEW 3 of 22
oxidized, acid-generating Cu-Ni mine tailings. The tailings’ surface is relatively flat, lying at an average elevation of about 320 MASL and covering an area of approximately 2500 ha. About half of the total area (1300 ha) is currently inactive (i.e., no longer receiving deposits of fresh tailings) and undergoing remediation. The total depth of tailings varies within the inactive impoundment from less than 1 m up to dozens of metres deep, depending on location. The water table varies seasonally, with lower-lying areas of the tailings being fully saturated during spring. In summer, the water table typically drops to about 2 m below the surface. At higher elevations (e.g., localized mounds of tailings), the upper, oxidized strata of the tailings remain unsaturated throughout the year.
Figure 1. Location of the study area, near Sudbury, Ontario, Canada.
The inactive tailings are subdivided for management purposes into areas designated by capital letters [9–12]. The study sites, which are located in an area referred to in previous publications [9–12] as the CD area, were established as part of a related project examining the biogeochemical evolution of acidic tailings under different reclamation strategies [20,25,26]. The CD area is about 132 ha in size including a central lake [9–12]. The two sampling sites were visually representative of the types of forested conditions currently found within the CD area, but they were not in a strict sense randomly located. Vegetation was re-established on these sites using the historical approach of applying fertilizers, limestone, and mulch in combination with a transition period with grass or legume crops prior to the establishment of a conifer plantation [9–12]. The details of the specific activities and amendments applied at the study sites, reconstructed to the best of our ability from historical reports [9–12], are summarized in Table S1. The main goal when revegetation activity initially began on this site was simply to establish vegetation to control blowing dust [11]. As a control, two additional sites were sampled in 44- and 45-year-old pine plantations, established following forest harvest in the managed forest that surrounds the Sudbury area, ~40–50 km away from the tailings site. A summary description of the basic characteristics of each revegetated and control site is provided in Table 1. The study region is located in the Boreal Shield ecozone of Canada’s national terrestrial ecosystem classification system [27], and the sites are within ecoregions 4E and 5E of the ecological land classification system of the province of Ontario [28]. Over the 30 years prior to sampling, the mean annual temperature in the general study region was 4.5 °C (range 2.8 to 6.2 °C) with an average annual precipitation of 895 mm (range 685 to 1086 mm).
Figure 1. Location of the study area, near Sudbury, Ontario, Canada.
The inactive tailings are subdivided for management purposes into areas designated by capitalletters [9–12]. The study sites, which are located in an area referred to in previous publications [9–12]as the CD area, were established as part of a related project examining the biogeochemical evolutionof acidic tailings under different reclamation strategies [20,25,26]. The CD area is about 132 ha insize including a central lake [9–12]. The two sampling sites were visually representative of thetypes of forested conditions currently found within the CD area, but they were not in a strict senserandomly located. Vegetation was re-established on these sites using the historical approach ofapplying fertilizers, limestone, and mulch in combination with a transition period with grass orlegume crops prior to the establishment of a conifer plantation [9–12]. The details of the specificactivities and amendments applied at the study sites, reconstructed to the best of our ability fromhistorical reports [9–12], are summarized in Table S1. The main goal when revegetation activityinitially began on this site was simply to establish vegetation to control blowing dust [11]. As a control,two additional sites were sampled in 44- and 45-year-old pine plantations, established following forestharvest in the managed forest that surrounds the Sudbury area, ~40–50 km away from the tailings site.A summary description of the basic characteristics of each revegetated and control site is providedin Table 1. The study region is located in the Boreal Shield ecozone of Canada’s national terrestrialecosystem classification system [27], and the sites are within ecoregions 4E and 5E of the ecologicalland classification system of the province of Ontario [28]. Over the 30 years prior to sampling, the meanannual temperature in the general study region was 4.5 ◦C (range 2.8 to 6.2 ◦C) with an average annualprecipitation of 895 mm (range 685 to 1086 mm).
Forests 2018, 9, 707 4 of 23
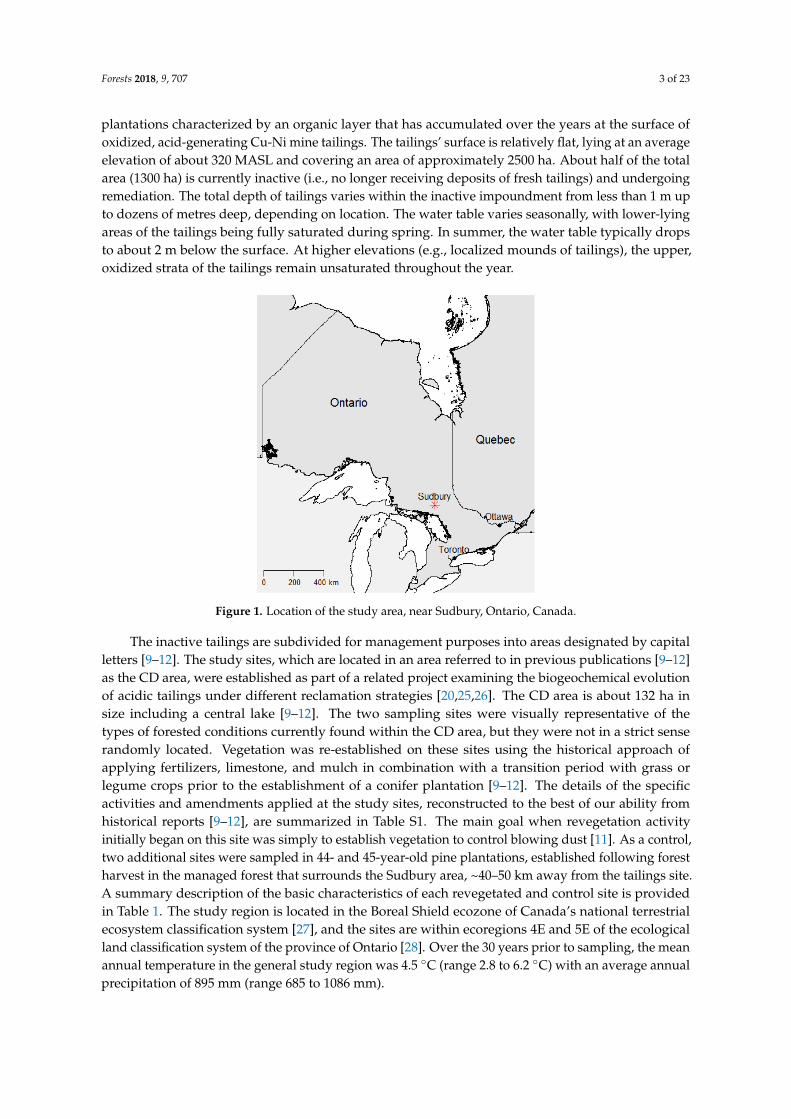
Table 1. Basic characteristics of each study site.
Study Site Plot Mean (SD)DBH (cm)
Mean (SD)Height (m)
Top Height(m) 1 Site Index 2 Live (Dead) Density
(stems ha−1)Total Age (years) 3
(year established)Breast HeightAge (years) 4
SpeciesComposition 5
Control CartierKukagami
14.9 (2.9)19.2 (4.9)
15.1 (1.3)19.2 (2.6)
16.121.0
1823
2089 (933)1556 (356)
44 (1972)45 (1971)
39 (1.1)40 (1.6)
PJ10PJ6PR4
Revegetated CDCD-SLOPE
24.7 (6.8)20.0 (3.6)
13.5 (2.3)16.0 (0.7)
15.116.6
2022
489 (89)756 (89)
36 (1980)36 (1980)
30 (1.1)30 (2.1)
PJ10PJ10
1 mean height of tallest 50% of trees at time of sampling. 2 at base age 50, calculated from top height and breast height age using equation 3 in [29]. 3 based on ring counts plus estimatedmissing rings on n = 3 cores taken at ground level at each study plot. 4 mean (SD) of ring count plus estimated missing rings on all live trees at time of sampling. 5 based on stem numberat time of sampling, PJ is jack pine, PR is red pine.
Forests 2018, 9, 707 5 of 23
2.2. Tailings Site Description
2.2.1. Site Establishment
There is some uncertainty about when trees were established at the revegetated sites. One studymentions that conifers were first planted in the CD area of the Vale tailings in 1972, with a range of5–15 thousand trees planted annually in the late 1970’s and early 1980’s [10]. Another suggests aneven earlier date, in or around 1961 [12], likely coinciding with overall revegetation program inceptionrather than tree establishment at these locations. The mean breast height ring count in 2015 for bothrevegetated sites was 30 years, implying that trees reached 1.3 meters in height, on average, in 1985.A typical number of years for jack pine to reach breast height in this region is 8 years [30], giving anage in 2015 of 38 years and an establishment date of 1977. Ring counts obtained on samples very closeto the ground contained a maximum of 33 rings, implying that trees were established in 1982. We used1980 as the establishment date, which is between these two estimates, and is consistent with the timingof tree establishment at this site implied in [9]. Tree-ring counts have not previously been obtained atthese sites, so we believe our establishment date estimate is close to correct.
2.2.2. Site Conditions
We provide here some additional description about the likely properties of the tailings before jackpine plantations were established. In the absence of original data, we relied on information reportedin previous studies to determine the chemical and mineralogical composition of the tailings at therevegetated sites and to establish the presence of an oxidized tailings layer prior to tree establishment.The composition of tailings will vary with the properties of the mined ore. The average mineralogicalcomposition of the Vale tailings was characterized by pyrrhotite (Fe7S8) as the main sulfide mineral(~5.6 wt. % = 2.0 wt. %S), with pentlandite ((Fe, Ni)9S8, 0.5 wt. %) and chalcopyrite (CuFeS2, 0.3 wt.%)in lesser amounts [10], and various gangue silicates including quartz, albite, clinochlore, phlogopiteand amphibole [20]. Given that chalcopyrite is the unique source of Cu, this would represent anaverage total concentration of 1039 mg Cu kg−1 in the tailings during that time. The CD area had areported a sulfur content of 5.4 wt. % in the unweathered tailings (2 to 3 m below the surface) [31].These data are in the same range as concentrations measured in unoxidized Vale tailings from anadjacent, more recent impoundment, with 1635 to 1785 mg Cu kg−1, 2.35 to 5.35 wt. % of total S,and pH ranging from 3.8 to 5.0 [25]. Early grass seeding trials at this site failed mainly due to low pH,which required the addition of limestone [10,11]. This indicates that the pH of the tailings was initiallyvery low, thus suggesting the presence of an oxidized layer. The occurrence of an oxidized layer at thesurface is important to consider because the mineralogy of oxidized tailings (dominated by oxides andsulfates) differs significantly from that of the original tailings (dominated by sulfides). In Vale, oxidizedtailings iron oxyhydroxide phases are abundant, with gypsum (CaSO4·2H2O), goethite (α-FeOOH)and jarosite (KFe3(SO4)2OH6) as the main secondary minerals resulting from sulfide oxidation [20,32].
2.3. Sampling and Processing
2.3.1. Tree Data
Data on past growth trajectories were obtained by dendrochronological stand reconstruction [21–23].This involves obtaining increment core samples from all live and dead trees at fixed area forest plots,and can reliably generate estimates of past growth for several decades into the past, depending on deadtree persistence [33]. At the revegetated site, two 225 m2 (15 m × 15 m) plots were sampled in October2015. Identical plots were sampled at each control site in July 2016. A full census was made of alllive and dead trees present at sampling. Height was measured on living trees; breast height diameter(DBH) on all trees. Two randomly oriented breast height cores were extracted from all living trees anda cross-sectional disc cut from all standing dead trees and downed logs. Samples were processed usingstandard dendrochronological methods, measured with WinDendro (Regent Instruments, Quebec,
Forests 2018, 9, 707 6 of 23
Canada) and cross-dated against site master chronologies developed from a subset of dominant treesat each site. All sample processing and measurement was conducted at the Northern Forestry Centreof Natural Resources Canada, Edmonton, Alberta. Due to decomposition, ring-widths could not bemeasured on 1.8% of trees at the control sites, for which ring-widths and year of death were estimatedfrom the 3 larger and 3 smaller trees nearest in diameter. The mean absolute difference between trueand estimated year of death using this method is 3.3 (SD 2.4) years when applied to jack pine treeswith known year of death [34]. No trees were excessively decomposed at the tailings site. The timingof mortality and downed log persistence suggest 30–50 years into the past as a reliable reconstructionperiod [22,33]. Because our sites are plantations and generally younger than this persistence period,we considered our reconstruction of growth in this case to be reliable since stand establishment.
2.3.2. Soil Data
Soil samples were collected at both revegetated sites in order to measure the main metalcontaminants (Cu, Ni, Fe) and the organic C content of the revegetate tailings profile. Four randomlocations, 20 m apart, were sampled at each site. At each location, a composite sample of the forestfloor and surface litter was collected, then two 50-cm plexiglass columns were used to retrieve intactvertical core samples that included the barely decomposed litter and humus portions of the forestfloor (FF) and the underlying oxidized tailings. These samples were transported on ice packs to thelaboratory, where the cores were split into distinct layers: forest floor, the interface between forestfloor and oxidized tailings, and the 0 to 5 and 5 to 15-cm layers of the oxidized tailings. No samplecould be obtained from the bottom layer of unoxidized tailings due to tailing oxidation depth down to80 cm depending on the locations and the occurrence of a hard pan layer at <20 cm depth. Total Cin the samples was determined by combustion and infrared detection of CO2 using an Eltra CS-2000analyzer. The inorganic C was determined the same way after removal of organic C by combustionat 400–450 ◦C for 12 h. The organic C was obtained by difference. The pH was measured in distilledwater with a 1:2 ratio (solids/water; w/v) for tailings and a 1:10 ratio for organic layers. Total Cu, Niand Fe contents of tailings were determined for the CD-slope site only and were obtained by an aciddigestion with HCl, HNO3, HF and HClO4 [35] followed by ICP-AES.
2.4. Reconstructing Past Growth Trajectories
2.4.1. Tree Diameter and Height
The annual DBH height (inside bark Dib) was determined for each tree from the arithmetic meanof the cumulative ring-widths on each of two measured radii, correcting first where needed for thenumber of missing rings, distance to missed pith, and shrinkage. Diameter inside bark (Dib, cm) wasconverted to diameter outside-bark (Dob, cm) using:
Dob = Dib/k (1)
where k was assumed to be 0.964 for jack pine [22] and 0.951 for red pine [36]. An initial estimate ofheight (Hi, m) was predicted from Dob (=D) using the Richards function
Hi = 1.3 + a (1 − e−bD)c (2)
where parameters a, b, and c were obtained from [34]. A correction factor derived from the ratio ofthe predicted and observed height at the time of sampling was then applied to the past estimates ofheight, such that the final estimated height was equal to measured height at the time of sampling.These corrected past heights (Hc) were then used to estimate past stand heights (SHT, m), and used to
Forests 2018, 9, 707 7 of 23
generate a second estimate of height using a model that also relies on stand height in addition to standbasal area (BA, m2 ha−1), and stand density (TPH, stems ha−1) [37]
H f = 1.3 + (θ)(SHT)δ(
1 − e−β(TPH/BA)ϕD)γ
(3)
where parameters θ, δ, β, ϕ and γ were obtained from [37]. This second estimate of height was alsoadjusted by the same tree-specific correction factor to generate a final estimate of height (Hf, m),which reduces the error associated with estimating whole tree growth from increment cores taken atbreast height only [38].
2.4.2. Wood Volume
Total volume (VT, m3) was estimated using Honer’s [39] standard volume equation
VT =0.0044D2 (1 − 0.0437B2)
2(C1 +
0.3048C2H f
) (4)
Parameters C1, C2, and B2 were obtained from [39]. Merchantable volume (VM, m3) was determinedusing the adjusted squared diameter method [39] using the merchantability criteria assumed forOntario by the CBM-CFS3 [24,40,41]. Tree values were summed to obtain stand-level volume (m3 ha−1)and differenced to obtain volume increment (m3 ha−1 year−1).
2.5. Estimating Ecosystem Production and Carbon Stock
2.5.1. Carbon Budget Model of the Canadian Forest Sector (CBM-CFS3)
Reconstructed estimates of merchantable volume increment were used as inputs to the CarbonBudget Model of the Canadian Forest Sector (CBM-CFS3 [24]). The CBM-CFS3 uses these datain combination with other information to derive annual resolution estimates of past NPP, NEP,and Rh, as well as ecosystem C stock [22,23]. The model is described in existing publications [24,41].In brief, it tracks three above-ground (foliage, merchantable stemwood, other biomass) and twobelow-ground (coarse roots and fine roots) biomass C pools by species group (softwoods andhardwoods). Models stratified by species and terrestrial ecozone are used to estimate above-groundbiomass C from merchantable volume [40]. Below-ground biomass C is estimated from above-groundbiomass C and species group [42]. Annual turnover of each biomass component is assigned to deadorganic matter (DOM; standing and downed dead wood) C pools using litterfall transfer parameters(% year−1). Soil and DOM C stocks are tracked using eleven pools. Temperature-dependent annualdecay decomposes the C in these pools, some of which is released to the atmosphere and the remaindertransferred to a stable, slowly decomposing pool from which decay releases all C to the atmosphere.
2.5.2. Mean Annual Temperature
The CBM-CFS3 uses historical mean annual temperature to estimate past inter-annual variation inRh. This was obtained from station records in the Sudbury area extracted from Meteorological Serviceof Canada’s online archive using the Canadian Climate Data Scraping Tool [43].
2.5.3. Uncertainty Analysis
An uncertainty analysis was conducted in order to determine confidence intervals for the standreconstruction estimates of ecosystem C stocks and fluxes [44]. Confidence intervals were derived fromthe 2.5th and 97.5th percentiles of n = 100 Monte Carlo simulations for each plot, where the simulationsaccount for uncertainty in net biomass increment, litterfall, and soil and DOM C modelling parameters.Briefly, a triangularly distributed ±50% multiplier was applied to modelled net biomass incrementto estimate uncertainty attributable to allometric models used to determine the input merchantable
Forests 2018, 9, 707 8 of 23
volume time series, and in the CBM-CFS3 to estimate biomass. Uncertainty attributable to biomassturnover and soil and dead organic C modelling parameters was estimated by varying 32 of theseparameters, using probability distributions derived from literature values [44].
2.5.4. Soil and DOM C Initialization
An issue with modelling C dynamics on revegetated sites is the uncertainty about the initialsoil and DOM C stock. These pools are usually initialized by repeated iterations of growth andstand-replacing disturbance until the difference between the total C in slowly decaying pools insuccessive iterations is less than 1%, followed by one additional disturbance reflecting the last knowndisturbance type. This procedure is assumed on average to yield soil and DOM C conditions consistentwith the disturbance history of the stand [24] and is valid for the control sites in the managed forest,which were known to be established following harvest of a previous stand dominated by naturalfire disturbance cycles. It is not valid for the revegetated sites, since they were not subject to thisregime. Alternative procedures used in similar situations such as regeneration of forest on abandonedagricultural land derive these values from agricultural soil C databases [45] or use averages fornonforest soil types [41]. It would be reasonable to assume that the tailings were C-depleted atsite establishment. However, because tree establishment was preceded by a period where variousamendments were applied in combination with grass or legume crops, it cannot be assumed thatsoil and DOM C were entirely absent. To assess this key uncertainty, we conducted three sensitivityanalysis simulations for the two revegetated sites, (1) zero initial soil C, (2) average initial soil C usedby the CBM-CFS3 for afforestation sites [41], and (3) initializing soil C using the default procedure fornatural stands [24].
2.6. Evaluation and Validation
2.6.1. Reference Estimates
We compared observed site index at each study plot against standard curves for jack pine usedregionally in forest management [29]. We also compared observed wood volume yield to two standardyield curves used in forest management in Ontario, (1) “Plonski” [46,47], and (2) “Penner” [48]. We alsocompared our estimated NEP to independent estimates for regenerating jack pine stands at the BorealEcosystem Research and Monitoring (BERMS) study sites in Saskatchewan, Canada. In total, n = 6eddy covariance sites (HJP75, HJP94, HJP02, F77, F89, and F98) originating in various years followingharvest (H) or fire (F) were monitored from 2001 to 2005. Annual NEP values were obtained fromtabular data appearing in publications detailing these results [49–52].
2.6.2. Field Measured Soil C
Soil C stocks estimated from the samples taken at each revegetated site (Section 2.2) werecompared against modelled output. Bulk density was not measured. For forest floor, we assumed0.16 g cm−3 (SD 0.33), the average of the LFH layers for Brunisols in Canadian forest soils [53]. For theVale oxidized tailings, where 73% of the mineral matter was comprised of fine clay, clay and silt, a labestimate of 1.3 g cm−3 was obtained. However, this material would be more compacted in the field sowe used this as the minimum, and 1.6 g cm−3 [54] as the maximum estimate for tailings bulk density.The average of forest floor and tailings was used as the estimate for the forest floor-tailings interfacelayer. The minimum and maximum bulk density estimates for tailings (95% CI in the case of the forestfloor) were used to generate a range of estimates of total C for each layer and for the whole soil profile.The means and standard deviations from the n = 4 samples were used to calculate estimates of totalsoil C and associated confidence intervals for both the minimum and maximum bulk density estimatesfor each layer. The reported mean estimates are the average of the minimum and maximum estimates,and the reported confidence intervals are the widest possible range of values.
Forests 2018, 9, 707 9 of 23
3. Results
3.1. Tree Height and Site Index
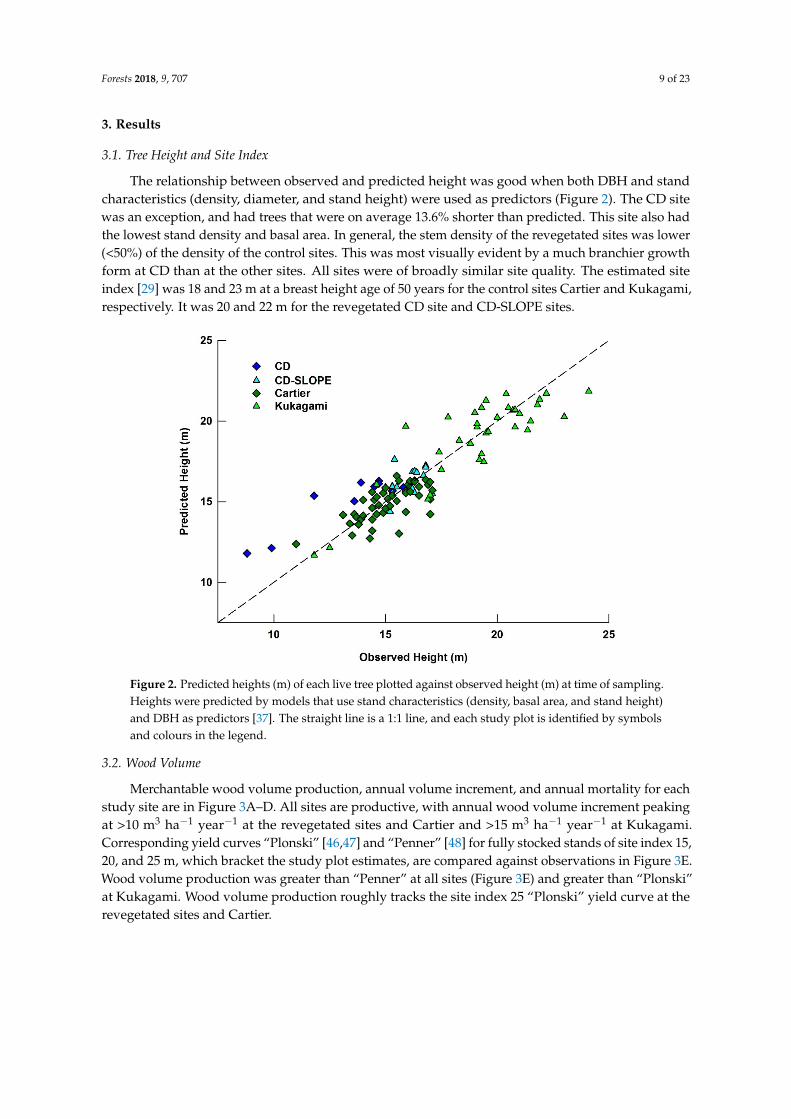
The relationship between observed and predicted height was good when both DBH and standcharacteristics (density, diameter, and stand height) were used as predictors (Figure 2). The CD sitewas an exception, and had trees that were on average 13.6% shorter than predicted. This site also hadthe lowest stand density and basal area. In general, the stem density of the revegetated sites was lower(<50%) of the density of the control sites. This was most visually evident by a much branchier growthform at CD than at the other sites. All sites were of broadly similar site quality. The estimated siteindex [29] was 18 and 23 m at a breast height age of 50 years for the control sites Cartier and Kukagami,respectively. It was 20 and 22 m for the revegetated CD site and CD-SLOPE sites.
Forests 2018, 9, x FOR PEER REVIEW 9 of 22
3. Results
3.1. Tree Height and Site Index
The relationship between observed and predicted height was good when both DBH and stand characteristics (density, diameter, and stand height) were used as predictors (Figure 2). The CD site was an exception, and had trees that were on average 13.6% shorter than predicted. This site also had the lowest stand density and basal area. In general, the stem density of the revegetated sites was lower (<50%) of the density of the control sites. This was most visually evident by a much branchier growth form at CD than at the other sites. All sites were of broadly similar site quality. The estimated site index [29] was 18 and 23 m at a breast height age of 50 years for the control sites Cartier and Kukagami, respectively. It was 20 and 22 m for the revegetated CD site and CD-SLOPE sites.
Figure 2. Predicted heights (m) of each live tree plotted against observed height (m) at time of sampling. Heights were predicted by models that use stand characteristics (density, basal area, and stand height) and DBH as predictors [37]. The straight line is a 1:1 line, and each study plot is identified by symbols and colours in the legend.
3.2. Wood Volume
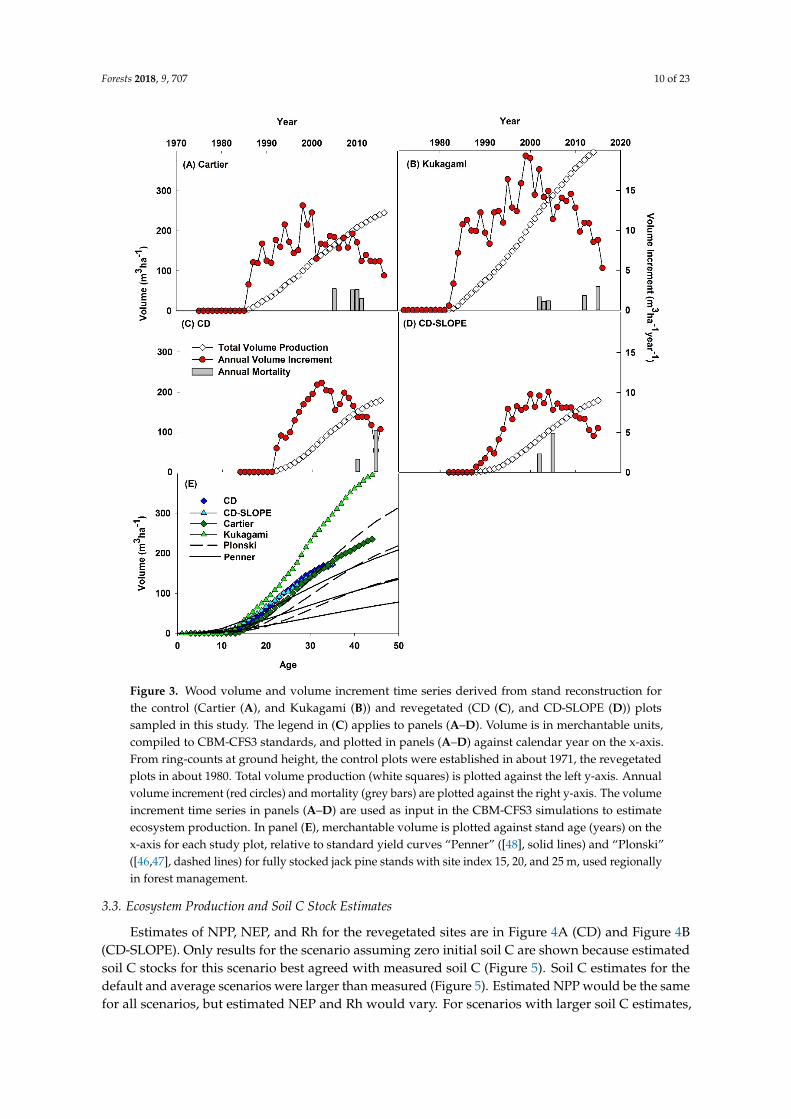
Merchantable wood volume production, annual volume increment, and annual mortality for each study site are in Figure 3A–D. All sites are productive, with annual wood volume increment peaking at >10 m3 ha−1 year−1 at the revegetated sites and Cartier and >15 m3 ha−1 year−1 at Kukagami. Corresponding yield curves “Plonski” [46,47] and “Penner” [48] for fully stocked stands of site index 15, 20, and 25 m, which bracket the study plot estimates, are compared against observations in Figure 3E. Wood volume production was greater than “Penner” at all sites (Figure 3E) and greater than “Plonski” at Kukagami. Wood volume production roughly tracks the site index 25 “Plonski” yield curve at the revegetated sites and Cartier.
Figure 2. Predicted heights (m) of each live tree plotted against observed height (m) at time of sampling.Heights were predicted by models that use stand characteristics (density, basal area, and stand height)and DBH as predictors [37]. The straight line is a 1:1 line, and each study plot is identified by symbolsand colours in the legend.
3.2. Wood Volume
Merchantable wood volume production, annual volume increment, and annual mortality for eachstudy site are in Figure 3A–D. All sites are productive, with annual wood volume increment peakingat >10 m3 ha−1 year−1 at the revegetated sites and Cartier and >15 m3 ha−1 year−1 at Kukagami.Corresponding yield curves “Plonski” [46,47] and “Penner” [48] for fully stocked stands of site index 15,20, and 25 m, which bracket the study plot estimates, are compared against observations in Figure 3E.Wood volume production was greater than “Penner” at all sites (Figure 3E) and greater than “Plonski”at Kukagami. Wood volume production roughly tracks the site index 25 “Plonski” yield curve at therevegetated sites and Cartier.
Forests 2018, 9, 707 10 of 23Forests 2018, 9, x FOR PEER REVIEW 10 of 22
Figure 3. Wood volume and volume increment time series derived from stand reconstruction for the control (Cartier (A), and Kukagami (B)) and revegetated (CD (C), and CD-SLOPE (D)) plots sampled in this study. The legend in (C) applies to panels (A–D). Volume is in merchantable units, compiled to CBM-CFS3 standards, and plotted in panels (A–D) against calendar year on the x-axis. From ring-counts at ground height, the control plots were established in about 1971, the revegetated plots in about 1980. Total volume production (white squares) is plotted against the left y-axis. Annual volume increment (red circles) and mortality (grey bars) are plotted against the right y-axis. The volume increment time series in panels (A–D) are used as input in the CBM-CFS3 simulations to estimate ecosystem production. In panel (E), merchantable volume is plotted against stand age (years) on the x-axis for each study plot, relative to standard yield curves “Penner” ([48], solid lines) and “Plonski” ([46,47], dashed lines) for fully stocked jack pine stands with site index 15, 20, and 25 m, used regionally in forest management.
3.3. Ecosystem Production and Soil C Stock Estimates
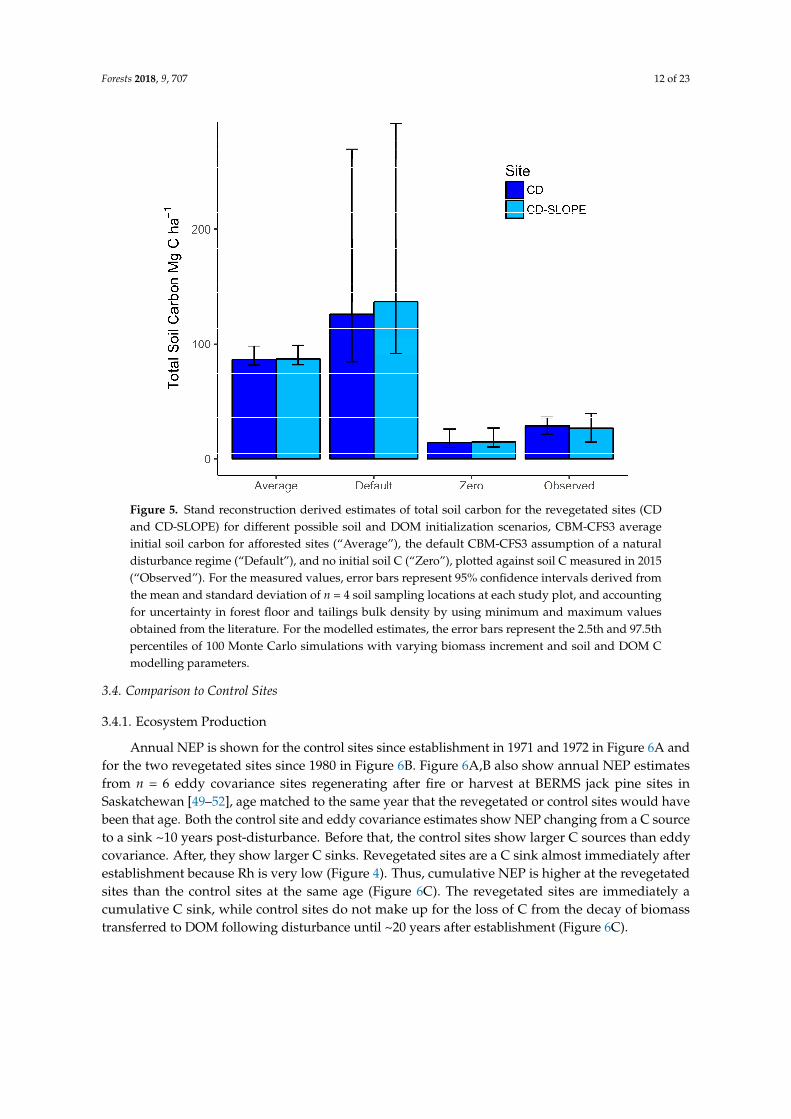
Estimates of NPP, NEP, and Rh for the revegetated sites are in Figure 4A (CD) and Figure 4B (CD-SLOPE). Only results for the scenario assuming zero initial soil C are shown because estimated soil C stocks for this scenario best agreed with measured soil C (Figure 5). Soil C estimates for the default and average scenarios were larger than measured (Figure 5). Estimated NPP would be the same for all scenarios, but estimated NEP and Rh would vary. For scenarios with larger soil C estimates, Rh would be higher and therefore NEP lower because more C would be available for release by decay. In the last five years before sampling, NEP at CD averaged 250 g C m−2 year−1 1. At
Figure 3. Wood volume and volume increment time series derived from stand reconstruction forthe control (Cartier (A), and Kukagami (B)) and revegetated (CD (C), and CD-SLOPE (D)) plotssampled in this study. The legend in (C) applies to panels (A–D). Volume is in merchantable units,compiled to CBM-CFS3 standards, and plotted in panels (A–D) against calendar year on the x-axis.From ring-counts at ground height, the control plots were established in about 1971, the revegetatedplots in about 1980. Total volume production (white squares) is plotted against the left y-axis. Annualvolume increment (red circles) and mortality (grey bars) are plotted against the right y-axis. The volumeincrement time series in panels (A–D) are used as input in the CBM-CFS3 simulations to estimateecosystem production. In panel (E), merchantable volume is plotted against stand age (years) on thex-axis for each study plot, relative to standard yield curves “Penner” ([48], solid lines) and “Plonski”([46,47], dashed lines) for fully stocked jack pine stands with site index 15, 20, and 25 m, used regionallyin forest management.
3.3. Ecosystem Production and Soil C Stock Estimates
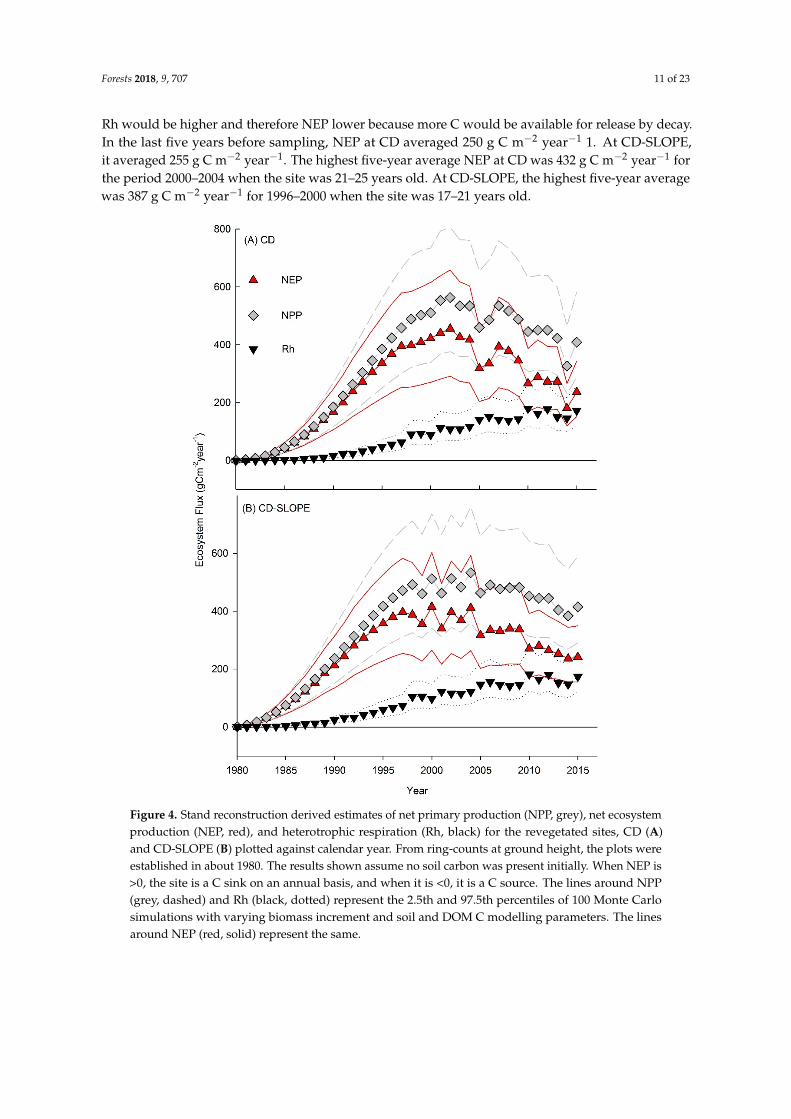
Estimates of NPP, NEP, and Rh for the revegetated sites are in Figure 4A (CD) and Figure 4B(CD-SLOPE). Only results for the scenario assuming zero initial soil C are shown because estimatedsoil C stocks for this scenario best agreed with measured soil C (Figure 5). Soil C estimates for thedefault and average scenarios were larger than measured (Figure 5). Estimated NPP would be the samefor all scenarios, but estimated NEP and Rh would vary. For scenarios with larger soil C estimates,
Forests 2018, 9, 707 11 of 23
Rh would be higher and therefore NEP lower because more C would be available for release by decay.In the last five years before sampling, NEP at CD averaged 250 g C m−2 year−1 1. At CD-SLOPE,it averaged 255 g C m−2 year−1. The highest five-year average NEP at CD was 432 g C m−2 year−1 forthe period 2000–2004 when the site was 21–25 years old. At CD-SLOPE, the highest five-year averagewas 387 g C m−2 year−1 for 1996–2000 when the site was 17–21 years old.
Forests 2018, 9, x FOR PEER REVIEW 11 of 22
CD-SLOPE, it averaged 255 g C m−2 year−1. The highest five-year average NEP at CD was 432 g C m−2 year−1 for the period 2000–2004 when the site was 21–25 years old. At CD-SLOPE, the highest five-year average was 387 g C m−2 year−1 for 1996–2000 when the site was 17–21 years old.
Figure 4. Stand reconstruction derived estimates of net primary production (NPP, grey), net ecosystem production (NEP, red), and heterotrophic respiration (Rh, black) for the revegetated sites, CD (A) and CD-SLOPE (B) plotted against calendar year. From ring-counts at ground height, the plots were established in about 1980. The results shown assume no soil carbon was present initially. When NEP is >0, the site is a C sink on an annual basis, and when it is <0, it is a C source. The lines around NPP (grey, dashed) and Rh (black, dotted) represent the 2.5th and 97.5th percentiles of 100 Monte Carlo simulations with varying biomass increment and soil and DOM C modelling parameters. The lines around NEP (red, solid) represent the same.
Figure 4. Stand reconstruction derived estimates of net primary production (NPP, grey), net ecosystemproduction (NEP, red), and heterotrophic respiration (Rh, black) for the revegetated sites, CD (A)and CD-SLOPE (B) plotted against calendar year. From ring-counts at ground height, the plots wereestablished in about 1980. The results shown assume no soil carbon was present initially. When NEP is>0, the site is a C sink on an annual basis, and when it is <0, it is a C source. The lines around NPP(grey, dashed) and Rh (black, dotted) represent the 2.5th and 97.5th percentiles of 100 Monte Carlosimulations with varying biomass increment and soil and DOM C modelling parameters. The linesaround NEP (red, solid) represent the same.
Forests 2018, 9, 707 12 of 23Forests 2018, 9, x FOR PEER REVIEW 12 of 22
Figure 5. Stand reconstruction derived estimates of total soil carbon for the revegetated sites (CD and CD-SLOPE) for different possible soil and DOM initialization scenarios, CBM-CFS3 average initial soil carbon for afforested sites (“Average”), the default CBM-CFS3 assumption of a natural disturbance regime (“Default”), and no initial soil C (“Zero”), plotted against soil C measured in 2015 (“Observed”). For the measured values, error bars represent 95% confidence intervals derived from the mean and standard deviation of n = 4 soil sampling locations at each study plot, and accounting for uncertainty in forest floor and tailings bulk density by using minimum and maximum values obtained from the literature. For the modelled estimates, the error bars represent the 2.5th and 97.5th percentiles of 100 Monte Carlo simulations with varying biomass increment and soil and DOM C modelling parameters.
3.4. Comparison to Control Sites
3.4.1. Ecosystem Production
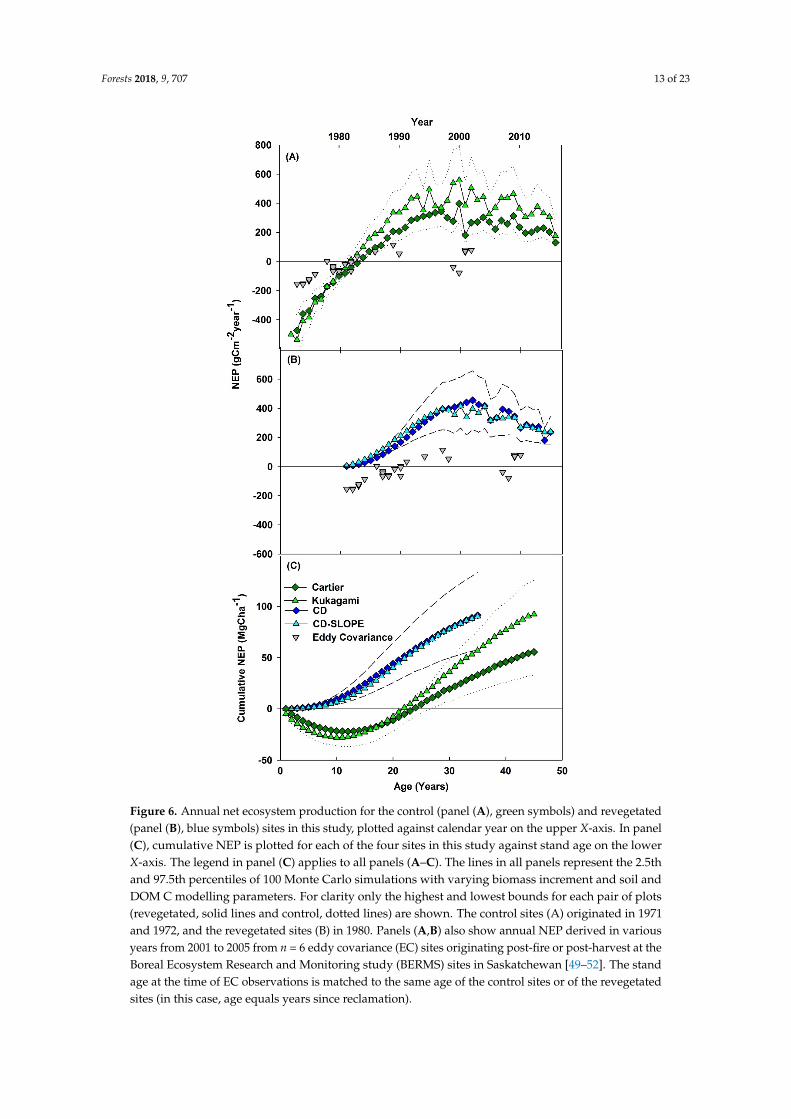
Annual NEP is shown for the control sites since establishment in 1971 and 1972 in Figure 6A and for the two revegetated sites since 1980 in Figure 6B. Figure 6A,B also show annual NEP estimates from n = 6 eddy covariance sites regenerating after fire or harvest at BERMS jack pine sites in Saskatchewan [49–52], age matched to the same year that the revegetated or control sites would have been that age. Both the control site and eddy covariance estimates show NEP changing from a C source to a sink ~10 years post-disturbance. Before that, the control sites show larger C sources than eddy covariance. After, they show larger C sinks. Revegetated sites are a C sink almost immediately after establishment because Rh is very low (Figure 4). Thus, cumulative NEP is higher at the revegetated sites than the control sites at the same age (Figure 6C). The revegetated sites are immediately a cumulative C sink, while control sites do not make up for the loss of C from the decay of biomass transferred to DOM following disturbance until ~20 years after establishment (Figure 6C).
Figure 5. Stand reconstruction derived estimates of total soil carbon for the revegetated sites (CDand CD-SLOPE) for different possible soil and DOM initialization scenarios, CBM-CFS3 averageinitial soil carbon for afforested sites (“Average”), the default CBM-CFS3 assumption of a naturaldisturbance regime (“Default”), and no initial soil C (“Zero”), plotted against soil C measured in 2015(“Observed”). For the measured values, error bars represent 95% confidence intervals derived fromthe mean and standard deviation of n = 4 soil sampling locations at each study plot, and accountingfor uncertainty in forest floor and tailings bulk density by using minimum and maximum valuesobtained from the literature. For the modelled estimates, the error bars represent the 2.5th and 97.5thpercentiles of 100 Monte Carlo simulations with varying biomass increment and soil and DOM Cmodelling parameters.
3.4. Comparison to Control Sites
3.4.1. Ecosystem Production
Annual NEP is shown for the control sites since establishment in 1971 and 1972 in Figure 6A andfor the two revegetated sites since 1980 in Figure 6B. Figure 6A,B also show annual NEP estimatesfrom n = 6 eddy covariance sites regenerating after fire or harvest at BERMS jack pine sites inSaskatchewan [49–52], age matched to the same year that the revegetated or control sites would havebeen that age. Both the control site and eddy covariance estimates show NEP changing from a C sourceto a sink ~10 years post-disturbance. Before that, the control sites show larger C sources than eddycovariance. After, they show larger C sinks. Revegetated sites are a C sink almost immediately afterestablishment because Rh is very low (Figure 4). Thus, cumulative NEP is higher at the revegetatedsites than the control sites at the same age (Figure 6C). The revegetated sites are immediately acumulative C sink, while control sites do not make up for the loss of C from the decay of biomasstransferred to DOM following disturbance until ~20 years after establishment (Figure 6C).
Forests 2018, 9, 707 13 of 23Forests 2018, 9, x FOR PEER REVIEW 13 of 22
Figure 6. Annual net ecosystem production for the control (panel (A), green symbols) and revegetated (panel (B), blue symbols) sites in this study, plotted against calendar year on the upper X-axis. In panel (C), cumulative NEP is plotted for each of the four sites in this study against stand age on the lower X-axis. The legend in panel (C) applies to all panels (A–C). The lines in all panels represent the 2.5th and 97.5th percentiles of 100 Monte Carlo simulations with varying biomass increment and soil and DOM C modelling parameters. For clarity only the highest and lowest bounds for each pair of plots (revegetated, solid lines and control, dotted lines) are shown. The control sites (A) originated in 1971 and 1972, and the revegetated sites (B) in 1980. Panels (A,B) also show annual NEP derived in various years from 2001 to 2005 from n = 6 eddy covariance (EC) sites originating post-fire or post-harvest at the Boreal Ecosystem Research and Monitoring study (BERMS) sites in Saskatchewan [49–52]. The stand age at the time of EC observations is matched to the same age of the control sites or of the revegetated sites (in this case, age equals years since reclamation).
Figure 6. Annual net ecosystem production for the control (panel (A), green symbols) and revegetated(panel (B), blue symbols) sites in this study, plotted against calendar year on the upper X-axis. In panel(C), cumulative NEP is plotted for each of the four sites in this study against stand age on the lowerX-axis. The legend in panel (C) applies to all panels (A–C). The lines in all panels represent the 2.5thand 97.5th percentiles of 100 Monte Carlo simulations with varying biomass increment and soil andDOM C modelling parameters. For clarity only the highest and lowest bounds for each pair of plots(revegetated, solid lines and control, dotted lines) are shown. The control sites (A) originated in 1971and 1972, and the revegetated sites (B) in 1980. Panels (A,B) also show annual NEP derived in variousyears from 2001 to 2005 from n = 6 eddy covariance (EC) sites originating post-fire or post-harvest at theBoreal Ecosystem Research and Monitoring study (BERMS) sites in Saskatchewan [49–52]. The standage at the time of EC observations is matched to the same age of the control sites or of the revegetatedsites (in this case, age equals years since reclamation).
Forests 2018, 9, 707 14 of 23
3.4.2. Ecosystem C Stock
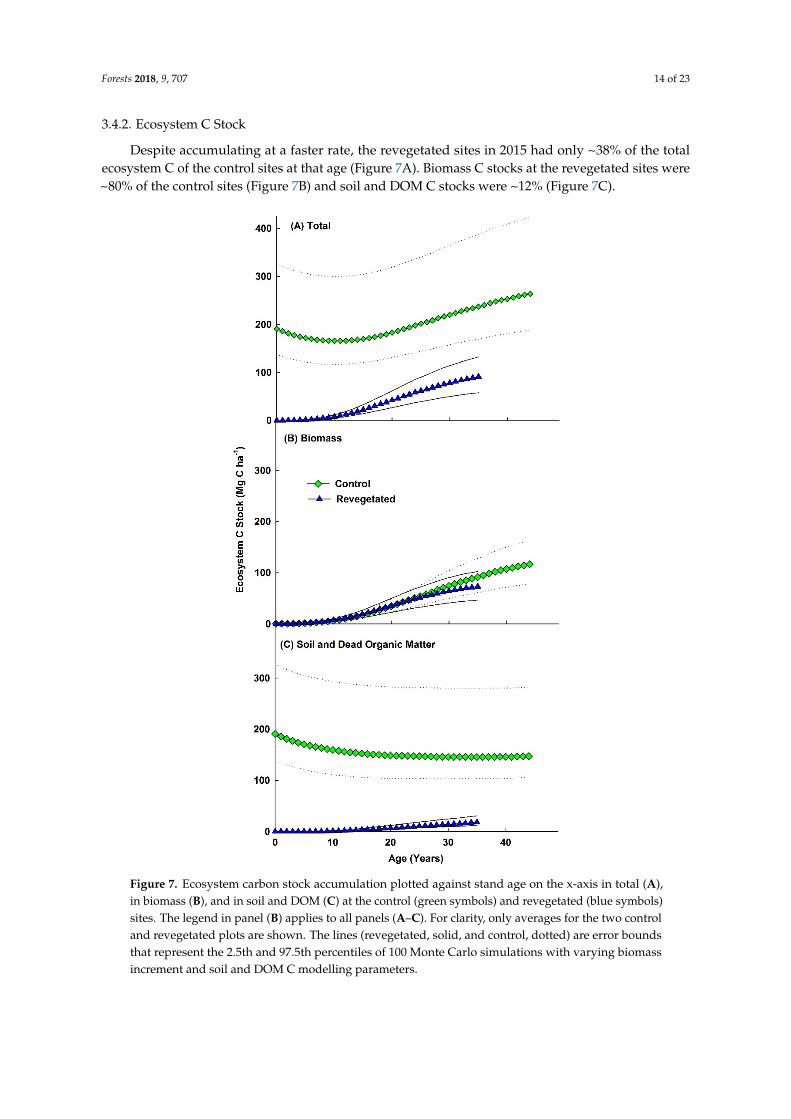
Despite accumulating at a faster rate, the revegetated sites in 2015 had only ~38% of the totalecosystem C of the control sites at that age (Figure 7A). Biomass C stocks at the revegetated sites were~80% of the control sites (Figure 7B) and soil and DOM C stocks were ~12% (Figure 7C).
Forests 2018, 9, x FOR PEER REVIEW 14 of 22
3.4.2. Ecosystem C Stock
Despite accumulating at a faster rate, the revegetated sites in 2015 had only ~38% of the total ecosystem C of the control sites at that age (Figure 7A). Biomass C stocks at the revegetated sites were ~80% of the control sites (Figure 7B) and soil and DOM C stocks were ~12% (Figure 7C).
Figure 7. Ecosystem carbon stock accumulation plotted against stand age on the x-axis in total (A), in biomass (B), and in soil and DOM (C) at the control (green symbols) and revegetated (blue symbols) sites. The legend in panel (B) applies to all panels (A–C). For clarity, only averages for the two control and revegetated plots are shown. The lines (revegetated, solid, and control, dotted) are error bounds that represent the 2.5th and 97.5th percentiles of 100 Monte Carlo simulations with varying biomass increment and soil and DOM C modelling parameters.
Figure 7. Ecosystem carbon stock accumulation plotted against stand age on the x-axis in total (A),in biomass (B), and in soil and DOM (C) at the control (green symbols) and revegetated (blue symbols)sites. The legend in panel (B) applies to all panels (A–C). For clarity, only averages for the two controland revegetated plots are shown. The lines (revegetated, solid, and control, dotted) are error boundsthat represent the 2.5th and 97.5th percentiles of 100 Monte Carlo simulations with varying biomassincrement and soil and DOM C modelling parameters.
Forests 2018, 9, 707 15 of 23
3.5. Metal Distribution in the Revegetated Tailings Profile
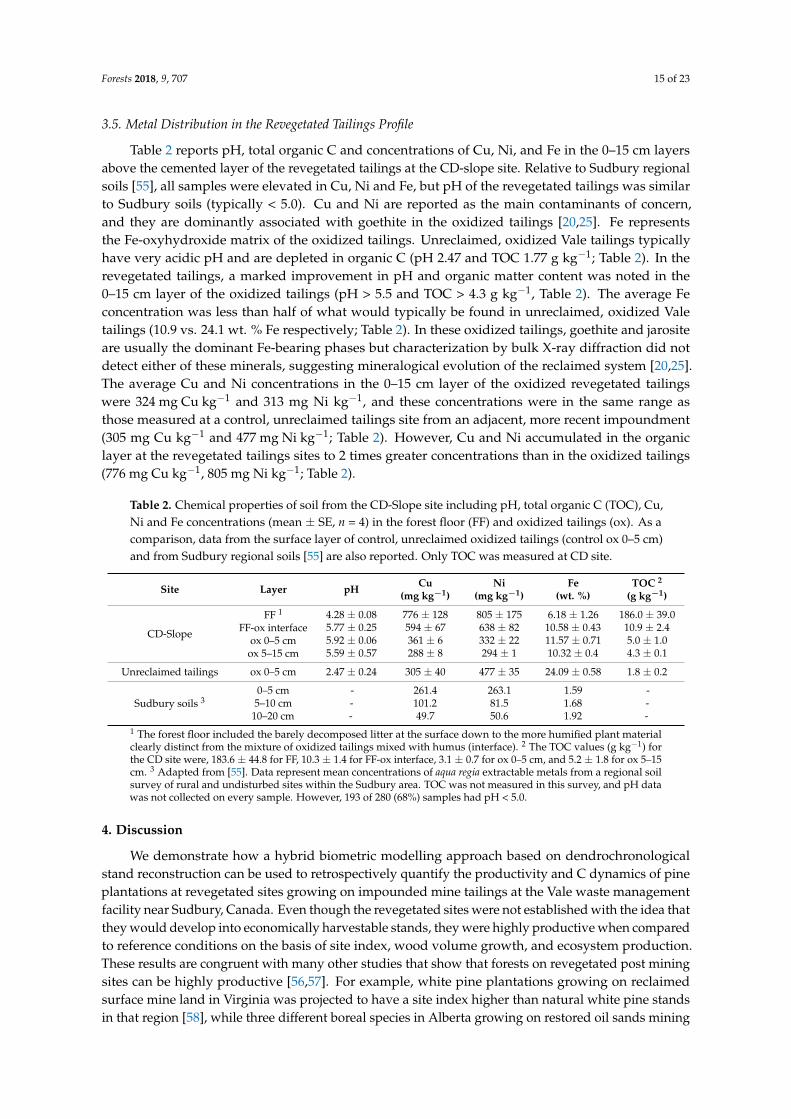
Table 2 reports pH, total organic C and concentrations of Cu, Ni, and Fe in the 0–15 cm layersabove the cemented layer of the revegetated tailings at the CD-slope site. Relative to Sudbury regionalsoils [55], all samples were elevated in Cu, Ni and Fe, but pH of the revegetated tailings was similarto Sudbury soils (typically < 5.0). Cu and Ni are reported as the main contaminants of concern,and they are dominantly associated with goethite in the oxidized tailings [20,25]. Fe representsthe Fe-oxyhydroxide matrix of the oxidized tailings. Unreclaimed, oxidized Vale tailings typicallyhave very acidic pH and are depleted in organic C (pH 2.47 and TOC 1.77 g kg−1; Table 2). In therevegetated tailings, a marked improvement in pH and organic matter content was noted in the0–15 cm layer of the oxidized tailings (pH > 5.5 and TOC > 4.3 g kg−1, Table 2). The average Feconcentration was less than half of what would typically be found in unreclaimed, oxidized Valetailings (10.9 vs. 24.1 wt. % Fe respectively; Table 2). In these oxidized tailings, goethite and jarositeare usually the dominant Fe-bearing phases but characterization by bulk X-ray diffraction did notdetect either of these minerals, suggesting mineralogical evolution of the reclaimed system [20,25].The average Cu and Ni concentrations in the 0–15 cm layer of the oxidized revegetated tailingswere 324 mg Cu kg−1 and 313 mg Ni kg−1, and these concentrations were in the same range asthose measured at a control, unreclaimed tailings site from an adjacent, more recent impoundment(305 mg Cu kg−1 and 477 mg Ni kg−1; Table 2). However, Cu and Ni accumulated in the organiclayer at the revegetated tailings sites to 2 times greater concentrations than in the oxidized tailings(776 mg Cu kg−1, 805 mg Ni kg−1; Table 2).
Table 2. Chemical properties of soil from the CD-Slope site including pH, total organic C (TOC), Cu,Ni and Fe concentrations (mean ± SE, n = 4) in the forest floor (FF) and oxidized tailings (ox). As acomparison, data from the surface layer of control, unreclaimed oxidized tailings (control ox 0–5 cm)and from Sudbury regional soils [55] are also reported. Only TOC was measured at CD site.
Site Layer pH Cu(mg kg−1)
Ni(mg kg−1)
Fe(wt. %)
TOC 2
(g kg−1)
CD-Slope
FF 1
FF-ox interfaceox 0–5 cmox 5–15 cm
4.28 ± 0.085.77 ± 0.255.92 ± 0.065.59 ± 0.57
776 ± 128594 ± 67361 ± 6288 ± 8
805 ± 175638 ± 82332 ± 22294 ± 1
6.18 ± 1.2610.58 ± 0.4311.57 ± 0.7110.32 ± 0.4
186.0 ± 39.010.9 ± 2.45.0 ± 1.04.3 ± 0.1
Unreclaimed tailings ox 0–5 cm 2.47 ± 0.24 305 ± 40 477 ± 35 24.09 ± 0.58 1.8 ± 0.2
Sudbury soils 30–5 cm5–10 cm
10–20 cm
---
261.4101.249.7
263.181.550.6
1.591.681.92
---
1 The forest floor included the barely decomposed litter at the surface down to the more humified plant materialclearly distinct from the mixture of oxidized tailings mixed with humus (interface). 2 The TOC values (g kg−1) forthe CD site were, 183.6 ± 44.8 for FF, 10.3 ± 1.4 for FF-ox interface, 3.1 ± 0.7 for ox 0–5 cm, and 5.2 ± 1.8 for ox 5–15cm. 3 Adapted from [55]. Data represent mean concentrations of aqua regia extractable metals from a regional soilsurvey of rural and undisturbed sites within the Sudbury area. TOC was not measured in this survey, and pH datawas not collected on every sample. However, 193 of 280 (68%) samples had pH < 5.0.
4. Discussion
We demonstrate how a hybrid biometric modelling approach based on dendrochronologicalstand reconstruction can be used to retrospectively quantify the productivity and C dynamics of pineplantations at revegetated sites growing on impounded mine tailings at the Vale waste managementfacility near Sudbury, Canada. Even though the revegetated sites were not established with the idea thatthey would develop into economically harvestable stands, they were highly productive when comparedto reference conditions on the basis of site index, wood volume growth, and ecosystem production.These results are congruent with many other studies that show that forests on revegetated post miningsites can be highly productive [56,57]. For example, white pine plantations growing on reclaimedsurface mine land in Virginia was projected to have a site index higher than natural white pine standsin that region [58], while three different boreal species in Alberta growing on restored oil sands mining
Forests 2018, 9, 707 16 of 23
sites have similar site indices to undisturbed natural stands [59]. Like previous studies [7], total C stockof the revegetated site had not yet reached the same levels as what was present in analogous managedforest stands growing under natural conditions (Figure 7). However, the cumulative NEP since standestablishment was larger for the revegetated site than for the analogous managed forest stands in theregion (Figure 6C). Annual NEP was also larger than estimates derived from eddy covariance studiesin young disturbed forest stands elsewhere in Canada [49–52] (Figure 6B). The primary reason forthis was low (or no) initial soil and DOM C stocks when the trees were established. Therefore, littleor no soil or DOM C was available for decay, and soil C built up over time [7,60]. Unlike sites thatwere previously peatlands with very large soil C stocks [61], it may be possible in pine ecosystemsto eventually reach similar levels of ecosystem C stock as present prior to industrial disturbance [62].The accumulation of C in soils developing in pine ecosystems at post-mining sites in Poland has beenestimated to range from 0.73 to 5.26 Mg ha−1 year−1 depending on the substrate [63]. This is largerthan the average of 0.5 Mg ha−1 year−1 that has on average accumulated at the revegetated sites inthis study, but our sites were also accumulating less biomass than in the Polish study [63], and wouldhave been considered potentially less fertile due to the requirement to ameliorate pH by adding lime.
The modelling approach predicts that little C would be lost from the system through decay,and therefore both the annual C sequestration and total ecosystem C accumulation at the revegetatedsites is higher than at control sites located at pine plantations established following forest harvestin the managed forest that surrounds the Sudbury area. Modelled estimates of soil C that assumedthat the sites started in a very C depleted state were most consistent with measurements of soil Cobtained at the time of sampling. The observed organic C content at the revegetated sites relativeto observations made 20 years previously [12], particularly in the forest floor, are consistent with anincrease in soil C stock over time. Similar to an analogous study of a post-mining site in the CzechRepublic [64], most soil C accumulation was in situ, originating as input from biomass turnoverand litterfall. The decomposition of this litterfall is an important ecological process contributing tosoil restoration [65]. In general, it is apparent that soils make a significant contribution to total Caccumulation at revegetated sites on land that was formerly degraded [60]. The close match betweenmodelled and measured values suggests that the soil and DOM C dynamics at the restored sites,including decomposition and transformation rates, were in close approximation to what is assumedby the soil and DOM C dynamics sub-module of the CBM-CFS3, which is parameterized from naturalforest conditions [24]. It also provides further evidence that the soil and DOM C stock and fluxestimates in the model are highly dependent on biomass input [66]. A small amount of soil C waslikely initially present, originating from the mulch, grass, or legume crops present during the transitionperiod prior to the establishment of a pine plantation [10,11]. This could be inferred from the differencebetween the measured soil C at the time of sampling and the model predicted soil C assuming theinitial amount was zero.
4.1. Evaluation of Risks to Tailings Stability
This study shows that acid-generating tailings reclaimed with jack pine were highly productive35 to 40 years after planting. However, successful reclamation should also aim to minimize acidmine drainage (AMD) and metal contaminant transfer into the environment (e.g., vegetation uptake).While inputs of C and other nutrients are key to successfully establishing vegetation on tailings,their addition or accumulation in these mineral wastes may also change the cycling and stability ofmetal contaminants in ways that could be deleterious to the health of the surrounding ecosystem.For example, the concentrations of Cu (776 mg kg−1) and Ni (805 mg kg−1) in the forest floor at thereforested CD-slope site both exceed the Canadian soil quality guidelines for industrial sites (91 and89 mg kg−1 for Cu and Ni, respectively [67,68]). As the guidelines are based on toxicity data fromplants and invertebrates exposed to affected soils, the levels of Cu and Ni measured in the reforestedCD tailings suggest the potential for metal transfer to the food chain that could, for example, have toxiceffects on invertebrate species [69,70]. A previous study on metal uptake by vegetation at this site [12]
Forests 2018, 9, 707 17 of 23
reported that Cu and Ni concentrations were higher in grasses, tree foliar tissues and mosses growingon tailings than at control sites. For grasses, Cu and Ni concentrations were also higher in rootsthan shoots. However, differences in metal accumulation depended on plant species, and their studyshowed comparable Cu and Ni concentrations in jack pine needles established on tailings at the CDarea compared to nontailings sites for samples taken in 1996 [12]. In light of these studies, additionalresearch is warranted to evaluate the impact of elevated metal concentrations on the ecosystem at thesesites. On-going studies are also clarifying the degree of microbial recovery using molecular biologytechniques to assess microbial community composition and function.
In addition to potential ecosystem effects, the reforested tailings profile exhibited extensiveoxidation (down to >80 cm). This indicates that the revegetation approach did not prevent the oxidationof the unweathered tailings and AMD, though it was not expected that it would have been fullysuccessful at doing so when the revegetation activities were initiated [10,11]. In line with the absenceof goethite and jarosite as dominant Fe-bearing secondary mineral phases in the reforested tailings,chemical analysis indicated a significant depletion of Fe in the oxidized tailings compared to thenon-reforested tailings control site (Table 2). These observations likely reflect on-going podzolizationwhich is favored under cold humid climates and coniferous vegetation. The beginning of a podzoliclayer was already observed at these sites prior to the establishment of the jack pine plantations [10,11].As the tailings are colonized by vegetation, organic acids are produced by decomposition of litterand exudation of roots, fungi and microbes. These organic acids contribute to mineral weatheringby complexing Al and Fe and promoting their migration downwards where they can precipitate andform a hard pan [71], which was observed at the revegetated sites below 20 cm depth in the oxidizedtailings. A common driving force for podzolization under coniferous vegetation is the occurrence ofectomycorrhizal fungi, which are believed to be responsible for the upward translocation of nutrientsand other elements from the weathering mineral layer to the plant roots [72]. This phenomenon,coupled with potential dust contamination from surrounding barren tailings and vegetation uptake,may have contributed over the years to the accumulation of Cu and Ni in the tailings forest floor.These results certainly suggest that there are environmental risks to this particular tailings revegetationstrategy, even though the site is presently a productive forest. An alternative approach that is currentlybeing tested at this site is the use of oxygen consuming organic covers [13,14,20]. This approach,while potentially accelerating the rehabilitation of the tailings, also requires more assessment of itssuitability to prevent acid mine drainage particularly if more economical thin covers are used [20].The efficiency of a reclamation strategy in minimizing AMD should especially be considered atabandoned acid-generating sites where mine drainage is not collected for treatment like it is at thisstudy site.
4.2. Assessment of GHG Mitigation Benefits
We examined the question of whether there is any reasonable potential that the revegetation ofthese sites could provide any GHG mitigation benefit. The rehabilitation of industrially disturbedforest lands has been recognized as an activity that could provide such benefits, but these have notoften been adequately quantified [7]. Such an assessment must also consider the GHG emissions ofthe amendments and management activities needed to undertake the revegetation, ideally through aformal life cycle analysis. A similar study of an oak plantation established at a former lignite minein Italy showed that tree growth was sufficient to offset the GHG costs of plantation managementfour years after establishment [73]. However, this was not an entirely analogous situation as the sitein that study was actively managed with periodic thinning and required only standard mechanizedforestry operations to establish trees, and not intensive input of high GHG emission amendments aswas required at this study site.
The previously mentioned uncertainty about the precise establishment date of these sites,which was inconsistently reported in previous studies relative to the actual ages of the trees measuredin this study using dendrochronological methods, makes it difficult to determine the precise timing
Forests 2018, 9, 707 18 of 23
and nature of various activities undertaken at these sites. However, some general assumptions may bemade based on available published information [9–11]. As previously described, the amendments andactivities required before trees could successfully be established, included the spreading of agriculturallimestone, straw mulch, seeding with grasses and legumes, and fertilizer application. Some informationabout typical rates of application can be determined. Average rates of 25 Mg ha−1 for agriculturallimestone, and 750 kg ha−1 of fertilizer are suggested [11], but these are also not consistent in differentpublications [9,10]. Supplementary Table S1 provides an outline of the best available estimates ofthe activities required to revegetate these sites based on this published information [9–11], as wellas the potential GHG emissions associated with these activities, obtained from the literature [74–76].Accounting only for the GHG emissions of the activities described in Supplementary Table S1 givesan estimate that could range from 2.4 to 5.7 Mg CO2 ha−1 for activities and amendments required torevegetate these sites. Based on the maximum value in the range (5.7 Mg CO2 ha−1), the accumulatedNEP at the revegetated sites recovers this C in 7 to 12 years, which is comparable to analogous estimatesfor forest bioenergy projects that use harvesting residues under some circumstances [77,78]. However,significant uncertainties in these estimates remain. They do not account for all of the activities requiredin the process, particularly activities indicated as occurring but for which no estimate of the amountor details of the material applied are given, for example, site leveling prior to revegetation or theapplication of straw mulch and chemical binders [10,11]. There are also key uncertainties in theamounts of amendments applied. For example, some publications give an estimate of the amount offertilizer applied as 750 kg ha−1 in total [10,11], while another gives an estimate of an annual rate of300 kg ha−1, which could have begun as early as 1958 [9]. In addition, there is the possibility that thereason for the discrepancy in precise timing of site establishment is that several attempts were made toestablish these sites, and previous attempts failed. Therefore, the estimated emissions associated withthe revegetation activities should be considered minimums. The estimate also does not account fornon-CO2 emissions associated with fertilization, and depends on a baseline scenario that assumes thesites are not revegetated.
5. Conclusions
In this study, we examined the recovery of revegetated sites located on impounded mine tailingsat the Vale waste management facility near Sudbury, Ontario, Canada. In terms of wood volumegrowth and annual NEP, the productivity at revegetated sites was similar to or greater than that fromregional control sites and other reference conditions to which the sites could be compared, despite aplanting density that is lower than what is typically used in forest management regionally. Less C hadaccumulated in the soil and DOM at the revegetated sites than at the regional control sites, and theamount that had accumulated was consistent with low initial soil C stocks. A hybrid-biometricmodelling approach that incorporates tree-ring data into an ecosystem model (CBM-CFS3) wassuccessfully used to recover these ecosystem C dynamics, and could be applied to other historicallyreclaimed industrial sites. Can the results with respect to forest productivity at the revegetated sites inthis study be indicative of successful reclamation? Relative to the initially stated goal when ecosystemrestoration activities began on this site, which was simply to control blowing dust, it could be said thatthe objectives were achieved. Further investigation is needed to determine if metal accumulation inthe forest floor originates from metal uptake by the trees and whether these elevated concentrationsare having environmental impacts. This would be particularly important if there was a desire to usethe wood biomass in forest products, though such use in not currently contemplated. Finally, despitethe large quantity of GHG-intensive inputs required, the revegetation of industrially disturbed sitesin this study may possibly have climate change mitigation benefits with similar C debt repaymenttimes as some forest residue-derived bioenergy projects. However, significant uncertainties in thesecalculations remain, and the amount of time required to recover the GHG emissions associated withthe reclamation activities and amendments required to revegetate the sites in this study are more likelyto be longer than what was calculated than they are to be shorter.
Forests 2018, 9, 707 19 of 23
Supplementary Materials: The following are available online at http://www.mdpi.com/1999-4907/9/11/707/s1,Table S1: Estimated GHG emissions (on a kg CO2 ha−1 basis) for actions associated with the application of soilamendments and revegetation of tailings at CD area at the Vale waste management facility near Sudbury, Canada.Activities and amendments were derived from descriptions provided in the literature [9–11]. The GHG emissionsassociated with each action were also obtained from the cited literature [55,77,78].
Author Contributions: Conceptualization, J.M.M., B.T., and P.D.; Methodology, J.M.M., S.B., and S.L.; DataCollection, J.M., B.T., and P.D., Data Analysis and Modelling, J.M.M. and S.B.; Writing-Original Draft Preparation,J.M.; Writing-Review & Editing, J.M.M., S.B., and S.L.; Project Administration and Funding Acquisition, P.D.
Funding: This work was funded by the Forest Innovation Program of the Canadian Forest Service of NaturalResources Canada. Chemical characterization of tailings was funded through Natural Resources Canada,CanmetMINING, project P-002496.001.03.
Acknowledgments: The authors acknowledge the contribution of the Analytical Group at CanmetMINING(Ottawa, ON, Canada) for all chemical analyses, Hyejin Hwang at the Northern Forestry Centre (Edmonton, AB,Canada) for conducting the tree ring measurements, and Ian Bedard (CanmetMINING, Sudbury, ON, Canada)for assistance with field data collection. We thank Cindy Shaw and two anonymous reviewers for helpfulcomments on the manuscript. Special thanks are also extended to Glen Watson from Vale for site access to therevegetated tailings.
Conflicts of Interest: The authors declare no conflict of interest.
References
1. Owen, J.R.; Kemp, D. Social licence and mining: A critical perspective. Resour. Policy 2013, 38, 29–35.[CrossRef]
2. Moffat, K.; Lacey, J.; Zhang, A.; Leipold, S. The social licence to operate: A critical review. Forestry 2016, 89,477–488. [CrossRef]
3. Macdonald, S.E.; Landhäusser, S.M.; Skousen, J.; Franklin, J.; Frouz, J.; Hall, S.; Jacobs, D.F.; Quideau, S.Forest restoration following surface mining disturbance: Challenges and solutions. New For. 2015, 46,703–732. [CrossRef]
4. Taylor, A.R.; Chen, H.Y.H. Multiple successional pathways of boreal forest stands in central Canada.Ecography 2011, 24, 208–219. [CrossRef]
5. Gauthier, S.; Bernier, P.; Burton, P.J.; Edwards, J.; Isaac, K.; Isabel, N.; Jayen, K.; Le Goff, H.; Nelson, E.A.Climate change vulnerability and adaptation in the managed Canadian boreal forest. Environ. Rev. 2014, 29,256–285. [CrossRef]
6. Lemprière, T.C.; Kurz, W.A.; Hogg, E.H.; Schmoll, C.; Rampley, G.J.; Yemshanov, D.; McKenney, D.W.;Gilsenan, R.; Beatch, A.; Blain, D.; et al. Canadian boreal forests and climate change mitigation. Environ. Rev.2013, 21, 293–321. [CrossRef]
7. Amichev, B.Y.; Burger, J.A.; Rodrigue, J.A. Carbon sequestration by forests and soils on mined land in theMidwestern and Appalcian coalfields of the U.S. For. Ecol. Manag. 2008, 256, 1949–1959. [CrossRef]
8. Mendez, M.O.; Maier, R.M. Phytostabilization of mine tailings in arid and semiarid environments—Anemerging remediation technology. Environ. Health Perspect. 2008, 116, 278–283. [CrossRef] [PubMed]
9. Crowder, A.A.; McLaughlin, B.E.; Rutherford, G.K.; van Loon, G.W. Site factors affecting semi-naturalherbaceous vegetation on tailings at Copper Cliff, Ontario. Rec. Reveg. Res. 1982, 1, 177–193.
10. Peters, T.H. Rehabilitation of mine tailings: A case of complete ecosystem reconstruction and revegetation ofindustrially stressed lands in the Sudbury area, Ontario, Canada. In Effects of Pollutants at the Ecosystem Level;Sheehan, P.J., Miller, D.R., Butler, G.C., Boudreau, P., Eds.; John Wiley and Sons: New York, NY, USA, 1984;pp. 403–421.
11. Peters, T.H. Revegetation of the Copper Cliff tailings are. In Restoration and Recovery of an Industrial Region;Gunn, J.M., Ed.; Springer: New York, NY, USA, 1995; pp. 123–133.
12. Bagatto, G.; Shorthouse, J.D. Biotic and abiotic characteristics of ecosystems on acid metalliferous minetailings near Sudbury, Ontario. Can. J. Bot. 1998, 77, 410–425.
13. Tisch, B.; Hargreave, J.; Beckett, J.P.; Beckett Lock, A.; Spiers, G.; Fyfe, J.; Lanteigne, L.; Sulatycky, T.Post-mining agriculture for biofuels on mine tailings: An overview of results from green mines green energy(GMGE) initiative. In Proceedings of the 9th international conference on acid rock drainage (ICARD), Ottawa,ON, Canada, 20–26 May 2012.
Forests 2018, 9, 707 20 of 23
14. Hargreaves, J.; Lock, A.; Beckett, P.; Spiers, G.; Tisch, B.; Lanteigne, L.; Posadowski, T.; Soenens, M. Suitabilityof an organic residual cover on tailings for bioenergy crop production: A preliminary assessment. Can. J.Soil Sci. 2012, 92, 203–211. [CrossRef]
15. Gunn, J.M. Restoration and Recovery of an Industrial Region; Springer: New York, NY, USA, 1995.16. Winterhalder, K. Environmental degradation and rehabilitation of the landscape around Sudbury, a major
mining and smelting area. Environ. Rev. 1996, 4, 185–224. [CrossRef]17. Nkongolo, K.K.; Micheal, P.; Theriault, G.; Narendrula, R.; Castilloux, P.; Kalubi, K.N.; Beckett, P.; Spiers, G.
Assessing Biological Impacts of Land Reclamation in a Mining Region in Canada: Effects of Dolomitic LimeApplications on Forest Ecosystems and Microbial Phospholipid Fatty Acid Signatures. Water Air Soil Pollut.2016, 227, 1–13. [CrossRef]
18. Santala, K.R.; Monet, S.; McCaffrey, T.; Campbell, D.; Beckett, P.; Ryser, P. Using turf transplants to reintroducenative forest understorey plants into smelter-disturbed forests. Restor. Ecol. 2016, 24, 346–353. [CrossRef]
19. Aubertin, M.; Bussière, B.; Pabst, T.; James, M.; Mbonimpa, M. Review of reclamation techniques for acidgenerating mine wastes upon closure of disposal sites. In Geo-Chicago 2016: Sustainable Materials and ResourceConservation; Farid, A., Anirban, D., Reddy, K.R., Yesiler, N., Zekkos, D., Eds.; American Society of CivilEngineers: Reston, VA, USA, 2016; pp. 343–358.
20. Beauchemin, S.; Clement, J.S.; Thibault, Y.; Langley, S.; Gregorich, E.G.; Tisch, B. Geochemical stabilityof acid-generating pyrrhotite tailings 4 to 5 years after addition of oxygen-consuming organic covers.Sci. Total Environ. 2018, 645, 1643–1655. [CrossRef] [PubMed]
21. Metsaranta, J.M.; Lieffers, V.J. Using dendrochronology to obtain annual data for modelling standdevelopment: A supplement to permanent sample plots. Forestry 2009, 82, 163–173. [CrossRef]
22. Metsaranta, J.M.; Kurz, W.A. Inter-annual variability of ecosystem production in boreal jack pine forests(1975–2004) estimated from tree-ring data using CBM-CFS3. Ecol. Model. 2012, 224, 111–123. [CrossRef]
23. Metsaranta, J.M.; Trofymow, J.A.; Black, T.A.; Jassal, R.S. Long-term time series of annual ecosystemproduction (1985–2010) derived from tree rings in Douglas-fir stands on Vancouver Island, Canada using ahybrid biometric-modelling approach. For. Ecol. Manag. 2018, 429, 57–68. [CrossRef]
24. Kurz, W.A.; Dymond, C.C.; White, T.M.; Stinson, G.; Shaw, C.H.; Rampley, G.J.; Smyth, C.; Simpson, B.N.;Neilson, E.T.; Trofymow, J.A.; et al. CBM-CFS3: A model of carbon-dynamics in forestry and land-use changeimplementing IPCC standards. Ecol. Model. 2009, 220, 480–504. [CrossRef]
25. Beauchemin, S.; Langley, S.; MacKinnon, T.; Thibault, Y.; Gamage McEvoy, J.; Smith, D.; Tisch, B. GeochemicalEvolution of Acidic Tailings after Organic Input: Lessons Learned at Vale; Report No. WF-13805965; NaturalResources Canada, CanmetMINING: Ottawa, ON, Canada, 2017.
26. Langley SBeauchemin, S.; Morin, L.; MacKinnon, T.; Khendelwal, A. Geomicrobiology of Acidic Tailings Treatedwith Different Reclamation Strategies; Report No. WF-15569416; Natural Resources Canada, CanmetMINING:Ottawa, ON, Canada, 2017.
27. Ecological Stratification Working Group. A National Ecological Framework for Canada; Agriculture andAgri-Food Canada, Research Branch, Centre for Land and Biological Resources Research and EnvironmentCanada, State of Environment Directorate: Ottawa, ON, Canada, 1996.
28. Crins, W.J.; Gray, P.A.; Uhlig, P.W.C.; Webste, M.C. The Ecosystems of Ontario, Part 1: Ecozones and Ecoregions;Technical Report SIB TER IMA TR-01; Ontario Ministry of Natural Resources, Inventory, Monitoring,and Assessment: Peterborough, ON, Canada, 2009.
29. Carmean, W.H.; Niznowski, G.P.; Hazenberg, G. Polymorphic site index curves for jack pine in NorthernOntario. For. Chron. 2001, 77, 141–150. [CrossRef]
30. Vasiliuskas, S.; Chen, H.Y.H. How long do trees take to reach breast height after fire in northeastern Ontario?Can. J. For. Res. 2002, 32, 1889–1892. [CrossRef]
31. Cherry, J.A.; Robertson, W.D.; Blowes, D.W.; Coggans, C.; McGregor, R.J. Hydrogeology and Geochemsitry of theINCO Copper Cliff Mine Tailings Impoundment; Draft report prepared by Waterloo Centre for GroundwaterResearch for Inco Inc.: Copper Cliff, ON, Canada, 1990.
32. McGregor, R.G.; Blowes, D.W.; Jambor, J.L.; Robertson, W.D. Mobilization and attenuation of heavy metalswithin a nickel mine tailings impoundment near Sudbury, Ontario, Canada. Environ. Geol. 1998, 36, 305–319.[CrossRef]
33. Metsaranta, J.M.; Lieffers, V.J.; Wein, R.W. Dendrochronological reconstruction of jack pine snag and downedlog dynamics in Saskatchewan and Manitoba, Canada. For. Ecol. Manag. 2008, 255, 1262–1270. [CrossRef]
Forests 2018, 9, 707 21 of 23
34. Peng, C. Nonlinear Height-Diameter Models for Nine Boreal Forest Tree Species in Ontario; Forest Research ReportNo. 155; Ontario Forest Research Institute: Sault Ste. Marie, ON, Canada, 1999.
35. Sulcek, Z.; Provondra, P. Methods of Decomposition in Inorganic Analysis; CRC Press: Boca Raton, FL, USA, 1989.36. Fowler, G.; Damchroder, I.J. A Red Pine Bark Factor Equation for Michigan. North. J. Appl. For. 1988, 5,
28–30.37. Sharma, M.; Parton, J. Height-diameter equations for boreal tree species in Ontario using a mixed-effects
modelling approach. For. Ecol. Mansg. 2007, 249, 187–198. [CrossRef]38. Metsaranta, J.M.; Bhatti, J.S. Evaluation of whole tree growth increment derived from tree-ring seres for use
in assessments of changes in forest productivity across various spatial scales. Forests 2016, 7, 303. [CrossRef]39. Honer, T.G.; Ker, M.F.; Alemdag, I.S. Metric Timber Tables for the Commercial Tree Species of Central and Eastern
Canada; Information Report M-X-140; Maritimes Forest Research Centre: Fredericton, NB, Canada, 1983.40. Boudewyn, P.; Song, X.; Magnussen, S.; Gillis, M.D. Model-Based Volume-to-Biomass Conversion for Forested and
Vegetated Land in Canada; Information Report BC-X-41; Natural Resources Canada, Canadian Forest Service,Pacific Forestry Centre: Victoria, BC, Canada, 2007.
41. Kull, S.J.; Rampley, G.J.; Morken, S.; Metsaranta, J.M.; Neilson, E.T.; Kurz, W.A. Operational-Scale CarbonBudget Model of the Canadian Forest Sector (CBM-CFS3) Version 1.2: User’s Guide; Natural Resources Canada,Canadian Forest Service, Northern Forestry Centre: Edmonton, AB, Canada, 2016.
42. Li, Z.; Kurz, W.A.; Apps, M.J.; Beukema, S.J. Belowground biomass dynamics in the Carbon Budget Modelof the Canadian Forest Sector: Recent improvements and implications for the estimation of NPP and NEP.Can. J. For. Res. 2003, 33, 126–136. [CrossRef]
43. Bonifacio, C.; Barchyn, T.E.; Hugenholtz, C.H.; Kienzle, S.W. CCDST: A free Canadian climate data scrapingtool. Comput. Geosci. 2015, 75, 13–16. [CrossRef]
44. Metsaranta, J.M.; Shaw, C.H.; Kurz, W.A.; Boisvenue, C.; Morken, S. Uncertainty of inventory-based estimatesof the carbon dynamics of Canada’s managed forest (1990–2014). Can. J. For. Res. 2017, 47, 1082–1094.[CrossRef]
45. Voicu, M.; Shaw, C.H.; Kurz, W.A.; Huffman, T.; Liu, J.; Fellow, M. Carbon dynamics on agricultural landreverting to woody land in Ontario, Canada. J. Environ. Manag. 2017, 193, 318–325. [CrossRef] [PubMed]
46. Plonski, W.L. Normal Yield Tables (Metric) for Major Forest Species of Ontario; Ontario Ministry of NaturalResources: Toronto, ON, Canada, 1974.
47. Payendeh, P. Plonski’s (metric) yield tables formulated. For. Chron. 1991, 67, 545–546. [CrossRef]48. Penner, M.; Woods, M.; Parton, J.; Stinson, A. Validation of empirical yield curves for natural-origin stands
in boreal Ontario. For. Chron. 2008, 84, 704–717. [CrossRef]49. Amiro, B.D.; Barr, A.G.; Barr Black, T.A.; Iwashita, H.; Kljun, N.; McCaughey, J.H.; Morgenstern, K.;
Murayama, S.; Nesic, Z.; Orchansky, A.L.; et al. Carbon, energy and water fluxes at mature and disturbedforest sites, Saskatchewan, Canada. Agric. For. Meteorol. 2006, 136, 237–251. [CrossRef]
50. Grant, R.F.; Barr, A.G.; Black, T.A.; Gaumont-Guay, D.; Iwashita, H.; Kidson, J.; McCaughey, H.;Morgenstern, K.; Murayama, S.; Nesic, Z.; et al. Net ecosystem productivity of boreal jack pine standsregenerating from clearcutting under current and future climates. Glob. Chang. Biol. 2007, 13, 1–18. [CrossRef]
51. Zha, T.; Barr, A.G.; Black, T.A.; Black, M.; Caughey, J.H.; Bhatti, J.; Hawthorne, I.; Krishnan, P.; Kidston, J.;Saigusa, P.; et al. Carbon sequestration in boreal jack pine stands following harvesting. Glob. Chang. Biol.2009, 15, 1475–1487. [CrossRef]
52. Mkhabela, M.S.; Amiro, B.D.; Barr, A.G.; Black, T.A.; Hawthorne, I.; Kidston, J.; McCaughey, J.H.;Orchansky, A.L.; Nesic, Z.; Sass, A.; et al. Comparison of carbon dynamics and water use efficiencyfollowing fire and harvesting in Canadian boreal forests. Agric. For. Meteorol. 2009, 149, 783–794. [CrossRef]
53. Shaw, C.H.; Bhatti, J.S.; Sabourin, K.J. An Ecosystem Carbon Database for Canadian Forests; Information ReportNOR-X-403; Natural Resources Canada, Canadian Forest Srvice, Northern Foresty Centre: Edmonton, AB,Canada, 2005.
54. Huang, L.; Baumgartl, T.; Mulligan, D. Is rhizosphere remediation sufficient for sustainable revegetation ofmine tailings? Ann. Bot. 2012, 110, 223–238. [CrossRef] [PubMed]
55. Sudbury Soils Study. Available online: http://www.sudburysoilsstudy.com/EN/indexE.htm (accessed on31 October 2018).
Forests 2018, 9, 707 22 of 23
56. Rodrigue, J.A.; Burger, J.A.; Oderwald, R.G. Forest Productivity and Commercial Value of Pre-Law ReclaimedMined Land in the Eastern United States. North. J. Appl. For. 2002, 19, 106–114.
57. Zipper, C.E.; Burger, J.A.; Skousen, J.G.; Angel, P.N.; Barton, C.D.; Davis, V.; Franklin, J.A. Restoring Forestsand Associated Ecosystem Services on Appalachian Coal Surface Mines. Environ. Manag. 2001, 47, 751–765.[CrossRef] [PubMed]
58. Casselman, C.N.; Fox, T.R.; Burger, J.A. Thinning Response of a White Pine Stand on a Reclaimed SurfaceMine in Southwestern Virginia. North. J. Appl. For. 2007, 24, 9–13.
59. Huang, S.; Pinno, B.; Vassov, R.; Tomm, B.; Yang, Y. Estimating and monitoring the long-term growth andproductivity of boreal forests on reclaimed oil sands sites: Preliminary results and future outlook. In JSMProceedings, Advances in Ecological Modeling, Section on Statistics and the Environment; American StatisticalAssociation: Alexandria, VA, USA, 2014; pp. 3902–3916.
60. Karu, H.; Szava-Kovats, R.; Pensa, M.; Pensa Kull, O. Carbon sequestration in a chronosequence of Scotspine stands in a reclaimed opencast oil shale mine. Can. J. For. Res. 2009, 29, 1507–1517. [CrossRef]
61. Rooney, R.C.; Bayley, S.E.; Schindler, D.W. Oil sands mining and reclamation cause massive loss of peatlandand stored carbon. Proc. Nat. Acad. Sci. USA 2012, 109, 4933–4937. [CrossRef] [PubMed]
62. Pietrzykowski, M.; Krzaklewski, K. Potential for carbon sequestration in reclaimed mine soil on reforestedsurface mining areas in Poland. Nat. Sci. 2010, 2, 1015–1021. [CrossRef]
63. Pietrzykowski, M.; Daniels, W.L. Estimation of carbon sequestration by pine (Pinus sylvestris L.) ecosystemsdeveloping on reforested post-mining sites in Poland on differing mine soil substrates. Ecol. Eng. 2014, 73,209–218. [CrossRef]
64. Frouz, J.; Pižl, V.; Cienciala, E.; Kalcík, J. Carbon storage in post-mining forest soil, the role of tree biomassand soil bioturbation. Biogeochemistry 2009, 94, 111–121. [CrossRef]
65. Horodecki, P.; Jagodzinski, A.M. Tree species effects on litter decomposition in pure stands on afforestedpost-mining sites. For. Ecol. Manag. 2017, 406, 1–11. [CrossRef]
66. Shaw, C.H.; Bona, K.A.; Kurz, W.A.; Kurz Fyles, J.W. The importance of tree species and soil taxonomy tomodeling forest soil carbon stocks in Canada. Geoderma Reg. 2015, 4, 114–125. [CrossRef]
67. Canadian Council of Ministers of the Environment. Canadian Soil Quality Guidelines for the Protection ofEnvironmental and Human Health: Copper 1999; Canadian Environmental Quality Guidelines; CanadianCouncil of Ministers of the Environment: Winnipeg, MB, Canada, 1999.
68. Canadian Council of Ministers of the Environment. Canadian Soil Quality Guidelines for the Protection ofEnvironmental and Human Health: Nickel 2015; Canadian Environmental Quality Guidelines; CanadianCouncil of Ministers of the Environment: Winnipeg, MB, Canada, 2015.
69. Langdon, C.J.; Piearce, T.G.; Meharg, A.A.; Meharg Semple, K.T. Resistance to copper toxicity inpopulations of the earthworms Lumbricus rubellus and Dendrodrilus rubidus from contaminated mine wastes.Environ. Toxicol. Chem. 2001, 20, 2336–2341. [CrossRef]
70. Arnold, R.E.; Hodson, M.E.; Langdon, C.J. A Cu tolerant population of the earthworm Dendrodrilus rubidus(Savigny, 1862) at Coniston Copper Mines, Cumbria, UK. Environ. Pollut. 2008, 152, 713–722. [CrossRef][PubMed]
71. Lundström, U.S.; van Breemen, N.; Bain, D. The podsolization process. A review. Geoderma 2000, 94, 91–107.[CrossRef]
72. Van Breemen, N.; Lundström, U.S.; Jongmans, A.G. Do plants drive podsolization via rock-eating mycorrhizalfungi? Geoderma 2000, 94, 163–171. [CrossRef]
73. Brunori, A.M.E.; Sdringola, P.; Dini, F.; Ilarioni, L.; Nasini, L.; Regni, L.; Proietti, P.; Proietti, S.; Vitone, A.;Pelleri, F. Carbon balance and Life Cycle Assessment in an oak plantation for mined area reclamation.J. Clean. Prod. 2017, 144, 69–78. [CrossRef]
74. Aldentun, Y. Life cycle inventory of forest seedling production—From seed to regeneration site. J. Clean. Prod.2002, 10, 47–55. [CrossRef]
75. West, T.O.; Marland, G. A synthesis of carbon sequestration, carbon emissions, and net carbon flux inagriculture: Comparing tillage practices in the United States. Agric. Ecosyst. Environ. 2002, 91, 217–232.[CrossRef]
76. West, T.O.; McBride, A.C. The contribution of agricultural lime to carbon dioxide emissions in the UnitedStates: Dissolution, transport, and net emissions. Agric. Ecosyst. Environ. 2002, 108, 145–154. [CrossRef]

Forests 2018, 9, 707 23 of 23
77. Lamers, P.; Junginger, M. The ‘debt’ is in the detail: A synthesis of recent temporal forest carbon analyses onwoody biomass for energy. Biofuels Bioprod. Biorefin. 2013, 6, 44–60. [CrossRef]
78. Ter-Mikaelian, M.T.; Colombo, S.J.; Lovekin, D.; McKechnie, J.; Reynolds, R.; Titus, B.; Laurin, E.;Chapman, A.-M.; Chen, J.; MacLean, H.L. Carbon debt repayment or carbon sequestration parity? Lessonsfrom a forest bioenergy case study in Ontario. Glob. Chang. Biol. Bioenergy 2015, 7, 704–716. [CrossRef]
© 2018 by the authors. Licensee MDPI, Basel, Switzerland. This article is an open accessarticle distributed under the terms and conditions of the Creative Commons Attribution(CC BY) license (http://creativecommons.org/licenses/by/4.0/).
Copyright © 2022 FDOKUMEN