Assessing the Health Benefits of Urban Air Pollution Reductions Associated with Climate Change...
7
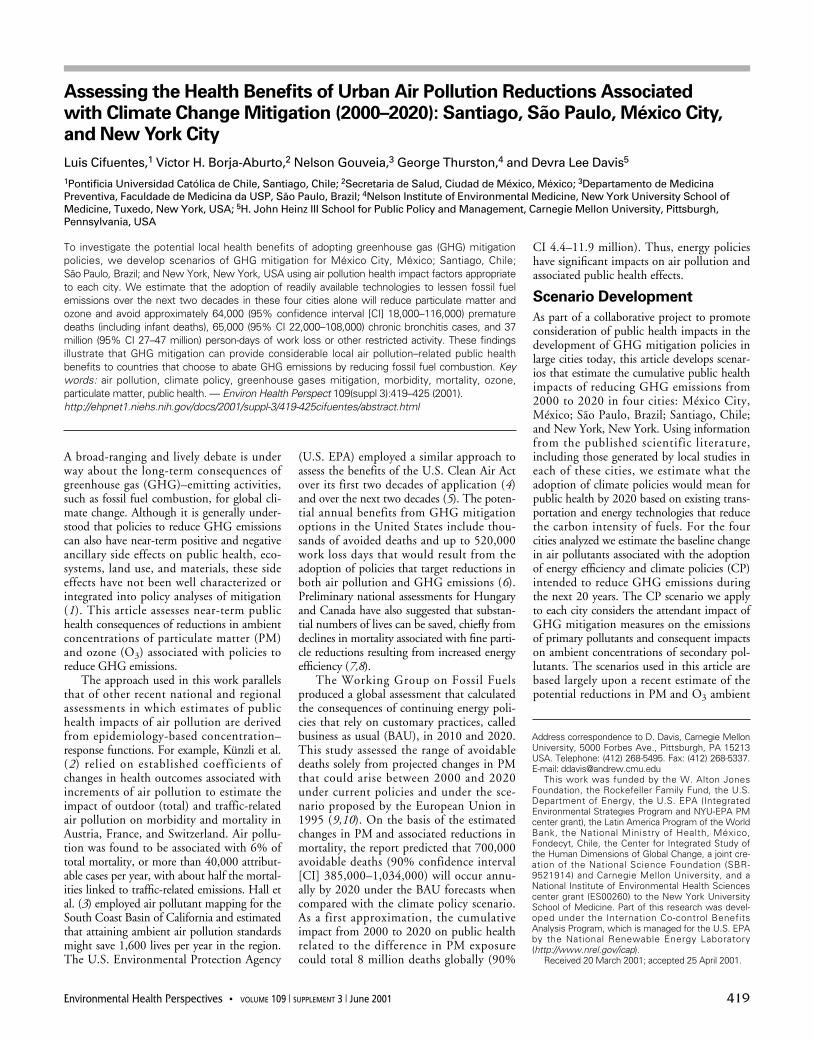
Environmental Health Perspectives • VOLUME 109 | SUPPLEMENT 3 | June 2001 419 A broad-ranging and lively debate is under way about the long-term consequences of greenhouse gas (GHG)–emitting activities, such as fossil fuel combustion, for global cli- mate change. Although it is generally under- stood that policies to reduce GHG emissions can also have near-term positive and negative ancillary side effects on public health, eco- systems, land use, and materials, these side effects have not been well characterized or integrated into policy analyses of mitigation ( 1). This article assesses near-term public health consequences of reductions in ambient concentrations of particulate matter (PM) and ozone (O 3 ) associated with policies to reduce GHG emissions. The approach used in this work parallels that of other recent national and regional assessments in which estimates of public health impacts of air pollution are derived from epidemiology-based concentration– response functions. For example, Künzli et al. ( 2 ) relied on established coefficients of changes in health outcomes associated with increments of air pollution to estimate the impact of outdoor (total) and traffic-related air pollution on morbidity and mortality in Austria, France, and Switzerland. Air pollu- tion was found to be associated with 6% of total mortality, or more than 40,000 attribut- able cases per year, with about half the mortal- ities linked to traffic-related emissions. Hall et al. (3) employed air pollutant mapping for the South Coast Basin of California and estimated that attaining ambient air pollution standards might save 1,600 lives per year in the region. The U.S. Environmental Protection Agency (U.S. EPA) employed a similar approach to assess the benefits of the U.S. Clean Air Act over its first two decades of application (4) and over the next two decades (5). The poten- tial annual benefits from GHG mitigation options in the United States include thou- sands of avoided deaths and up to 520,000 work loss days that would result from the adoption of policies that target reductions in both air pollution and GHG emissions (6). Preliminary national assessments for Hungary and Canada have also suggested that substan- tial numbers of lives can be saved, chiefly from declines in mortality associated with fine parti- cle reductions resulting from increased energy efficiency (7,8). The Working Group on Fossil Fuels produced a global assessment that calculated the consequences of continuing energy poli- cies that rely on customary practices, called business as usual (BAU), in 2010 and 2020. This study assessed the range of avoidable deaths solely from projected changes in PM that could arise between 2000 and 2020 under current policies and under the sce- nario proposed by the European Union in 1995 (9,10). On the basis of the estimated changes in PM and associated reductions in mortality, the report predicted that 700,000 avoidable deaths (90% confidence interval [CI] 385,000–1,034,000) will occur annu- ally by 2020 under the BAU forecasts when compared with the climate policy scenario. As a first approximation, the cumulative impact from 2000 to 2020 on public health related to the difference in PM exposure could total 8 million deaths globally (90% CI 4.4–11.9 million). Thus, energy policies have significant impacts on air pollution and associated public health effects. Scenario Development As part of a collaborative project to promote consideration of public health impacts in the development of GHG mitigation policies in large cities today, this article develops scenar- ios that estimate the cumulative public health impacts of reducing GHG emissions from 2000 to 2020 in four cities: México City, México; São Paulo, Brazil; Santiago, Chile; and New York, New York. Using information from the published scientific literature, including those generated by local studies in each of these cities, we estimate what the adoption of climate policies would mean for public health by 2020 based on existing trans- portation and energy technologies that reduce the carbon intensity of fuels. For the four cities analyzed we estimate the baseline change in air pollutants associated with the adoption of energy efficiency and climate policies (CP) intended to reduce GHG emissions during the next 20 years. The CP scenario we apply to each city considers the attendant impact of GHG mitigation measures on the emissions of primary pollutants and consequent impacts on ambient concentrations of secondary pol- lutants. The scenarios used in this article are based largely upon a recent estimate of the potential reductions in PM and O 3 ambient To investigate the potential local health benefits of adopting greenhouse gas (GHG) mitigation policies, we develop scenarios of GHG mitigation for México City, México; Santiago, Chile; São Paulo, Brazil; and New York, New York, USA using air pollution health impact factors appropriate to each city. We estimate that the adoption of readily available technologies to lessen fossil fuel emissions over the next two decades in these four cities alone will reduce particulate matter and ozone and avoid approximately 64,000 (95% confidence interval [CI] 18,000–116,000) premature deaths (including infant deaths), 65,000 (95% CI 22,000–108,000) chronic bronchitis cases, and 37 million (95% CI 27–47 million) person-days of work loss or other restricted activity. These findings illustrate that GHG mitigation can provide considerable local air pollution–related public health benefits to countries that choose to abate GHG emissions by reducing fossil fuel combustion. Key words: air pollution, climate policy, greenhouse gases mitigation, morbidity, mortality, ozone, particulate matter, public health. — Environ Health Perspect 109(suppl 3):419–425 (2001). http://ehpnet1.niehs.nih.gov/docs/2001/suppl-3/419-425cifuentes/abstract.html Address correspondence to D. Davis, Carnegie Mellon University, 5000 Forbes Ave., Pittsburgh, PA 15213 USA. Telephone: (412) 268-5495. Fax: (412) 268-5337. E-mail: [email protected] This work was funded by the W. Alton Jones Foundation, the Rockefeller Family Fund, the U.S. Department of Energy, the U.S. EPA (Integrated Environmental Strategies Program and NYU-EPA PM center grant), the Latin America Program of the World Bank, the National Ministry of Health, México, Fondecyt, Chile, the Center for Integrated Study of the Human Dimensions of Global Change, a joint cre- ation of the National Science Foundation (SBR- 9521914) and Carnegie Mellon University, and a National Institute of Environmental Health Sciences center grant (ES00260) to the New York University School of Medicine. Part of this research was devel- oped under the Internation Co-control Benefits Analysis Program, which is managed for the U.S. EPA by the National Renewable Energy Laboratory (http://www.nrel.gov/icap). Received 20 March 2001; accepted 25 April 2001. Assessing the Health Benefits of Urban Air Pollution Reductions Associated with Climate Change Mitigation (2000–2020): Santiago, São Paulo, México City, and New York City Luis Cifuentes, 1 Victor H. Borja-Aburto, 2 Nelson Gouveia, 3 George Thurston, 4 and Devra Lee Davis 5 1 Pontificia Universidad Católica de Chile, Santiago, Chile; 2 Secretaria de Salud, Ciudad de México, México; 3 Departamento de Medicina Preventiva, Faculdade de Medicina da USP, São Paulo, Brazil; 4 Nelson Institute of Environmental Medicine, New York University School of Medicine, Tuxedo, New York, USA; 5 H. John Heinz III School for Public Policy and Management, Carnegie Mellon University, Pittsburgh, Pennsylvania, USA
Transcript of Assessing the Health Benefits of Urban Air Pollution Reductions Associated with Climate Change...
Environmental Health Perspectives • VOLUME 109 | SUPPLEMENT 3 | June 2001 419
A broad-ranging and lively debate is underway about the long-term consequences ofgreenhouse gas (GHG)–emitting activities,such as fossil fuel combustion, for global cli-mate change. Although it is generally under-stood that policies to reduce GHG emissionscan also have near-term positive and negativeancillary side effects on public health, eco-systems, land use, and materials, these sideeffects have not been well characterized orintegrated into policy analyses of mitigation(1). This article assesses near-term publichealth consequences of reductions in ambientconcentrations of particulate matter (PM)and ozone (O3) associated with policies toreduce GHG emissions.
The approach used in this work parallelsthat of other recent national and regionalassessments in which estimates of publichealth impacts of air pollution are derivedfrom epidemiology-based concentration–response functions. For example, Künzli et al.(2) relied on established coefficients ofchanges in health outcomes associated withincrements of air pollution to estimate theimpact of outdoor (total) and traffic-relatedair pollution on morbidity and mortality inAustria, France, and Switzerland. Air pollu-tion was found to be associated with 6% oftotal mortality, or more than 40,000 attribut-able cases per year, with about half the mortal-ities linked to traffic-related emissions. Hall etal. (3) employed air pollutant mapping for theSouth Coast Basin of California and estimatedthat attaining ambient air pollution standardsmight save 1,600 lives per year in the region.The U.S. Environmental Protection Agency
(U.S. EPA) employed a similar approach toassess the benefits of the U.S. Clean Air Actover its first two decades of application (4)and over the next two decades (5). The poten-tial annual benefits from GHG mitigationoptions in the United States include thou-sands of avoided deaths and up to 520,000work loss days that would result from theadoption of policies that target reductions inboth air pollution and GHG emissions (6).Preliminary national assessments for Hungaryand Canada have also suggested that substan-tial numbers of lives can be saved, chiefly fromdeclines in mortality associated with fine parti-cle reductions resulting from increased energyefficiency (7,8).
The Working Group on Fossil Fuelsproduced a global assessment that calculatedthe consequences of continuing energy poli-cies that rely on customary practices, calledbusiness as usual (BAU), in 2010 and 2020.This study assessed the range of avoidabledeaths solely from projected changes in PMthat could arise between 2000 and 2020under current policies and under the sce-nario proposed by the European Union in1995 (9,10). On the basis of the estimatedchanges in PM and associated reductions inmortality, the report predicted that 700,000avoidable deaths (90% confidence interval[CI] 385,000–1,034,000) will occur annu-ally by 2020 under the BAU forecasts whencompared with the climate policy scenario.As a first approximation, the cumulativeimpact from 2000 to 2020 on public healthrelated to the difference in PM exposurecould total 8 million deaths globally (90%
CI 4.4–11.9 million). Thus, energy policieshave significant impacts on air pollution andassociated public health effects.
Scenario Development
As part of a collaborative project to promoteconsideration of public health impacts in thedevelopment of GHG mitigation policies inlarge cities today, this article develops scenar-ios that estimate the cumulative public healthimpacts of reducing GHG emissions from2000 to 2020 in four cities: México City,México; São Paulo, Brazil; Santiago, Chile;and New York, New York. Using informationfrom the published scientific literature,including those generated by local studies ineach of these cities, we estimate what theadoption of climate policies would mean forpublic health by 2020 based on existing trans-portation and energy technologies that reducethe carbon intensity of fuels. For the fourcities analyzed we estimate the baseline changein air pollutants associated with the adoptionof energy efficiency and climate policies (CP)intended to reduce GHG emissions duringthe next 20 years. The CP scenario we applyto each city considers the attendant impact ofGHG mitigation measures on the emissionsof primary pollutants and consequent impactson ambient concentrations of secondary pol-lutants. The scenarios used in this article arebased largely upon a recent estimate of thepotential reductions in PM and O3 ambient
To investigate the potential local health benefits of adopting greenhouse gas (GHG) mitigationpolicies, we develop scenarios of GHG mitigation for México City, México; Santiago, Chile;São Paulo, Brazil; and New York, New York, USA using air pollution health impact factors appropriateto each city. We estimate that the adoption of readily available technologies to lessen fossil fuelemissions over the next two decades in these four cities alone will reduce particulate matter andozone and avoid approximately 64,000 (95% confidence interval [CI] 18,000–116,000) prematuredeaths (including infant deaths), 65,000 (95% CI 22,000–108,000) chronic bronchitis cases, and 37million (95% CI 27–47 million) person-days of work loss or other restricted activity. These findingsillustrate that GHG mitigation can provide considerable local air pollution–related public healthbenefits to countries that choose to abate GHG emissions by reducing fossil fuel combustion. Keywords: air pollution, climate policy, greenhouse gases mitigation, morbidity, mortality, ozone,particulate matter, public health. — Environ Health Perspect 109(suppl 3):419–425 (2001).http://ehpnet1.niehs.nih.gov/docs/2001/suppl-3/419-425cifuentes/abstract.html
Address correspondence to D. Davis, Carnegie MellonUniversity, 5000 Forbes Ave., Pittsburgh, PA 15213USA. Telephone: (412) 268-5495. Fax: (412) 268-5337.E-mail: [email protected]
This work was funded by the W. Alton JonesFoundation, the Rockefeller Family Fund, the U.S.Department of Energy, the U.S. EPA (IntegratedEnvironmental Strategies Program and NYU-EPA PMcenter grant), the Latin America Program of the WorldBank, the National Ministry of Health, México,Fondecyt, Chile, the Center for Integrated Study ofthe Human Dimensions of Global Change, a joint cre-ation of the National Science Foundation (SBR-9521914) and Carnegie Mellon University, and aNational Institute of Environmental Health Sciencescenter grant (ES00260) to the New York UniversitySchool of Medicine. Part of this research was devel-oped under the Internation Co-control BenefitsAnalysis Program, which is managed for the U.S. EPAby the National Renewable Energy Laboratory(http://www.nrel.gov/icap).
Received 20 March 2001; accepted 25 April 2001.
Assessing the Health Benefits of Urban Air Pollution Reductions Associated with Climate Change Mitigation (2000–2020): Santiago, São Paulo, México City,and New York City
Luis Cifuentes,1 Victor H. Borja-Aburto,2 Nelson Gouveia,3 George Thurston,4 and Devra Lee Davis5
1Pontificia Universidad Católica de Chile, Santiago, Chile; 2Secretaria de Salud, Ciudad de México, México; 3Departamento de MedicinaPreventiva, Faculdade de Medicina da USP, São Paulo, Brazil; 4Nelson Institute of Environmental Medicine, New York University School ofMedicine, Tuxedo, New York, USA; 5H. John Heinz III School for Public Policy and Management, Carnegie Mellon University, Pittsburgh,Pennsylvania, USA
109S3.Part 1 06/05/01 3:52 PM Page 419 (Black plate)
Cifuentes et al.
420 VOLUME 109 | SUPPLEMENT 3 | June 2001 • Environmental Health Perspectives
concentrations that have been estimated asachievable in Chile through the use of readilyavailable technologies to mitigate GHGemissions in energy, transport, residential, andindustrial sectors (11). This Chilean studyshows that the adoption of energy efficiencyand fuel substitution measures in transporta-tion, energy, residences, and industry canlower GHG emissions in 2020 by approxi-mately 13% with respect to the BAU case, atlittle or no cost.
The associated reductions in ambient con-centrations of PM less than 10 µm in diame-ter (PM10) and O3 are approximately 10% ofthe projected baseline levels in 2020 and occurgradually throughout the two decades. Theseresults agree with another study for Chiledeveloped independently by the Organisationfor Economic Co-operation and Development(12). On the basis of these results, we com-pute the benefits associated with a 10%reduction in PM and O3 that might be asso-ciated with climate change policies in each ofthese megacities. Although we recognize thatother air pollutants may also affect humanhealth, we consider only PM and O3 in thisanalysis. These two presently have the best-documented health effects across a wide rangeof health outcomes and are pollutants thatrepresent, respectively, the particulate andthe gaseous components of air pollution.Therefore, although conservative in that onlytwo pollutants are considered, this analysisdoes consider the breadth of types of air pollu-tion and health effect changes that wouldresult from GHG mitigation measures.
The magnitude and scale of potentialbenefits of GHG mitigation will vary withthe stringency of existing and proposed regu-lations (13). Where baseline conditionsinclude relatively high ambient levels of pol-lution and unsophisticated technology, aswith many rapidly developing countries suchas Chile, México, and Brazil, the potentialbenefits of reducing emissions will likely bemuch larger than where baseline conditionsalready include fairly strict regulatory controlsand advanced systems. Mitigation policies incities that have little regulatory control willhave a greater absolute impact than those inareas with well-established controls in place.To develop the scenarios in this analysis, wemade a number of simplifying assumptions.We assumed that the fuel and technologymixes in the Latin American cities we assessedhere were similar. Although São Paulo reliedon ethanol fuels until the mid-1990s, thatfuel is not expected to play a major role in thefuture. On the basis of recent trend informa-tion, we assumed that the concentrations ofboth PM10 and O3 would remain constant inthese cities for the baseline scenarios. ForSantiago, where progress is being made in thereduction of PM10, we assumed a reduction
of 3% per year in the concentrations ofPM10. Applying the 10% reduction to theprojected concentrations for 2020 for MéxicoCity, São Paulo, and Santiago, respectively,we project reductions of 6.4, 5.3, and 4.5µg/m3 in the annual average of PM10, and11.4, 6.5, and 4.9 ppb in the annual averageof daily 1-hr maximum O3 by 2020.
In the analysis of air pollution–relatedimpacts associated with GHG mitigation forNew York City, a 10% reduction in O3 andPM10 from present baseline levels amounts tochanges in the annual average concentrationsof 3.9 ppb daily 1-hr maximum O3 and 2.2µg/m3 annual average PM10. This assumedGHG-associated reduction in air pollutioncompares well with the only estimate that hasbeen made to date regarding potential reduc-tions that could arise from GHG mitigationin the United States. Abt Associates (6)recently estimated for the U.S. EPA that aGHG policy of applying a fee of $56/ton ofcarbon emitted would be associated with areduction of between 0.4 and 2.7 µg/m3
PM2.5 in the Midwest/Northeastern UnitedStates (or about 0.6 to 3.9 µm/m3 PM10,assuming 70% is PM2.5) when compared withvarious baseline emissions scenarios. (PM2.5 isthe mass of suspended particles less than 2.5µm in aerodynamic diameter that can pene-trate to the deepest recesses of the lung.)Thus, although New York City is very differ-ent from Santiago, the assumption of a 10%reduction from present PM10 and O3 levels inNew York City appears reasonable. This isbecause this assumption is consistent with co-pollutant reductions previously projected tobe associated with potential GHG mitigationmeasures in this region of the United States.
While the reductions in pollutantconcentrations estimated here are similarbetween New York City and the LatinAmerican cities, it must be noted that theymight arise from very different policies. Fordeveloping countries, which are notrequired to abate GHGs under the KyotoProtocol, the reductions stem from nonposi-tive cost measures of energy efficiency andfuel substitution, whereas for the UnitedStates, which is supposed to abate GHGemissions under the Kyoto Protocol, thereductions might result from the applicationof a carbon tax or other policies.
Health Effects EstimationMethodsTo develop estimates of public health impactsin the cities of interest over the next twodecades, we relied on published studies on airpollution and health, using concentration–response (C–R) coefficients derived fromstudies conducted in these or similar citieswhenever possible. Table 1 shows a list of endpoints that have been associated with air
pollution. The left side of the table displayseffects associated with air pollution in numer-ous cities in more than 20 countries across theworld; these effects are used extensively instandard setting (4,5,14). The effects in theright side of the table have been observed insome cities but have not yet been replicated inmany locations. Assessments of air pollution–related health effects are based almost exclu-sively upon epidemiologic studies, which arecorroborated by a body of knowledge fromcontrolled human and animal studies (5).Most of the recent studies linking air pollu-tion and health have applied multivariatemethods, such as Poisson models, that addressmajor potential confounders (15). In suchmodels the expected value of the number ofhealth effects is modeled as an exponentialfunction of the explanatory variables, and thechange in the number of health effects, J,when ambient concentrations of pollutant, P,change by ∆CP , is given by
∆EJP = [exp(β J
P ⋅ ∆CP) – 1] ⋅ PopJ ⋅ BRJ0.
β JP is often referred to as the C–R coefficient
of end point, J, associated to pollutant P. BR J0
is the base rate of effects, J, in the affectedpopulation Pop J. For example, BR J
0 might bethe number of deaths per 100,000 infants lessthan 1 year of age during a baseline year.However, it is important to note that theaffected population is not necessarily thewhole population of a city. It can be sepa-rated by age groups (e.g., infants, adults,
Table 1. Scope of human health effects of air pollution.a
Quantifiable health effects Suspected health effects
Mortality (elder) Induction of asthma Mortality (infant) Fetus/child developmental
effectsNeonatal mortality Increased airway
responsivenessBronchitis: chronic Nonbronchitis chronic
and acute respiratory diseasesIncreased asthma attacks CancerRespiratory hospital Lung cancer
admissionsCardiovascular hospital Behavioral effects
admissions (e.g., learning disabilities)Emergency room visits Neurologic disorders
for asthmaLower respiratory illness Exacerbation of allergiesUpper respiratory illness Altered host defense
mechanisms (e.g., increased shortness of breath susceptibility to respiratory infection)
Respiratory symptoms Respiratory cell damageDays of work loss Decreased time to onset
of anginaModerate or worse Morphologic changes in
asthma status the lungDays with restricted Cardiovascular arrhythmia
activityaAdapted from U.S. EPA (5).
109S3.Part 1 05/24/01 4:10 PM Page 420 (Black plate)
Air pollution health benefits of climate change mitigation
elder) or by health conditions (e.g., asthmaticpopulation) among many possible divisions.
Because β JP is small, the previous equation
can be linearized and expressed in the follow-ing terms:
where Pop is the total population of an area ofanalysis and IF J
P is the health impact factor ofpollutant P for end point J. It encompassesthe relative risk, the base rate of the effect,and the relative size of the exposed popula-tion as a fraction of the total population. Byexpressing it this way, it is straightforward tocompare the relative impact of pollutionacross different populations, and to computethe changes in health effects from the changesin concentrations and total population of agiven city.
An important decision in the estimationof pollution effects involves the selection ofpollutants for analysis. Incremental changesin mortality and morbidity associated withchanges in exposures to PM have been docu-mented extensively. A number of other com-mon air pollutants, including sulfur dioxide,carbon monoxide, nitrogen oxides (NOx),
and O3 have also been linked with varioushealth effects. Inclusion of several pollutantsin a single analysis simultaneously can lead tooverestimation of the total effects if the C–Rcoefficients for each pollutant have beenderived independently and the effects areadded up later. Conversely, consideration ofonly one pollutant (PM10, for example) toestimate the effects can underestimate thetotal air pollution effects, as several analysesshow that the total risk of air pollutionincreases when more pollutants in addition toPM10, such as O3 and nitrogen dioxide(NO2), are considered (16,17). In this analy-sis we considered two pollutants that haveshown consistent and relatively independentassociations with an array of adverse healtheffects: PM and O3.
Ideally, the estimation of the change inhealth effects associated with concentrationsin a given city should be based on studiesconducted locally. However, local studies arenot available for every health effect in everycity. Therefore, we also use studies from othersimilar places, as available. For morbidity,C–R functions were derived from pooled esti-mates from the international literature whenmore than three studies were available.Random effects models were used to obtain asummary measure in this meta-analysis (18).For the case of O3, studies taking into
account the effects of PM10 simultaneouslywere employed when available. LatinAmerican studies were preferred for the citiesin that region. Regionally relevant informa-tion was available for the acute effects of PMon mortality for each of the cities. For exam-ple, whereas New York City infant mortalityand hospital admissions effects were esti-mated using U.S.-based studies, the LatinAmerican cities’ pollution effect on infantmortality was derived from México City (19),child medical visits from Santiago (20), andhospital admissions from São Paulo (21).
The effects of PM exposure on mortalityhave been derived both from time–seriesstudies that evaluate the effect of several daysof elevated or acute exposures on daily mor-tality and from cohort studies that evaluatethe annual changes in mortality or morbidityassociated with long-term, chronic exposures.Because the estimates from these two types ofstudies focus on different time frames, weused both types to indicate the likely upper-and lower-bound effects on mortality. Twomain cohort studies of the general popula-tion have reported different central effectestimates, although their CIs overlap. Weused the Pope et al. (22) and the Dockery etal. (23) studies to derive the central and highestimates of mortality, respectively. A recentreanalysis of these studies has been con-ducted by the Health Effects Institute andhas confirmed their results (24). The lowerbound of mortality effects were obtainedfrom time-series studies, as shown in Table2. Some have raised the issue that thesestudies may reflect life shortening of only afew days or weeks [sometimes referred to as“harvesting” (25)], but recent analyses havenot borne out this assertion (26–28). Theeffects of O3 on mortality in the LatinAmerican cities were obtained from a meta-analysis of several studies.
In New York, the health effects associatedwith the GHG mitigation–induced air pollu-tion decreases were based largely on the C–Rcoefficients derived from the published litera-ture for New York State by the Empire StateElectric Energy Research Corporation(ESEERCO) as part of the New York StateEnvironmental Externalities Cost Study (29).In some cases, however, alternative studyresults were used to define the bounds, suchas in the case of PM10-associated mortality.In this case, as for the Latin American cities,the Pope et al. study (22) of the effects ofchronic PM exposure was used as the centralestimate, the Dockery et al. study (23) wasused to estimate the upper bound, and theresults of a time–series PM study of theeffects of acute PM exposure were used forthe lower bound (as derived from theESEERCO report). In addition, theESEERCO C–R coefficients were updated
∆ ∆
∆
E BRPopPop
C Pop
IF C Pop
PJ
PJ
0J
J
P
PJ
P
= ⋅ ⋅
⋅ ⋅
= ⋅ ⋅
β
,
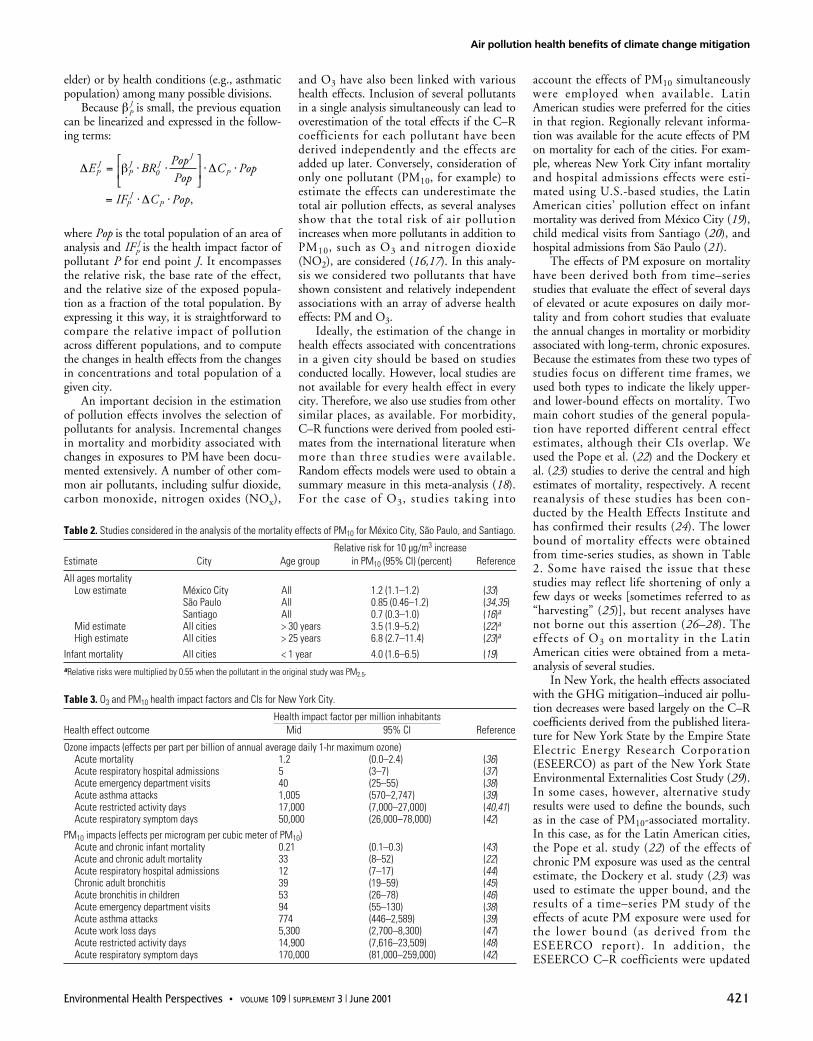
Environmental Health Perspectives • VOLUME 109 | SUPPLEMENT 3 | June 2001 421
Table 2. Studies considered in the analysis of the mortality effects of PM10 for México City, São Paulo, and Santiago.
Relative risk for 10 µg/m3 increaseEstimate City Age group in PM10 (95% CI) (percent) Reference
All ages mortalityLow estimate México City All 1.2 (1.1–1.2) (33)
São Paulo All 0.85 (0.46–1.2) (34,35)Santiago All 0.7 (0.3–1.0) (16)a
Mid estimate All cities > 30 years 3.5 (1.9–5.2) (22)aHigh estimate All cities > 25 years 6.8 (2.7–11.4) (23)a
Infant mortality All cities < 1 year 4.0 (1.6–6.5) (19)aRelative risks were multiplied by 0.55 when the pollutant in the original study was PM2.5.
Table 3. O3 and PM10 health impact factors and CIs for New York City.
Health impact factor per million inhabitantsHealth effect outcome Mid 95% CI Reference
Ozone impacts (effects per part per billion of annual average daily 1-hr maximum ozone)Acute mortality 1.2 (0.0–2.4) (36)Acute respiratory hospital admissions 5 (3–7) (37)Acute emergency department visits 40 (25–55) (38)Acute asthma attacks 1,005 (570–2,747) (39)Acute restricted activity days 17,000 (7,000–27,000) (40,41)Acute respiratory symptom days 50,000 (26,000–78,000) (42)
PM10 impacts (effects per microgram per cubic meter of PM10)Acute and chronic infant mortality 0.21 (0.1–0.3) (43)Acute and chronic adult mortality 33 (8–52) (22) Acute respiratory hospital admissions 12 (7–17) (44)Chronic adult bronchitis 39 (19–59) (45)Acute bronchitis in children 53 (26–78) (46)Acute emergency department visits 94 (55–130) (38)Acute asthma attacks 774 (446–2,589) (39) Acute work loss days 5,300 (2,700–8,300) (47)Acute restricted activity days 14,900 (7,616–23,509) (48)Acute respiratory symptom days 170,000 (81,000–259,000) (42)
109S3.Part 1 06/05/01 3:52 PM Page 421 (Black plate)
Cifuentes et al.
422 VOLUME 109 | SUPPLEMENT 3 | June 2001 • Environmental Health Perspectives
with newer studies as appropriate, andstudies conducted in or near New York Statewere chosen when available.
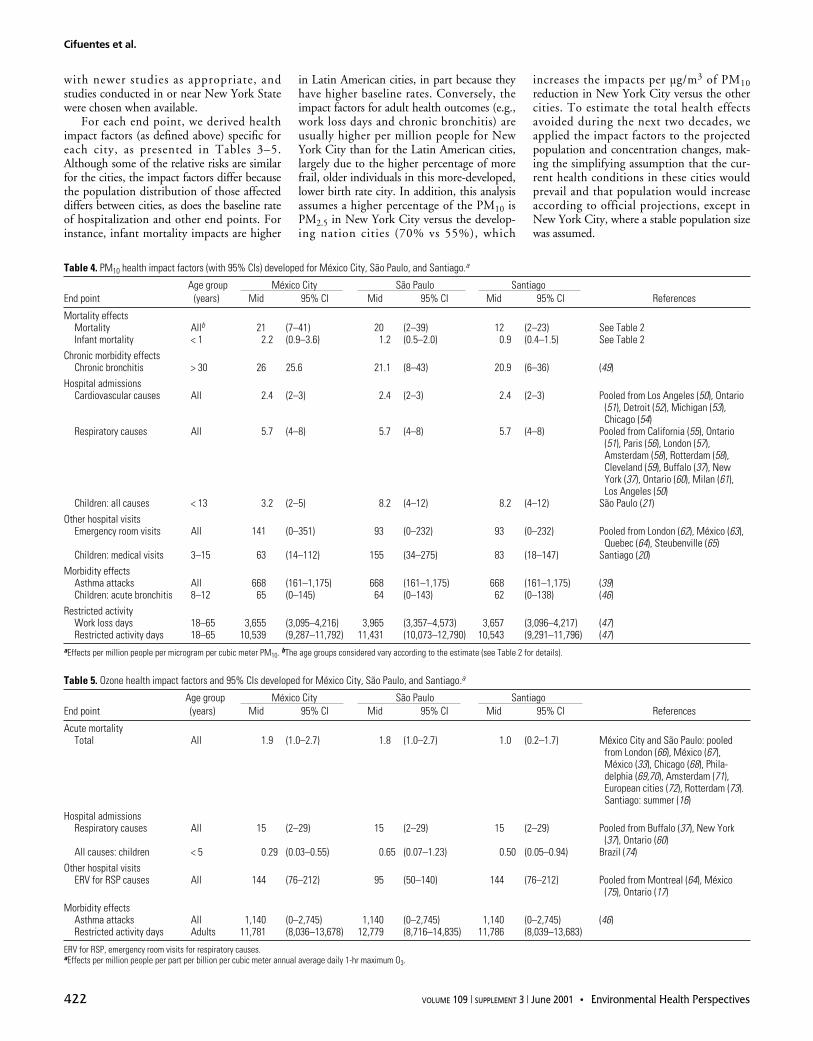
For each end point, we derived healthimpact factors (as defined above) specific foreach city, as presented in Tables 3–5.Although some of the relative risks are similarfor the cities, the impact factors differ becausethe population distribution of those affecteddiffers between cities, as does the baseline rateof hospitalization and other end points. Forinstance, infant mortality impacts are higher
in Latin American cities, in part because theyhave higher baseline rates. Conversely, theimpact factors for adult health outcomes (e.g.,work loss days and chronic bronchitis) areusually higher per million people for NewYork City than for the Latin American cities,largely due to the higher percentage of morefrail, older individuals in this more-developed,lower birth rate city. In addition, this analysisassumes a higher percentage of the PM10 isPM2.5 in New York City versus the develop-ing nation cities (70% vs 55%), which
increases the impacts per µg/m3 of PM10reduction in New York City versus the othercities. To estimate the total health effectsavoided during the next two decades, weapplied the impact factors to the projectedpopulation and concentration changes, mak-ing the simplifying assumption that the cur-rent health conditions in these cities wouldprevail and that population would increaseaccording to official projections, except inNew York City, where a stable population sizewas assumed.
Table 4. PM10 health impact factors (with 95% CIs) developed for México City, São Paulo, and Santiago.a
Age group México City São Paulo SantiagoEnd point (years) Mid 95% CI Mid 95% CI Mid 95% CI References
Mortality effectsMortality Allb 21 (7–41) 20 (2–39) 12 (2–23) See Table 2Infant mortality < 1 2.2 (0.9–3.6) 1.2 (0.5–2.0) 0.9 (0.4–1.5) See Table 2
Chronic morbidity effectsChronic bronchitis > 30 26 25.6 21.1 (8–43) 20.9 (6–36) (49)
Hospital admissionsCardiovascular causes All 2.4 (2–3) 2.4 (2–3) 2.4 (2–3) Pooled from Los Angeles (50), Ontario
(51), Detroit (52), Michigan (53), Chicago (54)
Respiratory causes All 5.7 (4–8) 5.7 (4–8) 5.7 (4–8) Pooled from California (55), Ontario(51), Paris (56), London (57), Amsterdam (58), Rotterdam (58), Cleveland (59), Buffalo (37), New York (37), Ontario (60), Milan (61), Los Angeles (50)
Children: all causes < 13 3.2 (2–5) 8.2 (4–12) 8.2 (4–12) São Paulo (21)Other hospital visits
Emergency room visits All 141 (0–351) 93 (0–232) 93 (0–232) Pooled from London (62), México (63), Quebec (64), Steubenville (65)
Children: medical visits 3–15 63 (14–112) 155 (34–275) 83 (18–147) Santiago (20)Morbidity effects
Asthma attacks All 668 (161–1,175) 668 (161–1,175) 668 (161–1,175) (39)Children: acute bronchitis 8–12 65 (0–145) 64 (0–143) 62 (0–138) (46)
Restricted activityWork loss days 18–65 3,655 (3,095–4,216) 3,965 (3,357–4,573) 3,657 (3,096–4,217) (47)Restricted activity days 18–65 10,539 (9,287–11,792) 11,431 (10,073–12,790) 10,543 (9,291–11,796) (47)
aEffects per million people per microgram per cubic meter PM10. bThe age groups considered vary according to the estimate (see Table 2 for details).
Table 5. Ozone health impact factors and 95% CIs developed for México City, São Paulo, and Santiago.a
Age group México City São Paulo SantiagoEnd point (years) Mid 95% CI Mid 95% CI Mid 95% CI References
Acute mortalityTotal All 1.9 (1.0–2.7) 1.8 (1.0–2.7) 1.0 (0.2–1.7) México City and São Paulo: pooled
from London (66), México (67), México (33), Chicago (68), Phila-delphia (69,70), Amsterdam (71), European cities (72), Rotterdam (73). Santiago: summer (16)
Hospital admissionsRespiratory causes All 15 (2–29) 15 (2–29) 15 (2–29) Pooled from Buffalo (37), New York
(37), Ontario (60) All causes: children < 5 0.29 (0.03–0.55) 0.65 (0.07–1.23) 0.50 (0.05–0.94) Brazil (74)
Other hospital visitsERV for RSP causes All 144 (76–212) 95 (50–140) 144 (76–212) Pooled from Montreal (64), México
(75), Ontario (17) Morbidity effects
Asthma attacks All 1,140 (0–2,745) 1,140 (0–2,745) 1,140 (0–2,745) (46)Restricted activity days Adults 11,781 (8,036–13,678) 12,779 (8,716–14,835) 11,786 (8,039–13,683)
ERV for RSP, emergency room visits for respiratory causes. aEffects per million people per part per billion per cubic meter annual average daily 1-hr maximum O3.
109S3.Part 1 06/05/01 3:53 PM Page 422 (Black plate)
Air pollution health benefits of climate change mitigation
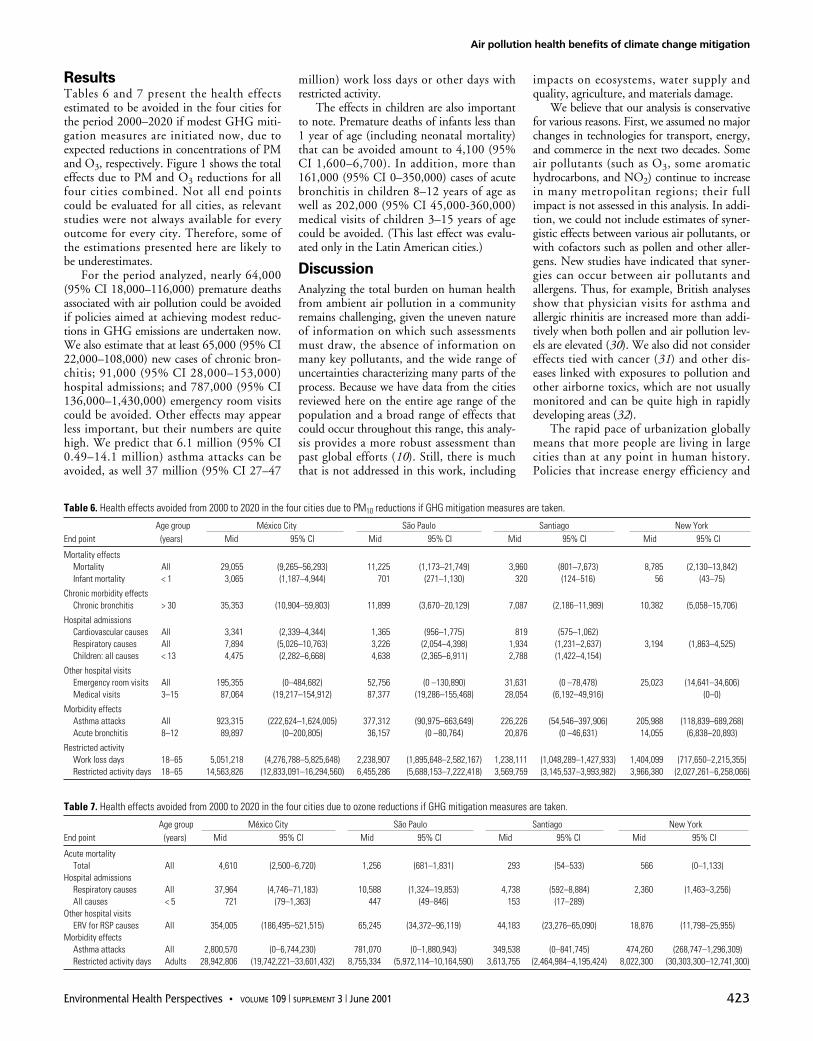
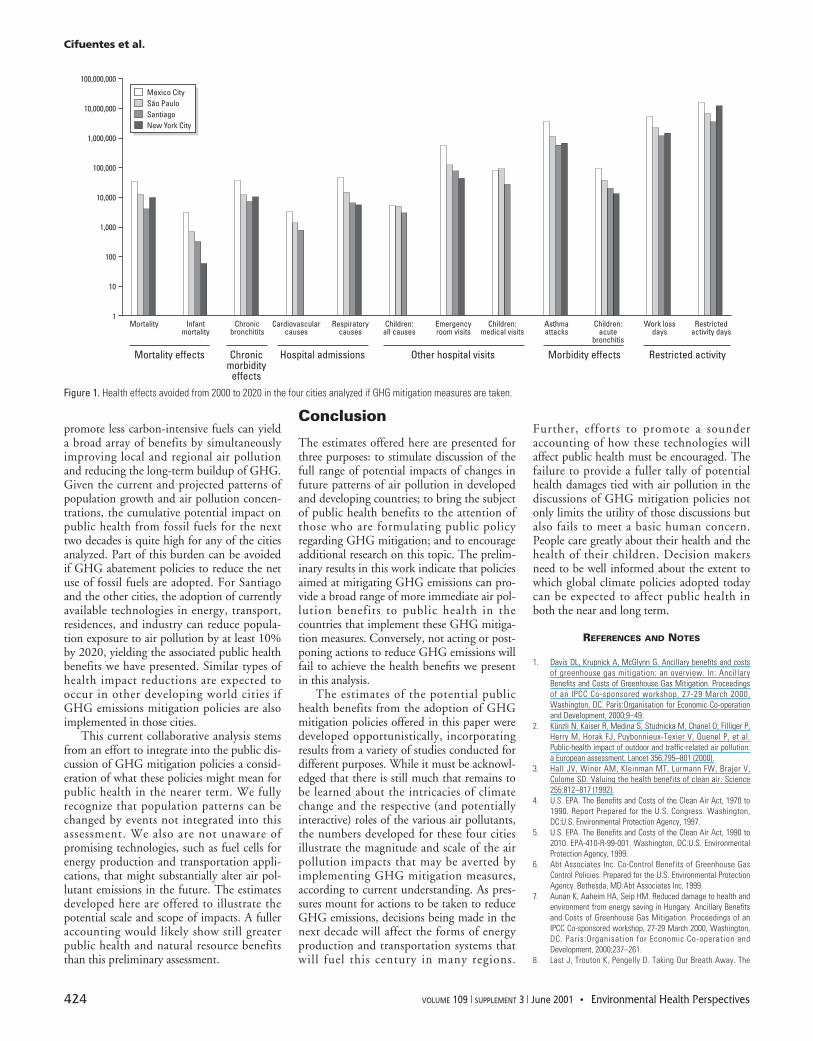
ResultsTables 6 and 7 present the health effectsestimated to be avoided in the four cities forthe period 2000–2020 if modest GHG miti-gation measures are initiated now, due toexpected reductions in concentrations of PMand O3, respectively. Figure 1 shows the totaleffects due to PM and O3 reductions for allfour cities combined. Not all end pointscould be evaluated for all cities, as relevantstudies were not always available for everyoutcome for every city. Therefore, some ofthe estimations presented here are likely tobe underestimates.
For the period analyzed, nearly 64,000(95% CI 18,000–116,000) premature deathsassociated with air pollution could be avoidedif policies aimed at achieving modest reduc-tions in GHG emissions are undertaken now.We also estimate that at least 65,000 (95% CI22,000–108,000) new cases of chronic bron-chitis; 91,000 (95% CI 28,000–153,000)hospital admissions; and 787,000 (95% CI136,000–1,430,000) emergency room visitscould be avoided. Other effects may appearless important, but their numbers are quitehigh. We predict that 6.1 million (95% CI0.49–14.1 million) asthma attacks can beavoided, as well 37 million (95% CI 27–47
million) work loss days or other days withrestricted activity.
The effects in children are also importantto note. Premature deaths of infants less than1 year of age (including neonatal mortality)that can be avoided amount to 4,100 (95%CI 1,600–6,700). In addition, more than161,000 (95% CI 0–350,000) cases of acutebronchitis in children 8–12 years of age aswell as 202,000 (95% CI 45,000-360,000)medical visits of children 3–15 years of agecould be avoided. (This last effect was evalu-ated only in the Latin American cities.)
Discussion
Analyzing the total burden on human healthfrom ambient air pollution in a communityremains challenging, given the uneven natureof information on which such assessmentsmust draw, the absence of information onmany key pollutants, and the wide range ofuncertainties characterizing many parts of theprocess. Because we have data from the citiesreviewed here on the entire age range of thepopulation and a broad range of effects thatcould occur throughout this range, this analy-sis provides a more robust assessment thanpast global efforts (10). Still, there is muchthat is not addressed in this work, including
impacts on ecosystems, water supply andquality, agriculture, and materials damage.
We believe that our analysis is conservativefor various reasons. First, we assumed no majorchanges in technologies for transport, energy,and commerce in the next two decades. Someair pollutants (such as O3, some aromatichydrocarbons, and NO2) continue to increasein many metropolitan regions; their fullimpact is not assessed in this analysis. In addi-tion, we could not include estimates of syner-gistic effects between various air pollutants, orwith cofactors such as pollen and other aller-gens. New studies have indicated that syner-gies can occur between air pollutants andallergens. Thus, for example, British analysesshow that physician visits for asthma andallergic rhinitis are increased more than addi-tively when both pollen and air pollution lev-els are elevated (30). We also did not considereffects tied with cancer (31) and other dis-eases linked with exposures to pollution andother airborne toxics, which are not usuallymonitored and can be quite high in rapidlydeveloping areas (32).
The rapid pace of urbanization globallymeans that more people are living in largecities than at any point in human history.Policies that increase energy efficiency and
Environmental Health Perspectives • VOLUME 109 | SUPPLEMENT 3 | June 2001 423
Table 7. Health effects avoided from 2000 to 2020 in the four cities due to ozone reductions if GHG mitigation measures are taken.
Age group México City São Paulo Santiago New YorkEnd point (years) Mid 95% CI Mid 95% CI Mid 95% CI Mid 95% CI
Acute mortalityTotal All 4,610 (2,500–6,720) 1,256 (681–1,831) 293 (54–533) 566 (0–1,133)
Hospital admissionsRespiratory causes All 37,964 (4,746–71,183) 10,588 (1,324–19,853) 4,738 (592–8,884) 2,360 (1,463–3,256)All causes < 5 721 (79–1,363) 447 (49–846) 153 (17–289)
Other hospital visitsERV for RSP causes All 354,005 (186,495–521,515) 65,245 (34,372–96,119) 44,183 (23,276–65,090) 18,876 (11,798–25,955)
Morbidity effectsAsthma attacks All 2,800,570 (0–6,744,230) 781,070 (0–1,880,943) 349,538 (0–841,745) 474,260 (268,747–1,296,309)Restricted activity days Adults 28,942,806 (19,742,221–33,601,432) 8,755,334 (5,972,114–10,164,590) 3,613,755 (2,464,984–4,195,424) 8,022,300 (30,303,300–12,741,300)
Table 6. Health effects avoided from 2000 to 2020 in the four cities due to PM10 reductions if GHG mitigation measures are taken.
Age group México City São Paulo Santiago New YorkEnd point (years) Mid 95% CI Mid 95% CI Mid 95% CI Mid 95% CI
Mortality effectsMortality All 29,055 (9,265–56,293) 11,225 (1,173–21,749) 3,960 (801–7,673) 8,785 (2,130–13,842)Infant mortality < 1 3,065 (1,187–4,944) 701 (271–1,130) 320 (124–516) 56 (43–75)
Chronic morbidity effectsChronic bronchitis > 30 35,353 (10,904–59,803) 11,899 (3,670–20,129) 7,087 (2,186–11,989) 10,382 (5,058–15,706)
Hospital admissionsCardiovascular causes All 3,341 (2,339–4,344) 1,365 (956–1,775) 819 (575–1,062)Respiratory causes All 7,894 (5,026–10,763) 3,226 (2,054–4,398) 1,934 (1,231–2,637) 3,194 (1,863–4,525)Children: all causes < 13 4,475 (2,282–6,668) 4,638 (2,365–6,911) 2,788 (1,422–4,154)
Other hospital visitsEmergency room visits All 195,355 (0–484,682) 52,756 (0 –130,890) 31,631 (0 –78,478) 25,023 (14,641–34,606)Medical visits 3–15 87,064 (19,217–154,912) 87,377 (19,286–155,468) 28,054 (6,192–49,916) (0–0)
Morbidity effectsAsthma attacks All 923,315 (222,624–1,624,005) 377,312 (90,975–663,649) 226,226 (54,546–397,906) 205,988 (118,839–689,268)Acute bronchitis 8–12 89,897 (0–200,805) 36,157 (0 –80,764) 20,876 (0 –46,631) 14,055 (6,838–20,893)
Restricted activityWork loss days 18–65 5,051,218 (4,276,788–5,825,648) 2,238,907 (1,895,648–2,582,167) 1,238,111 (1,048,289–1,427,933) 1,404,099 (717,650–2,215,355)Restricted activity days 18–65 14,563,826 (12,833,091–16,294,560) 6,455,286 (5,688,153–7,222,418) 3,569,759 (3,145,537–3,993,982) 3,966,380 (2,027,261–6,258,066)
109S3.Part 1 06/05/01 3:53 PM Page 423 (Black plate)
Cifuentes et al.
424 VOLUME 109 | SUPPLEMENT 3 | June 2001 • Environmental Health Perspectives
promote less carbon-intensive fuels can yielda broad array of benefits by simultaneouslyimproving local and regional air pollutionand reducing the long-term buildup of GHG.Given the current and projected patterns ofpopulation growth and air pollution concen-trations, the cumulative potential impact onpublic health from fossil fuels for the nexttwo decades is quite high for any of the citiesanalyzed. Part of this burden can be avoidedif GHG abatement policies to reduce the netuse of fossil fuels are adopted. For Santiagoand the other cities, the adoption of currentlyavailable technologies in energy, transport,residences, and industry can reduce popula-tion exposure to air pollution by at least 10%by 2020, yielding the associated public healthbenefits we have presented. Similar types ofhealth impact reductions are expected tooccur in other developing world cities ifGHG emissions mitigation policies are alsoimplemented in those cities.
This current collaborative analysis stemsfrom an effort to integrate into the public dis-cussion of GHG mitigation policies a consid-eration of what these policies might mean forpublic health in the nearer term. We fullyrecognize that population patterns can bechanged by events not integrated into thisassessment. We also are not unaware ofpromising technologies, such as fuel cells forenergy production and transportation appli-cations, that might substantially alter air pol-lutant emissions in the future. The estimatesdeveloped here are offered to illustrate thepotential scale and scope of impacts. A fulleraccounting would likely show still greaterpublic health and natural resource benefitsthan this preliminary assessment.
Conclusion
The estimates offered here are presented forthree purposes: to stimulate discussion of thefull range of potential impacts of changes infuture patterns of air pollution in developedand developing countries; to bring the subjectof public health benefits to the attention ofthose who are formulating public policyregarding GHG mitigation; and to encourageadditional research on this topic. The prelim-inary results in this work indicate that policiesaimed at mitigating GHG emissions can pro-vide a broad range of more immediate air pol-lution benefits to public health in thecountries that implement these GHG mitiga-tion measures. Conversely, not acting or post-poning actions to reduce GHG emissions willfail to achieve the health benefits we presentin this analysis.
The estimates of the potential publichealth benefits from the adoption of GHGmitigation policies offered in this paper weredeveloped opportunistically, incorporatingresults from a variety of studies conducted fordifferent purposes. While it must be acknowl-edged that there is still much that remains tobe learned about the intricacies of climatechange and the respective (and potentiallyinteractive) roles of the various air pollutants,the numbers developed for these four citiesillustrate the magnitude and scale of the airpollution impacts that may be averted byimplementing GHG mitigation measures,according to current understanding. As pres-sures mount for actions to be taken to reduceGHG emissions, decisions being made in thenext decade will affect the forms of energyproduction and transportation systems thatwill fuel this century in many regions.
Further, efforts to promote a sounderaccounting of how these technologies willaffect public health must be encouraged. Thefailure to provide a fuller tally of potentialhealth damages tied with air pollution in thediscussions of GHG mitigation policies notonly limits the utility of those discussions butalso fails to meet a basic human concern.People care greatly about their health and thehealth of their children. Decision makersneed to be well informed about the extent towhich global climate policies adopted todaycan be expected to affect public health inboth the near and long term.
REFERENCES AND NOTES
1. Davis DL, Krupnick A, McGlynn G. Ancillary benefits and costsof greenhouse gas mitigation: an overview. In: AncillaryBenefits and Costs of Greenhouse Gas Mitigation. Proceedingsof an IPCC Co-sponsored workshop, 27-29 March 2000,Washington, DC. Paris:Organisation for Economic Co-operationand Development, 2000;9–49.
2. Künzli N, Kaiser R, Medina S, Studnicka M, Chanel O, Filliger P,Herry M, Horak FJ, Puybonnieux-Texier V, Quenel P, et al.Public-health impact of outdoor and traffic-related air pollution:a European assessment. Lancet 356:795–801 (2000).
3. Hall JV, Winer AM, Kleinman MT, Lurmann FW, Brajer V,Colome SD. Valuing the health benefits of clean air. Science255:812–817 (1992).
4. U.S. EPA. The Benefits and Costs of the Clean Air Act, 1970 to1990. Report Prepared for the U.S. Congress. Washington,DC:U.S. Environmental Protection Agency, 1997.
5. U.S. EPA. The Benefits and Costs of the Clean Air Act, 1990 to2010. EPA-410-R-99-001. Washington, DC:U.S. EnvironmentalProtection Agency, 1999.
6. Abt Associates Inc. Co-Control Benefits of Greenhouse GasControl Policies. Prepared for the U.S. Environmental ProtectionAgency. Bethesda, MD:Abt Associates Inc, 1999.
7. Aunan K, Aaheim HA, Seip HM. Reduced damage to health andenvironment from energy saving in Hungary. Ancillary Benefitsand Costs of Greenhouse Gas Mitigation. Proceedings of anIPCC Co-sponsored workshop, 27-29 March 2000, Washington,DC. Paris:Organisation for Economic Co-operation andDevelopment, 2000;237–261.
8. Last J, Trouton K, Pengelly D. Taking Our Breath Away. The
100,000,000
10,000,000
1,000,000
100,000
10,000
1,000
100
10
1Mortality Infant
mortality
Mortality effects
Chronicbronchitits
Cardiovascularcauses
Chronicmorbidity
effects
Hospital admissions Other hospital visits Morbidity effects Restricted activity
Respiratorycauses
Children:all causes
Emergencyroom visits
Children:medical visits
Asthmaattacks
Children:acute
bronchitis
Work lossdays
Restrictedactivity days
Mexico CitySão PauloSantiagoNew York City
Figure 1. Health effects avoided from 2000 to 2020 in the four cities analyzed if GHG mitigation measures are taken.
Air pollution health benefits of climate change mitigation
Health Effects of Air Pollution and Climate Change. Vancouver,BC, Canada:David Suzuki Foundation, 1998;51.
9. Davis D. The hidden benefits of climate policy: reducing fossilfuel use saves lives now. Environmental Health Notes.Washington, DC:World Resources Institute, 1997.
10. Working Group on Public Health and Fossil-fuel Combustion.Short-term improvements in public health from global-climatepolicies on fossil-fuel combustion: an interim report. Lancet350:1341–1349 (1997).
11. Cifuentes LA, Sauma E, Jorquera H, Soto F. Preliminary estima-tion of the potential ancillary benefits for Chile. In: AncillaryBenefits and Costs of Greenhouse Gas Mitigation. Proceedingsof an IPCC Co-sponsored workshop, 27-29 March 2000,Washington, DC. Paris:Organisation for Economic Co-operationand Development, 2000;237–261.
12. Dessus S, O’Connor D. Climate Policy without Tears: CGE-BasedAncillary Benefits Estimates for Chile. Technical Paper no 156.Paris:Organisation for Economic Co-operation andDevelopment, 1999.
13. Morgenstern R. Baseline issues in the estimation of the ancil-lary benefits of greenhouse gas mitigation policies. In: AncillaryBenefits and Costs of Greenhouse Gas Mitigation. Proceedingsof an IPCC Co-sponsored workshop, 27-29 March 2000,Washington, DC. Paris:Organisation for Economic Co-operationand Development, 2000;95–122.
14. U.S. EPA. Regulatory Impact Analysis for the Particulate Matterand Ozone National Ambient Air Quality Standards andProposed Regional Haze Rule. Research Triangle Park, NC:U.S.Environmental Protection Agency, 1997.
15. Pope CA III. Epidemiology of fine particulate air pollution andhuman health. Environ Health Perspect 108:713–723 (2000).
16. Cifuentes L, Lave L, Vega J, Kopfer K. Effect of the fine fractionof particulate matter vs the coarse mass and other pollutantson daily mortality in Santiago, Chile. J Air Waste Manag Assoc50:1287–1298 (2000).
17. Burnett T, Cakmak S. The effect of the urban ambient air pollu-tion mix on daily mortality rates in 11 Canadian cities. Rev CanSanté Publique 89:152–156 (1998).
18. Blettner M, Sauerbrei W, Schlehofer B, Scheuchenpflug T,Friedenreich C. Traditional rewiews, meta-analysis and pooledanalysis in epidemiology. Int J Epidemiol 28:1–9 (1999).
19. Loomis D, Castillejos M, Gold D, McDonnell W, Borja-Aburto V.Air pollution and infant mortality in México City. Epidemiology10:118–123 (1999).
20. Ostro BD, Eskeland GS, Sanchez JM, Feyzioglu T. Air pollutionand health effects: a study of medical visits among children inSantiago, Chile. Environ Health Perspect 107:69–73 (1999).
21. Braga A, Conceicao G, Pereira L, Kishi H, Pereira J, Andrade M.Air pollution and pediatric hospital admissions in Sao Paulo,Brazil. J Environ Med 1:95–102 (1999).
22. Pope CA III, Thun MJ, Nambordini MM, Dockery D, Evans JS,Speizer FE, Heath CW Jr. Particulate air pollution as a predictorof mortality in a prospective study of U.S. adults. Am J RespirCrit Care Med 151:669–674 (1995).
23. Dockery DW, Pope CA III, Xu X, Spengler JD, Ware JH, Fay ME,Ferris BG Jr, Speizer FE. An association between air pollutionand mortality in six U.S. Cities. N Engl J Med 329:1753–1759(1993).
24. Krewski D, Burnett RT, Goldberg MS, Hoover K, Siemiatycki J,Jerret M, Abrahamowicz M, White WH. Reanalysis of theHarvard Six Cities Study and the American Cancer SocietyStudy of Particulate Air Pollution and Mortality Special Report.Cambridge, MA:Health Effects Institute, 2000.
25. McMichael AJ, Anderson HR, Brunekreef B, Cohen A.Inappropriate use of daily mortality analyses to estimatelonger-term mortality effects of air pollution. Int J Epidemiol27:450–453 (1998).
26. Zeger SL, Dominici F, Samet J. Harvesting-resistant estimatesof air pollution effects on mortality. Epidemiology 10:171–175(1999).
27. Schwartz J. Harvesting and long term exposure effects in therelation between air pollution and mortality. Am J Epidemiol151:440–448 (2000).
28. Schwartz J. Is there harvesting in the association of airborneparticles with daily deaths and hospital admissions?Epidemiology 12:55–61 (2001).
29. Rowe RD, Lang C, Chestnut L, DA Latimer, Rae D, Bernbow S,White D. The New York Electricity Externality Study. NewYork:Oceana Publications, 1995.
30. Higgins BG, Francis HC, Yates C, Warburton CJ, Fletcher AM,Pickering CA, Woodcock AA. Environmental exposure to air pol-lution and allergens and peak flow changes. Eur Respir J16:61–66 (2000).
31. Cohen A. Outdoor air pollution and lung cancer. Environ HealthPerspect 108:743–749 (2000).
32. Suh H, Bahadori T, Vallarino J, Spengler JD. Criteria air pollu-tants and toxic air pollutants. Environ Health Perspect108:625–633 (2000).
33. Borja-Aburto VH, Loomis DP, Bangdiwala SI, Shy CM, Rascon-Pacheco RA. Ozone, suspended particulates, and daily mortalityin México City. Am J Epidemiol 145:258–268 (1997).
34. Saldiva P, Pope CA III, Schwartz J, Dockery DW, Lichtenfels AJ,Salge JM, Barone I, Bohm GM. Air pollution and mortality inelderly people: a time-series study in São Paulo, Brazil. ArchEnviron Health 50:159–163 (1995).
35. Gouveia N, Fletcher T. Air pollution and daily mortality in SaoPaulo, Brazil: effects by cause, age and socioeconomic status. JEpidemiol Community Health 54:750–755 (2000).
36. Kinney PL, Ozkaynak H. Associations of Daily Mortality and AirPollution in Los Angeles County. Environ Res 54:99–120 (1991).
37. Thurston GD, Ito K, Kinney PL, Lippmann M. A multi-year studyof air pollution and respiratory hospital admissions in threeNew York State metropolitan areas: results for 1988 and 1989summers. J Expo Anal Environ Epidemiol 2:429–450 (1992).
38. Barton D, Tets-Grimm K, Kattan M. Emergency room patterns ofinner city children for asthma [Abstract]. Am Rev Respir Dis47:A577 (1993).
39. Whittemore AS, Korn EL. Asthma and air pollution in the LosAngeles area. Am J Public Health 70:687–696 (1980).
40. Portney P, Mullahy J. Urban air quality and chronic respiratorydisease. Reg Sci Urb Econ 20:407–418 (1990).
41. Ostro BD, Rothschild S. Air pollution and acute respiratory mor-bidity: an observational study of multiple pollutants. EnvironRes 50:238–247 (1989).
42. Krupnick A, Harrington W, Ostro B. Ambient ozone and acutehealth effects: evidence from daily data. J Environ Econ Manag18:1–18 (1990).
43. Woodruff TJ, Grillo J, Schoendorf KC. The relationship betweenselected causes of postneonatal infant mortality and particulateair pollution in the United States. Environ Health Perspect105:608–612 (1997).
44. Pope CA III, Dockery D, Spengler JD, Raizenne ME. Respiratoryhealth and PM10 pollution: a daily time series analysis. Am RevRespir Dis 144:668–674 (1991).
45. Abbey DE, Petersen F, Mills PK, Beeson WL. Long term ambientconcentrations of total suspended particulates, ozone and sul-fur dioxide and respiratory symptoms in a non-smoking popula-tion. Arch Environ Health 48:33–46 (1993).
46. Dockery DW, Speizer FE, Stram DO, Ware JH, Spengler JD,Ferris BG Jr. Effects of inhalable particles on respiratory healthof children. Am Rev Respir Dis 139:587–594 (1989).
47. Ostro BD. Air pollution and morbidity revisited: a specificationtest. J Environ Econ Manag 14:87–98 (1987).
48. Ostro BD. Associations between morbidity and alternative mea-sures of particulate matter. Risk Anal 10:421–427 (1990).
49. Schwartz J. Particulate air pollution and chronic respiratory dis-ease. Environ Res 62:7–13 (1993).
50. Linn WS, Szlachcic Y, Gong H Jr, Kinney PL, Berhane KT. Airpollution and daily hospital admissions in metropolitan LosAngeles. Environ Health Perspect 108:427–434 (2000).
51. Burnett R, Robert T, Daniel D, Krewski R, Dann T, Brook J.Associations between ambient particulate sulphate and admis-sions to Ontario hospitals for cardiac and respiratory diseases.Am J Epidemiol 142:15–22 (1995).
52. Schwartz J, Morris R. Air pollution and hospital admission forcardiovascular disease in Detroit, Michigan. Am J Epidemiol142:23–35 (1995).
53. Schwartz J. Air pollution and hospital admissions for cardiovas-cular disease in Tucson. Epidemiol 8:371–377 (1997).
54. Morris SC. Carbon monoxide and hospital admission for con-gestive heart failure: evidence of an increase effect at low tem-peratures. Environ Health Perspect 106:649–653 (1998).
55. Abbey DE, Ostro BE, Petersen F, Burchette RJ. Chronic respira-tory symptoms associated with estimated long-term ambientconcentrations of fine particulates less than 2.5 microns inaerodynamic diameter (PM 2.5) and other air pollutants. J ExpoAnal Environ Epidemiol 5:137–159 (1995).
56. Dab W, Medina S, Quenel P, Moullec YL, Tertre AL, Thelot B,Monteil C, Lameloise P, Pirard P, Momas I, et al. Short term res-piratory health effects of ambient air pollution: results of theAPHEA project in Paris. J Epidemiol Community Health50:542–546 (1996).
57. Ponce de Leon A, Anderson HR, Bland JM, Strachan DP, BowerJ. Effects of air pollution on daily hospital admissions for respi-ratory disease in London between 1987-88 1991-92. JEpidemiol Community Health 50:63–70 (1996).
58. Schouten J, Vonk J, Graff A. Short term effects of air pollutionon emergency hospital admissions for respiratory disease:results of the APHEA project in two major cities in theNetherlands, 1977-89. J Epidemiol Community Health50:s22–s30 (1996).
59. Schwartz J, Spix C, Touloumi G, Bacharova L, BarumamdzadehY, Le Tretre A, Pierkarski T, Ponce de Leon A, Ponka A, Rossi G,et al. Methodological issues in studies of air pollution and dailycounts of deaths or hospital admissions. J EpidemiolCommunity Health 50 (suppl A):S3–S11 (1996).
60. Thurston G, Ito K, Hayes C, Bates D, Kinney P, Lippmann M.Respiratory hospital admissions and summertime haze air pollu-tion in Toronto, Ontario: consideration of the role of acidaerosols. Environ Res 65:271–290 (1994).
61. Vigotti M. Short term effects of urban air pollution on respira-tory health in Milan, Italy 1980-89. J Epidemiol CommunityHealth 50:71–75 (1996).
62. Atkinson RW. Short-term associations between outdoor air pol-lution and visits to accident and emergency departments inLondon for respiratory complaints. Eur Respir J 13:257–265(1999).
63. Damakosh A, Castillejos M, Bierzwinski S, Retama A, Gold D.Unpublished data.
64. Delfino R, Murphy-Moulton A, Burnett R, Brook J, Becklake M.Effects of air pollution on emergency room visits for respiratoryillnesses in Montreal, Quebec. Am J Respir Crit Care Med155:568–576 (1997).
65. Samet JM. Particulate air pollution and mortality: thePhiladelphia story. Epidemiology 6:471–473 (1995).
66. Anderson HR, Ponce de León A, Bland J, Bower JS, StrachanDP. Air pollution and daily mortality in London: 1987-92. Br MedJ 312:665–669 (1996).
67. Borja-Aburto VH, Castillejos M, Gold DR, Bierzwinski S, LoomisDP. Mortality and ambient fine particles in Southwest MéxicoCity, 1993-1995. Environ Health Perspect 106:849–855 (1998).
68. Ito K, Thurston GD. Daily PM10/mortality associations: an inves-tigation of at-risk subpopulations. J Expo Anal EnvironEpidemiol 6:79–95 (1996).
69. Kelsall JE, Samet JS, Zeger S, Xu J. Air Pollution and mortalityin Philadelphia, 1974-1988. Am J Epidemiol 146:750–762(1997).
70. Moolgavkar SH, Luebeck EG. A critical review of the evidenceon particulate air pollution and mortality. Epidemiology7:420–428 (1996).
71. Verhoeff A, Hoek G, Schwartz J, Wijnen JV. Air pollution anddaily mortality in Amsterdam. Epidemiology 7:225–230 (1996).
72. Touloumi G, Katsouyanni K, Zmirou D, Schwartz J, Spix C, deLeon AP, Tobias A, Quennel P, Rabczenko D, Bacharova L, et al.Short-term effects of ambient oxidant exposure on mortality: acombined analysis within the APHEA project. Air pollution andhealth: a European approach. Am J Epidemiol 146:177–185(1997).
73. Hoek G, Schwartz J, Groot B, Eilers P. Effects of ambient partic-ulate matter and ozone on daily mortality in Rotterdam, theNetherlands. Arch Environ Health 52:455–463 (1997).
74. Gouveia N, Fletcher T. Respiratory diseases in children and out-door air pollution in Sao Paulo, Brazil: a time series analysis.Occup Environ Med 57:477–483 (2000).
75. Téllez-Rojo M, Romieu I, Polo-Peña M, Ruiz-Velasco S,Menesses-González F. MH-A. Efecto de la contaminación ambi-ental sobre las consultas por infecciones respiratorias en niñosde la ciudad de México. Salud Pública Méx 39:513–522 (1997).
Environmental Health Perspectives • VOLUME 109 | SUPPLEMENT 3 | June 2001 425
109S3.Part 1 06/05/01 3:53 PM Page 425 (Black plate)