Assessing protein co-evolution in the context of the tree of life assists in the prediction of the...
14
Assessing Protein Co-evolution in the Context of the Tree of Life Assists in the Prediction of the Interactome Florencio Pazos 1 * †, Juan A. G. Ranea 2 , David Juan 3 and Michael J. E. Sternberg 1 1 Structural Bioinformatics Group, Division of Molecular Biosciences, Imperial College London, London SW7 2AZ UK 2 Biomolecular Structure and Modelling Unit, Department of Biochemistry and Molecular Biology, University College London, London WC1E 6BT UK 3 Protein Design Group National Centre for Biotechnol- ogy (CNB-CSIC), Madrid Spain The identification of the whole set of protein interactions taking place in an organism is one of the main tasks in genomics, proteomics and systems biology. One of the computational techniques used by many investigators for studying and predicting protein interactions is the comparison of evolutionary histories (phylogenetic trees), under the hypothesis that interacting proteins would be subject to a similar evolutionary pressure resulting in a similar topology of the corresponding trees. Here, we present a new approach to predict protein interactions from phylogenetic trees, which incorporates information on the overall evolutionary histories of the species (i.e. the canonical “tree of life”) in order to correct by the expected background similarity due to the underlying speciation events. We test the new approach in the largest set of annotated interacting proteins for Escherichia coli. This assessment of co-evolution in the context of the tree of life leads to a highly significant improvement (P(N) by sign test w10E–6) in predicting interaction partners with respect to the previous technique, which does not incorporate information on the overall speciation tree. For half of the proteins we found a real interactor among the 6.4% top scores, compared with the 16.5% by the previous method. We applied the new method to the whole E. coli proteome and propose functions for some hypothetical proteins based on their predicted interactors. The new approach allows us also to detect non-canonical evolutionary events, in particular horizontal gene transfers. We also show that taking into account these non-canonical evolutionary events when assessing the similarity between evolutionary trees improves the performance of the method predicting interactions. q 2005 Elsevier Ltd. All rights reserved. Keywords: protein interactions; phylogenetic tree; co-evolution; interac- tome; horizontal gene transfer *Corresponding author Introduction The network of protein–protein interactions of a given organism (“interactome”) contains extensive information about its biology, since protein inter- actions are involved in most cellular processes (structural macromolecular complexes, signalling cascades, metabolism, transcription control, etc.). Experimental techniques for the determination of protein interaction, mainly variations of the yeast two-hybrid system 1 and affinity purification, 2,3 have been applied in a high-throughput approach aiming to cover as much as possible of the interactome of a number of model organisms. 4–7 Knowledge of the complete interactome allowed some of the first studies of biological networks from a systems biology point of view, extracting import- ant data on the topology, connectivity and evolution of the protein interaction network. 8–14 Several computational techniques have emerged to complement these experimental approaches. These computational techniques can be used to guide experiments restricting the number of pairs to test experimentally, 15 to filter a set of experimental 0022-2836/$ - see front matter q 2005 Elsevier Ltd. All rights reserved. Present address: F. Pazos, Protein Design Group, National Center for Biotechnology (CNB-CSIC), Campus UAM, Cantoblanco, 28049 Madrid, Spain. Abbreviations used: HGT, horizontal gene transfer; 16 S rRNA, ribonucleic acid molecule in the small subunit of the ribosome; ORF, open reading frame; GO, gene ontology. E-mail address of the corresponding author: [email protected] doi:10.1016/j.jmb.2005.07.005 J. Mol. Biol. (2005) 352, 1002–1015
Transcript of Assessing protein co-evolution in the context of the tree of life assists in the prediction of the...

doi:10.1016/j.jmb.2005.07.005 J. Mol. Biol. (2005) 352, 1002–1015
Assessing Protein Co-evolution in the Context of theTree of Life Assists in the Prediction of the Interactome
Florencio Pazos1*†, Juan A. G. Ranea2, David Juan3 andMichael J. E. Sternberg1
1Structural BioinformaticsGroup, Division of MolecularBiosciences, Imperial CollegeLondon, London SW7 2AZUK
2Biomolecular Structure andModelling Unit, Department ofBiochemistry and MolecularBiology, University CollegeLondon, London WC1E 6BTUK
3Protein Design GroupNational Centre for Biotechnol-ogy (CNB-CSIC), MadridSpain
0022-2836/$ - see front matter q 2005 E
Present address: F. Pazos, ProteinNational Center for Biotechnology (UAM, Cantoblanco, 28049 Madrid,Abbreviations used: HGT, horizon
rRNA, ribonucleic acid molecule inthe ribosome; ORF, open reading frontology.E-mail address of the correspond
The identification of the whole set of protein interactions taking place in anorganism is one of the main tasks in genomics, proteomics and systemsbiology. One of the computational techniques used by many investigatorsfor studying and predicting protein interactions is the comparison ofevolutionary histories (phylogenetic trees), under the hypothesis thatinteracting proteins would be subject to a similar evolutionary pressureresulting in a similar topology of the corresponding trees. Here, we presenta new approach to predict protein interactions from phylogenetic trees,which incorporates information on the overall evolutionary histories of thespecies (i.e. the canonical “tree of life”) in order to correct by the expectedbackground similarity due to the underlying speciation events. We test thenew approach in the largest set of annotated interacting proteins forEscherichia coli. This assessment of co-evolution in the context of the tree oflife leads to a highly significant improvement (P(N) by sign testw10E–6) inpredicting interaction partners with respect to the previous technique,which does not incorporate information on the overall speciation tree. Forhalf of the proteins we found a real interactor among the 6.4% top scores,compared with the 16.5% by the previous method. We applied the newmethod to the whole E. coli proteome and propose functions for somehypothetical proteins based on their predicted interactors. The newapproach allows us also to detect non-canonical evolutionary events, inparticular horizontal gene transfers. We also show that taking into accountthese non-canonical evolutionary events when assessing the similaritybetween evolutionary trees improves the performance of the methodpredicting interactions.
q 2005 Elsevier Ltd. All rights reserved.
Keywords: protein interactions; phylogenetic tree; co-evolution; interac-tome; horizontal gene transfer
*Corresponding authorIntroduction
The network of protein–protein interactions of agiven organism (“interactome”) contains extensiveinformation about its biology, since protein inter-actions are involved in most cellular processes(structural macromolecular complexes, signalling
lsevier Ltd. All rights reserve
Design Group,CNB-CSIC), CampusSpain.tal gene transfer; 16 Sthe small subunit ofame; GO, gene
ing author:
cascades, metabolism, transcription control, etc.).Experimental techniques for the determination ofprotein interaction, mainly variations of the yeasttwo-hybrid system1 and affinity purification,2,3
have been applied in a high-throughput approachaiming to cover as much as possible of theinteractome of a number of model organisms.4–7
Knowledge of the complete interactome allowedsome of the first studies of biological networks froma systems biology point of view, extracting import-ant data on the topology, connectivity and evolutionof the protein interaction network.8–14
Several computational techniques have emergedto complement these experimental approaches.These computational techniques can be used toguide experiments restricting the number of pairs totest experimentally,15 to filter a set of experimental
d.
Protein Interactions and Co-evolution 1003
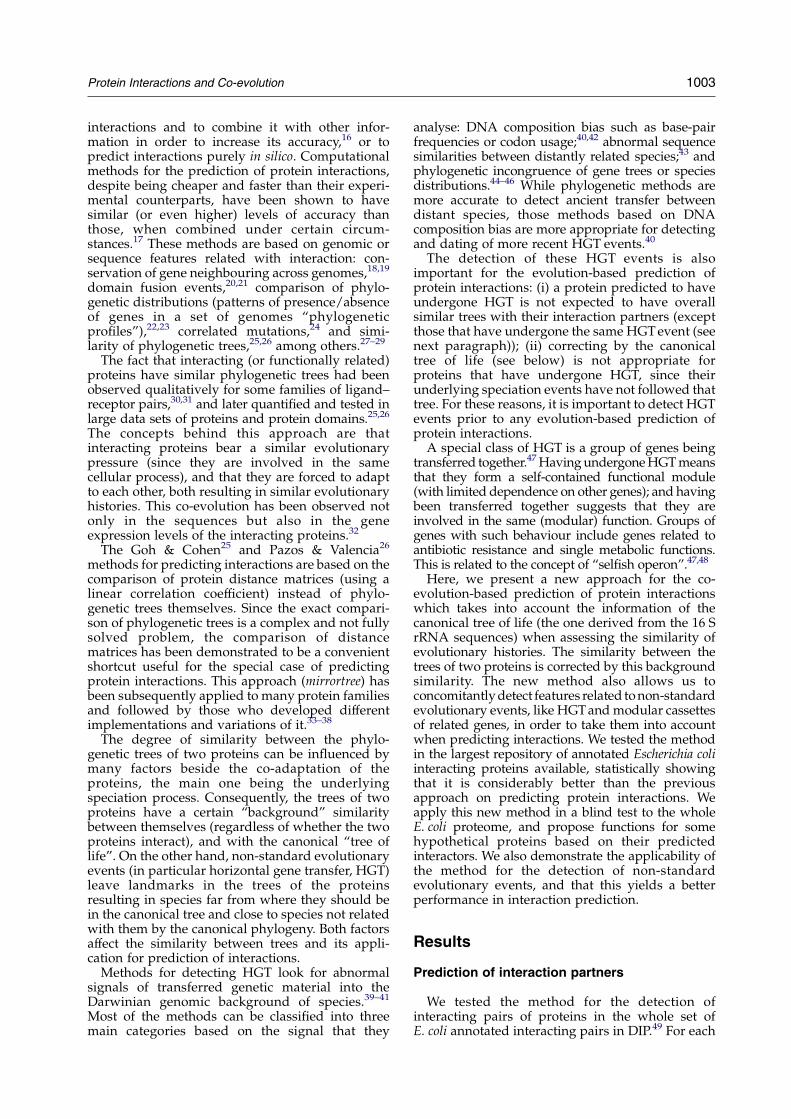
interactions and to combine it with other infor-mation in order to increase its accuracy,16 or topredict interactions purely in silico. Computationalmethods for the prediction of protein interactions,despite being cheaper and faster than their experi-mental counterparts, have been shown to havesimilar (or even higher) levels of accuracy thanthose, when combined under certain circum-stances.17 These methods are based on genomic orsequence features related with interaction: con-servation of gene neighbouring across genomes,18,19
domain fusion events,20,21 comparison of phylo-genetic distributions (patterns of presence/absenceof genes in a set of genomes “phylogeneticprofiles”),22,23 correlated mutations,24 and simi-larity of phylogenetic trees,25,26 among others.27–29
The fact that interacting (or functionally related)proteins have similar phylogenetic trees had beenobserved qualitatively for some families of ligand–receptor pairs,30,31 and later quantified and tested inlarge data sets of proteins and protein domains.25,26
The concepts behind this approach are thatinteracting proteins bear a similar evolutionarypressure (since they are involved in the samecellular process), and that they are forced to adaptto each other, both resulting in similar evolutionaryhistories. This co-evolution has been observed notonly in the sequences but also in the geneexpression levels of the interacting proteins.32
The Goh & Cohen25 and Pazos & Valencia26
methods for predicting interactions are based on thecomparison of protein distance matrices (using alinear correlation coefficient) instead of phylo-genetic trees themselves. Since the exact compari-son of phylogenetic trees is a complex and not fullysolved problem, the comparison of distancematrices has been demonstrated to be a convenientshortcut useful for the special case of predictingprotein interactions. This approach (mirrortree) hasbeen subsequently applied to many protein familiesand followed by those who developed differentimplementations and variations of it.33–38
The degree of similarity between the phylo-genetic trees of two proteins can be influenced bymany factors beside the co-adaptation of theproteins, the main one being the underlyingspeciation process. Consequently, the trees of twoproteins have a certain “background” similaritybetween themselves (regardless of whether the twoproteins interact), and with the canonical “tree oflife”. On the other hand, non-standard evolutionaryevents (in particular horizontal gene transfer, HGT)leave landmarks in the trees of the proteinsresulting in species far from where they should bein the canonical tree and close to species not relatedwith them by the canonical phylogeny. Both factorsaffect the similarity between trees and its appli-cation for prediction of interactions.
Methods for detecting HGT look for abnormalsignals of transferred genetic material into theDarwinian genomic background of species.39–41
Most of the methods can be classified into threemain categories based on the signal that they
analyse: DNA composition bias such as base-pairfrequencies or codon usage;40,42 abnormal sequencesimilarities between distantly related species;43 andphylogenetic incongruence of gene trees or speciesdistributions.44–46 While phylogenetic methods aremore accurate to detect ancient transfer betweendistant species, those methods based on DNAcomposition bias are more appropriate for detectingand dating of more recent HGT events.40
The detection of these HGT events is alsoimportant for the evolution-based prediction ofprotein interactions: (i) a protein predicted to haveundergone HGT is not expected to have overallsimilar trees with their interaction partners (exceptthose that have undergone the same HGTevent (seenext paragraph)); (ii) correcting by the canonicaltree of life (see below) is not appropriate forproteins that have undergone HGT, since theirunderlying speciation events have not followed thattree. For these reasons, it is important to detect HGTevents prior to any evolution-based prediction ofprotein interactions.A special class of HGT is a group of genes being
transferred together.47HavingundergoneHGTmeansthat they form a self-contained functional module(with limited dependence on other genes); and havingbeen transferred together suggests that they areinvolved in the same (modular) function. Groups ofgenes with such behaviour include genes related toantibiotic resistance and single metabolic functions.This is related to the concept of “selfish operon”.47,48
Here, we present a new approach for the co-evolution-based prediction of protein interactionswhich takes into account the information of thecanonical tree of life (the one derived from the 16 SrRNA sequences) when assessing the similarity ofevolutionary histories. The similarity between thetrees of two proteins is corrected by this backgroundsimilarity. The new method also allows us toconcomitantlydetect features related tonon-standardevolutionary events, like HGTandmodular cassettesof related genes, in order to take them into accountwhen predicting interactions. We tested the methodin the largest repository of annotated Escherichia coliinteracting proteins available, statistically showingthat it is considerably better than the previousapproach on predicting protein interactions. Weapply this new method in a blind test to the wholeE. coli proteome, and propose functions for somehypothetical proteins based on their predictedinteractors. We also demonstrate the applicability ofthe method for the detection of non-standardevolutionary events, and that this yields a betterperformance in interaction prediction.
Results
Prediction of interaction partners
We tested the method for the detection ofinteracting pairs of proteins in the whole set ofE. coli annotated interacting pairs in DIP.49 For each
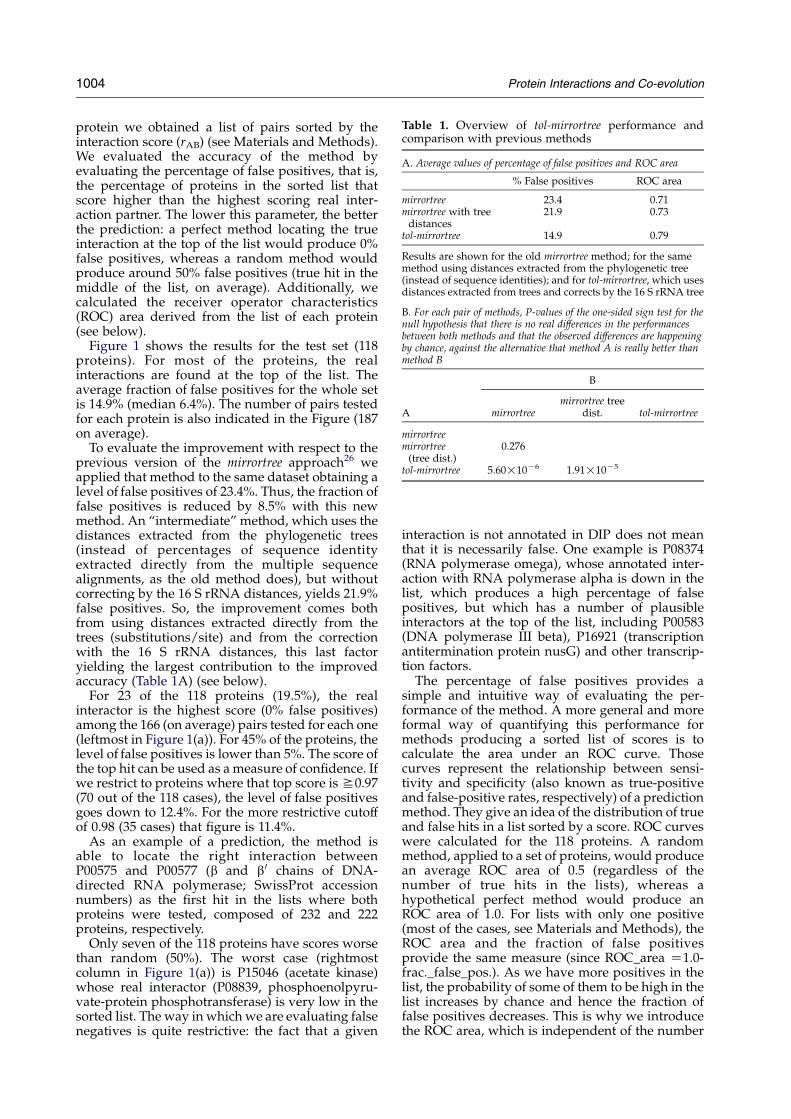
Table 1. Overview of tol-mirrortree performance andcomparison with previous methods
A. Average values of percentage of false positives and ROC area
% False positives ROC area
mirrortree 23.4 0.71mirrortree with treedistances
21.9 0.73
tol-mirrortree 14.9 0.79
Results are shown for the old mirrortree method; for the samemethod using distances extracted from the phylogenetic tree(instead of sequence identities); and for tol-mirrortree, which usesdistances extracted from trees and corrects by the 16 S rRNA tree
B. For each pair of methods, P-values of the one-sided sign test for thenull hypothesis that there is no real differences in the performancesbetween both methods and that the observed differences are happeningby chance, against the alternative that method A is really better thanmethod B
B
A mirrortreemirrortree tree
dist. tol-mirrortree
mirrortreemirrortree(tree dist.)
0.276
tol-mirrortree 5.60!10K6 1.91!10K5
1004 Protein Interactions and Co-evolution
protein we obtained a list of pairs sorted by theinteraction score (rAB) (see Materials and Methods).We evaluated the accuracy of the method byevaluating the percentage of false positives, that is,the percentage of proteins in the sorted list thatscore higher than the highest scoring real inter-action partner. The lower this parameter, the betterthe prediction: a perfect method locating the trueinteraction at the top of the list would produce 0%false positives, whereas a random method wouldproduce around 50% false positives (true hit in themiddle of the list, on average). Additionally, wecalculated the receiver operator characteristics(ROC) area derived from the list of each protein(see below).
Figure 1 shows the results for the test set (118proteins). For most of the proteins, the realinteractions are found at the top of the list. Theaverage fraction of false positives for the whole setis 14.9% (median 6.4%). The number of pairs testedfor each protein is also indicated in the Figure (187on average).
To evaluate the improvement with respect to theprevious version of the mirrortree approach26 weapplied that method to the same dataset obtaining alevel of false positives of 23.4%. Thus, the fraction offalse positives is reduced by 8.5% with this newmethod. An “intermediate” method, which uses thedistances extracted from the phylogenetic trees(instead of percentages of sequence identityextracted directly from the multiple sequencealignments, as the old method does), but withoutcorrecting by the 16 S rRNA distances, yields 21.9%false positives. So, the improvement comes bothfrom using distances extracted directly from thetrees (substitutions/site) and from the correctionwith the 16 S rRNA distances, this last factoryielding the largest contribution to the improvedaccuracy (Table 1A) (see below).
For 23 of the 118 proteins (19.5%), the realinteractor is the highest score (0% false positives)among the 166 (on average) pairs tested for each one(leftmost in Figure 1(a)). For 45% of the proteins, thelevel of false positives is lower than 5%. The score ofthe top hit can be used as ameasure of confidence. Ifwe restrict to proteins where that top score isS0.97(70 out of the 118 cases), the level of false positivesgoes down to 12.4%. For the more restrictive cutoffof 0.98 (35 cases) that figure is 11.4%.
As an example of a prediction, the method isable to locate the right interaction betweenP00575 and P00577 (b and b 0 chains of DNA-directed RNA polymerase; SwissProt accessionnumbers) as the first hit in the lists where bothproteins were tested, composed of 232 and 222proteins, respectively.
Only seven of the 118 proteins have scores worsethan random (50%). The worst case (rightmostcolumn in Figure 1(a)) is P15046 (acetate kinase)whose real interactor (P08839, phosphoenolpyru-vate-protein phosphotransferase) is very low in thesorted list. The way in which we are evaluating falsenegatives is quite restrictive: the fact that a given
interaction is not annotated in DIP does not meanthat it is necessarily false. One example is P08374(RNA polymerase omega), whose annotated inter-action with RNA polymerase alpha is down in thelist, which produces a high percentage of falsepositives, but which has a number of plausibleinteractors at the top of the list, including P00583(DNA polymerase III beta), P16921 (transcriptionantitermination protein nusG) and other transcrip-tion factors.
The percentage of false positives provides asimple and intuitive way of evaluating the per-formance of the method. A more general and moreformal way of quantifying this performance formethods producing a sorted list of scores is tocalculate the area under an ROC curve. Thosecurves represent the relationship between sensi-tivity and specificity (also known as true-positiveand false-positive rates, respectively) of a predictionmethod. They give an idea of the distribution of trueand false hits in a list sorted by a score. ROC curveswere calculated for the 118 proteins. A randommethod, applied to a set of proteins, would producean average ROC area of 0.5 (regardless of thenumber of true hits in the lists), whereas ahypothetical perfect method would produce anROC area of 1.0. For lists with only one positive(most of the cases, see Materials and Methods), theROC area and the fraction of false positivesprovide the same measure (since ROC_area Z1.0-frac._false_pos.). As we have more positives in thelist, the probability of some of them to be high in thelist increases by chance and hence the fraction offalse positives decreases. This is why we introducethe ROC area, which is independent of the number
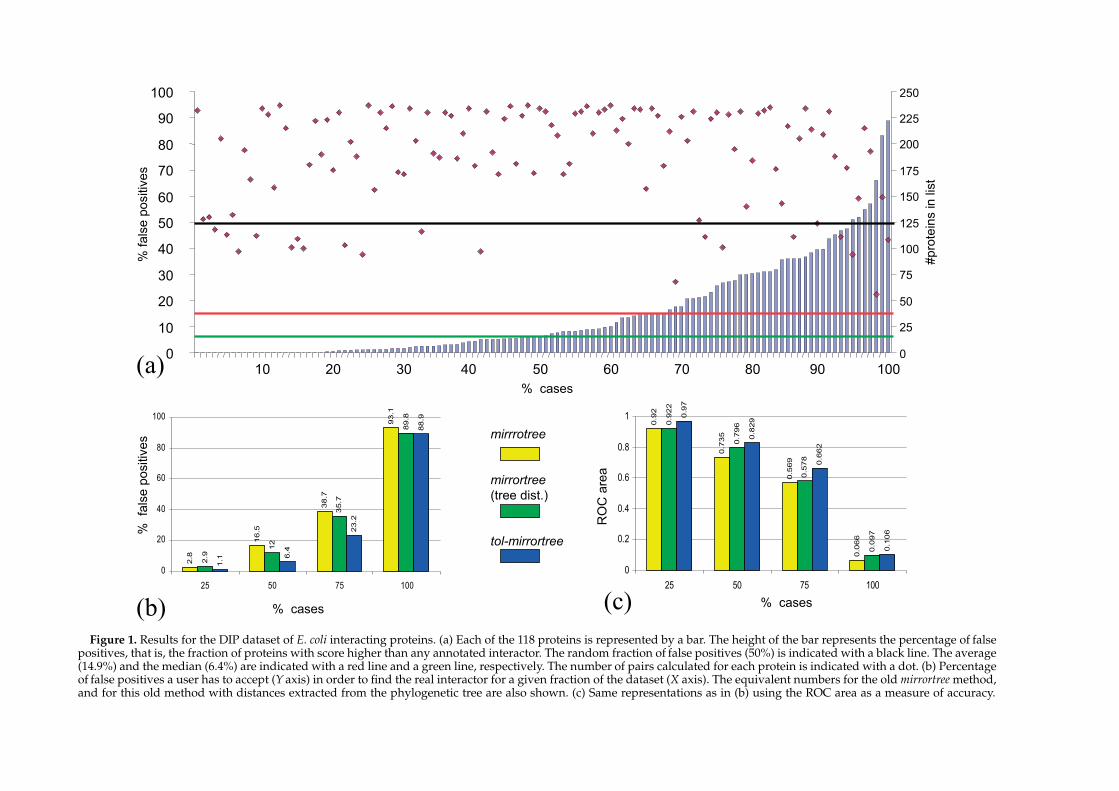
Figure 1. Results for the DIP dataset of E. coli interacting proteins. (a) Each of the 118 proteins is represented by a bar. The height of the bar represents the percentage of falsepositives, that is, the fraction of proteins with score higher than any annotated interactor. The random fraction of false positives (50%) is indicated with a black line. The average(14.9%) and the median (6.4%) are indicated with a red line and a green line, respectively. The number of pairs calculated for each protein is indicated with a dot. (b) Percentageof false positives a user has to accept (Yaxis) in order to find the real interactor for a given fraction of the dataset (X axis). The equivalent numbers for the old mirrortreemethod,and for this old method with distances extracted from the phylogenetic tree are also shown. (c) Same representations as in (b) using the ROC area as a measure of accuracy.
1006 Protein Interactions and Co-evolution
of positives in the list, as an additional measure toconsider these cases, whilst maintaining also thepercentage of false positives as a more intuitiveparameter. The new tol-mirrortree method producesanaverageROCareaof 0.79,whereas the correspond-ing figure for the oldmirrortree is 0.71 (Table 1A): 12%of proteins produce an ROC area of 1.0 (perfectpredictions); 93% have ROC areas higher than 0.5(random).
A potential user of this method who aims toidentify interactors for a large set of proteins(interactome) has to decide on a balance betweenaccuracy of the prediction and number of casespredicted (coverage). Figure 1(b) shows the percen-tage of false positives the user has to accept in orderto find a real interactor for a given fraction of thedataset. For example, in order to find a realinteractor for half of the cases, a level of 6.4%false positives has to be accepted. Theequivalent figure for the old mirrortree method is16.5%. Figure 1(c) show the equivalentnumbers using the ROC area as a measure ofperformance.
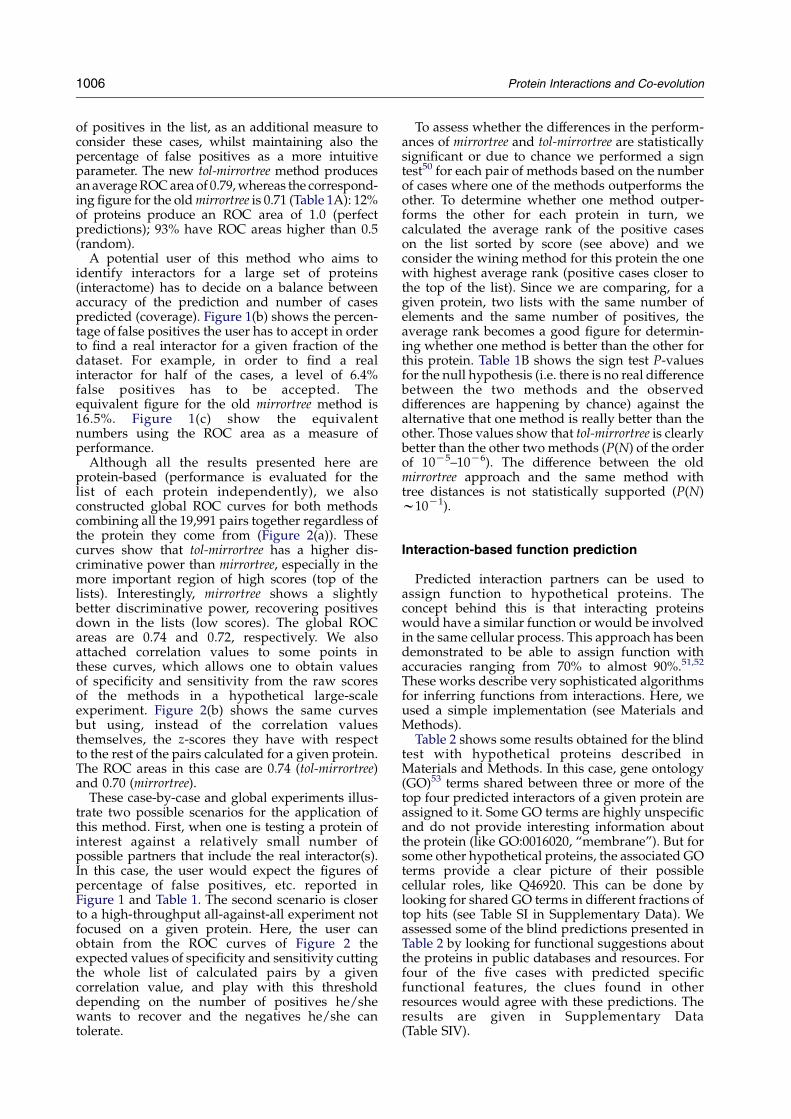
Although all the results presented here areprotein-based (performance is evaluated for thelist of each protein independently), we alsoconstructed global ROC curves for both methodscombining all the 19,991 pairs together regardless ofthe protein they come from (Figure 2(a)). Thesecurves show that tol-mirrortree has a higher dis-criminative power than mirrortree, especially in themore important region of high scores (top of thelists). Interestingly, mirrortree shows a slightlybetter discriminative power, recovering positivesdown in the lists (low scores). The global ROCareas are 0.74 and 0.72, respectively. We alsoattached correlation values to some points inthese curves, which allows one to obtain valuesof specificity and sensitivity from the raw scoresof the methods in a hypothetical large-scaleexperiment. Figure 2(b) shows the same curvesbut using, instead of the correlation valuesthemselves, the z-scores they have with respectto the rest of the pairs calculated for a given protein.The ROC areas in this case are 0.74 (tol-mirrortree)and 0.70 (mirrortree).
These case-by-case and global experiments illus-trate two possible scenarios for the application ofthis method. First, when one is testing a protein ofinterest against a relatively small number ofpossible partners that include the real interactor(s).In this case, the user would expect the figures ofpercentage of false positives, etc. reported inFigure 1 and Table 1. The second scenario is closerto a high-throughput all-against-all experiment notfocused on a given protein. Here, the user canobtain from the ROC curves of Figure 2 theexpected values of specificity and sensitivity cuttingthe whole list of calculated pairs by a givencorrelation value, and play with this thresholddepending on the number of positives he/shewants to recover and the negatives he/she cantolerate.
To assess whether the differences in the perform-ances of mirrortree and tol-mirrortree are statisticallysignificant or due to chance we performed a signtest50 for each pair of methods based on the numberof cases where one of the methods outperforms theother. To determine whether one method outper-forms the other for each protein in turn, wecalculated the average rank of the positive caseson the list sorted by score (see above) and weconsider the wining method for this protein the onewith highest average rank (positive cases closer tothe top of the list). Since we are comparing, for agiven protein, two lists with the same number ofelements and the same number of positives, theaverage rank becomes a good figure for determin-ing whether one method is better than the other forthis protein. Table 1B shows the sign test P-valuesfor the null hypothesis (i.e. there is no real differencebetween the two methods and the observeddifferences are happening by chance) against thealternative that one method is really better than theother. Those values show that tol-mirrortree is clearlybetter than the other twomethods (P(N) of the orderof 10K5–10K6). The difference between the oldmirrortree approach and the same method withtree distances is not statistically supported (P(N)w10K1).
Interaction-based function prediction
Predicted interaction partners can be used toassign function to hypothetical proteins. Theconcept behind this is that interacting proteinswould have a similar function or would be involvedin the same cellular process. This approach has beendemonstrated to be able to assign function withaccuracies ranging from 70% to almost 90%.51,52
These works describe very sophisticated algorithmsfor inferring functions from interactions. Here, weused a simple implementation (see Materials andMethods).
Table 2 shows some results obtained for the blindtest with hypothetical proteins described inMaterials and Methods. In this case, gene ontology(GO)53 terms shared between three or more of thetop four predicted interactors of a given protein areassigned to it. Some GO terms are highly unspecificand do not provide interesting information aboutthe protein (like GO:0016020, “membrane”). But forsome other hypothetical proteins, the associated GOterms provide a clear picture of their possiblecellular roles, like Q46920. This can be done bylooking for shared GO terms in different fractions oftop hits (see Table SI in Supplementary Data). Weassessed some of the blind predictions presented inTable 2 by looking for functional suggestions aboutthe proteins in public databases and resources. Forfour of the five cases with predicted specificfunctional features, the clues found in otherresources would agree with these predictions. Theresults are given in Supplementary Data(Table SIV).
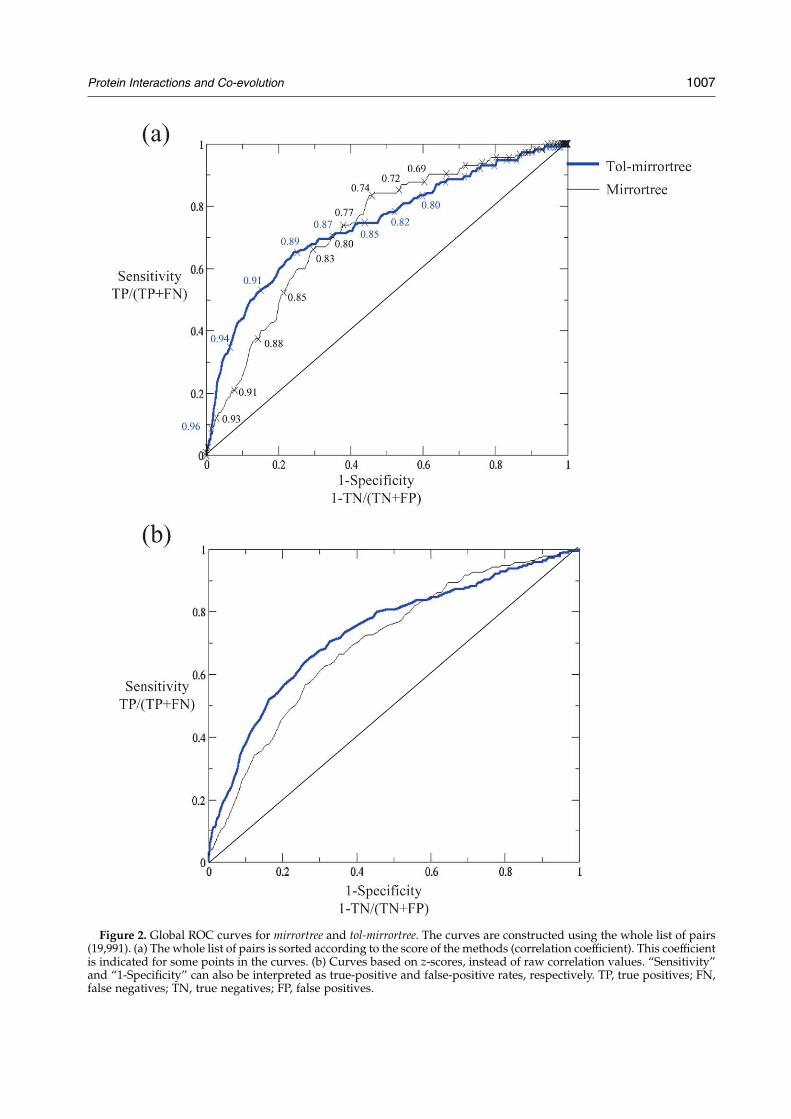
Figure 2. Global ROC curves for mirrortree and tol-mirrortree. The curves are constructed using the whole list of pairs(19,991). (a) The whole list of pairs is sorted according to the score of the methods (correlation coefficient). This coefficientis indicated for some points in the curves. (b) Curves based on z-scores, instead of raw correlation values. “Sensitivity”and “1-Specificity” can also be interpreted as true-positive and false-positive rates, respectively. TP, true positives; FN,false negatives; TN, true negatives; FP, false positives.
Protein Interactions and Co-evolution 1007
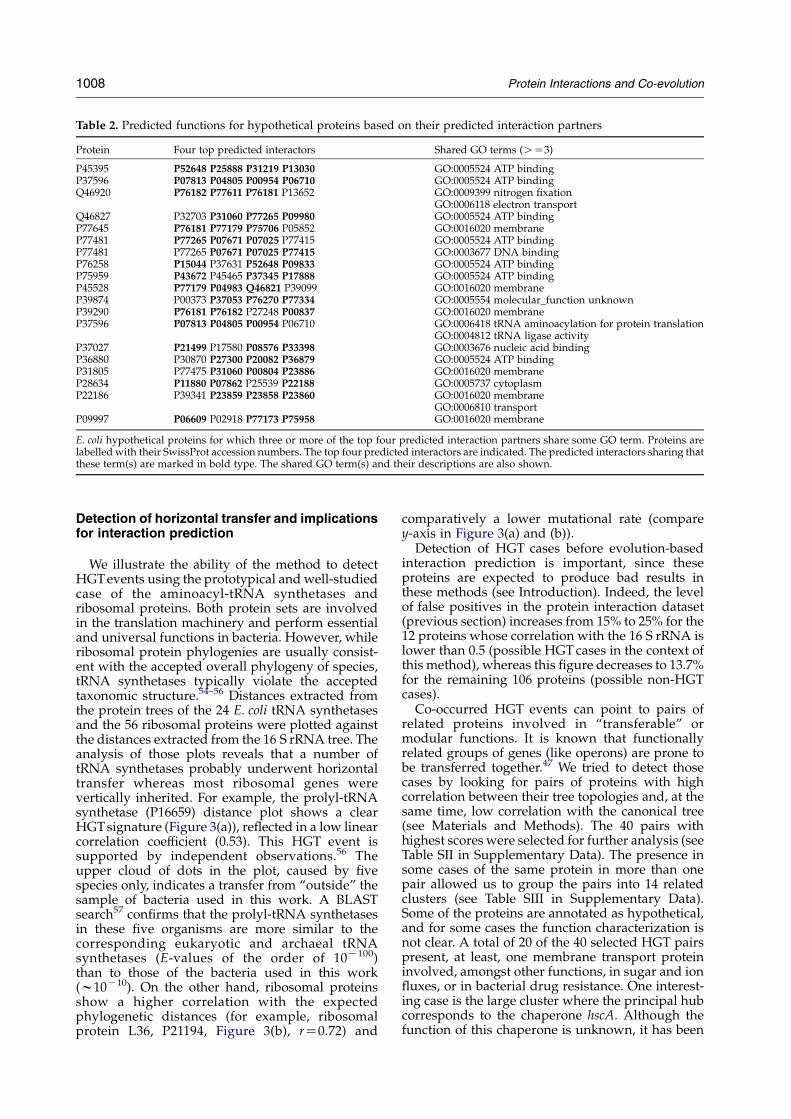
Table 2. Predicted functions for hypothetical proteins based on their predicted interaction partners
Protein Four top predicted interactors Shared GO terms (OZ3)
P45395 P52648 P25888 P31219 P13030 GO:0005524 ATP bindingP37596 P07813 P04805 P00954 P06710 GO:0005524 ATP bindingQ46920 P76182 P77611 P76181 P13652 GO:0009399 nitrogen fixation
GO:0006118 electron transportQ46827 P32703 P31060 P77265 P09980 GO:0005524 ATP bindingP77645 P76181 P77179 P75706 P05852 GO:0016020 membraneP77481 P77265 P07671 P07025 P77415 GO:0005524 ATP bindingP77481 P77265 P07671 P07025 P77415 GO:0003677 DNA bindingP76258 P15044 P37631 P52648 P09833 GO:0005524 ATP bindingP75959 P43672 P45465 P37345 P17888 GO:0005524 ATP bindingP45528 P77179 P04983 Q46821 P39099 GO:0016020 membraneP39874 P00373 P37053 P76270 P77334 GO:0005554 molecular_function unknownP39290 P76181 P76182 P27248 P00837 GO:0016020 membraneP37596 P07813 P04805 P00954 P06710 GO:0006418 tRNA aminoacylation for protein translation
GO:0004812 tRNA ligase activityP37027 P21499 P17580 P08576 P33398 GO:0003676 nucleic acid bindingP36880 P30870 P27300 P20082 P36879 GO:0005524 ATP bindingP31805 P77475 P31060 P00804 P23886 GO:0016020 membraneP28634 P11880 P07862 P25539 P22188 GO:0005737 cytoplasmP22186 P39341 P23859 P23858 P23860 GO:0016020 membrane
GO:0006810 transportP09997 P06609 P02918 P77173 P75958 GO:0016020 membrane
E. coli hypothetical proteins for which three or more of the top four predicted interaction partners share some GO term. Proteins arelabelled with their SwissProt accession numbers. The top four predicted interactors are indicated. The predicted interactors sharing thatthese term(s) are marked in bold type. The shared GO term(s) and their descriptions are also shown.
1008 Protein Interactions and Co-evolution
Detection of horizontal transfer and implicationsfor interaction prediction
We illustrate the ability of the method to detectHGTevents using the prototypical and well-studiedcase of the aminoacyl-tRNA synthetases andribosomal proteins. Both protein sets are involvedin the translation machinery and perform essentialand universal functions in bacteria. However, whileribosomal protein phylogenies are usually consist-ent with the accepted overall phylogeny of species,tRNA synthetases typically violate the acceptedtaxonomic structure.54–56 Distances extracted fromthe protein trees of the 24 E. coli tRNA synthetasesand the 56 ribosomal proteins were plotted againstthe distances extracted from the 16 S rRNA tree. Theanalysis of those plots reveals that a number oftRNA synthetases probably underwent horizontaltransfer whereas most ribosomal genes werevertically inherited. For example, the prolyl-tRNAsynthetase (P16659) distance plot shows a clearHGTsignature (Figure 3(a)), reflected in a low linearcorrelation coefficient (0.53). This HGT event issupported by independent observations.56 Theupper cloud of dots in the plot, caused by fivespecies only, indicates a transfer from “outside” thesample of bacteria used in this work. A BLASTsearch57 confirms that the prolyl-tRNA synthetasesin these five organisms are more similar to thecorresponding eukaryotic and archaeal tRNAsynthetases (E-values of the order of 10K100)than to those of the bacteria used in this work(w10K10). On the other hand, ribosomal proteinsshow a higher correlation with the expectedphylogenetic distances (for example, ribosomalprotein L36, P21194, Figure 3(b), rZ0.72) and
comparatively a lower mutational rate (comparey-axis in Figure 3(a) and (b)).
Detection of HGT cases before evolution-basedinteraction prediction is important, since theseproteins are expected to produce bad results inthese methods (see Introduction). Indeed, the levelof false positives in the protein interaction dataset(previous section) increases from 15% to 25% for the12 proteins whose correlation with the 16 S rRNA islower than 0.5 (possible HGTcases in the context ofthis method), whereas this figure decreases to 13.7%for the remaining 106 proteins (possible non-HGTcases).
Co-occurred HGT events can point to pairs ofrelated proteins involved in “transferable” ormodular functions. It is known that functionallyrelated groups of genes (like operons) are prone tobe transferred together.47 We tried to detect thosecases by looking for pairs of proteins with highcorrelation between their tree topologies and, at thesame time, low correlation with the canonical tree(see Materials and Methods). The 40 pairs withhighest scores were selected for further analysis (seeTable SII in Supplementary Data). The presence insome cases of the same protein in more than onepair allowed us to group the pairs into 14 relatedclusters (see Table SIII in Supplementary Data).Some of the proteins are annotated as hypothetical,and for some cases the function characterization isnot clear. A total of 20 of the 40 selected HGT pairspresent, at least, one membrane transport proteininvolved, amongst other functions, in sugar and ionfluxes, or in bacterial drug resistance. One interest-ing case is the large cluster where the principal hubcorresponds to the chaperone hscA. Although thefunction of this chaperone is unknown, it has been
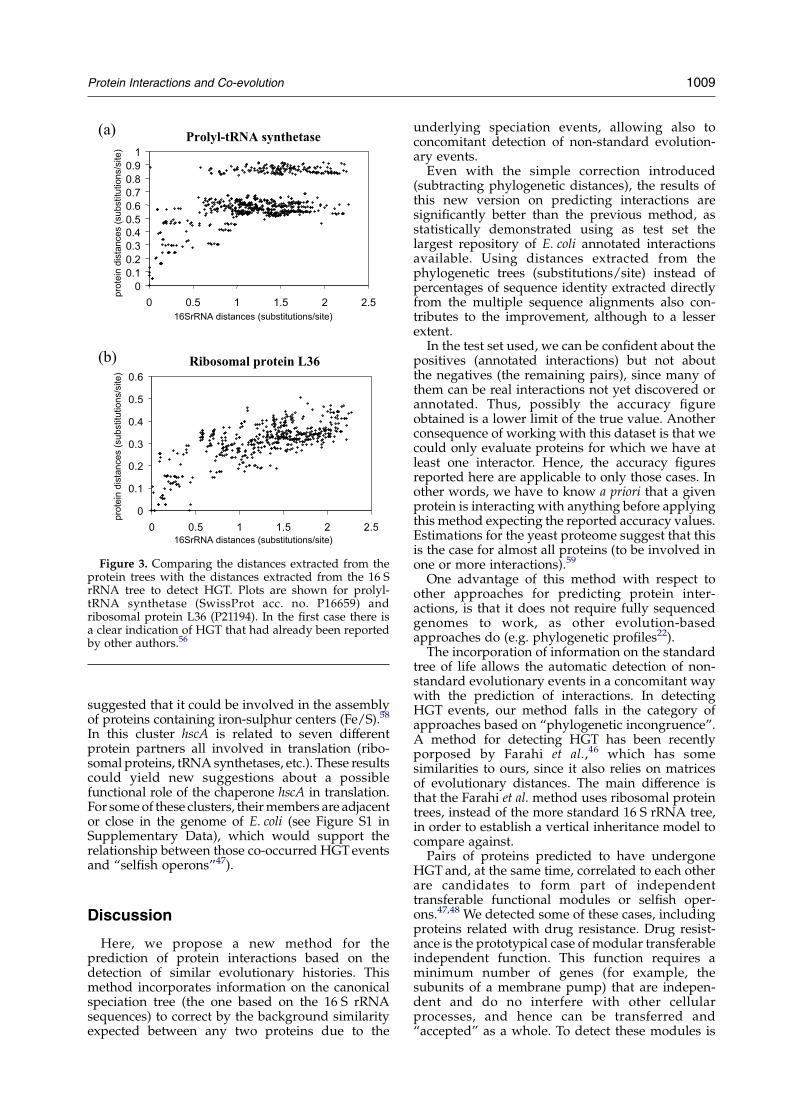
Figure 3. Comparing the distances extracted from theprotein trees with the distances extracted from the 16 SrRNA tree to detect HGT. Plots are shown for prolyl-tRNA synthetase (SwissProt acc. no. P16659) andribosomal protein L36 (P21194). In the first case there isa clear indication of HGT that had already been reportedby other authors.56
Protein Interactions and Co-evolution 1009
suggested that it could be involved in the assemblyof proteins containing iron-sulphur centers (Fe/S).58
In this cluster hscA is related to seven differentprotein partners all involved in translation (ribo-somal proteins, tRNA synthetases, etc.). These resultscould yield new suggestions about a possiblefunctional role of the chaperone hscA in translation.For someof these clusters, theirmembers are adjacentor close in the genome of E. coli (see Figure S1 inSupplementary Data), which would support therelationship between those co-occurred HGTeventsand “selfish operons”47).
Discussion
Here, we propose a new method for theprediction of protein interactions based on thedetection of similar evolutionary histories. Thismethod incorporates information on the canonicalspeciation tree (the one based on the 16 S rRNAsequences) to correct by the background similarityexpected between any two proteins due to the
underlying speciation events, allowing also toconcomitant detection of non-standard evolution-ary events.Even with the simple correction introduced
(subtracting phylogenetic distances), the results ofthis new version on predicting interactions aresignificantly better than the previous method, asstatistically demonstrated using as test set thelargest repository of E. coli annotated interactionsavailable. Using distances extracted from thephylogenetic trees (substitutions/site) instead ofpercentages of sequence identity extracted directlyfrom the multiple sequence alignments also con-tributes to the improvement, although to a lesserextent.In the test set used, we can be confident about the
positives (annotated interactions) but not aboutthe negatives (the remaining pairs), since many ofthem can be real interactions not yet discovered orannotated. Thus, possibly the accuracy figureobtained is a lower limit of the true value. Anotherconsequence of working with this dataset is that wecould only evaluate proteins for which we have atleast one interactor. Hence, the accuracy figuresreported here are applicable to only those cases. Inother words, we have to know a priori that a givenprotein is interacting with anything before applyingthis method expecting the reported accuracy values.Estimations for the yeast proteome suggest that thisis the case for almost all proteins (to be involved inone or more interactions).59
One advantage of this method with respect toother approaches for predicting protein inter-actions, is that it does not require fully sequencedgenomes to work, as other evolution-basedapproaches do (e.g. phylogenetic profiles22).The incorporation of information on the standard
tree of life allows the automatic detection of non-standard evolutionary events in a concomitant waywith the prediction of interactions. In detectingHGT events, our method falls in the category ofapproaches based on “phylogenetic incongruence”.A method for detecting HGT has been recentlyporposed by Farahi et al.,46 which has somesimilarities to ours, since it also relies on matricesof evolutionary distances. The main difference isthat the Farahi et al. method uses ribosomal proteintrees, instead of the more standard 16 S rRNA tree,in order to establish a vertical inheritance model tocompare against.Pairs of proteins predicted to have undergone
HGT and, at the same time, correlated to each otherare candidates to form part of independenttransferable functional modules or selfish oper-ons.47,48 We detected some of these cases, includingproteins related with drug resistance. Drug resist-ance is the prototypical case of modular transferableindependent function. This function requires aminimum number of genes (for example, thesubunits of a membrane pump) that are indepen-dent and do no interfere with other cellularprocesses, and hence can be transferred and“accepted” as a whole. To detect these modules is
1010 Protein Interactions and Co-evolution
important not only because of the eventual practicalapplications (antibiotic resistance) but because ofthe theoretical implications as well (“isolated”functional modules, highly independent on others,and hence easier to model).
The detection of these non-canonical evolution-ary histories, in addition to being important byitself, is also critical when assessing interactions byevolution-based methods, as discussed in theIntroduction. Indeed, our results are better whendiscarding proteins automatically predicted to havesuffered HGT (see Results). This method is notintended to compete with the many existingmethods specifically designed to locate HGT (seeIntroduction), but to detect it in a simple andconvenient way, naturally integrated with theinteraction prediction methodology.
Finding the right interaction partner among the15% top scores (15% false positives) could beconsidered insufficient for a researcher interestedin a given protein. However, we consider that thisperformance is useful for two main reasons: (i) itimplies an important reduction in the number ofpairs to test experimentally; and (ii) for certainstudies of the interactome that deal with globalproperties such as topology or connectivity,8–14 ahigh rate of false positives can be tolerated, sincethese studies are statistical in nature and deal withglobal properties not markedly affected by thedetailed description of the individual components.Indeed, high-throughput experimental sets ofinteractions have a very high degree of error17 andthey are still used for many studies.8–14 So, thismethod can help, together with other compu-tational and experimental techniques, in the in silicoreconstruction of protein interaction networks.
Another application of the predicted interactionpartners is the prediction of function for openreading frames (ORFs) by simply transferringfunction from their interactors.51,52 This is anapproach orthogonal and complementary to thestandard function transfer by sequence homology.
Another factor that could affect the similarity oftrees of interacting proteins is the difference inevolutionary rates. A certain relation has beenfound between this parameter and the number ofinteractors a protein has to co-evolve with,9 beinghighly connected proteins with slightly lowerevolutionary rates. We will explore the possibilityof extending the tol-mirrortree method in order totake this factor into account.
Although very fast and convenient, “neighbourjoining” is not the state-of-the-art technique forconstructing phylogenetic trees. We plan to assessthe performance of the method using phylogenetictrees obtained with more sophisticated techniques.Moreover, although used by many investigators asa very convenient and practical shortcut, which hasbeen shown to achieve a good performance inpredicting interactions (see Introduction), the usageof a correlation formulation to compare distancematrices is not very robust from the mathematicalpoint of view, since the values (distances) are not
independent. We plan to study more exhaustive,albeit practical, ways to compare evolutionaryhistories. This dependence also makes it impossibleto associate tabulated P-values (which would beeasier to interpret) to the correlation scores, sincethese P-values are based on a null hypothesis,which involves the independence of the data. Itwould be useful to explore the possibility ofconstructing background distributions, which dotake into account the intrinsic dependence ofdistance matrices data (i.e. from random trees) toextract P-values from them.
The evolutionary assumptions made by mirror-tree-like approaches (i.e. co-evolution of interactingproteins; see Introduction) were the basis forgenerating and improving the methodologies. Butthe methods and their performances do not dependon these assumptions to be true. The fact is thatsimilarity of phylogenetic distances is related tointeraction. This observation can be used to deriveputative interactions, irrespective of the underlyingevolutionary assumptions. Nevertheless, the valueof working with these assumptions is that they canlead to future improvements and produce scientificknowledge beyond just a black-box predictive tool.
The method presented here allows the user tostudy and compare evolutionary histories in anintegrated framework, for predicting protein inter-actions, non-standard evolutionary histories andprotein function. Since it is fully automatic andrequires only sequence information to work, it canbe coupled to the continuous stream of newsequences coming from the many whole-genomesequencing projects.
Materials and Methods
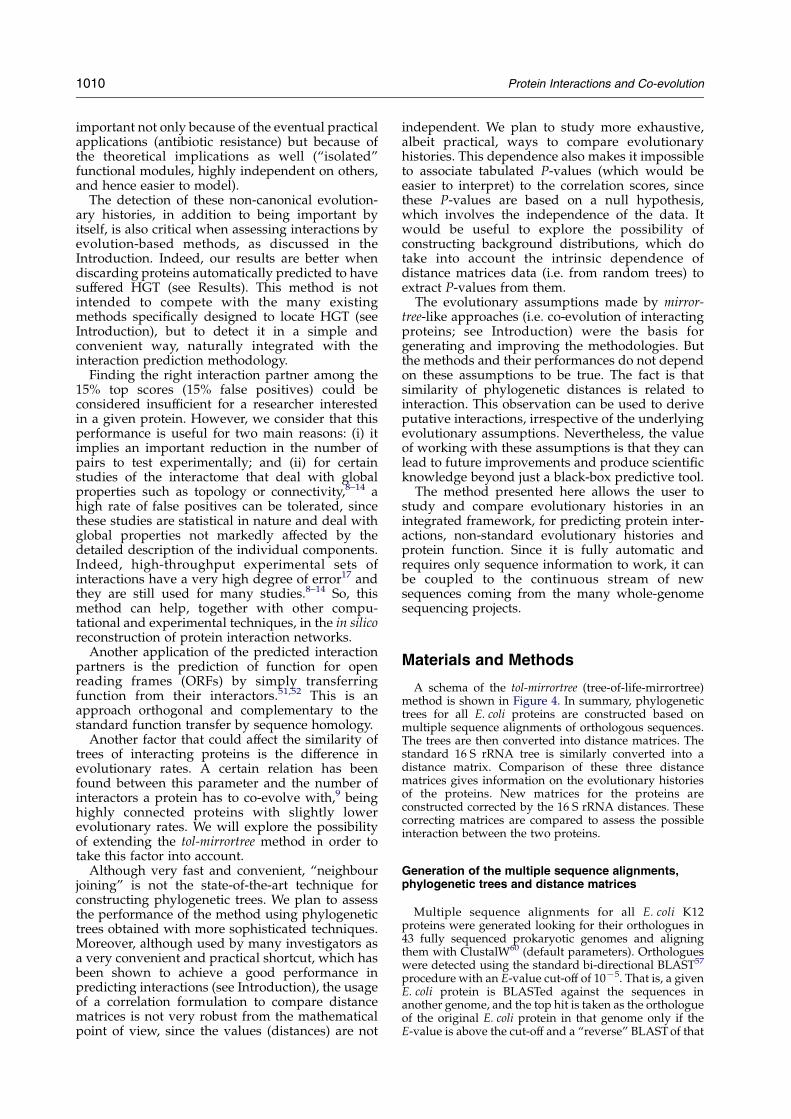
A schema of the tol-mirrortree (tree-of-life-mirrortree)method is shown in Figure 4. In summary, phylogenetictrees for all E. coli proteins are constructed based onmultiple sequence alignments of orthologous sequences.The trees are then converted into distance matrices. Thestandard 16 S rRNA tree is similarly converted into adistance matrix. Comparison of these three distancematrices gives information on the evolutionary historiesof the proteins. New matrices for the proteins areconstructed corrected by the 16 S rRNA distances. Thesecorrecting matrices are compared to assess the possibleinteraction between the two proteins.
Generation of the multiple sequence alignments,phylogenetic trees and distance matrices
Multiple sequence alignments for all E. coli K12proteins were generated looking for their orthologues in43 fully sequenced prokaryotic genomes and aligningthem with ClustalW60 (default parameters). Orthologueswere detected using the standard bi-directional BLAST57
procedure with an E-value cut-off of 10K5. That is, a givenE. coli protein is BLASTed against the sequences inanother genome, and the top hit is taken as the orthologueof the original E. coli protein in that genome only if theE-value is above the cut-off and a “reverse” BLASTof that
Figure 4. Schema of the tol-mirrortree method. Phylogenetic trees are built from the multiple sequence alignments ofthe proteins. Matrices containing the distances between species are extracted from those trees. The distances between the
Protein Interactions and Co-evolution 1011
1012 Protein Interactions and Co-evolution
protein back against E. coli also finds the original proteinas the top hit (again with an E-value above the cut-off).Phylogenetic trees are derived from the multiple
sequence alignments using the neighbour-joining algor-ithm implemented in ClustalW. These trees are convertedinto distance matrices by summing the length of thebranches separating each pair of species. The canonicaltree of life, constructed from the 16 S rRNA sequences,was obtained from the European rRNA Database.61 This16 S rRNA tree is converted into a distance matrix in thesame way. New distance matrices for the proteins areobtained by subtracting from each value the distancebetween the corresponding species in the 16 S rRNAdistance matrix. Due to the different scale of protein andRNA distances matrices, their values are rescaled beforesubtraction. For this rescaling, we need an equivalencebetween RNA and protein distances. That equivalencecan be obtained from “molecular clock” proteins, proteinsexpected to reflect the same evolutionary history as the“standard tree” (16 S rRNA). For that, we took theproteins with the trees most similar to the 16 S rRNA(highest correlations). For these proteins the relationdistance_protein/distance_RNAwas, on average, 0.42/1.We rescaled the values of the matrices with these figuresbefore subtraction. The final corrected matrices areexpected to contain only the distances between ortho-logues that are not due to speciation but to other reasonsrelated to function.
Prediction of interacting pairs
An interaction score is obtained by calculating the linearcorrelation coefficient between the two corrected matrices.In order for thematrices to have the samedimension and tobe comparable, only the distances between species that arein the multiple sequence alignment of both proteins areconsidered. We require a minimum of ten species incommon (45 distance values) to test a pair of proteins. So,for two proteins A and Bwith n species in common in theirmultiple sequence alignment, being dAij the distancebetween species i and j in the tree of protein A, dBij thedistance in the tree of protein B (both rescaled as explainedbefore), and dRij the distance between species i and j in thestandard 16 S rRNA tree; the interaction score between Aand B (rAB) is calculated as:
rAB Z
PnK1
iZ1
PnjZiC1
ðdA0ijKdA
0Þ$ðdB0
ijKdB0Þ
ffiffiffiffiffiffiffiffiffiffiffiffiffiffiffiffiffiffiffiffiffiffiffiffiffiffiffiffiffiffiffiffiffiffiffiffiffiffiffiffiffiffiPnK1
iZ1
PnjZiC1
ðdA0ijKdA
0Þ2
s$
ffiffiffiffiffiffiffiffiffiffiffiffiffiffiffiffiffiffiffiffiffiffiffiffiffiffiffiffiffiffiffiffiffiffiffiffiffiffiffiffiffiPnK1
iZ1
PnjZiC1
ðdB0ijKdB
0Þ2
s
Where dA0ij and dB0
ij are the values of the correctedmatrices, that is dA0
ijZdAijKdRij; dB0ijZdBijKdRij; and
dA0, dB
0are the average values of those matrices. High
values of that score reflect similar evolutionary historiesnot due to the overall speciation and hence are expectedto be related to physical interaction or functionalrelationship. Hence, the two differences between tol-mirrortree and the old mirrortree method are: (i) the use ofdistances extracted from phylogenetic trees instead of
same species are also extracted from the canonical tree of life,the protein trees (distance matrices) with the 16 S rRNA tree gihorizontal gene transfers (HGT). The distances in the proteinnew corrected distances matrices are compared using a linbetween the two proteins.
sequence similarities; and (ii) the correction by the 16 SrRNA distances.
Protein interactions test set
We tested this method for predicting protein inter-actions in the whole set of E. coli interacting proteinsannotated in the DIP database49 (version of February2004). This database contains interactions manuallyextracted from the literature and, except for organismsfor which more specialised databases exist, it can beconsidered the current gold standard for protein inter-actions. There were 516 pairs of interacting pairs,comprising 512 different E. coli proteins. This test setcontains only physically interacting proteins, not func-tionally related ones. In order to get a set of negativeexamples involving the same proteins, we generated allpossible pairs between those proteins. This set of negativeexamples may actually erroneously include positiveexamples, since the fact a pair of proteins is not annotatedin DIP does not guarantee that these two proteins do notinteract. In other words, we can be sure of the positivesbut not of the negatives. Due to the limitation of requiringten or more species in common in order for two proteinsto be tested, our final test set contained 19,991 pairs, 115 ofthem being true interactions. There were 118 proteins forwhich at least one pair comprising a real interactor couldbe calculated. From these 118 cases, 80 (68%) have onlyone annotated interactor in the list, 20 (17%) have two,and the remaining 18 (15%) have three or more.We acknowledge that this dataset is limited, since there
is no experimental high-throughput protein interactiondata for E. coli. This incompleteness creates someproblems in evaluating the results (especially falsepositives) discussed elsewhere in the article. To useother organisms with a far larger coverage of experimen-tal protein interaction data (such as yeast) would over-come these problems. There are two main reasons torestrict to prokarya and not use the available eukaryoticinteraction datasets: (i) some characteristics of eukaryoticproteins (including multidomain and low-complexityregions) make the automatic generations of reliablemultiple sequence alignments more difficult than forprokarya; (ii) while the phylogenetic tree for bacteria ismore or less well established, the one involving eukarya isnot so clear (especially the separation between the threekingdoms). Since the tree of life is an input for thismethod, we wanted to restrict to a well-established one.Moreover, concepts like operon or genome closeness usedin this study make sense only for prokaryotic organisms.Additionally, for E. coliwe can produce blind predictions,which could be useful for further investigation, since notall the interactions are known. For these reasons, wedecided to use E. coli as a simpler model organism in spiteof the relatively limited protein interaction data.
Interaction-based prediction of function
As a blind prediction, we ran all-against-all E. coliproteins. Due to the limitations described, we could make
the one based on the 16 S rRNA sequences. Comparison ofves information on non-standard evolutionary events, likematrices are corrected by those in the 16 S rRNA. These
ear correlation criteria to assess the possible interaction
Protein Interactions and Co-evolution 1013
calculations for 836,934 pairs. For the proteins annotatedas “hypothetical”, we took the top list of predictedinteraction partners, extracted their functional annota-tions from the GO database53 and assigned to thehypothetical protein those GO terms shared by itspredicted interactors.
Detection of non-standard evolutionary events
Non-standard evolutionary events are detected bycomparing the trees (distance matrices) of the twoproteins, between them and with the 16 S rRNA tree.For this purpose we use the original distance matrices(before rescaling and correcting) (see Figure 4).Proteins predicted to have undergone HGT events are
those whose trees are different from the 16 S rRNA tree(poorly correlated, low rAR). Modular cassettes offunctionally related proteins are composed of proteinswith a high degree of similarity between their trees but alow degree of similarity with the 16 S rRNA tree, thusindicating a possible joint HGT due to functional reasons.To quantify this we calculated, for all possible pairs inE. coli the difference between the correlation of the trees ofthe two proteins and the average correlation of theseproteins with the 16 S rRNA tree (rABK(rARCrBR)/2). Inthis case correlation values (r) are calculated from theoriginal matrices, before correcting with the 16 S rRNAdistances (Figure 4).
Acknowledgements
We acknowledge Alfonso Valencia (CNB, CSIC),Michael Stumpf (Division of Molecular Biosciences,IC), Victor Lesk (SBG, IC) and Hernan Dopazo(CNIO) for interesting discussion and comments,Dr Elena Kulinskaya (Statistical Advice Service, IC)for help and Eduardo Andres (CNB, CSIC) forcomputer assistance. We also acknowledge themaintainers of the databases and resources usedin this work and one of the anonymous referees forfair and constructive comments. F.P. is supported bythe DTI beacon project QCBB/C/012/00003. Allcomputer programs and datasets discussed in thisarticle are available upon request for academic use.
Supplementary Data
Supplementary data associated with this articlecan be found, in the online version, at doi:10.1016/j.jmb.2005.07.005
References
1. Fields, S. & Song, O. (1989). A novel genetic system todetect protein–protein interactions.Nature, 340, 245–246.
2. Gavin, A. C., Bosche, M., Krause, R., Grandi, P.,Marcioch, M., Bauer, A. et al. (2002). Functionalorganisation of the yeast proteome by systematicanalysis of protein complexes. Nature, 415, 141–147.
3. Ho, Y., Gruhler, A., Heilbut, A., Bader, G. D., Moore,
L., Adams, S. L. et al. (2002). Systematic identificationof protein complexes in Saccharomyces cerevisiae bymass spectrometry. Nature, 415, 180–183.
4. Uetz, P., Giot, L., Cagney, G., Mansfield, T. A., Judson,R. S., Knight, J. R. et al. (2000). A comprehensiveanalysis of protein-protein interactions in Saccharo-myces cerevisiae. Nature, 403, 623–631.
5. Rain, J. C., Selig, L., De Reuse, H., Battaglia, V.,Reverdy, C., Simon, S. et al. (2001). The protein–protein interaction map of Helicobacter pylori. Nature,409, 211–215.
6. Giot, L., Bader, J. S., Brouwer, C., Chaudhuri, A.,Kuang, B., Li, Y. et al. (2003). A protein interactionmapof Drosophila melanogaster. Science, 302, 1727–1736.
7. Li, S., Armstrong, C. M., Bertin, N., Ge, H., Milstein,S., Boxem, M. et al. (2004). A map of the interactomenetwork of the metazoan C. elegans. Science, 303,540–543.
8. Jeong, H., Mason, S. P., Barabasi, A. L. & Oltvai, Z. N.(2001). Lethality and centrality in protein networks.Nature, 411, 41–42.
9. Fraser, H. B., Hirsh, A. E., Steinmetz, L. M., Scharfe, C.& Feldman, M. W. (2002). Evolutionary rate in theprotein interaction network. Science, 296, 750–752.
10. Bu, D., Zhao, Y., Cai, L., Xue, H., Zhu, X., Lu, H. et al.(2003). Topological structure analysis of the protein-protein interaction network in budding yeast. Nucl.Acids Res. 31, 2443–2450.
11. Kelley, B. P., Sharan, R., Karp, R. M., Sittler, T., Root,D. E., Stockwell, B. R. et al. (2003). Conservedpathways within bacteria and yeast as revealed byglobal protein network alignment. Proc. Natl Acad. Sci.USA, 100, 11394–11399.
12. Qin, H., Lu, H. H., Wu, W. B. & Li, W. H. (2003).Evolution of the yeast protein interaction network.Proc. Natl Acad. Sci. USA, 100, 12820–12824.
13. Wuchty, S., Oltvai, Z. N. & Barabasi, A. L. (2003).Evolutionary conservation of motif constituents in theyeast protein interaction network. Nature Genet. 35,176–179.
14. Yeger-Lotem, E. & Margalit, H. (2003). Detection ofregulatory circuits by integrating the cellular net-works of protein–protein interactions and transcrip-tion regulation. Nucl. Acids Res. 31, 6053–6061.
15. Lappe, M. & Holm, L. (2004). Unraveling proteininteraction networks with near-optimal efficiency.Nature Biotechnol. 22, 98–103.
16. Jansen, R., Yu, H., Greenbaum, D., Kluger, Y., Krogan,N. J., Chung, S. et al. (2003). A Bayesian networksapproach for predicting protein–protein interactionsfrom genomic data. Science, 302, 449–453.
17. von Mering, C., Krause, R., Snel, B., Cornell, M.,Oliver, S. G., Fields, S. et al. (2002). Comparativeassessment of large scale data sets of protein–proteininteractions. Nature, 417, 399–403.
18. Overbeek, R., Fonstein, M., D’Souza, M., Pusch, G. D.& Maltsev, N. (1999). Use of contiguity on thechromosome to predict functional coupling. In SilicoBiol. 1, 93–108.
19. Dandekar, T., Snel, B., Huynen, M. & Bork, P. (1998).Conservation of gene order: a fingerprint of proteinsthat physicaly interact. Trends Biochem. Sci. 23,324–328.
20. Enright, A. J., Iliopoulos, I., Kyrpides, N. C. &Ouzounis, C. A. (1999). Protein interaction maps forcomplete genomes based on gene fusion events.Nature, 402, 86–90.
21. Marcotte, E. M., Pellegrini, M., Ho-Leung, N., Rice,
1014 Protein Interactions and Co-evolution
D. W., Yeates, T. O. & Eisenberg, D. (1999). Detectingprotein function and protein–protein interactionsfrom genome sequences. Science, 285, 751–753.
22. Pellegrini, M., Marcotte, E. M., Thompson, M. J.,Eisenberg, D. & Yeates, T. O. (1999). Assigning proteinfunctions by comparative genome analysis: proteinpylogenetic profiles. Proc. Natl Acad. Sci. USA, 96,4285–4288.
23. Date, S. V. & Marcotte, E. M. (2003). Discovery ofuncharacterized cellular systems by genome-wideanalysis of functional linkages. Nature Biotechnol. 21,1055–1062.
24. Pazos, F. & Valencia, A. (2002). In silico two-hybridsystem for the selection of physically interactingprotein pairs. Proteins: Struct. Funct. Genet. 47, 219–227.
25. Goh, C.-S., Bogan, A. A., Joachimiak, M., Walther, D.& Cohen, F. E. (2000). Co-evolution of proteinswith their interaction partners. J. Mol. Biol. 299,283–293.
26. Pazos, F. & Valencia, A. (2001). Similarity of phyloge-netic trees as indicator of protein-protein interaction.Protein Eng. 14, 609–614.
27. Salwinski, L. & Eisenberg, D. (2003). Computationalmethods of analysis of protein–protein interactions.Curr. Opin. Struct. Biol. 13, 377–382.
28. Valencia, A. & Pazos, F. (2002). Computationalmethods for the prediction of protein interactions.Curr. Opin. Struct. Biol. 12, 368–373.
29. Huynen, M. A., Snel, B., von Mering, C. & Bork, P.(2003). Function prediction and protein networks.Curr. Opin. Cell Biol. 15, 191–198.
30. Fryxell, K. J. (1996). The coevolution of gene familytrees. Trends Genet. 12, 364–369.
31. Pages, S., Belaich, A., Belaich, J. P., Morag, E., Lamed,R., Shoham, Y. et al. (1997). Species-specificity of thecohesin-dockerin interaction between Clostridiumthermocellum and Clostridium cellulolyticum: predictionof specificity determinants of the dockerin domain.Proteins: Struct. Funct. Genet. 29, 517–527.
32. Fraser, H. B., Hirsh, A. E., Wall, D. P. & Eisen, M. B.(2004). Coevolution of gene expression among inter-acting proteins. Proc. Natl Acad. Sci. USA, 101,9033–9038.
33. Gertz, J., Elfond, G., Shustrova, A., Weisinger, M.,Pellegrini, M., Cokus, S. et al. (2003). Inferring proteininteractions from phylogenetic distance matrices.Bioinformatics, 19, 2039–2045.
34. Goh, C. S. & Cohen, F. E. (2002). Co-evolutionaryanalysis reveals insights into protein–protein inter-actions. J. Mol. Biol. 324, 177–192.
35. Ramani, A. K. & Marcotte, E. M. (2003). Exploidingthe co-evolution of interacting proteins to discoverinteraction specificity. J. Mol. Biol. 327, 273–284.
36. Sato, T., Yamanishi, Y., Horimoto, K., Toh, H. &Kanehisa, M. (2003). Prediction of protein–proteininteractions from phylogenetic trees using partialcorrelation coefficient. Genome Informatics, 14, 496–497.
37. Kim, W. K., Bolser, D. M. & Park, J. H. (2004). Large-scale co-evolution analysis of protein structuralinterlogues using the global protein structural inter-actome map (PSIMAP). Bioinformatics, 20, 1138–1150.
38. Tan, S., Zhang, Z. & Ng, S. (2004). ADVICE:automated detection and validation of interaction byco-evolution. Nucl. Acids Res. 32, W69–W72.
39. Brown, J. R. (2003). Ancient horizontal gene transfer.Nature Rev. Genet. 4, 121–132.
40. Lawrence, J. G. & Ochman, H. (2002). Reconciling themany faces of lateral gene transfer. Trends Microbiol.10, 1–4.
41. Philippe, H. & Douady, C. J. (2003). Horizontal genetransfer and phylogenetics. Curr. Opin. Microbiol. 6,498–505.
42. Nakamura, Y., Itoh, T., Matsuda, H. & Gojobori, T.(2004). Biased biological functions of horizontallytransfered genes in prokaryotic genomes. NatureGenet. 36, 760–766.
43. Clarke, G. D., Beiko, R. G., Ragan, M. A. & Charlebois,R. L. (2002). Inferring genome trees by using a filter toeliminate phylogenetically discordant sequences anda distance matrix based on mean normalized BLASTPscores. J. Bacteriol. 184, 2072–2080.
44. Daubin, V., Moran, N. A. & Ochman, H. (2003).Phylogenetics and the cohesion of bacterial genomes.Science, 301, 829–832.
45. Kunin, V. & Ouzounis, C. A. (2003). GeneTRACE-reconstruction of gene content of ancestral species.Bioinformatics, 19, 1412–1416.
46. Farahi, K., Whitman, W. B. & Kraemer, E. T. (2003).RED-T: utilizing the ratios of evolutionary distancesfor determination of alternative phylogenetic events.Bioinformatics, 19, 2152–2154.
47. Lawrence, J. G. (1997). Selfish operons and speciationby gene transfer. Trends Microbiol. 5, 355–359.
48. Omelchenko, M. V., Makarova, K. S., Wolf, Y. I.,Rogozin, I. B. & Koonin, E. V. (2003). Evolution ofmosaic operons by horizontal gene transfer and genedisplacement in situ. Genome Biol. 4, R55.
49. Xenarios, I., Salwinski, L., Duan, X. J., Higney, P., Kim,S. M. & Eisenberg, D. (2002). DIP, the database ofinteracting proteins: a research tool for studyingcellular networks of protein interactions. Nucl. AcidsRes. 30, 303–305.
50. Bland, M. (1987). An Introduction to Medical Statistics,Oxford Medical Publications, Oxford UniversityPress, London.
51. Vazquez, A., Flammini, A., Maritan, A. & Vespignani,A. (2003). Global protein function prediction fromprotein-protein interaction networks. Nature Biotech-nol. 21, 697–700.
52. Samanta, M. P. & Liang, S. (2003). Predicting proteinfunctions from redundancies in large-scale proteininteraction networks. Proc. Natl Acad. Sci. USA, 100,12579–12583.
53. Harris, M. A., Clark, J., Ireland, A., Lomax, J.,Ashburner, M., Foulger, R. et al. (2004). The GeneOntology (GO) database and informatics resource.Nucl. Acids Res. 32, D258–D261.
54. Brown, J. R. & Doolittle, W. F. (1995). Root of theuniversal tree of life based on ancient aminoacyl-tRNA synthetase gene duplications. Proc. Natl Acad.Sci. USA, 92, 2441–2445.
55. Shiba, K., Motegi, H. & Schimmel, P. (1997). Main-taining genetic code through adaptations of tRNAsynthetases to taxonomic domains. Trends Biochem.Sci. 22, 453–457.
56. Woese, C. R., Olsen, G. J., Ibba, M. & Soll, D. (2000).Aminoacyl-tRNA synthetases, the genetic code, andthe evolutionary process. Microbiol. Mol. Biol. Rev. 64,202–236.
57. Altschul, S. F., Madden, T. L., Schaffer, A. A., Zhang, J.,Zhang, Z., Miller, W. et al. (1997). Gapped BLASTand PSI-BLAST: a new generation of proteindatabase search programs. Nucl. Acids Res. 25, 3389–3402.
58. Dougan, D. A., Mogk, A. & Bukau, B. (2002). Protein

Protein Interactions and Co-evolution 1015
folding and degradation in bacteria: to degrade or notto degrade? That is the question. Cell. Mol. Life Sci. 59,1607–1616.
59. Grigoriev, A. (2003). On the number of protein-proteininteractions in the yeast proteome.Nucl. Acids Res. 31,4157–4161.
60. Chenna, R., Sugawara, H., Koike, T., Lopez, R.,
Gibson, T. J., Higgins, D. G. et al. (2003). Multiplesequence alignment with the Clustal series ofprograms. Nucl. Acids Res. 31, 3497–3500.
61. Wuyts, J., Perriere, G. & Van De Peer, Y. (2004). TheEuropean ribosomal RNA database. Nucl. Acids Res.32, D101–D103.
Edited by J. Thornton
(Received 20 January 2005; received in revised form 22 June 2005; accepted 4 July 2005)Available online 15 August 2005