R-Map: A Map Metaphor for Visualizing Information Reposting ...
Upload
khangminh22Category
view
3download
0
HAL Id: hal-02347978https://hal.archives-ouvertes.fr/hal-02347978
Preprint submitted on 8 Nov 2019
HAL is a multi-disciplinary open accessarchive for the deposit and dissemination of sci-entific research documents, whether they are pub-lished or not. The documents may come fromteaching and research institutions in France orabroad, or from public or private research centers.
L’archive ouverte pluridisciplinaire HAL, estdestinée au dépôt et à la diffusion de documentsscientifiques de niveau recherche, publiés ou non,émanant des établissements d’enseignement et derecherche français ou étrangers, des laboratoirespublics ou privés.
Distributed under a Creative Commons Attribution - NonCommercial - NoDerivatives| 4.0International License
A reference map of the human protein interactomeKatja Luck, Dae-Kyum Kim, Luke Lambourne, Kerstin Spirohn, Bridget E
Begg, Wenting Bian, Ruth Brignall, Tiziana Cafarelli, Francisco JCampos-Laborie, Benoit Charloteaux, et al.
To cite this version:Katja Luck, Dae-Kyum Kim, Luke Lambourne, Kerstin Spirohn, Bridget E Begg, et al.. A referencemap of the human protein interactome. 2019. �hal-02347978�

1
A reference map of the human protein interactome
Katja Luck1-3,33, Dae-Kyum Kim1,4-6,33, Luke Lambourne1-3,33, Kerstin Spirohn1-3,33, Bridget E.
Begg1-3, Wenting Bian1-3, Ruth Brignall1-3, Tiziana Cafarelli1-3, Francisco J. Campos-Laborie7,8,
Benoit Charloteaux1-3, Dongsic Choi9, Atina G. Cote1,4-6, Meaghan Daley1-3, Steven Deimling10,
Alice Desbuleux1-3,11, Amélie Dricot1-3, Marinella Gebbia1,4-6, Madeleine F. Hardy1-3, Nishka
Kishore1,4-6, Jennifer J. Knapp1,4-6, István A. Kovács1,12,13, Irma Lemmens14,15, Miles W. Mee4,5,16,
Joseph C. Mellor1,4-6,17, Carl Pollis1-3, Carles Pons18, Aaron D. Richardson1-3, Sadie Schlabach1-3,
Bridget Teeking1-3, Anupama Yadav1-3, Mariana Babor1,4-6, Dawit Balcha1-3, Omer Basha19,20,
Christian Bowman-Colin2,3, Suet-Feung Chin21, Soon Gang Choi1-3, Claudia Colabella22,23,
Georges Coppin1-3,11, Cassandra D'Amata10, David De Ridder1-3, Steffi De Rouck14,15, Miquel
Duran-Frigola18, Hanane Ennajdaoui1,4-6, Florian Goebels4,5,16, Liana Goehring2,3, Anjali Gopal1,4-
6, Ghazal Haddad1,4-6, Elodie Hatchi2,3, Mohamed Helmy4,5,16, Yves Jacob24,25, Yoseph Kassa1-3,
Serena Landini2,3, Roujia Li1,4-6, Natascha van Lieshout1,4-6, Andrew MacWilliams1-3, Dylan
Markey1-3, Joseph N. Paulson26-28, Sudharshan Rangarajan1-3, John Rasla1-3, Ashyad Rayhan1,4-
6, Thomas Rolland1-3, Adriana San-Miguel1-3, Yun Shen1-3, Dayag Sheykhkarimli1,4-6, Gloria M.
Sheynkman1-3, Eyal Simonovsky19,20, Murat Taşan1,4-6,16, Alexander Tejeda1-3, Jean-Claude
Twizere11, Yang Wang1-3, Robert J. Weatheritt4, Jochen Weile1,4-6,16, Yu Xia1,29, Xinping Yang1-3,
Esti Yeger-Lotem19,20, Quan Zhong1-3,30, Patrick Aloy18,31, Gary D. Bader4,5,16, Javier De Las
Rivas7,8, Suzanne Gaudet1-3, Tong Hao1-3, Janusz Rak9, Jan Tavernier14,15, Vincent Tropepe10,
David E. Hill1-3*, Marc Vidal1,2*, Frederick P. Roth1,4-6,16,32*, & Michael A. Calderwood1-3*
1Center for Cancer Systems Biology (CCSB), Dana-Farber Cancer Institute, Boston, MA, USA. 2Department of Genetics, Blavatnik Institute, Harvard Medical School, Boston, MA, USA. 3Department of
Cancer Biology, Dana-Farber Cancer Institute, Boston, MA, USA. 4The Donnelly Centre, University of
Toronto, Toronto, ON, Canada. 5Department of Molecular Genetics, University of Toronto, Toronto, ON,
Canada. 6Lunenfeld Tanenbaum Research Institute, Mount Sinai Hospital, Toronto, ON, Canada. 7Cancer
Research Center (CiC-IBMCC, CSIC/USAL), Consejo Superior de Investigaciones Científicas (CSIC) and
University of Salamanca (USAL), Salamanca, Spain. 8Institute for Biomedical Research of Salamanca
(IBSAL), Salamanca, Spain. 9The Research Institute of the McGill University Health Centre, Montreal,
QC, Canada. 10Department of Cell and Systems Biology, University of Toronto, Toronto, ON, Canada. 11Molecular Biology of Diseases, Groupe Interdisciplinaire de Génomique Appliquée (GIGA) and
.CC-BY-NC-ND 4.0 International licenseIt is made available under a (which was not peer-reviewed) is the author/funder, who has granted bioRxiv a license to display the preprint in perpetuity.
The copyright holder for this preprint. http://dx.doi.org/10.1101/605451doi: bioRxiv preprint first posted online Apr. 10, 2019;

2
Laboratory of Viral Interactomes, University of Liège, Liège, Belgium. 12Network Science Institute,
Northeastern University, Boston, MA, USA. 13Wigner Research Centre for Physics, Institute for Solid
State Physics and Optics, Budapest, Hungary. 14Center for Medical Biotechnology, Vlaams Instituut voor
Biotechnologie (VIB), Ghent, Belgium. 15Cytokine Receptor Laboratory (CRL), Department of
Biomolecular Medicine, Faculty of Medicine and Health Sciences, Ghent University, Ghent, Belgium. 16Department of Computer Science, University of Toronto, Toronto, ON, Canada. 17seqWell, Inc. Beverly
MA, USA. 18Institute for Research in Biomedicine (IRB Barcelona), The Barcelona Institute for Science
and Technology, Barcelona, Catalonia, Spain. 19Department of Clinical Biochemistry and Pharmacology,
Faculty of Health Sciences, Ben-Gurion University of the Negev, Beer-Sheva, Israel. 20National Institute
for Biotechnology in the Negev, Ben-Gurion University of the Negev, Beer-Sheva, Israel. 21CRUK
Cambridge Institute, University of Cambridge, Cambridge, UK. 22Department of Pharmaceutical Sciences,
University of Perugia, Italy. 23Istituto Zooprofilattico Sperimentale dell’Umbria e delle Marche “Togo
Rosati”, Perugia, Italy. 24Département de Virologie, Unité de Génétique Moléculaire des Virus à ARN
(GMVR), Institut Pasteur, UMR3569, Centre National de la Recherche Scientifique (CNRS), Paris,
France. 25Université Paris Diderot, Paris, France. 26Department of Biostatistics and Computational
Biology, Dana-Farber Cancer Institute, Boston, MA, USA. 27Department of Biostatistics, Harvard School
of Public Health, Boston, MA, USA. 28Department of Biostatistics, Product Development, Genentech Inc.,
South San Francisco, CA, USA. 29Department of Bioengineering, McGill University, Montreal, QC,
Canada. 30Department of Biological Sciences, Wright State University, Dayton, OH, USA. 31Institució
Catalana de Recerca i Estudis Avançats (ICREA), Barcelona, Catalonia, Spain. 32Canadian Institute for
Advanced Research (CIFAR), Toronto, ON, Canada. 33These authors contributed equally: Katja Luck,
Dae-Kyum Kim, Luke Lambourne, Kerstin Spirohn. *e-mail: [email protected];
[email protected]; [email protected]; [email protected]
.CC-BY-NC-ND 4.0 International licenseIt is made available under a (which was not peer-reviewed) is the author/funder, who has granted bioRxiv a license to display the preprint in perpetuity.
The copyright holder for this preprint. http://dx.doi.org/10.1101/605451doi: bioRxiv preprint first posted online Apr. 10, 2019;
3
Abstract
Global insights into cellular organization and function require comprehensive
understanding of interactome networks. Similar to how a reference genome sequence
revolutionized human genetics, a reference map of the human interactome network is
critical to fully understand genotype-phenotype relationships. Here we present the first
human “all-by-all” binary reference interactome map, or “HuRI”. With ~53,000 high-
quality protein-protein interactions (PPIs), HuRI is approximately four times larger than
the information curated from small-scale studies available in the literature. Integrating
HuRI with genome, transcriptome and proteome data enables the study of cellular
function within essentially any physiological or pathological cellular context. We
demonstrate the use of HuRI in identifying specific subcellular roles of PPIs and protein
function modulation via splicing during brain development. Inferred tissue-specific
networks reveal general principles for the formation of cellular context-specific functions
and elucidate potential molecular mechanisms underlying tissue-specific phenotypes of
Mendelian diseases. HuRI thus represents an unprecedented, systematic reference
linking genomic variation to phenotypic outcomes.
.CC-BY-NC-ND 4.0 International licenseIt is made available under a (which was not peer-reviewed) is the author/funder, who has granted bioRxiv a license to display the preprint in perpetuity.
The copyright holder for this preprint. http://dx.doi.org/10.1101/605451doi: bioRxiv preprint first posted online Apr. 10, 2019;

4
The reference human genome sequence has enabled systematic study of genetic1 and
expression2 variability at the organism1, tissue2, cell type3 and single cell level4. Despite
advances in sequencing genomes, transcriptomes and proteomes, we still understand little of
the cellular mechanisms that mediate phenotypic and tissue or cell type variability. A
mechanistic understanding of cellular function and organization emerges from studying how
genes and their products, primarily proteins, interact with each other, forming a dynamic
interactome that drives biological function. Analogous to the reference human genome
sequence5,6, a reference map of the human protein interactome, generated systematically and
comprehensively, would provide an unprecedented scaffold for the unbiased proteome-wide
study of biological mechanisms, generally and within specific cellular contexts. Almost 20 years
after the publication of a first draft of the reference human genome sequence5,6, a reference
protein interactome map is yet to be reported.
Proteins are biochemically more complex than DNA, the interactome is much more dynamic
than the genome, and the search space for interactions requires testing all-by-all pairwise
combinations, making interactome mapping extremely challenging. Approaches to human
proteome-wide protein-protein interaction (PPI) mapping either aim to identify protein complex
assemblies using mass spectrometry7–9 or direct PPIs using binary screening methods such as
yeast two-hybrid (Y2H) followed by empirical validation using orthogonal assays10–12. In contrast
to protein complex mapping, binary interactome mapping is based on interrogating pairs of
proteins for interaction independently from any particular endogenous cellular context, thereby
generating relatively unbiased systematic PPI datasets. For example, our most recent human
protein interactome map (HI-II-14) described ~14,000 PPIs involving 4,000 proteins from
screening ~40% of the genome-by-genome search space10 and in striking contrast to literature-
curated and protein complex interactome maps, HI-II-14 uniformly covered the proteome, free of
study and expression bias.
To increase interactome coverage and generate a first human reference interactome map,
we have expanded the ORFeome collection to encompass ~90% of the protein-coding genome
and screened this search space a total of nine times with a panel of assays using an enhanced
screening platform. The resulting human binary PPI map doubles HI-II-14's coverage of the
proteome and quadruples its interactome coverage. Integrating this PPI network with genome,
transcriptome and proteome resources, we infer cellular context-specific views of the protein
interactome, which are predictive of cellular context-specific gene function, at the level of
individual subcellular compartments, cell types and tissues, across developmental stages and in
disease (Fig. 1a). With its comprehensive view of the protein interactome, the resulting network
.CC-BY-NC-ND 4.0 International licenseIt is made available under a (which was not peer-reviewed) is the author/funder, who has granted bioRxiv a license to display the preprint in perpetuity.
The copyright holder for this preprint. http://dx.doi.org/10.1101/605451doi: bioRxiv preprint first posted online Apr. 10, 2019;

5
enables biological discovery across any cellular context, thus representing the first reference
map of the human protein interactome.
Generation and biophysical characterization of HI-III-19 Our previously published human protein interactome map, HI-II-1410, covered less than half of
the possible search space. To generate a more complete map, we established human
ORFeome v9.1. This expanded ORFeome covers 17,408 protein-coding genes, on par with the
number of genes found to be expressed in three comprehensive individual transcriptome
sequencing studies2,3,13 (Fig. 1b) and includes 94% of the genes with robust evidence of
expression in all three (Fig. 1c, Supplementary Table 1). The search space formed by
hORFeome v9.1 (Space III), encompassing over 150 million binary combinations, more than
doubles the space screened to generate HI-II-14 and represents the most comprehensive
search space to be systematically screened for human PPIs.
Limitations in PPI assay sensitivity can be overcome by employing different PPI assays14 or
different versions of the same PPI assay15,16. To maximize sensitivity while maintaining high-
throughput screening capabilities, we employed three Y2H assay versions (Fig. 1d), which,
when benchmarked against a gold standard positive and random reference set (PRSv1 and
RRSv1)17, showed good sensitivity and low false positive rates while detecting complementary
sets of PPIs (Extended Data Fig. 1a, b, Supplementary Table 2). We further assessed Y2H
assay version quality, complementarity and screening behavior on a test space of ~2,000 by
~2,000 human genes10. After verification by pairwise Y2H retesting and sequence confirmation,
PPIs from each version were evaluated using MAPPIT18, an orthogonal assay. For each Y2H
assay version, the recovery rate of PPIs was comparable or exceeded that of a set of PPIs from
the literature with ≥ 2 pieces of experimental evidence, of which at least one comes from a
binary assay type (Lit-BM)10 (Extended Data Fig. 1c, Supplementary Table 3). The Y2H assay
versions were complementary, in that performing three screens with each version doubled the
number of PPIs and proteins detected relative to performing the equivalent number of screens
using a single assay version (Extended Data Fig. 1d, Supplementary Table 4).
To construct the reference interactome, we performed nine screens of Space III, three with
each Y2H assay version, followed by pairwise testing in quadruplicate, sequence confirmation,
and validation using two orthogonal assays, MAPPIT18 and GPCA19. Screen PPIs were
recovered at rates that were similar or superior to Lit-BM over a large range of score thresholds
(Fig. 1e, Extended Data Fig. 1e-g, Supplementary Table 5), confirming the high quality of the
interactome dataset. Each additional screen identified novel PPIs and proteins, with the largest
.CC-BY-NC-ND 4.0 International licenseIt is made available under a (which was not peer-reviewed) is the author/funder, who has granted bioRxiv a license to display the preprint in perpetuity.
The copyright holder for this preprint. http://dx.doi.org/10.1101/605451doi: bioRxiv preprint first posted online Apr. 10, 2019;
6
gains obtained by switching assay versions (Fig. 1f, g, Extended Data Fig. 1d), highlighting the
importance of performing multiple screens and using several assay versions. The dataset,
versioned HI-III-19 (Human Interactome obtained from screening Space III, published in 2019),
contains 52,569 verified PPIs involving 8,275 proteins (Supplementary Table 6). Given its
systematic nature, completeness and scale, we consider HI-III-19 to be the first draft of the
Human Reference Interactome (HuRI).
To assess whether assay complementarity can partially stem from different steric constraints
in the protein fusions, we integrated HuRI with protein structure data20 and observed that the
dataset is depleted for PPIs where the interaction interface is a short spatial distance (< 20Å)
from the protein terminus fused to the AD domain (Extended Data Fig. 2a, b, Supplementary
Table 7). These results provide the first systematic investigation into the impact of protein tags
on PPI detection.
Molecular mechanisms can be more readily inferred from direct PPIs, yet, the fraction of
direct versus indirect PPIs reported in various human protein interactome maps is unknown.
Using three-dimensional structural information from protein complexes with at least three
subunits20,21, we show that the vast majority of PPIs in HuRI (90%) correspond to direct
biophysical contacts, significantly higher than in Lit-BM (81%, P = 0.019, two-sided Fisher’s
exact test, n = 121 (HuRI), 410 (Lit-BM)) or in protein complex interactome maps (less than
50%, P < 0.001 for all, two-sided Fisher’s exact test) (Fig. 1h, Supplementary Table 8),
demonstrating that HuRI represents a unique dataset of direct PPIs. Combining HuRI with all
previously published systematic screening efforts at CCSB yields 64,006 binary PPIs involving
9,094 proteins (HI-union) (Supplementary Table 9), which is approximately five-fold more PPIs
than the entirety of high-quality binary PPIs curated from the literature (Fig. 1i). The union of Lit-
BM and HI-union represent the most complete collection of high quality direct PPI data available
to date (http://interactome.dfci.harvard.edu/huri/).
PPIs in HuRI vary by the number of screens and assay versions in which they were
detected (Extended Data Fig. 2c, d). To investigate any potential relationship between these
factors and PPI false discovery rate, we compared MAPPIT recovery rates of HuRI and Lit-BM
PPIs found in different numbers of screens. Interestingly, both sets of PPIs show that MAPPIT
recovery rates increase with the number of screens in which an interaction was detected
(Extended Data Fig. 2e, Supplementary Table 10). This trend persists even when titrating Lit-
BM to higher numbers of experimental evidence (Extended Data Fig. 2f), suggesting that
differences in PPI recovery rates are driven by factors other than veracity of a PPI. In HuRI the
number of screens in which an interaction is detected is weakly correlated with both the size of
.CC-BY-NC-ND 4.0 International licenseIt is made available under a (which was not peer-reviewed) is the author/funder, who has granted bioRxiv a license to display the preprint in perpetuity.
The copyright holder for this preprint. http://dx.doi.org/10.1101/605451doi: bioRxiv preprint first posted online Apr. 10, 2019;

7
the molecular interfacial area (ρ = 0.15, P = 0.026, two-sided permutation test, n = 234)
(Extended Data Fig. 2g) and the number of atomic contacts (ρ = 0.14, P = 0.038, two-sided
permutation test, n = 234) (Extended Data Fig. 2h, Supplementary Table 11), suggesting that
identification of a PPI in a screen is impacted by interaction strength and may therefore be
reflecting ‘detectability’ rather than accuracy. Indeed, PPIs in HuRI found in at least two screens
corresponded more often to direct PPIs within rather than between well-described stable protein
complexes22,23 (P = 3 × 10-18, two-sided Fisher’s exact test, n = 1817) (Extended Data Fig. 2i, 3,
Supplementary Table 12). Because the majority of PPIs in HuRI were found in only one screen,
our data further reinforces previous observations7,24 that the protein interactome might be
dominated by weak, more transient PPIs, that are harder to detect. PPI detectability may impact
previous assessments of overlap between PPI datasets, as well as estimates of interactome
size.
Multiple layers of functional relationships between proteins in HuRI Based on the observation that HuRI is enriched in direct PPIs, we hypothesize that proteins in
HuRI with similar interaction interfaces should share a significant number of their interaction
partners. For example, retinoic acid receptors RXR-γ and -β (Fig. 2a, left panel) share
previously reported interaction partners involving binding to retinoic acid receptor RAR types25
and oxysterol receptors26. We derived a profile similarity network (PSN) from HuRI
(Supplementary Table 13), and found that the number of pairs of proteins in HuRI with similar
interaction profiles is significantly higher than random (P < 0.01, one-sided empirical test)
(Extended Data Fig. 4a) and proteins of overall higher sequence identity tend to exhibit higher
interaction profile similarities (P < 0.01, one-sided empirical test) (Extended Data Fig. 4b).
However, proteins with a tendency to share interaction partners often have interaction interfaces
that are similar, as opposed to complementary, and therefore tend not to interact, unless both
proteins originate from the same ancestral protein that was able to self-interact27 (Extended
Data Fig. 4c). Indeed, only 5% of the proteins found to interact in HuRI share more than 10% of
their interaction partners. HuRI and the PSN display significant enrichment to link proteins of
similar function (P < 0.01, one-sided empirical test) (Fig. 2b, Extended Data Fig. 4d, e) and both
contain much higher numbers of functional modules28 compared to our previously published
interactome maps10,11 (Fig. 2c). Because HuRI and the PSN display little link overlap but both
are functionally enriched, this suggests that HuRI and the PSN complement each other in
revealing functional relationships between proteins.
.CC-BY-NC-ND 4.0 International licenseIt is made available under a (which was not peer-reviewed) is the author/funder, who has granted bioRxiv a license to display the preprint in perpetuity.
The copyright holder for this preprint. http://dx.doi.org/10.1101/605451doi: bioRxiv preprint first posted online Apr. 10, 2019;

8
As shown above, global sequence identity between two proteins is indicative of shared
interaction interfaces, however, it likely fails to identify pairs of proteins whose shared interaction
interface is small. Indeed, 50% (502) of all pairs of proteins in HuRI with interaction profile
similarities ≥ 0.5 exhibit less than 20% sequence identity, showing that the functional
relationships between proteins cannot necessarily be identified by sequence identity. One such
pair of proteins is the endoplasmic reticulum (ER) transmembrane protein TMEM258 and the
uncharacterized protein C19ORF18, which display a sequence identity of only 10% but share
80% of their interactors (Fig. 2a, right panel). TMEM258 catalyzes the first step in N-
glycosylation of proteins in the ER and might play a role in protein translocation across the ER29.
Roles in protein transport and ER function have also been ascribed to two of the four shared
interaction partners, ARL6IP130 and IER3IP131, suggesting that C19ORF18 as well as the other
two shared yet unstudied interaction partners MFSD6 and AC012254.2 might contribute to ER-
related functions of protein maturation and transport.
Uncharted network neighborhoods of disease-related genes Unlike Lit-BM, HuRI was generated by systematically testing pairs of proteins for interaction.
While Lit-BM is highly biased towards the most highly studied genes10, HuRI covers the
genome-by-genome space, as ranked by number of publications, more uniformly and at
increased depth compared to Lit-BM and our previous screening efforts (Fig. 3a). Considering
these differences in interactome space coverage, we find that among the best-studied genes,
where Lit-BM is most complete, the agreement between Lit-BM and HuRI is highest, with ~40%
of the PPIs in HuRI being previously identified (Fig. 3b). Because of its uniform coverage, HuRI
substantially expands the set of genes of biomedical interest for which high-quality direct PPI
data is available (Fig. 3c, Extended Data Fig. 4g), and extends their network neighborhood to
previously uncharted regions of the protein interactome (Fig. 3d, Extended Data Fig. 4g).
As previously shown10,32, study bias can skew interactome coverage and the assessment of
systems properties of genes. Using HuRI, we find no evidence of reported correlations between
a protein’s number of interaction partners (degree) and various gene properties, i.e. lethality33,34,
loss-of-function intolerance1, fitness effect35, and age36,37 (Fig. 3e-g). Moreover, these
correlations weaken for protein complex and Lit-BM interactome maps when they are corrected
for confounding protein expression or study bias, respectively (Fig. 3e-g). These results
highlight the value of HuRI as a uniformly-mapped reference for the study of systems properties
of genes and networks.
.CC-BY-NC-ND 4.0 International licenseIt is made available under a (which was not peer-reviewed) is the author/funder, who has granted bioRxiv a license to display the preprint in perpetuity.
The copyright holder for this preprint. http://dx.doi.org/10.1101/605451doi: bioRxiv preprint first posted online Apr. 10, 2019;
9
Identification of subcellular compartment-specific roles of PPIs Proteins are localized to specific subcellular compartments to exert functions that can depend
both on the subcellular environment and the local PPI network. Despite available proteome-wide
datasets on the localization of individual proteins38, experimental determination of cellular
localization-specific PPI networks remains challenging39. We find that proteins localized to a
diverse range of subcellular compartments are evenly represented in HuRI (Fig. 4a) suggesting
that cellular localization-specific PPI networks can be inferred for many different cellular
compartments via integration of HuRI with available protein localization data.
One such compartment, extracellular vesicles (EVs), has been intensively studied using
proteomics approaches40, however, our understanding of the molecular mechanisms that lead
to protein recruitment into EVs and subsequent secretion, remains limited. The subnetwork of
interactions between EV proteins (Fig. 4b) shows significantly higher connectivity in HuRI than
in degree-controlled randomized networks (P < 0.001, one-sided empirical test) (Fig. 4c)
enabling prediction of EV recruiters using the number of EV interaction partners. Seven of the
top 20 most connected proteins in this EV network have established roles in EV biogenesis or
cargo recruitment41,42 (Fig. 4b). SDCBP (syntenin-1) functions in ESCRT-dependent exosome
generation and its knockout shows reduced EV production43. SDCBP has 48 PPIs with other EV
proteins and is frequently detected in EVs (Fig. 4b), suggesting that it regulates recruitment of
interacting proteins to EVs. To test this hypothesis (Fig. 4d), we knocked out SDCBP in the
U373vIII cell line (Extended Data Fig. 5a) and found that three of six SDCBP partners detected
in the U373vIII EV proteome, CALM1, CEP55 and HPRT1, displayed significantly reduced (P <
0.05, one-sided empirical test, fold change < 0.66) (Fig. 4e) protein levels in EVs in the SDCBP
knockout line. In contrast, only 15% of the non-interaction partners of SDCBP were reduced (P
< 0.05, one-sided empirical test) (Extended Data Fig. 5b). Thus, SDCBP may play a role in the
recruitment of proteins into EVs, highlighting the potential value of HuRI in studying protein
function within specific subcellular contexts.
Despite a significant tendency for interactions in HuRI to link proteins localized to the same
compartment (P < 0.01, one-sided empirical test) (Fig. 2b), a considerable number of
interactions were identified between proteins not reported to co-localize. We find that HuRI PPIs
between non-colocalized proteins tended to connect proteins from compartments that
significantly overlapped (P < 0.001, one-sided empirical test) (Extended Data Fig. 5c-e). This
suggests that the lack of co-localization results from incompleteness of the underlying
localization annotation and that HuRI could prove useful in predicting additional protein locations
and dynamics.
.CC-BY-NC-ND 4.0 International licenseIt is made available under a (which was not peer-reviewed) is the author/funder, who has granted bioRxiv a license to display the preprint in perpetuity.
The copyright holder for this preprint. http://dx.doi.org/10.1101/605451doi: bioRxiv preprint first posted online Apr. 10, 2019;

10
Principles of tissue-specific cellular function Despite recent advances in systematic genome-wide identification of tissue-preferentially
expressed genes (TiP genes)2,44, we lack a concrete understanding of how the surprisingly
small set of TiP genes operate together and coordinate their activity with the core housekeeping
cellular machinery to mediate tissue-specific functions. Insights can be obtained from
investigating the tissue-specific network context of TiP proteins, inferred from integrating protein
interactome data with tissue transcriptomes. However, we find that protein complex7–9 and
literature-curated interactome maps45 as well as our previously published binary PPI
datasets10,11 are strongly depleted for TiP proteins, whereas they are well-represented in HuRI,
making it the most suitable interactome map available to study the network context of TiP
proteins (Fig. 5a, Extended Data Fig. 6a).
System-wide properties of TiP proteins can be determined by assessing their connectivity
and centrality in a PPI network compared to “non-TiP” proteins46. In HuRI we observe that TiP
proteins can engage in as many PPIs and be as central in a PPI network as the more uniformly
expressed proteins (degree: Spearman ρ = 0.005, centrality: Spearman ρ = -0.008) (Extended
Data Fig. 6b), contrary to previous observations derived from literature-curated PPI networks47–
49. This result, paired with the fact that PPIs mediated by a TiP protein are effectively also
tissue-specific, leads to the finding that the protein interactome as characterized by HuRI is
more tissue-specific than the expressed genome (Fig. 5b). This indicates that substantial
information on tissue-specific function can only be obtained from the interactome. The opposite
is observed for Lit-BM, likely owing to its bias against TiP genes (Fig. 5b).
To investigate the local network neighborhoods of TiP proteins within their respective tissue
context, we used HuRI to derive protein interactome maps for 35 tissues2,50 (Supplementary
Table 14). Each contained an average of 25,000 PPIs that link proteins expressed in that tissue
(Extended Data Fig. 6c, d). Within each tissue PPI network, we focused on the interactions
involving at least one TiP protein (Fig. 5c). The TiP PPI networks show extensive interactions
between TiP proteins and non-TiP proteins, with very few TiP-TiP PPIs dispersed through the
network, as exemplified for brain (Fig. 5c, d). Indeed, TiP-TiP PPIs in brain are not enriched, nor
is the average shortest path among TiP proteins shorter than in degree-controlled randomized
networks (P > 0.05, empirical test) (Fig. 5e). Using either metric, TiP proteins were found to be
significantly close to each other in six of 35 tissues, in four of which signals were dominated by
clusters of specifically expressed keratins or late-cornified envelope proteins (Extended Data
Fig. 6e). Overall, these results provide support for a model in which tissue-specific functions
emerge through interactions between TiP proteins and more uniformly expressed members of
.CC-BY-NC-ND 4.0 International licenseIt is made available under a (which was not peer-reviewed) is the author/funder, who has granted bioRxiv a license to display the preprint in perpetuity.
The copyright holder for this preprint. http://dx.doi.org/10.1101/605451doi: bioRxiv preprint first posted online Apr. 10, 2019;
11
the basic cellular machinery, presumably modulating and adapting common cellular processes
for cellular context-specific needs51.
To further investigate functional roles of the identified interactions in HuRI between the basic
cellular machinery and preferentially expressed proteins, we selected apoptosis, a biological
process with known cell type and developmental stage-specific homeostatic roles52,53. We
predicted apoptosis-related functions for proteins based on an enrichment of known apoptosis
regulators in the protein network neighborhood (Supplementary Table 15). Among the ten most
significant predictions were five proteins with demonstrated roles in apoptosis (BCL2L254,
BCL2L155, LCN256, BCL2A157 and BCL2L1058) supporting the validity of the approach. Among
the genes with predicted apoptosis function were C6ORF222, OTUD6A, and NHSL2, three
uncharacterized and highly specifically expressed genes (Extended Data Fig. 6f, g). To test the
predicted role of the three genes in apoptosis, we assessed their impact on cell viability upon
over-expression. Abundance of OTUD6A negatively correlated with time-of-death after addition
of TRAIL (TNF-related apoptosis-inducing ligand, P = 0.012, two-sided, empirical test, n = 40
cells) (Extended Data Fig. 6h), contrary to expression of OTUD6A alone (Extended Data Fig.
6h, Supplementary Table 16). This suggests that OTUD6A participates in the apoptosis
pathway but is not itself an inducer of cell death. We found OTUD6A to interact with DYNLL1
and 2 (Extended Data Fig. 6i), two integral members of motor complexes that sequester
BCL2L11 and BMF, two “BH3-only” proteins, to the cytoskeleton thereby inhibiting their pro-
apoptotic function59,60. OTUD6A expression is generally repressed with low expression in
eosinophils61–63 (Extended Data Fig. 6f) and significant upregulation in response to Decitabine
treatment, a drug effective against acute myeloid leukemia63,64. Thus, OTUD6A might exert an
apoptosis sensitization function via transcriptional activation in a haematopoietic cellular context
(Extended Data Fig. 6i).
We were unable to generate a sufficient number of cells expressing C6ORF222 or NHSL2
to perform the cell death assay. However, C6ORF222 contains a BH3 domain65 that likely
mediates the binding to BCL2L2 and BCL2L1 identified in HuRI (Extended Data Fig. 6i). The
interaction between C6ORF222 and the apoptosis regulator MAPK9 identified in HuRI
(Extended Data Fig. 6i) was also reported in BioPlex (unpublished released BioPlex data8)
providing further support for a functional role of C6ORF222 in apoptosis, probably in a digestive
tract-specific cellular context (Extended Data Fig. 6g,i). OTUD6A and C6ORF222 represent two
examples of specifically expressed genes that might adapt the basic apoptosis machinery to
cellular context-specific needs.
.CC-BY-NC-ND 4.0 International licenseIt is made available under a (which was not peer-reviewed) is the author/funder, who has granted bioRxiv a license to display the preprint in perpetuity.
The copyright holder for this preprint. http://dx.doi.org/10.1101/605451doi: bioRxiv preprint first posted online Apr. 10, 2019;

12
Molecular mechanisms of tissue-specific Mendelian diseases
Many Mendelian diseases display highly tissue-specific phenotypes, which are rarely explained
by tissue-specific expression of genes carrying disease-associated mutations66,67 (Fig. 5f,
Extended Data Fig. 6j). Such mutations have been shown to broadly or specifically affect the
formation of PPIs involving the mutated protein68. Perturbations of PPIs between uniformly
expressed disease-associated proteins and TiP proteins in the corresponding affected tissues
have been suggested to underlie the tissue-specific phenotypes of those diseases67. Searching
the HuRI-derived tissue PPI networks, we find 130 such PPIs involving 63 distinct non-TiP
causal proteins and 94 TiP proteins (Fig. 5g). Although we do not observe a significant trend for
PPIs between causal proteins and TiP proteins to occur more often than in random networks
(Extended Data Fig. 6k), this does not rule out the possibility that perturbations of some of these
interactions mediate tissue-specific phenotypes of Mendelian diseases.
To further explore this hypothesis, we experimentally tested whether pathogenic variants
associated with the corresponding Mendelian diseases were able to perturb these PPIs. Of ten
causal proteins tested, seven showed perturbation of PPIs to preferentially expressed
interaction partners in the corresponding “disease tissues” (Fig. 5g-h, Extended Data Fig. 7,
Supplementary Table 17). One example is the gene PNKP, mutations in which have been
associated with microcephaly, seizures and developmental delay69. PNKP, a polynucleotide
kinase 3’-phosphatase, is involved in DNA damage repair69. The well-established pathogenic
mutation (Glu326Lys) affects neither the DNA kinase nor DNA phosphatase activity of PNKP,
rendering the mechanism of pathogenicity unclear70. We observed that Glu326Lys perturbed
PPIs with two partners preferentially expressed in the brain, SYNGR1 and TRIM37, whereas the
benign mutation Pro20Ser71 did not affect any of these PPIs (Fig. 5i). Interestingly, TRIM37 is
known to facilitate DNA repair72 suggesting a potential mechanism through which the
perturbation of this interaction might affect the brain-specific DNA repair function of PNKP.
In two other cases, CTNNA3 and SUCLA2, the identified TiP interaction partners TRIM54
and ARL6IP1, respectively, themselves cause similar diseases with overlapping symptoms73,74,
reinforcing the likely pathogenic relevance of the interactions. Overall, this study yields
hypotheses of molecular mechanisms for otherwise unexplained tissue-specific phenotypes of
seven Mendelian diseases (Fig. 5h) and demonstrates the utility of HuRI as a reference to study
biological mechanisms within specific disease contexts.
.CC-BY-NC-ND 4.0 International licenseIt is made available under a (which was not peer-reviewed) is the author/funder, who has granted bioRxiv a license to display the preprint in perpetuity.
The copyright holder for this preprint. http://dx.doi.org/10.1101/605451doi: bioRxiv preprint first posted online Apr. 10, 2019;

13
Exploration of isoform-specific protein function during development Transcripts of most human genes undergo alternative splicing, leading in many cases to altered
protein sequences. Due to loss or gain of protein interaction-mediating domains or linear motifs,
alternative isoforms of the same gene have been found to differ in their interaction profiles75,76.
Modulation of cellular function by alternative splicing is especially prevalent during
developmental processes and in some select adult tissues such as brain or testis77, yet most
alternative splice products remain uncharacterized. Although we screened only one isoform per
gene, HuRI is unique among available human protein interactome maps in providing information
about the exact full-length protein sequence of each interaction partner. To aid in the functional
characterization of alternative splice products, we aimed at identifying isoforms of a gene with a
dominant-negative effect on overall gene function. We combined HuRI with isoform-dependent
expression data78 to identify genes with isoforms expressed in the same tissue. These genes
were further filtered to identify those for which an alternative isoform was predicted to lose some
but not all of its interaction-mediating domains79, thus likely to lose some but not all of its
interaction partners compared to the isoform screened in HuRI76 (Fig. 6a).
Of the 192 candidate genes identified (involving known examples of altered alternative
isoform function, Supplementary Table 18), we further considered NCK2. NCK2 displayed a well
studied principal (long) isoform80,81 and an uncharacterized alternative (short) isoform in which
three of four predicted interaction-mediating domains are lost (Fig. 6b). Both isoforms are
expressed in brain, suggesting specific functional modulation by alternative splicing during brain
development (Fig. 6c, Extended Data Fig. 8a, Supplementary Table 19). Known brain-specific
functions of NCK2 include synaptic transmission82, organization of neuronal circuits83, and axon
guidance84,85. Interestingly, a variant associated with autism was found near a splice site of the
alternative exon of NCK2 further suggesting a functional implication of alternative splicing of
NCK2 in brain development86,87.
Pairwise testing interaction partners of the long isoform of NCK2 with the short isoform
confirms the loss of some but not all interaction partners (Fig. 6d) consistent with the retention
of one interaction-mediating domain in the short isoform (Fig. 6b). We used zebrafish as a
model to test the hypothesized dominant-negative function of the short isoform over the long
isoform of NCK2 during brain development (Extended Data Fig. 8b-d). We successfully knocked
down both isoforms of zNCK2B in zebrafish using morpholinos (Extended Data Fig. 8e) to
measure the impact of loss of zNCK2B on the size of the developing zebrafish brain. While
expression of the hNCK2 long isoform in zebrafish under knockdown condition of the
endogenous zNCK2B gene partially rescued the phenotype, expression of the short isoform did
.CC-BY-NC-ND 4.0 International licenseIt is made available under a (which was not peer-reviewed) is the author/funder, who has granted bioRxiv a license to display the preprint in perpetuity.
The copyright holder for this preprint. http://dx.doi.org/10.1101/605451doi: bioRxiv preprint first posted online Apr. 10, 2019;

14
not (Fig. 6e, Extended Data Fig. 8f, g). Furthermore, expression of the short isoform of hNCK2
in zebrafish brain led to a significant decrease in the size of the developing zebrafish brain, an
effect that was not observed with expression of the long isoform of hNCK2 (Fig. 6e). These
observations support the predicted dominant negative effect of the short isoform of NCK2 and
highlight the power of HuRI to serve as a reference to study isoform-specific protein function in
a developmental cellular context.
Perspectives By systematically screening about 90% of the protein-coding genome for binary PPIs using a
panel of Y2H assays, we generated HuRI, a first reference map of the human protein
interactome. Via integration of HuRI with contextual genome, transcriptome and proteome data,
we infer cellular context-specific PPI networks that prove to be powerful resources in delineating
aspects of cellular context-specific function and organization. Inferred cellular context-specific
interactome maps will further gain in accuracy from advances in transcriptomics and proteomics
technologies with increasing sensitivities down to the single cell level4. Transition from discrete
(presence/absence) towards more continuous network models may be achieved by using
expression levels to assign weights to interactions88, and further improved with large-scale
measurements of interaction strengths9. Integration of inferred cellular context-specific networks
with experimentally-derived cellular context-specific molecular interaction data89 will be critical to
further refine those models. Future efforts to generate binary protein interactome maps will
benefit from development of new PPI assays16 capable of identifying PPIs for the proteins still
absent from HuRI. New cloning and faster screening technologies90,91 are needed to take
interactome mapping from testing one isoform per gene to the ensemble of proteoforms
generated within the cell. Although multiple challenges remain to be solved for a complete and
context-specific map of protein functions, interactions, and higher-level organization, HuRI
provides an unbiased genome-scale scaffold with which to coordinate this information as it
emerges.
1. Lek, M. et al. Analysis of protein-coding genetic variation in 60,706 humans. Nature 536,
285–291 (2016).
2. Melé, M. et al. The human transcriptome across tissues and individuals. Science 348,
660–665 (2015).
3. FANTOM Consortium and the RIKEN PMI and CLST (DGT). A promoter-level mammalian
expression atlas. Nature 507, 462–470 (2014).
.CC-BY-NC-ND 4.0 International licenseIt is made available under a (which was not peer-reviewed) is the author/funder, who has granted bioRxiv a license to display the preprint in perpetuity.
The copyright holder for this preprint. http://dx.doi.org/10.1101/605451doi: bioRxiv preprint first posted online Apr. 10, 2019;

15
4. Regev, A. et al. The human cell atlas. eLife 6, e27041 (2017).
5. Lander, E. S. et al. Initial sequencing and analysis of the human genome. Nature 409,
860–921 (2001).
6. Venter, J. C. et al. The sequence of the human genome. Science 291, 1304–1351 (2001).
7. Wan, C. et al. Panorama of ancient metazoan macromolecular complexes. Nature 525,
339–344 (2015).
8. Huttlin, E. L. et al. Architecture of the human interactome defines protein communities and
disease networks. Nature 545, 505–509 (2017).
9. Hein, M. Y. et al. A human interactome in three quantitative dimensions organized by
stoichiometries and abundances. Cell 163, 712–723 (2015).
10. Rolland, T. et al. A proteome-scale map of the human interactome network. Cell 159,
1212–1226 (2014).
11. Rual, J.-F. et al. Towards a proteome-scale map of the human protein-protein interaction
network. Nature 437, 1173–1178 (2005).
12. Stelzl, U. et al. A human protein-protein interaction network: a resource for annotating the
proteome. Cell 122, 957–968 (2005).
13. Uhlén, M. et al. Tissue-based map of the human proteome. Science 347, 1260419 (2015).
14. Braun, P. et al. An experimentally derived confidence score for binary protein-protein
interactions. Nat. Methods 6, 91–97 (2009).
15. Chen, Y.-C., Rajagopala, S. V., Stellberger, T. & Uetz, P. Exhaustive benchmarking of the
yeast two-hybrid system. Nat. Methods 7, 667–668 (2010).
16. Choi, S. G. et al. Towards an ″assayome″ for binary interactome mapping. bioRxiv 530790
(2019).
17. Cusick, M. E. et al. Literature-curated protein interaction datasets. Nat. Methods 6, 39–46
(2009).
18. Eyckerman, S. et al. Design and application of a cytokine-receptor-based interaction trap.
Nat. Cell Biol. 3, 1114–1119 (2001).
19. Cassonnet, P. et al. Benchmarking a luciferase complementation assay for detecting
protein complexes. Nat. Methods 8, 990–992 (2011).
20. Berman, H. M. et al. The protein data bank. Nucleic Acids Res. 28, 235–242 (2000).
21. Mosca, R., Céol, A. & Aloy, P. Interactome3D: adding structural details to protein
networks. Nat. Methods 10, 47–53 (2013).
22. Giurgiu, M. et al. CORUM: the comprehensive resource of mammalian protein complexes-
2019. Nucleic Acids Res. 47, D559–D563 (2019).
.CC-BY-NC-ND 4.0 International licenseIt is made available under a (which was not peer-reviewed) is the author/funder, who has granted bioRxiv a license to display the preprint in perpetuity.
The copyright holder for this preprint. http://dx.doi.org/10.1101/605451doi: bioRxiv preprint first posted online Apr. 10, 2019;
16
23. Baccon, J., Pellizzoni, L., Rappsilber, J., Mann, M. & Dreyfuss, G. Identification and
characterization of Gemin7, a novel component of the survival of motor neuron complex.
J. Biol. Chem. 277, 31957–31962 (2002).
24. Tompa, P., Davey, N. E., Gibson, T. J. & Babu, M. M. A million peptide motifs for the
molecular biologist. Mol. Cell 55, 161–169 (2014).
25. Leid, M. et al. Purification, cloning, and RXR identity of the HeLa cell factor with which
RAR or TR heterodimerizes to bind target sequences efficiently. Cell 68, 377–395 (1992).
26. Willy, P. J. et al. LXR, a nuclear receptor that defines a distinct retinoid response pathway.
Genes Dev. 9, 1033–1045 (1995).
27. Kovács, I. A. et al. Network-based prediction of protein interactions. Nat. Commun. 10,
1240 (2019).
28. Baryshnikova, A. Systematic functional annotation and visualization of biological networks.
Cell Syst. 2, 412–421 (2016).
29. Graham, D. B. et al. TMEM258 is a component of the oligosaccharyltransferase complex
controlling ER stress and intestinal inflammation. Cell Rep. 17, 2955–2965 (2016).
30. Yamamoto, Y., Yoshida, A., Miyazaki, N., Iwasaki, K. & Sakisaka, T. Arl6IP1 has the
ability to shape the mammalian ER membrane in a reticulon-like fashion. Biochem. J. 458,
69–79 (2014).
31. Abdel-Salam, G. M. H. et al. A homozygous IER3IP1 mutation causes microcephaly with
simplified gyral pattern, epilepsy, and permanent neonatal diabetes syndrome (MEDS).
Am. J. Med. Genet. A. 158A, 2788–2796 (2012).
32. Yu, H. et al. High-quality binary protein interaction map of the yeast interactome network.
Science 322, 104–110 (2008).
33. Jeong, H., Mason, S. P., Barabási, A. L. & Oltvai, Z. N. Lethality and centrality in protein
networks. Nature 411, 41–42 (2001).
34. Smith, C. L. et al. Mouse Genome Database (MGD)-2018: knowledgebase for the
laboratory mouse. Nucleic Acids Res. 46, D836–D842 (2018).
35. Pan, J. et al. Interrogation of mammalian protein complex structure, function, and
membership using genome-scale fitness screens. Cell Syst. 6, 555-568.e7 (2018).
36. Capra, J. A., Williams, A. G. & Pollard, K. S. ProteinHistorian: tools for the comparative
analysis of eukaryote protein origin. PLoS Comput. Biol. 8, e1002567 (2012).
37. Rito, T., Deane, C. M. & Reinert, G. The importance of age and high degree, in protein-
protein interaction networks. J. Comput. Biol. 19, 785–795 (2012).
38. Thul, P. J. et al. A subcellular map of the human proteome. Science 356, (2017).
.CC-BY-NC-ND 4.0 International licenseIt is made available under a (which was not peer-reviewed) is the author/funder, who has granted bioRxiv a license to display the preprint in perpetuity.
The copyright holder for this preprint. http://dx.doi.org/10.1101/605451doi: bioRxiv preprint first posted online Apr. 10, 2019;
17
39. Youn, J.-Y. et al. High-density proximity mapping reveals the subcellular organization of
mRNA-associated granules and bodies. Mol. Cell 69, 517-532 (2018).
40. Kim, D.-K. et al. EVpedia: a community web portal for extracellular vesicles research.
Bioinformatics 31, 933–939 (2015).
41. Hessvik, N. P. & Llorente, A. Current knowledge on exosome biogenesis and release.
Cell. Mol. Life Sci. 75, 193–208 (2018).
42. Fader, C. M., Sánchez, D. G., Mestre, M. B. & Colombo, M. I. TI-VAMP/VAMP7 and
VAMP3/cellubrevin: two v-SNARE proteins involved in specific steps of the
autophagy/multivesicular body pathways. Biochim. Biophys. Acta 1793, 1901–1916
(2009).
43. Imjeti, N. S. et al. Syntenin mediates SRC function in exosomal cell-to-cell communication.
Proc. Natl. Acad. Sci. U. S. A. 114, 12495–12500 (2017).
44. Sonawane, A. R. et al. Understanding tissue-specific gene regulation. Cell Rep. 21, 1077–
1088 (2017).
45. Calderone, A., Castagnoli, L. & Cesareni, G. Mentha: a resource for browsing integrated
protein-interaction networks. Nat. Methods 10, 690–691 (2013).
46. Barabási, A.-L. & Oltvai, Z. N. Network biology: understanding the cell’s functional
organization. Nat. Rev. Genet. 5, 101–113 (2004).
47. Kiran, M. & Nagarajaram, H. A. Global versus local hubs in human protein-protein
interaction network. J. Proteome Res. 12, 5436–5446 (2013).
48. Lin, W.-H., Liu, W.-C. & Hwang, M.-J. Topological and organizational properties of the
products of house-keeping and tissue-specific genes in protein-protein interaction
networks. BMC Syst. Biol. 3, 32 (2009).
49. Yang, L. et al. Comparative analysis of housekeeping and tissue-selective genes in
human based on network topologies and biological properties. Mol. Genet. Genomics 291,
1227–1241 (2016).
50. Paulson, J. N. et al. Tissue-aware RNA-Seq processing and normalization for
heterogeneous and sparse data. BMC Bioinformatics 18, 437 (2017).
51. Bossi, A. & Lehner, B. Tissue specificity and the human protein interaction network. Mol.
Syst. Biol. 5, 260 (2009).
52. Singh, R., Letai, A. & Sarosiek, K. Regulation of apoptosis in health and disease: the
balancing act of BCL-2 family proteins. Nat. Rev. Mol. Cell Biol. 20, 175–193 (2019).
53. Bouillet, P. et al. Proapoptotic Bcl-2 relative Bim required for certain apoptotic responses,
leukocyte homeostasis, and to preclude autoimmunity. Science 286, 1735–1738 (1999).
.CC-BY-NC-ND 4.0 International licenseIt is made available under a (which was not peer-reviewed) is the author/funder, who has granted bioRxiv a license to display the preprint in perpetuity.
The copyright holder for this preprint. http://dx.doi.org/10.1101/605451doi: bioRxiv preprint first posted online Apr. 10, 2019;

18
54. Huang, S., Tang, R. & Poon, R. Y. C. BCL-W is a regulator of microtubule inhibitor-
induced mitotic cell death. Oncotarget 7, 38718–38730 (2016).
55. Chao, D. T. et al. Bcl-XL and Bcl-2 repress a common pathway of cell death. J. Exp. Med.
182, 821–828 (1995).
56. Xu, G. et al. Lipocalin-2 induces cardiomyocyte apoptosis by increasing intracellular iron
accumulation. J. Biol. Chem. 287, 4808–4817 (2012).
57. D’Sa-Eipper, C. & Chinnadurai, G. Functional dissection of Bfl-1, a Bcl-2 homolog: anti-
apoptosis, oncogene-cooperation and cell proliferation activities. Oncogene 16, 3105–
3114 (1998).
58. Zhai, D. et al. Characterization of the anti-apoptotic mechanism of Bcl-B. Biochem. J. 376,
229–236 (2003).
59. Puthalakath, H. et al. Bmf: a proapoptotic BH3-only protein regulated by interaction with
the myosin V actin motor complex, activated by anoikis. Science 293, 1829–1832 (2001).
60. Puthalakath, H., Huang, D. C., O’Reilly, L. A., King, S. M. & Strasser, A. The proapoptotic
activity of the Bcl-2 family member Bim is regulated by interaction with the dynein motor
complex. Mol. Cell 3, 287–296 (1999).
61. Adams, D. et al. BLUEPRINT to decode the epigenetic signature written in blood. Nat.
Biotechnol. 30, 224–226 (2012).
62. Stunnenberg, H. G., International Human Epigenome Consortium & Hirst, M. The
International Human Epigenome Consortium: a blueprint for scientific collaboration and
discovery. Cell 167, 1145–1149 (2016).
63. Petryszak, R. et al. Expression Atlas update - an integrated database of gene and protein
expression in humans, animals and plants. Nucleic Acids Res. 44, D746-752 (2016).
64. Purcell, M., Kruger, A. & Tainsky, M. A. Gene expression profiling of replicative and
induced senescence. Cell Cycle 13, 3927–3937 (2014).
65. DeBartolo, J., Taipale, M. & Keating, A. E. Genome-wide prediction and validation of
peptides that bind human prosurvival Bcl-2 proteins. PLoS Comput. Biol. 10, e1003693
(2014).
66. Barshir, R. et al. Role of duplicate genes in determining the tissue-selectivity of hereditary
diseases. PLoS Genet. 14, e1007327 (2018).
67. Barshir, R., Shwartz, O., Smoly, I. Y. & Yeger-Lotem, E. Comparative analysis of human
tissue interactomes reveals factors leading to tissue-specific manifestation of hereditary
diseases. PLoS Comput. Biol. 10, e1003632 (2014).
68. Sahni, N. et al. Widespread macromolecular interaction perturbations in human genetic
.CC-BY-NC-ND 4.0 International licenseIt is made available under a (which was not peer-reviewed) is the author/funder, who has granted bioRxiv a license to display the preprint in perpetuity.
The copyright holder for this preprint. http://dx.doi.org/10.1101/605451doi: bioRxiv preprint first posted online Apr. 10, 2019;
19
disorders. Cell 161, 647–660 (2015).
69. Shen, J. et al. Mutations in PNKP cause microcephaly, seizures and defects in DNA
repair. Nat. Genet. 42, 245–249 (2010).
70. Reynolds, J. J., Walker, A. K., Gilmore, E. C., Walsh, C. A. & Caldecott, K. W. Impact of
PNKP mutations associated with microcephaly, seizures and developmental delay on
enzyme activity and DNA strand break repair. Nucleic Acids Res. 40, 6608–6619 (2012).
71. Landrum, M. J. et al. ClinVar: improving access to variant interpretations and supporting
evidence. Nucleic Acids Res. 46, D1062–D1067 (2018).
72. Bhatnagar, S. et al. TRIM37 is a new histone H2A ubiquitin ligase and breast cancer
oncoprotein. Nature 516, 116–120 (2014).
73. Olivé, M. et al. New cardiac and skeletal protein aggregate myopathy associated with
combined MuRF1 and MuRF3 mutations. Hum. Mol. Genet. 24, 3638–3650 (2015).
74. Novarino, G. et al. Exome sequencing links corticospinal motor neuron disease to
common neurodegenerative disorders. Science 343, 506–511 (2014).
75. Corominas, R. et al. Protein interaction network of alternatively spliced isoforms from brain
links genetic risk factors for autism. Nat. Commun. 5, 3650 (2014).
76. Yang, X. et al. Widespread expansion of protein interaction capabilities by alternative
splicing. Cell 164, 805–817 (2016).
77. Yeo, G., Holste, D., Kreiman, G. & Burge, C. B. Variation in alternative splicing across
human tissues. Genome Biol. 5, R74 (2004).
78. Irimia, M. et al. A highly conserved program of neuronal microexons is misregulated in
autistic brains. Cell 159, 1511–1523 (2014).
79. Mosca, R., Céol, A., Stein, A., Olivella, R. & Aloy, P. 3did: a catalog of domain-based
interactions of known three-dimensional structure. Nucleic Acids Res. 42, D374-379
(2014).
80. Bladt, F. et al. The murine Nck SH2/SH3 adaptors are important for the development of
mesoderm-derived embryonic structures and for regulating the cellular actin network. Mol.
Cell. Biol. 23, 4586–4597 (2003).
81. Ngoenkam, J. et al. Non-overlapping functions of Nck1 and Nck2 adaptor proteins in T cell
activation. Cell Commun. Signal. 12, 21 (2014).
82. Thévenot, E. et al. P21-Activated Kinase 3 (PAK3) protein regulates synaptic transmission
through its interaction with the Nck2/Grb4 protein adaptor. J. Biol. Chem. 286, 40044–
40059 (2011).
83. Fawcett, J. P. et al. Nck adaptor proteins control the organization of neuronal circuits
.CC-BY-NC-ND 4.0 International licenseIt is made available under a (which was not peer-reviewed) is the author/funder, who has granted bioRxiv a license to display the preprint in perpetuity.
The copyright holder for this preprint. http://dx.doi.org/10.1101/605451doi: bioRxiv preprint first posted online Apr. 10, 2019;
20
important for walking. Proc. Natl. Acad. Sci. U. S. A. 104, 20973–20978 (2007).
84. Wegmeyer, H. et al. EphA4-dependent axon guidance is mediated by the RacGAP
alpha2-chimaerin. Neuron 55, 756–767 (2007).
85. Cowan, C. A. & Henkemeyer, M. The SH2/SH3 adaptor Grb4 transduces B-ephrin reverse
signals. Nature 413, 174–179 (2001).
86. Hyung, D., Kim, J., Cho, S. Y. & Park, C. ASpedia: a comprehensive encyclopedia of
human alternative splicing. Nucleic Acids Res. 46, D58–D63 (2018).
87. Xiong, H. Y. et al. RNA splicing. The human splicing code reveals new insights into the
genetic determinants of disease. Science 347, 1254806 (2015).
88. Celaj, A. et al. Quantitative analysis of protein interaction network dynamics in yeast. Mol.
Syst. Biol. 13, 934 (2017).
89. Skinnider, M. A. et al. An atlas of protein-protein interactions across mammalian tissues.
bioRxiv 351247 (2018).
90. Yachie, N. et al. Pooled-matrix protein interaction screens using Barcode Fusion Genetics.
Mol. Syst. Biol. 12, 863 (2016).
91. Weile, J. et al. A framework for exhaustively mapping functional missense variants. Mol.
Syst. Biol. 13, 957 (2017).
Acknowledgements We thank Pablo Porras Millan and the IntAct team for their help in
disseminating our PPI data via IntAct, pre- and post-publication. We thank Ulrich Braunschweig,
Jonathan Ellis, and Benjamin J. Blencowe for sharing isoform-resolved expression data and
discussions on NCK2. We also thank Qian Zhu and Olga G. Troyanskaya as well as Joshua
Pan and Cigall Kadoch for sharing co-expression and co-fitness data, respectively. We thank
Katharine S. Tuttle for help with graphics. This work was primarily supported by the National
Institute of Health (NIH) National Human Genome Research Institute (NHGRI) grant
U41HG001715 (M.V., F.P.R., D.E.H., M.A.C., G.D.B, J.T.) with additional support from NIH
grants P50HG004233 (M.V. and F.P.R.), U01HL098166 (M.V.), U01HG007690 (M.V.),
R01GM109199 (M.A.C.), a Canadian Institute for Health Research (CIHR) Foundation Grant
(F.P.R.), the Canada Excellence Research Chairs Program (F.P.R.) and an American Heart
Association grant 15CVGPS23430000 (M.V.). D.K. was supported by a Banting Postdoctoral
Fellowship through the Natural Sciences and Engineering Research Council (NSERC) of
Canada and by the Basic Science Research Program through the National Research
Foundation (NRF) of Korea funded by the Ministry of Education (2017R1A6A3A03004385).
G.M.S. was supported by NIH Training Grant T32CA009361. M.V. is a Chercheur Qualifié
.CC-BY-NC-ND 4.0 International licenseIt is made available under a (which was not peer-reviewed) is the author/funder, who has granted bioRxiv a license to display the preprint in perpetuity.
The copyright holder for this preprint. http://dx.doi.org/10.1101/605451doi: bioRxiv preprint first posted online Apr. 10, 2019;
21
Honoraire from the Fonds de la Recherche Scientifique (FRS-FNRS, Wallonia-Brussels
Federation, Belgium).
Author contributions The project was conceived and supervised by G.D.B., J.T., D.E.H., M.V.,
F.P.R. and M.A.C. The Y2H assay versions were developed and benchmarked by K.S., A.D.R.,
and Q.Z. with help from K.L., B.E.B. and D.B. hORFeome v9.1 was generated by K.L., D.-K.K.,
K.S., W.B., M.D., D.B., D.M., and T.H. with help from A.G.C., A.Dr., A.M., S.R., Y.S., G.M.S., J.-
C.T. and X.Y. The preparation of Y2H destination clones by en masse gateway cloning and
yeast transformations were performed by D.-K.K., K.S., A.G.C., J.J.K., R.L., D.M. with help from
M.G., D.S., S.S., B.T., C.C., G.H., N.v.L., A.R., and J.W. The Y2H screens were performed and
the data analyzed by K.L., K.S., B.E.B., M.D., A.Dr., M.F.H., C.Pol., S.S., B.T., A.T., and T.H.
with help from W.B., T.C., B.C., A.De., D.B., S.-F.C., A.M., D.M., J.Ras., A.S.M., Y.S. and Y.W.
The validation experiments were performed and the data analyzed by T.C., A.De., I.L., S.G.C.,
and T.H. with help from K.L., L.L., K.S., D.B., S.D.R., Y.J., Y.K., S.R. and J.T. Sequencing and
analysis of the sequencing data was performed by W.B., A.G.C., M.G., N.K., J.K., J.C.M., Y.S.
and T.H. with help from K.L., D.-K.K., M.B., C.C., A.G., R.L., A.R., M.T., and J.W. Integrative
downstream analyses were performed by K.L., D.-K.K., L.L., F.J.C.-L., I.A.K., and C.Pon. with
help from B.C., O.B., G.C., D.D.R., M.D.-F., F.G., G.H., J.N.P., T.R., E.S., E.Y.-L., Y.X., P.A.
and J.D.L.R. Follow-up experiments and analysis were performed by K.L., D.-K.K., K.S., R.B.,
D.C., S.D., A.De. and A.Y. with help from L.L., T.C., C.B.-C., G.C., C.D.A., H.E., L.G., E.H.,
S.La. and R.J.W. supervised by S.G., J.Rak. and V.T. The webportal was developed by M.W.M.
with help from K.L., M.H., T.H., M.A.C. and G.D.B. The paper was written by K.L., D.-K.K., L.L.,
K.S., D.E.H., M.V., F.P.R., and M.A.C. with help from F.J.C.-L., A.G.C., G.C., S.G., I.A.K., T.H,
and A.Y. Authors other than co-first and co-corresponding are listed alphabetically and
contributed equally within their group.
Competing interests J.C.M. is a founder and CEO of seqWell, Inc; F.P.R. is a founder of
seqWell, Inc.; F.P.R. and M.V. serve as Scientific Advisors of seqWell, Inc.
Correspondence and requests for materials should be addressed to M.A.C., F.P.R., M.V., or
D.E.H.
.CC-BY-NC-ND 4.0 International licenseIt is made available under a (which was not peer-reviewed) is the author/funder, who has granted bioRxiv a license to display the preprint in perpetuity.
The copyright holder for this preprint. http://dx.doi.org/10.1101/605451doi: bioRxiv preprint first posted online Apr. 10, 2019;
22
METHODS
Construction of Reference ORFeome and definition of screening space (space III)
Selection of existing clones
We supplemented our human ORFeome collection hORFeome version 7.1 (v7.1)
(http://horfdb.dfci.harvard.edu/hv7)92 with clones from additional genes from the ORFeome
Collaboration93 (http://www.orfeomecollaboration.org), DNASU plasmid repository94
(https://dnasu.org) and other collaborators. All clones are in Gateway compatible entry vectors
with spectinomycin or kanamycin resistance markers, as appropriate. While native stop codons
of most clones have been removed, 617 clones contain native stop codons.
To select a single Open Reading Frame (ORF) for genes with multiple ORFs available,
for each gene, we aligned the sequences of the corresponding ORFs to human genome
GRCh37 using BLAT95 (v36x1) and chose the longest ORF with more than 95% of its sequence
aligned to the genome. If no such ORF was available, we chose the ORF with the highest
percentage of alignment to the genome.
Cloning of new ORFs
After collecting available ORFs from different resources, about ~3,000 human protein-coding
genes remained uncovered (no ORF available). To obtain ORF clones for these missing genes,
we attempted RT-PCR on a pool of cDNA libraries from brain, heart, and liver ordered from
Biochain (Human Adult Normal Tissue: Brain, catalog number C1234035, lot number C203351;
Human Adult Normal Tissue: Heart, catalog number C1234122, lot number B901100; Human
Adult Normal Tissue: Liver, catalog number C1234149, lot number C203352). We designed
primers for all the missing genes for which we could find coding sequences from RefSeq96
(https://www.ncbi.nlm.nih.gov/refseq; downloaded April 13th, 2015). In total, we attempted 2,257
primer pairs and successfully cloned 481 ORFs into pDONR223 vector, all without native stops.
The sequences of the clones were verified using Illumina sequencing. We named the combined
collection hORFeome v9.1.
.CC-BY-NC-ND 4.0 International licenseIt is made available under a (which was not peer-reviewed) is the author/funder, who has granted bioRxiv a license to display the preprint in perpetuity.
The copyright holder for this preprint. http://dx.doi.org/10.1101/605451doi: bioRxiv preprint first posted online Apr. 10, 2019;

23
Definition of the human protein-coding genome
GENCODE97 annotation (ftp://ftp.sanger.ac.uk/pub/gencode/Gencode_human/release_27) and
DNA and protein sequences were filtered for information on transcript entries. After removing
PseudoAutosomal Regions on the Y chromosome (PAR) genes, all genes of gene_type
“protein_coding” with annotated transcripts yielded the 19,818 protein-coding genes used in this
study. External datasets were mapped via gene or protein IDentifiers (IDs) to the Ensembl gene
ID space, and genes, proteins, or transcripts that did not map were removed.
Mapping of ORFs to GENCODE release 27
To assign Ensembl gene IDs to ORFs in the hORFeome v9.1 collection, we aligned ORFs to
protein-coding transcripts in GENCODE97 and determined the best match for each ORF-
transcript pair. Briefly, ORF protein sequences were aligned to all protein sequences of protein-
coding transcripts using BLASTP98 (NCBI BLAST v2.2.30) with default parameters. Alignments
were further refined using MUSCLE99 (v3.8.31; default parameters). For each Ensembl gene,
we kept only alignments with identity ≥ 95%, ORF coverage ≥ 50%, transcript coverage either ≥
50% or with at least two exons covered. The best match was determined based on the
combination of ORF coverage, transcript coverage and alignment identity.
Each ORF could generally be assigned to only one Ensembl gene, but where alignments
were fully identical among different genes (e.g. histones), the ORF was assigned to multiple
genes. Finally, we removed 33 ORFs containing known disease mutations based on HGMD100
v2016 annotation. Using this pipeline, hORFeome v9.1 was matched to 17,408 protein-coding
genes (Supplementary Table 20).
Generation and benchmarking of Yeast Two-Hybrid (Y2H) assay versions
Vector design
To generate pDest-AD-AR67 [Activation Domain (AD) at C-terminus (C-term) with yeast
centromere (CEN)], a fragment encoding an ADH1 promoter, Gateway recombination cassette,
and C-terminal AD was PCR amplified from pGADCg101 using forward primer AP36 (5’
GAAGGCTTTAATTTGCAAAGCTCGGGATCCGGGCCCCCCCTCGAGATCCGcatctattgaagtaat
aataggcgcatg 3’) and reverse primer AP37 (5’
CAACCTTGATTGGAGACTTGACCAAACCTCTGGCGAAGAAGTCCAAAGCTctgaataagccctcgt
aatatattttcatg 3’) and cloned into EcoRI (New England Biolabs, NEB) and SalI (NEB) digested
.CC-BY-NC-ND 4.0 International licenseIt is made available under a (which was not peer-reviewed) is the author/funder, who has granted bioRxiv a license to display the preprint in perpetuity.
The copyright holder for this preprint. http://dx.doi.org/10.1101/605451doi: bioRxiv preprint first posted online Apr. 10, 2019;

24
pDEST-AD via homologous recombination gap repair in yeast. To generate pDest-AD-AR68
(AD at Cterm with yeast 2µ), the same fragment encoding the ADH1 promoter, Gateway
recombination cassette, and C-terminal AD was instead PCR amplified from pGADCg using
forward primer AP36 and reverse primer AP38 (5’
GCTGCATGTGTCAGAGGTTTTCACCGTCATCACCGAAACGCGCGAGGCAGcatctattgaagtaat
aataggcgcatg 3’) and cloned into NotI- and XmaI-digested (NEB) pDest-AD-QZ213 via
homologous recombination in yeast. See Supplementary Table 21 for details on vector design
and Y2H assay versions.
Benchmarking pairwise test performance
Assay versions were benchmarked by Y2H using a positive reference set of 92 well-
documented interacting human protein pairs (Positive Reference Set; PRS v1) and a set of 92
random human protein pairs (Random Reference Set; RRS v1), as previously described14.
Briefly, haploid yeast strains Y8800 and Y8930 carrying plasmids expressing AD and DB
reference set fusions, respectively, were mated overnight and diploid selection was performed.
Diploids were spotted onto Synthetic Complete media without Leucine, Tryptophan and
Histidine with 1 mM 3-Amino-1,2,4-triazole (SC-Leu-Trp-His+1 mM 3AT for assay versions 1 &
2) or SC-Leu-Trp-His+10 mM 3AT (for assay version 3) solid media, incubated at 30oC for 4
days, and interactions were scored based on the strength of GAL1::HIS3@LYS2 reporter
activation. Pairs that displayed AD-independent GAL1::HIS3@LYS2 autoactivation were
designated as negatives.
Benchmarking screening capabilities of Y2H assay versions on a test space
For each assay version we performed several screens of a test space10 covering ~1% of the
total space (~2,000 DB’s against ~2,000 AD’s) to adjust the protocol for high-throughput
screening. Based on that, we were able to calculate how many screens per assay version are
needed to reach saturation and how many new pairs are found by screening a space several
times. For Y2H assay version 1, 2 and 3, we performed 12, 3, and 6 screens, respectively. The
screens were performed and validated as described below in the Y2H screening, retest, and
validation sections.
.CC-BY-NC-ND 4.0 International licenseIt is made available under a (which was not peer-reviewed) is the author/funder, who has granted bioRxiv a license to display the preprint in perpetuity.
The copyright holder for this preprint. http://dx.doi.org/10.1101/605451doi: bioRxiv preprint first posted online Apr. 10, 2019;
25
Subcloning into Y2H vectors
Preparation of Y2H destination clones by 1-to-1 Gateway cloning
ORFs from the hORFeome v9.1 collection were transferred by Gateway recombinational cloning
(Invitrogen) into Y2H destination vectors pDEST-DB and pDEST-AD-CYH2 to generate DB and
AD-hybrid proteins (DB-ORF and AD-ORF, respectively), as described previously102. In addition,
all ORFs were transferred into pDest-AD-QZ213 for assay version 2 and all ORFs without a
stop codon into pDest-AD-AR68 for assay version 3.
Preparation of Y2H destination clones by en masse Gateway cloning
To increase the throughput and efficiency of the cloning, we transferred the majority of the
clones into the pDest-AD-AR68 vector en masse. To enable future use in the barcode fusion
genetics Y2H system90. As described previously90,91, we generated randomly barcoded Y2H
destination plasmid pools and carried out en masse Gateway LR reactions, bacterial
transformations, colony pickings, and sequencing to identify ORFs and barcodes. After
obtaining the raw sequencing reads, we ran Illumina bcl2fastq (v2.20 with options “--no-lane-
splitting -r 3 -p 10 -w 3”) to demultiplex all the reads into different plates according to the i5/i7
index sequences. Extracting well-tag from each read, identified by locating conserved flank
sequences, allowed assignment of reads from each plate to the corresponding well of origin.
Full length (24-26 nt) barcodes within one base-pair mismatch were merged to identify the
dominant barcode for each well. ORF reads in each well were aligned to reference ORF
sequences via Bowtie 2103 (v2.2.3). For wells containing more than one clone, we filtered all the
ORF and barcode pairs found in each well by calculating the percentage of reads aligned to
each ORF. Only dominant barcoded-ORFs were selected, as defined by the ORF with the
highest fraction of reads (at least, 20 reads and 20%) and ≥5X more reads than those for the
second dominant ORF. About 1% of clones were validated by Sanger sequencing with ≥95%
validation rate.
Primary screening
Yeast strains and transformation
Competent yeast strains Y8800, mating type MATa, and Y8930, mating type MATa, both
harboring the genotype leu2-3,112 trp1-901 his3Δ200 ura3-52 gal4Δ gal80Δ GAL2::ADE2
GAL1::HIS3@LYS2 GAL7::lacZ@MET2cyh2R were transformed with individual AD-ORF and
.CC-BY-NC-ND 4.0 International licenseIt is made available under a (which was not peer-reviewed) is the author/funder, who has granted bioRxiv a license to display the preprint in perpetuity.
The copyright holder for this preprint. http://dx.doi.org/10.1101/605451doi: bioRxiv preprint first posted online Apr. 10, 2019;
26
DB-ORF constructs respectively, and plated onto SC-Trp or SC-Leu to select for AD-ORF or
DB-ORF plasmids102.
Auto-activator identification and removal
Prior to Y2H screening, haploid DB-ORF yeast strains were tested for auto-activation of the
GAL1::HIS3 reporter gene in the absence of any AD-ORF plasmid. Individual DB-ORF yeast
strains showing growth in a spotting assay on SC-His-Leu+3AT media were considered auto-
activators and removed from the collection of strains to be screened.
Y2H screening
Fresh overnight cultures of individual Y8930:DB-ORF yeast strains (bait) were mated against
Y8800:AD-ORF libraries containing ~1,000 different Y8800:AD-ORF yeast strains (prey). After
overnight growth at 30ºC in liquid rich medium (YEPD), mated yeast cells were transferred into
liquid SC-Leu-Trp media to select for diploids. After overnight incubation at 30ºC diploid yeast
cells were spotted onto SC-Leu-Trp-His+3AT solid media to select for activation of the
GAL1::HIS3 reporter gene. In parallel, diploid yeast cells were transferred onto SC-Leu-
His+3AT solid media supplemented with 1 or 10 mg/l CHX for assay version 1 or 2 and 3,
respectively. All AD-ORF plasmids carry the counter-selectable marker CYH2, which allows
selection on CHX-containing medium of yeast cells that do not contain any AD-ORF plasmid in
order to identify spontaneous DB-ORF auto-activators102. After 72h incubation at 30ºC, yeast
that grew on SC-Leu-Trp-His+3AT media but not on SC-Leu-His+3AT+CHX media were picked
into SC-Leu-Trp overnight and then processed to determine the identity of the respective bait
and prey proteins.
Yeast colony PCR and sequencing
Because each DB-ORF yeast strain was mated against a library of ~1,000 AD-ORF yeast
strains in the first-pass screens, one bait protein could interact with more than one prey proteins
per mini-library. To account for this, we picked between three and five colonies (primary
positives) from each growth spot on SC-Leu-Trp-His+3AT media to 96-well plates. Primary
positive colonies were processed as described102 to generate lysates for PCR. Three microliters
of diluted lysate was used as a template for PCR amplification to generate DB-ORF and AD-
ORF PCR amplicons.
To cost-effectively identify both bait and prey proteins for hundreds of thousands positive
colonies, we developed a method called SWIM-seq (Shared-well Interaction Mapping by
.CC-BY-NC-ND 4.0 International licenseIt is made available under a (which was not peer-reviewed) is the author/funder, who has granted bioRxiv a license to display the preprint in perpetuity.
The copyright holder for this preprint. http://dx.doi.org/10.1101/605451doi: bioRxiv preprint first posted online Apr. 10, 2019;
27
sequencing). Using SWIM-seq, we took advantage of next generation sequencing technology
and pooled DB-ORF and AD-ORF PCR products that contain well-specific and plate-specific
nucleotide sequences from tens of thousands colonies together in one sequencing run. Briefly,
PCR was performed using AD and DB well index primers together with universal primers (see
table below). All PCR was done using Platinum Taq (Life Technologies). After PCR, the
products from each PCR plate were pooled into one single well in a 96-well plate (SWIM plate).
The SWIM plates were purified (Qiagen, PCR Purification Kit) and processed to make an
Illumina sequencing library, during which Illumina adapter sequences, i7 and i5, were
incorporated as plate indexes. The library was then paired-end-sequenced using an Illumina
platform (MiSeq or NextSeq 500). See Supplementary Table 22 for the primers used for the
different Y2H assay versions.
Identification of pairs of AD-ORF and DB-ORF
We developed a computational pipeline to process demultiplexed paired-end reads and identify
the matching ORF pairs corresponding to Y2H-positive colonies. Paired-end reads are in a fastq
format, with one read, R1, containing a part of the ORF sequence and the other paired read,
R2, containing the well index. Briefly, we used Bowtie 2103 (v2.2.3) to align all R1 reads to
reference sequences and extracted the well-identifying indices from the R2 reads. AD-ORFs
and DB-ORFs that shared the same well indices were paired together. Pairs identified from the
primary screen were calls FiPPs (First Pass Pairs). To identify likely true interacting pairs, we
developed a “SWIM score” S that takes into account the AD and DB reads in each well, total
reads returned from the sequencing run, and other factors.
where x and y are read counts of an AD-ORF and DB-ORF in a given well respectively, a and d
are total read counts of all aligned AD-ORF and DB-ORF in that well, and M and N are pseudo-
counts for AD and DB respectively, which were constant for each sequencing batch but varied
for different batches.
We then selected FiPPs for pairwise test using a cutoff that balances the risk of testing
too many FiPPs that are not protein-protein interactions (PPIs) versus not testing too many
FiPPs that are actual PPIs. The cutoff varied for different screens and sequencing runs to
accommodate slight variations in the screening and sequencing protocol.
.CC-BY-NC-ND 4.0 International licenseIt is made available under a (which was not peer-reviewed) is the author/funder, who has granted bioRxiv a license to display the preprint in perpetuity.
The copyright holder for this preprint. http://dx.doi.org/10.1101/605451doi: bioRxiv preprint first posted online Apr. 10, 2019;

28
Pairwise test
Design of pairwise test and scoring
No FiPP is considered a PPI and released before it has been verified in a pairwise test using
Y2H. For all FiPPs, each protein was picked from the stock collection and mated with its
partner. This experiment was done in quadruplicate, with yeast spotted on both SC-Leu-Trp-
His+3AT plates and SC-Leu-His+3AT+CHX to test for spontaneous auto-activation. As positive
and negative controls in each test batch, 92 pairs from PRS v1, 250 randomly selected Lit-BM
pairs (literature binary multiple pairs), and 250 pairs of proteins randomly selected from the
search space were included. Experiments were considered successful if at most 1% of the
random protein pairs and 10% or more of the Lit-BM or PRS v1 pairs scored positive. Positive
and negative controls were combined in the same batches with FiPPs and scored blindly. To
ensure the mating of the corresponding plates with each other (AD-X with DB-Y) and identify
any potential plate rotations or swaps, each retest plate has a unique pattern of empty wells. We
developed a pipeline to semi-automate the scoring of growing yeast in 384 or 96 format.
Growing yeast colonies were first scored automatically by software that uses the python library
Colonyzer104 to process the images. The scores were then manually checked prior to saving
and pixel intensities were used to estimate the strength of growth. Both retest plates and CHX
control plates were independently scored and scores combined to produce a final score of each
well. A pair was scored invalid (NA) for 96-well format if the well was unscorable (contaminated,
not spotted, etc.); or, if in 384 format, if at least 2 of the 4 quadruplicates were unscorable on the
retest plate; or, if the corresponding well on the CHX plate was unscorable. If a pair was not
scored as NA but grew at least as strongly on the CHX plate compared to the growth on the
retest plate (average of quadruplicates), then it was scored as a spontaneous auto-activator. If a
pair was neither NA nor an auto-activator and showed growth in at least 3 of 4 replicates on the
retest plate, then it was scored as positive; otherwise, negative.
Treatment of pairs scored as spontaneous auto-activators
Because validation data has suggested that the CHX control is over-sensitive for 2µ vectors and
removes many actual PPIs, we performed one more pairwise test for pairs that scored as
spontaneous auto-activators in the pairwise test in assay versions 2 and 3. For these retests,
the DB-ORF was separately mated with an “AD-nul” plasmid without any ORF in the cloning
site. If a yeast colony grew more strongly when mated to the corresponding AD-ORF than the
AD-null strain, we “rescued” this PPI and added it to the dataset after sequence confirmation.
.CC-BY-NC-ND 4.0 International licenseIt is made available under a (which was not peer-reviewed) is the author/funder, who has granted bioRxiv a license to display the preprint in perpetuity.
The copyright holder for this preprint. http://dx.doi.org/10.1101/605451doi: bioRxiv preprint first posted online Apr. 10, 2019;
29
Sequence confirmation of positive pairs from pairwise test
To guide the picking of all positive pairs for sequence confirmation, a “picking map” with all
positive pairs was generated by the scoring software and printed. Picked pairs were lysed and
SWIM-PCR was performed as described in the above section. Illumina reads were processed
via the computational pipeline described above. Only pairs identified from the pipeline that
matched the tested ORF pairs previously scored as positive were considered PPIs.
Validation of screens with orthogonal PPI assays
Design of validation experiments
To validate each of the nine screens of Space III, we randomly selected ~340 positives from
each screen and tested them in several batches using two assays, MAPPIT (MAmmalian
Protein-Protein Interaction Trap) and GPCA (Gaussia princeps luciferase protein
complementation). For each batch, we included ~200 randomly selected PPIs from Lit-BM as
PRS and ~400 pairs of proteins randomly selected from the search space as RRS. For each
pair, a random bait-prey configuration was assigned. All tested pairs and control pairs were
combined in batches and tested blindly.
For the test space validation, unlike in the main screen where we chose PPIs for each
screen, we randomly chose PPIs from all positive pairs together regardless of which screens
they were from. All Lit-BM PPIs (~200) and ~400 random pairs of proteins from within the tested
space were treated as a positive reference set and a random reference set respectively.
MAPPIT assay
MAPPIT experiments were performed as previously described10. Briefly, HEK293T cells were
grown in 384-well plates and co-transfected with a luciferase reporter and plasmids for both bait
and prey fusion proteins. Twenty-four hours post-transfection, cells were either stimulated with
ligand (erythropoietin) or left untreated, then incubated for an additional 24 hours before
luciferase activity was measured in duplicate. The MAPPIT validation experiment was deemed
valid if both bait and prey were successfully cloned into expression vectors and bait expression
was detected. “Fold-induction” values (signal from stimulated cells divided by signal from
unstimulated cells) were calculated for each tested pair, and two negative controls (no bait with
prey and bait with no prey). Each tested pair was assigned a quantitative score: the fold-
.CC-BY-NC-ND 4.0 International licenseIt is made available under a (which was not peer-reviewed) is the author/funder, who has granted bioRxiv a license to display the preprint in perpetuity.
The copyright holder for this preprint. http://dx.doi.org/10.1101/605451doi: bioRxiv preprint first posted online Apr. 10, 2019;
30
induction value of the pair divided by the maximum of the fold-induction value of the two
negative controls.
GPCA assay
As an orthogonal validation assay, GPCA experiments were performed as described
elsewhere16. Briefly, GPCA N1 and N2 vectors are based on two fragments of the Gaussia
princeps luciferase with humanized codon usage (herein referred as GLuc)19. Both GLuc
fragments were linked to the N-terminus of the tested proteins via a flexible linker polypeptide of
20 amino acid residues, including the Gateway recombinational cloning sites. To normalize
mRNA translation initiation, a consensus Kozak translation start sequence was added. Both
constructs were carried by the same CytoMegaloVirus (CMV)-driven mammalian expression
vector (pCI-neo derived, Promega) and were maintained at high copy number via the presence
of the SV40 replication origin.
HEK293T cells were seeded at 6x10⁴ cells per well in 96-well, flat-bottom, cell culture
microplates (Greiner Bio-One), and cultured in Dulbecco's Modified Eagle's Medium (DMEM)
supplemented with 10% fetal calf serum at 37°C and 5% CO2. 100 ng of purified plasmid DNA
for each protein of a pair was transfected into HEK293T cells in 96-well, flat bottom, cell culture
plates (Greiner Bio-One) supplemented with 10% Fetal Bovine Serum (FBS) in DMEM using
PolyEthylenImine (PEI)19. The DNA/PEI ratio (mass:mass) was 1:3. Cell culture medium was
removed 24 h after DNA transfection, and cells were gently washed with 150 µL pre-warmed 1x
PBS (phosphate buffered saline). 40 µL of lysis buffer was added to each well, and cell lysis
was performed under vigorous plate shaking for 20 min at 900 rpm. Luminescence was
measured by auto-injecting 50 µL Renilla luciferase substrate (Renilla Luciferase Assay system,
Promega) in each well and integrating light output for 4 s using a TriStar luminometer (Berthold)
to obtain quantitative scores. GPCA has not been performed on PPIs of screens 7, 8, and 9
generated with Y2H assay version 3.
Processing of data and calculation of validation rates
In MAPPIT and GPCA assays, if a pair is positive or negative was determined by thresholds set
at the 99th percentile of the RRS scores (equivalent to a 1% false discovery rate). This was
determined separately for each experimental batch and calculated using the quantile function in
the Python pandas library. Pairs without valid quantitative scores were dropped, and recovery
rates were calculated as the number of positive pairs over the sum of the positive and negative
pairs. The error bars on the recovery rates were calculated using a Bayesian model (a binomial
.CC-BY-NC-ND 4.0 International licenseIt is made available under a (which was not peer-reviewed) is the author/funder, who has granted bioRxiv a license to display the preprint in perpetuity.
The copyright holder for this preprint. http://dx.doi.org/10.1101/605451doi: bioRxiv preprint first posted online Apr. 10, 2019;

31
likelihood with a uniform prior), taking the central 68.27% interval of Beta (p + 1, n + 1), where p
and n are the number of pairs testing positive and negative, respectively.
Testing of PPIs in MAPPIT that were found in multiple screens and analysis of data
Randomly sampled PPIs were selected for validation assessment from individual screens and
from additional randomly-sampled pairs from subsets of PPIs that were defined by the number
of screens in which the PPI was detected. Every pair in HuRI that was also in any of the
literature curated datasets [Lit-BM / Lit-BS (literature binary singleton pairs) / Lit-NB (literature
not binary)] was also selected for validation assessment.
Processing of external transcriptome datasets: GTEx, FANTOM and Human Protein Atlas
Genotype-Tissue Expression project (GTEx)2 v6 transcriptome data previously processed with
the R YARN package50 was downloaded from
http://networkmedicine.org:3838/gtex_data/gtex_portal_normalized.rds on March 15th, 2016
and processed with R v3.5.1 to extract normalized log read count data for every gene and tissue
sample. The median expression of every gene across all samples from a given subtype (tissue
or cell line) was calculated and considered as the expression level of the genes in those tissues.
A median expression cutoff of >5 was applied to consider a gene being expressed in a given
tissue. Cell line samples were excluded and genes were restricted to the set of protein-coding
genes (see above). The YARN package collapses the 16 brain subregions into three brain
tissues, basal ganglia, cerebellum, and other, which have been used in this study
(Supplementary Table 23).
Transcripts Per Kilobase Million (TPM) from Cap Analysis Gene Expression (CAGE)
peak data was extracted from the hg19.cage_peak_phase1and2combined_tpm.osc.txt file
(http://fantom.gsc.riken.jp/5/datafiles/latest/extra/CAGE_peaks/; version November 11th, 2014).
Entrez gene IDs were mapped to Ensembl gene IDs and the dataset was restricted to protein-
coding genes. For each gene from FANTOM3, we computed the mean of cage peak TPM
values of all samples associated to any FANTOM primary cell category. Samples were mapped
to primary cells using FANTOM SSTAR (http://fantom.gsc.riken.jp/5/sstar/). Primary cell
categories that were considered to be biologically too similar and of close TPM expression were
.CC-BY-NC-ND 4.0 International licenseIt is made available under a (which was not peer-reviewed) is the author/funder, who has granted bioRxiv a license to display the preprint in perpetuity.
The copyright holder for this preprint. http://dx.doi.org/10.1101/605451doi: bioRxiv preprint first posted online Apr. 10, 2019;

32
merged. TPM values were log2 transformed and a gene was considered expressed if its value >
0.
RNA-seq data from 64 cell lines processed at the gene level with TPM values
downloaded on December 1st, 2017 from the Human Protein Atlas13 (https://proteinatlas.org).
Genes with TPM ≥ 1 were considered expressed.
Computing increase of HuRI with more assay versions and screens
To evaluate the number of PPIs and proteins observed as a function of the number and assay
version of screens used, the mean of the cumulative number of PPIs and proteins across all
matching screen combinations was used. For example, for five screens with three being assay
version 1 and two being assay version 2, the mean number of unique PPIs was calculated for all
combinations of any 3 of the 12 assay version 1 screens and any 2 of the 3 assay version 2
screens.
Integrative analyses with protein structural information
Analysis of distances between protein termini and interaction interfaces
We retrieved experimental structures, or either complete or domain-based models (using
Interactome3D21 version 2018_04) involving any two proteins that have at least one interaction
in HuRI. For each subunit in a complex structure, we defined its interaction interface as the
residues for which the Accessible Surface Area (ASA) changed more than 1 Å2 between the
bound and unbound state. The center of this interaction interface was determined as the Cα
atom being closest to the center of coordinates of the interaction interface. Next, we calculated
the distance from the N- and C-terminal Cα atoms to the center of the interaction interface.
Importantly, we only considered protein structures with complete N- or C-termini depending on
the analysis performed. In complexes with truncated tails, we searched for monomer structures
with a minimum of 50% coverage and complete terminal tails. In those cases, we superimposed
the monomers onto the respective complex subunits and calculated the distance from the
relevant terminus to the interaction interface center. Finally, we grouped these interactions
based on the Y2H assay version(s) in which they were detected and performed the analysis
separately for DB and AD fusions.
.CC-BY-NC-ND 4.0 International licenseIt is made available under a (which was not peer-reviewed) is the author/funder, who has granted bioRxiv a license to display the preprint in perpetuity.
The copyright holder for this preprint. http://dx.doi.org/10.1101/605451doi: bioRxiv preprint first posted online Apr. 10, 2019;
33
Analysis of the fraction of PPIs in dataset that are direct We queried Interactome3D21 (version 2018_04) for complexes involving three or more proteins
with experimental structure available. For all combinations of protein pairs within a complex,
Interactome3D calculated the number of residue-residue contacts by accounting for hydrogen
bonds, van der Waals interactions, and salt and disulfide bridges. We defined protein pairs with
five or more contacts as direct, and remaining pairs as indirect. Separately for each given PPI
dataset, the fraction of direct PPIs was calculated as the number of direct PPIs divided by the
number of direct and indirect PPIs.
Analysis of correlation between number of screens and interaction strength
We downloaded from Interactome3D21 (version 2018_04) the experimental structures involving
any two proteins in HuRI (Human Reference Interactome). For each complex structure, we
calculated the interaction interface area by subtracting the ASA in the bound state from the total
ASA of the unbound proteins and by dividing the result by two. Additionally, we calculated the
number of residue-residue contacts as explained above. Finally, we grouped the protein pairs
by the number of HuRI screens in which an interaction was detected.
Retrieval and processing of other interactome datasets
Construction of Lit-BM
Literature curated datasets were derived from the Mentha resource45, which aggregates
literature-curated PPIs from five source databases: MINT105, IntAct106, DIP107, MatrixDB108 and
BioGRID109. The data downloaded from Mentha was dated August 28th 2017. Data was filtered
to have valid IDs for the UniProt accession numbers, Pubmed IDs and PSI-MI terms. Each
piece of evidence for a protein pair must consist of a Pubmed ID and an interaction detection
method code in the PSI-MI controlled vocabulary110. Duplicated evidence arises in cases where
different source databases curate the same paper. We merged duplicated entries for each pair,
as detected by multiple pieces of evidence with the same Pubmed ID and experimental
interaction detection codes which are either the same or have an ancestor-descendent
relationship in the PSI-MI ontology. (In the latter case, the more specific descendent term was
assigned to the merged evidence.) In order to select the subset of PPIs corresponding to binary
interactions (as opposed to co-complex associations) we developed a manual classification of
the PSI-MI interaction detection method110 terms, which define the experimental technique used.
Our classification has been updated since previous versions, in order to cover new experimental
.CC-BY-NC-ND 4.0 International licenseIt is made available under a (which was not peer-reviewed) is the author/funder, who has granted bioRxiv a license to display the preprint in perpetuity.
The copyright holder for this preprint. http://dx.doi.org/10.1101/605451doi: bioRxiv preprint first posted online Apr. 10, 2019;

34
methods which have been added to the controlled vocabulary in the intervening time. The
methods are classified into three categories; ‘invalid’, ‘binary’ and ‘indirect’. Where ‘invalid’
corresponds to terms that are not considered valid experimental protein-protein interaction
detection methods, ‘binary’ to terms that detect binary protein-protein interactions and ‘indirect’
to terms that detect potentially indirect interactions. An example term in the first category is
“colocalization”. All PPI evidences annotated with “invalid” terms are removed and not
considered. The other two categories are used to divide the protein pairs in the literature-
curated dataset into three categories, as follows. If a pair has no evidence that correspond to a
binary method it is classified as Lit-NB, if a pair has only one piece of evidence with a binary
method it is classified as Lit-BS and if a pair has multiple pieces of evidence, with at least one
corresponding to a binary method then it is annotated as Lit-BM. The resulting number of PPIs
in each category is shown in (Extended Data Fig. 9a).
The interactions that make up the literature come from experiments that span a broad
range of different sizes. It is possible that there could be a difference in average quality between
experiments that report just a single or small number of PPIs and those that use high-
throughput techniques to identify large numbers of PPIs. In order to investigate this we divided
the Lit-BM and Lit-BS into High-Throughput (HT) and Low-Throughput (LT) subsets, based on
the size of the smallest experiment, that provided a piece of evidence for that pair using a binary
experimental method. If 50 or more PPIs were reported in that experiment, it was classified as
HT and otherwise was classified as LT. Random samples of these subsets were pairwise tested
using Y2H (assay version 1) and MAPPIT (Extended Data Fig. 9b, c, Supplementary Table 24,
25). We observed no significant difference between the validation rates of the HT and LT
subsets and so we made the decision not to implement any cutoff in experiment size when
defining the literature dataset.
The main differences from the previous literature curated dataset Lit-BM-1310 are the
databases used. Random samples of Lit-BM-17 pairs show similar recovery rates to random
samples of Lit-BM-13 pairs in Y2H and MAPPIT (Extended Data Fig. 9d, e). PPIs from Lit-BM-
13 have been used as positive controls in experiments, PPIs from Lit-BM-17 (Supplementary
Table 26) have been used in all computational analyses.
Processing of co-complex interactome maps BioPlex, QUBIC, CoFrac
BioPlex8 v2.0 data was downloaded from http://bioplex.hms.harvard.edu on August 1st, 2018,
and protein IDs were mapped from UniProt to Ensembl gene IDs. QUBIC was downloaded from
the supplementary table of the previous study9 and protein IDs were mapped from UniProt to
.CC-BY-NC-ND 4.0 International licenseIt is made available under a (which was not peer-reviewed) is the author/funder, who has granted bioRxiv a license to display the preprint in perpetuity.
The copyright holder for this preprint. http://dx.doi.org/10.1101/605451doi: bioRxiv preprint first posted online Apr. 10, 2019;

35
Ensembl gene IDs. CoFrac7 was processed by downloading the data from
http://human.med.utoronto.ca on August 1st, 2018 and mapping from UniProt to Ensembl gene
IDs. All interatome maps were then filtered to contain interactions only involving Ensembl gene
IDs corresponding to protein-coding genes.
Processing of previously generated binary interactome maps at CCSB
To update the previous CCSB (the Center for Cancer Systems Biology) binary interactome
maps and convert them into Ensembl gene ID pairs, for each map, we retrieved the original
ORF based IDs stored in our database and mapped the ORF IDs to Ensembl gene IDs as
described above. PPIs involving ORFs that remained unmapped or were discarded or mapped
to non-protein-coding genes were removed.
Analysis of HuRI PPIs linking proteins within versus between protein complexes
CORUM22 complexes were downloaded from http://mips.helmholtz-muenchen.de on August 1st
2018 and gene IDs were mapped from UniProt to Ensembl. Complexes with less than three
subunits were removed as well as complexes that overlapped 90% or more with another
complex (the smaller complex of both was removed). HuRI PPIs were filtered to remove
homodimers and were restricted to those linking proteins annotated to be in at least one
CORUM complex (restriction to common space between HuRI and CORUM). The fraction of
these HuRI PPIs that link a pair of interacting proteins that were observed to be at least once
part of the same CORUM complex was determined and these PPIs were further split into PPIs
found in only one of the 9 HuRI screens versus having been found in at least 2 screens. The
fractions plotted were 137/1042 and 232/775 for one screens and multiple screens, respectively.
CORUM complex membership was used to identify all interactions between them from BioPlex8
or HuRI. py2cytoscape111 was used to generate network models of each complex.
.CC-BY-NC-ND 4.0 International licenseIt is made available under a (which was not peer-reviewed) is the author/funder, who has granted bioRxiv a license to display the preprint in perpetuity.
The copyright holder for this preprint. http://dx.doi.org/10.1101/605451doi: bioRxiv preprint first posted online Apr. 10, 2019;

36
Functional enrichment analyses of HuRI and the Profile Similarity Network (PSN) of HuRI
Construction of PSN and randomizations
Jaccard similarity (number of shared interaction partners divided by union of interaction
partners) was calculated for every pair of proteins of degree ≥ 2 in a given network. Only pairs
of proteins that shared at least one interaction partner were considered in any further analysis
using the PSN. Random PSNs were generated in the same way from degree-controlled
randomized HuRI networks that generated using the degree_sequence() function in the Python
igraph112 library v0.7.1.
Calculation of pairwise sequence identity and correlation with Jaccard similarity
To calculate the sequence identity between a pair of proteins in HuRI, we aligned the two
corresponding ORF protein sequences using MUSCLE99 (v3.8.31) with default parameters. We
then parsed the MUSCLE alignment file and calculated the sequence identity as the number of
matched amino acid positions divided by the length of the alignment. To assess whether higher
Jaccard similarity between two proteins in HuRI correlates with higher overall sequence
similarity between the two proteins as an indication for similar interaction interfaces while
controlling for degree biases, we computed for increasing sequence identity cutoffs the sum of
Jaccard similarities of all edges in the PSN that link two proteins with a sequence identity of or
above that cutoff. This sum was divided by the mean of the sums calculated in identical ways
from 100 random PSNs to obtain a fold change that was plotted. The lower and upper bound of
the 95% confidence interval of the fold change was computed by dividing the actual sum of the
Jaccard similarities with the 97.5th and 2.5th percentile of the random distribution, respectively,
and plotted as error bars.
Retrieval and processing of resources for functional annotations
Co-fitness relationships between human genes were kindly provided by Joshua Pan, calculated
as a Pearson correlation coefficient between the effects of the separate knockout of two genes
on the AVANA cancer cell line panel113 as described previously35. Gene IDs were mapped to
Ensembl gene IDs and restricted to protein-coding genes. Co-expression data on the level of
correlated expression between two genes was downloaded from the SEEK114 database on June
13th 2018 and restricted to protein-coding genes. Pathway membership of proteins was
obtained from Reactome, using a file mapping Ensembl gene IDs to lowest level pathways,
.CC-BY-NC-ND 4.0 International licenseIt is made available under a (which was not peer-reviewed) is the author/funder, who has granted bioRxiv a license to display the preprint in perpetuity.
The copyright holder for this preprint. http://dx.doi.org/10.1101/605451doi: bioRxiv preprint first posted online Apr. 10, 2019;

37
downloaded on August 1st 2018. Subcellular compartment membership of proteins was
obtained from the Human Protein Atlas downloaded on August 1st 2018. Annotations of
‘Uncertain’ reliability were not used. Protein complex membership of proteins was obtained from
BioPlex8 2.0 supplementary table 7. Entrez gene IDs were mapped to Ensembl gene IDs and
restricted to protein-coding genes.
Calculation of significances for a network to link functionally related proteins
The significance of a given network [HuRI, HuRI 2ev (HuRI with multiple evidences), or the PSN
of HuRI] to link proteins that are co-expressed or that display similar growth defects on cell lines
was determined by computing for increasing correlation cutoffs the sum of the edge weights
(Jaccard similarities for PSN, edge weights = 1 for PPI networks) of all edges in the given
network that link two proteins with a correlation value of at least that cutoff. This sum was
divided by the mean of the sums obtained from randomized networks. the 95% confidence
interval was computed as described above. A single correlation cutoff (Pearson correlation
coefficient of 0.3 for growth defects and co-expression value of 0.86) was chosen for display
based on the number of pairs of proteins that met this cutoff. However, consistent trends were
observed across most cutoffs tested (Extended Data Fig. 4d, e). The significance and
confidence interval of a given network to link proteins that localize to the same subcellular
compartment, or work in the same pathway, or associate in the same protein complex was
computed in identical ways with the exception that no titration was performed to calculate
significances.
Computation and visualization of functional modules
We used the SAFE software28 (v1.5) to determine and visualize significant functional modules in
various networks. The network layouts were generated with Cytoscape115 (v3.4.0) using the
edge-weighted spring embedded layout. PSNs were drawn using a Jaccard similarity cutoff of
≥0.1 and using the Jaccard similarity as edge weight for the layout algorithm. Gene Ontology116
(GO) terms for each gene were extracted from FuncAssociate117 (v3 - GO updated on February
2018). SAFE analysis was run with the default option except layoutAlgorithm = none (using
layout generated by Cytoscape), neighborhoodRadius = 200, and neighborhoodRadiusType =
absolute.
.CC-BY-NC-ND 4.0 International licenseIt is made available under a (which was not peer-reviewed) is the author/funder, who has granted bioRxiv a license to display the preprint in perpetuity.
The copyright holder for this preprint. http://dx.doi.org/10.1101/605451doi: bioRxiv preprint first posted online Apr. 10, 2019;
38
Network coverage of genes of interest and correlation with gene properties
Acquisition and Processing of gene properties
The number of publications for each gene was determined as the number of unique PubMed
IDs associated with the gene, using the file gene2pubmed from NCBI downloaded on August
1st 2018, after mapping NCBI gene IDs to Ensembl gene IDs, using the ID mapping file
provided by NCBI, gene2ensembl, downloaded on August 1st 2018. Disease genes were
defined as all genes with a disease annotation in OMIM118, using files generated on July 26th
2018. Pharmacological targets were taken from the IUPHAR/BPS Guide to
PHARMACOLOGY119 downloaded on July 26th 2018. Cancer genes were the Tier 1 genes of
the Cancer Gene Census120. Genes with Single Nucleotide Polymorphism (SNP) from Genome-
Wide Association Study (GWAS) were selected using data from the GWAS Catalog121 v1.0.2
from July 17th 2018. Genes were selected if there was a SNP associated with a trait with P < 5
x 10-8, associated with the gene that belonged to a class that could affect the protein product.
Transcription factors (TFs) were all known and likely TFs from The Human Transcription
Factors122 v1.01 downloaded on July 26th 2018. Cell growth genes were derived from the
AVANA CRISPR knockout screens113, using a file dated June 21st 2018 containing data for 436
cell lines. Cell growth genes were selected as those with a median relative growth < -0.5 across
the cell lines tested. We took the list of genes annotated with “embryonic lethality” from the MGI
database (v6.13)34. Transcript expression levels of genes were retrieved from GTEx, and
protein expression levels from HEK293T and HeLa cell lines from these studies9,123. Age
information was adopted from Protein Historian36 (http://lighthouse.ucsf.edu/ProteinHistorian,
downloaded on August 2nd 2018). Age time was computed based on OrthoMCL. LoF
intolerance was adopted from ExAC database1 (release 0.3.1 / updated February 27th 2017).
Summary and detailed information of gene properties is provided in Supplementary Table 27.
Calculation and plotting of binned adjacency matrices
The protein-coding genome is ranked by the number of publications of each gene. In the case
where multiple genes have the same number of publications, the order was randomized. The
genome was divided into equal-sized bins, dividing the symmetric genome-by-genome space
into two-dimensional bins.
.CC-BY-NC-ND 4.0 International licenseIt is made available under a (which was not peer-reviewed) is the author/funder, who has granted bioRxiv a license to display the preprint in perpetuity.
The copyright holder for this preprint. http://dx.doi.org/10.1101/605451doi: bioRxiv preprint first posted online Apr. 10, 2019;

39
Processing of gene properties for network degree correlation analysis
We calculated the correlation and the partial correlation between network degree of each
network and protein properties within the set of proteins with at least one interaction in the
corresponding network and with the value for the corresponding property, using Matlab (version
2016a). To calculate the partial correlation based on expression, we used HEK293T proteomic
data from the BioPlex123 v1.0 study, proteomics data from the HeLa cell line from the QUBIC
study, GTEx tissue expression data and the number of publications from NCBI (method above)
for the networks BioPlex, QUBIC, CoFrac and Lit-BM, respectively.
Integrative analyses of HuRI with subcellular compartment data
Calculation of protein coverage of networks by subcellular compartments
The subcellular localization dataset was retrieved from Cell Atlas38 and processed as described
above. Any compartments with less than 100 proteins were not considered in this analysis, and
additional extracellular region and extracellular vesicle annotations from the GO database were
included. Fisher’s exact test was used to test for an enrichment or depletion of the proteins of
each network restricted to those that have at least one localization annotation. Odds ratios were
provided in log scale and colored with gray for non-significant enrichment (P > 0.05).
Calculation of trend between cellular compartment overlap and HuRI
For pairs of subcellular compartments, A and B, both the odds ratio of proteins to be annotated
in both A and B and the odds ratio of the density of PPIs between proteins annotated as being
in A and not B and B and not A, were calculated. The density of PPIs is the number of PPIs
within a set of proteins, divided by the number of pairwise combinations of those proteins.
Haldane-Anscombe corrected odds ratios were used. The uncertainties on the log odds ratios
were calculated using the standard error approximation. Orthogonal distance regression (ODR)
was used to estimate the relationship between the two log odds ratios. ODR was chosen since
the subcellular compartments have a large variation in their sizes and so widely varying
uncertainties on both the x and y variables needed to be accounted for. The z-value of the
regression slope was used as the test-statistic and compared to a null distribution generated by
running the same regression analysis on 1,000 degree-preserved randomized networks. All
possible pairs of compartments were used, with the exclusion of pairs of compartments whose
annotations partially or fully excluded each other for technical reasons. The excluded pairs
.CC-BY-NC-ND 4.0 International licenseIt is made available under a (which was not peer-reviewed) is the author/funder, who has granted bioRxiv a license to display the preprint in perpetuity.
The copyright holder for this preprint. http://dx.doi.org/10.1101/605451doi: bioRxiv preprint first posted online Apr. 10, 2019;

40
were: Nucleoplasm/Nucleus, Nucleoplasm/Nucleoli, Nucleus/Nuclear Speckles, Nucleoli fibrillar
center/Nucleoli, and Microtubule organizing center/Centrosome.
Analysis of HuRI PPIs about extracellular vesicle function
Acquisition and processing of extracellular vesicle (EV) proteomic data from the EVpedia
database
We used EVpedia database40,124,125 (version: April 30th 2018) to define vesicular proteins. In
EVpedia, there are 487 studies for EV proteomics from human samples and an “Identification
Count” for each protein, which is the number of EV proteomic studies with the corresponding
protein detected. If a protein was found in more than 45 different studies (~10% of the studies),
we defined it as a vesicular protein, resulting in 2,548 proteins in total (about top 10% among all
the identified EV proteins). The Largest Connected Component (LCC) of this EV network,
containing 525 proteins, was visualized with Cytoscape115 (v3.4.0). To test the significance of
this EV protein network, we compared the number of PPIs between EV proteins in this network
to the number of PPIs between EV proteins obtained in 1,000 degree-controlled randomized
networks, deriving an empirical P < 0.001.
Design and Transfection of gRNA and selection for KO cells
We used gRNA shared in TKO database126. U373vIII cells were prepared at 70% confluency
prior transfection. For each gene to be KO, a pool of plasmids carrying the gRNAs were
transfected using JetPrime according to the manufacturer’s guidelines (Polyplus Transfection).
The cells were submitted to Puromycin selection 36h after 48h of transfection. KO of SDCBP
was confirmed by Western Blot127 with the rabbit anti-SDCBP antibody (ab133267 with lot
number GR282684-7) purchased from Abcam (Cambridge).
Comparative proteomics
We performed the EV comparative proteomics as previously described127 with some
modifications. The conditioned media (CM) was collected from cells grown for 72 h in culture
media containing 10% EV-depleted FBS (generated by centrifugation at 150,000 g for 18 h at
4ºC). CM was centrifuged at 400 g and then passed through 0.8 µm pore-size filter. The
resulting filtrate was concentrated using Amicon Ultra-15 Centrifugal Filter Unit (EMD Millipore)
with 100,000 nominal molecular weight limit (NMWL) molecular cutoff. The concentrate was
mixed with 50% of iodixanol solution (Sigma) and processed for density gradient
.CC-BY-NC-ND 4.0 International licenseIt is made available under a (which was not peer-reviewed) is the author/funder, who has granted bioRxiv a license to display the preprint in perpetuity.
The copyright holder for this preprint. http://dx.doi.org/10.1101/605451doi: bioRxiv preprint first posted online Apr. 10, 2019;

41
ultracentrifugation at 200,000 g for 2 h. The EV-enriched fraction of iodixanol was collected (at
the density of ∼1.10 g/mL) and particles were confirmed to carry CD81, an established
exosome marker. The concentration of EV proteins was quantified using the BCA assay (Pierce
Biotechnology). For concentration and size distribution of EVs, nanoparticle tracking analysis
(NTA) was carried out with each collected iodixanol fraction using NanoSight NS500 instrument
(NanoSight Ltd.). Three recordings of 30 s at 37 ºC were obtained and processed using NTA
software (v3.0).
The purified EV protein preparation (9 µg) was desalted with SDS-PAGE loaded onto the
stacking gel followed by staining and destaining. The in-gel trypsin digestion was carried out
under reducing conditions afforded by DiThioThreitol (DTT), and alkylation was achieved using
iodoacetic acid. The lyophilized peptides were re-solubilized in 0.1% aqueous formic acid/2%
acetonitrile, the peptides were loaded onto a Thermo Acclaim Pepmap (75 µm inner diameter
with 2 cm length, C18, 3 µm particle size, 100 Å pore size; Thermo Fisher Scientific) pre-column
and onto an Acclaim Pepmap Easyspray (75 µm inner diameter with 15 cm length, C18, 2 µm
particle size, 100 Å pore size; Thermo Fisher Scientific) analytical column. Separation was
achieved using a Dionex Ultimate 3000 uHPLC at 220 nL/min with a gradient of 2-35% organic
solvents (0.1% formic acid in acetonitrile) over 3 h. Peptides were analyzed using an Orbitrap
Fusion Tribrid mass spectrometer (Thermo Fisher Scientific) operating at 120,000 resolution
(FWHM in MS1, 15,000 for MS/MS). All experiments were carried out in three biological
replicates. The quantification of proteins was done by Maxquant program (v1.5.6.5) with default
parameters of label-free quantification with UniProt database of human proteins (SwissProt
release September 2016). To define the decreased proteins after knockout, P-value was
calculated by fitting a Gaussian kernel density estimation (KDE) to the distribution of t-statistics
obtained by randomly permuting the WT/KO labels for all proteins, as previously described128.
Decreased proteins in EV after knockout were defined as the proteins with P < 0.05 and fold
change < 0.66 (Fig. 4e). The enrichment of decreased proteins among SDCBP interactors were
tested with empirical testing; among all the EV proteins from U373vIII, we randomly picked 6
proteins 10,000 times and calculated the fraction of cases with ≥ 50% decrease proteins
(Extended Data Fig. 5b).
.CC-BY-NC-ND 4.0 International licenseIt is made available under a (which was not peer-reviewed) is the author/funder, who has granted bioRxiv a license to display the preprint in perpetuity.
The copyright holder for this preprint. http://dx.doi.org/10.1101/605451doi: bioRxiv preprint first posted online Apr. 10, 2019;

42
Inference and analysis of tissue PPI networks from HuRI
Calculation and assessment of tissue preferential expression
A z-score related statistic published in Sonawane et al.44 was applied on the sample expression
data of 35 tissues and testis to calculate a tissue preferential expression (TiP) value for every
gene-tissue pair (Extended Data Fig. 10a and Supplementary Table 28). However, at a given
TiP value cutoff, only those genes were considered preferentially expressed in a given tissue, if
they also showed a level of expression > 5 in that tissue. A unique value of preferential
expression for every gene was calculated by taking the maximum of all TiP values across the 35
tissues (Extended Data Fig. 10a). As noted by others2,44, testis by far represents the tissue with
the largest number of TiP genes increasingly dominating the overall set of TiP genes for
increasing TiP value cutoffs (Extended Data Fig. 10b). The expression of many genes in testis
has been hypothesized to be linked to DNA integrity control mechanisms during reproduction129
suggesting that the majority of testis-specific genes are not related to testis-specific function.
Therefore, testis was excluded from any analysis involving tissue-preferential expression in this
study. The impact of that decision on the number of TiP genes defined for all other tissues was
minimal, leading to a small gain in TiP genes and essentially no loss (Extended Data Fig. 10c,
d). The number of TiP genes substantially decreases for increasing TiP value cutoffs (Extended
Data Fig. 10a). At higher TiP value cutoffs, some tissues are left without any TiP gene. At a TiP
value cutoff of 2, most TiP genes are not exclusively expressed. However, that fraction
increases with higher TiP value cutoffs and plateaus at about 75% with a cutoff of 8 or 9
(Extended Data Fig. 10e). Where applicable, analyses were performed without the application of
a TiP value cutoff to define TiP genes, however, whenever a cutoff was necessary, a cutoff of 2
(lenient but highly significant preferential expression), 3, and 8 were applied to test for
dependencies of results on the level of preferential expression considered.
Correlation analysis of network properties with tissue preferential expression
Networks were processed as described above. A PPI was considered to exist in a tissue, if both
proteins showed expression (at the transcript level, expression cutoff > 5) in the same sample
for more than 50% of all samples available for that tissue. For the network property analyses,
each PPI network was restricted to the PPIs being expressed in at least one tissue and to the
largest connected component. The degree and betweenness function from the python igraph
library112 (v0.7.1) were used to calculate the degree and betweenness of every protein in the
network. Degree and betweenness were assessed for correlation with the max TiP value of
.CC-BY-NC-ND 4.0 International licenseIt is made available under a (which was not peer-reviewed) is the author/funder, who has granted bioRxiv a license to display the preprint in perpetuity.
The copyright holder for this preprint. http://dx.doi.org/10.1101/605451doi: bioRxiv preprint first posted online Apr. 10, 2019;
43
every protein using Spearman’s rank correlation in the python scipy library130 (v1.1.0). The 95%
confidence interval of Spearman’s ρ was calculated using 1,000 bootstrap samples.
Calculation of fraction of genome or network that is tissue-specific
Networks were processed as described above and restricted to PPIs linking proteins expressed
in the same tissue. Titrations were performed as described above, by the max TiP value of
every gene. The fraction of the genome that is tissue-specific at a given max TiP value cutoff
was calculated by dividing the number of TiP genes at the cutoff with the number of protein-
coding genes in GTEx. The fraction of proteins in a network that are tissue-specific were
calculated by dividing the number of TiP proteins at a given max TiP value cutoff that are in the
network with the total number of proteins in the filtered network. Error bars reflect standard error
of proportion.
Generation and visualization of TiP networks
TiP networks were drawn for every tissue by taking all TiP proteins for a given tissue with a TiP
value ≥ 2 and all their interaction partners in HuRI that are expressed in the same tissue.
Networks were drawn with Cytoscape115 (v3.7.0) and manually adjusted for aesthetic purposes.
The human body clipart was obtained from smart.servier.com.
Calculation of closeness of TiP proteins in tissue PPI networks
For every tissue the number of PPIs in HuRI between TiP proteins of that tissue was determined
defining TiP proteins at a TiP value cutoff ≥ 2. This number was compared to the number of
PPIs between TiP proteins in 1,000 degree-controlled randomized networks (generated using
the degree_sequence function in the python igraph112 library) of the corresponding tissue PPI
network of HuRI (all PPIs linking proteins expressed in this tissue). Tissues were excluded from
the analysis, if less than two TiP proteins were in the tissue PPI network. The average shortest
path between TiP proteins in a tissue PPI network was calculated by restricting the tissue PPI
network to the Largest Connected Component (LCC), determining the shortest path of every TiP
protein to the closest TiP protein and averaging those shortest paths, and comparing the
average shortest path to those from 1,000 degree-controlled randomized tissue PPI networks.
Tissue PPI networks with less than two TiP proteins in the LCC were excluded from the
analysis. Tissues in which TiP proteins are significantly close to each other were determined by
calculating the fraction of random networks with a number of TiP-TiP PPIs at least as high as in
the actual tissue PPI network (or with an average shortest path at least as small or smaller) and
.CC-BY-NC-ND 4.0 International licenseIt is made available under a (which was not peer-reviewed) is the author/funder, who has granted bioRxiv a license to display the preprint in perpetuity.
The copyright holder for this preprint. http://dx.doi.org/10.1101/605451doi: bioRxiv preprint first posted online Apr. 10, 2019;

44
requiring that fraction to be ≤ 0.05 × 35 (one-sided empirical p-value corrected for multiple
testing).
Gene function prediction and experimental testing
Analysis of annotation of TiP genes with tissue-specific GO terms
Assignment of tissues to GO116 terms was done manually as described in detail elsewhere
(Basha et al. in preparation). These GO term - tissue annotations were further matched to the
35 tissues with transcriptome data from GTEx. GO Biological Process terms were downloaded
from FuncAssociate117 on March 20th 2018 excluding annotations with evidence codes ND and
IBA. For every tissue all genes with a TiP value ≥ 2 were selected and the fraction of those
determined with at least one GO term annotation assigned to that tissue.
Prediction of gene functions using guilt-by-association approach
Finding a new protein annotation can be described as a link prediction problem between a node
representing the function and the proteins. Initially, we connect the functional node to each of
the proteins annotated with this function and obtain a link prediction score for each other gene in
the network based on our recently developed link prediction method27. As the result, the indirect
score of protein i is obtained as where aik is the connection weight between nodes i and k and
kj is the degree of node j. Intuitively, the indirect score integrates the amount of network
similarity of the candidate node to the known proteins involved in this function.
We then compare the original network-based indirect score (s) to a random benchmark,
obtained by randomizing the network several times in a degree-preserved way. Calculating the
z-score z=(s-sR)/sR is the traditional way of such comparison, obtained by standardizing the
original score with the expectation value (sR) and standard deviation (sR) of the score that
would be expected by chance. Yet, the z-score is not free from degree biases and prefers low-
degree nodes with an extremely small sR. As described elsewhere in detail (manuscript in
preparation), we propose to apply a related measure, called the effect size. The effect size s-
sR-αsR is obtained by comparing the original score with the reasonably expected value of the
random benchmark, estimated as the mean value (sR) and α-times the standard deviation (sR).
In practice, we use α=2, selecting the same candidates as a traditional z-score threshold of z ≥
2, but ordering them based on the amount of signal beyond random expectations to avoid a bias
towards low-degree nodes. To generate the benchmark distribution for each gene, we perform
.CC-BY-NC-ND 4.0 International licenseIt is made available under a (which was not peer-reviewed) is the author/funder, who has granted bioRxiv a license to display the preprint in perpetuity.
The copyright holder for this preprint. http://dx.doi.org/10.1101/605451doi: bioRxiv preprint first posted online Apr. 10, 2019;

45
10,000 degree-preserved randomizations over the human interactome and score each gene in
each of the random networks.
Functional annotations of genes with GO Biological Process terms were obtained as
described above and further restricted to annotations with the evidence codes EXP, IMP, TAS,
HMP, HEP, IDA, IGI, NAS, HGI, IEP, IC, HDA to avoid circularity introduced from using inferred
GO annotations based on PPI data to infer more GO annotations using PPI data again.
Cell culture, transfection and cell death assay
Cell death assay was performed as described previously131. HeLa cells (obtained from American
Type Culture Collection) were maintained in DMEM supplemented with 10% FBS, 0.2 mM L-
glutamine, 100 U/ml penicillin and 100 µg/ml streptomycin (Invitrogen) at 37°C and 5% CO2.
Cells were plated onto 96-well imaging plates (BD Biosciences) and transient transfection was
performed using Lipofectamine 3000 according to the manufacturer’s instructions (Invitrogen).
After 24h in transfection reagent, the cells were imaged on a BD Pathway 855 Bioimager (BD
Biosciences) with a UAPO/340 20X objective (0.75 NA; Olympus). After 1 hour of imaging, cells
were treated with 100 ng/ml of recombinant human TRAIL Apo/2L (PeproTech). The
fluorescence signal and the time of death of transfected cells were calculated using ImageJ
(NIH) software.
To assess the significance of a correlation between levels of OTUD6A expression and
time of death, a Pearson correlation coefficient was calculated and its significance assessed by
comparison to the Pearson correlation coefficients of 100,000 shufflings of the cell death and
fluorescence measurements.
Generation of apoptosis candidate networks
Networks around OTUD6A and C6ORF222 were drawn with Cytoscape115 (v3.7.0). All
interaction partners of OTUD6A and C6ORF222 in HuRI were selected as well as indirect
interaction partners, if they had a known apoptosis GO annotation (restricted to those used in
the gene function prediction, see above), to visualize the network neighborhood used to obtain
the apoptosis prediction for the two candidate genes. This reference network was filtered using
transcript expression data from GTEx for colon_transverse (expression cutoff > 5) and transcript
expression data from the BLUEPRINT project61,62 for major eosinophils (log2(TPM+1) > 0.3).
The same expression data was used to adjust the size of the nodes in the network to reflect
transcript expression levels.
.CC-BY-NC-ND 4.0 International licenseIt is made available under a (which was not peer-reviewed) is the author/funder, who has granted bioRxiv a license to display the preprint in perpetuity.
The copyright holder for this preprint. http://dx.doi.org/10.1101/605451doi: bioRxiv preprint first posted online Apr. 10, 2019;

46
Analyses of tissue-specificity of Mendelian diseases
Quantification of tissue-specificity of Mendelian diseases and integration with tissue
gene expression data
Tissues affected in Mendelian diseases were manually curated as described in detail elsewhere
(Basha et al. manuscript in preparation). Briefly, disease information was downloaded from the
OMIM database118 and tissues were annotated to diseases within phenotypic series. Affected
tissues were matched to the 35 tissue names from GTEx. If brain was an affected tissue, all
three brain subregions for which transcriptome data from GTEx was available (see above for
processing of GTEx data), were assigned to the corresponding disease. Other tissues, such as
heart, were processed the same way. Annotated causal gene information from OMIM was
mapped and restricted to the protein-coding gene space.
The distribution for how many diseases affect how many tissues was calculated by
restricting the list of annotated Mendelian diseases and tissues to those where causal genes
showed to be expressed in at least one disease-associated tissue (GTEx tissue expression >
5). Tissues were grouped into tissue types (e.g. the three brain subregions were grouped into
brain) and tissue types were counted for each disease. Diseases with at most three tissue types
where the disease manifests were considered tissue-specific diseases and used in all
downstream analyses.
The diseases were split into those where all causal genes are TiP genes, some causal
genes are TiP genes and no causal gene is a TiP gene as follows. For a given disease, every
causal gene was assessed for its expression (expression > 5) in at least one of the annotated
affected tissues of the given disease and whether it is preferentially expressed or not in that
tissue (TiP value ≥ 2). For each disease, only causal genes that were expressed in at least one
affected tissue were considered. All these causal genes for a given disease were counted
based on their preferential expression and diseases grouped accordingly.
Test for significance of connectivity between causal proteins and TiP proteins in HuRI
To test for the significance of causal proteins of tissue-specific Mendelian diseases to interact
with preferentially expressed proteins of the corresponding disease-associated diseases
(hereafter referred to as disease tissues) we only considered those diseases where not a single
causal proteins was found to be preferentially expressed in any of the corresponding disease
tissues. Cutoffs were used as described above. For a given tissue only those HuRI PPIs were
considered that linked proteins both expressed in that tissue. For every tissue, all causal genes
.CC-BY-NC-ND 4.0 International licenseIt is made available under a (which was not peer-reviewed) is the author/funder, who has granted bioRxiv a license to display the preprint in perpetuity.
The copyright holder for this preprint. http://dx.doi.org/10.1101/605451doi: bioRxiv preprint first posted online Apr. 10, 2019;
47
are considered that are expressed in that tissue but that are not preferentially expressed in that
tissue and that are causal to a disease that specifically manifests in that tissue and where the
disease corresponds to the above mentioned criteria. No causal gene or interaction was
counted twice for the analysis within each tissue. The number of PPIs between these causal
proteins and TiP proteins for each tissue as well as the number of causal proteins with at least
one PPI to a TiP protein was determined for each tissue and compared to the distribution of the
same counts observed in 1,000 degree-controlled randomized networks that were generated
with the degree_sequence function in the python igraph library.
Experimental design of pairwise test in Y2H to test perturbation of PPIs between causal
proteins and TiP proteins by disease mutations
Causal proteins were selected as follows. Causal proteins from tissue-specific diseases were
considered, if that causal protein was expressed in a given disease tissue and interacted with a
TiP protein of that tissue where the causal protein itself was not preferentially expressed (cutoff
as described above) and the interaction between the causal protein and TiP protein was found
with the causal protein as DB fusion. For all assay versions in which a valid causal protein - TiP
protein interaction was found, all interactions from these assay versions found with the
corresponding causal protein as DB fusion were selected for pairwise test. Interactions involving
a causal protein with 30 or more interaction partners for a given assay version were removed to
control the size of the experiment. PRS v1 and RRS v1 pairs17 were tested along as positive
and negative control.
Cloning of disease mutations
Within the causal genes described above, we cloned variants that were annotated as
pathogenic or likely pathogenic in ClinVar71 (May 2015) and disease modifying in HGMD100
(v2016). Since then, ongoing reannotation efforts by ClinVar have classified some of these
pathogenic variants as benign, conflicting or variants of uncertain significance (VUS). We
generated the disease mutants by implementing an advanced high-throughput site-directed
mutagenesis pipeline68,132,133 with some modifications as described below. For each mutation,
two “primary PCRs” were performed to generate gene fragments containing the mutation and a
“stitch PCR” was performed to fuse the two fragments to obtain the mutated ORF. For the
primary PCRs, two universal primers (E2E forward and E2E reverse) and two ORF-specific
internal forwards and reverse primers were used. The two ORF-specific primers contained the
desired nucleotide change. The gene fragments generated by the primary PCRs were fused
.CC-BY-NC-ND 4.0 International licenseIt is made available under a (which was not peer-reviewed) is the author/funder, who has granted bioRxiv a license to display the preprint in perpetuity.
The copyright holder for this preprint. http://dx.doi.org/10.1101/605451doi: bioRxiv preprint first posted online Apr. 10, 2019;

48
together by the stitch PCR using the universal primers to generate the mutated ORF. The final
product was a full length ORF containing the mutation of interest. All the mutated ORFs were
cloned into Gateway donor vector, pDONR223, by a BP reaction followed by bacterial
transformation and selection by spectinomycin. Two single colonies were picked per
transformant. The mutated ORF was sequence confirmed by M13 PCR followed by pooling and
sequencing the PCR products on the Illumina platform. The reads were aligned to the reference
ORFs using bowtie 2103 (v2.2.3) and samtools134 (v1.2). Only those colonies with the correct
mutation, fully covered by the reads, and without other mutations were considered sequence-
confirmed. The confirmed colonies were rearrayed and assembled followed by LR reaction and
bacterial transformation to transfer the mutated ORFs in pDEST-DB. The plasmids were purified
and transformed into Y8930 yeast strain for the pairwise test.
Primers used for the experiment:
E2E forward: GGCAGACGTGCCTCACTACTACAACTTTGTACAAAAAAGTTGGC
E2E reverse: CTGAGCTTGACGCATTGCTAACAACTTTGTACAAGAAAGTTGG
M13-reverse: GTAACATCAGAGATTTTGAGACAC
M13-forward: CCCAGTCACGACGTTGTAAAACG
See Supplementary Table 29 for ORF-specific primers used in the mutagenesis.
Pairwise test of disease mutations
All sequence-confirmed pathogenic, likely pathogenic, and reclassified alleles for all selected
causal genes (see above) were subject to pairwise test along with the wild-type allele paired
with all interaction partners in the respective assay versions as described above. Before the
pairwise test was performed, the yeast strains containing the mutated or wild-type ORFs were
Sanger sequenced to confirm the presence or absence of the mutations. Considering that all the
entry clones used in the experiments have been full-length sequence verified, we were less
stringent to call that a clone is sequence confirmed. Specifically, for ORFs with mutations, if
either forward or reverse sanger reads confirmed the identity of the ORF and the presence of
the mutations and there was no contradictory between the two reads, the clone was considered
as sequence confirmed. Wild-type ORFs required one of the sanger reads confirming the
identity of the ORF and absence of any of the tested mutations, and no contradictory between
reads.
The pairwise test was performed in 96 well format. In all, 50 mutants in 17 genes/ORFs
were subjected to pairwise test. The ORFs were inoculated in SC-Leu and SC-Trp media
overnight and mated in YEPD media the following day. After incubation at 30ºC overnight, the
.CC-BY-NC-ND 4.0 International licenseIt is made available under a (which was not peer-reviewed) is the author/funder, who has granted bioRxiv a license to display the preprint in perpetuity.
The copyright holder for this preprint. http://dx.doi.org/10.1101/605451doi: bioRxiv preprint first posted online Apr. 10, 2019;

49
mated yeasts were transferred into SC-Leu-Trp media to select for diploids. Next day, the
diploid yeasts were spotted on SC-Leu-Trp-His+3AT, SC-Leu-His+3AT+CHX and SC-Leu-Trp
media to control for mating success. In parallel, we made lysates of all SC-Leu-Trp plates to
perform SWIM PCR as described in the primary screening section.
Sequence confirmation of pairwise test positives and negatives
SWIM PCR product was sequenced and the sequencing reads were analyzed as described
above in the primary screening section. Due to the short read length of the Illumina sequencing
and the design of SWIM-seq, absence or presence of a mutation on the ORF sequence could
not always be confirmed. Therefore, for a given pair, as long as the identities returned from the
pipeline matched the tested ORF and its partner, the pair was considered as sequence
confirmed. Both positives and negatives were sequenced and only combinations of sequence
confirmed pairs including both wild-type and mutated ORFs with same interacting partners were
included in the final analysis.
Processing of pairwise test data
Each spot was scored with a growth score ranging from 0 to 4, 0 being no growth, 1 being one
or two colonies, 2 being some colonies, 3 being lot’s of colonies, 4 being a big fat spot where no
individual colonies can be distinguished. Pairs for which the SC-Leu-Trp spot was scored as 3
or 4 and for which the CHX and the 3AT spot were valid (yeasts were spotted and no
contamination or other experimental failure) were considered as successfully tested.
Successfully tested pairs were further classified into auto-activators, if growth on CHX was >2 or
growth on CHX was = 1 and less than 3 on 3AT, else negatives, if there was no growth (growth
score = 0) on 3AT or positives if there was growth > 0 on 3AT and no growth on CHX or growth
> 2 and growth = 1 on CHX. Pairs were scored blindly with respect to their identity.
Analysis of PPI perturbation data
Only pairs that were successfully tested, classified as positive or negative, for which the wild-
type allele was classified as positive with a growth score ≥ 2, and that were sequence-confirmed
were considered for all further analysis. An interaction was considered perturbed by an allele, if
the growth score of the wild-type pair was at least 2 growth scores above the growth score for
that interaction with the respective allele. If an interaction involving an allele was tested in
multiple assay versions (because the wild-type PPI has been found in those originally), then a
final decision on that interaction for being perturbed or not was based on the results from the
.CC-BY-NC-ND 4.0 International licenseIt is made available under a (which was not peer-reviewed) is the author/funder, who has granted bioRxiv a license to display the preprint in perpetuity.
The copyright holder for this preprint. http://dx.doi.org/10.1101/605451doi: bioRxiv preprint first posted online Apr. 10, 2019;

50
assay version where the wild-type interaction reached the highest growth score (in case of ties,
order of priority was given to assay version 1, 2, 6). A causal gene was included in the analyses,
if first, there was at least one interaction with a TiP interaction partner that was positive with a
growth score ≥ 2 as wild-type and that was successfully tested (as defined above) for at least
one of the pathogenic alleles of that causal gene and second, if more than half of all interactions
of a causal protein subjected to pairwise test were classified as positive with a growth score ≥ 2.
Network visualizations were drawn with Cytoscape115 (v3.7.0).
Prediction and experimental confirmation of functionally divergent splice isoforms
Finding tissue-regulated splicing exon
For tissue-regulated alternative splicing information, we used a dataset78 previously defined in
49 tissues, which was kindly shared by members of the Blencowe lab, and is now publicly
available via vastDB135. For each of the events, we mapped Ensembl exon accession with
respect to their genome coordinate information. A tissue regulated exon was defined, if there is
more than 25% difference between maximum Percent Spliced-In (PSI) and minimum PSI (ΔPSI
> 25) as previously described78.
Finding protein domain regulated by alternative splicing and defining hub protein with
possible partial loss of protein-protein interactions
Based on the tissue-regulated exons we defined, we computationally derived the spliced-out
HuRI ORFs without the corresponding exon. After that, we translated it and mapped domains
for HuRI ORFs and the spliced-out HuRI ORFs with InterProScan136 (v5.16-55.0) with Pfam137
(v28.0). We restricted to domains that are previously known to mediate protein-protein
interactions using information from 3did79 (based on UniProt version 201804). The domains that
were missing in transcripts with spliced-out exons were defined as domains regulated by the
alternative splicing. If a spliced-out HuRI ORF partially loses its PPI-mediating domains, we
define that ORF as a possible candidate for partial PPI loss by tissue-regulated alternative
splicing (Supplementary Table 18).
Analysis of NCK2 isoform expression in brain samples
We gained the exon-specific RPKM (Reads Per Kilobase Million) from the Allen Institute for
Brain Science - BrainSpan Atlas of the Developing Human Brain138 (www.brainspan.org). To
.CC-BY-NC-ND 4.0 International licenseIt is made available under a (which was not peer-reviewed) is the author/funder, who has granted bioRxiv a license to display the preprint in perpetuity.
The copyright holder for this preprint. http://dx.doi.org/10.1101/605451doi: bioRxiv preprint first posted online Apr. 10, 2019;

51
estimate the fraction of exon A inclusion, we divided the RPKM of exon A by the average RPKM
of exon C1 and C2, which are two adjacent exons of exon A (Supplementary Table 19).
Pairwise test of interaction partners of NCK2 with short and long isoform
We used the orientation and Y2H assay version of the interactions where the corresponding
protein interactions were found in HuRI. The pairwise test of these interactions was done as
previously described139.
NCK2 function in Zebrafish
An antisense morpholino oligonucleotide, as well as a 5 nt-mismatched control morpholino
oligonucleotide (Gene Tools, Inc.), was designed to knockdown expression of zNCK2B
(ortholog of human NCK2) via inhibiting the removal of intron 2. Zebrafish embryos at the 1-cell
stage were microinjected with 5 ng of the antisense zNCK2B or control morpholinos, and
inhibition of splicing in zNCK2B was confirmed via RT-PCR at 1 dpf (days post fertilization;
forward exon 2: TACGGCACAACAAGACCAGG, exon3 reverse:
TTGACTATGGCCGGAGTGTT, intron2 reverse: CGTGTGCGGTCAAATTTATGC). To rescue
the zNCK2B knockdown, full length and short form zNCK2B and human NCK2 (hNCK2)
messenger RNA was cloned into the multiple cloning site of pCS2+MT, and transcribed with the
SP6 mMessage machine kit (ThermoFisher). Purified mRNA was microinjected into 1-cell stage
zebrafish embryos either alone, or in combination with the above morpholinos at a concentration
sufficient to yield 0.5 fmol RNA per embryo. zNCK2B knockdown and rescued embryos were
assayed at 48 hpf (hours post fertilization) for midbrain GFP expression in the zebrafish
enhancer trap line SAGFF(LF)223A, where GFP was inserted adjacent to lhx9140. Wild-type AB
embryos were similarly injected with zNCK2B or control morpholino and mRNA, fixed at 48 hpf
and assayed by whole mount in situ hybridization for lef1 expression as previously described141.
The midbrain specific lef1 expression domain was imaged and quantified by measuring the 2-
dimensional area with Image-J; the experimental groups were then compared via t-test with
MicroSoft Excel.
Data availability
The PPI data from this publication has been submitted to the IMEx
(http://www.imexconsortium.org) consortium through IntAct106 and assigned the identifier IM-
25472. HuRI, Lit-BM, and all previously published human interactome maps from CCSB are
.CC-BY-NC-ND 4.0 International licenseIt is made available under a (which was not peer-reviewed) is the author/funder, who has granted bioRxiv a license to display the preprint in perpetuity.
The copyright holder for this preprint. http://dx.doi.org/10.1101/605451doi: bioRxiv preprint first posted online Apr. 10, 2019;

52
available at http://interactome.dfci.harvard.edu/huri/ for search and download. All HuRI-related
networks generated and analyzed in this study are available at NDExbio.org142
(https://tinyurl.com/networks-HuRI-paper). The raw and analyzed proteomic data were
deposited in the PRIDE repository143 with the accession number PXD012321.
Code availability
Custom code used in this study has been made available as Supplementary Data 1 for the
reviewers and will be made public on github.com upon acceptance.
92. Yang, X. et al. A public genome-scale lentiviral expression library of human ORFs. Nat.
Methods 8, 659–661 (2011).
93. ORFeome Collaboration. The ORFeome Collaboration: a genome-scale human ORF-
clone resource. Nat. Methods 13, 191–192 (2016).
94. Seiler, C. Y. et al. DNASU plasmid and PSI:biology-materials repositories: resources to
accelerate biological research. Nucleic Acids Res. 42, D1253-1260 (2014).
95. Kent, W. J. BLAT - the BLAST-like alignment tool. Genome Res. 12, 656–664 (2002).
96. O’Leary, N. A. et al. Reference sequence (RefSeq) database at NCBI: current status,
taxonomic expansion, and functional annotation. Nucleic Acids Res. 44, D733-745 (2016).
97. Frankish, A. et al. GENCODE reference annotation for the human and mouse genomes.
Nucleic Acids Res. 47, D766–D773 (2019).
98. Altschul, S. F., Gish, W., Miller, W., Myers, E. W. & Lipman, D. J. Basic local alignment
search tool. J. Mol. Biol. 215, 403–410 (1990).
99. Edgar, R. C. MUSCLE: multiple sequence alignment with high accuracy and high
throughput. Nucleic Acids Res. 32, 1792–1797 (2004).
100. Stenson, P. D. et al. Human Gene Mutation Database (HGMD): 2003 update. Hum. Mutat.
21, 577–581 (2003).
101. Stellberger, T. et al. Improving the yeast two-hybrid system with permutated fusions
proteins: the Varicella Zoster Virus interactome. Proteome Sci. 8, 8 (2010).
102. Dreze, M. et al. High-quality binary interactome mapping. Methods Enzymol. 470, 281–
315 (2010).
103. Langmead, B. & Salzberg, S. L. Fast gapped-read alignment with Bowtie 2. Nat. Methods
9, 357–359 (2012).
104. Lawless, C., Wilkinson, D. J., Young, A., Addinall, S. G. & Lydall, D. A. Colonyzer:
.CC-BY-NC-ND 4.0 International licenseIt is made available under a (which was not peer-reviewed) is the author/funder, who has granted bioRxiv a license to display the preprint in perpetuity.
The copyright holder for this preprint. http://dx.doi.org/10.1101/605451doi: bioRxiv preprint first posted online Apr. 10, 2019;

53
automated quantification of micro-organism growth characteristics on solid agar. BMC
Bioinformatics 11, 287 (2010).
105. Licata, L. et al. MINT, the molecular interaction database: 2012 update. Nucleic Acids
Res. 40, D857-861 (2012).
106. Orchard, S. et al. The MIntAct project - IntAct as a common curation platform for 11
molecular interaction databases. Nucleic Acids Res. 42, D358-363 (2014).
107. Salwinski, L. et al. The database of interacting proteins: 2004 update. Nucleic Acids Res.
32, D449-451 (2004).
108. Launay, G., Salza, R., Multedo, D., Thierry-Mieg, N. & Ricard-Blum, S. MatrixDB, the
extracellular matrix interaction database: updated content, a new navigator and expanded
functionalities. Nucleic Acids Res. 43, D321-327 (2015).
109. Chatr-Aryamontri, A. et al. The BioGRID interaction database: 2017 update. Nucleic Acids
Res. 45, D369–D379 (2017).
110. Kerrien, S. et al. Broadening the horizon - level 2.5 of the HUPO-PSI format for molecular
interactions. BMC Biol. 5, 44 (2007).
111. Ono, K., Muetze, T., Kolishovski, G., Shannon, P. & Demchak, B. CyREST: turbocharging
Cytoscape access for external tools via a RESTful API. F1000Research 4, 478 (2015).
112. Csardi, G. & Nepusz, T. The igraph software package for complex network research.
InterJournal Complex Syst. 1695, 1–9 (2006).
113. Tsherniak, A. et al. Defining a cancer dependency map. Cell 170, 564–576 (2017).
114. Zhu, Q. et al. Targeted exploration and analysis of large cross-platform human
transcriptomic compendia. Nat. Methods 12, 211–214 (2015).
115. Shannon, P. et al. Cytoscape: a software environment for integrated models of
biomolecular interaction networks. Genome Res. 13, 2498–2504 (2003).
116. Ashburner, M. et al. Gene ontology: tool for the unification of biology. Nat. Genet. 25, 25–
29 (2000).
117. Berriz, G. F., King, O. D., Bryant, B., Sander, C. & Roth, F. P. Characterizing gene sets
with FuncAssociate. Bioinformatics 19, 2502–2504 (2003).
118. Amberger, J. S., Bocchini, C. A., Schiettecatte, F., Scott, A. F. & Hamosh, A. OMIM.org:
Online Mendelian Inheritance in Man (OMIM®), an online catalog of human genes and
genetic disorders. Nucleic Acids Res. 43, D789-798 (2015).
119. Harding, S. D. et al. The IUPHAR/BPS Guide to PHARMACOLOGY in 2018: updates and
expansion to encompass the new guide to IMMUNOPHARMACOLOGY. Nucleic Acids
Res. 46, D1091–D1106 (2018).
.CC-BY-NC-ND 4.0 International licenseIt is made available under a (which was not peer-reviewed) is the author/funder, who has granted bioRxiv a license to display the preprint in perpetuity.
The copyright holder for this preprint. http://dx.doi.org/10.1101/605451doi: bioRxiv preprint first posted online Apr. 10, 2019;
54
120. Tate, J. G. et al. COSMIC: the Catalogue Of Somatic Mutations In Cancer. Nucleic Acids
Res. 47, D941–D947 (2019).
121. Buniello, A. et al. The NHGRI-EBI GWAS Catalog of published genome-wide association
studies, targeted arrays and summary statistics 2019. Nucleic Acids Res. 47, D1005–
D1012 (2019).
122. Lambert, S. A. et al. The human transcription factors. Cell 172, 650–665 (2018).
123. Huttlin, E. L. et al. The BioPlex network: a systematic exploration of the human
interactome. Cell 162, 425–440 (2015).
124. Kim, D.-K. et al. EVpedia: an integrated database of high-throughput data for systemic
analyses of extracellular vesicles. J. Extracell. Vesicles 2, (2013).
125. Kim, D.-K., Lee, J., Simpson, R. J., Lötvall, J. & Gho, Y. S. EVpedia: A community web
resource for prokaryotic and eukaryotic extracellular vesicles research. Semin. Cell Dev.
Biol. 40, 4–7 (2015).
126. Hart, T. et al. Evaluation and design of genome-wide CRISPR/SpCas9 knockout screens.
G3 7, 2719–2727 (2017).
127. Choi, D. et al. The impact of oncogenic EGFRvIII on the proteome of extracellular vesicles
released from glioblastoma cells. Mol. Cell. Proteomics 17, 1948–1964 (2018).
128. Kim, H. J. et al. Time-evolving genetic networks reveal a NAC troika that negatively
regulates leaf senescence in Arabidopsis. Proc. Natl. Acad. Sci. U. S. A. 115, E4930–
E4939 (2018).
129. Xia, B. et al. Widespread transcriptional scanning in the testis modulates gene evolution
rates. bioRxiv 282129 (2019).
130. Jones, E., Oliphant, T. & Peterson, P. SciPy: open source scientific tools for python.
(2001). Available at: http://www.scipy.org/. (Accessed: 3rd April 2019)
131. Lee, R. E. C., Walker, S. R., Savery, K., Frank, D. A. & Gaudet, S. Fold-change of nuclear
NF-κB determines TNF-induced transcription in single cells. Mol. Cell 53, 867–879 (2014).
132. Zhong, Q. et al. Edgetic perturbation models of human inherited disorders. Mol. Syst. Biol.
5, 321 (2009).
133. Charloteaux, B. et al. Protein-protein interactions and networks: forward and reverse
edgetics. Methods Mol. Biol. 759, 197–213 (2011).
134. Li, H. et al. The Sequence Alignment/Map format and SAMtools. Bioinformatics 25, 2078–
2079 (2009).
135. Tapial, J. et al. An atlas of alternative splicing profiles and functional associations reveals
new regulatory programs and genes that simultaneously express multiple major isoforms.
.CC-BY-NC-ND 4.0 International licenseIt is made available under a (which was not peer-reviewed) is the author/funder, who has granted bioRxiv a license to display the preprint in perpetuity.
The copyright holder for this preprint. http://dx.doi.org/10.1101/605451doi: bioRxiv preprint first posted online Apr. 10, 2019;

55
Genome Res. 27, 1759–1768 (2017).
136. Jones, P. et al. InterProScan 5: genome-scale protein function classification.
Bioinformatics 30, 1236–1240 (2014).
137. El-Gebali, S. et al. The Pfam protein families database in 2019. Nucleic Acids Res. 47,
D427–D432 (2019).
138. Miller, J. A. et al. Transcriptional landscape of the prenatal human brain. Nature 508, 199–
206 (2014).
139. Betts, M. J. et al. Systematic identification of phosphorylation-mediated protein interaction
switches. PLoS Comput. Biol. 13, e1005462 (2017).
140. Kawakami, K. et al. zTrap: zebrafish gene trap and enhancer trap database. BMC Dev.
Biol. 10, 105 (2010).
141. Olsen, J. B. et al. G9a and ZNF644 physically associate to suppress progenitor gene
expression during neurogenesis. Stem Cell Rep. 7, 454–470 (2016).
142. Pratt, D. et al. NDEx, the Network Data Exchange. Cell Syst. 1, 302–305 (2015).
143. Perez-Riverol, Y. et al. The PRIDE database and related tools and resources in 2019:
improving support for quantification data. Nucleic Acids Res. 47, D442–D450 (2019).
.CC-BY-NC-ND 4.0 International licenseIt is made available under a (which was not peer-reviewed) is the author/funder, who has granted bioRxiv a license to display the preprint in perpetuity.
The copyright holder for this preprint. http://dx.doi.org/10.1101/605451doi: bioRxiv preprint first posted online Apr. 10, 2019;

hORFeo
me
v9.1
Tissue
s
Cell ty
pes
Cell lin
es0
5,000
10,000
15,000
20,000
Num
ber o
f gen
es
4,103 91513,305
hORFeome v9.1 Cell typesCell linesTissues
Reporter
ADBADBY2H
N-ter. C-ter.
0.0
0.1
MAPPIT
HuRI
Lit-B
MRRS
GPCA
HuRI
Lit-B
M
BioPlex
QUBIC
CoFrac
0.00
0.25
0.50
0.75
1.00
Fra
ctio
n di
rect
con
tact
2005
2014
2019
0
20,000
40,000
60,000
Num
ber o
f PP
Is
HI-unionLit-BM
1 2 3 4 5 6 7 8 9Number of screens
0
20,000
40,000
60,000
Cum
ulat
ive
num
ber o
f PP
Is
1 2 3 4 5 6 7 8 9Number of screens
0
2,000
4,000
6,000
8,000
Cum
ulat
ive
num
ber o
f pro
tein
s
Y2Hv1v2v3
0.0
0.1
Frac
tion
posi
tive
v1
v2
v3
Y2Hv1v2v3
a b c
d e
f g h i
Fig. 1 | Generation of a reference interactome map using a panel of binary assays. a, Overview of HuRI generation and applications. b, Number of protein-coding genes in hORFeome v9.1 and GTEx, FANTOM, and HPA transcriptome projects. c, Overlap between hORFeome v9.1 and intersection of transcriptomes in b. d, Schematic of the Y2H assay versions. e, Experimentalvalidation. PPIs were tested in GPCA (first six screens) and MAPPIT (all nine
screens). Lit-BM: literature-curated binary PPIs with multiple evidence; RRS: random protein pairs. Error bars are 68.3% Bayesian CI. f, g, Number of PPIs and proteins, detected with each additional screen. h, Fraction of direct contact pairs among five PPI networks. Error bars are standard error of proportion. i, Number of PPIs identified over time from screening at CCSB and Lit-BM.
+
*
+
Integration with context-specific genome, proteome and transcriptome data
17,500 proteins17
,500
pro
tein
s
Nine“all-by-all”screens
Isoform 1 Isoform 2 Mutated isoform 1
.CC-BY-NC-ND 4.0 International licenseIt is made available under a (which was not peer-reviewed) is the author/funder, who has granted bioRxiv a license to display the preprint in perpetuity.
The copyright holder for this preprint. http://dx.doi.org/10.1101/605451doi: bioRxiv preprint first posted online Apr. 10, 2019;
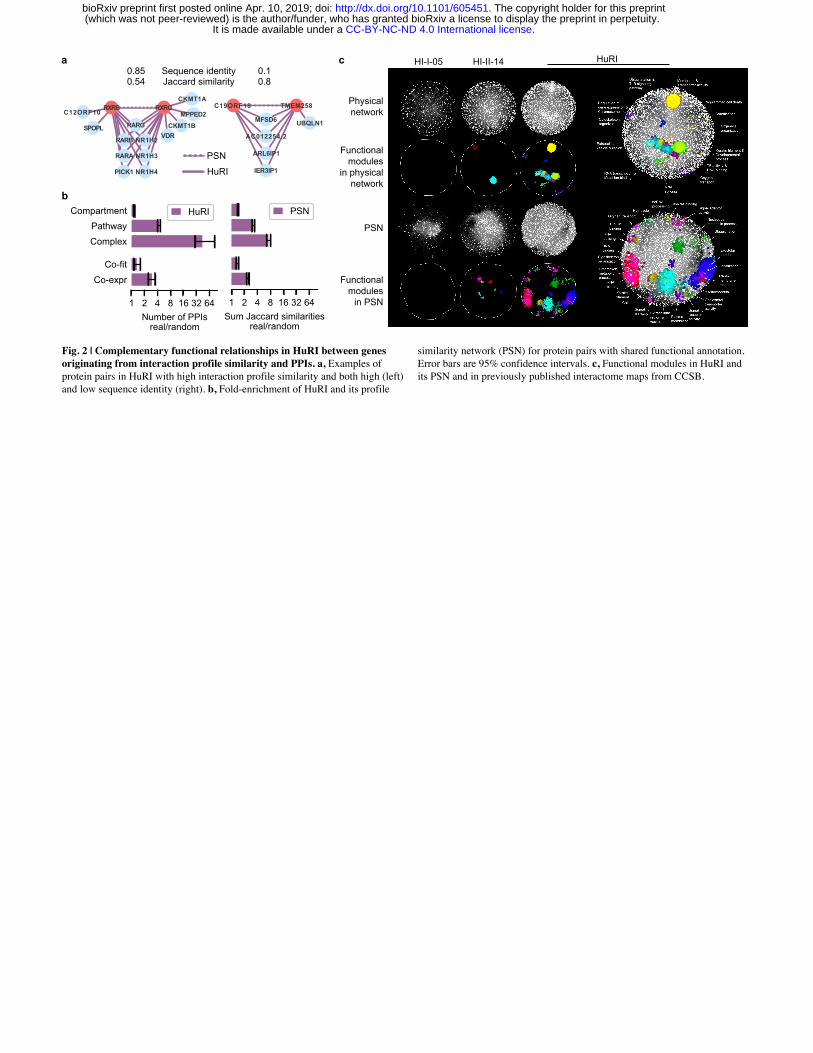
C12ORF10
NR1H2
NR1H4
RARG
PICK1
NR1H3
RXRB
RARA
RARB
SPOPL
CKMT1A
MPPED2CKMT1B
RXRG
VDR
Sequence identityJaccard similarity
UBQLN1MFSD6
ARL6IP1
TMEM258
IER3IP1
AC012254.2
C19ORF18
HuRI
PSN
HI-I-05 HI-II-14 HuRI
Physicalnetwork
Functionalmodules
in physicalnetwork
PSN
Functionalmodules
in PSN
a c
b
0.850.54
0.10.8
1 2 4 8 16 32 64Number of PPIs
real/random
CompartmentPathwayComplex
Co-fitCo-expr
HuRI
1 2 4 8 16 32 64Sum Jaccard similarities
real/random
PSN
Fig. 2 | Complementary functional relationships in HuRI between genes originating from interaction profile similarity and PPIs. a, Examples of protein pairs in HuRI with high interaction profile similarity and both high (left) and low sequence identity (right). b, Fold-enrichment of HuRI and its profile
similarity network (PSN) for protein pairs with shared functional annotation. Error bars are 95% confidence intervals. c, Functional modules in HuRI and its PSN and in previously published interactome maps from CCSB.
.CC-BY-NC-ND 4.0 International licenseIt is made available under a (which was not peer-reviewed) is the author/funder, who has granted bioRxiv a license to display the preprint in perpetuity.
The copyright holder for this preprint. http://dx.doi.org/10.1101/605451doi: bioRxiv preprint first posted online Apr. 10, 2019;
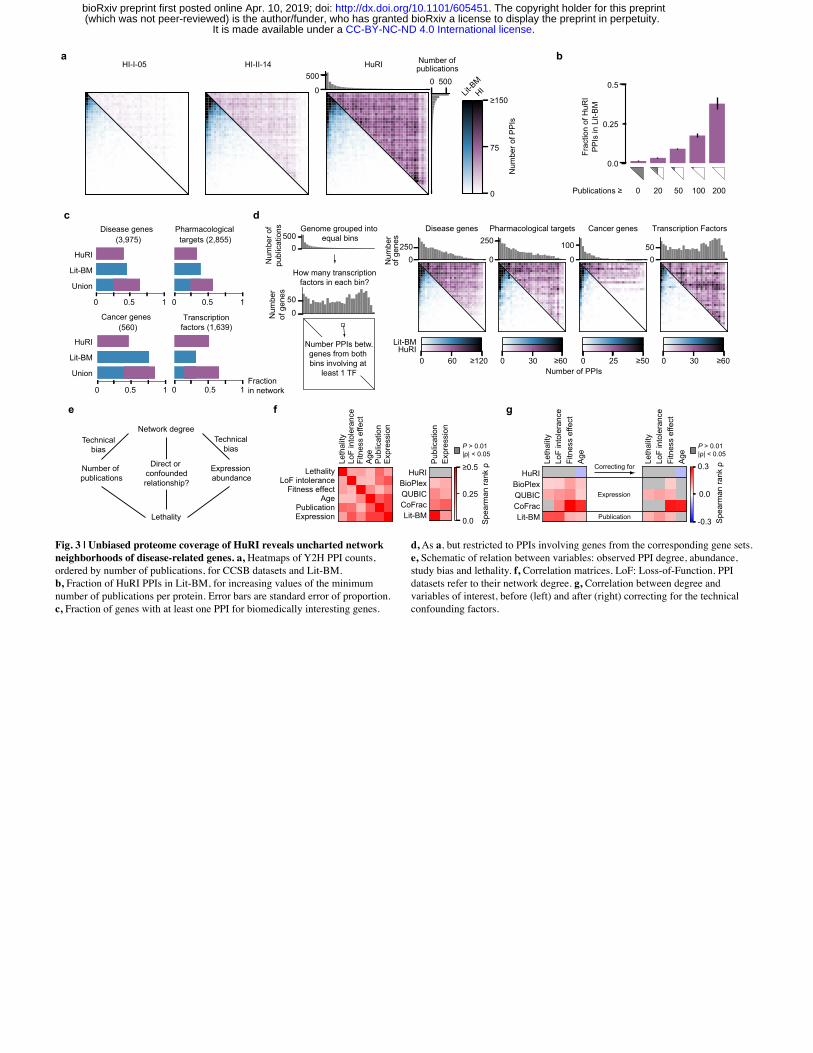
0
5000 500
Number ofpublications
HILit-B
M
HI-I-05 HI-II-14 HuRI
0 0.5 1
Union
Lit-BM
HuRI
Disease genes(3,975)
0 0.5 1
Pharmacologicaltargets (2,855)
0 0.5 1
Cancer genes(560)
0 0.5 1
Transcriptionfactors (1,639)
Fraction in network
0.0
0.25
0.5
Frac
tion
of H
uRI
PP
Is in
Lit-
BM
0 20 50 100 200Publications ≥
0500
0
50
Num
ber o
fpu
blic
atio
nsN
umbe
rof
gen
es
Genome grouped into equal bins
How many transcriptionfactors in each bin?
Number PPIs betw.genes from both bins involving at
least 1 TFUnion
Lit-BM
HuRI
a b
c d
Network degree
Lethality
Number of publications
Expression abundance
Technicalbias
Technicalbias
Direct or confoundedrelationship?
e
Pub
licat
ion
Exp
ress
ion
HuRIBioPlexQUBICCoFracLit-BM
0.0
0.25
≥0.5
Spe
arm
an ra
nk ρ
Leth
ality
LoF
into
lera
nce
Fitn
ess
effe
ctA
ge
-0.3
0.0
0.3
Spe
arm
an ra
nk ρ
HuRIBioPlexQUBICCoFracLit-BM
Leth
ality
LoF
into
lera
nce
Fitn
ess
effe
ctA
geP
ublic
atio
nE
xpre
ssio
n
LethalityLoF intolerance
Fitness effectAge
PublicationExpression
f
Leth
ality
LoF
into
lera
nce
Fitn
ess
effe
ctA
ge
Correcting for
Expression
Publication
g
0
75
≥150
Num
ber o
f PP
Is
P > 0.01 |ρ| < 0.05
P > 0.01 |ρ| < 0.05
0
250
Num
ber
of g
enes
Disease genes
0 60 ≥120Number of PPIs
0
250Pharmacological targets
0 30 ≥60
0
100
Cancer genes
0 25 ≥50
050
Transcription Factors
0 30 ≥60
Lit-BMHuRI
Fig. 3 | Unbiased proteome coverage of HuRI reveals uncharted network neighborhoods of disease-related genes. a, Heatmaps of Y2H PPI counts, ordered by number of publications, for CCSB datasets and Lit-BM. b, Fraction of HuRI PPIs in Lit-BM, for increasing values of the minimum number of publications per protein. Error bars are standard error of proportion. c, Fraction of genes with at least one PPI for biomedically interesting genes.
d, As a, but restricted to PPIs involving genes from the corresponding gene sets. e, Schematic of relation between variables: observed PPI degree, abundance, study bias and lethality. f, Correlation matrices. LoF: Loss-of-Function. PPI datasets refer to their network degree. g, Correlation between degree and variables of interest, before (left) and after (right) correcting for the technical confounding factors.
.CC-BY-NC-ND 4.0 International licenseIt is made available under a (which was not peer-reviewed) is the author/funder, who has granted bioRxiv a license to display the preprint in perpetuity.
The copyright holder for this preprint. http://dx.doi.org/10.1101/605451doi: bioRxiv preprint first posted online Apr. 10, 2019;

P > 0.05
1
-1
0
Log2
odd
s ra
tio
HuR
IBi
oPle
xQ
UBI
CLi
t-BM
CoF
rac
Number of EV proteomic studies with protein detected
46 367
Increasing network degree
600 700 800 900Number of PPIs between EV proteins
0.0
0.1
0.2
Frac
tion
of ra
ndom
net
wor
ks
HuRI
0 108 10100
108
1010Signif. decreasedNot signif. decreasedNot SDCBP interactor
Predicted EV recruiter
Predicted EV recruitee
Other EV protein
Wild-type EV+ MS
EV with knockout+ MS
HuRI PPIPerturbed PPI
Decreased proteins
CytosolNucleoplasm
Nuclear specklesNuclear bodies
NucleoliNucleus
Nucleoli fibrillar centerNuclear membrane
Golgi apparatusVesicles
Endoplasmic reticulumCell junctions
Plasma membraneFocal adhesion sites
MitochondriaCentrosome
Actin filamentsMicrotubules
Microtubule org. centerIntermediate filaments
Extracellular regionExtracellular vesicle
Protein amount in WT EV
Pro
tein
am
ount
in K
O E
V
LDHB
CALM1
CEP55
HPRT1
EIF5A
RNH1 SDCBP
a b
c d e
Fig. 4 | Identification of potential recruiters of proteins into extracellular vesicles. a, Odds ratios of proteins in different subcellular compartments and PPI datasets. b, The subnetwork of HuRI involving extracellular vesicle (EV) proteins. Names of high degree proteins are shown. c, Number of PPIs in
HuRI between EV proteins compared to the distribution from randomized networks (grey). d, Schematic of experimental design to test EV recruitment function of proteins. MS: Mass Spectrometry. e, Protein abundance from EVs for each gene in WT (wild-type) and SDCBP KO (knockout).
.CC-BY-NC-ND 4.0 International licenseIt is made available under a (which was not peer-reviewed) is the author/funder, who has granted bioRxiv a license to display the preprint in perpetuity.
The copyright holder for this preprint. http://dx.doi.org/10.1101/605451doi: bioRxiv preprint first posted online Apr. 10, 2019;

Brain
Heart
Liver*
Skeletal muscle
Skin*
StomachLung
Intestine
Adrenal gland
Pancreas
Kidney
NonTiP protein in tissueTiP protein in tissueTiP-nonTiP PPI
TiP-TiP PPI
TiP-TiP PPIs1.2%
TiP-nonTiP PPIs98.8% 5 10 15
Number TiP-TiP PPIs
0
100
Num
ber o
f ra
ndom
net
wor
ks
2.1 2.2 2.3Average
shortest path
0
100
200
Brain
0 2 4 6 8
0.0
0.4
0.8
1.2
HuRI
BioPlexLit-BMCoFracQUBIC
Tissue-pref. expr. cutoff
Rel
ativ
e fra
ctio
n pr
otei
ns in
net
wor
kExpected
a
d
c
e
all...12.7%
some...6.4%80.9%
no causal gene = pref. expr.
Tissue-specific diseases with
BrainCausal proteinTiP proteinNonTiP proteinPPI not testedPPI not perturbedPPI perturbed
f
g h
i
PGAP2
BAG3
PNKP
CTNNA3
DOLK
TECR
SUCLA2
GOSR2
CLN6
TMEM43
Perturbed
Unperturbed
PPI between causal protein and TiP protein:
Hyperphosphatasia with mentalretardation syndrome 3
Microcephaly, seizures, anddevelopmental delay
Mitochondrial DNA depletionsyndrome 5
Congenital disorder ofglycosylation
Mental retardation
Cardiomyopathy
Arrhythmogenic rightventricular dysplasia
Epilepsy
Ceroid lipofuscinosis, neuronal
Arrhythmogenic right ventricular dysplasiaEmery-Dreifuss muscular dystrophy
PNKP WTPro20Ser
Glu326Lys
Pro20SerGlu326Lys
PNKP WTPro20Ser
Glu326Lys
Perturbed Unperturbed
Basal gangliaCerebellumBrain other
CACFD1
CAMK2B
CARD10
CCDC14
CCDC43
CNTROB
COL17A1
FADS6
IKZF1KLHL12
MCCMSANTD4
PICK1PNMA5
PSTPIP1
RPRMSFT2D1
SNX2SP4
SYNGR1
SYNGR3
SYPTBC1D1
TNIP1TRIM37
XRCC4
ZBTB14
ZNF639
PNKP
0 4 8-4-8Tissue-preferential expression value
0 2 4 6 8Tissue-pref. expr. cutoff
10-2
10-1
100
Frac
tion
gene
s or
PP
Is
GenomeLit-BM
HuRI
b
Heart
Skeletal muscle
Skin
RPRMTNIP1
MGST2
TARBP2
TRIM37
CARD10CCDC43
KANK2PSTPIP1
FADS6CNTROB
SNX2KLHL12
CAMK2B
XRCC4
TBC1D1SP4
GAS8SYNGR3
SFT2D1
ZBTB14THAP1
SYNGR1CACFD1
ZNF639MSANTD4
MCC
RNF219CCDC14
PICK1
PNKP
Inverse of degree
Fig. 5 | Tissue-specific functions are largely mediated by interactions between TiP proteins and uniformly expressed proteins. a, Tissue-preferentially expressed (TiP) protein coverage by PPI networks for increasing levels of tissue-preferential expression. b, Fraction of HuRI and Lit-BM that involve TiP proteins compared to fraction of genome that are TiP genes for increasing levels of tissue-preferential expression. c, Tissue-preferential sub-networks with enlarged brain sub-network. *: tissues with TiP proteins being significantly close to each other (empirical P < 0.001). d, Fraction of PPIs between TiP-TiP proteins in brain. e, Empirical test of closeness of TiP proteinsin the brain sub-network. f, Tissue-specific diseases split by tissue-preferential
expression levels of causal genes. g, Network neighborhood of uniformly expressed causal proteins of tissue-specific diseases found to interact with TiP proteins in HuRI, indicating PPI perturbation by mutations. h, Causal genes split by mutation found to perturb PPI to TiP protein (dashed) or not (solid). i, Expression profile of PNKP and interactors in brain tissues and PPI perturbation pattern of disease causing (Glu326Lys) and benign (Pro20Ser) mutation. Yeast growth phenotypes on SC-Leu-Trp (upper) or SC-Leu-Trp-His+3AT media (lower) are shown, green/grey gene symbols: preferentially/not expressed.
.CC-BY-NC-ND 4.0 International licenseIt is made available under a (which was not peer-reviewed) is the author/funder, who has granted bioRxiv a license to display the preprint in perpetuity.
The copyright holder for this preprint. http://dx.doi.org/10.1101/605451doi: bioRxiv preprint first posted online Apr. 10, 2019;

Long proteinShort protein
Long isoformShort isoform
NCK2
C1 A C2
C1 C2
SH3 SH3 SH3 SH2
SH3 *Relative
expression levels of
isoform A and B
Tissues
GeneIsoform AIsoform B
A B
Protein AProtein B
Pairwise test In vivo test
Amygdaloid complexAnterior cingulate cortexCerebellar cortexDorsolateral prefrontal cortexHippocampusInferolateral temporal cortexMediodorsal nucleus of thalamusOrbital frontal cortexPosterior superior temporal cortexPosteroventral parietal cortexPrimary auditory cortexPrimary motor cortexPrimary somatosensory cortexPrimary visual cortexStriatumVentrolateral prefrontal cortex
Fraction of exon A inclusion
After birthBefore birth
Age
0
5,000
10,000
15,000
20,000Control MO zNCK2B MO
zNCK2B MO+ hNCK2
short isoform
Lef1
exp
ress
ion
dom
ain
area
(µm
2 )
***
n.s.
***
**
***
***n.s.
a b c
d
e
1.00.0 0.5
Long
Short
Long
Short -
NC
K2
Perturbed
Unperturbed
ABI1ABI3
BCAR1
CHN1CHN2
FAM10
9A
LCP2
NCKIPSD
NET1NFKBID
SHDSOCS7
SRMSSYNGAP1
TXKIsoform:
hNCK2long isoform
zNCK2B MO+ hNCK2
long isoformhNCK2
short isoform
Lef1
I II III IV V VI I II III IV V VI
Fig. 6 | Distinct function of a long and short uncharacterized isoform of NCK2 in brain. a, Workflow for predicting and confirming functionally distinct alternative isoforms from the same gene. Rectangles: exons; ovals: protein domains. b, Schematic of isoform structure of NCK2. C1, A, C2: constitutive and alternative exons; *: alternative stop codon; rectangles: exons; ovals: protein domains. c, Relative NCK2 exon A inclusion in different brain
samples. d, Pairwise test of long and short isoform of NCK2 with interaction partners in HuRI. Yeast growth phenotypes on SC-Leu-Trp (upper) or SC-Leu-Trp-His+3AT media (lower) are shown. e, In vivo test of distinct functions of NCK2 isoforms. ***, **, *: P < 0.001, 0.01, 0.05; n.s.: not significant by two-sided t-test with n>10; MO: morpholino; zNCK2B: long isoform of NCK2 ortholog in zebrafish. Error bars are standard error.
.CC-BY-NC-ND 4.0 International licenseIt is made available under a (which was not peer-reviewed) is the author/funder, who has granted bioRxiv a license to display the preprint in perpetuity.
The copyright holder for this preprint. http://dx.doi.org/10.1101/605451doi: bioRxiv preprint first posted online Apr. 10, 2019;
Copyright © 2022 FDOKUMEN