Assessing optical music recognition tools
16
Assessing Optical Music Recognition Tools P. Bellini, I. Bruno, P. Nesi Dep. of Systems and Informatic University of Florence Via S. Marta, 3 50139 Florence, Italy +39 055 4796425, +39 055 4796365, +39 055 4796523 [email protected], [email protected], [email protected], 1 Introduction The Optical Music Recognition task is more complex than OCR. Despite to the availability of several commercial OMRs: SharpEye2, SmartScore, Photoscore, CapellaScan, etc., none of these is satisfactory in terms of precision and reliability. The efficiency declared by the each distributor is close to 90%, but this value is obtained only when quite regular music sheets are processed and the estimation is not always objective. In the character or face recognition field, there are many ground truth databases that enable recognition results to be evaluated automatically and objectively. At the present time, there is neither a standard database for music score recognition or a standard terminology. If a new recognition algorithm or system were proposed, it could not be compared with the other algorithms or systems since the results would have to be traditionally evaluated with different scores and different methods. Taking these facts into consideration, it is indispensable to make a master music score database that can be used to objectively and automatically evaluate the music score recognition system. At the same time a set of rules and metrics are needed in order to define what aspects have to be considered in the evaluation. 2 Evaluation methodologies for OMR application To cope with the lack of standard methodologies, a study for the definition of OMR performance evaluation models has been conducted. Actually, the study is in progress and is focussed to monophonic music score. The chosen solution has been addressed in defining two evaluation methodologies. 2.1 EVALUATION OF BASIC SYMBOLS RECOGNITION This is a low-level analysis where the recognition of each basic symbols and to consider them independently each other is measured. An elementary information is assigned to each symbol and its recognition constitutes the first step in the reconstruction of complete music symbols. In these terms, this kind of evaluation allows considering the capacity of the system in recognising elementary information. A set of basic symbols has been defined on the basis of examples considered as test images. For each category of symbols the following metrics have been defined: 1. The occurrence number E i of expected symbols (Expected) for each category counted in the original score. 2. The occurrence number T i of correct symbols (True), counted in the reconstructed score respect of the original score. 3. The occurrence number F i of confused symbols (False), added or wrong symbols counted in the reconstructed score respect of the original score. 4. The occurrence number M i of missed symbols (Miss), symbols not recognised but that are in the original score. 5. The measurement of each metric is done by counting basic symbols located in the original score and afterwards by repeating the counting in the reconstructed score. Considering as: N the number of categories; N i i tot E E 1 , the total number of expected basic symbols; the following evaluation indexes have been defined:
-
Upload
independent -
Category
Documents
-
view
3 -
download
0
Transcript of Assessing optical music recognition tools

Assessing Optical Music Recognition Tools P. Bellini, I. Bruno, P. Nesi
Dep. of Systems and Informatic University of Florence Via S. Marta, 3 50139 Florence, Italy
+39 055 4796425, +39 055 4796365, +39 055 4796523 [email protected], [email protected], [email protected],
1 Introduction The Optical Music Recognition task is more complex than OCR. Despite to the availability of several commercial OMRs: SharpEye2, SmartScore, Photoscore, CapellaScan, etc., none of these is satisfactory in terms of precision and reliability. The efficiency declared by the each distributor is close to 90%, but this value is obtained only when quite regular music sheets are processed and the estimation is not always objective. In the character or face recognition field, there are many ground truth databases that enable recognition results to be evaluated automatically and objectively. At the present time, there is neither a standard database for music score recognition or a standard terminology. If a new recognition algorithm or system were proposed, it could not be compared with the other algorithms or systems since the results would have to be traditionally evaluated with different scores and different methods. Taking these facts into consideration, it is indispensable to make a master music score database that can be used to objectively and automatically evaluate the music score recognition system. At the same time a set of rules and metrics are needed in order to define what aspects have to be considered in the evaluation. 2 Evaluation methodologies for OMR application To cope with the lack of standard methodologies, a study for the definition of OMR performance evaluation models has been conducted. Actually, the study is in progress and is focussed to monophonic music score. The chosen solution has been addressed in defining two evaluation methodologies.
2.1 EVALUATION OF BASIC SYMBOLS RECOGNITION
This is a low-level analysis where the recognition of each basic symbols and to consider them independently each other is measured. An elementary information is assigned to each symbol and its recognition constitutes the first step in the reconstruction of complete music symbols. In these terms, this kind of evaluation allows considering the capacity of the system in recognising elementary information. A set of basic symbols has been defined on the basis of examples considered as test images. For each category of symbols the following metrics have been defined: 1. The occurrence number Ei of expected symbols (Expected) for each category counted in the original
score. 2. The occurrence number Ti of correct symbols (True), counted in the reconstructed score respect of the
original score. 3. The occurrence number Fi of confused symbols (False), added or wrong symbols counted in the
reconstructed score respect of the original score. 4. The occurrence number Mi of missed symbols (Miss), symbols not recognised but that are in the original
score. 5. The measurement of each metric is done by counting basic symbols located in the original score and
afterwards by repeating the counting in the reconstructed score. Considering as: N the number of categories;
N
i
itot EE1
, the total number of expected basic symbols;
the following evaluation indexes have been defined:

1. Percentage Recognition Rate
1001
tot
N
i
i
R E
T
T
2. Weighted Percentage Recognition Rate
1001
1
1
N
i
i
N
i
ii
totR
p
Tp
ETW
where: pi stands for the relevance (weight) given to each basic symbol. The range for weights is [1,10], where
10 means high relevance. 3. Percentage Confusion Rate (or Recognition Noise)
1001
tot
N
i
i
R E
F
TC
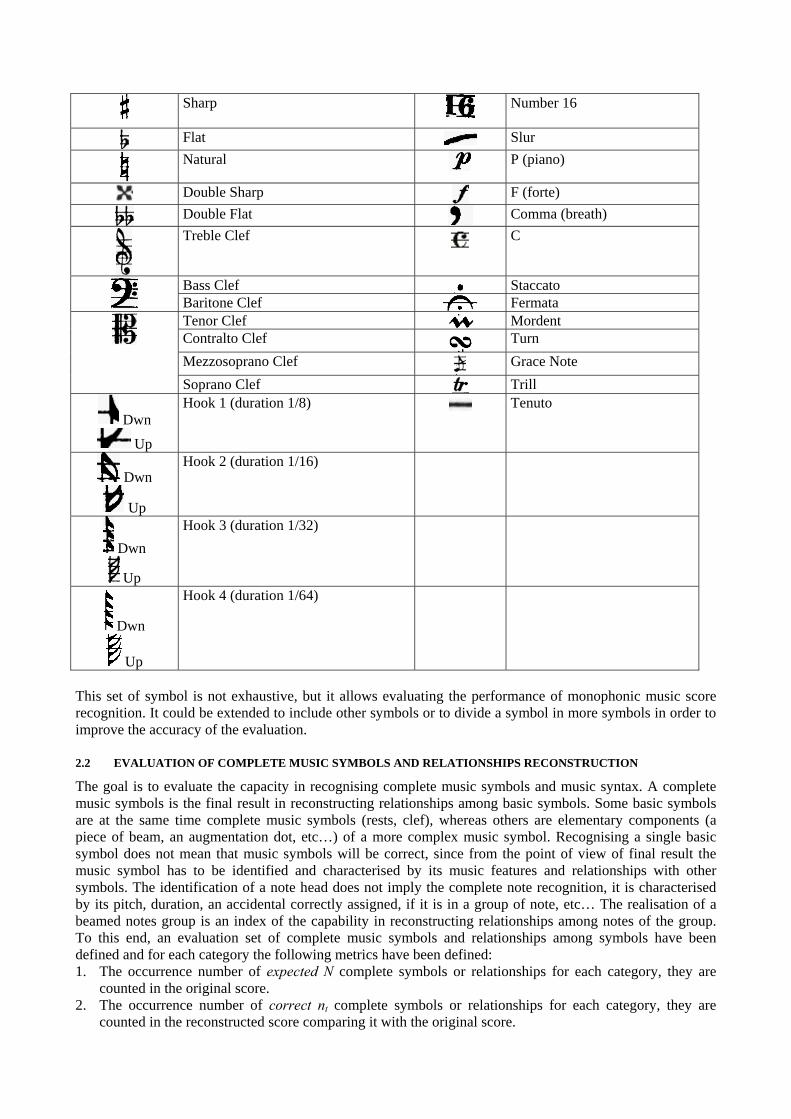
The set of considered basic symbols is reported in the following table:
Symbol Name Symbol Name Empty Note Head duration 4/4
Beam 1 (duration 1/8)
Empty Note Head duration 2/4
Beam 2 (duration 1/16)
Black Note Head duration ¼ -> 1/64
Beam 3 (duration 1/32)
Rest duration 4/4 Beam 4 (duration 1/64)
Rest duration 2/4 Augmentation Dot
Rest duration 1/4 Accent
Rest duration 1/8
Number 1
Rest duration 1/16
Number 2
Rest duration 1/32
Number 3
Rest duration 1/64 Number 4
Barline Single
Number 5
Barline Double
Number 6
Barline End
Number 8
Barline Start Refrain Number 9
Barline End Refrain Number 12
Sharp
Number 16
Flat Slur
Natural P (piano)
Double Sharp F (forte)
Double Flat Comma (breath)
Treble Clef
C
Bass Clef Staccato Baritone Clef Fermata
Tenor Clef Mordent Contralto Clef Turn
Mezzosoprano Clef Grace Note
Soprano Clef Trill
Dwn
Up
Hook 1 (duration 1/8) Tenuto
Dwn
Up
Hook 2 (duration 1/16)
Dwn
Up
Hook 3 (duration 1/32)
Dwn
Up
Hook 4 (duration 1/64)
This set of symbol is not exhaustive, but it allows evaluating the performance of monophonic music score recognition. It could be extended to include other symbols or to divide a symbol in more symbols in order to improve the accuracy of the evaluation.
2.2 EVALUATION OF COMPLETE MUSIC SYMBOLS AND RELATIONSHIPS RECONSTRUCTION
The goal is to evaluate the capacity in recognising complete music symbols and music syntax. A complete music symbols is the final result in reconstructing relationships among basic symbols. Some basic symbols are at the same time complete music symbols (rests, clef), whereas others are elementary components (a piece of beam, an augmentation dot, etc…) of a more complex music symbol. Recognising a single basic symbol does not mean that music symbols will be correct, since from the point of view of final result the music symbol has to be identified and characterised by its music features and relationships with other symbols. The identification of a note head does not imply the complete note recognition, it is characterised by its pitch, duration, an accidental correctly assigned, if it is in a group of note, etc… The realisation of a beamed notes group is an index of the capability in reconstructing relationships among notes of the group. To this end, an evaluation set of complete music symbols and relationships among symbols have been defined and for each category the following metrics have been defined: 1. The occurrence number of expected N complete symbols or relationships for each category, they are
counted in the original score. 2. The occurrence number of correct nt complete symbols or relationships for each category, they are
counted in the reconstructed score comparing it with the original score.

3. The occurrence number of added na complete symbols or relationships for each category, they are counted in the reconstructed score comparing it with the original score.
4. The occurrence number of fault nf complete symbols or relationships for each category, they are counted in the reconstructed score comparing it with the original score.
5. The occurrence number of missed nm complete symbols or relationships for each category, symbols or relationships not recognised but that are in the original score. They are counted in the reconstructed score comparing it with the original score.
For each category the following equation is valid:
N = nt + nf + nm
This evaluation method extends the previous and is characterised by a more accurate analysis, in fact a music symbol or a relationship is considered correct if basic symbols and music symbols that are involved in the relationship are correct. For this reason, this kind of evaluation is more severe than the previous one. Considering as: M the total number of symbols and relationships;
M
i
itot NE1
, the total number of expected symbols and relationships;
the following evaluation indexes have been defined: 1. Percentage Reconstruction Rate
1001
)(
Retot
M
i
it
c E
n
T
2. Weighted Percentage Reconstruction Rate
1001
1
1
)(
Re
M
i
i
M
i
iti
totc
p
np
ETP
where: pi stands for the relevance (weight) given to each basic symbol or relationship. The range for weights is
[1,10], where 10 means high relevance. 3. Percentage Reconstruction Error
1001
)()()(
Retot
M
i
im
ia
if
c E
nnn
E
The list of categories used during the test is reported below. For each category is described how to measure metrics. This evaluation set is not exhaustive for all genre of music score, it could be extended in order to include more aspects (structural, symbolic, etc…). The proposed list is able to describe the monophonic music score and relationships, and the most important and frequent symbols.
Note with pitch and duration The aim is to evaluate the note reconstruction correctness in terms of pitch and duration. It has to be considered: Correct, when its pitch and duration are correct. Fault, when its pitch or duration is wrong; Miss, when the note shape is not in the reconstructed score;
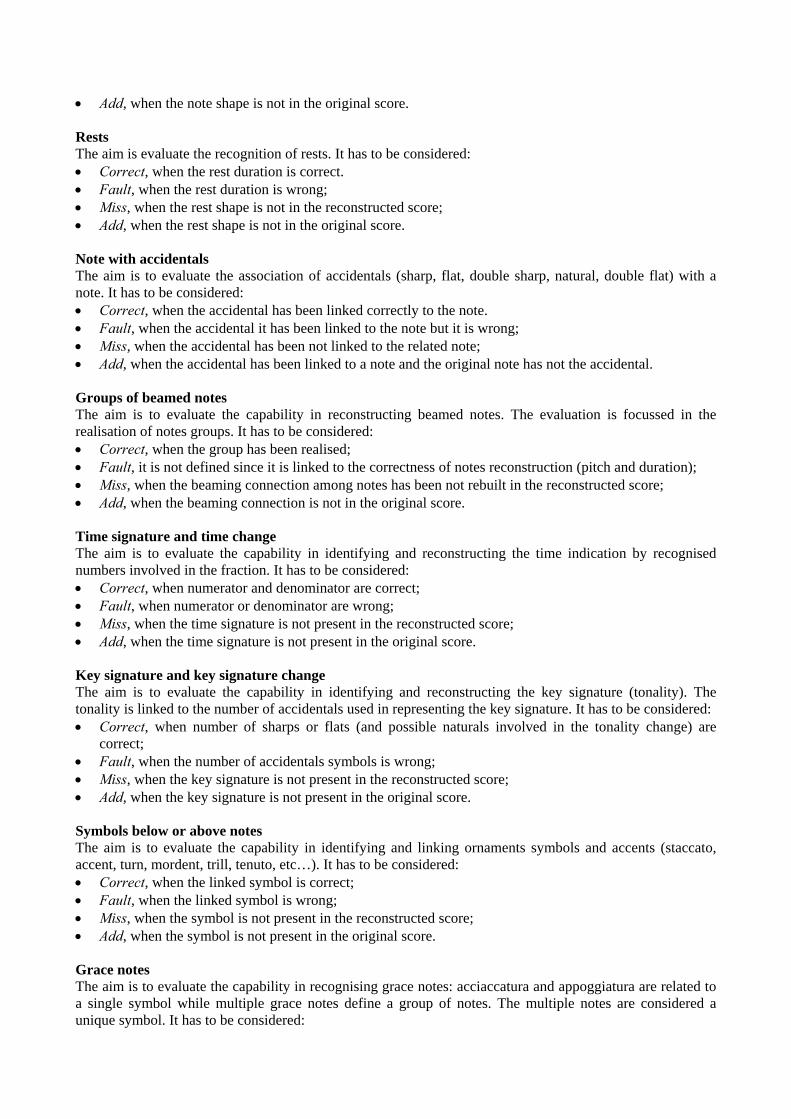
Add, when the note shape is not in the original score. Rests The aim is evaluate the recognition of rests. It has to be considered: Correct, when the rest duration is correct. Fault, when the rest duration is wrong; Miss, when the rest shape is not in the reconstructed score; Add, when the rest shape is not in the original score. Note with accidentals The aim is to evaluate the association of accidentals (sharp, flat, double sharp, natural, double flat) with a note. It has to be considered: Correct, when the accidental has been linked correctly to the note. Fault, when the accidental it has been linked to the note but it is wrong; Miss, when the accidental has been not linked to the related note; Add, when the accidental has been linked to a note and the original note has not the accidental. Groups of beamed notes The aim is to evaluate the capability in reconstructing beamed notes. The evaluation is focussed in the realisation of notes groups. It has to be considered: Correct, when the group has been realised; Fault, it is not defined since it is linked to the correctness of notes reconstruction (pitch and duration); Miss, when the beaming connection among notes has been not rebuilt in the reconstructed score; Add, when the beaming connection is not in the original score. Time signature and time change The aim is to evaluate the capability in identifying and reconstructing the time indication by recognised numbers involved in the fraction. It has to be considered: Correct, when numerator and denominator are correct; Fault, when numerator or denominator are wrong; Miss, when the time signature is not present in the reconstructed score; Add, when the time signature is not present in the original score. Key signature and key signature change The aim is to evaluate the capability in identifying and reconstructing the key signature (tonality). The tonality is linked to the number of accidentals used in representing the key signature. It has to be considered: Correct, when number of sharps or flats (and possible naturals involved in the tonality change) are
correct; Fault, when the number of accidentals symbols is wrong; Miss, when the key signature is not present in the reconstructed score; Add, when the key signature is not present in the original score. Symbols below or above notes The aim is to evaluate the capability in identifying and linking ornaments symbols and accents (staccato, accent, turn, mordent, trill, tenuto, etc…). It has to be considered: Correct, when the linked symbol is correct; Fault, when the linked symbol is wrong; Miss, when the symbol is not present in the reconstructed score; Add, when the symbol is not present in the original score. Grace notes The aim is to evaluate the capability in recognising grace notes: acciaccatura and appoggiatura are related to a single symbol while multiple grace notes define a group of notes. The multiple notes are considered a unique symbol. It has to be considered:

Correct, when grace notes are correct all the features (pitch, duration, type of grace note) are perfectly reconstructed;
Fault, when a feature among pitch, duration and type of grace note is wrong; Miss, when grace notes are not present in the reconstructed score; Add, when grace notes are not present in the original score. Slurs and bends The aim is to evaluate the reconstruction of horizontal symbols: slurs (and ties) and bends. It has to be considered: Correct, when the start and the end note are correct; Fault, when the start or the end note is not correct; Miss, when the slur or bend is not present in the reconstructed score; Add, when the slur or bend is not present in the original score. Augmentation dots The aim is to evaluate the augmentation dots linking to notes. In presence of multiple dots, they have to be counted one by one. It has to be considered: Correct, when the augmentation dot has been linked to the note correctly; Fault, this condition is equivalent to the Miss case; Miss, when the augmentation dot has not been linked to the note; Add, when the augmentation dot is not present in the note of the original score. Clefs The aim is to evaluate the recognition of clefs and clef changes. A symbol can indicate different clefs, for instance Alto clef and Baritone clef. In these cases the position in the staff and the shape have to be taken in account. It has to be considered: Correct, when shape and position are correct; Fault, when shape or position are not correct; Miss, when the clef is not present in the reconstructed score; Add, when the clef is not present in the original score. Irregular notes groups The aim is to evaluate the capability in recognising tuplets. An irregular group is a set of notes not necessarily beamed and with a numeric indication that defines the kind of tuplet. It has to be considered: Correct, when group of note is in effect an irregular group and the numeric indication is correct; Fault, when the group of notes is in effect an irregular group but the numeric indication is not correct; Miss, when the irregular group has not been recognised; Add, when the identified group is not an irregular group in the original score. Number of measures The aim is to evaluate the capability in recognising the bar line and the number of measures. The recognition of bar lines could generate different error in measure reconstruction: fusion of measures, adding empty measures, measure fragmentation. It has to be considered: Correct, when a measure of the original score is detectable in the reconstructed score; Fault, this condition is equivalent to the Miss case; Miss, when a measure of the original score is not detectable in the reconstructed score (the missed
recognition of a bar line could generate the fusion of two consecutive measure. In this case a measure is lost and then it has to be counted as Miss, while the reconstructed one could be considered right);
Add, when the measure is not present in the original score or a measure has been divided in two measures.
Number of staves The aim is to evaluate the capability in recognising staves. It has to be considered: Correct, when a measure of the original score is detectable in the reconstructed score;
Fault, when the staff has different features (number of lines); Miss, when the staff has been not identified; Add, when the staff is not the original score.
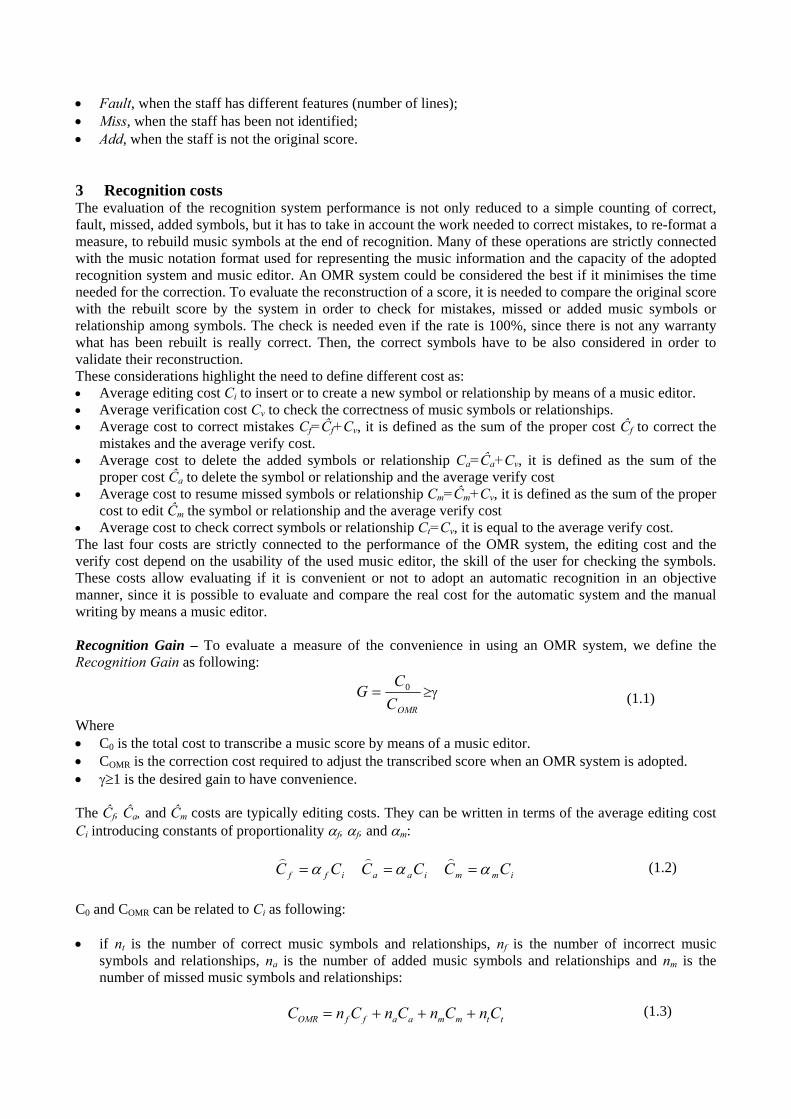
3 Recognition costs The evaluation of the recognition system performance is not only reduced to a simple counting of correct, fault, missed, added symbols, but it has to take in account the work needed to correct mistakes, to re-format a measure, to rebuild music symbols at the end of recognition. Many of these operations are strictly connected with the music notation format used for representing the music information and the capacity of the adopted recognition system and music editor. An OMR system could be considered the best if it minimises the time needed for the correction. To evaluate the reconstruction of a score, it is needed to compare the original score with the rebuilt score by the system in order to check for mistakes, missed or added music symbols or relationship among symbols. The check is needed even if the rate is 100%, since there is not any warranty what has been rebuilt is really correct. Then, the correct symbols have to be also considered in order to validate their reconstruction. These considerations highlight the need to define different cost as: Average editing cost Ci to insert or to create a new symbol or relationship by means of a music editor. Average verification cost Cv to check the correctness of music symbols or relationships. Average cost to correct mistakes Cf=Ĉf+Cv, it is defined as the sum of the proper cost Ĉf to correct the
mistakes and the average verify cost. Average cost to delete the added symbols or relationship Ca=Ĉa+Cv, it is defined as the sum of the
proper cost Ĉa to delete the symbol or relationship and the average verify cost Average cost to resume missed symbols or relationship Cm=Ĉm+Cv, it is defined as the sum of the proper
cost to edit Ĉm the symbol or relationship and the average verify cost Average cost to check correct symbols or relationship Ct=Cv, it is equal to the average verify cost. The last four costs are strictly connected to the performance of the OMR system, the editing cost and the verify cost depend on the usability of the used music editor, the skill of the user for checking the symbols. These costs allow evaluating if it is convenient or not to adopt an automatic recognition in an objective manner, since it is possible to evaluate and compare the real cost for the automatic system and the manual writing by means a music editor. Recognition Gain – To evaluate a measure of the convenience in using an OMR system, we define the Recognition Gain as following:
OMRC
CG 0
Where C0 is the total cost to transcribe a music score by means of a music editor. COMR is the correction cost required to adjust the transcribed score when an OMR system is adopted. 1 is the desired gain to have convenience. The Ĉf, Ĉa, and Ĉm costs are typically editing costs. They can be written in terms of the average editing cost Ci introducing constants of proportionality f, f, and m:
immiaaiff CCCCCC
C0 and COMR can be related to Ci as following:
if nt is the number of correct music symbols and relationships, nf is the number of incorrect music
symbols and relationships, na is the number of added music symbols and relationships and nm is the number of missed music symbols and relationships:
ttmmaaffOMR CnCnCnCnC
(1.1)
(1.2)
(1.3)
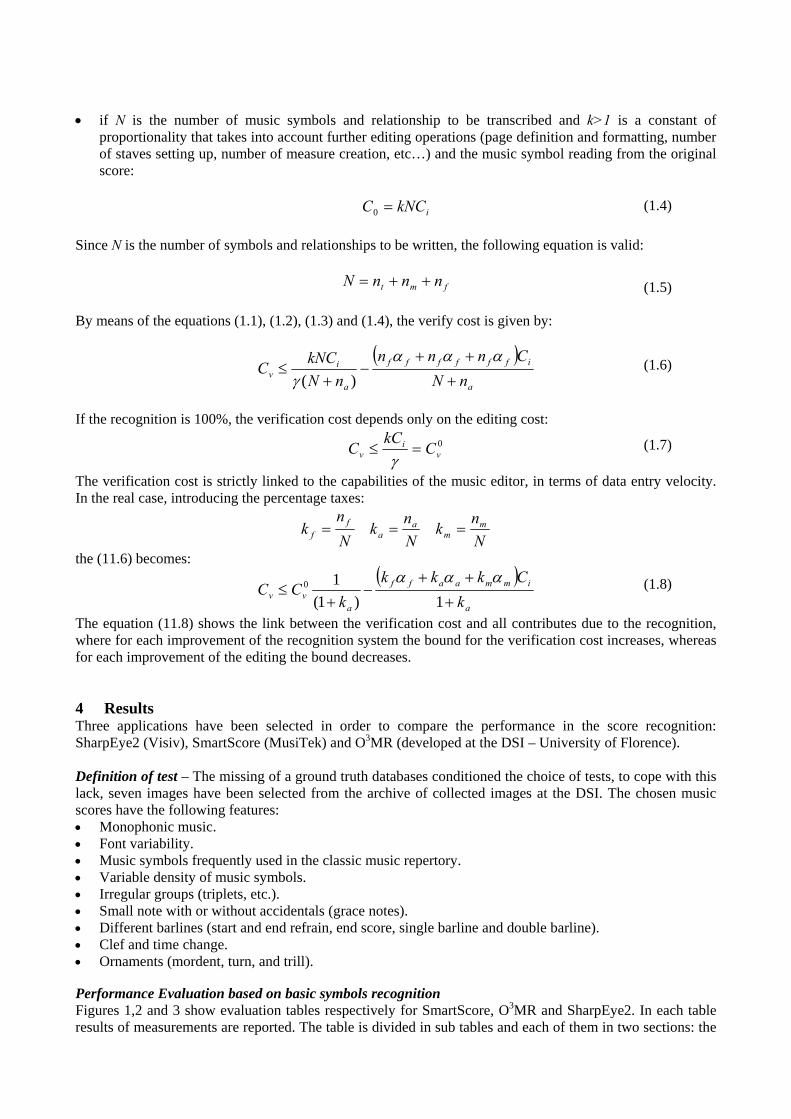
if N is the number of music symbols and relationship to be transcribed and k>1 is a constant of
proportionality that takes into account further editing operations (page definition and formatting, number of staves setting up, number of measure creation, etc…) and the music symbol reading from the original score:
ikNCC 0
Since N is the number of symbols and relationships to be written, the following equation is valid:
fmt nnnN
By means of the equations (1.1), (1.2), (1.3) and (1.4), the verify cost is given by:
a
iffffff
a
iv nN
Cnnn
nN
kNCC
)(
If the recognition is 100%, the verification cost depends only on the editing cost:
0v
iv C
kCC
The verification cost is strictly linked to the capabilities of the music editor, in terms of data entry velocity. In the real case, introducing the percentage taxes:
N
nk
N
nk
N
nk m
ma
af
f
the (11.6) becomes:
a
immaaff
avv k
Ckkk
kCC
1)1(
10
The equation (11.8) shows the link between the verification cost and all contributes due to the recognition, where for each improvement of the recognition system the bound for the verification cost increases, whereas for each improvement of the editing the bound decreases. 4 Results Three applications have been selected in order to compare the performance in the score recognition: SharpEye2 (Visiv), SmartScore (MusiTek) and O3MR (developed at the DSI – University of Florence). Definition of test – The missing of a ground truth databases conditioned the choice of tests, to cope with this lack, seven images have been selected from the archive of collected images at the DSI. The chosen music scores have the following features: Monophonic music. Font variability. Music symbols frequently used in the classic music repertory. Variable density of music symbols. Irregular groups (triplets, etc.). Small note with or without accidentals (grace notes). Different barlines (start and end refrain, end score, single barline and double barline). Clef and time change. Ornaments (mordent, turn, and trill). Performance Evaluation based on basic symbols recognition Figures 1,2 and 3 show evaluation tables respectively for SmartScore, O3MR and SharpEye2. In each table results of measurements are reported. The table is divided in sub tables and each of them in two sections: the
(1.4)
(1.5)
(1.6)
(1.7)
(1.8)

expected values column (symbols counted in the original score) and columns under the found voice (symbols counted in the reconstructed score). In the found section: The Total column reports the number of occurrences for each basic symbol. The True column reports the number of occurrences for correct basic symbols. The Fault column reports the number of occurrences for confused basic symbols. The Miss column reports the number of occurrences for missed basic symbols. The W column reports values given to weights and associated to each basic symbol. Values in the tables show that: SmartScore looses information and the number of missing symbol is greater than confused symbols. The
accent symbol has been never recognised, some identification problems with time signatures, rests with duration less than 1/8 and slurs. It adds whole notes, augmentation dots and staccato symbols. Mordent, trill and fermata seem to be not managed.
SharpEye2 shows a best performance, but at the same time it looses information. It adds a less symbols than the other two software. It is able to reconstruct slurs and recognise trill, fermata and grace notes. Some problems with Baritone clef have been detected.
O3MR looses information, since in the current version it does not manage symbols such as fermata, trill, staccato, mordent and turn. The high value of confusion is mainly due to the difficulty in slur reconstruction.
Observing the graphics reported in Figure 4, SharpEye provides in general the best performance. The O3MR is comparable with Smartscore, but it introduces less symbols than SmartScore. Performance Evaluation based on complete music symbols and relationships reconstruction Figure 5 shows evaluation tables respectively for SmartScore, O3MR and SharpEye2. Each table collects sub tables that refer to examples to test. Each sub table consists of: The Expected column where the number of counted occurrences for the expected symbol or relationship
has been reported (Ni). The counting has been done on the original score. The True column where the number of counted occurrences for the correct symbol or relationship has
been reported (nt). The counting has been done on the reconstructed score. The Add column where the number of counted occurrences for the added symbol or relationship has
been reported (na). The counting has been done on the reconstructed score. The Fault column where the number of counted occurrences for the fault symbol or relationship has
been reported (nf). The counting has been done on the reconstructed score. The Miss column where the number of counted occurrences for the missed symbol or relationship has
been reported (nm). The counting has been done on the reconstructed score. The W column reports values given to weights and associated to each basic symbol. Tables show that: SmartScore introduces errors in notes reconstruction and adds notes. It detects tuplets, but the main
tendency is to make mistakes. SmartScore seems to detect tuplets by analysing the time consistence of the measure and not by recognising the number that characterises them. It has difficulty with slurs, time signature change and key signatures.
SharpEye 2 does not introduce notes, it has some problems with tuplets. Differently by SmartScore, SharpEye seems to recognise the tuplet by detecting the number that characterises it. In the grace notes detection, it does not discriminate appoggiatura from acciaccatura, it considers only grace notes as appoggiatura.
The main limits for O3MR are due to the recognition of slurs, tuplets, grace notes and ornaments symbols. It introduces rests when the segmentation provided a wrong decomposition of symbol, whereas it adds less symbols than SmartScore.
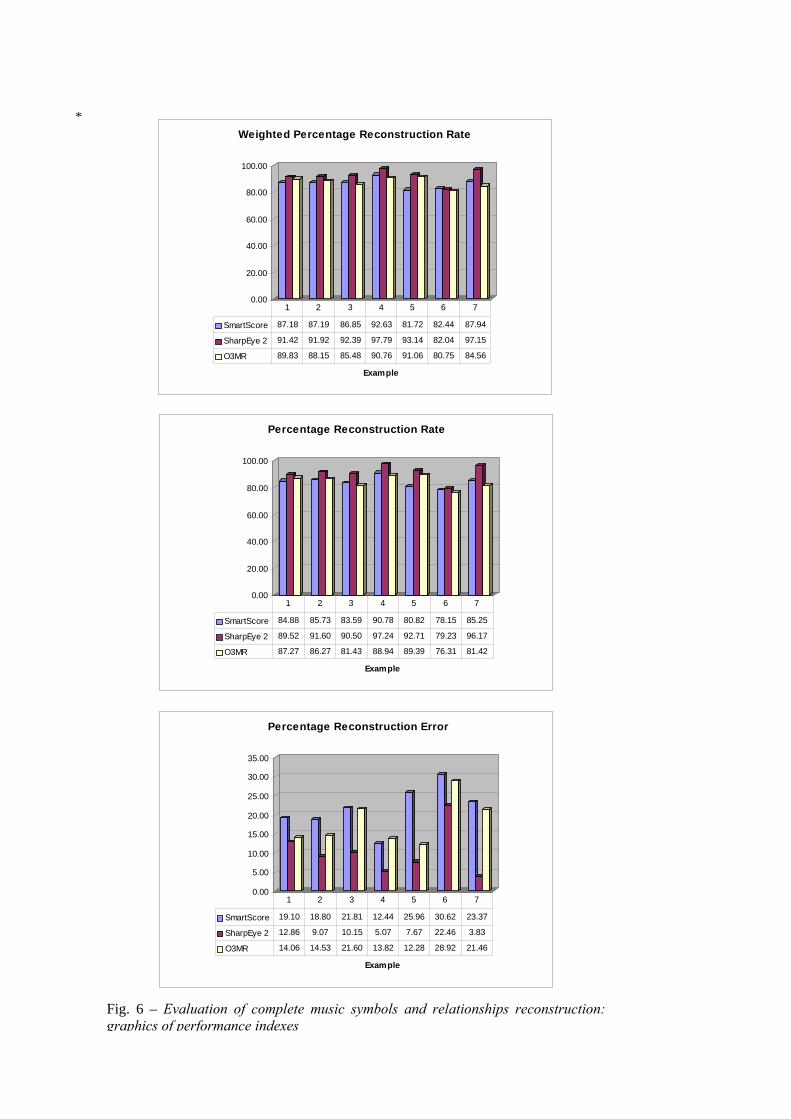
Observing graphics reported in Figure 6, SharpEye provides in general the best performance. The O3MR is yet comparable with Smartscore. Notes and rests recognition The recognition of notes and rests is the most important requirement that an OMR system has to respect. They are considered the most important music symbols, and their recognition has to be robust and to provide

a high performance. The evaluation of note recognition has to take into account the pitch and the duration. All examples have been considered and values reported in tables of Figure 5 (Evaluation based on complete music symbols and relationships reconstruction) have been used. The evaluation has been performed by considering the percentage rate for correct, incorrect, missed and added notes and rests. They have defined as following: Percentage rate for correct (True) symbols
1007
1
7
1
)(
Re
i
i
i
it
c
N
n
TT
Percentage rate for incorrect (Fault) symbols
1007
1
7
1
)(
Re
i
i
i
if
c
N
n
TF
Percentage rate for missed (Miss) symbols
1007
1
7
1
)(
Re
i
i
i
im
c
N
n
TM
Percentage rate for added (Add) symbols
1007
1
7
1
)(
Re
i
i
i
ia
c
N
n
TA
Ni stands for the total number of expected symbols for the each example. The percentage values are reported in the following tables:
Note recognition (pitch & duration) SmartScore SharpEye2 O3MR
Correct Notes (TTRec) 95.68% 96.67% 97.24% Incorrect Notes (TFRec) 2.29% 1.25% 1.72% Missed Notes (TMRec) 2.03% 2.08% 1.04% Added Notes (TARes) 2.44% 0.21% 1.20%
Rests recognition SmartScore SharpEye2 O3MR
Correct Rests (TTRec) 38.54% 81.77% 94.79% Incorrect Rests (TFRec) 0.00% 2.60% 0.52% Missed Rests (TMRec) 61.46% 15.63% 4.69% Added Rests (TARec) 8.85% 0.00% 8.85%
Tables show the O3MR capability in recognising notes and rests. In particular, the recognition rate for rests is the highest, with a difference of 13.02% with SharpEye2 and 56.25% with SmartScore. In terms of corrections to perform after the reconstructing phase, the O3MR provides a behaviour comparable with SharpEye2. Rests, added by O3MR, are due to segmentation errors. They generate incorrect basic symbols that are recognised as rests. This is a limit for the actual version of the O3MR system. 5 Conclusion The problem of Optical Music recognition tools assessment has been discussed. The lack of standard methodologies does not allow comparing objectively the existing OMR tools. For this reason the study and approches for the definition of OMR performance evaluation models has been described. Two evaluation methodologies have been proposed: the evaluation based on basic symbols and the evaluation based on complete music symbols and their relationships. These methodolgies have been used to compare three OMR tools: SharpEye2, SmartScore and O3MR. The final results show that SharpEye2 is the tool with best perfomances. It also manges more symbols. SmartScore and O3MR are comparable, but in terms of notes and rests recognition O3MR is more robust than SmartScore. A evalutation on costs needed to polish the recostructed score from mistakes has been described. The most important cost is the verification cost. It is always needed, even if the OMR tool recognises perfectly, since the correctness of each music symbol has been verified. If the verification cost is less than editing cost then we have a gain in using the OMR tools.
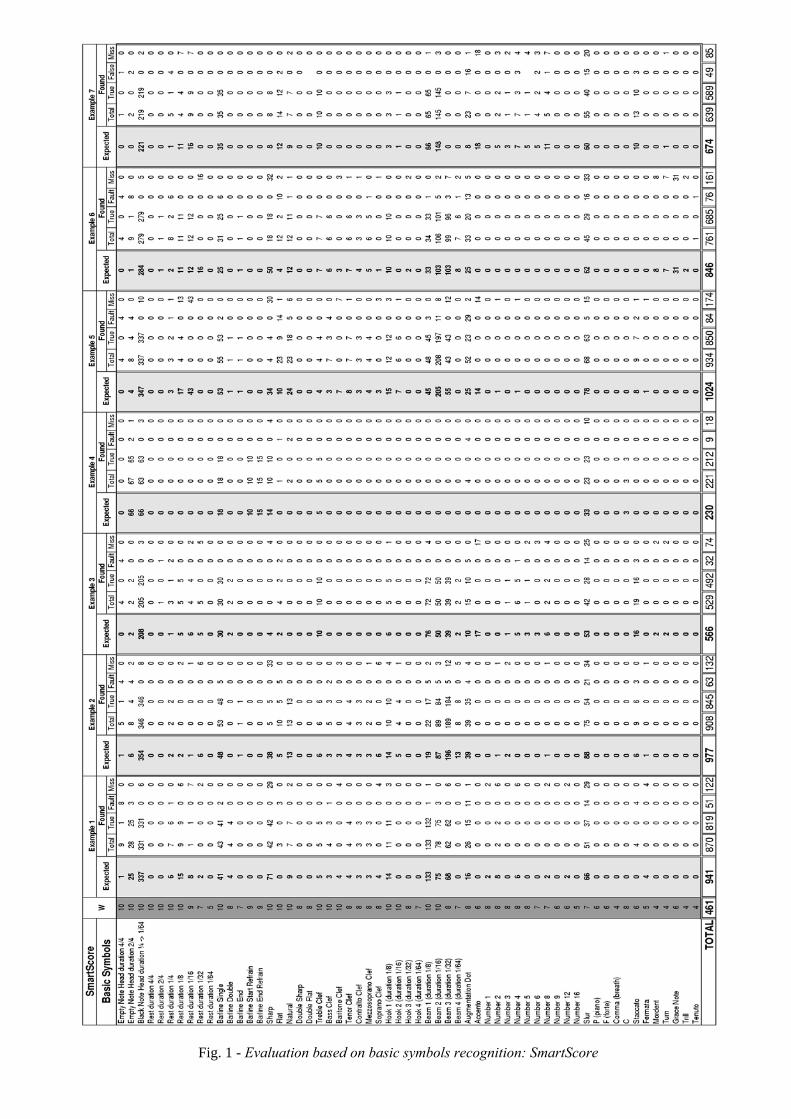
Fig. 1 - Evaluation based on basic symbols recognition: SmartScore

Fig. 2 - Evaluation based on basic symbols recognition: O3MR

Fig. 3 - Evaluation based on basic symbols recognition: SharpEye2

75.00
80.00
85.00
90.00
95.00
100.00
Example
Weighted Percentage Recognition Rate
SmartScore 88.40 87.38 89.73 93.09 83.99 84.39 89.77
SharpEye 2 94.63 94.16 94.62 97.56 93.11 83.03 97.99
O3MR 94.46 92.96 89.77 89.77 93.34 84.61 86.90
1 2 3 4 5 6 7
0.00
20.00
40.00
60.00
80.00
100.00
Example
Percentage Recognition Rate
SmartScore 87.04 86.49 86.93 92.17 83.01 80.97 87.39
SharpEye 2 93.52 93.55 93.11 97.39 92.77 80.26 97.33
O3MR 92.99 91.71 86.57 89.13 92.19 81.09 84.57
1 2 3 4 5 6 7
0.00
2.00
4.00
6.00
8.00
10.00
Example
Percentage Confusion Rate
SmartScore 5.42 6.45 5.65 3.91 8.20 8.98 7.27
SharpEye 2 1.81 2.35 3.53 3.04 3.13 6.62 0.89
O3MR 4.68 3.48 6.36 3.48 3.52 9.34 6.68
1 2 3 4 5 6 7
Fig. 4 - Evaluation based on basic symbols recognition: graphics of performance indexes

Fig. 5 – Evaluation of complete music symbols and relationships reconstruction
*
0.00
20.00
40.00
60.00
80.00
100.00
Example
Weighted Percentage Reconstruction Rate
SmartScore 87.18 87.19 86.85 92.63 81.72 82.44 87.94
SharpEye 2 91.42 91.92 92.39 97.79 93.14 82.04 97.15
O3MR 89.83 88.15 85.48 90.76 91.06 80.75 84.56
1 2 3 4 5 6 7
0.00
20.00
40.00
60.00
80.00
100.00
Example
Percentage Reconstruction Rate
SmartScore 84.88 85.73 83.59 90.78 80.82 78.15 85.25
SharpEye 2 89.52 91.60 90.50 97.24 92.71 79.23 96.17
O3MR 87.27 86.27 81.43 88.94 89.39 76.31 81.42
1 2 3 4 5 6 7
0.00
5.00
10.00
15.00
20.00
25.00
30.00
35.00
Example
Percentage Reconstruction Error
SmartScore 19.10 18.80 21.81 12.44 25.96 30.62 23.37
SharpEye 2 12.86 9.07 10.15 5.07 7.67 22.46 3.83
O3MR 14.06 14.53 21.60 13.82 12.28 28.92 21.46
1 2 3 4 5 6 7
Fig. 6 – Evaluation of complete music symbols and relationships reconstruction: graphics of performance indexes