Assessing Plant Genetic Diversity by Molecular Tools
17
Diversity 2009, 1, 19-35; doi:10.3390/d1010019 diversity ISSN 1424-2818 www.mdpi.com/journal/diversity Review Assessing Plant Genetic Diversity by Molecular Tools Linda Mondini, Arshiya Noorani and Mario A. Pagnotta* Department of Agrobiology and Agrochemistry, Tuscia University, Via S.C. de Lellis, 01100 Viterbo, Italy; E-Mails: [email protected] (L.M.); [email protected] (A.N.) * Author to whom correspondence should be addressed; E-Mail: [email protected]; Tel.: +39-0761357423; Fax: +39-0761357242 Received: 5 May 2009 / Accepted: 4 August 2009 / Published: 6 August 2009 Abstract: This paper is an overview of the diverse, predominantly molecular techniques, used in assessing plant genetic diversity. In recent years, there has been a significant increase in the application of molecular genetic methods for assessing the conservation and use of plant genetic resources. Molecular techniques have been applied in the analysis of specific genes, as well as to increase understanding of gene action, generate genetic maps and assist in the development of gene transfer technologies. Molecular techniques have also had critical roles in studies of phylogeny and species evolution, and have been applied to increase our understanding of the distribution and extent of genetic variation within and between species. These techniques are well established and their advantages as well as limitations have been realized and described in this work. Recently, a new class of advanced techniques has emerged, primarily derived from a combination of earlier, more basic techniques. Advanced marker techniques tend to amalgamate advantageous features of several basic techniques, in order to increase the sensitivity and resolution to detect genetic discontinuity and distinctiveness. Some of the advanced marker techniques utilize newer classes of DNA elements, such as retrotransposons, mitochondrial and chloroplast based microsatellites, thereby revealing genetic variation through increased genome coverage. Techniques such as RAPD and AFLP are also being applied to cDNA-based templates to study patterns of gene expression and uncover the genetic basis of biological responses. The most important and recent advances made in molecular marker techniques are discussed in this review, along with their applications, advantages and limitations applied to plant sciences. Keywords: molecular markers; plant genetics; assessment of diversity OPEN ACCESS
-
Upload
independent -
Category
Documents
-
view
0 -
download
0
Transcript of Assessing Plant Genetic Diversity by Molecular Tools

Diversity 2009, 1, 19-35; doi:10.3390/d1010019
diversity ISSN 1424-2818
www.mdpi.com/journal/diversity
Review
Assessing Plant Genetic Diversity by Molecular Tools
Linda Mondini, Arshiya Noorani and Mario A. Pagnotta*
Department of Agrobiology and Agrochemistry, Tuscia University, Via S.C. de Lellis,
01100 Viterbo, Italy; E-Mails: [email protected] (L.M.); [email protected] (A.N.)
* Author to whom correspondence should be addressed; E-Mail: [email protected];
Tel.: +39-0761357423; Fax: +39-0761357242
Received: 5 May 2009 / Accepted: 4 August 2009 / Published: 6 August 2009
Abstract: This paper is an overview of the diverse, predominantly molecular techniques,
used in assessing plant genetic diversity. In recent years, there has been a significant
increase in the application of molecular genetic methods for assessing the conservation and
use of plant genetic resources. Molecular techniques have been applied in the analysis of
specific genes, as well as to increase understanding of gene action, generate genetic maps
and assist in the development of gene transfer technologies. Molecular techniques have
also had critical roles in studies of phylogeny and species evolution, and have been applied
to increase our understanding of the distribution and extent of genetic variation within and
between species. These techniques are well established and their advantages as well as
limitations have been realized and described in this work. Recently, a new class of
advanced techniques has emerged, primarily derived from a combination of earlier, more
basic techniques. Advanced marker techniques tend to amalgamate advantageous features
of several basic techniques, in order to increase the sensitivity and resolution to detect
genetic discontinuity and distinctiveness. Some of the advanced marker techniques utilize
newer classes of DNA elements, such as retrotransposons, mitochondrial and chloroplast
based microsatellites, thereby revealing genetic variation through increased genome
coverage. Techniques such as RAPD and AFLP are also being applied to cDNA-based
templates to study patterns of gene expression and uncover the genetic basis of biological
responses. The most important and recent advances made in molecular marker techniques
are discussed in this review, along with their applications, advantages and limitations
applied to plant sciences.
Keywords: molecular markers; plant genetics; assessment of diversity
OPEN ACCESS

Diversity 2009, 1
20
1. Introduction
Understanding the molecular basis of the essential biological phenomena in plants is crucial for the
effective conservation, management, and efficient utilization of plant genetic resources (PGR). In
particular, an adequate knowledge of existing genetic diversity, where in plant population it is found
and how to best utilize it, is of fundamental interest for basic science and applied aspects like the
efficient management of crop genetic resources. The improvement of crop genetic resources is
dependent on continuous infusions of wild relatives, traditional varieties and the use of modern
breeding techniques. These processes all require an assessment of diversity at some level, to select
resistant, highly productive varieties.
The assessment of genetic diversity within and between populations is routinely performed at the
molecular level using various laboratory-based techniques such as allozyme or DNA analysis, which
measure levels of variation directly. Genetic diversity may be also gauged using morphological, and
biochemical characterization and evaluation:
(i) Morphological characterization does not require expensive technology but large tracts of land
are often required for these experiments, making it possibly more expensive than molecular
assessment. These traits are often susceptible to phenotypic plasticity; conversely, this allows
assessment of diversity in the presence of environmental variation.
(ii) Biochemical analysis is based on the separation of proteins into specific banding patterns. It is a
fast method which requires only small amounts of biological material. However, only a limited
number of enzymes are available and thus, the resolution of diversity is limited.
(iii) Molecular analyses comprise a large variety of DNA molecular markers, which can be
employed for analysis of variation. Different markers have different genetic qualities (they can
be dominant or co-dominant, can amplify anonymous or characterized loci, can contain
expressed or non-expressed sequences, etc.).
The concept of genetic markers is not a new one; in the nineteenth century, Gregor Mendel
employed phenotype-based genetic markers in his experiments. Later, phenotype-based genetic
markers for Drosophila melanogaster led to the founding of the theory of genetic linkage, occurring
when particular genetic loci or alleles for genes are inherited jointly. The limitations of
phenotype-based genetic markers led to the development of DNA-based markers, i.e., molecular
markers. A molecular marker can be defined as a genomic locus, detected through probe or specific
starters (primer) which, in virtue of its presence, distinguishes unequivocally the chromosomic trait
which it represents as well as the flanking regions at the 3’ and 5’ extremity [1].
Molecular markers may or may not correlate with phenotypic expression of a genomic trait. They
offer numerous advantages over conventional, phenotype-based alternatives as they are stable and
detectable in all tissues regardless of growth, differentiation, development, or defense status of the cell.
Additionally, they are not confounded by environmental, pleiotropic and epistatic effects.
An ideal molecular marker should possesses the following features: (1) be polymorphic and evenly
distributed throughout the genome; (2) provide adequate resolution of genetic differences; (3) generate
multiple, independent and reliable markers; (4) be simple, quick and inexpensive; (5) need small
amounts of tissue and DNA samples; (6) link to distinct phenotypes; and, (7) require no prior

Diversity 2009, 1
21
information about the genome of an organism. Nevertheless, no molecular marker presents all the
listed advantages.
The different methods of molecular assessment differ from each other with respect to important
features such as genomic abundance, level of polymorphism detected, locus specificity,
reproducibility, technical requirements and cost. Depending on the need, modifications in the
techniques have been made, leading to a second generation of advanced molecular markers.
Genetic or DNA based marker techniques such as Restriction Fragment Length Polymorphism
(RFLP), Random Amplified Polymorphic DNA (RAPD), Simple Sequence Repeats (SSR) and
Amplified Fragment Length Polymorphism (AFLP) are now in common use for ecological,
evolutionary, taxonomical, phylogenic and genetic studies of plant sciences. These techniques are well
established and their advantages and limitations have been documented [2-4].
Recently, a new class of advanced techniques has emerged, primarily derived from combination of
the earlier, more basic techniques. These advanced marker techniques combine advantageous aspects
of several basic techniques. In particular, the newer methods incorporate modifications in the basic
techniques, thereby increasing the sensitivity and resolution in detecting genetic discontinuity and
distinctiveness. The advanced marker techniques also utilize newer classes of DNA elements such as
retrotransposons, mitochondrial and chloroplast based microsatellites, allowing increased genome
coverage. Techniques such as RAPD and AFLP are also being applied to cDNA-based templates (i.e.,
sequences of complementary DNA obtained by mRNA retrotranscription) to study patterns of gene
expression and uncover the genetic basis of biological responses. The recent development of high-
throughput sequencing technology provides the possibility of analysing high numbers of samples over
smaller periods of time. The present review details the molecular techniques of genetic variability and
their application to plant sciences.
2. Molecular Assessment of Genetic Diversity
Analyses of genetic diversity are usually based on assessing the diversity of an individual using
either allozymes (i.e., variant forms of an enzyme that are coded for by different alleles at the same
locus) or molecular markers, which tend to be selectively neutral. It has been argued that the rate of
loss of diversity of these neutral markers will be higher that those which are associated with fitness. In
order to verify this, Reed and Frankham [5] conducted a meta-analysis of fitness components in three
or more populations and in which heterozygosity, and/or heritability, and/or population size were
measured. Their findings, based on 34 datasets, concluded that heterozygosity, population size, and
quantitative genetic variation, which are all used as indicators of fitness, were all positively correlated
significantly with population fitness.
Genetic variability within a population can be assessed through:
1. The number (and percentage) of polymorphic genes in the population.
2. The number of alleles for each polymorphic gene.
3. The proportion of heterozygous loci per individual [6].
Proteic methods, such as allozyme electrophoresis, and molecular methods, such as DNA analysis,
directly measure genetic variation, giving a clear indication of the levels of genetic variation present in
a species or population [7] without direct interference from environmental factors. However, they have

Diversity 2009, 1
22
the disadvantage of being relatively expensive, time consuming and require high levels of expertise
and materials in analysis. Given below is an overview of the different types of markers used for
assessing genetic diversity (adapted from Spooner et al. [8]).
2.1. Biochemical Markers
The use of biochemical markers involves the analysis of seed storage proteins and isozymes. This
technique utilizes enzymatic functions and is a comparatively inexpensive yet powerful method of
measuring allele frequencies for specific genes.
Allozymes, being allelic variants of enzymes, provide an estimate of gene and genotypic
frequencies within and between populations. This information can be used to measure population
subdivision, genetic diversity, gene flow, genetic structure of species, and comparisons among species
out-crossing rates, population structure and population divergence, such as in the case of crop wild
relatives [8-13]. Major advantages of these types of markers consist in assessing co-dominance,
absence of epistatic and pleiotrophic effects, ease of use, and low costs. Disadvantages of isozymes
include: (i) there are only few isozyme systems per species (no more than 30) with correspondingly
few markers; (ii) the number of polymorphic enzymatic systems available is limited and the enzymatic
loci represent only a small and not random part of the genome (the expressed part) - therefore, the
observed variability may be not representative of the entire genome; (iii) although these markers allow
large numbers of samples to be analyzed, comparisons of samples from different species, loci, and
laboratories are problematic, since they are affected by extraction methodology, plant tissue, and
plant stage.
2.2. Molecular Markers
Molecular markers work by highlighting differences (polymorphisms) within a nucleic sequence
between different individuals. These differences include insertions, deletions, translocations,
duplications and point mutations. They do not, however, encompass the activity of specific genes.
In addition to being relatively impervious to environmental factor, molecular markers have the
advantage of: (i) being applicable to any part of the genome (introns, exons and regulation regions);
(ii) not possessing pleiotrophic or epistatic effects; (iii) being able to distinguish polymorphisms which
not produce phenotypic variation and finally, (iv) being some of them co-dominant.
The different techniques employed are based either on restriction-hybridization of nucleic acids or
techniques based on Polymerase Chain Reaction (PCR), or both (see Table 1 for a list of the main
molecular analysis techniques). In addition, the different techniques can assess either multi-locus or
single-locus markers. Multi-locus markers allow simultaneous analyses of several genomic loci, which
are based on the amplification of casual chromosomic traits through oligonucleic primers with
arbitrary sequences. These types of markers are also defined as dominant since it is possible to observe
the presence or the absence of a band for any locus, but it is not possible to distinguish between
heterozygote (a/-) conditions and homozygote for the same allele (a/a). By contrast, single-locus
markers employ probes or primers specific to genomic loci, and are able to hybridize or amplify
chromosome traits with well-known sequences. They are defined as co-dominant since they allow
discrimination between homozygote and heterozygote loci.
Diversity 2009, 1
23
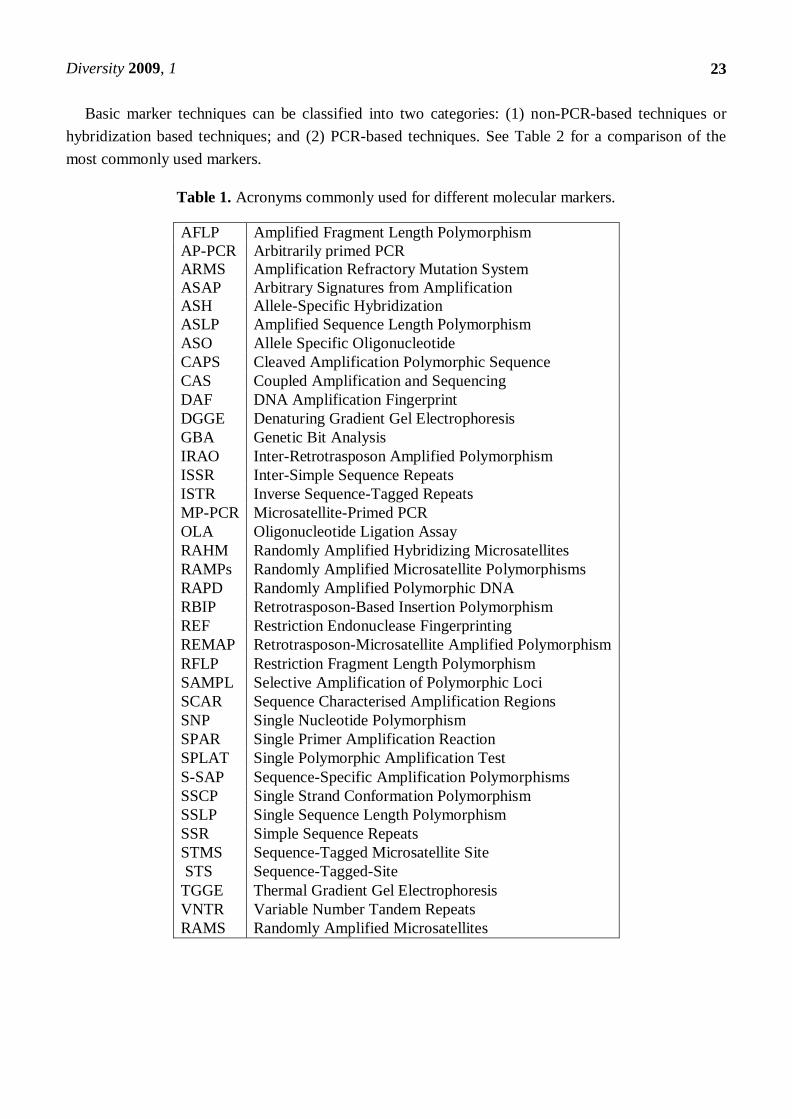
Basic marker techniques can be classified into two categories: (1) non-PCR-based techniques or
hybridization based techniques; and (2) PCR-based techniques. See Table 2 for a comparison of the
most commonly used markers.
Table 1. Acronyms commonly used for different molecular markers.
AFLP Amplified Fragment Length Polymorphism
AP-PCR Arbitrarily primed PCR
ARMS Amplification Refractory Mutation System
ASAP Arbitrary Signatures from Amplification
ASH Allele-Specific Hybridization
ASLP Amplified Sequence Length Polymorphism
ASO Allele Specific Oligonucleotide
CAPS Cleaved Amplification Polymorphic Sequence
CAS Coupled Amplification and Sequencing
DAF DNA Amplification Fingerprint
DGGE Denaturing Gradient Gel Electrophoresis
GBA Genetic Bit Analysis
IRAO Inter-Retrotrasposon Amplified Polymorphism
ISSR Inter-Simple Sequence Repeats
ISTR Inverse Sequence-Tagged Repeats
MP-PCR Microsatellite-Primed PCR
OLA Oligonucleotide Ligation Assay
RAHM Randomly Amplified Hybridizing Microsatellites
RAMPs Randomly Amplified Microsatellite Polymorphisms
RAPD Randomly Amplified Polymorphic DNA
RBIP Retrotrasposon-Based Insertion Polymorphism
REF Restriction Endonuclease Fingerprinting
REMAP Retrotrasposon-Microsatellite Amplified Polymorphism
RFLP Restriction Fragment Length Polymorphism
SAMPL Selective Amplification of Polymorphic Loci
SCAR Sequence Characterised Amplification Regions
SNP Single Nucleotide Polymorphism
SPAR Single Primer Amplification Reaction
SPLAT Single Polymorphic Amplification Test
S-SAP Sequence-Specific Amplification Polymorphisms
SSCP Single Strand Conformation Polymorphism
SSLP Single Sequence Length Polymorphism
SSR Simple Sequence Repeats
STMS Sequence-Tagged Microsatellite Site
STS Sequence-Tagged-Site
TGGE Thermal Gradient Gel Electrophoresis
VNTR Variable Number Tandem Repeats
RAMS Randomly Amplified Microsatellites
Diversity 2009, 1
24
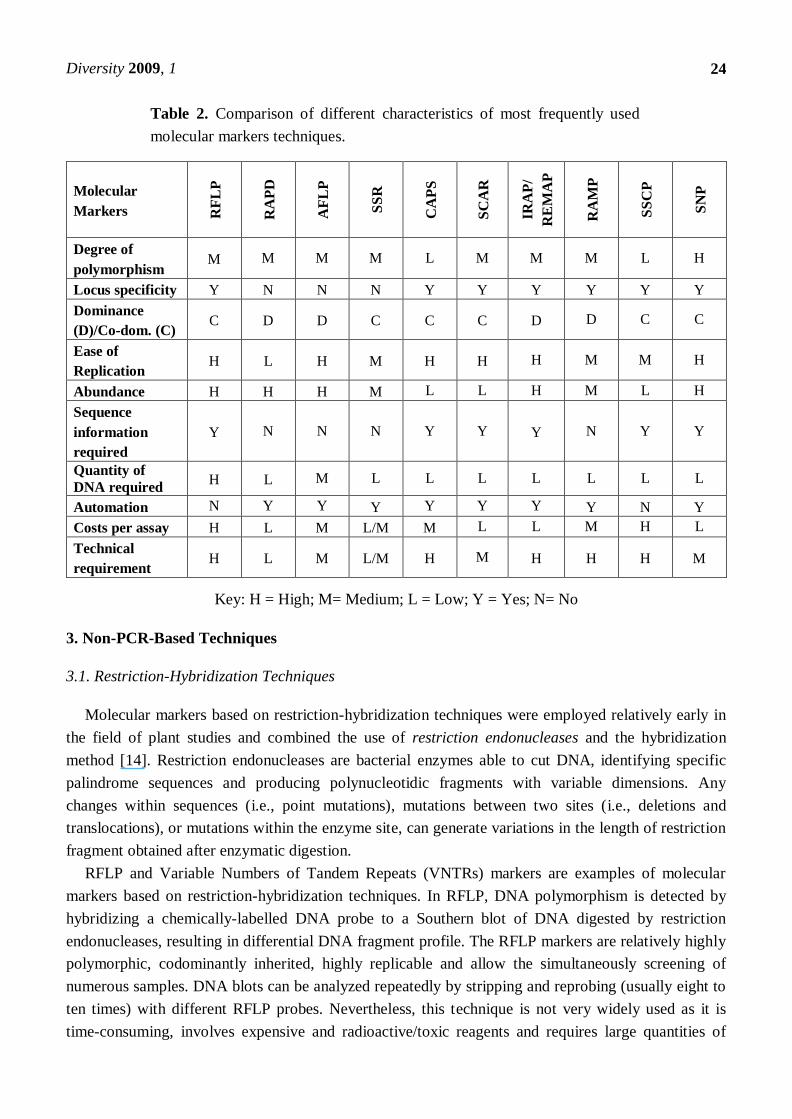
Table 2. Comparison of different characteristics of most frequently used
molecular markers techniques.
Molecular
Markers RF
LP
RA
PD
AF
LP
SS
R
CA
PS
SC
AR
IRA
P/
RE
MA
P
RA
MP
SS
CP
SN
P
Degree of
polymorphism M M M M L M M M L H
Locus specificity Y N N N Y Y Y Y Y Y
Dominance
(D)/Co-dom. (C) C D D C C C D D C C
Ease of
Replication H L H M H H H M M H
Abundance H H H M L L H M L H
Sequence
information
required
Y N N N Y Y Y N Y Y
Quantity of
DNA required H L M L L L L L L L
Automation N Y Y Y Y Y Y Y N Y
Costs per assay H L M L/M M L L M H L
Technical
requirement H L M L/M H M H H H M
Key: H = High; M= Medium; L = Low; Y = Yes; N= No
3. Non-PCR-Based Techniques
3.1. Restriction-Hybridization Techniques
Molecular markers based on restriction-hybridization techniques were employed relatively early in
the field of plant studies and combined the use of restriction endonucleases and the hybridization
method [14]. Restriction endonucleases are bacterial enzymes able to cut DNA, identifying specific
palindrome sequences and producing polynucleotidic fragments with variable dimensions. Any
changes within sequences (i.e., point mutations), mutations between two sites (i.e., deletions and
translocations), or mutations within the enzyme site, can generate variations in the length of restriction
fragment obtained after enzymatic digestion.
RFLP and Variable Numbers of Tandem Repeats (VNTRs) markers are examples of molecular
markers based on restriction-hybridization techniques. In RFLP, DNA polymorphism is detected by
hybridizing a chemically-labelled DNA probe to a Southern blot of DNA digested by restriction
endonucleases, resulting in differential DNA fragment profile. The RFLP markers are relatively highly
polymorphic, codominantly inherited, highly replicable and allow the simultaneously screening of
numerous samples. DNA blots can be analyzed repeatedly by stripping and reprobing (usually eight to
ten times) with different RFLP probes. Nevertheless, this technique is not very widely used as it is
time-consuming, involves expensive and radioactive/toxic reagents and requires large quantities of

Diversity 2009, 1
25
high quality genomic DNA. Moreover, the prerequisite of prior sequence information for probe
construction contributes to the complexity of the methodology. These limitations led to the
development of a new set of less technically complex methods known as PCR-based techniques.
4. Markers Based on Amplification Techniques (PCR-Derived)
The use of this kind of marker has been exponential, following the development by
Mullis et al. [15] of the Polymerase Chain Reaction (PCR). This technique consists in the
amplification of several discrete DNA products, deriving from regions of DNA which are flanked by
regions of high homology with the primers. These regions must be close enough to one another to
permit the elongation phase.
The use of random primers overcame the limitation of prior sequence knowledge for PCR analysis
and being applicable to all organisms, facilitated the development of genetic markers for a variety of
purposes. PCR-based techniques can further be subdivided into two subcategories: (1) arbitrarily
primed PCR-based techniques or sequence non-specific techniques; and, (2) sequence targeted
PCR-based techniques. Based on this, two different types of molecular markers have been developed:
RAPD and AFLP.
4.1. Random Amplified Polymorphic DNA (RAPD)
RAPDs were the first PCR-based molecular markers to be employed in genetic variation
analyses [16,17]. RAPD markers are generated through the random amplification of genomic DNA
using short primers (decamers), separation of the obtained fragments on agarose gel in the presence of
ethidium bromide and finally, visualization under ultraviolet light. The use of short primers is
necessary to increase the probability that, although the sequences are random, they are able to find
homologous sequences suitable for annealing. DNA polymorphisms are then produced by
“rearrangements or deletions at or between oligonucleotide primer binding sites in the genome” [17].
As this approach requires no prior knowledge of the genome analyzed, it can be employed across
species using universal primers. The major drawback of this method is that the profiling is dependent
on reaction conditions which can vary between laboratories; even a difference of a degree in
temperature is sufficient to produce different patterns. Additionally, as several discrete loci are
amplified by each primer, profiles are not able to distinguish heterozygous from homozygous
individuals [18]. Arbitrarily Primed Polymerase Chain Reaction (AP-PCR) and DNA Amplification
Fingerprinting (DAF) are independently developed methodologies, which are variants of RAPD. For
AP-PCR [16], a single primer, 10–15 nucleotides long, is used and involves amplification for initial
two PCR cycles at low stringency. Thereafter, the remaining cycles are carried out at higher stringency
by increasing the annealing temperatures.
4.2. Amplified Fragment Length Polymorphism (AFLP)
To overcome the limitation of reproducibility associated with RAPD, AFLP technology was
developed by the Dutch company, Keygene [19,20]. This method is based on the combination of the
main analysis techniques: digestion of DNA through restriction endonuclease enzymes and PCR
Diversity 2009, 1
26
technology. It can be considered an intermediate between RFLPs and RAPDs methodologies as it
combines the power of RFLP with the flexibility of PCR-based technology.
The primer pairs used for AFLP usually produce 50–100 bands per assay. The number of amplicons
per AFLP assay is a function of the number selective nucleotides in the AFLP primer combination, the
selective nucleotide motif, GC content, and physical genome size and complexity. AFLP generates
fingerprints of any DNA regardless of its source, and without any prior knowledge of DNA sequence.
Most AFLP fragments correspond to unique positions on the genome and hence can be exploited as
landmarks in genetic and physical mapping. The technique can be used to distinguish closely related
individuals at the sub-species level [21] and can also map genes
The origins of AFLP polymorphisms are multiple and can be due to: (i) mutations of the restriction
site which create or delete a restriction site; (ii) mutations of sequences flanking the restriction site, and
complementary to the extension of the selective primers, enabling possible primer annealing; (iii)
insertions, duplications or deletions inside amplification fragments. These mutations can cause the
appearance/disappearance of a fragment or the modification (increase or decrease) of an amplified-
restricted fragment.
4.3. Sequence Specific PCR Based Markers
A different approach to arbitrary PCR amplification consists in the amplification of target regions of
a genome through specific primers. With the advent of high-throughput sequencing technology,
abundant information on DNA sequences for the genomes of many plant species has been
generated [22-24]. Expressed Sequence Tags (EST) of many crop species have been generated and
thousands of sequences have been annotated as putative functional genes using powerful
bioinformatics tools. ESTs are single-read sequences produced from partial sequencing of a bulk
mRNA pool that has been reverse transcribed into cDNA. EST libraries provide a snapshot of the
genes expressed in the tissue at the time of, and under the conditions in which, they were sampled [25].
Despite these advantages, however, EST-SSRs are not without their drawbacks. One of the concerns
with SSRs in general is the possibility of null alleles, which fail to amplify due to primer site variation,
do not produce a visible amplicon. Because the cDNA from which ESTs are derived lack introns,
another concern is that unrecognized intron splice sites could disrupt priming sites, resulting in failed
amplification. Lastly, as EST-SSRs are located within genes, and thus more conserved across species,
they may be less polymorphic than anonymous SSRs. Although the use of EST possesses these
limitations, several features of EST sequence libraries make them a valuable resource for conservation
and evolutionary genetics. ESTs are an inexpensive source for identifying gene-linked markers with
higher levels of polymorphism, which can also be applied to closely related species in many
cases [26-28]. EST libraries are also a good starting point for developing tools to study gene
expression such as microarrays or quantitative PCR assays [22].
4.4. Microsatellite-Based Marker Technique
Microsatellites or Simple Sequence Repeats (SSR) are sets repeated sequences found within
eukaryotic genomes [29-31]. These consist of sequences of repetitions, comprising basic short motifs
generally between 2 and 6 base-pairs long. Polymorphisms associated with a specific locus are due to

Diversity 2009, 1
27
the variation in length of the microsatellite, which in turn depends on the number of repetitions of the
basic motif. Variations in the number of tandemly repeated units are mainly due to strand slippage
during DNA replication where the repeats allow matching via excision or addition of repeats [32]. As
slippage in replication is more likely than point mutations, microsatellite loci tend to be hypervariable.
Microsatellite assays show extensive inter-individual length polymorphisms during PCR analysis of
unique loci using discriminatory primers sets.
Microsatellites are highly popular genetic markers as they possess: co-dominant inheritance, high
abundance, enormous extent of allelic diversity, ease of assessing SSR size variation through PCR
with pairs of flanking primers and high reproducibility. However, the development of microsatellites
requires extensive knowledge of DNA sequences, and sometimes they underestimate genetic structure
measurements, hence they have been developed primarily for agricultural species, rather than wild
species. Initial approaches were principally based on hybridization techniques, whilst more recent
techniques are based on PCR [33]. Major molecular markers based on assessment of variability
generated by microsatellites sequences are: STMSs (Sequence Tagged Microsatellite Site), SSLPs
(Simple Sequence Length Polymorphism), SNPs (Single Nucleotide Polymorphisms), SCARs
(Sequence Characterized Amplified Region) and CAPS (Cleaved Amplified Polymorphic Sequences).
5. Single Nucleotide Polymorphisms (SNPs)
Single nucleotide variations in genome sequence of individuals of a population are known as SNPs.
SNPs are the most abundant molecular markers in the genome. They are widely dispersed throughout
genomes with a variable distribution among species. The SNPs are usually more prevalent in the non-
coding regions of the genome. Within the coding regions, when an SNP is present, it can generate
either non-synonymous mutations that result in an amino acid sequence change [34], or synonymous
mutations that not alter the amino acid sequence. Synonymous changes can, however, modify mRNA
splicing, resulting in phenotypic differences [35]. Improvements in sequencing technology and an
increase in the availability of the increasing number of EST sequences have made analysis of genetic
variation possible directly at the DNA level.
The majority of SNP genotyping analyses are based on: allele-specific hybridization,
oligonucleotide ligation, primer extension or invasive cleavage [36]. Genotyping methods, including
DNA chips, allele-specific PCR and primer extension approaches based on SNPs, are particularly
attractive for their high data throughput and for their suitability for automation. They are used for a
wide range of purposes, including rapid identification of crop cultivars and construction of ultra
high-density genetic maps.
6. Markers Based on Other DNA than Genomic DNA
There are also other highly informative approaches used to study genetic variation based on
organelle microsatellite sequences detection; in fact, due to their uniparental mode of transmission,
chloroplast (cpDNA) and mitochondrial genomes (mtDNA) exhibit different patterns of genetic
differentiation compared to nuclear alleles [37,38]. Consequently, in addition to nuclear
microsatellites, marker techniques based on chloroplast and mitochondrial microsatellites have also
been developed. The cpDNA, maternally inherited in most plants, has proved to be a powerful tool for
Diversity 2009, 1
28
phylogenetic studies. Due to increasing numbers of recent examples of intraspecific variation observed
in cpDNA, there is additional potential for within-species genetic variation analysis [39,40]. CpDNA
has been preserved well within the genome, and consequently has been employed widely for studying
plant populations through the use of PCR-RFLP and PCR sequencing approaches [40]. They are also
employed in the detection of hybridization/introgression [41], in the analysis of genetic diversity [42]
and in obtaining the phylogeography of plant populations [43,44].
Mitochondrial DNA in plants, in contrast, has been demonstrated to be an unsuitable tool for
studying phylogenesis and genetic diversity, being quantitatively scarce.
At the nuclear level, another type of sequence employed largely for studying genetic diversity is
ribosomal RNA (rRNA). Ribosomal RNA genes are placed on the specific chromosomal loci Nor, and
organized in tandem repeats which can be repeated up to thousands of times. Since some regions of
rRNA are well preserved in eukaryotes, it represents a very useful phylogenetic tool. Conversely, other
regions such as the “Internal Transcriber Spacers” (ITS) are so variable that they can be used to
analyze polymorphism at the intraspecific level.
7. Transposable Elements-Based Molecular Markers
Although transposon insertions can have deleterious effects on host genomes, transposons are
considered important for adaptative evolution, and can be instrumental in acquiring novel
traits [45-49]. Retrotransposons have so far received little attention in the assessment of genetic
diversity, despite of their contribution to the genome structure, size, and variation [50]. Additionally,
their dispersion [51,52], ubiquity [53,54] and prevalence in plant genomes provide an excellent basis
for the development of a set of marker systems, to be used alone or in combination with other markers,
such as AFLPs and SSRs. Retrotransposon-based molecular analysis relies on amplification using a
primer corresponding to the retrotransposon and a primer matching a section of the neighbouring
genome. To this type of class of molecular markers belong: Sequence-Specific Amplified
Polymorphism (S-SAP), Inter-Retrotransposon Amplified Polymorphism (IRAP), Retrotransposon-
Microsatellite Amplified Polymorphism (REMAP), Retrotransposon-Based Amplified Polymorphism
(RBIP) and finally, Transposable Display (TD).
8. RNA-Based Molecular Markers
Studies of mechanisms which control genetic expression are essential to better understand
biological responses and developmental programming in organisms. PCR-based marker techniques
such as cDNA-SSCP, cDNA-AFLP and RAP-PCR are used for differential RNA studies, using
selective amplification of cDNA.
9. Real-Time PCR
Real-time polymerase chain reaction is a laboratory technique based on the polymerase chain
reaction, amplifying and simultaneously quantifying a targeted DNA molecule [55]. It enables both
detection and quantification (as absolute number of copies or relative amount when normalized to
DNA input or additional normalizing genes) of a specific sequence in a DNA sample.

Diversity 2009, 1
29
The procedure follows the general principle of polymerase chain reaction; its key feature is that the
amplified DNA is quantified as it accumulates in the reaction in real time after each amplification
cycle. Two common methods of quantification are: (i) the use of fluorescent dyes that intercalate with
double-stranded DNA, and (ii) modified DNA oligonucleotide probes that fluoresce when hybridized
with a complementary DNA. The major advantage of this technique consists in its sensitivity and
speed due to the system of detection (spectrophotometric respect to ethidium bromide) and the quick
changes of temperature. Real-time PCR is, therefore, particularly suitable for molecular markers based
on PCR amplifications. In fact, the number of conservation and phylogenetic studies are now
increasingly using real-time PCR for assessment of genetic variation [56].
10. Diversity Arrays Technology (DArT)
DArT is a generic and cost-effective genotyping technology. It was developed to overcome some of
the limitations of other molecular marker technologies such as RFLP, AFLP and SSR [57]. DArT is an
alternative method to time-consuming hybridisation-based techniques, typing simultaneously several
thousand loci in a single assay. DArT is particularly suitable for genotyping polyploid species with
large genomes, such as wheat. This technology generates whole-genome fingerprints by scoring the
presence/absence of DNA fragments in genomic representations generated from samples of genomic
DNA. DArT technology consists of several steps: (i) complexity reduction of DNA; (ii) library
creation; (iii) the microarray of libraries onto glass slides; (iv) hybridisation of fluoro-labelled DNA
onto slides; (v) scanning of slides for hybridisation signal and (vi) data extraction and analysis. DArT
acts by reducing the complexity of a DNA sample to obtain a “representation” of that sample. The
main method of complexity reduction used relies on a combination of restriction enzyme digestion and
adapter ligation, followed by amplification. However, an infinite range of alternative methods can be
used to prepare genomic representations for DArT analysis. DArT markers for a new species are
discovered by screening a library of several thousand fragments from a genomic representation
prepared from a pool of DNA samples that encompass the diversity of the species. The microarray
platform makes the discovery process efficient because all markers on a particular DArT array are
scored simultaneously. For each complexity reduction method, an independent collection of DArT
markers can be assembled on a separate DArT array. The number of markers for a given species,
therefore, is only dependent on: (i) the level of genetic variation within the species (or gene pool); and
(ii) the number of complexity reduction methods screened.
11. New Generation of Sequencing Technology
The recent development “high throughput sequencing” technologies make DNA sequencing
particularly important to conservation biology. These technologies have the potential to remove one of
the major impediments to implementing genomic approaches in non-model organisms, including many
of conservation relevance, i.e, the lack of extensive genomic sequence information. These
technologies, in fact avoid the expense, complication, and biases associated with traditional
clone-based sequencing by using direct amplification of DNA templates [58-60]. The three
pre-eminent technologies to be commercialized are 454 (Roche), Solexa (Illumina), and SOLiD
(Applied Biosystems). The 454 sequencing is a pyrosequencing-based method that utilizes emulsion

Diversity 2009, 1
30
PCR to achieve high throughput, parallel sequencing [61]. Solexa’s sequencing-by-synthesis (SBS)
approach is based on a simplified library construction method and reversible fluorescence termination
chemistry in the sequencing reaction, which produces 35-bp reads [58]. Supported oligonucleotide
ligation and detection (SOLiD) sequencing has some features in common with the other two
technologies but, unlike the other two technologies, uses ligation-based sequencing technology [62].
These new approaches to DNA sequencing enable the generation of 0.1–4 gigabases of DNA sequence
in one to seven days with reagent costs being between US$ 3,400 and 8,500. Due to the differences in
fragment read lengths of sequencing, the target of each of these technologies is different: the shorter
length and lower price per base of Solexa and SOLiD. This makes these approaches well suited to
whole genome resequencing, where a novel genome sequence can be assembled and then compared to
a reference sequence, that is, when the genome sequence of the species already exists. The 454
sequencing, on the other hand, with longer read lengths (soon to be upward of 400 bp per sequence)
can also be used for obtaining the first glimpse of a species’ genome or transcriptome.
12. Conclusions
Molecular markers represent a class of molecular tools that are particularly sensitive to new
genome-based discoveries and technical advancements and are, therefore, subject to continuous
evolution. Most molecular marker techniques are employed in the evaluatation of genetic diversity and
constructruction of genetic and physical maps. Physical mapping of linked markers helps in relating
genetic distances to physical distances. Correlating patterns of inheritance in a meiotic-mapping
population to those of individually-mapped genetic markers has led to construction of genetic linkage
maps by locating many monogenic and polygenic traits within specific regions of the plant genome.
Greater and greater amounts of sequence data, genomic and cDNA libraries, and isolated
chromosomes will be increasingly available with time. This information and material will be of major
importance in the future due to the present rate of extinction and diversity reduction. For example, they
could be used to draw genes coding for potentially useful traits. Data obtained through PCR analysis of
DNA fragments from ancient DNA samples have shown evolutionary changes within the genepool
over long time periods. The information available is now also key in devising suitable conservation
strategies. It is highly unlikely, however, that these data and molecular sample collections can replace
the germplasm conservation of whole organisms. Most agronomically important characters are coded
by polygenes, and it would be virtually impossible, with our current knowledge state, to reconstitute all
the implied gene blocks with their regulatory elements.
Molecular markers are used also to assess plant response to climate change, which is a major issue
at a global level. Changes, such as rapid warming, have been seen to cause a decrease in the variability
of those loci controlling physical responses to climate [63]. Jump and Peñuelas [63] conducted a
review of climatic factors correlated with microgeographical genetic differences, and the various
molecular markers used for each study. They concluded that although phenotypic plasticity buffers
against environmental changes over a plant’s life cycle, it will weaken over time as climatic event
become more extreme and over longer time spans. The assessment and maintenance of genetic
diversity, through the use of molecular markers is crucial as it provides a repository of adaptability to
environmental and other changes.
Diversity 2009, 1
31
References
1. Barcaccia, G.; Alberini, E.; Rosellini, D. Inheritance and mapping of 2n-egg production in diploid
alfalfa. Genome 2000, 43, 528-537.
2. Ayad, W.G.; Hodking, A.; Jaradat, A.; Rao, V.R. Molecular genetic techniques for plant genetic
resources. IPGRI Workshop: Rome, Italy, October 9-11, 1995.
3. Agarwal, M.; Shrivastava, N.; Padh, H. Advances in molecular marker techniques and their
application in plant sciences. Plant Cell Rep. 2008, 27, 617-631.
4. Primmer, R. From conservation genetics to conservation genomics. “The Year in Ecology and
Conservation Biology”. Ann. N.Y. Acad. Sci. 2009, 1162, 357-368.
5. Reed, D.H.; Frankham, R. Correlation between fitness and genetic diversity. Cons. Biol. 2003, 17,
230-237.
6. Primack, R.B. Essentials of Conservation Biology. Sinauer Associates: Sunderland, MA,
USA, 1993.
7. Karp, A.; Seberg, O.; Buiatti, M. Molecular techniques in the assessment of botanical diversity.
Ann. Bot. 1996, 78, 143-149.
8. Spooner, D.; van Treuren, R.; de Vicente, M.C. Molecular Markers for Genebank Management.
Bioversity International: Rome, Italy, 2005.
9. Guarino, L. Approaches to Measuring Genetic Erosion. In Proceedings of the Technical Meeting
on the Methodology of the FAO World Information and Early Warning System on Plant Genetic
Resources; Prague, Czech Republic, June 21-23, 1999.
10. Hamrick, J.L.; Godt, M.J.W. Allozyme diversity in cultivated crops. Crop Science 1997, 37,
26-30.
11. Brown, A.H.D. Enzyme polymorphism in plant populations. Theo. Pop. Biol. 1979, 15, 1-42.
12. Gonzalez, A.A.; Wong, A.; Delgado-Salinas, R.; Gepts, P. Assessment of inter simple sequence
repeat markers to differentiate sympatric wild and domesticated populations of common bean.
Crop Science 2005, 45, 606-615.
13. Volis, S.; Mendlinger, S.; Turuspekov ,Y.; Esnazarov, U.; Abugalieva, S.; Orlovsky, N. Allozyme
variation in Turkmenistan populations of wild barley Hordeum Spontaneum. Koch. Annals.
Botany 2001, 87, 435-446.
14. Southern, E. Detection of specific sequences among DNA fragments separated by
gel-electrophoresis. J. Mol. Biol. 1975, 98, 503.
15. Mullis, K.B.; Faloona, F.A.; Scharf, S.J.; Saiki, S.K.; Horn, G.T.; Erlich, H.A. Specific enzymatic
amplification of DNA in vitro: the polymerase chain reaction. Cold Spring Harbor. Symp. Quant.
Biol. 1986, 51, 263-273.
16. Welsh, J.; McClelland, M. Fingerprinting genomes using PCR with arbitrary primers. Nucleic
Acids Res. 1990, 18, 7213-7218.
17. Williams. J.G.K.; Kubelik, A.R.; Livak, K.J.; Rafalski, J.A.; Tingey, S.V. DNA polymorphisms
amplified by arbitrary primers are useful as genetic markers. Nucleic Acids Res. 1991, 18,
6531-6535.
18. Bardakci, F. Random amplified polymorphic DNA (RAPD) markers. Turk. J. Biol. 2001, 25,
185-196.

Diversity 2009, 1
32
19. Vos, P.; Hogers, R.; Bleeker, M.; Reijans, M.; van de Lee, T.; Hornes, M.; Frijters, A.; Pot, J.;
Peleman, J.; Kuiper, M.; Zabeau, M. AFLP: a new technique for DNA fingerprinting. Nucleic
Acids Res. 1995, 23, 4407-4414.
20. Zabeau, M.; Vos, P. Selective Restriction Fragment Amplification:a General Method for DNA
Fingerprinting. European Patent EP0534858, September 24, 1992.
21. Althoff, D.M.; Gitzendanner, M.A.; Segraves, K.A. The utility of amplified fragment length
polymorphisms in phylogenetics: a comparison of homology within and between genomes. Syst.
Biol. 2007, 56, 477-484.
22. Goff, S.A.; Ricke, D.; Lan, T.H.; Presting, G.; Wang, R.; Dunn, M.; Glazebrook, J.; Sessions, A.;
Oeller, P.; Varma, H. Hadley, D.; Hutchison, D.; Martin, C.; Katagiri, F.; Lange, B.M.;
Moughamer, T.; Xia, Y.; Budworth, P.; Zhong, J.; Miguel, T.; Paszkowski, U.; Zhang, S.;
Colbert, M.; Sun, W.L.; Chen, L.; Cooper, B.; Park, S.; Wood, T.C.; Mao, L.; Quail, P.; Wing, R.;
Dean, R.; Yu, Y.; Zharkikh, A.; Shen, R.; Sahasrabudhe, S.; Thomas, A.; Cannings, R.; Gutin, A.;
Pruss, D.; Reid, J.; Tavtigian, S.; Mitchell, J.; Eldredge, G.; Scholl, T.; Miller, R.M.; Bhatnagar,
S.; Adey, N.; Rubano, T.; Tusneem, N.; Robinson, R.; Feldhaus, J.; Macalma, T.; Oliphant, A.;
Briggs, S. A draft sequence of the rice genome (Oryza sativa L. ssp. japonica). Science 2002, 296,
92-100.
23. Yu, J.; Hu, S.; Wang, J.; Wong, G.K.; Li, S.; Liu, B.; Deng, Y.; Dai, L.; Zhou, Y.; Zhang, X.;
Cao, M.; Liu, J.; Sun, J.; Tang, J.; Chen, Y.; Huang, X.; Lin, W.; Ye, C.; Tong, W.; Cong, L.;
Geng, J.; Han, Y.; Li, L.; Li, W.; Hu, G.; Huang, X.; Li, W.; Li, J.; Liu, Z.; Li, L.; Liu, J.; Qi, Q.;
Liu, J.; Li, L.; Li, T.; Wang, X.; Lu, H.; Wu, T.; Zhu, M.; Ni, P.; Han, H.; Dong, W.; Ren, X.;
Feng, X.; Cui, P.; Li, X.; Wang, H.; Xu, X.; Zhai, W.; Xu, Z.; Zhang, J.; He, S.; Zhang, J.; Xu, J.;
Zhang, K.; Zheng, X.; Dong, J.; Zeng, W.; Tao, L.; Ye, J.; Tan, J.; Ren, X.; Chen, X.; He, J.; Liu,
D.; Tian, W.; Tian, C.; Xia, H.; Bao, Q.; Li, G.; Gao, H.; Cao, T.; Wang, J.; Zhao, W.; Li, P.;
Chen, W.; Wang, X.; Zhang, Y.; Hu, J.; Wang, J.; Liu, S.; Yang, J.; Zhang, G.; Xiong, Y.; Li, Z.;
Mao, L.; Zhou, C.; Zhu, Z.; Chen, R.; Hao, B.; Zheng, W.; Chen, S.; Guo, W.; Li, G.; Liu, S.;
Tao, M.; Wang, J.; Zhu, L.; Yuan, L.; Yang, H. A draft sequence of the rice Genome (Oryza
sativa L. ssp. indica). Science 2002, 296, 79-92.
24. Arabidopsis Genome Initiative. Analysis of the genome sequence of the flowering plant
Arabidopsis thaliana. Nature 2000, 408, 796-815.
25. Bouck, A.; Vision, T. The molecular ecologist’s guide to expressed sequence tags. Mol. Ecol.
2007, 16, 907-924.
26. Cordeiro, G.M.; Casu, R.; McIntyre, C.L.; Manners, J.M.; Henry, R.J. Microsatellite markers from
sugarcane (Saccharum spp.) ESTs cross transferable to erianthus and sorghum. Plant Sci. 2001,
160, 1115-1123.
27. Vasemagi, A. Expressed sequence tag (EST) linked microsatellites as a source of gene associated
polymorphisms for detecting signatures of divergent selection in Atlantic salmon (Salmo salar
L.). Mol. Biol. Evol. 2005, 22, 1067-1076.
28. Karaiskou, N. High degree of transferability of 86 newly developed zebra finch EST-linked
microsatellite markers in 8 bird species. J. Hered. 2008, 99, 688-693.
29. Dietrich, W.; Katz, H.; Lincoln, S.E.; Shin, H.S.; Friedman, J.; Dracopoli, N.C.; Lander, E.S.
A genetic map of mouse suitable for typing intraspecific crosses. Genetics 1992, 131, 423-447.

Diversity 2009, 1
33
30. Bell, C.J.; Ecker, J.R. Assignment of 30 microsatellite loci to the linkage map of Arabidopsis.
Genomics 1994, 19, 137-144.
31. Morgante, M.; Olivieri, A.M. PCR-amplified microsatelites as markers in plant genetics. Plant J.
1993, 3, 175-182.
32. Schlotterer, C.; Tautz, D. Slippage synthesis of simple sequence DNA. Nucleic Acids Res. 1992,
20, 2211-2215.
33. Gupta, P.K.; Varshney, R.K. The development and use of microsatellite markers for genetic
analysis and plant breeding with emphasis on bread wheat. Euphytica 2000, 113, 163-185.
34. Sunyaev, S.; Hanke, J.; Aydin, A.; Wirkner, U.; Zastrow, I.; Reich, J.; Bork, P. Prediction of
nonsynonymous single nucleotide polymorphisms in human disease-associated genes. J. Mol.
Med. 1999, 77, 754-760.
35. Richard, I.; Beckman, J.S. How neutral are synonymous codon mutations? Nat. Genet. 1995,
10, 259.
36. Sobrino, B.; Briona, M.; Carracedoa, A. SNPs in forensic genetics: a review on SNP typing
methodologies. Forensic Sci. Int. 2005, 154, 181-194.
37. Provan, J.; Russell, J.R.; Booth, A.; Powell, W. Polymorphic chloroplast simple-sequence repeat
primers for systematic and population studies in the genus Hordeum. Mol. Ecol. 1999, 8, 505-511.
38. Provan, J.; Soranzo, N.; Wilson, N.J.; Goldstein, D.B.; Powell, W.A. Low mutation rate for
chloroplast microsatellites. Genetics 1999, 153, 943-947.
39. Ali, I.F.; Neale, D.B.; Marshall, K.A. Chloroplast DNA restriction fragment length polymorphism
in Sequoia sempervirens D. Don Endl., Pseudotsuga menzipsii (Mirb.) Franco, Calocedrus
decurrens (Ton ), and Pinus taeda. L. Theor. Appl. Genet. 1991, 81, 83-89.
40. McCauley, D.E. Contrasting the distribution of chloroplast DNA and allozyme polymorphisms
among local populations of Silene alba: implications for studying gene flow in plants. Proc. Nat.
Acad. Sci. 1994, 17, 8127-8131.
41. Bucci, G.; Anzidei, M.; Madaghiele, A.; Vendramin, G.G. Detection of haplotypic variation and
natural hybridization in halepensiscomplex pine species using chloroplast simple sequence repeat
(SSR) markers. Mol. Ecol. 1998, 7, 1633-1643.
42. Clark, C.M.; Wentworth, T.M.; Malley, D.M.O. Genetic discontinuity revealed by chloroplast
microsatellites in eastern North American Abies (Pinaceae). Am. J. Bot. 2000, 87, 774-778.
43. Parducci, L.; Szmidt, A.E.; Madaghiele, A.; Anzidei, M.; Vendramin, G.G. Genetic variation at
chloroplast microsatellites (cpSSRs) in Abies nebrodensis (Lojac.) Mattei and three neighboring
Abies species. Theor. Appl. Genet. 2001, 102, 733-740.
44. Shaw, J.; Lickey, E.B.; Beck, J.T.; Farmer, S.B.; Liu, W.; Miller, J.; Siripun, K.C.; Winder, C.T.;
Schilling, E.E.; Small, R. The tortoise and Hare II: relative utility of 21 noncoding chloroplast
DNA sequences for phylogenetic analysis. Am. J. Bot. 2005, 92, 142-166.
45. Miller, W.; McDonald, J.; Pinsker, W. Molecular domestication of mobile elements. Genetica
1997, 100, 261-270.
46. Agrawal, A.; Eastmann, Q.; Schatz, D. Transposition mediated by RAG1 and RAG2 and its
implications for the evolution of the immune system. Nature 1998, 394, 744-751.
47. May, B.P.; Dellaporta, S.L. Transposon sequences drive tissue-specific expression of the maize
regulatory gene R-s. Plant J. 1998, 13, 241-248.

Diversity 2009, 1
34
48. Girard, L.; Freeling, M. Regulatory changes as a consequence of transposon insertion. Dev. Genet.
1999, 25, 291-296.
49. Gray, Y. It takes two transposon to tango. Trends Genet. 2000, 16, 461-468.
50. Gynheung, A.; Dong-Hoon, J.; Ki-Hong, J.; Sichul, L. Reverse genetic approaches for functional
genomics of rice. Plant. Mol. Biol. 2005, 59, 111-123.
51. Katsiotis, A.; Schmidt, T.; Heslop-Harrison, J. Chromosomal and genomic organization of Ty1-
copia-like retrotransposon sequences in the genus Avena. Genome 1996, 39, 410-417.
52. Suoniemi, A.; Anamthawat-Jonsson, K.; Arna, T.; Schulman, A. Retrotransposon BARE-1 is a
major, dispersed component of the barley (Hordeum vulgare L.) genome. Plant. Mol. Biol. 1996,
30, 1321-1329.
53. Flavell, A.; Smith, D.; Kumar, A. Extreme heterogenity of Ty1-copia group retrotransposons in
plants. Mol. Genet. Genom. 1992, 231, 233-242.
54. Voytas, D.F.; Cummings, M.P.; Konieczny, A.; Ausubel, F.M.; Roderme, S.R. Copia-like
retrotransposons are ubiquitous among plants. Proc. Natl. Acad. Sci. USA 1992, 89, 7124-7128.
55. Heid, C.A.; Stevens, J.; Livak, K.J.; Williams, P.M. Real time quantitative PCR. Genome Res.
1996, 6, 986-994.
56. Pagnotta, M.A.; Mondini, L.; Porceddu, E. Real-time PCR and IRAP: tools for assessing genetic
variability and quantitation of WIS 2-1A and BARE-1 retrotransposons in hulled wheat. Mol.
Gen. Genom. 2009, doi: 10.1007/s00438-009-0462-6 (in press).
57. Akbari, M.; Wenzl, P.; Caig, V.; Carling, J.; Xia, L.; Yang, S.; Uszinski, G.; Mohler, V.;
Lehmensiek, A.; Kuchel, H.; Hayden, M.J.; Howes, N.; Sharp, P.; Vaughan, P.; Rathmell, B.;
Huttner, E.; Kilian, A. Diversity arrays technology (DArT) for high-throughput profiling of the
hexaploid wheat genome. Theor. Appl. Genet. 2006, 113, 1409-1420.
58. Bentley, D.R. Whole-genome re-sequencing. Curr. Opin. Genet. Dev. 2006, 16, 545-552.
59. Holt, R.A.; Jones, S.J.M. The new paradigm of flow cell sequencing. Genome Res. 2008, 18,
839-846.
60. Mardis, E.R. The impact of next-generation sequencing technology on genetics. Trends Genet.
2008, 24, 133-141.
61. Margulies, M.; Egholm, M.; Altman, W.E.; Attiya, S.; Bader, J.S.; Bemben, L.A.; Berka, J.;
Braverman, M.S.; Chen, Y.J.; Chen, Z.; Dewell, S.B.; Du, L.; Fierro, J.M.; Gomes, X.V.; Godwin,
B.C.; He, W.; Helgesen, S; He Ho, C.; Irzyk, G.P.; Jando, S.C.; Alenquer, M.L.I.; Jarvie, T.P.;
Jirage, K.B.; Kim, J.B.; Knight, J.R.; Lanza, J.R.; Leamon, J.H.; Lefkowitz, S.M.; Lei, M.; Li, J.;
Lohman, K.L.; Lu, H.; Makhijani, V.B.; McDade, K.E.; McKenna, M.P.; Myers, E.W.;
Nickerson, E.; Nobile, J.R.; Plant, R.; Puc, B.P.; Ronan, M.T.; Roth, G.T.; Sarkis, G.J.; Simons,
J.F.; Simpson, J.W.; Srinivasan, M.; Tartaro, K.R.; Tomasz, A.; Vogt, K.A.; Volkmer, G.A.;
Wang, S.H.; Wang, Y.; Weiner, M.P.; Yu, P.; Begley, R.F.; Rothberg, J.M. Genome sequencing
in microfabricated high-density picolitre reactors. Nature 2005, 437, 376-380.
62. Shendure, J.; Porreca, G.J.; Reppas, N.B.; Lin, X.; McCutcheon, J.P.; Rosenbaum, A.M.; Wang,
M.D.; Zhang, K.; Mitra, R.D.; Church, G.M. Accurate multiplex polony sequencing of an evolved
bacterial genome. Science 2005, 309, 1728-1732.

Diversity 2009, 1
35
63. Jump, A.S.; Peñuelas, J. Running to stand still: adaptation and the response of plants to rapid
climate change. Ecol. Lett. 2005, 8, 1010-1020.
© 2009 by the authors; licensee Molecular Diversity Preservation International, Basel, Switzerland.
This article is an open-access article distributed under the terms and conditions of the Creative
Commons Attribution license (http://creativecommons.org/licenses/by/3.0/).