Assessing bone loss in micro-gravity: A fuzzy approach
12
c o m p u t e r m e t h o d s a n d p r o g r a m s i n b i o m e d i c i n e 1 0 8 ( 2 0 1 2 ) 910–921 j o ur nal homep age : w ww.intl.elsevierhealth.com/journals/cmpb Assessing bone loss in micro-gravity: A fuzzy approach Bruno Beomonte Zobel, Riccardo Del Vescovo, Gabriele Oliva ∗ , Valentina Russo, Roberto Setola University Campus Bio-Medico of Rome, Italy a r t i c l e i n f o Article history: Received 27 March 2011 Received in revised form 23 April 2012 Accepted 1 May 2012 Keywords: Bone demineralization Fuzzy modeling Microgravity a b s t r a c t A prolonged stay in microgravity has various negative effects on the human body; one of these problems is a noticeable demineralization of bone tissues. Such effects are quite sim- ilar to those experienced by subjects on earth affected by osteoporosis; therefore it seems quite straightforward to adopt a similar pharmacological therapy during the stay in the space. In this paper a first step in the identification of a monitoring procedure for the bone demineralization in microgravity, as well as some guidelines for the choice of adequate ther- apies are given. Such a procedure is based on a mathematical model of the interaction of the most relevant blood and urine indicators of bone demineralization. Specifically, some bone metabolites have been identified, which are relevant to the phenomena and are feasible to be evaluated in the space. Moreover, a model to foresee the evolution of these parameters in the space, depending on the therapy chosen, is provided. The model is derived from the experience of doctors and experts, hence it is based mainly on linguistic information; such an information is codified by means of fuzzy numbers, in order to take into account their uncertainty. © 2012 Elsevier Ireland Ltd. All rights reserved. 1. Introduction Several experiences of prolonged stay in the space and the planning of inter-planets flights in the next future, make medicine in charge to cope with the negative effects of micro- gravity environment to the human body. In fact, some significant and dangerous changes have been noticed on astronauts in prolonged stays, as depicted in Table 1. Human skeletal system, in particular, evolved in an envi- ronment characterized by gravity; it is, therefore, no surprise that a prolonged stay in the space is responsible of an alter- ation of the homeostasis of the bone tissue, whose adaptation to the new environment determines a calcium loss ten times greater than female subjects in postmenopausal stage [1]. ∗ Corresponding author. Tel.: +39 225419636. E-mail addresses: [email protected] (B.B. Zobel), [email protected] (R. Del Vescovo), [email protected], [email protected] (G. Oliva), [email protected] (V. Russo), [email protected] (R. Setola). The adaptation to microgravity exposes the skeletal sys- tem to the risk of fracture, is associated to an increased risk of urinary stones and may potentially cause long-term damages [2]. In the literature some attempts to model and quantify bone-loss in microgravity have been made; however, it is a hard challenge, being difficult to perform studies in micro- gravity environment. Most of the existing works are therefore performed on earth: in [3] a Rotary Cell Culture System (RCCS) has been used, while in [4] a magnetic field has been adopted to study cell cultures; in [5] the effect of micrograv- ity on the calcium mineral nucleation has been studied from both the analytical and experimental point of view, while in [6] a simple mathematical model of bone remodeling was adopted. 0169-2607/$ – see front matter © 2012 Elsevier Ireland Ltd. All rights reserved. http://dx.doi.org/10.1016/j.cmpb.2012.05.001
Transcript of Assessing bone loss in micro-gravity: A fuzzy approach

c o m p u t e r m e t h o d s a n d p r o g r a m s i n b i o m e d i c i n e 1 0 8 ( 2 0 1 2 ) 910–921
j o ur nal homep age : w ww.int l .e lsev ierhea l th .com/ journa ls /cmpb
Assessing bone loss in micro-gravity: A fuzzy approach
Bruno Beomonte Zobel, Riccardo Del Vescovo, Gabriele Oliva ∗, Valentina Russo,Roberto SetolaUniversity Campus Bio-Medico of Rome, Italy
a r t i c l e i n f o
Article history:
Received 27 March 2011
Received in revised form
23 April 2012
Accepted 1 May 2012
Keywords:
Bone demineralization
Fuzzy modeling
a b s t r a c t
A prolonged stay in microgravity has various negative effects on the human body; one of
these problems is a noticeable demineralization of bone tissues. Such effects are quite sim-
ilar to those experienced by subjects on earth affected by osteoporosis; therefore it seems
quite straightforward to adopt a similar pharmacological therapy during the stay in the
space. In this paper a first step in the identification of a monitoring procedure for the bone
demineralization in microgravity, as well as some guidelines for the choice of adequate ther-
apies are given. Such a procedure is based on a mathematical model of the interaction of the
most relevant blood and urine indicators of bone demineralization. Specifically, some bone
metabolites have been identified, which are relevant to the phenomena and are feasible to
Microgravity be evaluated in the space. Moreover, a model to foresee the evolution of these parameters
in the space, depending on the therapy chosen, is provided. The model is derived from the
experience of doctors and experts, hence it is based mainly on linguistic information; such
an information is codified by means of fuzzy numbers, in order to take into account their
uncertainty.
ity on the calcium mineral nucleation has been studied from
1. Introduction
Several experiences of prolonged stay in the space and theplanning of inter-planets flights in the next future, makemedicine in charge to cope with the negative effects of micro-gravity environment to the human body.
In fact, some significant and dangerous changes havebeen noticed on astronauts in prolonged stays, as depictedin Table 1.
Human skeletal system, in particular, evolved in an envi-ronment characterized by gravity; it is, therefore, no surprisethat a prolonged stay in the space is responsible of an alter-
ation of the homeostasis of the bone tissue, whose adaptationto the new environment determines a calcium loss ten timesgreater than female subjects in postmenopausal stage [1].∗ Corresponding author. Tel.: +39 225419636.E-mail addresses: [email protected] (B.B. Zobel), r.delves
[email protected] (G. Oliva), [email protected] (V. Russo), r.seto0169-2607/$ – see front matter © 2012 Elsevier Ireland Ltd. All rights reshttp://dx.doi.org/10.1016/j.cmpb.2012.05.001
© 2012 Elsevier Ireland Ltd. All rights reserved.
The adaptation to microgravity exposes the skeletal sys-tem to the risk of fracture, is associated to an increasedrisk of urinary stones and may potentially cause long-termdamages [2].
In the literature some attempts to model and quantifybone-loss in microgravity have been made; however, it is ahard challenge, being difficult to perform studies in micro-gravity environment. Most of the existing works are thereforeperformed on earth: in [3] a Rotary Cell Culture System(RCCS) has been used, while in [4] a magnetic field has beenadopted to study cell cultures; in [5] the effect of micrograv-
[email protected] (R. Del Vescovo), [email protected],[email protected] (R. Setola).
both the analytical and experimental point of view, while in[6] a simple mathematical model of bone remodeling wasadopted.
erved.

c o m p u t e r m e t h o d s a n d p r o g r a m s i n b i o m e d i c i n e 1 0 8 ( 2 0 1 2 ) 910–921 911
Table 1 – Physiological changes in microgravity [5,2].
System Effects
Skeletal Calcium lossMuscular Reduced tropismCardio-vascular 10–20% blood mass reduction, anemia, fluids
shift from lower limbs to chest and headImmune Lymphatic organs tropism reduction,
reduced antigenic stimulus, resulting into areduced lymphocytic differentiation
Endocrine Production increase of GH, cortisol, PRLfollowing physical activity; increasedproduction of cathecolamines duringstressing periods
Nervous Loss of awake–asleep cycle, reduced ability toconcentrate, difficulty in complex motorcoordination
tpdh
otlhskaicstp
ttits
sb[
btiswe
ictpd
Table 2 – Therapies used as inputs for the model.
Therapy Input Dosage Measure unit
Physical exercise u1 0.25/1.25/2.5 h/day
All the organs Increased levels of absorbed ionizingradiation doses with potential dangerous,long-term effects
Analogously, the studies on humans are typically limitedo bed resting [7,8] or menopause women [9] or senile osteo-orosis in general [10–12], that for obvious reasons cannot beirectly applied to astronauts, due to the completely differentormonal characteristics.
Nevertheless, some works have been specifically tailoredn astronauts [1,13,2]; the results showed a monthly reduc-ion of the bone mineral density of about 1.06% at the femurevel and about 1–1.6% at the hip level. These studies have alsoighlighted that the demineralization occurs mainly at thepine and femur proximal portion. In particular, although it isnown that the bone loss at proximal femur level is restoredbout one year after the return to earth, such a restorations mainly associated to an increase in size, which might notorrespond to an increase in the resistance of the bone. Theubjects, however, were analyzed before and after the stay intohe space, without giving any insight on the evolution of thehenomenon.
Clinical studies [14,15] have highlighted that it is possibleo compare the effects of bone demineralization, induced byhe absence of gravity, with those induced by osteoporosis. Its well known that to counteract demineralization process ofhe osteoporosis, one can adopt dietetics and pharmacologicalupplements, along with physical exercise [16].
Although physical activity programs are tailored to eachingle astronaut, it seems not enough to prevent the draw-acks deriving from a prolonged condition of micro-gravity
14–16].On the other hand, although being quite ineffective for
one demineralization, physical exercise is mandatory, sincehe human body tends to adapt to the microgravity conditionn a variety of ways such as reducing the hydrostatic pres-ure gradients within the cardiovascular system, reducing theeight load upon the muscles and bones, and requiring less
nergy consumption [17].Hence, to adequately counteract the negative effects, there
s the need to complement the physical activities and the spe-
ific diet (i.e., Vitamin D and calcium dietary supplements areypically given through all the stay in microgravity) with aharmacological therapy. Starting from the similarity of theemineralization in microgravity with that experienced onTeriparatide u2 10/50/100 mcg/dayAlendronate u3 7/35/70 mg/week
the earth by osteoporotic subjects, in this paper we proposea therapy based on two drugs commonly used while treatingosteoporosis, Teriparatide and Alendronate, in combinationwith physical activity (a synoptic view of therapies consid-ered in this study is presented in Table 2). The first drug is arecombinant form of parathyroid hormone, which is naturallysecreted by the human body. It is administered by injectiononce a day in the thigh or abdomen. Such a hormone increasesserum calcium, partially accomplishing this by increasingbone resorption; therefore it stimulates the formation of newbone tissue and leads to an increase in bone mineral density.However some side effects have been reported, such as nauseaand leg cramps [18].
The other drug considered in this study, namely Alen-dronate, is a bisphosphonate and it is typically marketed incombination with Vitamin D. Alendronate inhibits osteoclast-mediated bone-resorption and acts as a regulator of boneturnover, increasing bone density and reducing the risk of frac-tures. Such a drug, however, has severe side effects, such asacute inflammations of the gastrointestinal tract or hypocal-cemia. Note therefore that such a drug, besides having positiveeffects on bone mineralization, reduces the concentrationof calcium in the blood (i.e., Calcaemia), thus leading topetechiae, cardiac dysrhythmia, or even worse [19]. As a para-dox, moreover, some cases of osteonecrosis of the jaw havebeen reported as a direct consequence of this drug [19].
Note further that these drugs proved their effectiveness onearth, while the response of the human body in microgravityenvironment has not yet been studied.
In this paper a first step in the identification of a monitor-ing procedure for the bone demineralization in microgravity,as well as a guideline for the choice of adequate therapies aregiven, based on a mathematical model of the interaction of themost relevant blood and urine indicators of bone demineral-ization [20].
However, such indicators have to be chosen among thosethat are feasible to be measured in the space.
Note that the proposed model should be tuned on-boardduring space flights. To this end there is the need to carefullytailor the model on each astronaut before the mission andthen continuously tune the model using blood and urine sam-ples (e.g., with a monthly rate) during the stay in the space. Inorder to cope with the intrinsic lack of data of the problem,we have chosen to rely on the experience of doctors for thesetup of the model. The underlying idea is to systematize theknowledge, by merging the scarce information on bone dem-ineralization in the space with an a priori knowledge of doctorsabout the impact of bone loss on the chosen parameters, aswell as the complex interaction among such variables.
Such a knowledge and experience is often implicit andis anyhow affected by uncertainty and ambiguity; in orderto encode such an information we used the theory of Fuzzy
912 c o m p u t e r m e t h o d s a n d p r o g r a m s i n b i o m e d i c i n e 1 0 8 ( 2 0 1 2 ) 910–921
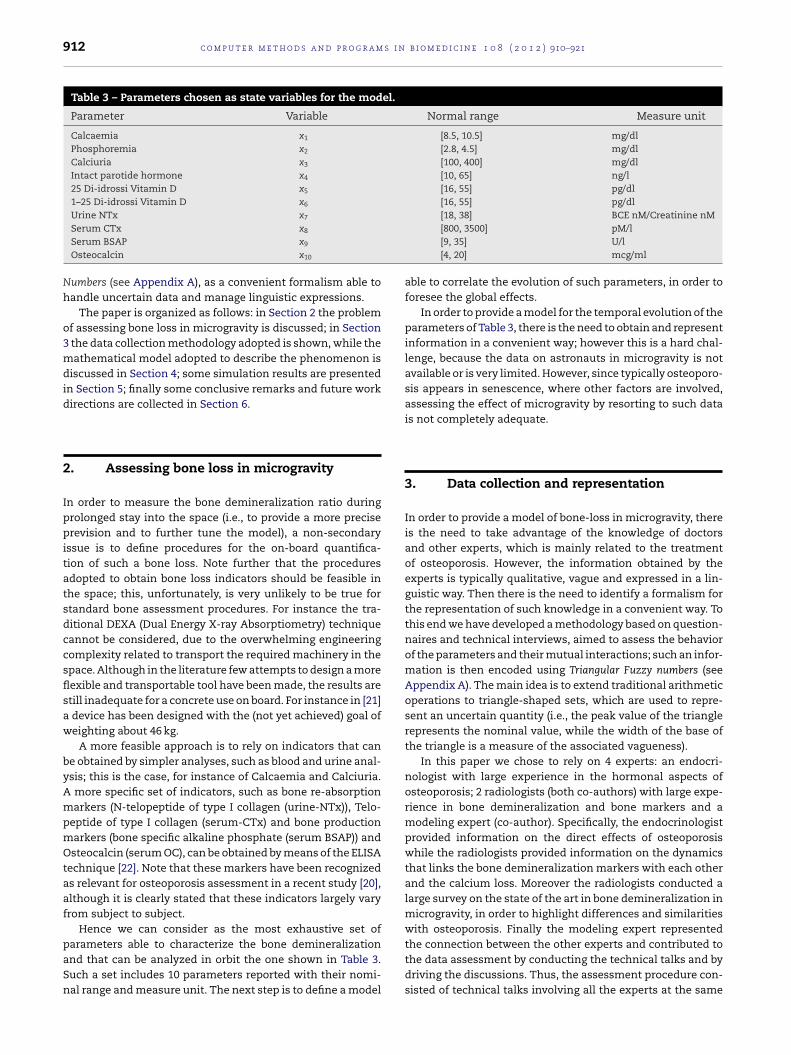
Table 3 – Parameters chosen as state variables for the model.
Parameter Variable Normal range Measure unit
Calcaemia x1 [8.5, 10.5] mg/dlPhosphoremia x2 [2.8, 4.5] mg/dlCalciuria x3 [100, 400] mg/dlIntact parotide hormone x4 [10, 65] ng/l25 Di-idrossi Vitamin D x5 [16, 55] pg/dl1–25 Di-idrossi Vitamin D x6 [16, 55] pg/dl
Urine NTx x7Serum CTx x8
Serum BSAP x9
Osteocalcin x10
Numbers (see Appendix A), as a convenient formalism able tohandle uncertain data and manage linguistic expressions.
The paper is organized as follows: in Section 2 the problemof assessing bone loss in microgravity is discussed; in Section3 the data collection methodology adopted is shown, while themathematical model adopted to describe the phenomenon isdiscussed in Section 4; some simulation results are presentedin Section 5; finally some conclusive remarks and future workdirections are collected in Section 6.
2. Assessing bone loss in microgravity
In order to measure the bone demineralization ratio duringprolonged stay into the space (i.e., to provide a more preciseprevision and to further tune the model), a non-secondaryissue is to define procedures for the on-board quantifica-tion of such a bone loss. Note further that the proceduresadopted to obtain bone loss indicators should be feasible inthe space; this, unfortunately, is very unlikely to be true forstandard bone assessment procedures. For instance the tra-ditional DEXA (Dual Energy X-ray Absorptiometry) techniquecannot be considered, due to the overwhelming engineeringcomplexity related to transport the required machinery in thespace. Although in the literature few attempts to design a moreflexible and transportable tool have been made, the results arestill inadequate for a concrete use on board. For instance in [21]a device has been designed with the (not yet achieved) goal ofweighting about 46 kg.
A more feasible approach is to rely on indicators that canbe obtained by simpler analyses, such as blood and urine anal-ysis; this is the case, for instance of Calcaemia and Calciuria.A more specific set of indicators, such as bone re-absorptionmarkers (N-telopeptide of type I collagen (urine-NTx)), Telo-peptide of type I collagen (serum-CTx) and bone productionmarkers (bone specific alkaline phosphate (serum BSAP)) andOsteocalcin (serum OC), can be obtained by means of the ELISAtechnique [22]. Note that these markers have been recognizedas relevant for osteoporosis assessment in a recent study [20],although it is clearly stated that these indicators largely varyfrom subject to subject.
Hence we can consider as the most exhaustive set of
parameters able to characterize the bone demineralizationand that can be analyzed in orbit the one shown in Table 3.Such a set includes 10 parameters reported with their nomi-nal range and measure unit. The next step is to define a model[18, 38] BCE nM/Creatinine nM[800, 3500] pM/l[9, 35] U/l[4, 20] mcg/ml
able to correlate the evolution of such parameters, in order toforesee the global effects.
In order to provide a model for the temporal evolution of theparameters of Table 3, there is the need to obtain and representinformation in a convenient way; however this is a hard chal-lenge, because the data on astronauts in microgravity is notavailable or is very limited. However, since typically osteoporo-sis appears in senescence, where other factors are involved,assessing the effect of microgravity by resorting to such datais not completely adequate.
3. Data collection and representation
In order to provide a model of bone-loss in microgravity, thereis the need to take advantage of the knowledge of doctorsand other experts, which is mainly related to the treatmentof osteoporosis. However, the information obtained by theexperts is typically qualitative, vague and expressed in a lin-guistic way. Then there is the need to identify a formalism forthe representation of such knowledge in a convenient way. Tothis end we have developed a methodology based on question-naires and technical interviews, aimed to assess the behaviorof the parameters and their mutual interactions; such an infor-mation is then encoded using Triangular Fuzzy numbers (seeAppendix A). The main idea is to extend traditional arithmeticoperations to triangle-shaped sets, which are used to repre-sent an uncertain quantity (i.e., the peak value of the trianglerepresents the nominal value, while the width of the base ofthe triangle is a measure of the associated vagueness).
In this paper we chose to rely on 4 experts: an endocri-nologist with large experience in the hormonal aspects ofosteoporosis; 2 radiologists (both co-authors) with large expe-rience in bone demineralization and bone markers and amodeling expert (co-author). Specifically, the endocrinologistprovided information on the direct effects of osteoporosiswhile the radiologists provided information on the dynamicsthat links the bone demineralization markers with each otherand the calcium loss. Moreover the radiologists conducted alarge survey on the state of the art in bone demineralization inmicrogravity, in order to highlight differences and similaritieswith osteoporosis. Finally the modeling expert represented
the connection between the other experts and contributed tothe data assessment by conducting the technical talks and bydriving the discussions. Thus, the assessment procedure con-sisted of technical talks involving all the experts at the same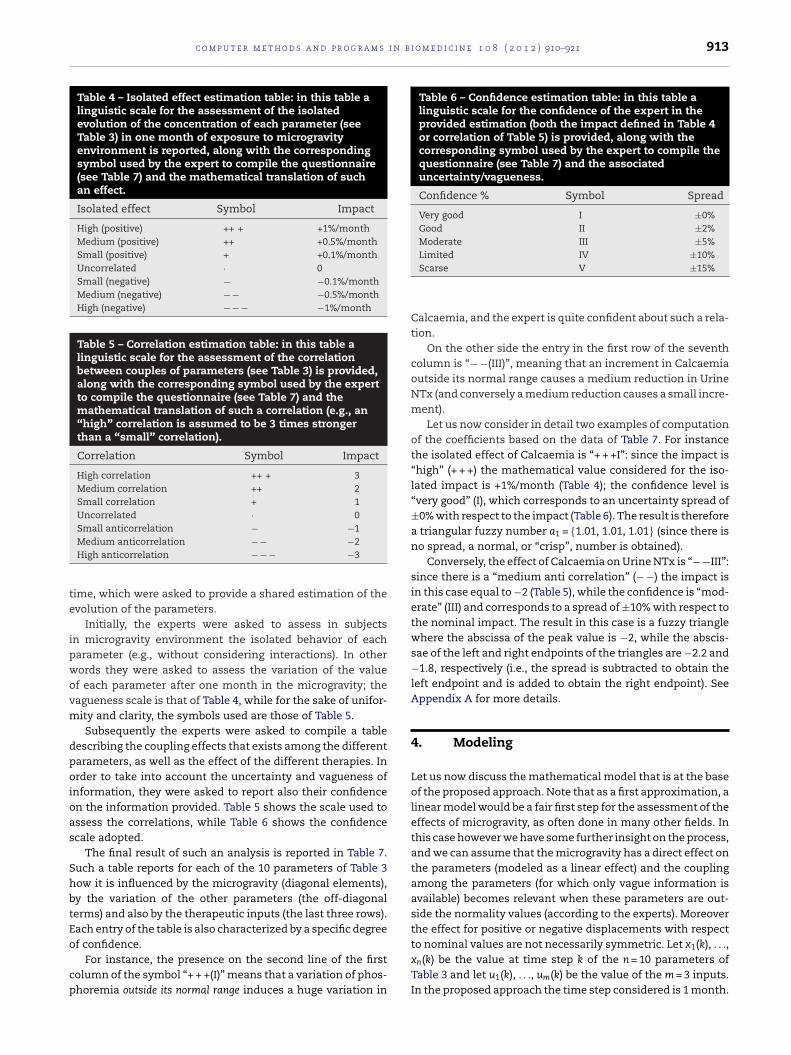
c o m p u t e r m e t h o d s a n d p r o g r a m s i n b i o m e d i c i n e 1 0 8 ( 2 0 1 2 ) 910–921 913
Table 4 – Isolated effect estimation table: in this table alinguistic scale for the assessment of the isolatedevolution of the concentration of each parameter (seeTable 3) in one month of exposure to microgravityenvironment is reported, along with the correspondingsymbol used by the expert to compile the questionnaire(see Table 7) and the mathematical translation of suchan effect.
Isolated effect Symbol Impact
High (positive) ++ + +1%/monthMedium (positive) ++ +0.5%/monthSmall (positive) + +0.1%/monthUncorrelated · 0Small (negative) − −0.1%/monthMedium (negative) − − −0.5%/monthHigh (negative) − − − −1%/month
Table 5 – Correlation estimation table: in this table alinguistic scale for the assessment of the correlationbetween couples of parameters (see Table 3) is provided,along with the corresponding symbol used by the expertto compile the questionnaire (see Table 7) and themathematical translation of such a correlation (e.g., an“high” correlation is assumed to be 3 times strongerthan a “small” correlation).
Correlation Symbol Impact
High correlation ++ + 3Medium correlation ++ 2Small correlation + 1Uncorrelated · 0
te
ipwovm
dpoioas
ShbtEo
cp
Table 6 – Confidence estimation table: in this table alinguistic scale for the confidence of the expert in theprovided estimation (both the impact defined in Table 4or correlation of Table 5) is provided, along with thecorresponding symbol used by the expert to compile thequestionnaire (see Table 7) and the associateduncertainty/vagueness.
Confidence % Symbol Spread
Very good I ±0%Good II ±2%Moderate III ±5%
Small anticorrelation − −1Medium anticorrelation − − −2High anticorrelation − − − −3
ime, which were asked to provide a shared estimation of thevolution of the parameters.
Initially, the experts were asked to assess in subjectsn microgravity environment the isolated behavior of eacharameter (e.g., without considering interactions). In otherords they were asked to assess the variation of the valuef each parameter after one month in the microgravity; theagueness scale is that of Table 4, while for the sake of unifor-ity and clarity, the symbols used are those of Table 5.Subsequently the experts were asked to compile a table
escribing the coupling effects that exists among the differentarameters, as well as the effect of the different therapies. Inrder to take into account the uncertainty and vagueness of
nformation, they were asked to report also their confidencen the information provided. Table 5 shows the scale used tossess the correlations, while Table 6 shows the confidencecale adopted.
The final result of such an analysis is reported in Table 7.uch a table reports for each of the 10 parameters of Table 3ow it is influenced by the microgravity (diagonal elements),y the variation of the other parameters (the off-diagonalerms) and also by the therapeutic inputs (the last three rows).ach entry of the table is also characterized by a specific degreef confidence.
For instance, the presence on the second line of the firstolumn of the symbol “+ + +(I)” means that a variation of phos-horemia outside its normal range induces a huge variation in
Limited IV ±10%Scarse V ±15%
Calcaemia, and the expert is quite confident about such a rela-tion.
On the other side the entry in the first row of the seventhcolumn is “− −(III)”, meaning that an increment in Calcaemiaoutside its normal range causes a medium reduction in UrineNTx (and conversely a medium reduction causes a small incre-ment).
Let us now consider in detail two examples of computationof the coefficients based on the data of Table 7. For instancethe isolated effect of Calcaemia is “+ + +I”: since the impact is“high” (+ + +) the mathematical value considered for the iso-lated impact is +1%/month (Table 4); the confidence level is“very good” (I), which corresponds to an uncertainty spread of±0% with respect to the impact (Table 6). The result is thereforea triangular fuzzy number a1 = {1.01, 1.01, 1.01} (since there isno spread, a normal, or “crisp”, number is obtained).
Conversely, the effect of Calcaemia on Urine NTx is “− −III”:since there is a “medium anti correlation” (− −) the impact isin this case equal to −2 (Table 5), while the confidence is “mod-erate” (III) and corresponds to a spread of ±10% with respect tothe nominal impact. The result in this case is a fuzzy trianglewhere the abscissa of the peak value is −2, while the abscis-sae of the left and right endpoints of the triangles are −2.2 and−1.8, respectively (i.e., the spread is subtracted to obtain theleft endpoint and is added to obtain the right endpoint). SeeAppendix A for more details.
4. Modeling
Let us now discuss the mathematical model that is at the baseof the proposed approach. Note that as a first approximation, alinear model would be a fair first step for the assessment of theeffects of microgravity, as often done in many other fields. Inthis case however we have some further insight on the process,and we can assume that the microgravity has a direct effect onthe parameters (modeled as a linear effect) and the couplingamong the parameters (for which only vague information isavailable) becomes relevant when these parameters are out-side the normality values (according to the experts). Moreoverthe effect for positive or negative displacements with respectto nominal values are not necessarily symmetric. Let x1(k), . . .,
xn(k) be the value at time step k of the n = 10 parameters ofTable 3 and let u1(k), . . ., um(k) be the value of the m = 3 inputs.In the proposed approach the time step considered is 1 month.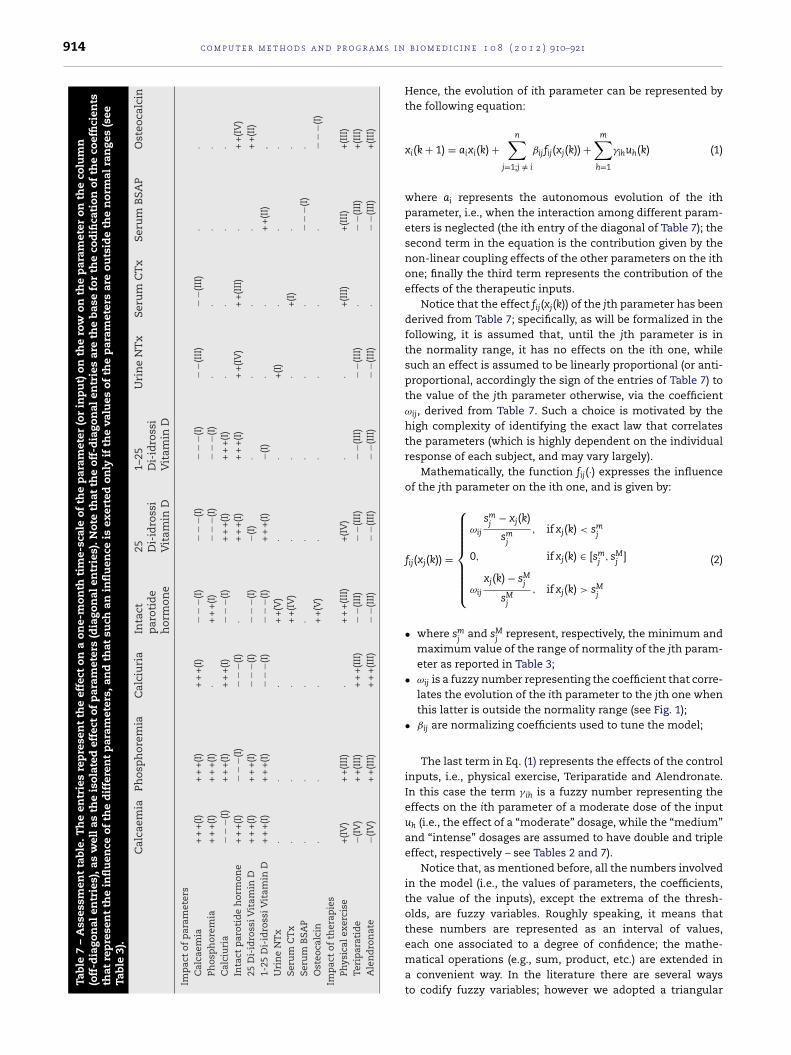
914 c o m p u t e r m e t h o d s a n d p r o g r a m s i n
Tabl
e
7
–
Ass
essm
ent
tabl
e.
Th
e
entr
ies
rep
rese
nt
the
effe
ct
on
a
one-
mon
th
tim
e-sc
ale
of
the
par
amet
er
(or
inp
ut)
on
the
row
on
the
par
amet
er
on
the
colu
mn
(off
-dia
gon
al
entr
ies)
, as
wel
l as
the
isol
ated
effe
ct
of
par
amet
ers
(dia
gon
al
entr
ies)
. Not
e
that
the
off-
dia
gon
al
entr
ies
are
the
base
for
the
cod
ifica
tion
of
the
coef
fici
ents
that
rep
rese
nt
the
infl
uen
ce
of
the
dif
fere
nt
par
amet
ers,
and
that
such
an
infl
uen
ce
is
exer
ted
only
if
the
valu
es
of
the
par
amet
ers
are
outs
ide
the
nor
mal
ran
ges
(see
Tabl
e
3).
Cal
caem
ia
Phos
ph
orem
ia
Cal
ciu
ria
Inta
ctp
arot
ide
hor
mon
e
25 Di-
idro
ssi
Vit
amin
D
1–25
Di-
idro
ssi
Vit
amin
D
Uri
ne
NT
x
Seru
m
CT
x
Seru
m
BSA
P
Ost
eoca
lcin
Imp
act
of
par
amet
ers
Cal
caem
ia+
+
+(I
)+
+
+(I
)+
+
+(I
)−
−−(
I)−
−−(
I)−
−−(
I)−
−(II
I)−
−(II
I)·
·Ph
osp
hor
emia
+
+
+(I
)+
+
+(I
)·
+
+
+(I
)−
−−(
I)−
−−(
I)·
··
·C
alci
uri
a−
−−(
I)+
+
+(I
)+
+
+(I
)−
−−(
I)+
+
+(I
)+
+
+(I
)·
·
· ·
Inta
ct
par
otid
e
hor
mon
e+
+
+(I
)−
−−(
I)−
−−(
I)·
+
+
+(I
)+
+
+(I
)
+
+(I
V)
+
+(I
II)
· +
+(I
V)
25
Di-
idro
ssi V
itam
in
D+
+
+(I
)+
+
+(I
)−
−
−(I)
−
−
−(I)
−(I)
·
·
·
·
+
+(I
I)1-
25
Di-
idro
ssi V
itam
in
D+
+
+(I
)+
+
+(I
)
−
−
−(I)
−
−
−(I)
+
+
+(I
)
−(I)
·
·
+
+(I
I)
.U
rin
e
NT
x
·
·
·
+
+(V
)
·
·
+(I
)
·
·
·Se
rum
CT
x
·
·
·
+
+(I
V)
·
·
·
+(I
) ·
·Se
rum
BSA
P
·
·
·
·
·
·
·
· −
−
−(I)
·O
steo
calc
in·
·
·
+
+(V
)
·
·
·
· ·
−
−
−(I)
Imp
act
of
ther
apie
sPh
ysic
al
exer
cise
+(I
V)
+
+(I
II)
·
+
+
+(I
II)
+(I
V)
·
·
+(I
II)
+(I
II)
+(I
II)
Teri
par
atid
e−(
IV)
+
+(I
II)
+
+
+(I
II)
−
−(II
I)
−
−(II
I)
−
−(II
I)
− −(
III)
·
−
−(II
I)
+(I
II)
Ale
nd
ron
ate
−(IV
)
+
+(I
II)
+
+
+(I
II)
−
−(II
I)
−
−(II
I)
−
−(II
I)
− −(
III)
·
−
−(II
I)
+(I
II)
b i o m e d i c i n e 1 0 8 ( 2 0 1 2 ) 910–921
Hence, the evolution of ith parameter can be represented bythe following equation:
xi(k + 1) = aixi(k) +n∑
j=1;j /= i
ˇijfij(xj(k)) +m∑
h=1
�ihuh(k) (1)
where ai represents the autonomous evolution of the ithparameter, i.e., when the interaction among different param-eters is neglected (the ith entry of the diagonal of Table 7); thesecond term in the equation is the contribution given by thenon-linear coupling effects of the other parameters on the ithone; finally the third term represents the contribution of theeffects of the therapeutic inputs.
Notice that the effect fij(xj(k)) of the jth parameter has beenderived from Table 7; specifically, as will be formalized in thefollowing, it is assumed that, until the jth parameter is inthe normality range, it has no effects on the ith one, whilesuch an effect is assumed to be linearly proportional (or anti-proportional, accordingly the sign of the entries of Table 7) tothe value of the jth parameter otherwise, via the coefficientωij, derived from Table 7. Such a choice is motivated by thehigh complexity of identifying the exact law that correlatesthe parameters (which is highly dependent on the individualresponse of each subject, and may vary largely).
Mathematically, the function fij(·) expresses the influenceof the jth parameter on the ith one, and is given by:
fij(xj(k)) =
⎧⎪⎪⎪⎪⎪⎪⎨⎪⎪⎪⎪⎪⎪⎩
ωij
smj
− xj(k)
smj
, if xj(k) < smj
0, if xj(k) ∈ [smj
, sMj
]
ωij
xj(k) − sMj
sMj
, if xj(k) > sMj
(2)
• where smj
and sMj
represent, respectively, the minimum andmaximum value of the range of normality of the jth param-eter as reported in Table 3;
• ωij is a fuzzy number representing the coefficient that corre-lates the evolution of the ith parameter to the jth one whenthis latter is outside the normality range (see Fig. 1);
• ˇij are normalizing coefficients used to tune the model;
The last term in Eq. (1) represents the effects of the controlinputs, i.e., physical exercise, Teriparatide and Alendronate.In this case the term � ih is a fuzzy number representing theeffects on the ith parameter of a moderate dose of the inputuh (i.e., the effect of a “moderate” dosage, while the “medium”and “intense” dosages are assumed to have double and tripleeffect, respectively – see Tables 2 and 7).
Notice that, as mentioned before, all the numbers involvedin the model (i.e., the values of parameters, the coefficients,the value of the inputs), except the extrema of the thresh-olds, are fuzzy variables. Roughly speaking, it means thatthese numbers are represented as an interval of values,
each one associated to a degree of confidence; the mathe-matical operations (e.g., sum, product, etc.) are extended ina convenient way. In the literature there are several waysto codify fuzzy variables; however we adopted a triangular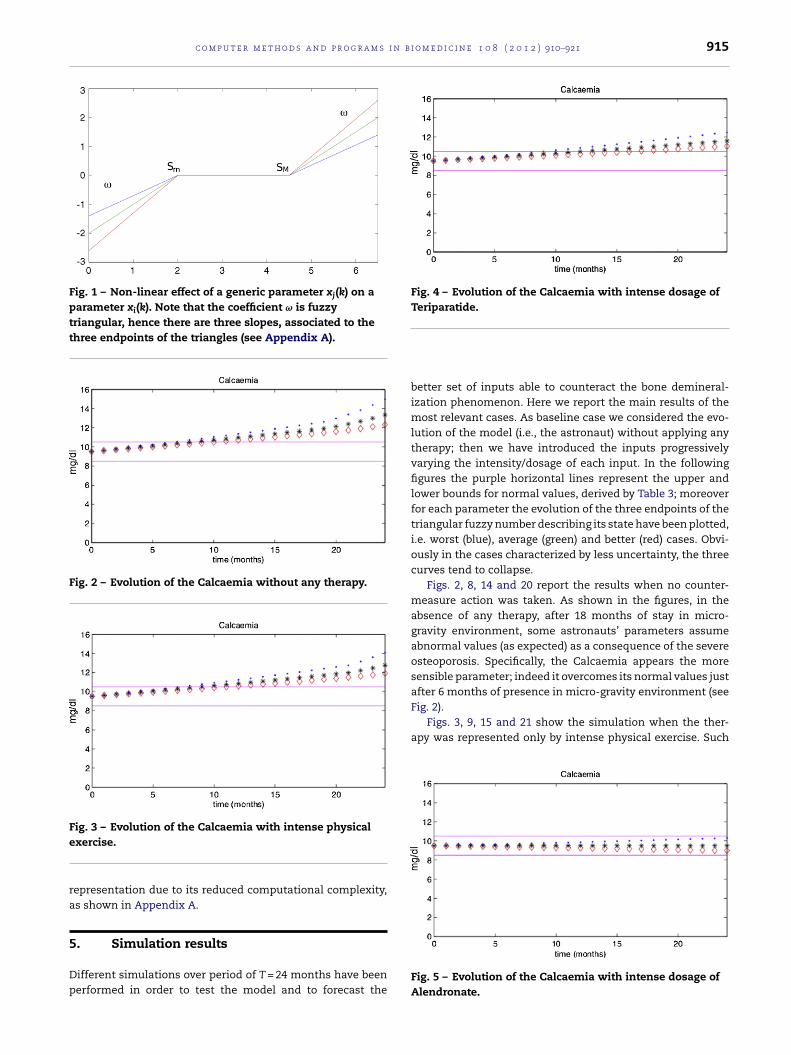
c o m p u t e r m e t h o d s a n d p r o g r a m s i n b i o m e d i c i n e 1 0 8 ( 2 0 1 2 ) 910–921 915
Fig. 1 – Non-linear effect of a generic parameter xj(k) on aparameter xi(k). Note that the coefficient ω is fuzzytriangular, hence there are three slopes, associated to thethree endpoints of the triangles (see Appendix A).
Fig. 2 – Evolution of the Calcaemia without any therapy.
Fe
ra
5
Dp
Fig. 4 – Evolution of the Calcaemia with intense dosage ofTeriparatide.
Fig. 2).Figs. 3, 9, 15 and 21 show the simulation when the ther-
apy was represented only by intense physical exercise. Such
ig. 3 – Evolution of the Calcaemia with intense physicalxercise.
epresentation due to its reduced computational complexity,s shown in Appendix A.
. Simulation results
ifferent simulations over period of T = 24 months have beenerformed in order to test the model and to forecast the
better set of inputs able to counteract the bone demineral-ization phenomenon. Here we report the main results of themost relevant cases. As baseline case we considered the evo-lution of the model (i.e., the astronaut) without applying anytherapy; then we have introduced the inputs progressivelyvarying the intensity/dosage of each input. In the followingfigures the purple horizontal lines represent the upper andlower bounds for normal values, derived by Table 3; moreoverfor each parameter the evolution of the three endpoints of thetriangular fuzzy number describing its state have been plotted,i.e. worst (blue), average (green) and better (red) cases. Obvi-ously in the cases characterized by less uncertainty, the threecurves tend to collapse.
Figs. 2, 8, 14 and 20 report the results when no counter-measure action was taken. As shown in the figures, in theabsence of any therapy, after 18 months of stay in micro-gravity environment, some astronauts’ parameters assumeabnormal values (as expected) as a consequence of the severeosteoporosis. Specifically, the Calcaemia appears the moresensible parameter; indeed it overcomes its normal values justafter 6 months of presence in micro-gravity environment (see
Fig. 5 – Evolution of the Calcaemia with intense dosage ofAlendronate.
916 c o m p u t e r m e t h o d s a n d p r o g r a m s i n b i o m e d i c i n e 1 0 8 ( 2 0 1 2 ) 910–921
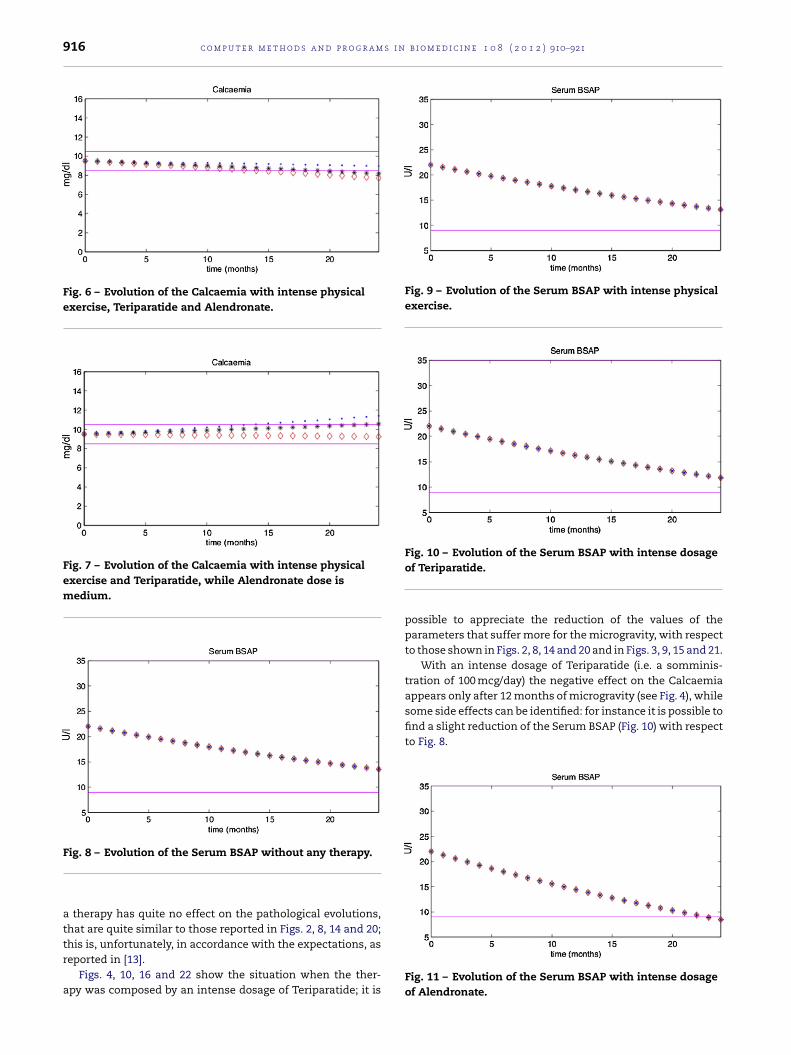
Fig. 6 – Evolution of the Calcaemia with intense physicalexercise, Teriparatide and Alendronate.
Fig. 7 – Evolution of the Calcaemia with intense physicalexercise and Teriparatide, while Alendronate dose ismedium.
Fig. 9 – Evolution of the Serum BSAP with intense physicalexercise.
some side effects can be identified: for instance it is possible tofind a slight reduction of the Serum BSAP (Fig. 10) with respectto Fig. 8.
Fig. 8 – Evolution of the Serum BSAP without any therapy.
a therapy has quite no effect on the pathological evolutions,that are quite similar to those reported in Figs. 2, 8, 14 and 20;
this is, unfortunately, in accordance with the expectations, asreported in [13].Figs. 4, 10, 16 and 22 show the situation when the ther-apy was composed by an intense dosage of Teriparatide; it is
Fig. 10 – Evolution of the Serum BSAP with intense dosageof Teriparatide.
possible to appreciate the reduction of the values of theparameters that suffer more for the microgravity, with respectto those shown in Figs. 2, 8, 14 and 20 and in Figs. 3, 9, 15 and 21.
With an intense dosage of Teriparatide (i.e. a somminis-tration of 100 mcg/day) the negative effect on the Calcaemiaappears only after 12 months of microgravity (see Fig. 4), while
Fig. 11 – Evolution of the Serum BSAP with intense dosageof Alendronate.
c o m p u t e r m e t h o d s a n d p r o g r a m s i n b i o m e d i c i n e 1 0 8 ( 2 0 1 2 ) 910–921 917
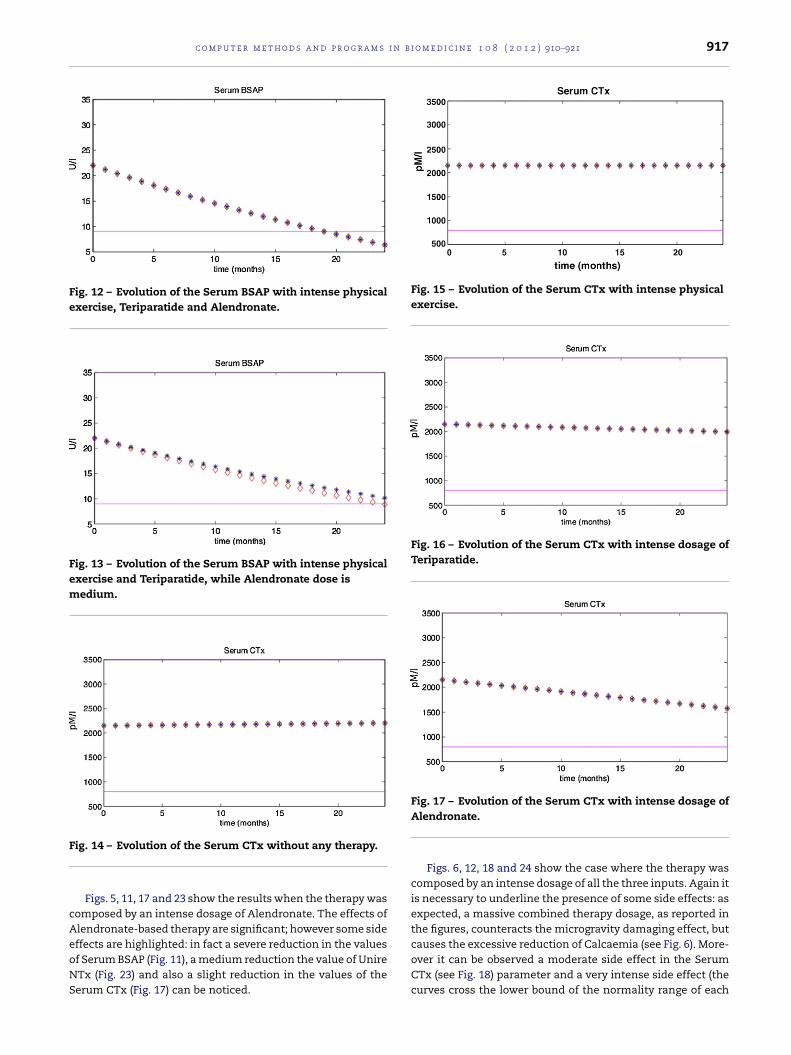
Fig. 12 – Evolution of the Serum BSAP with intense physicalexercise, Teriparatide and Alendronate.
Fig. 13 – Evolution of the Serum BSAP with intense physicalexercise and Teriparatide, while Alendronate dose ismedium.
F
cAeoNS
Fig. 15 – Evolution of the Serum CTx with intense physicalexercise.
Fig. 16 – Evolution of the Serum CTx with intense dosage ofTeriparatide.
causes the excessive reduction of Calcaemia (see Fig. 6). More-
ig. 14 – Evolution of the Serum CTx without any therapy.
Figs. 5, 11, 17 and 23 show the results when the therapy wasomposed by an intense dosage of Alendronate. The effects oflendronate-based therapy are significant; however some sideffects are highlighted: in fact a severe reduction in the values
f Serum BSAP (Fig. 11), a medium reduction the value of UnireTx (Fig. 23) and also a slight reduction in the values of theerum CTx (Fig. 17) can be noticed.Fig. 17 – Evolution of the Serum CTx with intense dosage ofAlendronate.
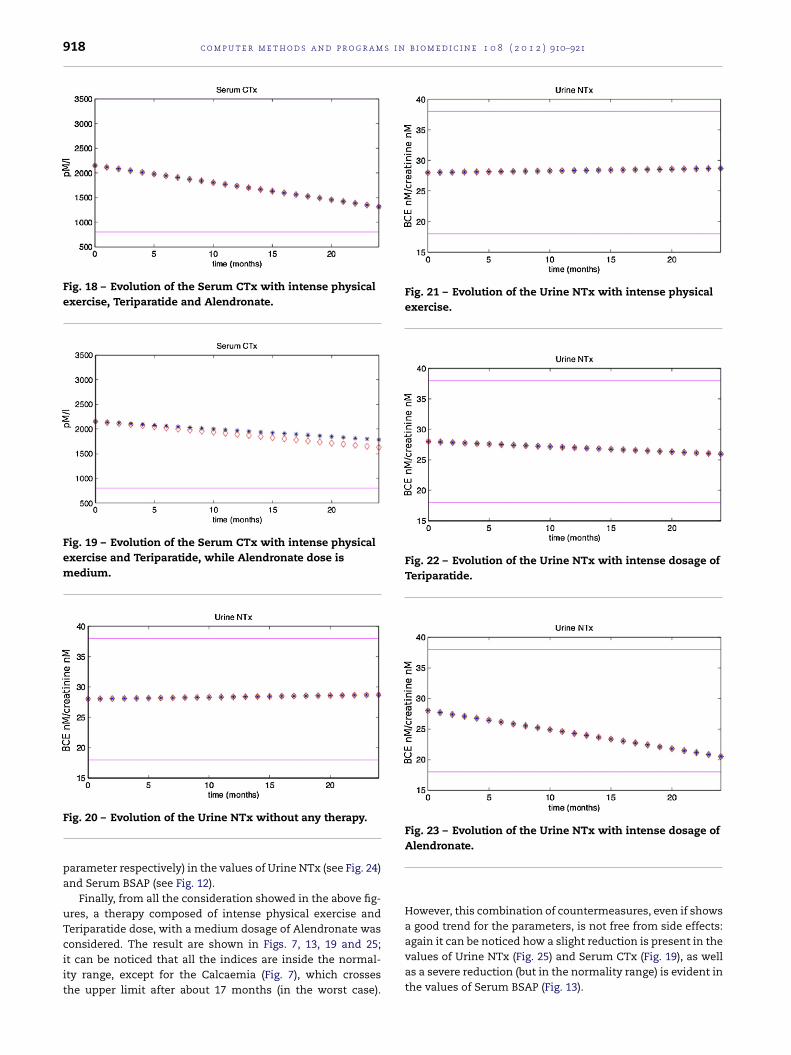
Figs. 6, 12, 18 and 24 show the case where the therapy wascomposed by an intense dosage of all the three inputs. Again itis necessary to underline the presence of some side effects: asexpected, a massive combined therapy dosage, as reported inthe figures, counteracts the microgravity damaging effect, but
over it can be observed a moderate side effect in the SerumCTx (see Fig. 18) parameter and a very intense side effect (thecurves cross the lower bound of the normality range of each
918 c o m p u t e r m e t h o d s a n d p r o g r a m s i n b i o m e d i c i n e 1 0 8 ( 2 0 1 2 ) 910–921
Fig. 18 – Evolution of the Serum CTx with intense physicalexercise, Teriparatide and Alendronate.
Fig. 19 – Evolution of the Serum CTx with intense physicalexercise and Teriparatide, while Alendronate dose ismedium.
Fig. 21 – Evolution of the Urine NTx with intense physicalexercise.
Fig. 22 – Evolution of the Urine NTx with intense dosage ofTeriparatide.
Fig. 23 – Evolution of the Urine NTx with intense dosage of
Fig. 20 – Evolution of the Urine NTx without any therapy.parameter respectively) in the values of Urine NTx (see Fig. 24)and Serum BSAP (see Fig. 12).
Finally, from all the consideration showed in the above fig-ures, a therapy composed of intense physical exercise andTeriparatide dose, with a medium dosage of Alendronate was
considered. The result are shown in Figs. 7, 13, 19 and 25;it can be noticed that all the indices are inside the normal-ity range, except for the Calcaemia (Fig. 7), which crossesthe upper limit after about 17 months (in the worst case).Alendronate.
However, this combination of countermeasures, even if showsa good trend for the parameters, is not free from side effects:again it can be noticed how a slight reduction is present in thevalues of Urine NTx (Fig. 25) and Serum CTx (Fig. 19), as well
as a severe reduction (but in the normality range) is evident inthe values of Serum BSAP (Fig. 13).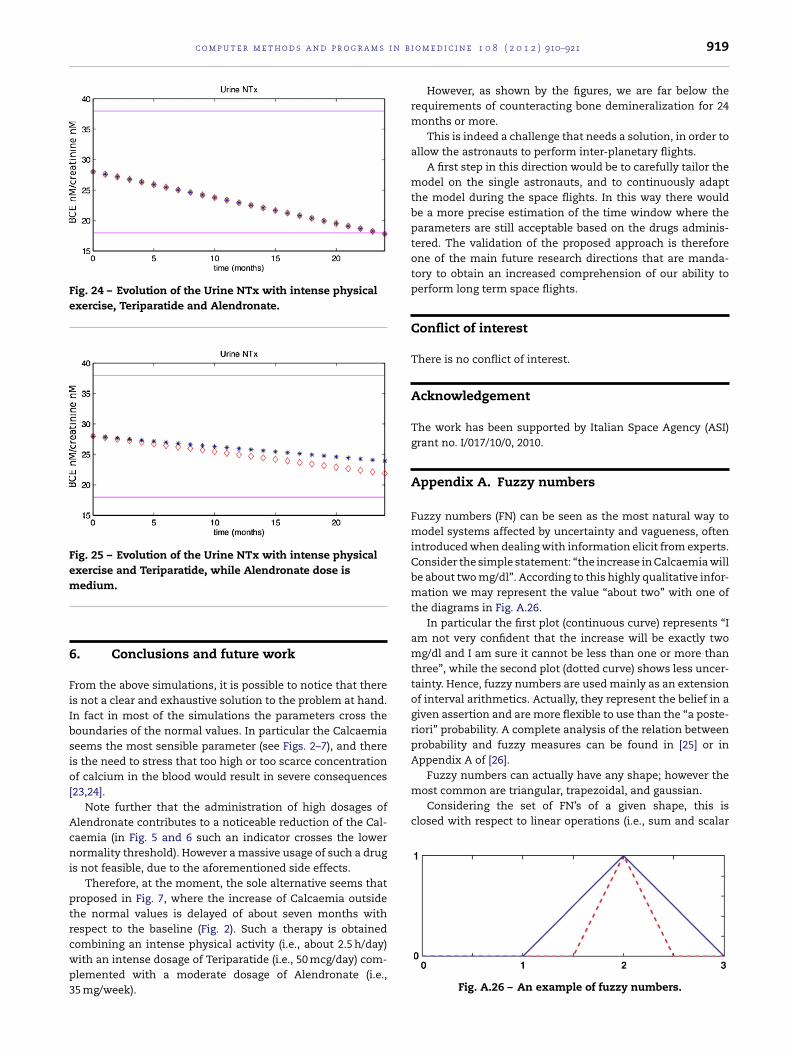
c o m p u t e r m e t h o d s a n d p r o g r a m s i n b i
Fig. 24 – Evolution of the Urine NTx with intense physicalexercise, Teriparatide and Alendronate.
Fig. 25 – Evolution of the Urine NTx with intense physicalexercise and Teriparatide, while Alendronate dose ism
6
FiIbsio[
Acni
ptrcwp3
Fuzzy numbers can actually have any shape; however themost common are triangular, trapezoidal, and gaussian.
Considering the set of FN’s of a given shape, this isclosed with respect to linear operations (i.e., sum and scalar
edium.
. Conclusions and future work
rom the above simulations, it is possible to notice that theres not a clear and exhaustive solution to the problem at hand.n fact in most of the simulations the parameters cross theoundaries of the normal values. In particular the Calcaemiaeems the most sensible parameter (see Figs. 2–7), and theres the need to stress that too high or too scarce concentrationf calcium in the blood would result in severe consequences
23,24].Note further that the administration of high dosages of
lendronate contributes to a noticeable reduction of the Cal-aemia (in Fig. 5 and 6 such an indicator crosses the lowerormality threshold). However a massive usage of such a drug
s not feasible, due to the aforementioned side effects.Therefore, at the moment, the sole alternative seems that
roposed in Fig. 7, where the increase of Calcaemia outsidehe normal values is delayed of about seven months withespect to the baseline (Fig. 2). Such a therapy is obtainedombining an intense physical activity (i.e., about 2.5 h/day)
ith an intense dosage of Teriparatide (i.e., 50 mcg/day) com-lemented with a moderate dosage of Alendronate (i.e.,5 mg/week).o m e d i c i n e 1 0 8 ( 2 0 1 2 ) 910–921 919
However, as shown by the figures, we are far below therequirements of counteracting bone demineralization for 24months or more.
This is indeed a challenge that needs a solution, in order toallow the astronauts to perform inter-planetary flights.
A first step in this direction would be to carefully tailor themodel on the single astronauts, and to continuously adaptthe model during the space flights. In this way there wouldbe a more precise estimation of the time window where theparameters are still acceptable based on the drugs adminis-tered. The validation of the proposed approach is thereforeone of the main future research directions that are manda-tory to obtain an increased comprehension of our ability toperform long term space flights.
Conflict of interest
There is no conflict of interest.
Acknowledgement
The work has been supported by Italian Space Agency (ASI)grant no. I/017/10/0, 2010.
Appendix A. Fuzzy numbers
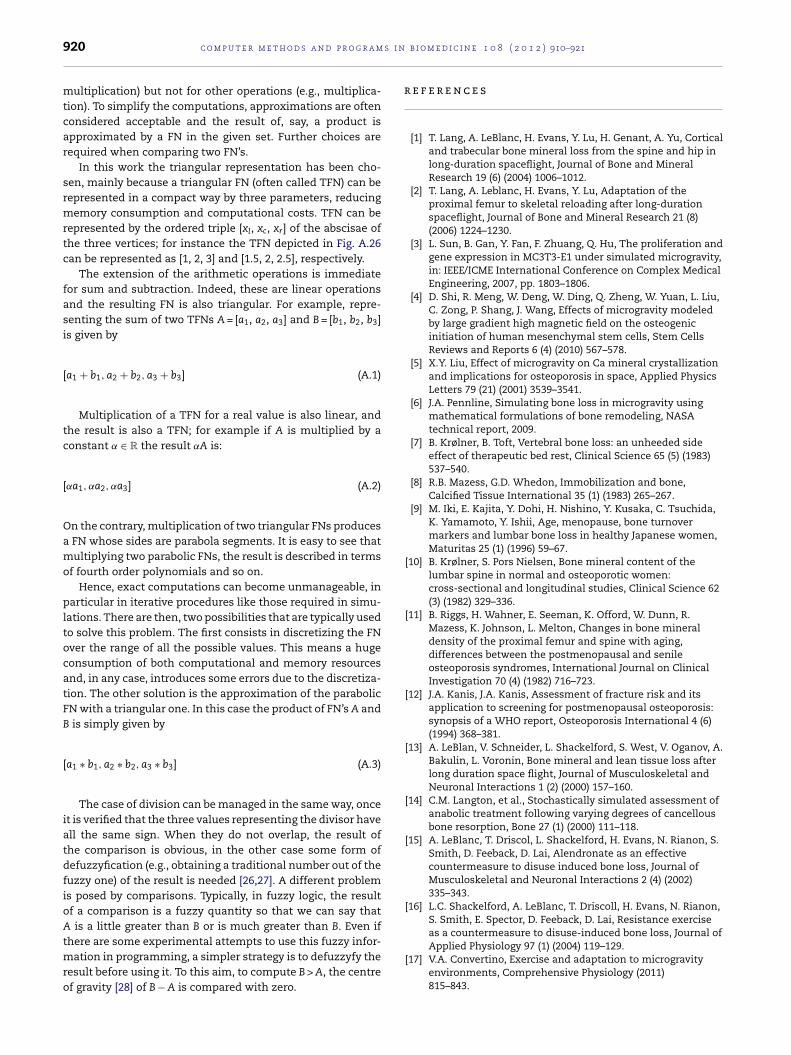
Fuzzy numbers (FN) can be seen as the most natural way tomodel systems affected by uncertainty and vagueness, oftenintroduced when dealing with information elicit from experts.Consider the simple statement: “the increase in Calcaemia willbe about two mg/dl”. According to this highly qualitative infor-mation we may represent the value “about two” with one ofthe diagrams in Fig. A.26.
In particular the first plot (continuous curve) represents “Iam not very confident that the increase will be exactly twomg/dl and I am sure it cannot be less than one or more thanthree”, while the second plot (dotted curve) shows less uncer-tainty. Hence, fuzzy numbers are used mainly as an extensionof interval arithmetics. Actually, they represent the belief in agiven assertion and are more flexible to use than the “a poste-riori” probability. A complete analysis of the relation betweenprobability and fuzzy measures can be found in [25] or inAppendix A of [26].
Fig. A.26 – An example of fuzzy numbers.
s i n
r
920 c o m p u t e r m e t h o d s a n d p r o g r a m
multiplication) but not for other operations (e.g., multiplica-tion). To simplify the computations, approximations are oftenconsidered acceptable and the result of, say, a product isapproximated by a FN in the given set. Further choices arerequired when comparing two FN’s.
In this work the triangular representation has been cho-sen, mainly because a triangular FN (often called TFN) can berepresented in a compact way by three parameters, reducingmemory consumption and computational costs. TFN can berepresented by the ordered triple [xl, xc, xr] of the abscisae ofthe three vertices; for instance the TFN depicted in Fig. A.26can be represented as [1, 2, 3] and [1.5, 2, 2.5], respectively.
The extension of the arithmetic operations is immediatefor sum and subtraction. Indeed, these are linear operationsand the resulting FN is also triangular. For example, repre-senting the sum of two TFNs A = [a1, a2, a3] and B = [b1, b2, b3]is given by
[a1 + b1, a2 + b2, a3 + b3] (A.1)
Multiplication of a TFN for a real value is also linear, andthe result is also a TFN; for example if A is multiplied by aconstant ̨ ∈ R the result ˛A is:
[˛a1, ˛a2, ˛a3] (A.2)
On the contrary, multiplication of two triangular FNs producesa FN whose sides are parabola segments. It is easy to see thatmultiplying two parabolic FNs, the result is described in termsof fourth order polynomials and so on.
Hence, exact computations can become unmanageable, inparticular in iterative procedures like those required in simu-lations. There are then, two possibilities that are typically usedto solve this problem. The first consists in discretizing the FNover the range of all the possible values. This means a hugeconsumption of both computational and memory resourcesand, in any case, introduces some errors due to the discretiza-tion. The other solution is the approximation of the parabolicFN with a triangular one. In this case the product of FN’s A andB is simply given by
[a1 ∗ b1, a2 ∗ b2, a3 ∗ b3] (A.3)
The case of division can be managed in the same way, onceit is verified that the three values representing the divisor haveall the same sign. When they do not overlap, the result ofthe comparison is obvious, in the other case some form ofdefuzzyfication (e.g., obtaining a traditional number out of thefuzzy one) of the result is needed [26,27]. A different problemis posed by comparisons. Typically, in fuzzy logic, the resultof a comparison is a fuzzy quantity so that we can say thatA is a little greater than B or is much greater than B. Even if
there are some experimental attempts to use this fuzzy infor-mation in programming, a simpler strategy is to defuzzyfy theresult before using it. To this aim, to compute B > A, the centreof gravity [28] of B − A is compared with zero.b i o m e d i c i n e 1 0 8 ( 2 0 1 2 ) 910–921
e f e r e n c e s
[1] T. Lang, A. LeBlanc, H. Evans, Y. Lu, H. Genant, A. Yu, Corticaland trabecular bone mineral loss from the spine and hip inlong-duration spaceflight, Journal of Bone and MineralResearch 19 (6) (2004) 1006–1012.
[2] T. Lang, A. Leblanc, H. Evans, Y. Lu, Adaptation of theproximal femur to skeletal reloading after long-durationspaceflight, Journal of Bone and Mineral Research 21 (8)(2006) 1224–1230.
[3] L. Sun, B. Gan, Y. Fan, F. Zhuang, Q. Hu, The proliferation andgene expression in MC3T3-E1 under simulated microgravity,in: IEEE/ICME International Conference on Complex MedicalEngineering, 2007, pp. 1803–1806.
[4] D. Shi, R. Meng, W. Deng, W. Ding, Q. Zheng, W. Yuan, L. Liu,C. Zong, P. Shang, J. Wang, Effects of microgravity modeledby large gradient high magnetic field on the osteogenicinitiation of human mesenchymal stem cells, Stem CellsReviews and Reports 6 (4) (2010) 567–578.
[5] X.Y. Liu, Effect of microgravity on Ca mineral crystallizationand implications for osteoporosis in space, Applied PhysicsLetters 79 (21) (2001) 3539–3541.
[6] J.A. Pennline, Simulating bone loss in microgravity usingmathematical formulations of bone remodeling, NASAtechnical report, 2009.
[7] B. Krølner, B. Toft, Vertebral bone loss: an unheeded sideeffect of therapeutic bed rest, Clinical Science 65 (5) (1983)537–540.
[8] R.B. Mazess, G.D. Whedon, Immobilization and bone,Calcified Tissue International 35 (1) (1983) 265–267.
[9] M. Iki, E. Kajita, Y. Dohi, H. Nishino, Y. Kusaka, C. Tsuchida,K. Yamamoto, Y. Ishii, Age, menopause, bone turnovermarkers and lumbar bone loss in healthy Japanese women,Maturitas 25 (1) (1996) 59–67.
[10] B. Krølner, S. Pors Nielsen, Bone mineral content of thelumbar spine in normal and osteoporotic women:cross-sectional and longitudinal studies, Clinical Science 62(3) (1982) 329–336.
[11] B. Riggs, H. Wahner, E. Seeman, K. Offord, W. Dunn, R.Mazess, K. Johnson, L. Melton, Changes in bone mineraldensity of the proximal femur and spine with aging,differences between the postmenopausal and senileosteoporosis syndromes, International Journal on ClinicalInvestigation 70 (4) (1982) 716–723.
[12] J.A. Kanis, J.A. Kanis, Assessment of fracture risk and itsapplication to screening for postmenopausal osteoporosis:synopsis of a WHO report, Osteoporosis International 4 (6)(1994) 368–381.
[13] A. LeBlan, V. Schneider, L. Shackelford, S. West, V. Oganov, A.Bakulin, L. Voronin, Bone mineral and lean tissue loss afterlong duration space flight, Journal of Musculoskeletal andNeuronal Interactions 1 (2) (2000) 157–160.
[14] C.M. Langton, et al., Stochastically simulated assessment ofanabolic treatment following varying degrees of cancellousbone resorption, Bone 27 (1) (2000) 111–118.
[15] A. LeBlanc, T. Driscol, L. Shackelford, H. Evans, N. Rianon, S.Smith, D. Feeback, D. Lai, Alendronate as an effectivecountermeasure to disuse induced bone loss, Journal ofMusculoskeletal and Neuronal Interactions 2 (4) (2002)335–343.
[16] L.C. Shackelford, A. LeBlanc, T. Driscoll, H. Evans, N. Rianon,S. Smith, E. Spector, D. Feeback, D. Lai, Resistance exercise
as a countermeasure to disuse-induced bone loss, Journal ofApplied Physiology 97 (1) (2004) 119–129.[17] V.A. Convertino, Exercise and adaptation to microgravityenvironments, Comprehensive Physiology (2011)815–843.
i n b i
c o m p u t e r m e t h o d s a n d p r o g r a m s[18] G. Saag, E. Shane, S. Boonen, F. Marin, D. Donley, K. Taylor, G.Dalsky, R. Marcus, Teriparatide or alendronate inglucocorticoid-induced osteoporosis, The New EnglandJournal of Medicine 357 (20) (2007) 2028–2039.
[19] Fosamax product description, Merck & Co.,http://www.merck.com.
[20] E. Biver, F. Chopin, G. Coiffier, T. Funck Brentano, B. Bouvard,P. Garneroan, B. Cortet, Bone turnover for osteoporoticstatus assessment? A systematic review of their diagnosisvalue at baseline in osteoporosis, Joint Bone Spine (2011).
[21] H.K. Charles, T. Beck, H. Feldmesser, T. Magee, M. Chen, T.Spisz, Measurement of bone mineral density in space, in:
24th Annual Conference on Engineering in Medicine andBiology, vol. 3, 2003, pp. 2168–2169.[22] R.M. Lequin, Enzyme immunoassay (EIA)/enzyme-linkedimmunosorbent assay (ELISA), Clinical Chemistry 51 (2005)2415–2418.
o m e d i c i n e 1 0 8 ( 2 0 1 2 ) 910–921 921
[23] L. Wesson, V. Suresh, R. Parry, Severe hypercalcaemiamimicking acute myocardial infarction, Clinical Medicine(London, England) 9 (2) (2009) 186–187.
[24] G.P. Zaloga, Hypocalcemia in critically ill patients, CriticalCare Medicine 20 (2) (1992).
[25] D. Dubois, H. Prade, Possibility Theory: An Approach toComputerized Processing of Uncertainty, Plenum PublishingCorporation, New York, 1998.
[26] T.J. Ross, Fuzzy Logic with Engineering Applications, J. Wileyand Sons Ltd., 2004 (chapter 12).
[27] C.H. Chiu, W.J. Wang, A simple computation of max and minoperations for fuzzy numbers, Fuzzy Sets end Systems 126
(2002) 273–276.[28] E. Van Broekhoven, B. De Baets, Fast and accurate center ofgravity defuzzification of fuzzy system outputs defined ontrapezoidal fuzzy partitions, Fuzzy Sets and Systems 157 (7)(2006) 904–918.