ASEAN-CHINA FREE TRADE AREA (ACFTA)
49
ASEAN-China Free Trade Area Chia Siow Yue Singapore Institute of International Affairs Paper for presentation at the AEP Conference Hong Kong 12-13 April 2004
Transcript of ASEAN-CHINA FREE TRADE AREA (ACFTA)
ASEAN-China FreeTrade Area
Chia SiowYue
Singapore Institute ofInternational Affairs
Paper for presentation at theAEP Conference
Hong Kong12-13 April
2004
11
11
I. INTRODUCTION
The Association of Southeast Asian Nations (ASEAN) was formedin 1967 by Indonesia, Malaysia, Philippines, Thailand andSingapore, joined by Brunei in the 1980s (known as ASEAN-6),and by Cambodia, Laos, Myanmar and Vietnam (known as CLMV) inthe 1990s. The ASEAN-10 members are diverse in size, level ofeconomic development, resource endowment, and industrial andtechnological capabilities. In 1992 ASEAN agreed to form theASEAN Free Trade Area (AFTA) with tariffs reduced to the 0-5%level by 2002 (brought forward from 2008) for ASEAN-6 and tothe zero level by 2010 for ASEAN-6 and by 2015 for CLMV. Inaddition, ASEAN has in place a services liberalisationagreement and an investment liberalisation agreement. ASEAN isalso forging FTAs with China, Japan, South Korea and India,while individual ASEAN countries are forming bilateral FTAswith a growing number of countries in the Asia Pacific andbeyond.
China has experienced rapid and sustained economic growth sinceits economic reforms and oen door policy launched in 1978-79.Its WTO accession in November 2001 marks another stage ofeconomic reform and opening to outside world that is expectedto make China even more efficient and competitive. The size andspeed of growth of China's economy and its WTO accession willimpact significantly on economic relations and economicprospects in East Asia and beyond.
ASEAN countries are viewing the rise of China with a mixedsense of threat and hope. The sense of economic threat arisesfrom the sheer size and dynamism of China's economy and itsgrowing ability to "flood the market" with competitvely-pricedproducts. There is concern that China's huge and cheap labourforce and cost competitiveness will capture ASEAN's marketshares in the US, EU and Japan as well as threaten ASEANindustries in their domestic markets. There is also concernthat China's cost competitiveness and its rapidly growingdomestic market will divert FDI from ASEAN. The hope is thatChina's economic dynamism and market of 1.3 billion consumerswill become a new regional growth engine, particularly as the
22
22
Japanese economic engine continues to sputter into its seconddecade.
With its meteoric economic rise, China has to assure itssouthern neighbours that it will be a responsible and benignpower. On the political and security front, China has joinedthe ASEAN Regional Forum and acceded to the ASEAN Treaty ofAmity. On the economic front, it is participating in theASEAN+3 process and has proposed an FTA with ASEAN.
This paper looks at the ASEAN-China FTA in the context of therise of China and its WTO accession, developments in ASEANeconomic integration, emerging rivalry between China and Japan,and ever-widening regionalism from ASEAN to ASEAN+1 to ASEAN+3,
II. DEVELOPMENTS IN CHINA AND
ASEAN China's Rise and WTO
Accession
China's economy has been growing rapidly since the economicreforms and open-door policy of1978-79, and more particularly since 1990 when growth hasaveraged 10% a year. China's external trade has been growing atan even faster rate of 15% a year since 1990, and it has also
33
33
become the world's second largestrecipient of FDI.
WTO accession will have a fundamental impact on the Chineseeconomy and economic institutions and there is a growing volumeof literature on the subject. Accession means Chinese exportswill enjoy most-favoured-nation treatment and China will haverecourse to the WTO dispute settlement mechanism for resolvingtrade disputes. With investment liberalisation and greatertransparency of rules and regulations, more FDI will beattracted. Industries such as garments, footwear, metals,electronics, utilities and other light manufactures are likelyto benefit most from WTO accession.
Accession also means opening up the China market to globalcompetition and to conformity with WTO rules and disciplines.It exposes China's sensitive and infant sectors and SMEshitherto protected by tariffs, NTBs and subsidies. It isexpected that the most affected sectors will be chemicals,medicine, automobiles and agriculture. In particular, theopening up of agriculture will impact negatively on ruralincomes and rural employment and worsen China's regionaldisparities and rural-urban income gap. Imports and competitionfrom foreign MNCs will force Chinese enterprises to become moreproductive and to upgrade their technology and managementexpertise quickly. As the banking and insurance sector opens toforeign competition, domestic institutions are also undersevere pressure to reform. With market liberalisation, China'simports may increase faster than exports and worsen the tradebalance in the initial years.
China's size, economic dynamism, and cost competitivenesscreate a sense of threat among its smaller Southeast Asianneighbours, notwithstanding the general acceptance that aprosperous and globally integrated China is good for theregion. Tables 1 summarise the relative economic size, growthperformance, and economic development level of China and ASEANeconomies
China's 1.3 billion population is double that of ASEAN-10 and 6times that of Indonesia. China's huge and cheap labour force
44
44
gives it a comparative advantage in labour intensiveproduction. China's nominal GNP of US$1.1 trillion in 2001 istwice that of ASEAN-10, but is only one- fourth that of Japan.However, when adjusted for purchasing power parity (PPP), theChinese economy is already 1.5 times larger than Japan. China'sGDP grew at an annual average rate of10.0% in 1990-2001 and is forecasted to continue growing at anannual rate of around 7% for the next 10-15 years. China'sexternal trade has been growing even at a faster pace than itsGDP, at an annual pace of 15%. In contrast, several ASEANeconomies had been severely affected by the Asian FinancialCrisis of 1997-98 and are still struggling to regain the robustgrowth trajectory of the pre-crisis years.
China's cost competitiveness is driven by its abundant laboursupply and low wages, which gives it a strong competitiveadvantage in labour intensive products and processes. As shownin Table2, China's wage level is a small fraction of those in the USand Japan and considerably lower than the ASEAN economies ofSingapore, Malaysia, Thailand, Philippines and Indonesia.However, cost competitiveness depends not only on wage levelsbut also on productivity. Unit labour cost in US, Japan,Singapore and Malaysia are higher than China, those inPhilippines and Indonesia are lower. China's competitivenesslies mainly in labour intensive industries, products andprocesses. A country's cost competitiveness for the exportmarket is also affected by the exchange rate. The Asianfinancial crisis and massive currency depreciation of mostASEAN
55
55
countries vis-a-vis the US dollar gave ASEAN a temporary cost-competitive advantage over China, where the renminbi remainspegged to the US dollar. The US government is putting strongpressure on China to revalue the renminbi as it believes theChinese currency is much undervalued.
The revealed comparative advantage (RCA) index can be used tomeasure a country's competitive edge in specific products. Theindex is a ratio of share of China's export share in a specificproduct relative to share of the same product in world trade. Aratio exceeding one indicates a competitive advantage in theproduct and an improvement in the RCA indicates improvedcompetitiveness. One major shortcoming of the RCA ratio is thatit does not reveal where competitiveness lies for products withhigh import content. Table 3 shows China's leading exportproducts ranked according to RCA. Products in which China showshigh RCAs are either traditional labour-intensive sectors(toys, footwear, garments, plastic articles, travel goods,watches and cloks) as well as technology-intensive sectors(electrical and electronic machinery and equipment) in whichChina is involved mainly in the labour-intensive processes ofassembly. The increase in RCA between the two time periods of1992-93 and 1997-98 is particularly strong in the electricaland electronics sector.
ASEAN Economic Cooperation andIntegration
ASEAN has been in existence since 1967 but serious economicintegration efforts began only in1992. To-date, a unified regional market has not actualised.Even now, intra-ASEAN trade accounts for only about 25% of theregion's total trade, while 60% of tourists and 90% of foreigninvestments are from outside the region.
AFTA, AFAS and AIA
The centrepiece of ASEAN economic cooperation and integrationis the ASEAN Free Trade Area (AFTA), which entails theprogressive reduction and elimination of tariffs for intra-ASEAN trade in goods. By January 2002, 6 years ahead of

66
66
original schedule, the ASEAN-6 realised the target of 0-5%tariff level, covering 95.7% of tariffs and 90% of intra-ASEANtrade in goods. The ASEAN-6 will achieve the zero tariff levelby 2010. The CLMV countries will achieve the 0-5% tariff levelby 2010 and the zero tariff level by 2015.
AFTA is complemented by the 1995 ASEAN Framework Agreement onServices (AFAS) for services liberalisation and by the 1999Framework Agreement on the ASEAN Investment Area (AIA) forinvestment liberalisation. ASEAN has identified priorityservices to be liberalised as business services,transportation, telecommunications, and finance. AIA providesnational treatment for investments in manufacturing,agriculture, forestry, fisheries and mining. Exceptions tonational treatment are specified in temporary and sensitivelists and these have to be phased out by 2010 for ASEANinvestors and 2020 for non-ASEAN investors in ASEAN-6 countries,with later deadlines for CLMV countries. (An ASEAN investor isdefined as being equal to a national investor in terms of theequity requirements of an ASEAN country in which the investmentis made. Thus an ASEAN firm with majority interest can availitself of national treatment and investment market accessprivileges). In 2002, in an effort to further improve theinvestment climate, Brunei, Indonesia, Myanmar, Philippines andThailand agreed to accelerate the phase-out of TEL formanufacturing by January 2003. Malaysia and Singapore have noTEL.
77
77
AIA aims at encouraging investors to adopt a regionalinvestment strategy and network of operations, promoting a moreefficient regional division of labour and creatingopportunities for greater industrial productivity and costcompetitiveness
The pace of ASEAN economic integration and lack of effectiveimplementation of commitments have often been criticised. Theend-date of 2015 for the complete elimination of intra-ASEANtariffs is too far away. The tariff reduction schedules havesignificant exceptions. Non-tariff barriers to trade in goodshave yet to be dismantled and include cumbersome customsprocedures, diverse product standards and conformancerequirements, and lack of seamless connectivity in cross-bordertransportation and telecommunications. Services liberalizationunder AFAS has been slow, the main progress being in tourismcooperation and some opening up of the financial servicesmarket and entry of foreign banks in the wake of the Asianfinancial crisis. The major obstacle is the widely divergentstages of services development among ASEAN countries andreluctance to open up many services. Investment liberalisationunder AIA has also been slow, until recently. As such, ASEAN isnot yet a "single production base" in which manufacturingoperations could be linked seamlessly across the region andASEAN enterprises and foreign MNCs could leverage on diversecost structures and comparative advantages to manufacturedifferent components in different locations.
ASEAN Economic Community and ASEAN+1
The ASEAN Summit in October 2003 agreed to progresstowards an ASEAN Economic Community (AEC) by 2020. The AECwill be a single production base and market, with free movementof goods, services, investment, capital and skilled labour.This decision to hasten and deepen ASEAN economic integrationis in response to various criticisms over the slow progress ofASEAN economic integration and the challenges from the rise ofChina, the rise of continental FTAs in the Americas and Europe,and the challenge pf globalisation.

88
88
Collectively ASEAN has a population of over 550 million and aGNP of US$580 billion, both half the sizes of China. However,as noted earlier, ASEAN markets are still fragmented bynational barriers. The 2003 ASEAN Competitiveness Study by McKinseyConsultants estimated that an integrated ASEAN could increaseregional GDP by at least 10% or US$50 billion, and reduceoperational costs by up to 20%.
The AEC action plan has 4 components. First, to build oncurrent initiatives under AFTA, AFAS and AIA with clear timelines specified for removal of NTBs and harmonization ofproduct standards and technical regulations and conclusion ofmutual recognition arrangements for priority sectors. Inrecognition of the problem that not all ASEAN-10 countries arewilling and able to move at the same pace, a pragmatic "2+X"approach has been adopted enabling fast movers to cooperate onspecific sectors and others joining in later. Singapore andThailand are spearheading this new bilateral approach. Second,to focus liberalisation, facilitation and cooperation so as tomaximise linkage and impact, 11 priority sectors wereidentified for "fast track" vertical integration, includingautomotive, textiles and apparel, electronics, airtravel andhealthcare. Third, as weak regional institutions have beencriticised as a factor in weak effective implementation ofcommitments, ASEAN institutions are to be strengthened,including a dispute settlement mechanism. Fourth, stress oncapacity building of CLMV countries so as to narrow thedevelopment gap within ASEAN.

99
99
But even an integrated ASEAN is still too small in GNP sizerelative to NAFTA or EU, or a Northeast Asian FTA. Hence ASEANneeds to enter into economic partnerships with leadingeconomies and economic blocs. It has so far accepted proposalsfor ASEAN+1 FTAs with China, Japan, South Korea, and India.This gives rise to a number of issues. First, will ASEAN+1initiatives dilute interest, efforts and resources in thedeepening of ASEAN economic integration itself? Second, how toensure that the multiple initiatives will not give rise to the"spaghetti bowl" and "hub and spokes" effect. Third, instead ofmultiple ASEAN+1 initiatives, would it not be more effective toaim at an ASEAN+3 or pan-East Asian FTA?
III. ASEAN-CHINA ECONOMICRELATIONS
Growing economic relations between ASEAN and China reflecttheir buoyant economies, their respective economic reform andtrade and investment liberalisation over the years,complementarity of economic structures, and warming politicalties.
ASEAN-ChinaTrade
ASEAN and China are not each other's major trading partner, asthe bulk of trade are with the US, Europe and Japan. In 2001,ASEAN trade with China+Hong Kong reached US$55.4 billion, notincluding the considerable border trade between China and Laos,Myanmar and Vietnam. Among ASEAN countries, Singapore accountsfor almost half of the ASEAN-China trade, followed by Malaysia(20.5%), Thailand (11.5%) and Indonesia (10.1%).
Trade growth and shares: ASEAN-China trade has been growing muchfaster, averaging 20.4% a year during 1991-2000, than eithergrowth in China's global trade (15%) or in ASEAN's global trade(10.9%). Trade growth between the two accelerated to over 30%in 2002 and 45% in first- half 2003. As a result, ASEAN shareof China's total exports rose from 5.7% to 6.9% in 1991-
11
11
2000 and ASEAN share of China's total imports rose from 6% to9.9%. ASEAN was China's 5th largest trading partner, afterJapan, US, EU and Hong Kong. In the period 1993-2000, China'sshare of ASEAN-6 exports grew from 2.2% to 3.14%, while China'sshare of Asean-6 imports grew from 1.9% to 5.2%. It should benoted that the trade shares exclude the sizeable unrecordedborder trade between China and Laos, Myanmar and Vietnam.
Trade composition: The composition of ASEAN-China trade changedsignificantly in thr 1990s, with the declining importance oftrade in primary commodities and the rising importance of tradein manufactures, particularly of machinery and electricalequipment. In the early 1990s, China's leading exports to ASEANwere machinery and electrical equipment, oil and fuel, cotton,and tobacco. By 2001 (Table 4) the share of machinery andelectrical equipment jumped to 51%. Other major exports toASEAN are textiles and apparel, base metal and metal products,chemicals and mineral fuels. Likewise, in the early 1990s,ASEAN's leading exports to China were of primary commoditiessuch as oil and fuel, wood, vegetable oils and fats and ofmachinery and electrical equipment, but by 2001, exportsshifted towards manufactures, particularly machinery andelectrical equipment (including electronic components) whichgrew from 12.4% to a 48.3% share. ASEAN's other major exportsare mineral products, chemicals, plastics and pulp and paper.The large and growing two-way trade in machinery and electricalequipment reflects the rapid growth of intra-industry tradedue to product differentiation and

11
11
scale economies, and intra-firm trade by MNCs. Growing intra-industry and intra-firm trade reflect the strong growth ofproduction networks and supply chains.
Services trade: This is mainly in tourism, finance andtelecommunications. China is a fast growing source of touristarrivals in ASEAN, with 2.8 million Chinese visited ASEAN in2002, comprising 8.6% of total non-ASEAN visitors. The mostpopular destinations are Thailand, Vietnam, Singapore andMalaysia. China is also receiving a growing number of ASEANtourists and business persons.
ASEAN-China Investments
To date, cross-border investments between ASEAN and China arelimited, and both are major net recipients of FDI. ASEAN is anet investor in China.
China investments in ASEAN: Chinese investments in ASEAN are smallrelative to China's total outward FDI and ASEAN's total inwardFDI. Chinese total outward FDI averaged US$2.4 billion a yearin 1990-98 and US$1.4 billion in 1999-2001, concentrated mainlyin Hong Kong, US, Canada and Australia, with a substantial partof investments in Hong Kong attributable to "round-tripping".Chinese cumulative investments in ASEAN-5 in the 1990s amountedto US$1.9 billion, with Singapore and Thailand each accountingfor about one-third. Pangestu (2004) reported thattraditionally Chinese investors are attracted to the resource-rich ASEAN countries to secure energy and raw materialsupplies. In recent years, Chinese investments have gone intolabour intensive manufacturing, particularly electrical andelectronics in Malaysia and Thailand. In Singapore, Chineseinvestments are mainly in services, reflecting Singapore'sposition as a regional services hub. The Singapore governmentis actively wooing Chinese investments, including gettingChinese enterprises to list on the Singapore stock exchange.The Chinese government is also encouraging Chinese enterprisesto venture abroad to increase their international exposure,secure oil and other natural resources, and to counterbalancethe economic presence of the US, EU and Japan.
11
11
ASEAN investments in China: Singapore is the leading ASEAN investor.By 2001, the stock of Singapore FDI in China reached SGD16.5billion or 12.6% of Singapore's total outward FDI stock andoutstripping Singapore's traditional FDI in Malaysia. Singaporeinvestments in China are concentrated in manufacturing (62.6%)and real estate and construction (17.8%). Investments areundertaken by foreign MNCs in Singapore relocating operationsto China, investments by government-linked companies, as wellas Singapore SMEs. Most of the Singapore investments areattracted by cheaper labour and better access to the market.Most investments are based on rational business decisionsrather than historical and cultural ties.
Implications for ASEAN of Rise of China andWTO Accession
China's rise and WTO accession have several implications forASEAN that can be framed in terms of increased exports toChina, competition in domestic and foreign markets, andcompetition for FDI.
Increased Exports to China

11
11
The ASEAN-China Expert Group (2001) estimated that, with WTOaccession, China's imports from ASEAN will increase by US$13.3billion between 2000-2005, of which about US$4 billion willresult from WTO accession. Increased exports to China willarise from China's more open market and faster economic andindustrial growth which generate more demand for imported food,energy, raw materials and intermediate products. ASEAN exportsof oil and gas, agriculture (rice, seafood, food preparations,tropical fruits, vegetable fats and oils), other naturalresource based products (wood and wood products, naturalrubber, tin) and electronics are likely to benefit most. Agrowing volume of exports will be parts and components destinedfor assembly in China and re-exported as final products.
Services exports of particular interest to ASEAN areprofessional services and tourism. As non- WTO members, Laosand Vietnam will not directly benefit from China'sliberalisation under WTO accession, but China is according MFNtreatment to the CLMV economies under the ASEAN-China FTA.ASEAN countries have to ensure that they are competitivesuppliers.
Competition in ASEAN Domestic and Third Country Markets
China's spectacular export growth has led to itscharacterisation by the media as the "factory of the world".Kwan (30.08.2003) argues that as China is dependent on lowwages to compete in international markets, its "factory of theworld" status cannot be equated with the "industrial power"status of Japan where competitiveness is in high-tech and high-value added products based on core technologies, productstandards and brand names.
The large Chinese economy also enables exploitation of scaleeconomies, another factor in cost competitiveness. However,Kwan (06.02.2004) notes that China is not a single unifiedmarket,as there are trade barriers and restrictions imposed byprovinces and municipalities. Fragmentation of the nationalmarket creates inefficiency in resource allocation and reducesthe attraction of China for foreign investors targeted at thepan-China market. As noted earlier, ASEAN also lacks a unified
11
11
regional market, impeding exploitation of scale economies anddifferent comparative advantages.
ASEAN countries are concerned over China competition in theirdomestic markets and in third country markets. While suchcompetition is perceived as a threat by some, others view therise of China and WTO accession as an opportunity to exportgoods and services as well as to outsource production to remaininternationally competitive. The sense of economic threat oropportunity depends on whether China's economy is complementaryor competitive vis-a-vis ASEAN (and other countries) andwhether these economies are able to exploit the complementaryopportunities and overcome the competitive threats. Differencesin resource and factor endowments, production structures andproductivities lead to complementarity while similarities leadto a competitive relationship. Analysis of complementarityposes two problems of aggregation. First, China containsregions with different levels of economic development,competitiveness and comparative advantage. For example, thereis the industrial and financial sophistication of the Shanghairegion, and there is the very low level of development in thewestern interior region. Second, it depends on the level ofproduct disaggregation. The growth of intra-industry trade isdue to product differentiation and complementarity reflected inhighly disaggregated trade classifcations, as is the case withthe growing trade in electronic products and components. Evenin non-manufactures, complementarity depends on thelevel of
11
11
disaggregation; for example, China's temperate fruits andvegetables are complementary toASEAN's tropicalproducts.
Increased imports of cheap and competitively-priced goods fromChina will benefit ASEAN consumers as well as ASEAN producersincorporating intermediate inputs from China. However, theyalso impact on the market shares of domestic producers. ManyASEAN countries are concerned over competition from China inlabour intensive industries such as textiles, garments,footwear, toys, processed foodstuffs and machinery andequipment in their domestic markets and the likely demise ofdomestic SMEs, particularly as many businesses are stillstruggling to recover from the 1997-98 financial crisis. SuchSMEs are seriously challenged to improve productivity andquality and lower costs to meet the price competition fromChina.
ASEAN and China both rely heavily on third markets in the US,EU and Japan. The export composition of ASEAN and China showsconsiderable overlap in manufactures, especially textiles andclothing and other labour intensive products. Table 5 from Kwan(2003) demonstrates the growing overlap in exports ofmanufactures to the US market between 1990-2002 with the increasing technological sophistication of Chinaexports. The export structures ofASEAN and China are largely competitive. In particular, Chinaand Indonesia show a 83.5% overlap, followed by Thailand(76.1%), Philippines (57.0%) and Malaysia (54.5%). The lowestoverlap is with Singapore (44.2%). The overlaps with ASEANcountries have grown considerably since 1990, spilling overinto electrical and electronic products and other moresophisticated products. While ASEAN's electronics exports haveslowed down in recent years, China's exports are stillclimbing. The increasing technological sophistication ofChina's exports is also seen in the growing overlap betweenChina and Japan. While the two economies remain largelycomplementary, with different comparative advantages, theoverlap has increased from only 3.0% in 1990 to 20.5% by 2002.As Japanese and other MNCs increasingly invest in China and
11
11
transfer advanced technologies, China's technology catch-up andcompetitiveness will accelerate.
Another study by Weiss and Gao (2002) looks at ASEAN and Chinaexports to the US and Japan markets disaggregated into 9product categories based on factor and technology intensitydeveloped by Lall (2000). Using the trade classification basedon SITC 3-digit levle, exports are classified into thefollowing-- primary products, resource-based manufactures, lowtech manufactures (texiles+garments+footwear, and others)medium technology manufactures (engineering, automotiveproducts, and process products), and high tech (electronics andelectricals, others). A serious problem with thisclassification is that all electrical and electronic productsare automatically classified as high tech, even though some ofthe final products are the result of very labour intensiveassembly operations using high-tech imported parts andcomponents.
In the US market, ASEAN exports are dominated by electronicsand electrical, followed by textiles, garments and footwear andengineering (Table 6). ASEAN exports show high RCA ratios inelectronics and electrical and in textiles+garments+footwear infactor intensity reflects the composite of exports from high-tech Singapore and Malaysia and low-tech Indonesia andPhilippines, as well as the masking of labour intensiveassembly operations in electronics and electrical sector.China's exports to the US are more diversified but dominated bylow tech goods (including toys, furniture, plastics, steel,textiles+garments+footwear), although engineering and

11
11
electronics and electrical have shown rapid growth. ASEANexports to the US of electronics and electrical were more thandouble those from China in 2000, while its textiles, garmentsand footwear exports were one-half and its other low techexports were only one-fifth the levels of China. In the Japanmarket, ASEAN exports have a much higher component of primaryand resource-based products, although electronics andelectrical are also important. Textiles+garments+footwearexports are now only a very small component of ASEAN exportsto Japan. China exports to Japan are still dominated bytextiles+garments+footwear. China's exports of primary andresource-based products are relatively more significant than inthe US and other low tech exports, engineering, and electronicsand electrical are also important. Engineering and electronicsand electrical have grown rapidly recently.
Similarity in exports does not indicate whether ASEAN exportsare losing market share to China exports. Table 7 from Pangestu(2004) shows the changing export shares of ASEAN and China inthe markets of US and Japan. China is not taking away marketshare from ASEAN. In the US market, export share of China+HongKong more than doubled from 3.9% in 1987 to 10.4% in mid-2002,but the ASEAN share also rose from 4.2% to peak at 8.1% in1997 before falling to6.4%. In the Japan market, share of China+Hong Kong rose from8.1% in 1992 to 18.2% in mid-2002, while the share of ASEAN rose from 12.9% to 14.1%. Chinais taking away market share from Japan and NIEs in the USmarket and from US and NIEs in the Japan market, in part due toexports by Japanese and NIE companies which have relocated toChina. However, disaggregated analysis shows China has gainedmarket share in textiles and clothing in the Japanese market atASEAN expense --- for 1996-2001, China's share of Japan'scotton knit apparel market increased from 47.3% to 77.3% andfor manmade fibre knit garments from 59.1% to 80.4%. ASEANexports of textiles and clothing in the Japanese market areparticularly vulnerable since Japan has not imposed bilateraltextile quotas. ASEAN exports to the US market are lessvulnerable as they are protected by US quotas till 2005.Although China exports of textiles and clothing will be fullyintegrated into WTO rules only by 2008, ASEAN producers will
11
11
face fierce competition in the US market from other low-costproducing countries.
The Weiss and Gao study reached a different conclusionregarding ASEAN export competitiveness vis-a-vis China in theUS and Japan markets. They differ from the Pangestu study innot including Hong Kong under China exports, in disaggregatingexport shares according to the Lall classification, and indefining competitiveness not in changes in absolute exportshares but in the ratio of export shares of ASEAN and China.The study concludes that ASEAN economies have been exposed toincreasing competition from China in both markets. There was amajor loss of market share in the US and Japan to exports fromChina. As shown in Table 6, the relative export shares of ASEANvis-a-vis China has declined between 1995-2000. Increased Chinacompetition is found in both relatively labour intensivesectors and relatively high tech sectors, although within agiven sector, the competition is at the low-tech end. ASEAN'sloss of competitiveness is particularly evident in theengineering and electronics and electrical product sectors.There is also loss of competitiveness in primary products,resource- based manufactures, and textiles+garments+footwearproduct sectors. Loss of market share does not necessarily meanabsolute export declines. In many of the trade categories,ASEAN exports continued to grow in absolute terms, particularlyin electronics and electrical sector. But absolute exportsdeclined for primary products and engineering in the US marketand for primary products, resource-based manufactures andtextiles+garments+footwear in Japan.

11
11
Growth of China exports means growing China imports. BecauseChina's trade centers on processing trade, its import ofintermediate goods rises in line with increased exports.Chinese statistics show 55.2% of its exports and 39.5% of itsimports were processing trade in 2003. Kwan (01.03.2004)reports that Japanese perception of the China threat is fastreceding as exports to China are surging and helping to driveJapan's economic recovery. In 2003, Japan's exports to Chinasoared 43.6%, while imports rose 21.9%; in contrast, Japan'sexports to the US fell 2.6% and imports grew only 1.7%. Japan'sexports to China are driven by general machinery, electricequipment and transport equipment, with notable increases insemiconductors and other electronic parts (45.6%), semi-finished audio-visual equipment (113.9%), telecoms equipment(54.7%) and visual equipment (114.9%), auto parts (104.9%),automobiles (30.1%).
Competition for FDI
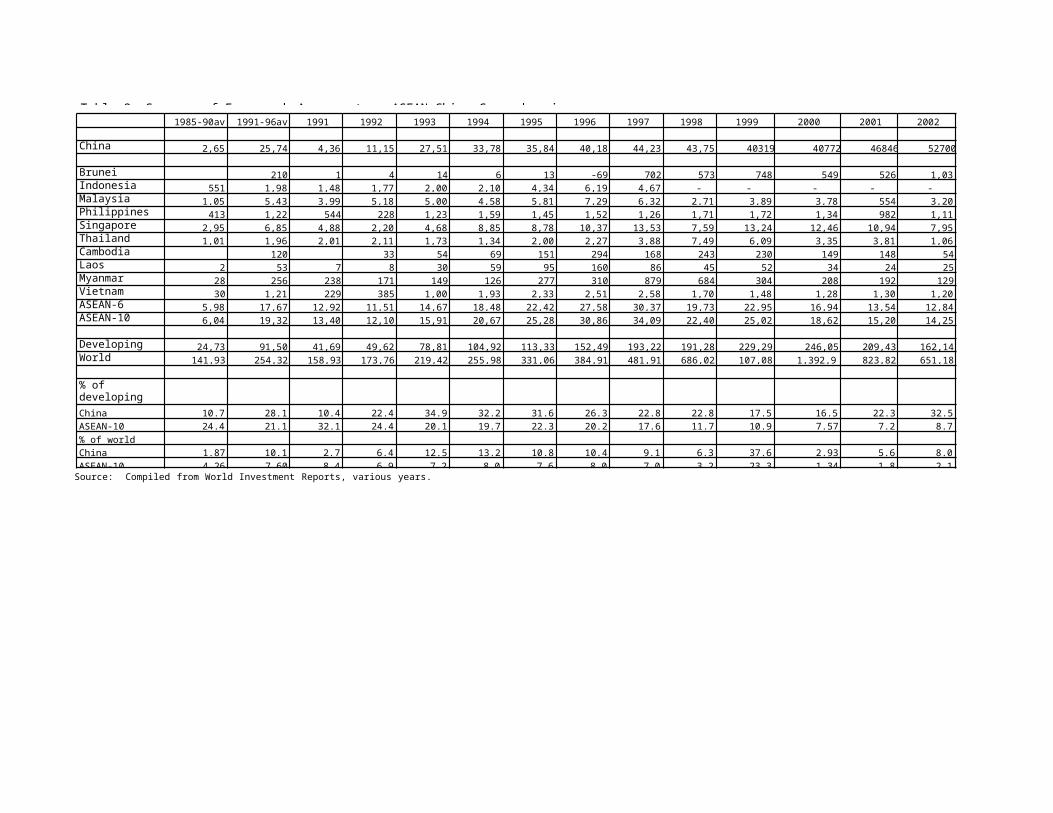
Table 8 shows FDI inflows to China rising from an annualaverage of US$2.6 billion in 1985-90 to over US$40 billion in1996-2001 and reaching US$52.7 billion in 2002. Thisspectacular growth has raised China's share of inflows to thedeveloping world from 10.7% in the 1985-90 period to 32.5% in2002. With WTO accession and continuing dynamic economicgrowth, FDI into China is expected to remain buoyant in thecoming years. China's large FDI inflow is commensurate with itsGDP size. It also bears noting that China's FDI inflow figureshave been inflated by "round-tripping", that is Chinesecompanies move funds out of China to Hong Kong and othercountries and return to China as FDI to take advantage ofpreferential tax treatment.
In the 1980s and early 1990s FDI in China were producing mainlyfor the export market and attracted by China's low wages andabundant labour supply. As a result, foreign-funded companiesaccounted for over half of China's exports of manufactures. Inrecent years, an increasing volume of FDI is targeted atChina's domestic market, reflecting China's policy relaxationon trade-balancing requirements and foreign exchange controlsas well as the rapidly growing domestic market. Foreign
22
22
investors are also no longer just attracted by China's abundantlabour supply and low wage costs. With the improvements insupport infrastructure and skills profile, more technologicallysophisticated industries are being established. Foreign MNCsare also locating regional and global production centres,product development and R&D centres and procurement andlogisticscentres.
FDI inflows into ASEAN-10 averaged US$6.0 billion in 1985-90(more than China), to US$19.3 billion in 1991-96 (less thanChina), peaked at US$34.1 billion in 1997. Thereafter, FDIinflows plummeted with the onset of the Asian financial crisisin mid-1997 and post-crisis economic and political problems,declining to US$14.3 billion by 2002. Its share of inflows tothe developing world fell from 24.4% in 1985-90 to less than10% in the 2002-2002 period. There is particular anxiety amongASEAN countries over investment diversion by China. However,apart from China, ASEAN also faces increasing investmentcompetition from Latin America and eastern and central Europe.
The up-trend of FDI flows to China and the down-trend of FDIflows to ASEAN in recent years reflect respective improving anddeteriorating investment climates. China has a huge populationand huge pool of unskilled labour and sizeable pool of skilledlabour, varied technological capabilities and costcompetitiveness, In addition, China's investment climate hasimproved
22
22
dramatically since the early 1990s and more particularly withpreparations for WTO accession --- political and social stability; high and sustained economicgrowth resulting in tremendous market potential; improvedinfrastructure; improved worker skills; trade and investmentliberalisation; improved legal framework and greatertransparency in rules and regulations. In contrast, ASEAN'sinvestment climate has deteriorated since the Asian financialcrisis, notwithstanding the existence of AFTA and efforts atfurther investment liberalisation unilaterally and under theAIA. ASEAN has lost its economic dynamism. Also, economicintegration has not been broad and deep enough to enable ASEANto be a seamless market of over 550 million people. The crisishas also highlighted the lack of public and corporategovernance. Finally, the political and social climate in anumber of ASEAN countries has deteriorated, including theterrorist threat, raising investment risks and reducinginvestment profitability.
Japan is a major investor in ASEAN and the growing Japanesepreference for China as an investment location is worrisome forASEAN. FDI notification statistics from Japan's Ministry ofFinance show that investments in China in FY2002 rose 19.1%while investment in ASEAN showed a broad decline among themember countries. A survey on Japanese overseas investments byJBIC and released in November 2003 shows that manufacturers areplacing greater priority on China rather than ASEAN as the basefor their overseas operations. Firms are beginning to rateChina at same level as ASEAN members. And Japanese companiesthat have invested in ASEAN are taking increasing notice ofChina. Of Japanese firms that have directly invested in China,73.9% planned to strengthen or expand their China operations inthe mid- term, while the corresponding figure for ASEAN wasonly 42.7%. China scored not just as a low-cost production basebut also as a potential market. Some 93% of respondents namedChina as a promising place for business in medium-long term asagainst only 29% for Thailand.
Pangestu (2004) cited a growing number of Japanese firmsconsidering shifting production and procurement to China to
22
22
supply parts to major customers and to supply domestic market.This includes manufacturers of flat-screen TVs, DVD players,LCD monitors, plasma-display panels, laptops and digitalcameras. For example, Minolta stopped manufacturing in Japanand Malaysia, and moved to Shanghai late in 2002, while Olympuswill produce all its digital cameras in China by 2004. TheJapanese moves are also followed by US MNCs. For example, Inteldoubled its investment in semiconductors in Shanghai and USproducers of telecoms network equipment see China as the onlymarket with substantial growth. Such high-tech investments byJapan and US could enable China to climb the up the technologyladder and produce higher value added faster and with moredepth than ASEAN countries.
All is not lost. A JETRO survey released in March 2004 showsASEAN is regaining some investment competitiveness after theSARS crisis. Japanese investment in ASEAN-5 jumped66.7% in 2003 to reach US$4.8 billion, after a plunging near40% in 2002. Japanese investors are reported to be diversifyingbetween China and ASEAN in immediate response to the perceivedlack of transparency and governance in China's handling of itsSARS outbreak and decide against risking all its investmenteggs in the China basket. The new developments in ASEANeconomic cooperation and integration, as well as globaleconomic recovery also helped FDI to ASEAN.
IV. ASEAN-CHINA ECONOMIC COOPERATION AND FTA
22
22
A proposal from Chinese Premier Zhu Rongji for ASEAN-Chinacooperation at the ASEAN+China Summit in November 2000 led tothe formation of an ASEAN-China Expert Group and its 2001report on Forging Closer ASEAN-China Economic Relations in the Twenty- FirstCentury. The Report made the following recommendations ----(a)establishment of an ASEAN-China FTA within 10 years, includingspecial and differential treatment and flexibility for CLMVcountries, and an "early harvest" package of mutually agreedlist of goods to be liberalised ahead of implementation ofChina's commitments to the WTO; (b) wide range of trade andinvestment facilitation measures; (c) technical assistance andcapacity building to ASEAN members, particular CLMV; (d)expansion of cooperation in areas such as finance, tourism,agriculture, human resource development, small and mediumenterprises, industrial cooperation, intellectual propertyrights, environment, forestry and forestry products, energy andsubregional development. At the ASEAN+China Summit inNovember 2001, ASEAN and China agreed to launch negotiationsfor a ASEAN-China FTA (ACFTA) and to establish it within 10years.
FTAIssues
The ASEAN-China FTA as well as several regional and bilateralFTAs concluded or under negotiation and study have raised anumber of issues concerning FTAs.
International trade theory is clear that customs unions andfree trade areas are inferior and second-best positions tomultilateralism. While they result in trade creation amongmembers, they also cause trade diversion from lower-costsuppliers outside the membership. The term "FTA", however,has become increasingly inappropriate to describe the recentspate of economic cooperation arrangements in East AsiaThese are no longer "regional" as they cut acrossgeographical regions. They are also no longer "FTAs" as theyextend beyond the traditional FTA focus on trade liberalisationthrough removal of tariffs and NTBs on trade in goods toinclude liberalisation of trade in services and investment,
22
22
trade and investment facilitation, and economic and technicalcooperation. These are "new age FTAs" and have adopted newterminology such as ASEAN-Japan Comprehensive EconomicPartnership, ASEAN-China Comprehensive Economic Cooperation.Empirical studies to model the effects of such "FTAs", focusingonly on results of tariff elimination, fail to capture theirbroader and dynamic effects.
The proliferating FTAs have given rise to some concerns inacademic discussions that regionalism and bilateralism couldundermine multilateralism and the WTO. It may be premature toconclude whether FTAs in East Asia are stumbling blocs orbuilding blocs without careful examination of the motivationsand designs of of such FTAs. On motivations, East Asianeconomies active in RTAs appear to be also active in the WTOprocess. On design, in many FTAs the scope and pace of tradeand investment liberalisation are beyond those achievable inthe WTO. Many economies are using the FTAs to pressure andconsolidate domestic economic reforms. And to the extent thatFTAs normally cover sectors, areas, and issues beyond thecurrent scope of the WTO, they are a WTO-plus in trade andinvestment liberalisation and facilitation and enhancestechnical and economic cooperation between countries.
Increasingly, countries are simultaneously participating inseveral and often overlapping FTAs, giving rise to the"spaghetti bowl effect" and the "hub and spokes" effect. Thespaghetti bowl
11
11
effect arises from different and divergent rules of origin,technical standards and conformance requirements, and schedulesfor tariff and NTB reductions. Producers and exporters have toobserve all these varied requirements, which mitigates againsteconomies of scale in production and distribution and adds tobusiness transaction costs. The hub and spokes effect ariseswhen a country signs onto several FTAs and becomes a hub withits market shared among many spokes. Hence a hub gains morefrom an FTA than a spoke. However, with a proliferation ofoverlapping FTAs, many countries end up as hubs.
Features of the Framework Agreement onAsean-China CEC
The Framework Agreement on ASEAN-China Comprehensive EconomicCooperation (AC- CEC) was signed at the ASEAN+China Summit on 4November 2002 and protocol for amendments was signed at theSummit on 6 October 2003. The Framework Agreement sets out howASEAN and China will cooperate in trade and investmentliberalisation and facilitation and economic cooperation. Table9 summarises the main features of the Framework Agreement andthe time frames agreed on.
ACFTA will be established within 10 years, with tariffs reducedor eliminated by 2010 for ASEAN-6 and China and 2015 for CLMV(in consonance with the deadlines for AFTA). Unlike the Japan-ASEAN CEP, the ASEAN-China FTA (ACFTA) comprises developingcountries and could qualify under the WTO enabling clause fordeveloping countries (as was the case for AFTA) rather than themore stringent GATT Article XXIV. Nevertheless, for trade ingoods, ACFTA is committed to cover "substantially all trade".The tariff reduction has two tracks. Track1 refers to the "Early Harvest" which covers a large group ofagricultural products under HS1- HS8 and representing over 600tariff lines (about 10% of total), so that participatingcountries can benefit from increased liberalised trade beforethe actual FTA enters into force. Early Harvest products willhave tariffs eliminated over 3 years, with effect from 1January 2004. The Early Harvest products highlight thatagriculture is not a sensitive sector in China as it is inJapan or Korea. Track 2 goods will have tariffs progressively
11
11reduced according to a negotiated timeframe, with end-dates of2010 for ASEAN-6 and China, and 2015 for CLMV. The FrameworkAgreement also covers liberalisation of services and investmentand economic cooperation activities.
In recognition of the different stages of economic developmentamong ASEAN countries and the need for flexibility, especiallythe need to facilitate increasing participation of CLMV, thereare provisions for strengthening their domestic capacity,efficiency and competitiveness. China agreed to participate inthe accelerated implementation of sub-regional developmentcooperation in the Greater Mekong Subregion, co-financing ofthe completion of the Signapore-Kunming Railway Link, and tolaunch an IT training programme for ASEAN.
For trade in goods, negotiations commenced in March 2003 andare scheduled to end in June2004, with negotiations on the rules of origin completed byDecember 2003. For trade in services and investments,negotiations commenced in 2003 and will be completed onmutually agreed timeframes. For other areas of economiccooperation, implementation of commitments will be decided atspeeds acceptable to both ASEAN and China.
Differences among the ASEAN-10 economies also make itdifficult to maintain a common

11
11
position in negotiations on trade liberalisation. Protocolamendments to the Framework Agreement in October 2003recognised this difficulty and contained provisions forseparate bilateral negotiations between China and individualASEAN countries. Bilateral negotiations between China andThailand are already underway while negotiations between Chinaand Singapore will commence in mid-2004. A media report notethat the China-Singapore bilateral will include using Singaporeas a window to the outside world and Singapore encouraging moreChinese companies to be listed on the Singapore stock exchange.Both China and Singapore place emphasis on completing theASEAN-China FTA negotiations before the China-Singaporenegotiations.
Motivations forACFTA
China's motivations in offering ACFTA are both political andeconomic. Politically, China wishes to remain on friendly termswith its neighbours on its southern front. ACFTA is part ofconfidence building that includes China's participation in theASEAN Regional Forum and China's accession to the ASEAN Treatyof Amity. ACFTA is to allay ASEAN concerns that China poses athreat with its economic ascendency by providing preferentialaccess to its rapidly growing domestic market. China is alsoeyeing the ASEAN region for its various natural resources,especially oil and its market of 560 million consumers. Closereconomic relations with ASEAN will enable China to build itsgeopolitical clout in Southeast Asia and counterbalance theinfluences of Japan and US. The swift progress of ACFTA hashastened Japan as well as the US, South Korea and India topropose economic cooperation arrangements with ASEAN as well
ASEAN governments welcomed the China initiative for a number ofreasons. First, China is a huge and dynamic economy and itsgrowing demand for ASEAN goods and services could serve as anew engine of growth. Chinese tourists are already a keyfactor in the growth of tourism in the region. ASEAN also looksto more Chinese investments as well. China's WTO entry willalso mean a trading partnership based on international rulesand discipline. Closer ASEAN-China economic ties will also

11
11
enable ASEAN to reduce dependence on the US, EU and Japan.Second, China's offer of special treatment and developmentassistance for the CLMV group as well as the extension of WTOmost-favoured-nation benefits to the non-WTO members of ASEANhave helped them to accept the China initiative more readily.Third, China and ASEAN will be able to go further than the WTOin liberalising agricultural trade, as China's temperateagriculture and ASEAN's tropical agriculture are complementaryin many product areas. Thailand, in particular, looks toaccelerating agricultural exports to China. Nonetheless thereare continuing concerns over the impact of preferential openingof ASEAN markets, as many ASEAN labour intensive manufactureswill not be able to compete with China on price.
Impact ofACFTA
Economic benefits: ACFTA will create an economic region with 1.7billion consumers, combined GDP of about US$2 trillion, andcombined trade of US$1.23 trillion. It will be the world'sbiggest FTA in population size. ACFTA is marketed as a "win-win" initiative. It aims at forging closer economic relationsbetween China and ASEAN through lowering of trade andinvestment barriers and through joint technical and economiccooperation projects. The lowering of trade and investmentbarriers will result in an enlarged integrated market, promotespecialisation and trade according to comparative advantage,and enable exploitation of scale
11
11
economies, contributing to lower costs and increased economicefficiency. Trade creation occurs when domestic production isreplaced by lower cost imports from an FTA member, boostingregional income and welfare. However, there is also the cost oftrade diversion, as some imports may now be sourced from highercost regional partners. In addition, there may also be welfaregains or losses due to terms of trade changes. ACFTA will alsoattract more investments, both from regional investors as wellas investors from non-ACFTA countries.
Simulation study by the ASEAN Secretariat using the GlobalTrade Analysis Project (GTAP)model estimates the impact of tariff elimination under ACFTAon trade and GDP. (Tables 10-12)
Impact on trade: Asean exports to China will increase by US$13billion or 48%, while China's exports to ASEAN will increaseby US$10.6 billion or 55.1%. Among ASEAN countries, biggestgains in exports are Indonesia, Malaysia, Singapore andThailand. China's exports make the biggest inroads in thePhilippines and Thailand (US$3.1 billion increase each).However, both ASEAN and China see a reduction in their tradewith US, Japan and ROW. Hence the overall effect is a modestrise in exports, with ASEAN's exports increasing only byUS$5.6 billion or 1.5% from the baseline, and the biggestgainers in absolute terms being Thailand, Indonesia andMalaysia. China's exports rise by US$6.8 billion or only 2.4%from the baseline.
Sectorally, ASEAN's biggest gains are textiles and apparel,electrical appliances and machinery, and other manufactures.Indonesia's exports of other manufactures to China rises byUS$1.3 billion. Singapore's exports of electrical appliancesand machinery to China rises by US$1.3 billion. Thai exports oftextiles and apparel to China rise by US$1.7 billion.Sectorally, the biggest gains for China are textiles andapparel, electrical appliances and machinery, and othermanufactures. Chinese exports of other manufactures to thePhilippines rises by US$1.2 billion. Its exports of electrical
11
11
appliances and machinery to Philippines and Thailand rise byUS$0.8 billion and US$0.7 billion respectively. China exportsof textiles and apparel make significant headway in thePhilippines and Thailand. The simulation results suggestsignificant scope for intraindustry trade between ASEAN andChina, especially textiles and apparel, electrical appliancesand machinery, and "other manufactures". There are significanttrade diversio effects on non-ACFTA trading partners.
Impact on real GDP: ASEAN's GDP will increase by 0.9% or US$5.4billion, while China's GDP will increase by 0.3% or US$2.2billion, representing a total GDP increase of US$7.8 billion.Among ASEAN countries, the biggest percentage increase will beenjoyed by Vietnam, while Indonesia will enjoy the biggestabsolute increase. There are negative repercussions on othercountries and regions.
Non-economic benefits: Motivations for ACFTA are both economic andpolitical. ACFTA will contribute to improving political andsocial relations between ASEAN and China, building on existinggeographic closeness and historical and cultural ties. ASEAN-China collaboration will contribute to a balance of power inEast Asia and provide for a larger and more effective voice inthe international fora.
ASEAN-Japan Initiative

11
11
With the ascendancy of China, rivalry between Japan and Chinafor economic and political influence in Southeast Asia hasheightened. In January 2002, immediately after the signing ofthe Japan-Singapore Economic Partnership Agreement (JSEPA) andsoon after China's FTA proposal of an FTA with ASEAN inNovember 2001, Japanese Prime Minister Koizumi proposed
VI. CONCLUSION
To meet the China challenge as well as the broader challenge ofglobalisation, individual ASEAN countries will have to hastenthe pace of domestic economic reforms and industrialrestructuring up the skills and technology ladder so as tomaintain international competitiveness and provide thefoundation for sustained economic growth. Skills andtechnological upgrading have proceeded fastest in Singapore,Malaysia and Thailand. Other ASEAN countries are pre- occupiedwith maintaining or restoring political and social stabilityand national cohesiveness, or lack the financial and technicalresources to restructure. These economies are the mostvulnerable to competition from Chinese products and services inboth their domestic markets and export markets.
Engaging in FTAs can help ASEAN countries improve on theirefficiency and competitiveness and their economic growthprospects. The McKinsey Study has shown the considerableeconomic benefits to be reaped from ASEAN economic integrationASEAN countries will need to put aside national sovereigntypreferences and economic rivalries and accelerate and deepenits own internal economic integration. The vision of an ASEANEconomic Community by 2020 has been articulated and the roadmapis being worked out. ASEAN has to find the political will andthe management capability to ensure implementation. If the paceand scope of ASEAN integration is determined by the leastwilling members, then the front-runners will be increasinglytempted to seek bilateral FTAs to achieve their liberalisationand efficiency objectives.
ASEAN is being wooed into FTAs by China, Japan, South Korea,India and the US, giving it a de facto hub status. However,only a unified ASEAN can negotiate from a position of strength
22
22
and enjoy the hub status. Regrettably such unity is stilllacking. ASEAN is a grouping of economies diverse in economicsize and level of economic and technological development, withdifferent degrees of willingness and capability to open up thegoods, services, and investment sectors to foreign competition.There is no perceived "common ASEAN interest" and "common ASEANposition" on many issues. This lack of cohesiveness that hashindered deeper economic integration among ASEAN countries isalso hindering a common negotiating position vis-a-vis ASEAN'snew FTA partners. Unless ASEAN can overcome its own internaldifferences, the result would be individual countriesnegotiating from much weaker national positions. IndividualASEAN economies will become spokes.
Participation in multiple and overlapping FTAs pose otherissues for ASEAN. Will participation in the various ASEAN+1initiatives divert attention, commitment and resources awayfrom ASEAN economic integration? ASEAN also has to resolve the"spaghetti bowl effect", as the multiple and overlapping FTAsresult in proliferation of rules of origin, product standardsand conformance requirements that splinter production andincrease business transaction costs.

22
22
The various ASEAN+1 initiatives, as well as bilateral andtrilateral initiatives in northeast Asia suggests that the EastAsian region might be better served by a pan-East Asian FTA orcommunity. The foundation for East Asian economic cooperationis already laid by the ASEAN+3 process involving the ASEAN-10,China, Japan and South Korea. An East Asian FTA has a largermembership, greater opportunities for economic complementarityand economies of scale, more trade creation and less tradediversion effects. It would also promote regional peace andstability, as when economics are more interdependent andintertwined there will be a greater awareness of a sharedcommon destiny. The East Asian Vision Group has proposed theEast Asian FTA (EAFTA) as a long term objective and building onthe foundation of the ongoing ASEAN+3 process. Many challengeshave to be overcome first, including the lack of a commonpolitical vision for East Asia, baggage of historicalanimosities and mistrusts, different political systems andeconomic regimes, and differences in levels of economicdevelopment and economic competence.
REFERENCES
Official
documents:ASEAN-China Expert Group on Economic Cooperation (October2001). Forging CloserASEAN-China Economic Relations in the Twenty-First Century. Jakarta: ASEANSecretariat.
East Asia Vision Group (October 2001). Towards an East AsianCommunity: Region of Peace, Prosperity and Progress. Jakarta: ASEANSecretariat.
Framework Agreement on Comprehensive Economic Cooperationbetween the Association of Southeast Asian Nations and thePeople's Republic of China, 4 November 2002. Jakarta: ASEANSecretariat (ASEAN Secretariat website)

22
22
Protocol to Amend the Framework Agreement on ComprehensiveEconomic Cooperation between the Association of SoutheastAsian Nations and the People's Republic of China, 6October 2003 (ASEANSecretariat website)
Second consultation between Asean and China economicministers (AEM-MOFCOM), JointMedia Statement, 3 September 2003, Phnom Penh (ASEANSecretariat website)
Otherreferences:Chia Siow Yue (2003). "East Asian Regionalism and the ASEAN-Japan Economic Partnership", in Narongchai Akrasanee, Chia SiowYue et al, ASEAN-Japan Cooperation: A Foundation for East Asian Community.Tokyo: Japan Center for International Exchange.
Chia Siow Yue (2004). "The Rise of China and Emergent EastAsian Regionalism", in Kokubun Ryosei and Wang Jisi (eds), TheRise of China and a Changing East Asian Order. Tokyo:Japan Center forInternational Exchange.
Chia Siow Yue and Mari Pangestu (2003). "Regionalism and Bilateralism in Southeast Asia". Paper for the forthcoming festschrift volume in honour of Professor Peter Lloyd.
22
22
Pangestu, Mari (2004). "China's Economic Rise and Responses ofASEAN", in Kokubun Ryosei and Wang Jisi (eds), The Rise of China anda Changing East Asian Order. Tokyo:Japan Center for InternationalExchange.
Kwan, C H (July 2002). The Rise of China and Asia's Flying Geese Pattern ofEconomic Development: An Empirical Analysis Based on US Import Statistics. Tokyo:RIETI Discussion paper Series 02-E-009.
Kwan, C H (01.03.2004). Japan's "China Syndrome" Dissipating as Exports toChina Surge. RIETI, China in Transition Series.
Kwan, C H (06.02.2004). China Should Create a Huge Unified Market throughDomestic FreeTrade Agreements. RIETI, China inTransition Series.
Kwan, C H (12.12.2003). Pearl River Delta to Remain the Engine of the"Workshop of the World" - Factors Favouring Industrial Upgrading Firmly in Place.RIETI, China in Transition Series.
Kwan, C H (05.12.2003). The Accelerating Shift of Japanese Direct Investmentto China- Competition between ASEAN and China. RIETI, China in TransitionSeries.
Pangestu, Mari (2004). "China's Economic Rise and the Resposesof ASEAN" in Kokubun Ryosei and Wang Jisi (eds), The Rise of Chinaand a Changing East Asian Order. Tokyo:Japan Center for InternationalExchange.
UNCTAD (various years). World Investment Report.
Geneva: UNCTAD. UNCTAD (2002). Trade and Development
Report 2003.
Wattanpruthipaisan, Thitapha (2001). ASEAN-China EconomicRelationships and Cooperation in Trade and Investment: Patterns and Potential.Paper presented at the Symposium on China- ASEAN EntrepreneurExchanges, Chengdu, China, 22-23 October 2001 (ASEAN websitedownload)
22
22
Weiss, John and Gao Shanwen (October 2002). China's ExportThreat to ASEAN. AsianDevelopment Bank Institutemonograph.
Zhang Yunling (2003). "The ASEAN Partnership with China andJapan", in Narongchai Akrasanee, Chia Siow Yue et al, ASEAN-JapanCooperation: A Foundation for East Asian Community. Tokyo: Japan Centerfor International Exchange.
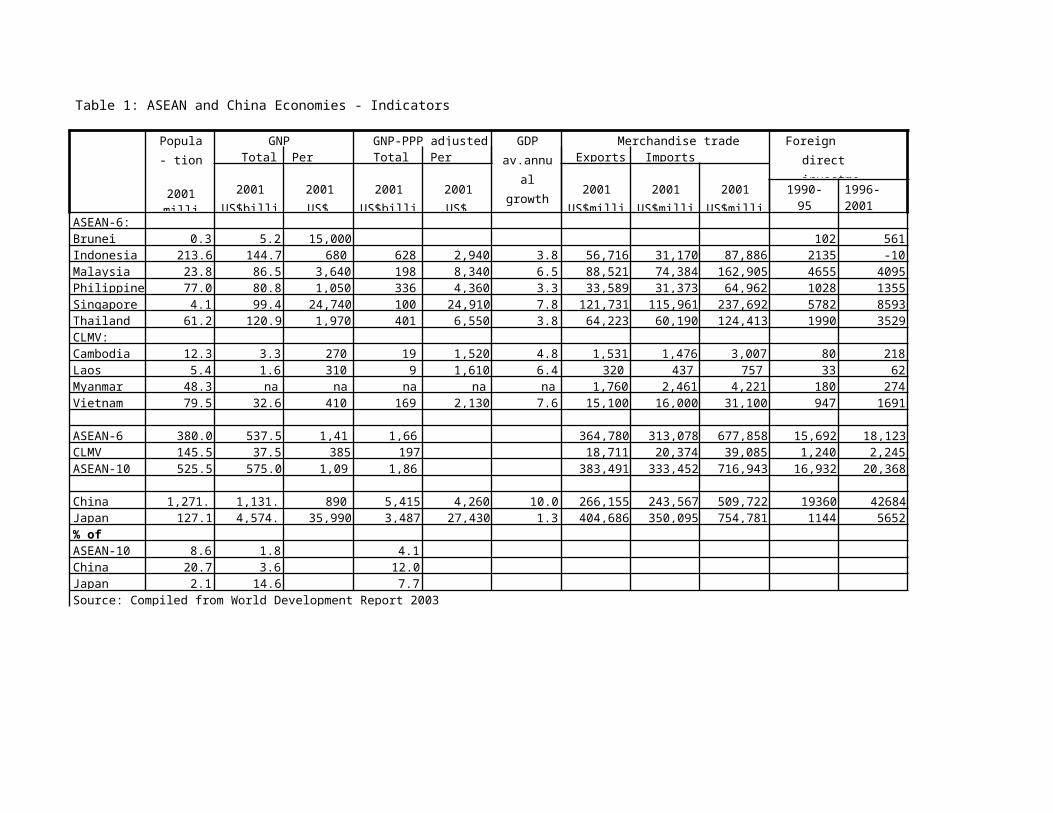
Table 1: ASEAN and China Economies - Indicators
Popula- tion
2001milli
GNP GNP-PPP adjusted GDPav.annu
algrowth1990-
Merchandise trade Foreign direct investme
Total Per Total Per Exports Imports
2001US$billi
2001US$
2001US$billi
2001US$
2001US$milli
2001US$milli
2001US$milli
1990-95
1996-2001
ASEAN-6:Brunei 0.3 5.2 15,000 102 561Indonesia 213.6 144.7 680 628 2,940 3.8 56,716 31,170 87,886 2135 -10Malaysia 23.8 86.5 3,640 198 8,340 6.5 88,521 74,384 162,905 4655 4095Philippine 77.0 80.8 1,050 336 4,360 3.3 33,589 31,373 64,962 1028 1355Singapore 4.1 99.4 24,740 100 24,910 7.8 121,731 115,961 237,692 5782 8593Thailand 61.2 120.9 1,970 401 6,550 3.8 64,223 60,190 124,413 1990 3529CLMV:Cambodia 12.3 3.3 270 19 1,520 4.8 1,531 1,476 3,007 80 218Laos 5.4 1.6 310 9 1,610 6.4 320 437 757 33 62Myanmar 48.3 na na na na na 1,760 2,461 4,221 180 274Vietnam 79.5 32.6 410 169 2,130 7.6 15,100 16,000 31,100 947 1691
ASEAN-6 380.0 537.5 1,41 1,66 364,780 313,078 677,858 15,692 18,123CLMV 145.5 37.5 385 197 18,711 20,374 39,085 1,240 2,245ASEAN-10 525.5 575.0 1,09 1,86 383,491 333,452 716,943 16,932 20,368
China 1,271. 1,131. 890 5,415 4,260 10.0 266,155 243,567 509,722 19360 42684Japan 127.1 4,574. 35,990 3,487 27,430 1.3 404,686 350,095 754,781 1144 5652% of ASEAN-10 8.6 1.8 4.1China 20.7 3.6 12.0Japan 2.1 14.6 7.7Source: Compiled from World Development Report 2003
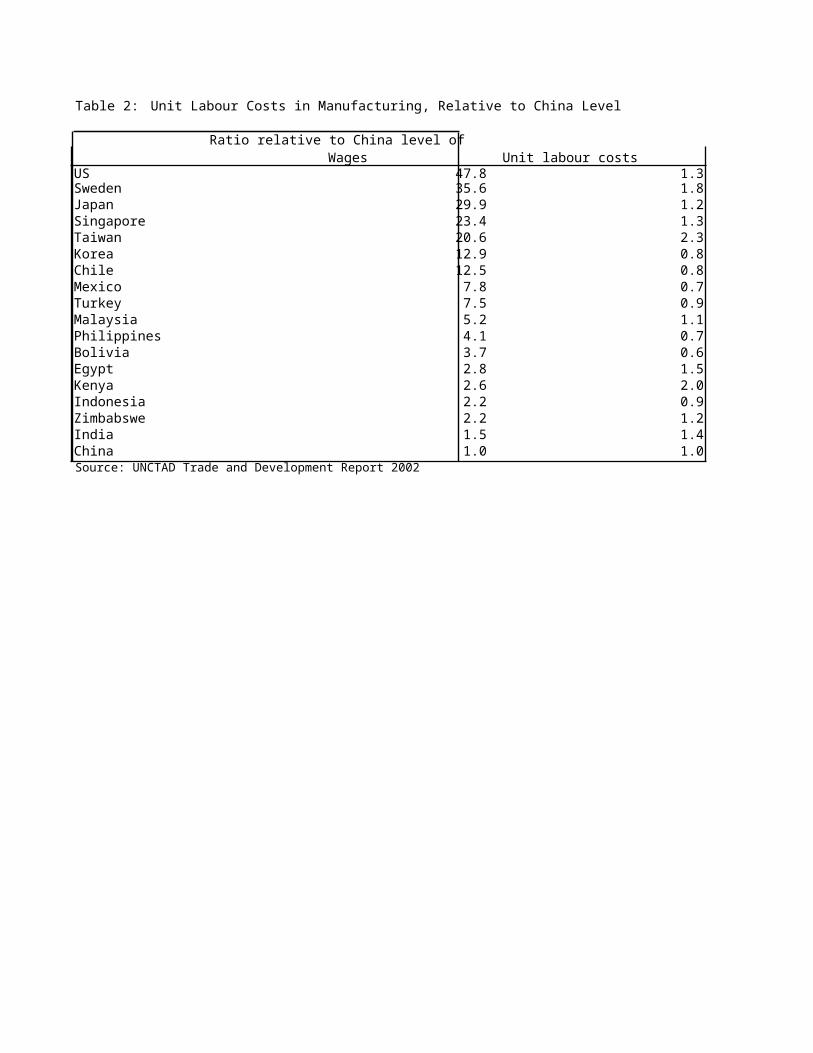
Table 2: Unit Labour Costs in Manufacturing, Relative to China Level
Ratio relative to China level ofWages Unit labour costs
US 47.8 1.3Sweden 35.6 1.8Japan 29.9 1.2Singapore 23.4 1.3Taiwan 20.6 2.3Korea 12.9 0.8Chile 12.5 0.8Mexico 7.8 0.7Turkey 7.5 0.9Malaysia 5.2 1.1Philippines 4.1 0.7Bolivia 3.7 0.6Egypt 2.8 1.5Kenya 2.6 2.0Indonesia 2.2 0.9Zimbabswe 2.2 1.2India 1.5 1.4China 1.0 1.0Source: UNCTAD Trade and Development Report 2002
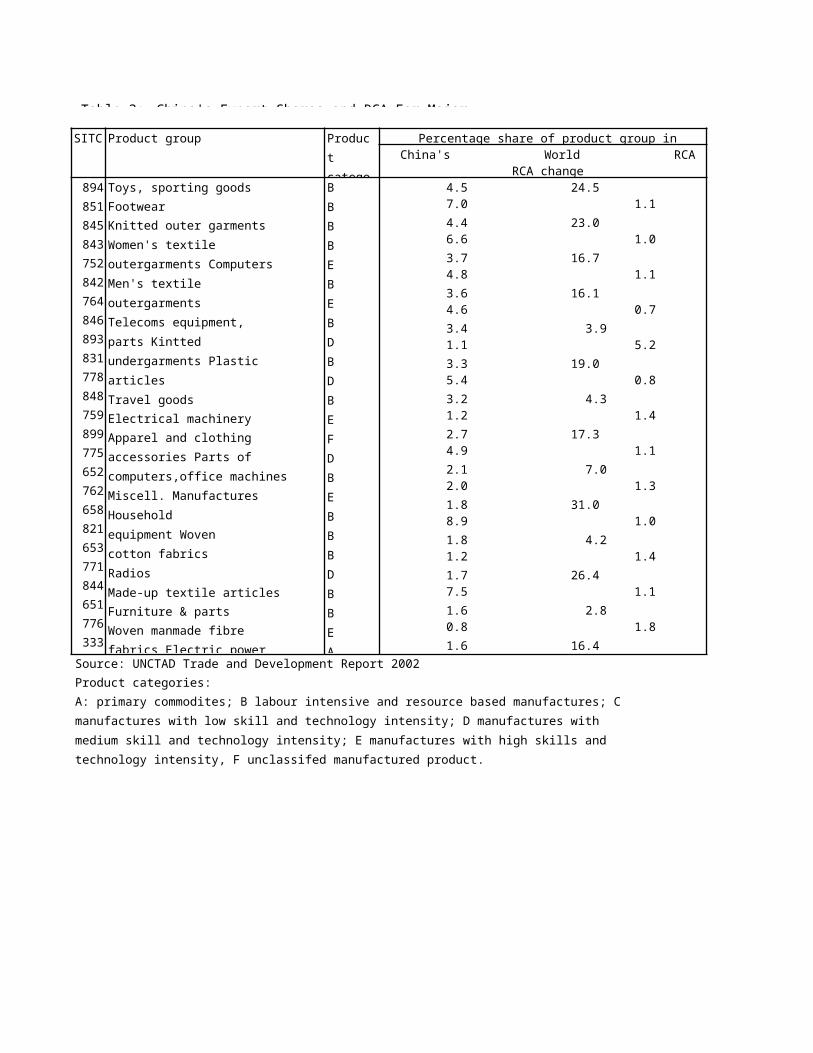
Table 3: China's Export Shares and RCA For Major
SITC Product group Product catego
Percentage share of product group inChina's World RCA
RCA change894851845843752842764846893831778848759899775652762658821653771844651776333772
Toys, sporting goodsFootwearKnitted outer garments Women's textile outergarments ComputersMen's textile outergarments Telecoms equipment, parts Kintted undergarments PlasticarticlesTravel goodsElectrical machineryApparel and clothing accessories Parts of computers,office machines Miscell. ManufacturesHousehold equipment Woven cotton fabrics RadiosMade-up textile articlesFurniture & partsWoven manmade fibre fabrics Electric power
BBBBEBEBDBDBEFDBEBBBDBBEA
4.5 24.5 7.0 1.14.4 23.0 6.6 1.03.7 16.7 4.8 1.13.6 16.1 4.6 0.73.4 3.9 1.1 5.23.3 19.0 5.4 0.83.2 4.3 1.2 1.42.7 17.3 4.9 1.12.1 7.0 2.0 1.31.8 31.0 8.9 1.01.8 4.2 1.2 1.41.7 26.4 7.5 1.11.6 2.8 0.8 1.81.6 16.4 4.7 0.9Source: UNCTAD Trade and Development Report 2002
Product categories:A: primary commodites; B labour intensive and resource based manufactures; C manufactures with low skill and technology intensity; D manufactures with medium skill and technology intensity; E manufactures with high skills and technology intensity, F unclassifed manufactured product.
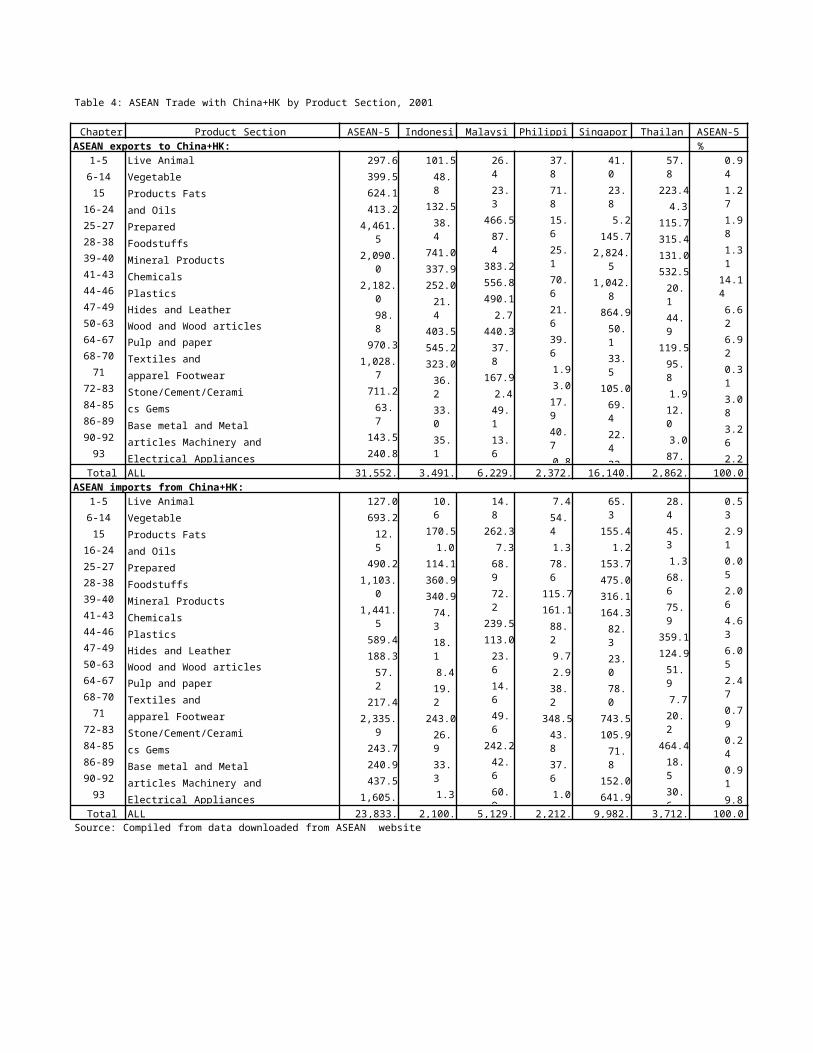
Table 4: ASEAN Trade with China+HK by Product Section, 2001
Chapter Product Section ASEAN-5 Indonesi Malaysi Philippi Singapor Thailan ASEAN-5ASEAN exports to China+HK: %
1-56-1415
16-2425-2728-3839-4041-4344-4647-4950-6364-6768-7071
72-8384-8586-8990-9293
94-96
Live Animal Vegetable Products Fats and Oils Prepared Foodstuffs Mineral ProductsChemicalsPlasticsHides and LeatherWood and Wood articlesPulp and paper Textiles and apparel Footwear Stone/Cement/Ceramics GemsBase metal and Metal articles Machinery and Electrical Appliances
297.6399.5624.1413.2
4,461.5
2,090.0
2,182.098.8
970.31,028.
7711.263.7
143.5240.8757.9
101.548.8
132.538.4
741.0337.9252.021.4
403.5545.2323.036.233.035.169.
26.423.3
466.587.4
383.2556.8490.12.7
440.337.8
167.92.449.113.6
141.7
37.871.815.625.170.621.639.61.93.017.940.70.8
41.023.85.2
145.72,824.
51,042.
8864.950.133.5
105.069.422.422.
57.8
223.44.3
115.7315.4131.0532.520.144.9
119.595.81.912.03.087.1
0.941.271.981.3114.146.626.920.313.083.262.2
Total ALL 31,552. 3,491. 6,229. 2,372. 16,140. 2,862. 100.0ASEAN imports from China+HK:
1-56-1415
16-2425-2728-3839-4041-4344-4647-4950-6364-6768-7071
72-8384-8586-8990-9293
94-96
Live Animal Vegetable Products Fats and Oils Prepared Foodstuffs Mineral ProductsChemicalsPlasticsHides and LeatherWood and Wood articlesPulp and paper Textiles and apparel Footwear Stone/Cement/Ceramics GemsBase metal and Metal articles Machinery and Electrical Appliances
127.0693.212.5
490.21,103.
01,441.
5589.4188.357.2
217.42,335.
9243.7240.9437.5
1,605.5
10.6
170.51.0
114.1360.9340.974.318.18.419.2
243.026.933.31.3
178.4
14.8
262.37.368.972.2
239.5113.023.614.649.6
242.242.660.9
7.454.41.378.6
115.7161.188.29.72.938.2
348.543.837.61.0
108.4
65.3
155.41.2
153.7475.0316.1164.382.323.078.0
743.5105.971.8
152.0641.9
28.445.31.368.675.9
359.1124.951.97.720.2
464.418.530.6
0.532.910.052.064.636.052.470.790.240.919.8
Total ALL 23,833. 2,100. 5,129. 2,212. 9,982. 3,712. 100.0Source: Compiled from data downloaded from ASEAN website
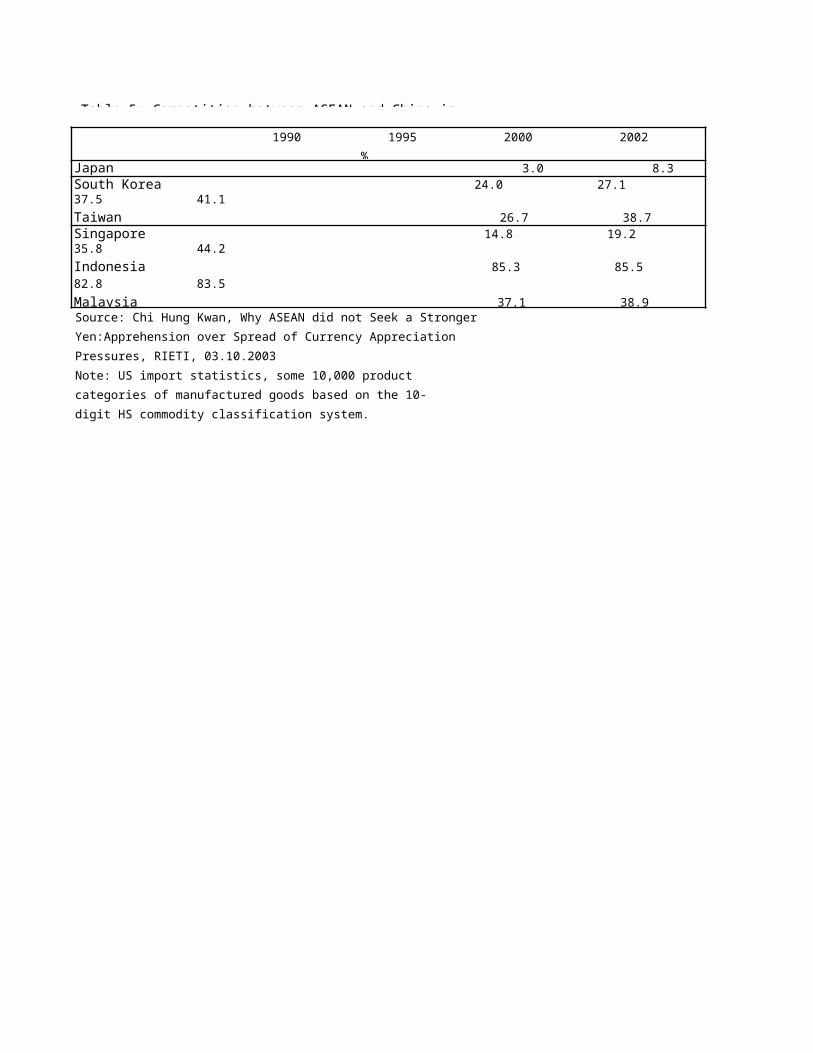
Table 5: Competition between ASEAN and China inTable 6: Structure of Exports to the US and Japan Markets
1990 1995 2000 2002%
Japan 3.0 8.3 16.3 20.5South Korea 24.0 27.1 37.5 41.1Taiwan 26.7 38.7 Singapore 14.8 19.2 35.8 44.2Indonesia 85.3 85.5 82.8 83.5Malaysia 37.1 38.9 Source: Chi Hung Kwan, Why ASEAN did not Seek a Stronger Yen:Apprehension over Spread of Currency Appreciation Pressures, RIETI, 03.10.2003Note: US import statistics, some 10,000 product categories of manufactured goods based on the 10-digit HS commodity classification system.

Table 6: Structure of Exports to the US and Japan Markets Table 7: Shares of US and Japanese Import
Trade CategoriesI II III IV V
Primary Resource- Textiles, Automotive Engineering Electronics, Other lowProcess Other high products based garments, electrical tech tech
Exports to US:Export shares (%) ASEAN
China
1995 6.9 6.5 13.5 0.2 12.0 52.3 6.8 0.8 1.12000 5.0 7.0 13.0 0.5 9.0 56.7 7.0 0.9 1.0
ASEAN/China shares ratio 1995 3.56 2.61 0.55 0.30 1.08 4.94 0.30 1.22 0.73
Av, annual growth (%) ASEANChina
1995-2000-0.50 8.17 5.85 23.21 0.62 8.32 7.09 8.56 6.36
Revealed compar. advantageASEAN
China
1995 0.55 0.53 1.37 0.02 0.80 2.57 0.71 0.23 0.382000 0.37 0.55 1.39 0.03 0.65 2.79 0.73 0.30 0.28
Exports to Japan:Export shares (%) ASEAN
China
1995 32.6 24.4 4.7 0.4 7.7 21.9 5.7 1.6 0.92000 28.1 17.5 2.9 1.2 8.5 33.4 5.3 2.1 1.0
ASEAN/China shares ratio 1995 2.56 2.17 0.14 1.06 1.63 3.26 0.70 0.55 1.04
Av, annual growth (%) ASEANChina
1995-20000.91 -2.76 -5.66 26.03 6.09 13.092.41 9.76 7.55
Revealed compar. advantageASEAN
China
1995 1.07 1.14 0.49 0.11 1.09 1.56 0.89 0.44 0.282000 0.92 1.00 0.34 0.38 1.03 1.72 0.88 0.65 0.31
Source: Weiss and Gao (October 2002)
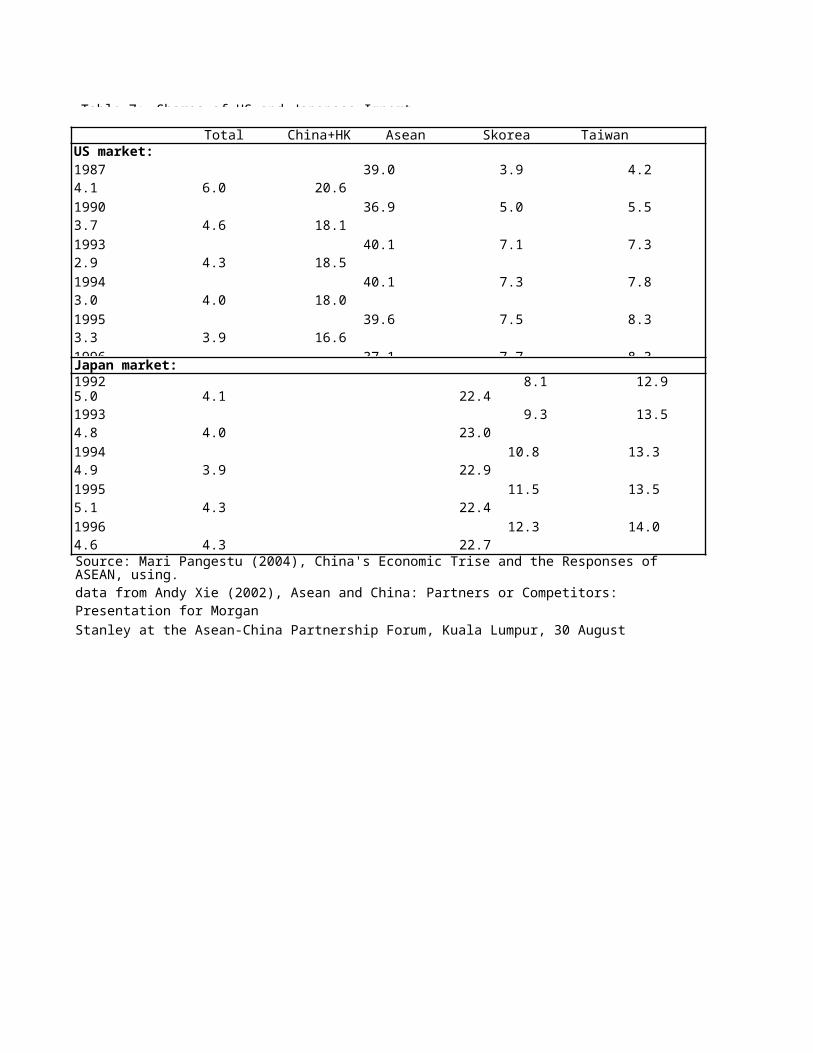
Table 7: Shares of US and Japanese Import Table 8: FDI Inflows to ASEAN and China
Total China+HK Asean Skorea Taiwan Japan USUS market:
1987 39.0 3.9 4.2 4.1 6.0 20.61990 36.9 5.0 5.5 3.7 4.6 18.11993 40.1 7.1 7.3 2.9 4.3 18.51994 40.1 7.3 7.8 3.0 4.0 18.01995 39.6 7.5 8.3 3.3 3.9 16.61996 37.1 7.7 8.3 Japan market:1992 8.1 12.9 5.0 4.1 22.41993 9.3 13.5 4.8 4.0 23.01994 10.8 13.3 4.9 3.9 22.91995 11.5 13.5 5.1 4.3 22.41996 12.3 14.0 4.6 4.3 22.7Source: Mari Pangestu (2004), China's Economic Trise and the Responses of ASEAN, using.data from Andy Xie (2002), Asean and China: Partners or Competitors: Presentation for MorganStanley at the Asean-China Partnership Forum, Kuala Lumpur, 30 August
1985-90av 1991-96av 1991 1992 1993 1994 1995 1996 1997 1998 1999 2000 2001 2002
China 2,65 25,74 4,36 11,15 27,51 33,78 35,84 40,18 44,23 43,75 40319 40772 46846 52700
Brunei 210 1 4 14 6 13 -69 702 573 748 549 526 1,03Indonesia 551 1,98 1,48 1,77 2,00 2,10 4,34 6,19 4,67 - - - - -Malaysia 1,05 5,43 3,99 5,18 5,00 4,58 5,81 7,29 6,32 2,71 3,89 3,78 554 3,20Philippines 413 1,22 544 228 1,23 1,59 1,45 1,52 1,26 1,71 1,72 1,34 982 1,11Singapore 2,95 6,85 4,88 2,20 4,68 8,85 8,78 10,37 13,53 7,59 13,24 12,46 10,94 7,95Thailand 1,01 1,96 2,01 2,11 1,73 1,34 2,00 2,27 3,88 7,49 6,09 3,35 3,81 1,06Cambodia 120 33 54 69 151 294 168 243 230 149 148 54Laos 2 53 7 8 30 59 95 160 86 45 52 34 24 25Myanmar 28 256 238 171 149 126 277 310 879 684 304 208 192 129Vietnam 30 1,21 229 385 1,00 1,93 2,33 2,51 2,58 1,70 1,48 1,28 1,30 1,20ASEAN-6 5,98 17,67 12,92 11,51 14,67 18,48 22,42 27,58 30,37 19,73 22,95 16,94 13,54 12,84ASEAN-10 6,04 19,32 13,40 12,10 15,91 20,67 25,28 30,86 34,09 22,40 25,02 18,62 15,20 14,25
Developing 24,73 91,50 41,69 49,62 78,81 104,92 113,33 152,49 193,22 191,28 229,29 246,05 209,43 162,14World 141,93 254,32 158,93 173,76 219,42 255,98 331,06 384,91 481,91 686,02 107,08 1,392,9 823,82 651,18
% of developingworld flowsChina 10.7 28.1 10.4 22.4 34.9 32.2 31.6 26.3 22.8 22.8 17.5 16.5 22.3 32.5ASEAN-10 24.4 21.1 32.1 24.4 20.1 19.7 22.3 20.2 17.6 11.7 10.9 7.57 7.2 8.7% of world China 1.87 10.1 2.7 6.4 12.5 13.2 10.8 10.4 9.1 6.3 37.6 2.93 5.6 8.0ASEAN-10 4.26 7.60 8.4 6.9 7.2 8.0 7.6 8.0 7.0 3.2 23.3 1.34 1.8 2.1
Table 8: FDI Inflows to ASEAN and ChinaTable 9: Summary of Framework Agreement on ASEAN-China Comprehensive
Source: Compiled from World Investment Reports, various years.
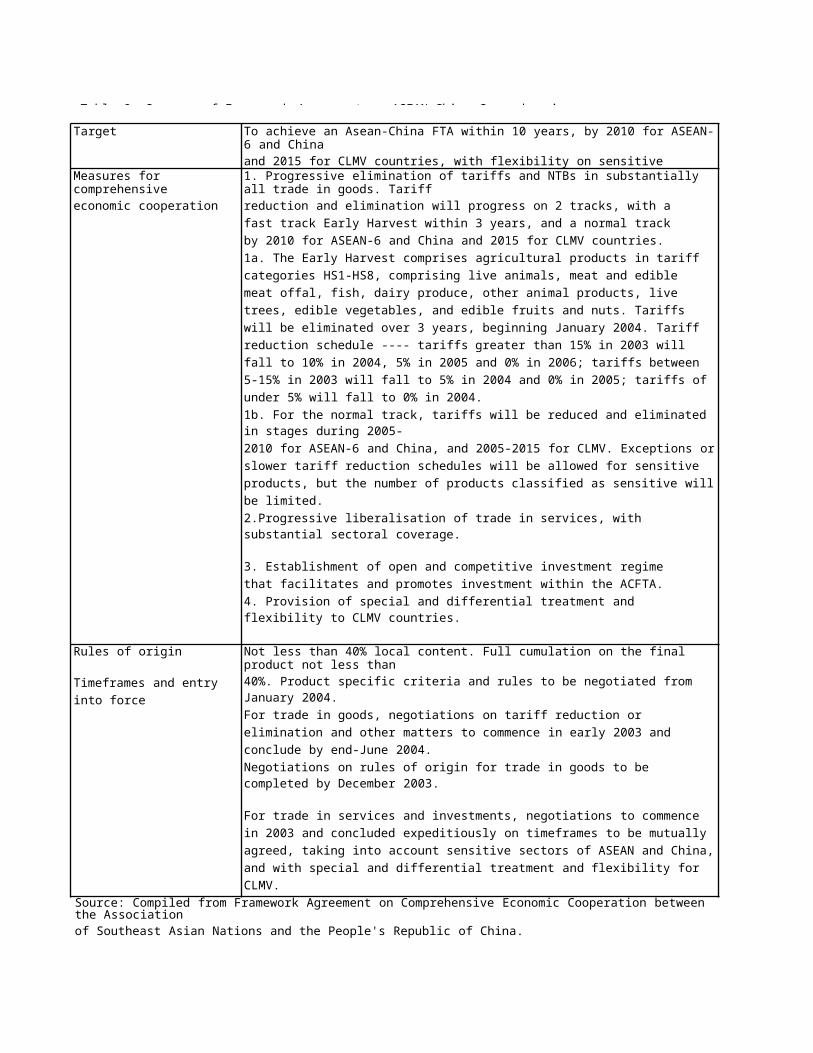
Table 9: Summary of Framework Agreement on ASEAN-China Comprehensive Table 10: Changes in Exports with Target To achieve an Asean-China FTA within 10 years, by 2010 for ASEAN-
6 and Chinaand 2015 for CLMV countries, with flexibility on sensitive
Measures for comprehensiveeconomic cooperation
1. Progressive elimination of tariffs and NTBs in substantially all trade in goods. Tariffreduction and elimination will progress on 2 tracks, with a fast track Early Harvest within 3 years, and a normal track by 2010 for ASEAN-6 and China and 2015 for CLMV countries.1a. The Early Harvest comprises agricultural products in tariff categories HS1-HS8, comprising live animals, meat and edible meat offal, fish, dairy produce, other animal products, live trees, edible vegetables, and edible fruits and nuts. Tariffs will be eliminated over 3 years, beginning January 2004. Tariff reduction schedule ---- tariffs greater than 15% in 2003 will fall to 10% in 2004, 5% in 2005 and 0% in 2006; tariffs between 5-15% in 2003 will fall to 5% in 2004 and 0% in 2005; tariffs ofunder 5% will fall to 0% in 2004.1b. For the normal track, tariffs will be reduced and eliminated in stages during 2005-2010 for ASEAN-6 and China, and 2005-2015 for CLMV. Exceptions orslower tariff reduction schedules will be allowed for sensitive products, but the number of products classified as sensitive willbe limited.2.Progressive liberalisation of trade in services, with substantial sectoral coverage.
3. Establishment of open and competitive investment regime that facilitates and promotes investment within the ACFTA.4. Provision of special and differential treatment and flexibility to CLMV countries.
5. Provision of flexibility in ACFTA negotiations to address Rules of origin
Timeframes and entryinto force
Not less than 40% local content. Full cumulation on the final product not less than40%. Product specific criteria and rules to be negotiated from January 2004.For trade in goods, negotiations on tariff reduction or elimination and other matters to commence in early 2003 and conclude by end-June 2004.Negotiations on rules of origin for trade in goods to be completed by December 2003.
For trade in services and investments, negotiations to commence in 2003 and concluded expeditiously on timeframes to be mutually agreed, taking into account sensitive sectors of ASEAN and China,and with special and differential treatment and flexibility for CLMV.For other areas of economic cooperation, ASEAN and China will Source: Compiled from Framework Agreement on Comprehensive Economic Cooperation between
the Associationof Southeast Asian Nations and the People's Republic of China.
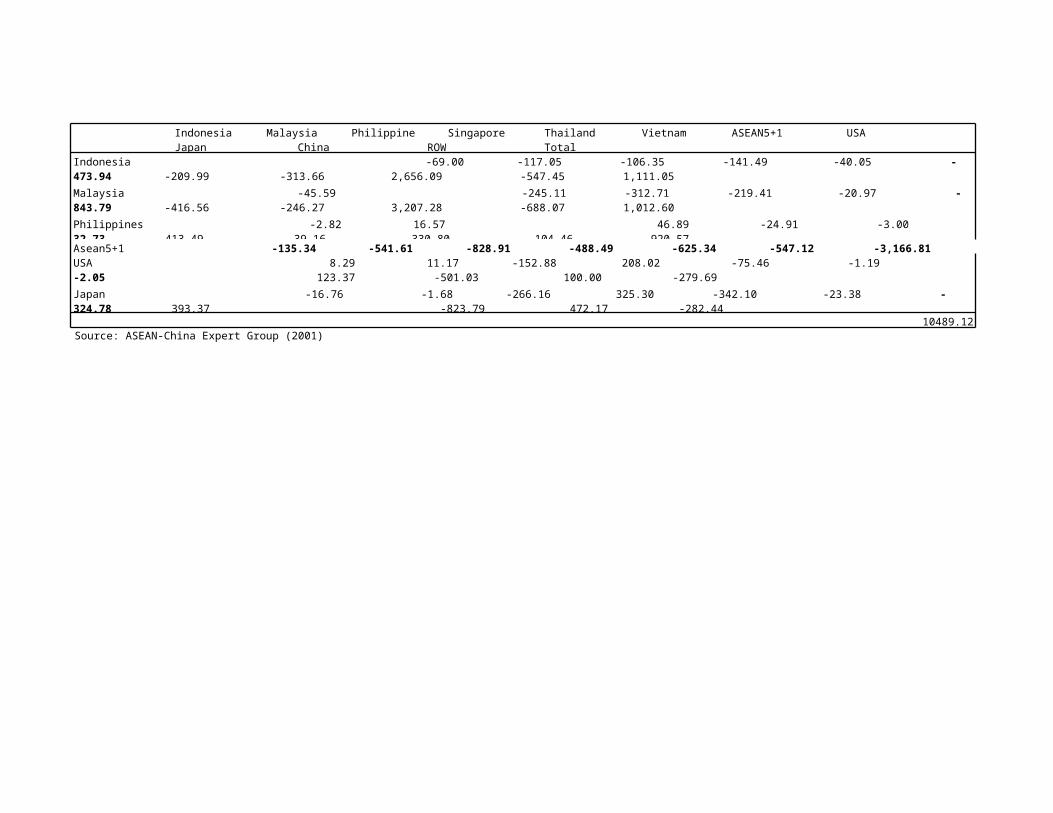
Table 10: Changes in Exports with Indonesia Malaysia Philippine Singapore Thailand Vietnam ASEAN5+1 USA Japan China ROW Total
Indonesia -69.00 -117.05 -106.35 -141.49 -40.05 -473.94 -209.99 -313.66 2,656.09 -547.45 1,111.05Malaysia -45.59 -245.11 -312.71 -219.41 -20.97 -843.79 -416.56 -246.27 3,207.28 -688.07 1,012.60Philippines -2.82 16.57 46.89 -24.91 -3.00 32.73 413.49 39.16 330.80 104.46 920.57Asean5+1 -135.34 -541.61 -828.91 -488.49 -625.34 -547.12 -3,166.81 USA 8.29 11.17 -152.88 208.02 -75.46 -1.19 -2.05 123.37 -501.03 100.00 -279.69Japan -16.76 -1.68 -266.16 325.30 -342.10 -23.38 -324.78 393.37 -823.79 472.17 -282.44
10489.12Source: ASEAN-China Expert Group (2001)

Indonesia
Malaysia
Philippines
SingaporeUS$milli
Thailand
Vietnam Total
Increase in exports to China: - - 42.0 - 129.5 - 153.9Vegetable oil 42.9 505.5 4.2 38.4 2.83 20.88 614.9Other agric products
139.2 145.6 12.2 72.9 290.7 30.08 690.9Extractive 55.9 25.7 52.1 18.8 9.89 12.28 174.8Textiles & apparel
735.3 465.6 68.5 101.9 1,698.7 9.39 3,079.Chemicals 94.7 186.3 14.5 369.2 164.8 9.05 838.9Motor Vehicles 287.9 618.6 5.0 755.7 60.1 150.29 1,877.Elec machinery 28.0 495.0 58.8 1,344.1 230.2 0.30 2,156.Other manufactures
1,281.8 773.6 77.3 948.3 323.7 44.50 3,449.Services - - - - - - -Total 2,656.0 3,207. 330.8 3,639.1 2,907.7 267.04 13,008.Increase in exports to ASEAN: 58.7 163.5 82.9 117.1 115.8 31.96 570.1Vegetable oil 42.3 1.6 0.6 6.0 10.6 0.10 61.5Other agric products
31.0 11.4 14.4 80.3 40.3 5.00 182.7Extractive 18.0 1.9 0.0 - 13.5 0.23 33.0Textiles & apparel
402.7 307.6 622.6 58.6 869.8 240.71 2,502.Chemicals 97.9 105.6 179.2 13.9 196.8 31.32 624.9Motor Vehicles 74.4 45.6 173.9 54.8 357.6 50.78 757.3Elec machinery 114.3 361.3 813.4 - 794.0 80.26 2,151.Other manufactures
527.9 453.9 1,169. 329.8 742.7 499.15 3,723.Services 3.9 3.5 0.0 - - 5.31 7.2Total 1,371.6 1,456. 3,057. 643.9 3,140.1 944.81 10,614.
Table 11: Sectoral Composition of Increase in ASEAN-China Exports
Source: ASEAN-China Expert Group (2001)

Table 12: Impact on Real GDP of ASEAN-China FTA
Country Real GDPUS$millon
IncreaseUS$million
% increase
Indonesia 204,031.4 2,267.8 1.12Malaysia 98,032.3 1,133.5 1.17Philippnes 71,167.1 229.1 0.32Singapore 72,734.9 753.3 1.05Thailand 165,516.0 673.6 0.41Vietnam 16,110.9 339.1 2.15China 815,163.0 2,214.9 0.27
USA 7,120,465.5 -2,594.5 -0.04Japan 5,078,704.5 -4,452.0 -0.09ROW 14,657,026.0 -6,272.0 -0.04Total 28,298,952.1 -5,706.9 -0.02Source: ASEAN-China Expert Group (2001)