ASB Allegiance Real Estate Fund - Granicus
58
ASB Real Estate Investments ASB Allegiance Real Estate Fund THIRD QUARTER 2012 August 21, 2019 Presentation to: Imperial County Employees Retirement System Frank Nigro, Vice President Client Service, (650) 304-0024 A $7.6 billion open-end, core U.S. real estate fund building on three decades of performance ASB Allegiance Real Estate Fund David Quigley, Chief Investment Officer Capital Investments, (650) 304-0019
-
Upload
khangminh22 -
Category
Documents
-
view
0 -
download
0
Transcript of ASB Allegiance Real Estate Fund - Granicus

ASB Real Estate Investments
ASB A l leg iance Real Es ta te Fund
THIRD QUARTER 2012
August 21, 2019
Presentation to: Imperial County Employees Retirement System
Frank Nigro, Vice President
Client Service, (650) 304-0024
A $7.6 bil l ion open-end,
core U.S. real estate fund
building on three decades
of performance
ASB Allegiance
Real Estate Fund
David Quigley, Chief Investment Officer
Capital Investments, (650) 304-0019

ASB Real Estate Investments
ASB A l leg iance Real Es ta te FundDisclosure Statement
GIPS Compliant
ASB Capital Management LLC claims compliance with the Global
Investment Performance Standards (GIPS®).
GIPS Compliant Report
A GIPS compliant report of the ASB Core Real Estate Composite,
which includes the verification and examination statements, is
located in the Appendix section of this presentation. The
verification and examination opinion letters are available upon
request. The body of the presentation contains supplemental
information for GIPS purposes. A complete list of all of ASB
Capital Management’s composites and their descriptions is
available by contacting 240-482-2900.
─ All materials in this presentation are supplemental to the
GIPS compliant presentation included in the Appendix.
2
Investment Performance - Gross of Fees
Investment performance is presented gross of fees. Actual client
performance will be reduced by investment management fees. In
order to illustrate the performance effect of investment
management fees, comparative ASB Core Real Estate Composite
gross and net of investment fee returns are included in the
Appendix of this presentation. Past performance is not necessarily
indicative of future results.
Investment Management Fees
Investment management fees are described in ASB Capital
Management’s ADV and in the Appendix of this presentation.
─ All information, unless otherwise noted, is as of 6/30/19.
To ensure comparability, the returns in this presentation (unless otherwise noted) are portrayed as gross of
investment management fees. As a result, the following disclosures are made:
The information provided in this booklet should not be used for any other purpose unless expressly authorized by ASB Capital Management, LLC ®

ASB Real Estate Investments
ASB A l leg iance Real Es ta te FundIntroduction
3
ASB’s Mission: We Put Our Clients’ Investment Performance First
Our steadfast mission is to generate outstanding risk-adjusted investment
performance for our investors, so that their beneficiaries and retirees can
secure life-long financial independence and peace of mind.
Contents of Today’s Presentation:
I. Overview of ASB Real Estate Investments
II. ASB Allegiance Real Estate Fund — Strategy
III. Fund Performance, Drivers and Outlook
IV. Allegiance Fund Portfolio Composition
V. Appendix

ASB Real Estate Investments
ASB A l leg iance Real Es ta te Fund
4
465 Broadway | New York, NY

ASB Real Estate Investments
ASB A l leg iance Real Es ta te FundAbout ASB Real Estate Investments
5
A S S E T S U N D E R M A N A G E M E N T ( A S O F 6 / 3 0 / 1 9 ) *
Gross Asset Value $8.1 billion
Number of Assets 190
U.S. Markets 19
Total Square Feet 15.7 million
Performance
ASB has consistently delivered long-term performance well above
industry averages.
Philosophy
ASB’s investment philosophy capitalizes on a deep understanding
of local markets and tenant performance.
Veteran Leadership
The company’s disciplined strategy has been successfully executed by a senior team working collaboratively through multiple
real estate cycles.
Accountability
Executives and team members operate cross-functionally and are held accountable for performance outcomes based on the
full-life cycle of investments from acquisition through disposition.
Focus and Discipline
ASB manages a limited number of real estate investment products with clear, compelling strategies and no competing
mandates.
Social Responsibility
We are dedicated to making the places we invest in better. Socially responsible investments take into consideration
environmental, social, and governance (ESG) issues which can positively impact long-term performance and reduce risk.
ASB Real Estate Investments (ASB), a division of ASB Capital Management, LLC, is a leading U.S. real estate
investment management firm. Headquartered in Washington, DC, ASB invests in major urban markets across
the U.S., concentrating in office, multifamily, retail and industrial properties.
*Includes Meridian II, which is reported as of 3/31/2019

ASB Real Estate Investments
ASB A l leg iance Real Es ta te Fund
6
Sedona / Slate | Washington, DC

ASB Real Estate Investments
ASB A l leg iance Real Es ta te FundStrategy – ASB Allegiance Real Estate Fund
Investment Objective: Achieve full cycle, risk-adjusted out-performance through long-term NOI growth in a well diversified portfolio
of assets with unique competitive advantages located in top urban submarkets exhibiting robust demand drivers.
7
Target Markets/ Sub-Markets
• Major U.S. Metros – primarily global gateway markets
— Economic growth engines; supply constraints; demonstrated
liquidity
• Urban submarkets in future growth path based on tenant-centric analysis
— Pedestrian vibrancy, mass-transit proximity, amenities, among
other desirable traits.
Investment Criteria (Core = High Tenant Demand)
• Lease pricing power capable of generating long-term NOI growth
• Superior or unique physical characteristics
• Tenant’s perspective - proximity to desirable amenities and ideal
space/configuration preferences
• Supply-constrained submarkets with growth momentum where tenants
are and want to locate

ASB Real Estate Investments
ASB A l leg iance Real Es ta te FundNiche Investment Strategies Focused on Tenant Demand
TENANT CENTRIC, EXCEPTIONAL QUALITY, URBAN FOCUSED
8
URB A N & W ORK FORCE
MULT IFA M IL Y
T he Green D i s t r i c t , B os ton605 L i nco l n , Miam i
URB A N RE T A IL
SELF-STORAGE
S to rQue s t P o r t f o l i o I , V a r i ous1400 16 t h S t . , S an F ranc i sco
INDUSTRIAL FOR TECH PRODUCTION,
LOGISTICS & DATA
URB A N CRE A T IV E OFFICE
455 Mass A ve . , W ash ing ton , DC
• Modern construction with high percentage of
temperature controlled units
• Strong visibility with superior traffic counts
• Dense urban submarkets with limited competing supply
• Submarkets in vibrant, mixed-use settings with access
to mass-transit and sustainable economic drivers
• Urban locations enhance access to top talent and build
corporate brand and reach
• Creative buildings with natural light, high ceilings and
open, flexible floor plates
• Urban, walkable mixed-use submarkets with
neighborhood restaurants and entertainment amenities
• Steady net absorption due to strong job growth amid
solid fundamentals
• Job center proximity
• Urban density and strong foot traffic drive sales and e-
commerce
• Limited vacancy and street-level requirements create
high barriers
• No mall or power center exposure
• Unique bulk facilities with competitive physical
characteristics, including high ceilings, open floor
plates, etc.
• Tight industrial submarkets with low vacancy and
limited supply of comparable product
• Proximity to major highways, providing efficient routes
to major commercial corridors

ASB Real Estate Investments
ASB A l leg iance Real Es ta te Fund
9
455 Massachusetts Avenue, NW | Washington, DC

ASB Real Estate Investments
ASB A l leg iance Real Es ta te Fund
10
Imperial County Employees Retirement System CH500009
CH500009
Fund NAV: $6,091,381,818.52
3 Months 12 Months Inception date for your plan was:
Beginning Partner's Capital $35,981,713 $34,098,127 January-13 12/31/2012
Net Contributions / (Withdrawals) $0 $0
Net Income $263,645 $1,048,487 Fund Gross Return Since Client Inception
Gains and Losses1 $239,740 $1,338,484 (annualized if greater than 1 year) 10.08%
Distributions2 $0 $0
Ending Partner's Capital $36,485,098 $36,485,098 Client Net Return Since Client Inception
Cash Balance (Pending Settlements) $0 $0 (annualized if greater than 1 year) 9.14%
Total Partner's Assets $36,485,098 $36,485,098
PERFORMANCE SUMMARY3
3 Months YTD 1 Yr 3 Yrs 5 Yrs 7 Yrs 10 Yrs
ASB Allegiance Real Estate Fund 1.40% 3.44% 7.00% 6.20% 9.25% 10.25% 10.16%
NCREIF Fund Index - ODCE - Value Weight 4 1.00% 2.43% 6.41% 7.57% 9.76% 10.52% 9.88%
ASB Allegiance Real Estate Fund - Net5 1.18% 2.99% 6.06% 5.26% 8.27% N/A N/A
ALLOCATION PROFILE (GAV)6 GEOGRAPHIC PROFILE (GAV)6
Allegiance NFI-ODCE VW Allegiance NFI-ODCE VW
Office 32.3% 34.7% East 48.49% 32.66%
Industrial 17.6% 17.0% Midwest 7.4% 8.7%
Residential 19.9% 26.1% South 6.5% 18.5%
Retail 24.2% 18.0% West 37.6% 40.1%
Self-Storage 5.9% 2.2%
Land N/A 0.3%
Hotel N/A 0.3%
Other N/A 1.3%
Cash 4.3% 2.2%
Note: Percentages are calculated NET of cash as per NFI-ODCE reporting format
1After all fees and costs except investment management fees.
2Distributions represent asset management fees paid from the dividend plus the net cash dividend paid to the investor.
3Past performance is not necessarily indicative of future results. Returns for periods greater than one year are annualized and time-w eighted. Returns are before the deduction of investment advisory fees.
6ABeginning 6-30-19, Fund asset class and geographic diversif ication is being show n on a GAV rather than NAV basis, as it is a better reflection of the Fund's total property exposure.
Quarterly Review for Periods Ending 6/30/19
LP Unit Value: $1,484.560 Client Outstanding LP Units: 24,576.376
ASSET GROWTH SUMMARY
Note: This analysis excludes non-real estate assets.
4As of March 31, 2009, the ASB Allegiance Fund’s benchmark for performance is the NCREIF Fund Index - Open-End Diversif ied Core Equity (NFI-ODCE). This index is a fund level capitalization-w eighted, time-w eighted return index and includes property
investments at ow nership share, cash balances and leverage (i.e. returns reflect each member fund’s actual asset ow nership positions and f inancing strategy).5ASB Allegiance Real Estate Fund net of fee returns are calculated by client on a cash basis for time periods in w hich the client w as invested for the entire time period.

ASB Real Estate Investments
ASB A l leg iance Real Es ta te FundPerformance
11
0%
4%
8%
12%
QTR YTD 1 YR 3 YR 5 YR 10 YR 15 YRSince
Inception
ASB Allegiance Fund 1.40% 3.44% 7.00% 6.20% 9.25% 10.16% 8.70% 8.22%
NFI-ODCE VW 1.00% 2.43% 6.41% 7.57% 9.76% 9.88% 8.01% 7.43%1
The Allegiance Fund has outperformed the NFI-ODCE over a full market cycle.
1 The NFI-ODCE Value-Weight is a fund level value-weighted return index and includes property investments at ownership share, cash balances and leverage (i.e. returns reflect each member fund’s
actual asset ownership positions and financing strategy). In addition, each fund has unique investment strategies (i.e. leverage, property type investments) that will impact performance differently.
Please see the ASB Core Real Estate Composite GIPS compliant presentation located in the Appendix section of this presentation for further details concerning gross of fee returns and net of fee
returns.
A N N U A L I Z E D G R O S S O F F E E T O T A L R E T U R N S ( a s o f 6 / 3 0 / 1 9 )
ASB Real Estate Investments
ASB A l leg iance Real Es ta te FundOutperformance Over A Full Market Cycle
12
• Strong relative performance during the downturn demonstrates
a modest risk profile.
• Demonstrably provides similar outperformance in both up and
down markets.
• Outperformed the NCREIF Fund Index-ODCE Value-Weight in
nine of the past 15 years.
S U M M A R Y
ALLEGIANCE FUND NFI-ODCE-VW1
UP YEARS
2004 14.00% 13.06%
2005 18.63% 21.39%
2006 18.11% 16.32%
2007 15.65% 15.97%
2010 17.02% 16.36%
2011 21.02% 15.99%
2012 12.46% 10.94%
2013 13.72% 13.94%
2014 13.52% 12.50%
2015 17.28% 15.02%
2016 5.56% 8.77%
2017 4.92% 7.62%
2018 7.61% 8.35%
Cumulative 430.83% 418.34
Cumulative Outperformance 12.49%
# of Years 13
Annualized Outperformance 0.91%
1 The NFI-ODCE Value-Weight is a fund level value-weighted return index and includes property investments at ownership share, cash balances and leverage (i.e. returns reflect each member fund’s actual asset ownership positions and
financing strategy). In addition, each fund has unique investment strategies (i.e. leverage, property type investments) that will impact performance differently.
Please see the ASB Core Real Estate Composite GIPS compliant presentation located in the Appendix section of this presentation for further details concerning gross of fee returns and net of fee returns.
Annualized performance is compounded.
ALLEGIANCE FUND NFI-ODCE-VW1
DOWN YEARS
2008 -4.55% -10.01%
2009 -29.52% -29.76%
Cumulative -32.73% -36.79%
Cumulative Outperformance 4.06%
# of Years 2
Annualized Outperformance 2.01%
F I F T E E N - Y E A R A N A L Y S I S

ASB Real Estate Investments
ASB A l leg iance Real Es ta te Fund
-4.00%
-3.00%
-2.00%
-1.00%
0.00%
1.00%
2.00%
3.00%
4.00%
0.00%
1.00%
2.00%
3.00%
4.00%
5.00%
6.00%
7.00%
8.00%
Q2 2018 Q3 2018 Q4 2018 Q1 2019
ASBAllegianceFund
NPI-ODCE
ASB Relativeto NPI-ODCE
Active asset management is driving results on an absolute and relative basis
13
Drivers of Improved Relative Performance
• Continued broad-based leasing success in core and non-core portfolios
• Strategic Dispositions: New York and Minneapolis office, data center portfolio, and select retail
• Accretive Acquisitions: Industrial, self-storage, and multifamily
• Rightsizing portfolio leverage
• Greater pricing equilibrium between primary and secondary markets
T R A I L I N G O N E - Y E A R U N L E V E R E D R E A L E S T A T E R E T U R N S *
* As of 3/31/19 and does not include the performance of data center bonds or leverage

ASB Real Estate Investments
ASB A l leg iance Real Es ta te FundProjected New and Expansion Lease Commencements (in $ millions)*
14
Including executed commercial leases and projected self-storage lease up, annual NOI commencements of approximately
$25.9 million are projected over the next four quarters.
P R O J E C T E D N E W & E X P A N S I O N L E A S E C O M M E N C E M E N T S ( i n $ m i l l i o n s ) *
*Self-storage lease-up is based on projections.
$1.5
$10.2
$1.3
$4.2$2.1
$1.5
$2.4
$2.7$3.7
$11.7
$3.7
$6.9
$15.3
$19.0
$25.9
$0.0
$5.0
$10.0
$15.0
$20.0
$25.0
$30.0
3Q19 4Q19 1Q20 2Q20
Mill
ions
Commercial Self-Storage Cumulative

ASB Real Estate Investments
ASB A l leg iance Real Es ta te FundUpside Potential
15
*Base rent opportunity from rolling current in-place leases to market rents upon lease expiration.
**As of 3/31/19
R E A L E S T A T E F U N D I N C O M E G R O W T H O P P O R T U N I T I E S * *
Property Type Leased SF
Weighted Avg.
Lease Maturity
(Yrs)
In-Place Rent Market RentMarket Premium
to In-PlaceBase Rent Upside*
Office 2,875,867 6.2 $46.53 $52.21 12.2% $13,588,548
Retail 1,215,744 7.2 $60.50 $66.23 9.5% $7,118,452
Industrial 3,153,734 8.2 $10.22 $12.17 19.0% $6,039,829
Total 7,245,345 6.8 $33.07 $37.13 12.3% $26,746,828
Over $32 million of potential significant upside through leasing high-value space.
1Includes unspent base building capital and capital related to speculative leasing.
REAL ESTATE FUND LEASING RISK AND UPSIDE -
Property Property TypeTotal Rentable
SF
Capex in Next 3
Years ($M)1
Total NOI Upside @
93% Leased ($M)Status
StorQuest Portfolio II Self-Storage 528,394 0.27$ 9.14$ Pre-Delivery
StorQuest Portfolio I Self-Storage 778,392 0.47$ 8.61$ Delivered
Williamsburg Portfolio II Retail 43,005 1.94$ 4.38$ Delivered
Williamsburg Portfolio I Retail 29,157 4.06$ 2.67$ Delivered
120 Greenw ich Retail 4,653 0.66$ 1.82$ Delivered
61 Crosby Retail 32,400 3.73$ 1.59$ Delivered
The Park on Bluebonnet Residential 358,608 7.11$ 1.38$ Delivered
200 Pow ell Street Retail 7,800 1.02$ 1.38$ Delivered
1010 Flanders Office 56,279 3.91$ 0.86$ Delivered
Colorado Center Tow er III Office 227,921 10.72$ 0.36$ Delivered
Total 2,066,609 33.88$ 32.19$ -

ASB Real Estate Investments
ASB A l leg iance Real Es ta te Fund
16
415 Broadway | New York City, NY

ASB Real Estate Investments
ASB A l leg iance Real Es ta te FundAllegiance Fund Overview
17
F U N D F A C T S ( A S O F 6 / 3 0 / 1 9 )
Fund’s Total Gross Assets $7.6B # of Investments/Properties1 82/176
Net Assets $6.1B Operating Occupancy2 92%
Leverage Level 19.3% WTD Avg. Lease Exp. 3 6.8 years
Number of Investors 335+ Non-Core % (GAV) 6.1%
Portfolio Size 12.9M SF % Joint Ventures (GAV) 44%
Well-Leased Diversified Portfolio
• Tenant-centric investment philosophy
• High-quality portfolio with characteristics attractive to tenants
• Well-located assets in the top urban markets across the United States where
tenants want to be
Moderate Risk Profile
• Weighted average lease expiration of 6.8 years 3
• Lease maturities are staggered
• Debt level below benchmark
• Laddered debt maturities with minimal refinancing risk
• Strategic line of credit primarily reserved for liquidity management
Limited non-core/development exposure
• 6.1% of Fund GAV is invested in non-core properties (7.6% of Fund NAV)
1The Equinix Bonds are categorized as four separate investments, one for each tranche.2Excludes properties in initial lease-up and development.3As of 3/31/2019.

ASB Real Estate Investments
ASB A l leg iance Real Es ta te Fund
91%
9%
Urban Office
Inner-ringUrban Office
Investment Attributes
• Walkable submarkets with sustainable economies with mass-transit
• Urban locations that help attract and retain top talent
• Creative buildings feature “inspired” workspaces with natural light, high ceilings and open, flexible
floor plates
P R O P E R T Y S U B T Y P E ( % o f O f f i c e G A V ) *
K E Y O F F I C E P O R T F O L I O M E T R I C S
Fund’s GAV $2.4B % LEED 31%
NAV $1.9B Walk Score 90
No. of Investments 22 Total Rentable SF 3.3M
Operating Occupancy* 93%
M S A D I V E R S I F I C A T I O N ( T o p 5 G A V )
Urban, Creative Office – Overview
18
*Excludes properties in initial lease-up and development
12%
14%
15%
19%
26%
0% 10% 20% 30%
Denver
New York
Boston
Washington
San Francisco

ASB Real Estate Investments
ASB A l leg iance Real Es ta te FundRepresentative Office Investments
19
333 S um m er S t . , B os ton , MA Hardwar e B lock , Denve r Co
455 Mass A ve . , W ash ing ton , DC 799 Mark e t , S an F ranc i sco , CA
De Haro P lace , S an F ranc i sco , CA989 Mark e t , S an F ranc i sco , CA625 B roadwa y , New York , NY
The investments shown above are not a complete representation of the respective property type investments and not all investments will have the characteristics of those shown here. For a complete list of investments, please refer to the
“Portfolio Summary” section located in the Appendix of this presentation.

ASB Real Estate Investments
ASB A l leg iance Real Es ta te Fund
91%
9%UrbanMultifamily
WorkforceMultifamily
Investment Attributes
• Walkable mixed-use submarkets
• Easy access to mass-transit and short
commute to employment hubs
P R O P E R T Y S U B T Y P E (% o f Mu l t i f a m i l y GA V ) *
K E Y M U L T I F A M I L Y P O R T F O L I O M E T R I C S
Fund’s GAV $1.5B Units 3,256
NAV $1.0B Walk Score 79
No. of Investments 14 Total Rentable SF 2.7M
Operating Occupancy* 91%
M S A D I V E R S I F I C A T I O N ( T o p 5 G A V )
Urban Multifamily – Overview
20
*Excludes properties in initial lease-up and development
• Restaurants and amenities
• Attractive fundamentals
• Superior rent growth potential
6%
8%
15%
23%
40%
0% 25% 50%
Seattle
Minneapolis
Washington
Los Angeles
Boston
ASB Real Estate Investments
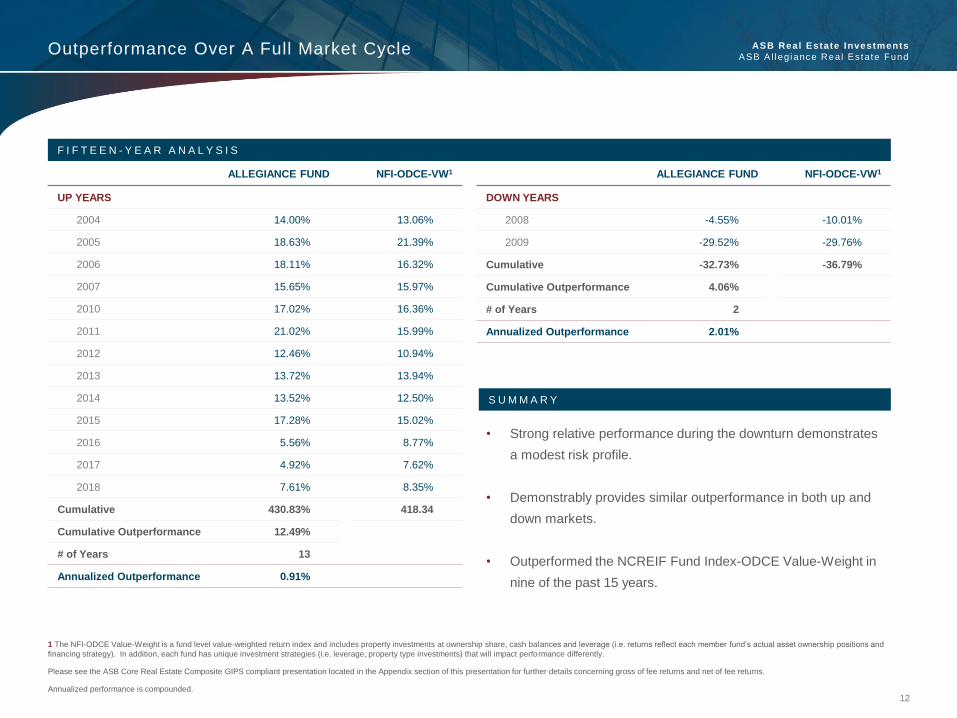
ASB A l leg iance Real Es ta te FundRepresentative Multifamily Investments
21
B lue , Minneap o l i s , MN L im e , Minnea po l i s , MN
Gibson S an ta Mon i ca , S an ta Mon i ca , CA 333 Frem on t , S an F ranc i sco , CA
Green D i s t r i c t , B os ton , MA S ta t i on Land ing , B os ton , MA
W ate rMark e , Los A nge les , CA
S edona S la te , W ash ing ton , DC
The investments shown above are not a complete representation of the respective property type investments and not all investments will have the characteristics of those shown here. For a complete list of investments, please refer to the
“Portfolio Summary” section located in the Appendix of this presentation.

ASB Real Estate Investments
ASB A l leg iance Real Es ta te Fund
18%
36%46%
IndustrialProduction
Logistics
Senior DataCenter Bonds
Investment Attributes
• Industrial Warehouse
— Distribution space in close-in, high-
barrier submarkets
— Key drivers: Time-sensitive
consumer demand in strong
population centers
P R O P E R T Y S U B T Y P E ( % o f I n d u s t r i a l G A V ) *
K E Y I N D U S T R I A L P O R T F O L I O M E T R I C S
Fund’s GAV $1.3B Operating Occupancy1 96%
NAV $1.2B % JV (NAV) 16%
No. of Investments2 16 % Manage-to-core 0%
Total Rentable SF 4.2M
M S A D I V E R S I F I C A T I O N ( T o p G A V ) 3
Industrial – Overview
22
• Hi-Tech R&D and Production
— Hybrid office, R&D and production space in
San Francisco
— Walkable urban locations catering to
knowledge workers
• Data Storage
─ Critical infrastructure: Fiber network,
power, cooling
─ Key drivers: Global growth in digital content
1Excludes properties in initial lease-up and development.2The Equinix Bonds are categorized as four separate investments, one for each tranche.3Does not include Senior Data Center Bonds.
7%
9%
15%
21%
33%
0% 10% 20% 30% 40%
Boston
Miami
Houston
New York
San Francisco

ASB Real Estate Investments
ASB A l leg iance Real Es ta te Fund
H ia l eah Gardens , Miam i , FL
Cader Lane , S an F ranc i sco , CAS unse t P a rk , B rook l yn , NY
1000 T ech , B os ton , MA
1201 B ryan t , S an F ranc i sco , CA
Representative Industrial Investments
23
1400 16 t h , S an F ranc i sco , CA
The investments shown above are not a complete representation of the respective property type investments and not all investments will have the characteristics of those shown here. For a complete list of investments, please refer to the
“Portfolio Summary” section located in the Appendix of this presentation.
A lam o C ross i ng , Hous ton , T X
ASB Real Estate Investments
ASB A l leg iance Real Es ta te Fund
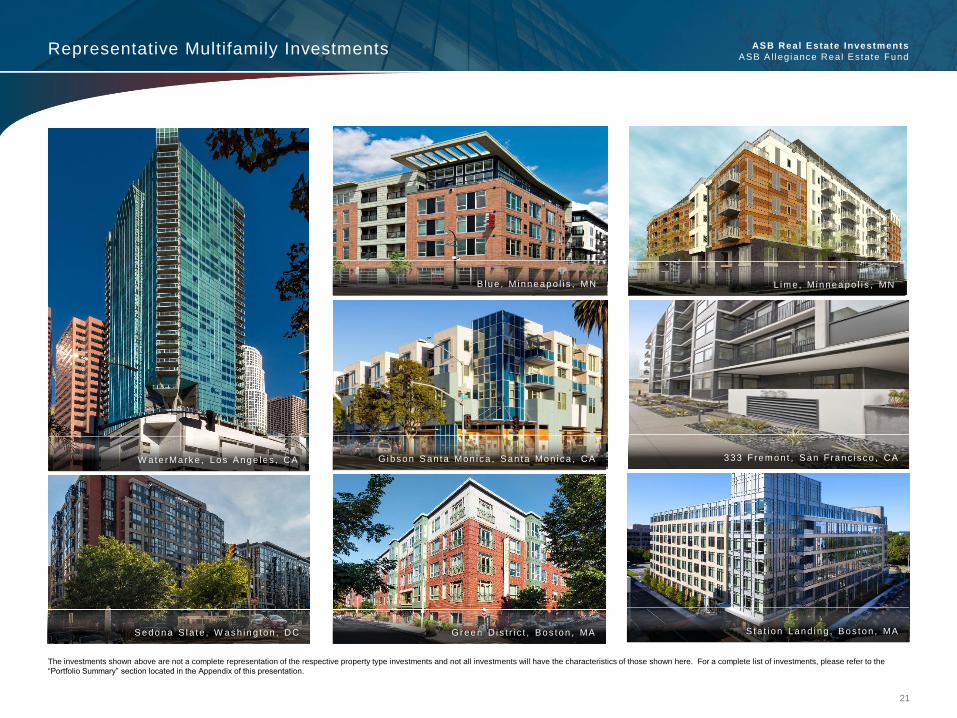
Investment Attributes
• Urban density and strong foot traffic drive
sales
• High visibility achieves marketing objectives
• Limited ground-floor availability creates
barriers
95%
5%
Urban Retail
CommunityRetail Center
P R O P E R T Y S U B T Y P E ( % o f R e t a i l G A V )
K E Y R E T A I L P O R T F O L I O M E T R I C S
Fund’s GAV $1.8B Average Market Rent PSF $71
NAV $1.6B Walk Score 94
No. of Investments 28 Total Rentable SF 1.4M
Operating Occupancy* 90%
M S A D I V E R S I F I C A T I O N ( T o p 5 G A V )
• Relative affordability creates value
proposition
• Avoids grocery-anchored binary risk
• No mall or power center exposure
Urban Retail – Overview
24
*Excludes properties in initial lease-up and development
8%
10%
15%
19%
36%
0% 10% 20% 30% 40%
San Francisco
Boston
Los Angeles
Chicago
New York

ASB Real Estate Investments
ASB A l leg iance Real Es ta te FundRepresentative Retail Investments
25
V en i ce P o r t f o l i o , Los A nge les , CA 415 W B roadwa y , New York , NY
6904 Ho l l ywo od , Los A nge les , CA Greene S t ree t , New York , NY
Co lo rado Cen te r Re ta i l , Denve r , CO 10 S S ta te , Ch i cago , IL
200 P owe l l , S an F ranc i sco , CA
B ack B ay P o r t f o l i o , B os ton , MA
The investments shown above are not a complete representation of the respective property type investments and not all investments will have the characteristics of those shown here. For a complete list of investments, please refer to the
“Portfolio Summary” section located in the Appendix of this presentation.
120 Nor th 6 t h , New York , NY

ASB Real Estate Investments
ASB A l leg iance Real Es ta te Fund
Investment Attributes
• Small leases translate to significant credit diversity
• Limited ongoing capital requirements
• Excellent trade area fundamentals heighten performance
• Modern facilities garner higher rents and better income growth
• Increasing institutional interest pushes investor demand
K E Y S E L F - S T O R A G E P O R T F O L I O M E T R I C S
Fund’s GAV $0.4B Average Market Rent PSF $26
NAV $0.4B Units 15,802
No. of Investments 2 Total Rentable SF 1.3M
No. of Properties 161 Operating Occupancy2 73%
M S A D I V E R S I F I C A T I O N
Self-Storage – Overview
261As of 6/30/2019, ASB’s self-storage portfolio was comprised of 16 properties. Three additional properties are expected to close during the third quarter of 2019.2Excludes properties in initial lease-up and development
31%
24%
17%
13%
9%
5%
0%
10%
20%
30%
40%
New York Miami Denver Los Angeles Phoenix San Diego

ASB Real Estate Investments
ASB A l leg iance Real Es ta te Fund
32.3%
24.2%
19.9%
17.6%
5.9%
0%
5%
10%
15%
20%
25%
30%
35%
40%
Office Retail Residential Industrial Self-Storage
ASB Allegiance Fund NFI-ODCE
Asset Type Composition Overview (GAV)
27
% Δ YoY -2.2% -2.5% -0.0% +1.9% +2.8%
Reductions in office and retail exposure and increased allocations to self-storage and industrial
reflect strategic priorities.

ASB Real Estate Investments
ASB A l leg iance Real Es ta te FundNCREIF Subregion Composition Overview (GAV)
28
% Δ YoY -4.2% +2.8% -1.3% -0.2% -0.7% +2.3% +1.4% -0.2%
N C R E I F S U B R E G I O N D I V E R S I F I C A T I O N ( G A V )
Near-term objective is to increase allocation to Pacific region markets.
36.9%
31.0%
11.6%
6.6%
5.7%4.2%
2.3% 1.7%
0.0%
5.0%
10.0%
15.0%
20.0%
25.0%
30.0%
35.0%
40.0%
Northeast Pacific Mid-Atlantic Mountain East Central Southeast Southwest West Central
ASB Allegiance Fund NFI-ODCE

ASB Real Estate Investments
ASB A l leg iance Real Es ta te FundDispositions (TTM)
29
ASB undertakes a highly proactive and disciplined sales approach to acknowledge new threats, respond
to overly aggressive pricing and divest uncompetitive assets.
In addition to leasing and asset management, the Fund’s investment activity continues to position the
portfolio for superior long-term performance.
Asset Date Type MSA Square feet Price ($M)
400 Madison 10/24/2018 Office New York 175,408 $194.5
Alaska CargoPort 1/2/2019 Industrial Anchorage 112,823 $14.5
Fulton Market (Partial Sale) 1/25/2019 Retail Chicago 14,486 $7.5
Station Landing (Partial Sale) 3/15/2019 Residential Boston 14,879 $1.7
875 Washington 4/29/2019 Retail New York 62,618 $129.5
TOTAL 380,214 $347.7

ASB Real Estate Investments
ASB A l leg iance Real Es ta te FundRecent Acquisitions (TTM)
30
All recent acquisitions reflect the Allegiance Fund’s strategic focus on assets with unique competitive advantages
located in supply-constrained, vibrant urban markets.
The Allegiance Fund will engage in orderly redeployment of sale proceeds into investments with accretive income
and compelling risk-adjusted returns.
Asset Date Type MSA Square feet Price ($M)
1490 Cader Lane 7/26/2018 Industrial San Francisco 94,000 $18.9
Corte Bella 8/29/2018 Residential Los Angeles 212,848 $85.8
StorQuest Portfolio II 9/12/2018 Self-Storage Various 462,648 $158.0
Alamo Crossing 9/28/2018 Industrial Houston 1,047,797 $99.9
La Mesa (StorQuest I) 11/8/2018 Self-Storage San Diego 77,862 $21.1
West Babylon (StorQuest II) 11/30/2018 Self-Storage New York 65,998 $25.1
Middlesex Logistics Center 11/16/2018 Industrial New Jersey 570,100 $83.0
Keystone Industrial Portfolio 11/19/2018 Industrial Philadelphia 475,910 $42.0
79 North 4/25/2019 Industrial Pittsburgh 407,720 $38.0
Leland James 5/8/2019 Office Portland 117,591 $67.5
Bridge Point Riverbend 5/24/2019 Industrial Miami 221,542 $38.2
8800 Adamo 6/13/2019 Industrial Tampa 368,664 $26.3
TOTAL 4,122,680 $703.8

ASB Real Estate Investments
ASB A l leg iance Real Es ta te Fund2019 Investment Objectives and Outlook
31
Continue to remain an active portfolio manager through investment and leasing activity
• Focus on income-growth driven by leasing success
─ $17 million in 2019 commencements from executed leases
─ Over $32 million in additional NOI upside from stabilizing value-add investments
─ Up to $27* million in additional upside from unlocking below-market rents
• Source compelling acquisitions with superior income durability and long-term NOI growth outlook
─ Industrial: Close-in logistics assets in high-barrier, supply-chain centric submarkets
─ Multifamily: Workforce and Class A in supply-constrained markets with growth drivers
• Pursue strategic sales for top disposition targets
─ Washington D.C. and New York retail and New York office
• Maintain Fund’s moderate leverage profile
*As of 3/31/19

ASB Real Estate Investments
ASB A l leg iance Real Es ta te Fund
32
A. Firm Governance
B. Investment Process
C. Portfolio Summary
D. Sustainability
E. ASB Allegiance Real Estate Fund Gross and Net Returns and GIPS Compliance Charts

ASB Real Estate Investments
ASB A l leg iance Real Es ta te Fund
33
Sunset Electric | Seattle, WA

ASB Real Estate Investments
ASB A l leg iance Real Es ta te FundFund Governance
34
A S B I N V E S T M E N T C O M M I T T E E
Primary Allegiance Fund Decision-Makers
David Quigley, Chief Investment Officer & Investment Committee Chair
• Robert B. Bellinger, President & CEO
• Jim Darcey, Managing Director
• Larry Braithwaite, SVP & Portfolio Manager
• Brodie Ruland, SVP, Northeast Region
• Nick Franzetti, SVP, Southeast/Midwest Region
• Aaron Duncan, SVP, West Region
• Brendan Reed, General Counsel
• Paul Duncan, Chief Compliance Officer (non-voting)
R E A L E S T A T E I N V E S T M E N T A D V I S O R Y C O M M I T T E E ( R E I A C ) I N V E S T O R A D V I S O R Y C O M M I T T E E ( I A C )
REIAC Responsibilities: Review and provide independent advice, industry expertise and guidance IAC Responsibilities: Review, consult and provide consent
‒ Major decision rights (majority approval
required)
‒ New investment commitments
‒ Dispositions/Financings
‒ Changes to portfolio investment strategy
‒ Quarterly portfolio reviews
‒ Changes to Investment Policy
‒ Appraisal firm recommendations
‒ Transactions not authorized by the Partnership Agreement
‒ Retention, services and fees of ASB affiliates
‒ Potential conflicts of interest
‒ Consents required by law or the Partnership Agreement
Independent Directors
• Philip Caraci, Saul Centers*
• Philip J. Mudd, DTZ
• Joyce R. Frater, Morgan Stanley*
• F. Joseph Moravec, GSA*
• Rebecca Owen, Clark Enterprises, Inc.
* Retired
ASB Capital Management Directors
• Peter M. Welber, Chevy Chase Trust
• Christine Nicolaides Kearns, Saul Organization
• Robert B. Bellinger, ASB Real Estate Investments
Non-Voting Directors
• Jim Darcey, ASB Real Estate Investments
• David Quigley, ASB Real Estate Investments
Investor Representatives
• Robert Alvarado, Northern California Carpenters
• Bruce Dunn, Ohio Bureau of Workers Compensation
• Kenneth Cooper, International Brotherhood of Electrical Workers
• Anthony Breault, Oregon Public Employees Retirement Fund
• Daryn Miller, Kern County Employees’ Retirement Association
ASB Real Estate Investments
ASB A l leg iance Real Es ta te Fund
35
Two Financial Center | Boston, MA

ASB Real Estate Investments
ASB A l leg iance Real Es ta te FundInvestment Process - Research
36
• Operating Partners
• Appraisal Firms
• Intermediaries
─ Investment Brokers
─ Leasing Agents
─ Capital Brokers
─ Lenders
Data Sources
• Focus on real estate fundamentals and capital markets
• Identify/Target MSA’s
Liquidity
Competitive
Threats
Economic
Trajectory
Occupancy
Performance
HH Formation
Rent Growth
Outlook
Absorption Trends
Supply Pipeline
Macro Trends
Employment
Composition &
Growth
Partner Track
Record & Expertise
Submarket Growth
Trajectory
Asset Competitive
Positioning
Return Drivers
Tenant
Demand Drivers
Income
Stability
• Leverage direct local network of over 2,500 professionals
• Underwrite a specific asset/geography
Investment Conviction

ASB Real Estate Investments
ASB A l leg iance Real Es ta te FundInvestment Process
37
Sourcing Initial Review
Letter Of IntentDue Diligence & Closing
● Negotiate definitive/acceptable pricing
● Formulate terms and structure
● Partner aligned with co-invest and incentivized through
back-end economics
● Legal review
● Approved by Investment Officer, Portfolio Manager,
CIO, and CIG MD
● Execute LOI
● Consistent off-market or repeat business through our
sourcing contacts/network
● Repeat investment in target markets enhances
acquisitions judgment
● Partner product knowledge and geographic expertise
shape opportunity
● Thorough due diligence conducted by ASB’s
Capital Investments Group staff
● Third-party physical and environmental study
● Detailed investment committee memo drafted
● Due diligence checklist
● Closing
BI -W EEKLY PIPELINE | B I -W EEKLY INVESTMENT COMMITTEE | REIAC PREVIEW AND FINAL APPROVAL | B I -W EEKLY LEASING
● Preliminary analysis of investment, market and operator
─ Site inspection
─ Financial projections
─ Market and location analysis
─ Assessment of real estate improvements
─ Review investment terms/capitalization
─ Prepare investment committee memo
● All-hands vetting discussion during pipeline
● Investment Committee vote
● Preliminary investment memo produced
● Investment allocation

ASB Real Estate Investments
ASB A l leg iance Real Es ta te Fund
38
1400 16th | San Francisco, CA

ASB Real Estate Investments
ASB A l leg iance Real Es ta te FundCurrent Portfolio Investments (East)
39
Investment Name City State MSA Type Rentable SF Allegiance NAV
East
Two Financial Center Boston MA Boston Office 217,763 $189,151,491
Station Landing - Residential Medford MA Boston Residential 424,009 $145,392,795
455 Massachusetts Ave Washington DC Washington Office 243,362 $131,633,735
Greene Street New York City NY New York Retail 42,950 $110,666,914
Back Bay Retail Portfolio Boston MA Boston Retail 51,565 $108,539,922
The Peninsula Boston MA Boston Residential 283,762 $108,432,951
625 Broadway New York City NY New York Office 93,839 $102,721,686
Williamsburg Portfolio II Brooklyn NY New York Retail 43,005 $99,900,743
168 Canal New York City NY New York Retail 51,719 $89,934,776
The Green District Portfolio Boston MA Boston Residential 209,214 $87,894,538
64 New York Washington DC Washington Office 355,034 $82,739,401
Sedona Arlington VA Washington Residential 214,704 $66,934,530
61 Crosby New York NY New York Retail 32,400 $65,306,799
Slate Arlington VA Washington Residential 151,535 $60,306,213
465 Broadway New York City NY New York Retail 9,339 $56,472,877
415 W. Broadway New York City NY New York Retail 40,595 $53,186,878
7 W. 18th New York NY New York Office 48,875 $52,797,418
333 Summer Boston MA Boston Office 117,801 $52,573,701
155 Mercer New York NY New York Retail 14,589 $51,862,017

ASB Real Estate Investments
ASB A l leg iance Real Es ta te FundCurrent Portfolio Investments (East Cont.)
40
Investment Name City State MSA Type Rentable SF Allegiance NAV
East
320 Summer Boston MA Boston Office 108,667 $50,353,461
Williamsburg Portfolio I Brooklyn NY New York Retail 29,157 $49,946,684
West 27th New York NY New York Office 118,766 $48,293,721
1000 Tech Drive Stoughton MA Boston Industrial 332,676 $47,852,942
Middlesex Logistics Center Edison NJ New York Industrial 570,100 $47,486,569
Dobbin Center Columbia MD Baltimore Retail 126,425 $45,626,846
Keystone Industrial Portfolio Bristol PA Philadelphia Industrial 475,910 $43,323,668
Prince William Square Woodbridge VA Washington Retail 232,957 $39,008,418
801 N. Capitol Washington DC Washington Office 87,883 $38,152,557
Station Landing - Retail Medford MA Boston Retail 119,301 $37,522,039
120 Greenwich New York NY New York Retail 4,653 $31,437,120
Sunset Park Brooklyn NY New York Industrial 209,853 $29,190,206
120 N. 6th Williamsburg NY New York Retail 7,500 $22,332,069
79 North Sewickley PA Pittsburgh Industrial 407,720 $19,254,106
3299 M Georgetown DC Washington Retail 3,300 $7,238,034
Total 5,480,928 $2,273,467,826

ASB Real Estate Investments
ASB A l leg iance Real Es ta te FundCurrent Portfolio Investments (South)
41
Investment Name City State MSA Type Rentable SF Allegiance NAV
South
Senior Data Center Bonds Industrial - $624,067,442
StorQuest Portfolio II Miami FL Miami Self-Storage 528,394 $188,653,011
Design District - 70 NE 39th Miami FL Miami Retail 9,023 $53,490,048
Alamo Crossing Houston TX Houston Industrial 1,047,797 $50,387,302
The Park on Bluebonnet Baton Rouge LA Baton Rouge Residential 358,608 $50,267,392
Bridge Point Riverbend Fort Lauderdale FL Miami Industrial 221,627 $38,295,970
605 Lincoln Miami Beach FL Miami Retail 9,268 $35,481,696
8800 Adamo Tampa FL Tampa Industrial 368,664 $26,307,323
215 SE Tenth Hialeah FL Miami Industrial 301,983 $25,925,528
Total 2,845,364 $1,092,875,712

ASB Real Estate Investments
ASB A l leg iance Real Es ta te FundCurrent Portfolio Investments (Midwest)
42
Investment Name City State MSA Type Rentable SF Allegiance NAV
Midwest
15 E. Oak Chicago IL Chicago Retail 94,700 $181,390,630
10 S. State Chicago IL Chicago Retail 56,109 $71,217,967
Blue Minneapolis MN Minneapolis Residential 193,293 $66,223,833
Fulton Market Portfolio Chicago IL Chicago Retail 91,388 $53,923,351
Lime Minneapolis MN Minneapolis Residential 136,843 $48,916,931
Total 572,333 $421,672,713

ASB Real Estate Investments
ASB A l leg iance Real Es ta te FundCurrent Portfolio Investments (West)
43
Investment Name City State MSA Type Rentable SF Allegiance NAV
West
StorQuest Portfolio I Denver CO Denver Self-Storage 778,392 $246,200,602
799 Market San Francisco CA San Francisco Office 138,953 $184,584,115
De Haro Place San Francisco CA San Francisco Office 136,481 $169,144,642
At Mateo Los Angeles CA Los Angeles Office 193,750 $159,378,160
1201 Bryant San Francisco CA San Francisco Industrial 139,154 $136,219,669
795 Folsom San Francisco CA San Francisco Office 189,533 $128,727,866
989 Market San Francisco CA San Francisco Office 111,337 $113,140,992
Colorado Center Office Denver CO Denver Office 502,429 $110,103,515
1400 16th San Francisco CA San Francisco Industrial 103,213 $101,512,565
Colorado Center Tower III Denver CO Denver Office 227,921 $97,017,618
Gibson Santa Monica Santa Monica CA Los Angeles Residential 75,712 $85,204,323
WaterMarke Tower Los Angeles CA Los Angeles Residential 254,326 $80,031,673
333 Fremont San Francisco CA San Francisco Residential 67,093 $63,997,722
Venice Portfolio Venice CA Los Angeles Retail 21,354 $63,281,197
Leland James Portland OR Portland Office 117,591 $61,548,166

ASB Real Estate Investments
ASB A l leg iance Real Es ta te FundCurrent Portfolio Investments (West Cont.)
44
Investment Name City State MSA Type Rentable SF Allegiance NAV
West
1755 Blake Denver CO Denver Office 112,943 $60,454,065
REO Flats Seattle WA Seattle Residential 68,218 $50,520,278
River East Portland OR Portland Office 99,715 $48,417,325
Sunset Electric Seattle WA Seattle Residential 60,695 $41,383,402
6904 Hollywood Hollywood CA Los Angeles Retail 44,821 $37,508,299
200 Powell Street San Francisco CA San Francisco Retail 7,800 $35,417,489
Colorado Center Retail Denver CO Denver Retail 121,133 $34,928,724
Corte Bella Fountain Valley CA Los Angeles Residential 212,728 $32,880,246
Beverly & Robertson West Hollywood CA Los Angeles Retail 18,838 $25,153,815
1010 Flanders Portland OR Portland Office 56,279 $25,130,252
145 N. Robertson West Hollywood CA Los Angeles Retail 12,478 $23,402,414
Hardware Block Denver CO Denver Office 52,191 $21,502,408
1490 Cader Lane Petaluma CA San Francisco Industrial 94,000 $20,480,992
1640 5th Street Santa Monica CA Los Angeles Office 36,555 $18,798,943
2014 E. 7th Los Angeles CA Los Angeles Retail 22,818 $14,189,042
131 Robertson Beverly Hills CA Los Angeles Retail 5,000 $9,281,243
Total 4,083,451 $2,299,541,764

ASB Real Estate Investments
ASB A l leg iance Real Es ta te FundHistorical Portfolio Investments
45
East
875 Washington New York NY Retail 62,618 $129.5
400 Madison New York NY Office 175,408 $141.2
Spotsylvania Crossing Fredericksburg VA Retail 144,000 $15.4
Infomart Ashburn Sterling VA Industrial (Data Center) 60,000 $70.9
900 G Street Washington DC Office 112,635 $80.7
Resource America - Nittany Pointe Altoona PA Residential 156 Units $27.9
Teaneck Data Center Teaneck NJ Industrial 55,000 $6.1
Station Landing - Land Boston MA Land N/A $6.3
Station Landing - Office Boston MA Office 158,090 $30.3
Hamilton Park White Plains NY Land N/A $4.5
499 South Pickett Alexandria VA Retail 70,000 $15.4
Swan Creek Glen Burnie MD Industrial 512,430 $24.4
Resource America -KY Lexington KY Residential 300,130 $8.8
Ames Pond Tewksbury MA Office 153,169 $12.5
West Quest Linthicum MD Office 315,350 $49.3
104 West 40th St New York NY Office 201,088 $88.4
Riverside Belcamp MD Industrial 197,248 $9.4
Pencader Newark DE Industrial 184,000 $8.2
Commodore Woolwich NJ Industrial 212,000 $9.3
Newton Place Newton MA Office 168,000 $0.6
Lion Building Washington DC Office 147,000 $6.2
West-X Building Rockville MD Office 112,500 $0.8
Brookfield Land Chantilly VA Office 5.2 Acres $2.1
Ambassador House Washington DC Residential 82 Units $12.0
Stevens Forest Green Columbia MD Office 80,000 $17.0
Chelsea House New York NY Residential Completed 2006 $12.5 (Loan)
Cork Factory Pittsburgh PA Residential 313,486 $50.5
Corporate Ridge Rocky Hill CT Office 103,000 $14.5
Park Central Richmond VA Land 0 $1.0
Total 3,837,152 $843.1
Investment Name City State Type Rentable SF Allegiance NAV

ASB Real Estate Investments
ASB A l leg iance Real Es ta te Fund
46
Investment Name City State Type Rentable SF Allegiance NAV
South
Infomart Dallas Dallas TX Industrial (Data Center) 1,379,000 $781.9
Design District 39th Miami FL Retail 9,400 $46.6
Braelinn Village Atlanta GA Retail 264,880 $26.6
On50 Tampa FL Residential 193,547 $17.2
42 North Tampa FL Residential 157,200 $6.1
Resource America - Tanglewood Court Houston TX Residential 523,139 $4.4
Lincoln Pointe Aventura FL Residential 284 Units $40.0
Mervyn's Data Center Plano TX Data Center/Office 50,000 $15.5
Total 2,577,166 $938.3
Historical Portfolio Investments

ASB Real Estate Investments
ASB A l leg iance Real Es ta te FundHistorical Portfolio Investments
47
Investment Name City State Type Rentable SF Allegiance NAV
Midwest
225 South Sixth Street Minneapolis MN Office 1,401,233 $250.1
Northland Industrial – Land Minneapolis MN Land N/A $0.2
UIRC Portfolio Chicago IL Industrial 1,166,968 $38.3
Laraway Land Parcels – 2015 Chicago IL Land N/A $18.9
Elaine Place Chicago IL Residential 175,550 $22.7
Millennium Bloomington IN Residential 625,550 $39.3
Automatic Lofts Chicago IL Residential 141,431 $41.6
Northland Industrial Brooklyn Park MN Industrial 356,176 $25.7
2040 Lofts Milwaukee WI Residential 213,483 $27.8
Laraway Crossing Joliet IL Industrial 849,564 $28.7
Randall Crossing Elgin IL Industrial 319,043 $19.3
Roseville Industrial Roseville MN Industrial 101,850 $17.4
Woods Mill Pointe St. Louis MO Office 79,616 $10.1
Laraway Land Joliet Il Land N/A $24.8
Crosstown Corp Center Eden Prairie MN Office 59,478 $9.5
Clayton Corporate Center Clayton MO Office 197,957 $31.8
Meridian Lakes I Aurora IL Office 75,000 $16.8
EDS Build to Suit Auburn Hills MI Office 202,000 $11.4
Crossroads Brookfield WI Office 104,000 $8.3
250 S. Gary Carol Stream IL Industrial 439,000 $16.2
545 N. Michigan Avenue Chicago IL Retail/Office 16,000 $14.6
Willow Lake Indianapolis IN Residential 230 Units $5.3
Total 6,523,899 $678.8

ASB Real Estate Investments
ASB A l leg iance Real Es ta te FundHistorical Portfolio Investments
48
Investment Name City State Type Rentable SF Allegiance NAV
West
Alaska CargoPort Anchorage AK Industrial 112,823 $15.4
Infomart Portland Portland OR Industrial (Data Center) 102,867 $275.4
Infomart Silicon Valley San Jose CA Industrial (Data Center) 42,497 $139.9
Urban 5th San Diego CA Retail 17,462 $18.4
Pima Northgate Scottsdale AZ Office 138,751 $27.9
Plaza 360 Oakland CA Office 114,288 $26.3
1315 Lincoln Boulevard Los Angeles CA Office 23,557 $21.5
Playa Vista - Phase III Los Angeles CA Land N/A $29.0
Latitude 34 Los Angeles CA Office 301,642 $130.3
350 Bush and 500 Pine San Francisco CA Land N/A $82.0
11900 East Cornell Aurora CO Industrial 285,840 $54.6
Fox Media Center Los Angeles CA Office 486,673 $136.1
Resource America - The Summit Albuquerque NM Residential 166,660 $2.4
Anchorage Hangarport Anchorage AK Industrial 53,339 $5.4
Toyama Drive Sunnyvale CA Industrial 42,083 $13.6
Resource America - CA Los Angeles CA Residential 31,272 $2.9
Ontario Distribution Center Ontario CA Industrial 150,000 $10.3
Mira Loma (Wineville Building) Mira Loma CA Industrial 151,300 $12.5
Mira Loma (Cantu Galleano Building) Mira Loma CA Industrial 201,000 $16.7
Total 2,422,054 $1,020.6

ASB Real Estate Investments
ASB A l leg iance Real Es ta te FundLease Maturity and Renewal Upside
49
*As of 3/31/2019
**Residential and Self-Storage excluded from lease rollover as apartments and self-storage units typically have one-year leases such that rollover is essentially 100% each year.
***Only stabilized square feet (NCREIF definition).
The Fund’s near-term lease rollover is balanced and modest, and presents $27 million in NOI upside in aggregate.
REAL ESTATE FUND STABILIZED LEASE EXPIRATION SCHEDULE BY SF (COMMERCIAL)
Property Type Rentable SFWA Duration
(Yrs)*% Leased 2019 2020 2021 2022 2023 Thereafter
Industrial 4,240,725 6.9 96.4% 0.2% 2.5% 2.2% 4.8% 2.6% 34.5%
Office 3,184,772 6.1 93.3% 1.0% 3.3% 2.2% 2.0% 3.7% 22.4%
Retail 1,324,854 8.5 90.4% 0.5% 1.2% 0.8% 0.9% 1.9% 7.6%
Total 8,750,351 6.9 92.3% 1.7% 7.0% 5.1% 7.8% 8.2% 64.4%

ASB Real Estate Investments
ASB A l leg iance Real Es ta te FundLeverage Summary
50
Key Debt Statistics
• Total Principal: $1,495 million
− Property Level: $1,245 million
− Line of Credit: $250 million
• Average Duration
− Total: 5.1 years
− Ex-Revolver: 5.1 years
• Average Cost
− Total: 3.86%
− Ex-Revolver: 3.86%
• % Fixed-rate
− Total: 82%
− Ex-Revolver: 82%
T O T A L D E B T M A T U R I T Y S C H E D U L E *
*The revolver portion of the line of credit is excluded from the debt maturity schedule. The revolver balance is $0
as of 6/30/2019. The term loan balance of $250 million will mature March 2023.
46
144
181
53
169
305
99
60
93
250
$0
$100
$200
$300
2020 2021 2022 2023 2024 2025 2026 2027 2028
Mill
ions
Existing Loans Line of Credit: Term Loan
Prudent debt strategy characterized by staggered maturities and limited refinancing risk.

ASB Real Estate Investments
ASB A l leg iance Real Es ta te Fund
51
415 Broadway | New York City, NY

ASB Real Estate Investments
ASB A l leg iance Real Es ta te FundESG Policy
52
ASB Real Estate Investments (“ASBREI”) believes that socially responsible investments take into
consideration environmental, social and governance (“ESG”) issues which can positively impact long-term
performance and reduce risk. We realize that many of our clients, tenants and employees share this interest
with us of implementing practices and procedures that correlate with ESG rational and the fulfilment of our
responsibilities.
To align the firm’s actions with these sustainability concerns, ASBREI has committed to the following sustainability objectives.
• Environment
Reduce utility consumption at both the corporate and investment level.
• Social
Consider the impact of our corporate and investment-level operations on the well-being of our tenants, employees, contractors,
and others.
• Governance
Embrace corporate responsibility, accountability, fairness, and transparency in how we manage our relationships with clients and
investments.
• Resources
Empower an interdisciplinary ESG Team with the technology and resources it needs to consistently advance its ESG objectives.
• Reporting
Provide clients transparency and accountability on its ESG progress through annual reporting to GRESB.

ASB Real Estate Investments
ASB A l leg iance Real Es ta te Fund
53
333 Summer Street | Boston, MA

ASB Real Estate Investments
ASB A l leg iance Real Es ta te FundQuarterly Returns
54
Q U A R T E R L Y R E T U R N S ( P e r i o d s e n d i n g 6 / 3 0 / 1 9 )
9/30 12/31 3/31 6/30 9/30 12/31 3/31 6/30 9/30 12/31 3/31 6/30 9/30 12/31 3/31 6/30 9/30 12/31
1984 1985 1986 1987 1988
Allegiance Gross (%) 3.00 4.74 2.60 2.64 2.71 4.70 2.45 2.36 1.16 2.60 1.17 1.39 1.93 0.53 1.31 1.67 1.84 2.65
Allegiance Net (%) 2.75 4.49 2.35 2.39 2.46 4.45 2.20 2.11 0.91 2.35 0.92 1.14 1.68 0.28 1.06 1.42 1.59 2.40
1989 1990 1991 1992
Allegiance Gross (%) 2.03 2.25 2.23 1.95 1.54 0.60 1.72 1.05 1.62 1.42 1.04 -1.79 0.99 0.35 -0.85 0.69
Allegiance Net (%) 1.78 2.00 1.98 1.70 1.29 0.35 1.47 0.80 1.37 1.17 0.79 -2.04 0.74 0.10 -1.10 0.44
1993 1994 1995 1996
Allegiance Gross (%) 0.98 1.19 1.13 0.69 1.21 1.66 1.51 1.84 0.83 1.17 2.94 2.36 1.77 1.77 1.22 2.23
Allegiance Net (%) 0.73 0.94 0.88 0.44 0.96 1.41 1.26 1.59 0.58 0.92 2.69 2.11 1.52 1.52 0.97 1.98
1997 1998 1999 2000
Allegiance Gross (%) 1.58 2.81 1.74 3.06 1.78 3.09 2.64 2.26 1.75 2.88 3.31 2.28 1.58 2.98 2.62 2.17
Allegiance Net (%) 1.33 2.56 1.49 2.81 1.53 2.84 2.39 2.01 1.50 2.63 3.06 2.03 1.33 2.73 2.37 1.92
2001 2002 2003 2004
Allegiance Gross (%) 3.57 2.24 2.40 2.11 1.37 1.15 1.26 0.92 1.38 1.71 3.23 5.02 2.97 2.59 4.74 3.04
Allegiance Net (%) 3.32 1.99 2.15 1.86 1.12 0.90 1.01 0.67 1.13 1.46 2.98 4.77 2.72 2.34 4.49 2.79
2005 2006 2007 2008
Allegiance Gross (%) 2.43 5.32 3.69 6.05 5.36 3.59 3.77 4.28 1.33 5.08 5.94 2.52 2.55 0.10 -0.66 -6.39
Allegiance Net (%) 2.18 5.09 3.45 5.81 5.12 3.34 3.52 4.04 1.09 4.84 5.70 2.28 2.31 -0.14 -0.90 -6.63
2009 2010 2011 2012
Allegiance Gross (%) -13.49 -8.01 -4.58 -7.20 -0.37 3.90 9.54 3.21 6.72 4.47 3.04 5.34 3.33 2.59 3.36 2.63
Allegiance Net (%) -13.72 -8.24 -4.83 -7.45 -0.62 3.65 9.29 2.96 6.48 4.22 2.80 5.10 3.09 2.36 3.12 2.40
2013 2014 2015 2016
Allegiance Gross (%) 2.60 2.38 5.02 3.08 2.75 2.65 3.85 3.64 2.77 5.20 2.69 5.64 1.57 1.33 1.77 0.78
Allegiance Net (%) 2.37 2.14 4.78 2.84 2.51 2.41 3.61 3.40 2.53 4.96 2.45 5.40 1.34 1.10 1.54 0.55
2017 2018 2019
Allegiance Gross (%) 1.33 0.66 0.79 2.06 2.00 1.99 1.96 1.45 2.01 1.40
Allegiance Net (%) 1.10 0.43 0.56 1.83 1.76 1.76 1.73 1.22 1.78 1.16
1Assumes a 0.93% annualized fee for the most recent quarter, which is the weighted average of all current Fund holders, charged quarterly. Actual fees are used to calculate the Fund's net returns from
1991 to the present, and for periods before 1991, net returns have been calculated using a modeled fee based upon the highest stated fee at the time. Past performance is no guarantee of future results.
Inception was June 1, 1984.2Please see the ASB Core Real Estate Composite GIPS compliant presentation located in the Appendix section of this presentation.
All performance is presented gross of investment fees through 6/30/19, as of the Fund's Inception date of June 1984.
Past performance is not necessarily indicative of future results. The advisory fees and any other expenses the Fund may incur in the management of its investment advisory account will reduce client returns. Part II of ASB Capital Management's Form ADV describes the investment advisory fees.
On a net of fees basis, the Allegiance Fund returned an annualized 7.18% since inception; NCREIF's NFI-ODCE Value Weight Index returned 6.39% since inception.

ASB Real Estate Investments
ASB A l leg iance Real Es ta te FundAnnualized, Calendar Year Returns
55
A N N U A L I Z E D R E T U R N S ( P e r i o d s e n d i n g 6 / 3 0 / 1 9 )
1 YR 2 YR 3 YR 4 YR 5 YR 7 YR 10 YR 15 YR 20 YR
SINCE
INCEPT.
Allegiance Gross (%) 7.00 7.00 6.20 7.54 9.25 10.25 10.16 8.70 8.95 8.22
NFI-ODCE Gross (%) 6.41 7.42 7.57 8.62 9.76 10.52 9.88 8.01 8.35 7.43
Allegiance Net (%) 6.02 6.03 5.23 6.56 8.25 9.24 9.14 7.69 7.92 7.18
C A L E N D A R Y E A R R E T U R N S ( 1 9 8 5 - 2 0 1 8 )
1985 1986 1987 1988 1989 1990 1991 1992 1993
Allegiance Gross (%) 13.24 8.84 5.11 7.68 8.73 4.99 2.27 1.17 4.04
NFI-ODCE Gross (%) 9.36 6.73 6.74 7.32 6.71 1.41 -6.24 -5.49 0.55
Allegiance Net (%) 12.14 7.78 4.08 6.63 7.67 3.96 1.26 0.17 3.02
1994 1995 1996 1997 1998 1999 2000 2001 2002
Allegiance Gross (%) 6.37 7.48 7.17 9.49 10.14 10.60 9.68 10.71 4.79
NFI-ODCE Gross (%) 6.14 7.11 11.71 15.11 16.42 13.17 14.28 5.64 5.54
Allegiance Net (%) 5.33 6.43 6.12 8.42 9.07 9.53 8.61 9.64 3.75
2003 2004 2005 2006 2007 2008 2009 2010 2011
Allegiance Gross (%) 11.79 14.00 18.63 18.11 15.65 -4.55 -29.52 17.02 21.02
NFI-ODCE Gross (%) 9.28 13.06 21.39 16.32 15.97 -10.01 -29.76 16.36 15.99
Allegiance Net (%) 10.71 12.90 17.54 17.04 14.59 -5.45 -30.26 15.90 19.90
2012 2013 2014 2015 2016 2017 2018
Allegiance Gross (%) 12.46 13.72 13.52 17.28 5.56 4.92 7.61
NFI-ODCE Gross (%) 10.94 13.94 12.50 15.02 8.77 7.62 8.35
Allegiance Net (%) 11.43 12.67 12.47 16.20 4.60 3.97 6.63
1Assumes a 0.93% annualized fee for the most recent quarter, which is the weighted average of all current Fund holders, charged quarterly. Actual fees are used to calculate the
Fund's net returns from 1991 to the present, and for periods before 1991, net returns have been calculated using a modeled fee based upon the highest stated fee at the time.
Past performance is no guarantee of future results. Inception was June 1, 1984.2Please see the ASB Core Real Estate Composite GIPS compliant presentation located in the Appendix section of this presentation.
All performance is presented gross of investment fees through 6/30/19, as of the Fund's Inception date of June 1984.
Past performance is not necessarily indicative of future results. The advisory fees and any other expenses the Fund may incur in the management of its investment advisory account will reduce client returns. Part II of ASB Capital Management's Form ADV describes the investment advisory fees.
On a net of fees basis, the Allegiance Fund returned an annualized 7.18% since inception; NCREIF's NFI-ODCE Value Weight Index returned 6.39% since inception.

ASB Real Estate Investments
ASB A l leg iance Real Es ta te FundGIPS Compliance
56
ASB Capital Management LLC, ASB Real Estate Investments, ASB Allegiance Real Estate Fund
Year
Income
Return
Capital
Return TOTAL
NFI-ODCE
Index
Benchmark
TOTAL3
Income
Return
Capital
Return TOTAL
NFI-ODCE
Index
Benchmark
TOTAL3
Net Assets
(USD Millions)
External
Valuation Accounts
2009 2.7% -31.4% -29.5% -29.8% 1.8% -31.4% -30.3% -30.4% 1,076.538$ 100% 1 7,303.3$ 14.7%
2010 5.8% 10.7% 17.0% 16.4% 4.7% 10.7% 15.9% 15.3% 1,241.694$ 100% 1 8,077.1$ 15.4%
2011 5.2% 15.1% 21.0% 16.0% 4.2% 15.1% 19.9% 15.0% 1,640.820$ 100% 1 9,010.2$ 18.2%
2012 5.1% 7.0% 12.5% 10.9% 4.1% 7.0% 11.4% 9.8% 2,128.295$ 100% 1 12,833.3$ 16.6%
2013 4.3% 9.1% 13.7% 13.9% 3.3% 9.1% 12.7% 12.9% 3,174.002$ 100% 1 16,700.4$ 19.0%
2014 4.2% 9.0% 13.5% 12.5% 3.2% 9.0% 12.5% 11.5% 4,058.856$ 100% 1 19,391.9$ 20.9%
2015 3.5% 13.4% 17.3% 15.0% 2.5% 13.4% 16.2% 14.0% 5,050.916$ 100% 1 21,311.5$ 23.7%
2016 3.2% 2.3% 5.6% 8.8% 2.2% 2.3% 4.6% 7.8% 5,846.095$ 100% 1 23,589.4$ 24.8%
2017 3.4% 1.5% 4.9% 7.6% 2.5% 1.5% 4.0% 6.7% 5,839.066$ 100% 1 27,468.7$ 21.3%
2018 3.2% 4.3% 7.6% 8.3% 2.2% 4.3% 6.6% 7.4% 5,927.981$ 100% 1 25,028.5$ 23.7%
Annualized Since Inception Time-Weighted Return as of 3/31/20191: Annualized Since Inception Time-Weighted Return as of 3/31/20191:
6.1% 2.0% 8.2% 7.5% 5.1% 2.0% 7.2% 6.4%
Notes:
5) Actual fees are used to calculate the Fund's net returns from 1991 to the present, and for periods before 1991, net returns have been calculated using a modeled fee based upon the highest stated fee at the time.
ASB Capital Management LLC Schedule of Performance Results
ASB Core Real Estate Composite 2
January 1, 2009 through March, 2019
Year-End
ASB Core Real Estate Composite
YE Firm Total
Net Assets
(USD Millions)
Percent
of Firm's
Assets
1) Tracks returns for the NFI- ODCE Value- Weight index and the Fund since the Fund's inception in June 1984. Income and Capital Returns are based on 12/31/1984 reporting start date.
2) The ASB Core Real Estate Composite was formerly known as the ASB Allegiance Real Estate Fund Composite. The name change became effective 12/31/2013.
3) The ASB Allegiance Fund’s benchmark for performance is the NCREIF Fund Index - Open- End Diversified Core Equity (NFI- ODCE). This Index is a fund level capitalization- weighted, time- weighted return index and includes property
investments at ownership share, cash balances and leverage (i.e. returns reflect each member fund’s actual asset ownership positions and financing strategy). As of March 31, 2009, the Fund changed its benchmark from the NPI to the NFI-
ODCE.
4) Past performance is not necessarily indicative of future results.
Gross-of-Fees Returns Net-of-Fees Returns

ASB Real Estate Investments
ASB A l leg iance Real Es ta te FundGIPS Compliance
57
ASB Capital Management LLC, ASB Real Estate Investments, ASB Allegiance Real Estate Fund
Compliance Statement - ASB Capital Management LLC claims
compliance with the Global Investment Performance Standards
(GIPS®) and has prepared and presented this report in
compliance with the GIPS standards. ASB Capital Management
LLC has been independently verified for the period 12/01/99-
6/30/17.
Verification assesses whether (1) the firm has complied with all
the composite construction requirements of the GIPS standards
on a firm-wide basis and (2) the firm’s policies and procedures
are designed to calculate and present performance in compliance
with the GIPS standards. The ASB Core Real Estate Composite
has been examined for the periods 12/01/99-06/30/17. The
verification and performance examination reports are available
upon request.
Definition of the Firm - For the purposes of applying the GIPS
Standards, the firm is defined as ASB Capital Management LLC,
an independent registered investment adviser. The firm was
founded in 1983, and specializes in providing equity, fixed income
and real estate investment management to institutional
investors. The firm adopted the GIPS standards for all periods of
performance beginning 01/01/1993. The firm has chosen to be
GIPS verified as of 12/1/1999. The Firm exercises full discretion
over the selection, capitalization, asset management, and
disposition of investments in wholly-owned properties and joint
ventures. The firm maintains a complete list and description of
composites, which is available upon request.
The ASB Core Real Estate Composite - The ASB Core Real
Estate Composite includes a single open-end commingled real
estate equity fund managed by the Firm with a core investment
and risk strategy. Portfolio management invests in a portfolio of
properties located in major markets within the United States
diversified by property type. The Firm will target a moderate level
of leverage between 15% and 25% with a maximum allowable
level of 40%. The Firm may invest in properties with value-add
characteristics on a select basis. Real estate investments are
generally illiquid, and the investment outlook may change given
the availability of credit or other financing sources. This
composite is measured against the NFI- ODCE Value Weighted
Index.
The ASB Core Real Estate Composite was formerly known as the
ASB Allegiance Real Estate Fund Composite. The name change
became effective 12/31/2013. The composite creation date and
the Fund’s inception date are June 1984.
Valuation - Assets are valued quarterly by the Firm and
appraised at least annually by an independent Member of the
Appraisal Institute. Both the internal and the external property
valuations rely primarily on the application of market discount
rates to future projections of free cash flows (un-leveraged cash
flows) and capitalized terminal values over the expected holding
period for each property. Other valuation techniques, such as the
sales comparison approach and the replacement cost approach,
are also employed by appraisers as secondary estimators of
value. Property mortgages, notes, and loans are marked to
market using prevailing interest rates for comparable property
loans, if the terms of existing loans preclude the immediate
repayment of such loans. ASB maintains a GIPS Policy and
Procedures Manual that contains policies for valuing portfolios,
calculating performance, and preparing compliant presentations.
The manual is available upon request.
Calculation of Performance Returns - Returns presented are
denominated in United States dollars and are inclusive of
leverage. Composite returns are calculated on an asset-
weighted average basis using beginning-of-period values.
Returns include cash and cash equivalents and related interest
income. Income return is based on accrual recognition of earned
income. Returns are presented gross of management fees and
include reinvestment of income. Actual returns will be reduced by
investment advisory fees. Actual fees are used to calculate the
Fund's net returns from 1991 to the present, and for periods
before 1991, net returns have been calculated using a modeled
fee based upon the highest stated fee at the time. The collection
of fees produces a compounding effect on the total rate of return
net of management fees. As an example, the effect of
investment management fees on the total value of a client’s
portfolio assuming (a) quarterly fee assessment, (b) $1,000,000
investment, (c) portfolio return of 8% a year, and (d) 1.25%
annual investment advisory fee would be $13,057 in the first
year, and cumulative effects of $74,572 over five years and
$177,494 over ten years. The fee for individual clients with
investments greater than $5 million will have lower annual
investment advisory fees. As of 3/31/19, the average weighted
fee was 0.93%. For a client with a $50 million investment, the
annual investment advisory fee would be 0.85%.
Capital expenditures, tenant improvements, and lease
commissions are capitalized and included in the cost of the
property, are not amortized, and are reconciled through the
valuation process and reflected in the capital return component.
Income and capital returns may not equal total returns due to
chain-linking of quarterly returns. Annual returns are time-
weighted rates of return calculated by linking quarterly returns.
For the annualized since-inception time-weighted return, terminal
value is based on ending market value of net assets of the Fund.
Investment Management Fees - Fees are charged to accounts
with indirect interests in real estate development projects through
units of the Fund.
1.25% on the first $5 million
1.00% on the next $10 million
0.90% on the next $60 million
0.75% on the balance (over $75 million)
NCREIF Fund Index - Open-End Diversified Core Equity
Benchmark - As of March 31, 2009, the ASB Allegiance Fund’s
benchmark for performance is the NCREIF Fund Index - Open-
End Diversified Core Equity (NFI-ODCE) presented on a value-
weighted basis. This Index is a fund level capitalization-weighted,
time-weighted return index and includes property investments at
ownership share, cash balances and leverage (i.e. returns reflect
each member fund’s actual asset ownership positions and
financing strategy). As of March 31, 2009, the Fund changed its
benchmark from the NCREIF Property Index (NPI) to the NFI-
ODCE. The NPI only measures stabilized property returns, so the
NFI-ODCE provides a more comparable benchmark.

ASB Real Estate Investments
ASB A l leg iance Real Es ta te Fund
58
• This presentation is made on a confidential basis to a qualified
prospective investor. Prospective investors or other recipients of this
presentation may not use, reproduce or distribute or disclose this
information in any manner unless required by law. This presentation is
not to be considered a general solicitation under Regulation D of the U.S.
Securities Act of 1933, as amended. Prospective investors will be
required to deliver certain representations and warranties regarding its
eligibility to invest.
• Units of the ASB Allegiance Real Estate Fund, LP have not been
registered under the U.S. Securities Act of 1933, as amended, or the
securities laws of any other jurisdiction, not is such registration currently
contemplated. The units are being offered under the exemption provided
by Section 4(2) of the Securities Act and Regulation D promulgated
thereunder, and similar exemptions under the laws of other jurisdictions
where the offering is made. In addition, the ASB Allegiance Real Estate
Fund, LP is not registered under the U.S. Investment Company Act of
1940, as amended, and is relying on an exemption from the registration
requirements thereof.
• This presentation contains information regarding the ASB Allegiance Real
Estate Fund, LP. It does not purport to be complete and it is subject to
and in its entirety by reference to the Partnership Agreement, the
Subscription Agreement and such other documents, copies of which will
be provided to each qualified prospective investor.
• For Benefit Plan Investors: This information is provided to assist you in
your consideration of making an investment in ASB Allegiance Real
Estate Fund, LP. This information is not intended to render any
investment advice or recommendations. Your decision as to an
investment in ASB Allegiance Real Estate Fund, LP must be made by you
in consultation with your own advisors. ASB Allegiance Real Estate
Partners GP, LLC, ASB Capital Management, LLC and their affiliates
receive fees for managing the Fund and therefore cannot provide
impartial investment advice or otherwise act as your fiduciary in
connection with your investment decision.