ARTÍCULO A GRAVITY MODEL OF TRADE FOR ...
37
391 ARTÍCULO A GRAVITY MODEL OF TRADE FOR NICARAGUAN AGRICULTURAL EXPORTS Medardo Aguirre González Claudio Candia Campano Lilliam Antón López Javier Beltrán Valdebenito Aguirre, M., Candia, C., Antón, L., & Beltrán, J. (2018). A gravity model of trade for Nicaraguan agricultural exports. Cuadernos de Economía, 37(74), 391-428. This research aims to find the determining factors of Nicaraguan agricultural exports. To carry out this study, the author formulated a Gravity Model of Trade (GMT) M. Aguirre González Is a PhD candidate at the Faculty of Administration and Economics of the University of Santiago de Chile and Professor at the Faculty of Economics and Business of the University of Talca, magui- [email protected], (56)712200318; av. lircay s/n; Talca, Chile. C. Candia Campano Researcher at the Faculty of Economics and Business of the University of Talca, clcandia@utalca. cl, (56)712200318; av. lircay s/n; Talca, Chile. Corresponding author, Facultad de Economía y Ne- gocios de la Universidad de Talca, Avenida lircay s/n, Talca - Chile; teléfono: 00+56+962256672; email: [email protected]. L. Antón López Researcher at the Faculty of Agrarian Sciences of the University of Talca, [email protected], (56)712200318; av. lircay s/n; Talca, Chile. J. Beltrán Valdebenito Professor at the Faculty of Economics and Business of the University of Talca, [email protected], (56)712200318; av. lircay s/n; Talca, Chile. Sugerencia de citación: Aguirre, M., Candia, C., Antón, L., & Beltrán, J. (2018). A gravity model of trade for Nicaraguan agricultural exports. Cuadernos de Economía, 37(74), 391-428. doi: https://doi. org/10.15446/cuad.econ.v37n74.55016. Este artículo fue recibido el 05 de enero de 2016, ajustado el 29 de junio de 2016, y su publica- ción aprobada el 26 de agosto de 2016.
-
Upload
khangminh22 -
Category
Documents
-
view
0 -
download
0
Transcript of ARTÍCULO A GRAVITY MODEL OF TRADE FOR ...

391
ARTÍCULO
A GRAVITY MODEL OF TRADE FOR NICARAGUAN AGRICULTURAL EXPORTS
Medardo Aguirre GonzálezClaudio Candia Campano
Lilliam Antón LópezJavier Beltrán Valdebenito
Aguirre, M., Candia, C., Antón, L., & Beltrán, J. (2018). A gravity model of trade for Nicaraguan agricultural exports. Cuadernos de Economía, 37(74), 391-428.
This research aims to find the determining factors of Nicaraguan agricultural exports. To carry out this study, the author formulated a Gravity Model of Trade (GMT)
M. Aguirre González Is a PhD candidate at the Faculty of Administration and Economics of the University of Santiago de Chile and Professor at the Faculty of Economics and Business of the University of Talca, [email protected], (56)712200318; av. lircay s/n; Talca, Chile.
C. Candia CampanoResearcher at the Faculty of Economics and Business of the University of Talca, [email protected], (56)712200318; av. lircay s/n; Talca, Chile. Corresponding author, Facultad de Economía y Ne-gocios de la Universidad de Talca, Avenida lircay s/n, Talca - Chile; teléfono: 00+56+962256672; email: [email protected].
L. Antón LópezResearcher at the Faculty of Agrarian Sciences of the University of Talca, [email protected], (56)712200318; av. lircay s/n; Talca, Chile.
J. Beltrán ValdebenitoProfessor at the Faculty of Economics and Business of the University of Talca, [email protected], (56)712200318; av. lircay s/n; Talca, Chile.
Sugerencia de citación: Aguirre, M., Candia, C., Antón, L., & Beltrán, J. (2018). A gravity model of trade for Nicaraguan agricultural exports. Cuadernos de Economía, 37(74), 391-428. doi: https://doi.org/10.15446/cuad.econ.v37n74.55016.
Este artículo fue recibido el 05 de enero de 2016, ajustado el 29 de junio de 2016, y su publica-ción aprobada el 26 de agosto de 2016.
392 Cuadernos de Economía, 37(74), julio-diciembre de 2018
and then made an estimation using a version of Ordinary Least Squares (OLS) that incorporates a consistent covariance matrix estimator to correct the heterosce-dasticity and autocorrelation effects. The data considered observations over twen-ty years and for twelve countries: eight have signed a Free Trade Agreement (FTA) with Nicaragua and four have not. The variables that significantly increased the flow of Nicaraguan agricultural exports are the following: Nicaragua’s trading part-ners’ population, Nicaragua’s Gross Domestic Product per capita (GDP pc), the Real Exchange Rate (RER), and Nicaragua’s trading partners’ GDP pc; howev-er, the distance variable turned out to be significantly trade-inhibiting. Free Trade Agreements (FTAs) predominantly have significant effects.
Keywords: Gravity model of trade, Nicaraguan agricultural exports, free trade agreements.JEL: Q17, Q18, F14, C50.
Aguirre, M., Candia, C., Antón, L., & Beltrán, J. (2018). Un modelo gravita-cional de comercio para las exportaciones agrícolas nicaragüenses. Cuader-nos de Economía, 37(74), 391-428.
Este artículo intenta identificar los factores determinantes de las exportaciones agrícolas de Nicaragua. Para realizar el estudio se formuló un modelo gravitacio-nal de comercio (MGC) que luego fue estimado a través de una versión de míni-mos cuadrados ordinarios (MCO) que incorpora un estimador consistente de la matriz de covarianzas para corregir los efectos de la heterocedasticidad y autoco-rrelación. El panel de datos consideró observaciones para veinte años y doce paí-ses, de los cuales algunos han firmado un tratado de libre comercio (TLC) con Nicaragua (ocho) y otros que no (cuatro). Como variables que incrementan sig-nificativamente el flujo de exportaciones agrícolas nicaragüenses se encuentran: la población de los socios comerciales de Nicaragua, el producto interno bruto per cápita (PIB pc) de Nicaragua, el tipo de cambio real (TCR) y el PIB pc de sus socios comerciales, mientras que la variable distancia resultó ser significati-vamente inhibidora del intercambio. En relación con los efectos de los TLC, se observa predominio de efectos significativos.
Palabras clave: modelo gravitacional de comercio, exportaciones agrícolas nica-ragüenses, tratados de libre comercio.JEL: Q17, Q18, F14, C50.

A gravity model of trade for Nicaraguan agricultural exports Medardo Aguirre González et al. 393
Aguirre, M., Candia, C., Antón, L., et Beltrán, J. (2018). Un modèle gravita-tionnel du commerce pour les exportations agricoles nicaraguayennes. Cua-dernos de Economía, 37(74), 391-428.
L’article cherche à identifier les facteurs déterminants des exportations agricoles du Nicaragua. Pour réaliser l’étude on formule un modèle gravitationnel du com-merce (MGC), qui est ensuite estimé à travers une version de moindres carrés ordinaires (MCO) incorporant un estimateur robuste de la matrice de covariances pour corriger les effets de l’hétéroscédasticité et l’autocorrélation. Les données de panel comprennent des observations sur vingt ans et douze pays, dont certains ont passé un accord de libre-échange (ALE) avec le Nicaragua (huit), et d’autres non (quatre). Comme variables qui accroissent de façon significative le flux d’exporta-tions agricoles nicaraguayennes on a : la population des partenaires commerciaux du Nicaragua, le produit intérieur brut per capita (PIB pc) du Nicaragua, le type de change réel (TCR) et le PIB pc de ses partenaires commerciaux ; alors que la variable de distance apparaît comme significativement inhibitrice des échanges. Quant aux effets des ALE, on observe une prédominance d’effets significatifs.
Mots-clés: modèle gravitationnel du commerce, exportations agricoles nicara-guayennes, accords de libre-échange.JEL: Q17, Q18, F14, C50.
Aguirre, M., Candia, C., Antón, L., & Beltrán, J. (2018). Um modelo gravita-cional de comércio para as exportações agrícolas da Nicarágua. Cuadernos de Economía, 37(74), 391-428.
Este artigo tenta identificar os determinantes das exportações agrícolas da Nica-rágua. Para fazer o estudo um modelo gravitacional de comércio (MGC), que foi então estimado utilizando uma versão de mínimos quadrados ordinários (MCO) incorporando uma estimativa consistente da matriz de covariância para corrigir os efeitos de heterocedasticidad e autocorrelação. O painel de dados considerou observações por vinte anos e doze países, dos quais alguns assinaram um acordo de livre comércio (TLC) com a Nicarágua (oito) e outros que não (quatro). As variáveis que aumentam significativamente o fluxo de exportações agrícolas nica-raguenses são: a população de parceiros da Nicarágua, o PIB per capita da Nicará-gua, a taxa de câmbio real (TCR), e o PIB Per capita dos seus parceiros comerciais, enquanto a distância variável provou estar inibindo significativamente a troca. Em relação com os efeitos dos TLC, há predominância de efeitos significativos.
Palavras chave: modelo gravitacional de comércio, exportações agrícolas nicara-guenses, tratados de livre comércio.JEL: Q17, Q18, F14, C50.

394 Cuadernos de Economía, 37(74), julio-diciembre de 2018
INTRODUCTIONThe aim of this research is to identify the determinant factors of Nicaraguan agri-cultural exports, which will allow this work to contribute to the literature with relevant information for the public and private sectors during the decision- making process.
This objective is related to some eventual future risks that the country’s economy could face. These risks were identified, in the first stage of research, through a general background review of the Nicaraguan agricultural sector. This concluded that although both the agricultural sector and the country’s strongest area, exports, have been growing, they do so at a lower rate than other productive sectors, and, thus, lose relative weight in terms of national GDP and job creation. The section concludes by pointing out that, in order to control this situation, it is important to understand the factors on which the Nicaraguan agricultural exports are based.
In the second section, to better address the objective, the author undertook a review on the situation of Nicaraguan exports. Then, to understand the GMT’s theoreti-cal foundations, this article presents a literature review, which ends by defining the hypotheses this research attempts to assess.
The next section describes methodological aspects such as the data, descriptions of variables, and an evolution of GMT estimation techniques. Because of its impor-tance in present research, specific importance is given to the Newey-West HAC covariance matrix estimator procedure.
The subsequent section presents the results, which include the assessment of the global goodness of fit and an individual evaluation of the parameters. Finally, the results are discussed and then the bibliography is presented.
GENERAL BACKGROUNDDuring the last two decades Nicaragua has shown sustained economic growth, which can be seen through the average yearly growth rate of both GDP (3.8%) and employment (5.5%). Graph 1 shows the evolution of GDP (in real terms) and employment (in thousands of people) during the period 1994 - 2011. Both varia-bles show continuous growth until 2011, and their (approximate) values have been doubled since 1994.
Even though all sectors have grown, they have done so at different speeds (mainly since 2000); agriculture has evolved more slowly while services have become the strongest sector in Nicaragua’s economy. As shown in Graphs 2 and 3, the relative contribution of agriculture and the manufacturing industry to the national GDP and employment has decreased, conversely to what is happening with the services. The agricultural sector’s lower contribution has been compensated for by the ser-vices sector.

A gravity model of trade for Nicaraguan agricultural exports Medardo Aguirre González et al. 395
Graph 1. Nicaragua’s GDP and Employment
3500
0
500
1000
1500
2000
2500
3000
1994 1995 1996 1997 1998 1999 2000 2001 2002 2003 2004 2005 2006 2007 2008 2009 2010 2011
GDP (hundreds of millions of 2006 cordobas) Employement (thousands of persons)
Source: Author’s own elaboration using data from Nicaragua’s Central Bank.
Graph 2. GDP share per Economic Activity
60%
0%
10%
20%
30%
40%
50%
Agriculture, livestock, foresty and fishing Manufacturing, construcction, minimg Services
1990 1992 1994 1996 1998 2000 2002 2004 2006 2008 2010 2012
Source: Author’s own elaboration using data from Nicaragua’s Central Bank.
Something similar happened with exports, the traditionally highest-performing component of the agricultural sector.1 Since 2006, as shown in Graph 4, the Nica-
1 In fact, according to the World Bank (2012), the Nicaraguan agricultural exports showed a special dynamism between 2000 - 2006 due to access to new markets as well as high international prices of some goods; this became the engine of the Nicaraguan agricultural sector.

396 Cuadernos de Economía, 37(74), julio-diciembre de 2018
raguan agricultural exports began to grow at a lower rate than other exportable sec-tors, and they showed strong signs of less relative participation, placing them below the manufacturing industry.
Graph 3. Percentage of Employment Generated by Economic Activity
60%
0%
10%
20%
30%
40%
50%
1994 1995 1996 1997 1998 1999 2000 2001 2002 2003 2004 2005 2006 2007 2008 2009 2010 2011
ServicesAgriculture, livestock, foresty and fishing Manufacturing, construcction, minimg
Source: Author’s own elaboration using data from Nicaragua’s Central Bank.
Graph 4.Percentage of FOB Exports per Economic Activity
60%
0%
10%
20%
30%
40%
50%
2008 20102006 2012
Agriculture Mining Manufacturing
Source: Author’s own elaboration using data from Nicaragua’s Central Bank.
In relation to the above, this research focuses on identifying the determinant fac-tors of Nicaraguan agricultural exports. As such, the paper can contribute by iden-tifying the factors on which public and private policy must operate in order to help

A gravity model of trade for Nicaraguan agricultural exports Medardo Aguirre González et al. 397
the sector regain its position and avoid future risk both for itself and for the Nica-raguan economy as a whole.
Nicaragua’s Export SituationAccording to the World Bank (2012), Nicaragua’s average economic growth in the past decade (3.2% annual average) has been partially driven by an expan-sion in exports (average rate of 11% after 2000). Access to new markets, together with high international prices of some goods, has benefited the exports’ dynamism (WTO, 2012).
Although the exports from all the different sectors in Nicaragua’s economy have been growing over recent years, as shown in Graph 5, which presents a 6.2% aver-age annual rate of growth; agricultural exports have expanded the least. The min-ing industry is the sector that shows the highest annual average of growth (16.7%), followed by the manufacturing sector (6.3%), and then agriculture (4.3%).
Graph 5. FOB Exports per Economic Activity in Thousand USD
3,000,000
0
500,000
1,000,000
1,500,000
2,000,000
2,500,000
2008 20102006 2012Agriculture Mining Manufacturing Total
Source: Author’s own elaboration using data from Nicaragua’s Central Bank.
In terms of the exported products matrix, besides gold and cheese, no major changes can be seen over the last twenty years. Since 1995, the main products have been coffee, beef, sugar, and lobster. See Graph 6 for more details.
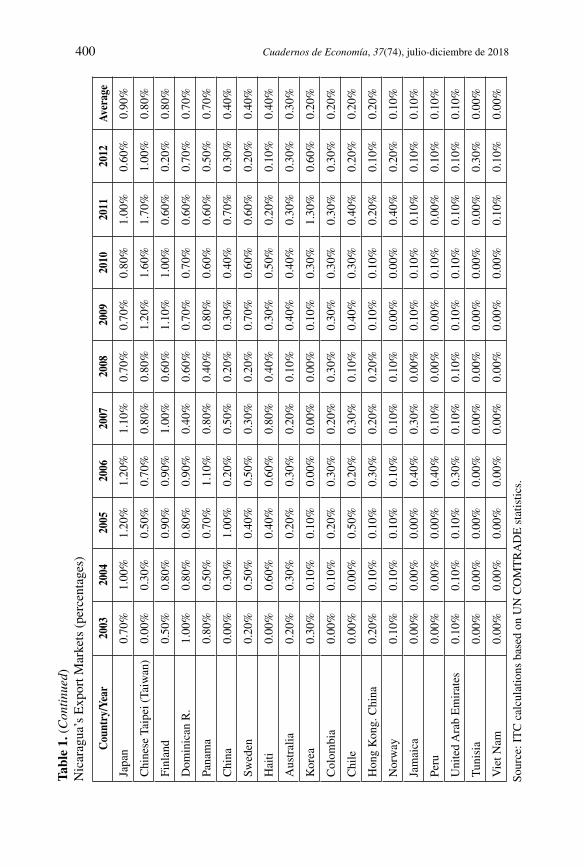
Table 1 shows that, generally, exports have not presented significant fluctua-tions in terms of the country to which they are exported. The most important mar-kets are: The United States, El Salvador, Honduras, Costa Rica, Canada, Mexico,

398 Cuadernos de Economía, 37(74), julio-diciembre de 2018
Venezuela, and Guatemala. It can be seen that North and Central America are the most important destinations for Nicaraguan exportable products.
Graph 6. FOB Exports of Main Products in Millions USD
0
100
200
300
400
500
1995 2000 2005 2010 2013Coffee Beef Gold Sugar Lobster
Cheese Farming shrimp Beans Beverage and rum Marine shrimp
Instant coffee Banana Cookies Tobaco Wheat flour
Source: Author’s own elaboration using data from Nicaragua’s Central Bank. Since 1995, the situation for agricultural exports has not changed dramatically. During this time, a similar pattern can be seen to that of overall product exports. North America is the most important destination for these products (43.2%), fol-lowed by Central America (27.9%), Europe (14.8%), and South America (7.4%). Some minor exports are also registered for Asia and Africa, see Table 2.
In order to improve the performance of exports, Nicaragua has sought to strengthen relations with its current trading partners while continuing to look for new ones. This can be seen in the agreements the country has signed over the last decade (WTO, 2012), see Table 3.
According to The World Bank (2012), the FTA signed in 2005 between Central American countries, the Dominican Republic, and the United States (DR-CAFTA) played an important role in increasing exports. Exports to the US (Nicaragua’s biggest trading partner) have more than doubled since its implementation. More recently, Venezuela has also become more important and represents the second highest export destination. Despite some disadvantages regarding inefficiencies in its productive processes and its relatively poor performance in the world mar-ket, Nicaragua has a promising future if it maintains its current course. Accord-ing to the 2012 reports from the World Bank and Economic Commission for Latin America (ELAC)’s forecast, Latin American exports will grow by 4%, meaning that Nicaragua will have the second highest growth rate with 13.5% percent, fol-lowing only Bolivia (World Bank, 2012).

A gravity model of trade for Nicaraguan agricultural exports Medardo Aguirre González et al. 399
Tabl
e 1.
N
icar
agua
’s E
xpor
t Mar
kets
(pe
rcen
tage
s)
Cou
ntry
/Yea
r20
0320
0420
0520
0620
0720
0820
0920
1020
1120
12Av
erag
e
Wor
ld10
0.0%
100.
0%10
0.0%
100.
0%10
0.0%
100.
0%10
0.0%
100.
0%10
0.0%
100.
0%10
0.0%
Uni
ted
Stat
es36
.50%
38.6
0%35
.40%
46.5
0%31
.20%
40.5
0%32
.80%
32.8
0%30
.40%
46.8
0%36
.10%
El S
alva
dor
17.2
0%14
.40%
14.2
0%2.
90%
14.1
0%7.
70%
14.3
0%10
.70%
8.70
%5.
20%
11.6
0%
Hon
dura
s7.
20%
7.60
%8.
10%
4.40
%9.
30%
4.70
%7.
20%
3.30
%2.
60%
2.50
%6.
00%
Cos
ta R
ica
8.10
%6.
70%
6.20
%3.
20%
7.30
%4.
10%
6.20
%4.
70%
5.20
%2.
50%
5.70
%
Can
ada
3.50
%4.
70%
3.70
%6.
00%
5.80
%2.
70%
3.00
%8.
50%
12.0
0%7.
30%
5.50
%
Mex
ico
4.60
%5.
40%
5.10
%6.
20%
4.90
%7.
40%
4.10
%2.
80%
3.90
%10
.60%
4.90
%
Ven
ezue
la0.
10%
0.20
%0.
40%
0.30
%0.
50%
1.00
%8.
60%
13.5
0%13
.30%
9.80
%4.
20%
Gua
tem
ala
4.30
%4.
30%
5.20
%1.
60%
5.50
%3.
20%
4.40
%3.
70%
3.10
%1.
60%
3.90
%
Spai
n2.
70%
2.90
%3.
90%
4.50
%3.
60%
2.00
%2.
60%
2.10
%1.
60%
1.30
%2.
90%
Uni
ted
Kin
gdom
2.80
%2.
30%
2.50
%2.
90%
1.50
%1.
20%
1.30
%1.
30%
1.70
%1.
20%
1.90
%
Ger
man
y1.
60%
1.90
%1.
80%
4.00
%2.
00%
1.20
%1.
10%
1.20
%1.
40%
0.70
%1.
80%
Bel
gium
0.60
%1.
50%
1.00
%3.
90%
2.10
%1.
10%
1.10
%1.
20%
1.50
%1.
50%
1.60
%
Fran
ce0.
80%
1.00
%0.
50%
1.00
%0.
90%
0.50
%1.
40%
1.50
%1.
10%
0.70
%1.
00%
Rus
sian
Fed
erat
ion
2.40
%0.
20%
1.60
%1.
00%
0.80
%0.
20%
0.30
%1.
20%
0.90
%0.
30%
1.00
%
Ital
y0.
80%
0.80
%0.
60%
1.20
%1.
00%
0.60
%0.
50%
1.00
%1.
50%
0.90
%0.
90%
Net
herl
ands
0.50
%0.
50%
0.70
%0.
70%
1.20
%1.
10%
2.90
%0.
20%
0.50
%0.
70%
0.90
%
400 Cuadernos de Economía, 37(74), julio-diciembre de 2018Ta
ble
1. (
Con
tinu
ed)
Nic
arag
ua’s
Exp
ort M
arke
ts (
perc
enta
ges)
Cou
ntry
/Yea
r20
0320
0420
0520
0620
0720
0820
0920
1020
1120
12Av
erag
e
Japa
n0.
70%
1.00
%1.
20%
1.20
%1.
10%
0.70
%0.
70%
0.80
%1.
00%
0.60
%0.
90%
Chi
nese
Tai
pei (
Taiw
an)
0.00
%0.
30%
0.50
%0.
70%
0.80
%0.
80%
1.20
%1.
60%
1.70
%1.
00%
0.80
%
Finl
and
0.50
%0.
80%
0.90
%0.
90%
1.00
%0.
60%
1.10
%1.
00%
0.60
%0.
20%
0.80
%
Dom
inic
an R
.1.
00%
0.80
%0.
80%
0.90
%0.
40%
0.60
%0.
70%
0.70
%0.
60%
0.70
%0.
70%
Pana
ma
0.80
%0.
50%
0.70
%1.
10%
0.80
%0.
40%
0.80
%0.
60%
0.60
%0.
50%
0.70
%
Chi
na0.
00%
0.30
%1.
00%
0.20
%0.
50%
0.20
%0.
30%
0.40
%0.
70%
0.30
%0.
40%
Swed
en0.
20%
0.50
%0.
40%
0.50
%0.
30%
0.20
%0.
70%
0.60
%0.
60%
0.20
%0.
40%
Hai
ti0.
00%
0.60
%0.
40%
0.60
%0.
80%
0.40
%0.
30%
0.50
%0.
20%
0.10
%0.
40%
Aus
tral
ia0.
20%
0.30
%0.
20%
0.30
%0.
20%
0.10
%0.
40%
0.40
%0.
30%
0.30
%0.
30%
Kor
ea0.
30%
0.10
%0.
10%
0.00
%0.
00%
0.00
%0.
10%
0.30
%1.
30%
0.60
%0.
20%
Col
ombi
a0.
00%
0.10
%0.
20%
0.30
%0.
20%
0.30
%0.
30%
0.30
%0.
30%
0.30
%0.
20%
Chi
le0.
00%
0.00
%0.
50%
0.20
%0.
30%
0.10
%0.
40%
0.30
%0.
40%
0.20
%0.
20%
Hon
g K
ong.
Chi
na0.
20%
0.10
%0.
10%
0.30
%0.
20%
0.20
%0.
10%
0.10
%0.
20%
0.10
%0.
20%
Nor
way
0.10
%0.
10%
0.10
%0.
10%
0.10
%0.
10%
0.00
%0.
00%
0.40
%0.
20%
0.10
%
Jam
aica
0.00
%0.
00%
0.00
%0.
40%
0.30
%0.
00%
0.10
%0.
10%
0.10
%0.
10%
0.10
%
Peru
0.00
%0.
00%
0.00
%0.
40%
0.10
%0.
00%
0.00
%0.
10%
0.00
%0.
10%
0.10
%
Uni
ted
Ara
b E
mir
ates
0.10
%0.
10%
0.10
%0.
30%
0.10
%0.
10%
0.10
%0.
10%
0.10
%0.
10%
0.10
%
Tun
isia
0.00
%0.
00%
0.00
%0.
00%
0.00
%0.
00%
0.00
%0.
00%
0.00
%0.
30%
0.00
%
Vie
t Nam
0.00
%0.
00%
0.00
%0.
00%
0.00
%0.
00%
0.00
%0.
00%
0.10
%0.
10%
0.00
%
Sour
ce: I
TC
cal
cula
tions
bas
ed o
n U
N C
OM
TR
AD
E s
tatis
tics.

A gravity model of trade for Nicaraguan agricultural exports Medardo Aguirre González et al. 401
Tabl
e 2.
N
icar
agua
’s M
ain
Agr
icul
tura
l Exp
ort M
arke
ts (
perc
enta
ges)
Cou
ntry
/Yea
r20
0320
0420
0520
0620
0720
0820
0920
1020
1120
12Av
erag
e
Wor
ld
100.
0%10
0.0%
100.
0%10
0.0%
100.
0%10
0.0%
100.
0%10
0.0%
100.
0%10
0.0%
100.
0%
Uni
ted
Stat
es39
.1%
39.6
%36
.0%
48.8
%32
.8%
35.4
%32
.5%
32.8
%30
.9%
30.1
%35
.8%
El S
alva
dor
18.2
%15
.4%
15.3
%2.
2%16
.1%
14.3
%15
.6%
12.2
%10
.7%
9.6%
13.0
%
Ven
ezue
la0.
2%0.
2%0.
5%0.
3%0.
6%2.
1%10
.3%
17.4
%17
.7%
22.0
%7.
1%
Hon
dura
s6.
4%7.
3%7.
1%2.
5%9.
2%6.
5%7.
0%3.
3%2.
5%2.
4%5.
4%
Mex
ico
5.5%
6.3%
5.6%
7.1%
5.5%
5.4%
4.6%
3.4%
5.0%
3.3%
5.2%
Cos
ta R
ica
6.2%
4.7%
4.3%
2.2%
5.5%
5.3%
4.8%
4.2%
5.1%
4.8%
4.7%
Gua
tem
ala
3.3%
3.3%
4.5%
0.9%
5.1%
4.7%
4.3%
3.7%
3.1%
2.9%
3.6%
Spai
n3.
2%3.
5%4.
8%5.
6%4.
3%4.
1%3.
1%2.
7%2.
1%1.
6%3.
5%
Gre
at B
rita
in3.
5%2.
8%3.
1%3.
6%1.
8%2.
6%1.
6%1.
7%2.
3%2.
2%2.
5%
Bel
gium
0.8%
1.9%
1.2%
4.8%
2.6%
2.3%
1.4%
1.5%
2.0%
3.3%
2.2%
Can
ada
0.9%
2.8%
2.2%
2.7%
3.3%
3.1%
1.0%
1.3%
2.1%
2.5%
2.2%
Ger
man
y1.
9%2.
3%2.
2%5.
0%2.
5%2.
2%1.
3%1.
5%1.
9%1.
4%2.
2%
Fran
ce1.
1%1.
2%0.
6%1.
2%1.
1%0.
9%1.
6%2.
0%1.
5%1.
5%1.
3%
Japa
n0.
9%1.
2%1.
5%1.
5%1.
3%1.
4%0.
8%1.
1%1.
4%1.
2%1.
2%
Net
herl
ands
0.6%
0.6%
0.8%
0.8%
0.4%
2.3%
2.8%
0.3%
0.6%
1.3%
1.1%

402 Cuadernos de Economía, 37(74), julio-diciembre de 2018
Tabl
e 2.
(C
onti
nued
)N
icar
agua
’s M
ain
Agr
icul
tura
l Exp
ort M
arke
ts (
perc
enta
ges)
Cou
ntry
/Yea
r20
0320
0420
0520
0620
0720
0820
0920
1020
1120
12Av
erag
e
Rus
ia3.
0%0.
2%1.
9%1.
3%0.
9%0.
5%0.
4%1.
5%1.
2%0.
8%1.
2%
Ital
ia0.
6%0.
7%0.
5%1.
2%0.
8%0.
9%0.
6%0.
9%1.
2%1.
0%0.
8%
Dom
inic
an R
. 1.
0%0.
7%0.
7%0.
9%0.
4%0.
8%0.
7%0.
7%0.
7%0.
6%0.
7%
Pana
ma
0.5%
0.4%
0.5%
0.7%
0.5%
0.5%
0.7%
0.4%
0.6%
0.6%
0.5%
Kor
ea0.
4%0.
0%0.
0%0.
0%0.
0%0.
0%0.
0%0.
2%1.
3%1.
0%0.
3%
Col
ombi
a0.
1%0.
1%0.
2%0.
3%0.
3%0.
5%0.
3%0.
3%0.
4%0.
7%0.
3%
Tun
isia
0.0%
0.0%
0.0%
0.0%
0.0%
0.0%
0.0%
0.0%
0.0%
0.7%
0.1%
Sour
ce: A
utho
r’s
own
elab
orat
ion
usin
g W
ITS
data
.

A gravity model of trade for Nicaraguan agricultural exports Medardo Aguirre González et al. 403
Table 3. Nicaragua’s Free Trade Agreements
Free Trade Agreement Countries Enforcement
Mexico - Nicaragua Mexico and Nicaragua July 1st, 1998
Dominican Republic - Central America
Dominican Republic, Guatemala, Honduras, El Salvador, Costa Rica and Nicaragua
September 3rd, 2002
Dominican Republic - Central America - United States
United States, Dominican Republic, Honduras, El Salvador, Costa Rica and Nicaragua
April 6th, 2006
Nicaragua - Chinese Taipei (Taiwan)
Chinese Taipei and Nicaragua January 1st, 2008
Panama - Nicaragua Panama and Nicaragua November 21st, 2009
México - Central America
México, Honduras, El Salvador, Costa Rica and Nicaragua
September 1st, 2012
Chile - Nicaragua Chile and Nicaragua October 19th, 2012
European Union - Central America
European Union (27), Honduras, El Salvador, Costa Rica and Nicaragua
August 1st, 2013
Source: Author’s own elaboration using WTO data.
LITERATURE REVIEW AND THEORETICAL FRAMEWORKTo find out the determining factors of trade among countries, several researchers have implemented GMT. These models were first applied to international trade by Tinbergen (1962) and Pöyhönen (1963), who proposed that the intensity of trade relations between countries could be estimated relating economic concepts to Newton’s law of universal gravitation (an analogy). Thus, the volume of trade could be estimated as an increasing function of the national incomes of the trading partners and a decreasing function of the distance between them.
These models first became popular because of their perceived empirical success, but then due to lack of theoretical economic foundations, they started to be criti-cized. However, as time has passed, these shortcomings have been improved. This can be seen in papers including those written by Anderson (1979), Bergstrand (1985), McCallum (1995), Deardorff (1998), Anderson and Van Wincoop (2003) and Feenstra (2004).

404 Cuadernos de Economía, 37(74), julio-diciembre de 2018
A first basic form As a starting point to understand GMT, it is necessary to review the relation between the law of gravitation and the economic concepts that allow us to estimate the vol-ume of trade between countries. As explained by Reinert (2012) gravitational force between two objects (namely n and j), in equation form, is expressed as:
GFM MD
n jnjn j
nj=
⋅≠, (1)
In the equation, the gravitational force is directly proportional to the masses of the objects (M
n and M
j) and indirectly proportional to the distance between them (D
nj).
Thus, if it is expressed in terms of natural logarithms, what is multiplied is instead added and what is divided is instead subtracted. Formula (1) is thus transformed into the following linear equation:
LnGF LnM LnM LnD n jnj n j nj= + + + ≠ 0 1 2 3 , (2)
According to Reinert (2012), the most solid theoretical foundations for handling mass consist in associating it with the corresponding national income of the coun-tries that are to be included in a specific analysis. Moreover, the distance between objects is replaced by the distance between nations, and the gravitational force must be replaced by a variable that allows trade between countries to be measured.
Nevertheless, some authors such as Porojan (2001) and Kucera and Sarna (2006) incorporate the Gross Domestic Product per capita (GDP pc) into the GMT instead of using GDP as the proxy variable for national income. They adduce that is a bet-ter to estimate the purchasing power of nations. In addition, Lee, Koo and Park (2008) not only recommend including GDP pc in gravity equations, but also pop-ulation data since higher income countries generally trade more due to the influ-ence of their market size and superior infrastructure. Kalirajan (2007) and Iwanow and Kirkpatrick (2007) also considered population in their studies.
Thus, it is useful to define an initial form as follows:
LnE GDP GDP POP DISTnj pcn pc j j nj nj= + + + + +β β β β β µ0 1 2 3 4ln ln ln ln (3)
Considering the Border Effects Apart from these basic components, several authors, due to the presence of what trade economists call border effects,2 consider that gravity models should include the effects political boundaries have on the relative prices of exportable products.
Over the last decade, the border effects have been incorporated into gravity equations in alternative ways. This was carried out by several authors following
2 According to Anderson (1979), this consists in recognizing that products traded internationally are in fact differentiated by country of origin.

A gravity model of trade for Nicaraguan agricultural exports Medardo Aguirre González et al. 405
McCallum’s (1995) paper using the commonly applied concept of “remoteness”, which intends to reflect the average distance from a specific region to all its trad-ing partners with the exception of the region where the trade is being measured.3
Several years later, in an attempt to continue to improve accuracy when consid-ering border effects, Anderson and Van Wincoop (2003), as well as criticizing the theoretical simplicity of “remoteness”, developed the alternative concept of rela-tive trade resistance. According to the authors, trade between two regions depends on the bilateral barrier between them relative to multilateral resistance (average trade barriers that both regions face with all their trading partners). In turn, this is incorporated as variables or indices, which are functions of all bilateral resist-ance (trade barriers)4 and the product of the respective price indices. This applica-tion has been recently further developed in works such as Baldwin and Taglioni (2006), Anderson (2011) and Martínez-Zarzoso, Voicu and Vidovic (2015).
Another option to border effects is a widely used alternative that consists in cap-turing price effects (including RER) between countries; a method that was used by Kandogan (2005), Thorpe and Zhang (2005) and Bahmani-Oskooee and Kovyry-alova (2008). In order to add the border effects through the inclusion of RER in the GMT, a well-known procedure needs to be followed. The procedure begins with the transformation of the Nominal Exchange Rate (NER), calculated in United States Dollars (USD), into the NER expressed in Nicaraguan legal tender (USD is the most common currency in which the indicator is reported) and ends with the attainment of the RER between the Nicaraguan Cordoba (Nicaraguan currency) and the local currency unit of the J-eth country. For further details see Apple-yard and Field (2003), Krugman and Obstfeld (2006) and Bahmani-Oskooee and Kovyryalova (2008). When choosing to add border effects through the RER, the model is expressed as follows:
LnE GDP GDP POP DIST
RERnj pcn pc j j nj= + + + +
+
β β β β β
β0 1 2 3 4
5
ln ln ln lnln nnj nj+ µ
(4)
A Final Theoretical Approach Lastly, in order to give the basic model a more suitable approach to better repre-sent commercial dynamism among countries, different authors have incorporated the effects of certain conditions by adding dummy variables. Some of these condi-tions and some of the respective authors who have considered them in their stud-ies are the following: common language (Abedini & Peridy, 2008; Rose, 2000), FTA inking (Grant & Lambert, 2008; Longo & Sekkat, 2004), access to the ocean (Carrère, 2006), and geographical adjacency (Lampe, 2008; Lee & Park, 2007; Musila, 2005).
3 Thus, when estimating trade between two regions, the gravity equations must add two remoteness variables.
4 These are calculated using the trade costs equation, which considers both bilateral distance and eventual bilateral adjacency.

406 Cuadernos de Economía, 37(74), julio-diciembre de 2018
Finally, with regards to the model’s endogenous variable, the exports, as declared by Kepaptsoglou, Tsamboulas, Karlaftis and Marzano (2009), are the most com-mon dependent variables found in trade flow gravity models and will therefore occupy the left-hand side of the equation.
The GMT in the Agricultural Sector Despite GMT being more commonly used to describe the trading of manufactured goods, over recent years there have been many similarities5 when applying these kinds of models to agriculture; some examples can be found in Florensa, Márquez-Ramos and Recalde (2015) and Parra, Martínez-Zarsoso and Suárez-Burguet (2015). Even though these works pursue different aims, both separately represent the trad-ing of agricultural and manufacturing products through the same theoretical specifi-cation that incorporates basic form variables, border effects (price resistance terms), and dummy additional variables. While the former studies the impact on trade for FTA agricultural and industrial products which came into force for ten Middle East and North African Countries (MENA), the latter analyses (for the same economic sectors) the effects of commercial agreements on the trade margins for eleven mem-ber-countries of the Latin American Integration Association (LAIA).
Nevertheless, it is important to note that due to complexities in trade policies, espe-cially in the case of agricultural products, some authors such as Márquez-Ramos and Martínez-Gómez (2015) believe that the border effects treatment should be expanded. The authors generally call theses expansions trade preferences, which consider entry price systems, seasonal variations, and quotas or tariff-rates. Thus, to capture the relevance of these preferences granted to Morocco by the Euro-pean Union,6 the authors construct three exogenous variables that consider differ-ent perspectives that stem from the application of the agreements. The basis for the construction of these variables considers the estimation of the price reduction granted for Morocco compared with the entry price of the European Union’s most favoured trade partner for different products. Different ways to incorporate trade preferences in agricultural products are shown in Emlinger, Jacquet and Chevas-sus Lozza (2008) and Cardamone (2011).
However, for Nicaragua, it is not feasible to do so since there is no available infor-mation.7
According to what is described above (in the Literature Review), and regarding data for different time periods (years), the resultant model to explain the Nicara-guan agricultural exports may be expressed as:
5 Since 2007, a consensus has been reached regarding the continuous improvements in terms of estimation methods and model specification.
6 This is in terms of Morocco’s exportable agricultural products. The country is part of the Southern and Eastern Mediterranean Countries (SEMCs).
7 The border effects are considered to be trade preferences.
A gravity model of trade for Nicaraguan agricultural exports Medardo Aguirre González et al. 407
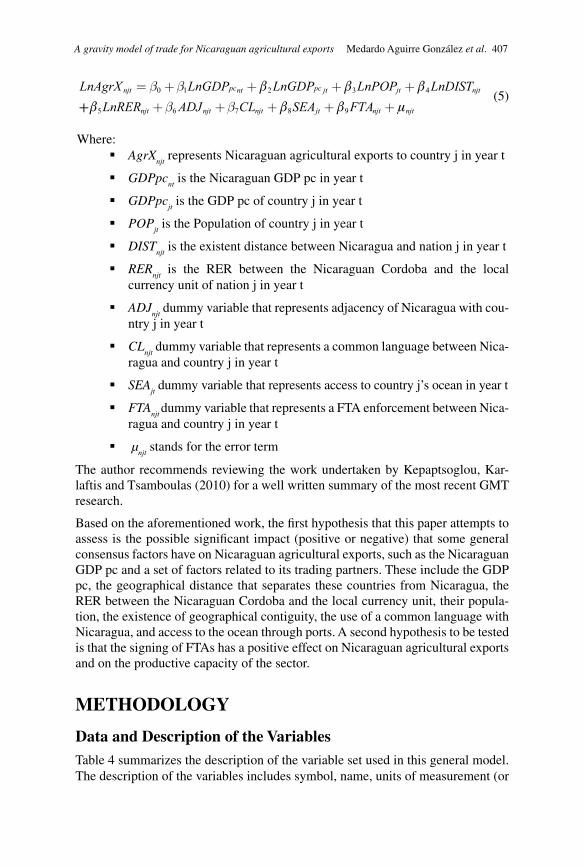
LnAgrX LnGDP LnGDP LnPOP LnDISTnjt pcnt pc jt jt njt= + + + +b b0 1 2 3 4β β β
++ + + + + +β β β µ5 6 7 8 9LnRER ADJ CL SEA FTAnjt njt njt jt njt njtb b (5)
Where:§AgrX
njt represents Nicaraguan agricultural exports to country j in year t
§GDPpcnt is the Nicaraguan GDP pc in year t
§GDPpcjt is the GDP pc of country j in year t
§POPjt is the Population of country j in year t
§DISTnjt
is the existent distance between Nicaragua and nation j in year t
§RERnjt
is the RER between the Nicaraguan Cordoba and the local currency unit of nation j in year t
§ADJnjt
dummy variable that represents adjacency of Nicaragua with cou-ntry j in year t
§CLnjt
dummy variable that represents a common language between Nica-ragua and country j in year t
§SEAjt dummy variable that represents access to country j’s ocean in year t
§FTAnjt
dummy variable that represents a FTA enforcement between Nica-ragua and country j in year t
§ µnjt
stands for the error term
The author recommends reviewing the work undertaken by Kepaptsoglou, Kar-laftis and Tsamboulas (2010) for a well written summary of the most recent GMT research.
Based on the aforementioned work, the first hypothesis that this paper attempts to assess is the possible significant impact (positive or negative) that some general consensus factors have on Nicaraguan agricultural exports, such as the Nicaraguan GDP pc and a set of factors related to its trading partners. These include the GDP pc, the geographical distance that separates these countries from Nicaragua, the RER between the Nicaraguan Cordoba and the local currency unit, their popula-tion, the existence of geographical contiguity, the use of a common language with Nicaragua, and access to the ocean through ports. A second hypothesis to be tested is that the signing of FTAs has a positive effect on Nicaraguan agricultural exports and on the productive capacity of the sector.
METHODOLOGY
Data and Description of the Variables Table 4 summarizes the description of the variable set used in this general model. The description of the variables includes symbol, name, units of measurement (or

408 Cuadernos de Economía, 37(74), julio-diciembre de 2018
possible values in case of dichotomous variables), and the source for each com-ponent. It is important to note that ‘owning sea-ports’ does not appear as one of the variables in Table 4; it is a useless variable as all Nicaragua’s trading partners have sea-ports.
The data used for this analysis is comprised of a total of twenty yearly observations (from 1990 to 2010) from twelve countries: eight have signed an FTA with Nica-ragua and four have not despite being important trade partners. All twelve coun-tries are among the sixteen main destinations for Nicaraguan agricultural exports.
The first group of eight countries consists of Mexico, the Dominican Republic, Guatemala, Honduras, El Salvador, Costa Rica, the United States, and Panama while the second group contains Germany, Spain, Great Britain, and Canada. The data used is made up of both time series and cross sectional data, which consti-tutes panel data.
Evolution of the GMTs’ Estimation Methodology Over time, the GMT estimation methodology –in the quest for the most efficient estimates– has experienced many changes. The most common practice in the GMT’s empirical applications has been to transform the multiplicative model by taking natural logarithms and estimating the obtained log-linear model using OLS, which, according to Santos Silva and Tenreyro (2006), leads to biased estimates of the true parameters under heteroscedasticity.
Thus, the previously cited authors propose using a Pseudo Poisson Maximum Likelihood (PPML) estimation technique for cross-sectional data that is consist-ent in the presence of heteroscedasticity.8 This provokes the first main change to the common practice and outlines Santos Silva and Tenreyro’s (2006) contribution as being highly influential despite criticism from authors such as Anderson (2011) and Márquez-Ramos and Martínez-Gómez (2015).
A second major contribution to the GMT’s estimation methodology was made by Baier and Bergstrand (2007). This work, based on findings from Baier and Berg-strand (2002, 2004) and Magee (2003), reveals that there are several plausible reasons to suggest that the quantitative effects FTAs have on trade flows using the standard cross-section gravity equation are biased. According to the authors, this is the case because the cross-sectional data approaches9 do not adjust well for FTA10 endogenei-ty11 since they are compromised by a lack of available suitable instruments.
8 PPML is a special case of the generalized linear model (GLM) framework in which the variance is assumed to be proportional to the mean.
9 Instrumental-variable and control-function approaches.10 According to Baier and Bergstrand (2007), FTA dummies are not exogenous random variables;
rather, countries likely select endogenously into FTAs, perhaps for reasons unobservable to the econometrician and possibly correlated with the level of trade.
11 Econometrically one variable is endogenous when it is correlated with the error term.

A gravity model of trade for Nicaraguan agricultural exports Medardo Aguirre González et al. 409
Table 4. Description of the Variables
Symbol Variable name Units Data source
AgrXnjt
Agricultural exports from Nicaragua to a determined partner Thousands of United
States Dollars (USDs) of 2005
World Inte-grated Trade Solution (WITS) a
GDPpcnt
Nicaraguan per capita Gross Domestic Product
World BankGDPpcjt
Per capita Gross Domestic Product of country j
POPjt
Population of a countryThousands of inhab-itants
DISTnjt
Distance from Managua to the main population centre of country j
Kilometres
Centre for Prospective Studies and International Information (CEPII)
RERnjt
Real Exchange Rate b
Index referred Nica-raguan Cordoba (NC) of 2005
World Bank and Economic Commission for Latin America(ELAC)
ADJnjt
Adjacency of Nicaragua with country j
1= whenever the condition is present
0=whenever the condition is not present
Centre for Prospective Studies and International Information (CEPII)
CLnjt
Common language (if country j uses Spanish as Nicaragua does)
FTAnjt
Free Trade Agreement Enforcement between Nicaragua and country j
World Trade Organization (WTO)
a This is an on-line system developed by the World Bank in close collaboration and consul-tation with various international organizations such as the United Nations Conference on Trade and Development (UNCTAD), the International Trade Centre (ITC), and the World Trade Organization (WTO).b Calculated using an interaction of Consumer Prices Index (CPI) and Nominal Exchange Rate (NER).Source: Prepared by the authors based on data from various sources.

410 Cuadernos de Economía, 37(74), julio-diciembre de 2018
Due to the previous, Baier and Bergstrand (2007) demonstrated that the most plau-sible estimates of the average effect that an FTA have on a bilateral trade flow are obtained using either panel data with fixed effects12 or differenced panel data with country and time effects, using OLS as an estimation method. For more detailed information about panel data techniques, the author highly recommends reviewing the following literature: Wooldridge (2002) and Gujarati (2003). According to both authors, these techniques are classified as follows: Constant Coefficients Models (CCMs), Fixed Effects Models (FEMs), and Random Effects Models (REMs).
Over recent years, the methodology to estimate GMTs has once again progressed: see Baier, Bergstrand and Feng (2011, 2014). The authors, apart from describ-ing a process that is similar to Baier and Bergstrand’s (2007) to address the het-eroscedasticity related to the endogeneity of the FTA variable, show arguably the best way to solve the residual autocorrelation (serially correlated errors and unit-root processes) that this variable could generate. To eliminate both problems, the authors propose estimating a theoretically-motivated gravity equation by fixed effects (FE),13 an equation that, according to Baier, Bergstrand and Feng (2011), must consider both a current and a lagged effect of the FTA variable. In Baier, Bergstrand and Feng (2014), the previously mentioned lagged effects of the FTA variable are replaced by a “random growth” model in differences.14 Some appli-cations of Baier et al.’s (2011, 2014) methodology, specifically for Latin Ameri-can countries, can be seen in Florensa, Márquez-Ramos and Recalde (2015) and Márquez-Ramos, Florensa and Recalde (2015).
First Estimations of the ModelTo detect eventual highly correlated exogenous variables (multicollinearity), we undertook a first estimation by using the simplest approach among panel data alter-natives: CCM with OLS. The multicollinearity problem appeared and manifested itself through the wrong signs of the variables that were measuring the existence of a common language (with Nicaragua) and the enforcement of the FTAs Nicara-gua - Mexico and Nicaragua – the Dominican Republic. Table 5 shows the expect-ed signs of each variable’s coefficient and highlights the variables that are included in this first model’s estimation, which is shown in Table 6. The right sign could not be obtained.
12 Bilateral fixed effects with country and time effects. 13 With country fixed effects (for country - pair) and time fixed effects (for exporter and importer). 14 In both works, panel data and OLS must be used.

A gravity model of trade for Nicaraguan agricultural exports Medardo Aguirre González et al. 411
Table 5. Expected Sign Between Nicaraguan Agricultural Exports and Independent Variables
VariableExpected
correlation signVariable
Expected correlation sign
Nicaragua’s GDPpc + FTA Mexico +
Importer’s GDPpc + FTA Dominican Republic -
Population + FTA Guatemala +
Distance - FTA Honduras +
Real Exchange Rate + FTA El Salvador +
Adjacency + FTA Costa Rica +
Common Language - FTA USA +
FTA Panama -
The expected correlation sign for FTA variables is obtained through descriptive statistics by comparing the flow of Nicaraguan agricultural exports before and after enforcement of the FTA.Source: Author’s own elaboration.
Table 6. OLS Estimation in Presence of Multicollinearity
Variable Coefficient Std. Error
Constant -24.2106 *** 5.1282
Nicaragua’s GDP pc 1.0259 *** 0.3419
Importer’s GDP pc 0.7466 *** 0.1987
Population 0.9736 *** 0.1566
Distance -0.9450 *** 0.2518
Real Exchange Rate 2.1789 ** 0.8972
Adjacency 0.5281 0.4754
Common Language 0.8166 ** 0.3413
FTA Mexico -1.1201 ** 0.4662
FTA Dominican R. 0.2093 0.2503
FTA Guatemala 0.5195 0.4641
FTA Honduras 0.6586 ** 0.3121
FTA El Salvador 1.9426 *** 0.4653
FTA Costa Rica 0.1172 0.3021
FTA United States 0.3362 0.3805
FTA Panama -0.1357 0.3622

412 Cuadernos de Economía, 37(74), julio-diciembre de 2018
Table 6. (Continued)OLS Estimation in Presence of Multicollinearity
Variable Coefficient Std. Error
R-squared 0.7465
Adjusted R-squared 0.7295
F-statistic 43.9707 ***
Durbin-Watson stat 0.7957
*** P < 0.01 ; ** P < 0.05 ; * P < 0.1Source: Author’s own elaboration.
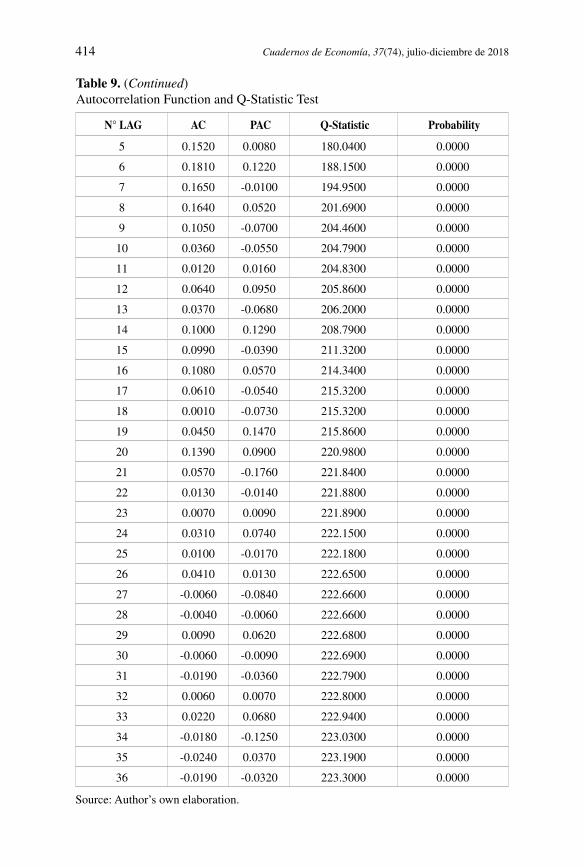
Subsequently, as shown in Table 7, once the highly correlated variables mentioned above were eliminated, the model was estimated again using CCM with OLS. However, due to the presence of heteroscedasticity and residual autocorrelation, as can be observed in Tables 8 and 9 respectively, another approach had to be found.
Table 7. OLS Estimation with Heteroscedasticity and Autocorrelation of Residuals
Variable Coefficient Std. Error
Constant -21.3659 *** 2.9480
Nicaragua’s GDP pc 1.1131 *** 0.1991
Importers’ GDP pc 0.4966 *** 0.1145
Population 0.7642 *** 0.0691
Distance -0.7374 *** 0.1167
Real Exchange Rate 2.4441 *** 0.5401
Adjacency 0.5605 ** 0.2524
FTA Guatemala 0.7299 ** 0.2810
FTA Honduras 0.7898 ** 0.3389
FTA El Salvador 2.1270 *** 0.2950
FTA Costa Rica 0.3511 0.3346
FTA United States 0.7733 ** 0.3591
FTA Panama -0.0018 0.4435
R-squared 0.72127
Adjusted R-squared 0.7065
F-statistic 48.9498 ***
Durbin-Watson stat 0.7055
*** P < 0.01; ** P < 0.05; * P < 0.1Source: Author’s own elaboration.

A gravity model of trade for Nicaraguan agricultural exports Medardo Aguirre González et al. 413
Table 8. Glejser Heteroscedasticity Test
F-statistic 5199.0000
Prob. F(12,227) 0.0000
Dependent variable: Absolute values of residualsMethod: Least Squares
Variable Coefficient Std. Error
Constant 8.8150 *** 1.8279
Nicaragua’s GDP pc -0.6814 *** 0.1234
Importers’ GDP pc 0.1510 ** 0.0710
Population -0.0863 ** 0.0428
Distance -0.1482 ** 0.0724
Real Exchange Rate -0.4753 0.3349
Adjacency -0.5158 *** 0.1565
FTA Guatemala -0.1033 0.1742
FTA Honduras 0.1382 0.2106
FTA El Salvador -0.3637 ** 0.1829
FTA Costa Rica -0.0122 0.2074
FTA United States -0.2688 0.2226
FTA Panama -0.5586 ** 0.2750
R-squared 0.2156
Adjusted R-squared 0.1741
F-statistic 5.1990 ***
Durbin-Watson stat 1.1951
*** P < 0.01; ** P < 0.05; * P < 0.1Source: Author’s own elaboration.
Table 9. Autocorrelation Function and Q-Statistic Test
N° LAG AC PAC Q-Statistic Probability
1 0.6460 0.6460 101.5400 0.0000
2 0.4150 -0.0050 143.5300 0.0000
3 0.2870 0.0370 163.7700 0.0000
4 0.2070 0.0150 174.3400 0.0000
414 Cuadernos de Economía, 37(74), julio-diciembre de 2018
Table 9. (Continued) Autocorrelation Function and Q-Statistic Test
N° LAG AC PAC Q-Statistic Probability
5 0.1520 0.0080 180.0400 0.0000
6 0.1810 0.1220 188.1500 0.0000
7 0.1650 -0.0100 194.9500 0.0000
8 0.1640 0.0520 201.6900 0.0000
9 0.1050 -0.0700 204.4600 0.0000
10 0.0360 -0.0550 204.7900 0.0000
11 0.0120 0.0160 204.8300 0.0000
12 0.0640 0.0950 205.8600 0.0000
13 0.0370 -0.0680 206.2000 0.0000
14 0.1000 0.1290 208.7900 0.0000
15 0.0990 -0.0390 211.3200 0.0000
16 0.1080 0.0570 214.3400 0.0000
17 0.0610 -0.0540 215.3200 0.0000
18 0.0010 -0.0730 215.3200 0.0000
19 0.0450 0.1470 215.8600 0.0000
20 0.1390 0.0900 220.9800 0.0000
21 0.0570 -0.1760 221.8400 0.0000
22 0.0130 -0.0140 221.8800 0.0000
23 0.0070 0.0090 221.8900 0.0000
24 0.0310 0.0740 222.1500 0.0000
25 0.0100 -0.0170 222.1800 0.0000
26 0.0410 0.0130 222.6500 0.0000
27 -0.0060 -0.0840 222.6600 0.0000
28 -0.0040 -0.0060 222.6600 0.0000
29 0.0090 0.0620 222.6800 0.0000
30 -0.0060 -0.0090 222.6900 0.0000
31 -0.0190 -0.0360 222.7900 0.0000
32 0.0060 0.0070 222.8000 0.0000
33 0.0220 0.0680 222.9400 0.0000
34 -0.0180 -0.1250 223.0300 0.0000
35 -0.0240 0.0370 223.1900 0.0000
36 -0.0190 -0.0320 223.3000 0.0000
Source: Author’s own elaboration.

A gravity model of trade for Nicaraguan agricultural exports Medardo Aguirre González et al. 415
For this reason, we attempted to estimate the model by using the first version of the methodology described in Baier and Bergstrand (2007), which includes the use of panel data with bilateral fixed effects (country and time effects) and OLS.
Once again, a proper fit could not be achieved. That is because Baier and Berg-strand’s (2007) methods require new variables to be created to incorporate the country and time effects, which, in turn, created the new problem of multicollin-earity.15 This problem resulted in the application of any further approaches sug-gested by Baier et al. (2011, 2014)16 proving fruitless.
The Final Estimation of the Model We attempted to estimate the model using different panel data methodologies and it did not achieve a proper fit both in relation to its forecast capacity and in regards to the significance of the exogenous variables.
Finally, we estimated the model using OLS and the Newey-West HAC consistent covariance estimator in order to improve the estimates of the coefficient variances. This procedure proposes a more general covariance matrix estimator, which, in the presence of heteroscedasticity and autocorrelation, corrects the estimates’ stand-ard errors. This means that the Newey-West HAC covariance matrix estimator does not change the point estimates of the parameters, only their estimated stand-ard errors (Newey & West, 1987). The Newey - West estimator is given by:
(6)
Where:
Æ ´ ( ´Ω=−
+ −+
+
=− − −∑T
T ku x x v
qx u u x xt t t
t
T
t t t v t v t v2
1
11
uu u xt v t tt v
T
v
q
−= +=∑∑
)
11 (7)
Where, T is the number of observations, k is the number of regressors, ut is the least
squares residual, and q (the truncation lag) is a parameter representing the number of autocorrelations used in evaluating the dynamics of the OLS residuals u
t.
To estimate the model, we used the EViews statistical software version 6.
RESULTSThe evaluation of the outcomes from the estimated model considers both the assess-ment of the global goodness of fit and the individual evaluation of the parameters. Table 10 shows the results.
15 A classic REM was also attempted but also did not reach a proper fit. 16 Both methods consider the creation of new variables that take into account the country and time
effects.

416 Cuadernos de Economía, 37(74), julio-diciembre de 2018
Table 10.OLS Estimation with Newey-West HAC Procedure
Variable Coefficient Std. Error
Constant -21.3659 *** 5.5328
Nicaragua’s GDP pc 1.1131 *** 0.3444
Importers’ GDP pc 0.4966 ** 0.2150
Population 0.7642 *** 0.0907
Distance -0.7374 *** 0.2527
Real Exchange Rate 2.4441 *** 0.8513
Adjacency 0.5605 0.4606
FTA Guatemala 0.7299 ** 0.3680
FTA Honduras 0.7898 *** 0.2490
FTA El Salvador 2.1270 *** 0.42069
FTA Costa Rica 0.3511 0.2757
FTA United States 0.7733 ** 0.3029
FTA Panama -0.002 0.3713
R-squared 0.7213
Adjusted R-squared 0.7065
F-statistic 48.9498 ***
Durbin-Watson stat 0.7055
*** P < 0.01; ** P < 0.05; * P < 0.1Source: Author’s own elaboration.
The criterion used, as a way of globally evaluating the beta parameters, was the F-statistic goodness-of-fit test, which indicates that the model can be used to make predictions.17
According to the p-values, we have found different results depending on the parameter. For the continuous variables parameters, the null hypothesis
i = 0 is
always rejected.
The Nicaraguan GDP pc, the GDP pc of partner nations, the population of these
countries, and the RER show (through the positive sign of the related estimate) a positive correlation with Nicaraguan agricultural exports. These turned out to be
17 The F-statistic value delivered by the OLS estimate has a related p – value equal to zero (p = 0.000). This indicates, with a 5% significance, that the null hypothesis (H
0: 1 = 2… K = 0)
remains inside the rejection area, which, in turn, indicates that the set of parameters are statistica-lly different from zero and that the model can be used to make predictions.

A gravity model of trade for Nicaraguan agricultural exports Medardo Aguirre González et al. 417
significant (T227
= 3.232, p < 0.01; T227
= 2.310, p < 0.05; T227
= 8.428, p < 0.001 and T
227 = 2.871, p < 0.01, respectively).
According to the distance, as indicated by the sign of the estimate and the related significance (T
227 = -0.737, p < 0.01), the variable plays a predominant role in lim-
iting the shipment of agricultural products from Nicaragua to other countries.
On the other hand, for the categorical variables parameters, the null hypothesis i =
0 is not always rejected, which means that those variables do not achieve the nec-essary level to be considered as significant in order to promote or limit (depending on the sign of the related parameters) Nicaraguan exports. This occurs with geo-graphical contiguity (T
227 = 1.217, p = 0.225) as well as with some FTA variables.
The regression coefficients for the different FTAs that Nicaragua has signed pos-sess both positive and negative signs.18 For the latter, the sign would be contradic-tory because of the intention of having conducted agreements with those nations (at least for the agricultural sector). The former would be interpreted as a favoura-ble influence of the FTAs over the dependent variable.
Based on the results in Table 5, Panama is the only trade partner that has nega-tively influenced the Nicaraguan agricultural exports in its market although this is not considered significant (T
227 = -0.005, p = 0.9961).
Furthermore, the same outcomes presented in Table 5 indicate that the FTAs Nic-aragua signed with Guatemala, Honduras, El Salvador, United States, and Costa Rica, have all been beneficial in terms of increasing the quantities of Nicaraguan agricultural products sold outside the country (Guatemala, T
227 = 1.983, p < 0.05),
(Honduras, T227
= 3.172, p < 0.01), (El Salvador, T227
= 5.056, p < 0.001), (United States, T
227 = 2.553, p < 0.05), and (Costa Rica, T
227 = 1.273, p = 0.2042). How-
ever, the significance level for the parameter related to the FTA signed by Nicara-gua and Costa Rica is somewhat higher than 20%.
With this, the country markets of Panama and Costa Rica remain under an uncer-tain context. This is because the corresponding parameters do not reach the mini-mum significance level that would allow them to be classified as a trade-inhibiting FTA (Panama) or a trade-enhancing FTA (Costa Rica).
As suggested by Milner and Sledziewska (2007) and Sun and Reed (2010),19 it is pertinent to comment that, in the present research, a complementary revision was carried out to determine whether the subsequent years presented a different sit-uation. For this reason, new dummy variables representing the first three years after signing a given FTA were included in the analysis, and they were associated in several different ways in order to conduct new regressions. The results of the described attempt do not indicate any improvements for the significance level of any sub-period.
18 As indicated, the parameters for dummy variables are assigned to the non-existence of the charac-teristic in a given nation for a given year.
19 They attempted to find specific influences from import-tariffs.

418 Cuadernos de Economía, 37(74), julio-diciembre de 2018
DISCUSSION After reviewing the outcomes of the OLS estimation, it is reasonable to think that the proposed set of variables fulfil the study’s objectives.
The present research shows that there is a positive relation between Nicaraguan ag-ricultural exports and the Nicaraguan GDP pc (
1) as well as the GDP pc of Nica-
ragua’s trading partners (2). Similar results have been found by Martínez-Zarzoso
and Nowak-Lehmann (2003) when GMTs are applied to asses Mercosur-EU trade. According to these authors, the positive influence both variables have on trade is due to the fact that the exporting party having a higher income suggests higher pro-duction levels, and the importing party having a higher income implies higher pur-chasing power.
However, according to some authors such as Grant and Lambert (2005), GDPs might have a less significant influence of on agricultural exports (
1 and
2).
They pointed out that in the case of agriculture, small income elasticity is to be expected mainly because this sector usually constitutes a much smaller percent-age of national GDP than others such as the manufacturing sector. Another reason could be that when national income rises, countries may choose to trade higher valued non-agricultural goods.
The effect of Nicaraguan trading partners’ population on Nicaraguan agricul-tural exports (
3) resulted both positive and significant. According to Oguledo
and MacPhee (1994) and Matyas (1997), population size is trade-enhancing since it promotes, among other characteristics, division of labour, specialization, and therefore economies of scale, which generate trade opportunities for both export-ing and importing countries. A different perspective for this positive effect is revealed by Lee et al. (2008) who consider this variable as a proxy of market size. However, different perspectives such as Oguledo and MacPhee’s (1994) must be taken into consideration as they point out that population size could have a nega-tive effect on trade. It could, therefore, be trade-inhibiting given that a large pop-ulation may indicate large resource endowment, self-sufficiency, and less reliance on international trade: known as the absorption effect.
Regarding the distance (4) between Nicaragua and its trading partners: a negative
effect on the level of exports can be observed. Authors such as Egger (2002) and Pradhan (2009) have reached similar conclusions; the main reason being the asso-ciation between distance and trade costs.
In this research, the findings point out that the impact of RER (5) on Nicara-
guan agricultural exports is both positive and significant. The effects the RER has on international trade have been long studied and have shown different results. According to one approach, the results of which coincide with this research’s results, RER has a significant influence since it determines the relative cost of the products in the international market. In the same vein, Egger (2002), Cafiero (2005) and Kepaptsoglou et al. (2010) point out that local currency devaluation in

A gravity model of trade for Nicaraguan agricultural exports Medardo Aguirre González et al. 419
real terms is beneficial for exports. According to the other approach, authors such as Bacchetta and Van Wincoop (2000) found that RER does not affect trade signif-icantly because of its uncertainty.
Contrary to the most common results this research, geographical contiguity effects (
6) turned out to not be significant. Anderson and Van Wincoop (2003), Pradhan
(2009) and Gul and Yasin (2011) came to similar conclusions. These results could be interpreted as a reflection of the loss of advantage that international land bridges have had in relation to the international seaports. Nevertheless, it should be high-lighted that there is a widely accepted notion about the positive and significant influence geographical adjacency has on international trade. This is indicated by the evidence found in Boughanmi (2008), Masudur and Arjuman (2010) and Sun and Reed (2010).
Although the effects of a common language (7) and having access to the ocean
(8) were not included in the model, it is useful to give an account of the evidence
found in the literature about the positive and significant impact, that, in general, both variables have on exports.
Regarding common language, Montenegro and Soloaga (2006) found these results when estimating the impact NAFTA had on US-Mexico and US-third countries’ trade flows. The reason was either due to the ease of communicating in the same language or the cultural similarity between countries that share a language.
With regards to having access to the ocean, Limao and Venables (2001) have shown that a lower shipping cost is the main reason for positive effects on exports. The per-kilometre cost of land freight is far higher than the equivalent cost of ship-ping, which means that landlocked countries face higher transportation costs for foreign trade because of their lack of seaport facilities.
However, the author found divergent evidence when reviewing papers on the effects of FTAs. As pointed out by Kepaptsoglou et al. (2010) and Kohl (2014) –two important works that review the effects economic agreements have on trade flows– the performance of FTAs is still unclear. Some studies indicate trade cre-ation and diversion while others indicate the opposite. Further evidence of this important discussion in the trade literature can be seen in Krueger (1999), Gilbert, Bora and Scollay (2001), Márquez-Ramos, Nowak-Lehmann, Herzer, Martínez -Zarzoso and Vollmer (2007) and Martínez-Zarzoso (2014).
To explain these divergent findings, although some authors cite different reasons, the most widely accepted are those related to the theories of comparative advan-tage. The most important are reviewed in Cuevas (2000), Krugman and Obstfeld (2006) and Raffo (2012). According to these theories, FTAs would benefit the commercial flow of relatively more efficient sectors at the expense of less efficient ones. Recent evidence supporting this idea, in the case of agricultural exports, can be found in Parra, Martínez-Zarzoso and Suárez-Burguet (2015).
Over recent years a complementary perspective has emerged that explains the divergent effects of FTAs. According to authors such as Kohl (2014) and Florensa

420 Cuadernos de Economía, 37(74), julio-diciembre de 2018
et al. (2015), these effects depend on certain characteristics of trade agreements, such as their institutional quality and level of economic integration. These, in turn, offer insights into different types of FTAs. Moreover, the authors point out that the effects should be measured in terms of the “margins of trade”. The intensive mar-gin (IM) is the increase in a country’s exports that result from maintaining and enhancing trade relations over time while extensive margins (EM) are related with the appearance of new products and markets. Hence, deeper integrated FTAs and better institutional quality should have more significant effect on margins.
For further reading on the effects FTAs have on trade margins, refer to the follow-ing studied: Hillberry and McDaniel (2003), Kehoe and Ruhl (2009) and Bensassi, Márquez-Ramos and Martínez-Zarzoso (2012).
Different results have been found depending on the country when measuring the effects FTAs (
9) have on Nicaraguan agricultural exports. Thus, it should be
understood that signing an FTA only results in an increase in agricultural exports when the country or region is relatively less efficient than Nicaragua in the pro-duction of agricultural products and/or the FTAs’ institutional quality and level of economic integration are suitable. This is the case for Guatemala, Honduras, El Salvador, and the United States.
Furthermore, signing a FTA would result in a decrease in agricultural exports when the efficiency favours Nicaragua´s commercial partner, or because of the poor institutional quality and low economic integration within the FTA.
As such, the FTAs that have reported non-significant effects on Nicaraguan agri-cultural exports are supposed to be signed with countries or regions that have a similar relative efficiency in agricultural production and/or because the FTA’s institutional quality and level of economic integration are sub-standard (Costa Rica and Panama).
In terms of this last issue (when FTAs have reported a non-significant effect on Nicaraguan agricultural exports), there may be an alternative reason, which is related to the economic power of attraction that the US exerts over Nicaraguan goods. The strong trading relationship between the two nations cannot be denied, which may represent a kind of barrier to trade between Nicaragua and other coun-tries. This could be the reason for the non-significant effects of those FTAs.
CONCLUSIONSIn summary, the most significant variables that increase the volume of Nicara-guan agricultural exports turned out to be the population of Nicaragua’s trading partners, Nicaragua’s GDP pc, the RER, and Nicaragua’s trading partners GDP pc. However, the variable distance turned out to be significantly trade-inhibit-ing. Moreover, the non-significant variables for Nicaraguan agricultural exports included geographical adjacency.
A gravity model of trade for Nicaraguan agricultural exports Medardo Aguirre González et al. 421
Finally, the effects FTAs have on Nicaragua and other nations depend on the par-ticular country; different results were obtained in terms of statistical significance. It is necessary to mention that only in the cases of the FTAs that Nicaragua signed with Costa Rica and Panama should the hypothesis of a null impact on Nicaraguan agricultural exports not be rejected.
This allows us to deduce that, in recent years, the FTAs have improved the eco-nomic performance of Nicaraguan agricultural exports.
The main limitation this research had to face was the lack of information related to some of Nicaragua’s important trading partners. First, for the twenty years con-sidered, there were some countries that despite being considered as one of the six-teen main trade partners with Nicaragua, there was no available information for the whole period, which meant that they were not incorporated in the study: two had signed an FTA (Taiwan and Chile) and two had not (Venezuela and Belgium).
It is also important to detail the effect that not incorporating some of Nicaragua’s trading partner’s particular features had on the final model. For example, it was not relevant to include owning sea-ports since the variable applied to all Nicaragua’s trading partners. Moreover, some exogenous variables presented a high correla-tion with other exogenous variables, which was expressed through a multicollin-earity problem. These variables turned out to be, the common language between nations (Spanish), FTA Nicaragua – Mexico, and FTA Nicaragua – the Domini-can Republic.
This research not only provides useful information for policy makers in the deci-sion-making process, but also gives a methodological alternative to estimate GMTs when standardized procedures do not work properly and there are some data con-straints. Furthermore, taking into account the complexities of trade policies (espe-cially for agricultural exports), it is our opinion that further research about trade preferences20 should be undertaken as a way of incorporating border effects.
ACKNOWLEDGEMENTS The authors would like to thank the Academic Writing Center at Programa de Idio-mas at Universidad de Talca, especially Mrs. Rachael Jiménez-Lange for her sup-port reviewing the draft.
REFERENCES 1. Abedini, J., & Peridy, N. (2008). The greater arab free trade area (GAFTA):
An estimation of the trade effects. Journal Economic Integration, 23(4), 848-872.
20 Entry price systems, seasonal variations and quotas or tariff-rates.

422 Cuadernos de Economía, 37(74), julio-diciembre de 2018
2. Anderson, J.E. (1979). A theoretical foundation of the gravity model. American Economic Review, 69(1), 106-116.
3. Anderson, J. E. (2011). The gravity model. Annual Review of Economics, 3, 133-160.
4. Anderson, J. E., & Van Wincoop, E. (2003). Gravity with gravitas: A solu-tion to border puzzle. American Economic Review, 93(1), 170-192.
5. Appleyard, D. R., & Field Jr., A. J. (2003). Economía Internacional 4ta. Edición. Bogotá D.C., Colombia: McGraw-Hill Interamericana S.A.
6. Baccheta, P., & Van Wincoop, E. (2000). Does exchange rate stability increase trade and welfare? American Economic Review, 90(5), 1093-1108.
7. Bahmani-Oskooee, M., & Kovyryalova, M. (2008). Impact of exchange rate uncertainty on trade flows: Evidence from commodity trade between the United States and the United Kingdom. The World Economy, 31(8), 1097-1128.
8. Baier, S. L., & Bergstrand, J. H. (1989). Estimating the effects of free trade agreements on international trade flows using matching economet-rics. Journal of International Economics, 77(1), 63-76.
9. Baier, S. L., & Berstrand, J. H. (2002). On the endogeneity of interna-tional trade flows and free trade agreements (Working paper presented at the Midwest International Economics Conference). Evanston, Illinois: Northwestern University.
10. Baier, S. L., & Bergstrand, J. (2004). Economic determinants of free trade agreements. Journal of International Economics, 64 (1), 29-63.
11. Baier, S. L., & Bergstrand, J. H. (2007). Do free trade agreements actu-ally increase members’ international trade?. Journal of international Eco-nomics, 71(1), 72-95.
12. Baier, S. L., Bergstrand, J. H., & Feng, M. (2011). Economic integration agreements and the margins of international trade. Notre Dame, Univer-sity of Notre Dame: Mimeo.
13. Baier, S. L., Bergstrand, J. H., & Feng, M. (2014). Economic integration agreements and the margins of international trade. Journal of Interna-tional Economics, 93(2), 339-350.
14. Baldwin, R., & Taglioni, D. (2006). Gravity for dummies and dummies for gravity equations (Working paper, No. 12516). National Bureau of Eco-nomic Research: Cambridge.
15. Bensassi, S., Márquez-Ramos, L., & Martínez-Zarzoso, I. (2012). Eco-nomic integration and the two margins of trade: The impact of the Bar-celona process on North African countries’ exports. Journal of African Economies, 21(2), 228-265.
A gravity model of trade for Nicaraguan agricultural exports Medardo Aguirre González et al. 423
16. Bergstrand, J. H. (1985). The gravity equation in international trade: Some microeconomic foundations and empirical evidence. Review of Econom-ics and Statistics, 67(3), 474-481.
17. Boughanmi, H. (2008). The trade potential of the Arab Gulf Cooperation Countries (GCC): A gravity model approach. Journal of Economic Inte-gration, 23(1), 42-56.
18. Cafiero, J. A. (2005). Modelos gravitacionales para el análisis del comer-cio exterior. Revista de Comercio Exterior e Integración, 4, 77-92.
19. Cardamone, P. (2011). The effect of preferential trade agreements on monthly fruit exports to the European Union. European Review of Agri-cultural Economics, 38(4), 553-586.
20. Carrère, C. (2006). Revisiting the effects of regional trade agreements on trade flows with proper specification of the gravity model. European Eco-nomic Review, 50(2), 223-247.
21. Cuevas, H. (2000). Los precios de los recursos en el comercio internacio-nal. Cuadernos de Economía, 33, 82-109.
22. Deardorff, A. V. (1998). Determinants of bilateral trade: Does gravity work in a neoclassical world?. In J. A. Frankel (Ed.), The regionalization of the world economy. University of Chicago Press.
23. Egger, P. (2002). An econometric view on the estimation of gravity mod-els and calculation of trade potentials. Oxford: Blackwell publishers Ltd.
24. Emlinger, C., Jacquet, F., & Chevassus Lozza, E. (2008). Tariffs and other trade costs: Assessing obstacles to Mediterranean countries’ Access to EU-15 Fruit and vegetable markets. European Review of Agricultural Economics, 35(4), 409-438.
25. Feenstra, R. M. (2004). Advanced international trade: Theory and evi-dence. New Jersey: Princeton University Press.
26. Florensa, L. M., Márquez-Ramos, L., & Recalde, M. L. (2015). The effect of economic integration and institutional quality of trade agreements on trade margins: Evidence for Latin America. Review of World Economics, 151(2), 329-351.
27. Gilbert, J., Bora, B., & Scollay, R. (2001). Assessing regional trading arrangement in the Asia-Pacific, UNCTAD (Policy Issues in International Trading and Commodities, Study Series No. 15). Geneva, Switzerland: United Nations.
28. Grant, J. S., & Lambert, D. M. (2005). Regionalism in world agricul-tural trade: Lessons from gravity model estimation. American Agricul-tural Economics Association Annual Meeting, Providence, Rhode Island (USA), July 24-27.
29. Grant, J. S., & Lambert, D. M. (2008). Do regional trade agreements increase members’ agricultural trade? American Journal of Agricultural Economics, 90(3), 765-782.

424 Cuadernos de Economía, 37(74), julio-diciembre de 2018
30. Gujarati, D. (2003). Econometría 4ta. Edición. Ciudad de México: McGraw-Hill Interamericana Editores.
31. Gul, N., & Yasin, H. M. (2011). The trade potential of Pakistan: An appli-cation of the gravity model. The Lahore Journal of Economics, 16(1), 23-62.
32. Hillberry, R., & McDaniel, C. (2003). A decomposition of North Amer-ican trade growth since NAFTA (Working Paper 15866). United States International Trade Commission, Office of Economics. Retrieved from https://ageconsearch.umn.edu/bitstream/15866/1/wp02012a.pdf
33. Iwanow, T., & Kirkpatrick, C. (2007). Trade facilitation, regulatory, qual-ity and export performance. Journal of International Development, 19(6), 735-753.
34. Kalirajan, K. (2007). Regional cooperation and bilateral trade flows: An empirical measurement of resistance. The International Trade Journal, 21(2), 85-107.
35. Kandogan, Y. (2005). Evidence for the natural trade partners theory from the Euro Mediterranean region (Working paper series 2005-01). University of Michigan-Flint, School of Management. Retrieved from https://editorialex-press.com/cgi-bin/conference/download.cgi?db_name=mwie2005&paper_id=4
36. Kehoe, T., & Ruhl, K. (2009). How important is the new goods margin in international trade? (Staff Report 324). Federal Reserve Bank of Minne-apolis. Retrieved from https:// minneapolisfed.org/research/sr/sr324.pdf
37. Kepaptsoglou, K., Tsamboulas, D., Karlaftis, M. G., & Marzano, V. (2009). Free trade agreement effects in the Mediterranean region. Journal of the Transportation Research Board, 2097(1), 88-96.
38. Kepaptsoglou, K., Karlaftis, M. G., & Tsamboulas, D. (2010). The gravity model specification for modeling international trade flows and free trade agreement effects: A 10-Year review of empirical studies. The Open Eco-nomics Journal, 3, 1-13.
39. Kohl, T. (2014). Do we really know that trade agreements increase trade? Review of World Economics/Weltwirtschaftliches Archiv, 150(3), 443-469.
40. Krueger, A. O. (1999). Are preferential trading arrangements trade liber-alising or protectionist? Journal of Economic Perspective, 13(4), 105-124.
41. Krugman, P. R., & Obtsfeld, M. (2006). Economía internacional: teoría y política (7ª edición). Madrid: Pearson Education S. A.
42. Kucera, D., & Sarna, R. (2006). Trade union rights, democracy, and exports: A gravity model approach. Review of International Economics, 14(5), 859-882.
43. Lampe, M. (2008). Bilateral trade flows in Europe, 1857-1875: A new dataset. Research in Economic History, 26(1), 81-155.

A gravity model of trade for Nicaraguan agricultural exports Medardo Aguirre González et al. 425
44. Lee, H. H., Koo, C. M., & Park, E. (2008). Are exports of China, Japan and Korea diverted in the major regional trading blocs? The World Econ-omy, 31(7), 841-860.
45. Lee, H. H., & Park, I. (2007). In search of optimized regional trade agree-ments and applications to East Asia. The World Economy, 30(5), 783-806.
46. Limao, N., & Venables, A. J. (2001). Infrastructure, geographical disad-vantage, transport costs and trade. World Bank Economic Review, 15(3), 451-479.
47. Longo, R., & Sekkat, K. (2004). Economic obstacles to expanding intra- African trade. World Development, 32(8), 1309-1321.
48. Magee, C. (2003). Endogenous preferential trade agreements: An empir-ical analysis. Contributions to Economic Analysis and Policy, 2(1), Arti-cle 15.
49. Márquez-Ramos, L., Florensa, L. M., & Recalde, M. L. (2015). Economic integration effects on trade margins: Sectoral evidence from Latin Amer-ica. Journal of Economic Integration, 30(2), 269-299.
50. Márquez-Ramos, L., & Martínez-Gómez, V. (2015). Revisiting the effect of trade preferences granted to Morocco in the light of an export-ori-ented approach for food security. In M. C. Paciello (Eds.). Building sus-tainable agriculture for food security in the Euro-Mediterranean area: Challenges and policy options (207-228). Edizioni Nuova Cultura.
51. Martínez-Zarzoso, I., & Nowak-Lehmann, F. (2003). Augmented grav-ity model: An empirical application to Mercosur-European Union trade flows. Journal of Applied Economics, 6(2), 291-316.
52. Martínez-Zarzoso, I., Voicu, A., & Vidovic, M. (2015). Central east Euro-pean countries’ accession into the European Union: Role of extensive mar-gin for trade in intermediate and final goods. Empirica, 42(4), 825-844.
53. Masudur, R. M., & Arjuman, L. A. (2010). Bangladesh trade potential: A dynamic gravity approach. Journal of International Trade Law and Pol-icy, 9(2), 130-147.
54. Matyas, L. (1997). Proper econometric specification of the gravity model. The World Economy, 20(3), 363-368.
55. McCallum, J. (1995). National borders matter: Canada-U.S. Regional trade patterns. American Economic Review, 85(3), 615-623.
56. Milner, C., & Sledziewska, K. (2007). Capturing regional trade effects in the presence of other trade effects: The impact of the Europe/Agreement on Poland’s imports. Open Economies Review, 19(1), 43-54.
57. Montenegro, C., & Soloaga, I. (2006). Nafta’s trade effects: New evi-dence with a gravity model. Estudios de Economía, 33(1), 45-63.
58. Musila, J. W. (2005). The Intensity of trade creation and trade diversion in COMESA, ECCAS and ECOWAS: A comparative analysis. Journal of African Economies, 14(1), 117-141.

426 Cuadernos de Economía, 37(74), julio-diciembre de 2018
59. Newey, W., & West, K. (1987). A simple positive semi-definite, hetero-scedasticity and autocorrelation consistent covariance matrix. Economet-rica, 55(3), 703-708.
60. Nowak-Lehmann, F., Herzer, D., Martínez-Zarzoso, I., & Vollmer, S. (2007). The impact of a customs union between Turkey and the EU on Turkey’s exports to the EU. Journal of Common Market Studies, 45(3), 719-743.
61. Oguledo, V. I., & Macphee, C. R. (1994). Gravity models: A reformu-lation and an application to discriminatory trade arrangements. Applied Economics, 26(2), 107-120.
62. Parra, M. D., Martínez-Zarzoso, I., & Suárez-Burguet, C. (2015). The impact of FTAs on MENA trade in agricultural and industrial products (Working Paper 16). Reus, CREIP Universitat Rovira I Virgili. Retrieved from http://www.urv.cat/creip/media/ upload/arxius/wp/WP2015/ DT.16-2015-575_Parra_Martinez_Suarez.pdf
63. Porojan, A. (2001). Trade flows and spatial effects: The gravity model revisited. Open Economies Review, 12(3), 265-80.
64. Pöyhönen, P. (1963). A tentative model for the volume of trade between countries. Weltwirtschaftliches Archiv, 90(1), 93-100.
65. Pradhan, S. R. (2009). India’s export potential to the gulf cooperation council: A gravity model exploration. New Delhi: The Icfai University Press.
66. Raffo, L. (2012). Una reconstrucción milliana del modelo ricardiano de comercio internacional. Cuadernos de Economía, 31(56), 21-58.
67. Reinert, K. A. (2012). Foreign direct investment and intra-firma trade. In K. A. Reinert (Ed.), An introduction to international economics: New perspectives on the world economy (pp. 170-228). New York: Cambridge University Press.
68. Rose, A. K. (2000). Currency unions-one money, one market: The effect of common currencies on trade. Economic Policy, 15(30), 7-45.
69. Santos Silva, J., & Tenreyro, S. (2006). The log of gravity. The Review of Economics and Statistics, 88(4), 641-658.
70. Sun, L., & Reed, M. R. (2010). Impacts of free trade agreements on agri-cultural trade creation and trade diversion. American Journal of Agricul-tural Economics, 92(5), 1351-1363.
71. Thorpe, M., & Zhang, Z. (2005). Study of the measurement and determi-nants of intra-industry trade in East Asia. Asian Economic Journal, 19(2), 231-247.
72. Tinbergen, J. (1962). Shaping the world economy: Suggestions for an international economic policy. New York: The Twentieth Century Fund.
73. Wooldridge, J. M. (2002). Econometric analysis of cross-section and panel data. Cambridge, MA: MIT Press.

A gravity model of trade for Nicaraguan agricultural exports Medardo Aguirre González et al. 427
74. World Bank. (2012). Country partnership strategy for the Republic of Nicaragua (pp. 1-85). Washington, DC: World Bank.
75. World Trade Organization. (2012). Trade policy review: Nicaragua (pp. 1-115). Ginebra: World Trade Organization.