
Article - Cell Press
29
Article Behavior-Dependent Activity and Synaptic Organization of Septo-hippocampal GABAergic Neurons Selectively Targeting the Hippocampal CA3 Area Highlights d Rhythmically firing medial septal neurons cluster into distinct subpopulations d The most rhythmic GABAergic Teevra cells fire coincident with hippocampal excitation d Teevra cells preferentially innervate CA3 axo-axonic and CCK GABAergic interneurons d Teevra axons restricted to CA3 septo-temporal segments reflect degree of rhythmicity Authors Abhilasha Joshi, Minas Salib, Tim James Viney, David Dupret, Peter Somogyi Correspondence [email protected] (A.J.), [email protected] (P.S.) In Brief Using congruent neuronal features, Joshi et al. define the most rhythmic medial septal GABAergic cell type, the Teevra cells, which preferentially innervate axo- axonic GABAergic interneurons in the hippocampal CA3. Such selective termination coordinates hippocampal excitability and theta oscillations via disinhibition. Joshi et al., 2017, Neuron 96, 1342–1357 December 20, 2017 ª 2017 The Authors. Published by Elsevier Inc. https://doi.org/10.1016/j.neuron.2017.10.033
-
Upload
khangminh22 -
Category
Documents
-
view
0 -
download
0
Transcript of Article - Cell Press

Article
Behavior-Dependent Activity
and Synaptic Organizationof Septo-hippocampal GABAergic Neurons SelectivelyTargeting the Hippocampal CA3 AreaHighlights
d Rhythmically firing medial septal neurons cluster into distinct
subpopulations
d The most rhythmic GABAergic Teevra cells fire coincident
with hippocampal excitation
d Teevra cells preferentially innervate CA3 axo-axonic and CCK
GABAergic interneurons
d Teevra axons restricted to CA3 septo-temporal segments
reflect degree of rhythmicity
Joshi et al., 2017, Neuron 96, 1342–1357December 20, 2017 ª 2017 The Authors. Published by Elsevier Ihttps://doi.org/10.1016/j.neuron.2017.10.033
Authors
Abhilasha Joshi, Minas Salib,
Tim James Viney, David Dupret,
Peter Somogyi
[email protected] (A.J.),[email protected] (P.S.)
In Brief
Using congruent neuronal features, Joshi
et al. define the most rhythmic medial
septal GABAergic cell type, the Teevra
cells, which preferentially innervate axo-
axonic GABAergic interneurons in the
hippocampal CA3. Such selective
termination coordinates hippocampal
excitability and theta oscillations via
disinhibition.
nc.

Neuron
Article
Behavior-Dependent Activity and SynapticOrganizationofSepto-hippocampalGABAergicNeuronsSelectively Targeting the Hippocampal CA3 AreaAbhilasha Joshi,1,2,* Minas Salib,1 Tim James Viney,1 David Dupret,1,2 and Peter Somogyi1,3,4,*1Department of Pharmacology, University of Oxford, Oxford OX1 3QT, UK2MRC Brain Network Dynamics Unit, Department of Pharmacology, University of Oxford, Oxford OX1 3TH, UK3Center for Brain Research, Medical University of Vienna, Vienna 1090, Austria4Lead Contact
*Correspondence: [email protected] (A.J.), [email protected] (P.S.)
https://doi.org/10.1016/j.neuron.2017.10.033
SUMMARY
Rhythmic medial septal (MS) GABAergic input coor-dinates cortical theta oscillations. However, the rulesof innervation of cortical cells and regions by diverseseptal neurons are unknown.We report a specializedpopulation of septal GABAergic neurons, the Teevracells, selectively innervating the hippocampal CA3area bypassing CA1, CA2, and the dentate gyrus.Parvalbumin-immunopositive Teevra cells show thehighest rhythmicity among MS neurons and firewith short burst duration (median, 38 ms) preferen-tially at the trough of both CA1 theta and slowirregular oscillations, coincident with highest hippo-campal excitability. Teevra cells synaptically targetGABAergic axo-axonic and some CCK interneuronsin restricted septo-temporal CA3 segments. Therhythmicity of their firing decreases from septal totemporal termination of individual axons.We hypoth-esize that Teevra neurons coordinate oscillatory ac-tivity across the septo-temporal axis, phasing thefiring of specific CA3 interneurons, thereby contrib-uting to the selection of pyramidal cell assembliesat the theta trough via disinhibition.
INTRODUCTION
Activity in the hippocampal CA1 area is spatially and tempo-
rally tuned during context-dependent behavior and the spiking
of pyramidal cells and interneurons is organized within theta
and gamma frequency oscillatory timescales. This temporal
organization is supported by well-characterized glutamatergic
projections from CA3 (Amaral and Witter, 1989; Middleton and
McHugh, 2016) as well as from the entorhinal cortex (EC) (Brun
et al., 2008; Witter et al., 1988). These inputs mediate both
dendritic excitation and feedforward inhibition (Buzsaki 1984)
of pyramidal cells. In addition to these cortical inputs, medial
septal (MS) cholinergic (Gielow and Zaborszky, 2017), gluta-
matergic (Justus et al.,2017; Huh et al., 2010; Robinson
1342 Neuron 96, 1342–1357, December 20, 2017 ª 2017 The AuthorThis is an open access article under the CC BY license (http://creative
et al., 2016; Fuhrmann et al., 2015), and GABAergic neurons
innervating the hippocampus are part of a subcortical theta
rhythm generating network involving the brainstem, thalamus,
and hypothalamus (Vertes and Kocsis, 1997). Disruptions of
MS input results in loss of theta power and impaired perfor-
mance in spatial learning (Winson, 1978), disrupted learning
in contextual fear conditioning (Calandreau et al., 2007), and
a slowed rate of acquisition of delayed eyeblink conditioning
(Berry and Thompson, 1979). A striking yet underappreciated
feature of GABAergic septal afferents to the hippocampus is
the extensive targeting of interneurons in CA3 and the hilus
and granule layer of the dentate gyrus (DG) compared to
CA1 (Freund and Antal, 1988). The key role of CA3 pyramidal
cells in the hippocampal circuit is underlined by their bilateral
projections, topographically organized through highly intercon-
nected cell assemblies and providing the numerically largest
innervation to CA1 (Witter, 2007). Interestingly, CA3 inactiva-
tion does not hamper rate coding in CA1; however, it is
required for the emergence of theta sequences (Foster and
Wilson, 2007; Middleton and McHugh, 2016). Furthermore,
the CA3 area and the DG are likely to be involved in distinct
aspects of spatial coding (Neunuebel and Knierim, 2014)
raising the hypothesis that septal GABAergic inputs to the hip-
pocampal subsystems might have distinct connectional and
temporal organization. However, the organization of MS inputs
to hippocampal or cortical areas at single-cell resolution are
largely unknown.
In CA3-CA1, pyramidal cells are active at the trough relative
to dorsal hippocampal CA1 theta oscillations (Csicsvari et al.,
1999; Lasztoczi et al., 2011). This activity is coordinated by
diverse local interneurons of the hippocampus, which provide
temporally coordinated rhythmic inhibition to distinct pyrami-
dal subcellular compartments (Somogyi et al., 2013). Some
of these GABAergic interneurons, e.g., axo-axonic cells (Viney
et al., 2013), do not fire when the pyramidal cells are most
excitable, whereas others (e.g., bistratified and O-LM cells,
Katona et al., 2014) fire maximally together with the overall
population of pyramidal cells. The way these differences
among GABAergic interneurons are brought about in the
network is beginning to emerge from analysis of their long
range synaptic inputs (Leao et al., 2012; Fuhrmann et al.,
2015; Kaifosh et al., 2013). A key missing link is the theta
s. Published by Elsevier Inc.commons.org/licenses/by/4.0/).

firing-phase preferences of subcortical inputs to defined types
of hippocampal interneuron.
Do septo-cortical long-range projection neurons follow
target-region-specific axonal distributions and cell-type-spe-
cific theta-phase firing preferences? In order to define the
contribution of septal inputs at single-cell resolution, we set
out to determine whether rhythmic septal neurons with similar
activity patterns project to the same or distinct hippocampal
areas. We used a combination of extracellular multiunit
recordings, targeted single-neuron recording, and juxtacellular
labeling (Pinault, 1996) in behaving head-fixed mice to reveal
the rules of septo-hippocampal connectivity. Here, we report
the activity patterns of a distinct group of rhythmic MS
GABAergic neurons, named ‘‘Teevra cells,’’ which selectively
target interneurons in spatially restricted domains of the CA3
region of the hippocampus but do not innervate DG or CA2
and only minimally CA1. We have determined their molecular
profiles, synaptic partners, and organizational principles along
the hippocampal septo-temporal axis.
RESULTS
Subpopulations of MS Rhythmic Neurons Based onSpike Train Dynamics: Teevra and Komal NeuronsUsing multichannel extracellular probes, we recorded neuronal
activity in the septum of head-fixed mice (n = 7) during running
(RUN) and pauses (REST) while they navigated on a virtual linear
maze. The location of the probe and recording sites were estab-
lished histologically in fixed brain sections post hoc, and further
analysis was restricted to the cases where several recording
sites were confirmed to be in the medial septum (MS) (n = 4
mice, Figure 1A). The action potential firing frequency of re-
corded neurons in the MS during running varied widely (median:
23.98 Hz; interquartile range [IQR]: 13.4–38.5 Hz, n = 81 neurons)
and was higher than adjacent lateral septal (LS) neurons (me-
dian: 2.55 Hz, IQR: 1–7.1 Hz, n = 18 neurons; Kruskal-Wallis
test, p < 10�8). All MS neurons recorded in this configuration
were phase coupled to ongoing theta oscillations recorded in
dorsal hippocampal CA1, whereas this was the case only for
27% of LS neurons (Rayleigh test, p < 0.05). Thus, MS neurons
differed from adjacent LS neurons both by their firing rate during
locomotion and phase coupling to local field potential (LFP) theta
oscillations in CA1.
Rhythmic burst firing is considered to be a characteristic
feature of MS GABAergic neurons (Borhegyi et al., 2004; Dragoi
et al., 1999; King et al., 1998; Simon et al., 2006). We observed a
striking diversity in the burst duration and extent of rhythmicity of
action potential firing among simultaneously recorded MS neu-
rons (Figure 1A). To capture this, we estimated the burst duration
(see STAR Methods) and calculated a rhythmicity index (RI; see
STAR Methods), which bounded from 0 to 1 in order of
increasing rhythmicity. During RUN periods, simultaneously re-
cordedMS neurons (range: 5 to 19) exhibited varying burst dura-
tion (median: 55 ms, IQR: 40.6–87.9 ms, n = 81 neurons) and
extent of rhythmicity (median: 0.13, IQR: 0.04–0.31, n = 81 neu-
rons). Additionally, the preferential mean firing phase of the
individual cells, collectively, covered the entire theta cycle as
referenced to ongoing LFP theta oscillations in the pyramidal
layer of CA1. We further found that simultaneously recorded in-
dividual MS neurons could increase, decrease, or not change
their mean firing rate between REST and RUN periods, and
this was consistent for a given cell for different periods of the
recording session. In order to capture this behavioral state
dependence, we computed a rate change score from REST to
RUN, which bounded from �1 to 1 (see STAR Methods).
Similar activity dynamics could be identified and measured
from extracellular glass electrode recordings of single MS
neurons in behaving head-fixed mice (n = 65 neurons,
N = 24 mice). Further analysis was restricted to MS neurons
with a rhythmicity index >0.1 from both recording configura-
tions (n = 43 tetrode, n = 46 glass electrode). We have calcu-
lated the rate change score and burst duration for all neurons
(n = 89) and fed them to an unsupervised hierarchical clus-
tering algorithm to explore the characteristics of major clusters
(Figure 1B).
The most populous cluster of MS neurons (group 2; n = 48,
mean silhouette value: 0.74) exhibited negligible change in their
firing rate from REST to RUN (median rate change score: �0.05,
IQR: �0.14–0.005), a high firing rate during RUN (median:
30.5 Hz, IQR: 22.8–51.4 Hz), and a short burst duration (median:
38 ms, IQR: 33.5–42.2 ms, Figure 1C). When we converted the
burst of action potential waveforms to sound, these neurons
had a ‘‘sharp’’ vocalization; therefore, we have named these
Teevra cells (e.g., neuron aj27b_10 in Figure 1C; Movie S1 and
explanation). In contrast, MS neurons in the second largest clus-
ter (group 3; n = 23, mean silhouette value: 0.74) increased their
firing rate from REST to RUN (median rate change score: 0.21,
IQR: 0.16–0.29), had a high firing rate during RUN (median:
41.5 Hz, IQR: 30.6–62.9 Hz), and had a long burst duration
(median: 57 ms, IQR: 53.4–64 ms, Figure 1C); we have named
theseKomal cells based on the ‘‘soft’’ or ‘‘flat’’ sound of the burst
(e.g., neuron aj27b_9 in Figure 1C; see also Movie S1). Teevra
and Komal neurons differed in their burst duration during RUN
(p = 8.73 10�11, Kruskal-Wallis test) and in the firing rate change
score (p = 1.23 10�11, Kruskal-Wallis test), but their mean firing
rate during running periods was not different (p = 0.12, Kruskal-
Wallis test). The activity of the two groups of neurons recorded
by tetrodes also differed in their correlation with running speed,
which was measured by a linear correlation coefficient ‘‘r’’
(Teevra cells, median ‘‘r’’:�0.02, IQR:�0.14–0.11, n = 21; Komal
cells, median r: 0.37, IQR: 0.21–0.53, n = 12; p = 1.5 3 10�5,
Kruskal-Wallis test), individual examples are shown in Figure 1C.
In addition to the two largest groups, group 1 neurons (n = 4)
decreased firing from REST to RUN and had a low mean firing
rate during RUN (median: 7 Hz, IQR: 4–13 Hz), and group 4 neu-
rons (n = 14) increased their firing rate from REST to
RUN (median rate change score: 0.27, IQR: 0.18–0.32) and
had a low firing rate during RUN (median: 14.5 Hz, IQR:
13.2–37.1 Hz).
The mean firing-phase preference of septal neurons with
respect to ongoing theta oscillations recorded in dorsal CA1 pro-
vides information about possible temporal specializations in their
activity and influence.We testedwhether Teevra andKomal neu-
rons were different in the mean firing-phase preference relative
to CA1 theta, a parameter not used in the clustering. The pooled
firing-phase preferences of Teevra and Komal neurons were
Neuron 96, 1342–1357, December 20, 2017 1343

Parameters:
Rate change scoreBurst duration
n=89 neurons
Teevra cells, n=48
Komal cells, n=23
1
2 34
A
D
Komal cellsTeevra cells
1056 1056.5 1057 1057.5
Spikes
0 10 100
2468
Spi
ke c
ount
Mean burst duration: 59.9 ms, theta period
1056 1056.5 1057 1057.5
Spikes
0 10 100
5
1 0
Mean burst duration: 35.3 ms, theta period Time (ms)Interspike interval
Spi
ke c
ount
4 12 20
Firin
g ra
te (H
z)
4 12 2 00
7 0
9 0
Teevra cell (aj27b_10)
Komal cell (aj27b_9)
Firin
g ra
te (H
z)
Speed (cm/s)
Speed (cm/s)
C
0.6
0.8
50
0
7 0
9 0
50
x103
x103Angle: CA1 theta phase Radius: rhythmicity index
8765
321
910111213141516
4
Medial septal neurons
Hippocampal str. pyramidale LFP
400 ms
A
B
MS
MS
Probe location
Tet2
Tet1
Tet3
Tet4
150 μmJetball
MouseReward tube
End of maze
Time (ms)Interspike interval
1 2 3 4
1 2 3 420
60
100
140
p<0.00001
p<0.00001
Bur
st d
urat
ion
(ms)
Rat
e ch
ange
sco
re
- 0.6 0 0.6 1
Group 1
Group 2
Group 3
Group 4
Silhouette value
short burst duration,no change/decrease firing rate
during movement
Long burst duration,increase firing rateduring movement
90
270
-0.6
-0.2
0.20
0.3
0.4
270
180Peak
180Peak
0Trough
0Trough
Figure 1. Subpopulations of MS Rhythmic Neurons Based on Spike Train Dynamics
(A) Simultaneously recorded septal neurons display diverse firing patterns (bottom, ticks) in head-fixed mice running on a Styrofoam ball (top, left). MS neurons
were sampled with a silicon probe (top, middle). Note, DiI painted silicon probe depicts recording location in the MS (top, right).
(B) Hierarchical clustering of strongly rhythmic MS neurons (rhythmicity index > 0.1, n = 89) into four groups based on rate change score and burst duration as
parameters. Left, comparison of rate change score and burst duration for the four groups (median values, Kruskal-Wallis test). Right, silhouette values show high
intra-cluster similarity. Cells in each cluster are ordered by decreasing silhouette value (range, �1 to 1). Large positive values indicate group cohesion for each
point (cell) toward points in its own cluster versus points in other clusters (see STAR Methods for calculation).
(C) Representative simultaneously recorded Teevra and Komal cells show differences in their burst duration. Left, during theta oscillations (s), detected bursts
are shorter for Teevra cell (red horizontal lines, bursts detected; colors identify spikes within a burst; arrows, spikes not detected by the algorithm). Middle, inter-
spike interval histogram of Teevra cell displays an additional peak at <5ms (asterisk) compared to Komal cell. Right, the firing rate of a Teevra cell is notmodulated
by running speed (green, weighted fitting function f = 92.6 Hz – 0.263 s; where s is the speed), whereas that of a Komal cell increases with running speed (purple,
p < 0.005, weighted fitting function f = 60.5 Hz +1.6 3 s; where s is the speed, dashed lines, 95% confidence interval).
(D) Preferential theta phase of firing of Teevra and Komal cells with rhythmicity index as the radius (RUN periods). Most Komal cells (purple) fire preferentially at the
peak of CA1 pyramidal cell layer theta oscillations, whereas most Teevra cells (green) fire phase coupled to the trough with increasing rhythmicity index. See also
Movie S1 and explanation and Figure S2.
1344 Neuron 96, 1342–1357, December 20, 2017

Table 1. Physiological Parameters and Immunohistochemical Analyses of Identified Septo-CA3 Projecting Teevra Neurons
Teevra
Cell ID
Rate (Hz) Rate Change
Score
Mean Burst
Duration (ms)
Phase Preference
(deg), dorsal CA1
Rhythmicity
Target Area
Immunoreactivity
Rest Run RI OF (Hz) PV SATB1 mGluR1a VGAT
AJ42mR 72.4 61.6 �0.1 37.9 341.6 0.73 7.5 CA3/(CA1)R a+ n+ s� t+
AJ37z 46.6 40.1 �0.1 25.8 7.0 0.61 7.2 CA3L u u u u
AJ45hL 28.5 33.4 0.1 49.1 5.7 0.48 6.8 CA3/(CA1)L s+ n+ s� t+
AJ43n 67.1 63.1 0.0 46.9 320.5 0.43 7.4 u d+ n+ s� t+
MS31h 20.5 20.6 0.0 39.1 115.0 0.30 6.2 CA3L u u u u
AJ40yR 30.9 24.6 �0.1 32.4 121.3 0.28 6.9 CA3R d+ n+ s� u
AJ48jL 38.9 33.2 �0.1 26.3 83.6 0.26 6.8 CA3L s+ n+ d� t+
AJ52gR 27.0 27.6 0.0 51.6 357.0 0.14 7.4 CA3R s+ n+ s� u
AJ43lR 28.6 23.4 �0.1 39.4 52.3 0.10 7.7 u s, a� n+ s+ u
MS11ba 31.8 39.7 0.1 56.0 320.3 0.01 6.1 CA3L u u d� u
MS71cL 47.6 49.4 0.0 42.3 34.1 0.14 7.1 CA3L s+ n+ s� u
MS73cL 52.5 34.6 �0.2 36.0 75.0 0.23 6.3 CA3L s+ n+ s� u
MS90ga 36.3 32.7 0.05 44.5 138.6 0.29 7.9 CA3/(CA1)R a+ n+ s� u
Positive (+) or undetectable (�) immunoreactivity within subcellular domain: s, soma; n, nucleus; d, dendrite; a, axon; t, axon terminals; u (unavailable or
inconclusive). Not shown: AJ42m, AJ43l, AJ45h, AJ48j, AJ52 g are immunonegative for NK1 receptor (s, d) and AJ42m, AJ43l, AJ48j, AJ45h are im-
munonegative for vGlut2 (t). (CA1), small extent. Superscripts denote location of soma and axonal terminal in the right (R) or left (L) hemisphere. RI, rhyth-
micity index; OF, oscillatory frequency, RUN periods.aAnimal was not trained. These cells were not included in clustering due to absence of voluntary movement.
significantly different (Figures 1D and S1; p < 0.002, Watson’s U2
test, difference of circular means = 160�), with most Teevra neu-
rons firing preferentially around the trough while most Komal
neurons preferring the peak of dorsal CA1 stratum pyramidale
theta LFP. Note that within both groups there are individual neu-
rons with diverse firing-phase preferences. For Teevra cells, the
trough phase preference correlated with a higher rhythmicity in-
dex (angular-linear correlation coefficient: 0.49, p = 0.003, n = 48,
Figure 1D).
Rhythmic Activity of Teevra Cells Is Coincident withHeightened CA1 ExcitationHaving identified distinct groups ofMS neurons based on activity
dynamics, we selected the largest group, the Teevra cells, which
had the highest rhythmicity index (median: 0.3, IQR: 0.18–0.55,
n = 48), for testing the hypothesis that these neurons represent
a distinct population in the septo-cortical circuit. The rhythmicity
indices of the other groups were group 1 (median: 0.19, IQR:
0.1–0.3, n = 4), group 3 (median: 0.19, IQR: 0.15–0.32, n = 23);
group 4 (median: 0.19, IQR: 0.12–0.29, n = 14) (p = 0.039, 4
groups, Kruskal-Wallis test). The identification of Teevra cells
was achieved by single-unit extracellular recording for cell
selection based on firing patterns, and subsequent juxtacellular
labeling (n = 13; Table 1) to aid their visualization and anatomical
analysis (Figure 2A).
Hippocampal circuit activity is known to be influenced by the
behavioral state of the animal, a feature thought to reflect partic-
ular stage of information processing. To assess the contribution
of Teevra cells to the hippocampal circuit, first we evaluated the
behavioral state dependent change in rhythmicity index from
REST to RUN periods. We found that Teevra cells maintained
rhythmic bursts discharge during both REST and RUN periods
(Figures 2B and 2C), but their rhythmicity increased during RUN
(median rhythmicity index rest: 0.07, IQR: 0.04–0.1;median rhyth-
micity index run: 0.3, IQR: 0.18–0.55, Wilcoxon paired-sample
test, p = 1.6 3 10�09). Consistent with the increase in theta fre-
quency during running (S1awi�nska and Kasicki, 1998), the oscilla-
tory frequency (OF) of Teevra cells also increased during RUN
(median oscillatory frequency rest: 6.4 Hz, IQR: 6.04–6.5 Hz; me-
dian oscillatory frequency run: 7 Hz, IQR: 7–7.34 Hz, Wilcoxon
paired-sample test, p = 4.9 3 10�07). Examples of juxtacellularly
labeled Teevra neurons AJ42m and AJ45h (Figures 2B and 2C)
show such an increase in rhythmicity index and in the oscillatory
frequency of firing. The bursts of Teevra cells often started on
the descending phase of CA1 theta in line with the reported in-
crease in CA3 pyramidal cell firing (Mizuseki et al., 2009).
Next, we explored the activity patterns of Teevra cells during
bouts of REST periods when the hippocampal CA1 field potential
was dominated by large amplitude irregular activity (LIA). Inter-
estingly, firing of Teevra cells coupled to the falling transition of
the LIA following the variable duration of the slow cycles
(Figure 2E) and mirroring the theta trough coupling during
RUN. Thus, during both REST and RUN, Teevra cells become
active at times of LFP troughs, coincident with heightened exci-
tation in CA1 (Mizuseki et al., 2009). Their bursting follows the
frequency at which LFP troughs occur both during regular theta
oscillations and the irregular slower waves at 2–6 Hz, which are
accompanied by high-frequency bursts of Teevra cells at the
negative phase of the wave.
In rats, MS GABAergic cells could be active or inhibited during
sharp wave ripple (SWR) oscillations (Borhegyi et al., 2004;
Dragoi et al., 1999; Viney et al., 2013). Under our behavioral para-
digm of head-fixed mice, sharp wave ripples (130–240 Hz) were
infrequent but could be observed for some Teevra cells (n = 4),
which did not change their firing significantly during ripple events
(Figure 2F) (p > 0.05, two-sample KS test, Katona et al., 2014).
Neuron 96, 1342–1357, December 20, 2017 1345

AJ42m RUN
500 ms
500 ms
RI: 0.26, OF: 6.2 Hz
50 200 350 500
0.2
0.6
1
RI: 0.73, OF:7.5 Hz
Time (ms)
134 ms
CA1 local field potential
Spikes in MS
CA1 local field potential
Spikes in MS
B
Mean rate 72.4 Hz
Mean rate 61.1Hz
CA1 local field potential
Spikes in MS
Spikes in MS
CA1 local field potential
149 ms
500 ms
500 msMean rate 33.43 Hz
Mean rate 28.5 Hz
180 0
180 0
AJ42m REST
AJ45h RUN
AJ45h REST
50 200 350 500
0.2
0.6
1
Time (ms)50 200 350 500
0.2
0.6
1
Time (ms)
50 200 350 500
0.2
0.6
1
Time (ms)
RI: 0.48, OF: 6.6 Hz
AJ42m
AJ45h
C D
0° - Trough 180° - Peak Dorsal CA1 theta
90
2700.5 mV
0.5 mV
0.5 mV
0.5 mV
MS neuron spikes
SomaAxon
Dendrites
Neurobiotin labeled MS neuronJuxtacellular labeling
MS electrodeCA1 electrode
Headplate
CA1 LFP str. pyramidale MouseReward tube
Treadmill
Single-unit extracellular recording Mouse with headplate
A
CA1 local field potential M11b REST
0
0.5
1
1.5
500 ms
CA1 local field potential
Spikes in MS
AJ43n REST
0
10
20
30
40
Cyc
le n
umbe
r N
. firi
ng ra
te (H
z)
-0.4 -0.2 0 0.2 0.4Time (s)
0.2 mV 500 ms0.5 mV
0
20
40
60
80
Spikes in MS
Ripple filtered (120-230 Hz)
-0.4 -0.2 0 0.2 0.4
Rip
ple
num
ber
E F
Firin
g pr
obal
ility
0
1
0.5
x10-3
Time (s)
Schematic SWR
RI: 0.09, OF: 6.2 Hz
Figure 2. Teevra Neurons Fire Rhythmically and Coincident with Increased Hippocampal CA1 Excitation
(A) Single MS neurons and CA1 LFP were recorded extracellularly using glass electrodes in mice alternating between REST and RUN periods on a spherical
treadmill. Teevra neurons preselected based on the sharp burst duration were juxtacellularly labeled with neurobiotin (green).
(B andC) Rhythmic burst firing of Teevra cells AJ42m (B) and AJ45h (C) during RUN (top) and REST (bottom). Local field potential (LFP) in CA1 stratumpyramidale.
Some of the theta trough-centered bursts of MS neuron action potentials relative to CA1 theta oscillations are highlighted (light green). The autocorrelograms
show a slight increase in oscillatory firing frequency (OF) and large increase in the rhythmicity index (RI) during RUN (top) compared to REST (bottom).
(legend continued on next page)
1346 Neuron 96, 1342–1357, December 20, 2017

Teevra Cells Are GABAergic and Immunopositive forParvalbumin and SATB1 but Not for mGluR1a in theSomatic MembraneTeevra cells comprised a distinct subpopulation of MS neurons
based on physiological parameters. Next, we have tested
whether they represent a distinct cell type according to molecu-
lar markers and transmitter phenotype. Labeled Teevra cells
were immunopositive for the calcium binding protein parvalbu-
min (PV, Figure 3A) (n = 9/10 tested), the transcription factor
SATB1 (Figure 3B, n = 10/10 tested), but lacked detectable
immunoreactivity for mGluR1a in the somatic plasmamembrane
(n = 10/11 tested). A weak cytoplasmic signal may represent a
pool of receptor in the endoplasmic reticulum. Approximately
half of the PV+ neurons were immunopositive for SATB1 in the
entire MS complex (unpublished data) and showed all four
possible combinations of immunoreactivity for PV andmGluR1a,
including double-immunonegative neurons. This indicates a dif-
ferentiation among various GABAergicMS neurons to be defined
in future studies with respect to their projections. Labeled Teevra
cells were also tested for molecular phenotype of their boutons;
all tested cells (n = 4/4; Table 1) were immunopositive for VGAT
but not VGlut2 (Figure 3C) confirming that they were GABAergic
and not glutamatergic neurons.
Teevra cells emitted axonal collaterals and boutons in the MS
(n = 5/5 tested). These collaterals targeted mainly PV+ soma or
dendrites (n = 10/11 tested targets, AJ42m axon, Figure 3D;
Table S1). All of the tested neurons innervated on their soma in
the MS were PV+ and SATB1+ (n = 5/5). Varicosities of the
axon of Teevra cell AJ42m were tested for the presence of syn-
apses using labeling for the postsynaptic junction scaffolding
protein gephyrin (Lardi-Studler et al., 2007), and the majority of
boutons formed GABAergic synapses (n = 42/47 tested varicos-
ities, Figure 3D). The identity of the PV+ MS neurons innervated
by Teevra cells remains to be determined. They may be other
Teevra cells synchronized by local interconnections (Leao
et al., 2015) or GABAergic MS neurons projecting to other
cortical areas or different types of interneuron as suggested by
Borhegyi et al. (2004).
GABAergic Teevra Cells Preferentially Innervate theCA3 and Target PV+ Axo-Axonic Cells as well as CCK+
InterneuronsMS GABAergic neurons innervate all hippocampal regions and
many extra-hippocampal cortices (Freund and Antal, 1988;
Unal et al., 2015), though it is not known whether single neurons
innervate one or multiple cortical areas. We are unaware of the
target area visualization of single GABAergic septal neurons
(D) Preferential coupling of spikes to CA1 theta troughs during RUN.
(E) Rhythmic burst firing of a Teevra neuron (AJ43n) during REST, a period domin
Consecutive zero crossings at falling transition of the LFP (red lines) are marked.
correlation of spikes (gray dots) with the timing of slow LFP oscillation cycles. C
duration and marked by red lines; spikes identified within two consecutive cycle
additional burst at �6 Hz between time points marked by red lines.
(F) During ripple oscillations (pink, top), a Teevra neuron (MS11b) does not chang
show sustained activity during ripple epochs (pink bars in the histogram) compare
were aligned to the peak sharp wave ripple power, and pink lines delineate the b
period are colored black. Time 0 is the peak power of each ripple oscillatory eve
with known activity patterns in the literature. Accordingly, to
explain the basis of the influence of Teevra cells on cortical activ-
ity, we tested the distribution of their axonal terminals. All labeled
Teevra cells projected either the left or the right hippocampus.
Among the labeled Teevra cells whose axon could be followed
to branches in the gray matter (n = 11/13), all innervated the
CA3 region of the hippocampus preferentially, and no branches
or varicosities were observed in the DG or CA2 (Figure 3E and 4;
Table 1). The axons of Teevra cells traveled to the hippocampus
either via the dorsal fornix (n = 2) or the fimbria (n = 11). In CA3,
Teevra cells innervated interneurons (Figure 4). Of a total of 472
sampled boutons from 12 coronal hippocampal sections (n = 3
cells, section thickness 70–80 mm), 91.5% of boutons were in
CA3 (n = 432), and only 8.5% boutons were observed in CA1
(n = 40). The main axon terminated in the hippocampus and no
branches were observed in the retrosplenial cortex, the subicu-
lum, the pre- and para-subiculum, or the entorhinal cortex. This
preferential termination in CA3 was accompanied by a septo-
temporal specialization of axonal branching with collaterals
innervating only a restricted septo-temporal domain in CA3.
For single Teevra cells, the majority of axonal branches and bou-
tons were observed only through 5–8 coronal sections (section
thickness: 70–80 mm). Although we cannot exclude the possibil-
ity of incomplete labeling, most terminal axon collaterals ended
in boutons indicating a restricted area of termination. The most
sensitive axon visualization method of horseradish peroxidase
(HRP) reaction following freeze-thaw permeabilization and dia-
minobenzidine (DAB) reaction end-product intensification with
osmium (see STAR Methods) was applied to the full course of
labeled axons to detect potential collateral branches. It is un-
likely that we missed substantial projections to CA1. The intra-
hippocampal spatial positions of the collaterals of the least
rhythmic labeled Teevra cell in temporal CA3 (MS11b) did not
overlap at all with those of the most rhythmic neuron (AJ42m)
in septal CA3, showing the change in rhythmicity together with
spatial progression along the septo-temporal extent of the hip-
pocampal formation.
To test the synaptic targets of Teevra cells in CA3, we analyzed
two labeled Teevra cells (AJ42m and MS90g). The targets of the
few boutons encountered in CA1 were not tested. The axon of
AJ42m was the most strongly labeled as its collateral branches
could be followed to terminal boutons throughout the axonal
arbor in CA3, both by fluorescence microscopy and following
HRP reaction. We determined the molecular characteristics of
22 cellular target profiles (Table S1). In CA3, 18 out of 22
tested targets were PV+, 11 were dendrites, and 7 somata. The
PV+ somatic profiles were all SATB1-immunonegative neurons
ated by large amplitude irregular activity (LIA) in CA1 stratum pyramidale (top).
Spike raster plot (middle) and normalized spike firing histogram (bottom) show
onsecutive LFP zero crossings (>200 ms apart) are ordered according to their
s are colored black; time 0 is the zero crossing of LFP falling transitions. Note
e its firing probability. Spike raster plot (middle) and firing probability (bottom)
d to ±0.4 s (gray) surrounding the peak of sharp wave ripple events. Raster plots
eginnings and end of sharp wave ripples; spikes within the sharp wave ripple
nt.
Neuron 96, 1342–1357, December 20, 2017 1347

* * *
neurobiotinAJ42m soma
SATB1 mGluR1a
10 μm
parvalbuminneurobiotinAJ42m axon
BA
DC
2 μm
neurobiotin gephyrin parvalbumin
merged
5 μm
*
VGATNB NB VGAT VGlut2
5 μm
Varicosities in str. oriensVaricosities in str. pyramidale Varicosities in str. lucidum/radiatum
CA1
CA2
CA3
DGDG
CA1
CA2
E
NB VGlut2
*
10 μm
neurobiotinAJ42m axon in MS
CA3
Dorsal
MedialRostral D
MR
Coronal
Sagittal
200 μm
Dorsal
Rostral Caudal
Ventral
AJ48j
Figure 3. Teevra Neurons Are GABAergic, Innervate PV+ Neurons in the Septum, and Target the Hippocampal CA3 Region
(A and B) Neurobiotin-labeled Teevra neuron; AJ42m was PV+ (A) (magenta, main axon), SATB1+ (B) (cyan, asterisk, nucleus), and immunonegative for mGluR1a
in the plasma membrane (arrowheads) showing only a weak cytoplasmic signal. Note, mGluR1a+ somatic membrane labeling (yellow, arrows) of a neighboring
SATB1+ cell is shown.
(C) Axon terminals of AJ42m (green) were VGAT+ (red, arrows) and VGlut2– (cyan, arrows).
(D) Main axon and local terminals of AJ42m in the MS (green, box) innervating a PV+ soma (magenta, asterisk) in a basket-like formation. Note, gephyrin puncta
(yellow, arrows) outlining the somato-dendritic membrane.
(E) Left, reconstruction of Teevra cell AJ48j in coronal and sagittal views showing a complete ovoid dendritic field (green), soma and main axon (red), and a local
axonal branch with boutons (blue). Right, the axonal varicosities (1003 objective, color coded by layer) of AJ48j in two series of consecutive 80-mm-thick sections
(left, 4 sections; right, 3 sections), showing preferential termination in part of CA3. Coronal sections are rotated to highlight laminar selectivity (D, dorsal; M,medial,
R. rostral).
Imaging details (z-thickness in micrometers, single optical slices unless z-projection type stated): (A) 0.60 mm, (B) 0.32 mm, (C) 0.70 mm, maximum intensity
projection (D, left) 33.60 mm, maximum intensity projection (D, right) 0.37 mm.
1348 Neuron 96, 1342–1357, December 20, 2017

AJ42m
DG
CA1
~ Bregma - 1.34 mm
RUNREST REST
Mean firing rate (Hz)
AJ42m spikes 50
120
Str. radiatum
A
CA1CA3Str. Or
CA3 str. pyr
CA3str. rad
112 boutons, 2 sections
B
152 boutons, 4 sections
CA1CA3Str. Or
CA3 str. pyr
CA3
CA2 DG
CA1
AJ45h ~ Bregma - 2.18 mm
RUN REST
0
75 Mean firing rate (Hz)
AJ45h spikes
DG
CA1
CA3
AJ48j
CA3Str. Or CA3
str rad
CA3str luc
208 boutons, 6 sections
~ Bregma - 2.90 mm
RUN RESTREST
0
100 Mean firing rate (Hz)
AJ48j spikes
1s
C
1s
Str. lucidum
CA3 str. pyr.
*
*
* **
CA3 str. luc.
CA2
CA3 str. pyr.
*
1mV
1s1mV
1mV
10 μm
10 μm
10 μm
CA3
25 μm
25 μm
25 μm
Str. pyramidale
Str. oriens
Str. lucidum
Str. pyramidale
Str. pyramidale
Figure 4. Teevra Neurons Innervate Interneurons in Spatially Restricted Domains of CA3
Teevra neurons were identified on the bases of not changing their mean firing rate during REST versus RUN and short burst duration during CA1 theta (upper
panels). Reconstructions of axonal collaterals (green, boutons) of labeled cells reveal that Teevra neurons, AJ42m (A), AJ45h (B), and AJ48j (C) innervate in-
terneurons in the CA3 region. Innervated interneuron somata (shaded pink) are identified by endogenous biotin in mitochondria. Pie charts show representative
samples of bouton distribution in different areas and layers. Light micrographs of axonal varicosities (arrows) visualized by HRP enzyme reaction adjacent to cell
bodies of individual interneurons (asterisks) rich in endogenous biotin in mitochondria (black in cytoplasm) as revealed by the color reaction.
Neuron 96, 1342–1357, December 20, 2017 1349

(legend on next page)
1350 Neuron 96, 1342–1357, December 20, 2017

(Figures 5A and S2). Another Teevra neuron, MS90g, was more
weakly labeled, and, although we followed the axon and
branches both by fluorescence microscopy and HRP reactions,
the terminal boutons were not well resolved in fluorescence
microscopy. Triple immunoreactions for PV, SATB1, and CCK
in immunofluorescence followed by HRP reaction for bouton
visualization helped to identify 6 innervated somata by light mi-
croscopy. All targeted neurons were PV+ and SATB1 immuno-
negative (Table S1). This combination is a strong indicator of
axo-axonic cells in the CA1 and CA3 areas (Viney et al., 2013).
To demonstrate the remarkable cell-type selectivity of Teevra
cells, we estimated the proportion of PV+ neurons that could be
classified as axo-axonic cells in the CA3 region of mouse hippo-
campus based on their molecular marker combination (30% of
PV cells, Figure S3). This has allowed us to estimate the proba-
bility of the observed number of axo-axonic cells as synaptic tar-
gets, if all PV+ cells were innervated uniformly. The probability for
AJ42m (7 axo-axonic cell targets found sequentially) is p = 0.37 =
2.1 3 10�4, and for MS90g (6 axo-axonic cell targets found
sequentially) is p = 0.36 = 7.2 3 10�4. Therefore, we conclude
that Teevra cells selectively target axo-axonic among PV+ neu-
rons of the CA3 hippocampal area, but this does not exclude
other interneuron types as we also found some CCK+ interneu-
rons (4 somata, AJ42m, Figure 5B) as target cells. These 4
CCK+ targeted profiles were confirmed to be PV–, SATB1–,
somatostatin– (SST), and calbindin– (CB). This combination of
molecular markers is indicative of CCK basket cells (Lasztoczi
et al., 2011) in CA3. Interestingly, both these neuronal popula-
tions fire spikes at the peak or ascending phase of dorsal CA1
pyramidal layer theta LFP oscillations (Somogyi et al., 2013),
out of phase with the trough firing of MS Teevra cells.
Electron microscopic examination of the main axons of Teevra
cells in the fimbria adjacent to the CA3 area showed that they
are covered by myelin sheaths (AJ45h, Figure 5C), which are 2
to 3 times thicker than those of nearby axons of CA3 pyramidal
cells. The main axonal branches in CA3 are also myelinated, and
the terminal collaterals are unmyelinated and 0.1 to 0.3 mm thick
formingboutons inclusters.We tested theprobabilityofpredicting
synaptic junctions based on axonal swellings next to a target cell.
All the boutons in a tested area (n = 11 boutons, AJ45h) formed
type II synaptic junctions (Figure 5C) with two nearby interneuron
somata in CA3b stratum pyramidale (n = 5 and 6 boutons per
soma, respectively). The boutons of AJ42m tested by electron
microscopy (n = 12) were distributed in CA3c strata pyramidale,
lucidum, and radiatum. They formedsynapseswith an interneuron
soma (n = 5 synapses, Figure 5C), 4 interneuron dendrites identi-
Figure 5. Postsynaptic Targets of Teevra Neurons Are PV+ or CCK+ In
(A) Left, Axonal terminals (green) of Teevra cell AJ42m innervate PV+ (magenta
following their dendrites (merged channels). Nearby PV+ and SATB1+ cells (doubl
sequentially reacted and imaged. Right, two innervated cells from left panel cha
(B) Axonal terminals (green, arrows) of Teevra cell AJ42m innervate two interneuro
reactions) in CA3 str. radiatum. Bottom left of image, non-targeted SATB1+ PV-i
(C) Electron micrographs of Teevra cells AJ42m (left) and AJ45h (middle and right)
(d) and two different somata (s) of interneurons. The postsynaptic dendrite receiv
myelinated. Surrounding projection axons (asterisks) in the fimbria have thinner m
(A) left, 34.48 mm SD projection; middle, 9.93 mm SD projection; right, 12.06 mm
and S3.
fied by receiving additional type I synapses (Figure 5C), and 3 un-
identifieddendritic shafts,which receivednoadditional synapse in
the range of sections that were followed.
Rhythmicity of Teevra Cells along the Septo-temporalAxis of the HippocampusTheta oscillations are traveling waves along the septo-temporal
and medio-lateral extent of the hippocampal formation, and the
power but not frequency of theta oscillations decreases along
the longitudinal axis (Lubenov and Siapas, 2009; Patel et al.,
2012; Long et al., 2015). Location of the somata of Teevra cells
relative to the midline of the MS predicted the axonal distribution
in the left or right hippocampus respectively as their axons did
not cross the midline (Table 1). Teevra cells have multiple thick,
long, and non-spiny dendrites originating from the soma. The
dendrites branch infrequently in the septum and may cross the
septal midline (Figure 6A). As Teevra cells innervated distinct
and restricted domains of CA3 along the septo-temporal axis
of the hippocampus, we asked whether the rhythmicity index,
oscillatory frequency, and firing-phase preference of septo-
CA3 projecting Teevra neurons showed any correlation with
the innervated hippocampal area. Using 3D Euclidian distance
along the hippocampal formation (see STAR Methods), we
have observed that the rhythmicity of the firing of septal neurons
decreases the more caudal the termination in the hippocampus
(linear correlation coefficient: r = �0.96, p = 0.0001, n = 8 neu-
rons, Figure 6B), but the oscillatory burst firing at theta frequency
does not change (p = 0.27, n = 8 neurons, Figure 6B). This shows
that the depth of modulation of rhythmic GABAergic input to CA3
from the MS decreases the more caudo-ventral the termination
in CA3. We have also assessed the mean firing-phase distribu-
tion of neurons across the septo-temporal axis and found no cor-
relation between these two variables (angular-linear correlation
coefficient: r = 0.38, p = 0.57, n = 8 neurons).
DISCUSSION
We have demonstrated that a population of septal GABAergic
neurons selectively target the CA3 region, which predicts that
other regions of the hippocampus and related cortical areas
also receive region and target cell-type-specific subcortical in-
puts. This organizational principle endows distinct cell types in
the MS and diagonal band nuclei with a flexible role in coordi-
nating functionally related cortical areas with each parallel
pathway adapted to the specific role and requirements of its
target area. Teevra cells formed the largest subpopulation of
terneurons
, asterisks) and SATB1-negative (cyan) cells in a basket-like formation also
e arrows) and a CCK+ cell (single arrow) were not innervated. CCK and PV were
nnel by channel.
ns (asterisks), which are CCK+ (red) and SATB1– and PV– (magenta, sequential
mmunonegative neuron.
in CA3. Boutons made type II synaptic junctions (single arrows) with a dendrite
ed a type I synapse (double arrows). Right, the main axon of AJ45h is heavily
yelin sheaths. Imaging details (z-thickness in micrometers, z-projection type):
SD projection; (B) 4.00 mm, average intensity projection. See also Figures S2
Neuron 96, 1342–1357, December 20, 2017 1351

Cell id: AJ42m
50 200 350 500
0.2
0.6
1RI: 0.73, OF:7.46 Hz
Time (ms)
Cell id: AJ45h
50 200 350 500
0.2
0.6
1
Time (ms)
RI: 0.48, OF: 6.79 Hz
50 200 350 500
0.2
0.6
1
Cell id: AJ48jRI: 0.26, OF: 6.79 Hz
Cell id: AJ52gRI: 0.14, OF: 7.4 Hz
DG CA2 CA2 DG
CA1
DG
CA1
CA2
DG
CA3
Nor
mal
ized
firin
g ra
te
50 200 350 500
0.2
0.6
1
CA3
A
Time (ms) Time (ms)
septalR
CA3
CA1
CA3
Labe
led
cells
Axo
nal t
erm
inat
ion
area
MS
B
AJ42mAJ45h
AJ48jAJ52g
Septal Temporal
1 2 3 40
0.2
0.4
0.6
0.8
Rhy
thm
icity
inde
x
Distance along Hippocampus (mm)
Distance along Hippocampus (mm)
0
2
4
6
8
Osc
illat
ory
freq.
(Hz)
r = -0.96p = 0.0001
r = -0.44p = 0.27
1 2 3 4
L L R
temporal
AJ42mAJ45h
AJ48jAJ52g
100 μm
Figure 6. The Degree of Rhythmicity of Teevra Neurons Predicts Their Septo-temporal Termination Zone in the CA3
(A) Rhythmicity index (RI), oscillatory frequency (OF), and termination areas (green, dotted) in the CA3 area of labeled septal neurons showing that rhythmicity
index decreases the more caudal the termination in CA3; outlines of the hippocampus (left, L; right, R) were rotated to display them in the same orientation.
Bottom, position of cell bodies in the medial septum (projected onto one coronal plane) and reconstructions of their dendritic trees (AJ45h partial).
(B) Linear negative correlation between rhythmicity index (during RUN) and the septo-temporal termination of the axons along the hippocampus (r = �0.96, p =
0.0001) for all labeled Teevra neurons. There is no correlation between the oscillatory frequency of firing of the neurons during RUN and the termination of the
axons (p = 0.27).
MS rhythmic neurons, which have been hypothesized to be the
coordinators of hippocampal theta oscillations (Alonso et al.,
1987; Gaztelu and Buno, 1982; Gogolak et al., 1968; Petsche
et al., 1962; Stumpf et al., 1962). Teevra neurons have a short
burst duration, do not significantly change their firing rate from
REST to RUN, and fire action potentials at dorsal hippocampal
CA1 troughs recorded in stratum pyramidale, coincident with
the maximal firing of CA1 pyramidal cells (Mizuseki et al., 2009;
Csicsvari et al., 1999).
We focused on neurons showing rhythmicity index of more
than 0.1, and all such cells labeled and tested were
GABAergic, but this does not exclude that less rhythmic
GABAergic neurons also exist in the MS. Identified initially by
their activity patterns, subsequent juxtacellular labeling of
Teevra cells revealed their axonal termination area and synaptic
target neurons. The most remarkable feature of Teevra cells is
their selective termination in restricted spatial domains along
septo-temporal axis of CA3, largely avoiding other hippocampal
areas. These findings reveal an unexpected sophistication in the
spatiotemporal organization of septo-hippocampal projection.
Based on our analysis of the synaptic targets of Teevra cells,
1352 Neuron 96, 1342–1357, December 20, 2017
and assuming that the high-frequency bursts fired at the trough
of the CA1 theta leads to inhibition, we propose that Teevra cells
innervate those CA3 interneurons, such as axo-axonic cells and
CCK basket cells (Lasztoczi et al., 2011; Somogyi et al., 2013),
which preferentially fire around the peak of theta. This would
lead to the disinhibition of CA3 pyramidal cell assemblies
(Toth et al., 1997), driving pyramidal cell firing in CA1 at the
trough of theta in the pyramidal layer. Because axo-axonic cells
do not innervate other interneurons, the coincidence of Teevra
cell firing and the highest discharge probability of pyramidal
cells also supports a disinhibitory role (Figure 7). Consistent
with the proposed disinhibition of CA3 pyramidal cells by Teevra
cells, pyramidal cells fire at the highest rate during the trough of
CA1 theta oscillations in anesthetized rats (Lasztoczi et al.,
2011). In this temporally coordinated circuit, during retrieval of
stored contextual associations around the theta trough (Has-
selmo et al., 2002), disinhibition provided by Teevra cells may
enable the CA3 pyramidal cell output to contribute to temporal
coding in the CA1 ensemble (Fernandez-Ruiz et al., 2017;
Middleton and McHugh, 2016). Such a proposed role remains
to be tested directly.

CA1 Theta phase (deg)
Pro
babi
lity
CA1
CA2
DG
Teevra Cells
??
MS
CA3
GABA GABA GABA
CA3 PC
AAC
CCK BC?
10
30
50
70
180 1800
TC (n=12)AACCCK BC
Firin
g ra
te (H
z)
CA1 PC3
5
1
x10-2
EC
EC
PP
PI
A B
Targets
Figure 7. Theta Firing-Phase Selectivity and
Schematic Summary of the Place of
GABAergic MS Teevra Cells in the Hippo-
campal Circuit
(A) Teevra cells (green) preferentially innervate CA3
axo-axonic (AAC, cyan) and putative CCK-ex-
pressing basket cells (CCK, violet), which in turn
target the axon initial segment and somata of
CA3 pyramidal cells, respectively. The entorhinal
cortical (EC) input to CA1 and CA3 innervates py-
ramidal cells and those GABAergic cells, such as
AACs, which have dendrites in the termination
zone. Pyramidal cells (P) provide recurrent input to
interneurons and to other pyramidal cells and
project to other cortical and subcortical areas
(arrows). The termination area and target cell
selectivity of other GABAergic MS neurons
(magenta, brown, and others) remain to be deter-
mined. One general GABAergic neuron is shown
in CA1 (I, lilac). Dentate granule cells, other types
of GABAergic interneurons, and cholinergic and
glutamatergic MS cells are not shown.
(B) Theta-phase relationships of neurons shown in (A) from recorded data, referenced to dorsal CA1 pyramidal cell layer LFP. On average, Teevra cells (n = 12,
current study) discharge maximally at the trough of CA1 theta oscillations inhibiting AACs (data from Viney et al., 2013, non-anesthetized rat, CA1 and CA2 AACs
averaged) and putative CCK basket cells (Lasztoczi et al., 2011, anesthetized rat, CA3) leading to disinhibition of CA3 pyramidal cells, which provide the largest
excitatory input to CA1 pyramidal cells (average firing probabilities from Mizuseki et al., 2009). The cell-type-specific temporal modulation of firing rates during
theta cycles contributes to the implementation of oscillatory increases and decreases of excitability in pyramidal cell networks via subcellular compartment
specific disinhibition.
Synaptic Targets of Theta Synchronized Teevra Cellsin CA3Following the discovery that septal GABAergic neurons selec-
tively innervate hippocampal interneurons (Freund and Antal,
1988), it was hypothesized that PV+ septal neurons firing at the
peak of CA1 theta inhibit both trough firing MS neurons and
GABAergic hippocampal neurons that innervated pyramidal
cell dendrites in CA1; in turn, theta trough-preferring MS neurons
innervate both the peak firing MS neurons and ‘‘peri-somatic’’
terminating inhibitory cells in CA1 (Borhegyi et al., 2004). Indeed,
some trough-preferring Teevra cells innervate other PV+ MS
neurons, but the firing phase of these target cells is unknown.
Moreover, none of the theta trough-firing rhythmic Teevra cells
innervated the CA1 significantly and instead targeted PV+ axo-
axonic cells and CCK+ cells in the CA3. The binary phase prefer-
ence hypothesis is also complicated by the fact that both hippo-
campal GABAergic cells (Klausberger and Somogyi 2008) and
theta rhythmically firing GABAergic MS neurons fire at all phases
of CA1 theta. The key missing information for explaining this
diversity has been the axonal area and target cell preference of
any septal neuron with known theta-phase firing. The Teevra
cells reported here show one example of a sophisticated and
highly selective septo-hippocampal connection.
Information on the firing-phase preference of identified CA3 in-
terneurons is sparse in awake animals. In anaesthetized rats,
identified axo-axonic cells in CA3 fired bursts of spikes at the
peak of dorsal CA1 theta oscillations (Varga et al., 2014; Viney
et al., 2013). Axo-axonic cells innervate exclusively the axon
initial segment of pyramidal neurons, which is particularly well
developed in CA3 with up to 150 synapses on a single-axon
initial segment (Kosaka, 1980). Their action is mediated by
GABAA receptors (Buhl et al., 1994) with fast (�1.7 ms) inhibitory
postsynaptic currents in their synaptic targets (Ganter et al.,
2004), at the site where the action potential is generated. Inter-
neurons expressing CCK also fire spikes at around the peak of
CA1 theta oscillations (Lasztoczi et al., 2011). Thus, the axo-ax-
onic and CCK target cells, postsynaptic to Teevra neurons, fire
preferentially at the theta peak, counter-phased with the rhyth-
mic input from Teevra cells at the trough of theta. This counter-
phase firing has been suggested earlier for CA1 (Somogyi
et al., 2013) and might indeed be a biological mechanism of
theta-phase modulation of long-range synaptic partners. How-
ever, theta peak firing MS neurons with long burst duration had
no terminals in the CA1 or CA3, but instead their main axon pro-
jected beyond the hippocampus likely innervating extrahippo-
campal structures. Our results do not exclude the innervation
of various other interneuron types by Teevra cells in CA3 such
as PV+ basket cells, which fire phase locked to the trough of
CA1 theta (Tukker et al., 2013), but coincident firingwith and syn-
aptic input from Teevra cells is unlikely. It is possible that other
MS GABAergic neuronal types with theta-phase preference
different from Teevra cells also innervate CA3. Besides a domi-
nant role of septal GABAergic neurons in determining interneu-
ronal firing-phase preference, interaction with other rhythmic
synaptic inputs, e.g., from the raphe nuclei, supramammillary
nucleus, and from local interneurons and pyramidal cells, may
also contribute to the determination of theta-phase firing prefer-
ence of interneurons. The effects of a potential synaptic influ-
ence of CCK-expressing interneurons, which are innervated by
Teevra cell, on axo-axonic cells, similar to PV+ basket cells inner-
vated by CCK+ interneurons in CA1 (Karson et al., 2009) remain
to be tested.
Synaptic inputs to CA1 are temporally organized within theta
and gamma timescales. The CA3 pyramidal cell input at the
Neuron 96, 1342–1357, December 20, 2017 1353

trough and descending phase of CA1 pyramidal layer theta coin-
cides with slow gamma (30–80 Hz) oscillations, while the me-
dium gamma (60–120 Hz) is coupled to the peak of pyramidale
theta oscillations (Fernandez-Ruiz et al., 2017; Lasztoczi and
Klausberger, 2014; Schomburg et al., 2014). It was previously
suggested that MS neuronal firing at gamma intraburst fre-
quencies (30–120 Hz) might contribute to these oscillations (Bo-
rhegyi et al., 2004; Viney et al., 2013). However, two oscillations
occurring at the same frequency might not lead to amplification
unless they are phase coupled. Unlike under anesthesia, MS
Teevra neurons in awake animals, on average, had higher intra-
burst frequencies than medium gamma (up to 300 Hz during
RUN). The phase coupling of Teevra cell spikes to various
gamma oscillations, especially putative CA3 coordinated slow
gamma, remains to be investigated with multielectrode arrays
to reveal current sources.
Teevra Cell Firing Is Modulated over MultipleTimescales: Within Theta Cycles and during Rest andRunningA fascinating feature of firing of Teevra cells is that the firing rate
did not change from rest to running significantly or could even
decrease during RUN. This is in contrast to the firing of most
CA1 interneurons, which increased their firing rate from rest
to running periods (Czurko et al., 2011; Varga et al., 2012)
possibly due to a combination of decreased inhibition from MS
GABAergic cells, increased excitatory input from CA3 pyramidal
cells and/or long range inputs (Fuhrmann et al., 2015). Although
the firing rate of Teevra cells may not be different during REST
and RUN periods, the temporal dynamics of firing pattern
changed with a clear increase in the rhythmicity index and oscil-
latory frequency during running. If on average each action poten-
tial provides a similar amount of GABA released at the synaptic
terminals, why do Teevra cells maintain a high level of GABA
release during rest when their targets are much less theta rhyth-
mic? We have shown that Teevra cells continue to fire at the
negative deflections of slow irregular activity, increasing their
firing around the hippocampal LFP troughs, irrespective of the
frequency at which these occur, mirroring the heightened excita-
tion in CA1.
Sharp wave ripple episodes are more frequent during rest and
consummatory behavior representing the highest population ac-
tivity in the hippocampus. During sharp wave ripples, some MS
GABAergic neurons are strongly active (Borhegyi et al., 2004;
Viney et al., 2013) while others are inhibited (Borhegyi et al.,
2004; Dragoi et al., 1999) or do not change their firing like Teevra
cells. MS GABAergic cells are innervated by hippocampo-septal
GABAergic projection neurons (Toth et al., 1993), which are
strongly activated during sharp wave ripple events (Jinno et al.,
2007; Katona et al., 2017). These MS cells might correspond to
the sharp wave ripple inhibited rhythmic population (Dragoi
et al., 1999). Teevra cells on the other hand did not change their
firing rate during sharp wave ripples suggesting that these are
not targets of hippocampo-septal projection neurons. Thus, dur-
ing REST periods, Teevra cells differentiated between sharp
wave ripples and the less regular duration increased hippocam-
pal excitability events, when their firing was strongly coupled to
hippocampal LFP troughs.
1354 Neuron 96, 1342–1357, December 20, 2017
Teevra Cells Spatial Organization and TravelingTheta WavesThe power of theta oscillations decreases along the longitudinal
hippocampal axis and the phase of theta shifts by 180� across
the septo-temporal extent of the hippocampus (Lubenov and
Siapas, 2009; Patel et al., 2012). Strikingly, we have found a
strong correlation of the rhythmicity of Teevra neurons along
the longitudinal axis. Highly rhythmic septal Teevra neurons
innervate interneurons in the septal pole and less rhythmic neu-
rons innervate interneurons in the temporal pole of the hippo-
campus, while the oscillatory frequency at which MS input is
organized does not change along this axis. This parallels the
decrease in theta power and reduction in theta rhythmic neurons
in ventral compared to dorsal CA3 (Royer et al., 2010).
Multiple mechanisms have been suggested for the generation
of theta waves. One of the suggestions was the existence of a
chain of oscillators residing within the septal area and theta
waves would be a reflection of the phase delayed septal outputs
(Patel et al., 2012). The septo-temporally restricted axons
demonstrated here could support mechanisms of locally vari-
able theta oscillations, as suggested by Kang et al. (2015). How-
ever, we have found no correlation between the firing-phase
preference and position of the axon.
The axons of septal GABAergic neurons are heavily myelin-
ated (Borhegyi et al., 2004), which we confirmed here, and
exhibit high conduction velocities (0.5–5 m/s, Jones et al.,
1999). Thus, the conduction delay is unlikely to contribute to a
significant delay of transmission as it is an order of magnitude
faster than the propagation velocity (0.16 m/s, Patel et al.,
2012) of theta waves. However, delays of similar theta wave ve-
locity were reported in hippocampal CA3 slices in vitro (Miles
et al., 1988) while blocking glutamatergic transmission; thus,
the hippocampal system is capable of generating such a wave
through inhibitory connections. In vivo, the uniquely positioned
Teevra neurons might provide a temporally coherent synchro-
nizedGABAergic input, which rhythmically inhibits CA3 interneu-
rons along the hippocampal long axis, thus coordinating pyrami-
dal cell excitability.
OutlookWe have defined a novel septo-hippocampal GABAergic cell
type using congruent neuronal features including physiological
parameters, molecular expression profiles, and axonal termina-
tion area. The results demonstrate the cellular diversity in the MS
and provide a spatiotemporal framework for understanding the
long-range, parallel subcortical innervation, which coordinates
network oscillations in the cortex via local inhibitory neurons.
We hypothesize that such cortical region-specific GABAergic
innervation by physiologically distinct septal neuronal types sup-
ports the coordination of network oscillations.
STAR+METHODS
Detailed methods are provided in the online version of this paper
and include the following:
d KEY RESOURCES TABLE
d CONTACT FOR REAGENT AND RESOURCE SHARING

d EXPERIMENTAL MODEL AND SUBJECT DETAILS
d METHOD DETAILS
B Surgery
B Behavioral procedures
B Recordings and single unit identification
B Juxtacellular labeling
B Tissue processing and immunohistochemistry
B Anatomical data analysis
B Calculation of 3D distance in the hippocampus
B Electrophysiological data analysis
B Hierarchical clustering
d QUANTIFICATION AND STATISTICAL ANALYSIS
d DATA AND SOFTWARE AVAILABILITY
SUPPLEMENTAL INFORMATION
Supplemental Information includes three figures, one table, and two movies
and can be found with this article online at https://doi.org/10.1016/j.neuron.
2017.10.033.
A video abstract is available at https://doi.org/10.1016/j.neuron.2017.10.
033#mmc5.
AUTHOR CONTRIBUTIONS
Conceptualization, A.J. and P.S.; Methodology, A.J., M.S., T.J.V., D.D.,
and P.S.; Investigation, A.J., M.S., and P.S.; Writing – Original Draft, A.J.;
Writing – Review & Editing, M.S., T.J.V., D.D., and P.S.; Funding Acquisition,
D.D. and P.S.; Supervision, D.D., P.S., and T.J.V.
ACKNOWLEDGMENTS
We would like to thank Linda Katona for training and critical advice during the
course of the project. We thank Rob Stewart and Linda Katona for providing
scripts for rhythmicity and sharp wave ripple analysis. We thank Thomas
Klausberger and Balint Lasztoczi for training and advice on analyzing the
slow irregular activity. We thank Vitor Lopes dos Santos, Balazs Hangya, Ste-
phanie Trouche, and John Tukker for comments on an earlier version of the
manuscript. We thank Michael Howarth for 3D reconstruction of AJ48j and
Amar Sharma for somato-dendritic reconstructions. We thank Kristina Wag-
ner, Ben Micklem, and Katja Hartwich for excellent technical assistance and
Joszef Somogyi for advice on confocal microscopy. A.J. was funded by Felix
scholarship, Oxford. The virtual reality setup was funded to D.D. by the
Medical Research Foundation (award C0443). The research was supported
by the Medical Research Council UK (awards MC_UU_12024/4 and
MC_UU_12024/3) and the Wellcome Trust (award 108726/Z/15/Z).
Received: June 19, 2017
Revised: August 23, 2017
Accepted: October 25, 2017
Published: November 30, 2017
REFERENCES
Alonso, A., Gaztelu, J.M., Buno, W., Jr., and Garcıa-Austt, E. (1987). Cross-
correlation analysis of septohippocampal neurons during theta-rhythm.
Brain Res. 413, 135–146.
Amaral, D.G., and Witter, M.P. (1989). The three-dimensional organization of the
hippocampal formation: A review of anatomical data. Neuroscience 31, 571–591.
Bakker, R., Tiesinga, P., and Kotter, R. (2015). The Scalable Brain Atlas: Instant
web-based access topublic brain atlases and related content. Neuroinformatics
13, 353–366.
Berry, S.D., and Thompson, R.F. (1979). Medial septal lesions retard classical
conditioning of the nicitating membrane response in rabbits. Science 205,
209–211.
Borhegyi, Z., Varga, V., Szilagyi, N., Fabo, D., and Freund, T.F. (2004). Phase
segregation of medial septal GABAergic neurons during hippocampal theta
activity. J. Neurosci. 24, 8470–8479.
Brun, V.H., Leutgeb, S., Wu, H.Q., Schwarcz, R., Witter, M.P., Moser, E.I., and
Moser, M.-B. (2008). Impaired spatial representation in CA1 after lesion of
direct input from entorhinal cortex. Neuron 57, 290–302.
Buhl, E.H., Han, Z.S., Lorinczi, Z., Stezhka, V.V., Karnup, S.V., and Somogyi, P.
(1994). Physiological properties of anatomically identified axo-axonic cells in
the rat hippocampus. J. Neurophysiol. 71, 1289–1307.
Buzsaki, G. (1984). Feed-forward inhibition in the hippocampal formation.
Prog. Neurobiol. 22, 131–153.
Calandreau, L., Jaffard, R., and Desmedt, A. (2007). Dissociated roles for the
lateral and medial septum in elemental and contextual fear conditioning.
Learn. Mem. 14, 422–429.
Csicsvari, J., Hirase, H., Czurko, A., Mamiya, A., and Buzsaki, G. (1999).
Oscillatory coupling of hippocampal pyramidal cells and interneurons in the
behaving Rat. J. Neurosci. 19, 274–287.
Czurko, A., Huxter, J., Li, Y., Hangya, B., and Muller, R.U. (2011). Theta phase
classification of interneurons in the hippocampal formation of freely moving
rats. J. Neurosci. 31, 2938–2947.
Dragoi, G., Carpi, D., Recce, M., Csicsvari, J., and Buzsaki, G. (1999).
Interactions between hippocampus and medial septum during sharp waves
and theta oscillation in the behaving rat. J. Neurosci. 19, 6191–6199.
Fernandez-Ruiz, A., Oliva, A., Nagy, G.A., Maurer, A.P., Berenyi, A., and
Buzsaki, G. (2017). Entorhinal-CA3 dual-input control of spike timing in the
hippocampus by theta-gamma coupling. Neuron 93, 1213–1226.e5.
Ferraguti, F., Cobden, P., Pollard, M., Cope, D., Shigemoto, R., Watanabe, M.,
and Somogyi, P. (2004). Immunolocalization of metabotropic glutamate recep-
tor 1a (mGluR1a) in distinct classes of interneuron in the CA1 region of the rat
hippocampus. Hippocampus 14, 193–215.
Foster, D.J., and Wilson, M.A. (2007). Hippocampal theta sequences.
Hippocampus 17, 1093–1099.
Freund, T.F., and Antal, M. (1988). GABA-containing neurons in the septum
control inhibitory interneurons in the hippocampus. Nature 336, 170–173.
Fuhrmann, F., Justus, D., Sosulina, L., Kaneko, H., Beutel, T., Friedrichs, D.,
Schoch, S., Schwarz, M.K., Fuhrmann, M., and Remy, S. (2015). Locomotion,
theta oscillations, and the speed-correlated firing of hippocampal neurons are
controlled by a medial septal glutamatergic circuit. Neuron 86, 1253–1264.
Ganter, P., Sz€ucs, P., Paulsen, O., and Somogyi, P. (2004). Properties of hor-
izontal axo-axonic cells in stratum oriens of the hippocampal CA1 area of rats
in vitro. Hippocampus 14, 232–243.
Gaztelu, J.M., and Buno, W., Jr. (1982). Septo-hippocampal relationships dur-
ing EEG theta rhythm. Electroencephalogr. Clin. Neurophysiol. 54, 375–387.
Gielow, M.R., and Zaborszky, L. (2017). The Input-output relationship of the
cholinergic basal forebrain. Cell Rep. 18, 1817–1830.
Gogolak, G., Stumpf, C., Petsche, H., and Sterc, J. (1968). The firing pattern of
septal neurons and the form of the hippocampal theta wave. Brain Res. 7,
201–207.
Gray, E.G. (1959). Axo-somatic and axo-dendritic synapses of the cerebral
cortex: An electron microscope study. J. Anat. 93, 420–433.
Harris, K.D., Henze, D.A., Czicvari, J., Hirase, H., and Buzsaki, G. (2000).
Accuracy of tetrode spike separation as determined by simultaneous intracel-
lular and extracellular measurements. J. Neurophysiol. 84, 401–414.
Hasselmo, M.E., Bodelon, C., and Wyble, B.P. (2002). A proposed function for
hippocampal theta rhythm: Separate phases of encoding and retrieval
enhance reversal of prior learning. Neural Comput. 14, 793–817.
Huh, C.Y.L., Goutagny, R., and Williams, S. (2010). Glutamatergic neurons of
the mouse medial septum and diagonal band of Broca synaptically drive hip-
pocampal pyramidal cells: Relevance for hippocampal theta rhythm.
J. Neurosci. 30, 15951–15961.
Jinno, S., Klausberger, T., Marton, L.F., Dalezios, Y., Roberts, J.D.,
Fuentealba, P., Bushong, E.A., Henze, D., Buzsaki, G., and Somogyi, P.
Neuron 96, 1342–1357, December 20, 2017 1355

(2007). Neuronal diversity in GABAergic long-range projections from the hip-
pocampus. J. Neurosci. 27, 8790–8804.
Jones, G.A., Norris, S.K., and Henderson, Z. (1999). Conduction velocities and
membrane properties of different classes of rat septohippocampal neurons re-
corded in vitro. J. Physiol. 517, 867–877.
Justus, D., Dal€ugge, D., Bothe, S., Fuhrmann, F., Hannes, C., Kaneko, H.,
Friedrichs, D., Sosulina, L., Schwarz, I., Elliott, D.A., et al. (2017). Glutamatergic
synaptic integration of locomotion speed via septoentorhinal projections. Nat.
Neurosci. 20, 16–19.
Kadir, S.N., Goodman, D.F.M., and Harris, K.D. (2014). High-dimensional clus-
ter analysis with the masked EM algorithm. Neural Comput. 26, 2379–2394.
Kaifosh, P., Lovett-Barron, M., Turi, G.F., Reardon, T.R., and Losonczy, A.
(2013). Septo-hippocampal GABAergic signaling across multiple modalities
in awake mice. Nat. Neurosci. 16, 1182–1184.
Kang, D., Ding, M., Topchiy, I., Shifflett, L., and Kocsis, B. (2015). Theta-rhyth-
mic drive between medial septum and hippocampus in slow-wave sleep and
microarousal: A Granger causality analysis. J. Neurophysiol. 114, 2797–2803.
Karson, M.A., Tang, A.-H., Milner, T.A., and Alger, B.E. (2009). Synaptic cross
talk between perisomatic-targeting interneuron classes expressing cholecys-
tokinin and parvalbumin in hippocampus. J. Neurosci. 29, 4140–4154.
Katona, L., Lapray, D., Viney, T.J., Oulhaj, A., Borhegyi, Z., Micklem, B.R.,
Klausberger, T., and Somogyi, P. (2014). Sleep and movement differentiates
actions of two types of somatostatin-expressing GABAergic interneuron in
rat hippocampus. Neuron 82, 872–886.
Katona, L., Micklem, B., Borhegyi, Z., Swiejkowski, D.A., Valenti, O., Viney,
T.J., Kotzadimitriou, D., Klausberger, T., and Somogyi, P. (2017). Behavior-
dependent activity patterns of GABAergic long-range projecting neurons in
the rat hippocampus. Hippocampus 27, 359–377.
King, C., Recce, M., and O’Keefe, J. (1998). The rhythmicity of cells of the
medial septum/diagonal band of Broca in the awake freely moving rat:
Relationships with behaviour and hippocampal theta. Eur. J. Neurosci. 10,
464–477.
Klausberger, T., and Somogyi, P. (2008). Neuronal diversity and temporal dy-
namics: The unity of hippocampal circuit operations. Science 321, 53–57.
Kosaka, T. (1980). The axon initial segment as a synaptic site: Ultrastructure
and synaptology of the initial segment of the pyramidal cell in the rat hippo-
campus (CA3 region). J. Neurocytol. 9, 861–882.
Lardi-Studler, B., Smolinsky, B., Petitjean, C.M., Koenig, F., Sidler, C., Meier,
J.C., Fritschy, J.M., and Schwarz, G. (2007). Vertebrate-specific sequences in
the gephyrin E-domain regulate cytosolic aggregation and postsynaptic clus-
tering. J. Cell Sci. 120, 1371–1382.
Lasztoczi, B., and Klausberger, T. (2014). Layer-specific GABAergic control of
distinct gamma oscillations in the CA1 hippocampus. Neuron 81, 1126–1139.
Lasztoczi, B., Tukker, J.J., Somogyi, P., and Klausberger, T. (2011). Terminal
field and firing selectivity of cholecystokinin-expressing interneurons in the
hippocampal CA3 area. J. Neurosci. 31, 18073–18093.
Leao, R.N., Mikulovic, S., Leao, K.E., Munguba, H., Gezelius, H., Enjin, A.,
Patra, K., Eriksson, A., Loew, L.M., Tort, A.B., and Kullander, K. (2012). OLM
interneurons differentially modulate CA3 and entorhinal inputs to hippocampal
CA1 neurons. Nat. Neurosci. 15, 1524–1530.
Leao, R.N., Targino, Z.H., Colom, L.V., and Fisahn, A. (2015). Interconnection
and synchronization of neuronal populations in the mouse medial septum/di-
agonal band of Broca. J. Neurophysiol. 113, 971–980.
Long, L.L., Bunce, J.G., and Chrobak, J.J. (2015). Theta variation and spatio-
temporal scaling along the septotemporal axis of the hippocampus. Front.
Syst. Neurosci. 9, 37.
Lubenov, E.V., and Siapas, A.G. (2009). Hippocampal theta oscillations are
travelling waves. Nature 459, 534–539.
Middleton, S.J., and McHugh, T.J. (2016). Silencing CA3 disrupts temporal
coding in the CA1 ensemble. Nat. Neurosci. 19, 945–951.
1356 Neuron 96, 1342–1357, December 20, 2017
Miles, R., Traub, R.D., and Wong, R.K. (1988). Spread of synchronous firing in
longitudinal slices from the CA3 region of the hippocampus. J. Neurophysiol.
60, 1481–1496.
Mizuseki, K., Sirota, A., Pastalkova, E., and Buzsaki, G. (2009). Theta oscilla-
tions provide temporal windows for local circuit computation in the entorhi-
nal-hippocampal loop. Neuron 64, 267–280.
Morino, P., Herrera-Marschitz, M., Castel, M.N., Ungerstedt, U., Varro, A.,
Dockray, G., and Hokfelt, T. (1994). Cholecystokinin in Cortico-striatal
Neurons in the Rat: Immunohistochemical Studies at the Light and Electron
Microscopical Level. Eur. J. Neurosci. 6, 681–692.
Neunuebel, J.P., and Knierim, J.J. (2014). CA3 retrieves coherent representa-
tions from degraded input: Direct evidence for CA3 pattern completion and
dentate gyrus pattern separation. Neuron 81, 416–427.
Patel, J., Fujisawa, S., Berenyi, A., Royer, S., and Buzsaki, G. (2012). Traveling
theta waves along the entire septotemporal axis of the hippocampus. Neuron
75, 410–417.
Petsche, H., Stumpf, C., and Gogolak, G. (1962). [The significance of the
rabbit’s septum as a relay station between themidbrain and the hippocampus.
I. The control of hippocampus arousal activity by the septum cells].
Electroencephalogr. Clin. Neurophysiol. 14, 202–211.
Pinault, D. (1996). A novel single-cell staining procedure performed in vivo un-
der electrophysiological control: Morpho-functional features of juxtacellularly
labeled thalamic cells and other central neurons with biocytin or Neurobiotin.
J. Neurosci. Methods 65, 113–136.
Robinson, J., Manseau, F., Ducharme, G., Amilhon, B., Vigneault, E., El
Mestikawy, S., and Williams, S. (2016). Optogenetic activation of septal
glutamatergic neurons drive hippocampal theta rhythms. J. Neurosci. 36,
3016–3023.
Royer, S., Sirota, A., Patel, J., and Buzsaki, G. (2010). Distinct representations
and theta dynamics in dorsal and ventral hippocampus. J. Neurosci. 30,
1777–1787.
Schindelin, J., Arganda-Carreras, I., Frise, E., Kaynig, V., Longair, M., Pietzsch,
T., Preibisch, S., Rueden, C., Saalfeld, S., Schmid, B., et al. (2012). Fiji: An
open-source platform for biological-image analysis. Nat. Methods 9, 676–682.
Schomburg, E.W., Fernandez-Ruiz, A., Mizuseki, K., Berenyi, A., Anastassiou,
C.A., Koch, C., and Buzsaki, G. (2014). Theta phase segregation of input-spe-
cific gamma patterns in entorhinal-hippocampal networks. Neuron 84,
470–485.
Simon, A.P., Poindessous-Jazat, F., Dutar, P., Epelbaum, J., and Bassant,
M.-H. (2006). Firing properties of anatomically identified neurons in the medial
septum of anesthetized and unanesthetized restrained rats. J. Neurosci. 26,
9038–9046.
S1awi�nska, U., and Kasicki, S. (1998). The frequency of rat’s hippocampal
theta rhythm is related to the speed of locomotion. Brain Res. 796, 327–331.
Sloviter, R.S., and Nilaver, G. (1987). Immunocytochemical localization of
GABA-, cholecystokinin-, vasoactive intestinal polypeptide-, and somato-
statin-like immunoreactivity in the area dentata and hippocampus of the rat.
The Journal of Comparative Neurology 256, 42–60.
Somogyi, P., Katona, L., Klausberger, T., Lasztoczi, B., and Viney, T.J. (2013).
Temporal redistribution of inhibition over neuronal subcellular domains under-
lies state-dependent rhythmic change of excitability in the hippocampus.
Philos. Trans. R. Soc. Lond. B Biol. Sci. 369. Published online December 23,
2013. https://doi.org/10.1098/rstb.2012.0518.
Stumpf, C., Petsche, H., and Gogolak, G. (1962). The significance of the rab-
bit’s septum as a relay station between the midbrain and the hippocampus. II.
The differential influence of drugs upon both the septal cell firing pattern and
the hippocampus theta activity. Electroencephalogr. Clin. Neurophysiol. 14,
212–219.
Toth, K., Borhegyi, Z., and Freund, T.F. (1993). Postsynaptic targets of
GABAergic hippocampal neurons in the medial septum-diagonal band of
broca complex. J. Neurosci. 13, 3712–3724.

Toth, K., Freund, T.F., andMiles, R. (1997). Disinhibition of rat hippocampal py-
ramidal cells by GABAergic afferents from the septum. J. Physiol. 500,
463–474.
Tukker, J.J., Lasztoczi, B., Katona, L., Roberts, J.D., Pissadaki, E.K., Dalezios,
Y., Marton, L., Zhang, L., Klausberger, T., and Somogyi, P. (2013). Distinct
dendritic arborization and in vivo firing patterns of parvalbumin-expressing
basket cells in the hippocampal area CA3. J. Neurosci. 33, 6809–6825.
Unal, G., Joshi, A., Viney, T.J., Kis, V., and Somogyi, P. (2015). Synaptic
Targets of medial septal projections in the hippocampus and extrahippocam-
pal cortices of the mouse. J. Neurosci. 35, 15812–15826.
Varga, C., Golshani, P., and Soltesz, I. (2012). Frequency-invariant temporal
ordering of interneuronal discharges during hippocampal oscillations in awake
mice. Proc. Natl. Acad. Sci. USA 109, E2726–E2734.
Varga, C., Oijala, M., Lish, J., Szabo, G.G., Bezaire, M., Marchionni, I.,
Golshani, P., and Soltesz, I. (2014). Functional fission of parvalbumin inter-
neuron classes during fast network events. eLife 3. Published online
November 6, 2014. https://doi.org/10.7554/eLife.04006.
Vertes, R.P., and Kocsis, B. (1997). Brainstem-diencephalo-septohippocam-
pal systems controlling the theta rhythm of the hippocampus. Neuroscience
81, 893–926.
Viney, T.J., Lasztoczi, B., Katona, L., Crump, M.G., Tukker, J.J., Klausberger,
T., and Somogyi, P. (2013). Network state-dependent inhibition of identified
hippocampal CA3 axo-axonic cells in vivo. Nat. Neurosci. 16, 1802–1811.
Winson, J. (1978). Loss of hippocampal theta rhythm results in spatial memory
deficit in the rat. Science 201, 160–163.
Witter, M.P. (2007). Intrinsic and extrinsic wiring of CA3: Indications for
connectional heterogeneity. Learn. Mem. 14, 705–713.
Witter, M.P., Griffioen, A.W., Jorritsma-Byham, B., and Krijnen, J.L.M. (1988).
Entorhinal projections to the hippocampal CA1 region in the rat: An underesti-
mated pathway. Neurosci. Lett. 85, 193–198.
Zar, J.H. (1999). Biostatistical Analysis, Fourth Edition (Prentice-Hall, Inc.).
Neuron 96, 1342–1357, December 20, 2017 1357

STAR+METHODS
KEY RESOURCES TABLE
REAGENT or RESOURCE SOURCE IDENTIFIER
Antibodies
Calbindin (CB) [host Rb; Dil 1:5000] Swant Cat. No. CB 38; RRID:AB_10000340
Calretinin (CR) [host Rb; Dil 1:500] Swant Cat. No. 7699/3H; RRID:AB_10000321
Metabotropic glutamate receptor 1a
(mGluR1a) [host Gp; Dil 1:1000]
Frontier Institute Cat. No. mGluR1a-GP-Af660;
RRID:AB_2531897
Parvalbumin (PV) [host Rb; Dil 1:1000] Swant Cat. No. PV 28; RRID:AB_2315235
PV [host Gt; Dil 1:1000] Swant Cat. No. PVG 214; RRID:AB_10000345
PV [host Gp; Dil 1:5000] Synaptic Systems Cat. No. 195 004; RRID:AB_2156476
Pro-cholecystokinin (pro-CCK) [host Rb;
Dil 1:500]
April 2005 gift (similar to Frontier Institute,
CCK-pro-Rb-Af350)
Similar labeling to two non-commercial
antibodies characterized by Sloviter
and Nilaver (1987); Morino et al. (1994)
SATB1 (N-14) [host Rb; Dil 1:200] Abcam Cat. No. ab70004; RRID:AB_1270545
SATB1 (N-14) [host Gt; Dil 1:200] Santa Cruz Cat. No. sc-5989; RRID:AB_2184337
Somatostatin (SOM) [host Ms; Dil 1:500] GeneTex Cat. No. GTX71935; RRID:AB_383280
Somatostatin (SOM) [host Rb; Dil 1:50] GenWay Biotech Cat. No. 18-783-76392; RRID:AB_1027453
Vesicular GABA transporter (VGAT) [host
Rb; Dil 1:500]
Synaptic Systems Cat. No. 131 003; RRID:AB_887869
VGAT [host Gp; Dil 1:500] Synaptic Systems Cat. No. 131 004; RRID:AB_887873
Vesicular Glutamate transporter (VGlut2)
[host Gp; Dil 1:2000]
Synaptic Systems Cat. No. 135 404; RRID:AB_887884
Chemicals, Peptides, and Recombinant Proteins
Neurobiotin Tracer Vector Laboratories Cat. No. SP-1120
Critical Commercial Assays
Vectastain ABC kit Vector Laboratories Cat. No. 6100
VECTASHIELD Antifade Mounting Medium Vector Laboratories Cat. No. H-1000
Experimental Models: Organisms/Strains
C57BL/6J Charles River JAX Mice Stock Number 000664
Software and Algorithms
MATLAB MathWorks Version R2014a; https://uk.mathworks.
com/products/matlab.html
Spike2 Cambridge Electronic Design Limited (CED) Spike2 version 7 and version 8; http://ced.
co.uk/
KlustaKwik Harris et al., 2000 http://klustakwik.sourceforge.net/
Zen Zeiss Version 2.1; https://www.zeiss.co.uk/
corporate/home.html
Fiji ImageJ Schindelin et al., 2012
Scalable Brain Atlas Allen Brain Atlas Bakker et al., 2015
Other
Silicon probe; A2x2tet-10mm-150-150-121 NeuroNexus http://neuronexus.com/
Jetball Dome PhenoSys https://www.phenosys.com/products/
virtual-reality/jetball-dome/
e1 Neuron 96, 1342–1357.e1–e5, December 20, 2017

CONTACT FOR REAGENT AND RESOURCE SHARING
Further information and requests for reagents and resource may be directed to the Lead Contact, Peter Somogyi (peter.somogyi@
pharm.ox.ac.uk).
EXPERIMENTAL MODEL AND SUBJECT DETAILS
Extracellular electrophysiological recordings were performed in adult male C57Bl6/J mice using either multichannel silicon probes
(n = 7 mice) or glass electrodes (n = 24 mice). At the time of surgery, mice ranged between 3 and 6 months of age. Mice were
housed with littermates until surgical implantation of the head-plate, after which they were housed individually and maintained
on a 12 hr light/dark schedule with lights off at 7:00 pm. All behavioral training and recording occurred in the light phase. All
procedures involving experimental animals were under approved personal and project licenses in accordance with the Animals
(Scientific Procedures) Act, 1986 (UK) and associated regulations.
METHOD DETAILS
SurgeryFor surgical implantation, mice were deeply anesthetized with isoflurane (induction chamber 3% - 4% v/v with airflow and reduced to
1% - 2% v/v after the animal was positioned in the stereotaxic apparatus) and given a subcutaneous injection of buprenorphine
(Vetergesic, 0.08 mg/kg). The skull was exposed under aseptic conditions, and three sites weremarked: the bregma, MS craniotomy
(antero-posterior (AP): +0.86 mm, medio-lateral (ML): 0 mm, dorso-ventral (DV): 3.5 mm, 0�) and hippocampal craniotomy
(AP: �2.4 mm, ML: 1.7 mm, DV: 1.2 mm, 10� postero-anterior angle). The head-plate (either a 0.7g or 1.1g version, custom made
at the Department of Physics, Oxford University) used for head-fixation was secured to the skull using dental cement and three small
M1 screws. Two such screws were fixed to the skull above the cerebellum and served as the ground and electrical reference for the
recordings.
Behavioral proceduresUpon recovery from the surgery (typically 3 to 4 days), mice were trained to run on an air-flow suspended styrofoam ball (for multi-
channel silicon probes) or spherical treadmill (for single cell recordings). After recovery, food restriction (to 90% of initial pre-surgery
body weight) was aimed to motivate running and mice received small drops of sucrose (20% solution) reward upon reaching the end
of the linear maze on the styrofoam ball (jetball, PhenoSys). Mice that performed anticipatory licking and whose tail was balanced, as
if running on a linear track, were considered trained. This training was a crucial behavioral control for each animal.
Recordings and single unit identificationThe recording sessions lasted between 30 to 60 min in case of multi-channel silicon probe recordings and up to 3 hr for single
cell recordings while aiming for neurons with a particular firing pattern. The activity of MS cells was recorded during multiple
running (RUN) and resting (REST) periods. LFP theta oscillation was recorded in the pyramidal cell layer or in stratum oriens in
CA1 and referenced to a screw in contact with the dura above the cerebellum, with 0� set as the trough. We defined this location
in CA1 by positive going ‘‘sharp waves’’ in the LFP during REST, which were recognized by the co-occurrence of 130-230 Hz filtered
‘‘ripple’’ oscillations. Sharp waves appear as a negative potential in stratum radiatum. Wide-band (0.1 – 6000 Hz; 20 kHz sampling
rate) recordings were performed using a 2 shank acute silicon probe (150 mm intershank distance; 2 tetrodes per shank; 25 mm
spacing between contacts within a tetrode, Neuronexus) connected to a RA16-AC preamplifier (Tucker-Davies). Recordings were
then digitally high pass filtered (0.8 – 5 kHz) and neuronal spikes were detected using a threshold crossing based algorithm. Detected
spikes were automatically sorted using the algorithm implemented in KlustaKwik (Kadir et al., 2014), followed by manual adjustment
of the clusters (Csicsvari et al., 1999) to obtain well-isolated single units, based on cross-correlations, spike-waveform and refractory
periods. Multiunit or noise clusters or those with less than 300 spikes were discarded from analysis.
Juxtacellular labelingExtracellular single-cell recording and juxtacellular labeling with neurobiotin reveals the identity of the labeled cells in conjunctionwith
their in vivo activity patterns, target area, and synaptic targets. Usingmulti-unit recordings in awake head-fixedmice, wewere able to
identify the stereotyped activity patterns of Teevra neurons. Spikes of putative Teevra neurons were recorded during RUN and REST
periods (Movie S1) using an extracellular glass electrode filled with 3% neurobiotin in 0.5MNaCl and the spike output was converted
into audio signal. Subsequently, if the neuron was deemed to be a Teevra cell, based on the ‘‘sound of the burst’’ corresponding to a
short burst duration, and if the firing rate from REST to RUN did not appear to change, an attempt was made to label the cells with
neurobiotin using the juxtacellular method (Pinault, 1996). We found four classes of MS rhythmic neurons. In addition to the most
numerous Teevra cells, the second group, which we named Komal (‘‘soft sound of burst’’) could reliably be differentiated from Teevra
cell based on their long burst duration and increase in firing rate during RUN. The potential success of juxtacellular labeling is pre-
dicted by analyzing cellular health post-labeling in vivo, by comparing the spiking of the cells before and after the firing modulation
Neuron 96, 1342–1357.e1–e5, December 20, 2017 e2

attempt. Successful labeling attempts were defined as those in which the cell wasmodulated for more than 30 s and action potentials
could still be seen and heard after themodulation attempt. In such cases, neurobiotin was left to be transported in the neurons for 4 to
8 hr to allow for potential terminal bouton labeling, which was assessed after processing the brain.
Tissue processing and immunohistochemistryMice were deeply anesthetized with sodium pentobarbital (50 mg/kg, i.p.) and transcardially perfused with saline followed by a fixa-
tive solution (4% paraformaldehyde, 15% v/v saturated picric acid, 0.05% glutaraldehyde in 0.1 M PB at pH 7.4). Some brains were
postfixed overnight in glutaraldehyde-free fixative. After washing in 0.1MPB, coronal sections (70-80 mm)were cut using a vibratome
(Leica VT 1000S, LeicaMicrosystems) and stored in 0.1MPBwith 0.05%sodium azide at 4�C for further processing. The neurobiotin-
labeled processes could be visualized in selected sets of sections using streptavidin-conjugated fluorophores in tissue sections pre-
viously permeabilized by Tris-buffered saline (TBS) with 0.3% Triton X-100 (TBS-Tx) or through rapid 2x freeze-thaw (FT) over liquid
nitrogen (cryoprotected in 20%sucrose in 0.1MPB). To visualize proteins within selected labeled cellular domains or in their synaptic
targets, the sections were first blocked for 1 hr at room temperature (RT) in 20% normal horse serum (NHS) and then incubated in
primary antibody solution containing 1%NHS for 2 to 4 days at 4�C. For the specificity of themethod, negative controls which lacked
the primary antibodies were processed in parallel. Primary antibodies (Key resource table) were detected with fluorophore-conju-
gated secondary antibodies for wide-field epifluorescence and confocal microscopy (Ferraguti et al., 2004; Lasztoczi et al., 2011).
After primary antibody incubation, sections were washed three times for 10 min and transferred to a secondary antibody solution
containing 1% NHS for 4 hr at RT or overnight at 4�C. Following secondary antibody incubation, sections were washed three times
for 10 min each and mounted on glass slides in VectaShield. Our strategy exploits the distinct subcellular locations of target proteins
(e.g nucleus, plasma membrane). Using this approach, the labeled process or synaptic target neurons could be simultaneously pro-
cessed with 4 primary antibodies and subsequently multiple times if the cellular domain to be tested lacked detectable immunore-
activity in the previous round of reactions or if the molecule was not in the same cellular compartment. We were able to test the same
cellular profile in a given section for up to 6 different molecules and different sections for up to 8 molecules of a single cell.
For light microscopic visualization, the neurobiotin signal was amplified by incubating the TBS-Tx or FT processed sections in
avidin-biotin complex (VECTASTAIN Elite ABC HRP Kit) for 3 to 7 days depending on the strength of labeling (incubating for longer
duration sometimes improved the neurobiotin visualization). The sections were then processed using horseradish peroxidase based
diaminobenzidine (DAB) reactions, using the glucose oxidase method for the generation of H2O2 and nickel-intensified DAB as chro-
mogen. The sections were osmium tetroxide treated (0.5%–1% in 0.1 M PB), sequentially dehydrated, and mounted on slides in
epoxy resin (Unal et al., 2015). Selected sections for electron microscopy were incubated in 2% wt/vol uranyl acetate during
dehydration.
Anatomical data analysisLight and florescence microscopy
Wide field epifluorescence microscopy and confocal microscopy (Carl Zeiss LSM 710) were used to evaluate antibody reacted sec-
tions. Sections were first observed with a wide field epifluorescence microscope (Leitz DMRB; Leica Microsystems) equipped with
PL Fluotar objectives. Multichannel fluorescence images were acquired with ZEN 2008 software v5.0 on a Zeiss LSM 710 laser scan-
ning confocal microscope (Zeiss Microscopy), equipped with DIC M27 Plan-Apochromat 40/1.3 numerical aperture, DIC M27 Plan
Apochromat 63/1.4 numerical aperture, and Plan-Apochromat 100/1.46 numerical aperture oil-immersion objectives. The following
channel specifications were used (laser/excitation wavelength, beam splitter, emission spectral filter) for detection of Alexa405,
Alexa488/EYFP, Cy3, and Cy5: 405-30 solid-state 405 nm with attenuation filter ND04, MBS-405, 409–499 nm; argon 488 nm,
MBS-488, 493–542 nm; HeNe 543 nm, MBS-458/543, 552–639 nm; HeNe 633 nm, MBS-488/543/633, 637–757 nm. The pinhole
size was set to 1 Airy unit for the shortest wavelength while, to keep all channels at the same optical slice thickness, the pinhole sizes
of the longer wavelength channels were adjusted to values close to 1 Airy unit. Thus, optical section thickness for all channels was
based on the set pinhole size for the shortest wavelength channel.
The osmium-treated sections mounted in resin after the HRP enzyme reaction (DAB) were analyzed using transmitted light micro-
scope. To reveal the axonal arbor of Teevra cells in the CA3 and sample boutons in different regions and layers, two-dimensional
reconstructions were made with a drawing tube attached to the transmitted light microscope equipped with a 63X oil-immersion
objective. For all visualized axons, the first and last antero-poterior section containing boutons and the last section with the axon
was established.
Electron microscopy
We tested the correspondence of light microscopically predicted putative synapses between target cells and axonal varicosities
by electron microscopy of selected axon collaterals in osmium-treated sections. This enabled us to determine the probability of
determining synaptic junctions based on axonal swellings next to a target profile. Serial sections (70 nm) were cut and mounted
on single-slot, pioloform-coated copper grids for conventional transmission electron microscopy. Images were acquired with a
Gatan UltraScan 1000 CCD camera. All neurobiotin containing boutons cut at the section plane were followed in serial sections to
locate synaptic junctions. We identified synapses as Gray’s type I (often called asymmetrical) and type II (often called symmetrical)
based on their fine structure; type I synapses having a thick postsynaptic density, whereas type II synapses are characterized by a
thin postsynaptic density (Gray, 1959).
e3 Neuron 96, 1342–1357.e1–e5, December 20, 2017

Calculation of 3D distance in the hippocampusWe used two estimates to compute the distance along the hippocampus where the first branch or branch with boutons was
observed, (1) the linear distance of the soma section to the section containing the first axonal collateral in the hippocampus as a
measure of the anterior-posterior distance from the septum and, (2) using the Scalable Brain Atlas (Bakker et al., 2015) we approx-
imated the medio-lateral, antero-posterior and dorso-ventral coordinates of the spatial location in the hippocampus to compute the
3D Euclidian distance of each coordinate from the septal pole of the hippocampal formation (ML: 0; AP: �0.98; DV: �1.4). These
distances were highly correlated (linear correlation coefficient: r = 0.89, p = 0.003).
Electrophysiological data analysisData were analyzed in MATLAB (R2014a, MathWorks) and Spike2 (CED). RUN was defined as locomotion, whereby the jetball (in
virtual reality) or circular treadmill (for single cell experiments, Table 1) was physically advanced by themouse, based on virtual reality
feedback or video observations. For single cell experiments, this additionally included signals from amotion sensor within the circular
treadmill. The initiation of locomotion was also included in RUN. Small postural shifts in the absence of limb motion were excluded
fromRUN. For labeled Teevra cells MS71c, MS73c, andMS90g, in addition to video analysis, signals from an external accelerometer
in contact with a running disc were used to define RUN. REST periods included everything outside RUN periods. There was no or little
contamination from sleep as the animals were mostly awake and alert even during REST periods. To detect the zero crossings of the
LIA, theCA1 reference LFP channel was downsampled to 1 kHz, the signal was rectified (time constant: 0.08 s) and the zero crossings
were detected at falling level (minimum interval: 200 ms).
Rhythmicity Index
Rhythmicity index is based on the ‘‘theta index’’ (Royer et al., 2010), but it has fewer parameters (3 versus 6 in Royer et al.), for a more
robust fit. Data were prepared by calculating the spike time autocorrelogram (bin width 10 ms, maximum lag 500 ms) for spikes
defined in periods of RUN or REST. Next, the autocorrelogram was normalized by dividing the peak value between 100 and
200 ms (range chosen to match theta frequency first side band), and center values were clipped so that overall maximum is 1.
We then fit a linear trend line to the above (dotted line in the figures) and perform a nonlinear fit (using MATLAB lsqnonlin function)
to the detrended data. The fitting function is a Gaussian-modulated cosine function with three parameters: (1) cosine (theta) fre-
quency in Hz (between 4 and 8); (2) the peak value of the Gaussian scaling function (high value indicates strong short-latency theta
modulation) and (3) standard deviation (width) of Gaussian scaling function (high value indicates prolonged theta modulation). The
solid red lines in Figures 2 and 6 are the fitted sinusoid functions (oscillatory frequency of the neuron), and the trends are shown
by dotted lines. A coefficient of determination is measured at this stage to measure the goodness of fit. After fitting, the rhythmicity
index is calculated as follows: (1) for each peak and trough in 50 to 500 ms, the absolute value of the fitted sinusoid is divided by the
corresponding trend line value (between zero and one) and (2) the rhythmicity index is taken as the mean of these trend-normalized
peak values.
Burst duration
Spikes were gathered by growing group such that nearest neighbor spikes were iteratively added unless interspike interval (ISI) >
threshold; when both neighboring ISIs are > threshold burst was delimited; min spikes = 2, threshold = mean ISI. Mean burst dura-
tions during RUN are reported throughout.
Rate change score and speed correlation
Mean firing rates (Hz) were calculated during RUN and REST periods. A rate change score was then computed according to the
following formula:
rate change score=rateðRUNÞ � rateðRESTÞrateðRUNÞ+ rateðRESTÞ
Score ranges from�1 (decrease of rate during running) to 1 (increase of rate during running). The speed modulation of MS unit firing
was also calculated for each neuron recorded usingmulti-channel probes. Data were binned at 1cm/s. For each speed bin (> 2cm/s),
the corresponding firing frequency was calculated as the number of detected action potentials while the mouse was moving at this
speed, divided by the duration the mouse ran at this speed. The firing frequencies per speed bin were linearly fitted with a weighting
function for each bin equal to the square root of its duration. A linear correlation coefficient was computed for each neuron and it was
determined if the firing is positively modulated (r > 0, p < 0.05), negatively modulated (r < 0, p < 0.05) or not correlated with the running
speed of the animal (p > 0.05).
Mean firing phase preference
For each recorded neuron, we determined the mean depth of theta modulation and the preferential mean theta phase of firing (cir-
cular mean ± circular SD) using Rayleigh’s method (Zar, 1999).
Hierarchical clusteringAll analyses were performed using ‘‘Cluster Analysis’’ toolbox in MATLAB (R2014a, MathWorks). All parameters (m) for all neurons (n)
are prepared in an ‘‘m-by-n’’ data matrix. The data are linearly rescaled and set to a new defined min and max (�1 to 1, rescale func-
tion, MATLAB) and stored in data matrix (e.g., X). Next, we calculate the pairwise Euclidian distance between each pair of observa-
tions in X (usingMATLAB ‘‘pdist’’ function) and store this in a matrix (e.g., D). Next, we calculate the linkages and create a hierarchical
Neuron 96, 1342–1357.e1–e5, December 20, 2017 e4

cluster tree. MATLAB function linkage returns a tree (e.g., Z) that encodes hierarchical clusters of the real matrix X using ‘‘Ward’’
method to measure the distance between clusters. A tree encoded by Z is plotted (using MATLAB function ‘‘dendrogram’’) and
four major branches are selected (using MATLAB function ‘‘cluster’’) and the smallest height at which a horizontal cut through the
tree leaves 4 clusters is identified (using MATLAB function ‘‘maxclust’’). The cluster value assignment for each neuron is stored
in a matrix (e.g., C). The silhouette method is used to determine the goodness of clustering. The silhouette value (MATLAB, Cluster
Analysis toolbox, range: �1 to 1) for each point is a measure of how similar that point is to points in its own cluster versus points in
other clusters according to the following formula:
Si = ðbi � aiÞ=maxðai;biÞwhere ai is the average distance from the ith point to the other points in the same cluster as i, and bi is the minimum average distance
from the ith point to points in a different cluster, minimized over clusters. Silhouette value for a cluster is reported as the mean silhou-
ette of its individual members. Large positive values indicate that the cluster is compact and distinct from other clusters.
QUANTIFICATION AND STATISTICAL ANALYSIS
Standard functions and custom-made scripts in MATLABwere used to perform all analysis. We have not estimated theminimal pop-
ulation sample for statistical power, but the number of animals and labeled neurons were similar to or larger than those employed in
previous works (Katona et al., 2014; Varga et al., 2014; Viney et al., 2013). The data were tested for normal distribution. Parametric
tests were used for normally distributed data and non-parametric tests were applied to all other data. For a comparisons of firing
phase preferences of different cell types, we used Watsons U2 test. Kruskal-Wallis one-way analysis of variance was used to
compare two groups. Box-plots represent median and 25th _ 75th percentiles and their whiskers show data range. Outliers are shown
as a ‘‘+’’sign.
DATA AND SOFTWARE AVAILABILITY
The software used for data acquisition and analysis is available for download. Data will be made available upon request.
e5 Neuron 96, 1342–1357.e1–e5, December 20, 2017

Neuron, Volume 96
Supplemental Information
Behavior-Dependent Activity and Synaptic
Organization of Septo-hippocampal GABAergic Neurons
Selectively Targeting theHippocampal CA3Area
Abhilasha Joshi, Minas Salib, Tim James Viney, David Dupret, and Peter Somogyi
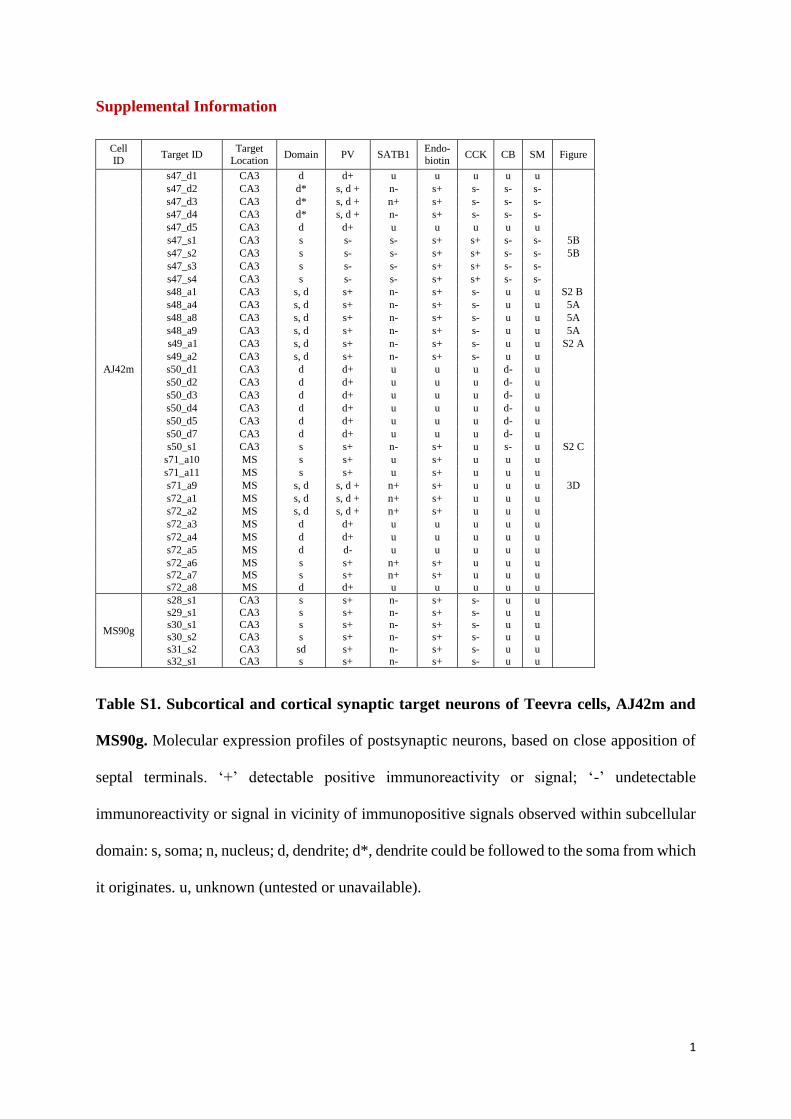
1
Supplemental Information
Cell ID
Target ID Target
Location Domain PV SATB1
Endo-biotin
CCK CB SM Figure
AJ42m
s47_d1 CA3 d d+ u u u u u
s47_d2 CA3 d* s, d + n- s+ s- s- s-
s47_d3 CA3 d* s, d + n+ s+ s- s- s-
s47_d4 CA3 d* s, d + n- s+ s- s- s-
s47_d5 CA3 d d+ u u u u u
s47_s1 CA3 s s- s- s+ s+ s- s- 5B
s47_s2 CA3 s s- s- s+ s+ s- s- 5B
s47_s3 CA3 s s- s- s+ s+ s- s-
s47_s4 CA3 s s- s- s+ s+ s- s-
s48_a1 CA3 s, d s+ n- s+ s- u u S2 B
s48_a4 CA3 s, d s+ n- s+ s- u u 5A
s48_a8 CA3 s, d s+ n- s+ s- u u 5A
s48_a9 CA3 s, d s+ n- s+ s- u u 5A
s49_a1 CA3 s, d s+ n- s+ s- u u S2 A
s49_a2 CA3 s, d s+ n- s+ s- u u
s50_d1 CA3 d d+ u u u d- u
s50_d2 CA3 d d+ u u u d- u
s50_d3 CA3 d d+ u u u d- u
s50_d4 CA3 d d+ u u u d- u
s50_d5 CA3 d d+ u u u d- u
s50_d7 CA3 d d+ u u u d- u
s50_s1 CA3 s s+ n- s+ u s- u S2 C
s71_a10 MS s s+ u s+ u u u
s71_a11 MS s s+ u s+ u u u
s71_a9 MS s, d s, d + n+ s+ u u u 3D
s72_a1 MS s, d s, d + n+ s+ u u u
s72_a2 MS s, d s, d + n+ s+ u u u
s72_a3 MS d d+ u u u u u
s72_a4 MS d d+ u u u u u
s72_a5 MS d d- u u u u u
s72_a6 MS s s+ n+ s+ u u u s72_a7 MS s s+ n+ s+ u u u
s72_a8 MS d d+ u u u u u
MS90g
s28_s1 CA3 s s+ n- s+ s- u u
s29_s1 CA3 s s+ n- s+ s- u u s30_s1 CA3 s s+ n- s+ s- u u
s30_s2 CA3 s s+ n- s+ s- u u
s31_s2 CA3 sd s+ n- s+ s- u u s32_s1 CA3 s s+ n- s+ s- u u
Table S1. Subcortical and cortical synaptic target neurons of Teevra cells, AJ42m and
MS90g. Molecular expression profiles of postsynaptic neurons, based on close apposition of
septal terminals. ‘+’ detectable positive immunoreactivity or signal; ‘-’ undetectable
immunoreactivity or signal in vicinity of immunopositive signals observed within subcellular
domain: s, soma; n, nucleus; d, dendrite; d*, dendrite could be followed to the soma from which
it originates. u, unknown (untested or unavailable).

2
Figure S1: Physiological parameters of MS neurons recorded using glass-electrodes and
silicon probes (related to Figure 1)
(A) Distribution of the mean theta firing phase of Teevra (green) and Komal (magenta) cells
with mean vector length as radius. (B) Burst duration (ms) and rate change score of labelled
Teevra neurons MS90g (x, left) and MS11b(x, right) in relation to other cells. These two
neurons were not included in the clustering because the animals did not exhibit voluntary
movement (see methods); the parameters were calculated during short bouts of theta oscillatory
activity (Table 1). (C) Comparison of parameters calculated based on the spike train dynamics
of neurons recorded using glass electrode or silicon probe recordings (p > 0.05, Kruskal-Wallis
test). +, outliers.

3
Figure S2: Postsynaptic PV+/SATB1-negative interneurons are consistently and
preferentially innervated by Teevra cells. (related to Figure 5)

4
(A) Axonal terminals (green) of Teevra cell innervate PV+ (magenta, asterisks) and SATB1-
negative (cyan) cells in a basket-like formation and also following their dendrites. Nearby PV+
and SATB1+ cells (double arrows) and a CCK+ cell (top, single arrow) were not innervated.
(B) Axonal terminals (green) of Teevra cell innervate a PV+ and SATB1-immunonegative cell
in CA1 (labeling as in A). (C) Axonal terminals (green) of Teevra cell in CA3, innervate a PV+
(magenta, asterisk) and CB-negative (cyan) cell in a basket-like formation and also follow its
dendrite, but do not innervate a neighboring CB+ cell (cyan). The immunoreactivity of targeted
interneurons is consistent with the molecular profile of axo-axonic cells. Imaging details (z-
thickness in µm, z-projection type stated): (A) 9.74 µm, standard deviation projection (B) 11.7
µm, standard deviation projection (C) 14.70 µm, maximum intensity projection

5
Figure S3: Molecular diversity of PV-expressing interneurons in mouse CA3 (related to
Figure 5)

6
(A) A cluster of PV+ interneurons (magenta, 1 to 5) exhibit a diverse combination of
immunoreactivity for molecules expressed in strata pyramidale and lucidum of the mouse CA3.
The SATB1-immunonegative nucleus of cell 3 is within the displayed optical slice and was
also checked in other slices. (B) Left, immunoreactivity scores of the cells in ‘A’. Middle,
quantification of PV+ cells sampled with immunoreactivity for SATB1, NPY and SST (n = 3
mice, 5 areas). Note that PV-immunopositive and SATB1-immunonegative axo-axonic cells
(Viney et al., 2013), comprise 30% of the PV+ population. All other PV+ cells also are
SATB1+ in combination with other molecular markers such as SST and NPY. Right,
proportions of interneurons labeled for combinations of the 4 molecules. Imaging details (z-
thickness): 0.38 µm, single optical section.


![[SPECIAL ARTICLE] Modernities Through Art and Design: Printing Press as a Source of Examining Penang’s Modernity](https://static.fdokumen.com/doc/165x107/6326f4c5cf3e39ceab049c48/special-article-modernities-through-art-and-design-printing-press-as-a-source.jpg)

