Area-wide integration (AWI) of specialized crop and livestock ...
111
1 Project Report Area-wide integration (AWI) of specialized crop and livestock activities in Vietnam funded by LEAD (FAO) Tran Thi Dan, Thai Anh Hoa, Le Quang Hung, Bui Minh Tri, Ho Thi Kim Hoa, Le Thanh Hien and Nguyen Ngoc Tri Nong Lam University (UAF), HCMC, Vietnam July 2003
-
Upload
khangminh22 -
Category
Documents
-
view
0 -
download
0
Transcript of Area-wide integration (AWI) of specialized crop and livestock ...

1
Project Report
Area-wide integration (AWI) of specialized crop and livestock activities in Vietnam
funded by LEAD (FAO)
Tran Thi Dan, Thai Anh Hoa, Le Quang Hung, Bui Minh Tri, Ho Thi Kim Hoa, Le Thanh Hien and Nguyen Ngoc Tri
Nong Lam University (UAF), HCMC, Vietnam July 2003

2
CONTENTS
1. INTRODUCTION 2. OBJECTIVES OF THE PROJECT 3. PROJECT AREAS 3.1 Human population 3.2 Livestock production
3.2.1 Aniaml breeds 3.2.2 Distribution of animal population 3.2.3 Animal feed 3.2.4 Amount of manure
3.3 Crop production 3.3.1 Area and yield of crop 3.3.2 Water 3.3.3 Soil and major trees
4. CURRENT INSTITUTIONAL EFFORTS TO PROTECT THE ENVIRONMENT, ANIMAL AND HUMAN HEALTH 4.1 National-level regulations relating to environment issue in Vietnam 4.2 Provincial regulation affecting industry 4.3 Some policy on foreign investment versus domestic investment 4.4 Current relocation projects of the government 5. METHODOLOGY TO SUPPORT ANALYSIS IN THE PROJECT 5.1 Technical solutions for animal waste use 5.2 Food safety and environment impact of these solutions 5.3 Manure application in crop experiments and assessment of nutrient flow 5.4 Spatial analysis 5.5 Economic/policy analysis 5.6 Proposed strategies 6. FINDINGS 6.1 FARM SURVEY OF CURRENT MANURE USE
6.1.1 General description of current waste management by species 6.1.2 Treatment of solid wastes 6.1.3 Current animal waste usage 6.1.4 Current markets of manure and ways of delivery 6.1.5 Analysis of the cost-benefit of different manure management solution
6.2 FINDINGS FROM ENVIRONMENT ANALYSIS 6.2.1 Environment analysis 6.2.2 Risk of pathogens transfered from manure recycling to food chain 6.2.3 Recommendations for manure management options based on findings from environment assessment
6.3 RESULTS FROM CROP EXPERIMENT
6.3.1 Results and problems of using manure for rice 6.3.2 Results and problems of using manure for peanut 6.3.3 Results and problems of using manure for leafy vegetable 6.3.4 Results and problems of using manure for rubber tree (Hevea brasiliensis)

3
6.3.5 Results and problems of using manure for longan 6.3.6 Manure treatments and changes of soil phosphate content 6.3.7 Lessons from the first stage of the project and recommendations for the next
6.4 FINDINGS FROM SPATIAL ANALYSIS 6.4.1 Discharge of manure from main livestock 6.4.2 Nutrient balance with mineral fertilizers 6.4.3 Potential areas for new farm relocation
7. RECOMMENDATIONS OF PROPOSED ALTERNATIVE SOLUTIONS 7.1 Discuss alternative ways to deal with animal waste 7.2 Policy options
7.2.1 Various options used elsewhere 7.2.2 What we need to be aware of when designing policies in the Vietnam situation 7.2.3 Proposed changes in policies
8. CONCLUSION APPENDICES

4
1. INTRODUCTION The urbanization and increase of animal-product demands have accompanied with the specification and intensification in animal production, also with the disintegration between crop and animals. This trend has resulted in environment pollution in Ho Chi Minh City (HCMC) and the surrounding provinces including Binh Duong, Dong Nai (North and North East of the city, respectively) and Long An of Mekong Delta. Biogas has been popular to small scale farms of 5-100 pigs. Every city/province has had program to support the poor farmers, on a limited scale, in installation of biogas. However, the biogas is not suitable for farms raising less than 5 pigs or farms having no land for crop. In addition, most of intensive farms, especially the swine farms, were built in the decade of 60 without treatment system of waste. The waste is therefore drained to vegetable field or stream, that has had BOD of 300-530 mg/l and an unaccepted number of E. coli as well as parasite egg. The environmental and technical problems of intensive swine farms have been solved by provincial master plane of relocation.
Investigations carried out by scientists at University of Agriculture and Forestry, HCMC City showed a pollution of underground water. During 1983-1999, 764 samples of underground- water were taken to determined pH, BOD, COD and indicator bacteria of contamination. The percentage of samples not followed the standard of TCVN-5945 was 8.5%. Besides that, the percentage of samples that was contaminated indicator bacteria increased from 3.7% in 1983-1990 to 6.4% in 1991-1999. The contaminated ground water becomes serious problem as the water is used for both human and animals. In HCMC about 70% of meat demand is supplied by provinces other provinces, especially Dong Nai, Binh Duong and Mekong Delta. Taken samples of fresh meat transported to the city, HCMC Sub-department of Veterinary indicated 2.2% of the samples contaminated by Salmonella and 43.3% by E. coli in the report of 1999. The contamination of vegetable sprayed with manure was also reported. Results from the project on production of safe vegetable, which was collected in Bien Hoa City of Dong Nai province in 2000, showed a contamination of E. coli, but not Salmonella and Vibrio cholera, in 100% samples. The issue of animal waste and risk of public health due to contamination of food have received serious attention by policy makers in Vietnam. Yet no convincing strategy had been developed as how to deal with increasing urbanized and industrialized livestock production and the associated pollution problems. Lack of analytical tools and experience in specific policy design may be the reasons.
In one study in Dong Nai province samples were taken randomly from leaves of vegetables collected from different investigated field. It was indicated that the accumulation of some heavy metals could be a results of malutilization of liquid manure. The analysis have shown evidence that farmer habits of spraying liquid manure in some areas could cause an accumulation of heavy metals in the plant leaves. It has proven that in field where had not applied liquid manure over the leaves would not found trace of heavy metals on the upper parts of the crops.

5
Pollutant analysis in vegetable cultivation areas in Dong Nai province Location NO3
-, ppm
Zn , ppm
Cu , ppm
Mn , ppm
Cd , ppm
Pb , ppm
Cr , ppm
Ni , ppm
Tan Hanh Hamlet 1 37,69 4,57 5,02 51,20 0,35 1,55 0.05 1,07 Hamlet 2 86,17 2,30 5,70 31,95 0,07 1,62 0,04 1,30 Hamlet 3 169,63 2,43 6,26 20,75 0,06 1,90 0,04 1,41 Hamlet 4 145,07 7,99 4,30 25,30 0,10 0,85 0,10 1,70 Trang Dai Hamlet 2 45,59 24,72 14,11 12,20 0,05 0,43 0.06 0.40 Hamlet 4 15,23 3,08 14,49 2,80 0,02 0,45 0,07 0,28 Hamlet 4 4,96 2,53 1,56 3,81 0,03 0,99 0,07 0,28 Hamlet 5 20,57 13,39 9,51 7,55 0,04 0,08 0,08 0,21 Pollutants analysis of water sample in vegetable cultivation area in Dong Nai province
Location Sampling place
NO3-
ppm Zn
ppm Cu
ppm Mn ppm
Cd ppm
Pb ppm
Cr ppm
Ni ppm
Tan Hanh Hamlet 1 Well 4,340 0,030 trace 0,005 trace trace 0,008 TraceHamlet 2 Canal 12,030 0.039 trace trace trace trace 0.019 TraceHamlet 3 Well 1,770 0,035 0,005 trace trace trace 0.025 TraceHamlet 4 Well 1,000 0,052 trace trace trace trace 0,027 TraceTrang Dai
Well 0,740 0,022 0,027 0,014 trace trace 0.032 TraceHamlet 2 Leaching from untreated manure
5,240 1,794 1,630 0,145 0,012 trace 0.048 0.092
Well 0,500 0,000 0,066 0,001 trace trace 0,036 TraceHamlet 4 Stream 0,290 0,000 0,049 trace trace trace 0,049 Trace
Hamlet 5 Leaching during composting
7,670 0,518 0,075 0,028 trace trace 0,049 Trace
Sources: Sub-dept. of Science, Technology and Environment, Dong Nai province, 2001 The identification and assessment of policy options from the AWI project will provide policy makers with solutions that may address the mounting environmental and public health problems that are increasingly being created by livestock production. These types of policies will also create jobs and income opportunities for rural people. 2. OBJECTIVES OF THE PROJECT
The main objective of the project was to provide policymakers with an assessment on environment, society and economics relating to animal waste recycle, which promotes area-wide integration of specialized crop-livestock activities.
The project aimed at:

6
- To overview the specific technical solutions for animal waste collection, treatment and use by specialized livestock producers in rural settings, within the overall concept of area-wide integration
- To assess the environment impact of waste management relying on chemical and microbiological analysis of feces, water and soil
- To provide data on manure application and to assess nutrient flow using results of crop experiments and a PC-based model
- To analyze the project areas with support of GIS (Geographical Information System), mainly on livestock production, cropping, infrastructure and environment
- To provide policymakers with various alternatives that they could use to which would balance the manure output from intensive production units and nutrient flows through feed and waste with the absorptive capacity of the surrounding natural resource base, to develop strategies for continued participation of rural people and areas of livestock activities. 3. PROJECT AREAS The project was conducted in four city/provinces of southern Vietnam, including Binh Duong, Dong Nai, HCMC and Long An in 2002. HCMC is the main supplier of breeding animals to the whole country, in where the number of intensive farms is highest and concentrated in the suburb that are surrounded by housing and industries. The other three provinces share borders with HCMC, raise a large number of pigs also concentrated in the suburb, and supply meat to HCMC. Table 1. Total area and structure of activities in 1999* Items Binh Duong Dong Nai HCMC Long An Number of district 6 9 22 14 Natural area, ha 271,743 586,660 209,201 444,866 Agriculture area, ha 198,474 302,845 94,385 337,612 GDP, USD 428 436 1,230 330 GDP structure from the 3 sections -agriculture, industry and services, %
20.65, 52.38 and 26.97
24.2, 50.4 and 25.4
2.19, 44.37 and 53.44
52, 18.33 and 26.09
GDP of animal production in agriculture, %
16.60 23.03 33.17 17.40
Average annual development rate in agriculture, %
6.03 3.90 2.40 7.00
Plants to be focused Perennial trees, i.e. rubber, fruit
Perennial trees, i.e. rubber, fruit, pepper, coffee
Rice and vegetable
Rice, Sugar cane, peanut
Animals to be focused Dairy cattle, pig
Dairy cattle, pig Dairy cattle, breeding pig
Pig, poultry, duck and dairy cattle
* Source: Institute of agriculture planning and projection, 2000 3.1 Human population Population concentrated in the capital of the city or provinces. Ho Chi Minh was high in human population density in the city center.

7
Table 2. Human population in four provinces (2000) Order Province Town Human population 1 2 3 4
Binh Duong province Dong Nai province HCMC Long An province
Thu Dau Mot Bien Hoa District 1 Tan An
742,790 2086,634 5169,449 1329,271
3.2 Livestock production Livestock sectors are mainly pig, poultry, cattle and buffalo (Table 3). State swine farms concentrated in the suburbs near the city and town. Therefore the relocation is a concern in environment protection for the next few years. The private pig farms had been moved to Ben Cat district in Binh Duong province and some small farms still maintain their activities. According to most producers, pig farm over 100 heads could be a large farm in these sites. Bien Hoa and Thong Nhat have the leading numbers of pig with 168,148 and 106,956 heads, respectively. Poultry farm with 3,000 heads is a large farm in these sites. Number of poultry was over 1 million heads in Bien Hoa, Thong Nhat and Long Thanh of Dong Nai province, followed by Phu Giao and Thuan An district in Binh Duong province, and Cu Chi of HCMC. Private poultry farms are concentrated in Binh Duong province. Table 3. Statistics of main livestock at district level of four provinces
District Pig Poultry Cattle Buffalo Binh Duong province
Thu Dau Mot 13,688 170,348 2,346 183Dau Tieng 12,498 355,633 3,011 5,133Ben Cat 84,857 176,755 5,083 2,649Phu Giao 9,879 500,673 2,721 1,821Tan Uyen 19,109 198,350 9,857 6,761Thuan An 23,332 680,094 2,399 61Di An 15,531 142,504 1,720 55
Dong Nai province Bien Hoa 168,148 1,150,000 2,915 205Vinh Cuu 25,146 0 2,058 1,418Tan Phu 32,304 0 2,993 1,183Dinh Quan 43,825 325,000 1,899 872Xuan Loc 90,866 0 18,906 1,533Long Khanh 52,900 550,000 2,694 128Thong Nhat 106,956 1,140,000 4,710 569Long Thanh 43,194 1,000,000 9,500 609Nhon Trach 17,507 343,000 4,989 1,899
HCMC Dist. 1 0 0 0 0

8
Dist. 2 8,642 31,245 295 5Dist. 3 0 0 0 0Dist. 4 0 0 0 0Dist. 5 0 0 0 0Dist. 6 0 0 0 0Dist. 7 3,063 9,990 18 0Dist. 8 2,468 23,670 12 0Dist. 9 12,984 113,080 1,003 149Dist. 10 0 0 0 0Dist. 11 0 0 0 0Dist. 12 15,271 192,500 6,474 77Go Vap 7,291 9,890 1,310 0Tan Binh 2,889 10,641 798 0Binh Thanh 969 4,240 75 6Phu Nhuan 0 0 0 0Thu Duc 8,872 39,118 1,436 15Cu Chi 40,800 810,469 15,640 5,328Hoc Mon 28,597 322,622 9,016 988Binh Chanh 31,064 420,316 2,998 1,323Nha Be 9,987 36,485 17 4Can Gio 3,887 43,275 25 30
Long An province Tan An 17,844 152,795 400 80Tan Hung 1,593 11,203 441 53Vinh Hung 8,364 63,436 907 94Moc Hoa 9,948 71,211 678 51Tan Thanh 8,850 110,600 12 9Thanh Hoa 6,507 15,668 9 81Duc Hue 6,069 301,636 2,273 9,752Duc Hoa 16,339 220,549 15,398 11,548Ben Luc 15,339 120,805 332 85Thu Thua 12,466 122,300 100 110Chau Thanh 26,848 323,361 1,533 26Tan Tru 17,229 221,031 109 46Can Duoc 16,382 478,219 241 190Can Giuoc 20,707 99,946 70 250

9
The increase of pig from 1996 to 2000 at the four sites showed that pig number reduced in the central districts of HCHMC such as District 1, 3, 5, 10, 11… Pig number reduced in Thu Dau Mot (Binh Duong) and Tan An town (Long An province) but increased in Bien Hoa City (Dong Nai province). Some districts with high percentage of pig increase were Ben Cat due to relocation of some private pig farms in 1997 (348.6% increase) followed by Di An district (104% increase). In HCMC, the pig increase was in District 2 which is now designed for urbanization, and Cu Chi district is a planned new area for relocation. Table 4. Increase percentage of pig from 1996-2000 at district level of four provinces
District Pig production in 1996 Pig production in 2000 Increase (%) Binh Duong province
Thu Dau Mot 15,331 13,688 -10.7Dau Tieng 7,865 12,498 58.9Ben Cat 18,914 84,857 348.6Phu Giao 6,403 9,879 54.2Tan Uyen 17,038 19,109 12.1Thuan An 13,988 23,332 66.8Di An 7,594 15,531 104.5
Dong Nai province Bien Hoa 110,055 168,148 52.7Vinh Cuu 18,302 25,146 37.3Tan Phu 24,721 32,304 30.6Dinh Quan 36,587 43,825 19.7Xuan Loc 65,546 90,866 38.6Long Khanh 48,385 52,900 9.3Thong Nhat 65,012 106,956 64.5Long Thanh 32,014 43,194 34.9Nhon Trach 13,217 17,507 32.4
HCMC Dist. 1 0 0 0Dist. 2 4,016 8,642 115.1Dist. 3 0 0 0Dist. 4 0 0 0Dist. 5 0 0 0Dist. 6 0 0 0Dist. 7 3,427 3,063 -10.6Dist. 8 3,945 2,468 -37.4Dist. 9 9,144 12,984 41.9Dist. 10 0 0 0Dist. 11 0 0 0Dist. 12 15,271 15,271 0Go Vap 16,254 7,291 -55.1Tan Binh 5,175 2,889 -44.1Binh Thanh 3,070 969 -68.4Phu Nhuan 0 0 0Thu Duc 8,966 8,872 -1Cu Chi 36,019 40,800 13.2Hoc Mon 18,660 28,597 53.2Binh Chanh 27,508 31,064 12.9Nha Be 6,411 9,887 54.2

10
Can Gio 3,763 3,887 3.2Long An province
Tan An 21,822 20,403 -6.5Tan Hung 1,270 1,593 25.4Vinh Hung 3,682 8,364 127.1Moc Hoa 7,852 9,948 26.6Tan Thanh 9,050 8,850 -2.2Thanh Hoa 6,505 6,507 0.03Duc Hue 6,337 6,069 -4.2Duc Hoa 17,870 16,339 -8.5Ben Luc 14,532 15,399 5.9Thu Thua 18,123 12,466 -31.2Chau Thanh 21,534 26,848 24.6Tan Tru 13,484 17,229 27.7Can Duoc 16,960 16,382 -3.4Can Giuoc 21,130 20,707 -2 3.2.1 Aniaml breeds Dairy cattle: crosses between LaiSind and HF (F1 and F2) is dominant (over 90%). Pigs: 80% of pigs are exotic crosses and 20% are crosses of local and exotic ones. Chicken: most of layer breeds (Goldline, Brown nick) have been imported from Western countries. Western meat breeds such as AA, Hubbard...are kept at intensive farms whereas local breeds or imported Asian breeds (Chinese) are raised at backyard. The number of local breed chicken covers 50% of backyard chicken. Duck: local breeds are dominant for paddy running. Super meat breeds (Cherry valley) and egg duck (Khaki campbell) have been introduced to intensive farms. 3.2.2 Distribution of animal population
Approximately 93% dairy cattle are raised in private holders and 7% in state farms. In the whole country, the number of purebred ones is 1600-1800 (5-6%) over 32,000 dairy cattle, which are raised at high land regions (Moc Chau and Lam Ñong provinces). Surveying 1403 dairy cattle farms in HCMC (Le Xuan Cuong, 2001) showed percentage of farms with various sizes of herd:
Herd size (n0 cattle per farm) Percentage of farms (%) 1-5 67.9 6-10 23.9 11-15 5.5 16-20 1.6 > 20 1.1 Most of fattening pigs (97%) are from private farms whereas state farms work as breed
suppliers. In HCMC, distribution of swine farms based on the herd size is as follows: Herd size (n0 pigs per farm) Percentage of farms (%) 1-5 77.2 6-10 17.8 11-20 4.1 21-50 0.7 51-100 0.07 > 100 0.01

11
Regarding to chicken, in Long An 90% chicken is in back yard flock and 10% from intensive production. In contrast, 70% chicken is in intensive production and 30% from back yard in other three city/provinces. In term of intensive production of chicken, CP Group holds 60%, Poultry Company 30% and privates 10%. Under contract production with CP Group, farmers get loan for animals and feed. Most of ducks are raised at private farms. 3.2.3 Animal feed According to Department of Agro-forestry Extension, feed produced by feed mills occupies 22% (2 mil. ton/year) of required animal feed. Among feed mills, 72% locates in HCMC and surrounding provinces (Binh Duong, Dong Nai, Long An). Market share between local feed mills and foreign invested feed mills was 54% and 46%, respectively. Levels of crude protein in piglet feed is 18-20%, growers 16-18%, fattening pigs 14-16%, chicken 19-21%, cattle 14-15%. Levels of Ca, P, Cu and Zn in various types of mixed feeds are 0.8-1.2%, 0.5-0.8%, 50-250 ppm and 50-120 ppm (lower for chicken), respectively. (1) Approximate amount of feed for dairy cattle per day: - Grass 20 kg - Rice straw 6-8 - Processing agricultural by-product 10
(brewery, cassava residue) - Mixed feed from feed mill 0.4 kg/kg milk produced (14-15% crude protein) (2) Pigs: 70-80% farms buy mixed feed or protein concentrates from feed mills. (3) Chicken: farms with intensive production buy mixed feed from feed mills. 3.2.4 Amount of manure Cattle: 15 kg/head/day Pig: 1.5-2.5 kg/head/day Chicken: 100-120 g including litter/head/day
The amount of water used for animals is about 100 L of water/pig/day, mainly for washing and cooling pigs, no data for cattle. Some farms have dropped-water system, which was established by Vietnamese engineer, to cool down sows or boars. Cost of dropped-water system including drinker and trough was 2 mil. VND per sow in the herd of 50 breeding sows. 3.3 Crop production 3.3.1 Area and yield of crop Crop area and yield were calculated as statistics with main crops. Rice and vegetable are the two main crops and the others were listed in Table 5 and 6. Nutrient requirement for crops are high, especially in vegetable growing (10 ton/ha) or at the beginning of planting in the case of black-pepper, fruit trees.

12
Table 5. Crop area (ha) at district level of four provinces
District
Rice
Peanut
Rubber
Vege-table
Sugar -cane
Corn
Cassava
Soy-bean
Sweet-potato
Longan
Durian
Coffee
Black-pepper
Cashew
Rambutan
Binh Duong province
Thu Dau Mot 1725 693 261 1700 524 0 345 0 0 24 55 0 43 90 0 Dau Tieng 2985 91 28845 316 304 0 781 0 0 327 95 4 24 4626 0 Ben Cat 7017 491 9878 1025 163 0 1001 0 0 415 206 12 80 3019 0 Phu Giao 1376 575 7557 604 1326 0 2223 0 0 313 20 46 40 2692 0 Tan Uyen 9392 5391 12353 4855 955 0 443 0 0 453 14 231 61 2474 0 Thuan An 1446 376 85 962 72 0 725 0 0 42 132 0 3 68 200 Di An 950 142 10 234 0 0 190 0 0 2 0 0 3 59 0
Dong Nai province Bien Hoa 1712 52 55 2962 0 17 73 0 0 0 0 0 0 310 0 Vinh Cuu 8811 397 456 191 1151 2793 1726 40 0 80 0 240 20 1000 0 Tan Phu 11686 20 4425 1282 327 10966 38 704 0 160 369 5650 599 4192 1328 Dinh Quan 8096 81 20697 945 3051 11443 605 6853 0 0 970 9500 380 3100 2700 Xuan Loc 15358 708 7800 1648 2637 21206 2508 600 404 200 255 10150 230 10906 830 Long Khanh 3153 45 0 281 90 2622 0 296 0 1300 620 1800 1400 1300 400 Thong Nhat 10356 349 2782 1450 979 12503 4488 1211 29 420 0 3830 115 6700 250 Long Thanh 11649 159 12100 335 112 3755 4564 220 180 235 180 670 98 3925 430 Nhon Trach 11004 78 790 762 1646 20 1387 0 273 69 50 0 0 2800 113
HCMC Dist. 1 0 0 0 0 0 0 0 0 0 0 0 0 0 0 0 Dist. 2 1524 1 0 98 1 0 0 0 0 0 0 0 0 0 0 Dist. 3 0 0 0 0 0 0 0 0 0 0 0 0 0 0 0 Dist. 4 0 0 0 0 0 0 0 0 0 0 0 0 0 0 0 Dist. 5 0 0 0 0 0 0 0 0 0 0 0 0 0 0 0 Dist. 6 0 0 0 0 0 0 0 0 0 0 0 0 0 0 0 Dist. 7 255 0 0 32 0 0 0 0 0 0 0 0 0 0 0 Dist. 8 330 0 0 223 0 0 0 0 0 0 0 0 0 0 0 Dist. 9 5492 17 0 152 0 0 0 0 0 0 0 0 0 0 0 Dist. 10 0 0 0 0 0 0 0 0 0 0 0 0 0 0 0 Dist. 11 0 0 0 0 0 0 0 0 0 0 0 0 0 0 0 Dist. 12 949 0 0 768 14 0 0 0 0 0 0 0 0 0 0 Go Vap 9 0 0 747 0 0 0 0 0 0 0 0 0 0 0 Tan Binh 17 0 0 200 0 0 0 0 0 0 0 0 0 0 0 Binh Thanh 273 0 0 2 7 0 0 0 0 0 0 0 0 0 0 Phu Nhuan 0 0 0 0 0 0 0 0 0 0 0 0 0 0 0 Thu Duc 1143 5 0 762 2 0 0 0 0 0 0 0 0 0 0 Cu Chi 32523 3016 3000 3137 734 0 0 0 0 0 0 0 0 0 0 Hoc Mon 6692 23 0 1212 48 0 0 0 0 0 0 0 0 0 0 Binh Chanh 17894 88 0 1946 3007 0 0 0 0 0 0 0 0 0 0 Nha Be 5475 0 0 10 32 0 0 0 0 0 0 0 0 0 0 Can Gio 3249 0 0 51 59 0 0 0 0 0 0 0 0 0 0
Long An province Tan An 12974 0 0 97 61 0 0 0 0 0 0 0 0 0 0 Tan Hung 50520 0 0 28 0 0 0 0 0 0 0 0 0 0 0 Vinh Hung 48076 0 0 188 0 0 0 0 0 0 0 0 0 0 0 Moc Hoa 52836 0 0 73 0 30 0 0 0 0 0 0 0 0 0

13
Tan Thanh 43498 0 0 0 0 0 0 0 0 0 0 0 0 0 0
Thanh Hoa 34805 0 0 0 0 0 250 0 0 0 0 0 0 0 0 Duc Hue 41713 18 0 96 1842 4 3 0 0 0 0 0 0 0 0 Duc Hoa 40163 5969 0 656 2627 360 0 0 0 0 0 0 0 0 0 Ben Luc 16622 0 0 230 10464 0 608 0 0 0 0 0 0 0 0 Thu Thua 29208 0 0 27 3523 0 310 0 0 0 0 0 0 0 0 Chau Thanh 24377 0 0 19 0 3 3 0 2 0 0 0 0 0 0 Tan Tru 17099 0 0 69 0 0 0 0 3 0 0 0 0 0 0 Can Duoc 22058 0 0 1200 78 0 34 0 16 0 0 0 0 0 0 Can Giuoc 19084 0 0 1730 218 1 9 0 4 0 0 0 0 0 0
Table 6. Crop yield at district level (ton/ha) of four provinces
District Rice Pea –
nut Rubber VegetableSugar –
cane Corn CassavaSoy –bean
Sweet –potato Longan Durian Coffee
Black –pepper Cashew Rambutan
Binh Duong province
Thu Dau Mot 3.2 0.9 1 11.3 49.2 11.4 1.6 1.7 2.6 0.3
Dau Tieng 2.6 0.8 1.4 9.7 40.5 18.4 0.5 2.2 2.5 2.6 0.2 Ben Cat 2.4 0.7 1.2 9.3 40.4 17 0.9 0.8 2.3 2.8 0.2 Phu Giao 2.1 0.9 1.1 6.1 40.9 19.1 0.7 0.3 2.2 3.1 0.1 Tan Uyen 2.4 1 1 9 43.9 19.8 1.3 0.2 2.4 2.3 0.3 Thuan An 3.1 0.9 0.7 1.01 49.2 20.6 1.8 2.2 2 0.3 6 Di An 3 0.8 0.8 13.1 21 2 2 0.2
Dong Nai province Bien Hoa 3.5 1.4 1.1 14.3 3.7 8 0.8 Vinh Cuu 2.9 0.9 1.21 5 46.1 3.3 16 0.8 5.4 1 1.2 0.6 Tan Phu 2.8 0.5 1.2 7.6 34.7 2.9 15.9 0.4 5.2 13 1.4 1.55 1.1 15 Dinh Quan 3.2 0.6 1.3 11.4 76 3.5 18 0.3 0 4.7 1.7 1.45 0.9 9.9 Xuan Loc 3.7 0.7 1.1 10.8 46.5 3.8 21.3 0.8 4.6 5.4 7.2 1.7 1.25 0.7 5 Long Khanh 3.7 1.1 15.8 31.2 3.7 0.9 6.5 8 1.5 2 0.6 7.2 Thong Nhat 3.7 0.8 1.25 11.3 44 3.9 19.6 0.9 6.5 7.2 2 2.1 1 7 Long Thanh 3.8 0.7 1.25 6.4 47 3.4 15.5 0.7 4.4 10 13.4 1.7 0.7 9 Nhon Trach 3.1 1.1 1.2 7.7 87.7 3.2 15.5 7.8 10.2 10.2 0.6 7
HCMC Dist. 1 Dist. 2 2.8 0.9 13.9 40 Dist. 3 Dist. 4 Dist. 5 Dist. 6 Dist. 7 1 10.5 Dist. 8 4.2 29.3 Dist. 9 2.6 1.1 16 Dist. 10 Dist. 11 Dist. 12 2.6 12.7 30 Go Vap 2.6 20.2 Tan Binh 1.1 15.7 Binh Thanh 1.4 30 40 Phu Nhuan Thu Duc 3.1 2.2 27.9 45 Cu Chi 3.2 1.8 0.8 16 57.2

14
Hoc Mon 3.2 1.2 17.9 28.1 Binh Chanh 3.3 1.9 19.8 38.7 Nha Be 2.9 10 28.1 Can Gio 2.9 10.7 29.4
Long An province Tan An 4.1 18.4 48 Tan Hung 3.8 14 Vinh Hung 3.9 12.9 Moc Hoa 3.8 20 5.4 Tan Thanh 4.2 Thanh Hoa 3.1 8 Duc Hue 3.2 1.7 18.1 45 4.5 3.6 Duc Hoa 2 2.3 15 48.4 4.1 Ben Luc 3.1 13 47.4 6.9 Thu Thua 3.8 17.9 41.3 5 Chau Thanh 3.7 16.5 5.6 4.6 4.5 Tan Tru 3.7 14.6 3.6 Can Duoc 2.3 19.8 50 5.9 4 Can Giuoc 2.1 20.7 50 6 3 4
3.3.2 Water
In Dong Nai, ground water table is rather deep, from -15 to -18 m; and in the dry season ground water table is from -20 to -24 m. In Binh Duong province, ground water table is from -10 to -15 m, and that is from -5 to -10 m in Ho Chi Minh City. Ground water table is from 0 to -1 or -2 m in Long An province. 3.3.3 Soil and major trees
Soil classification is based on FAO/UNESCO (1990) with major and sub-soil units: Acrisols (Grey soils) Ferralsols (Red soils) Fluvisols with sub-soil unit: Eutric Fluvisols (Alluvial soils)
Endoprotothionic Fluvisols (Acid sulphate soils) Sali-Endo Orthithionic Fluvisols (Salty soil, mangrove)
Soil type in Dong Nai is mainly red soil, a part with grey soil (podzolic soil). Binh Duong,
Long An and a part of HCMC are in grey soil. Long An has alluvial and acid sulfate soil. Can Gio (HCMC) and Can Duoc (Long An) have salty soil with mangrove.
Binh Duong and Dong Nai have perennial trees and large area of forest. Land around HCMC is used for vegetable cultivation and in Long An land is used for rice growing. Cu Chi district (HCMC) and Ben Cat (Binh Duong) are in podzolic soil with low fertility for crop cultivation. In master plans, these two areas are localized for new relocation of livestock farms.

15
Table 7. Analysis of main soil types in the four investigated areas
Sample
Sand %
Silt %
Clay %
pH KCl
pH H2O
EC mS/cm
OM %
N %
P %
K %
Available P
mg/100g
Ca meq/ 100g
Mg meq/ 100g
K meq/ 100g
Na meq/ 100g
CEC meq/100g
Sali-Epiprotothionic Fluvisols (1) 26 14 60 6.0 6.4 9.8 2.93 0.10 0.17 0.15 9.00 4.11 4.43 1.92 4.99 17.37Sali-Epiprotothionic Fluvisols (2) 1 25 74 5.3 6.5 1.9 5.36 0.18 0.10 0.62 36.92 4.40 12.7 1.22 4.29 22.75
Ferrasols (3) 4 20 76 4.3 6.0 - 3.27 0.08 0.27 0.02 5.66 2.21 1.70 0.09 - 9.80
Eutric Fluvisols (4) 2 41 57 5.7 6.4 - 2.16 0.05 0.09 0.50 30.40 10.82 14.86 0.36 - 27.23Thionic Fluvisols (flood) (5) 3 14 83 3.6 4.0 - 8.42 0.12 0.52 0.66 10.11 1.31 1.85 0.17 - 17.09 Thionic Fluvisols (6) 1 17 82 3.6 4.0 - 10.7 0.32 0.22 0.91 9.24 2.70 1.83 0.21 - 13.63
Acrisols (7) 50 5 45 4.0 4.8 - 2.08 0.04 0.13 0.04 33.42 1.02 0.09 0.02 - 4.07Results of soil analysis from Soil Science Laboratory, Department of Water Management, Nong Lam University (August 14, 2002) 1. (at Can Gio district, coastal) , salty soil 2. (at Can Gio Mangrove Biosphere Reserve) , salty soil 3. (at Long Khanh district), red soil 4. (at Ben Luc district) , alluvial soil 5. (at Moc Hoa district), acid sulphate soil 6. (atThanh Hoa district), acid sulphate soil 7. (at Thu Duc district), grey soil 4. CURRENT INSTITUTIONAL EFFORTS TO PROTECT THE ENVIRONMENT, ANIMAL AND HUMAN HEALTH Binh Duong and Dong Nai province issues Directions on waste treatment while other provinces work based on National Regulations. To push relocation People Committee of HCMC awards 500 mil. VND to the state farm that will be first relocate next year and 300 mil. VND to the secondly-relocated state farm. However, liquid waste from small and medium private intensive farms has been the problems. 4.1 National-level regulations relating to environment issue in Vietnam

16
1) Law of Environment Protection, approved by National Assembly on 27 December 1993
Decision No. 175/CP issued by the Government on October 18, 1994, to guide the implementation of the Law of Environment Protection
Decision No. 26/CP issued by the Government on April 26, 1996, to stipulate fines on
violating environment protection. Some interested issues: • Fine for not performing the necessary measures imposed by the authorised institution
to protect environment in terms of solid waste, liquid waste and emission. • In additional, firms may be prohibit to operating up to 6 months for violating
regulation or may be forced to stop violation, to apply appropriate measures to remedy the situation and to compensate the adverse effect created for regulation violation.
2) Vietnamese standards system
Established by the Standard – Measurement – Quality Control Authority, under the Ministry of Science – Technology and Environment. The following are some standards more or less related to the environmental problems created by livestock production.
• Vietnamese standards on air quality, imposed in 1995. • Vietnamese standards on water quality (surface/under ground/coastal water and
domestic/waste/industrial waste water), imposed in 1995. Water is differentiated into 3 levels: A, B and C. A level is for domestic use and B is for agricultural use.
• Vietnamese standards on using waste water for watering and making fertiliser. TCVN 5298: 1995.
• Vietnamese standards on soil quality. To classify soils based on the level of chemical contamination. Imposed in 1995. Generally, these standards are established in order to use for the industrial sector, not for
agricultural sector. Thus, there is a need to establish specific standards for waste discharge from livestock production. 3) Ordinance on Veterinary Medicine
Approved by Congress Committee In – Charge on Feb. 3, 1993. Main purpose is to prevent animal diseases transmitted and to improve the quality of animal products and the ecological environment. Some interested sections:
• Regulations on killing incurable sick animals. • Dead animal cannot be used as feed if not satisfying the vet. med. conditions. • Pathogen – untreated manure is not allowed to apply to crops.
The major problems of these above-mentioned regulations:
• They mention on regulations that are related to the common environmental issues and their focus is mainly for industrial sector, not for agricultural sector and, especially, not for livestock production.
• For the Ordinance on Veterinary Medicine, although there are several regulations on animal waste treatment; however, the specific measures to implement these regulations have not been established, or if there are measures to implement then there are problems on regulation

17
monitoring and enforcement. For example, it is said that pathogen – untreated manure is not allowed to apply to crops, but there is no standard to identify what pathogen-treated manure is.
Thus, there is the need to propose livestock – specified regulations on waste treatment, to
identify standards for animal waste to be treated and to be applied to crop or to be discharged to the environment. 4.2 Provincial regulation affecting industry

18
1) Dong Nai ‘Regulation on livestock production activities to protect environment’ issued on July 25,
2000 by The People Committee of Dong Nai Province. It defines the size of the livestock farm (small, medium and large scale farm) and the regulation on treating dead animal, animal waste, and introduction for wastewater treatment methods. 2) Long An
• Regulation on removing large scale livestock farms out of the urban area • Regulation on relocation of slaughter houses from urban areas to the concentrated area
3) Binh Duong
• A master plan in which to identify the specialisation areas for livestock production (Tan Uyen and Ben Cat district).
• ‘Regulation in livestock production activities to protect environment in Binh Duong’ issued on September 3, 2002 by the People Committee of Binh Duong province. Large-scale livestock farm that is newly established in Binh Duong province must have appropriate waste treatment system.
4) Ho Chi Minh City
• Decision No. 80/2002, issued on July 6, 2002 by the People Committee of HCMC, to approve the plan of relocation of pollution-created firms to industrial parks and sub-urban areas, included two state – owned livestock farms. Relocation of one of these two farms, the Dong Hiep farm, is going on up to date.
• To support for the relocation mentioned in the Decision No. 80/2002, the People Committee of HCMC has issued the Decision No. 81/2002 on July 8, 2002. The decision No. 81/2002 focuses on the policy to give financial support for pollution-created firms to be relocated, such as to supply the loans with favourable interest rates for reconstruction of firm, to impose favourable tax conditions, or to help in finding new places for firms to be relocated.
5) Others
Some interviewed farm households reported that at village level: - Local officials sometimes go to livestock farm to check for treatment of animal waste. - If the treatment is not adequate then local officials may require farmers to do some measure to improve the situation. - However, the enforcement for the requirement is not so strict (e.g., local officials may be unable to arrange their time to come back to livestock farm to check if farmers to perform their requirement). - Some farmers show their willingness to apply the new waste treatment method if it is efficient and at a low cost.
It is clear that local governments in the study site are aware of environmental problem
created by animal production then they have issued several regulations related to the problem. Some treatment techniques for animal waste are also included in local regulations. However, the major problems for local regulation are also how to monitoring and to enforce these regulation effectively. For farmers, to build a waste treatment system means that they must spend some money but their limited income may not afford for that. Thus, to find out low cost treatment techniques or to have some form of subsidy for waste treatment installation must be considered to make the AWI concept to become reality.

19
4.3 Some policy on foreign investment versus domestic investment
1) Regulations on tax reduction/exemption for domestic and foreign-invested enterprises
a. For foreign-invested enterprises
The Decision No 24/2000/ND-CP issued on 31 July 2000 by the Government is to regulate in details the implementation of the Law on Foreign Investment in Vietnam: If investing in the localities with hard socio-economic conditions, foreign-invested enterprises (joint venture or 100% foreign capital) shall be liable to a maximum income tax exemption period of 2 years from that beginning with profitable business, and a 50% income tax reduction for the 3 subsequent years
For investing in the localities with extreme hard socio-economic conditions or sectors with high priority of investment encouragement, foreign-invested enterprises shall be liable to a maximum income tax exemption of 4 years from that beginning with profitable business, and a 50% income tax reduction for the 4 subsequent years.
The list of sectors with high priority of investment encouragement includes cultivating and growing agricultural, forestry and aquatic products. The following table shows the localities with investment encouragement. Table 8. List of localities with investment encouragement
Provinces/Cities Localities with extreme hard socio-economic conditions
Localities with hard socio-economic conditions
Dong Nai Districts: Dinh Quan, Tan Phu, Xuan Loc
Binh Duong Districts: Ben Cat, Phu Giao, Tan Uyen, Dau Tieng,
HCM City Districts: Can Gio, Cu Chi Long An All districts of Long An Tan An Town
b. For domestic enterprises For newly established domestic enterprises, they shall be liable for income tax exemption period
of 2 years from the beginning of profitable business and a 50% income tax reduction for the 2 subsequent years. If investors invest in the localities with hard socio-economic conditions, they shall be liable for income tax exemption period of 3 years from the beginning of profitable business and a 50% income tax reduction for the 5 subsequent years (Decision No. 30/1998/ND-CP issued on 13 May 1998 by the Government to regulate in details the implementation of Law of Enterprise Taxes).
2) Income tax rates applied for foreign-invested and domestic enterprises
- The common income tax rate applied for foreign-invested enterprise is 25%. For sectors with investment encouragement (cultivating/growing agricultural, forestry and aquatic products included) the income tax rate applied is 20% for the first 10 years of business. - The common income tax rate applied for domestic enterprise is 32%.
In general, foreign investors enjoy a more favourable tax condition than domestic investors.
The General Director of the Dai Viet Company Limited, a 100% foreign capital invested company, said that one of the main reasons for the Dai Viet Company to choose Ben Cat district of Binh Duong province as the place to locate the livestock farm is the favourable condition for foreign investment in livestock production activities. Ben Cat and Tan Uyen are the two districts, which are in the list of localities with investment encouragement and identified by local government of Binh

20
Duong province as areas to specialize for livestock production. A domestic – invested livestock farm, the Kim Long farm, is also located in the Tan Uyen district because the domestic investor wants to enjoy the favourable conditions in area with investment encouragement. Thus, economic consideration is clearly a one of major reasons for investor to choose a place designed by government to locate their livestock farm. 4.4 Current relocation projects of the government
To partly take place the area-wide integration of crops-animal production as well as environment protection, two swine state farms in HCMC will construct new sites by June 2002 and relocate pigs by the end of 2003. Other provinces just have plan to relocate the existing state farms and slaughter houses causing pollution. Conditions for relocation of livestock farms: - Large farms are now located in densely populated town, thus they have to be relocated to prevent pollution which adversely affects people living nearby the farms. - The new area for relocation of large farm has available land for establishing new farm. - These places are far from urban area. - The soil conditions in the areas are poor grey soils; therefore, there is opportunity to use the manure from livestock activities to improve the soil fertility. - The level of water table is deep, meaning that the threat of water contamination by animal waste may be least. - Provincial government wants to create a zone of disease safety in the area specialized for livestock activities in order to promote the livestock production for export.
New sites of animal production decided by provincial government:
- Binh Duong: Ben Cat and Tan Uyen districts - Dong Nai: Nhon Trach, Vinh Cuu, Thong Nhat districts - HCMC: Cu Chi district - Long An: Ñuc Hoa district
The main problems of the city/provinces are the limited recycle of liquid animal waste, the
disintegration to some extent between animal production and cropping, and lack of economic analysis that strengthens the decision-making of policymakers in balancing the manure output, soil fertility and environment protection. The problems are more serious at the small scale and medium scale farms.
5. METHODOLOGY TO SUPPORT ANALYSIS IN THE PROJECT 5.1 Technical solutions for animal waste use The technical solutions for animal waste use were reviewed relying on results of a quick investigation on 160 householders and another comprehensive survey. The survey was conducted in some districts of the four project sites, including questionnaires on manure treatment, land use, agricultural activities, cost and benefit. Descriptions of the survey will be showed in methodology of economics/policy analysis. 5.2 Food safety and environment impact of these solutions
Environment impact of these solutions were determined by taking samples of various effluents in the two seasons (dry and rainy). Contamination of vegetable fertilized by manure was collected from the crop experiment. 5.3 Manure application in crop experiments and assessment of nutrient flow

21
The objectives of the experiment were to find the relationship between animal manure treatments and plant growth, development, yields as well as soil fertility on different crops including rice, vegetable, groundnuts, rubber tree and longan at different places during April 2002 - January 2003.
The crop experiments were designed for evaluation the efficiency of solid pig manure and sediment of biogas effluent from pig farms for five different crops. Each experiment was located in a specific place within the project area. The crops used in the experiments were dominant representative in the area. The experiments were conducted on farms rented from various farmers. The farm owners were responsible for routine works like watering, herb and pest controls. All other works had done by agronomists from Nong Lam University. Farm owners relating to the crop experiments are skillful and experienced farmers who were respected by other villagers. All of the farms had none or only little manure in-situ, thus manure used in the experiments were bought from other area. Manure was applied at the beginning of a crop cycle. For rice, vegetable and groundnut, manure was applied before sowing. While, manure was applied before fruitsetting for longan and before latex havesting season for rubber tree. All experiments had done with 3 repetitions. More details of these experiments are shown in the following table. Table 9. Experiment on paddy rice Location Ñong Ba of Thuan An Dist., Binh
Duong province Manure treament level (First crop) (Second crop)
0 tons/ha (control) 5 tons/ha (0.5 kg/m2) 10 tons/ha (1 kg/m2) 20 tons/ha (2 kg/m2) 2 tons/ha (0.2 kg/m2) 4 tons/ha (0.4 kg/m2) 8 tons/ha (0.8 kg/m2)
Plot size 50 m2 Number of experimental units 21 Total experimental area 1050 m2
Table 10. Experiment on vegetable – Brassica sp. Location Tan Hanh– Bien Hoa, Dong Nai
province Manure treament level 0 tons/ha (control)
5 tons/ha (0.5 kg/m2) 10 tons/ha (1 kg/m2) 20 tons/ha (2 kg/m2)
Plot size 30 m2 Number of experimental units 21 Total experimental area 630 m2

22
Table 11. Experiment on groundnut Location Ñuc Hoa district, Long An province
0 tons/ha (control)
5 tons/ha (0.5 kg/m2) 10 tons/ha (1 kg/m2) 20 tons/ha (2 kg/m2)
Plot size 50 Number of experimental units 21 Total experimental area 1050 m2 Table 12. Detail of the experiment on rubber tree Location Cu Chi district, HCMC 0 tons/ha (control)
5 tons/ha (10 kg/tree) 10 tons/ha (20 kg/tree) 20 tons/ha (40 kg/tree)
Plot size 400 m2 Number of experimental units 21 Total experimental area 8400 m2 Table 13. Detail of the experiment on longan Location Ben Cat district – Binh Duong
province Manure treament level 0 tons/ha (control)
5 tons/ha (10 kg/tree) 10 tons/ha (20 kg/tree) 20 tons/ha (40 kg/tree)
Plot size 400 m2 Number of experimental units 21 Total experimental area 8400 m2 Irrigation
Rice field was irrigated with water canalling from Saigon River. Water level on the field was kept stably with a deep of 5 centimeter in average. In the dry season, Longan and Barassica were watered with ground water pumped from wells on the fields. Longan was watered through a drip system while brassica was watered daily through manual spraying. pH of the water range from 4.6 to 5.8; 5.6 to 6.0 and 5.6 to 6.0 for rice, longan and brassica, respectively. No irrigation was conducted for rubber tree and peanut. Measurement (1) Soil fertility
Soil from every experimental plot was analyzed before and after experiments. Soil samples were collected in the surface layer (0-20 cm). Analysis was conducted within one week after sampling.

23
(2) Plant evaluation The field was instructed weekly. Special attention paid to seed germination, leaves and branches growth, flowers and fruit development, deseases and insect appearance, biomass yields, seed or fruit yields (3) Assessment of nutrien flow
Alterations of nutrients in experimented areas may give information about nutrient flow in the field. Soil from every experimental plot was analyzed before manure treatment and after the experiments had conducted. Soil samples were collected from several position (usually 5) inside every experimental plot. Soil sample was taken in the surface layer (0-20 cm). Analysis was conducted within one week after sampling. Analysis were conducted including nitrogen, phosphate, potassium, sodium, calcium, magnesium, manganese, copper, ferrous, as well as physical property were determined. 5.4 Spatial analysis
Data collected based on the statistics at district level; for example, number of livestock including pig, poultry, cattle and buffalo. Calculation supported by GIS on map represented characteristics of human population, pig increase percentage and density, main crops and promising new relocated areas of pig farms. The objectives of GIS application are: - To analyze the geographical distribution of livestock and crop at district level - To calculate the manure emission and nutrient balance which influences to environment - To calculate transportation costs and facilities for integration of crops and livestock sectors - To describe land use for evaluating integration of crop and livestock, and natural conservation - To determine the areas for new relocation of livestock farms 5.5 Economic/policy analysis
A survey was held in four city/provinces in July – August 2002. Below is a short description of the sampling procedure.
• In every province, two districts were selected to carry out the survey. These are districts with intensive livestock production or districts identified by local government as a place to relocate livestock farms. The selected districts of every city/provinces were the following:
Province/City Districts selected for survey
Binh Duong Thuan An and Ben Cat Dong Nai Thong Nhat and Vinh Cuu Ho Chi Minh City 12 and Cu Chi Long An Ben Luc and Duc Hoa
• 30 livestock farms, 30 crop farms and 30 mixed farms (crop & livestock production) of the
two above-mentioned districts of every province/city were selected to interview with the assistance of local experts. Thus, the number of interviewed farm households for each province is 90 and the total number of interviewed farm households is 360.
5.6 Proposed strategies Based on the results of the above activities and discussions in the meetings with farmers, middlemen involving in animal market or manure market, companies (Thien Sinh organic fertilizer, Nam Phong animal-product processing plant) and local officials of each province, policy options were proposed and presented at the two workshops held in September 2002 and March 2003 where

24
the participants were technicians, officials and policy from the four project provinces, Ministry of Agriculture and Rural Development, and the organic fertilizer company. 6. FINDINGS 6.1 FARM SURVEY OF CURRENT MANURE USE 6.1.1 General description of current waste management by species
The quick investigation was carried out at approximately 160 farms in some areas of the project provinces in order to get an overview of animal waste handling, and then another survey was conducted to analyze the economic aspect of the manure processing and use.
Below was sites to carry out the quick investigation. HCMC: Hiep Thanh, Thanh Loc, Thoi An, Tan Chanh Hiep wards of Dist. 12; and Dist. Hoc Mon Dong Nai: Long Binh, Tan Phong, Tan Hanh wards of Bien Hoa City; and Vinh Cuu Dist. Binh Duong: Dinh Hoa commune of Thuan An Dist.; Tru van Tho commune of Ben cat Dist. Long An: Tan Tru, Tan An, and Duc Hoa districts The common way of dead animal diposal is to cook the animal and feed to wild animal such as croccodile or snake; therefore, the disposal of manure will be focused.
Chicken waste
Faces are collected weekly or at intervals of several days. It is then treated by biogas, or for sale and finally utilized as fish feed or crop fertilizers.
Cattle waste Most cattle farms collect solid manure before flushing. Solid waste is then processed for
utilization at home garden or freshly sold to middlemen. Like chicken manure, cattle solid wastes are all used for fertilization.
Management of cattle liquid wastes is actually not a problematic issue due to: - Most of cattle manure are collected and utilized as fertilizer (as discussed above); therefore
pen washing does not produce high volume of wastewater which has low amount of solid matter. - Wastes from cattle is not as odorous as that from pig. - Almost all of cattle farms have more or less land of which some part is used to grow elephant
grass, and other is for manure storage (for sale) or processing (mostly drying, or fermentation); fresh liquid wastes or biogas effluent is used to irrigate the grass, vegetables, or crops
In summary, liquid wastes and biogas effluent from cattle farms is treated in one of the following ways:
- go to biogas plant - are lagooned for irritating grass (elephant grass) which is used for the animals - go through few settlement tanks; solid wastes are then collected, and wastewater is
discharged into streams, sewage system, and finally into rivers - go straight to streams or sewage and finally to river, or - overflow on land without any treatment
Pig waste Of observed farms about 40% have solid and liquid wastes are separated. However, neither
pig solid nor liquid wastes are preferred for agriculture. In surveyed areas, people may manage pig wastewater by one of the following:
* Farms without land (majority in Dong Nai, HCMC): • Discharge straight to stream, sewage, and after all to river (Dong Nai river, Sai Gon river,
and Vam Co rivers) • Pass over few settlement tanks, solids are then collected and liquid is discharged to streams,
sewage system, and finally to rivers

25
• Overflow on land surrounding the house or farm • Lead to biogas tanks or biogas plastic bags
* Farms with land: • Go to streams leading to vegetable or crop land (e.g. Long Binh, Tan Phong wards; in
HCMC, it is usually led to ponds growing water spinach) • Store and use for irrigation of vegetables, crops, or garden • Go to fish pond • Lead to biogas tanks or biogas plastic bags, or • Discharge to environment as described above.
At Vinh Cuu district of Dong Nai province, solid wastes are separated at most farms. Unlike in other surveyed areas, pig manure in this district is mostly used for agriculture. 6.1.2 Treatment of solid wastes
Solid wastes are referred to as faces or solid matters collected from sedimentation tanks or lagoons.
Chicken waste In Binh Duong and Dong Nai, chicken wastes are considered as high-value source of organic
fertilizer and locally utilized. Therefore, farmers are possible to sell them freshly to marketers (no treatment). Faces (with or without litter) are contained in 20 kg plastic bags.
At Tan Tru chicken manure is widely utilized in one of the following ways: - Biogas plants; it is said that biogas plants using chicken wastes have slower start but produce
more gas than that using cattle or pig wastes. - For fish; in some farms chicken pens are built above fish pond, so it saves labor for collection. Cattle manure
Cattle solid wastes are almost collected and utilized for agriculture. Cattle manure is widely used as fertilizer due to its softness, high content of fibers, and lower concentration of protein compared to pig manure. It does not have offensive odor.
Cattle solid wastes may go through one of the following treatment before utilized: - Land-spreading for dehydration (for approximately 3-4 days) is the most popular method. - Manure is piled or stored in concrete tanks, maybe mixed with lime, or mixed with rice straw
and then burnt before used. - It is dried under sunlight, then mixed with rice husk ash and coconut husk dust, piled up for
incubation and consequently utilized for growing bonsai. Pig manure
Unlike chicken and cattle manure, pig solid wastes are not widely used for fertilization. The reasons are given in later parts.
Whether solid manure is separately collected may depend on available water supply. In areas where farmers have to buy water (from public water plants or public wells, for example at Tan Tru and Tan An), solid manure is collected before flushing in order to save water.
On the other hand, at farms having their own wells, solid and liquid wastes are usually not separated. In this case, wastewater may go through few settlement tanks, solids are collected. At Long Binh ward, some families, who do not have animal production, build a wall downstream of pig waste streams (from other farms) to stop the flow and collect sediment which is then dehydrated, bagged or incubated with rice husk ash, and sole.
Before utilization as fertilizer, pig solid wastes may be mixed with rice husk ash and then incubated for 2-3 weeks or dehydrated by spreading for 1-2 weeks. Some farmers spray

26
microbiological products (EM) to the piles to increase the efficiency of treatment. Pig manure can be treated in biogas plants.
At Tan Phong ward, farmers buy pig solid wastes and soak them in lagoon (1 part of manure to 10 part of water) for several weeks. The slurry is again diluted before or during irrigation of vegetables or crops. (1) Composting
Although nation-wide extensionists have held training short course of composting techniques for farmers, it does not seem successful. Most farmers treat animal manure in their ways according to experience and depending on several factors such as crop seasons.
(i) Solid wastes (including solid manure and sediment) can be collected and stored in plastic bags (no addition of fiber materials) that are piled until used. Storage time depends on fertilization or market requirements: it may be few days to one to two months (pig and poultry manure).
(ii) Manure is mixed up with rice husk ash, and incubation time also ranges from few days to two months (cattle, pig, and poultry manure).
(iii) It is land-spread for drying (cattle’s) (iv) In few farms, microbiological products (e.g. EM, effective microorganisms, products) are
sprayed to manure pile to speed-up the fermentation process. (2) Biogas plant
In the attempt of popularization of biogas plants as methods of biological treatment of animal wastes, extension programs have periodically been conducted to transfer techniques as well partly financially support farmers to build-up house-hold biogas plants or install biogas plastic bags. According to farmers, the main advantages of biogas plants are the following: - Treatment of animal wastes. - Biogas effluent producing no offensive odor, not attracting flies, being able to be utilized for irrigation or for fish - Producing biogas that is used for cooking, which saves approximately 100,000 VND per month for a family (of 4-5 people); at one poultry farm at Tan Tru district (Long An), biogas stoves are used for warming baby chicks; or at a pig farm in Dong Nai, biogas is used to boil water for nursery piglets.
However, application of biogas plants also has important limitations: - It require large areas, so is not suitable for farms without land or ones having limited areas; in addition, building underground biogas tanks needs high initial investment. - It is not able to treat all of wastes produced from big farms; e.g. at Long Binh ward (Bien Hoa, Dong Nai), where very high population of pigs are raised on small areas, about 60% pig farms having biogas plants which however use only about 10% of generated wastewater, the remaining is discharged to Linh stream that finally goes to Dong Nai river. - It can not be practiced for farms that have small numbers of animals (less than 2 cattle or less than 5 grower pigs). - In some areas, water is limited in dry season (e.g. at Tan Hanh ward, Bien Hoa, Dong Nai; or southern districts of Long An); on the other hand, in some northern areas of Long An, flooding happens every year from July to October; so at those areas biogas plants can not be maintained. - Although biogas effluent does not have offensive odor, and the total solid and organic matter contents are reduced, it does not meet discharge standard for wastes water. According a report by Duong Nguyen Khang et al. (2001), dilution of manure at 1:5 to 1:7 ratio before feeding to biogas plastic bags can produce biogas discharge met level C of discharge standard. However, this ratio is not practicable because (i) it consumes large volume of water; (ii) needs larger volume of biogas tanks or bags (two-fold), so requires larger areas and more investment; (iii) according many authors,

27
the proper dilution for fermentation and producing gas is 1:2 for pig manure and 1:1 for cattle manure, higher dilution may lead to less gas produced.
In summary, application of biogas plants for treatment of animal wastes brings in many
advantages. However, its feasibility depends on: (i) geographical conditions: hard to apply to flooded or drought areas; (ii) scale of production: farms of less than 5 grower pigs do not produce enough wastes to run the reactor; for big farms where only part of generated wastes going to biogas plants, it is necessary to combine biogas plants with other wastes handling methods; and (iii) biogas discharge needs to be treated (sedimentation, filter), lagooned for irrigation or disposed of on crop land with care, or used for fish. The percentage of householders who had different methods of waste treatment was obtained in the comprehensive survey including economic analysis of waste treatment in the four provinces. Table 14. Various waste treatments applied by livestock farms in the study site (in %)
Waste treatment Solid waste Liquid waste
1) Biogas 21 25 2) Fresh manure storage 26 0 3) Composting 10 0 4) Discharge to fish ponds 8 12 5) Discharge to land/stream 19 60 6) Selling fresh manure 7 0 7) Give away 2 0 8) Combined 2 0 9) Others 5 3
Total 100% 100% Figures in the Table 14 also show that liquid waste poses a big problem for environment
when farm households directly discharge the liquid waste into land or stream. The percentage of interviewed farm households that directly discharge the liquid waste into the environment is 60% for 4 provinces/city. In the survey, several respondents have showed their willingness to treat their animal waste discharge if there is any efficient treatment method to apply at a low cost. Difficulties in management of pig waste
Disposal of wastes in swine production has remained a headache to enterprise owners as well as the authorities. It would be due to the following reasons:
- Wastewater from pig production usually has high levels of solid matters because solid and liquid wastes are not separated.
- High amounts of liquid wastes are generated due to high numbers of animals and high volume of water needed to flush out solid manure.
- Pig wastes are highly odorous. - Farmers do not prefer swine manure for agriculture.
In HCMC, Binh Duong, and Dong Nai, pig farms are often located in areas of high population. It may be due to an old custom that cattle used to be raised mainly for farming and transportation, not for meat or milk; in addition, cattle lives mainly on grass; so as discussed above, almost all of cattle farms have land for pasture and cropping and/or gardening. On the other hand, pigs are raised for meat and they require small areas; so pig farms often do not have large extra land for wastewater treatment, cropping, or gardening. Urbanization and industrialization of swine production have reduced land for waste treatment.

28
Another reason is also that farmers may not get accustomed to using animal wastes as fertilizers. In Long An, although majority farms have animal production together with cropping or gardening, farmers sell or discharge animal wastes and buy inorganic fertilizers for their crops and gardens.
6.1.3 Current animal waste usage Current usage of animal wastes can be summarized as follows: - Manure is used mainly for highly profitable crops (coffee and pepper plants, fruit plants,
flowers, and vegetables) - Farmers believe that cattle and poultry manure is better than pig manure. Farmers’
conventional thought that pig manure is “hot” thus not be a fertilizer. - Farmers’ belief that composting is of poor quality. - The majority of farms have used untreated manure for vegetable and consequently
accumulation of dangerous pollutants on vegetable is alarming. - Chicken manure and swine manure may be used for fish if the farms have land for fish
pond, which is not popular in HCMC and Bien Hoa city. Chicken manure
Chicken manure is considered as high-value fertilizers so it is not used for growing vegetables or crops, but for more valuable plants. ). Chicken manure from HCMC and Long An is transported to Dong Nai, Binh Duong, and Lam Dong where it is utilized for coffee, black pepper or fruits (longan, durian, grape fruit) plantation.
Manure with or without litter is stored in plastic bags that are piled until used. Fresh manure can be used if urgent. Each plant receives one manure bag (of ca. 20 kg) that has been tore so that wastes gradually penetrate to soil.
Cattle manure Cattle manure can be utilized as fertilizers for: - Elephant grass that is then used to feed the animals - Bonsai that has strongly developed in HCMC - Coffee or fruits plantation Cattle manure is not used for growing vegetables because it contains large amounts of grass
seeds. Pig manure
In surveyed areas, only at Bien Hoa city and Vinh Cuu district (Dong Nai province), pig manure is utilized for agriculture. It may be used for vegetables and crops such as lettuce, pumpkin, cucumber, bitter gourd, corn, peanut etc., and for flowers. Large proportion of vegetables supplied in HCMC markets come from Bien Hoa city and Lam Dong. Some farms in Dong Nai use pig manure for grape fruits.
6.1.4 Current markets of manure and ways of delivery
Solid manure may be sold directly to farmers or fertilizer factories, or to middlemen. In Binh Duong, animal solid wastes are utilized for fruit plants (longan, grape fruit). In HCMC, cattle manure is mainly used for bonsai. However, the main markets for animal solid manure are in Dong Nai and Lam Dong, where the manure is utilized for coffee, black pepper, fruits plants or vegetables. Chicken manure from Long An, HCMC, Binh Duong, and Bien Hoa city are transported those areas. Following are selling price of manure sold at animal farms.
Chicken manure
As discussed above, chicken manure is good source of fertilizers. The price of chicken faces is

29
higher than that of pigs and cattle. In general, the price often goes up and down depending on the price of coffee grain and others.
- Fresh chicken manure without litter is sold from 4000 to 6000 VND per bag (of about 20 kg). - Manure with litter is cheaper,1500 – 2000 VND/bag. Cattle manure Cattle solid waste is sold as fresh or processed manure. - One cubic meter of fresh manure costs 40,000 to 50,000 VND. - Processed cattle manure (simply by sun drying, or by incubation with rice husk ash, and
coconut husk), will be sold for 80,000 to 120,000 VND per cubic meter. Its demand for agriculture is very high and its price does not seasonally vary.
Swine manure Price of pig manure is lowest. - Fresh manure costs 2000-3000 VND for a bag of 20 kg. - Dehydrated waste can cost 4000 VND a bag. In rainy season, many farms give out pig manure for free but usually no ones take it.
Collection and transportation cost The cost may vary in different areas, in general: - Transportation from farms to rendezvous points (within 1-2 km): 500 VND/bag of 20 kg
(chicken waste), mainly by bicycles or small wagons; or 1500 VND per 1 cubic meter for 1 km (cattle manure), by small wagons; which is paid by middlemen.
- Transportation from rendezvous places to agriculture areas: 1,000,000 -1,200,000 VND/truck of 10 tons for a distance of 250 km, paid by the buyer. Data from the survey showed the information on manure stored and sold, and on manure application by the interviewed farms (Table 15). Table 15. Information on manure stored and sold by the interviewed farm households
Buyers Kinds of manure
No. of households
No. of households Farmer Middlemen
Selling price
(dong/kg)
Quantity sold/hh
(kg/year) Fresh manure 86 49 47 2 154 6835
Compost 28 20 19 1 217 3816
Generally, livestock farmers are the ones who do the manure collecting and cleaning works. One reason is to prevent the disease transmission. Farmers are afraid that middlemen can bring disease germs from other farms to their farms if they let middlemen do the manure collecting work. Farmers usually collect the solid waste and put it into the storage place while cleaning animals and animal house. Thus, labor costs for collecting manure may be considered nil. Costs associated with the compost processing are the costs of materials (e.g., straw, ash) used to mix with the solid waste as well as labor costs.
The details of information for each province on number of farm households that sell their manure, given by Appendix Table 5, show that among the four studied sites Dong Nai and Binh Duong have a relatively more developed manure market with the highest number of interviewed livestock farmers who sell manure. This implies that manure market is relatively developed in the project provinces. This is a major aspect to be considered regarding to the potential of AWI.

30
Tables 16 and 17 show the information on the application of manure of crop farms and mixed farms (crop & livestock) in the survey. Table16. Information on manure application for crops, the interviewed farm household
Producer types Items Unit of measurement Crop producers Mixed producers
1. Number of crop cycles (a) No. of cycles 203 157 2. Number of crop cycles with manure application (b) No. of cycles 78 90 3. Percentage of (b)/(a) (%) 38% 57% 4. Sources of manure - Purchased % 72 49 - Obtained free of charge from others % 7 0 - Self – produced % 21 51 5. Transportation method and cost associated with: - Cattle-pulled cart (000 dong/ton – km) 15.50 - Tricycle – motor (000 dong/ton – km) 14.75 - Motor (000 dong/ton – km) 22.50
There is a considerable proportion of the interviewed crop farmers to apply manure for their crops. The percentage of interviewed crop farmers in the study site applying manure for their crops is 38%. The proportion of mixed farmers who apply manure for their crops is even higher that of crop farms. The percentage of interviewed mixed farmers in the study site is 57%. It can conclude that mixed farms are prone to using more manure than crop farms. One possible reason is that manure transportation for mixed farms is easier than crop farms. Crop farmers must look for somewhere to buy and to transport manure to their farm. Thus, the problem of manure transportation needs to be considered when designing policies related to area wide integration concepts. The main transportation types used by the interviewed farmers within their farms are cattle-pulled cart, tricycle – motor and motorbike. For every transportation type, transportation cost for a one ton – kilometer of manure is not much different among the 4 study provinces/city. Table 17. Farmers’ recognition on manure application.
Items Unit of
measurement Quantity A) Farmers’ recognition of the effect of manure on crops 1. A source to provide nutrients for crops % 59% 2. To improve soils structure // 34% 3. To help plants growing faster // 7% B) Manure amount applied 1. More than enough % 8% 2. Appropriate quantity // 53% 3. Lower than the desired amount // 39% C) Manure price - High // 10% - Reasonable // 65% - Low // 25%

31
Table 17 shows the interviewed crop farmers’ opinions on the manure application for their crops. Among the farmers who apply manure on their crops, 93% recognize the role of manure as to provide nutrients for crops as well as to improve soils structure. Only 7% recognize the clear effect of manure to helping plants to grow faster. If farmers want a fast effect on crop growing, they prefer chemical fertiliser to manure. The majority of opinions (92%) thought that the quantity of manure applied for crops is appropriate or lower than the desired amount. Approximately, 90% of farmers’ opinions express that the price of manure is reasonable or low. In conclusion, the farmers’ recognition on the application of manure for their crops is positive. This is a favourable condition for appropriate policies to encourage the development of the area wide integration framework. 6.1.5 Analysis of the cost-benefit of different manure management solution
(1) Biogas treatment Table 18. Financial analysis for livestock farm with biogas treatment, the interviewed farm households in the study site
ITEMS Measurement Unit Long An
Livestock farm interviewed No. of households 240
Farm with biogas treatment No. of households 58
I. COST – BENEFIT FOR BIOGAS TREATMENT
1. Average installation cost for biogas treatment
000dong/hh/year 578
2. Estimated benefit from biogas treatment (LPG substitute)
000dong/hh/year 1134
3. Savings amount (= 2 – 1) 000dong/hh/year 556
4. Benefit – Cost Ratio (= 2/1) Times 1.96
II. BIOGAS USES
1. Cooking food Household 50
2. Cooking feed Household 31
3. Produce liquor Household 2
4. Give away to neighbor Household 2
5. No use Household 2
III. TREATMENT FOR BIOGAS LIQUID WASTE
1. Discharge into farm ditch Household 19
2. Discharge into river Household 18
3. Discharge into cultivated land Household 4
4. Watering plants Household 6
5. Discharge into orchards Household 3
6. Newly installed Household 7
7. Discharge into grass land Household 1

32
The table shows the estimation of cost and benefit for biogas treatment. The calculation is based on information from pig farms. The benefit from biogas is estimated as a substitute for liquid petroleum gas. Biogas is mainly used for cooking food and feed. The average benefit – cost ratio for the study area is 1.96. This ratio is greater than 1, i.e., the benefit from biogas uses is higher than the cost for installation the biogas treatment facilities. However, this does not mean that all farmers are willing and able to install the biogas treatment. Establishing a biogas system need the average costs of 1.5 – 2 million dong (the average installation cost showed in Table 18 is equal to total installation cost divided by 3 years, approximately). One more problem with biogas treatment is the biogas effluent. Farmers usually discharge biogas effluent into stream (farm ditch or river). A few farms discharge it on their cultivated land or use it to watering plants. This may create another problem: the treatment of biogas effluent to satisfy the requirement for wastewater discharged to the environment. Table 19. Types of biogas treatment by farm scale, the interviewed livestock farms
Biogas types Farm scale (animal
heads/farm) Plastic tube (household no.) Concrete (household no.)
<50 10 4 50 – 100 18 5 100 –200 7 6
>=200 4 4 Total 39 19
The table shows numbers of pig farms with biogas treatment, classified by different farm scales (measured as the number of animal heads per farm) in the study site. Generally, plastic tube biogas is more popular than concrete tank biogas because the earlier is cheaper. This implies that capital invested in biogas treatment is a major concern of livestock farmers.
(2) Fresh manure and compost treatments
Table 20. Benefit - cost ratio for fresh manure storage, the interviewed livestock farm households
No. of households Benefit – cost ratios Farm scales (animal heads/household) Cattle Chicken Swine Cattle Chicken Swine
<10 14 - - 4.79 - - 10 – 20 9 - 2 2.66 - 2.79 20 – 50 2 - 6 4.34 - 4.45 50 – 100 - - 9 - - 7.06 100 – 200 - - 13 - - 3.00 200 – 500 - 1 5 - 3.13 2.11 500-1000 - 1 2 - 0.00 2.78
>1000 - 10 - - 2.65 Total 25 12 37
The table shows the average benefit – cost ratio for fresh manure storage of livestock farms in the project site. The treatment cost of fresh manure storage is estimated based on labor costs. The

33
benefits from treatment are estimated from the market value of manure. The ratios of benefit – cost for fresh manure treatment of the interviewed livestock farm households at different farm scales and for major livestock production (i.e., cattle, swine and chicken) in the study site are greater than 1. This means that the treatment can bring profit if farmers can sell their treated manure. Table 21. Benefit - cost ratio for composting, the interviewed livestock farm households
No. of households Benefit – cost ratios Farm scales (animal heads/household) Cattle Chicken Swine Cattle Chicken Swine
<10 3 - 1 1.52 - - 10 – 20 - - 6 - - 2.68 20 – 50 1 - 4 3.20 - 5.49 50 – 100 - - 3 - - 2.57 100 – 200 - - 6 - - 2.60 200 – 500 - - 2 - - 2.45 500-1000 - 1 1 - 2.78 4.17
>1000 - 3 - - 2.68 - 4 4 23
The average benefit – cost ratios for composting of the interviewed livestock farm households for different farm scales are shown in Table 21. The treatment costs are estimated from the costs of labor and materials (e.g., straw and ash used for composting). The benefits from treatment are estimated from the market value of manure. The average benefit – cost ratios for compost treatment of the interviewed livestock farm households at various farm scales and for major livestock production (i.e., cattle, swine and chicken) in the study site are greater than 1. This implies that the compost can bring profit if farmers can sell their treated manure. However, not all livestock farms can sell their fresh manure or compost. In some areas the manure market does not exist thus farmers cannot sell manure, especially for livestock farms that locate relatively far from the main road. Thus, policy to enhance manure market development can bring out favorable conditions for farmers to apply various waste treatment methods.
Correlation analyses have been done to check the relation between livestock farm scales and costs associated with different ways of waste treatment. Generally, there is no clear relation between treatment costs and farm scales. This implies that the resources that which larger farms invest in their waste treatment are not increased proportionately with their farm size to compare with small farms. As consequences, environmental problems created by animal waste discharged from medium farms is greater than small farms. Some participants in the AWI workshop in Vietnam voiced that animal waste discharged from small- scale farms, i.e., farm with less than 10 pigs, create no problems to environment. For large-scale farm they must build the waste treatment system as required by local government. Thus livestock farms with medium farm scale, i.e., farms with more than 10 pigs, may create most problems for environment from their animal waste discharge. * Preliminary reasons why the crop industry may not be using the animal waste
As discussed above, chicken and cattle manure is almost utilized for agriculture. The most problem comes from pig wastes, with the following reasons:
- Pig manure is quite wet (watery) and bulky, so it is hard to collect and transport. - It has offensive odor. - High numbers of pigs are raised, which produce large amounts of wastes

34
- In rainy season, it is difficult to collect, dehydrate, and transport large quantity of pig manure. So during this period, solid wastes are usually not collected but flushed out with water.
- According to farmers, pig wastes are “hot” and so may damage the vegetables, crops or plants - Farmer’s experience/belief is that it is good for rice leaves, not for grains; while gardeners say
longan fertilized with pig waste is not as sweet as with chicken manure. However, extensionists and manure marketers/middlemen have other answers. According to
extensionists, inappropriate processing/composting of solid manure is the main reason. If the composting process has not finished yet, so complex organic compounds still remain when manure is applied to soil, heat produced from degradation will damage the roots.
Interestingly, according a middleman at Tan An, farmers prefer chicken manure because middlemen like to supply chicken waste rather than pig manure. He collects pig manure for only his close customers. Because pig wastes are watery and bulky, they have to pay more for carriers as it is hard to carry and move for long distance. That means they get less profit from pig manure than from chicken one. He states that marketers themselves can persuade and induce farmers to use pig manure if it can bring them profit.
Its bulk is also a reason why it is not preferred in Mekong delta where goods are transported on small boats to distant areas. It is also hard and cost more labor to carry and apply that bulk to rice farms where motored and manual vehicles can not be used.
6.2 FINDINGS FROM ENVIRONMENT ANALYSIS
Due to budget limitation and that swine production is the biggest animal production industry in Vietnam, the assessment of environmental impacts was conducted on swine wastes, not other animals. Sampling was carried out repeatedly in dry and rainy seasons. At each district each sample (Table 22) was collected once in each season at one pig farm which has animal numbers equivalent to around 10-30 fatteners.
Table 22. Tested samples
Samples Sampling techniques 1 2 3 4 5 6 7 8 9 10 11.
Flushing wastewater (solid waste not collected) Flushing wastewater (solid waste collected) Effluents from biogas plastic bags Effluents from biogas concrete tanks Surface water receiving flushing discharge, upstream Surface water receiving flushing discharge, downstream Surface water receiving biogas effluents, upstream Surface water receiving biogas effluents, downstream Ground water Composts Vegetables fertilized with animal wastes
10 min. after flushing started 10 min. after flushing started From the outlet From the outlet 10 m upstream to disposal point 10 m downstream to disposal point 10 m upstream to disposal point 10 m downstream to disposal point Finished Right before harvesting
Table 23. Testing methods
Parameters Reference
Dry matters APHA*, Standard Methods for the Examination of Water and Wastewater, 1999, 2540B
Chemical oxygen demand (COD) TCVN 6491:1999
Parasite eggs

35
Coliforms TCVN 6187-2:1996
Escherichia coli TCVN 6187-2:1996
Salmonella Andrews. W. (1992). Manual of Food Quality control: Microbiological Analysis. FAO (modified)
APHA: American Public Health Association; FAO: Food and Agriculture Organization;
TCVN: Vietnamese Standards
6.2.1 Environment analysis Characteristics of flushing waster from pig house were presented in Table 24. Samples were
collected from farms that have solid wastes either collected or not before flushing.
Low values of dry matters (most are less than 1%) indicate that wastewater are very diluted. At those areas where samples were collected, ground water is used and it does not cost much. In addition, most farms are located within residential areas. Therefore, people tend to use lot of water to clean the floor and to reduce odor, avoiding complaints from neighbors. Besides, flushing helps to cool animals as all-time high- temperature weather is characteristic to the South Vietnam, which affects significantly on animal health and productivity.
Although lot of water is used, COD and numbers of microorganisms in all samples are much higher than those permitted for discharged wastewater to all environmental sources (TCVN 5945:1995). Especially, salmonellae were detected in several samples. No significant difference in quality between samples with or without collection of solid waste before flushing.
Table 24a. Flushing wastewater (solid waste not collected) - Dry season
Location Dry matters
(%)
COD
(mg O2/L)
Egg Count
(Eggs/100ml)
Coliforms
(MPN/100ml)
E. coli (MPN/100m
l)
Salmonella
Cu Chi 0.40 9482 NT 9.5E+06 9.5E+06 +
Dist. 12 0.32 9267 NT 4.5E+05 4.5E+05 -
Duc Hoa 0.12 4373 NT 7.5E+04 7.5E+04 -
Tan An 0.13 6962 NT 4.5E+07 4.5E+07 +
Ben Cat 0.19 12852 NT 2.5E+06 2.5E+06 -
Thuan An 0.53 4373 NT 4.5E+07 4.5E+07 -
Bien Hoa 0.91 7854 NT 9.5E+05 9.5E+05 -
Vinh Cuu 0.16 9482 NT 4.5E+07 4.5E+07 +
Min 0.12 4373 7.5E+04 7.5E+04
Max 1.91 12852 4.5E+07 4.5E+07
NT: not tested; +: detected; -: not detected

36
Table 24b. Flushing wastewater (solid waste not collected) - Rainy season
Location Dry matters
(%)
COD
(mg O2/L)
Egg Count
(Eggs/100ml)
Coliforms (MPN/100ml)
E. coli (MPN/100ml)
Salmonella
Cu Chi 1.38 32750 500 2.5E+06 9.5E+05 +
Dist. 12 0.31 1500 ND 2.5E+07 2.5E+07 -
Duc Hoa 0.80 11825 800 2.5E+07 7.5E+05 -
Tan An 0.20 6875 2400 7.5E+07 7.5E+07 -
Ben Cat 0.00 5225 350 2.5E+05 2.5E+05 +
Thuan An 1.40 17500 750 4.5E+05 4.5E+05 -
Bien Hoa 3.64 8750 ND 4.5E+07 4.5E+07 -
Vinh Cuu 0.21 827 ND 4.5E+06 4.5E+06 -
Min 0.00 827 ND 2.5E+05 2.5E+05
Max 3.64 32750 2400 7.5E+07 7.5E+07
Table 24c. Flushing wastewater (solid waste collected) - Dry season
Location Dry matters
(%)
COD
(mg O2/L)
Egg Count
(Eggs/100ml)
Coliforms (MPN/100ml)
E. coli (MPN/100ml)
Salmonella
Cu Chi 0.18 2498 NT 4.5E+07 4.5E+07 -
Dist. 12 0.10 1336 NT 9.5E+05 9.5E+05 -
Duc Hoa 0.47 3070 NT 2.5E+05 2.5E+05 -
Tan An 0.30 2484 NT 4.5E+05 4.5E+05 -
Ben Cat 0.43 7676 NT 9.5E+05 9.5E+05 -
Thuan An 0.23 8033 NT 2.5E+05 2.5E+05 -
Bien Hoa 0.15 9267 NT 2.5E+05 2.5E+05 +
Vinh Cuu 0.56 15430 NT 4.5E+07 2.5E+07 -
Min 0.12 1336 2.5E+05 2.5E+05
Max 0.56 15430 4.5E+07 4.5E+07

37
Table 24d. Flushing wastewater (solid waste collected) - Rainy season
Location Dry matters
(%)
COD
(mg O2/L)
Egg Count
(Eggs/100ml)
Coliforms
(MPN/100ml)
E. coli (MPN/100m
l)
Salmonella
Cu Chi 0.29 5,940 ND 4.5E+06 4.5E+05 -
Dist. 12 0.07 1,800 ND 1.5E+06 1.5E+06 -
Duc Hoa 0.13 1,925 200 9.5E+05 2.5E+05 -
Tan An 0.09 1,925 75 1.5E+08 1.5E+08 -
Ben Cat 0.08 550 250 9.5E+05 9.5E+05 +
Thuan An 0.16 1,600 ND 9.5E+05 9.5E+05 +
Bien Hoa 0.57 4,250 ND 9.5E+05 9.5E+05 -
Vinh Cuu 0.22 3,185 ND 9.5E+05 4.5E+05 -
Min 0.07 550 ND 9.5E+05 2.5E+05
Max 0.57 5,940 250 1.5E+08 1.5E+08
Similarly, quality of biogas effluent from either plastic bags or concrete tanks does not meet the standards for discharge to environment. Numbers of indicator microbes are high, salmonellae are detected in some samples, and intact parasite eggs still discovered. Too diluted in-put (low dry matters) due to large amount of water used in cleaning may be one of reasons for unsuccessful treatment of pathogens in those biogas systems. This indicates that (i) biogas effluent needs to go under further treatment before disposal to environment; and (ii) using biogas effluent in this case for agricultural fertilization must be careful in term of public health. In addition, the operation of those biogas systems (ratios of solid and water, addition of fibers, detention time, etc.) should be reconsidered.
Table 25a. Effluents from biogas plastic bags - Dry season Location Dry
matters
(%)
COD
(mg O2/L)
Egg Count
(Eggs/100ml)
Coliforms (MPN/100ml)
E. coli (MPN/100ml)
Salmonella
Cu Chi 0.21 8620 NT 9.5E+05 9.5E+05 -
Dist. 12 0.21 5819 NT 2.5E+05 2.5E+05 -
Duc Hoa 0.11 3927 NT 2.5E+04 2.5E+04 +
Tan An 11.35 18564 NT 4.5E+04 4.5E+04 -
Ben Cat 0.27 1964 NT 4.5E+04 4.5E+04 -
Thuan An 0.43 1428 NT 9.5E+02 9.5E+02 -
Bien Hoa 0.09 1607 NT 4.5E+05 4.5E+05 -
Vinh Cuu 0.19 8620 NT 2.5E+06 2.5E+06 +

38
Min 0.08 1428 9.5E+02 9.5E+02
Max 1.25 18564 2.5E+06 2.5E+06
Table 25b. Effluents from biogas plastic bags - Rainy season Location Dry
matters
(%)
COD
(mg O2/L)
Egg Count
(Eggs/100ml)
Coliforms (MPN/100ml)
E. coli (MPN/100ml)
Salmonella
Cu Chi 0.2 1813 975 2.5E+04 ND -
Dist. 12 0.5 7140 ND 4.5E+04 2.5E+04 -
Duc Hoa 0.2 825 250 4.5E+04 4.0E+04 -
Tan An 0.2 1320 ND 2.5E+04 2.5E+04 -
Ben Cat 3.2 4950 450 1.5E+05 1.5E+05 -
Thuan An 0.8 27500 ND 9.5E+04 9.5E+04 -
Bien Hoa 0.9 6000 2300 4.5E+05 4.5E+05 -
Vinh Cuu 0.1 1215 ND 2.5E+04 ND -
Min 0.1 825 ND 2.5E+04 ND
Max 3.2 27500 2300 4.5E+05 4.5E+05
Table 26a. Effluents from biogas concrete tanks - Dry season
Location Dry matters
(%)
COD
(mg O2/L)
Egg Count
(Eggs/100ml)
Coliforms (MPN/100ml)
E. coli (MPN/100ml)
Salmonella
Cu Chi 0.23 8521 152 4.5E+05 2.5E+05 + Dist. 12 4.20 2518 ND 9.5E+04 9.5E+04 - Duc Hoa 0.34 2965 ND 1.5E+05 1.5E+05 - Tan An 0.26 5233 ND 4.5E+06 4.5E+05 - Ben Cat 1.60 4122 256 9.5E+05 4.5E+05 - Bien hoa 0.17 7862 ND 4.5E+05 2.5E+05 - Vinh Cuu 0.19 6102 ND 4.5E+05 4.5E+04 - Min. 0.17 2518 ND 9.5E+04 4.5E+04
Max. 4.20 8521 256 4.5E+06 4.5E+05
Table 26b. Effluents from biogas concrete tanks - Rainy season Location Dry
matters
(%)
COD
(mg O2/L)
Egg Count
(Eggs/100ml)
Coliforms (MPN/100ml)
E. coli (MPN/100ml)
Salmonella
Cu Chi 0.4 9375 225 7.5E+05 2.5E+05 - Dist. 12 7.2 35500 ND 2.5E+03 2.5E+03 -

39
Duc Hoa 0.6 4325 ND 1.5E+07 1.5E+07 - Tan An 0.5 6600 ND 7.5E+06 4.5E+06 - Ben Cat 1.6 1430 3000 1.5E+05 1.5E+05 + Bien hoa 0.2 9500 ND 2.5E+05 2.5E+05 + Vinh Cuu 0.1 5375 ND 1.5E+05 4.0E+04 - Min. 0.1 1430 ND 2.5E+03 2.5E+03 Max. 7.2 35500 3000 1.5E+07 1.5E+07
Values presented in Table 27 indicate heavy pollution of surface water due to discharge of animal wastes, which are in excess of the standards for surface water (TCVN 5942:1995). It is noted that some up-stream samples has high values of COD and microbes since animal wastewater from many farms in the areas is disposed to along the rivers or streams. In Bien Hoa city, Suoi Linh stream has been receiving huge amount of animal wastes everyday from many large pig farms, which then converges to Dong Nai river that supplies water for Bien Hoa and Ho Chi Minh cities. In Mekong Delta provinces and some other country-side areas, there still exist the customs of disposal of domestic and animal wastes to rivers and using river water supply for many purposes.
Table 27a. Surface water receiving flushing discharge - Dry season Location & places to take
samples COD
(mg O2/L)
Egg Count
(Eggs/100ml)
Coliforms (MPN/100ml)
E. coli (MPN/100ml)
Salmonella
Ben Cat upstream 210 ND 2.5E+02 2.5E+02 - downstream 1964 ND 4.5E+05 4.5E+05 -
Thuan An upstream 189 ND 4.5E+02 75 - downstream 1785 ND 9.5E+03 9.5E+03 -
Bien hoa upstream 384 ND 1.5E+03 15 - downstream 2142 ND 2.5E+05 2.5E+05 +
Vinh Cuu upstream 85 ND 1.5E+02 ND - downstream 3146 ND 4.5E+04 2.5E+04 -
Table 27b. Surface water receiving flushing discharge - Rainy season Location & places to take
samples COD
(mg O2/L)
Eggs
(Eggs/100ml)
Coliforms (MPN/100ml)
E. coli (MPN/100ml)
Salmonella
Cu Chi Upstream 130 ND 4.5E+5 2.5E+4 - Downstream 1313 300 2.5E+6 9.5E+5 -
Dist. 12 Upstream 30 ND 1.5E+3 9.5E+2 - Downstream 80 ND 1.5E+4 1.5E+4 -
Duc Hoa Upstream 66 ND 2.5E+3 9.5E+2 - Downstream 110 ND 1.5E+4 1.5E+4 -
Tan An Upstream 240 ND 4.5E+3 ND - Downstream 798 ND 4.5E+4 4.5E+4 -
Ben Cat Upstream 12 ND 2.0E+2 2.0E+2 -

40
Downstream 308 1237 7.5E+4 7.5E+4 + Thuan An Upstream 45 ND 2.5E+3 2.5E+3 -
Downstream 650 ND 9.5E+3 9.5E+3 - Bien hoa Upstream 475 ND 4.5E+4 4.5E+4 -
Downstream 2600 ND 9.5E+5 9.5E+5 + Vinh Cuu Upstream 1254 ND 7.5E+4 7.5E+4 -
Downstream 13230 ND 9.5E+5 9.5E+5 - Table 27c. Surface water receiving biogas effluents - Rainy season Location & places to take
samples COD
(mg O2/L)
Egg Count
(Eggs/100ml)
Coliforms (MPN/100ml)
E. coli (MPN/100ml)
Salmonella
Cu Chi Upstream 813 ND 2.5E+5 2.5E+5 - Downstream 6875 ND 9.5E+6 9.5E+6 -
Dist. 12 Upstream 70 ND 4.5E+2 4.5E+2 - downstream 10750 ND 4.5E+4 2.5E+4 -
Duc Hoa upstream 55 ND 4.5E+2 4.5E+2 - downstream 330 ND 4.5E+4 4.5E+4 -
Tan An upstream 61 ND 4.5E+2 ND - downstream 275 150 9.5E+3 9.5E+3 -
Ben Cat upstream 572 ND 4.5E+2 4.5E+2 - downstream 2475 ND 2.5E+4 2.5E+4 +
Thuan An upstream 2 ND 2.5E+2 2.5E+2 - downstream 10 ND 9.5E+4 9.5E+4 -
Bien hoa upstream 300 ND 2.5E+3 2.5E+3 - downstream 1500 ND 2.5E+5 2.5E+5 -
Vinh Cuu upstream 50 ND 4.5E+4 4.5E+4 - downstream 13230 ND 4.5E+7 4.5E+7 -
We also tested quality of ground water from some pig farms, which is used for human and
animals. The results show that no samples satisfy the standard for ground water COD (TCVN 5944:1995). Five out of eight samples in dry season and six out of eight samples in rainy season have numbers of coliforms in excess of the standards. Samples collected from the same wells in rainy season show more contamination than in dry season. Our studies (in other projects) also indicate extensive contamination of ground water, not only in these four provinces and city but also in others.
Table 28a. Ground water - Dry season Location Types of
ground water
COD
(mg O2/L)
Coliforms
(MPN/100ml)
E.coli (MPN/100ml)
Salmonella
Cu Chi Drilled 47 ND ND - Dist. 12 Drilled 43 95 ND - Duc Hoa Drilled 15 15 ND - Tan An Drilled 54 ND ND - Ben Cat Drilled 7 ND ND -

41
Thuan An Drilled 7 110 ND - Bien Hoa Dug 64 250 ND - Vinh Cuu Drilled 17 95 ND - Min. 7 ND ND Max. 64 250 ND Table 28b. Ground water - Rainy season Location Types of
ground water
COD
(mg O2/L)
Coliforms
(MPN/100ml)
E. coli (MPN/100ml)
Salmonella
Cu Chi Drilled 70 2500 2500 - Dist. 12 Drilled 140 1500 ND - Ñuc Hoa Drilled 15 250 45 - Tan An Drilled 22 150 ND - Ben Cat Drilled 5 15 15 - Thuan An Drilled 10 250 ND - Bien Hoa Dug 40 3 ND - Vinh Cuu Drilled 25 ND ND - Min. 5 ND ND Max. 140 2500 2500
We collected compost samples at farms having accepted procedures (at least two-week incubation). The results show better treatment of microorganisms compared to biogas process. However, coliforms are still found in high numbers in most samples, and E . coli are detected in one sample (out of seven) in dry season and five (out of seven) in rainy season. It seems that high temperature and low humidity of dry season help the sterilization in composting process to take place more effectively. The results show higher dry matters and lower numbers of microbes of dry-season samples.
Table 29a. Compost - Dry season Location Dry matters
(%)
Egg Count
(Eggs/100g)
Coliforms
(MPN/100g)
E. coli (MPN/100g)
Salmonella
Dist. 12 81 ND ND ND - Duc Hoa 65 ND 1.5E+04 ND - Ben Cat 78 ND 4.5E+04 ND - Thuan An 58 ND 9.5E+03 ND - Bien Hoa 85 ND 4.5E+04 1.5E+04 + Vinh Cuu 59 ND 9.5E+04 ND - Min. 59 9.5E+03 ND Max. 85 9.5E+04 ND

42
Table 29b. Compost - Rainy season Location Dry matters
(%)
Egg Count
(Eggs/100g)
Coliforms
(MPN/100g)
E. coli (MPN/100g)
Salmonella
Q 12 35.7 ND 2.5E+3 ND - Duc Hoa 17.4 ND 2.5E+6 2.5E+6 - Tan An 67.8 ND 1.5E+3 1.5E+3 - Ben Cat 38.1 ND 9.5E+5 9.5E+5 - Thuan An 43.5 ND 9.5E+2 ND - Bien Hoa 41.7 ND 9.5E+4 9.5E+4 - Vinh Cuu 35.5 ND 2.5E+6 2.5E+6 - Min. 17.4 ND 9.5E+2 ND Max. 67.8 ND 2.5E+6 2.5E+6
However, samples of vegetables taken right before harvesting in the crop experiment did not show any presence of Salmonella or E. coli.
From the above results, the following conclusions may be drawn:
(i) Flushing wastewater (with or without solid waste collection) and biogas effluents (from either plastic bags or concrete tanks) do not meet requirements for discharged wastewater to all kinds of environment.
(ii) Disposal of untreated and biogas liquid waste causes significant pollution to surface water. So they should go under further treatment before discharge to environment.
(iii) Amount of water used for cleaning farms and cooling animals should be reduced.
(iv) Operation of biogas systems (techniques) should be studied in order to get effective removal of pathogens.
(v) Use of animal biogas wastes and composts should be in care to reduce public health risks.
(vi) Pollution of ground water at animal farms should be warned, especially in rainy season.
6.2.2 Risk of pathogens transferred from manure recycling to food chain
Foodborn diseases are more extensive in Vietnam. Most of these cases related to the contamination of pathogens to food, especially vegetable. These pathogens mainly come from animal waste which is not treated and used appropriately.
On farms, it is suggested that manure must be recycled in order to limit excretion causing pollution and be used in agriculture as an economical strategy. However, this manure recycling needs to be controlled carefully to avoid spreading pathogens to human food chain. There are many pathogens from manure being capable of causing food poisons. These pathogens and their survival must be considered.

43
Pathogens Foodborn diseases Survival in soil
Campylobacter Listeria E. coli O157 Salmonella Cryptosporidium
Gastrointestinal infection Neurological trauma Haemolytic-uremic syndrome and lytic colitis Salmonellosis, gastrenteritis Diarrhoeal disease
In dairy slurry, decline from 128 to 23 CFU/g after 5 days 350 days in moist soil A few weeks in slurry 300 days in soil 3 months in soil
(Nicholson, 1999)
After collecting data in the project, the general scheme for manure treatment and the risk
points to food safety is summarized in the chart below.

44
E: Excrete waste to environment
R: Risks
The potential routes by which pathogens in animal manure could enter the human food chain
are considered as the letter “R” in the chart and analyzed as below. • R0: Sanitation in animal house, the ways to collect manure may influence animal’s health. This
has a connection with using drug for animal, which is now concerned especially drug residue in
Farms
Manure
Strorage
Treatment
Biogas Fish-pool Composting
Water Fish Transportation
Crops
E
E
R3
R7
R4
R5
R2
R6
R1
R0

45
animal products. There is no direction for this problem except the standards of TCVN 5838, 5839, 5840-1995 on quality of air from industry firms are used temporarily.
• R1: Some farms, especially household in concentrated area, have still excreted manure into the stream without being treated. This causes serious pollution in surface water that then is used by human.
• R2: Although some farms have systems to treat manure, storage becomes complicated. Farmers keep mass of manure without being covered and the place of storage is near the residential area. This is likely to spread pathogens widely via houseflies and oozes from manure.
• R3: After biogas treatment, the waste is mostly excreted into stream. However, many projects proved that there are a lot of pathogens in the waste after biogas. As a result, surface water is more polluted. Fortunately, many farms combine other treatments after biogas , such as fish pool and crops, if they have land. Thus, this risk is less hazardous.
• R4: This refers to the transferring of pathogen from manure, which had been treated as compost, via transportation from household to crops. Practically, composting is not processed completely but collected and put in bags for storage at farms until selling. After arriving the crops, which are far away, manure may be really composted there to use as fertilizer.
• R5: Using manure for fish is rather popular in some provinces. This leads to the risks of water pollution due to leaking to underground water - the major water source for human in Vietnam.
• R6: Another risk is that fishes from these pools are carriers of pathogens which come from manure especially some parasites that reside in fish as intermedium. Now there is no law for fish inspection at local market in terms of food safety.
• R7: All treated manure is finally used for crops. The most important problem is the risk of pathogens surviving in plant products especially vegetable used fresh popularly. Besides that, using manure for crops often leads to increase of insects and worm in crops. As a result, the amount of pesticide applied for crops may increase and this is another risk for food safety.
6.2.3 Recommendations for manure management options based on findings from environment assessment
• Problems From the above results, we can see that discharge of untreated wastewater has caused
notably surface and ground water pollution. In the mid-term report, we discussed that management of solid waste is not as problematic as of liquid waste, in particularly pig production.
• Objectives and aims of manure management - Reduce/prevent pollution of surface and ground water
o Reduction of wastewater volume
o Management of wastewater
- Recycle manure in agriculture
o Techniques of pathogen reduction
o Proper use of manure for different crops
• Measures in pig houses - Solids should be collected every day before flushing so that less water would be needed
for cleaning, and there would be less nutrients in liquid waste.

46
- Cooling system should be installed and operated during hot hours in order to reduce water use for cooling animals.
- High pressure equipment would be used for washing.
- Awareness building of farmers about pollution, health risks, and environment protection.
• Manure treatment
Solid manure Quality of manure fertiliser should be improved to have better markets. Several treatments
would be applied:
(i) Composting (on farm or by middle man or crop farmer)
(ii) Drying (with machine or by spreading out)
(iii) Mix with other substances (peat, coconut fiber/ash, micro-organisms etc.)
(iv) Anaerobic storage
(v) Black soldier fly
(vi) For further consideration, composting of dead animals should be studied.
Liquid manure As discussed above, amount of water use should be minimised. Farms without land need
collaboration with crop farmers or middlemen. They must have a place, tanks, or containers for liquid waste storage. Primary treatment such as septic system, biogas, using effective microbes, etc. may be required. For farms with land biogas treatment, aerobic or biological lagoon may be applied before use of such liquid manure for fertilisation.
• Liquid manure transport We suggest using tankers to transport wastewater from animal farms to areas where it will be
utilized for agriculture. This model has been used for transport of liquid waste from human septic tanks. However, the following issues should be of concerns:
(i) The cost of transportation (ii) Responsibilities of animal farmers and crop farmers (iii) Who runs the system - governmental or private bodies (iv) The operation under whose control - Department of Transportation and Public Work,
who is responsible for domestic and urban wastes, or Department of Agriculture and Rural Development.
For farms with land or near to crop areas, pipe and pump systems or channels (if enough slope, no leaching) should be considered for transport, loading, and irrigation of liquid waste to crops.
It is also necessary to have practical testing for optimal use, disinfection etc.
• Manure utilisation Farmers should be encouraged to use manure on their crops, which includes:
(i) Extension work, education, awareness building.
(ii) Detailed recommendation (dose and time for each crop, techniques etc.).
(iii) Which crops or plants can fertilised with solid or/and liquid manure, and which are not allowed.

47
(iv) The ways of application of solid and liquid manure to crops and plants.
(v) Planning aids
(vi) Demonstration (“model” farms, TV etc.)
For farmers without land, there should be system to co-ordinate collaboration between livestock and crop farms, middlemen etc.
In order to get the best application, it needs to have research, experiments and testing for recommendations.
• Manure spreading/distribution Solid manure can be distributed manually in small farms. At longan and grape-fruit farms
we visited, scratched 20-kg plastic bags of manure are put next to the plant on land, so that the content will be gradually absorbed to soil during irrigation. Machine may be used for big farms.
Liquid manure may be spread directly by tanker, by irrigation system, ditch system, or sprayed by hand. Research and testing for correct dosing and techniques during rainy season should be done.
• Liquid manure storage There are some problems in storage of wastewater before use or transport. Manure
production is continuous, but fertiliser demand of crops is only at certain times. Farms without own land need collaboration with crop farmers or middlemen, and liquid waste would not be collected everyday, but once for several days. So it would be recommended that animal farms and crop farms should have storage system for liquid manure such as concrete tanks, hole in the ground or lagoon (no leaching). Research on leaching losses from lagoon or storage hole, insects etc. should be carried out.
• General concerns Education programs of techniques and awareness to farmers are definitely important. Local
extensionists play a key role in these activities.
Importantly, all of people attending in our first workshop agreed that we need a national strong and effective legislation to farmers on management of animal wastes. At the moment, several provinces have provisional regulations for environmental protection in animal production. However, the issues mentioned in those legislation documents are just in general and they are not effectively enforced.
With respect to utilisation of manure, sanitation and public health must be of concerns. Techniques of (solid and liquid) manure treatment should be studied and educated to farmers to remove pathogens. Finally, one of the most difficulties in liquid waste management is the costs for waste treatment and transportation.
6.3 RESULTS FROM CROP EXPERIMENT
Urbanization and industrialization have become largely dominant in the surrounding of Ho Chi Minh City. Animal production sector in this area is also being in a process of industrialization, where numbers of family farms reduced in contract with an increase of larger farms. Arable land is narrowed and usually away from manure source. In such situation, several “nutrition-accumulated

48
pools” formed around concentrated animal farms. Using this nutrient source for crop production is a sole but promising way to halve environmental issue and establish a sustainable nutrition balance. However, the use of animal production waste in the project area is just at a starting point. An integrated procedure for consumption of animal waste will need to overcome not only technical but also several socio-economic obstacles. Manure utilization for crops in the project area
- Manure was used mainly for highly profitable crops (flowers, industrial crops, orchards, vegetable). Demand of manure for these crops is high but the supply is unstable in both price and quality aspects.
- Cattle and poultry waste require less treatment but still being considered as better manure in comparison with pig manure. The later was supposed as a “hot” fertilizer that easily harmed the crops.
- Farmers did not know how to make compost. A majority of mixed farms (farms had both pigs and vegetable) has used untreated animal waste for vegetable, consequently accumulation of dangerous pollutants on vegetable is alarming.
Difficulties in experiment on animal waste for crops (1) Technical reason
- Correct-composted manure is not available at cropping sites. - Current composting technique is too complicated to farmers. - At present, biogas model is suitable for family scale, not suitable for big farm (more than
100 pigs because too much gas) but family scale is in front of economic risk due to high production price.
- Farmers believed that manure degrading the quality of some crops. - Distance between livestock farms and crop fields is increasing. - Bad infrastructure in cultivating areas (road, irrigation system)
(2) Economical & social reasons - Rice is the most important crop but it is hard to persuade farmers apply manure to rice
field. Beside that, manure application is laborious while profit of rice cultivation is low. - Farmers income is unstable, thus farmer investment for fertilizers is also unstable. - There is not direct communication between manure suppliers and manure demanders. - Gas surplus from biogas cannot be commercialized because industry gas price goes
cheaper. - Farmers do not care to environmental issue. Environmental regulations to animal farms
are not strictly. - Competitive pressure among organic fertilizer processors occurred, especially between
semi-industrial processors and manual processors (middle men). 6.3.1 Results and problems of using manure for rice
Rice is the most important and largest cultivated crop in Vietnam. Naturally, the crop always grows in submerged condition that subsequently making the soil become highly reductive. This characteristic influences largely to nutritional status of this crop as compared with the others. In our experiment, rice was applied with pig solid compost and the sediment from biogas slurry. However, the obtained results from the first experiment showed that manure treatment did not bring about any advantages for the harvest. We had observed that in manure treatment plots rice grown worse, while weeds become dominant. This clearly suggested that manure treatment improved soil fertility but that might be favorable to weeds and unfavorable to rice. In further efforts, when using lower doses of manure, the response was partly improved but it is still not significant as compared to the control.

49
The result further indicated complicated nature of paddy nutrition. All of those results did not mean anything but suggested that much more requirement for field trials are needed before we can reach to an appropriate recommendation for the use of manure to rice. From what experienced so far, something evoked and waiting to be solved in case of rice cultivation are:
- We must find out whether the organic matter; water quality or even oxygen could influence to nutrient status and/or nutrient balance for the crop after manure treatment.
- We must find out what should be resolutions for the situation. Table 30. Yield of rice treated manure at different doses
Treatment doses Yield (ton/ha) Control 3.44 5 tons dried pig compost 3.46 5 tons dried pig biogas manure 3.10 10 tons dried pig compost 3.33 10 tons dried pig biogas manure 3.02 20 tons dried pig compost 2.78 20 tons dried pig biogas manure 3.16 Control 3.55 2 tons dried pig compost 3.60 2 tons dried pig biogas manure 3.62 4 tons dried pig compost 3.62 4 tons dried pig biogas manure 3.60 8 tons dried pig compost 3.55 8 tons dried pig biogas manure 3.60
6.3.2 Results and problems of using manure for peanut
Peanut is a crop, that the soil physical property plays a special role during nuts development. Farmers expect growing peanut on highly spongy and sandy soil. In general, this characteristic can be well improved thought application of organic substance. By this reason, the use of manure for peanut may get certain advantages. Before these experiments conducted, manure utilization for peanut was not strange to peanut growers. However, this was hard to become a customary manner for all growers just because they could not easily find that around their field.
Table 31. Yield (tons per hectare) of peanut treated manure at different doses
Treatment doses 1st crop 2nd crop Control 2.41 2.25 5 tons dried pig compost 2.51 2.78 5 tons dried pig biogas manure 2.52 2.83 10 tons dried pig compost 2.81 2.74 10 tons dried pig biogas manure 2.76 2.82 20 tons dried pig compost 2.81 2.71 20 tons dried pig biogas manure 2.83 2.82
Our experiments indicated that manure either pig compost or biogas sediment at rate
between 10 and 20 tons per hectare can induce an increase the nut harvest up to 25%. However, difference between the treatment of 10 and 20 tons either compost or biogas sediment was trivial.

50
Thus, we would strongly recommend an application of 10 tons of manure per hectare of peanut. From the experiment and bilateral conversation with the farmers, we would state that possibility of using pig manure for peanut depends mainly on the price of the manure, technical efficiencies of pig manure would not require so much more demonstration. 6.3.3 Results and problems of using manure for leafy vegetable
In our experiment, brassica (green rape) was chosen. This is one among the most familiar species of vegetable grown in the whole country. The crop life cycle is short (around two months) therefore, fertilizers are usually used intensively. In our experiment, it was evident that pig manure can improve yields of the vegetable up to 53% and 35% for the first and the second crop, respectively. In fact, advantage as the above was not surprising to farmers. For small farm size, if the farm owner himself rising pigs, the use of manure will be less trouble. However, vegetable is usually grown in concentrated areas in the suburb of big cities. Around Ho Chi Minh City, these areas established a “green belt” where, vegetable will delivered to the whole city. Demand of fertilizers for the “green belt” is great. Unfortunately, nutritional balance in these areas has not established. Farmers when needed manure they have always to purchase that from other areas. Besides, inter-farms road system in vegetable cultivation areas is usually in bad condition, transportation of a bulky amount is really difficult. Similar to the case of peanut, with vegetables if problems as above will not be improved appropriately that would become major obstacles delaying the wide application of manure and establishment of nutritional balance between crop cultivation zones and pig rising concentrated farms. Fortunately, in another aspect, it should also mentioned that organic farming is a new movement in agriculture sector in Vietnam and vegetable is the first one that is being encouraged by the government for the application. This perhaps will motivate farm owners as well as policy-makers paying more attention on the use of pig manure on vegetables.
Table 32. Yield of Brassica (tons per hectare) treated manure at different doses
Treatment doses 1st crop 2nd crop Control 15.2 13.4 5 tons dried pig compost 18.5 16.3 5 tons dried pig biogas manure 20.1 16.5 10 tons dried pig compost 21.3 17.4 10 tons dried pig biogas manure 21.0 17.2 20 tons dried pig compost 23.3 18.1 20 tons dried pig biogas manure 22.1 16.7
Finally, above situations allowed us to recommend that brassica can be fertilised at a rate up to 20 ton of manure per hectare. But toward an wide application from the farmers, certain social-economic question still need to be solved.
6.3.4 Results and problems of using manure for rubber tree (Hevea brasiliensis) Table 33. Trunks growth (centimeter of perimeter enhancement per tree) of Hevea brasiliensis treated manure at different doses
Treatment doses 1st crop 2nd crop Control 2.3 2.5 5 tons dried pig compost 3.7 2.7 5 tons dried pig biogas manure 3.8 3.8

51
10 tons dried pig compost 4.0 3.1 10 tons dried pig biogas manure 3.9 4.1 20 tons dried pig compost 4.4 3.4 20 tons dried pig biogas manure 4.4 4.4
The rubber tree trials located on a low soil fertile area in the suburb of Ho Chi Minh City. In this location, fertilizing in general or manure application, in particular is relatively strange to small-scale farm owners. When soil fertility was low, the effect of nutrients supplement became obviously. The obtained results showed that both the solid pig compost and biogas sediment manure influenced positively to tree growth. The experiment was conducted on 4-5 years old trees, at this phase trees still remain vegetative growth and start in latex production stage. In our experiment, manure application has not shown a clear effect on latex production and this would be a question need to be answered in the coming time. Nevertheless, it was quite clear that no revere effects can be found on the trees after manure treatment. Even it can be economically benefitable or not, rubber tree plantation will be an important sites where enable to take delivery of waste from pigs farms. In Vietnam, rubber tree is planted largely in Northern and Eastern Ho Chi Minh City. Rubber trees usually planted in big farms and away from residents thus, influence of animal waste to environment of the surrounding area can be omitted. In a workshop within the framework of AWI project organized in April 2003, a delegate from Binh Duong province affirmed that some rubber trees farm owners from this province had paid a price up to 900.000 VND per liquid waste tank on farm. This information and the obtained results suggested that we should set up model where, waste from pigs production (not only the solid but also the liquid) can deliver directly to rubber tree farms. Theoretically, this model can improve the nutritional balance and restrain environmental nuisances.
6.3.5 Results and problems of using manure for longan Table 34. Yield (kilogram per tree) of longan fruit treated manure at different doses
Treatment doses 1st crop 2nd crop Control 65 82 5 tons dried pig compost 73 86 5 tons dried pig biogas manure 79 80 10 tons dried pig compost 77 94 10 tons dried pig biogas manure 94 89 20 tons dried pig compost 83 95 20 tons dried pig biogas manure 96 98 Liquid pig manure (treatment through irrigation) (*)
120 108
Control (for *) 71 77
The experiments conducted at Ben Cat district, Binh Duong province showed that manure played an important part in yield enhancement of longan. In agronomic aspect, one of obvious arguments we did find out that manure application induced a reduction of flowers and young fruit drops during the development of the fruit. If did not apply manure, longan growers often treated this constrain by the use of micro mineral foliar fertilizers. From this argument, we suggest that one of benefit of using manure was to compensate mineral nutrients in the soil. Another meaningful result was observed when longan treated directly with liquid waste from pig houses. This result clearly suggested that the use of liquid waste is applicable and benefitable on longan garden. Something may be need to further clarify is dosing and long-term effects of liquid waste when it is delivered continuously to the same area.

52
Even did not be planned for the experiment, but in the year 2002, we can also report some results concerning with the use of manure in different plants. We recorded great influence of pig compost on paulownia, a promising tree for afforestation program in Vietnam. We also recorded significant alterations on lemon tree yield after treated directly with biogas slurry. The results on paulownia and lemon trees opened new abilities for the use of waste from animal production area.
Paulownia height (centimeter) from sites treated with solid pig compost at different doses
Treatment doses Height (cm) Control 127 5 tons 244 10 tons 282 20 tons 366
Lemon fruits yield (kg/tree) from sites treated with biogas slurry at different doses
Treatment doses Yield per tree (kg) Control 6.4 10 litter/tree 10.9 20 litter/tree 13.0
6.3.6 Manure treatments and changes of soil phosphate content
Nitrate residue was not intended for screening because it has been established that in tropical condition like Vietnam, when denitrification used to occur promptly after manure application. Owing to such characteristics, nitrogen content would never rise beyond an average threshold. The application rate as in our experiments was considered to be in a safe range, therefore nitrate would not rise any danger to crops products. Nitrate accumulation issue have reported in case of inorganic nitrogen fertilizer over-use. That is reason why nitrate in the products did not be planned for analysis.
Influence of organic matters including manure supplement to the soil is usually slow and long lasting. After a one-year experiment, it has still not known how much nutrients would accumulate to the soil. We still did not know kinetic of this process therefore it has not been clear which dose will be safe and sustainable for human health as well as the environment. Certainly, we still need more research to clarify that. In our experiment, several nutrients were analyzed at the beginning and the end of cropping cycles. The obtained results showed that variation between different treatments as well as different replications seemed to be complicated and highly variable. In general, phosphate, a most abundant ingredient in pig manure may become a limitation factor and play a decisive role in establishing a long term strategy of manure application. In the five experiment, phosphate concentration increased sharply after manure had treated. However, after two manure applications, the concentration are still lower than optimum range for most crops. Thus, in order to find out an optimum dose for application, field trials and nutrient analysis much be done for several years. Table 35. Phosphate concentrations (mg / 100 g dried soil) when treated with pig compost or biogas at a rate of 20 tons per hectare
Phosphate concentration (mg/100g) Crops Before After 1st crop After 2nd crop

53
1st crop Compost Biogas
manure Compost Biogas
manure Rice 138.23 191.26 147.77 --- --- Peanut 111.37 112.34 109.29 128.86 103.18Vegetable 36.25 207.24 219.97 202.75 211.71Longan 18.71 170.98 169.41 140.79 135.04Rubber tree 3.05 97.49 157.54 73.39 120.74
6.3.7 Economic analysis of crop experiments
The following is the financial analysis of crop experiment. Experiments were carried out for the five crop types including peanut, rice, vegetables, longan and rubber. The quantities of pig compost applied for every type of crop are: 5 tons, 10 tons and 20 tons per ha. The sediment of biogas effluent from pig farm is also used for crop experiments with the same quantities of 5 tons, 10 tons and 20 tons per ha.
The cost differences between a crop type with and without manure are manure cost and labor cost to apply the manure. The benefit of manure application is the incremental yield of the crop. Table 36 shows the yields of different quantities of manure applied to various crop types. Table 36. The crop yields with different quantities of manure applied
Unit of measurement: tons/ha
Crops yield Control A1 A2 A3 B1 B2 B3
PEANUT 1st crop 2.41 2.51 2.81 2.81 2.52 2.76 2.83 2nd crop 2.25 2.78 2.74 2.71 2.83 2.82 2.82 RICE 1st crop 3.44 3.46 3.33 2.87 3.1 3.02 3.16 2nd crop 3.55 3.6 3.62 3.55 3.62 3.6 3.6 VEGETABLES 1st crop 15.2 18.5 21.3 23.3 20.1 21 22.1 2nd crop 13.4 16.3 17.4 18.1 16.5 17.2 16.7 LONGAN 32.5 36.5 38.5 41.5 39.5 47 48
Notes: A1 = 5 tons of pig compost per ha A2 = 10 tons of pig compost per ha
A3 = 20 tons of pig compost per ha B1 = 5 tons of sediment of biogas effluent per ha B2 = 10 tons of sediment of biogas effluent per ha B3 = 20 tons of sediment of biogas effluent per ha
Financial analyses are conducted using the index of marginal benefit – marginal cost ratio (MB – MC Ratio). A MB – MC ratio for a specific crop being greater than 1 means it is worth to apply manure to the crop in terms of economic efficiency. Table 37 shows the result of financial analysis of crop experiments for different crop types. The experiments were carried out in dry as well as rainy season. However, the table shows the average figures of the two crop seasons because there was not much different between the results of the two crop seasons. Rubber tree experiment is

54
not included in the analysis because the results showed that manure did have effect on rubber trunk diameter but not on rubber yield. Table 37. Marginal Benefit – Marginal Cost Ratios of various crops for different quantities of manure applied Crops A1 A2 A3 B1 B2 B3
PEANUT MC (000 dong) 1540 3080 6160 1540 3080 6160 MB (000 dong) 1417.5 2002.5 1935 1552.5 2070 2227.5 MB/MC Ratio 0.92 0.65 0.31 1.00 0.67 0.36
RICE MC (000 dong) 1540 3080 6160 1540 3080 6160 MB (000 dong) 63 -36 -513 -243 -333 -207 MB/MC Ratio 0.04 -0.01 -0.08 -0.16 -0.11 -0.03
VEGETABLES MC (000 dong) 1540 3080 6160 1540 3080 6160 MB (000 dong) 4650 7575 9600 6000 7200 7650 MB/MC Ratio 3.02 2.46 1.56 3.90 2.34 1.24
LONGAN MC (000 dong) 1540 3080 6160 1540 3080 6160 MB (000 dong) 4000 6000 9000 7000 14500 15500 MB/MC Ratio 2.60 1.95 1.46 4.55 4.71 2.52 Notes: MC: costs of manure and labor to apply the manure Manure price: 300 dong/kg for compost as well as biogas manure
Labor cost: 20,000 dong/manday (2 mandays to apply 5 tons of manure, on average) Peanut price: 4,500 dong/kg Rice price: 1800 dong/kg Vegetables price: 1800 dong/kg Longan price: 1000 dong/kg Figures in Table 37 show that the MB/MC ratios of vegetables and longan are greater than 1
for every quantity of manure applied to the crop. It means manure may bring the benefit to farmers who apply manure to their longan and vegetables crops, even if the amount of manure applied is 20 tons per ha.
For rice, the experiment results showed that manure did not bring an increase of rice yield. It needs to conduct more experiments on rice crop to come up with the conclusion on effect and efficiency of manure on the crop. Note that the rice yield is slightly increased with the level of 5 tons of manure applied per ha, but the MB-MC ratio is less than 1.
For peanut, the experiment results showed that the MB-MC ratio is approximately equal to 1 at the level of 5 tons of manure applied to the crop, but the ratios at other levels of manure applied are less than l. However, the calculation is based on the average price of manure, i.e., 300 dong/kg. If the calculation is based on the manure price of 200 dong/kg - the low manure price that is available in manure market sometimes, then the MB-MC ratio for peanut is greater than 1 for the levels of 5 as well as 10 tons of manure per ha.
The above financial analysis for crop experiments is used as the base to calculate the livestock density limits with respect to different crop types, in which the levels of manure applied for peanut, vegetables, longan, and rice are 10, 20, 20, and 5 tons per ha, respectively.

55
6.3.8 Lessons from the first stage of the project and recommendations for the next After one-year investigation through experiments and dialogues with farmers, obtained
results have been even inadequate but further reinforced that using of animal production waste as nutritional sources for crops is essential and practically applicable. This way could partly solve paradoxical issues between crop nutrient and animal waste. Except rice, that still needs much more research, the use of pig manure for other crops is promising. Peanut, longan and especially, rubber tree are crops that accept largely waste from pig production even waste were incompletely treated. For vegetable, microorganism and nitrate if remained may cause serious problem to human health thus treatment techniques would require special attention before a protocol can be recommended. Beyond the scope of manure treatment, manure processing technology such as production of high quality organic fertilizers based on animal production waste will be an important step to solve the paradox between nutrition and waste. In macro scale, regulatory policies are needed to solve major issues, especially the balance between manure supply and demand; farmers attitude, resolution for manure transportation and storage.
Biogas source was relatively rare. In fact, biogas models have established so far are suit for family scale, nutrients obtained from such system are suitable only for in-situ consumption. Thus, biogas manure is unable to solve nutrition issue in an area-wide scale. A bulky quantity of liquid waste from animal production sector releases and induce environmental issues. An experiment in this report showed that the use of liquid waste for crop cultivation could give positive results. In the next stage, a further investigation on the use of liquid waste will be very useful in both environmental and nutritional aspects.
Crops in the project area should be paid special attention for further investigation include vegetable, legumes, pineapple, maize; industrial plant like rubber tree, black pepper. It is also valuable if manure is applied on diverse (mixed) species orchard garden, a popular cultivation model in Vietnam and in the project area. Evaluation in such model is difficult but it would be have a realistic value.

56
Proposed model of nutrient management
Appendices: Soil analysis results for five plants in two continuous crops
6.4 FINDINGS FROM SPATIAL ANALYSIS Table 38. Percentage of pig as number of head classification at district level of four provinces
District 0-19 20-99 100-499 500-999 1,000-9,999 >10,000 Total (%)
Binh Duong province Thu Dau Mot 79.8 14.6 5.6 0 0 0 100.0Dau Tieng 90.2 8.2 1.6 0 0 0 100.0Ben Cat 0.7 2.1 0.5 0 0 96.7 100.0Phu Giao 88.2 6.7 5.1 0 0 0 100.0Tan Uyen 95 2.4 2.6 0 0 0 100.0Thuan An 97.5 0 2.5 0 0 0 100.0Di An 68.3 7.4 1.8 3.2 19.3 0 100.0
Dong Nai province Bien Hoa 91.4 0 8.6 0 0 0 100.0Vinh Cuu 89.3 0 0.8 0 9.9 0 100.0
Tree & large scale plantation crops (rubber, fruit trees, sugarcane, forestation area, maize)
Large
farms
Solid waste
Liquid waste
Slaughter house Waste
Transporting (Tubing or tankers)
Composting Garden, small scale field (legume, pepper, ornamental plants
Processing
Small
Liquid waste
Solid waste
Pool, tank
Sediment
Feed
Composting
Middleman

57
Tan Phu 100 0 0 0 0 0 100.0Dinh Quan 97.5 0 0.2 0 2.3 0 100.0Xuan Loc 99.7 0.1 0.2 0 0 0 100.0Long Khanh 99.8 0 0.2 0 0 0 100.0Thong Nhat 97.2 0 0.7 0 2.1 0 100.0Long Thanh 82.6 0 3 2.9 11.5 0 100.0Nhon Trach 99.5 0.5 0 0 0 0 100.0
HCMC Dist. 1 0 0 0 0 0 0 0.0Dist. 2 100 0 0 0 0 0 100.0Dist. 3 0 0 0 0 0 0 0.0Dist. 4 0 0 0 0 0 0 0.0Dist. 5 0 0 0 0 0 0 0.0Dist. 6 0 0 0 0 0 0 0.0Dist. 7 100 0 0 0 0 0 100.0Dist. 8 100 0 0 0 0 0 100.0Dist. 9 32.3 0 0 0 67.7 0 100.0Dist. 10 0 0 0 0 0 0 0.0Dist. 11 0 0 0 0 0 0 0.0Dist. 12 0.9 0 0 0 99.1 0 100.0Go Vap 99.6 0.4 0 0 0 0 100.0Tan Binh 0 0 0 0 100 0 100.0Binh Thanh 100 0 0 0 0 0 100.0Phu Nhuan 0 0 0 0 0 0 0.0Thu Duc 0 0 6.5 0 93.5 0 100.0Cu Chi 67.7 0.3 1.8 1.8 28.4 0 100.0Hoc Mon 90.6 0 3.1 6.3 0 0 100.0Binh Chanh 98.5 0 1.5 0 0 0 100.0Nha Be 100 0 0 0 0 0 100.0Can Gio 100 0 0 0 0 0 100.0
Long An province Tan An 96.3 2.3 1.4 0 0 0 100.0Tan Hung 100 0 0 0 0 0 100.0Vinh Hung 100 0 0 0 0 0 100.0Moc Hoa 99.1 0.9 0 0 0 0 100.0Tan Thanh 100 0 0 0 0 0 100.0Thanh Hoa 100 0 0 0 0 0 100.0Duc Hue 100 0 0 0 0 0 100.0Duc Hoa 100 0 0 0 0 0 100.0Ben Luc 100 0 0 0 0 0 100.0Thu Thua 100 0 0 0 0 0 100.0Chau Thanh 99.3 0.1 0.6 0 0 0 100.0Tan Tru 100 0 0 0 0 0 100.0Can Duoc 100 0 0 0 0 0 100.0Can Giuoc 100 0 0 0 0 0 100.0Note: the percentages were calculated using the total number of pigs

58
Maps 1 to 24 in the appendices show the geographic trends of stock, location of livestock infrastructure (feed mills and main slaughter houses, grain market), total nitrogen and phosphorus, soil types, leaching risk, slope and runoff risk of soil, total cropland, suitable cropland for manure recycling, cost of transportation, flood area and suitable areas for livestock relocation. In general, nitrogen concentrated in Bien Hoa city; district 12 and Tan Binh district of Ho Chi Minh City. Phosphorus total concentrated in Bien Hoa city; district 12 and Tan Binh district of Ho Chi Minh City and lower in Thuan An district of Binh Duong province. Grain markets are also concentrated in the center of the four city/provinces and along main roads. 6.4.1 Discharge of manure from main livestock The contribution of livestock sector by manure per year could be calculated as in the below table. Pig emission with total N, P, K was high (44.8% N) followed by poultry (40.5% N). Cattle and buffalo together took account of 13% N. Total N and P from pig and poultry emission were high in Bien Hoa and Thong Nhat districts of Dong Nai province. Table 39. Percentage of livestock contribution on nutrient by manure per year at four provinces Nutrient content (%) Pig Poultry Cattle Buffalo
N 44.8 40.5 11.0 3.0 P2 O5 57.3 26.2 12.1 3.9 K2 O 28.8 28.1 33.0 10.1
The nutrient content for calculating (%) Livestock Water N P2O5 K2O CaO MgO Cattle, buffalo 83.1 0.29 0.17 1.00 0.35 0.13 Pig 82.0 0.60 0.41 0.26 0.09 0.10 Poultry 56.0 1.63 0.54 0.85 2.40 0.74 Table 40. Nutrient requirement for crops (Ministry of Agriculture and Rural Development, MARD), kg/ha of N, P2O5, K2O and ton/ha of manure
Crop N P2O5 K2O Manure Rice 80 60 90 6 Rubber 50 40 40 8 Peanut 30 50 60 5 Sugar-cane 150 90 120 12 Maize 100 60 90 10 Soybean 25 40 60 5 Longan 60 50 60 10 Vegetable 100 80 80 10 Rambutan 60 50 60 5 Cassava 60 60 80 5 Sweet-potato 60 50 90 10 Bean 30 60 60 10 Tobacco 60 60 90 10 Durian 110 50 200 10 Cotton 100 45 30 10 Jute 90 60 90 8 Coffee 250 200 250 10 Black-pepper 150 250 150 20

59
Table 41. Criteria for evaluation of runoff risk
Table 42. Criteria for evaluation of runoff risk 6.4.2 Nutrient balance with mineral fertilizers
Nutrient balance with mineral fertilizers was calculated as : (Nutrient available from manure+ mineral fertilizers)/(crop needs)*100
The below table showed that nutrient balance with N and P from mineral fertilizers were the same or very slightly increased in comparison with N and P available from manure. The application of mineral fertilizer is at a small amount for crop requirement, while in some districts with concentrated livestock numbers, the recycling of manure could reduce the mineral fertilizers. Otherwise, manure is discharged to small streams. Table 43. Balance of nitrogen and phosphorus from manure and manure with chemical fertilizer
Order District
N balance with chemical fertilizer
N balance (manure)
P balance with chemical fertilizer
P balance (manure)
Binh Duong 1 Thu Dau Mot 34.6 34.5 69.7 69.62 Dau Tieng 12.3 12.2 25.0 24.93 Ben Cat 45.2 45.1 86.8 86.74 Phu Giao 21.4 21.3 48.3 48.25 Tan Uyen 16.2 16.1 28.4 28.26 Thuan An 113.2 113.1 239.2 239.17 Di An 121.1 121.0 78.2 78.2
Dong Nai 8 Bien Hoa 261.8 261.8 540.9 540.9
Leaching risk
Water-table depthSalty Soil No Risk (*) -2 Low Risk -0.8 High RiskRed Soil No Risk (*) -3 Low Risk -2 High RiskAlluvial Soil No Risk (*) -3 Low Risk -1 High RiskAcid Sulphate Soil No Risk (*) -3 Low Risk -1 High RiskGrey Soil No Risk (*) -8 Low Risk -2 High Risk
(*) Provided regular MM recommendation are applied
Runoff risk Average slope (%) Salty Soil No Risk (*) 2 High Risk Red Soil No Risk (*) 0.25 Low Risk 2 High Risk Alluvial Soil No Risk (*) 2 High Risk Acid Sulphate Soil No Risk (*) 2 High Risk Grey Soil No Risk (*) 0.25 Low Risk 2 High Risk (*) Provided regular MM recommendation are applied

60
9 Vinh Cuu 13.3 13.3 26.2 26.110 Tan Phu 5.7 5.7 11.2 11.211 Dinh Quan 5.9 5.8 12.5 12.412 Xuan Loc 11.1 11.0 22.5 22.413 Long Khanh 49.4 49.3 92.5 92.414 Thong Nhat 26.5 26.5 59.1 59.015 Long Thanh 22.9 22.8 51.4 51.316 Nhon Trach 18.5 18.4 41.0 40.9
HCMC 17 Dist. 1 0.0 0.0 0.0 0.018 Dist. 2 49.1 48.8 99.0 98.619 Dist. 3 0.0 0.0 0.0 0.020 Dist. 4 0.0 0.0 0.0 0.021 Dist. 5 0.0 0.0 0.0 0.022 Dist. 6 0.0 0.0 0.0 0.023 Dist. 7 90.0 89.7 181.1 180.724 Dist. 8 42.2 42.0 87.1 86.825 Dist. 9 27.0 26.7 55.8 55.526 Dist. 10 0.0 0.0 0.0 0.027 Dist. 11 0.0 0.0 0.0 0.028 Dist. 12 155.2 154.9 309.5 309.229 Go Vap 89.9 89.6 166.1 165.830 Tan Binh 153.5 153.2 287.8 287.531 Binh Thanh 35.4 35.1 72.2 71.832 Phu Nhuan 0.0 0.0 0.0 0.033 Thu Duc 51.3 51.1 100.2 99.934 Cu Chi 23.8 23.5 47.1 46.735 Hoc Mon 60.4 60.2 122.1 121.836 Binh Chanh 16.8 16.5 36.4 36.137 Nha Be 15.9 15.6 32.3 31.938 Can Gio 12.6 12.4 27.0 26.7
Long An 39 Tan An 14.2 14.2 29.3 29.340 Tan Hung 0.5 0.5 1.0 1.041 Vinh Hung 2.1 2.1 4.2 4.242 Moc Hoa 2.1 2.1 4.2 4.243 Tan Thanh 2.3 2.3 4.8 4.844 Thanh Hoa 1.6 1.6 3.2 3.145 Duc Hue 6.7 6.7 12.3 12.346 Duc Hoa 13.3 13.2 23.5 23.547 Ben Luc 4.3 4.3 9.8 9.848 Thu Thua 3.7 3.7 7.9 7.949 Chau Thanh 13.3 13.3 27.8 27.850 Tan Tru 11.4 11.3 23.9 23.951 Can Duoc 11.1 11.1 24.2 24.2

61
52 Can Giuoc 8.8 8.8 17.7 17.7 6.4.3 Potential areas for new farm relocation
Ho Chi Minh City also has a mangrove area which is now a wetland protection location as biosphere area. Moreover, it is close to the ocean and the main way to Saigon port. There is one railway from Ho Chi Minh City to the North. The main road network is close to Ho Chi Minh City and other city in provinces. The cost of transportation for onay live pigs were considered: •Road (truck): 30,000 VND/30pigs/70km 14,3 VND/pig/km (min. of 714 VND # 50km) •Path (tricycle) : 40,000 VDN/5pigs/15km 533,3 VND/pig/km (min. of 2666 VND # 5km)
At the moment the master plans for relocation are processed in Ho Chi Minh City and Binh
Duong province. Firstly, in Ho Chi Minh City, Dong Hiep pig farm in Thu Duc district has established infrastructure for relocation in 25 ha of the rubber plantation in Pham Van Coi village of Cu Chi district (40 km from Ho Chi Minh City center). This area is grey podzolic soil with low fertility, water table depth is 15 m in sunny season. In Binh Duong, pig farms from Thuan An district will be relocated to An Tay and Lai Uyen village of Ben Cat district (60 to 70 km from Ho Chi Minh City). These are grey podzolic soil, low fertility, water table depth of around 20 m; however, the finance for relocation is a problem. The zone of animal production in Dong Nai province is Vinh Cuu and Thong Nhat district. The lowland in Long An with flooding areas and Can Gio biosphere reserve are not suitable for pig farm location. In general, the master plans are in accord with the current findings on the potential area of animal production regarding to the integration of crops and livestock. 7. RECOMMENDATIONS OF PROPOSED ALTERNATIVE SOLUTIONS 7.1 Discuss alternative ways to deal with animal waste
Following are suggestions for handling animal wastes. Their possibilities and practicalities will be evaluated in the final report.
(1) Chicken Production of chicken (layers and broilers) in general does not generate problems in waste
management. It does not produce liquid wastes. All of the manure is collected by middlemen and utilised for coffee or fruits plants.
(2) Cattle Farmers also consider cattle solid manure as a good fertilizer source. They can sell it or use the
manure for their home garden or elephant grass/ crops/ plants. Solutions for liquid waste may include: - Being lagooned and used for irrigation (of garden or elephant grass/ crops/ plants). - Biogas plants and the effluent is used for irrigation or managed as in later discussion. - The same way as in the management of pig liquid manure (3) Pig
Farmers would be educated or persuaded of environmental impact and value of pig manure. However it should be noted that marketers or middlemen play a very important role in this issue. Discussion with some middlemen indicated that they could persuade farmers to use pig manure instead of chicken’s one. According to these men, the most problem of utilization of pig manure is collection. It is too watery so that no one would like to carry it from pig farms to the truck and transport to places where it is used. In addition, it also costs them for drying that wet manure before selling to farmers. Therefore, if they could get some support or subsidization so that they could the same profit from pig manure as from chicken’s, collection and utilization of pig manure should not

62
be a problem any more. We should think of the same thing of collection of liquid manure and biogas effluent.
* Solutions for pig solid manure - The authorities would think of some financial support to middlemen to encourage them to
collect pig solid manure. - Educate farmers about value of pig manure. Extensionists should carry out some
experimental shows of utilization of pig manure for different plants or crops. * Solutions for liquid manure and biogas effluent management
The following discussion is just in the attempt to outline some possibilities to cope with the liquid wastes issue. Details must be worked out for their feasibility in the second phase.
Activities of government Authorities should impose legislation upon waste management to force farmers to get
responsible for generated animal waste, especially liquid one. For instance, if they do not have fishpond or land for biological treatment, they must collect liquid waste and store it in containers for collection. A strict fine law should be imposed.
Activities of farmer - Limitation of water volume used in house cleaning by collection of solid manure before
house washing, and applying air cooling system to minimize water volume used to cool animals.
- Collection of liquid wastes: for farms having land, wastewater or biogas effluent should be biologically treated (in biological lake), or used for fish. For farms without land, liquid wastes should be led to and stored in tanks or containers placed underground, and would be periodically collected.
- Who collects the liquid wastes? There are two options. Firstly, there should be a unit/company at Department of Agriculture and Rural Development or Department of Transportation and Public work, who would be responsible for collecting animal liquid wastes to a transfer depot or treating place. From these places, the wastewater would be treated or transported to farms. The other optional collector is middleman. However we must think of how this person gets profit from that, which means who pays him. Otherwise, this option is unfeasible.

63
7.2 Policy options
7.2.1 Various options used elsewhere
1) Voluntary approach – relies on getting individuals to adopt – can save society money in the long run compared to a program that also has enforcement costs Types: – education – technical assistance – cost sharing for waste treatment facilities, e.g., manure storage sheds, biogas treatment. – manure clearinghouse system: manure is moved from surplus areas to deficit areas
Unless these voluntary approaches work successfully there will be moves to look at
instituting other types of regulations. 2) Command-and-control approach
– Declares that there is a source-specific pollution problem in which a limit will be set and backed up by the threat of enforcement actions.
Types: – Discharge permits/fines/monitor
3) Economic incentives/instruments
– are used to influence, rather than dictate the actions to a targeted party – allow businesses and consumers to make their own choices by providing continuous
inducements, financial or otherwise, for sources to make reductions in the environmental pollution they release
– attempt to correct market failures by adjusting the costs faced by the private decision-makers to reflect the full social costs of their actions
Advantages – To allow information about scarcity to be transmitted across actors via prices and quantities
demanded. – However, these mechanisms can be restricted by information costs, economies of scale, high
transaction costs, joint impact goods that effect others (e.g., Prisoner's dilemma, free rider problem), variability in supply and demand, short versus long-term effects and outcomes that may be "efficient" but socially undesirable.
4) Market base measures
• Marketable permits Government-issued permits that use a system of allowable ceilings on the amount of
discharge of pollutants (or the use of scarce environmental resources). These permits can be tradable.
• Monetary incentives Methods to change market incentives, including direct subsidies, and the reduction of subsidies
that produce adverse environmental effects, fees, or taxes; • Deposit/refund systems Schemes to discourage the disposal and encourage central collection of specific products • Information disclosure Actions to improve existing market operations by providing information to consumers;

64
• Procurement policies Means by which the government uses its own buying power to stimulate development of
markets - e.g., for recycled products 7.2.2 What we need to be aware of when designing policies in the Vietnam situation 1) Cultural, industry size, current practice
– Farmers prefer to use chemical fertiliser because it has faster effects and is more convenient in application.
– Some current policies may favour the use of chemical fertiliser and may affect farmers to think that manure price is relatively higher than chemical fertiliser price, for example, the policy of allowing farmers to delay payment for chemical fertilizers they purchase; or some recommendations on do not impose import tax on imported fertilizer when chemical fertilizer price is high. The reason behind policies of favouring chemical fertilizer application is to prevent adverse effect farmers may face because of a high chemical fertilizer price.
– Lots of backyard non-com production. However lots in a small area creates problem and high animal units in the area.
– For livestock production, small-scale farm household is predominating. For example, the following table shows the proportion of livestock production by sector in HCMC. Farm households, mainly small-scale producers, account for 70% - 100% of the supply of major livestock products for HCMC market.
– However, many express their opinions that small-scale farms are likely to disappear in future. Because in the long run, small-scale farmers might not be able to compete with the large scale producers in terms of productivity and efficiency.
Table 44. Major livestock products supplied by various sector, HCMC, 2000 Quantity Percentage
Products Unit of
measure
State-owned
Joint venture
Farm household
Total State-owned
Joint venture
Farm household
Pork Tons 3522 0 23562 27084 13 0 87 Beef Tons 0 0 4251 4251 0 0 100
Poultry Tons 100 3500 9400 13000 1 27 72 Eggs 000 pieces 1100 0 198900 200000 1 0 99 Milk Tons 107 0 36834 36941 0 0 100
Source: HCMC Statistical Year Book 2000; and Veterinary Medicine Authority of HCMC

65
0
20
40
60
80
100
120
Pork Beef Poutry Eggs Milk
%
State-owned
Joint venture
Farm household
Figure 1. Percentage of major livestock products by sector, HCMC, 2000
2) Some policy on foreign investment versus domestic investment The issue is already discussed in section 4. 7.2.3 Proposed changes in policies 1) Potential new policies
• To set subsidy for manure transport (favourable tax/credit policy for enterprises which produce or assemble vehicle to transport manure, tax reduction or tax exemption for trading manure)
• To cancel policies that favour application of chemical fertilizer (e.g., policy that allows farmers to delay payment for chemical fertilizers purchased)
• To partially subsidise cost for waste treatment facility (for example: the local government subsidies 1/3 of the installation cost for biogas treatment in Cu Chi some years ago).
• Government finance to building of infrastructure for relocation. • Cost sharing between farmers for establishing waste treatment facilities • Establishment of standards on livestock density limits • Extension programs in on-farm composting or other technological options • Pubic sector funding research for appropriate techniques and private sector funding the cost
of application; in addition, a strict fine for not adapting the techniques that prevent the environment pollution
• Public sector funds monitoring program • Training and licence for manure middlemen • Introduce and enforce quality standards for manure • Food safety standards • Labelling the ‘green’ livestock farm as certification
2) Standards
(a) Livestock density limits With regard to the potential of AWI, one of the needs is to establish waste discharge
standards for livestock production. Based on the optimum amount of manure applied for different crops types resulted from crop experiments carried out under the framework of AWI project, preliminary estimation of livestock density limit is given by the following table.

66
Table 45. Livestock density limits with respect to different crop types
Livestock density limits (animal heads/ha)
Crops Quantity of manure applied/ha
(tons/crop/ha) Swine Chicken
Remarks
Rice 5 11 274 2 rice crops/year Vegetables 20 66 1644 3 veg. crops/year Peanuts 10 22 548 2 crop seasons/year Longan 20 22 548 For a year Rubber 20 22 548 For a year
Sources: Information from GIS data and crop experiments, AWI project, Vietnam, 2002 The livestock density limits in the table are only roughly estimated figures. The livestock density limits are calculated based on the optimum amount of manure applied for a specific crop (i.e., the amount of manure that bring a highest crop yields among different amounts of manure applied for that crop) and the average quantity of manure discharged from swine/chicken production. Note that for rice and peanut crops, the estimation is based on 2 crop seasons per year. For vegetables, the estimation is based on 3 crop seasons per year. For longan and rubber trees, the manure amounts are estimated for a whole year. To come up with more accurate figures of livestock density limits, it should consider soils characteristics and the nutrient contents of manure discharged by animals, not the quantity manure discharged itself.
(b) Manure standards There is a need to set up the quality standards for manure to be applied for crops, e.g., the time length of manure to be stored for the dry and for the wet season; requirements for pathogen reduction; manure dose; manure application timing and techniques etc.
(c) Standard for discharge of livestock wastes Requirement for using less water for cleaning and less nutrient in liquid form (e.g.,
collecting solid every day before cleaning). (d) Food safety standards (vegetables) Minimum standards of manure applied to vegetables, maximum quantity and safety
standards for vegetables/organic products. (e) Requirement for middlemen • Testing manure for pathogens and nutrients • Prevent leakage during storage • Cover manure during transport
8. CONCLUSION 8.1 Manure treatment and use - Biogas effluent did not meet the environment standards that allows use of biogas effluent in agriculture; therefore, technique of biogas operation should be reconsidered. - Treatment of liquid waste is still a problem even some farms use liquid waste for fish pond or irrigation. - Mixed farms are prone to using more manure than crop farms. Manure transportation is one of important factors affecting the manure use. - The surveyed livestock farmers do not invest their resources on waste treatment proportionately with their farm sizes. - Manure market exists but its operation is not under the regulations.

67
8.2 Environment analysis - Large amount of water used for cleaning and cooling animals facilitates pollution. - Pollution of ground water increased in rainy season. 8.3 Crop experiment Application of compost or solid sediment of biogas from pig manure showed that:
- Soil fertility but not rice yield was improved, weed was dominant in the rice plot. - The use of manure for groundnut, rubber, longan and vegetable was promising in terms of
yield and soil fertility. The economically optimal levels of manure applied for peanut, vegetables, longan, rubber and rice are 10, 20, 20 ,20 and 5 ton per ha.
- There was variation in soil nutrients between treatments as well as replications. Phosphate, a most abundant ingredient in pig manure, may become a limitation factor and play a decisive role in establishing a long term strategy of manure application. In the experiment, phosphate concentration increased sharply after manure had treated. However, the phosphate concentration still lower than optimum range for most crops. - Contamination of Salmonella and E. coli in the studied vegetable was not detected. 8.4 Spatial analysis - Soil in animal-concentrated areas such as Bien Hoa city of Dong Nai province, districts 12 and Tan Binh of HCMC contains high levels of phosphorus and nitrogen. - The application of mineral fertilizer is at a small amount in comparison to the requirement of crops. In some districts with concentrated livestock, the recycling of manure could reduce the requirement of mineral fertilizers.
- Relocation of animal production is in the right way for integration of crops and livestock. The master plan of relocation is in accord with GIS analysis. However, pollution of surface water must be paid attention if the treatment system is not strictly applied. 8.5 Economic - Benefit-cost ratio of storing fresh manure or composting showed a good profit to farmers. 8.6 Policy options - Subsidy for manure transport, especially liquid transport
- Training and license for manure middlemen - Share of cost for waste treatment facilities among farmers - Standards for manure management
- Reconsidered the policies that facilitate the use of chemical ferilizers.

Asw Map 1. Elevation and water surface in Dong Nai, Binh Duong, Ho Chi Minh city and Long An province.

Asasa Map 2. Transport infrastructure in Dong Nai, Binh Duong, Ho Chi Minh city and Long An province.

Map 3. Pig farms in Dong Nai, Binh Duong, Ho Chi Minh city and Long An province.

Map 4. Main feed mills and slaughterhouses in Dong Nai, Binh Duong, Ho Chi Minh city and Long An province.

Map 5. Grainmarkets in Dong Nai, Binh Duong, Ho Chi Minh city and Long An province.

Map 6. Industrial livstock sector location in Dong Nai, Binh Duong, Ho Chi Minh city and Long An province.

Pig distribution Map 7. Pig farm distribution in Dong Nai, Binh Duong, Ho Chi Minh city and Long An province.

Map 8. Catlle distribution in Dong Nai, Binh Duong, Ho Chi Minh city and Long An province

Map 9. Nutrient balance N total in Dong Nai, Binh Duong, Ho Chi Minh city and Long An province.

Map 10. Phosphorus balance in Dong Nai, Binh Duong, Ho Chi Minh City and Long An province .

Map 11. Contribution of pigs to total P2O5 supply (manure only) in Dong Nai, Binh Duong, Ho Chi Minh City and Long An province

Map 12. Ground water table in Dong Nai, Binh Duong, Ho Chi Minh City and Long An province

Map 13. Soil types in Dong Nai, Binh Duong, Ho Chi Minh City and Long An province

Map 14. Estimate leaching risk in Dong Nai, Binh Duong, Ho Chi Minh City and Long An province

Map 15. Average slope in Dong Nai, Binh Duong, Ho Chi Minh City and Long An province

Map 16. Estimate runoff risk in Dong Nai, Binh Duong, Ho Chi Minh City and Long An province

Map 17. Total cropland in Dong Nai, Binh Duong, Ho Chi Minh City and Long An province

Map 18. Estimate suitable cropland for manure recycling in Dong Nai, Binh Duong, Ho Chi Minh City and Long An province

Map 19. Estimate of cost for transportation in Dong Nai, Binh Duong, Ho Chi Minh City and Long An province

Map 20. Estimate transport cost for 1 live pig in Dong Nai, Binh Duong, Ho Chi Minh City and Long An province

Map 21. Main pig farms and estimated transport cost for live animals in Dong Nai, Binh Duong, Ho Chi Minh City and Long An province

Map 22. Estimated flood areas in Dong Nai, Binh Duong, Ho Chi Minh City and Long An province

Map 23. Estimated suitalbe areas for industrial farm location in Dong Nai, Binh Duong, Ho Chi Minh City and Long An province

Map 24. Estimated suitalbe areas for industrial farm location in Dong Nai, Binh Duong, Ho Chi Minh City and Long An province

APPEDICES 0N CROP EXPERIMENT (TWO CONTINUOUS CROPS)
1) SOIL ANALYSIS IN FIRST CROP Rubber tree (1)
PHYSICCAL
PROPERTIES pH Humu
s Nitrog
en P2O5 Ferro
us Copper Mangan Exchageable Cation
No. Treatment
Sand Loam Clay pHKCl
pHH2O
Hummus
Total Available Available
Total Available
Total Available
Ca Mg K Na CEC
(%) (%) (%) (mgP2O5/100g)
(mg/100g)
(ppm) (ppm) (ppm) (ppm) (meq/100g)
1 I 76.8 6.4 16.8 3.7 4.2 1.089 0.02 3.45 7.08 23.04 1.95 25.65 12.84 2.96 2.06 0.17 trace 6.25 2 II 77.5 6.5 16.0 4.6 5.0 1.231 0.04 4.32 6.48 18.25 2.48 24.07 10.02 4.35 4.00 0.25 trace 9.16 3 III 75.9 6.7 17.4 4.5 5.0 1.027 0.03 1.38 6.35 9.56 2.71 36.24 18.76 3.57 3.20 0.31 trace 8.62 4 A1 77.5 6.3 16.2 3.6 4.3 1.404 0.03 4.35 6.12 26.85 2.60 21.05 10.04 0.90 2.06 0.30 trace 6.94 5 A2 78.1 5.5 16.4 4.6 5.1 1.121 0.03 7.71 5.98 24.10 3.80 19.20 8.70 5.40 4.00 0.40 trace 12.20 6 A3 75.5 6.8 17.7 4.6 5.0 1.156 0.05 2.94 7.03 10.90 2.20 41.70 17.50 5.00 3.20 0.16 trace 12.00 7 B1 76.0 7.1 16.9 5.1 5.5 1.132 0.05 16.47 6.11 17.70 5.80 28.00 12.00 2.40 3.30 0.22 trace 13.00 8 B2 80.4 5.7 13.9 4.8 5.5 1.527 0.08 37.19 7.78 11.80 5.90 55.70 21.50 8.70 4.50 0.35 trace 15.20 9 B3 72.5 7.4 20.1 5.4 5.7 1.436 0.04 72.11 6.54 23.50 13.00 40.70 21.50 3.40 5.50 0.41 trace 11.20
10 C1 71.2 8.5 20.3 5.4 6.0 1.445 0.05 105.21 8.92 44.30 21.40 21.50 14.20 2.10 5.20 0.30 trace 15.00 11 C2 78.3 6.7 15.0 6.4 6.7 1.598 0.08 88.16 7.14 34.94 3.80 57.45 35.05 7.07 4.42 0.33 0.02 14.20 12 C3 72.5 8.4 19.1 5.2 5.5 1.567 0.04 87.43 9.11 13.80 7.20 27.80 9.90 1.30 2.10 0.27 trace 12.10 13 D1 71.4 8.6 20.0 6.6 6.6 1.986 0.08 92.83 9.13 34.71 16.08 62.31 25.06 5.64 6.35 0.48 trace 16.87 14 D2 71.3 8.7 20.0 5.8 5.9 2.215 0.07 72.02 10.04 27.20 13.80 77.70 31.30 7.50 7.00 0.31 trace 14.50 15 D3 79.5 7.7 12.8 6.4 6.6 1.734 0.06 127.64 7.46 31.60 15.10 31.30 20.00 2.50 7.50 0.44 trace 17.20 16 E1 74.9 6.8 18.3 4.4 5.1 2.571 0.07 40.27 6.25 12.40 4.20 42.40 19.00 3.50 4.30 0.25 trace 24.50

17 E2 77.7 6.7 15.6 5.2 5.7 2.556 0.06 40.56 5.41 12.10 7.10 21.20 13.00 6.60 4.20 0.42 trace 16.70 18 E3 75.0 6.8 18.2 4.5 5.1 1.820 0.07 22.12 7.28 20.00 7.10 29.00 12.50 8.00 1.90 0.40 trace 11.70 19 F1 77.5 6.6 15.9 5.0 5.5 2.438 0.12 34.78 8.96 22.50 12.40 23.10 12.80 7.50 1.50 0.20 trace 12.50 20 F2 71.9 6.8 21.3 4.3 4.7 3.071 0.09 127.28 10.25 27.20 11.10 11.70 7.70 10.40 5.60 0.30 trace 21.30 21 F3 76.5 7.5 16.0 4.3 5.0 2.487 0.05 37.12 9.78 16.90 13.40 42.80 30.10 5.40 3.20 0.30 trace 11.70 22 G1 72.0 7.7 20.3 5.8 6.5 2.142 0.05 42.37 9.23 19.80 9.40 55.30 21.80 9.00 4.41 0.45 trace 16.00 23 G2 75.4 6.7 17.9 5.1 5.8 2.495 0.11 307.92 10.04 21.40 13.20 44.20 29.90 7.20 3.11 0.55 trace 9.90 24 G3 78.2 5.8 16.0 5.1 5.5 3.624 0.20 122.34 11.84 26.30 17.20 28.60 16.50 8.10 3.88 0.77 trace 18.20
Rice (1)
PHYSICCAL PROPERTIES
pH Humus
Nitrogen
P2O5 Ferrous
Copper Mangan Exchageable Cation No.
Treatment
Sand Loam Clay pHKCl
pHH2O
Hummus
Total Available Available
Total Available
Total Available
Ca Mg K Na CEC
(%) (%) (%) (mgP2O5/100g)
(mg/100g)
(ppm) (ppm) (ppm) (ppm)
(meq/100g)
1 I 61.5 28.9 9.6 6.0 6.4 2.867 0.03 155.60 25.70 13.11 12.80 28.90 6.38 9.12 3.45 0.41 trace 14.50 2 II 62.8 29.4 7.8 5.6 6.1 2.568 0.02 137.80 16.80 25.60 16.02 34.50 7.42 6.46 3.96 0.46 trace 12.82 3 III 61.4 29.7 8.9 5.7 6.2 2.635 0.03 121.30 17.20 21.80 17.08 52.60 10.8
9 7.23 3.12 0.37 trace 13.72
4 A1 61.2 28.4 10.4 6.1 6.5 2.688 0.08 272.54 21.43 25.24 12.92 17.00 5.70 8.37 2.45 0.30 trace 13.11 5 A2 60.4 29.2 10.4 5.9 6.2 2.432 0.05 169.33 15.21 24.10 18.21 21.50 3.20 5.40 2.10 0.40 trace 12.20 6 A3 61.8 30.8 7.4 5.9 6.4 2.792 0.05 221.45 18.92 19.50 15.30 41.70 22.4
0 6.10 3.20 0.35 trace 14.20
7 B1 61.0 31.2 7.8 6.0 6.6 3.217 0.12 307.00 26.54 44.50 27.80 109.38
44.40
7.50 3.30 0.45 trace 16.20
8 B2 61.5 29.3 9.2 6.2 6.7 3.243 0.08 277.00 25.46 38.20 27.50 71.80 21.50
8.70 4.50 0.50 trace 18.20

9 B3 62.4 28.9 8.7 5.8 6.3 2.910 0.10 182.50 28.65 72.20 32.00 21.00 12.00
5.80 0.36 0.41 trace 10.20
10 C1 60.9 27.8 11.3 6.0 6.5 3.058 0.08 105.00 26.44 44.30 30.00 25.60 14.20
7.60 4.30 0.50 trace 18.20
11 C2 58.7 32.1 9.2 6.3 6.4 3.492 0.12 250.70 18.89 34.94 21.50 45.20 30.20
8.20 3.88 0.40 0.02 15.00
12 C3 61.0 30.0 9.0 6.1 6.5 3.041 0.16 302.50 20.45 60.80 33.00 44.50 23.60
6.50 2.80 0.60 trace 13.50
13 D1 62.4 28.3 9.3 5.7 6.0 3.489 0.15 332.07 33.84 44.5 25.8 41.2 32.1 7.2 4.4 0.8 trace 15.9 14 D2 61.3 29.5 9.2 5.8 6.2 3.962 0.15 143.20 24.35 32.30 31.00 77.70 28.6
0 8.70 5.60 0.36 trace 17.00
15 D3 63.4 30.5 6.1 6.4 6.6 3.130 0.09 98.50 18.92 85.50 44.40 66.00 28.70
9.10 6.60 1.03 trace 18.20
16 E1 62.1 30.2 7.7 6.1 6.3 2.214 0.07 40.20 22.65 32.00 21.00 45.50 7.20 6.20 2.30 0.88 trace 11.80 17 E2 60.9 31.2 7.9 5.8 6.3 1.985 0.10 61.20 22.55 28.10 4.60 33.50 12.4
0 7.50 3.90 0.55 trace 15.20
18 E3 61.8 28.4 9.8 5.6 6.0 2.126 0.09 56.50 25.74 17.50 6.60 33.50 9.20 7.60 2.20 0.60 trace 12.00 19 F1 61.4 28.5 10.1 5.4 5.8 2.343 0.12 42.10 33.45 65.50 11.10 43.30 11.0
0 7.20 1.50 0.75 trace 13.50
20 F2 62.3 29.7 8.0 6.0 6.4 2.568 0.09 99.90 24.68 66.60 9.00 61.00 16.40
10.0 4.50 0.65 trace 20.30
21 F3 64.5 31.4 4.1 5.8 6.3 2.850 0.10 144.50 31.54 36.50 9.50 72.50 15.50
8.50 3.45 0.77 trace 14.60
22 G1 59.2 34.8 6.0 5.8 6.1 3.154 0.10 97.50 36.12 41.10 8.80 65.00 23.30
8.50 4.22 0.61 0.02 14.40
23 G2 64.1 24.8 11.1 5.7 6.1 3.052 0.12 222.50 26.88 34.95 11.50 60.50 25.77
7.70 4.50 0.57 trace 18.50
24 G3 57.2 26.4 16.4 5.8 6.3 3.648 0.20 122.30 19.87 26.30 17.20 28.60 16.50
8.10 3.88 0.77 0.01 18.20

Peanut (1)
PHYSICCAL PROPERTIES
pH Humus
Nitrogen
P2O5 Ferrous
Copper Mangan Exchageable Cation No.
Treatment
Sand Loam Clay pHKCl
pHH2O
Hummus
Total Available Available
Total Available
Total Available
Ca Mg K Na CEC
(%) (%) (%) (mgP2O5/100g)
(mg/100g)
(ppm) (ppm) (ppm) (ppm)
(meq/100g)
1 I 72.8 14.6 12.6 5.9 6.4 1.348 0.18 165.37 1.02 18.37 11.56 22.01 8.96 8.87 3.46 0.26 trace 15.36 2 II 73.1 14.2 12.7 6.0 6.5 1.652 0.14 112.45 1.56 22.01 10.35 24.36 7.32 9.65 3.25 0.45 trace 14.07 3 III 73.8 13.9 12.3 6.1 6.6 1.245 0.09 56.89 1.34 24.56 11.28 26.89 5.64 7.24 3.85 0.42 trace 13.86 4 A1 71.5 14.0 14.5 5.9 6.5 2.341 0.24 187.22 1.05 16.50 12.92 25.63 6.65 6.64 2.45 0.36 trace 15.21 5 A2 73.8 14.2 12.0 6.0 6.2 1.684 0.21 169.33 2.34 23.21 9.56 36.06 8.55 8.54 3.12 0.41 trace 13.42 6 A3 74.5 13.7 11.8 6.1 6.4 2.457 0.20 68.90 1.98 35.21 12.35 41.70 10.1
06.88 3.20 0.35 trace 12.28
7 B1 70.8 14.2 15.0 6.2 6.6 1.719 0.19 165.63 2.13 33.30 14.25 87.56 16.54
7.50 2.27 0.45 trace 15.53
8 B2 72.1 15.6 12.3 6.2 6.7 3.180 0.27 245.31 3.47 38.20 34.25 71.80 19.93
8.70 4.21 0.42 0.02 15.50
9 B3 69.8 13.8 16.4 6.2 6.3 2.936 0.31 182.50 3.92 19.54 32.40 66.36 25.36
8.74 0.36 0.41 0.02 16.54
10 C1 75.9 11.2 12.9 6.0 6.5 2.428 0.11 105.00 4.01 37.25 12.74 89.72 14.20
7.60 3.45 0.50 0.02 15.52
11 C2 71.2 14.3 14.5 6.3 6.4 2.773 0.09 154.54 5.23 34.94 13.50 113.65
24.57
8.20 3.45 0.65 trace 17.28
12 C3 75.5 12.8 11.7 6.1 6.5 2.651 0.38 116.65 4.45 27.35 16.21 44.50 23.60
6.50 2.80 0.60 trace 14.06
13 D1 76.1 13.2 10.7 6.4 6.7 2.692 0.23 95.32 6.05 56.11 8.75 75.05 8.65 6.45 3.24 0.42 0.02 12.51 14 D2 77.0 12.4 10.6 6.2 6.2 3.041 0.49 143.20 7.23 32.30 9.58 95.24 28.6
07.58 4.54 0.36 0.02 16.08

15 D3 69.8 12.7 17.5 6.4 6.6 2.183 0.25 98.50 5.48 47.58 11.34 55.71 28.70
9.10 2.11 0.59 0.02 15.92
16 E1 72.8 13.6 13.6 5.9 6.3 2.455 0.26 40.20 2.04 32.00 14.54 79.52 6.85 8.85 2.30 0.88 trace 13.81 17 E2 76.1 12.4 11.5 5.8 6.3 2.117 0.41 61.20 2.85 35.54 4.60 88.25 12.4
07.50 3.90 0.55 trace 15.20
18 E3 72.9 14.0 13.1 6.0 6.0 3.050 0.13 123.21 3.17 32.23 7.95 121.44
15.45
7.60 2.20 0.60 trace 14.15
19 F1 75.5 13.1 11.4 6.0 6.2 2.457 0.55 78.92 3.86 46.50 14.35 43.30 9.88 7.20 1.50 0.75 trace 11.85 20 F2 76.4 12.7 10.9 5.8 6.4 2.468 0.32 99.90 3.94 26.42 8.64 66.85 12.7
48.75 4.50 0.65 trace 17.32
21 F3 74.2 13.4 12.4 5.8 6.3 2.850 0.75 144.50 4.56 35.80 12.35 72.50 9.58 8.50 3.45 0.69 trace 16.55 22 G1 74.0 12.9 13.1 5.8 6.1 2.790 0.25 97.50 6.03 41.10 15.14 65.00 21.8
77.65 4.22 0.45 trace 15.65
23 G2 75.5 11.9 12.6 6.1 6.4 2.698 0.25 108.08 7.14 34.95 11.50 60.50 25.77
6.95 4.50 0.45 trace 15.65
24 G3 73.8 12.6 13.6 6.0 6.5 2.450 0.33 122.30 6.48 44.33 9.64 52.46 16.50
7.85 3.01 0.42 0.01 17.54

Longan (1)
PHYSICCAL PROPERTIES
pH Humus
Nitrogen
P2O5 Ferrous
Copper Mangan Exchageable Cation No.
Treatment
Sand Loam Clay pHKCl
pHH2O
Hummus
Total Available Available
Total Available
Total Available
Ca Mg K Na CEC
(%) (%) (%) (mgP2O5/100g)
(mg/100g)
(ppm) (ppm) (ppm) (ppm) (meq/100g)
1 I 51.8 16.2 32.0 5.2 5.7 1.348 0.08 11.56 3.46 15.26 5.84 18.45 3.75 2.04 1.62 0.34 trace 6.85 2 II 51.8 16.9 31.3 5.1 5.5 1.582 0.11 19.85 4.12 18.96 6.03 19.22 3.16 1.23 1.58 0.27 trace 4.96 3 III 52.2 17.2 30.6 5.3 5.7 1.427 0.12 24.71 5.65 17.25 8.91 23.46 4.51 1.56 1.37 0.19 trace 5.87 4 A1 50.2 16.9 32.9 5.0 5.4 1.237 0.09 12.45 4.12 17.08 4.98 15.12 3.12 1.05 0.82 0.18 trace 2.58 5 A2 51.8 17.2 31.0 5.1 5.4 1.326 0.10 18.55 5.36 16.32 5.56 21.63 2.84 0.97 1.41 0.24 trace 3.12 6 A3 53.0 18.6 28.4 5.2 5.6 1.395 0.11 20.01 6.03 18.42 7.25 17.85 2.86 1.25 1.25 0.23 trace 4.01 7 B1 50.9 19.2 29.9 5.2 5.7 2.132 0.10 59.67 5.47 19.24 5.24 26.01 6.89 3.45 2.36 0.25 trace 8.41 8 B2 51.3 17.6 31.1 5.3 5.8 2.031 0.12 86.52 7.21 22.03 7.89 19.56 5.62 2.89 2.05 0.32 trace 7.18 9 B3 50.4 20.1 29.5 5.1 5.5 1.954 0.11 45.62 4.11 18.85 6.26 23.37 7.08 2.03 1.68 0.22 trace 6.24
10 C1 53.3 19.2 27.5 5.5 5.9 2.189 0.11 92.87 6.89 25.64 8.27 27.98 6.87 4.51 2.37 0.33 trace 9.15 11 C2 50.4 21.4 28.2 5.5 6.0 2.246 0.12 102.26 7.14 31.08 10.05 42.21 9.32 6.14 2.96 0.29 trace 10.56 12 C3 48.6 17.3 34.1 5.7 6.2 2.451 0.12 162.45 6.24 28.96 6.98 32.56 7.28 7.12 3.25 0.31 trace 11.62 13 D1 51.7 20.0 28.3 5.6 6.0 2.378 0.12 154.26 9.13 32.47 9.36 36.28 12.46 6.98 3.69 0.38 trace 12.78 14 D2 52.4 16.8 30.8 6.1 6.5 2.632 0.13 200.34 7.89 38.98 14.46 53.48 14.02 7.92 4.06 0.42 trace 13.89 15 D3 54.3 17.0 28.7 6.0 6.4 2.534 0.13 158.22 7.65 37.14 12.08 37.25 13.32 8.36 3.75 0.43 trace 14.56 16 E1 51.5 19.4 29.1 5.1 5.5 1.765 0.10 67.21 5.07 20.13 6.24 23.87 4.16 2.15 1.92 0.33 trace 6.72 17 E2 52.0 19.5 28.5 5.1 5.4 1.578 0.09 42.86 6.11 21.89 6.72 28.42 4.12 2.06 2.31 0.27 trace 5.83 18 E3 56.1 13.7 30.2 5.2 5.6 1.625 0.12 83.24 7.12 24.62 5.89 20.45 3.86 1.98 1.85 0.27 trace 4.92 19 F1 53.6 16.8 29.6 5.3 5.8 1.965 0.10 86.54 8.54 22.16 4.32 29.56 8.72 3.89 2.45 0.42 trace 9.12 20 F2 51.3 19.7 29.0 5.4 5.9 2.038 0.11 102.34 6.23 19.85 7.24 26.87 8.69 4.25 2.67 0.24 trace 9.06 21 F3 53.4 17.8 28.8 5.4 5.8 2.432 0.13 137.22 9.04 27.94 8.45 36.65 9.01 7.36 2.98 0.30 trace 12.86

22 G1 50.6 19.3 30.1 5.4 5.9 2.327 0.13 149.26 9.85 30.89 11.27 28.64 8.42 6.45 2.98 0.30 trace 12.45 23 G2 52.3 17.8 29.9 5.5 6.0 2.562 0.13 186.52 10.47 41.02 12.32 45.08 11.56 5.89 3.02 0.37 trace 11.56 24 G3 52.4 19.3 28.3 5.6 6.1 2.985 0.13 172.45 8.69 43.00 11.86 39.15 15.84 7.58 3.56 0.41 trace 14.02
Vegetable (1)
PHYSICCAL PROPERTIES
pH Humus
Nitrogen
P2O5 Ferrous
Copper Mangan Exchageable Cation No.
Treatment
Sand Loam Clay pHKCl
pHH2O
Hummus
Total Available Available
Total Available
Total Available
Ca Mg K Na CEC
(%) (%) (%) (mgP2O5/100g)
(mg/100g)
(ppm) (ppm) (ppm) (ppm) (meq/100g)
1 I 11.6 77.6 10.8 5.0 5.5 1.632 0.11 33.46 1.05 8.55 3.24 30.85 5.70 1.96 1.13 0.28 trace 5.72 2 II 11.8 78.2 10.0 5.0 5.4 1.549 0.10 34.51 2.68 14.65 6.40 26.10 4.85 2.76 1.98 0.42 trace 6.72 3 III 10.4 76.9 12.7 5.1 5.6 1.782 0.12 40.78 1.95 17.86 4.36 24.32 6.31 2.97 2.15 0.57 trace 6.96 4 A1 11.2 78.6 10.2 5.1 5.6 1.825 0.12 33.16 2.85 11.25 1.56 32.64 3.12 2.56 1.02 0.25 trace 4.75 5 A2 10.8 79.3 9.9 5.2 5.6 1.645 0.10 25.48 3.68 16.12 4.35 24.51 2.84 2.85 2.11 0.56 trace 6.42 6 A3 12.5 76.1 11.4 5.2 5.6 1.765 0.10 45.62 2.95 14.36 5.27 25.61 6.43 3.46 2.89 0.64 trace 7.12 7 B1 8.4 81.2 10.4 5.4 6.0 1.964 0.11 65.23 4.12 15.42 4.28 31.92 4.85 5.63 3.46 0.85 trace 10.23 8 B2 9.3 82.4 8.3 5.8 6.3 2.345 0.13 96.12 3.16 22.23 8.42 46.27 10.93 7.84 4.26 0.42 trace 15.34 9 B3 9.7 80.6 9.7 5.6 6.0 2.135 0.12 105.42 3.95 19.89 7.25 36.56 8.72 6.28 2.25 0.64 trace 10.26
10 C1 9.5 84.2 6.3 5.6 6.1 2.427 0.12 112.35 5.64 37.26 8.94 43.21 11.24 6.96 3.84 0.64 trace 11.25 11 C2 8.6 82.4 9.0 5.5 6.0 2.246 0.11 123.45 7.14 32.27 9.11 51.26 14.87 7.25 4.36 0.51 trace 13.61 12 C3 10.3 85.5 4.2 6.0 6.4 2.564 0.13 153.42 4.22 35.51 7.22 45.31 12.34 8.26 4.92 0.72 trace 16.24 13 D1 7.8 78.4 13.8 6.2 6.6 2.754 0.13 172.56 8.93 39.86 10.24 51.24 18.22 10.26 4.97 0.78 trace 17.06 14 D2 8.1 83.2 8.7 6.1 6.4 2.971 0.13 256.32 6.04 45.62 11.28 37.96 11.28 8.21 3.46 0.57 trace 15.63 15 D3 9.8 81.6 8.6 6.1 6.5 2.912 0.13 192.75 7.46 47.21 10.98 49.53 17.20 8.72 4.12 0.64 trace 16.47 16 E1 10.3 85.1 4.6 5.0 5.5 2.135 0.12 92.42 2.18 10.25 4.21 25.00 3.13 4.25 3.15 0.42 trace 10.21

17 E2 9.7 81.2 9.1 5.3 5.6 2.347 0.11 125.65 3.45 18.25 6.96 31.23 5.80 6.42 4.31 0.49 trace 12.85 18 E3 9.4 80.9 9.7 5.2 5.7 2.487 0.12 147.35 4.12 16.24 5.12 28.79 4.64 5.62 3.86 0.64 trace 12.78 19 F1 8.7 81.2 10.1 5.5 5.9 2.472 0.13 149.56 4.56 31.12 12.84 37.20 8.64 7.25 4.36 0.52 trace 14.35 20 F2 9.4 84.3 6.3 5.4 5.8 2.325 0.12 198.34 3.98 28.74 14.23 45.70 10.92 6.23 3.15 0.64 trace 12.41 21 F3 7.2 78.4 14.4 5.5 6.0 2.859 0.13 211.26 4.78 34.26 12.86 50.02 7.95 8.32 4.56 0.72 trace 14.63 22 G1 9.5 79.8 10.7 5.8 6.3 3.426 0.13 256.13 5.63 42.75 12.68 48.22 7.34 9.24 4.56 0.82 trace 16.84 23 G2 9.4 81.4 9.2 5.6 6.0 3.156 0.13 247.35 4.12 49.72 15.62 56.34 12.64 7.26 3.97 0.54 trace 13.25 24 G3 8.6 79.5 11.9 5.3 5.8 2.652 0.12 156.42 6.47 44.23 16.13 47.86 16.84 7.11 4.21 0.62 trace 12.96
2) SOIL ANALYSIS IN SECOND CROP

Rubber tree (2)
PHYSICCAL PROPERTIES
pH Humus
Nitrogen
P2O5 Ferrous
Copper Mangan Exchageable Cation No.
Treatment
Sand Loam Clay pHKCl
pHH2O
Hummus
Total Available Available
Total Available
Total Available
Ca Mg K Na CEC
(%) (%) (%) (mgP2O5/100g)
(mg/100g)
(ppm) (ppm) (ppm) (ppm) (meq/100g)
1 A1 76.5 8.3 15.2 3.8 4.4 1.344 0.03 11.30 7.50 16.00 8.62 71.00 22.20 0.90 2.06 0.30 trace 6.94 2 A2 77.8 8.8 13.4 4.2 5.1 1.331 0.07 8.65 7.98 42.32 21.54 18.20 8.66 5.40 4.00 0.40 0.01 12.20 3 A3 76.6 6.7 16.7 4.1 4.9 1.321 0.03 4.90 8.03 22.55 14.20 35.60 21.22 5.00 3.20 0.16 trace 12.00 4 B1 76.2 6.9 16.9 4.7 5.5 1.222 0.10 26.57 4.11 37.4 4.80 44.00 32.00 2.40 3.30 0.22 trace 13.00 5 B2 79.4 5.7 14.9 4.8 5.4 1.437 0.08 87.19 11.73 12.22 8.90 66.20 32.50 8.70 4.50 0.35 trace 15.20 6 B3 74.7 7.2 18.1 5.4 5.8 1.542 0.10 72.10 7.54 13.60 4.00 35.70 18.40 3.40 5.50 0.41 0.03 11.20 7 C1 76.2 5.5 18.3 5.2 5.8 1.554 0.10 67.3 9.26 24.30 8.40 33.40 21.20 2.10 5.20 0.30 trace 15.00 8 C2 76.3 8.1 15.6 6.1 6.7 1.554 0.08 55.66 11.44 30.94 8.80 46.45 25.05 7.07 4.42 0.33 0.02 14.20 9 C3 74.5 8.4 17.1 5.1 6.0 1.647 0.11 200.62 13.17 21.45 20.20 52.34 32.40 1.30 2.10 0.27 Trace 12.10
10 D1 73.3 8.3 18.4 5.0 6.0 1.776 0.08 58.40 12.53 24.71 20.08 44.51 14.06 5.64 6.35 0.48 Trace 16.87 11 D2 73.3 10.6 16.1 5.1 5.9 2.55 0.20 122.02 14.02 27.20 12.80 65.60 21.30 7.50 7.00 0.31 Trace 14.50 12 D3 77.5 5.7 16.8 5.9 6.2 2.184 0.10 39.74 7.46 71.12 26.20 49.50 35.00 2.50 7.50 0.44 0.03 17.20 13 E1 76.5 6.2 17.3 4.9 5.8 2.853 0.14 48.27 8.85 19.77 15.20 29.70 25.50 3.50 4.30 0.25 Trace 24.50 14 E2 77.2 6.7 16.1 5.0 5.6 2.346 0.10 144.43 7.74 97.10 26.40 91.50 36.80 6.60 4.20 0.42 Trace 16.70 15 E3 75.5 6.8 17.2 5.2 6.0 1.832 0.08 82.12 7.55 23.55 16.10 69.70 23.20 8.00 1.90 0.40 Trace 11.70 16 F1 76.5 7.6 15.9 5.0 6.0 2.834 0.18 82.78 12.46 67.50 41.30 28.50 22.20 7.50 1.50 0.20 Trace 12.50 17 F2 75.4 5.3 19.3 4.3 5.2 2.781 0.20 181.21 14.25 67.20 13.33 42.40 21.70 10.40 5.60 0.30 0.02 21.30 18 F3 74.5 8.7 16.8 5.0 6.0 2.672 0.08 97.72 9.78 67.90 43.40 45.80 31.10 5.40 3.20 0.30 Trace 11.70 19 G1 72.9 5.3 19.4 5.1 6.3 2.442 0.18 63.47 9.13 32.80 19.20 45.80 25.80 9.00 4.41 0.45 Trace 16.00 20 G2 76.4 6.2 17.4 5.5 5.8 2.394 0.22 147.92 16.04 23.60 13.10 44.70 19.90 7.20 3.11 0.55 0.0.3 9.90 21 G3 74.4 9.3 16.3 5.0 5.7 3.324 0.10 150.82 9.74 63.55 21.22 58.70 35.50 8.10 3.88 0.77 0.02 18.20

Rice (2)
PHYSICCAL PROPERTIES
pH Humus
Nitrogen
P2O5 Ferrous
Copper Mangan Exchageable Cation No.
Treatment
Sand Loam Clay pHKCl
pHH2O
Hummus
Total Available Available
Total Available
Total Available
Ca Mg K Na CEC
(%) (%) (%) (mgP2O5/100g)
(mg/100g)
(ppm) (ppm) (ppm) (ppm)
(meq/100g)
1 A1 61.5 31.2 7.3 5.7 6.3 2.247 0.08 54.60 18.29 24.42 6.54 39.32 9.50 6.50 2.56 0.45 trace 13.35 2 A2 62.1 30.8 7.1 5.6 6.0 2.364 0.09 46.35 22.15 26.81 8.85 24.56 14.2
6 6.88 2.11 0.36 trace 16.00
3 A3 63.0 29.8 7.2 5.9 6.2 2.465 0.10 45.70 19.01 32.37 7.52 46.53 8.87 5.97 2.45 0.39 trace 14.63 4 B1 58.7 32.1 9.2 6.1 6.5 2.270 0.08 77.50 24.13 25.00 9.55 55.45 6.66 8.50 3.88 0.15 trace 15.20 5 B2 62.0 30.5 7.5 5.8 6.0 3.641 0.20 122.30 26.04 26.30 14.50 88.80 16.4
5 6.65 2.57 0.40 trace 11.50
6 B3 61.8 31.2 7.0 5.6 5.9 3.144 0.06 57.50 27.42 27.50 5.00 58.50 25.77
7.22 3.50 0.36 trace 14.50
7 C1 62.1 28.4 9.5 5.8 6.0 2.987 0.08 91.10 29.56 34.60 11.50 50.30 14.60
6.90 2.66 0.77 trace 12.22
8 C2 63.1 28.2 8.7 5.4 5.7 3.050 0.10 159.50 23.01 34.50 8.66 37.66 6.21 5.90 3.20 0.31 trace 10.95 9 C3 61.5 29.9 8.6 5.5 6.1 3.854 0.16 161.97 22.87 42.22 11.33 32.50 27.5
0 7.55 2.06 0.77 0.01 12.30
10 D1 61.3 31.4 7.3 5.4 6.0 3.564 0.20 113.65 30.41 62.30 12.50 47.75 21.25
7.87 4.25 0.65 0.01 14.52
11 D2 61.2 30.8 8.0 5.8 6.0 4.125 0.11 176.31 28.35 32.23 8.75 56.55 21.44
6.57 2.66 0.82 0.01 11.38
12 D3 62.3 33.4 4.3 5.4 5.7 4.019 0.10 96.63 21.78 42.24 9.60 24.40 7.95 6.65 2.37 0.66 0.01 16.52 13 E1 58.7 35.1 6.2 5.6 6.2 2.561 0.09 113.37 25.63 31.30 7.90 24.50 15.5
0 8.10 2.45 0.64 trace 15.75

14 E2 65.1 27.8 7.1 5.8 6.3 2.340 0.13 61.25 24.12 50.51 17.20 28.28 11.32
6.66 2.65 0.73 trace 13.25
15 E3 62.3 29.5 8.2 5.4 5.7 2.297 0.06 45.50 26.48 37.55 6.35 37.11 6.52 7.50 3.50 0.48 trace 12.52 16 F1 63.4 31.1 5.5 5.3 6.0 3.184 0.08 67.54 37.08 45.56 18.56 63.85 12.5
2 6.65 3.21 0.85 trace 13.30
17 F2 61.4 29.9 8.7 5.6 6.0 3.120 0.13 217.00 26.60 35.53 8.89 39.65 13.34
7.50 4.70 0.65 trace 14.35
18 F3 61.2 30.7 8.1 5.6 5.9 2.584 0.21 122.35 29.17 26.30 9.54 64.24 21.20
8.00 4.12 0.58 0.01 15.15
19 G1 62.4 32.3 5.3 5.8 6.3 3.637 0.08 97.63 37.22 35.15 11.21 57.25 22.14
6.60 2.57 0.64 trace 13.30
20 G2 62.8 29.6 7.6 5.2 5.7 2.850 0.14 57.35 24.85 27.14 9.66 65.40 19.20
7.25 1.95 0.52 trace 11.24
21 G3 63.0 28.7 8.3 5.4 6.0 2.985 0.11 48.85 26.13 51.42 22.32 31.82 8.85 7.52 2.68 0.68 trace 16.61 Peanut (2)
PHYSICCAL PROPERTIES
pH Humus
Nitrogen
P2O5 Ferrous
Copper Mangan Exchageable Cation No.
Treatment
Sand Loam Clay pHKCl
pHH2O
Hummus
Total Available Available
Total Available
Total Available
Ca Mg K Na CEC
(%) (%) (%) (mgP2O5/100g)
(mg/100g)
(ppm) (ppm) (ppm) (ppm)
(meq/100g)
1 A1 76.1 12.8 11.1 5.8 6.2 2.311 0.28 65.54 3.18 42.10 8.65 44.45 9.65 5.98 3.25 0.35 trace 10.45 2 A2 75.2 14.5 10.3 5.7 6.3 1.657 0.34 107.65 5.62 37.60 9.64 37.58 14.2
3 8.64 2.21 0.54 trace 13.71
3 A3 75.6 13.7 10.7 6.0 6.2 1.892 0.27 67.58 4.45 46.98 11.08 46.24 2.31 7.79 1.97 0.29 trace 14.11 4 B1 76.3 12.9 10.8 6.1 6.5 2.270 0.42 77.50 5.78 32.40 9.55 55.45 8.73 8.23 2.14 0.25 trace 14.55 5 B2 75.5 13.4 11.1 6.0 6.4 2.875 0.28 122.30 6.34 15.60 6.54 88.80 13.7 9.41 2.57 0.56 trace 16.35

9 6 B3 72.8 12.9 14.3 6.1 6.3 2.447 0.25 95.24 7.04 27.50 8.65 58.50 25.5
8 7.22 2.46 0.45 trace 14.55
7 C1 74.7 11.5 13.8 5.9 6.3 2.254 0.24 91.10 7.15 34.60 11.50 50.30 19.18
7.68 2.66 0.55 trace 12.44
8 C2 73.1 14.2 12.7 5.7 6.2 3.050 0.26 159.50 8.91 34.50 9.32 78.12 9.65 8.28 2.35 0.65 trace 11.65 9 C3 75.6 12.8 11.6 6.2 6.4 2.857 0.43 161.97 7.38 42.22 8.25 45.65 17.2
8 7.35 2.06 0.66 0.01 16.24
10 D1 74.5 13.6 11.9 5.7 6.0 2.663 0.51 113.65 9.45 42.25 12.50 47.75 21.25
6.86 3.24 0.75 0.01 14.36
11 D2 74.6 12.8 12.6 5.8 6.1 2.958 0.62 176.31 10.78 32.23 8.75 56.55 21.44
8.52 2.66 0.46 0.01 14.25
12 D3 73.2 14.5 12.3 5.7 6.2 3.457 0.15 96.63 8.98 42.24 9.60 44.50 14.52
6.65 2.37 0.51 0.01 13.79
13 E1 75.2 14.7 10.1 5.7 6.2 1.986 0.33 113.37 5.40 31.30 7.90 65.54 15.50
8.10 2.45 0.34 trace 14.65
14 E2 75.5 13.6 10.9 6.2 6.3 1.850 0.38 61.25 6.01 32.46 14.22 74.25 11.32
8.45 2.65 0.70 trace 14.54
15 E3 76.1 14.1 9.8 6.0 6.5 2.291 0.41 65.34 6.25 37.55 6.35 37.11 8.96 7.54 2.45 0.68 trace 12.52 16 F1 76.0 12.8 11.2 5.8 6.1 2.831 0.18 67.54 7.24 45.56 17.32 63.85 12.5
2 6.58 2.14 0.45 trace 12.82
17 F2 77.3 14.6 8.1 6.1 6.4 2.345 0.46 36.65 6.97 35.53 8.89 39.65 13.34
7.50 1.35 0.45 trace 16.34
18 F3 75.4 12.7 11.9 6.0 6.3 2.580 0.55 166.42 7.28 26.30 9.54 64.24 21.20
9.54 2.75 0.55 0.01 16.34
19 G1 76.2 14.8 9.0 6.0 6.3 2.659 0.33 97.63 9.33 35.15 11.21 57.25 8.71 8.55 2.57 0.45 trace 13.52 20 G2 75.5 15.1 9.4 5.9 6.5 2.850 0.35 57.35 10.24 27.14 9.66 65.40 19.2
0 7.25 1.88 0.35 trace 15.25
21 G3 73.1 14.0 12.9 6.2 6.6 3.124 0.32 154.55 9.89 34.58 15.25 68.54 8.85 7.40 3.02 0.66 trace 14.52

Longan (2)
PHYSICCAL PROPERTIES
pH Humus
Nitrogen
P2O5 Ferrous
Copper Mangan Exchageable Cation No.
Treatment
Sand Loam Clay pHKCl
pHH2O
Hummus
Total Available Available
Total Available
Total Available
Ca Mg K Na CEC
(%) (%) (%) (mgP2O5/100g)
(mg/100g)
(ppm) (ppm) (ppm) (ppm) (meq/100g)
1 A1 54.0 16.5 29.5 5.2 5.5 1.327 0.04 122.15 12.32 23.00 11.34 35.32 21.22 0.85 1.12 0.22 trace 4.35 2 A2 52.2 15.6 32.2 5.3 5.6 1.361 0.07 55.56 11.26 11.35 3.56 31.23 5.53 1.27 3.32 0.14 trace 5.52 3 A3 48.5 16.8 34.7 5.0 5.8 1.336 0.12 44.14 3.32 48.23 65.65 7.35 5.43 1.15 1.25 0.20 trace 4.41 4 B1 52.4 17.2 30.4 5.5 5.7 1.472 0.06 54.74 22.22 15.45 6.88 23.41 9.89 3.43 2.24 0.23 trace 15.41 5 B2 51.3 18.6 30.1 5.4 5.5 2.651 0.22 64.25 11.54 52.34 21.39 77.26 46.66 1.82 1.03 0.30 trace 8.66 6 B3 50.4 20.2 29.4 4.6 5.5 1.654 0.10 56.62 18.85 14.45 5.55 13.32 7.76 2.11 1.82 0.12 trace 8.64 7 C1 54.0 18.2 27.8 5.5 5.9 2.849 0.07 54.87 64.73 55.45 33.43 34.32 21.23 5.51 3.34 0.31 trace 13.77 8 C2 50.0 20.4 29.6 5.3 6.5 2.446 0.08 88.55 5.52 34.04 16.75 52.65 12.12 1.22 1.63 0.10 trace 5.43 9 C3 54.9 17.8 27.3 5.5 6.5 2.541 0.16 262.32 5.74 29.46 4.68 35.52 21.38 2.22 2.23 0.41 trace 9.44
10 D1 53.3 18.0 28.7 5.7 6.2 2.748 0.20 156.65 54.77 22.37 4.65 33.54 7.56 3.48 13.54 0.22 Trace 52.78 11 D2 52.4 20.8 26.8 5.6 6.3 2.342 0.13 207.47 37.56 58.34 33.33 33.67 5.43 1.32 2.34 0.32 trace 11.39 12 D3 53.2 19.5 27.3 6.1 6.4 2.341 0.07 58.26 7.76 33.17 23.45 87.23 32.62 5.76 3.32 0.33 trace 13.3 13 E1 53.5 15.6 30.9 5.3 5.6 1.345 0.17 267.51 63.56 89.22 33.46 28.47 21.22 6.65 2.32 0.34 trace 2.42 14 E2 48.0 16.5 35.5 5.1 5.6 1.778 0.29 82.57 14.54 41.49 16.52 83.23 32.34 1.02 2.43 0.74 trace 11.23 15 E3 54.2 16.8 229.0 5.1 5.6 1.526 0.05 34.78 4.67 34.42 11.54 40.23 25.45 3.43 0.87 0.73 trace 8.32 16 F1 52.0 18.3 29.7 5.6 5.9 1.766 0.06 286.56 64.54 52.14 22.43 59.43 30.32 1.33 3.32 0.22 trace 7.44 17 F2 51.2 16.2 32.6 5.5 5.9 2.358 0.21 112.35 34.34 59.54 16.47 43.55 11.29 2.35 2.37 0.34 trace 3.35 18 F3 56.4 19.4 24.2 5.4 5.5 2.323 0.11 237.54 24.45 47.34 21.34 46.53 33.41 4.46 2.34 0.34 trace 56.83 19 G1 53.3 18.6 34.7 5.6 6.1 2.754 0.26 143.23 33.80 32.32 9.54 83.63 44.23 6.44 2.50 0.34 trace 12.54 20 G2 52.3 21.4 26.3 5.5 6.1 2.642 0.25 183.33 111.0 51.23 25.62 52.48 15.33 5.80 6.05 0.47 trace 21.56 21 G3 51.4 17.5 31.1 5.4 6.1 2.835 0.34 78.55 33.35 63.65 16.76 91.16 40.28 3.21 4.54 0.44 trace 8.00

Vegetable (2)
PHYSICCAL PROPERTIES
pH Humus
Nitrogen
P2O5 Ferrous
Copper Mangan Exchageable Cation No.
Treatment
Sand Loam Clay pHKCl
pHH2O
Hummus
Total Available Available
Total Available
Total Available
Ca Mg K Na CEC
(%) (%) (%) (mgP2O5/100g)
(mg/100g)
(ppm) (ppm) (ppm) (ppm) (meq/100g)
1 A1 11.2 81.1 7.7 5.8 6.3 2.576 0.10 118.98 4.56 38.46 8.84 63.41 30.16 6.50 4.10 0.68 trace 13.50 2 A2 12.4 78.9 8.7 5.4 5.9 2.551 0.09 161.97 5.46 36.41 9.23 72.76 4.99 10.4 4.22 0.53 trace 17.20 3 A3 11.0 78.4 10.6 4.8 5.4 2.840 0.10 213.16 4.13 34.86 6.73 65.48 5.62 7.64 4.24 0.70 trace 18.25 4 B1 12.5 81.4 6.1 6.2 6.7 2.407 0.10 159.93 6.17 36.85 9.23 57.98 8.40 7.55 5.62 0.68 trace 17.50 5 B2 11.8 79.4 8.8 5.9 6.4 2.810 0.13 176.31 5.61 42.21 10.43 57.28 55.48 4.50 5.88 0.41 trace 14.66 6 B3 12.6 81.2 6.2 6.0 6.6 2.561 0.12 163.25 5.32 39.24 10.33 57.62 50.23 12.62 3.52 0.532 trace 20.23 7 C1 11.8 76.5 11.7 6.2 6.6 2.763 0.12 152.34 7.34 43.20 9.25 62.38 55.36 7.64 5.64 0.55 trace 18.22 8 C2 11.0 78.5 10.5 6.1 6.5 2.637 0.11 172.25 9.56 40.63 11.32 60.48 40.86 8.25 3.75 0.64 trace 20.27 9 C3 13.5 81.1 5.4 6.2 6.8 2.856 0.13 148.67 6.89 42.43 10.65 58.54 48.23 8.52 4.76 0.43 trace 21.64
10 D1 12.7 74.6 12.7 6.1 6.7 2.954 0.12 165.23 8.12 44.21 11.56 58.68 47.52 15.75 6.88 0.66 trace 16.46 11 D2 13.0 79.6 7.4 6.2 6.8 3.215 0.13 265.46 8.37 48.34 11.35 61.37 52.41 9.40 4.68 0.78 trace 16.72 12 D3 12.4 76.8 10.8 6.0 6.5 2.984 0.12 186.56 9.03 45.65 10.98 55.67 30.65 10.60 5.54 0.59 trace 18.85 13 E1 8.2 79.2 12.7 5.2 5.7 2.752 0.12 165.42 4.18 37.52 12.45 51.23 8.96 11.66 5.75 0.56 trace 18.25 14 E2 16.7 76.4 6.9 5.4 5.8 2.986 0.12 178.32 5.55 38.45 14.32 53.24 10.85 7.55 5.25 0.62 trace 17.45 15 E3 12.9 78.2 8.9 5.3 5.8 2.641 0.12 153.45 6.74 32.65 12.78 54.32 40.08 8.62 6.27 0.65 trace 15.35 16 F1 11.4 77.5 11.1 5.5 5.9 2.567 0.11 147.23 6.43 36.42 13.54 52.41 8.72 13.34 4.20 0.44 trace 18.54 17 F2 12.4 81.2 6.4 5.7 6.0 2.782 0.12 165.52 5.89 40.36 15.02 56.34 9.87 9.25 7.53 0.52 trace 17.75 18 F3 11.5 78.0 10.5 5.6 5.9 2.654 0.12 254.32 6.75 35.62 14.25 56.84 48.56 2.54 3.85 0.50 trace 14.35 19 G1 13.1 76.9 10.0 5.7 6.0 2.776 0.13 149.69 7.89 38.41 13.75 60.23 6.21 7.48 5.37 0.72 trace 15.84 20 G2 12.5 79.9 7.6 5.7 6.0 3.931 0.13 286.87 6.22 56.05 18.98 57.23 6.55 11.25 5.39 0.65 trace 20.54 21 G3 11.0 81.3 7.7 5.6 6.0 2.956 0.13 198.56 8.37 47.24 15.62 58.42 48.56 8.54 4.67 0.30 trace 20.83

I, II & III: Analysis before experiments A: Control (no manure or biogas) C: Solid manure: 5 tons/ha C: Solid manure: 10 tons/ha D:Solid manure: 20 tons/ha E: Biogas: 5 tons/ha F: Biogas: 10 tons/ha G:Biogas 20 tons/ha
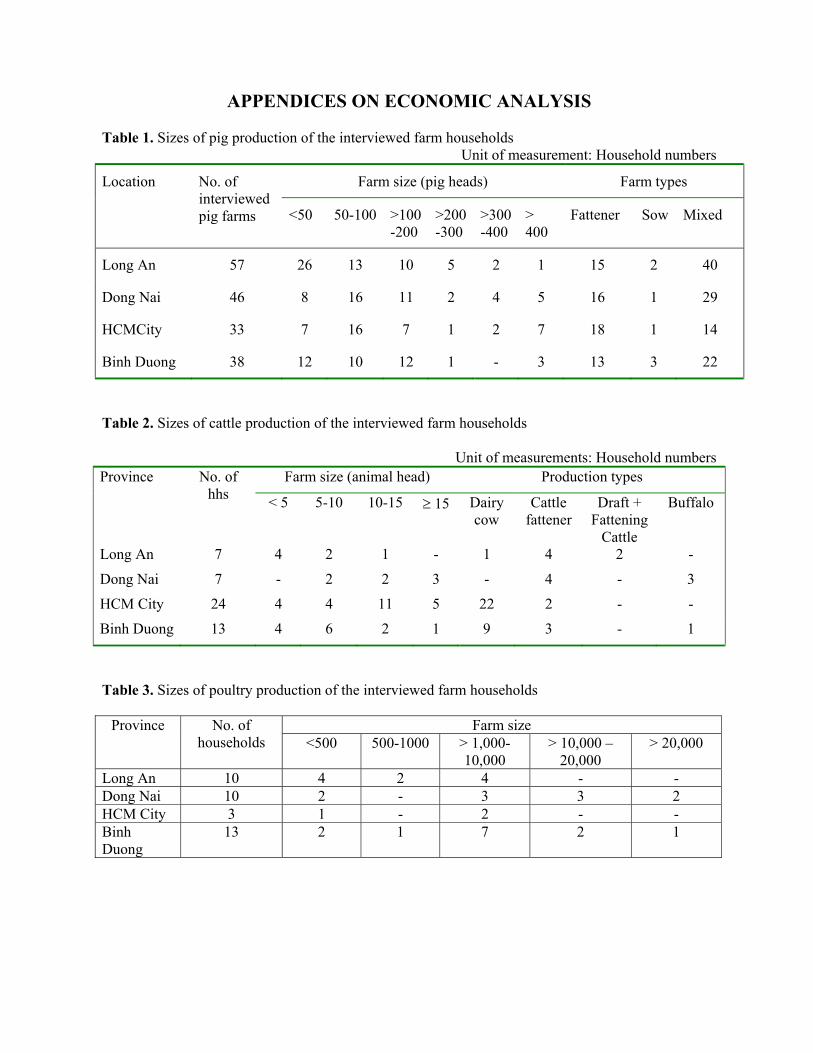
APPENDICES ON ECONOMIC ANALYSIS Table 1. Sizes of pig production of the interviewed farm households
Unit of measurement: Household numbers
Farm size (pig heads) Farm types Location No. of interviewed pig farms <50 50-100 >100
-200 >200-300
>300-400
> 400
Fattener Sow Mixed
Long An 57 26 13 10 5 2 1 15 2 40
Dong Nai 46 8 16 11 2 4 5 16 1 29
HCMCity 33 7 16 7 1 2 7 18 1 14
Binh Duong 38 12 10 12 1 - 3 13 3 22
Table 2. Sizes of cattle production of the interviewed farm households
Unit of measurements: Household numbers Farm size (animal head) Production types Province No. of
hhs < 5
5-10 10-15 ≥ 15 Dairy
cow Cattle
fattener
Draft + Fattening
Cattle
Buffalo
Long An 7 4 2 1 - 1 4 2 -
Dong Nai 7 - 2 2 3 - 4 - 3
HCM City 24 4 4 11 5 22 2 - -
Binh Duong 13 4 6 2 1 9 3 - 1
Table 3. Sizes of poultry production of the interviewed farm households
Farm size Province No. of households <500 500-1000 > 1,000-
10,000 > 10,000 –
20,000 > 20,000
Long An 10 4 2 4 - - Dong Nai 10 2 - 3 3 2 HCM City 3 1 - 2 - - Binh Duong
13 2 1 7 2 1

Table 4. Various waste treatments applied by livestock farms in Long An, Dong Nai, Binh Duong provinces and HCMC (in %)
SOLID WASTE LIQUID WASTE WASTE TREATMENT Long
An Dong Nai
HCMC Binh Duong
Long An
Dong Nai
HCMC Binh Duong
1) Biogas 25 23 16 18 30 30 19 19 2) Fresh manure storage
16
43 16 30
0
0 0 0
3) Composting 9 6 6 18 0 0 0 0 4) Discharge to fish ponds
17
8 7 1
22
19 7 2
5) Discharge to land/stream
22
9 30 16
43
49 74 73
6) Selling fresh manure
0
9 10 8
0
0 0 0
7) Give away 0 2 6 1 0 0 0 0 8) Combined 3 0 3 1 0 0 0 0 9) Others 8 0 6 7 5 2 0 6
Total 100 100 100 100 100 100 100 100 Table 5. Information on manure stored and sold by farm households in Long An, Dong Nai, Binh Duong provinces and HCMC
Who collect manure
Cleaning after collecting
Types of buyers Location & kinds of manure
No of hh.
No. of
selling hhs
Producer
Buyer
Producer
Buyer Farmer Middlemen
Selling price
(dong/kg)
Quantity sold/hh
(kg/year)
Long An
- Fresh manure
12 2 0 2 0 2 2 0 128 1,900
- Compost 7 2 1 1 1 1 1 1 194 680
Dong Nai
- Fresh manure
28 16 9 7 9 7 15 1 164 7,486
- Compost 4 4 1 3 1 3 4 0 283 4,587
HCMC
- Fresh manure
18 11 10 1 11 0 11 0 104 5,409
- Compost 4 3 2 1 2 1 3 0 133 7,000
Binh Duong
- Fresh manure 28 20 18 2 18 2 19 1 175 7,591 - Compost 13 11 10 1 11 1 11 0 220 3,238

Table 6. Fresh manure treatment by scale, the interviewed livestock farm households, Long An.
Farm types (no. of farms)
Species (no. of farms) Average treatment costs per farm (000 dong)
Average benefit per farm (000 dong)
Benefit – Cost Ratio Scale (no. of animals/farm)
Livestock
Mixed
Cattle
Chicken
Swine Cattle Chicken
Swine
Cattle Chicken
Swine Cattle Chicken
Swine
<10 1 4 5 - - 52 - - 449 - - 8.65 0.00 0.00 10 – 20 2 - 1 - 1 111 - 26 1300 - 60 11.69 0.00 2.28 20 – 50 - 1 - - 1 - - 67 - - 600 0.00 0.00 8.93 50 – 100 1 - - - 1 - - 88 - - 250 0.00 0.00 2.85 100 – 200 - 1 - - 1 - - 175 - - 600 0.00 0.00 3.42 200 – 500 1 1 - 1 1 - 16 317 - 50 450 0.00 3.20 1.42
Grand Total 5 7 6 1 5 Table 7. Fresh manure treatment by scale, the interviewed livestock farm households, Dong Nai
Farm types (no. of farms)
Species (no. of farms) Average treatment costs per farm (000 dong)
Average benefit per farm (000 dong)
Benefit – Cost Ratio Scale (no. of animals/farm
) Livesto
ck Mixed
Cattle Chicken
Swine Cattle Chicken
Swine
Cattle Chicken
Swine Cattle Chicken
Swine
10 – 20 1 2 2 - 1 130 - 17 733 - 60 5.65 - 3.59 20 – 50 1 3 2 - 2 301 - 30 1307 - 300 4.34 - 9.84 50 – 100 - 5 - - 5 - - 57 - - 376 - - 6.59 100 – 200 - 4 - - 4 - - 125 - - 423 - - 3.39 200 – 500 1 2 - - 3 - - 283 - - 450 - - 1.59 500-1000 - 1 - - 1 - - 619 - - 1200 - - 1.94
>1000 5 3 - 8 - - 438 - - 1298 - - 2.96 - Grand Total 8 20 4 8 16 195 438 146 1076 1298 424 5.53 2.96 2.91

Table 8. Fresh manure treatment by scale, the interviewed livestock farm households, HCMC
Farm types (no. of farms)
Species (no. of farms) Average treatment costs per farm (000
dong)
Average benefit per farm (000 dong)
Benefit – Cost RatioScale (no. of animals/farm)
Livestock Mixed Cattle Swine Cattle Swine Cattle Swine Cattle Swine <10 1 1 2 - 6 - 50 - 8.33 -
10 – 20 3 2 5 - 253 - 300 - 1.18 - 20 – 50 - 1 - 1 - - - - - -
100 – 200 1 2 - 3 - 83 - 400 - 4.8 Grand Total 5 6 7 4
Table 9. Fresh manure treatment by scale, the interviewed livestock farm households, Binh Duong
Farm types (no. of farms)
Species (no. of farms) Average treatment costs per farm (000 dong)
Average benefit per farm (000 dong)
Benefit – Cost Ratio Scale (no. of
animals/farm)
Livestoc
k Mixed Cattl
e Chick
en Swin
e Cattle Chick
en Swine Cattl
e Chick
en Swine Cattle Chicke
n Swine
<10 1 6 7 - - 121 - - 431 - - 3.55 - - 10-20 - 1 1 - - 230 - - 700 - - 3.04 - - 20 -50 - 2 - - 2 - - 150 - - 350 - - 2.33
50 - 100 1 2 - - 3 - - 67 - - 640 - - 9.60 100 - 200 4 1 - - 5 - - 192 - - 431 - - 2.25 200 - 500 - 1 - - 1 - - 160 - - 1,000 - - 6.25 500 - 1000 1 1 - 1 1 - 50 100 - - 800 - - 8.00
> 1000 1 1 - 2 - - 3,000 - - 7,400 - - 2.47 - Grand Total
8 15 8 3 12

Table 10. Compost treatment by scale, the interviewed livestock farm households, Long An, Dong Nai, HCMC and Binh Duong
Farm types (no. of farms)
Species (no. of farms) Average treatment costs per farm (000 dong)
Average benefit per farm (000 dong)
Benefit – Cost Ratio Scale (no. of animal
heads/farm) Livestoc
k Mixe
d Cattle Chick
en Swine Cattle Chick
en Swine Cattle Chick
en Swine Cattle Chicke
n Swine
1.Long An <=10 3 - 2 - 1 291 - - 420 - - 1.44 - - 10-50 - 4 - - 4 - - 105 - - 228 - - 2.16 Total 3 4 2 - 5 - - - - - - - - -
2. Dong Nai 10-50 1 - - - 1 - - 118 - - 300 - - 2.53
50 – 200 1 1 - - 2 - - 197 - - 525 - - 2.66 >200 - 1 - 1 - - 54 - - 150 - - 2.77 - Total 2 2 - 1 3 - - - - - - - - -
3. HCMC < 10 1 - 1 - - 50 - - 120 - - 2.4 - -
10 – 20 - 2 - - 2 - - 35 - - 200 - - 5.71 20 – 50 1 - 1 - - 50 - - 160 - - 3.2 - -
Grand Total 2 2 2 - 2 - - - 4. Binh Duong
20 –50 1 2 - - 3 - - 70 - - 500 - - 7.14 50 – 100 - 3 - - 3 - - 238 - - 612.5 - - 2.57 100 – 200 1 3 - - 4 - - 543 - - 1405 - - 2.59 200 – 500 1 1 - - 2 - - 500 - - 1225 - - 2.45 500 – 1000 1 - - 1 - 720 - 3000 - 4.17
>=1000 1 2 3 537 - 1440 2.68 Grand Total 5 11 3 13