Consumers' motivation for eating free-range meat or less meat
Upload
khangminh22Category
view
4download
0
Project code: L.EQT.1813
Prepared by: Dr Rod Polkinghorne OAM, Dr Michael Campbell, Dr Garth Tarr
Charles Sturt University, Polkinghornes Pty Ltd
Date published: 28th June 2018
PUBLISHED BY Meat and Livestock Australia Limited Locked Bag 1961 NORTH SYDNEY NSW 2059
Quantifying the impact of Modified Atmospheric Packaging (MAP)
and alternative packaging solutions on eating quality.
Meat & Livestock Australia acknowledges the matching funds provided by the Australian
Government to support the research and development detailed in this publication.
This publication is published by Meat & Livestock Australia Limited ABN 39 081 678 364 (MLA). Care is taken to ensure the accuracy of the information contained in this publication. However MLA cannot accept responsibility for the accuracy or completeness of the information or opinions contained in the publication. You should make your own enquiries before making decisions concerning your interests. Reproduction in whole or in part of this publication is prohibited without prior written consent of MLA.
final report

L.EQT.1813 – Quantifying the impact of Modified Atmospheric Packaging (MAP) and alternative packaging solutions on eating quality
Page 2 of 47
Abstract This project was initiated to build on results from an earlier study (P.PIP.0488) that reported a
serious and significant detrimental eating quality effect on retail steak packed for 9 days in 80:20
high Oxygen MAP. The current study investigated MAP, VSP and possible alternative gas mixes in
Trigas and 80:20 Nitrogen with visual and sensory consumer evaluation at 1, 3, 5, 7 and 9 days in the
retail pack. Both high oxygen and Trigas MAP had significantly lower eating quality from day 1 and
throughout the display period. The 80:20 Nitrogen packs had an unsatisfactory visual rating however
performed well and similar to VSP in sensory appraisal as cooked steak. Results of the study
informed the MSA Pathways committee decision to impose an 8 point Meat Quality (MQ4) score
penalty on any MSA product packed in high oxygen MAP.

L.EQT.1813 – Quantifying the impact of Modified Atmospheric Packaging (MAP) and alternative packaging solutions on eating quality
Page 3 of 47
Executive summary This study provides vital yet somewhat confronting knowledge for the beef industry. It substantiates
reported results from the prior packaging study conducted under P.PIP.0488 which documented a
highly significant decline in eating quality resulting from retail packaging in 80:20 high oxygen
modified atmosphere (MAP), a predominant packaging system utilised by major retailers in
Australia, relative to overwrap (OWP) and vacuum skin pack (VSP) alternatives.
Legitimate industry concerns were raised in relation to the prior study in that it utilised only
northern grass fed bullocks, was primarily designed to test colour and consumer based visual pack
appeal and included a large proportion of raw material with pH above the MSA upper threshold of
5.70. The concerns from industry were that 1) younger southern cattle were more typical of supply
chains, 2) that grain fed cattle were not included, 3) that the raw product was not all MSA compliant
and 4) that consumer sensory evaluation of cooked steak was only conducted after 9 days in retail
packs.
To address these concerns the current study was designed to evaluate product both visually and by
consumer sensory taste tests at 1, 3, 5, 7 and 9 days after retail packing. All product was drawn from
54 MSA compliant cattle sourced equally from grain and grass fed young southern Australian British
breed cattle. The collected product was further balanced across three Meat Quality (MQ4) based
eating quality bands within grass and grain fed categories.
As the previous study had found no difference in packaging effect across 3 cuts (tenderloin, striploin
and rump) after 5, 12 or 40 days ageing as vacuum packed primals prior to retail packing the current
study only utilised the M.Longissimus thoracis and lumborum muscle (cube roll and striploin) with
retail packing after 16 days of storage as vacuum packed primals. The OWP treatment was not used
in the new study with MAP and VSP providing linked comparison to the original research. Two
additional packaging treatments utilising alternative gas mixtures were included however. These
were a TRIGAS (TRI) treatment with 40% Oxygen, 30% Nitrogen and 30% Carbon Dioxide and a high
Nitrogen (NIT) treatment with 80% Nitrogen and 20% Carbon Dioxide gas mix. Both the additional
treatments had been advocated by parties in Europe and could potentially provide a low cost
transition from conventional high oxygen MAP as no change was required in packaging machinery.
By utilising the cube roll and striploin, 10 test samples were prepared from each carcase enabling
strong within animal linkage across the 4 packaging treatments and ageing time in retail packaging.
In all 540 packs, (135 per packaging treatment, 108 per ageing treatment, 27 per treatment x aged
combination were prepared for retail display and sensory testing as cooked steak samples. Extensive
design and accompanying control records and protocols were developed to enable the design to be
delivered within a commercial value adding facility.
All product was firstly fabricated from vacuum packed primals to 25mm slices, utilising a cutting jig
with slices, then allocated to the alternative packaging system in accordance with the specified
muscle position. Each pack was identified by a unique laminated 4 digit alphanumeric code, with a
coloured dot on the pack side signifying ageing group. Each open pack was evaluated for colour then

L.EQT.1813 – Quantifying the impact of Modified Atmospheric Packaging (MAP) and alternative packaging solutions on eating quality
Page 4 of 47
transferred to one of four commercial packaging lines, one allocated to each treatment, for retail
packing. After packing, all packs were transferred to Charles Sturt University (CSU).
A commercial open fronted retail display cabinet, a make and model used in major supermarkets,
was installed in the residential dining and kitchen facility at CSU and used to display the steak
product each display day. On each display day the 108 steak packs, allocated to the ageing period
(Days 1, 3, 5, 7 or 9) were placed in pre-allocated positions together with a constant reference group
of 36 packs of the 9 day treatment. Only the 108 packs aged for 9 days were viewed on the final day.
The display position of every pack was controlled utilising an 8 x 8 Latin square design to ensure that
each set of 8 trays, one of each packaging treatment within each of 4 grass and 4 grain fed samples,
was presented according to the Latin square rows. The sets of 8 were dispersed across the well and
3 shelves and balanced for shelf position (left, right, front and rear) to balance potential cabinet
position effects.
The same consumer meat colour (CMC) evaluation system was utilised as in the prior experiment.
This required each pack to be scored by 10 consumers by marking a 100 mm line scale anchored by
“extremely appealing” and “extremely unappealing” together with marking one of 3 boxes related to
purchasing intent (would definitely buy, definitely buy if discounted or definitely not buy).
Consumers were asked to evaluate three nominated sets of 8 packs. This utilised 356 consumers
across the trial who recorded a total of 8,544 pack observations.
The CMC judgements, and the calculated discrimination into purchase categories was consistent
with the prior study and indicated a high level of consensus.
As expected the high oxygen MAP and TRI treatments obtained the highest visual ratings being most
differentiated at day 1 and declining somewhat over the 9 days of display. As in the earlier study the
VSP scores were lower however were constant across the display period and rated as acceptable.
The NIT product was severely downgraded with a very dark grey to brown appearance at day 1
which improved somewhat as display days increased.
After viewing, the packs allocated to that viewing day were removed from the cabinet, scored for
colour immediately on opening and after a 20 minute bloom time, were fabricated into MSA
consumer grill samples (each comprising 5 small steaks), utilising MSA protocols. Following
fabrication they were vacuum packed and frozen, maintaining their individual ID. After completion
of the 9 days of visual appraisal, the frozen samples were allocated to picks (36 test samples
allocated to a group of 60 consumers) with each pick including both grass and grain fed product from
all packaging types and across ageing periods.
Consumer sensory evaluation was conducted in the greater Melbourne region in accordance with
MSA protocols with 10 consumers evaluating each sample. Each consumer was served 7 samples, 6
test samples following a first mid quality “link”. The 5 steaks within each sample were cooked in 5
different “rounds” to avoid possible serving order effects. The samples were arranged into 6
products ranging from expected lowest to highest eating quality and their presentational order

L.EQT.1813 – Quantifying the impact of Modified Atmospheric Packaging (MAP) and alternative packaging solutions on eating quality
Page 5 of 47
governed by a 6 x 6 Latin square design to ensure each was served an equal number of times before
and after each other product and equally in each cooking order.
Consumer scoring, as dictated by the protocol, utilised four 100 mm line scales for tenderness,
juiciness, flavour and overall liking together with a choice of 4 categories being unsatisfactory, good
everyday, better than everyday or premium quality. The 4 line scale scores were combined as tender
* 0.3 + juicy * 0.1 + flavour * 0.3 + overall * 0.3 to create a MQ4 score which was used as the primary
rating of each sample.
The sensory results were clear and statistically highly significant. As with the earlier study, sensory
scores were much higher for the VSP packaging relative to MAP and within the confidence interval of
the first study, although slightly lower numerically. In contrast to the visual ratings, the NIT
treatment was similar to VSP with high sensory ratings. The TRI packaging produced results very
similar, however trending slightly above the MAP treatment. The effect of ageing was not significant
with the sensory relationships evident from day 1 post packing. A trend approaching significance for
further MQ4 score reduction with ageing was evident for the MAP and TRI treatments.
On the basis of results from both studies the MSA Pathways Committee recommended that all high
oxygen packed product, including MAP and TRI, be discounted by 8 MQ4 points. This
recommendation was accepted by the MSA Beef Taskforce and implemented commercially.
The study offers critical guidance to the Australian Meat Industry and further emphasises the impact
of MSA grading outcomes reflecting a direct consumer satisfaction measure. As a result of the
project, industry has been alerted to the impact of retail packaging systems on consumer satisfaction
with this impact made visible through substantiated MQ4 deductions.
While there is no MSA requirement to utilise any packaging system there is now a clear consequence
of utilising MAP, as with HGP treatments and other production factors. This raises challenges due to
the widespread adoption of MAP in large retail chains due to the associated visual retail appeal. The
inclusion of TRI and NIT in this study evaluated two possible alternatives, both of which were
unsuccessful. The NIT treatment however did fully overcome the detrimental eating quality impact
but failed visually. Subsequent discussion has raised a possibility that more severe scavenging during
pack evacuation may alleviate the discolouration through further reduced residual oxygen. It is
recommended that this be evaluated as a transition to NIT packing would be highly effective and low
cost given that only a change in gas mix would be required to implement.

L.EQT.1813 – Quantifying the impact of Modified Atmospheric Packaging (MAP) and alternative packaging solutions on eating quality
Page 6 of 47
Table of contents
1 Background ............................................................................................................... 8
2 Project objectives...................................................................................................... 9
3 Methodology ............................................................................................................ 9
3.1 Trial design and cut allocation ................................................................................................. 9
3.1.1 Collection of Primals – Southern Australia 21st to 23rd October 2017 .......................... 12
3.1.2 Product codes and transport ......................................................................................... 15
3.2 Retail Packaging Experimental Design ................................................................................... 15
3.2.1 Fabrication and Retail Packing – 5th November 2017.................................................... 17
3.3 Retail cabinet display at Charles Sturt University (CSU) ........................................................ 21
3.4 Consumer assessment of visual pack appeal ........................................................................ 25
3.5 Preparation of MSA consumer samples and data recording post retail display. .................. 26
3.6 MSA consumer testing ........................................................................................................... 26
3.6.1 Pick design ..................................................................................................................... 26
3.6.2 Consumer recruitment .................................................................................................. 27
3.6.3 Cooking, serving and data protocols ............................................................................. 27
4 Statistical Analysis ................................................................................................... 28
5 Results ..................................................................................................................... 29
5.1 Visual appraisal of packaging in retail display case ............................................................... 29
5.2 Sensory appraisal of cooked steaks with alternative retail packaging and display period
treatments ......................................................................................................................................... 32
6 Discussion ................................................................................................................ 36
7 Conclusions/recommendations ................................................................................ 37
8 Key messages ........................................................................................................... 37
9 Acknowlegements .................................................................................................... 38
10 Bibliography ............................................................................................................ 38

L.EQT.1813 – Quantifying the impact of Modified Atmospheric Packaging (MAP) and alternative packaging solutions on eating quality
Page 7 of 47
11 Appendix ................................................................................................................. 39
11.1 Retail packing material specifications ................................................................................... 39
11.2 Consumer visual appraisal - demographics input ................................................................. 42
11.3 Consumer visual appraisal- CMC scoring sheet .................................................................... 43
11.4 Consumer sensory testing questionnaire sheets .................................................................. 44

L.EQT.1813 – Quantifying the impact of Modified Atmospheric Packaging (MAP) and alternative packaging solutions on eating quality
Page 8 of 47
1 Background
This project was originated to expand on previous work reported in P.PIP.0488 (Polkinghorne et al.
2017; Polkinghorne et al. 2018) and to resolve a number of questions raised in relation to the
findings. As the earlier project reported a significant eating quality reduction with high oxygen MAP
packaging and recommended imposition of a 12 MQ4 point MSA reduction for 80:20 MAP product
there was considerable industry interest and reaction. Adoption of the recommendation was
claimed to have potential severe commercial ramifications and further work to substantiate the
findings and expand on the scope was requested.
The earlier project investigated interactions between AUS-MEAT meat colour scores (AMC) taken
from the loin quartering site during MSA grading and immediately after boning. AMC was recorded
on the tenderloin, striploin and rump from both carcase sides, subsequently after placement in retail
packing following 5, 12 or 42 days in vacuum packaging and finally after 9 days of subsequent retail
display following each ageing period. Instrumental colour and pH readings were also taken at each
step with trial carcases selected from a matrix of over and under 5.70 pH at grading for AMC 3 to 5
and below 5.70 for AMC 1C, and 2. Forty eight carcases from northern Australian grass fed bullocks
with a dentition range of 0 to 6 teeth, were utilised in the P.PIP.0488 project.
The P.PIP.0488 project retail packed steak portions of every cut in overwrap (OWP), 80:20 high
oxygen (MAP) and vacuum skin pack (VSP). The retail packs were subsequently viewed in a
commercial upright chilled retail cabinet, as used in the major supermarket chains, and scored for
colour appeal and willingness to purchase over a 9 day period by untrained consumers with 10
viewings for each pack on each viewing day.
At the completion of viewing the packs were fabricated into MSA sensory samples 9 days post retail
packing and frozen prior to sensory testing. The sensory results indicated that the 12 MQ4 point
MAP reduction was consistent across the three muscles and also across each of the primal ageing
periods.
While this defined the MAP effect at 9 days of retail display the rate of this developing was not
studied and raised the question of whether it increased over time and, if so, at what rate and
whether in a linear or other pattern.
There was an additional knowledge gap regarding the impact of alternative MAP gas mixtures and
their potential to reduce the eating quality impact. Researchers from the Danish Meat Research
Institute (DMRI) had reported that a 40:30:30 “Trigas” mix could be satisfactorily used based on
trained panel observation (Tørngren, M., 2003). An AMPC funded study with DMRI had also
investigated Trigas using exported Australian product. Unfortunately it had not been possible to
incorporate MSA consumer testing in this study which was evaluated by a trained panel (Tørngren
and Darré, 2016). The MSA Pathways Committee concluded that Trigas should be compared with
80:20 however raised concerns as to whether 30% oxygen at packing was sufficient to maintain
retail appearance given the very low (3%) residual oxygen reported by (DMRI) and other reviews
suggesting that a minimum of 55% is needed for stable retail colour.

L.EQT.1813 – Quantifying the impact of Modified Atmospheric Packaging (MAP) and alternative packaging solutions on eating quality
Page 9 of 47
A further reservation with the original study related to the source cattle which were all grass fed
central Queensland bullocks, some to 6 teeth with almost half having a loin pH over 5.70 at grading.
Various industry groups queried whether the study findings would be applicable to MSA eligible (pH
less than 5.71) carcases from typical southern grass and grain fed carcases.
These were legitimate concerns requiring resolution through further work.
2 Project objectives
The initial contract objectives were listed as below:
1. To quantify the progressive visual and sensory differences between 80:20 MAP and Trigas
packaging after 1, 3, 5, 7 and 9 days of retail display.
2. To quantify visual and sensory progression in VSP retail packs at 9, 16, 23 and 30 days of
retail display.
3. To evaluate differences in current VSP and a new board format in visual display and sensory
outcomes.
4. To compare visual display and sensory outcome of VSP retail packs packed directly into retail
VSP at boning versus preparation from vacuum packed primal after 5 days ageing.
5. To report microbiological and flavour volatile outcomes across the packaging and ageing
treatments.
6. To provide a reliable knowledge base for industry use in assessing and managing retail
packaging systems within alternate supply chains.
7. Delivery of practical guidelines and reliable data for industry use as a base to select and
manage alternative retail packaging systems.
After further development of the trial design objectives 2 and 3 were modified to apply identical
ageing and associated retail viewing and sensory treatments to the VSP and MAP samples. The
board format was also replaced by a further 80:20 Nitogen:Oxygen MAP alternative believed to
offer a potential solution to the high oxygen problem identified in the earlier study.
3 Methodology
3.1 Trial design and cut allocation
The trial design was developed to address concerns from the prior project, P.PIP.0488, discussed
above. In particular the following factors were elected for testing:
1. Product sourcing from younger southern produced cattle typical of supermarket supply
chains.
2. Inclusion of grain fed carcases.

L.EQT.1813 – Quantifying the impact of Modified Atmospheric Packaging (MAP) and alternative packaging solutions on eating quality
Page 10 of 47
3. All source carcases to be successfully MSA graded with none outside pH, rib fat or meat
colour ranges.
4. Control VSP samples to be directly compared to 80% oxygen:20% carbon dioxide high
oxygen MAP.
5. Product to be visually rated in a retail display cabinet 1, 3, 5, 7 and 9 days post retail
packing.
6. Product to be consumer sensory tested after 1, 3, 5, 7 and 9 days of retail display.
It was agreed that OWP packing did not need to be re-tested due to the previous equivalence of VSP
and OWP but prospective alternative gas mixtures advocated by European researchers, including the
Danish Meat Research Institute (DMRI), could be tested in conjunction to provide benchmarks.
Consequently two further MAP gas mixes were adopted:
7. TriGas a 40% Nitrogen:30% oxygen:30% carbon dioxide mix reported in research
literature by DMRI (TRI).
8. An 80% Nitrogen:20% carbon dioxide high nitrogen mix (NIT) reported from trade
sources in Europe.
Cut collection for this project was conducted simultaneously with two other projects, P.PIP.0550 and
L.EQT.1814, each of which required collection of multiple cuts sourced from a wide quality range. To
minimise plant disruption a single large collection was planned to obtain all cuts to be utilised in the
three R&D projects, with data from each to be interlinked and consequently more valuable.
Consequently the trial design encompassed all required cuts with their subsequent allocation to the
component projects.
The combined projects required collection of ribs, briskets, striploins, cube rolls, eye rounds and
knuckles from an extreme range of grass and grain fed carcases. The briskets, ribs, eye rounds and
knuckles plus the lower quality striploins and cube rolls were also programmed to provide direct USA
and Australian consumer linkage across a wide variety of cooking and value adding treatments.
The current packaging project was planned to utilise only striploin and cube roll, to be managed as a
single M.longissimus dorsi (LD) muscle due to the previous P.PIP.0408 study finding no packaging
effect differences between striploin, tenderloin and rump. The LD also suited the experimental
requirements in that up to 10 samples could be prepared from a carcase providing within animal
comparison of treatments. Carcase side and position within the LD were required to be rotated to
balance and allow statistical adjustment for side and position.
A cattle quality range restricted to MSA grading of 3* and above was also designated with a
structured grain and grass fed mix further balanced on the basis of MSA predicted MQ4 score bands
to reflect three MSA based quality levels. This structure was designed to statistically assess any inter-
relationship with either initial raw material MQ4 or feed type.
As many of the background R&D questions from the 3 projects related to interactions between
different muscles sourced from carcases of different inherent initial quality a structured extreme
range for collection was planned as shown in Table 1.

L.EQT.1813 – Quantifying the impact of Modified Atmospheric Packaging (MAP) and alternative packaging solutions on eating quality
Page 11 of 47
Table 1. Cattle collection by quality category.
To maximise the possible treatments within animal and quality range, cuts from both sides were
collected across all 90 bodies. While the design envisaged collecting all product from a single
southern Australian plant, the lower two categories, ungraded grass fed and manufacturing, were
not found within the initial kill despite grading and selection from over 500 head. Arrangements
were made to complete the product collection at a Northern plant 10 days later.
Striploins and cube rolls designated for the packaging project were drawn from the 9 grass and 9
grain fed carcases in the top three quality categories, a total of 54 head. All these were obtained at
the southern plant. A summary of principal carcase traits utilised within MSA prediction modelling is
shown in Table 2.
Table 2: Mean carcase traits, variance and range for the 54 carcases utilised in the packaging study
Table 3 lists the primal cuts collected from both sides of each carcase and the subsidiary muscles
available for study. While only striploins and cube rolls were utilised in this packaging study, results
can be linked within animal to other cuts which were utilised for different research projects. The
Projected Carcase Quality FEED No. Head
Premium MSA Quality Grain 9
Grass 9
High MSA Quality Grain 9
Grass 9
Base 3* MSA Quality Grain 9
Grass 9
Ungrade MSA Quality Grain 9
Grass 9
Manufacturing non MSA Quality Grass 18
Total 90 Packaging 54
Striploins and Cube
Rolls utilised in
packaging project
Carcass Traits MeanStandard
DeviationRange
Hot Carcass weight (kg) 371 61.1 262 – 526
Hump height (mm) 77 12.4 50 – 105
Marbling score 425 156.3 210 – 880
Ossification score 176 22.7 110 – 230
Rib fat (mm) 9 3.9 3 – 22
P8 (mm) 16 6.4 May-30
Meat colour score 2.2 1.1 0-4
Ultimate pH 5.52 0.08 5.39-5.67
Loin temperature (oC) 4.8 0.932 3.0 - 6.1

L.EQT.1813 – Quantifying the impact of Modified Atmospheric Packaging (MAP) and alternative packaging solutions on eating quality
Page 12 of 47
spinalis muscle from the 108 (54 x 2 per body) cube rolls used in the packaging study were sensory
tested in conjunction with the LD samples as a further direct linkage.
This stage of the project involved the selection of both grass and grain fed carcases after MSA
grading, with collection of multiple cuts during boning. A critical success factor was outstanding
plant cooperation and detailed communication prior to the collection date to determine working
procedures that could achieve the design requirements within commercial operations.
Table 3. Cuts collected from all carcase sides
3.1.1 Collection of Primals – Southern Australia 21st to 23rd October 2017
A summary of the plant operations from kill to cut collection is as follows:
1. The cooperating plant adjusted the kill on Friday October 20th to enable a wide supply of
cattle quality to meet the design specifications. Analysis of the previous two weeks kill
indicated that more very high quality, non-HGP grain fed might be required together with
manufacturing grade cattle. Both were actively sourced prior to the kill run. The full
requirement from each grade of cattle was sourced, except for 18 head of manufacturing
grade cattle and 9 head of grass fed ‘MSA ungraded’ cattle requiring a subsequent collection
of 27 head which was done at a northern plant on October 31st 2017. A Friday kill was
agreed together with weekend overtime labour for carcase grading and marshalling to
provide sufficient time for assessment and selection without delaying boning operations.
2. To enable full MSA grade data collection from non MSA eligible cattle, ossification was
measured on the slaughter floor for all cattle in the kill. MSA eligible bodies were recorded
through the terminal as normal however, non-MSA bodies were manually recorded on the
morning of Saturday the 21st.
On Saturday October 21st over 500 carcases anticipated to meet the numbers and range
required were graded by company graders between 4am and 8am and transferred to rails in
the boning room marshalling area. Carcase numbers, required by grade quality and feed
Primal HAM no. MSA Code Muscle
Short ribs 1691 INT037 M.intercostales externus and internus
RIB041 M.latissimus dorsi
RIB078 M.serratus ventralis thoracis
BRI056 M.pectoralis profundus
NEB 2340 BRI056 M.pectoralis profundus
PEB 2330 BRI057 M.pectoralis superficialis
Cuberoll 2243 CUB045 M.longissimus dorsi et thoracis
Striploin 2142 STR045 M.longissimus dorsi et lumorum
Eye Round 2040 EYE075 M.semitendinosus
Knuckle 2070 KNU066 M.rectus femoris
KNU098 M.vastus intermedius 2069
KNU099 M. vastus lateralis 2068
KNU100 M.vastus medialis
L.EQT.1813 – Quantifying the impact of Modified Atmospheric Packaging (MAP) and alternative packaging solutions on eating quality
Page 13 of 47
type, were as shown previously in Table 1. In essence there were 10 subsets of 9 carcases
with two manufacturing cow and 8 others representing grain and grass fed within the four
higher quality categories.
3. The grading data was extracted from the plant system and further compiled by research
personnel to enable assignment of carcases to the specified quality bands which differed
from the standard plant MSA Plant Boning Run (PBR) specifications. Carcases were then
selected to fit the design numbers per category and lists printed to target final carcase
selection and MSA assessment by Janine Lau, the senior MSA research grader.
4. Research personnel worked through the marshalled carcases using the list to select the
required number in each category. Slapsheets were applied post grading to prevent drying of
the eye muscle. A DNA sample was taken from all project carcases.
5. Nix colour measures and HunterLAB measurements were recorded on all selected carcases.
6. After selection, a large pre-prepared and numbered coloured tag was pinned with a 150mm
stainless steel skewer to the cube roll on each carcase side to clearly identify those required
for cut collection. Early on the morning of Sunday October 22nd plant personnel re-circulated
the 500 bodies and railed off the 63 selected for the research programs into three runs: MSA
Grainfed, MSA Grassfed and Non MSA Grassfed using the cube roll tag to identify required
bodies and a printed list to assign to the boning runs.
7. Additional tagging was then completed with 7 additional labels applied to each side: PE
Brisket, NE Brisket, Chuck Rib, Short Rib, Cube Roll, Striploin, Eye Round and Knuckle. The
eye round and knuckle tickets were pinned into the Topside face for transfer in the boning
room after the loin/butt saw. The NE brisket, PE Brisket and striploin tickets were pinned in
the relevant muscle at designated muscle positions to suit cutting lines. The chuck and short
rib tickets were applied during boning on Monday October 23rd after removal of the 6 rib
section early in the boning process. Both labels were pinned on a single pin to the bone-in 6
rib section immediately after they were removed from the carcase, with ID confirmed by
reference to the carcase CUD number on the cube roll ticket. The short ribs and chuck ribs
were left as a single piece to reduce complexity, with both tickets placed in the bag for
subsequent allocation during sample fabrication.
8. The tickets were in 5 colours with colour designating their destination and refrigeration
regime. The coding was:
PINK – Freeze and ship to TTU
YELLOW – Freeze and hold in Australia
GREEN – Maintain chilled and hold for retail packaging
BLUE – Maintain chilled and ship to TTU
RED – Maintain chilled and hold in Australia

L.EQT.1813 – Quantifying the impact of Modified Atmospheric Packaging (MAP) and alternative packaging solutions on eating quality
Page 14 of 47
Different cuts within each side had different coloured tickets other than the striploins and
cube rolls designated for the packaging project as shown in Figure 1.
Figure 1. Example of tickets for right and left sides
9. Objective measurements were taken on Sunday 22nd October as follows: Aaron Van Den
Heuvel, Xuemei Han and Katie Austin (UNE) took images with an Meat Imaging Japan (MIJ)
camera and a Frontmatic hyperspectral camera. Nick van den Berg and Jordon Kitschke took
measurements using an experimental Meat Eating Qualtiy (MEQ) Probe device. The MIJ and
frontmatic cameras imaged the cut grading surface only. The MEQ probe probed the loin,
eye round and knuckle cuts.
10. Due to the boning room layout and complexity of the collection 42 people were required to
assist with cut collection on Monday October 23rd. The plant provided 12 experienced staff
with the balance from MLA (3), TTU (2), UNE (5), CSU (14) and PPL (6). A safety and hygiene
practices briefing was conducted for non-plant personnel. A detailed task list was produced
in conjunction with boning room management to define where each person was to be
located and their specific task.
11. Actual boning room activity commenced at 6:00 am with the research collection to begin at
7:30. This provided time for all research team members to be shown their allocated position
and to observe the routine in that area. Each was instructed on the particular research
project duties at that position (applying rib tags, checking tag and pin security at key line
transition points, observing transfer of tags and pins during boning and slicing, removing
pins and placing labels in the vacuum bags with matching cuts, confirming all cuts in a carton
have common coloured tags etc). This occurred prior to 7:30 when the research collection
commenced. It was completed within an hour.
12. Staff positioned at each cut bagging station retrieved the metal skewers and placed the
laminated tags on the cut within the bag. The skewers were counted after the collection to
ensure none remained on plant.
Label Colours
Freeze TTU
Freeze Aust
Chilled TAFS
Chilled TTU
Chilled Aust

L.EQT.1813 – Quantifying the impact of Modified Atmospheric Packaging (MAP) and alternative packaging solutions on eating quality
Page 15 of 47
3.1.2 Product codes and transport
Trial specific product codes were assigned by the plant including designation and refrigeration
statements in addition to cut description. This controlled carton sorting and subsequent load out to
TTU, other Australian sites and for the cuts retained for the packaging study. As it was likely that
there would be partial cartons it was important to ensure in advance that the system would allow
these to be packed off.
After collection was completed, piece and carton counts were confirmed together with weights. A
critical check was that all cuts in any carton had the same label colour and that the piece counts
were correct.
All the packaging project cuts were confirmed and moved to chilled on plant storage for ageing prior
to retail fabrication.
3.2 Retail Packaging Experimental Design
The experimental design required the 4 packaging formats to be directly compared across balanced
muscle positions. This balance was important due to previous MSA research, which established
positional differences along the LD muscle with eating quality reducing from the anterior cube roll
portion to the posterior section of the striploin. Due to carcase ribbing at the 10/11 rib the length of
the cube roll (CUB045) and striploin (STR045) was similar and 3 positions, anterior (A), centre (C) and
posterior (P) were designated within each.
This provided for up to 6 LD derived samples to be prepared from each carcase side, a total of 12 per
body. In practice the extreme posterior of the LD is often flat and not ideal for steak preparation. To
reduce positional variation this “P” position was allocated to Link (non-core test samples served first
in the consumer testing) leaving 5 positions (CUB045 A, C, P and STR A and C) per side available for
the packaging treatments.
A single centre position was nominated for the spinalis (CUB081) muscle which was removed and
sensory tested in conjunction with the LD portions. The packaging comparisons were only made
within the LD, the CUB081 being prepared and packed under standard MSA grill protocols and
included in sensory evaluation to provide a high end quality anchor.
In addition, 5 ageing variations of 1, 3, 5, 7 and 9 days in the retail pack were required within each of
the packaging treatments. With the addition of 16 days primal ageing in vacuum this resulted in total
sample ageing of 17, 19, 21, 23 and 25 days and a total of 20 treatment variations (4 packaging
treatments by 5 ageing periods). By utilising 5 positions within each side, ageing the five pack ageing
periods of 1, 3, 5, 7 and 9 days were applied to all sides and enable 5 of the possible 10 ageing
comparisons within each carcase.
To reduce position by ageing interactions it was elected to pair ageing treatments within packaging
type across the two carcase sides so that, the left and right side CUB045 A positions for Body 1 were
both MAP packed with the left aged 19 days and the right 17 (example as shown in Table 4). This

L.EQT.1813 – Quantifying the impact of Modified Atmospheric Packaging (MAP) and alternative packaging solutions on eating quality
Page 16 of 47
arrangement enabled one ageing comparison within each packaging type (8 samples) to be
compared in every carcase plus an additional pair from one packaging treatment and two link
samples from the STR045 P positions to utilise the 12 available LD positions within each carcase.
Table 4 represents a portion of the Cut Up Developer (CUD) file, produced by MSA software, which
was utilised in trial design. It can be seen that the CUB081 samples were designated as GRL, the
standard MSA format, and the STR045 P positions all allocated to “LNK”. The paired packaging
treatment by ageing blocks were rotated along the designated 5 LD positions as illustrated by the 2
(of 9) bodies displayed in 3 (of 6) quality categories.
Table 4. Allocation of packaging and ageing treatments by muscle position.
The format of 2 ageing comparisons from each of the 4 pack types per body was firstly assigned
across a 5 body layout, as displayed in Table 5. As shown in Table 5, this resulted in a fully balanced
muscle position x packaging type by side allocation with a further unallocated pair available.
Group Body Cut Tment Daged Pos Side Group Body Cut Tment Daged Pos Side Group Body Cut Tment Daged Pos Side
504.1 8 CUB081 GRL 17 C L 504.3 26 CUB081 GRL 17 C L 504.5 44 CUB081 GRL 17 C L
504.1 8 CUB081 GRL 17 C R 504.3 26 CUB081 GRL 17 C R 504.5 44 CUB081 GRL 17 C R
504.1 9 CUB081 GRL 17 C L 504.3 27 CUB081 GRL 17 C L 504.5 45 CUB081 GRL 17 C L
504.1 9 CUB081 GRL 17 C R 504.3 27 CUB081 GRL 17 C R 504.5 45 CUB081 GRL 17 C R
504.1 1 CUB045 MAP 19 A L 504.3 19 CUB045 TRI 17 A L 504.5 37 CUB045 VSP 25 A L
504.1 1 CUB045 VSP 21 C L 504.3 19 CUB045 NIT 21 C L 504.5 37 CUB045 NIT 19 C L
504.1 1 CUB045 TRI 17 P L 504.3 19 CUB045 VSP 25 P L 504.5 37 CUB045 MAP 21 P L
504.1 1 CUB045 MAP 17 A R 504.3 19 CUB045 TRI 23 A R 504.5 37 CUB045 VSP 21 A R
504.1 1 CUB045 VSP 23 C R 504.3 19 CUB045 NIT 17 C R 504.5 37 CUB045 NIT 17 C R
504.1 1 CUB045 TRI 25 P R 504.3 19 CUB045 VSP 19 P R 504.5 37 CUB045 MAP 23 P R
504.1 2 CUB045 VSP 21 A L 504.3 20 CUB045 MAP 19 A L 504.5 38 CUB045 TRI 17 A L
504.1 2 CUB045 VSP 25 C L 504.3 20 CUB045 MAP 21 C L 504.5 38 CUB045 NIT 21 C L
504.1 2 CUB045 MAP 23 P L 504.3 20 CUB045 TRI 17 P L 504.5 38 CUB045 VSP 25 P L
504.1 2 CUB045 VSP 17 A R 504.3 20 CUB045 MAP 17 A R 504.5 38 CUB045 TRI 23 A R
504.1 2 CUB045 VSP 19 C R 504.3 20 CUB045 MAP 23 C R 504.5 38 CUB045 NIT 17 C R
504.1 1 STR045 VSP 23 A L 504.3 19 STR045 NIT 23 A L 504.5 37 STR045 NIT 17 A L
504.1 1 STR045 NIT 25 C L 504.3 19 STR045 MAP 19 C L 504.5 37 STR045 TRI 23 C L
504.1 1 STR045 LNK 17 P L 504.3 19 STR045 LNK 17 P L 504.5 37 STR045 LNK 17 P L
504.1 1 STR045 VSP 19 A R 504.3 19 STR045 NIT 25 A R 504.5 37 STR045 NIT 25 A R
504.1 1 STR045 NIT 21 C R 504.3 19 STR045 MAP 21 C R 504.5 37 STR045 TRI 19 C R
504.1 1 STR045 LNK 17 P R 504.3 19 STR045 LNK 17 P R 504.5 37 STR045 LNK 17 P R
504.1 2 STR045 TRI 19 A L 504.3 20 STR045 VSP 23 A L 504.5 38 STR045 MAP 23 A L
504.1 2 STR045 NIT 17 C L 504.3 20 STR045 NIT 25 C L 504.5 38 STR045 MAP 19 C L
504.1 2 STR045 LNK 17 P L 504.3 20 STR045 LNK 17 P L 504.5 38 STR045 LNK 17 P L
504.1 2 STR045 TRI 21 A R 504.3 20 STR045 VSP 19 A R 504.5 38 STR045 MAP 25 A R
504.1 2 STR045 NIT 23 C R 504.3 20 STR045 NIT 21 C R 504.5 38 STR045 MAP 21 C R
504.1 2 STR045 LNK 17 P R 504.3 20 STR045 LNK 17 P R 504.5 38 STR045 LNK 17 P R

L.EQT.1813 – Quantifying the impact of Modified Atmospheric Packaging (MAP) and alternative packaging solutions on eating quality
Page 17 of 47
Table 5. Rotation of ageing by treatment pairs across carcases
The unallocated positions in Table 5, represented in Table 4 by dark red cell borders, were then filled
by rotating the packaging treatments with ageing pairs as against the empty cells in Table 5. This
resulted in each ageing comparison being represented once across each pair of bodies as read
vertically. When repeated on a second body, the lower half of table 5, each packaging treatment was
repeated twice and each ageing comparison (1:3, 1:5, 1:7, 1:9, 2:3, 2:5, 2:7, 2:9, 3:5, 3:7, 3:9, 5:7,
5:9, 7:9) included once in each position as read to the right.
When extended this produced 540 retail tray samples (10 samples x 54 bodies of 3 quality
categories) subdivided into 108 trays for each days ageing, 27 per packaging treatment.
This design was consequently implemented utilising the MSA CUD software and supplementary
processes.
3.2.1 Fabrication and Retail Packing – 5th November 2017
Fabrication of the vacuum packed striploins and cube rolls was conducted on Sunday November 5th,
2017 in a commercial large scale retail fabrication facility that produced retail product in VSP and
MAP formats for major supermarket groups. The cuts had been aged 16 days in vacuum packaging at
this point.
The facility operates on a two shift-6 day per week production schedule and was made available on a
Sunday to enable the research activity to be conducted without disrupting normal operations or
compromising research requirements. The plant also provided staff to assist in processing the cuts
and operating the packaging equipment in addition to supplying packaging consumables including
gas mixes.
The outstanding cooperation and valuable technical input from the plant management and staff is
acknowledged and greatly appreciated.
The process adopted was as follows:
1. Each primal was removed from vacuum packaging at a common processing room entry point
and placed on a plastic tray together with the cut identification label put in the bag during
cut collection at boning.
Body POS L R PACK Body POS L R PACK Body POS L R PACK Body POS L R PACK Body POS L R PACK
1 CA 3 1 MAP 3 CA 5 7 TRI 5 CA 1 9 NIT 7 CA 7 3 9 CA 9 5 VSP
CC 5 7 CC 1 9 VSP CC 7 3 MAP CC 9 5 TRI CC 3 1 NIT
CP 1 9 TRI CP 7 3 NIT CP 9 5 CP 3 1 VSP CP 5 7 MAP
SA 7 3 VSP SA 9 5 MAP SA 3 1 TRI SA 5 7 NIT SA 1 9
SC 9 5 NIT SC 3 1 SC 5 7 VSP SC 1 9 MAP SC 7 3 TRI
SP LINK LINK SP LINK LINK SP LINK LINK SP LINK LINK SP LINK LINK
2 CA 5 1 VSP 4 CA 9 3 MAP 6 CA 7 9 NIT 8 CA 3 5 10 CA 1 7 TRI
CC 9 3 CC 7 9 TRI CC 3 5 VSP CC 1 7 MAP CC 5 1 NIT
CP 7 9 MAP CP 3 5 NIT CP 1 7 CP 5 1 TRI CP 9 3 VSP
SA 3 5 TRI SA 1 7 VSP SA 5 1 MAP SA 9 3 NIT SA 7 9
SC 1 7 NIT SC 5 1 SC 9 3 TRI SC 7 9 VSP SC 3 5 MAP
SP LINK LINK SP LINK LINK SP LINK LINK SP LINK LINK SP LINK LINK
Days aged counts Days aged counts Days aged counts Days aged counts Days aged counts
1 2 2 1 2 2 1 2 2 1 2 2 1 2 2
3 2 2 3 2 2 3 2 2 3 2 2 3 2 2
5 2 2 5 2 2 5 2 2 5 2 2 5 2 2
7 2 2 7 2 2 7 2 2 7 2 2 7 2 2
9 2 2 9 2 2 9 2 2 9 2 2 9 2 2
AGEING AGEING AGEING AGEING AGEING
L.EQT.1813 – Quantifying the impact of Modified Atmospheric Packaging (MAP) and alternative packaging solutions on eating quality
Page 18 of 47
2. A pH reading was recorded for each cut with the measurement taken at the quartering point
end to align with the grading site and provide an ultimate pH for comparison.
3. The tray was passed to one of several preparation stations manned by company butchers
who were instructed in MSA preparation protocols. Each striploin was denuded removing all
fat and silverskin and reduced to the LD muscle by removing the multifidi and portion of
rump from the posterior end.
4. The cube roll was denuded and the spinalis muscle removed after which further connective
tissue and surface fat were trimmed to leave the LD and Spinalis (M.spinalis doris) as
separated and denuded muscles.
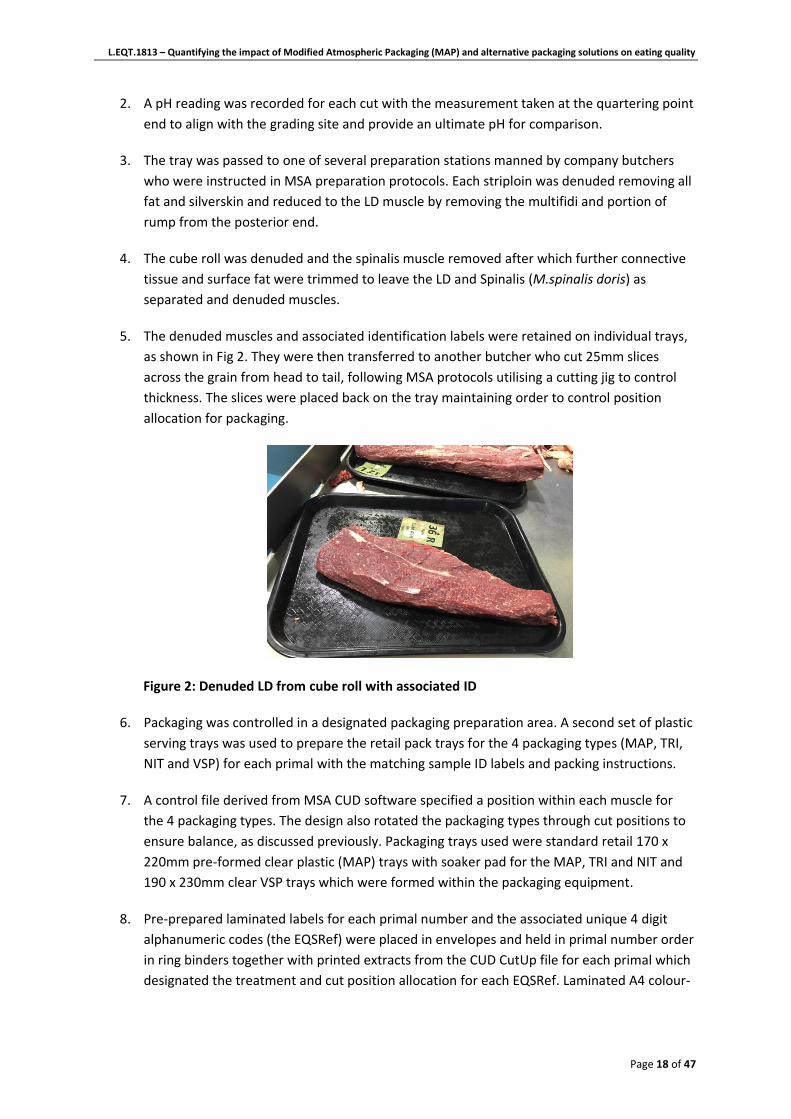
5. The denuded muscles and associated identification labels were retained on individual trays,
as shown in Fig 2. They were then transferred to another butcher who cut 25mm slices
across the grain from head to tail, following MSA protocols utilising a cutting jig to control
thickness. The slices were placed back on the tray maintaining order to control position
allocation for packaging.
Figure 2: Denuded LD from cube roll with associated ID
6. Packaging was controlled in a designated packaging preparation area. A second set of plastic
serving trays was used to prepare the retail pack trays for the 4 packaging types (MAP, TRI,
NIT and VSP) for each primal with the matching sample ID labels and packing instructions.
7. A control file derived from MSA CUD software specified a position within each muscle for
the 4 packaging types. The design also rotated the packaging types through cut positions to
ensure balance, as discussed previously. Packaging trays used were standard retail 170 x
220mm pre-formed clear plastic (MAP) trays with soaker pad for the MAP, TRI and NIT and
190 x 230mm clear VSP trays which were formed within the packaging equipment.
8. Pre-prepared laminated labels for each primal number and the associated unique 4 digit
alphanumeric codes (the EQSRef) were placed in envelopes and held in primal number order
in ring binders together with printed extracts from the CUD CutUp file for each primal which
designated the treatment and cut position allocation for each EQSRef. Laminated A4 colour-

L.EQT.1813 – Quantifying the impact of Modified Atmospheric Packaging (MAP) and alternative packaging solutions on eating quality
Page 19 of 47
coded packing indicators displaying MAP, TRI, NIT and VSP were also prepared as shown in
Fig 3.
Figure 3: Pre-packed envelopes with laminated labels as per CUD
9. As a tray with the sliced primal was moved to the packaging area the Primal number was
located, the duplicate primal label transferred from the envelope to a new plastic tray and
the treatment for each cut position referenced from the CutUp extract. The A4 laminated
pack type designators were then placed in the allocated position order on the plastic tray
and the appropriate empty packaging trays placed over them with soaker pads (temporary
blank trays were used to hold the VSP allocated slices prior to their transfer to the packaging
machine).
10. The laminated EQSRef ID labels were then taken from the envelope labelled with
corresponding primal number and placed in the allocated empty retail trays, this again being
referenced from the CutUp extract. A coloured dot to indicate the correct ageing period
prior to visual and sensory testing (1,3,5,7, or 9 days) was placed on the side of the retail
tray. An additional laminated label was placed on a VSP base for Links or CUB081 and a
sticky label for micro applied to sample tubes.
11. The packaging tray was then transferred to the cutting station and aligned with the sliced
primal and the ID cross-checked. Five slices from the primal were then placed in the retail
trays with the slice order aligned with the tray positions to maintain the allocated cut
position. The slices were placed to achieve a typical retail pack appearance and the
laminated EQSRef label placed in a designated corner of the pack as shown in Fig 4. The LINK
product and spinalis (CUB081) were packed on VSP and sent directly to the VSP packing line
for packing.

L.EQT.1813 – Quantifying the impact of Modified Atmospheric Packaging (MAP) and alternative packaging solutions on eating quality
Page 20 of 47
Figure 4: Placement into retail packs showing 4 treatment types
12. The tray with the filled retail packs was then transferred to a colour recording station and all
samples bloomed for 20 minutes. A MSA independent grader was utilised to view each retail
tray and assign an AUS-MEAT meat colour score. Recordings for each tray were also made
with HunterLab and NIX instruments as shown in Fig 5.
Figure 5: Recording colour, HunterLab and NIX readings
13. Immediately following the colour analysis, HunterLab and NIX readings the trays were taken
to the relevant retail packing line where they were processed according to standard practice.
A dedicated Multivac™ line was utilised for each packaging treatment with gas analysis taken
at hourly intervals.

L.EQT.1813 – Quantifying the impact of Modified Atmospheric Packaging (MAP) and alternative packaging solutions on eating quality
Page 21 of 47
Packaging material specifications may be seen in Appendix 10.1
14. The coloured dot on the side of the retail packing trays denoted the ageing period allowing
collating at the end of the packing line. MAP, NIT, TRI and VSP packs were mixed in each of
the 5 ageing groups. Packed samples were then transferred to chilled storage in their ageing
groups of 1, 3, 5, 7 and 9 days at which time they were transferred in refrigerated transport
to the retail viewing cabinet at Charles Sturt University.
3.3 Retail cabinet display at Charles Sturt University (CSU)
A commercial chilled retail display cabinet was utilised at Charles Sturt University for evaluation. The
cabinet utilised a three deck display and well and was of a type widely used by Australian retailers.
The number of packs able to be displayed was constrained by the shelf dimensions with 144 packs
the maximum. As there were a total of 540 packs, 108 per display day allocation, it was not possible
to have all packs on display at all times. To enable a consistent full cabinet for evaluation the design
shown in Table 6 was adopted.
This dictated that the 108 packs designated for a particular day were interspersed with a constant
36, 9 per packaging type, from the 9 day samples. On day 9 only 108, the entire 9 day cohort were
displayed.

L.EQT.1813 – Quantifying the impact of Modified Atmospheric Packaging (MAP) and alternative packaging solutions on eating quality
Page 22 of 47
Table 6: Number of steak packs displayed by treatment and days post retail packing
To balance out potential case position and adjacent packaging type effects each packaging
treatment was allocated within an 8 x 8 Latin square design with two of each packaging type, one
grass fed and one grain fed, within each “set” of 8 and the relative order of each type rotated
according to rows within the Latin square. The three quality levels of product within grass and grain
were also evenly distributed across the Latin Square rows and order. A final “set” of 4 packs, one per
treatment, was created to allocate all samples and enable a full cabinet display on days 1 to 7. The
Latin square rows or “sets” were further rotated within shelf (Top to well) and shelf position (front,
back, right and left and centre for the well only).
An example of a “set”, representing one of 8 Latin Square rows used to determine pack order on the
cabinet shelf is displayed in Table 7.
TREATMENT 1 3 5 7 9 Total
MAP-1 27 27
MAP-3 27 27
MAP-5 27 27
MAP-7 27 27
MAP-9 9 9 9 9 27 27*
TRI-1 27 27
TRI-3 27 27
TRI-5 27 27
TRI-7 27 27
TRI-9 9 9 9 9 27 27*
NIT-1 27 27
NIT-3 27 27
NIT-5 27 27
NIT-7 27 27
NIT-9 9 9 9 9 27 27*
VSP-1 27 27
VSP-3 27 27
VSP-5 27 27
VSP-7 27 27
VSP-9 9 9 9 9 27 27*
TOTAL 144 144 144 144 108 540*
Consumers 90 90 90 90 68 428
* Adjusted to actual total packs
DAYS IN RETAIL PACKAGING

L.EQT.1813 – Quantifying the impact of Modified Atmospheric Packaging (MAP) and alternative packaging solutions on eating quality
Page 23 of 47
Table 7: Example of allocation pack quality, display order and cabinet position for an example set
The GROUP indicates the product eating quality category and whether from grass or grain fed
carcases linked to a CUD design number, plant body number and Primal ID from which the sample
was fabricated. The source cut, cooking method and days aged from slaughter (with the first 16 days
as a vacuum packed primal) to the date of display are shown to the right. The unique pack ID for
each pack is the EQSRef with the order of display and cabinet position 3D assigning the 8 packs to
the front of the third cabinet shelf, right hand side in the designated 1 to 8 order (See figure 6 for
shelf designation coding).
The description “BLUE, THIRD shelf, FRONT row, RIGHT side” and the EQSRef was reproduced
utilising an R software routine on the 10 related consumer scoring forms to guide the consumers to
the 8 trays for assessment with “BLUE” indicating a blue label attached to the starting shelf position
(See cabinet in Fig 7).
The 36 packs allocated to display across the entire period were maintained in a fixed cabinet
position as a reference point across each display period. All packs not on display were held in a CSU
chiller at approximately 3˚C.
Individual case layouts were produced for each viewing day (1, 3, 5, 7 and 9 days from packing) with
the 108 of the applicable day packs and 33% (36 packs) of the 9 day treatment displayed for
consumer evaluation. A typical cabinet plan allocating each EQSRef to a specific position within its’
set and shelf position is shown in Fig 6 with the constant 9 day samples shaded blue.
GROUP CUD No BODY No Primal EQS Set No Order Cab Pos Description Cut Cook
Ag
e
Premium GRAIN 9 824 55128 P1N6 18 1 3DBLUE. THIRD shelf. FRONT row. RIGHT side.
CUB045 VSP 25
Classic GRAIN 19 559 55171 R9Q9 18 2 3DBLUE. THIRD shelf. FRONT row. RIGHT side.
STR045 NIT 25
Premium grass 18 149 55167 A5X0 18 3 3DBLUE. THIRD shelf. FRONT row. RIGHT side.
STR045 VSP 25
Premium GRAIN 9 824 55131 R9F6 18 4 3DBLUE. THIRD shelf. FRONT row. RIGHT side.
STR045 TRI 25
Classic grass 30 208 55214 R3Z0 18 5 3DBLUE. THIRD shelf. FRONT row. RIGHT side.
CUB045 MAP 25
Classic GRAIN 19 559 55168 F8P8 18 6 3DBLUE. THIRD shelf. FRONT row. RIGHT side.
CUB045 VSP 25
Premium grass 18 149 55164 W2J9 18 7 3DBLUE. THIRD shelf. FRONT row. RIGHT side.
CUB045 VSP 25
Classic grass 30 208 55212 R6Z2 18 8 3DBLUE. THIRD shelf. FRONT row. RIGHT side.
CUB045 MAP 25

L.EQT.1813 – Quantifying the impact of Modified Atmospheric Packaging (MAP) and alternative packaging solutions on eating quality
Page 24 of 47
Figure 6: Cabinet Plan for Day 1 retail viewing display
After viewing, the 108 packs for that day were removed for colour measurement and converting to
consumer sensory samples then frozen with the 9 day packs remaining in the cabinet.
Each consumer visually evaluated 3 sets of 8 packs. Ten consumers evaluated each pack utilising the
same scoring system as used in the original packaging study. The cabinet and associated layout is
shown in Fig7.
Figure 7: Retail display cabinet. Note mix of packaging treatments and coloured locator flags
CABINET LAYOUT FOR CSU COLOUR TRIAL - DAY 1 - MONDAY Nov 6th, 2017 MINCE CABINET
TOP SHELF TOP SHELF
F9D9 M4T2 F1H4 Z8K9 W6X0 H9K2 M6V9 Y7S3 L4Q8 W8A8 Y5B2 C8V2 Y6W1 Y0R9 N0J3 X6V0 V0E0 E5U2 S4J2 V3H1 G4M0
1A Set 10 Set 10 Set 10 Set 10 Set 10 Set 10 Set 10 Set 10 Set 3 Set 3 Set 3 Set 3 Set 3 Set 3 Set 3 Set 3 1C 1A Set 20 Set 20 Set 20 Set 20 Set 19 5E
1 2 3 4 5 6 7 8 1 2 3 4 5 6 7 8 1 2 3 4 1
S0F8 S2A1 N5Z8 Q3S8 N0D7 C4A3 S6G0 Z5H9 M8Q8 Z1U2 X3B3 S3T2 F9Y7 E6D1 Z6K4 N7B4 A9A7 U0R8 C4E1 N8F1 T0J8
1B Set 15 Set 15 Set 15 Set 15 Set 15 Set 15 Set 15 Set 15 Set 8 Set 8 Set 8 Set 8 Set 8 Set 8 Set 8 Set 8 1D 1B Set 22 Set 22 Set 22 Set 22 Set 19 5E
1 2 3 4 5 6 7 8 1 2 3 4 5 6 7 8 1 2 3 4 2
WHITE with BLUE dots GREEN RED WHITE Label
F5D2 W4T2 P1S7 G9L2 R7D5 B6K6 J0X5 S9A8 N7J8 Z3Z3 F4Z6 P2X8 D1V8 W5B7 M3F6 P8B3 K4P3 X2A3 R4B0 N2J8 G4M7
2A Set 1 Set 1 Set 1 Set 1 Set 1 Set 1 Set 1 Set 1 Set 17 Set 17 Set 17 Set 17 Set 17 Set 17 Set 17 Set 17 2C 2A Set 22 Set 22 Set 22 Set 22 Set 19 5E
1 2 3 4 5 6 7 8 1 2 3 4 5 6 7 8 5 6 7 8 3
L0T0 D1F5 Q0F3 R4F1 F3E6 S9J1 H9D3 Z3Z6 D1S1 Q9N1 N3J5 V5N2 T2P1 E0R5 T3V0 G5V6 W2T3 K1G0 P7J8 Z7A2 P7S6
2B Set 6 Set 6 Set 6 Set 6 Set 6 Set 6 Set 6 Set 6 Set 12 Set 12 Set 12 Set 12 Set 12 Set 12 Set 12 Set 12 2D 2B Set 23 Set 23 Set 23 Set 23 Set 19 5E
1 2 3 4 5 6 7 8 1 2 3 4 5 6 7 8 1 2 3 4 4
RED WHITE BLUE WHITE Label
THIRD SHELF THIRD SHELF
A5A2 C9W6 M2P3 A5T2 Y5V1 M6M7 L1C6 D2G3 E1T6 J2P2 U5P6 S9G6 T9G9 Y2A7 U3D1 Q0Q7 V0R4 R9F7 D3M8 Q9H9 D9R6
3A Set 14 Set 14 Set 14 Set 14 Set 14 Set 14 Set 14 Set 14 Set 9 Set 9 Set 9 Set 9 Set 9 Set 9 Set 9 Set 9 3C 3A Set 21 Set 21 Set 21 Set 21 Set 19 5E
1 2 3 4 5 6 7 8 1 2 3 4 5 6 7 8 1 2 3 4 5
M7M6 J0R5 M9S6 D0F0 T9R7 R5E5 V1B0 C5G0 P1N6 R9Q9 A5X0 R9F6 R3Z0 F8P8 W2J9 R6Z2 W2V3 S3Y0 D9W4 T1U9 V0C4
3B Set 7 Set 7 Set 7 Set 7 Set 7 Set 7 Set 7 Set 7 Set 18 Set 18 Set 18 Set 18 Set 18 Set 18 Set 18 Set 18 3D 3B Set 23 Set 23 Set 23 Set 23 Set 19 5E
1 2 3 4 5 6 7 8 1 2 3 4 5 6 7 8 5 6 7 8 6
GREEN with ORANGE dots BLUE GREEN WHITE Label
BOTTOM SHELF BOTTOM SHELF
V6C2 P0T6 F9N8 R5G7 F9J9 Y0B0 S6Y4 L8W3 E6P0 C9B3 R9D2 Q8N7 C7K9 K5Y7 D0D5 R9T5 K5W2 K3E9 T1L1 M7G3
4A Set 11 11 11 11 11 11 11 11 Set 4 Set 4 Set 4 Set 4 Set 4 Set 4 Set 4 Set 4 4D 4A Set 20 Set 20 Set 20 Set 20 5E
1 2 3 4 5 6 7 8 1 2 3 4 5 6 7 8 5 6 7 8
V3F5 D6S7 E7Y8 L5T4 L2C3 E8P6 E0B6 R1R9 A0G3 F4U5 P2M7 Y6D1 V7Y7 C8S9 U3Q8 W6S2 R2P9 Z2C9 N8U9 N7P8 B4V4
4B Set 16 Set 16 Set 16 Set 16 Set 16 Set 16 Set 16 Set 16 Set 13 Set 13 Set 13 Set 13 Set 13 Set 13 Set 13 Set 13 4E 4B Set 21 Set 21 Set 21 Set 21 Set 19 5E
1 2 3 4 5 6 7 8 1 2 3 4 5 6 7 8 5 6 7 8 7
W9R4 M7U1 U9T2 R7X5 Q4H9 X2U9 Z6D3 D0U4 W1F7 T2D5 R7A0 G6Q6 S7A2 Y4P1 U0D4 F7C1 X0J4 J0E4 A6A9 L8H8 J5H0
4C Set 2 Set 2 Set 2 Set 2 Set 2 Set 2 Set 2 Set 2 Set 5 Set 5 Set 5 Set 5 Set 5 Set 5 Set 5 Set 5 4F 4C 24 24 24 24 Set 19 5E
1 2 3 4 5 6 7 8 1 2 3 4 5 6 7 8 1 2 3 4 8
YELLOW WHITE with PINK dots YELLOW WHITE Label
SECOND SHELF SECOND SHELF

L.EQT.1813 – Quantifying the impact of Modified Atmospheric Packaging (MAP) and alternative packaging solutions on eating quality
Page 25 of 47
3.4 Consumer assessment of visual pack appeal
In accordance with the experimental design each pack was viewed for visual assessment by 10
consumers with each consumer required to assess 24 packs being 3 sets of 8 from the 144 steak
packs on display. This required up to 81 consumers to view the cabinet for each viewing day/ageing
cycle, a total of 356 for the entire experiment resulting in 8,544 pack observations.
Consumer recruitment was conducted by Charles Sturt University primarily via fundraising with
community groups supported by the individual panellists. Where no affiliation was noted a movie
pass was offered to the individual. Viewing times were scheduled across the day in 15 minute blocks
between 8am and 8pm.
On arrival each consumer was briefed in regard to the scoring procedure and given a clipboard with
one sheet of demographic questions as shown in the appendix followed by 2 pages, each relating to
an assigned set of 8 retail packs identified by EQSRef number and display order within the relevant
set of 8. Each set was preceded by an instruction defining the cabinet position such as “Blue Label,
top shelf, back row” to assist in accurate location of the first sample.
The demographic and visual CMC scoring sheet is presented in Appendix 10.2.
Each sample was scored via a 100mm line scale anchored by the words extremely unappealing and
extremely appealing. For each sample the consumer was also asked to choose one of three category
boxes described as definitely would buy, definitely would buy if discounted and definitely would not
buy. An example scoring sheet is shown in the appendix. The sample order on each sheet reflected
the pack order in the case from left to right with the EQSRef pre-printed in the ID box.
The consumer was accompanied to the cabinet and assisted in locating the first starting position to
ensure the instruction was understood. Figure 7 displays the cabinet and typical layout.
All consumer scores were measured twice and the data entered independently by two separate
teams at different locations. Any result where the two scores differed by more than 2 (mm) was
resolved by re-checking the original sheet. A zero tolerance was applied to the 3 category boxes.
The consumer response files combined with source files detailing linkage of the EQSRefs to the
packaging system, source muscle and carcase including MSA grading data and to the days aged in
vacuum packaging prior to retail packing were forwarded to Dr Ray Watson and Dr Garth Tarr
accompanied by an analysis brief. All original questionnaires were filed and retained for reference.
On completion of each viewing session (days 1,3,5,7 and 9) CSU processed all samples for the final
colour measurement and fabrication to MSA sensory samples.

L.EQT.1813 – Quantifying the impact of Modified Atmospheric Packaging (MAP) and alternative packaging solutions on eating quality
Page 26 of 47
3.5 Preparation of MSA consumer samples and data recording post retail
display.
On the completion of viewing for each ageing group, CSU and MSA research staff removed the
sample trays from the display cabinet and transferred to an adjacent work area where they were
progressively opened and allowed to bloom for a minimum of 20 minutes. At this point a colour
assessment using AUS-MEAT meat colour chips was completed by the same MSA grader who
assessed colour at cut up. A HunterLab reading was also recorded for each tray.
The retail display samples were then fabricated into MSA grill sensory steaks following MSA
protocol (Watson et al., 2008). In brief this required fabrication of 5 steaks 25mm thick and
approximately 50 x 38mm or equivalent area with each wrapped in freezer wrap prior to vacuum
packing as a set of 5 and freezing down on the day of removal from the retail display cabinet. Each
set of consumer sensory steaks were identified by attaching an Avery label incorporating the EQSRef
(produced from the source CUD file) to the vacuum bag during transfer from the retail tray and
fabrication. This label replaced the laminated EQSRef label placed in each retail pack on November
5th in preparation for retail observation.
3.6 MSA consumer testing
MSA sensory testing by untrained consumers was conducted on all 540 retail pack grill samples to
evaluate differences between the 4 packaging treatments and 5 ageing periods which were rotated
and balanced across ten M.longissimus dorsi (cube roll and striploin) positions. The product was
tested within 19 groups of 60 Melbourne consumers (each group of 60 comprising a pick) with
linkage to other trials through some picks having product from two or more experiments included.
All consumer testing was conducted in the greater Melbourne area by Tastepoint Pty Ltd.
3.6.1 Pick design
The individual “picks” each allocated 42 samples across 60 consumers, tested in three groups of 20
per session. All consumers received a “link” sample as the first of 7 samples with this product
sourced from the collected striploins posterior position and predicted to be of mid range eating
quality. The allocation of samples followed MSA protocols (Watson et al., 2008b) which in brief
allocate six test samples, each from a separate product, according to a 6x6 Latin square that ensures
each product is served an equal number of times in each serving order and equally before and after
the other 5 products to balance potential halo or serving order effects. The samples were allocated
to product groupings by packaging treatment and ageing days to ensure each consumer received a
wide quality range. Many picks utilised the M.spinalis dorsi removed from the trial cube rolls as a
high end anchor with further linkage to other MSA data through inclusion of selected product from
other projects in further picks.
L.EQT.1813 – Quantifying the impact of Modified Atmospheric Packaging (MAP) and alternative packaging solutions on eating quality
Page 27 of 47
3.6.2 Consumer recruitment
Consumer recruitment for sensory testing of cooked product was managed by Tastepoint who
utilised community groups for recruitment with the community organisation/group paid for
participation rather than individual consumers.
Consumers were screened and selected on the following criteria:
Aged between 18 and 70
Regular consumers of red meat, at least once per fortnight
Prefer beef cooked to medium doneness
3.6.3 Cooking, serving and data protocols
MSA grill cooking and serving protocols were utilised for all sensory testing as described by Watson
et.al, 2008a. In brief a 3 phase Silex (STronic 165) double sided grill was utilised with all cooking
procedures regulated by count up timers. A first round of scrap meat was cooked to stabilise plate
temperature recovery with the link and six sample rounds following at designated intervals. The
round sheets were aligned beside the grill and steaks transferred onto the grill and after cooking to a
cutting board for serving in a strict 3-4-3 left to right, top to bottom sequence to ensure ID was
maintained.
10 steaks, approximately 50mm x 38mm by 25mm thick were cooked within each of the seven
rounds, rested for 2 minutes after removal from the grill then halved with each served to 2
consumers. The ID on the consumer plates was further checked against the empty round sheet
codes during cutting and serving. Allocation of steaks to rounds and to consumer ID was controlled
by software in accordance with the design criteria described previously.
After an initial briefing each consumer completed a number of demographic questions followed by
an individual scoring sheet for each of the 7 samples. Each sample was identified only by the 4 digit
alphanumeric EQSref code and related Q code. The sample score sheets included four 100mm line
scales for each of tenderness, juiciness, flavour and overall liking followed by four category boxes
labelled as unsatisfactory, good everyday quality, better than everyday quality and premium quality.
The tenderness scale was anchored with the words not tender and very tender, the juiciness scale
with not juicy and very juicy and the flavour and overall liking scales with dislike extremely and like
extremely. Consumers were instructed to make a vertical line across each scale at a point that
reflected their judgement for each sample. They were also asked to mark one of the four category
boxes.
The consumer demographic and sample scoring sheets are shown in Appendix 10.3 and 10.4.
Following serving and evaluation of the 7 samples each consumer was asked to mark a further line
scale graduated in $10 increments from $0 to $80/kg representing the $/kg value they ascribed to
each of the category boxes.

L.EQT.1813 – Quantifying the impact of Modified Atmospheric Packaging (MAP) and alternative packaging solutions on eating quality
Page 28 of 47
Each sheet was checked after completion by serving staff and scanned twice by the contractor with
software that displayed the sheet and scores on screen while highlighting any score differences
between scans. The mm to the consumer mark from the left end of the linescale was recorded as a
score between 0 and 100. Each sheet required manual acceptance before writing to a sensory data
file. The completed file for each pick (420 rows of data) was then emailed to the research manager
who utilised further software to calculate both 10 consumer averages for each line scale and
category score and a clipped score that removed the two highest and two lowest scores and
averaged the remaining central six.
In addition a raw and clipped MQ4 score was calculated by multiplying the tenderness, flavour and
overall scores by 0.3 and the juiciness scores by 0.1 before summing the results. The output was
visually checked and raw product means calculated prior to uploading the sensory summary for each
sample (a single row with the 10 consumer averages and clipped scores) to the AUSBlue database
where the sensory data was matched to the record of animal, carcase, grading, ageing and packaging
detail.
Examples of the demographic, scoring sample and WTP (willingness to pay) sheets are presented in
Appendices.
The collated AUSBlue data was forwarded to Dr Garth Tarr, Dr Ray Watson and Professor John
Thompson for independent analysis.
4 Statistical Analysis
Independent statistical analysis was conducted by Dr Ray Watson, Dr Garth Tarr and Professor John
Thompson and presented to the MSA Pathways Committee for review.
Dr Tarr utilised the R statistical package (R Core Team, 2019) for primary analysis including linear
mixed models using the lme4 package (Bates et al., 2015) and posthoc analysis using the emmeans
package (Lenth, 2019). The ggplot2 package was used to generate all visualisations (Wickham,
2016). Days in retail packaging were tested as both a categorical and continuous variable.
Professor Thompson conducted analysis using a mixed model (SAS, 2002) which examined the effect
of position within the m. longissimus muscle, treatment and days in the retail pack before samples
were taken out of the packs frozen for subsequent sensory analysis. There were a total of 54
carcases used in this experiment. A random term for carcass number was included in the analysis.
The random term accounts for animal specific variation embedded in the experimental design. First
order interactions between position within muscle, treatment and days in the retail pack were
tested. These were all found to be non significant (P>0.05) and were not included in the final
models.
The interaction between treatment and time in the retail pack was not significant (P>0.05) indicating
that the difference between retail pack treatments did not alter when held in the retail packs for 1,

L.EQT.1813 – Quantifying the impact of Modified Atmospheric Packaging (MAP) and alternative packaging solutions on eating quality
Page 29 of 47
3, 5,7 and 9 days before subsequently processing for sensory evaluation. Any effect on eating quality
was immediate (i.e. present at day 1) for all packaging methods.
5 Results
The results for each aspect of the project were definitive in regard to both visual and sensory
evaluation when cooked. The primary comparison of MAP and VSP also aligned with the prior
P.PIP.0488 outcomes with close to identical boundaries for consumer colour score thresholds.
Differences between 80:20 high oxygen MAP and VSP were marginally lower than in the earlier
study but did not differ statistically. The negative MAP deduction was statistically significant from
day 1 after retail packing with a trend to increase over time to day 9 due to deterioration in MAP and
TRI scores. The previous study only evaluated sensory at 9 days.
5.1 Visual appraisal of packaging in retail display case
The consumer meat colour (CMC) score statistic developed and utilised in P.PIP.0488 was again used
to record consumer ratings of visual appeal and to define cut-off points that effectively assigned
retail packaged product to “would definitely buy”, “would definitely buy if discounted” or “would
definitely not buy” categories. There were clear and significant differences between the packaging
treatments as displayed in Figure 8.
Figure 8: Distribution of Consumer Meat Colour (CMC) score by packaging type
Clearly both the MAP and TRI packaging with 80% and 30% oxygen respectively provided a superior
CMC value whereas NIT packaging was scored substantially lower and VSP intermediate. Results of a

L.EQT.1813 – Quantifying the impact of Modified Atmospheric Packaging (MAP) and alternative packaging solutions on eating quality
Page 30 of 47
linear mixed model by REML of CMC related to pack and days in pack produced contrast values
displayed in Table 7.
Table 7: Contrast estimates and standard error for CMC and Packaging Types
When examined at a more detailed cut and position level as demonstrated by Fig 9 it is clear that the
packaging effects are relatively uniform across cuts and position within cut. Analysis indicated
significance (P<0.001) for packaging type and the interaction of packaging type and days in pack.
Figure 10: Distribution of CMC scores by cut position within packaging type
These contrasts are also reflected in the allocation to purchase intent categories displayed in the
violin plots in Fig 8. They were remarkably consistent and very close to the previous project CMC cut-
offs. A linear discriminate analysis produced classification cut-offs of 58.4 and 33.9 with a
corresponding overall in-sample prediction accuracy of 81.2% whereas a classification and
discriminate regression tree approach yielded cut-off values of 60.5 and 30.5 with accuracy of 82.2%.
Contrast Est CMC se
NIT -TRI -43.75 1.9
NIT - VSP -25.7 1.19
MAP - TRI 2.78 1.18
TRI - VSP 18.05 1.19
MAP - VSP 20.83 1.19
MAP - NIT 46.53 1.19

L.EQT.1813 – Quantifying the impact of Modified Atmospheric Packaging (MAP) and alternative packaging solutions on eating quality
Page 31 of 47
Figure 11: Distribution of consumer meat colour (CMC) scores for retail packs of steak by purchase
intent. The three vertical lines in each violin plot indicate the first quartile, median and third
quartile respectively.
The relationship between CMC and AUS-MEAT meat colour measured during MSA grading was less
than convincing as depicted in Fig 12 and in more detail in Fig 13 where, while the clear CMC
differences are evident across each of the packaging types and retail viewing dates there is little
relationship or trend in regard to the AUS-MEAT meat colour scores. This aligns with the previous
study and remains a concern given the extensive Industry use of the AUS-MEAT scores in purchase
criteria.
Figure 12: Relationship of CMC score to AUS-MEAT Meat Colour score at grading

L.EQT.1813 – Quantifying the impact of Modified Atmospheric Packaging (MAP) and alternative packaging solutions on eating quality
Page 32 of 47
Figure 13: Relationship of CMC to AUS-MEAT Meat Colour at grading by packaging type and
display date
5.2 Sensory appraisal of cooked steaks with alternative retail packaging
and display period treatments
The distribution of eating quality MQ4 values by packaging type over the display period are
illustrated in Figure 14. In contrast to the CMC visual appeal scores the MAP and TRI treatments are
significantly (P<0.001) lower than the NIT and VSP. Relative to VSP the MAP treatment predicted
MQ4 mean is -6.32, TRI -4.04 and NIT -0.98. The detrimental MAP effect was reduced relative to the
prior P.PIP 0488 2015 trial but approached a similar negative position by day 9 with the results for
both experiments within the confidence interval.

L.EQT.1813 – Quantifying the impact of Modified Atmospheric Packaging (MAP) and alternative packaging solutions on eating quality
Page 33 of 47
Figure 14: Distribution of MQ4 score by cut within packaging type
When analysed using a linear model and treating days in retail pack as a categorical value days in
pack failed to reach significance (P<0.05) across all packaging types. The predicted mean values for
each packaging type at the 5 retail pack display periods are shown in Table 8 and graphically in Fig
15. There are different trends, although not reaching statistical significance. The MAP and TRI-GAS
declined with increased days of display with the difference between them reducing with time, the
NIT increased and the VSP effectively remained stable, a pattern not dissimilar to the meat colour
acceptance observations.

L.EQT.1813 – Quantifying the impact of Modified Atmospheric Packaging (MAP) and alternative packaging solutions on eating quality
Page 34 of 47
Table 8: Adjusted mean MQ4 values for packaging type and display period
While slightly reduced the TRI-GAS treatment paralleled the MAP effect in magnitude and pattern
over time. The NIT treatment appears to trend upward over time with the VSP trending slightly
lower.
Figure 15: Adjusted MQ4 differences between packaging types across a 9 day period
A mixed model analysis produced a similar outcome albeit with some smoothing of the adjusted
values across the time frame after removing the cut x days aged interaction as illustrated by Figure
16, a pattern mirrored at an individual cut x packaging type level as shown in Fig 17.
1 3 5 7 9
VSP 60.9 60.6 60.2 59.8 59.5
NIT 57.8 58.5 59.1 59.8 60.5
TRI-GAS 58.2 57.1 56.1 55.1 54.1
MAP 55.1 54.5 53.8 53.2 52.6
PACKAGINGDISPLAY PERIOD (DAYS)

L.EQT.1813 – Quantifying the impact of Modified Atmospheric Packaging (MAP) and alternative packaging solutions on eating quality
Page 35 of 47
Figure 17: Mixed model MQ4 values by packaging type across 1, 3, 5, 7 and 9 day display periods
(xd).
Figure 18: Mixed model MQ4 values by packaging type & muscle position and days in pack (XD).
The lines are parallel because there were no significant interactions between muscle position and
days in pack.
The days in pack across all treatments approached significance (P<0.05540) when days in pack were
treated as a continuous variable.
Despite differences in cattle type, dentition and pH, primal ageing, muscles tested and days of
display the packaging effects were statistically similar for both this and the previous study reported
L.EQT.1813 – Quantifying the impact of Modified Atmospheric Packaging (MAP) and alternative packaging solutions on eating quality
Page 36 of 47
in P.PIP.0488 with overlapping confidence intervals. The final MSA Pathways recommendation of an
8 MQ4 point deduction reflects these findings.
Further analysis was conducted to investigate possible animal effect interactions including HGP and
marbling. The tested product was obtained from 54 British breed steer carcases which differed
significantly in eating quality (P<0.001). The carcases comprised 20/34 from No HGP/HGP implanted
cattle. Previous work suggested that retail packs using high O2 MAP resulted in tougher meat. The
literature suggested that this toughening may have been caused by a number of different
mechanisms including deactivation of the calpain/calpastatin enzymes and crosslinking of myosin
heavy chain proteins through disulfide bonding. (Geesink et al 2015). The recent paper by
Polkinghorne et al (2018) discounted the deactivation of the calpain/calpstatin system as a
contributing factor to the high O2 MAP effect as the effect was similar in muscles that aged at
different rates (ie tenderloin, rump and striploin) and were aged in the bag for different times (5, 12
or 40 days before being placed in retail packs).
Including HGP and the interaction between HGP and treatment in the mixed model effectively
provided a further test whether the high O2 MAP effect interacted with HGP effects. As expected
the HGP effect was significant (ie HGP treated carcases were tougher, P<0.05), but there was no
interaction between the treatment x HGP interaction. This further supports the results of
Polkinghorne et al (2018) that higher calpastatin in the HGP treated carcases did not interact with
the magnitude of the high O2 MAP effect.
The fourfold range in marbling scores in the 54 carcases provided an opportunity to test if marbling
interacted with packaging treatments. As expected whilst marbling had a large effect on sensory
scores the interaction between marbling score and treatment was not significant (P>0.05).
6 Discussion
These results provide valuable albeit challenging insights for industry. High oxygen MAP has been
the predominant retail packaging type adopted by major retailers for many years supplanting the
traditional overwrap packaging prepared in store and enabling central packaging models to be
employed. In recent years VSP has become more evident but still substantially less common than
MAP. In part this has been influenced by a belief that the darker visual colour of non-oxygenated
beef would reduce consumer attractiveness and sales. To an extent this perception may have
reduced in recent years due to a number of premium brands being VSP packed. In the previous trial
there were indications that while consumers rated the colour of VSP lower than MAP they had some
understanding that it may have an equal or better sensory outcome at equivalent scores as indicated
by lower CMC thresholds between the higher categories.
The existing situation consequently creates a position where superior consumer visual appeal
equates to decreased consumer sensory satisfaction. Both studies have confirmed a lower visual
rating for VSP relative to MAP but also that the difference is perhaps not as extreme as some
predictions. A transition to improved consumer satisfaction through changing to VSP however raises

L.EQT.1813 – Quantifying the impact of Modified Atmospheric Packaging (MAP) and alternative packaging solutions on eating quality
Page 37 of 47
further challenges due to the cost of replacing or modifying existing machinery and adapting store
systems. An upside could be the additional shelf life of VSP reducing distribution costs and time
pressures from central packaging facilities.
It would be convenient if a solution could be found to avoid the decrease in eating quality while
utilising the same packaging equipment. Two potential options in TRI and NIT treatments were
evaluated in the study without success. The NIT treatment however did resolve the eating quality
problem leaving a visual appearance issue. It has been suggested that residual oxygen levels are
critical to avoid colour problems with the suggestion that more aggressive pack evacuation could
resolve the issue. It is recommended that this be investigated further. A further alternative requiring
more change to store systems and distribution would be adoption of a mother bag system to
transfer centrally packed OWP trays with oxygen permeable film restoring colour when removed
from the mother bag environment.
7 Conclusions/recommendations
It is concluded that high oxygen packaging at either 80% (MAP) or a reduced 30% (TRI) oxygen
content have significant detrimental effects on eating quality. These effects were not evident in
either NIT or VSP packaging which maintained eating quality across a 9 day retail display period.
It is also reported that consumer assessment of meat colour appeal and related purchase intent is
extremely consistent being noted across two studies for steak retail packaging. While the MAP and
TRI treatments were superior to VSP this difference was moderate and tended to decrease over the
display period. The NIT treatment colour however was unacceptable to consumers.
Further work is recommended to investigate possible approaches to countering the unattractive
colour generated by the NIT treatment. One possibility is more aggressive evacuation during
packaging to reduce residual oxygen. Success in this aspect would provide an attractive low cost
commercial alternative utilising existing MAP equipment with a change of gas mix.
8 Key messages
High oxygen MAP retail packaging decreases eating quality. This effect is evident within 24 hours of
packing and persists or increases over a 9 day retail display period.
Consumers are highly consistent in their visual scoring of retail pack appearance. This consistency
translates to purchase attitudes.
While VSP packaging has a lesser visual attractiveness relative to MAP and TRI this effect is moderate
with VSP also recording strong purchase intent.
NIT high nitrogen packaging has an unacceptable visual appearance but does not reduce sensory
ratings of cooked product.

L.EQT.1813 – Quantifying the impact of Modified Atmospheric Packaging (MAP) and alternative packaging solutions on eating quality
Page 38 of 47
9 Acknowlegements
The support of MLA staff, in particular Jessira Perovic and Janine Lau who provided grading data,
colour scoring and daily supervision of the retail display and subsequent sensory sample fabrication
is gratefully acknowledged as is the funding support of MLA.
Students of CSU were also deeply involved in all trial aspects from product collection to retail and
sensory sample preparation and their willing and cheerful assistance is much appreciated. The
commitment of CSU to permanently install a retail display cabinet and provide facilities for product
storage and sample preparation is also acknowledged.
Further the outstanding collaborative assistance of Teys Australia and Teys Australia Food Service
personnel at Wagga is acknowledged as is their PIP funding of the initial research study. No aspect of
the research could have been achieved without their outstanding cooperation.
Tastepoint Pty Ltd are thanked for their expert management of sensory product testing.
Judy Philpott and Clare Mathieson (Polkinghornes ) are thanked for their valuable contribution and
assistance throughout the field work and in report production.
10 Bibliography
Tørngren, M. A. 2003. Effect of packing method on colour and eating quality of beef loin steaks.
Pages 495–496 in Proc. 49th Int. Cong. Meat Sci. Technol., Campinas, Brazil
Tørngren, M.A. and Darré, M., 2016. Optimising Eating Quality of Steaks by using Tri-Gas Map.
Australian Meat Processor Corporation, North Sydney NSW, Australia.
Polkinghorne RJ, Philpott J, Watson R, Tarr G, 2017. Impacts on consumer acceptance of beef from
interactions between pH, meat colour and packaging - Final Report. Meat and Livestock Australia,
North Sydney, NSW, Australia.
Polkinghorne RJ, Philpott J, Perovic J, Lau J, Davies L, Mudannayake W, Watson R, Tarr G and
Thompson JM (2018). The effect of packaging on consumer eating quality of beef. Meat Science, 142,
59–64. DOI: 10.1016/j.meatsci.2018.04.002
Watson R, Gee A, Polkinghorne R and Porter M. (2008a). Assessory publication. MSA sensory testing
protocols. Australian Journal of Experimental Agriculture, 48(11), 1360–1367.
Watson R, Gee A, Polkinghorne R and Porter M. (2008b). Consumer assessment of eating quality -
development of protocols for Meat Standards Australia testing. Australian Journal of Experimental
Agriculture, 48, 1360–1367.

L.EQT.1813 – Quantifying the impact of Modified Atmospheric Packaging (MAP) and alternative packaging solutions on eating quality
Page 39 of 47
11 Appendix
11.1 Retail packing material specifications
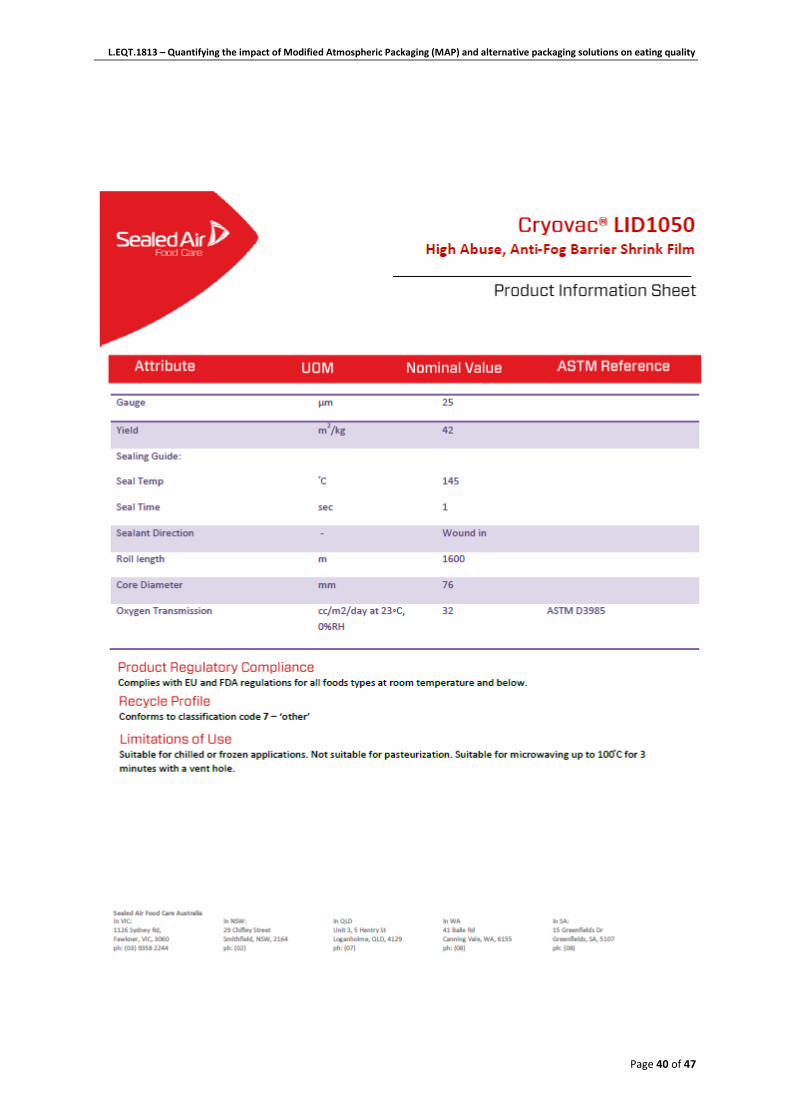
L.EQT.1813 – Quantifying the impact of Modified Atmospheric Packaging (MAP) and alternative packaging solutions on eating quality
Page 40 of 47

L.EQT.1813 – Quantifying the impact of Modified Atmospheric Packaging (MAP) and alternative packaging solutions on eating quality
Page 41 of 47

L.EQT.1813 – Quantifying the impact of Modified Atmospheric Packaging (MAP) and alternative packaging solutions on eating quality
Page 42 of 47
11.2 Consumer visual appraisal - demographics input
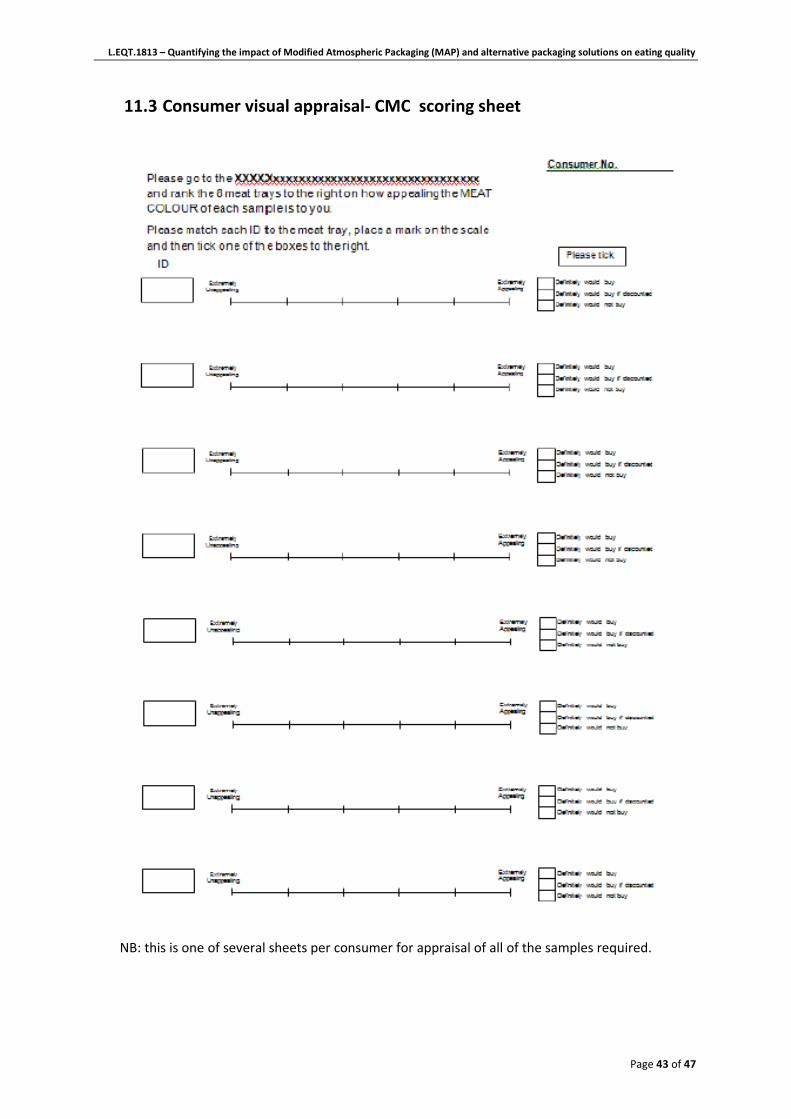
L.EQT.1813 – Quantifying the impact of Modified Atmospheric Packaging (MAP) and alternative packaging solutions on eating quality
Page 43 of 47
11.3 Consumer visual appraisal- CMC scoring sheet
NB: this is one of several sheets per consumer for appraisal of all of the samples required.

L.EQT.1813 – Quantifying the impact of Modified Atmospheric Packaging (MAP) and alternative packaging solutions on eating quality
Page 44 of 47
11.4 Consumer sensory testing questionnaire sheets

L.EQT.1813 – Quantifying the impact of Modified Atmospheric Packaging (MAP) and alternative packaging solutions on eating quality
Page 45 of 47

L.EQT.1813 – Quantifying the impact of Modified Atmospheric Packaging (MAP) and alternative packaging solutions on eating quality
Page 46 of 47

L.EQT.1813 – Quantifying the impact of Modified Atmospheric Packaging (MAP) and alternative packaging solutions on eating quality
Page 47 of 47
Copyright © 2022 FDOKUMEN