Authentication of Meat and Meat Products Using ... - MDPI
19
foods Article Authentication of Meat and Meat Products Using Triacylglycerols Profiling and by DNA Analysis Vojtech Hrbek 1 , Kamila Zdenkova 2, *, Diliara Jilkova 2,3 , Eliska Cermakova 2 , Monika Jiru 1 , Katerina Demnerova 2 , Jana Pulkrabova 1 and Jana Hajslova 1 1 Department of Food Analysis and Nutrition, University of Chemistry and Technology, Technicka 5, 166 28 Prague 6, Czech Republic; [email protected] (V.H.); [email protected] (M.J.); [email protected] (J.P.); [email protected] (J.H.) 2 Department of Biochemistry and Microbiology, University of Chemistry and Technology, Technicka 5, 166 28 Prague 6, Czech Republic; [email protected] (E.C.); [email protected] (K.D.) 3 Research Department, Food Research Institute Prague, Radiová 1285/7, 10231 Prague 10, Czech Republic; [email protected] * Correspondence: [email protected] Received: 4 July 2020; Accepted: 8 September 2020; Published: 10 September 2020 Abstract: Two alternative, complementary analytical strategies were successfully used to identify the most common meat species—beef, pork and chicken—in meat products. The first innovative high-throughput approach was based on triacylglycerols fingerprinting by direct analysis in real time coupled with high-resolution mass spectrometry (DART–HRMS). The second was the classic commonly used DNA analysis based on the use of nuclear or mitochondrial DNA in multiplex polymerase chain reaction (mPCR). The DART–HRMS method represents a rapid, high throughput screening method and was shown to have a good potential for the authentication of meat products. Nevertheless, it should be noted that due to a limited number of samples in this pilot study, we present here a proof of concept. More samples must be analyzed by DART–HRMS to build a robust classification model applicable for reliable authentication. To verify the DART–HRMS results, all samples were analyzed by PCRs. Good compliance in samples classification was documented. In routine practice under these conditions, screening based on DART–HRMS could be used for identification of suspect samples, which could be then examined and validated by accurate PCRs. In this way, saving of both labor and cost could be achieved. In the final phase, commercially available meat products from the Czech market were tested using this new strategy. Canned meats—typical Czech sausages and luncheon meats, all with declared content of beef, pork and chicken meat—were used. Compliance with the label declaration was confirmed and no adulteration was found. Keywords: meat; authentication; triacylglycerols; ambient mass spectrometry; DNA; PCR 1. Introduction The adulteration of food is a current socioeconomic worldwide problem. Consumer demand for correct and understandable food labeling is growing. The informed choice of the products that they want to buy is issue of high concern. One relatively common fraudulent practice is the replacement or dilution of a highly valuable commodity by a cheaper one. This problem may be encountered in meat products—specifically in minced ones. Pork, beef or chicken meat are among the most popular and nutritionally valuable food commodities. Nevertheless, as chicken meat is the cheapest, it may be used to substitute for expensive beef. In addition to economic fraud, hazard for consumers suffering of allergic reaction to certain meats (e.g., chicken protein allergy) must be considered. Moreover, religious aspects may be of concern, as eating pork is not acceptable in Muslim populations. Foods 2020, 9, 1269; doi:10.3390/foods9091269 www.mdpi.com/journal/foods
-
Upload
khangminh22 -
Category
Documents
-
view
1 -
download
0
Transcript of Authentication of Meat and Meat Products Using ... - MDPI
foods
Article
Authentication of Meat and Meat Products UsingTriacylglycerols Profiling and by DNA Analysis
Vojtech Hrbek 1, Kamila Zdenkova 2,*, Diliara Jilkova 2,3, Eliska Cermakova 2, Monika Jiru 1,Katerina Demnerova 2, Jana Pulkrabova 1 and Jana Hajslova 1
1 Department of Food Analysis and Nutrition, University of Chemistry and Technology, Technicka 5,166 28 Prague 6, Czech Republic; [email protected] (V.H.); [email protected] (M.J.);[email protected] (J.P.); [email protected] (J.H.)
2 Department of Biochemistry and Microbiology, University of Chemistry and Technology, Technicka 5,166 28 Prague 6, Czech Republic; [email protected] (E.C.); [email protected] (K.D.)
3 Research Department, Food Research Institute Prague, Radiová 1285/7, 10231 Prague 10, Czech Republic;[email protected]
* Correspondence: [email protected]
Received: 4 July 2020; Accepted: 8 September 2020; Published: 10 September 2020�����������������
Abstract: Two alternative, complementary analytical strategies were successfully used to identifythe most common meat species—beef, pork and chicken—in meat products. The first innovativehigh-throughput approach was based on triacylglycerols fingerprinting by direct analysis in realtime coupled with high-resolution mass spectrometry (DART–HRMS). The second was the classiccommonly used DNA analysis based on the use of nuclear or mitochondrial DNA in multiplexpolymerase chain reaction (mPCR). The DART–HRMS method represents a rapid, high throughputscreening method and was shown to have a good potential for the authentication of meat products.Nevertheless, it should be noted that due to a limited number of samples in this pilot study,we present here a proof of concept. More samples must be analyzed by DART–HRMS to build arobust classification model applicable for reliable authentication. To verify the DART–HRMS results,all samples were analyzed by PCRs. Good compliance in samples classification was documented.In routine practice under these conditions, screening based on DART–HRMS could be used foridentification of suspect samples, which could be then examined and validated by accurate PCRs.In this way, saving of both labor and cost could be achieved. In the final phase, commercially availablemeat products from the Czech market were tested using this new strategy. Canned meats—typicalCzech sausages and luncheon meats, all with declared content of beef, pork and chicken meat—wereused. Compliance with the label declaration was confirmed and no adulteration was found.
Keywords: meat; authentication; triacylglycerols; ambient mass spectrometry; DNA; PCR
1. Introduction
The adulteration of food is a current socioeconomic worldwide problem. Consumer demand forcorrect and understandable food labeling is growing. The informed choice of the products that theywant to buy is issue of high concern.
One relatively common fraudulent practice is the replacement or dilution of a highly valuablecommodity by a cheaper one. This problem may be encountered in meat products—specifically inminced ones. Pork, beef or chicken meat are among the most popular and nutritionally valuable foodcommodities. Nevertheless, as chicken meat is the cheapest, it may be used to substitute for expensivebeef. In addition to economic fraud, hazard for consumers suffering of allergic reaction to certain meats(e.g., chicken protein allergy) must be considered. Moreover, religious aspects may be of concern,as eating pork is not acceptable in Muslim populations.
Foods 2020, 9, 1269; doi:10.3390/foods9091269 www.mdpi.com/journal/foods
Foods 2020, 9, 1269 2 of 19
With regards to the above facts, analytical strategies that can quickly, affordably and reliablydetect such unfair practices are urgently needed. A number of approaches have been employed forauthentication purposes. The most common of them is target analysis of specific markers such asnucleic acids, peptides/proteins or metabolites. Wide variety of techniques including chromatographic,electrophoretic, spectroscopic immunochemical and molecular–biologic methods have been used formeat authentication [1–5]. In routine practice also immunological methods based on the interactionbetween an antigen and antibody (mainly ELISA) are used for authentication of animal species inmeat products.
Various molecular techniques used for food authentication have been developed and reviewed [6,7].These techniques are based on the DNA polymorphism between species and are classified into threetypes. (1) polymerase chain reaction (PCR)-based techniques, (2) hybridization-based techniques and(3) sequencing-based techniques such as DNA barcoding to analyze short standard DNA sequencesand forensically informative nucleotide sequencing FINS [5,8–14]. Various PCR methods have beendescribed: endpoint PCR, real-time qPCR and digital dPCR that allow the amplification of a chosenregion of genomic or mitochondrial DNA. In animal cells, mitochondrial DNA (mtDNA) is present inmany copies, while genomic DNA is mostly present in one copy. Genomic DNA is an appropriate targetfor quantification, while a small addition of undeclared species to the sample can be demonstrated bythe detection of mtDNA [12].
Regarding specific markers screening by chromatographic methods, in our recent study,we demonstrated the possibility to recognize addition of 2% chicken meet addition to pork by assessingspecific ratios of amino acids 1-methylhisitidine/3-methylhistidine [15]. However, this approach israther time-consuming. The same applies e.g., for proteomics-based procedures in which meat speciesauthenticity is performed by means of well-defined proteogenomic annotation, carefully chosensurrogate tryptic peptides ad analysis using a high resolution mass spectrometry HRMS [16].This technique, thanks to high spectral resolution, enables skipping over chromatographic separation.The use of ambient ionization method such as direct analysis in real time (DART) allows a greatsimplification and increase in the speed of mass spectrometry-based measurements. In particular case,the sample investigation can be performed in the open environment of the laboratory by its introductioninto the ionization region, where it is exposed to a stream of ionizing medium [17]. The attractivefeatures of DART have made this technique, apart of other applications, a challenging tool rapidcharacterization of food composition and/or assessment of its authenticity based on metabolomicfingerprinting [18]. For processing of data generated by DART–HRMS advanced statistical methodsrepresented by principal component analysis (PCA) followed by discriminant analysis, e.g., partialleast squares discriminant analysis (PLS-DA) are commonly used.
The objective of this pilot study was to demonstrate the applicability of a new authenticationstrategy for large sets of selected meat products enabling both labor and cost saving. In the firstphase, samples with suspect triacylglycerols (TAGs) profile were rapidly identified by DART–HRMStechnique, in the next step, the confirmation was performed by validated PCRs. To our knowledge,this is the first study that analyzes meat samples by both mentioned methods and discusses theirdiscrimination potential.
2. Materials and Methods
2.1. Samples
Samples were purchased through the retail network of the Czech Republic. In total, 36 sampleswere available: pork (n = 3), chicken (n = 3), beef (n = 3) and heat-treated meat products: ham(n = 3), sausages (n = 11), luncheon meat (n = 7) and meat in its natural juices (n = 6). Approximately200-g of each sample was homogenized by means of an electric grinder (Grindomix GM 200, Retsch,Düsseldorf, Germany) and stored in a plastic container at −20 ◦C until analysis. The fat content andmeat composition of the commercial meat products are shown in Table 1. All samples were tested using

Foods 2020, 9, 1269 3 of 19
both analytical approaches, DART–HRMS–represents a rapid screening method and PCR–verificationmethod. DART–HRMS models for data evaluation were created from nine samples of meat (pork,chicken and beef), 27 samples (meat products) were used for comparison of use in practice. It must bementioned, that due to the very low number of analyzed samples, this innovative strategy was beingtested to determine the potential of this method for the purpose of authentication of meat and meatproducts. The purpose of this pilot study was to present the suitability of this combination; it is proofof the concept.
Table 1. Declared composition of analyzed samples.
Sample Product Pork Meat/Lard (%) Chicken Meat (%) Beef Meat (%) Max Fat Content (%)
1 Chicken ham – 92 – 1.52 Poultry ham – 60 – 1.53 Pork ham 95 – – 104 Sausage 16/Y – 35 405 Sausage 40/Y – 10 406 Sausage 62/Y – 23 407 Sausage 40/25 – 10 348 Sausage 54/Y – 26 449 Luncheon meat N/Y – Y 40
10 Sausage 16/Y – 35 4511 Sausage 17/Y – 26 N12 Sausage 17.5/Y – 38.5 4513 Meat in natural juices 70 – – 3314 Luncheon meat 79 – – 3015 Meat in natural juices 92 – – N16 Meat in natural juices 70 – – 4017 Meat in natural juices 70 – – 3018 Sausage 33/30 – 22 N19 Sausage 71/Y – 16 4520 Sausage 43/30 – 17 4521 Luncheon meat 48 Y – 4022 Meat in natural juices 30 + MSM/Y – N23 Luncheon meat 18 32 – 3024 Luncheon meat 35 30 – 2525 Luncheon meat 71 – 4026 Luncheon meat 31/Y 39 – 2627 Meat in natural juices Y Y 70 27
Y—label on packaging indicates the usage, but the percent content is not stated; N—not labeled on the packaging;MSM—mechanically separated meat.
2.2. Direct Analysis in Real Time Coupled with High-Resolution Mass Spectrometry (DART–HRMS) Analysis
2.2.1. Sample Preparation for Instrumental Analysis
6 mL of hexane was added to the homogenized sample (2 g) in a 15-mL plastic tube. The samplein the plastic tube was extracted for 1 min using a Turrax instrument (T 10 basic ULTRA-TURRAX®,IKA, Staufen, Germany). After centrifugation (5 min, 20 ◦C, 10,000 rpm), the extract was transferred toa glass vial and ready for DART–HRMS analysis. (QC) 100 µL of each pure meat hexane extract (beef,chicken and pork) was mixed as a quality control sample.
2.2.2. Conditions of DART–HRMS Analysis
For the analysis using ambient mass spectrometry, the DART ion source (DART-SVP) was fittedwith a 12Dip-ItTM tip scanner autosampler (IonSense, Saugus, MA, USA) coupled to an ExactiveTM
benchtop (Thermo Fisher Scientific, Bremen, Germany). A VapurTM interface (IonSense, Saugus, MA,USA) was employed to couple the ion source to the mass spectrometer and low vacuum in the interfacechamber was maintained with a membrane pump (Vacuubrand, Wertheim, Germany). The distancebetween the exit of the DART gun and the ceramic transfer tube of the Vapur was set to 10 mm, the gapbetween the ceramic tube and the inlet to the heated capillary of the Exactive was 2 mm.
Foods 2020, 9, 1269 4 of 19
The DART and MS instruments were operated in positive ionization mode and the optimizedsettings were as follows: helium pressure: 5.5 bar; gas temperature: 450 ◦C; discharge needle voltage:1000 V; grid electrode: 250 V. For mass spectrometric detection, the settings were as follows: capillaryvoltage: 60 V; tube lens voltage: 120 V; capillary temperature: 250 ◦C. The sheath, auxiliary, and sweepgases were disabled during DART–MS analysis.
The mass spectrometer was operated at a mass resolving power of 50,000 FWHM calculated form/z 200. The mass spectra acquisition rate was 2 spectra s−1. Liquid samples were delivered into theDART ionization region with the use of a 12 Dip-It tip scanner autosampler. Dip-ItTM tips (IonSense,Saugus, MA, USA) were inserted into a holder. µL of hexane extract of each sample were individuallyplaced on the end of glass tips. The Dip-It holder was mounted on the body of the autosampler andthe Dip-It tips were automatically moved at a constant speed of 0.5 mms−1 through the helium gasbetween the exit of the DART gun and the inlet of the Vapur interface.
Standard external mass calibration of the MS system in the range of 50–1000 m/z was performed inpositive mode prior to the measurement of every sample set (sequence) according to the manufacturer’sinstructions. Moreover, an adjusted mass calibration for ESI(+) in the mass range of m/z 50–1000 usingcollision-induced dissociation (CID) at 25 eV was subsequently performed to cover the lower masses.
2.2.3. Data Analysis
Chemometric analysis included multivariate data analysis using unsupervised and supervisedmodels. Principal component analysis (PCA) and partial least squares discriminant analysis (PLS-DA)were employed based on SIMCA software (v. 13.0, 2011, Umetrics, Umea, Sweden; www.umetrics.com).
In the first stage, data processing and data pretreatment must be carried out to capture the bulk ofthe variation between different datasets. In this way, raw data generated by meat samples analysisemploying the DART–HRMS technique (TAGs signals in positive ionization mode) in the form ofabsolute peak intensities were preprocessed using a constant row sum, that is, each variable wasdivided in the sum of all variables for each sample; this procedure transformed all the data to auniform range of variability. In other words, the intensities of the variables obtained from the profileof the analyzed sample were summed and then each specific variable was divided by the sum thusobtained, thus avoiding the different intensities of the individual ions which would be caused by themeasurement itself and not by the differences of analyzed samples. DART–HRMS data were initiallyprocessed with the software Xcalibur 2.2 and copied to MS Excel 2010. The macro function was used inthe following step to create the final tables which were exported to the SIMCA software.
Subsequently, Pareto scaling was applied prior to PCA and PLS-DA [19]. Then, PCA analysisenabled the transformation of the original variables (normalized intensities of ions) to the newuncorrelated variables (principal components). In this way, the reduced dimensionality of the datawere obtained while still preserving information from the original data set. Additionally, PLS-DA wassubsequently applied to identify and reveal the most significant TAGs. PLS-DA was performed toprovide a better distribution of samples and enable the creation of a statistical model and validation.
The quality of the models was evaluated by the goodness-of-hit parameter (R2X), the proportionof the variance of the response variable that is explained by the model (R2Y) and the predictive abilityparameter (Q2), which was calculated by a k-fold internal cross-validation of the data using a defaultoption of the SIMCA software. In general terms, the value of R2 must be higher than Q2 and anacceptable value of Q2 is more than 0.5 [20]. In addition, the models were also evaluated in terms oftheir recognition and prediction abilities. Recognition ability represents the percentage of samples inthe training set that were correctly classified. Prediction ability is the percentage of samples in thetest set that are correctly classified by using the model developed during the training step. For thispurpose, seven-fold internal cross-validation was used [21]. For the control of the Q2 values, if theywere stable and relevant (correctly calculated), the permutation test was used [22].
S-plot illustrating the distribution of the detected features involved in the statistical evaluationwas used as a tool for ´marker´ selection. Features at the extremes of the S-plot, the outermost ions
Foods 2020, 9, 1269 5 of 19
can be considered as ´markers´ with the highest importance for sample separation. For sorting the´markers´ according their importance, a VIP (variable importance in projection) plot that explains Xand correlates to Y can be used. The most important variables in a given model are those with VIP score>1. The other tool for explaining/confirming ions as markers is a variable line plot, which illustratesthe variability among the top ions across the sample sets.
The tentative identification of compounds behind the marker ions was based on theestimation/calculation of the elemental formula (accurate mass and mass error for respective m/zvalues in MS1 and isotopic pattern were considered). The estimated molecular structure of themarkers was compared with online databases such as ChemSpider (www.chemspider.com) or Metlin(www.metlin.scripps.edu/index.php).
2.2.4. Quality Control
To verify the absence of carryover effects and to control the stability of the recorded fingerprints,blank and quality control (QC) matrix samples were analyzed within the DART–HRMS sequence.It should be noted that the order of the tested samples within the sequence was random (establishedbased on random number generation) to avoid any possible time-dependent changes duringDART–HRMS analysis, which could result in false clustering. To check the overall performanceof the instrumental system, QC samples were inserted into the sequence, always after a set of tentested samples and analyzed under the same conditions. The QC sample was a pool of all meat sampleextracts. In this way, the repeatability of sample fingerprints could be monitored. The good instrumentperformance was documented by a tight clustering of these QC samples (i.e., the similarity of theirfingerprints) in the PCA plot.
2.3. Analysis by Polymerase Chain Reaction (PCR)
Multiplex mPCRs were used for the authentication of meat origin. The design of this study wasas follows: after homogenization of the meat or whole meat product, the isolation of the DNA wasperformed, followed by PCRs. The mPCR based on mitochondrial cytochrome b gene amplification wasused for qualitative analysis. Two mqPCRs (triplex and duplex) were used, based on the amplificationof a single copy of chromosomally encoded gene sequences. Single-copy chromosomal genes wereanalyzed, such as cyclic phosphodiesterase for cattle, beta actin for pigs; interleukin-2 (Il-2) for chickensand the myostatin gene for mammals and poultry.
2.3.1. DNA Isolation
DNA was isolated from 200-mg homogenized samples (Section 2.1) using a cetyltrimethylammoniumbromide (CTAB) method [23]. The quality of the isolated DNA was verified by 1% horizontal agaroseelectrophoresis in Tris/Borate/EDTA buffer (Bio-Rad, Hercules, CA, USA), DNA concentration and puritywas determined spectrophotometrically with a nanophotometer (Implen, Munich, Germany).
2.3.2. Primers and Probes
The primers and probes used are shown in Table 2 and were synthetized by East Port (Prague,Czech Republic).
Foods 2020, 9, 1269 6 of 19
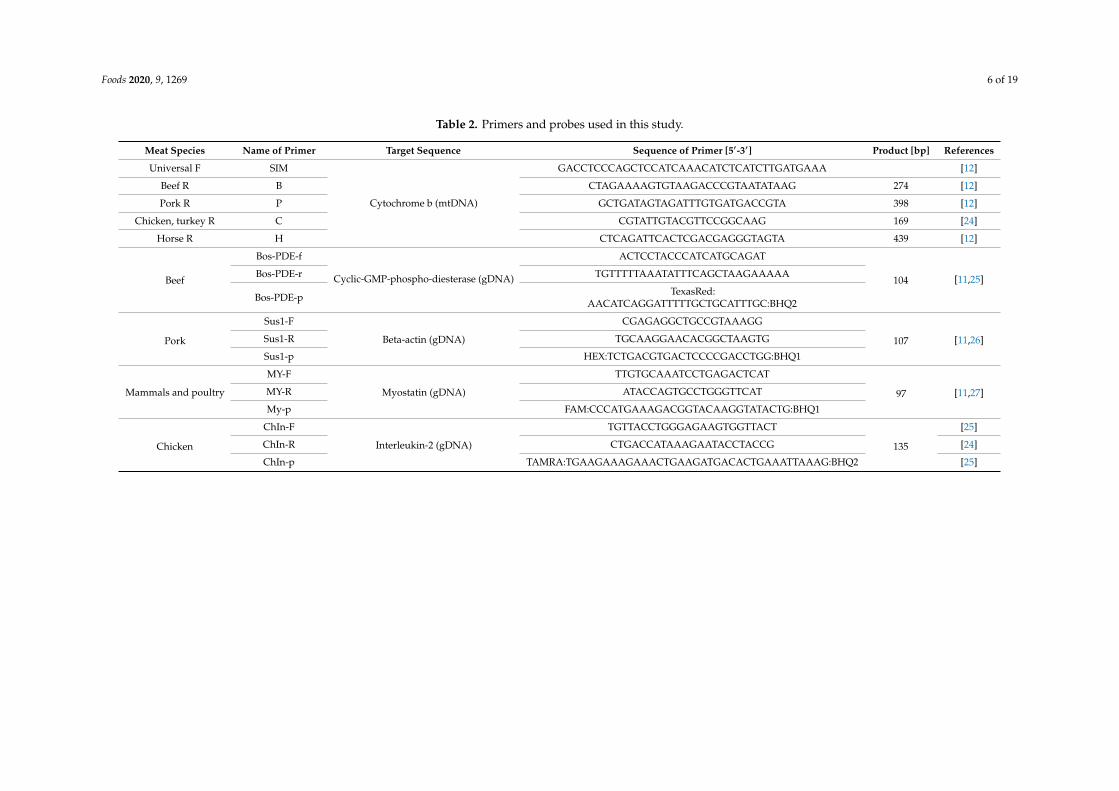
Table 2. Primers and probes used in this study.
Meat Species Name of Primer Target Sequence Sequence of Primer [5′-3′] Product [bp] References
Universal F SIM
Cytochrome b (mtDNA)
GACCTCCCAGCTCCATCAAACATCTCATCTTGATGAAA [12]
Beef R B CTAGAAAAGTGTAAGACCCGTAATATAAG 274 [12]
Pork R P GCTGATAGTAGATTTGTGATGACCGTA 398 [12]
Chicken, turkey R C CGTATTGTACGTTCCGGCAAG 169 [24]
Horse R H CTCAGATTCACTCGACGAGGGTAGTA 439 [12]
Beef
Bos-PDE-f
Cyclic-GMP-phospho-diesterase (gDNA)
ACTCCTACCCATCATGCAGAT
104 [11,25]Bos-PDE-r TGTTTTTAAATATTTCAGCTAAGAAAAA
Bos-PDE-p TexasRed:AACATCAGGATTTTTGCTGCATTTGC:BHQ2
Pork
Sus1-F
Beta-actin (gDNA)
CGAGAGGCTGCCGTAAAGG
107 [11,26]Sus1-R TGCAAGGAACACGGCTAAGTG
Sus1-p HEX:TCTGACGTGACTCCCCGACCTGG:BHQ1
Mammals and poultry
MY-F
Myostatin (gDNA)
TTGTGCAAATCCTGAGACTCAT
97 [11,27]MY-R ATACCAGTGCCTGGGTTCAT
My-p FAM:CCCATGAAAGACGGTACAAGGTATACTG:BHQ1
Chicken
ChIn-F
Interleukin-2 (gDNA)
TGTTACCTGGGAGAAGTGGTTACT
135
[25]
ChIn-R CTGACCATAAAGAATACCTACCG [24]
ChIn-p TAMRA:TGAAGAAAGAAACTGAAGATGACACTGAAATTAAAG:BHQ2 [25]
Foods 2020, 9, 1269 7 of 19
2.3.3. Multiplex mPCR
For this method, primers complementary to mitochondrial DNA cytochrome b were used [12,24].mPCR amplification was conducted in 15 µL 1.5-mM MgCl2, 0.2-mM dNTP mix (Promega, Madison,WI, USA), primer mix (Metabion International AG, Planegg, Germany), 100 ng template DNA and 0.4 UPlatinumTM DNA polymerase (Thermo Fisher Scientific, Waltham, MA, USA). The primers were mixedin the ratio of 1:0.6:0.6:1.5:1.5 for SIM:B:P:C:H and used together to mPCR (ratio 1 means concentration0.4µmol·L−1). Amplifications were performed in a Biometra T-Gradient (Whatman Biometra, Göttingen,Germany) as follows: initial denaturation at 94 ◦C for 2 min, 40 cycles of denaturation at 94 ◦C for 30 s,annealing at 53 ◦C for 30 s and extension at 72 ◦C for 30 s, final polymerization was for 5 min at 72 ◦C.Visualization and detection of amplicons were done on 2.5% agarose gel.
2.3.4. Multiplex mqPCRs
Primers and probes used for mqPCR were complementary to single-copy chromosomallyencoded gene sequences. The reaction conditions for pork and beef were adopted from Iwobiet al. [11], chicken mqPCR from Zdenkova et al. [24]. The analyses were performed in an ABI 7500(Applied Biosystems™, Foster City, CA, USA), the 7500 Software v2.0.6 was employed for data analysis.Four fluorescence channels were analyzed separately.
The result of the triplex qPCR was amplification of the 104-bp-long bovine gDNA segment withthe Texas Red fluorescence curve; 107 bp from pork gDNA with a fluorescence curve of the HEXfluorophore and a 97-bp-long amplicon from the gDNA of mammals and poultry with the FAMfluorophore. The duplex qPCR amplified the 135-bp-long amplicon of chicken gDNA with the TAMRAfluorophore together with a 97-bp-long amplicon from the gDNA of mammals and poultry with theFAM fluorophore.
2.3.5. Data Analysis
To separate the PCR amplicons, a 2.5% agarose gel was used. The confirmation of amplicon sizewas based on comparing the length of the amplicons obtained from the samples with the length of themarker fragments (100-bp DNA ladder, New England Biolabs, Ipswich, MA, USA) and the positivecontrol during the reaction (target DNA) which, together with the non-template control, was includedin each amplification reaction.
The qPCR data analyses are based on evaluating the fluorescence curves of the amplificationcycle. If the fluorescence value of the sample exceeds the base fluorescence value, the amplificationis positively evaluated, and the sample thus contains the target segment. If the sample does notcontain a target section or its sample content is lower than the detection limit of the method used,the fluorescence reading does not exceed the fluorescence baseline.
2.3.6. Quality Control
PCR controls were performed for each reaction; a positive control containing the target DNA andno-template control without any DNA added.
3. Results and Discussion
In this study, TAGs and DNA were used for identification of the meat origin. The workflow wasas follows: In the first step, the potential of using metabolomics profiling, focusing on the analysisof TAGs, employing DART–HRMS to differentiate pork, beef and chicken samples was investigated.The aim was to design the conditions of the analysis, which would allow obtaining separate groupsfor different meats on the PCA and PLS-DA plots. If such conditions would not have been found,the authentication of meat cannot be done with this approach. As the samples were differentiatedaccording to the type of meat, the same strategy for the analysis of commercial meat products wasused. At the same time, the results obtained by the DART–HRMS method were confirmed by the
Foods 2020, 9, 1269 8 of 19
established validated mPCRs. A theoretical comparison of the two methods used for our analyses wasalso performed. A possible combination of these methods that can facilitate the routine analysis ofmeat and meat products was suggested based on both theoretical and practical comparisons. See thechapters below for more details.
3.1. Results of DART–HRMS Analysis
Hexane was chosen as an extracting agent for sample preparation, since it is a nonpolar solventsuitable for the isolation of TAGs. Other solvents (e.g., methanol) were tested. However, when compilingthe statistical models, the assumption was confirmed that, for pure meat, methanol and hexane can beused for the extraction and analysis with excellent classification of different types of meats. However,the classification is no longer satisfactory with methanol when analyzing meat products containingother ingredients (besides meat, e.g., spices). The reason for this is the co-isolation of many othersubstances that come from other ingredients used in the production of meat products and may bedifferent for different products. Therefore, the only possible way to use the metabolomic approachfor the authentication of meat in a meat product is TAGs analysis. The profiles of TAGs associatedwith various types of meat should be the same in the original meat as in the final meat product, asshown below.
3.1.1. DART–HRMS Fingerprints of Different Meat Types
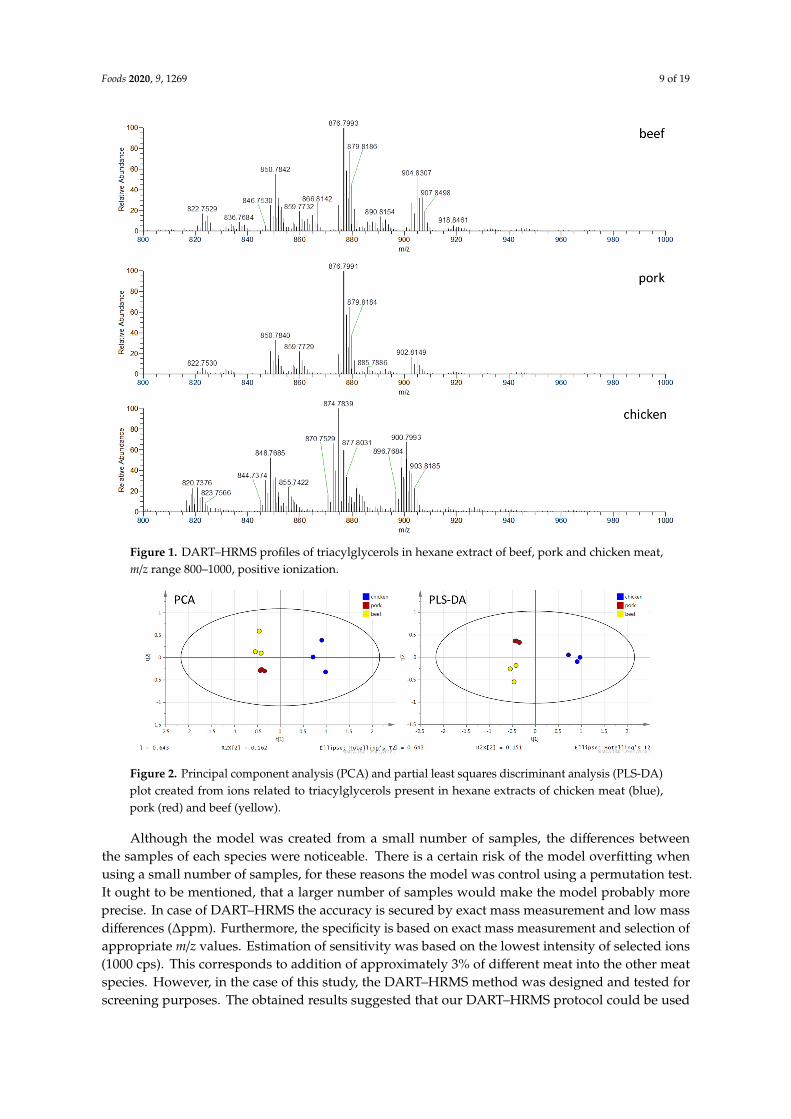
Figure 1 shows the characteristic fingerprints, TAGs profiles, associated with all three types ofanalyzed meat (beef, pork and chicken). TAGs form [M + NH4]+ ions, which are in the m/z range800–1000. Apparent differences in TAGs profiles of individual meat species are evident, especially inthe ratios of relative intensities of the individual TAG ions present in the profiles. Different TAGs aredominant in various types of meat, for example, TAGs with m/z 848.7682, 874.7837 and 900.7996 arepredominantly found in chicken meat, while TAGs with ions with 850.7836, 876.7995 and 902.8148 arepredominantly found in pork and ions with m/z 850.7836, 876.7995 and 904.8306 in beef. The mentioneddifferences are mainly in terms of the ratios of ions relative intensities, as shown in Figure 1. This factis particularly important from the point of view to reveal the economically motivated adulteration,i.e., to reveal the addition of undeclared cheap chicken meat, more often to pork meat products, but alsoto beef products. Due to the differences in the TAGs present and their ratios, in particular meat profiles,the employed DART–HRMS strategy indicates a good potential for detecting adulteration.
The fingerprint was converted to an ion list according to m/z and information about the intensitiesof the ions. The total number of detected ions related to TAGs in the profiles with signal intensityhigher than 1000 cps was 40. However, it means 40 different summary formulas, but thanks to theisomers, the number of TAGs is probably higher. Data were transferred to MS Excel and TAG ionswith VIP values higher than 1 (see Section 2.2.3) with their intensities were selected using the MAKROfunction. The total number of selected ions was 15 (see Table 3). Furthermore, SIMCA v13.0 softwarewas used for chemometric analysis. First of all, PCA was performed, followed by partial least squaresdiscriminant analysis (PLS-DA). For the statistical analysis, 15 selected ions corresponding to TAGswere used. The obtained PCA and PLS-DA plots are shown in Figure 2.
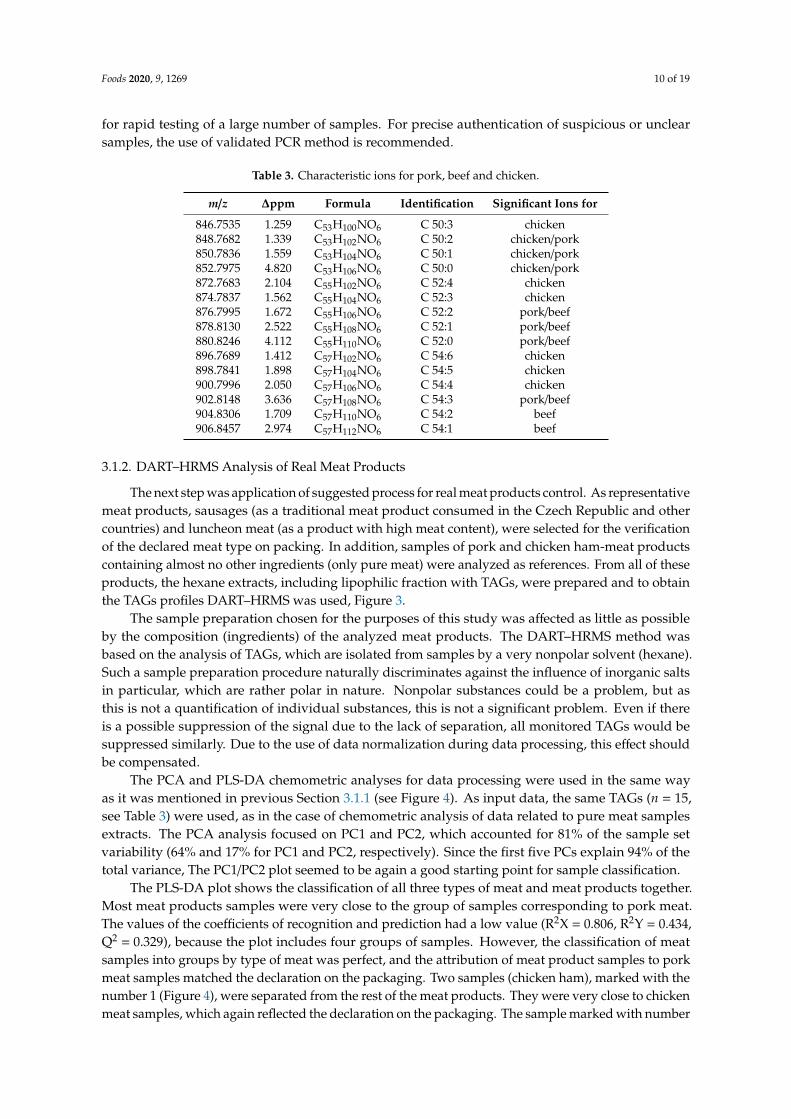
As for the processing of DART–HRMS data, PCA clearly separated the meat varieties based ontheir TAGs profiles. In Figure 2 presenting the positive ionization data, PC1 and PC2 together described79% of the sample set variability (64% and 15% for PC1 and PC2, respectively). Considering the factthat the first five PCs explain 99% (ESI+) of the total variance, The PC1/PC2 plot seemed to be a goodstarting point for sample clustering according to meat variety.
In the next step (following PCA analysis), PLS-DA was used, see Figure 2. As expected, efficient separationof samples into groups was achieved, and the mathematical model (R2X = 0.994, R2Y = 0.989, Q2 = 0.973)obtained in this way reliably enabled the correct classification of an unknown sample; recognition ability(100%) and prediction ability (100%) were excellent.
Foods 2020, 9, 1269 9 of 19
Foods 2020, 9, x FOR PEER REVIEW 9 of 19
Figure 1. DART–HRMS profiles of triacylglycerols in hexane extract of beef, pork and chicken meat, m/z range 800–1000, positive ionization.
Figure 2. Principal component analysis (PCA) and partial least squares discriminant analysis (PLS-DA) plot created from ions related to triacylglycerols present in hexane extracts of chicken meat (blue), pork (red) and beef (yellow).
Although the model was created from a small number of samples, the differences between the samples of each species were noticeable. There is a certain risk of the model overfitting when using a small number of samples, for these reasons the model was control using a permutation test. It ought to be mentioned, that a larger number of samples would make the model probably more precise. In case of DART–HRMS the accuracy is secured by exact mass measurement and low mass differences (Δppm). Furthermore, the specificity is based on exact mass measurement and selection of appropriate m/z values. Estimation of sensitivity was based on the lowest intensity of selected ions (1000 cps). This corresponds to addition of approximately 3% of different meat into the other meat species. However, in the case of this study, the DART–HRMS method was designed and tested for screening purposes. The obtained results suggested that our DART–HRMS protocol could be used
Figure 1. DART–HRMS profiles of triacylglycerols in hexane extract of beef, pork and chicken meat,m/z range 800–1000, positive ionization.
Foods 2020, 9, x FOR PEER REVIEW 9 of 19
Figure 1. DART–HRMS profiles of triacylglycerols in hexane extract of beef, pork and chicken meat, m/z range 800–1000, positive ionization.
Figure 2. Principal component analysis (PCA) and partial least squares discriminant analysis (PLS-DA) plot created from ions related to triacylglycerols present in hexane extracts of chicken meat (blue), pork (red) and beef (yellow).
Although the model was created from a small number of samples, the differences between the samples of each species were noticeable. There is a certain risk of the model overfitting when using a small number of samples, for these reasons the model was control using a permutation test. It ought to be mentioned, that a larger number of samples would make the model probably more precise. In case of DART–HRMS the accuracy is secured by exact mass measurement and low mass differences (Δppm). Furthermore, the specificity is based on exact mass measurement and selection of appropriate m/z values. Estimation of sensitivity was based on the lowest intensity of selected ions (1000 cps). This corresponds to addition of approximately 3% of different meat into the other meat species. However, in the case of this study, the DART–HRMS method was designed and tested for screening purposes. The obtained results suggested that our DART–HRMS protocol could be used
Figure 2. Principal component analysis (PCA) and partial least squares discriminant analysis (PLS-DA)plot created from ions related to triacylglycerols present in hexane extracts of chicken meat (blue),pork (red) and beef (yellow).
Although the model was created from a small number of samples, the differences betweenthe samples of each species were noticeable. There is a certain risk of the model overfitting whenusing a small number of samples, for these reasons the model was control using a permutation test.It ought to be mentioned, that a larger number of samples would make the model probably moreprecise. In case of DART–HRMS the accuracy is secured by exact mass measurement and low massdifferences (∆ppm). Furthermore, the specificity is based on exact mass measurement and selection ofappropriate m/z values. Estimation of sensitivity was based on the lowest intensity of selected ions(1000 cps). This corresponds to addition of approximately 3% of different meat into the other meatspecies. However, in the case of this study, the DART–HRMS method was designed and tested forscreening purposes. The obtained results suggested that our DART–HRMS protocol could be used
Foods 2020, 9, 1269 10 of 19
for rapid testing of a large number of samples. For precise authentication of suspicious or unclearsamples, the use of validated PCR method is recommended.
Table 3. Characteristic ions for pork, beef and chicken.
m/z ∆ppm Formula Identification Significant Ions for
846.7535 1.259 C53H100NO6 C 50:3 chicken848.7682 1.339 C53H102NO6 C 50:2 chicken/pork850.7836 1.559 C53H104NO6 C 50:1 chicken/pork852.7975 4.820 C53H106NO6 C 50:0 chicken/pork872.7683 2.104 C55H102NO6 C 52:4 chicken874.7837 1.562 C55H104NO6 C 52:3 chicken876.7995 1.672 C55H106NO6 C 52:2 pork/beef878.8130 2.522 C55H108NO6 C 52:1 pork/beef880.8246 4.112 C55H110NO6 C 52:0 pork/beef896.7689 1.412 C57H102NO6 C 54:6 chicken898.7841 1.898 C57H104NO6 C 54:5 chicken900.7996 2.050 C57H106NO6 C 54:4 chicken902.8148 3.636 C57H108NO6 C 54:3 pork/beef904.8306 1.709 C57H110NO6 C 54:2 beef906.8457 2.974 C57H112NO6 C 54:1 beef
3.1.2. DART–HRMS Analysis of Real Meat Products
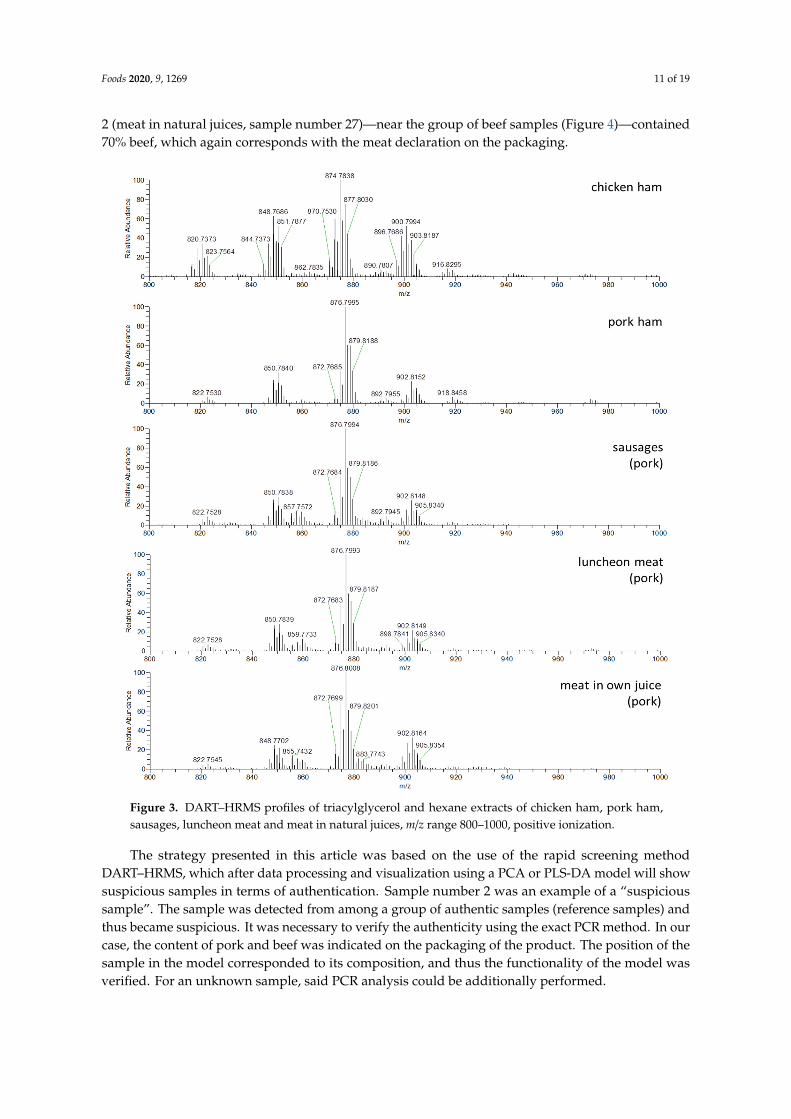
The next step was application of suggested process for real meat products control. As representativemeat products, sausages (as a traditional meat product consumed in the Czech Republic and othercountries) and luncheon meat (as a product with high meat content), were selected for the verificationof the declared meat type on packing. In addition, samples of pork and chicken ham-meat productscontaining almost no other ingredients (only pure meat) were analyzed as references. From all of theseproducts, the hexane extracts, including lipophilic fraction with TAGs, were prepared and to obtainthe TAGs profiles DART–HRMS was used, Figure 3.
The sample preparation chosen for the purposes of this study was affected as little as possibleby the composition (ingredients) of the analyzed meat products. The DART–HRMS method wasbased on the analysis of TAGs, which are isolated from samples by a very nonpolar solvent (hexane).Such a sample preparation procedure naturally discriminates against the influence of inorganic saltsin particular, which are rather polar in nature. Nonpolar substances could be a problem, but asthis is not a quantification of individual substances, this is not a significant problem. Even if thereis a possible suppression of the signal due to the lack of separation, all monitored TAGs would besuppressed similarly. Due to the use of data normalization during data processing, this effect shouldbe compensated.
The PCA and PLS-DA chemometric analyses for data processing were used in the same wayas it was mentioned in previous Section 3.1.1 (see Figure 4). As input data, the same TAGs (n = 15,see Table 3) were used, as in the case of chemometric analysis of data related to pure meat samplesextracts. The PCA analysis focused on PC1 and PC2, which accounted for 81% of the sample setvariability (64% and 17% for PC1 and PC2, respectively). Since the first five PCs explain 94% of thetotal variance, The PC1/PC2 plot seemed to be again a good starting point for sample classification.
The PLS-DA plot shows the classification of all three types of meat and meat products together.Most meat products samples were very close to the group of samples corresponding to pork meat.The values of the coefficients of recognition and prediction had a low value (R2X = 0.806, R2Y = 0.434,Q2 = 0.329), because the plot includes four groups of samples. However, the classification of meatsamples into groups by type of meat was perfect, and the attribution of meat product samples to porkmeat samples matched the declaration on the packaging. Two samples (chicken ham), marked with thenumber 1 (Figure 4), were separated from the rest of the meat products. They were very close to chickenmeat samples, which again reflected the declaration on the packaging. The sample marked with number
Foods 2020, 9, 1269 11 of 19
2 (meat in natural juices, sample number 27)—near the group of beef samples (Figure 4)—contained70% beef, which again corresponds with the meat declaration on the packaging.
Foods 2020, 9, x FOR PEER REVIEW 10 of 19
for rapid testing of a large number of samples. For precise authentication of suspicious or unclear samples, the use of validated PCR method is recommended.
3.1.2. DART–HRMS Analysis of Real Meat Products
The next step was application of suggested process for real meat products control. As representative meat products, sausages (as a traditional meat product consumed in the Czech Republic and other countries) and luncheon meat (as a product with high meat content), were selected for the verification of the declared meat type on packing. In addition, samples of pork and chicken ham-meat products containing almost no other ingredients (only pure meat) were analyzed as references. From all of these products, the hexane extracts, including lipophilic fraction with TAGs, were prepared and to obtain the TAGs profiles DART–HRMS was used, Figure 3.
Figure 3. DART–HRMS profiles of triacylglycerol and hexane extracts of chicken ham, pork ham, sausages, luncheon meat and meat in natural juices, m/z range 800–1000, positive ionization.
Figure 3. DART–HRMS profiles of triacylglycerol and hexane extracts of chicken ham, pork ham,sausages, luncheon meat and meat in natural juices, m/z range 800–1000, positive ionization.
The strategy presented in this article was based on the use of the rapid screening methodDART–HRMS, which after data processing and visualization using a PCA or PLS-DA model will showsuspicious samples in terms of authentication. Sample number 2 was an example of a “suspicioussample”. The sample was detected from among a group of authentic samples (reference samples) andthus became suspicious. It was necessary to verify the authenticity using the exact PCR method. In ourcase, the content of pork and beef was indicated on the packaging of the product. The position of thesample in the model corresponded to its composition, and thus the functionality of the model wasverified. For an unknown sample, said PCR analysis could be additionally performed.

Foods 2020, 9, 1269 12 of 19
Foods 2020, 9, x FOR PEER REVIEW 12 of 19
It can be very difficult to identify a sample as suspicious based only on a visual assessment. Therefore, the PCR method was used to confirm the results of DART–HRMS analyses. All samples were analyzed by PCRs. Thanks to these analyses, it was possible to determine the boundary (bold red line) in the PLS-DA model behind which suspicious samples are located, and it is necessary to subject these samples to confirmatory PCR analysis. Other samples that are located from the border (bold red line) towards the reference samples are considered as authentic samples containing only pork, as it demonstrated in Figure 4.
It is worth noting that four pork meat products (marked (x) that contained mechanically separated chicken meat tended to separate from the meat product made only from pork meat. They were situated towards the chicken meat samples in the PCA and PLS-DA plot, marked with the number 3 (see Figure 4). The other analyzed meat products mainly contained pork (without beef or chicken meat addition) were assigned to a group of authentic pork meat samples. From the analyses carried out and the obtained PLS-DA model, it is clear that this procedure correctly evaluates and assigns samples into groups according to the meat composition, the type of meat used in the production of meat products (sausages, luncheon meat, meat in natural juices). TAGs profiling by DART–HRMS could be used as a screening method to verify the composition of meat in meat products and to detect of adulteration by chicken meat.
Figure 4. PCA and PLS-DA plots created from ions related to triacylglycerols present in hexane extracts of meat products (green), chicken (blue), pork (red) and beef (yellow). Group 1—chicken ham samples; group 2—meat products containing 70% of beef; group 3—pork meat products containing mechanically separated chicken meat and the rest of the green points represent meat products based on pork meat.
To better demonstrate/simulate pork adulteration by chicken meat (the situation is similar for beef adulterated by chicken meat), PLS-DA plot (Figure 5A) was created using only the data for samples of chicken and pork and meat products composed of them. The plots show an excellent separation of chicken and pork samples (R2X = 0.784, R2Y = 0.929, Q2 = 0.894, recognition ability = 100% and prediction ability = 100%). In case of adulteration, in the sense of mislabeling, i.e., a meat product labeled as a pork product contains (undeclared) chicken meat, the sample would be assigned more to the chicken meat group. For better understanding, one of the chicken samples was marked as a pork sample. The model did not place it among the other pork samples (red dots), but correctly
Figure 4. PCA and PLS-DA plots created from ions related to triacylglycerols present in hexane extractsof meat products (green), chicken (blue), pork (red) and beef (yellow). Group 1—chicken ham samples;group 2—meat products containing 70% of beef; group 3—pork meat products containing mechanicallyseparated chicken meat and the rest of the green points represent meat products based on pork meat.
It can be very difficult to identify a sample as suspicious based only on a visual assessment.Therefore, the PCR method was used to confirm the results of DART–HRMS analyses. All sampleswere analyzed by PCRs. Thanks to these analyses, it was possible to determine the boundary (bold redline) in the PLS-DA model behind which suspicious samples are located, and it is necessary to subjectthese samples to confirmatory PCR analysis. Other samples that are located from the border (bold redline) towards the reference samples are considered as authentic samples containing only pork, as itdemonstrated in Figure 4.
It is worth noting that four pork meat products (marked (x) that contained mechanically separatedchicken meat tended to separate from the meat product made only from pork meat. They weresituated towards the chicken meat samples in the PCA and PLS-DA plot, marked with the number 3(see Figure 4). The other analyzed meat products mainly contained pork (without beef or chicken meataddition) were assigned to a group of authentic pork meat samples. From the analyses carried out andthe obtained PLS-DA model, it is clear that this procedure correctly evaluates and assigns samples intogroups according to the meat composition, the type of meat used in the production of meat products(sausages, luncheon meat, meat in natural juices). TAGs profiling by DART–HRMS could be used as ascreening method to verify the composition of meat in meat products and to detect of adulteration bychicken meat.
To better demonstrate/simulate pork adulteration by chicken meat (the situation is similar for beefadulterated by chicken meat), PLS-DA plot (Figure 5A) was created using only the data for samplesof chicken and pork and meat products composed of them. The plots show an excellent separationof chicken and pork samples (R2X = 0.784, R2Y = 0.929, Q2 = 0.894, recognition ability = 100% andprediction ability = 100%). In case of adulteration, in the sense of mislabeling, i.e., a meat productlabeled as a pork product contains (undeclared) chicken meat, the sample would be assigned moreto the chicken meat group. For better understanding, one of the chicken samples was marked asa pork sample. The model did not place it among the other pork samples (red dots), but correctly
Foods 2020, 9, 1269 13 of 19
assigned/kept it in the chicken meat samples group (red dot among the blue dots group—chicken meatsamples), as shown in Figure 5B.
Foods 2020, 9, x FOR PEER REVIEW 13 of 19
assigned/kept it in the chicken meat samples group (red dot among the blue dots group—chicken meat samples), as shown in Figure 5B.
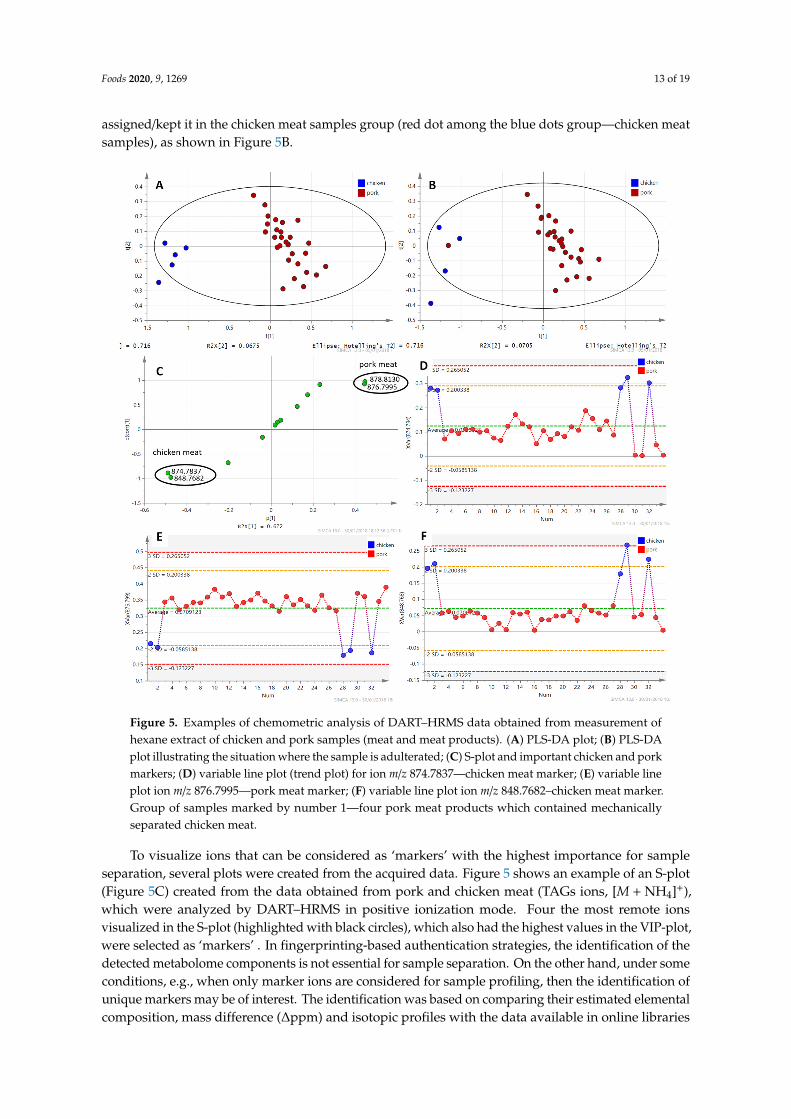
Figure 5. Examples of chemometric analysis of DART–HRMS data obtained from measurement of hexane extract of chicken and pork samples (meat and meat products). (A) PLS-DA plot; (B) PLS-DA plot illustrating the situation where the sample is adulterated; (C) S-plot and important chicken and pork markers; (D) variable line plot (trend plot) for ion m/z 874.7837—chicken meat marker; (E) variable line plot ion m/z 876.7995—pork meat marker; (F) variable line plot ion m/z 848.7682–chicken meat marker. Group of samples marked by number 1—four pork meat products which contained mechanically separated chicken meat.
To visualize ions that can be considered as ´markers´ with the highest importance for sample separation, several plots were created from the acquired data. Figure 5 shows an example of an S-plot (Figure 5C) created from the data obtained from pork and chicken meat (TAGs ions, [M + NH4]+), which were analyzed by DART–HRMS in positive ionization mode. Four the most remote ions visualized in the S-plot (highlighted with black circles), which also had the highest values in the VIP-plot, were selected as ´markers´. In fingerprinting-based authentication strategies, the identification of the detected metabolome components is not essential for sample separation. On the other hand, under some conditions, e.g., when only marker ions are considered for sample profiling, then the identification of unique markers may be of interest. The identification was based on comparing their estimated elemental composition, mass difference (Δppm) and isotopic profiles with the data available in online libraries and scientific papers [28,29]. The variable line plot for the ions at m/z
Figure 5. Examples of chemometric analysis of DART–HRMS data obtained from measurement ofhexane extract of chicken and pork samples (meat and meat products). (A) PLS-DA plot; (B) PLS-DAplot illustrating the situation where the sample is adulterated; (C) S-plot and important chicken and porkmarkers; (D) variable line plot (trend plot) for ion m/z 874.7837—chicken meat marker; (E) variable lineplot ion m/z 876.7995—pork meat marker; (F) variable line plot ion m/z 848.7682–chicken meat marker.Group of samples marked by number 1—four pork meat products which contained mechanicallyseparated chicken meat.
To visualize ions that can be considered as ‘markers’ with the highest importance for sampleseparation, several plots were created from the acquired data. Figure 5 shows an example of an S-plot(Figure 5C) created from the data obtained from pork and chicken meat (TAGs ions, [M + NH4]+),which were analyzed by DART–HRMS in positive ionization mode. Four the most remote ionsvisualized in the S-plot (highlighted with black circles), which also had the highest values in the VIP-plot,were selected as ‘markers’ . In fingerprinting-based authentication strategies, the identification of thedetected metabolome components is not essential for sample separation. On the other hand, under someconditions, e.g., when only marker ions are considered for sample profiling, then the identification ofunique markers may be of interest. The identification was based on comparing their estimated elementalcomposition, mass difference (∆ppm) and isotopic profiles with the data available in online libraries
Foods 2020, 9, 1269 14 of 19
and scientific papers [28,29]. The variable line plot for the ions at m/z 874.7837, 848.7682 (markers forchicken meat, Figure 5D,F) and m/z 876.7995 (marker for pork meat, Figure 5E) illustrates the changes inthe content of the respective TAGs in the pork and chicken meat. The estimated elemental compositionof these ions together with their tentative identification are shown in Table 3, where the markers alsofor beef are included. These ions are not markers in the true sense of the word, because they are notunique to one group (meat type). However, due to the fact that statistical data processing takes intoaccount not only the presence and intensity of the ions, but also their relative ratio, these selected ionsare essential for authentication. For beef, pork and chicken, significant (very abundant) ions wereselected for each type of meat, which are determinants and key for verifying an undeclared additionof—for example—chicken meat into a meat product or determining which type of meat was used.
It could be concluded that the usage of supervised PLS-DA model could lead to a distortion of theseparation (overfitting). This model was used for completeness and, also for better visualization of theobtained data and explanation of the context. The PLS-DA model is very similar as the PCA modelin terms of sample separation. Permutation tests were also performed during data processing andconfirmed its applicability. Due to the fact, that DART–HRMS analysis is intended primarily for rapidscreening of large number of samples and identification of only suspicious samples for an additionalaccurate PCR method, it is possible to use the PCA model for this purpose.
3.1.3. Confirmation of Isolated DNA Quality and Quantity
DNA was isolated using a CTAB method according to CSN EN ISO 21,571 (ISO 21571, 2005).Both the yield and quality of the DNA obtained from pure musculature of beef, pork, chicken,turkey and horse were higher than 90 ng·µL−1 for all tested, commercially important meat species.More than 100 ng·µL−1 DNA was obtained from chicken, pork and beef samples. More than 50 ng·µL−1
DNA was isolated from 26 real meat products; the highest yield (316 ng·µL−1) was obtained from meatin its natural juices (sample number 22). The lowest yield of DNA was isolated from one sausage(sample number 6), 15 ng·µL−1 was isolated with the ratio of absorbance (A 260 nm/A 280 nm) equal to1.6 corresponding to nucleic acids with the presence of proteins. DNA of appropriate quality as well asquantity for subsequent amplifications was isolated from all samples tested.
3.1.4. DNA Analysis of Meat and Meat Products
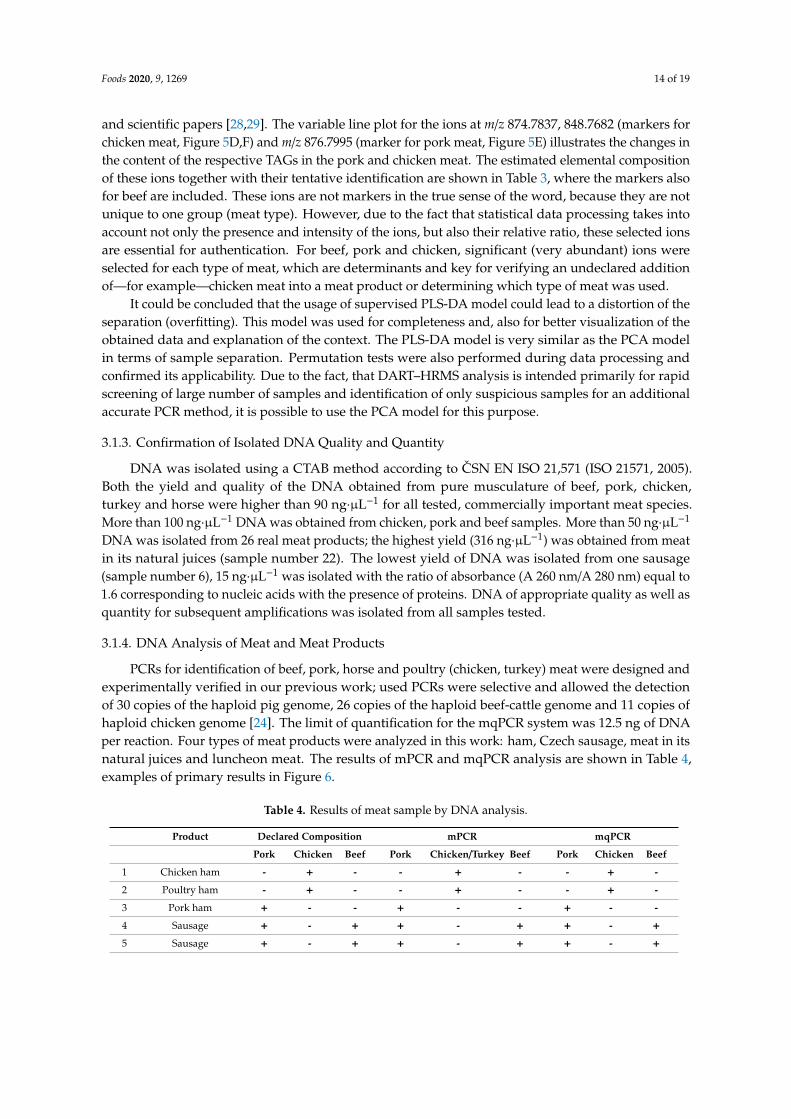
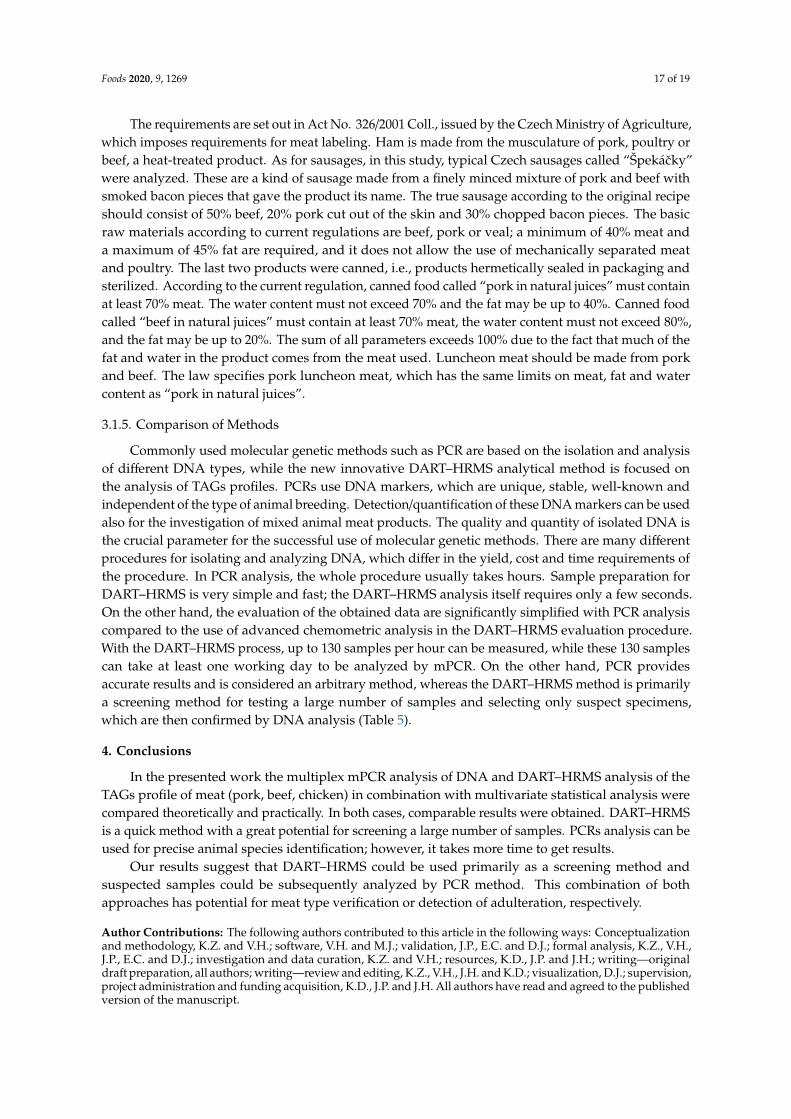
PCRs for identification of beef, pork, horse and poultry (chicken, turkey) meat were designed andexperimentally verified in our previous work; used PCRs were selective and allowed the detectionof 30 copies of the haploid pig genome, 26 copies of the haploid beef-cattle genome and 11 copies ofhaploid chicken genome [24]. The limit of quantification for the mqPCR system was 12.5 ng of DNAper reaction. Four types of meat products were analyzed in this work: ham, Czech sausage, meat in itsnatural juices and luncheon meat. The results of mPCR and mqPCR analysis are shown in Table 4,examples of primary results in Figure 6.
Table 4. Results of meat sample by DNA analysis.
Product Declared Composition mPCR mqPCR
Pork Chicken Beef Pork Chicken/Turkey Beef Pork Chicken Beef
1 Chicken ham - + - - + - - + -
2 Poultry ham - + - - + - - + -
3 Pork ham + - - + - - + - -
4 Sausage + - + + - + + - +
5 Sausage + - + + - + + - +
Foods 2020, 9, 1269 15 of 19
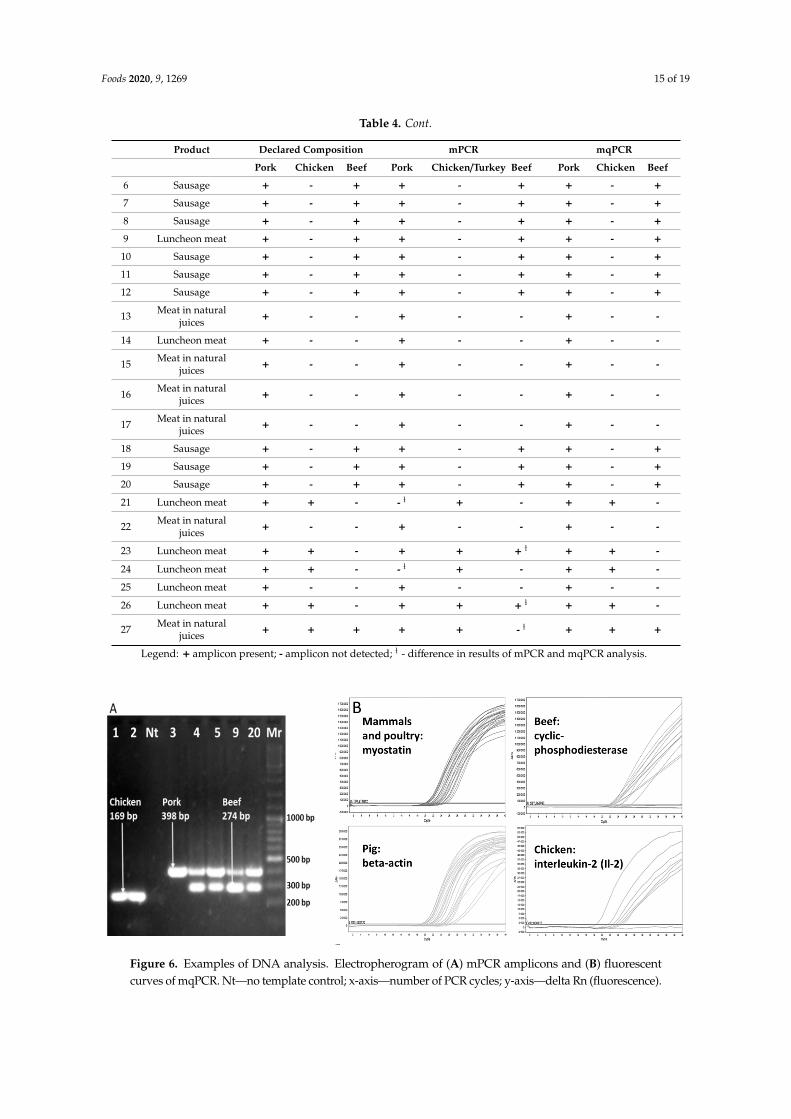
Table 4. Cont.
Product Declared Composition mPCR mqPCR
Pork Chicken Beef Pork Chicken/Turkey Beef Pork Chicken Beef
6 Sausage + - + + - + + - +
7 Sausage + - + + - + + - +
8 Sausage + - + + - + + - +
9 Luncheon meat + - + + - + + - +
10 Sausage + - + + - + + - +
11 Sausage + - + + - + + - +
12 Sausage + - + + - + + - +
13 Meat in naturaljuices + - - + - - + - -
14 Luncheon meat + - - + - - + - -
15 Meat in naturaljuices + - - + - - + - -
16 Meat in naturaljuices + - - + - - + - -
17 Meat in naturaljuices + - - + - - + - -
18 Sausage + - + + - + + - +
19 Sausage + - + + - + + - +
20 Sausage + - + + - + + - +
21 Luncheon meat + + - - ł + - + + -
22 Meat in naturaljuices + - - + - - + - -
23 Luncheon meat + + - + + + ł + + -
24 Luncheon meat + + - - ł + - + + -
25 Luncheon meat + - - + - - + - -
26 Luncheon meat + + - + + + ł + + -
27 Meat in naturaljuices + + + + + - ł + + +
Legend: + amplicon present; - amplicon not detected; ł - difference in results of mPCR and mqPCR analysis.
Foods 2020, 9, x FOR PEER REVIEW 15 of 19
12 Sausage + - + + - + + - + 13 Meat in natural juices + - - + - - + - - 14 Luncheon meat + - - + - - + - - 15 Meat in natural juices + - - + - - + - - 16 Meat in natural juices + - - + - - + - - 17 Meat in natural juices + - - + - - + - - 18 Sausage + - + + - + + - + 19 Sausage + - + + - + + - + 20 Sausage + - + + - + + - + 21 Luncheon meat + + - -� + - + + - 22 Meat in natural juices + - - + - - + - - 23 Luncheon meat + + - + + +� + + - 24 Luncheon meat + + - -� + - + + - 25 Luncheon meat + - - + - - + - - 26 Luncheon meat + + - + + +� + + - 27 Meat in natural juices + + + + + -� + + +
Legend: + amplicon present; - amplicon not detected; ᵻ - difference in results of mPCR and mqPCR analysis.
Figure 6. Examples of DNA analysis. Electropherogram of (A) mPCR amplicons and (B) fluorescent curves of mqPCR. Nt—no template control; x-axis—number of PCR cycles; y-axis—delta Rn (fluorescence).
Analyses of hams by quadruplex PCR of mtDNA and multiplex qPCR of genomic DNA gave the same results, the presence of the declared animal species (i.e., chicken or pig) was established. Eleven samples of typical Czech sausages were analyzed by mPCR, with identical results obtained for both target DNA (mtDNA and gDNA). The presence of the animal species declared in the label (i.e., beef and/or pork) was proved. Six cans of meat in natural juices were analyzed, five were made mainly from pork and one was made mainly from beef. Results that matched the labels were obtained for both target DNAs (mtDNA and gDNA) for all five pork cans. Beef meat in natural juices (sample 27) also contained mechanically separated poultry meat and pork skin, all three animal´s DNA was detected by mqPCR with gDNA as a target. It worked despite the heat treatment. Seven different Luncheon meats were analyzed, all the results obtained by mqPCR with gDNA as a target corresponded to the declaration on the label. A discrepancy between the results of mtDNA and gDNA analysis was observed in this type of meat product (luncheon meat). White adipose tissue (univacuolar adipocytes) contains a low number of mitochondria. The use of mqPCR amplified gDNA, which enables the better detection of a low amount of target DNA, is recommended for the analysis of samples containing large quantities of fat (e.g., luncheon meat).
Figure 6. Examples of DNA analysis. Electropherogram of (A) mPCR amplicons and (B) fluorescentcurves of mqPCR. Nt—no template control; x-axis—number of PCR cycles; y-axis—delta Rn (fluorescence).
Foods 2020, 9, 1269 16 of 19
Analyses of hams by quadruplex PCR of mtDNA and multiplex qPCR of genomic DNA gavethe same results, the presence of the declared animal species (i.e., chicken or pig) was established.Eleven samples of typical Czech sausages were analyzed by mPCR, with identical results obtainedfor both target DNA (mtDNA and gDNA). The presence of the animal species declared in the label(i.e., beef and/or pork) was proved. Six cans of meat in natural juices were analyzed, five were mademainly from pork and one was made mainly from beef. Results that matched the labels were obtainedfor both target DNAs (mtDNA and gDNA) for all five pork cans. Beef meat in natural juices (sample27) also contained mechanically separated poultry meat and pork skin, all three animal´s DNA wasdetected by mqPCR with gDNA as a target. It worked despite the heat treatment. Seven differentLuncheon meats were analyzed, all the results obtained by mqPCR with gDNA as a target correspondedto the declaration on the label. A discrepancy between the results of mtDNA and gDNA analysis wasobserved in this type of meat product (luncheon meat). White adipose tissue (univacuolar adipocytes)contains a low number of mitochondria. The use of mqPCR amplified gDNA, which enables the betterdetection of a low amount of target DNA, is recommended for the analysis of samples containing largequantities of fat (e.g., luncheon meat).
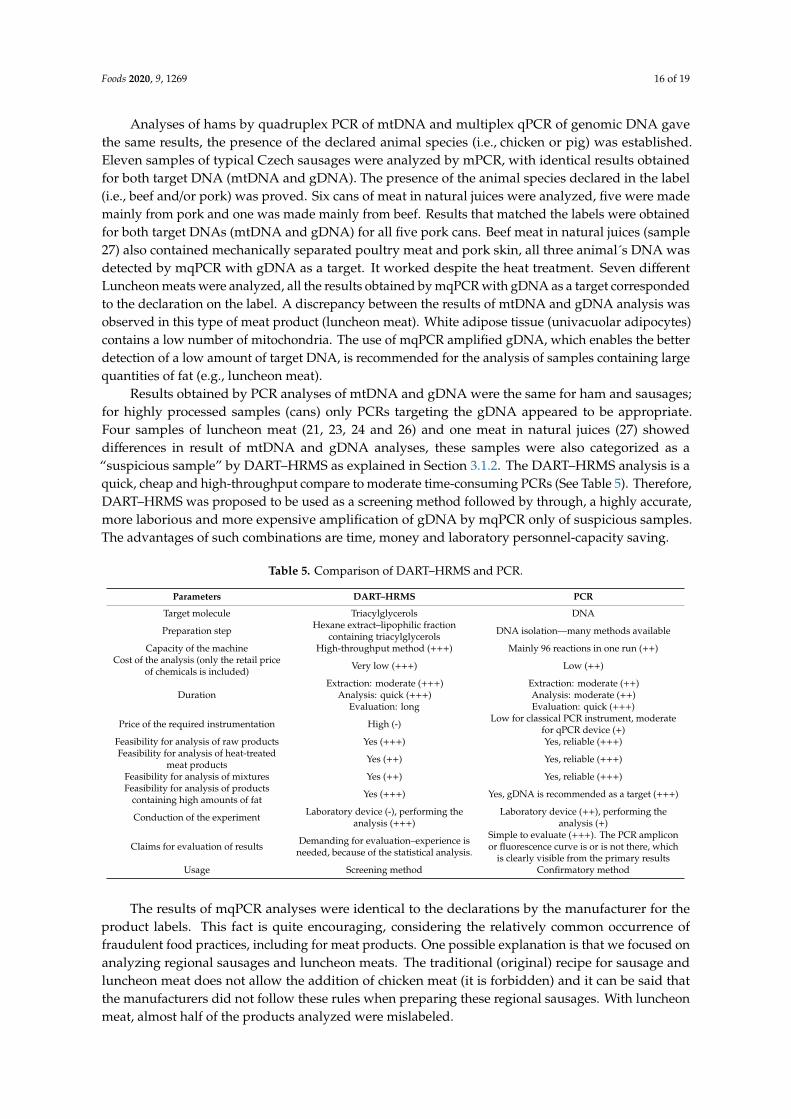
Results obtained by PCR analyses of mtDNA and gDNA were the same for ham and sausages;for highly processed samples (cans) only PCRs targeting the gDNA appeared to be appropriate.Four samples of luncheon meat (21, 23, 24 and 26) and one meat in natural juices (27) showeddifferences in result of mtDNA and gDNA analyses, these samples were also categorized as a“suspicious sample” by DART–HRMS as explained in Section 3.1.2. The DART–HRMS analysis is aquick, cheap and high-throughput compare to moderate time-consuming PCRs (See Table 5). Therefore,DART–HRMS was proposed to be used as a screening method followed by through, a highly accurate,more laborious and more expensive amplification of gDNA by mqPCR only of suspicious samples.The advantages of such combinations are time, money and laboratory personnel-capacity saving.
Table 5. Comparison of DART–HRMS and PCR.
Parameters DART–HRMS PCR
Target molecule Triacylglycerols DNA
Preparation step Hexane extract–lipophilic fractioncontaining triacylglycerols DNA isolation—many methods available
Capacity of the machine High-throughput method (+++) Mainly 96 reactions in one run (++)Cost of the analysis (only the retail price
of chemicals is included) Very low (+++) Low (++)
DurationExtraction: moderate (+++)
Analysis: quick (+++)Evaluation: long
Extraction: moderate (++)Analysis: moderate (++)Evaluation: quick (+++)
Price of the required instrumentation High (-) Low for classical PCR instrument, moderatefor qPCR device (+)
Feasibility for analysis of raw products Yes (+++) Yes, reliable (+++)Feasibility for analysis of heat-treated
meat products Yes (++) Yes, reliable (+++)
Feasibility for analysis of mixtures Yes (++) Yes, reliable (+++)Feasibility for analysis of products
containing high amounts of fat Yes (+++) Yes, gDNA is recommended as a target (+++)
Conduction of the experiment Laboratory device (-), performing theanalysis (+++)
Laboratory device (++), performing theanalysis (+)
Claims for evaluation of results Demanding for evaluation–experience isneeded, because of the statistical analysis.
Simple to evaluate (+++). The PCR ampliconor fluorescence curve is or is not there, which
is clearly visible from the primary resultsUsage Screening method Confirmatory method
The results of mqPCR analyses were identical to the declarations by the manufacturer for theproduct labels. This fact is quite encouraging, considering the relatively common occurrence offraudulent food practices, including for meat products. One possible explanation is that we focused onanalyzing regional sausages and luncheon meats. The traditional (original) recipe for sausage andluncheon meat does not allow the addition of chicken meat (it is forbidden) and it can be said thatthe manufacturers did not follow these rules when preparing these regional sausages. With luncheonmeat, almost half of the products analyzed were mislabeled.
Foods 2020, 9, 1269 17 of 19
The requirements are set out in Act No. 326/2001 Coll., issued by the Czech Ministry of Agriculture,which imposes requirements for meat labeling. Ham is made from the musculature of pork, poultry orbeef, a heat-treated product. As for sausages, in this study, typical Czech sausages called “Špekácky”were analyzed. These are a kind of sausage made from a finely minced mixture of pork and beef withsmoked bacon pieces that gave the product its name. The true sausage according to the original recipeshould consist of 50% beef, 20% pork cut out of the skin and 30% chopped bacon pieces. The basicraw materials according to current regulations are beef, pork or veal; a minimum of 40% meat anda maximum of 45% fat are required, and it does not allow the use of mechanically separated meatand poultry. The last two products were canned, i.e., products hermetically sealed in packaging andsterilized. According to the current regulation, canned food called “pork in natural juices” must containat least 70% meat. The water content must not exceed 70% and the fat may be up to 40%. Canned foodcalled “beef in natural juices” must contain at least 70% meat, the water content must not exceed 80%,and the fat may be up to 20%. The sum of all parameters exceeds 100% due to the fact that much of thefat and water in the product comes from the meat used. Luncheon meat should be made from porkand beef. The law specifies pork luncheon meat, which has the same limits on meat, fat and watercontent as “pork in natural juices”.
3.1.5. Comparison of Methods
Commonly used molecular genetic methods such as PCR are based on the isolation and analysisof different DNA types, while the new innovative DART–HRMS analytical method is focused onthe analysis of TAGs profiles. PCRs use DNA markers, which are unique, stable, well-known andindependent of the type of animal breeding. Detection/quantification of these DNA markers can be usedalso for the investigation of mixed animal meat products. The quality and quantity of isolated DNA isthe crucial parameter for the successful use of molecular genetic methods. There are many differentprocedures for isolating and analyzing DNA, which differ in the yield, cost and time requirements ofthe procedure. In PCR analysis, the whole procedure usually takes hours. Sample preparation forDART–HRMS is very simple and fast; the DART–HRMS analysis itself requires only a few seconds.On the other hand, the evaluation of the obtained data are significantly simplified with PCR analysiscompared to the use of advanced chemometric analysis in the DART–HRMS evaluation procedure.With the DART–HRMS process, up to 130 samples per hour can be measured, while these 130 samplescan take at least one working day to be analyzed by mPCR. On the other hand, PCR providesaccurate results and is considered an arbitrary method, whereas the DART–HRMS method is primarilya screening method for testing a large number of samples and selecting only suspect specimens,which are then confirmed by DNA analysis (Table 5).
4. Conclusions
In the presented work the multiplex mPCR analysis of DNA and DART–HRMS analysis of theTAGs profile of meat (pork, beef, chicken) in combination with multivariate statistical analysis werecompared theoretically and practically. In both cases, comparable results were obtained. DART–HRMSis a quick method with a great potential for screening a large number of samples. PCRs analysis can beused for precise animal species identification; however, it takes more time to get results.
Our results suggest that DART–HRMS could be used primarily as a screening method andsuspected samples could be subsequently analyzed by PCR method. This combination of bothapproaches has potential for meat type verification or detection of adulteration, respectively.
Author Contributions: The following authors contributed to this article in the following ways: Conceptualizationand methodology, K.Z. and V.H.; software, V.H. and M.J.; validation, J.P., E.C. and D.J.; formal analysis, K.Z., V.H.,J.P., E.C. and D.J.; investigation and data curation, K.Z. and V.H.; resources, K.D., J.P. and J.H.; writing—originaldraft preparation, all authors; writing—review and editing, K.Z., V.H., J.H. and K.D.; visualization, D.J.; supervision,project administration and funding acquisition, K.D., J.P. and J.H. All authors have read and agreed to the publishedversion of the manuscript.

Foods 2020, 9, 1269 18 of 19
Funding: This research was funded by a grant from the Ministry of Agriculture of the Czech Republic: NationalAgency for Agricultural Research project number QJ1530272: Complex strategies for the effective detection of foodfraud in the production-consumer chain and the projects ERDF CZ.2.16/3.1.00/21537 and CZ.2.16/3.1.00/24503 andMETROFOOD-CZ research infrastructure project (MEYS Grant No.: LM2018100) including access to its facilities.
Conflicts of Interest: The authors declare no conflict of interest.
References
1. Hsieh, Y.P.; Woodward, B.B.; Ho, S.H. Detection of Species Substitution in Raw and Cooked Meats UsingImmunoassays. J. Food Prot. 1995, 58, 555–559. [CrossRef] [PubMed]
2. Ballin, N.Z.; Vogensen, F.K.; Karlsson, A.H. Species determination—Can we detect and quantify meatadulteration? Meat Sci. 2009, 83, 165–174. [CrossRef] [PubMed]
3. Fajardo, V.; González, I.; Rojas, M.; García, T.; Martín, R. A review of current PCR-based methodologies forthe authentication of meats from game animal species. Trends Food Sci. Technol. 2010, 21, 408–421. [CrossRef]
4. Köppel, R.; Daniels, M.; Felderer, N.; Brünen-Nieweler, C. Multiplex real-time PCR for the detection andquantification of DNA from duck, goose, chicken, turkey and pork. Eur. Food Res. Technol. 2013, 236,1093–1098. [CrossRef]
5. Iwobi, A.; Sebah, D.; Spielmann, G.; Maggipinto, M.; Schrempp, M.; Kraemer, I.; Gerdes, L.; Busch, U.;Huber, I. A multiplex real-time PCR method for the quantitative determination of equine (horse) fractions inmeat products. Food Control 2017, 74, 89–97. [CrossRef]
6. Griffiths, A.M.; Sotelo, C.G.; Mendes, R.; Pérez-Martín, R.I.; Schröder, U.; Shorten, M.; Silva, H.A.;Verrez-Bagnis, V.; Mariani, S. Current methods for seafood authenticity testing in Europe: Is there aneed for harmonisation? Food Control 2014, 45, 95–100. [CrossRef]
7. Murugaiah, C.; Al-Talib, H.; Radu, S. Forensics: Food Authentication Using MtDNA. J. Nutr. Health Food Sci.2015, 3, 1–10. [CrossRef]
8. Mozola, M.A.; Peng, X.; Wendorf, M.; Artiga, L. Evaluation of the GeneQuence® DNA hybridization methodin conjunction with 24-h enrichment protocols for detection of Salmonella spp. in select foods: Collaborativestudy. J. AOAC Int. 2007, 90, 738–755. [CrossRef]
9. Tichoniuk, M.; Ligaj, M.; Filipiak, M. Application of DNA hybridization biosensor as a screening method forthe detection of genetically modified food components. Sensors 2008, 8, 2118–2135. [CrossRef]
10. Chapela, M.J.; Sotelo, C.G.; Calo-Mata, P.; Pérez-Martín, R.I.; Rehbein, H.; Hold, G.L.; Quinteiro, J.;Rey-Méndez, M.; Rosa, C.; Santos, A.T. Identification of Cephalopod Species (Ommastrephidae andLoliginidae) in Seafood Products by Forensically Informative Nucleotide Sequencing (FINS). J. Food Sci. 2002,67, 1672–1676. [CrossRef]
11. Iwobi, A.; Sebah, D.; Kraemer, I.; Losher, C.; Fischer, G.; Busch, U.; Huber, I. A multiplex real-time PCRmethod for the quantification of beef and pork fractions in minced meat. Food Chem. 2015, 169, 305–313.[CrossRef] [PubMed]
12. Matsunaga, T.; Chikuni, K.; Tanabe, R.; Muroya, S.; Shibata, K.; Yamada, J.; Shinmura, Y. A quick and simplemethod for the identification of meat species and meat products by PCR assay. Meat Sci. 1999, 51, 143–148.[CrossRef]
13. Barbuto, M.; Galimberti, A.; Ferri, E.; Labra, M.; Malandra, R.; Galli, P.; Casiraghi, M. DNA barcodingreveals fraudulent substitutions in shark seafood products: The Italian case of “palombo” (Mustelus spp.).Food Res. Int. 2010, 43, 376–381. [CrossRef]
14. Thakur, M.; Singh, S.; Shukla, M.; Sharma, L.; Agarwal, N.; Goyal, S.; Sambandam, S. Identification ofGalliformes through Forensically Informative Nucleotide Sequencing (FINS) and its Implication in WildlifeForensics. J. Forensic Res. 2012, 4. [CrossRef]
15. Jíru, M.; Stranska, M.; Kocourek, V.; Krmela, A.; Tomaniová, M.; Rosmus, J.; Hajslova, J. Authenticationof meat species and net muscle proteins: Updating of an old concept. Czech J. Food Sci. 2019, 37, 205–211.[CrossRef]
16. Ruiz Orduna, A.; Husby, E.; Yang, C.T.; Ghosh, D.; Beaudry, F. Assessment of meat authenticity usingbioinformatics, targeted peptide biomarkers and high-resolution mass spectrometry. Food Addit. Contam.Part A 2015, 32, 1709–1717. [CrossRef]
Foods 2020, 9, 1269 19 of 19
17. Cody, R.B.; Laramée, J.A.; Durst, H.D. Versatile new ion source for the analysis of materials in open air underambient conditions. Anal. Chem. 2005, 77, 2297–2302. [CrossRef]
18. Hajslova, J.; Cajka, T.; Vaclavik, L. Challenging applications offered by direct analysis in real time (DART) infood-quality and safety analysis. TrAC Trends Anal. Chem. 2011, 30, 204–218. [CrossRef]
19. Worley, B.; Powers, R. Multivariate Analysis in Metabolomics. Curr. Metab. 2013, 1, 92–107. [CrossRef]20. Blasco, H.; Błaszczynski, J.; Billaut, J.C.; Nadal-Desbarats, L.; Pradat, P.F.; Devos, D.; Moreau, C.; Andres, C.R.;
Emond, P.; Corcia, P.; et al. Comparative analysis of targeted metabolomics: Dominance-based rough setapproach versus orthogonal partial least square-discriminant analysis. J. Biomed. Inform. 2015, 53, 291–299.[CrossRef]
21. Berrueta, L.A.; Alonso-Salces, R.M.; Héberger, K. Supervised pattern recognition in food analysis.J. Chromatogr. A 2007, 1158, 196–214. [CrossRef]
22. Triba, M.N.; Le Moyec, L.; Amathieu, R.; Goossens, C.; Bouchemal, N.; Nahon, P.; Rutledge, D.N.; Savarin, P.PLS/OPLS models in metabolomics: The impact of permutation of dataset rows on the K-fold cross-validationquality parameters. Mol. Biosyst. 2015, 11, 13–19. [CrossRef]
23. ISO. Foodstuffs-Methods of Analysis for the Detection of Genetically Modified Organisms and Derived Products-NucleicAcid Extraction; ANSI: New York, NY, USA, 2005.
24. Zdenková, K.; Akhatova, D.; Fialová, E.; Krupa, O.; Kubica, L.; Lencová, S.; Demnerová, K. Detection ofmeat adulteration: Use of efficient and routine-suited multiplex polymerase chain reaction-based methodsfor species authentication and quantification in meat products. J. Food Nutr. Res. 2018, 57, 351–362.
25. Laube, I.; Zagon, J.; Spiegelberg, A.; Butschke, A.; Kroh, L.W.; Broll, H. Development and design of a‘ready-to-use’ reaction plate for a PCR-based simultaneous detection of animal species used in foods. Int. J.Food Sci. Technol. 2007, 42, 9–17. [CrossRef]
26. Köppel, R.; Ruf, J.; Zimmerli, F.; Breitenmoser, A. Multiplex real-time PCR for the detection and quantificationof DNA from beef, pork, chicken and turkey. Eur. Food Res. Technol. 2008, 227, 1199–1203. [CrossRef]
27. Laube, I.; Spiegelberg, A.; Butschke, A.; Zagon, J.; Schauzu, M.; Kroh, L.; Broll, H. Methods for the detectionof beef and pork in foods using real-time polymerase chain reaction. Int. J. Food Sci. Technol. 2003, 38, 111–118.[CrossRef]
28. Hurkova, K.; Uttl, L.; Rubert, J.; Navratilova, K.; Kocourek, V.; Stranska-Zachariasova, M.; Paprstein, F.;Hajslova, J. Cranberries versus lingonberries: A challenging authentication of similar Vaccinium fruit.Food Chem. 2019, 284, 162–170. [CrossRef] [PubMed]
29. Hrbek, V.; Rektorisova, M.; Chmelarova, H.; Ovesna, J.; Hajslova, J. Authenticity assessment of garlic using ametabolomic approach based on high resolution mass spectrometry. J. Food Compos. Anal. 2018, 67, 19–28.[CrossRef]
© 2020 by the authors. Licensee MDPI, Basel, Switzerland. This article is an open accessarticle distributed under the terms and conditions of the Creative Commons Attribution(CC BY) license (http://creativecommons.org/licenses/by/4.0/).