Are microbial indicators and pathogens correlated? A statistical analysis of 40 years of research
15
Provided for non-commercial research and educational use only. Not for reproduction or distribution or commercial use. This article was originally published by IWA Publishing. IWA Publishing recognizes the retention of the right by the author(s) to photocopy or make single electronic copies of the paper for their own personal use, including for their own classroom use, or the personal use of colleagues, provided the copies are not offered for sale and are not distributed in a systematic way outside of their employing institution. Please note that you are not permitted to post the IWA Publishing PDF version of your paper on your own website or your institution’s website or repository. Please direct any queries regarding use or permissions to [email protected]
Transcript of Are microbial indicators and pathogens correlated? A statistical analysis of 40 years of research

Provided for non-commercial research and educational use only. Not for reproduction or distribution or commercial use.
This article was originally published by IWA Publishing. IWA Publishing recognizes the retention of the right by the author(s) to photocopy or make single electronic
copies of the paper for their own personal use, including for their own classroom use, or the personal use of colleagues, provided the copies are not offered for sale and
are not distributed in a systematic way outside of their employing institution.
Please note that you are not permitted to post the IWA Publishing PDF version of your paper on your own website or your institution’s website or repository.
Please direct any queries regarding use or permissions to [email protected]
265 © IWA Publishing 2011 Journal of Water and Health | 09.2 | 2011
Are microbial indicators and pathogens correlated?
A statistical analysis of 40 years of research
J. Wu, S. C. Long, D. Das and S. M. Dorner
ABSTRACT
Indicator organisms are used to assess public health risk in recreational waters, to highlight periods
of challenge to drinking water treatment plants, and to determine the effectiveness of treatment and
the quality of distributed water. However, many have questioned their efficacy for indicating
pathogen risk. Five hundred and forty cases representing independent indicator–pathogen
correlations were obtained from the literature for the period 1970–2009. The data were analyzed to
assess factors affecting correlations using a logistic regression model considering indicator classes,
pathogen classes, water types, pathogen sources, sample size, the number of samples with
pathogens, the detection method, year of publication and statistical methods. Although no single
indicator was identified as the most correlated with pathogens, coliphages, F-specific coliphages,
Clostridium perfringens, fecal streptococci and total coliforms were more likely than other indicators
to be correlated with pathogens. The most important factors in determining correlations between
indicator–pathogen pairs were the sample size and the number of samples positive for pathogens.
Pathogen sources, detection methods and other variables have little influence on correlations
between indicators and pathogens. Results suggest that much of the controversy with regards to
indicator and pathogen correlations is the result of studies with insufficient data for assessing
correlations.
doi: 10.2166/wh.2011.117
J. WuGillings School of Global Public Health,166 Rosenau Hall, CB #7431,University of North Carolina Chapel Hill,Chapel Hill, NC 27599-7431,USA
S. C. LongWisconsin State Laboratory of Hygiene and
Department of Soil Science,2601 Agriculture Drive,University of Wisconsin,Madison, WI 53718,USA
D. DasEnvironmental and Occupational Health Sciences,
School of Public Health,University of Illinois at Chicago,2121 W. Taylor Street, Chicago, IL 60612,USA
S. M. Dorner (corresponding author)Department of Civil, Geological
and Mining Engineering,École Polytechnique de Montréal,P.O. Box 6079, Station Centre-ville,Montréal, QC,Canada H3C3A7E-mail: [email protected]
Key words | correlation, indicators, logistic regression, pathogens, sample size, waterINTRODUCTION
Concerns regarding microbial contamination of waters con-
tinue as a result of documented waterborne disease
outbreaks (Mackenzie et al. ; Hrudey & Hrudey )
and observations of pathogenic contamination of water
(e.g. Aboytes et al. ). Waterborne pathogens may
impact drinking water supplies, recreational waters and
source waters for agriculture and aquaculture.
The monitoring of indicator organisms is required by
law in many political jurisdictions worldwide, for example
the Total Coliform Rule in the US (US EPA ). However,
the indicator organism systems used are imperfect and the
absence of indicators in water does not ensure the absence
of pathogenic microorganisms and their presence does not
always pose a public health risk. With many studies provid-
ing conflicting results with regards to quantitative
relationships between indicators and pathogens, it can be
difficult to evaluate the health risks of decisions based on
indicator results. Many have attempted to identify the
most suitable indicators for signaling the presence of patho-
gens based upon correlations (e.g. Stetler ; Payment &
Franco ) and many have not found correlations among
indicators and pathogens (e.g. Carter et al. ; Noble &
Fuhrman ).
Coliforms are the most frequently studied indicators
because they have been included in drinking water regu-
lations. Several investigators have observed relationships
between the presence of traditional indicators and illnesses.
Raina et al. () found Escherichia coli in well water was
significantly associated with gastrointestinal illness in family
members. Craun et al. () observed that the presence of
266 J. Wu et al. | Are microbial indicators and pathogens correlated? Journal of Water and Health | 09.2 | 2011
coliforms correlated very well with the presence of viral gas-
troenteritis when evaluating outbreaks of gastroenteritis
associated with consumption of groundwater.
In 2007, Yates presented a discussion of how criteria for
a microbial indicator may change depending on the ques-
tions being asked. Therefore, specific ideal characteristics
of indicators applied to drinking waters and recreational
waters could be different. Beach water quality monitoring
has relied heavily on a different subset of bacterial indicators
than drinking water monitoring. For example, under the
Beaches Environmental Assessment and Coastal Health
Act of 2000 (BEACH Act) in the US, monitoring for the
presence of fecal coliforms, enterococci or E. coli are the
indicators most often used to determine whether or not
swimming waters are safe (US EPA ). The US standards
for freshwater beach quality using coliforms and enterococci
as indicators were based upon epidemiological studies
demonstrating health risks for swimmers in relation to indi-
cator densities (US EPA , ).
Factors affecting the strength of correlations between
indicators and pathogens include resistance to environ-
mental stressors and growth, transport characteristics,
carriage rates and shedding patterns among host popu-
lations, presence of host populations, waste management
practices affecting inactivation/removal during treatment,
and time of year. These factors are not often quantified
when correlating indicator and pathogen densities. A pri-
mary concern has been with regards to the survival or
persistence differences among indicators and pathogens
(e.g. Lund ; Nasser et al. ). Alternative indicators
of fecal contamination have been proposed because of the
limitations associated with coliforms, such as lower environ-
mental resistance than protozoa or differential transport
characteristics from viruses. A review of traditional and
alternative indicators is provided by Savichtcheva &
Okabe ().
The development of new rapid methods for detecting
pathogens using molecular tools such as quantitative
real-time PCR (e.g. Guy et al. ) and microarrays (e.g.
Maynard et al. ) will allow for monitoring of a greater
number of pathogens and raises the question of the future
utility of microbial indicators (Committee on Indicators for
Waterborne Pathogens ). Even with validation of micro-
array technology, monitoring for the hundreds of known
waterborne pathogens remains impractical. A new paradigm
is evolving among the water microbiology community, to
utilize different indicator systems depending on the question
being asked (Yates ). Indicator organisms such as E. coli
and enterococci will continue to be used amongst a growing
number of tools for assessing the risk of microbial and
pathogenic contamination and indicating the presence of
fecal contamination (Yates ).
The overall goal of this study was to investigate the
relationship between microbial indicators and pathogens
in a variety of water environments. The specific objectives
of this research were to: (1) determine the number and
strength of correlated cases of indicators with pathogens
across a broad sampling of published studies; (2) determine
whether some indicators demonstrate higher correlations
with given pathogens; and (3) determine which factors influ-
ence reported correlations (e.g. water environment, number
of samples, pathogen detection and enumeration methods,
statistical methods).
METHODS
Data collection
Data were collected on the relationship between indicators
and pathogens from the literature published in scientific
journals for the period 1970–2009. An individual case of
an indicator–pathogen pair represents a statistical analysis
of a published dataset of one indicator type with one patho-
gen type where the methods of statistical analysis,
correlation coefficients and p values were reported.
Indicator–pathogen pairs were retained only if their corre-
lations were explicitly recorded and correlation analyses
were not performed on grouped data across water types
(e.g. freshwater and sewage). Some water environments
were not considered (i.e. groundwaters, treated drinking
waters and sand/sediments). Groundwaters, treated drink-
ing waters and waters from drinking water distribution
systems were not considered because of the relatively low
frequency of pathogen detection. Pathogen correlation
with indicators in groundwaters was recently addressed by
Payment & Locas () and supports the exclusion of
waters with low levels of contamination from the current
267 J. Wu et al. | Are microbial indicators and pathogens correlated? Journal of Water and Health | 09.2 | 2011
analysis. They did not observe any direct correlation
between indicators and pathogens and stated that corre-
lations should not be expected in such waters given the
dilution, persistence and low probability of the presence of
infected hosts at any given time. Sediments and sands
were not considered because environmental monitoring
for regulatory purposes is limited to the water phase.
Once the cases of interest were found, the specific types
of indicators and pathogens were recorded along with their
relationship (significantly correlated or not), geographic
location, the method used for pathogen detection and enu-
meration, water type, the statistical method used for
correlation analysis, the year of publication, the number of
samples collected, the percentage of samples positive for
pathogens and the total number of positive pathogen
samples. The water type was further classified according to
sources of known contamination and subclass (i.e. stream
or lake, level of treatment, etc.).
Five hundred and forty independent indicator–pathogen
pairs were retained in the dataset. Indicators among
the pairs included total coliforms, fecal coliforms, fecal strep-
tococci enterococci, E. coli, Clostridium perfringens,
heterotrophic bacteria, aerobic spores, spores of sulfite-
reducing bacteria, somatic coliphages, male-specific coli-
phages and phages infecting Bacteroides fragilis. Pathogens
(and pathogen genes) among the pairs included Giardia,
Cryptosporidium, Campylobacter, Helicobacter pylori,
Salmonella, shiga toxin genes, Pseudomonas aeruginosa,
Aeromonads, Vibrio, Staphylococcus aureus, hepatitis A
virus, adenoviruses, astroviruses, noroviruses, sapoviruses,
enteroviruses, human enteric viruses, filamentous fungi,
yeasts and Candida albicans.
Statistical analysis
The collected data were primarily analyzed using SPSS 15.0
software (SPSS Inc., Chicago, IL, USA) for the descriptive
statistical analyses, such as total number of cases, the
types and frequency of indicators and pathogens, etc. The
association between indicators and pathogens and its stat-
istical significance was examined by logistical regression.
A general model for logistic regression can be written as:
logit[pr(y¼ 1)]¼ β0þ β1x1þ β2x2þ ···þ βjxj, where y is the
dependent variable, which is in binary data format.
Namely, if there is a significant positive correlation corre-
sponding to an indicator–pathogen pair, y is equal to 1;
otherwise y is equal to 0. β0 is the intercept; β1, β2,… , βjare the regression coefficients and x1, x2,… , xj are indepen-
dent variables. Nine independent variables were considered
in the logistic regression model: (1) indicators, (2) patho-
gens, (3) water types, (4) sources of pathogens, (5) sample
size, (6) positive samples of pathogens, (7) detection
methods for pathogens, (8) methods of correlation analysis
and (9) the year of publication. The detailed explanations
for each variable are shown in Table 1. Each variable was
coded and reclassified as category data. Dummy variables
were created for each variable when the analysis was con-
ducted. For example, when we calculate the association
between E. coli with pathogens, we assume x¼ 1 if the indi-
cator is E. coli and x¼ 0 if the indicator is not E. coli. The
association is indexed by the odds ratio (OR), which is the
ratio of the odds when the indicator is E. coli to the odds
when the indicator is not E. coli. The null hypothesis is
that the number of correlated cases and uncorrelated cases
are equal, namely the possibility that indicators are corre-
lated with pathogens is the same as the possibility that
indicators are not correlated with pathogens (OR¼ 1). If
the null hypothesis was rejected at a significance level of
0.05 and OR is larger than 1, it was assumed that
the relationship between indicators and pathogens was
significant. If the null hypothesis was rejected at a signifi-
cance level of 0.05 and OR is less than 1, it was assumed
that the relationship between indicators and pathogens
was not significantly correlated. The confounding and inter-
action effects were examined by the likelihood ratio statistic:
LR¼�2logLR� (�2logLF), where LR is the likelihood ratio,
LR is the likelihood for the full model and LF is the likeli-
hood for the partial model. The logistic regression was
carried out using SAS 9.2 (SAS Inc., Cary, NC, USA).
Geographic analysis
A geographic information system (GIS) was used to analyze
the potential geographic variation of indicator–pathogen
relationships. For each case, a geographic coordinate was
assumed based on the description of the study area in the
paper. The error between the assumed location and the real
location can be neglected since the scale of our study is the
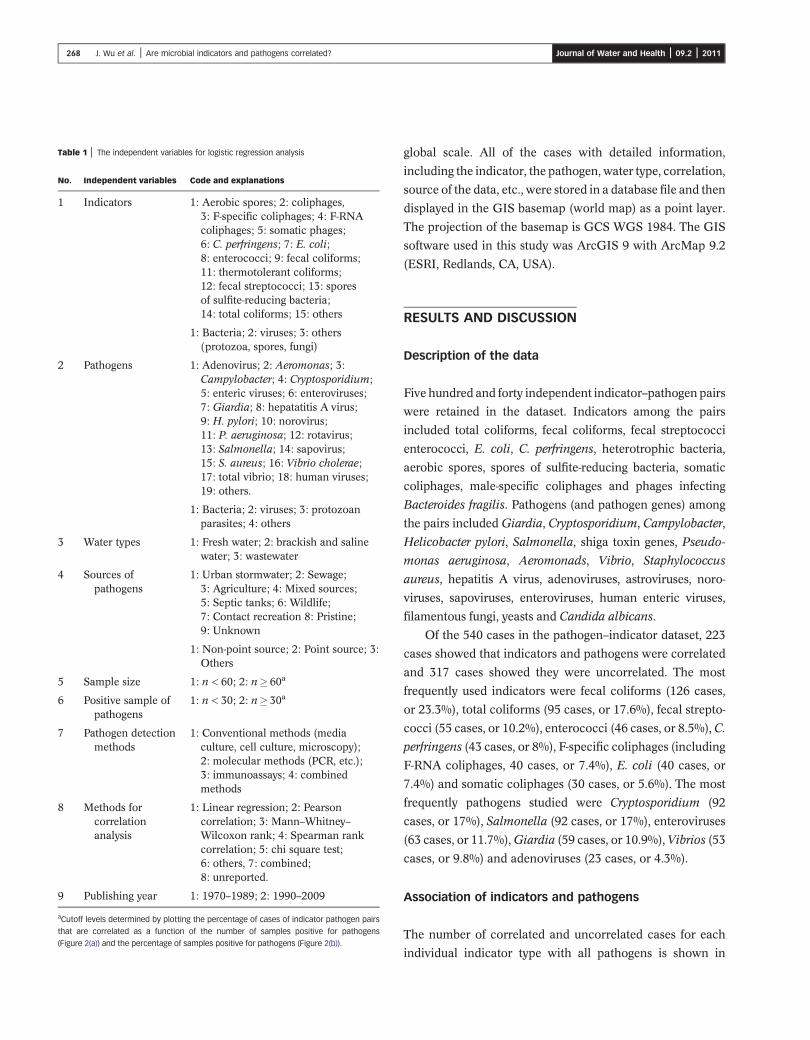
Table 1 | The independent variables for logistic regression analysis
No. Independent variables Code and explanations
1 Indicators 1: Aerobic spores; 2: coliphages,3: F-specific coliphages; 4: F-RNAcoliphages; 5: somatic phages;6: C. perfringens; 7: E. coli;8: enterococci; 9: fecal coliforms;11: thermotolerant coliforms;12: fecal streptococci; 13: sporesof sulfite-reducing bacteria;14: total coliforms; 15: others
1: Bacteria; 2: viruses; 3: others(protozoa, spores, fungi)
2 Pathogens 1: Adenovirus; 2: Aeromonas; 3:Campylobacter; 4: Cryptosporidium;5: enteric viruses; 6: enteroviruses;7: Giardia; 8: hepatatitis A virus;9: H. pylori; 10: norovirus;11: P. aeruginosa; 12: rotavirus;13: Salmonella; 14: sapovirus;15: S. aureus; 16: Vibrio cholerae;17: total vibrio; 18: human viruses;19: others.
1: Bacteria; 2: viruses; 3: protozoanparasites; 4: others
3 Water types 1: Fresh water; 2: brackish and salinewater; 3: wastewater
4 Sources ofpathogens
1: Urban stormwater; 2: Sewage;3: Agriculture; 4: Mixed sources;5: Septic tanks; 6: Wildlife;7: Contact recreation 8: Pristine;9: Unknown
1: Non-point source; 2: Point source; 3:Others
5 Sample size 1: n< 60; 2: n� 60a
6 Positive sample ofpathogens
1: n< 30; 2: n� 30a
7 Pathogen detectionmethods
1: Conventional methods (mediaculture, cell culture, microscopy);2: molecular methods (PCR, etc.);3: immunoassays; 4: combinedmethods
8 Methods forcorrelationanalysis
1: Linear regression; 2: Pearsoncorrelation; 3: Mann–Whitney–Wilcoxon rank; 4: Spearman rankcorrelation; 5: chi square test;6: others, 7: combined;8: unreported.
9 Publishing year 1: 1970–1989; 2: 1990–2009
aCutoff levels determined by plotting the percentage of cases of indicator pathogen pairs
that are correlated as a function of the number of samples positive for pathogens
(Figure 2(a)) and the percentage of samples positive for pathogens (Figure 2(b)).
268 J. Wu et al. | Are microbial indicators and pathogens correlated? Journal of Water and Health | 09.2 | 2011
global scale. All of the cases with detailed information,
including the indicator, the pathogen, water type, correlation,
source of the data, etc., were stored in a database file and then
displayed in the GIS basemap (world map) as a point layer.
The projection of the basemap is GCS WGS 1984. The GIS
software used in this study was ArcGIS 9 with ArcMap 9.2
(ESRI, Redlands, CA, USA).
RESULTS AND DISCUSSION
Description of the data
Five hundred and forty independent indicator–pathogen pairs
were retained in the dataset. Indicators among the pairs
included total coliforms, fecal coliforms, fecal streptococci
enterococci, E. coli, C. perfringens, heterotrophic bacteria,
aerobic spores, spores of sulfite-reducing bacteria, somatic
coliphages, male-specific coliphages and phages infecting
Bacteroides fragilis. Pathogens (and pathogen genes) among
the pairs includedGiardia, Cryptosporidium, Campylobacter,
Helicobacter pylori, Salmonella, shiga toxin genes, Pseudo-
monas aeruginosa, Aeromonads, Vibrio, Staphylococcus
aureus, hepatitis A virus, adenoviruses, astroviruses, noro-
viruses, sapoviruses, enteroviruses, human enteric viruses,
filamentous fungi, yeasts and Candida albicans.
Of the 540 cases in the pathogen–indicator dataset, 223
cases showed that indicators and pathogens were correlated
and 317 cases showed they were uncorrelated. The most
frequently used indicators were fecal coliforms (126 cases,
or 23.3%), total coliforms (95 cases, or 17.6%), fecal strepto-
cocci (55 cases, or 10.2%), enterococci (46 cases, or 8.5%),C.
perfringens (43 cases, or 8%), F-specific coliphages (including
F-RNA coliphages, 40 cases, or 7.4%), E. coli (40 cases, or
7.4%) and somatic coliphages (30 cases, or 5.6%). The most
frequently pathogens studied were Cryptosporidium (92
cases, or 17%), Salmonella (92 cases, or 17%), enteroviruses
(63 cases, or 11.7%),Giardia (59 cases, or 10.9%),Vibrios (53
cases, or 9.8%) and adenoviruses (23 cases, or 4.3%).
Association of indicators and pathogens
The number of correlated and uncorrelated cases for each
individual indicator type with all pathogens is shown in
269 J. Wu et al. | Are microbial indicators and pathogens correlated? Journal of Water and Health | 09.2 | 2011
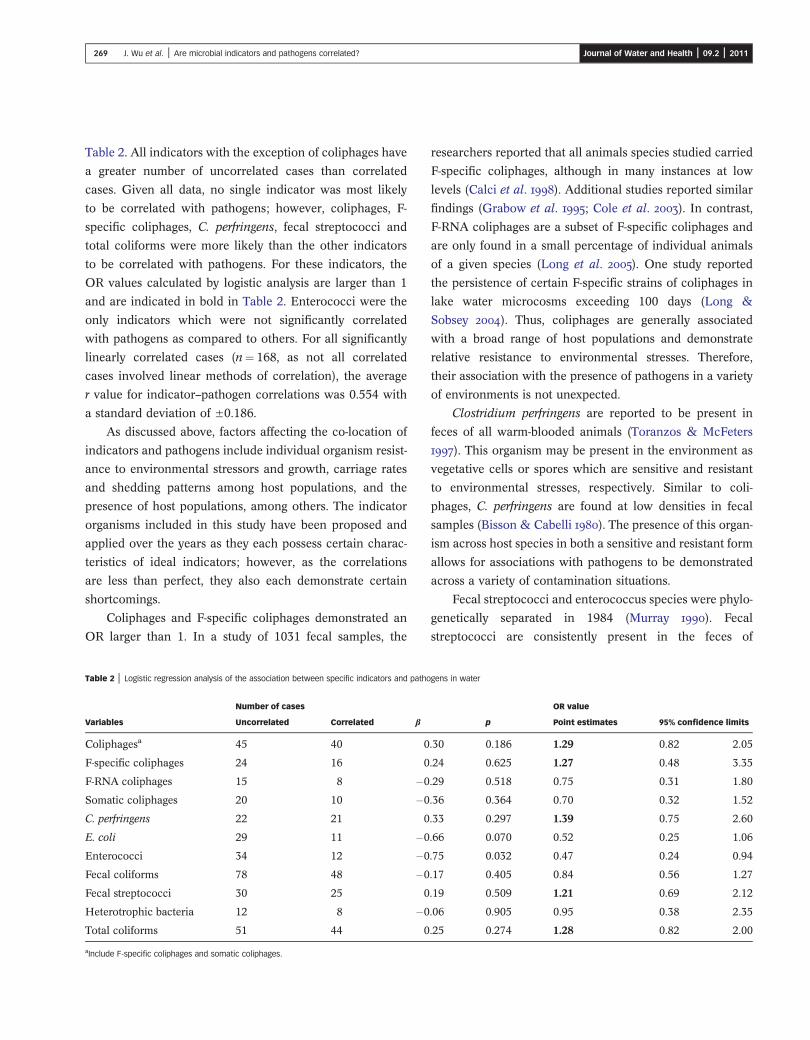
Table 2. All indicators with the exception of coliphages have
a greater number of uncorrelated cases than correlated
cases. Given all data, no single indicator was most likely
to be correlated with pathogens; however, coliphages, F-
specific coliphages, C. perfringens, fecal streptococci and
total coliforms were more likely than the other indicators
to be correlated with pathogens. For these indicators, the
OR values calculated by logistic analysis are larger than 1
and are indicated in bold in Table 2. Enterococci were the
only indicators which were not significantly correlated
with pathogens as compared to others. For all significantly
linearly correlated cases (n¼ 168, as not all correlated
cases involved linear methods of correlation), the average
r value for indicator–pathogen correlations was 0.554 with
a standard deviation of ±0.186.
As discussed above, factors affecting the co-location of
indicators and pathogens include individual organism resist-
ance to environmental stressors and growth, carriage rates
and shedding patterns among host populations, and the
presence of host populations, among others. The indicator
organisms included in this study have been proposed and
applied over the years as they each possess certain charac-
teristics of ideal indicators; however, as the correlations
are less than perfect, they also each demonstrate certain
shortcomings.
Coliphages and F-specific coliphages demonstrated an
OR larger than 1. In a study of 1031 fecal samples, the
Table 2 | Logistic regression analysis of the association between specific indicators and patho
Number of cases
Variables Uncorrelated Correlated β
Coliphagesa 45 40 0
F-specific coliphages 24 16 0
F-RNA coliphages 15 8 �0
Somatic coliphages 20 10 �0
C. perfringens 22 21 0
E. coli 29 11 �0
Enterococci 34 12 �0
Fecal coliforms 78 48 �0
Fecal streptococci 30 25 0
Heterotrophic bacteria 12 8 �0
Total coliforms 51 44 0
aInclude F-specific coliphages and somatic coliphages.
researchers reported that all animals species studied carried
F-specific coliphages, although in many instances at low
levels (Calci et al. ). Additional studies reported similar
findings (Grabow et al. ; Cole et al. ). In contrast,
F-RNA coliphages are a subset of F-specific coliphages and
are only found in a small percentage of individual animals
of a given species (Long et al. ). One study reported
the persistence of certain F-specific strains of coliphages in
lake water microcosms exceeding 100 days (Long &
Sobsey ). Thus, coliphages are generally associated
with a broad range of host populations and demonstrate
relative resistance to environmental stresses. Therefore,
their association with the presence of pathogens in a variety
of environments is not unexpected.
Clostridium perfringens are reported to be present in
feces of all warm-blooded animals (Toranzos & McFeters
). This organism may be present in the environment as
vegetative cells or spores which are sensitive and resistant
to environmental stresses, respectively. Similar to coli-
phages, C. perfringens are found at low densities in fecal
samples (Bisson & Cabelli ). The presence of this organ-
ism across host species in both a sensitive and resistant form
allows for associations with pathogens to be demonstrated
across a variety of contamination situations.
Fecal streptococci and enterococcus species were phylo-
genetically separated in 1984 (Murray ). Fecal
streptococci are consistently present in the feces of
gens in water
OR value
p Point estimates 95% confidence limits
.30 0.186 1.29 0.82 2.05
.24 0.625 1.27 0.48 3.35
.29 0.518 0.75 0.31 1.80
.36 0.364 0.70 0.32 1.52
.33 0.297 1.39 0.75 2.60
.66 0.070 0.52 0.25 1.06
.75 0.032 0.47 0.24 0.94
.17 0.405 0.84 0.56 1.27
.19 0.509 1.21 0.69 2.12
.06 0.905 0.95 0.38 2.35
.25 0.274 1.28 0.82 2.00
270 J. Wu et al. | Are microbial indicators and pathogens correlated? Journal of Water and Health | 09.2 | 2011
warm-blooded animals while enterococci are more highly
associated with humans (Geldreich & Kenner ; Murray
). The broad host range of fecal streptococci compared
to the more limited host range of enterococci may be one
factor that explains the logistic regression analysis findings.
Total coliforms belong to the family Enterobacteriaceae
and include E. coli and various members of the genera Enter-
obacter, Klebsiella and Citrobacter (DiSalvio ). These
organisms can originate from the intestinal tracts of both
homeothermic animals as well as other sources that may
also harbor pathogens such as distribution system biofilms
(LeChevallier et al. ; Toranzos & McFeters ). Coli-
forms have demonstrated similar persistence in the aquatic
environment as some bacterial waterborne pathogens (e.g.
McFeters et al. ). In some instances, coliforms have
been demonstrated to have the ability to grow in environ-
mental settings (Hazen ; Bonet ). The combination
of broad host range and environmental survival character-
istics may contribute to the higher occurrence of
associations between total coliforms and pathogens.
It is interesting that the non-enteric indicators (total and
fecal coliforms) showed a greater correlation with pathogens
than the fecal indicators (E. coli and enterococci). Payment
& Locas () also found that the non-enteric indicators
(total coliforms and aerobic endospores) were more
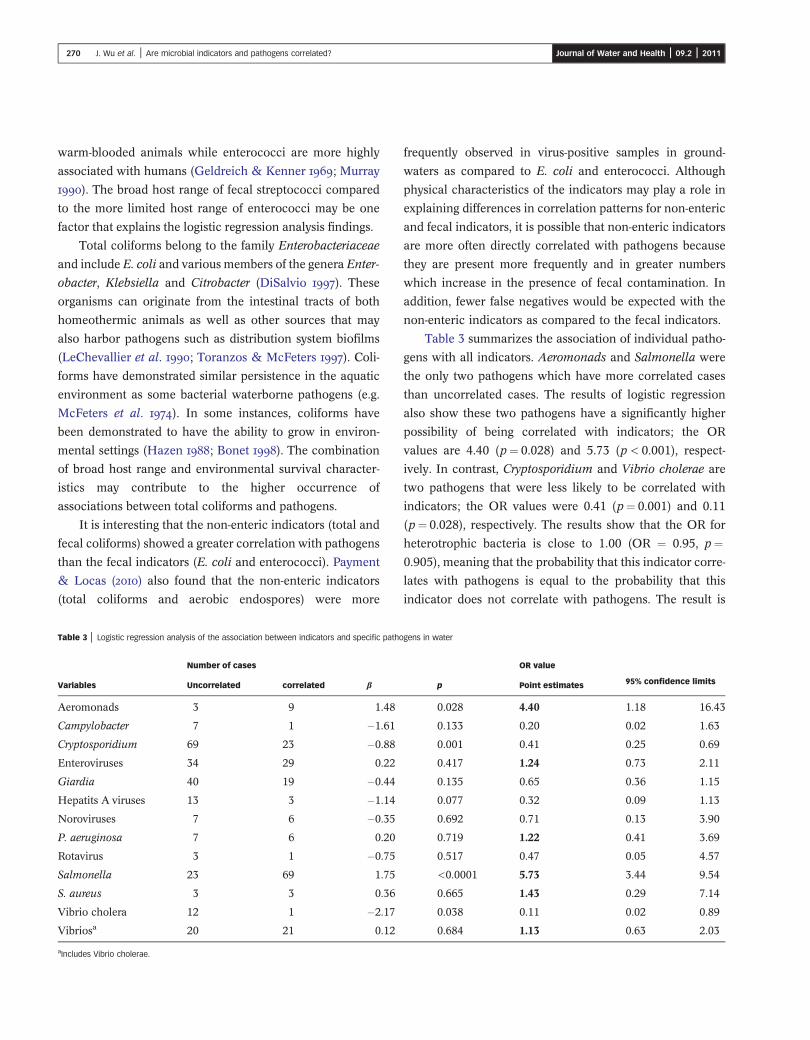
Table 3 | Logistic regression analysis of the association between indicators and specific patho
Number of cases
Variables Uncorrelated correlated β
Aeromonads 3 9 1.48
Campylobacter 7 1 �1.61
Cryptosporidium 69 23 �0.88
Enteroviruses 34 29 0.22
Giardia 40 19 �0.44
Hepatits A viruses 13 3 �1.14
Noroviruses 7 6 �0.35
P. aeruginosa 7 6 0.20
Rotavirus 3 1 �0.75
Salmonella 23 69 1.75
S. aureus 3 3 0.36
Vibrio cholera 12 1 �2.17
Vibriosa 20 21 0.12
aIncludes Vibrio cholerae.
frequently observed in virus-positive samples in ground-
waters as compared to E. coli and enterococci. Although
physical characteristics of the indicators may play a role in
explaining differences in correlation patterns for non-enteric
and fecal indicators, it is possible that non-enteric indicators
are more often directly correlated with pathogens because
they are present more frequently and in greater numbers
which increase in the presence of fecal contamination. In
addition, fewer false negatives would be expected with the
non-enteric indicators as compared to the fecal indicators.
Table 3 summarizes the association of individual patho-
gens with all indicators. Aeromonads and Salmonella were
the only two pathogens which have more correlated cases
than uncorrelated cases. The results of logistic regression
also show these two pathogens have a significantly higher
possibility of being correlated with indicators; the OR
values are 4.40 (p¼ 0.028) and 5.73 (p< 0.001), respect-
ively. In contrast, Cryptosporidium and Vibrio cholerae are
two pathogens that were less likely to be correlated with
indicators; the OR values were 0.41 (p¼ 0.001) and 0.11
(p¼ 0.028), respectively. The results show that the OR for
heterotrophic bacteria is close to 1.00 (OR ¼ 0.95, p¼0.905), meaning that the probability that this indicator corre-
lates with pathogens is equal to the probability that this
indicator does not correlate with pathogens. The result is
gens in water
OR value
p Point estimates 95% confidence limits
0.028 4.40 1.18 16.43
0.133 0.20 0.02 1.63
0.001 0.41 0.25 0.69
0.417 1.24 0.73 2.11
0.135 0.65 0.36 1.15
0.077 0.32 0.09 1.13
0.692 0.71 0.13 3.90
0.719 1.22 0.41 3.69
0.517 0.47 0.05 4.57
<0.0001 5.73 3.44 9.54
0.665 1.43 0.29 7.14
0.038 0.11 0.02 0.89
0.684 1.13 0.63 2.03
271 J. Wu et al. | Are microbial indicators and pathogens correlated? Journal of Water and Health | 09.2 | 2011
consistent with the other reports that have concluded that
there is no direct relationship between heterotrophic bac-
teria counts in drinking water when there are no sources
of fecal contamination (i.e. no pathogens) and human
health effects (Bartram et al. ). Heterotrophic bacteria
are present in most environmental samples, and thus when
pathogens are present, they are also likely to be present.
Host range and population carriage rates can affect
whether an individual pathogen is present in a fecal or
waste source. A variety of host species as well as soil have
been identified as sources of Aeromonads or Salmonella
(Millership et al. ; AWWA ). In contrast, while C.
parvum is described as ubiquitous, it is described as capable
of infecting most mammals (Griffiths ). Vibrio cholerae
is not described as having significant reservoirs other than
humans, although shellfish can harbor V. cholerae once a
water body has been contaminated (AWWA ). These
differences in host range may partially account for the
associations or lack thereof between individual pathogens
and indicators.
Higher population carriage rates of pathogens would
result in a higher likelihood of correlation between indicators
and pathogens. In a study of clinical samples, it was reported
that 4.2% or 42 of 1004 fecal specimens were positive for
Aeromonas hydrophila (Millership et al. ). In the same
study, 11.6% or 116 of the 1004 fecal specimens were positive
for Salmonella by culture. It is unclear whether patient car-
riage rates are representative of the general population. An
older study evaluated studies of healthy populations and
reported Salmonella carriage rates among the US population
to be of the order of 0–10.3% in 1988, but also demonstrated
an increasing trend of Salmonella infections between 1955
and 1988 (Chalker & Blaser ). In contrast, cases of Cryp-
tosporidiosis in the US were of the order of 2 per 100,000
population or ∼0.0002% between 2003 and 2005 (Yoder &
Beach ). The Cryptosporidiosis rate is acknowledged to
be an underestimate of the true Cryptosporidium carriage
rate: however, this estimate would have to be off by four
orders of magnitude. A study of seagulls reported 0 of 205
fresh fecal specimens positive for Cryptosporidium (Moore
et al. ). Thus, higher population carriage rates appear
to be a factor in indicator–pathogen associations.
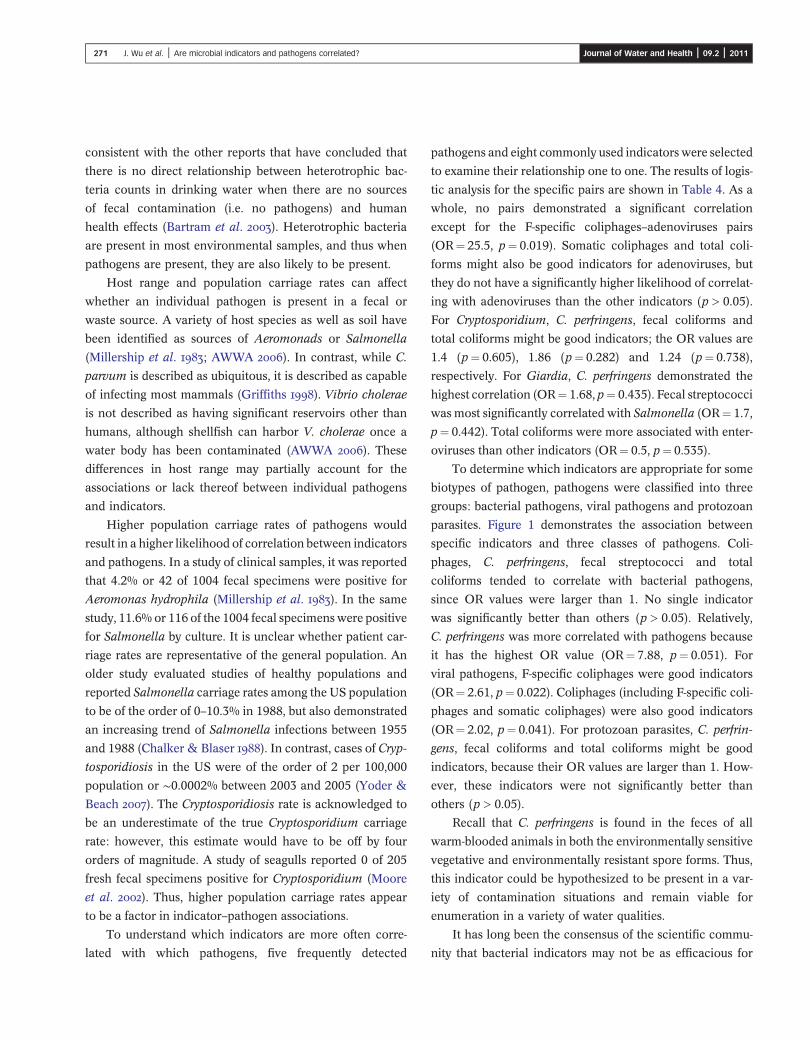
To understand which indicators are more often corre-
lated with which pathogens, five frequently detected
pathogens and eight commonly used indicators were selected
to examine their relationship one to one. The results of logis-
tic analysis for the specific pairs are shown in Table 4. As a
whole, no pairs demonstrated a significant correlation
except for the F-specific coliphages–adenoviruses pairs
(OR¼ 25.5, p¼ 0.019). Somatic coliphages and total coli-
forms might also be good indicators for adenoviruses, but
they do not have a significantly higher likelihood of correlat-
ing with adenoviruses than the other indicators (p> 0.05).
For Cryptosporidium, C. perfringens, fecal coliforms and
total coliforms might be good indicators; the OR values are
1.4 (p¼ 0.605), 1.86 (p¼ 0.282) and 1.24 (p¼ 0.738),
respectively. For Giardia, C. perfringens demonstrated the
highest correlation (OR¼ 1.68, p¼ 0.435). Fecal streptococci
was most significantly correlated with Salmonella (OR¼ 1.7,
p¼ 0.442). Total coliforms were more associated with enter-
oviruses than other indicators (OR¼ 0.5, p¼ 0.535).
To determine which indicators are appropriate for some
biotypes of pathogen, pathogens were classified into three
groups: bacterial pathogens, viral pathogens and protozoan
parasites. Figure 1 demonstrates the association between
specific indicators and three classes of pathogens. Coli-
phages, C. perfringens, fecal streptococci and total
coliforms tended to correlate with bacterial pathogens,
since OR values were larger than 1. No single indicator
was significantly better than others (p> 0.05). Relatively,
C. perfringens was more correlated with pathogens because
it has the highest OR value (OR¼ 7.88, p¼ 0.051). For
viral pathogens, F-specific coliphages were good indicators
(OR¼ 2.61, p¼ 0.022). Coliphages (including F-specific coli-
phages and somatic coliphages) were also good indicators
(OR¼ 2.02, p¼ 0.041). For protozoan parasites, C. perfrin-
gens, fecal coliforms and total coliforms might be good
indicators, because their OR values are larger than 1. How-
ever, these indicators were not significantly better than
others (p> 0.05).
Recall that C. perfringens is found in the feces of all
warm-blooded animals in both the environmentally sensitive
vegetative and environmentally resistant spore forms. Thus,
this indicator could be hypothesized to be present in a var-
iety of contamination situations and remain viable for
enumeration in a variety of water qualities.
It has long been the consensus of the scientific commu-
nity that bacterial indicators may not be as efficacious for
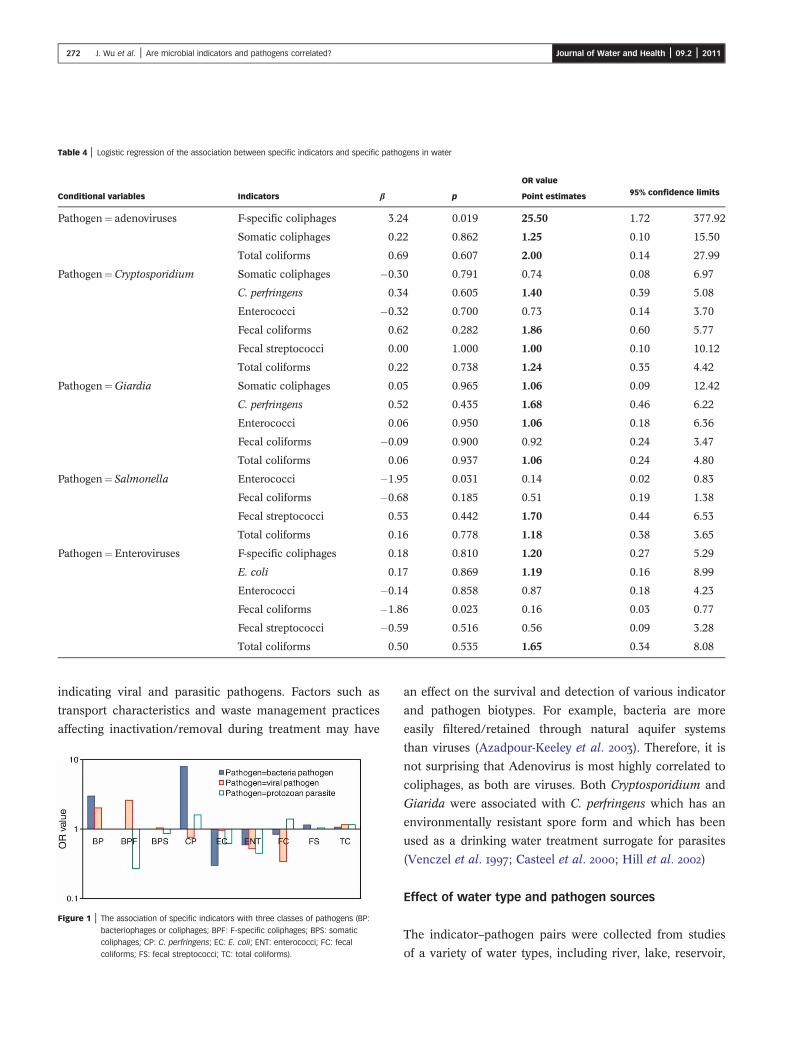
Table 4 | Logistic regression of the association between specific indicators and specific pathogens in water
OR value
Conditional variables Indicators β p Point estimates 95% confidence limits
Pathogen¼ adenoviruses F-specific coliphages 3.24 0.019 25.50 1.72 377.92
Somatic coliphages 0.22 0.862 1.25 0.10 15.50
Total coliforms 0.69 0.607 2.00 0.14 27.99
Pathogen¼Cryptosporidium Somatic coliphages �0.30 0.791 0.74 0.08 6.97
C. perfringens 0.34 0.605 1.40 0.39 5.08
Enterococci �0.32 0.700 0.73 0.14 3.70
Fecal coliforms 0.62 0.282 1.86 0.60 5.77
Fecal streptococci 0.00 1.000 1.00 0.10 10.12
Total coliforms 0.22 0.738 1.24 0.35 4.42
Pathogen¼Giardia Somatic coliphages 0.05 0.965 1.06 0.09 12.42
C. perfringens 0.52 0.435 1.68 0.46 6.22
Enterococci 0.06 0.950 1.06 0.18 6.36
Fecal coliforms �0.09 0.900 0.92 0.24 3.47
Total coliforms 0.06 0.937 1.06 0.24 4.80
Pathogen¼ Salmonella Enterococci �1.95 0.031 0.14 0.02 0.83
Fecal coliforms �0.68 0.185 0.51 0.19 1.38
Fecal streptococci 0.53 0.442 1.70 0.44 6.53
Total coliforms 0.16 0.778 1.18 0.38 3.65
Pathogen¼Enteroviruses F-specific coliphages 0.18 0.810 1.20 0.27 5.29
E. coli 0.17 0.869 1.19 0.16 8.99
Enterococci �0.14 0.858 0.87 0.18 4.23
Fecal coliforms �1.86 0.023 0.16 0.03 0.77
Fecal streptococci �0.59 0.516 0.56 0.09 3.28
Total coliforms 0.50 0.535 1.65 0.34 8.08
272 J. Wu et al. | Are microbial indicators and pathogens correlated? Journal of Water and Health | 09.2 | 2011
indicating viral and parasitic pathogens. Factors such as
transport characteristics and waste management practices
affecting inactivation/removal during treatment may have
Figure 1 | The association of specific indicators with three classes of pathogens (BP:
bacteriophages or coliphages; BPF: F-specific coliphages; BPS: somatic
coliphages; CP: C. perfringens; EC: E. coli; ENT: enterococci; FC: fecal
coliforms; FS: fecal streptococci; TC: total coliforms).
an effect on the survival and detection of various indicator
and pathogen biotypes. For example, bacteria are more
easily filtered/retained through natural aquifer systems
than viruses (Azadpour-Keeley et al. ). Therefore, it is
not surprising that Adenovirus is most highly correlated to
coliphages, as both are viruses. Both Cryptosporidium and
Giarida were associated with C. perfringens which has an
environmentally resistant spore form and which has been
used as a drinking water treatment surrogate for parasites
(Venczel et al. ; Casteel et al. ; Hill et al. )
Effect of water type and pathogen sources
The indicator–pathogen pairs were collected from studies
of a variety of water types, including river, lake, reservoir,
273 J. Wu et al. | Are microbial indicators and pathogens correlated? Journal of Water and Health | 09.2 | 2011
pond, estuary, coastal and marine waters, and wastewater.
The water types were reclassified by grouping cases into
three classes: fresh water, brackish and saline water, and
wastewaters. Among 540 cases, 230 cases were from fresh
waters, 205 cases were from brackish or saline waters and
105 cases were from wastewaters. As shown in Table 5,
the number of correlated cases is larger than the number
of uncorrelated cases in brackish and saline waters, but
smaller in fresh water and wastewater. In wastewater, the
number of uncorrelated cases is four times the number of
correlated cases. The results of logistical analysis reveal
that correlation between indicators and pathogens is signifi-
cantly higher in brackish and saline water than in other
types of water (OR¼ 2, p< 0.001). In contrast, there is sig-
nificantly less possibility of correlation in wastewater
(OR¼ 0.29, p< 0.001). The correlation between indicators
and pathogens is not significant in fresh water (OR¼ 1.03,
p¼ 0.857). The results suggest that indicators are reasonable
for the prediction of pathogen occurrence in brackish and
saline water, but are very poor indicators of pathogens in
wastewater. Payment & Locas () combined three differ-
ent datasets of pathogen and indicator occurrences,
representing three groups of water types with varying
expected concentrations in waters (i.e. low concentrations
in groundwaters and surface waters, and high concen-
trations in wastewaters). They also did not observe
correlations for wastewaters where pathogen concentrations
are expected to be high, but concluded that, when indicators
are detected in groundwater, the probability of pathogen
occurrence increases significantly and thus indicators are
useful for assessing risk.
The sources of pathogens include urban stormwater,
agriculture, sewage, septic tanks, wildlife and others. In gen-
eral, these sources fall into two groups: non-point sources
Table 5 | Influences of water types and pathogens on the relationship between indicators and
Number of cases
Water types Uncorrelated Correlated β
Fresh water 134 96
Saline or brackish water 99 106
Wastewater 84 21 �Point sources 191 138
Non-point sources 32 28
and point sources. As shown in Table 5, there are 329
cases from water environments affected by point sources
of contamination. Only 60 cases are from non-point sources.
The results of logistic analysis show that indicator–pathogen
correlations are not significantly different between either
point sources (OR¼ 1.07, p¼ 0.703) or non-point sources
(OR¼ 1.28, p¼ 0.371).
The presence of indicators and pathogens in a particular
environment depends on the presence of microbial sources
within the catchment area and host species carriage and
shedding rates, among others. The approximately equal
number of cases for environmental waters for indicators
and pathogens to be correlated is not surprising. As dis-
cussed above, many warm-blooded animals shed indicator
organisms all the time. Conversely, not all individual ani-
mals may shed pathogens. For example, it is estimated that
∼50% of US chickens are culture-positive for Salmonella
(AWWA ). Wastewater naturally contains human
sewage. Therefore, it is not surprising that wastewater
should always be positive for indicators, while correlations
with pathogens would reflect population carriage rates.
For example, the overall incidence of Giardia infection in
the United States is estimated at 2% of the population
(FDA ). Thus, only 2% of the population would be shed-
ding coliforms, enterococci and Giardia at any given time.
Conversely, 98% of the population would be shedding coli-
forms and enterococci, but not Giardia.
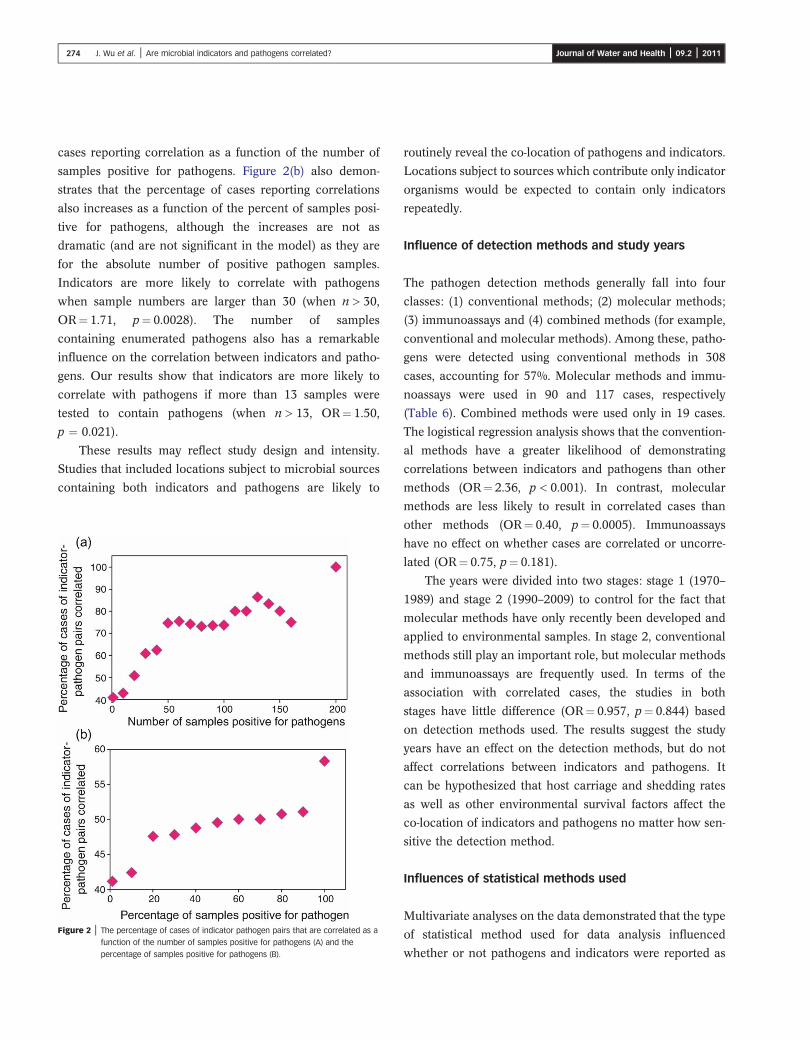
Effect of sample size
Among nine factors included in the logistic regression
model, the most important factor was found to be the
number of samples positive for the given pathogen (p<
0.001). Figure 2(a) shows an increase of the percentage of
pathogens
OR value
p Point estimates 95% confidence limits
0.03 0.857 1.03 0.73 1.46
0.69 0.000 2.00 1.40 2.84
1.24 0.000 0.29 0.17 0.48
0.07 0.703 1.07 0.75 1.52
0.25 0.371 1.28 0.75 2.19
274 J. Wu et al. | Are microbial indicators and pathogens correlated? Journal of Water and Health | 09.2 | 2011
cases reporting correlation as a function of the number of
samples positive for pathogens. Figure 2(b) also demon-
strates that the percentage of cases reporting correlations
also increases as a function of the percent of samples posi-
tive for pathogens, although the increases are not as
dramatic (and are not significant in the model) as they are
for the absolute number of positive pathogen samples.
Indicators are more likely to correlate with pathogens
when sample numbers are larger than 30 (when n> 30,
OR¼ 1.71, p¼ 0.0028). The number of samples
containing enumerated pathogens also has a remarkable
influence on the correlation between indicators and patho-
gens. Our results show that indicators are more likely to
correlate with pathogens if more than 13 samples were
tested to contain pathogens (when n> 13, OR¼ 1.50,
p ¼ 0.021).
These results may reflect study design and intensity.
Studies that included locations subject to microbial sources
containing both indicators and pathogens are likely to
Figure 2 | The percentage of cases of indicator pathogen pairs that are correlated as a
function of the number of samples positive for pathogens (A) and the
percentage of samples positive for pathogens (B).
routinely reveal the co-location of pathogens and indicators.
Locations subject to sources which contribute only indicator
organisms would be expected to contain only indicators
repeatedly.
Influence of detection methods and study years
The pathogen detection methods generally fall into four
classes: (1) conventional methods; (2) molecular methods;
(3) immunoassays and (4) combined methods (for example,
conventional and molecular methods). Among these, patho-
gens were detected using conventional methods in 308
cases, accounting for 57%. Molecular methods and immu-
noassays were used in 90 and 117 cases, respectively
(Table 6). Combined methods were used only in 19 cases.
The logistical regression analysis shows that the convention-
al methods have a greater likelihood of demonstrating
correlations between indicators and pathogens than other
methods (OR¼ 2.36, p< 0.001). In contrast, molecular
methods are less likely to result in correlated cases than
other methods (OR¼ 0.40, p¼ 0.0005). Immunoassays
have no effect on whether cases are correlated or uncorre-
lated (OR¼ 0.75, p¼ 0.181).
The years were divided into two stages: stage 1 (1970–
1989) and stage 2 (1990–2009) to control for the fact that
molecular methods have only recently been developed and
applied to environmental samples. In stage 2, conventional
methods still play an important role, but molecular methods
and immunoassays are frequently used. In terms of the
association with correlated cases, the studies in both
stages have little difference (OR¼ 0.957, p¼ 0.844) based
on detection methods used. The results suggest the study
years have an effect on the detection methods, but do not
affect correlations between indicators and pathogens. It
can be hypothesized that host carriage and shedding rates
as well as other environmental survival factors affect the
co-location of indicators and pathogens no matter how sen-
sitive the detection method.
Influences of statistical methods used
Multivariate analyses on the data demonstrated that the type
of statistical method used for data analysis influenced
whether or not pathogens and indicators were reported as
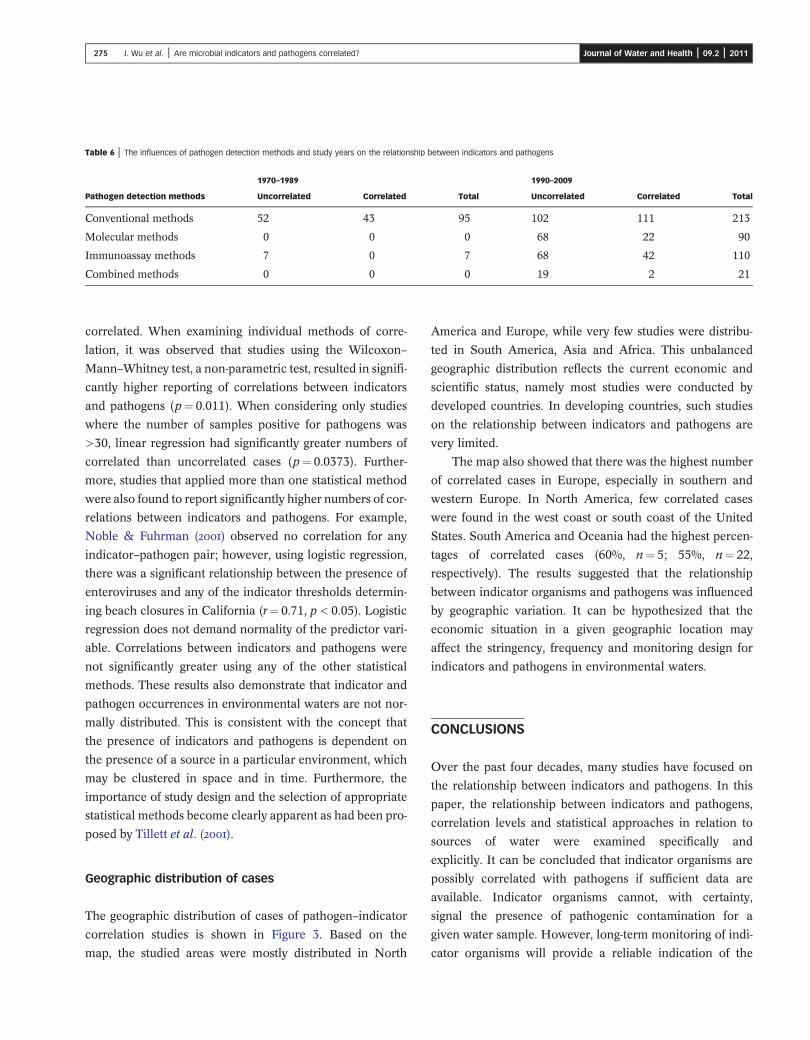
Table 6 | The influences of pathogen detection methods and study years on the relationship between indicators and pathogens
1970–1989 1990–2009
Pathogen detection methods Uncorrelated Correlated Total Uncorrelated Correlated Total
Conventional methods 52 43 95 102 111 213
Molecular methods 0 0 0 68 22 90
Immunoassay methods 7 0 7 68 42 110
Combined methods 0 0 0 19 2 21
275 J. Wu et al. | Are microbial indicators and pathogens correlated? Journal of Water and Health | 09.2 | 2011
correlated. When examining individual methods of corre-
lation, it was observed that studies using the Wilcoxon–
Mann–Whitney test, a non-parametric test, resulted in signifi-
cantly higher reporting of correlations between indicators
and pathogens (p¼ 0.011). When considering only studies
where the number of samples positive for pathogens was
>30, linear regression had significantly greater numbers of
correlated than uncorrelated cases (p¼ 0.0373). Further-
more, studies that applied more than one statistical method
were also found to report significantly higher numbers of cor-
relations between indicators and pathogens. For example,
Noble & Fuhrman () observed no correlation for any
indicator–pathogen pair; however, using logistic regression,
there was a significant relationship between the presence of
enteroviruses and any of the indicator thresholds determin-
ing beach closures in California (r¼ 0.71, p< 0.05). Logistic
regression does not demand normality of the predictor vari-
able. Correlations between indicators and pathogens were
not significantly greater using any of the other statistical
methods. These results also demonstrate that indicator and
pathogen occurrences in environmental waters are not nor-
mally distributed. This is consistent with the concept that
the presence of indicators and pathogens is dependent on
the presence of a source in a particular environment, which
may be clustered in space and in time. Furthermore, the
importance of study design and the selection of appropriate
statistical methods become clearly apparent as had been pro-
posed by Tillett et al. ().
Geographic distribution of cases
The geographic distribution of cases of pathogen–indicator
correlation studies is shown in Figure 3. Based on the
map, the studied areas were mostly distributed in North
America and Europe, while very few studies were distribu-
ted in South America, Asia and Africa. This unbalanced
geographic distribution reflects the current economic and
scientific status, namely most studies were conducted by
developed countries. In developing countries, such studies
on the relationship between indicators and pathogens are
very limited.
The map also showed that there was the highest number
of correlated cases in Europe, especially in southern and
western Europe. In North America, few correlated cases
were found in the west coast or south coast of the United
States. South America and Oceania had the highest percen-
tages of correlated cases (60%, n¼ 5; 55%, n¼ 22,
respectively). The results suggested that the relationship
between indicator organisms and pathogens was influenced
by geographic variation. It can be hypothesized that the
economic situation in a given geographic location may
affect the stringency, frequency and monitoring design for
indicators and pathogens in environmental waters.
CONCLUSIONS
Over the past four decades, many studies have focused on
the relationship between indicators and pathogens. In this
paper, the relationship between indicators and pathogens,
correlation levels and statistical approaches in relation to
sources of water were examined specifically and
explicitly. It can be concluded that indicator organisms are
possibly correlated with pathogens if sufficient data are
available. Indicator organisms cannot, with certainty,
signal the presence of pathogenic contamination for a
given water sample. However, long-term monitoring of indi-
cator organisms will provide a reliable indication of the
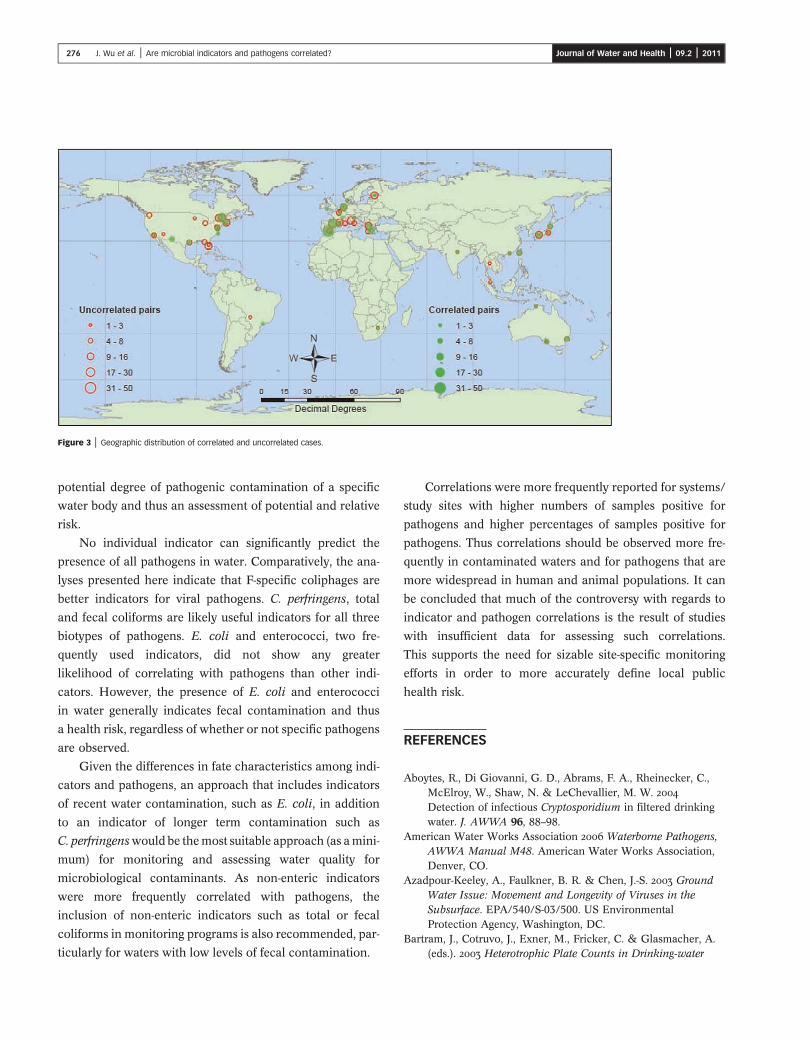
Figure 3 | Geographic distribution of correlated and uncorrelated cases.
276 J. Wu et al. | Are microbial indicators and pathogens correlated? Journal of Water and Health | 09.2 | 2011
potential degree of pathogenic contamination of a specific
water body and thus an assessment of potential and relative
risk.
No individual indicator can significantly predict the
presence of all pathogens in water. Comparatively, the ana-
lyses presented here indicate that F-specific coliphages are
better indicators for viral pathogens. C. perfringens, total
and fecal coliforms are likely useful indicators for all three
biotypes of pathogens. E. coli and enterococci, two fre-
quently used indicators, did not show any greater
likelihood of correlating with pathogens than other indi-
cators. However, the presence of E. coli and enterococci
in water generally indicates fecal contamination and thus
a health risk, regardless of whether or not specific pathogens
are observed.
Given the differences in fate characteristics among indi-
cators and pathogens, an approach that includes indicators
of recent water contamination, such as E. coli, in addition
to an indicator of longer term contamination such as
C. perfringenswould be themost suitable approach (as amini-
mum) for monitoring and assessing water quality for
microbiological contaminants. As non-enteric indicators
were more frequently correlated with pathogens, the
inclusion of non-enteric indicators such as total or fecal
coliforms in monitoring programs is also recommended, par-
ticularly for waters with low levels of fecal contamination.
Correlations were more frequently reported for systems/
study sites with higher numbers of samples positive for
pathogens and higher percentages of samples positive for
pathogens. Thus correlations should be observed more fre-
quently in contaminated waters and for pathogens that are
more widespread in human and animal populations. It can
be concluded that much of the controversy with regards to
indicator and pathogen correlations is the result of studies
with insufficient data for assessing such correlations.
This supports the need for sizable site-specific monitoring
efforts in order to more accurately define local public
health risk.
REFERENCES
Aboytes, R., Di Giovanni, G. D., Abrams, F. A., Rheinecker, C.,McElroy, W., Shaw, N. & LeChevallier, M. W. Detection of infectious Cryptosporidium in filtered drinkingwater. J. AWWA 96, 88–98.
American Water Works Association Waterborne Pathogens,AWWA Manual M48. American Water Works Association,Denver, CO.
Azadpour-Keeley, A., Faulkner, B. R. & Chen, J.-S. GroundWater Issue: Movement and Longevity of Viruses in theSubsurface. EPA/540/S-03/500. US EnvironmentalProtection Agency, Washington, DC.
Bartram, J., Cotruvo, J., Exner, M., Fricker, C. & Glasmacher, A.(eds.). Heterotrophic Plate Counts in Drinking-water
277 J. Wu et al. | Are microbial indicators and pathogens correlated? Journal of Water and Health | 09.2 | 2011
Safety: The Significance of HPCs for Water Quality andHuman Gealth. IWA Publishing, London.
Bisson, J. W. & Cabelli, V. J. Clostridium perfringens as awater pollution indicator. J. Water Pollut. Control Feder. 52(2), 241–248.
Bonnet, S. An Evaluation of the Membrane Filtration Methodfor the Enumeration of Total Coliforms from Surface WaterSources. MS Environmental Engineering Project,Department of Civil and Environmental Engineering,University of Massachusetts, Amherst, MA.
Calci, K. R., Burkhardt, W., Watkins, W. D. & Rippey, S. R.
Occurrence of male-specific bacteriophage in feral anddomestic animal wastes, human feces, and human-associatedwastewaters. Appl. Environ. Microbiol. 64 (12), 5027–5029.
Carter, A. M., Pacha, R. E., Clark, G. W. & Willams, E. A. Seasonal occurrence of Campylobacter spp. in surface watersand their correlation with standard indicator bacteria. Appl.Environ. Microbiol. 53 (2), 523–526.
Casteel, M. J., Sobsey, M. D. & Arrowood, M. J. Inactivation
of Cryptosporidium parvum oocysts and other microbes inwater and wastewater by electrochemically generated mixedoxidants. Water Sci. Technol. 41 (7), 127–134.
Chalker, R. B. & Blaser, M. J. A review of humanSalmonellosis: III. Magnitude of Salmonella infection in theUnited States. Rev. Infect. Dis. 10 (1), 111–124.
Cole, D., Long, S. C. & Sobsey, M. D. Evaluation of FþRNA
and DNA coliphages as source-specific indicators of fecalcontamination in surface waters. Appl. Environ. Microbiol.69, 6507–6514.
Committee on Indicators for Waterborne Pathogens Indicators for Waterborne Pathogens. National ResearchCouncil of the National Academies. The National AcademiesPress, Washington, DC.
Craun, G. E., Berger, P. S. & Calderon, R. L. Coliform bacteriaand waterborne disease outbreaks. J. AWWA 89 (3), 96–104.
DiSalvio, D. An Evaluation of the Use of Coliform Bacteria asan Indicator Organism in Drinking Water. MS EngineeringReport, Department of Civil and Environmental Engineering,University of Massachusetts, Amherst, MA.
Food and Drug Administration The Bad Bug Book. Availablefrom: http://www.cfsan.fda.gov/~mow/intro.html (Accessed
30 January 2009).Geldreich, E. E. & Kenner, B. A. Concepts of fecal
streptococci in stream pollution. J. Wat. Pollut. Control Feder.41 (8), R336–R352.
Grabow, W. O. K., Neubrech, T. E., Holtshausen, C. S. & Jofre, J. Bacteroides fragilis and E. coli bacteriophages: excretionby humans and animals. Water Sci. Technol. 31 (5–6),
223–230.Griffiths, J. K. Human cryptosporidosis: Epidemiology,
transmission, clinical disease, treatment and diagnosis. Adv.Parasitol. 40, 37–85.
Guy, R., Payment, P., Krull, U. J. & Horgen, P. A. Real-timePCR for quantification of Giardia and Cryptosporidium in
environmental water samples and sewage. Appl. Environ.Microbiol. 69, 5178–5185.
Hazen, T. C. Fecal coliforms as indicators in tropical waters –a review. Toxicity Assess. 3 (5), 461–477.
Hill, V. R., Kantardjieff, A., Sobsey, M. D. & Westerman, P. W. Reduction of enteric microbes in flushed swinewastewater treated by a biological aerated filter and UVirradiation. Water Environ. Res. 74 (1), 91–99.
Hrudey, S. E. & Hrudey, E. J. (eds.) Safe Drinking Water,Lessons From Recent Outbreaks in Affluent Nations. IWAPublishing, London.
LeChevallier, M. W., Lowry, C. D. & Lee, R. G. Disinfectingbiofilms in a model distribution system. J. AWWA 82 (7),87–99.
Long, S. C. & Sobsey, M. D. A comparison of the survival ofFþRNA and FþDNA coliphages in Lake Water Microcosms.J. Water Health 2 (1), 15–22.
Long, S. C., El-Khoury, S. S., Oudejans, S., Sobsey, M. D. & Vinjé, J. Assessment of sources and diversity of male-specificcoliphages for source tracking. Environ. Engng. Sci. 22 (3),367–377.
Lund, V. Evaluation of E. coli as an indicator for the presenceof Campylobacter jejuni and Yersinia enterocolitica inchlorinated and untreated oligotrophic lake water. WaterRes. 30 (6), 1528–1534.
Mackenzie, W. R., Hoxie, N. J., Proctor, M. E., Gradus, M. S.,Blair, K. A., Peterson, D. E., Kazmierczak, J. J., Addiss, D. G.,Fox, K. R., Rose, J. B. & Davis, J. P. A massive outbreakin Milwaukee of Cryptosporidium infection transmittedthrough the public water supply. New Engl. J. Med. 331 (3),161–167.
Maynard, C., Berthiaume, F., Lemarchand, K., Harel, J., Payment,P., Bayardelle, P., Masson, L. & Brousseau, R. Waterborne pathogen detection by use of oligonucleotide-based microarrays. Appl. Environ. Microbiol. 71 (12), 8548–8557.
McFeters, G. A., Bissonette, G. K., Jezeski, J. J., Thomson, C. A. &Stuart, D. G. Comparative survival of indicator bacteriaand enteric pathogens in well wáter. Appl. Microbiol. 27 (5),823–829.
Millership, S. E., Curnow, S. R. & Chattopadhyay, B. Faecalcarriage rate of Aeromonas hydrophila. J. Clin. Parasitol. 36,920–923.
Moore, J. E., Gilpin, D., Crothers, E., Canney, A., Kaneko, A. &Matsuda, M. Occurrence of Campylobacter spp. andCryptosporidium spp. in seagulls (Larus spp.). Vector BorneZoonotic Dis. 2 (2), 111–114.
Murray, B. E. The life and times of the enterococci. Clin.Microbiol. Rev. 3 (1), 46–65.
Nasser, A. M., Zaruk, N., Tenenbaum, L. & Netzan, Y. Comparative survival of Cryptosporidium, coxsackievirus A9and E. coli in stream, brackish and sea waters. Water Sci.Technol. 47 (3), 91–96.
Noble, R. T. & Fuhrman, J. A. Enteroviruses detected byreverse transcriptase polymerase chain reaction from the
278 J. Wu et al. | Are microbial indicators and pathogens correlated? Journal of Water and Health | 09.2 | 2011
coastal waters of Santa Monica Bay, California: lowcorrelation to bacterial indicator levels. Hydrobiologia 460(1–3), 175–184.
Payment, P. & Franco, E. C. perfringens and somaticcoliphages as indicators of the efficiency of drinking watertreatment for viruses and protozoan cysts. Appl. Environ.Microbiol. 59 (8), 2418–2424.
Payment, P. & Locas, A. Pathogens in water: value and limitsof correlation with microbial indicators. Ground Water 49(1), 4–11.
Raina, P. S., Pollari, F. L., Teare, G. F., Goss, M. J., Barry, D. A. &Wilson, J. B. The relationship between E. coli indicatorbacteria in well-water and gastrointestinal illnesses in ruralfamilies. Can. J. Public Health 90 (3), 172–175.
Savichtcheva, O. & Okabe, S. Alternative indicators of fecalpollution: relations with pathogens and conventionalindicators, current methodologies for direct pathogenmonitoring and future application perspectives. Water Res.40, 2463–2476.
Stetler, R. E. Coliphages as indicators of enteroviruses. Appl.Environ. Microbiol. 48 (3), 668–670.
Tillett, H. E., Sellwood, J., Lightfood, N. F., Boyd, P. & Eaton, S. Correlations between microbial parameters from watersamples: expectations and reality. Water Sci. Technol. 43(12), 19–22.
Toranzos, G. A. & McFeters, G. A. Detection of indicatormicroorganisms in environmental freshwaters and drinkingwaters. In: Manual of Environmental Microbiology (C. J.Hurst, G. R. Knuden, M. J. McInerney, L. D. Stetzenbach &
M. V. Walter, eds.). ASM Press, Washington, DC,
pp. 184–194.US Environmental Protection Agency Ambient Water
Criteria for Bacteria–1986. EPA-440/5-84-002. USEnvironmental Protection Agency, Washington, DC.
US Environmental Protection Agency. National primary
drinking water regulations: total coliform rule, final rule. Fed.Regist. 54 (124), 27544–27568, June 29.
US Environmental Protection Agency Bacterial WaterQuality Standards for Recreational Waters (Freshwater andMarine Waters). EPA-823-R-03-008, Status Report, Office of
Water, Washington, DC.US Environmental Protection Agency Review of Published
Studies to Characterize Relative Risks from Different Sourcesof Fecal Contamination in Recreational Water. EPA 822-R-
09-001. US Environmental Protection Agency Office of
Water Health and Ecological Criteria Division, Washington,
DC.Venczel, L. V., Arrowood, M., Hurd, M. & Sobsey, M. D.
Inactivation of Cryptosporidium parvum oocysts and
Clostridium perfringens spores by a mixed-oxidant
disinfectant and by free chlorine. Appl. Environ. Microbiol.63 (4), 1598–1601.
Yates, M. Classical indicators in the 21st century – far andbeyond the coliform. Water Environ. Res. 79 (3), 279–286.
Yoder, J. S. & Beach, M. J. Cryptosporidiosis surveillance –
United States, 2003–2005. MMWR Morb. Mortal. Wkly. Rep.56 (SS07), 1–10.
First received 29 June 2010; accepted in revised form 11 November 2010. Available online 25 April 2011