APSI - Analisa Perancangan Sistem Informasi
167
Chapter 1 Chapter 1 1
-
Upload
independent -
Category
Documents
-
view
0 -
download
0
Transcript of APSI - Analisa Perancangan Sistem Informasi

Chapter 1Chapter 1
1

Key IdeasMany failed systems were abandoned because analysts tried to build wonderful systems without understanding the organization.
The primarily goal is to create value for the organization.
2

Key IdeasThe systems analyst is a key person analyzing the business, identifying opportunities for improvement, and designing information systems to implement these ideas.
It is important to understand and develop through practice the skills needed to successfully design and implement new information systems.
3

4
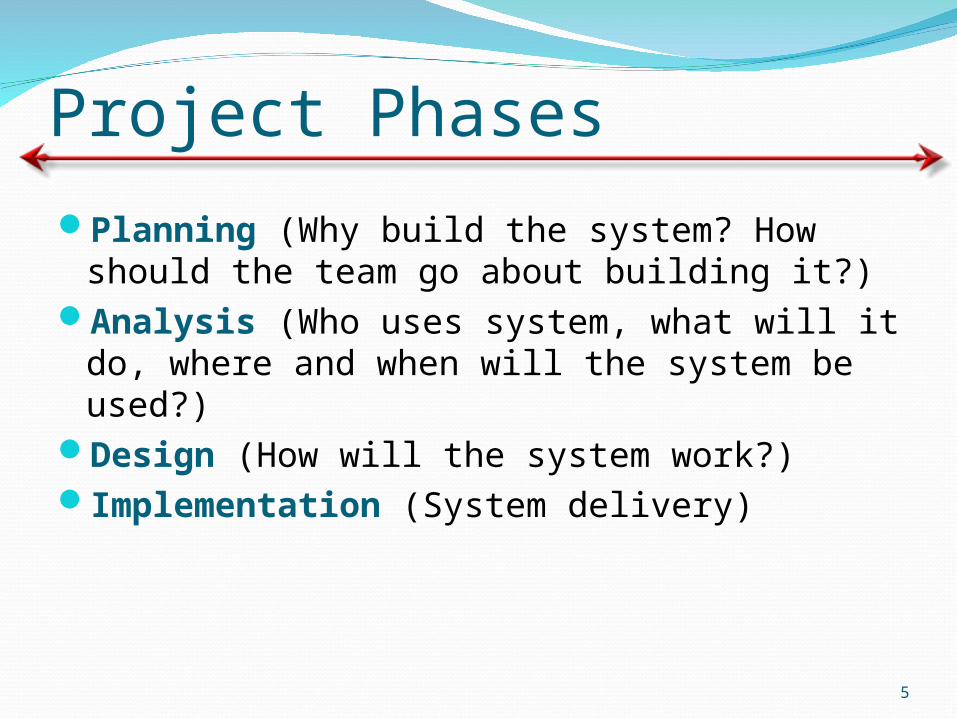
Project PhasesPlanning (Why build the system? How should the team go about building it?)
Analysis (Who uses system, what will it do, where and when will the system be used?)
Design (How will the system work?)Implementation (System delivery)
5

PlanningIdentifying business valueAnalyze feasibilityDevelop work planStaff the projectControl and direct project
6
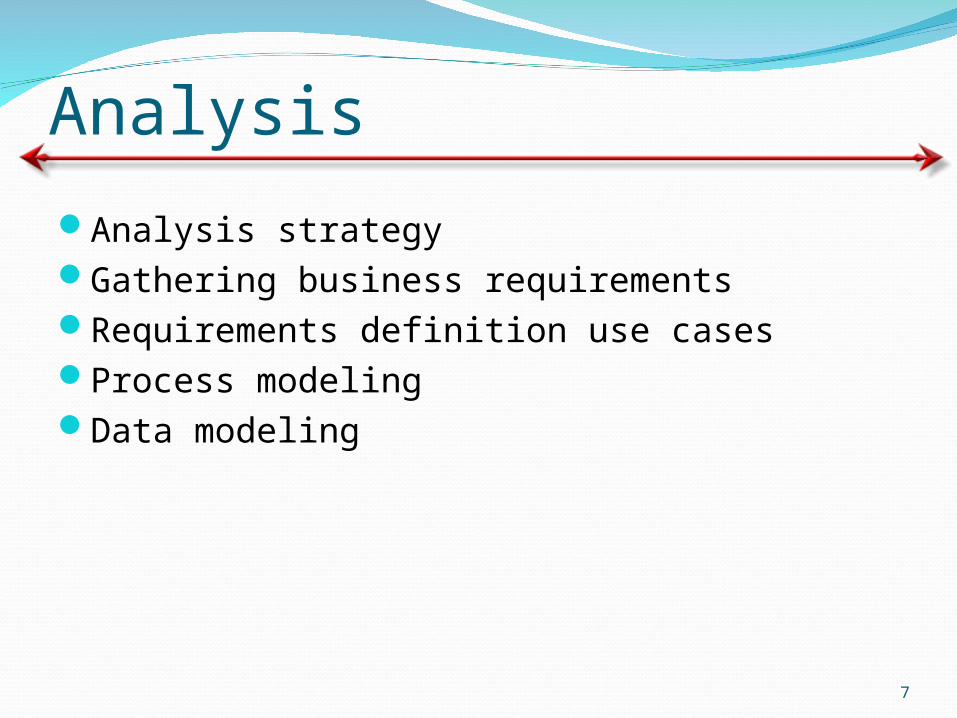
AnalysisAnalysis strategyGathering business requirementsRequirements definition use casesProcess modelingData modeling
7

DesignDesign selectionArchitecture designInterface designData storage designProgram design
8
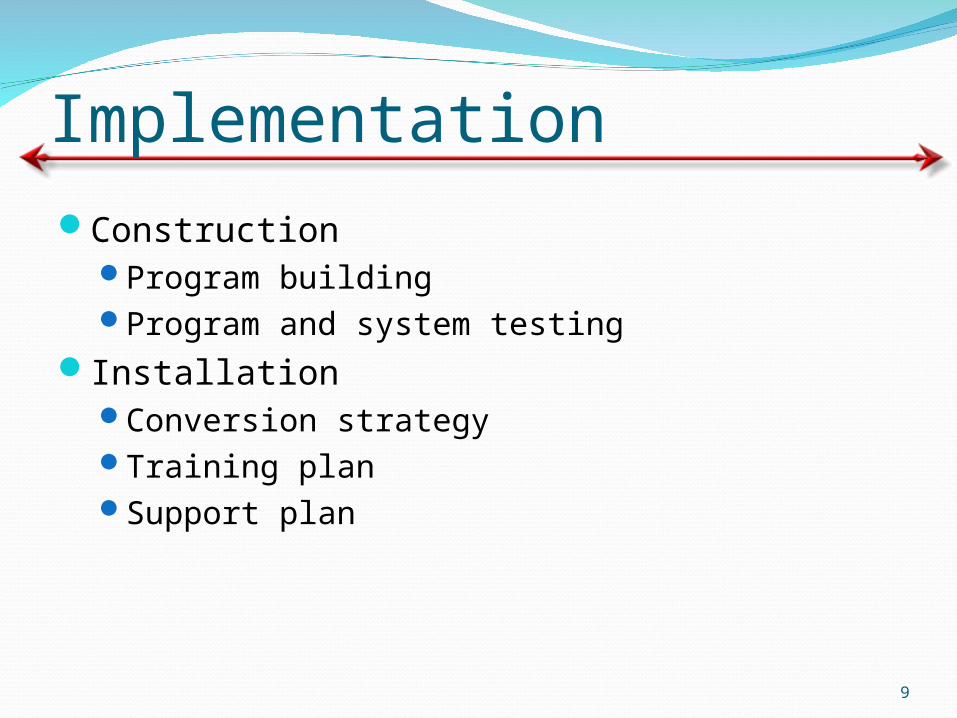
ImplementationConstruction
Program buildingProgram and system testing
InstallationConversion strategyTraining planSupport plan
9

Processes and Deliverables
10
Process Product
Planning
Analysis
Design
Implementation
System RequestFeasibility
AnalysisWorkplan
System Proposal
System Specification
New System and Maintenance Plan
11

12
13
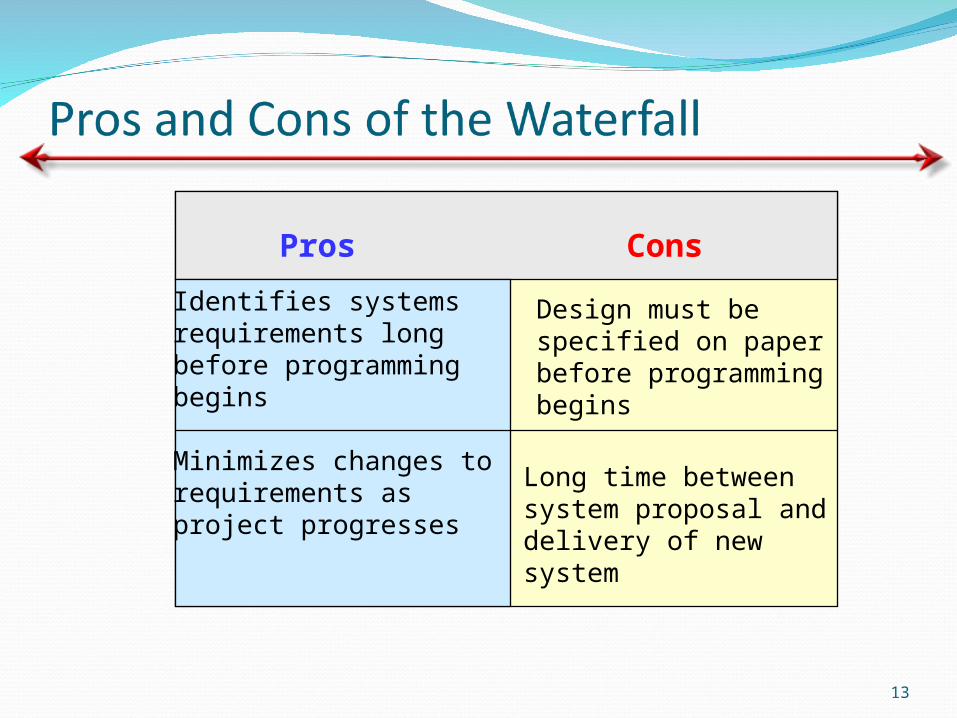
Pros ConsIdentifies systems requirements long before programming begins
Minimizes changes to requirements asproject progresses
Design must be specified on paper before programming begins
Long time between system proposal and delivery of new system

14

15
Pros Cons
Reduces Schedule Time
Less Chance ofRework
Still Uses PaperDocuments
Sub-projects May BeDifficult to Integrate

16
Incorporate special techniques and tools:CASE toolsJAD sessionsFourth generation/visualization programming languages
Code generators
17
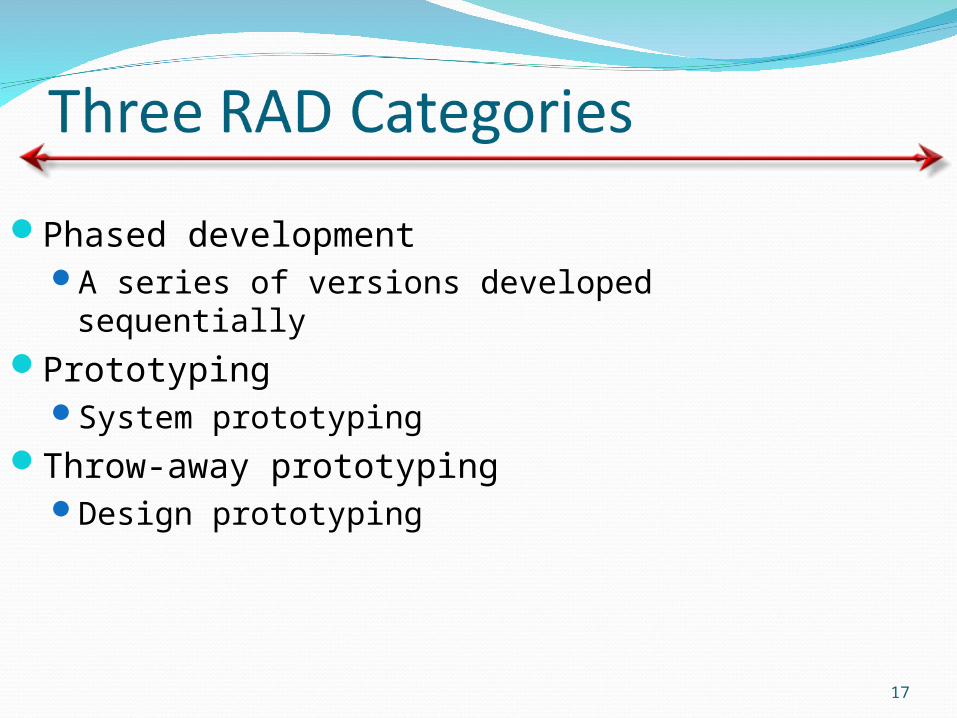
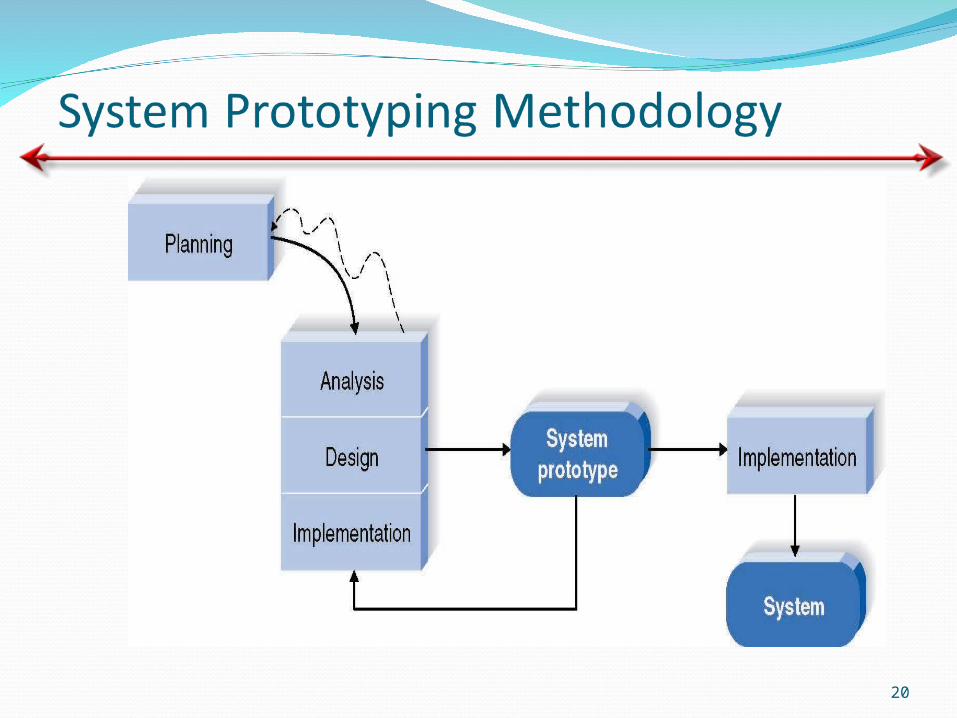
Phased developmentA series of versions developed sequentially
PrototypingSystem prototyping
Throw-away prototypingDesign prototyping

18
Insert Figure 1-4 here

19
Pros Cons
Users Get a SystemTo Use Quickly
Users Can IdentifyAdditional NeedsFor Later Versions
Users Work with aSystem that isIntentionally
Incomplete
20

21
Pros Cons
Users Interact withPrototype Very Quickly
Users Can IdentifyNeeded ChangesAnd Refine RealRequirements
Tendency to doSuperficial Analysis
Initial Design Decisions May
Be Poor

22

23
Pros Cons
Risks are Minimized
Important Issues areUnderstood Before theReal System is Built
May Take LongerThan Prototyping

24

25
Pros Cons
Fast Delivery of Results
Works Well in ProjectsWith Undefined or
Changing Requirements
Requires Discipline
Works Best in Small Projects
Requires MuchUser Input

Object-Oriented Approach
26

Criteria for Selecting the Appropriate Methodology
Clear user requirementsFamiliarity with technologyComplexity of systemReliability of systemTime scheduleSchedule visibility
27

Basic Step to develop an Object Oriented
Systems
Identifying business valueAnalyze feasibilityDevelop workplanStaff the projectControl and direct projectRequirements determinationFunctional modelingStructural modelingBehavioral modelingMoving on to design
28

Chapter 2
29

Key IdeasAn opportunity to create business value from using information technology initiates a project.
Feasibility analysis helps determine whether or not to proceed with the IS project.
Projects are selected based on business needs and project risks.
30
Key IdeasThe project sponsor is a key person who identifies business value to be gained from using information technology.
The approval committee reviews system requests from groups throughout the organization and selects projects for the benefit of the business.
31

32
IDENTIFYING PROJECTS IDENTIFYING PROJECTS WITH BUSINESS VALUEWITH BUSINESS VALUE

How Do Projects Begin?Business needs should drive projects.Project sponsor recognizes business need for new system and desires to see it implemented.
Business needs determine the system’s functionality (what it will do).
The project’s business value should be clear.

System RequestA document describing business reasons for project and system’s expected value.
Lists project’s key elementsProject sponsorBusiness needBusiness requirementsBusiness valueSpecial issues or constraints
System Request ExamplesProject sponsor – VP of MarketingBusiness need – Reach new customers and improve service to existing customers
Business requirements – Provide web-based shopping capability
Business value - $750,000 in new customer sales; $1.8M in existing customer sales
Special issues or constraints – System must be operational by holiday shopping season

Preliminary Project AcceptanceSystem request is reviewed by approval committee
Based on information provided, project merits are assessed.
Worthy projects are accepted and undergo additional investigation – the feasibility analysis.

Feasibility AnalysisDetailed business case for the project
Technical feasibilityEconomic feasibilityOrganizational feasibility
Compiled into a feasibility studyFeasibility is reassessed throughout the project
37

Technical Feasibility: Can We Build It?
Users’ and analysts’ familiarity with the business application area
Familiarity with technologyHave we used it before? How new is it?
Project sizeNumber of people, time, and features
Compatibility with existing systems
Economic Feasibility: Should We Build It?Identify costs and benefitsAssign values to costs and benefitsDetermine cash flowAssess financial viability
Net present value (NPV)Return on investment (ROI)Break even point(BEP)

40
Costs Benefits
Tangible
Intangible
***
***
***
***
Assign Cost and Benefit ValuesDifficult, but essential to estimateWork with people who are most familiar with the area to develop estimates
Intangibles should also be quantifiedIf intangibles cannot be quantified, list and include as part of supporting material
Organizational Feasibility: If we build it, will they come?
Strategic alignmentHow well do the project goals align with business objectives?
Stakeholder analysisProject champion(s)Organizational managementSystem users

Project SelectionApproval committee works from the system
request and the feasibility studyProject portfolio – how does the project fit within the entire portfolio of projects?
Trade-offs must be made to select projects that will form a balanced project portfolio
Viable projects may be rejected or deferred because of project portfolio issues.

Chapter 3
44
Key DefinitionsProject management is the process of planning and controlling the development of a system within a specified timeframe at a minimum cost with the right functionality.
A project manager has the primary responsibility for managing the hundreds of tasks and roles that need to be carefully coordinated.
45

Four Key Steps in Managing ProjectsIdentifying project sizeCreating and managing the workplanStaffing the projectCoordinating and controlling project activities
46

47
48
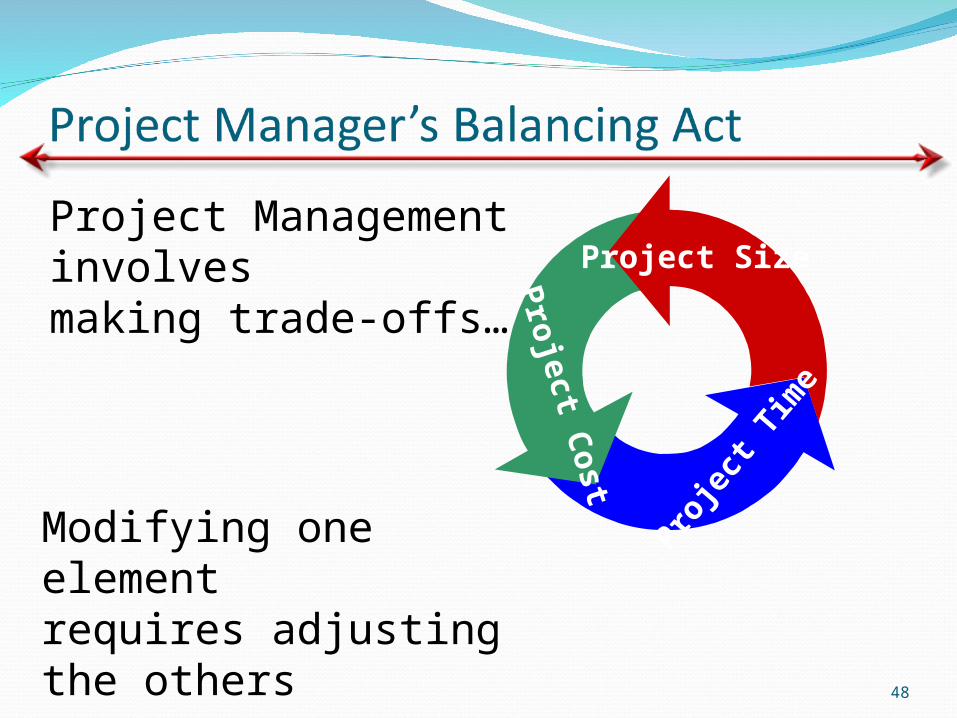
Project Management involvesmaking trade-offs…
Project SizeProject Cost
Project Time
Modifying one elementrequires adjusting the others

Project EstimationThe process of assigning projected values for time and effort
Sources of estimatesMethodology in useActual previous projectsExperienced developers
Estimates begin as a range and become more specific as the project progresses
49

50
Planning Analysis Design Implementation
IndustryStandardFor Web 15% 20% 35% 30%Applications
TimeRequired 4 5.33 9.33 8in PersonMonths

Converting Function Points to Lines of Code
51
Source: Capers Jones, Software Productivity Research
Language LOC ratioCCOBOLJAVAC++
Turbo PascalVisual BasicPowerBuilderHTMLPackages (e.g., Access, Excel)
130110 55 50 50 30 15 1510-40

52

53
Work Plan Information Example
Name of task Perform economic feasibilityStart date ` Jan 05, 2003Completion date Jan 19, 2003Person assigned Mary Smith, sponsorDeliverable(s) Cost-benefit analysisCompletion status OpenPriority HighResources needed SpreadsheetEstimated time 16 hoursActual time 14.5 hours

Identifying TasksMethodology
Using standard list of tasksTop-down approach
Identify highest level tasksBreak them into increasingly smaller units
Organize into work breakdown structure
54

Project WorkplanList of all tasks in the work breakdown structure, plusDuration of taskCurrent task statusTask dependenciesKey milestone dates
55

Tracking Project TasksGantt Chart
Bar chart formatUseful to monitor project status at any point in time
PERT ChartFlowchart formatIllustrate task dependencies and critical path
56

57
Go to Library
Go to Bookstore
Select and Purchase Book
Skim Book
Write Phase One
Read Book Carefully
Write Phase Two
Task Week 2 3 4 5 6 7 8 9 10 11 12 13

58
Go to Library4 weeks
Select and purchase book
1 weekGo to Bookstore4 weeks
Skim book3 weeks
Write Phase One2 weeks
Read book carefully3 weeks
Write Phase Two3 weeks

59

Staffing AttributesStaffing levels will change over a project’s lifetime
Adding staff may add more overhead than additional labor
Using teams of 8-10 reporting in a hierarchical structure can reduce complexity
60

61
62

63
Planning Analysis Design Implementation
Upper CASE Lower CASE
Integrated CASE (I-CASE)

64
Procedural MetadataLogic
Diagrams ScreenDesigns
CASE Repository

StandardsExamples
Formal rules for naming filesForms indicating goals reachedProgramming guidelines
65

DocumentationProject binderTable of contentsContinual updating
66
Managing RiskRisk assessmentActions to reduce riskRevised assessment
67

Classic MistakesOverly optimistic scheduleFailing to monitor scheduleFailing to update scheduleAdding people to a late project
68

Chapter 4
69

Key DefinitionsThe As-Is system is the current system and may or may not be computerized
The To-Be system is the new system that is based on updated requirements
The System Proposal is the key deliverable from the Analysis Phase
70
Key IdeasThe goal of the analysis phase is to truly understand the requirements of the new system and develop a system that addresses them -- or decide a new system isn’t needed.
The System Proposal is presented to the approval committee via a system walk-through.
Systems analysis incorporates initial systems design.
Requirements determination is the single most critical step of the entire SDLC.
71

What is a Requirement?A statement of what the system must do A statement of characteristics the system must have
Focus is on business user needs during analysis phase
Requirements will change over time as project moves from analysis to design to implementation
72
Requirement TypesFunctional Requirements
A process the system hast to performInformation the system must contain
Nonfunctional RequirementsBehavioral properties the system must have Operational Performance Security Cultural and political
73
Documenting RequirementsRequirements definition report
Text document listing requirements in outline form
Priorities may be includedKey purpose is to define the project scope: what is and is not to be included.
74

Basic Steps of Determining RequirementsUnderstand the “As-Is” systemIdentify improvement opportunitiesDevelop the “To-Be” system conceptTechniques vary in amount of change
Business Process Automation (BPA) – small changeBusiness Process Improvement (BPI) - moderate change
Business Process Reengineering (BPR) – significant change
Additional information gathering techniques are needed as well
75

Chapter 5
76

Key IdeasFunctional models describe business processes and the interaction of an information system with its environment.
Two types of models are used to describe functional models: Activity Diagrams and Usecase Diagrams
Activity diagrams support the logical modeling of business processes and workflows.
Usecase Diagrams are used to describe the basic functions of the information system.
77
Elements of an Activity DiagramActions/ActivitiesObject NodesObject FlowsControl NodesControl FlowsSwimlanes
78

Activity Diagram
79
What are Use-Case Descriptions?Describe basic functions of the system
What the user can doHow the system responds
Use cases are building blocks for continued design activities.
80
How Are Use-Cases Created?Two steps:
Write text-based case descriptionsTranslate descriptions into diagrams
Describes one and only one function, but may have multiple paths.
Developed working with users for content.
81
Types of Use-CasesOverview versus detailEssential versus real
82
83
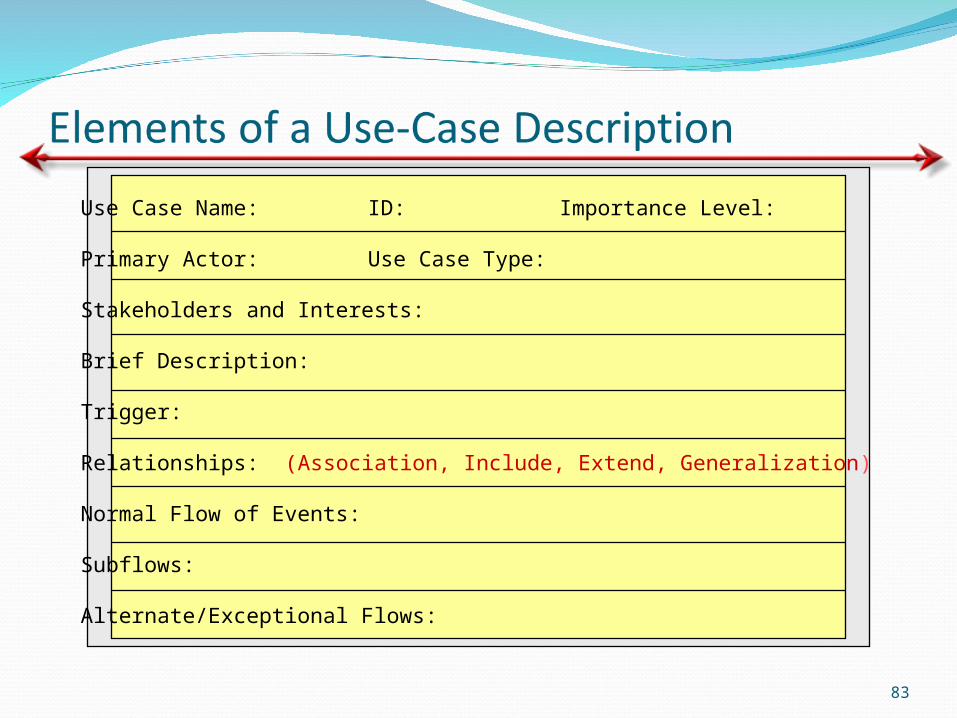
Use Case Name: ID: Importance Level:
Primary Actor: Use Case Type:
Stakeholders and Interests:
Brief Description:
Trigger:
Relationships: (Association, Include, Extend, Generalization)
Normal Flow of Events:
Subflows:
Alternate/Exceptional Flows:

84

85

Chapter 6
86

Key DefinitionsData model
A formal way of representing the data that are used and created by a business system
Shows the people, places and things about which data is captured and the relationships among them.
Logical data model shows the organization of data without indicating how it is stored, created, or manipulated.
87

Key DefinitionsPhysical data model
shows how the data will actually be stored in databases or files.
Normalization is the process analysts use to validate data models.
Data models should balance with process models
88
89

What Is an ERD?A picture showing the information created, stored, and used by a business system.
Entities generally represent similar kinds of information
Lines drawn between entities show relationships among the data
High level business rules are also shown
90

Using the ERD to Show Business RulesBusiness rules are constraints that are followed when the system is in operation.
ERD symbols can show when one instance of an entity must exist for an instance of another to existA doctor must exist before appointments the doctor can be made
91

ERD symbols can show when one instance of an entity can be related to only one or many instances of another entityOne doctor can have many patients; each patient may have only one primary doctor
ERD symbols show when the existence of an entity instance is optional for a related entity instanceA patient may or may not have insurance coverage
92
93
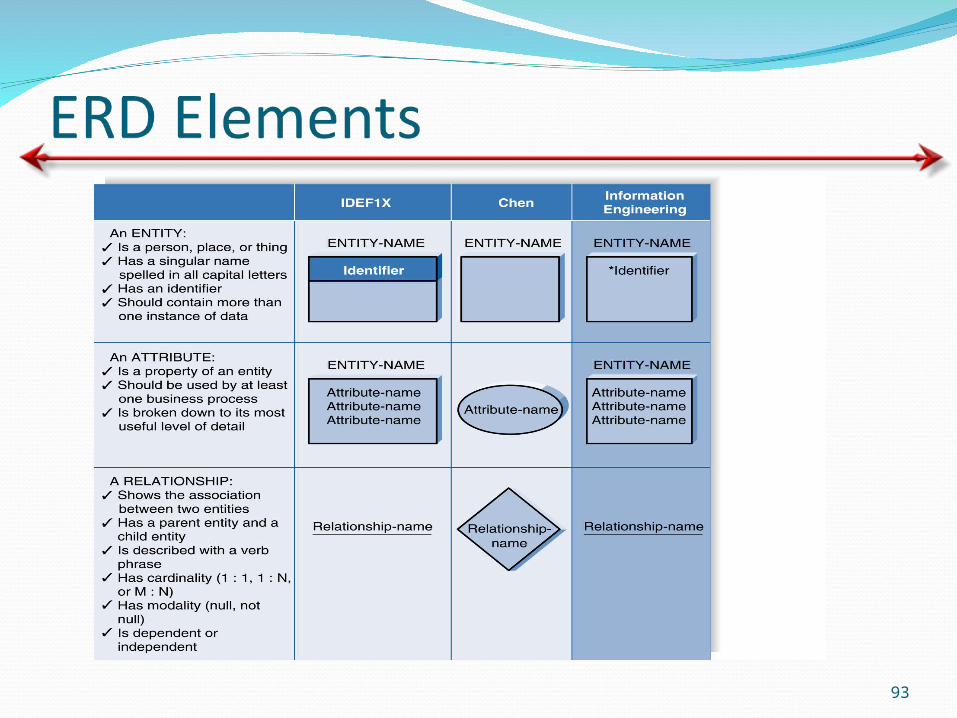
EntityA person, place, event, or thing about which data is collected
Must be multiple occurrences to be an entityExample: If a firm has only one warehouse, the warehouse is not an entity. However, if the firm has several warehouses, the warehouse could be an entity if the firm wants to store data about each warehouse instance.
94

95

AttributesInformation captured about an entityOnly those used by the organization should be included in the model
Attribute names are nounsSometimes entity name is added at the beginning of the attribute name for clarity
96
IdentifiersOne or more attributes can serve as the entity identifier, uniquely identifying each entity instance
Concatenated identifier consists of several attributes
An identifier may be ‘artificial,’ such as creating an ID number
Identifiers may not be developed until the Design Phase
97

98

RelationshipsAssociations between entitiesThe first entity in the relationship is the parent entity; the second entity in the relationship is the child entity
Relationships should have active verb names
Relationships go in both directions
99

100
Cardinality refers to the number of times instances in one entity can be related to instances in another entity One instance in an entity refers to one and only one instance in the related entity (1:1)
One instance in an entity refers to one or more instances in the related entity (1:N)
One or more instances in an entity refer to one or more instances in the related entity (M:N)
101
Modality Refers to whether or not an instance of a child entity can exist without a related instance in the parent entity Not Null means that an instance in the related entity must exist for an instance in another entity to be valid
Null means that no instance in the related entity is necessary for an instance in another entity to be valid

102

ERD BasicsDrawing the ERD is an iterative process of trial and revision
ERDs can become quite complex
103

Steps in Building ERDsIdentify the entitiesAdd appropriate attributes for each entity
Draw the relationships that connect associated entities
104

Identify the EntitiesIdentify major categories of informationIf available, check the process models for data stores, external entities, and data flows
Check the major inputs and outputs from the use cases
Verify that there is more than one instance of the entity that occurs in the system
105

Add Appropriate AttributesIdentify attributes of the entity that are relevant to the system under developmentCheck the process model repository entries for details on data flows and data stores
Check the data requirements of the requirements definition
Interview knowledgeable usersPerform document analysis on existing forms and reports
Select the entity’s identifier
106

Draw the RelationshipsStart with an entity and identify all entities with which it shares relationships
Describe the relationship with the appropriate verb phrase
Determine the cardinality and modality by discussing the business rules with knowledgeable users
107

ERD Building TipsOnly include entities with more than one instance of information
Don’t include entities associated with implementation of the system (they will be added later)
108
109

110
Best practices rather than rulesEntities should have many occurrencesAvoid unnecessary attributesClearly label all components Apply correct cardinality and modalityBreak attributes into lowest level neededLabels should reflect common business terms
Assumptions should be clearly stated

111
Technique used to validate data models
Series of rules applied to logical data model to improve its organization
Three normalization rules are common

112
Chapter 7
113

Key IdeasA structural or conceptual model describes the structure of the data that supports the business processes in an organization..
The structure of data used in the system is represented through class diagrams, and object diagrams.
114
Purpose of Structural ModelsReduce the “semantic gap” between the real world and the world of software
Create a vocabulary for analysts and users
Represent things, ideas, and concepts of importance in the application domain
115
ClassesTemplates for creating instances or objectsConcreteAbstract
Typical examples:Application domain, user interface, data structure, file structure, operating environment, document, and multimedia classes
116
AttributesUnits of information relevant to the description of the class
Only attributes important to the task should be included
117

OperationsAction that instances/objects can takeFocus on relevant problem-specific operations (at this point)
118

RelationshipsGeneralization
Enables inheritance of attributes and operations
AggregationRelates parts to wholes
AssociationMiscellaneous relationships between classes
119
120

121

Class Diagram Syntax
122
A CLASS
AN ATTRIBUTE
AN OPERATION
AN ASSOCIATION
Class 1
-attribute
+operation ()
Attribute name/derived attribute name
operation name ()
1..* 0..1______verb phrase____

More on AttributesDerived attributes
/age, for example can be calculated from birth date and current date
VisibilityPublicProtectedPrivate
123
More on OperationsConstructor
Creates objectQuery
Makes information about state availableUpdate
Changes values of some or all attributes
124
More on RelationshipsClass can be related to itself (role)Multiplicity
Exactly one, zero or more, one or more, zero or one, specified range, multiple disjoint ranges
Association class
125
Simplifying Class DiagramsThe view mechanism shows a subset of information
Packages show aggregations of classes (or any elements in UML)
126

127
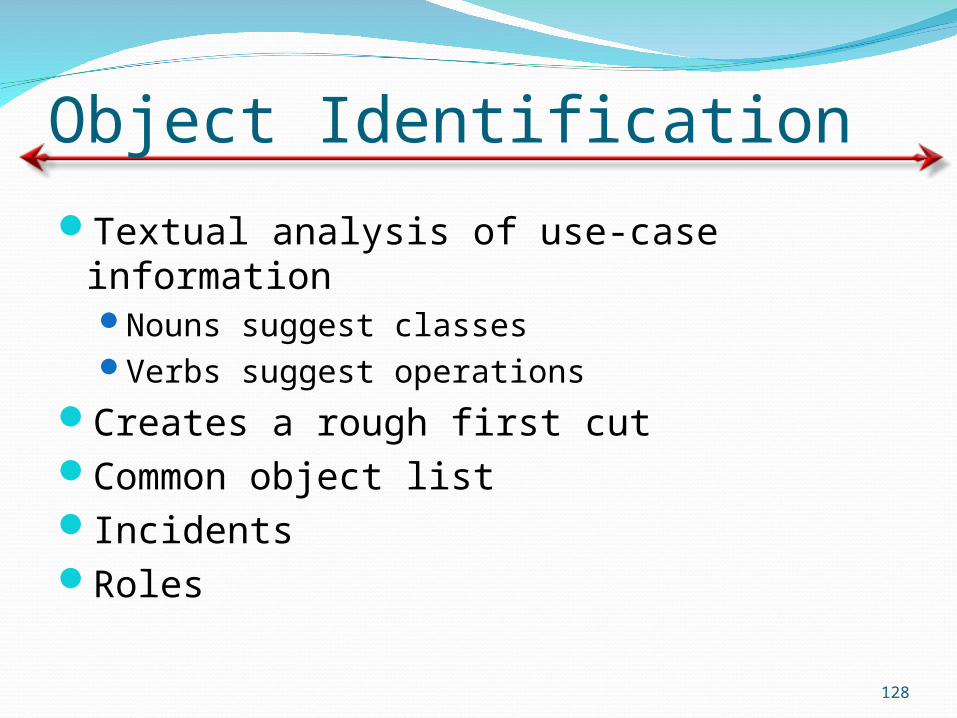
Object IdentificationTextual analysis of use-case informationNouns suggest classesVerbs suggest operations
Creates a rough first cutCommon object listIncidentsRoles
128

PatternsUseful groupings of classes that recur in various situations
TransactionsTransaction classTransaction line item classItem classLocation classParticipant class
129
Chapter 8
130

Key IdeasBehavioral models describe the internal dynamic aspects of an information system that supports business processes in an organization
Key UML behavioral models are: sequence diagrams, collaboration diagrams, and statechart diagrams
131
Purpose of Behavioral ModelsTo depict the internal view of business processes
To show the effects of varied processes on the system
132

Interaction Diagram ComponentsObjectsOperationsMessages
133

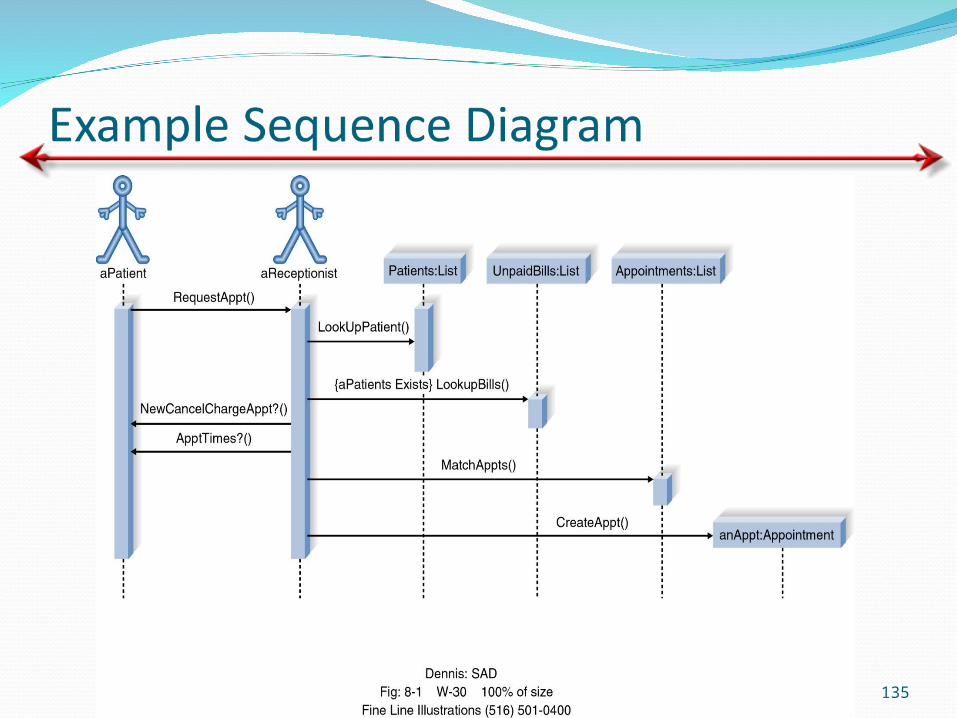
Sequence DiagramsIllustrate the objects that participate in a use-case
Show the messages that pass between objects for a particular use-case
134
135

136
AN ACTOR
AN OBJECT
A LIFELINE
A FOCUS OF CONTROL
A MESSAGE
OBJECT DESTRUCTION
anObject:aClass
aMessage()
x

137
Determine the context of the sequence diagram
Identify the participating objectsSet the lifeline for each objectAdd messagesPlace the focus of control on each object’s lifeline
Validate the sequence diagram

138
Essentially an object diagram that shows message passing relationships instead of aggregation or generalization associations.
Emphasize the flow of messages among objects, rather than timing and ordering of messages

139
Chapter 9
140

Key DefinitionsThe navigation mechanism provides the way for users to tell the system what to do
The input mechanism defines the way the system captures information
The output mechanism defines the way the system provides information to users or other systems
141

Key DefinitionsThe graphical user interface (GUI) is the most common type of interfaces most students are likely to use personally and for developing systems.
142

143

Basic PrinciplesAssume users
Have not read the manualHave not attended trainingDo not have external help readily at hand
All controls should be clear and understandable and placed in an intuitive location on the screen.
144

Basic PrinciplesPrevent mistakes
Limit choicesNever display commands that can’t be used (or “gray them out”)
Confirm actions that are difficult or impossible to undo
Simplify recover from mistakesUse consistent grammar order
145

Types of Navigation ControlLanguages
Command languageNatural language
MenusGenerally aim at broad shallow menuConsider using “hot keys”
Direct ManipulationUsed with icons to start programsUsed to shape and size objectsMay not be intuitive for all commands
146

147
148

149

150
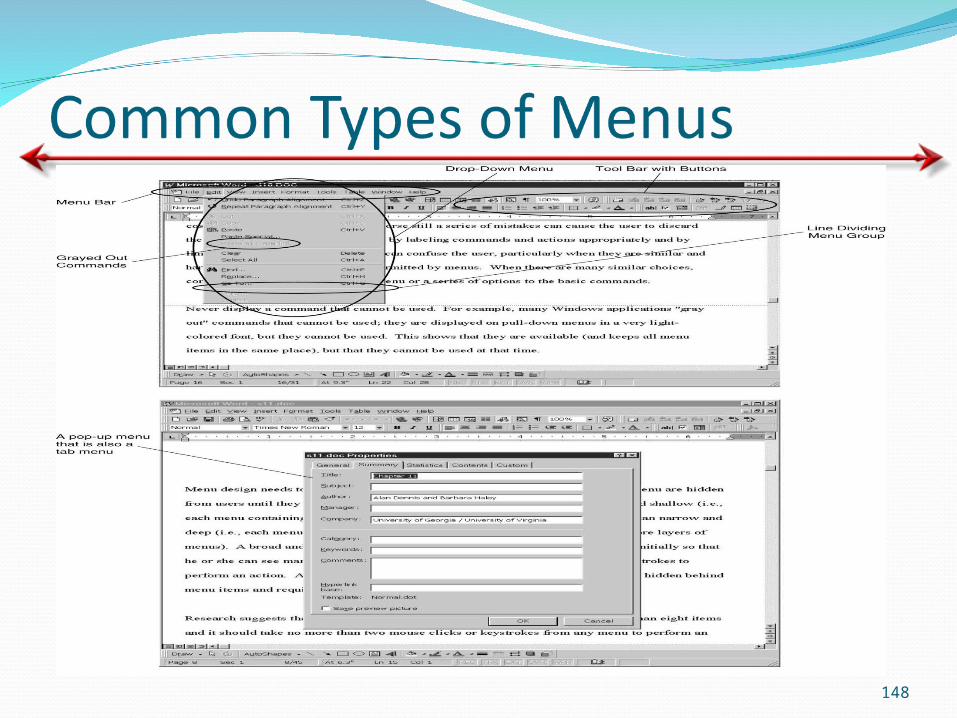
Types of Menus
Menu barDrop-down menuPop-up menuTab menuToolbarImage map
WhenWould YouUse Each ofThese MenuTypes?

Message TipsShould be clear, concise and completeShould be grammatically correct and free of jargon and abbreviations (unless they are the users)
Avoid negatives and humor
151

152
Types of Messages
Error messageConfirmation messageAcknowledgment messageDelay messageHelp message
WhenWould YouUse Each ofThese MessageTypes?

153
154

Basic PrinciplesThe goal is to simply and easily capture accurate information for the system
Reflect the nature of the inputsFind ways to simplify their collection
155

Online versus Batch ProcessingOnline processing immediately records the transaction in the appropriate database
Batch processing collects inputs over time and enters them into the system at one time in a batch
Batch processing simplifies data communications and other processes, but means that inventory and other reports are not accurate in real time
156
Capture Data at the SourceReduces duplicate workReduces processing timeDecreases costDecreases probability of error
157
Source Data AutomationCan be obtained by using the following technologies:bar code readersoptical character recognitionmagnetic stripe readerssmart cards
How can internet be used for source data automation?
158
Minimize KeystrokesNever ask for information that can be obtained in another way
List selection is more efficient than entering information
Use default values where possible
159

Types of InputsData items linked to fieldsTextNumbersSelection boxes
160

161

162
Types of Boxes
Check boxRadio buttonOn-screen list boxDrop-down list boxCombo boxSlider
WhenWould YouUse Each ofThese BoxTypes?

163
Types of Validation
Completeness checkFormat checkRange checkCheck digit checkConsistency checkDatabase checks
WhenWould YouUse Each ofThese ValidationMethods?

164

Basic PrinciplesUnderstand report usage
Reference or cover-to-cover?Frequency?Real-time or batch reports?
Manage information loadAll needed information, no more
Minimize bias
165
166
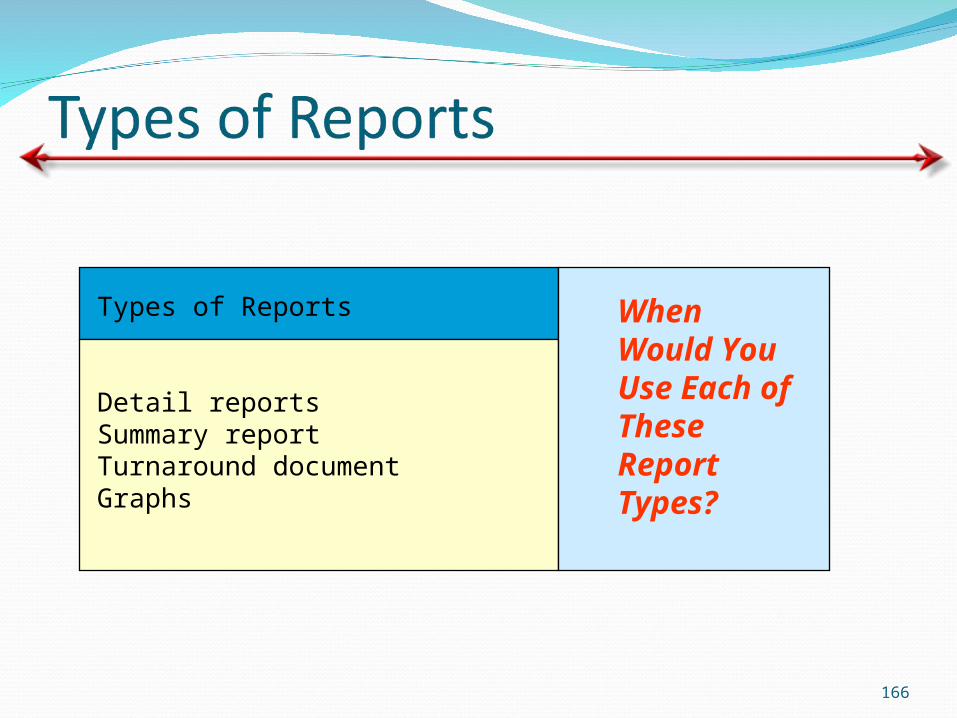
Types of Reports
Detail reportsSummary reportTurnaround documentGraphs
WhenWould YouUse Each ofThese ReportTypes?
167
Electronic
Versus Paper