L'émigration italique dans la Lusitanie côtière : une approche onomastique
Upload
khangminh22Category
view
0download
0
FONCTIONNEMENT DES AQUIFERES
HETEROGENES : APPROCHE COUPLEE DE LA
MESURE IN SITU ET DE LA MODELISATION
HYDROGEOCHIMIQUE POUR LA
COMPREHENSION DES TRANSFERTS D’EAU
SOUTERRAINE DANS LES MASSIFS FISSURES
Catherine Bertrand
To cite this version:
Catherine Bertrand. FONCTIONNEMENT DES AQUIFERES HETEROGENES : AP-PROCHE COUPLEE DE LA MESURE IN SITU ET DE LA MODELISATION HYDRO-GEOCHIMIQUE POUR LA COMPREHENSION DES TRANSFERTS D’EAU SOUTER-RAINE DANS LES MASSIFS FISSURES. Sciences de la Terre. Universite de Franche-ComteEcole doctorale ES, 2014. <tel-01089203>
HAL Id: tel-01089203
https://tel.archives-ouvertes.fr/tel-01089203
Submitted on 1 Dec 2014
HAL is a multi-disciplinary open accessarchive for the deposit and dissemination of sci-entific research documents, whether they are pub-lished or not. The documents may come fromteaching and research institutions in France orabroad, or from public or private research centers.
L’archive ouverte pluridisciplinaire HAL, estdestinee au depot et a la diffusion de documentsscientifiques de niveau recherche, publies ou non,emanant des etablissements d’enseignement et derecherche francais ou etrangers, des laboratoirespublics ou prives.

Mémoire d’Habilitation à Diriger des Recherches
Présenté le 30 octobre 2014
par
Catherine Bertrand
Devant le jury composé de
Yves Guglielmi, Professeur, CEREGE Université Aix-Marseille, Président du jury Bartolomé Andréo , Professeur, Université de Malaga, Rapporteur Bertrand Fritz, Directeur de Recherches, UMR 7517, Université de Strasbourg, Rapporteur Patrick Lachassagne, HDR, Responsable Environnement et Ressources en Eau, Evian les Bains,
Rapporteur Jean-Philippe Malet, Chargé de Recherches, EOST Université de Strasbourg Olivier Fabbri, Professeur, Université de Franche-Comté Jacques Mudry, Professeur, Université de Franche-Comté
FONCTIONNEMENT DES AQUIFERES HETEROGENES : APPROCHE COUPLEE DE LA MESURE IN SITU ET DE LA MODELISATION HYDROGEOCHIMIQUE POUR LA COMPREHENSION DES TRANSFERTS D’EAU
SOUTERRAINE DANS LES MASSIFS FISSURES


Avant-propos
Si la rédaction de mon mémoire d’HDR est une occasion de faire un point sur mes travaux, la
rédaction des avant-propos me permet de faire un bilan plus personnel de ces « quelques années »
qui se sont écoulées depuis le début de ma thèse de troisième cycle.
La formation universitaire que j’ai eue à Strasbourg m’a conduit naturellement à réaliser un
doctorat en géochimie de la surface. Cette thèse effectuée en grande partie au BRGM à Orléans a été
une première étape dans ma vie d’adulte en construction puisque c’est la première fois que je
quittais mon Alsace pour aller vivre « dans la France de l’Intérieur ». Cela a été également une étape
importante de la découverte du monde de la recherche qui m’a convenue puisque j’y suis restée. Je
me suis investie dans la confrontation des données issues de la modélisation géochimique, en plein
essor à l’époque, et des données issues de l’expérimentation. C’est ce qui m’avait attirée dans ces
travaux : contraindre les modèles par des données réelles, ligne directrice que je n’ai pas quittée
depuis. Mes travaux au CEA de Bruyères-le-Châtel ont été une suite logique car également centrés
sur la calibration de paramètres nécessaires à la validation des modèles géochimiques.
Et puis …
J’ai été accueillie au laboratoire de Géologie Structurale et Appliquée de l’Université de
Franche-Comté par une équipe de fous furieux. Et là, je me suis dit « mais qu’est-ce que je fais ici ? ».
Quoiqu’il en soit, j’ai quand même évité une intoxication au monoxyde de carbone qui a failli
décimer l’équipe des hydrogéologues de Besançon mais pas l’effraction d’un gymnase à 2h du matin
pour dormir sur un tatami qui ne sentait pas bon. Et je suis restée.
Pour les géologues bisontins, il y a eu l’époque des laboratoires sur deux sites (la Bouloie et la
Place Leclerc), qui différenciaient la Géologie Fondamentale de celle de la géologie appliquée.
Et puis …
Un jour nous avons aussi rejoint le site de la Bouloie….
2
Pour moi il y a également eu deux époques :
- L’Ere du tsunami guglielmia mama mia d’Yves, qui m’a fait découvrir la problématique des
instabilités de versant et la force de l’outil hydrochimique dans l’aide à la compréhension
des écoulements souterrains. Fini les expérimentations en laboratoire, il était temps de
changer d’échelle. Mais Yves est toujours en avance, trop vite pour moi. Il n’empêche que
j’en ai appris des choses à son contact.
- L’Ere de la Force Tranquille de Jacques, plus calme où tout était sous contrôle. Quand je dis
plus calme, c’est un doux euphémisme, en tout cas à un rythme qui me convenait mieux.
Nous avons travaillé ensemble et toujours sereinement sur des projets qui nous tenaient à
cœur. Jacques, à toi aussi je dois beaucoup.
Le labo d’hydro, c’est également Sophie avec qui c’est vraiment un plaisir de travailler dans
tous les domaines de notre métier. J’aime sa rigueur et son sens de l’humour.
Toute cette activité que nous avons imaginée n’a pu se faire que grâce à MON REGENT. C’est
super gentil Bruno, de vouloir prendre ta retraite en 2030. C’est promis nous ferons notre pot de
départ ensemble. Trêve de plaisanteries, Bruno a été un pilier de voûte de ce laboratoire. Il n’est pas
encore parti qu’il me manque déjà. Bruno, merci pour tout.
Merci également à Claire Pamart qui a été remplacée par Caroline Merey-Amiot puis
Marguerite Goetghebeur-Perrey et enfin Christophe Loup qui ont assuré le coté analytique. Sans leur
compétence et leur bonne humeur, je ne sais pas ce que nous aurions fait de toute l’eau que nous
leur avons ramenée.
Un grand merci à tous mes collègues (par ordre alphabétique de ma vieille liste téléphonique),
Vincent, Martine, Nicolas, Delphine, Olivier, Philippe, et Philippe, James, Patrick, et Patrick, Jean-
Pierre, et Jean-Pierre, Marc, Christian, Pierre et Anne-Véronique avec qui travailler est un plaisir et
qui m’ont acceptée (ou pas) avec mes humeurs (qui sur une échelle style pH) varie de 7 à 7. Je pense
également à Michel Rossy, Nicole Morre-Biot Patrick Gaviglio, Chantal Wackenheim et Hervé Grisey.
Je ne voudrais pas oublier toutes les personnes qui nous facilitent au quotidien le travail
administratif et technique : Serge André, même si tu es parti depuis un certain temps, ton ancien
bureau sent encore le vieux tabac, Annie Bouchez, Marie-Jo Manfredi, Gisèle Thor, Céline Guillemot,
Christelle Robbe, Annie Martin, Blandine Delaby et Didier Convert-Gaubier. Et bien sûr Sylvie Costille-
Varey, Cristina Ramos et Nathalie Puillet ainsi que Jean-Daniel Tissot et Charles-Henri Falconnet à qui
je crée bien des soucis.
Merci à tous les étudiants et ATER que j’ai croisé sur mon chemin. Je pense en particulier à
Arnaud, Stéphane et Aurélien ainsi que Jean-Baptiste et Nicolas, qui malgré le fait qu’ils soient
hydrogéologues, ne boivent pas que de l’eau, ce qui rend nos trouvailles et retrouvailles plutôt
sympas.
Et puis..
Il y a les membres du jury qui ont bien voulu se déplacer, pour certains jusque dans le grand
nord de l’Europe où se situe Besançon.

3
Tout d’abord merci à Patrick Lachassagne, Bartoloméo Andréo-Navarro et Bertrand Fritz qui
ont bien voulu accepter de juger mon travail. Une pensée particulière pour Bertrand qui a été mon
directeur de thèse et que je remercie encore de m’avoir fait confiance il y a plus de 20 ans. Je suis
ravie de continuer à travailler avec Bartolomé, à la seule différence que je n’irai plus à Malaga en
fourgon pour 4 jours de déplacement. Et oui, je vieilli mal. J’espère également avoir donné envie à
Patrick Lachassagne de collaborer dans le futur avec l’équipe bisontine.
Merci à Yves Guglielmi d’avoir accepté la présidence de ce jury et d’avoir animé une discussion
passionnante, mais je n’étonne personne en écrivant cela.
Enfin Jean-Philippe Malet, Olivier Fabbri et Jacques Mudry ont parfaitement rempli leur
mission d’examinateur et je les en remercie. J’ai rencontré Jean-Philippe par l’intermédiaire de mes
collègues d’Avignon, et dont j’ai rapidement apprécié la rigueur scientifique et la simplicité des
relations humaines. Je suis heureuse que notre collaboration se poursuive au travers de l’OMIV.
Quant à Olivier, compagnon des premiers jours à la Place Leclerc, je ne désespère pas de te mettre à
l’eau. Jacques, profite bien de ta retraite. Si ce mémoire a vu le jour, c’est bien parce que tu m’as
démontré que j’en été capable et pour une fois tu avais raison.
Et …..
La famille, bien sûr
Valérie et Jean-Mi, depuis le temps je n’ai pas réussi à vous lasser, j’en suis la première
étonnée. En tout cas de copain de fac vous êtes passé à une dimension supérieure et c’est moi qui
suis chanceuse.
Je suis également chanceuse d’avoir ma mère qui, le jour de ma soutenance a oublié sa
tablette (ce n’était pas le moment, Moman), Eric et Danièle, Agnès et Claude, Marie et Bastien et la
génération suivante ainsi que mes gendres (j’adore cette expression), je ne vous échangerais pas
contre deux barils de lessives.
La nouvelle nouvelle génération s’appelle Maël. Il croque la vie à « quatre dents » et
s’épanouit en compagnie de son frère, de ses parents, de ses oncle et tantes. Yannick et Alexandre, je
vous souhaite de vous épanouir dans la vie que vous vous construisez.
Et …..
Toute ma vie, assurément
Hubert, main dans la main, continuons à avancer ensemble, peu importe vers où, allons-y.
Anna et Marine, votre force c’est d’être deux, votre force c’est d’être unique, je pense que vous ferez de belles choses de votre vie. J’ai confiance, vous réussirez votre quête de l’Absolu et je serais à vos côtés.
-« Dit, ma petite maman, et si on jouait ? » - « Encore une bonne idée, mon petit Délou, jouons, Il me reste une vie pour cela. »

4
5
Table des matières
Dossier scientifique ........................................................................................ 9
1 Curriculum vitae ....................................................................................... 9
1.1 Situation administrative ..................................................................................................... 9
1.2 Diplôme et Formation ........................................................................................................ 9
1.3 Carrière ............................................................................................................................. 10
1.4 Responsabilités collectives ............................................................................................... 10
1.5 Activités d’enseignement ................................................................................................. 11
1.6 Participation au fonctionnement du parcours hydrogéologie du Master de Géologie
Appliquée ......................................................................................................................................... 13
1.7 Participation au fonctionnement des Etablissements d’Enseignement Supérieur .......... 13
1.8 Expertises scientifiques .................................................................................................... 14
1.9 Organisation colloques, conférences, journées d’étude .................................................. 14
2 Animation de la recherche ..................................................................... 15
2.1 Parcours scientifique ........................................................................................................ 15
2.2 Responsable de projets scientifiques : élaboration et rédaction de projets, recherche de
financement monde industriel/public, rédaction de rapports de fin de contrat............................. 16
2.3 Participation à des programmes de recherche ................................................................ 16
2.4 Fonctionnement du laboratoire d’hydrogéologie ............................................................ 17
2.5 Encadrements-co-encadrements de travaux de recherche ............................................. 18
2.6 Réseaux de recherche ...................................................................................................... 19
2.7 Echanges internationaux .................................................................................................. 20
2.8 Diffusions des résultats de la recherche en direction du public ...................................... 20
3 Liste des travaux .................................................................................... 20
3.1 O - Ouvrages individuels et collectifs : ............................................................................. 20
3.2 A- Publications dans des revues scientifiques à comité de lecture : ................................ 21
3.3 B- Publications nationales avec comité de lecture : ......................................................... 23
3.4 CI : Conférences internationales à comité de lecture et actes publiés ............................ 23
3.5 CN : Conférences nationales à comité de lecture et actes publiés : ................................ 26

6
3.6 Publications didactiques et non référencées ................................................................... 27
R : Rapports scientifiques ................................................................................................................. 27
C : Conférences invitées et séminaires .............................................................................................. 28
Fonctionnement des aquifères hétérogènes : Approche couplée de la mesure in
situ et de la modélisation hydrogéochimique pour la compréhension des
transferts d’eau souterraine dans les massifs fissurés .................................. 31
4 Préambule .............................................................................................. 31
5 Les aquifères des milieux fissurés .......................................................... 34
5.1 Les milieux fissurés ........................................................................................................... 34
5.2 Ecoulements dans les milieux fissurés à double perméabilité ......................................... 37
5.3 Minéralisation de l’eau des milieux fissurés .................................................................... 40
5.4 Les zones ateliers .............................................................................................................. 43
6 Mouvements de fluides et processus hydrochimiques ........................... 48
6.1 Caractérisation du signal d’infiltration dans les aquifères hétérogènes .......................... 49
6.2 Caractérisation des transferts au sein de l’aquifère ........................................................ 51
6.2.1 Epikarst-Zone Non Saturée/ Zone Saturée ............................................................... 53
6.2.2 Socle instable/socle stable ....................................................................................... 54
7 Mouvements de fluides et modélisation géochimique ........................... 56
7.1 Les modèles géochimiques : de l’expérimental en laboratoire au terrain ....................... 57
7.1.1 Calage des paramètres des modèles ........................................................................ 57
7.1.2 Stratégie de modélisation ........................................................................................ 59
7.2 Apport de la modélisation à la compréhension des écoulements ................................... 62
7.2.1 Ecoulement et colmatage (R6, R7, R9) ..................................................................... 62
7.2.2 Mécanisme d’acquisition de la chimie de l’eau ;...................................................... 62
8 Conclusion- ............................................................................................ 67
9 mesures et observables ......................................................................... 71
9.1 Mesures ............................................................................................................................ 71
9.2 Observables ...................................................................................................................... 73
10 Perspectives ........................................................................................... 77
10.1 Hydrochimie et couplage avec un modèle de transport réactif ....................................... 77
10.2 Hydrochimie et couplage hydromécanique ..................................................................... 78
7
10.3 Hydrochimie et transfert de matière ............................................................................... 79
Bibliographie………………………………………… ………………………….…………………81
Liste des figures…………………………………… ……………………………………………………95
Liste des tableaux……………………………………………………………… ……………………..95
Annexe……………………………………………………………………………………… ……………97

8
9
Dossier scientifique
1 CURRICULUM VITAE
Nationalité française
Née le 1er juillet 1964
Mariée, 3 enfants (1992, 1995, 2002-2007)
Coordonnées professionnelles
UMR 6249 Chrono-environnement-Université de Franche-Comté
16 route de Gray, 25 030 Besançon cedex
Tel : +33 (3) 81 66 65 49
1.1 Situation administrative
Maître de conférences à l’Université de Franche-Comté, UFR Sciences et
Techniques depuis le 1/10/1997
rattachée à l’EA2642 de novembre 1997 à décembre 2007
rattachée à l’UMR Chrono-Environnement 6249 depuis janvier 2008
rattachée à la section 36 (Terre solide : géodynamique des enveloppes
supérieures, paléobiosphère)
1.2 Diplôme et Formation
1997 Mastère spécialisé en Maîtrise des déchets, Ecole Nationale du Génie de l’Eau
et de l’Environnement de Strasbourg
1992 Doctorat de l'Université L. Pasteur de Strasbourg, collaboration entre le Centre de Géochimie de la Surface (Unité propre du CNRS) et le Bureau de Recherche Géologique et Minière d'Orléans, mention Très Honorable, félicitations du Jury
"Etude expérimentale et modélisation thermodynamique et cinétique de
l'altération hydrothermale d'un grès"

10
Jury : C. Roques-Carme, D. Jeannette, JF Sureau, Y. Gueguen, B. Fritz (Directeur
de Thèse)
1988 DEA de Géochimie de la Surface (mention AB), Institut de Géologie de Strasbourg
1986-1987 Licence et Maîtrise de Géologie Fondamentale et Appliquée (mention AB), Institut de Géologie de Strasbourg
1985 DEUG B Université Louis Pasteur Strasbourg
1983 Baccalauréat série C, Académie de Strasbourg
1.3 Carrière
2011-2014 Maître de conférences à l’UFR ST, Université Franche-Comté, UMR 6249 ChronoEnvironement, (Direction D. Gilbert) rattachée au thème « Terre Climats Société » (Resp. O. Fabbri)
2008-2011 Maître de conférences à l’UFR ST, Université Franche-Comté, UMR 6249 ChronoEnvironement, (Direction H. Richard) rattachée au thème « Interactions et transferts dans la biogéosphère » (resp. D. Marquer)
1997-2007 Maître de conférences à l’UFR ST, Université Franche-Comté (EA2642, Déformation Ecoulement transfert, Directions J. Mudry, P. Gaviglio puis D. Marquer)
1993-1996 Chercheur post doctoral CEA (Bruyères-le-Châtel)
1991-1993 ATER à l’Université Louis Pasteur de Strasbourg
1989-1991 Allocataire, thèse de Doctorat à l’Université Louis Pasteur de
Strasbourg- collaboration BRGM-CNRS
1.4 Responsabilités collectives
Au cours de ma carrière, j’ai participé (entre autres) aux tâches collectives
comme :
- Responsable du laboratoire d’hydrogéologie et chimie des eaux du thème 1
de l’UMR Chrono-Environnement, depuis mon intégration à l’UFC:
- Référente de Bruno Régent, technicien du laboratoire d’hydrogéologie et
chimie des eaux
- Co-directeur des études de la filière de master professionnelle (2008-2010,
période intérimaire en remplacement de J.M. Quenardel),
- Comité de direction du CMI de Géologie Appliquée (depuis 2012),
- Responsable du parcours hydrogéologie du CMI Géologie Appliquée
- Participation à la rédaction des maquettes d’enseignement (CMI, Licence
professionnelle Analyses Chimiques)

11
1.5 Activités d’enseignement
Mon enseignement a évolué au cours de ma carrière. Jusqu’en 2005, j’intervenais
en premier cycle avec des enseignements de base (camps de terrain, cartographie,
pétrographie, outils informatiques) et des enseignements spécialisés en hydrochimie et
géologie de l’environnement (déchets et pollution).
Puis, mon enseignement a évolué avec un investissement plus important dans la
filière professionnalisante du master de Géologie Appliquée, notamment par un
enseignement intégré cours-TD-TP en hydrologie-hydrogéologie : hydrogéochimie,
protection et gestion des ressources en eau, dépollution. Dans les deux derniers
domaines, j’organise des visites de sites et chantiers afin d’illustrer l’enseignement
théorique. Cela permet également aux étudiants de rencontrer des professionnels et
d’établir des contacts.
Pratique de terrain en hydrogéologie - Mise en situation professionnelle :
Chaque année, dans le cadre d’un module « pratique de terrain » j’organise mon
enseignement autour de cas pratiques rencontrés en hydrogéologie. Il s’agit de mettre
les étudiants en situation professionnelle.
Ces enseignements demandent de ma part un fort investissement pour plusieurs
raisons, il faut chaque année découvrir des sites d’étude qui puisse convenir aux
étudiants. Cela nécessite également une bonne gestion du matériel à disposition des
étudiants.
Parallèlement je continue à m’investir dans le premier cycle, surtout en premier
semestre de la L1 ou j’ai créé un TP hydrogéologie. Les étudiants découvrent, à partir
d’un modèle analogique, les écoulements d’eau au sein d’une nappe phréatique (calcul
du coefficient de perméabilité, visualisation des effets d’une pluie sur la recharge d’un
aquifère, visualisation de la migration d’un polluant dans l’aquifère).
Actuellement la majorité de mon enseignement se fait en master professionnel
(Géologie Appliquée, Qualité des eaux, Traitements), en formation initiale présentielle.
J’effectue le plus grand nombre de mes heures d’enseignement en TP, puis en TD, pour
un nombre d’heures qui avoisine en moyenne 250hEDT par an. Les deux années à faible
volume horaire correspond à un congé de maternité (2002) et à 6mois de CRCT (2012)
0
100
200
300
400
Master
Licence 0
100
200
300
400
CM
TD
TP

12
Jusqu’en 2004, j’ai également enseigné dans d’autres universités (cf liste ci-
dessous). Vu mon investissement pédagogique dans ma propre université, j’ai stoppé
ces interventions extérieures.
UFR STGI Montbéliard (2000 (6h) ; 2003, 2004, 8h)
DEUG Génie l’environnement 1ère année : TD, TP Lecture de paysage, cartographie
Université Bourgogne (2000, 2001 ; 8h)
DEA Principe de la modélisation géochimique
Nancy (1999, 2001, 4,5 h)
Ecole Nationale des Mines de Nancy, 3ème année : cours sur le principe de la
modélisation géochimique
Université Nice (2001, 6h)
DEA gestion de la Planète : modélisation géochimique, hydrochimie
UFR SLHS Besançon (2003, 2004 ; 10h puis 44h)
IUP Génie de l’environnement : 1ère année : cours, TD, TP Lecture de paysage,
cartographie, 2eme année hydrogéologie et déchets, 3eme année suivi des étudiants en
entreprise, encadrement des mémoires de stage
Université Technologique de Troyes (2004, 18h)
Master Management Environnemental et Développement Durable,
hydrogéologie, cartographie hydrogéologique, hydrochimie)
UFR ST Besançon (depuis fin 1997, temps plein)
Licence sciences de la terre : TD géologie générale, TP outils documentaires, TP
hydrogéologie, encadrement de mémoires de TER
Licence professionnelle Lons le Saunier (1999-2005, 4h): Stockage des déchets
Licence professionnelle Analyse chimique (depuis 2011, 13h) prélèvements et
analyse de la matrice eau
Master professionnel Géologie appliquée 1ère année : cours, TD, TP :
hydrogéochimie, métrologie de terrain en hydrogéologie, encadrement de mémoires
techniques de master pro, suivi des apprentis en entreprise.
Master professionnel Géologie appliquée 2ème année : cours, TD, TP de protection
et gestion des ressources en eau, Déchets et pollution, Mise en situation
professionnelle ; camps de terrain hydrogéologie, animation de projets professionnels,
encadrement de mémoires professionnels de Master pro, suivi des apprentis en
entreprise.

13
Master professionnel QuEST (Qualité des Eaux, traitements) : Cours et TD
hydrochimie et éléments polluants, encadrement de mémoires de Master pro (1 par an
depuis 2009).
Master recherche Vie-Terre-Environnement-Santé-Société : Hydrochimie,
métrologie en hydrogéologie. Co-encadrement de mémoires de master recherche (1 par
an environ depuis 2002)
1.6 Participation au fonctionnement du parcours hydrogéologie du Master de
Géologie Appliquée
Je coordonne l’équipe pédagogique qui intervient dans le cursus du CMI de
Géologie Appliquée, je m’assure du bon fonctionnement de la filière, (contenus
pédagogiques, interventions des professionnels extérieurs à l’université).
Je m’engage également dans le bon fonctionnement de la recherche
d’apprentissage des étudiants, notamment en les aidant dans leur recherche d’une
entreprise selon leur projet professionnel (CV, lettre de motivation, aide à un futur
entretien)
Je m’assure du renouvellement du matériel pédagogique, notamment par la
rédaction de demande d’investissement auprès du CFA-Sup.
1.7 Participation au fonctionnement des Etablissements d’Enseignement
Supérieur
Conseils
2014 Membre élue du Conseil de l’OSU THETA
Membre élue du Conseil de département de Géosciences
2012-2014 Membre nommée du Comité Scientifique de l’UMR Chrono-Environnement
Commissions de spécialistes
2001-2004 35-36ème section, Université de Franche-Comté, membre suppléant élue
2004-2007 35-36ème section, Université de Franche-Comté, membre titulaire élue
35-36-67ème section, Université de Bourgogne, membre suppléant élue
2012 35-36-67ème section, Université de Bourgogne, membre titulaire, nommée
2013 35-36ème section, Université d’Avignon, membre titulaire, nommée
2014 35-36ème section, Université de Bordeaux, membre titulaire, nommée,
35-36ème section, Université de Franche-Comté, membre titulaire nommée
14
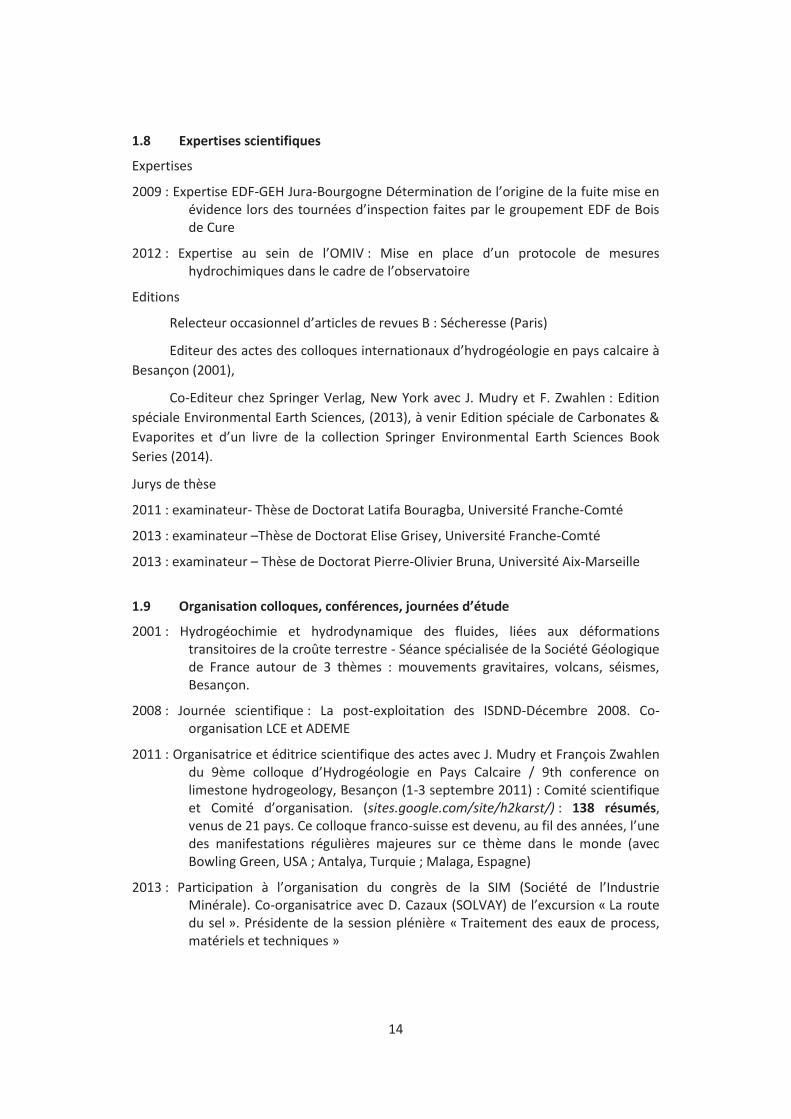
1.8 Expertises scientifiques
Expertises
2009 : Expertise EDF-GEH Jura-Bourgogne Détermination de l’origine de la fuite mise en
évidence lors des tournées d’inspection faites par le groupement EDF de Bois
de Cure
2012 : Expertise au sein de l’OMIV : Mise en place d’un protocole de mesures
hydrochimiques dans le cadre de l’observatoire
Editions
Relecteur occasionnel d’articles de revues B : Sécheresse (Paris)
Editeur des actes des colloques internationaux d’hydrogéologie en pays calcaire à
Besançon (2001),
Co-Editeur chez Springer Verlag, New York avec J. Mudry et F. Zwahlen : Edition
spéciale Environmental Earth Sciences, (2013), à venir Edition spéciale de Carbonates &
Evaporites et d’un livre de la collection Springer Environmental Earth Sciences Book
Series (2014).
Jurys de thèse
2011 : examinateur- Thèse de Doctorat Latifa Bouragba, Université Franche-Comté
2013 : examinateur –Thèse de Doctorat Elise Grisey, Université Franche-Comté
2013 : examinateur – Thèse de Doctorat Pierre-Olivier Bruna, Université Aix-Marseille
1.9 Organisation colloques, conférences, journées d’étude
2001 : Hydrogéochimie et hydrodynamique des fluides, liées aux déformations transitoires de la croûte terrestre - Séance spécialisée de la Société Géologique de France autour de 3 thèmes : mouvements gravitaires, volcans, séismes, Besançon.
2008 : Journée scientifique : La post-exploitation des ISDND-Décembre 2008. Co-organisation LCE et ADEME
2011 : Organisatrice et éditrice scientifique des actes avec J. Mudry et François Zwahlen du 9ème colloque d’Hydrogéologie en Pays Calcaire / 9th conference on
limestone hydrogeology, Besançon (1-3 septembre 2011) : Comité scientifique et Comité d’organisation. (sites.google.com/site/h2karst/) : 138 résumés, venus de 21 pays. Ce colloque franco-suisse est devenu, au fil des années, l’une
des manifestations régulières majeures sur ce thème dans le monde (avec Bowling Green, USA ; Antalya, Turquie ; Malaga, Espagne)
2013 : Participation à l’organisation du congrès de la SIM (Société de l’Industrie
Minérale). Co-organisatrice avec D. Cazaux (SOLVAY) de l’excursion « La route du sel ». Présidente de la session plénière « Traitement des eaux de process, matériels et techniques »

15
2014 : International Symposium on Karst (ISKA) Malaga : A terme, les colloques H2karst ISKA vont fusionner pour former EuroKarst, dont je serai une des principales organisatrices avec mes collègues suisses et espagnols.
2 ANIMATION DE LA RECHERCHE
Coordinatrice de plusieurs projets scientifiques
Co-encadrement d’un contrat post-doctoral, de trois thèses de Doctorat et de 12
stages de DEA/master recherche
2.1 Parcours scientifique
Au cours de mes 3 années de thèse qui se sont déroulées entre le BRGM et le
Centre de Géochimie de la Surface de Strasbourg, ma thématique de recherches était
centrée sur l’expérimentation en laboratoire des interactions eau-roche sédimentaire.
L’objectif de ces recherches était de contraindre les modèles géochimiques par la
détermination de paramètres nécessaire à la validation de modèles géochimiques.
Les travaux entrepris lors de mon contrat post-doctoral au Laboratoire de
Détection et de Géophysique (LDG) de la Direction des Applications Militaires se sont
essentiellement focalisés sur la détermination de la surface réactive d’une roche dans
son milieu naturel dans le but de mieux contraindre les paramètres des modèles
géochimiques. Effectivement, dans le cadre des activités du LDG, dont l'une des missions
est de prévoir à court, moyen et long terme la migration des produits radioactifs issus
des essais nucléaires et déposés dans le massif de Mururoa, des approches
expérimentales en laboratoire et sur le terrain ainsi que des approches théoriques de
simulations numériques sont développées en parallèle.
Depuis mon intégration dans l’Equipe d’Accueil 2642 de Besançon, puis dans
l’UMR Chrono-Environnement, j’ai orienté mes activités de recherche selon deux axes :
- le traçage géochimique des interactions eau-roche à l’échelle du massif,
- le couplage de la mesure in situ du signal chimique des eaux et analyse
pétrographique des roches du massif et des structures existantes et de la modélisation
numérique des interactions eau-roche
L’objectif de ma recherche est d’étudier les circulations de fluides actuelles ou à
court terme, en traçant les écoulements et en définissant les mécanismes de transport
enregistrés par les marqueurs chimiques et minéralogiques. La démarche adoptée
consiste à confronter le signal chimique des eaux prélevées à différentes sources du
massif à celui des phases solides afin de retracer le parcours des fluides en fonction de la
pétrographie des roches rencontrées lors du transit et d’évaluer les effets de cette
circulation à partir de modèles géochimiques.

16
2.2 Responsable de projets scientifiques : élaboration et rédaction de projets,
recherche de financement monde industriel/public, rédaction de rapports de fin de
contrat
Projets de Recherche avec l’industrie
1998-2003 INERIS : Impact environnemental sur la qualité des eaux lors de la fermeture des mines (Responsable de programme)
1999-2000 EDF-CNEH (Centre National d’Etudes Hydrauliques ; G. CASTANIER et G. CHASSARD) : Interprétation des débits de fuite dans les appuis rocheux du barrage de Vieux-Pré (Vosges) et de Vouglans (Jura) par des mesures hydrochimiques (co-responsable du programme avec Y. Guglielmi)
2002-2004 EDF-CNEH (G. CASTANIER et G. DEVEZE) : Interprétation des débits de fuites dans les appuis rocheux des barrages de Laparan (Ariège) et de Vouglans (Jura) par des mesures hydrochimiques (responsable du programme)
2013 : BRGM : SR de Besançon : Evaluation des pollutions naturelles et anthropiques sur
les substrats eau et sols dans le territoire de Belfort. Responsable universitaire
de la convention
Porteur de projets universitaire
BQR-Région :
Nombreux projets qui ont permis de développer le laboratoire d’hydrogéologie
(automatisation de la chaine d’analyse des anions, carotteuse,
chromatographie des éléments fluorescents).
2010-2011-2013 : Porteur de projets Région
2010 : Projet BQR en soutien de l’ANR SLAMS : analyses chimiques
SRO : Soutien à la recherche de l’Observatoire des Sciences de l’Univers
2012 : Hydrochimie Ecoulement et Instabilités de Versants
2013 : Quantification de la dégradation mécanique et chimique du versant instable de Séchilienne : approche géologique, hydromécanique et hydrochimique
2.3 Participation à des programmes de recherche
PNRN dans le thème « Aléas gravitaire »
1998- Approche hydrogéologique, géochimique et géophysique des relations transferts d'eau souterraine - mouvement de terrain. Collaboratrice, participation à la
rédaction du programme.
2000- Mesure et modélisation des effets du couplage hydromécanique et hydrogéochimique dans les mouvements de versants rocheux fracturés de grande ampleur. Collaboratrice, participation à la rédaction du programme.

17
2002- Approche géomécanique du comportement mécanique, hydromécanique et hydrogéochimique des mouvements de versants rocheux. Participante
ACI dans le thème « Catastrophes Naturelles »
2000- Mesure et modélisation couplées des précurseurs sismiques « Déformations-niveaux de nappes-géochimie des eaux » : mise en place d’une méthodologie
issue des expériences sur le site de Coaraze en zone à sismicité modérée (Alpes Maritimes, 06) : Participante
ANR STABROCK :
2006-2008 : Impact des changements climatiques sur la stabilité des fronts rocheux : Observation, Expérimentation et Modélisation. Participante et co-rédactrice
de la synthèse hydrogéologique.
ANR SLAMS :
2010-2013 : Etudes Multidisciplinaires du Mouvement de Séchilienne : aléa, risques associés et conséquences socio-économique : responsable de la partie « Hydrogéologie » : mise au point d’un modèle hydrogéologique global; et remise d’un rapport de synthèse. Cette partie est incluse dans la tache 2 « Compréhension des effets des mouvements de fluides et des couplages hydromécaniques associés sur les processus de déstabilisation du glissement de terrain de Séchilienne. » du programme..
2.4 Fonctionnement du laboratoire d’hydrogéologie
Les financements obtenus par ces différents projets (coordinatrice ou
participante) ont permis :
- De faire fonctionner le laboratoire d’hydrogéologie, de renouveler le matériel
d’analyse (changement de l’absorption atomique, hotte aspirante),
d’améliorer la chaine d’acquisition de la chaine HPLC par l’achat d’un passeur
automatique et enfin d’équiper celui-ci d’une chaine d’acquisition du carbone
organique COT et de la mesure de la fluorescence par chromatographie.
- d’équiper le site de Fertans (25) avec comme valorisation de la recherche,
d’une part des publications internationales et d’autre part, l’intégration de
l’équipe des hydrogéologues, associés au sein de l’OSU-THETA, dans un
programme EQUIPEX. Dans ce programme, le projet CRITEX a pour objectifs de
décrire le fonctionnement hydrologique, hydrogéologique et géochimique des
bassins versants sélectionnés et représentant des contextes variés (roches,
sols, végétation, climat, activités humaines, etc.) afin de mieux comprendre les
effets du changement climatique sur l'avenir de la planète.
Par ailleurs, plusieurs travaux de master recherche ont pu être réalisés par
symbiose avec le milieu industriel.

18
2.5 Encadrements-co-encadrements de travaux de recherche
Post Doc
2011- Federico CERVI (Italien) : Geochemistry & hydrochemistry of clay-rich landslides, co-encadrement par Vincent MARC (UMR EMMAH, Avignon), et Jérôme GAILLARDET (IPGP). Contrat d’un an (2010-2011). Publication soumise à J. of Hydrology + une communication l’EGU
Thèses
2002-2005- Arnaud CHARMOILLE, Traçage hydrochimique des interactions hydrauliques et mécaniques entre les volumes perméables et peu perméables au sein des aquifères fracturés carbonatés. Actuellement Ingénieur à l’INERIS. Directeurs
de thèse Y. GUGLIELMI et J. MUDRY Co-encadrement : C.BERTRAND
2003-2006 Stéphane BINET, L'hydrochimie, marqueur de l'évolution à long terme des versants montagneux fracturés vers les grands mouvements de terrain. Actuellement Maître de Conférences à l’Université d’Orléans. Directeurs de
thèse Y. GUGLIEMI et J. MUDRY Co-encadrement : C.BERTRAND
2010-2014 Aurélien VALLET (en cours de redaction, soutenance prévue premier semestre 2014), Mouvements de fluides et processus de déstabilisation des versants alpins Approches hydrogéochimiques par le traçage naturel Directeur de thèse J. MUDRY Co-direction : C.BERTRAND
Master/DEA
Encadrement de stages de DEA
Au Laboratoire de Détection et de Géophysique du CEA/DAM à Bruyères-le-
Châtel.
1994- Hélène SERRA : "Percolation de fluides hydrothermaux en milieu poreux et fissuré"
A l’Université de Franche Comté
1998 Dorothée LEFORT “Suivi de l’ennoyage des lacs miniers HBCM, Unité d’exploitation
de Blanzy-Montceau-les–Mines ”
1999 Magalie HOCHART : Hydrogéologie d’un site minier en cours de réaménagement.
Caractérisation des différents réservoirs et leurs échanges. Co encadrement Y. Guglielmi
2000 Jean-Marie FERREUX : Relargage de l'arsenic par lixiviation de terrains houillers après combustion. Co encadrement M. Steinmann et C. Dubois
2001 Arnaud CHARMOILLE : Modélisations thermocinétiques avec écoulement des interactions eau-roche dans le versant de la Clapière. Co encadrement Y. Guglielmi
2002 Emilien BELLE : Evolution du fonctionnement physico-chimique et biologique de lagunes d’épuration, traitant les lixiviats de décharges d’ordures ménagères.
Co encadrement J. Mudry
19
2004 Emilie THIEBAUD : Flux d’infiltration dans la zone non saturée du karst (Laboratoire Souterrain à Bas Bruit-Rustrel) Co encadrement J. Mudry
Encadrement de stages de Master
2005 David BAILLY, Apport de la simulation hydrodynamique 3D à la compréhension des écoulements dans les massifs carbonatés fracturés. Application à l'entretient d'ouvrages hydro-électriques, le barrage de Vouglans, Jura, 39. a poursuivi par une thèse à Toulouse. Co encadrement Y. Guglielmi
2008 Kévin ETIEVANT, L’hydrogéochimie, marqueur des flux d’infiltration dans un
versant instable. Sites des Rochers de Valabres (Mercantour) et des Ruines de Séchilienne (Belledonne). Co encadrement J.Mudry
2009 Louise BEURAUD (M1) : Caractérisation des néoformations dans des roches carbonatées issues du barrage de Vouglans, et leurs implications potentielles dans les écoulements.
2010 Nicolas FORAZ : Caractérisation de l’infiltration dans un petit système karstique.
Site expérimental de Fertans (Plateau d’Amancey, 25) Co encadrement JB Charlier et J. Mudry
2013 Cécile BAUDEMENT : Quantification de la dégradation mécanique et chimique d’un versant instable : approche géologique, hydromécanique et
hydrochimique (Versant instable de Séchilienne, Isère, 38). Co encadrement Y. Guglielmi et F Cappa
2.6 Réseaux de recherche
· Collaborations nationales
Université de Provence : Yves Guglielmi,
IPG : Jean-Philippe Malet (IPG Starsbourg), Jérôme Gaillardet (IPG Paris)
Géoazur, Sophia Antipolis : Frédéric Cappa, Thomas Lebourg
LGIT, Grenoble: Jean-Robert Grasso
Université Avignon : Vincent Marc, Christophe Emblanch
Université Orléans : Stéphane Binet
BRGM, Montpellier : Jean-Baptiste Charlier
CETE, Lyon : Marie-Aurélie Chanut
· Collaborations internationales
University of Technology, Delft (The Netherlands) : Thom Bogaard ,
EPF Lausanne : Cornelia Brönnimann
Université de Malaga (Espagne) Bartolomé Andréo
20
2.7 Echanges internationaux
Accueil d’étudiants de l’université de Malaga : Maria Perez Rodriguez (master) ;
Pablo Jimenez Juberias, Matias Mudarra Martinez, Juan-Antonio Barbera (doctorants)
2.8 Diffusions des résultats de la recherche en direction du public
2009 : La nuit des chercheurs, Besançon
2010-2011-2012-2013 -2014: 1 classe / 1 chercheur, lycées et collèges
2011 : Fête de la Science : bar à eau à Nans sous Ste Anne (25)
2012 : Conférence à la Société d’Histoire Naturelle du Doubs
2013 : Animation autour de l’eau Fougerolles (70)
2014 : Emissions radiophoniques, France Bleu Besançon dans le cadre des « 2 heures du temps à Besançon », Radio-Campus dans le cadre de « l'actualité universitaire et les laboratoires »
3 LISTE DES TRAVAUX
3.1 O - Ouvrages individuels et collectifs :
O1- CHARLIER J.B., MUDRY J., BERTRAND C. & FORAZ N. (2010) Use of dissolved organic carbon to characterize infiltration in a small karst system in the French Jura mountains (Fertans), Advances in research in karst media: 151-156, Springer.
O2- MARC V., DEBIECHE T.-H., GAREL E., de MONTETY V., CERVI F., CRAS A., COGNARD-PLANCQ A.-L., EMBLANCH C., BERTRAND C., RUY S., BOGAARD T.A., MALET J.-P. & KLOTZ S. (2011) Comportement hydrologique et hydro-géochimique des versants marneux de Terres Noires. Les cahiers de Seolane, 1, p. 43-46. Ed. SEOLANE, Barcelonnette, 2011 ISBN 978-2-9540080-0-4
O3- MUDRY J., BERTRAND C. & ZWAHLEN F. (2013) Introductory Editorial Besancon—
karst aquifers topical issue Besançon- Environmental Earth Sciences DOI 10.1007/s12665-013-2871-4
O4- BERTRAND C., GUGLIELMI Y., DENIMAL S. & MUDRY J (2015) In Situ Study of hydrochemical response of a fractured-layered carbonate regional aquifer: Comparative analyses of natural infiltration and artificial leakage in a large dam lake (Vouglans, Jura, France). B. Andreo et al. (eds.), Hydrogeological and Environmental Investigations, in Karst Systems, Environmental Earth Sciences 1, DOI 10.1007/978-3-642-17435-3_21
O5- BERTRAND C, VALLET A. & MUDRY J (2015) Hydrochemical approach of mechanical degradation of the Séchilienne unstable slope. G Lollino et al. (Eds). Engineering Geology for Society and Territory, Vol 2, DOI: 10.1007/978-3-319-09057-3_383, © Springer International Publishing Switzerland 2015
O6- VALLET A., VARRON D., BERTRAND C & MUDRY J (2015) Hydrogeological threshold using support vector machines and effective rainfall applied to a deep seated
21
unstable slope (Séchilienne, French Alps). G Lollino et al. (Eds). Engineering Geology for Society and Territory, Vol 2, DOI: 10.1007/978-3-319-09057-3_384, © Springer International Publishing Switzerland 2015
3.2 A- Publications dans des revues scientifiques à comité de lecture :
A1- BERTRAND C., FRITZ B. & SUREAU J.F. (1994) Hydrothermal experiments and thermo-kinetic modelling of water-sandstone interactions. Chem. Geol. 116, p. 189-202.
A2- GUGLIELMI Y., BERTRAND C., COMPAGNON F., FOLLACI J.P. & MUDRY J. (2000) Acquisition of water chemistry in a mobile fissured basement massif : its role in the hydrogeological knowledge of the La Clapière landslide (Mercantour massif, southern Alps, France). J. of Hydrology, 229, 138-148.
A3- GUGLIELMI Y., VENGEON J.M., BERTRAND C., MUDRY J., FOLLACI J.P. & GIRAUD A. (2001) Hydrogeochemistry : an investigation tool to evaluate infiltration into large moving rock masses : case study of La Clapière and Séchilienne alpine landslides. Bull. Eng. Geol. Env., 63:311-324.
A4- CAPPA F., GUGLIELMI Y., MERRIEN-SOUKATCHOFF V., MUDRY J., BERTRAND C. & CHARMOILLE A (2004) Hydromechanical modeling of a large moving rock slope inferred from slope levelling coupled to spring long-term hydromechanical monitoring: example of the La Clapière landslide (Southern Alps, France). J. of
Hydrology, 291, 67-90
A5- CHARMOILLE A., FABBRI O., MUDRY J., GUGLIELMI Y. & BERTRAND C. (2005) Post-seismic permeability change in a shallow fractured aquifer following a ML 5.1 earthquake (Fourbanne karst aquifer, Jura outermost thrust unit, eastern France). Geophysical Research Letters, 32 (18): 1-5.
A6-DENIMAL S., BERTRAND C., MUDRY J., PAQUETTE Y., HOCHARD M. & STEINMANN M. (2005) Evolution of mine pit lakes aqueous geochemistry. Blanzy-Montceau-les-Mines coal basin (Massif central, France). Origin of sulfate contents; effects of stratification on water quality. Applied Geochemistry 20: 825-839,
A7- BINET S., MUDRY J., BERTRAND C., GUGLIELMI Y. & COVA R. (2006) Estimation of quantitative descriptors of mediterranean karst behavior. multiparametric study and local validation on the Siou-Blanc massif (Toulon, France). Hydrogeology Journal 14 (7) : 1107-1121
A8- BINET S., MUDRY J., SCAVIA C., CAMPUS S., BERTRAND C. & GUGLIELMI Y. (2007) In situ characterization of flows in a fractured unstable slope. Geomorphology 86 (1-2):193-203
A9- De MONTETY V., MARC V., EMBLANCH C., MALET J.-P., BERTRAND C., MAQUAIRE O. & BOGAARD T. (2007) Identifying origin of groundwater and flow processes in complex landslides affecting black marls in southern French Alps: insights from an hydrochemistry survey. Earth Surface Processes and Landforms. Wiley InterScience (www.interscience.wiley.com) DOI: 10.1002/esp.1370

22
A10- BINET S., JOMARD H., LEBOURG T., GUGLIELMI Y., TRIC E., BERTRAND C. & MUDRY J. (2007) Experimental analysis of groundwater flow through a landslide slip surface using natural and artificial water chemical tracers., Hydrol. Process. 21, 3463–3472
A11- CHARMOILLE A.; BINET S., BERTRAND C.; GUGLIELMI Y. & MUDRY J. (2009) Hydraulic interactions between fractures and bedding planes in a carbonate aquifer studied by means of experimentally induced water-table fluctuations (Coaraze experimental site, southeastern France), Hydrogeology Journal,17: 1607-1616, DOI: 10.1007/s10040-009-0470-y
A12- BINET S., SPADINI L., BERTRAND C., GUGLIELMI Y., MUDRY J. & SCAVIA C. (2009) Variability of groundwater sulfate concentration in fractured rock slope: a tool to identify active unstable areas. Hydrol. Earth Syst. Sci., 13, 2315-2327
A13- CHARLIER J.B., BERTRAND C., BINET S., MUDRY J. & BOUILLIER N. (2010) Use of continuous measurements of dissolved organic matter fluorescence in groundwater to characterize fast infiltration through an unstable fractured hillslope (Valabres rockfall, French Alps), Hydrogeology Journal: Volume 18, Issue 8, 1963-1969, DOI: 10.1007/s10040-010-0670-5
A14- CHARLIER J.B., BERTRAND C. & MUDRY J. (2012) Conceptual hydrogeological model of flow and transport of dissolved organic carbon in a small Jura karst system, J. of hydrology, 460-461, 52-64, http://dx.doi.org/10.1016/j.jhydrol.2012.06.043
A15- BRUNA P.O., GUGLIELMI Y., LAMARCHE J., FLOQUET M., FOURNIER F., SIZUN J.P., GALLOIS A., MARIE L., BERTRAND C. & HOLLENDER F. (2013). Porosity Gain and Loss in Unconventional Reservoirs: example of rock typing in Lower Cretaceous hemipelagic limestones, SE France (Provence) Marine and Petroleum Geology, Vol. 48, 186–205
A16- VALLET A., BERTRAND C., FABBRI O. & MUDRY J. An efficient workflow to zccurztely compute groundwater recharge for the study of rainfall triggered seep-seated landslides.Application to the Séchilienne unstable slope (Western Alps). Accepted to publication in HESS (Hydrol Earth Syst Sci Discuss 11:6343–6403. doi: 10.5194/hessd-11-6343-2014).
A17- VINCENT M., BERTRAND C., CERVI F., MALLET, CARRY N. & SIMLER R. Conceptual groundwater flow systems for landslides in clayey slopes from hydrochemistry and geochemical modelling. Soumis à J. of Hydrology
A18- VALLET A., BERTRAND C., MUDRY J. BOGAARD T., BAUDEMENT C., REGENT B. Groundwater conceptual model of large landslide: contribution of time-related environmental tracing combined with tracer tests (Séchilienne, western Alps). Hydrogeology Journal, en révision
A19- VALLET A., CHARLIER J.B., FABBRI O., BERTRAND C., CARRY N. & MUDRY J. Functioning and precipitation-displacement modelling on landslides subject to creep deformation Soumis à Landslide
A20- VALLET A., VARRON D., BERTRAND C., MUDRY J. & FABBRI O. Determination of a multi-dimensional statistical rainfall threshold for continuously moving deep-

23
landslides based on groundwater recharge and support vector machines. Soumis à J. of Hydrology
3.3 B- Publications nationales avec comité de lecture :
B1- BERTRAND C., FRITZ B. & SUREAU J.F. (1993) Etude expérimentale et modélisation cinétique de l'altération hydrothermale d'un grès de Fontainebleau. C.R. Acad.
Sci. Paris, II, 317, 9, p. 1193-1198.
B2- BERTRAND C., FRITZ B., REMOND G. & SUREAU J.F. (1993) Application de la microrugosimétrie de surface à l'étude de l'altération hydrothermale d'un grès. C.R. Acad. Sci. Paris, II, 317, 11, p. 1457-1460.
B3- BINET S., GUGLIELMI Y., BERTRAND C. & MUDRY J. (2007) Unstable rock slope hydrogeology: insights from the large-scale study of western Argentera-Mercantour hillslopes (South-East France) Bull. Soc. géol. Fr., 178, 2, 159-168
B4- BOGAARD T., GUGLIELMI Y., MARC V., EMBLANCH C., BERTRAND C. & MUDRY M. (2007) Hydrogeochemistry in landslide research: a review. Bull. Soc. géol. Fr., 178, 2, 113-126
3.4 CI : Conférences internationales à comité de lecture et actes publiés
CI1- MAWHIN B., SAUTER D. & BERTRAND C. (1987) Analyse de texture par traitement d'images : application aux linéations minérales. Proc. 4th Meeting of the European Union of Geosciences, Strasbourg, avril 1987, Terra Cognita, 7, 2-3, p. 393.
CI2- BERTRAND C., MADE B., DEL NERO M. & FRITZ B. (1991) Hydrothermal experiments and modelling of water-sandstone interactions. Proc. 6th Meeting of the European Union of Geosciences, Strasbourg, mars 1991, Terra Abstr., 3, 1, p. 467.
CI3- BERTRAND C., FRITZ B. & SUREAU J.F. (1993) Hydrothermal experiments and thermo-kinetic modelling of water-sandstone interactions. Proc. 7th Meeting of the European Union of Geosciences, Strasbourg, avril 1993, Terra Abstr., 1, 5, p. 336.
CI4- BERTRAND C., CATTIN R. & GUY C. (1995) Estimation of reactive surface during basalt alteration: Physical and chemical approach. 8th Meeting of the European Union of Geosciences, Strasbourg, avril 1995, Terra Abstr., 1, 7, p. 188.
CI5- SERRA H., SCHOTT J., GUY C. & BERTRAND C. (1995) Experimental study of the percolation of fluid through a volcanic fissured rock. Example of a hawaiite from Mururoa atoll (French Polynesia). 8th Meeting of the European Union of Geosciences, Strasbourg, avril 1995, Terra Abstr., 1, 7, p. 192.
CI6- FERREUX J.M, STEINMANN M., BERTRAND C., DUBOIS C. & PAQUETTE Y. (2000) Mobilisation of arsenic in mine tailings subjected to spontaneous combustion. 10th V.M. Goldschmidt Conference, September 3rd–8th, 2000 Oxford, UK. Journal of Conference Abstracts Vol. 5(2), 398

24
CI7- BERTRAND C. & GUGLIELMI Y. (2001) Modeling the thermodynamical acquisition of groundwater chemistry into metamorphic mountainous slopes : validation of the model with field values. European Union of Geosciences XI, April 2001, Strasbourg France, p.510.
CI8- DEBIECHE T.H., MUDRY J., GUGLIELMI Y & BERTRAND C. (2001) Décomposition de l’origine du débit de pompage dans un milieu karstique par le principe de
conservation des flux. Approche sur site expérimental (Mouans-Sartoux, 06). 7ième Conférence on Limestone Hydrology and Fissured Media, Besançon, p.117-120.
CI9- HOCHART M., BERTRAND C. DUBAR M., GUGLIELMI Y. & MERRIEN-SOUKATCHOFF V. (2002) Hydrodynamism determination and water ressource management of an alluvial aquifer modified by human activities : example of Nice airport area. Coastal Environment, Rhodes 24-26 mars 2002, abstract 43
CI10- MUDRY J, CHARMOILLE A., ROBBE N., BERTRAND C., BATIOT C., EMBLANCH C. & METTETAL J.P. (2002) Use of hydrochemistry to display a present recharge of confined karst aquifers. Case study of the Doubs Valley, Jura Mountains, Eastern France. In Carrasco F., Duran J.J. and Andreo B. (Eds.) Karst and Environment, 123-129
CI11- CAPPA F., GUGLIELMI Y., MERRIEN-SOUKATCHOFF V., MUDRY J., BERTRAND C. & CHARMOILLE A (2003) Chemical spring water measurements coupled with 2d u.d.e.c hydromechanical modelling as an investigation methodology of water infiltration influence on large moving rock mass stability : application to the "la Clapière" landslide (France, 06)." EGS - AGU - EUG Joint Assembly, Nice, France, April 2003".
CI12- CHARMOILLE A, BERTRAND C., GUGLIELMI Y & CAPPA F. (2003) Relation between hydromechanical deformation and water chemistry evolution in a fractured media, implication for in situ flow law spatialisation, Euro-conferences on Rock Physics and Geomechanics, Kijkduin (The Netherlands), 7-11 September 2003
CI13- BINET S., GUGLIELMI Y., CAPPA F., MUDRY J. & BERTRAND C. (2004) Long –term evolution of aquifers in mountainous rocks slopes toward a large moving rock mass: influence of the coupling between hydrogeology and deformation. EGS - AGU - EUG Joint Assembly Geophysical Research Abstracts, Vol. 6, 06865
CI14- BINET S., BERTRAND C., MUDRY J., GUGLIELMI Y., SCAVIA C. & TROISI C. (2005) Water sulfate concentration variability in fractured rock slopes: An instantaneous marker of deformation. American Geosciences Union – San Francisco – USA (Poster, résumé FM05: H41F 0475) Outstanding student awards
CI15- EMBLANCH C., JIMÉNEZ P., CHARMOILLE A., ANDREO B.., BATIOT C., PUIG J.M., LASTENNET R., MUDRY J., VADILLO I., BERTRAND C., CARRASCO F. & LIÑAN C. (2005) Tracing two different types of infiltration through karst hydrosystems by combined use of Nitrates and Total Organic Carbon. Application to three different systems (Millet, SE France; Fourbanne, Jura; Cuevas del Moro, S Spain). Karst 2005, Water Resources and Environmental Problems in karst.

25
International Conference and Field Seminar, Belgrade and Kotor, September 14-19, 2005.
CI16- JIMÉNEZ P., ANDREO B., EMBLANCH C., CARRASCO F., MUDRY J., BATIOT C., VADILLO I., PUIG J.M., LASTENNET R., BERTRAND C. & LIÑÁN C. (2005) Use of δ13CCMTD and total organic carbon (TOC) to distinguish the influence of the
unsaturated and the saturated zones in two carbonate aquifers. In: Z. Stevanović y P. Milanović (eds), Water Resources and Environmental Problems
in Karst”, 431-436. Proceedings of the international conference and field seminars “Water Resources and Environmental Problems in Karst”, Belgrade.
CI17- CHARMOILLE A, BERTRAND C. & MUDRY J. (2006) Etude détaillée, à l’échelle
métrique, du comportement hydraulique d’un aquifère fracturé carbonaté à
double perméabilité à partir de mesures hydrochimiques in-situ (site expérimental de Coaraze, France) AquainMed-06. Hydrogeologia y aguas subterraneas 18: 37-47. Duran J.J., Andreo B. & Carrasco F., editors, IGME Madrid,
CI18- CHARMOILLE A, MUDRY J., FABBRI O., GUGLIELMI Y & .BERTRAND C. (2006) Study of Hydraulic and Mechanical Interactions by Hydrogeochemical Tracing Between Low-Permeable and Permeable Volumes in Fractured Aquifer AGU, San Francisco, H42C-06
CI19- CHARMOILLE A., FABBRI O., MUDRY J., BERTRAND C. & HESSENAUER M. (2006) Apport de l’hydrochimie à l’étude des perturbations hydrauliques liées au cycle
sismique. Exemple de deux aquifères karstiques Jurassiens. Proc. 8th Conference on Limestone Hydrogeology, Neuchâtel (Switzerland), p. 63-66. Presses universitaires de Franche-Comté.
CI20- EMBLANCH C., CHARMOILLE A., JIMENEZ P., ANDREO B., MUDRY J., BERTRAND C., BATIOT-GUILHE C. & LASTENNET R. (2006) Variabilité du type et de la qualité de l’information issue du traçage naturel en fonction des caractéristiques des
systèmes étudiés. Quelques exemples français et espagnols. Proc. 8th Conference on Limestone Hydrogeology, Neuchâtel (Switzerland), p. 101-104. Presses universitaires de Franche-Comté.
CI21- BERTRAND C., MARC V. & MALET J-P (2010) New insight into unstable hillslopes hydrology from hydrogeochemical modelling. HS13.13/NH3.16, EGU Vienne
CI22- CERVI F., MARC V., BERTRAND C. & MALET J.-P. (2011) Hydrogeochemical modelling of clay-rich landslides and anomalies in groundwater compositions: evidences from case studies in the northern Apennines of Italy and South Alps of French. Geophysical Research Abstracts, Vol. 13, EGU2011-4097, Vienna
CI23- CHARLIER J.-B., MUDRY J. & BERTRAND C. (2010) Use of dissolved organic carbon to characterize infiltration in a small karst system in the French Jura mountains (Fertans), International Symposium on Karst (ISKA), Malaga
CI24- CHARLIER J.-B., MUDRY J. & BERTRAND C. (2011) Infiltration processes in karst characterized using an event-based rainfall-discharge model coupled with a mixing model of DOC transport. Proc. H2Karst, 9th Conference on Limestone Hydrogeology, Besançon (France) 1-4 sep. 2011, p. 91-94.
26
CI25- VALLET A., CHARLIER J.-B., CHANUT M.A., BERTRAND C. & MUDRY J. (2013) Impact of rainfall and snowmelt on unstable slope destabilisation using wavelet analysis (Séchilienne, French Alps) Abstract EGU, Wien (Austria) 15, 2825.
3.5 CN : Conférences nationales à comité de lecture et actes publiés :
CN1- BERTRAND C., REMOND G. & ROQUES-CARMES C. (1991) Application de la microrugosimétrie de surface à l'altération hydrothermale d'un grès. SGF-ISS Journée du 8 février 1991, "Objets géologiques : description quantitative et modélisation, du compteur de points à l'analyseur d'image", Paris, Soc. géol.
Fr., p. 9-11.
CN2- BERTRAND C. (1994) Evolution physico-chimique d'échantillons de grès induite par la percolation d'un fluide hydrothermal. 15ème Réunion Sci. Terre, Nancy, Soc.
géol. Fr., p. 49.
CN3- BERTRAND C., GUGLIELMI Y. & MUDRY J. (2000) Rôle des interfaces superficiels dans l'acquisition de la chimie des eaux d'infiltration dans le socle en zone montagneuse : mesure et modélisation hydrogéochimique des interfaces. Actes du colloque PNRH, 16-17 mai 2000, pp 231-235.
CN4- CHARMOILLE A., BERTRAND C., GUGLIELMI Y. & CAPPA F (2002) Modélisation hydrodynamique 3D des écoulements souterrains dans un versant montagneux instable couplée à une étude numérique 2D de l’altération
hydrogéochimique : application au versant de la Clapière (Alpes-Maritimes, 06). Réunion des Sciences de la Terre, Nantes 2002.
CN5- HOCHART M., BERTRAND C. & GUGLIELMI Y. (2002) Apports de l’hydrochimie à
l’étude 3D du fonctionnement hydrodynamique d’un aquifère deltaïque côtier
suite aux aménagements anthropiques : exemple de l’aéroport de Nice.
Réunion des Sciences de la Terre, Nantes 2002.
CN6- BELLE E., MUDRY J., ALEYA L., GRISEY H., BERTRAND C. & DENIMAL S. (2004) Evaluation de l'infiltration et de l'impact des lixiviats de la décharge d'ordures ménagères d'Etueffont dans le substratum (Territoire de Belfort 90). Réunion des Sciences de la Terre Strasbourg
CN7- CHARMOILLE A., GUGLIELMI Y., MUDRY J., FABBRI O., GAFFET S. & BERTRAND C. (2004) Perturbation de perméabilité dans un aquifère fissuré superficiel soumis à un séisme : Exemple de l’aquifère karstique de Fourbanne (Doubs,
France). Réunion des Sciences de la Terre Strasbourg.
CN8- DENIMAL S., BERTRAND C., MUDRY J., PAQUETTE Y. & STEINMANN M. (2004) Mine pit lakes of Blanzy Montceau-les-Mines: evolution of aqueous geochemistry, sources of contamination, effects of stratification on water quality. Réunion des Sciences de la Terre Strasbourg
CN9- BINET S., GUGLIELMI Y., MUDRY J. & BERTRAND C. (2004) Evolution à long terme des versants montagneux vers de grands mouvements de terrain: interactions entre l'hydrogéologie et la déformation. Réunion des Sciences de la Terre Strasbourg.

27
CN10- BINET S., JOMARD H., LEBOURG T., GUGLIELMI Y., BERTRAND C., MUDRY J., CHARMOILLE A. & QUENARDEL J.-M. (2004) Apport des méthodes électriques 3D à l’étude du comportement d’un pied de versant : interactions entre mouvement superficiel et profond (La Clapière, Alpes maritimes). Réunion des Sciences de la Terre Strasbourg.
CN11- BAUDEMENT C., BERTRAND C., GUGLIELMI Y., VISEUR S., VALLET A. & CAPPA F. (2013) Quantification de la dégradation mécanique et chimique d’un versant
instable : approche géologique, hydromécanique et hydrochimique. Journées des Aléas Gravitaires, Grenoble .
CN12- BERTRAND C., MARC V. VALLET A., MUDRY J. & SCHMITT A.D. (2013) Apport de l’hydrogéochimie pour la caractérisation des mouvements
gravitaires. Journées « Aléas Gravitaires », Grenoble
CN13- BERTRAND C., VALLET A. & MUDRY J. (2013) Approche hydrochimique de la dégradation mécanique du versant instable de Séchilienne. Journées « Aléas Gravitaires », Grenoble.
CN14- MARC V., CERVI F., BERTRAND C. & MALET J.P. (2013) Caractérisation du système d’écoulement à grande échelle des eaux souterraines dans des versants
instable de marnes par observation et modélisation hydrochimique. Journées « Aléas Gravitaires », Grenoble.
CN15- VALLET A., BERTRAND C. & MUDRY J. (2013) Détermination d’un seuil
hydrogéologique pour la déstabilisation profonde d’un versant (Séchilienne,
Alpes) à partir des précipitations efficaces et des machines à vecteurs de support (SVM). Journées «Aléas Gravitaires », Grenoble.
CN16- BAUDEMENT C., GUGLIELMI Y., BERTRAND C. VISEUR S., VALLET A. & CAPPA F. (2014) Fluids hydrochemical signature of a slow-moving giant landslide rupture
Unstable slope of Séchilienne, France. Réunion Sciences de la Terre, Pau
CN-17 DENIMAL S., STEINMANN M., BERTRAND C. & MUDRY J. (2014) Etude des processus d’écoulement dans un petit système karstique Jurassien : apport du
traçage naturel (éléments majeurs, traces et carbone organique) dans un suivi de crue (Fertans, France). Réunion Sciences de la Terre, Pau
3.6 Publications didactiques et non référencées
R : Rapports scientifiques
R1- BERTRAND C., REMOND G. & ROQUES-CARMES C. (1989) Méthode physique d'analyse de l'altération hydrothermale d'une roche poreuse. 3ème Réunion de Chimie du solide et des Matériaux, Orléans, 23 novembre 1989
R2- BERTRAND C. (1990) Expérimentation et modélisation de l'altération hydrothermale d'une roche poreuse. Rapport interne BRGM, R31073, GRF SGN 90, 45 p

28
R3- BERTRAND C., CATTIN R. et GUY C. (1996) - Détermination de la surface réactive d’une roche dans son milieu naturel : approche chimique et application au massif basaltique de Mururoa. Rapport interne CEA, 40 p.
R4- BERTRAND C. et GUGLIELMI Y. (1999) – Interprétation des débits de fuites dans les appuis rocheux du barrage de Vieux-Pré (Vosges) par des mesures hydrogéochimiques des eaux. Phase 1. Rapport interne Université de Besançon-EDF, 34p.
R5- GUGLIELMI Y. 1 BERTRAND C. (2001) Suivi hydrogéochimique de la vulnérabilité du milieu naturel (cours d’eau et eaux souterraines) vis à vis des sources de pollution périphériques constituées en particulier par la décharge du Jas de Madame. 23p.
R6- GUGLIELMI Y. & BERTRAND C. (2003) Etude hydrogéologique et hydrogéochimique des circulations d’eau au niveau du barrage de Vouglans. Rapport interne
Université de Besançon-EDF.,
R7- BERTRAND C, GUGLIELMI Y. & MUDRY J. (2003) Interprétation des débits de fuite dans les appuis rocheux du barrage de Vieux-Pré par des mesures hydrogéochimique des eaux . °Phase 2. Rapport interne Université de Besançon-EDF.
R8- DENIMAL S., BERTRAND C. & MUDRY J. (2003). Evolution de la qualité des eaux de 6 lacs miniers situés sur le gisement de Blanzy – Montceau-les-Mines / Synthèse.
R9- BERTRAND C. (2008) Etude hydrogéologique et hydrogéochimique des circulations d’eau au niveau du barrage de Crescent. Détermination de l’origine de la fuite
mise en évidence lors des tournées d’inspection faites par le groupement EDF
de Bois de Cure. Rapport interne, Université de Franche Comté-EDF
R10- BERTRAND C. (2008) Synthèse des données hydrochimiques acquises en 2002-2004 sur les sites de Vouglans (Jura), Castillon et Sainte Croix (Verdon). Rapport interne, Université de Franche Comté-EDF
R11- BERTRAND C. (2009) Rapport final : synthèse des données hydrochimiques acquises en 2002-2004 sur les sites de Vouglans (Jura), Castillon et Sainte Croix (Verdon). Rapport interne, Université de Franche Comté-EDF
R12- BERTRAND C. & MUDRY (2013) Le karst franc-Comtois. Bull. Soc. Hist. Nat. Doubs, 93, 73-79
C : Conférences invitées et séminaires
S1- BERTRAND C., SUREAU J.F. & FRITZ B. (1992) Etude expérimentale et modélisation thermodynamique et cinétique de l'altération hydrothermale d'un grès. Soc. fr. Cristallogr. Minéral., Journées d'Orléans, 7-9 septembre 1992.
S2- BERTRAND C. (2002) Relation entre hydrogéologie, géochimie et déformation : données expérimentales et modélisations. Séminaire organisé par le CEA : De la déformation d’un massif aux précurseurs de séismes. Arêches, 30 septembre
au 3 octobre 2002.

29
S3- BERTRAND C., VALLET A. & MUDRY J. (2011) Hydrogéochimie de versant : Quelles mesures pour quels impacts scientifiques : un point sur ce qui est possible de mesurer en hydrogéochimie appliquée aux instabilités de versant. ISTERRE, Grenoble
S4- BERTRAND C. & MUDRY J. (2012) Hydrogéochimie, Ecoulement, Instabilités de Versant. Journées scientifiques de l’OSU-THETA
S4- MUDRY J & BERTRAND C. (2012) Le karst en Franche-Comté, un milieu original, une grande ressource en eau parfois difficile à protéger. Société d’Histoire
Naturelle du Doubs
S5- BERTRAND C. (2013) Hydrogéochimie pour la caractérisation des mouvements gravitaires. Séminaire au CETE de Lyon, décembre 2014

30
31
Fonctionnement des aquifères hétérogènes : Approche couplée de la mesure in situ et de la
modélisation hydrogéochimique pour la
compréhension des transferts d’eau souterraine
dans les massifs fissurés
Outils : traçage naturel, hydrogéochimie, modélisation des interactions eau-roche
4 PREAMBULE
La connaissance des écoulements dans les milieux poreux ou fissurés est
fondamentale car ils conditionnent la qualité et la réserve d’eau présente dans ces
réservoirs. Dans les milieux géologiques souterrains, les flux ne sont en général ni
localisés dans une structure particulière ou distribués dans un réservoir homogène, mais
plutôt ramifiés à toutes les échelles. Cette complexité pose à la fois le problème de la
mesure et de sa représentativité. Les écoulements dans le milieu rocheux se produisent
à la fois à travers les pores présents dans la matrice rocheuse et le long des fractures
découpant la roche. On peut définir l’emmagasinement du milieu rocheux et la
perméabilité respectivement par rapport à la matrice poreuse ou microporeuse et par
rapport au réseau de fractures.
Lorsque la matrice est très peu perméable, les écoulements se produisent
principalement dans les fractures (c’est le cas de certains calcaires ou granites
fracturés). Lorsque la roche n’est pas fracturée ou que les fractures sont mal
connectées, les écoulements se produisent à travers la matrice poreuse. Dans les cas
intermédiaires, les deux types d’écoulement doivent être pris en compte pour que le
comportement hydraulique du milieu rocheux soit bien représenté.
Les hydrosystèmes en milieu poreux, ou aquifères à porosité d’interstice sont des
milieux perméables lorsque les pores sont bien interconnectés. En général, ces milieux
sont homogènes (à petite échelle) et isotropes, et les écoulements sont continus. Les
aquifères les plus productifs se développent dans les roches meubles non consolidées
(alluvions fluviatiles et fluvio-glaciaires), et sont en général très productifs. Les roches
32
consolidées, telles les roches gréseuses constituent également des aquifères
d’interstices, ou bien souvent les fortes perméabilités sont dues à la fracturation.
Les hydrosystèmes de socle ou carbonatés correspondent à des milieux
discontinus anisotropes avec de forts contrastes de perméabilités. Les réservoirs
karstiques présentent un cas extrême de double perméabilité, faible et homogène dans
les blocs épargnés par la karstification, très grande et fortement anisotrope dans les
drains karstiques. Dans le karst et dans les aquifères fissurés plus généralement, les
drains expliquent quasiment la totalité des écoulements alors qu'ils représentent moins
de 10% de la porosité totale du réservoir. A contrario, le stockage d'eau s'effectue dans
les blocs qui représentent plus de 90% de la porosité totale du réservoir.
Il est notoire que la perméabilité des zones carbonatées est essentiellement
acquise par dissolution. La perméabilité des zones de socle est plutôt acquise par
altération météorique à long terme, qui peut être associée avec une action mécanique
en zone montagneuse à fort relief. C’est le cas des milieux instables ou l’eau joue deux
rôles importants, le premier étant un processus hydrogéologique qui est un facteur
aggravant de l’instabilité, le deuxième étant un facteur géochimique qui altère le massif,
le rendant moins cohésif. Ces deux facteurs interagissent dans le temps et modifient la
perméabilité et donc la circulation de l’eau au sein de la roche.
Contrairement aux aquifères granulaires, typiques des roches gréseuses, dans
lesquels la porosité est très bien répartie et donc ou les équations distribuées de
l'hydrologie classique s'appliquent, la porosité des aquifères fissurés est extrêmement
localisée. Dans ces aquifères complexes, les hétérogénéités qui guident les transferts
d’eau rendent les modèles hydrogéologiques classiques peu pertinents. Dans ces
milieux, les mesures hydrogéologiques ponctuelles (piézométrie, transmissivité) n’ont
qu’une représentativité locale, il importait donc de mettre au point une méthodologie
capable de fournir une information à la fois sur les flux d’eau (lieu et montant de la
recharge, types et flux d’écoulement, stockage, temps de séjour) et sur l’acquisition de
la chimie lors de son transit dans l’aquifère (interaction eau-roche lors du transit,
quantification de l’altération).
L’hydrogéochimie, intégrative de toute l’«histoire» de l’eau dans les différents
compartiments couplée à la modélisation géochimique, qui permet de discriminer le
signal chimique en fonction de son parcours dans l’aquifère, s’avère une méthode
adaptée à l’objectif. Il s’agit en fait, dans deux types d’aquifère fissurés, d’améliorer la
connaissance de la genèse du signal chimique, de définir les apports de la connaissance
de ce signal en terme de fonctionnement aussi bien sur le transfert de pression que sur
le transfert de masse et de ses effets
Enjeux sociétaux
Les aquifères fissurés constituent la ressource essentielle en eau dans de
nombreuses régions péri-méditerranéennes. Comme le karst possède en général des
33
ressources en eau et des réserves importantes encore assez peu sollicitées, il est devenu
depuis l’antiquité un milieu à fort intérêt économique, d’autant plus qu’il constitue, dans
certaines régions comme le pourtour méditerranéen, la ressource essentielle sinon
unique. Actuellement, la recherche de nouvelles ressources en eau (eau pour
alimentation, soutien d’étiage, agriculture) conduit à s’intéresser de plus en plus aux
systèmes karstiques, soit pour une surexploitation saisonnière (gestion active), soit en
vue de la mise en place de schémas de protection de la qualité (périmètres de
protection, ouvrages de protection) ou de la quantité (dimensionnement d’ouvrages
pour l’évacuation en zone urbanisée). Les aquifères de roches dures constituent la seule
ressource en eau disponible dans beaucoup de régions, en particulier dans les régions
arides à semi-arides. Ces aquifères servent également à alimenter aussi bien des
populations dispersées, des usagers de petites et moyennes villes, voire des banlieues
résidentielles des grandes agglomérations Les ressources en eau souterraine de ces
aquifères sont faibles en termes de débit de soutien par rapport à la production des
puits où il arrive souvent que ceux-ci ne soient plus productifs. Par ailleurs, la
surexploitation de cette ressource en eau, pour l’agriculture, comme c’est le cas en Inde,
conduit d’une part à l’épuisement de celle-ci et d’autre part à la détérioration de sa
qualité. Enfin, la compréhension et l'évaluation des impacts environnementaux de ces
activités humaines sur ces milieux fissurés sont importants afin de trouver un équilibre
entre le développement et la préservation de ces systèmes hydrogéologiques complexes
(Milanovic, 2002, 2004).
Comprendre le fonctionnement et les processus de transport de tels aquifères
permettra une gestion efficace et durable de la ressource en eau.
Par ailleurs, les mouvements de terrain de grande ampleur ont un impact socio-
économique qui peut s’avérer dramatique. Ils sont effectivement une menace majeure
pour la vie humaine, les bâtis, les infrastructures et l'environnement naturel dans la
plupart des régions montagneuses et vallonnées du monde (Petley, 2012). Les
mécanismes contrôlant leur dynamique ou leur déclenchement sont nombreux et
complexes, ce qui entraine une forte incertitude dans la prévision, que ce soit dans le
domaine spatial (volume mis en jeu, localisation) ou temporel (occurrence, dynamique).
« Dans un climat futur dans lequel la moyenne et les extrêmes des précipitations
pourraient augmenter dans certaines régions, le nombre de petits et grands glissements
devraient augmenter en conséquence. » (Beniston et Douglas, 1996).
Le risque « mouvement de terrain » est plus important en France (en termes de
dégâts matériels et humains) que le risque sismique. Par exemple, le site à risque dit des
Ruines de Séchilienne, dans le massif de Belledonne, surplombant la vallée de la
Romanche, à une trentaine de kilomètres au sud-est de Grenoble, présente le triple
intérêt de combiner plusieurs aléas. Il se présente comme un risque en chaîne, associant
à un éboulement, un risque d’inondation en amont et de submersion en aval, puis un
risque industriel généré par la présence d’usines chimique de type Seveso.

34
5 LES AQUIFERES DES MILIEUX FISSURES
5.1 Les milieux fissurés
L’eau souterraine réside principalement dans les pores, les fissures ou dans
certains cas les fractures des roches. C’est également dans ces espaces que l’eau circule
lorsqu’ils communiquent. En hydraulique souterraine, le milieu fissuré s’oppose au
milieu poreux de par son caractère discontinu, par comparaison au caractère continu du
second (Feuga and Vaubourg, 1980). La distinction est toutefois dans certains cas,
relativement floue car si l’on peut assimiler le milieu poreux à un milieu discontinu (taille
des grains non homogènes séparés les uns des autres) le milieu fissuré peut être
également assimilé à un milieu poreux lorsqu’il est suffisamment fracturé pour que la
maille de fracturation soit de l’ordre de grandeur de gros graviers alluvionnaires. Blanc
(1986) redéfinit les deux types de milieu à partir des concepts de Feuga and Vaubourg
(1980) comme :
- milieu poreux (ou continu) : la schématisation adoptée ne permet pas de
distinguer l’écoulement du fluide dans des cheminements bien localisés,
- milieu fissuré (ou discontinu) : la localisation de surface de cheminement sont
bien délimitées et sont immuables. C’est ce que l’on appelle plus communément les
fissures.
Trois grandes familles d’aquifères sont définies dans ce contexte de milieu
fissuré :
- Les aquifères de roches volcaniques : les formations volcaniques se caractérisent
de manière générale par une structure complexe avec des hétérogénéités présentes de
l’échelle cartographique à celle du forage, souvent liées à la mise en place de ces
formations en milieu aérien et dans un contexte géodynamique actif (Lachassagne et al.,
2006). Les formations volcaniques présentent donc une structure complexe liée à des
hétérogénéités à différentes échelles, cartographiques (variabilités spatiale, latérale et
verticale), variabilité lithologique (niveaux perméable/imperméable au sein de la même
formation, ou formations perméables isolées par des paléosols), variabilités des
processus d’altération (météorique ou hydrothermale) qui peuvent inverser la
perméabilité des formations par les produits de l’altération.
Il existe au sein de ces formations une perméabilité de fissures, formée lors du
refroidissement rapide de la lave. Certaines fissures peuvent atteindre une ouverture de
quelques centimètres voire quelques décimètres. Il existe également une perméabilité
d’interstice ou dans certains cas, la porosité peut être grossière avec des vides de taille
centimétrique à décimétrique. Ainsi la porosité des basaltes se situe entre 1 et 12% et
celle de tufs est comprise entre 14 et 40%.
Il existe également une hétérogénéité des propriétés hydrauliques de ces
aquifères liées à leur fracturation. On peut ainsi mesurer des conductivités équivalentes
variant de 10-8 à 10-3 m/s (Banton et Bangoy, 1997) pour des basaltes sains et galets et
35
sables. Charlier et al. (2011) ont également mesuré différentes conductivités
hydrauliques, qui varient en fonction de la lithologie présente sur une ile volcanique
soumise à un climat tropical, des variations de conductivité, de 10-7 m/s (formations de
brèches altérées), 10-6 m/s (nuées ardentes) et enfin de 10-5 m/s (lapilli). La
connaissance des conditions de fonctionnement des aquifères volcaniques s’est
développée essentiellement autour de la gestion et l’exploitation de la ressource en eau.
Le fonctionnement de ces aquifères est très variable d’un type de formation volcanique
à l’autre et d’un contexte à l’autre. Il est surtout connu par des études hydrogéologiques
classiques où les paramètres hydrodynamiques sont mesurés par des tests hydrauliques,
des mesures temporelles des paramètres hydrologiques suivies d’un traitement du
signal (Bourlier et al., 2005) surtout en milieu insulaire (Hahn et al., 1997 ; Charlier et al.,
2008). L’approche hydrogéologique couplée à une approche hydrochimique est plus
récente et permet de tenir compte de toutes les hétérogénéités de ces milieux (Herrera
and Custodio, 2008 ; Charlier et al. 2011). Enfin, le fonctionnement de ces aquifères
intéresse également les gestionnaires du risque, où des suivis géochimiques sont déjà
intégrés dans les dispositifs de surveillance (Federico et al., 2004).
- les aquifères de roches de socle métamorphiques ou plutoniques, plus
communément appelées par la communauté scientifique HRA (Hard Rock Aquifers) dues
aux propriétés mécaniques des roches dures qui les composent (Hard Rock défini par
Michel and Fairbridge, 1992). Ces roches sont à l’affleurement sur de très grandes
surfaces (Afrique du Sud, Amérique du Sud et du Nord, Inde, Australie) dans des régions
tectoniquement stables. En France ces roches sont présentes à l’affleurement dans les
anciens massifs (Armoricain, Vosges, Massif Central, Ardennes) et dans les reliefs
montagneux jeunes (Alpes et Pyrénées). Ce sont des aquifères superficiels (environ 0-
100m bgl) du fait de leur perméabilité plus conséquente en subsurface. Il est maintenant
admis, depuis la fin des années 1990, que l’altération des roches de socle soumises à
une altération météorique ont conduit à la formation, sous la partie meuble des profils,
d’un horizon fissuré stratiforme de 50 à 100m de puissance (Braga et al., 2002). Cho et
al, (2003) et plus récemment, Lachassagne et al. (2011) oppose un modèle de formation
de ces fissures/fractures due à un effet de l’altération plutôt qu’à un effet de la
décompression liée à l’exhumation de ces roches ou à un effet tectonique. La fréquence
des fissures est maximale au sommet du bed rock et décroît régulièrement vers le bas.
Sausse et al. (2001) mettent également en évidence le rôle important de l’altération
météorique dans l’ouverture des microfissures ce qui se traduit par une augmentation
respectivement de 5.2% et 19% de la porosité et de la perméabilité du haut de la
colonne de roche. On retrouve des orientations préférentielles de ces fissures selon la
nature de la roche (Lachassagne et al., 2006). Plusieurs compartiments peuvent ainsi
être distingués et qui vont guider les écoulements du fait de leurs propriétés
hydrauliques différentes. Le substratum rocheux sain dont la porosité primaire est très
faible, dépasse rarement 1% (Banton et Bangoy, 1997). C’est du même ordre de
grandeur que la porosité que j’ai mesuré dans des micaschistes non altérés (non publié).

36
De même, la conductivité hydraulique de cet horizon est très faible, variant de 10-11 à 10-
13 m/s. Un horizon fissuré se situe entre cet horizon sain et les altérites. Dans les
granites, les fissures sont nombreuses et subhorizontales dans les premiers mètres sous
les altérites (10 par mètre en moyenne). Par contre, seules quelques fissures présentent
des conductivités hydrauliques de l’ordre de 10-5 m/s (Dewandel et al., 2006). Les
fissures sont reliées entre elles par des joints sub verticaux, dont on suppose une origine
tectonique. Cet horizon assure la fonction transmissive de l’aquifère. Enfin sur cet
horizon se situent les altérites, formation meuble composée des argiles issues de
l’altération des roches de socle. La porosité totale de cet horizon est d’environ 10% voir
plus sauf si le matériel argileux prédomine. Dans ce cas, la porosité totale est comprise
entre 0 à 10% (Compaore, 1997). De par leur perméabilité faible, ces altérites ont une
fonction capacitive importante. Ce dernier horizon peut être absent comme par
exemple dans les régions montagneuses à fort relief (Alpes ou Pyrénées). Les zones les
plus perméables se situent préférentiellement dans les zones de décompression
superficielles ou les zones de fracturation tectonique majeure (Juif, 1991 ; Maréchal,
2000 ; Maréchal et al., 1999 ; A8, A18).
- les aquifères karstiques dont la couverture carbonatée, susceptible de se
karstifier couvre environ 35 % du territoire français (Mangin, 1975), alors qu’ils ne
représentent que 10 à 15% de la surface des continents (Gunn and Lowe, 2000 ; Ford et
Williams, 2007). C’est la dissolution des minéraux des roches carbonatées qui sont à
l’origine de ces aquifères. La dissolution des minéraux carbonatés est accentuée par
l’acidité du milieu. Cette acidité est apportée par la dissolution du CO2 présent dans l’air
(pCO2 de l’ordre de 3. 10-4 atm) et surtout dans les sols (pCO2 de l’ordre de 1.10-2 atm).
Le transit de l’eau dans le sol aura une action plus importante sur la dissolution des
carbonates. Effectivement, une eau enrichie en CO2 peut dissoudre jusqu’à 300 mg/L de
calcite contre 12 mg/L dans une eau pure. La dissolution des minéraux carbonatés
intervient dans un système à trois phases, le CO2 gazeux, l’eau et le minéral selon un
ensemble de réactions d’équilibres chimiques appelé le système calco-carbonique
(Bakalowicz, 1979 ; Gabrovsek et al., 2004). Ces réactions sont pilotées par la pCO2 et
l’eau et l’équilibre des réactions est rapidement atteint, de quelques jours à quelques
semaines selon que la pCO2 est forte. Le karst ne pourra donc se développer que par un
renouvellement constant d’une eau acide dans le milieu grâce à un fort gradient
hydraulique. Les phénomènes de dissolution conduisent généralement à un
élargissement significatif des fractures qui affectent le volume rocheux. Ces
phénomènes conduisent à la formation d’un réseau de conduits ouverts qui vont
chenaliser préférentiellement les écoulements.
En milieu karstique, la perméabilité augmente de manière significative avec
l’échelle d’observation, depuis la mesure en laboratoire qui concerne essentiellement
les pores et les microfissures de la matrice de la roche (conductivité hydraulique de
l’ordre de 10-7 m/s), la mesure en forage qui concerne plutôt les macrofissures de cette
même matrice (conductivité hydraulique de l’ordre de 10-5 m/s) et enfin la mesure à

37
l’échelle du bassin qui tient compte de l’ensemble du réseau karstique avec des
conductivités hydrauliques de l’ordre de 10-3 m/s (Kiraly, 1975 ; Sauter, 1992).
5.2 Ecoulements dans les milieux fissurés à double perméabilité
Tous ces aquifères présentent des hétérogénéités de structure qui induisent un
comportement hydraulique particulier. A l’échelle macroscopique et selon leur origine
(sédimentaire ou mécaniques), les discontinuités qui affectent les massifs rocheux
peuvent se décomposer en quatre familles principales :
- les joints stratigraphiques : discontinuités d’origine sédimentaire qui présentent un
espace de vide propice à la circulation de fluide relativement réduit mais qui peuvent
être augmentées lors de la circulation de fluide puis présente un gradient hydraulique
parallèle à la direction de ces joints.
- les joints tectoniques : discontinuités tectoniques, plus ou moins planes qui présentent
en général un espace de vide réduit et une faible rugosité (Fénart, 2002). Ce sont des
joints qui peuvent être de dimension métrique mais dont l’ouverture utile aux
écoulements est faible. Par contre, ils apportent une contribution importante à la
porosité équivalente de la roche.
- les failles : discontinuités de géométrie plane, de grande extension et qui peuvent
affecter indifféremment plusieurs séries lithologiques. Les failles présentent en
moyenne des ouvertures supérieures au millimètre pouvant atteindre plusieurs
centimètres (Barton et Zoback, 1992). Ces failles peuvent jouer comme des barrières
imperméables ou des drains au sein du volume rocheux.
- les zones faillées : ensembles de discontinuités de géométrie complexe qui sont
définies comme des accidents cisaillants pour lesquelles la zone endommagée a un
impact significatif sur le comportement hydraulique du massif.
L’écoulement dans ces aquifères fissurés est dirigé par ce réseau de discontinuités
avec un contraste entre la matrice, bloc de roche sain ou microfissuré à perméabilité
variable et le réseau de fracturation, à perméabilité très élevée. La perméabilité globale
d’un aquifère fissuré dépend du degré de connexions entre les différents réseaux de
fracturations (Berkowitz, 2002 ; Guihéneuf et al., 2014). Les aquifères peuvent avoir un
comportement relativement homogène si les familles de discontinuités ont des rôles
équivalents, jusqu’à un comportement hétérogène, dans le cas où des discontinuités
peu perméables sont connectées par des accidents plus transmissifs. On parle alors de
double perméabilité (Guglielmi et Mudry, 2001). Dans cette famille d’aquifères fissurés,
les aquifères karstiques sont un cas extrême de double perméabilité. Les mesures
hydrogéologiques (telles que la perméabilité ou le niveau de l'eau) sont fortement
dépendantes de l'échelle d'observation (Clauser, 1992, fig. 1) et une mesure locale est
rarement représentative du comportement de l'aquifère (Jeannin, 1996).

38
Figure 1 : Changement d’échelle de mesure de la perméabilité dans les aquifères
cristallins (Clauser, 1992)
Le fonctionnement des aquifères fissurés de socle est bien documenté et bien
défini lorsque les écoulements sont générés par l’exploitation. Les altérites, de part
l’hétérogénéité du matériel, ont un comportement capacitif qui s’oppose à la propriété
transmissive des fissures. A l’échelle d’un bassin versant, le rôle de l’horizon fissuré n’est
pas bien défini. Deux hypothèses sont mises en balance à l’heure actuelle, soit un
horizon bien connecté horizontalement avec un tenseur de perméabilité à composante
principale horizontale, jouant de ce fait un rôle transmissif, et drainant les eaux depuis la
surface vers le bas. Les joints sub-verticaux sont 10 fois moins perméables que les
fissures sub-horizontales mais ont une importance primordiale dans le système
d’écoulement car ils assurent la connectivité du réseau (Maréchal et al., 2004) ; soit un
horizon mal connecté horizontalement avec un tenseur de perméabilité à composante
principale verticale, ne permettant que les échanges locaux entre altérites et le réseau
fissural (Maréchal et al., 2003 ; Lachassagne and Wyns., 2006). Le rôle des discontinuités
verticales présentes dans certains massifs granitiques sous forme de veine de quartz
plus ou moins altérées et traversant l’ensemble des formations a été caractérisé
(Dewandel et al., 2011). Ces discontinuités induisent des variations de conductivité
hydraulique au droit de celles-ci, avec des écoulements préférentiels le long des fissures
sub-verticales parallèles aux veines de quartz. Dans les aquifères de socle en milieu
montagneux, les écoulements peuvent être drainés par des aquifères perchés situés
dans des zones décomprimées, dans des zones peu faillées ou dans les couvertures
sédimentaires (Maréchal, 1998). Puis, les eaux souterraines s’écoulent au travers d’un
milieu fracturé dont les conductivités hydrauliques peuvent varier de 1.10-11 m/s dans la
matrice de gneiss, à 10-3 m/s dans les fractures (A4). Ces valeurs de perméabilité de la
matrice sont équivalentes à celles mesurées dans les micaschites non altérés de
l’instabilité de Séchilienne (non publié). Les eaux souterraines s’écoulent ensuite dans

39
une zone instable où la perméabilité n’est pas constante mais qu’elle est fonction des
contraintes du milieu ainsi que celles induites par la dégradation (Tang et al, 2002 ; A8).
Le fonctionnement du karst est également bien documenté par les travaux de
nombreuses équipes nationales (Montpellier, Rouen, Avignon, Paris, Besançon) et
internationales (Espagne, Suisse, Europe Centrale, Amérique du Nord). Deux théories
s’opposent. Tout d’abord, l’approche fonctionnelle (Mangin, 1975) décrit le
fonctionnement de ces aquifères d’un point de vue temporel, qui permet ainsi de
déduire un comportement spatial et par conséquent de déduire une structure.
L’approche structurelle (Kiraly, 1969, 1975) quant à elle s’intéresse d’abord à la
structure de l’aquifère et en déduit le type de fonctionnement. Jeannin (1996) alterne
les deux approches, ce qui lui permet d’obtenir le plus d’information possible. Ces deux
types d’approches ont conduit à la différenciation de deux types d’écoulement : d’une
part les drains ou axes de drainage, qui ont une fonction transmissive, et d’autre part les
systèmes annexes de drainage (SAD) qui ont un rôle capacitif (Mangin, 1975 ; Plagnes,
1997).
Les aquifères karstiques sont subdivisés en quatre entités, au sein desquelles,
l’écoulement est structuré différemment (Bakalowicz, 2005), qui sont :
- le sol et les terrains non karstiques qui sont considérés comme une zone
d’infiltration. Suivant la nature de la couverture, cette infiltration alimente le karst
uniquement de manière diffuse, ou en combinant une infiltration directe (perte) ou
diffuse. Dans le dernier cas, le transit peut se faire très rapidement depuis la surface
vers l’exutoire. L’épaisseur de sol est un facteur prépondérant des paramètres qui
interviennent dans l’infiltration (Gdalia, 1980, A7) et joue un rôle régulateur important
dans le temps de transfert de cette infiltration (A14).
- l’épikarst (Mangin, 1975 ; Klimchouk, 2004 ; Ford et Williams, 2007), qui
représente la partie la plus superficielle de l’aquifère. La base de l’épikarst est délimitée
par une zone de transition qui forme une barrière semi-perméable. C’est dans cette
zone que l’épikarst est capable de stocker un grand volume d’eau et de le libérer
rapidement vers les exutoires (Aquilina et al., 2005).
- la zone non saturée (ZNS) sensus stricto (Mangin 1975, Emblanch et al., 2006),
fait suite à l’épikarst. Les écoulements sont diphasiques dans un réseau de
discontinuités de perméabilité très variable. La ZNS est considérée comme une zone de
transit entre l’épikarst jusqu’à la zone saturée (Lastennet, 1994, Mudarra et al., 2011).
Au sein même de la ZNS, l’écoulement est déjà hiérarchisé vers la ZS. Le nombre de
zones d’écoulement diminue avec la profondeur au profit d’une pérennisation de ceux-
ci (Périneau et al., 2011).
- la zone saturée (ZS) est la zone de stockage principale de l’eau, dont la structure
est semblable à la ZNS. La différence réside dans le fait que les écoulements se font en
permanence en milieu saturé.
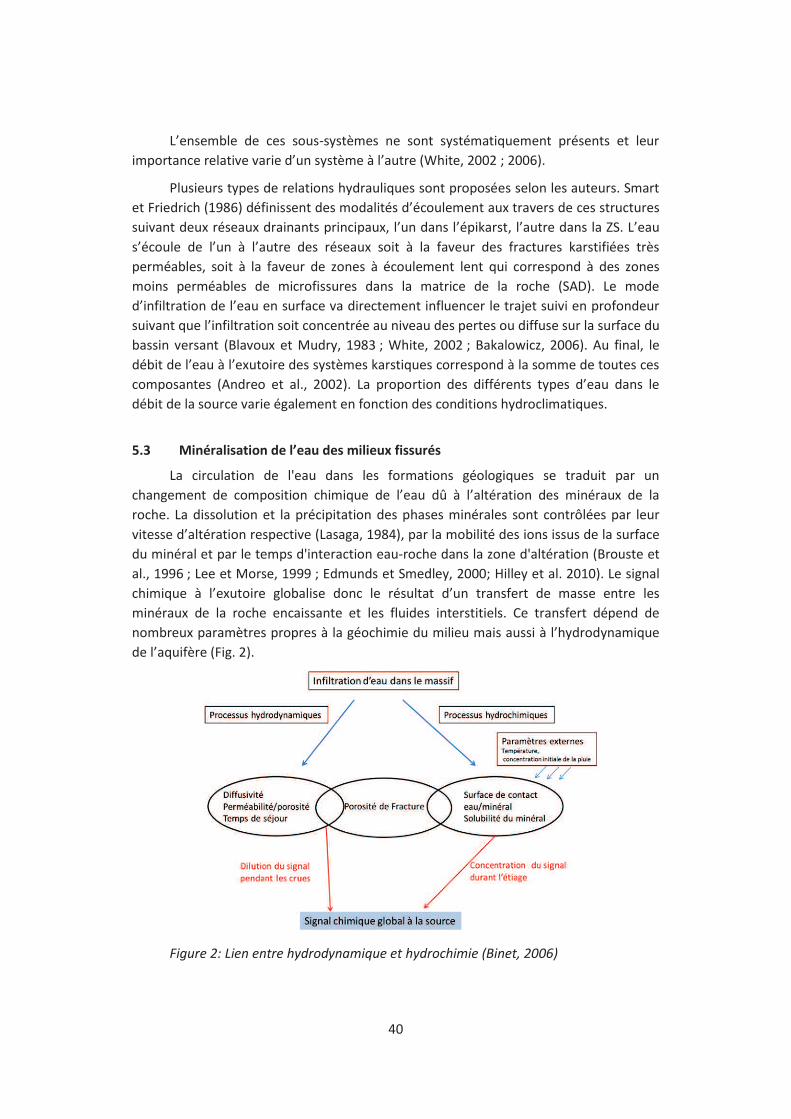
40
L’ensemble de ces sous-systèmes ne sont systématiquement présents et leur
importance relative varie d’un système à l’autre (White, 2002 ; 2006).
Plusieurs types de relations hydrauliques sont proposées selon les auteurs. Smart
et Friedrich (1986) définissent des modalités d’écoulement aux travers de ces structures
suivant deux réseaux drainants principaux, l’un dans l’épikarst, l’autre dans la ZS. L’eau
s’écoule de l’un à l’autre des réseaux soit à la faveur des fractures karstifiées très
perméables, soit à la faveur de zones à écoulement lent qui correspond à des zones
moins perméables de microfissures dans la matrice de la roche (SAD). Le mode
d’infiltration de l’eau en surface va directement influencer le trajet suivi en profondeur
suivant que l’infiltration soit concentrée au niveau des pertes ou diffuse sur la surface du
bassin versant (Blavoux et Mudry, 1983 ; White, 2002 ; Bakalowicz, 2006). Au final, le
débit de l’eau à l’exutoire des systèmes karstiques correspond à la somme de toutes ces
composantes (Andreo et al., 2002). La proportion des différents types d’eau dans le
débit de la source varie également en fonction des conditions hydroclimatiques.
5.3 Minéralisation de l’eau des milieux fissurés
La circulation de l'eau dans les formations géologiques se traduit par un
changement de composition chimique de l’eau dû à l’altération des minéraux de la
roche. La dissolution et la précipitation des phases minérales sont contrôlées par leur
vitesse d’altération respective (Lasaga, 1984), par la mobilité des ions issus de la surface
du minéral et par le temps d'interaction eau-roche dans la zone d'altération (Brouste et
al., 1996 ; Lee et Morse, 1999 ; Edmunds et Smedley, 2000; Hilley et al. 2010). Le signal
chimique à l’exutoire globalise donc le résultat d’un transfert de masse entre les
minéraux de la roche encaissante et les fluides interstitiels. Ce transfert dépend de
nombreux paramètres propres à la géochimie du milieu mais aussi à l’hydrodynamique
de l’aquifère (Fig. 2).
Figure 2: Lien entre hydrodynamique et hydrochimie (Binet, 2006)
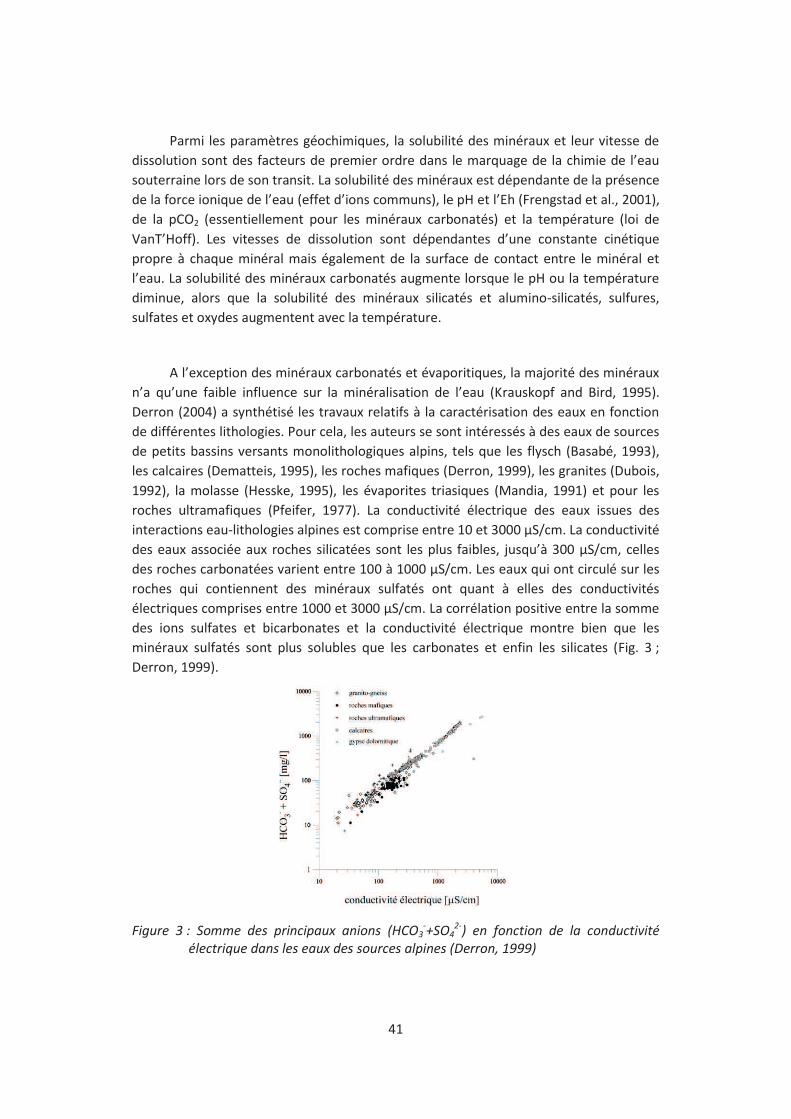
41
Parmi les paramètres géochimiques, la solubilité des minéraux et leur vitesse de
dissolution sont des facteurs de premier ordre dans le marquage de la chimie de l’eau
souterraine lors de son transit. La solubilité des minéraux est dépendante de la présence
de la force ionique de l’eau (effet d’ions communs), le pH et l’Eh (Frengstad et al., 2001),
de la pCO2 (essentiellement pour les minéraux carbonatés) et la température (loi de
VanT’Hoff). Les vitesses de dissolution sont dépendantes d’une constante cinétique
propre à chaque minéral mais également de la surface de contact entre le minéral et
l’eau. La solubilité des minéraux carbonatés augmente lorsque le pH ou la température
diminue, alors que la solubilité des minéraux silicatés et alumino-silicatés, sulfures,
sulfates et oxydes augmentent avec la température.
A l’exception des minéraux carbonatés et évaporitiques, la majorité des minéraux
n’a qu’une faible influence sur la minéralisation de l’eau (Krauskopf and Bird, 1995).
Derron (2004) a synthétisé les travaux relatifs à la caractérisation des eaux en fonction
de différentes lithologies. Pour cela, les auteurs se sont intéressés à des eaux de sources
de petits bassins versants monolithologiques alpins, tels que les flysch (Basabé, 1993),
les calcaires (Dematteis, 1995), les roches mafiques (Derron, 1999), les granites (Dubois,
1992), la molasse (Hesske, 1995), les évaporites triasiques (Mandia, 1991) et pour les
roches ultramafiques (Pfeifer, 1977). La conductivité électrique des eaux issues des
interactions eau-lithologies alpines est comprise entre 10 et 3000 µS/cm. La conductivité
des eaux associée aux roches silicatées sont les plus faibles, jusqu’à 300 µS/cm, celles
des roches carbonatées varient entre 100 à 1000 µS/cm. Les eaux qui ont circulé sur les
roches qui contiennent des minéraux sulfatés ont quant à elles des conductivités
électriques comprises entre 1000 et 3000 µS/cm. La corrélation positive entre la somme
des ions sulfates et bicarbonates et la conductivité électrique montre bien que les
minéraux sulfatés sont plus solubles que les carbonates et enfin les silicates (Fig. 3 ;
Derron, 1999).
Figure 3 : Somme des principaux anions (HCO3-+SO4
2-) en fonction de la conductivité
électrique dans les eaux des sources alpines (Derron, 1999)
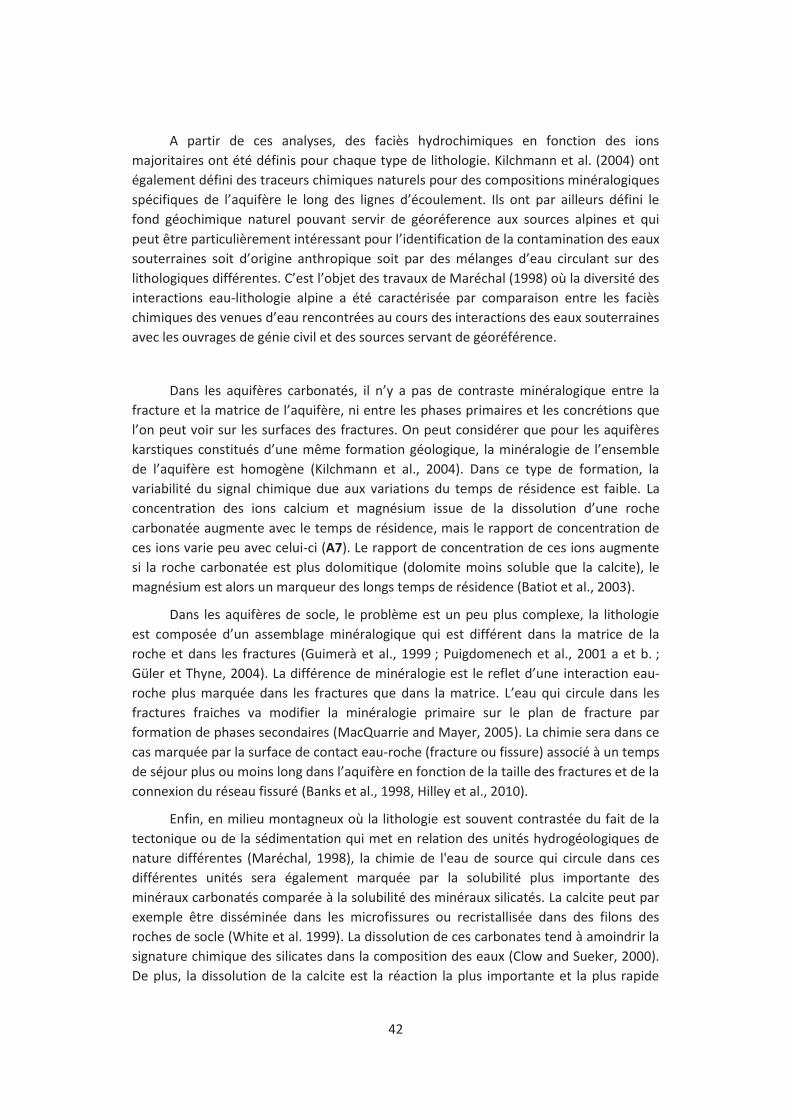
42
A partir de ces analyses, des faciès hydrochimiques en fonction des ions
majoritaires ont été définis pour chaque type de lithologie. Kilchmann et al. (2004) ont
également défini des traceurs chimiques naturels pour des compositions minéralogiques
spécifiques de l’aquifère le long des lignes d’écoulement. Ils ont par ailleurs défini le
fond géochimique naturel pouvant servir de géoréference aux sources alpines et qui
peut être particulièrement intéressant pour l’identification de la contamination des eaux
souterraines soit d’origine anthropique soit par des mélanges d’eau circulant sur des
lithologiques différentes. C’est l’objet des travaux de Maréchal (1998) où la diversité des
interactions eau-lithologie alpine a été caractérisée par comparaison entre les faciès
chimiques des venues d’eau rencontrées au cours des interactions des eaux souterraines
avec les ouvrages de génie civil et des sources servant de géoréférence.
Dans les aquifères carbonatés, il n’y a pas de contraste minéralogique entre la
fracture et la matrice de l’aquifère, ni entre les phases primaires et les concrétions que
l’on peut voir sur les surfaces des fractures. On peut considérer que pour les aquifères
karstiques constitués d’une même formation géologique, la minéralogie de l’ensemble
de l’aquifère est homogène (Kilchmann et al., 2004). Dans ce type de formation, la
variabilité du signal chimique due aux variations du temps de résidence est faible. La
concentration des ions calcium et magnésium issue de la dissolution d’une roche
carbonatée augmente avec le temps de résidence, mais le rapport de concentration de
ces ions varie peu avec celui-ci (A7). Le rapport de concentration de ces ions augmente
si la roche carbonatée est plus dolomitique (dolomite moins soluble que la calcite), le
magnésium est alors un marqueur des longs temps de résidence (Batiot et al., 2003).
Dans les aquifères de socle, le problème est un peu plus complexe, la lithologie
est composée d’un assemblage minéralogique qui est différent dans la matrice de la
roche et dans les fractures (Guimerà et al., 1999 ; Puigdomenech et al., 2001 a et b. ;
Güler et Thyne, 2004). La différence de minéralogie est le reflet d’une interaction eau-
roche plus marquée dans les fractures que dans la matrice. L’eau qui circule dans les
fractures fraiches va modifier la minéralogie primaire sur le plan de fracture par
formation de phases secondaires (MacQuarrie and Mayer, 2005). La chimie sera dans ce
cas marquée par la surface de contact eau-roche (fracture ou fissure) associé à un temps
de séjour plus ou moins long dans l’aquifère en fonction de la taille des fractures et de la
connexion du réseau fissuré (Banks et al., 1998, Hilley et al., 2010).
Enfin, en milieu montagneux où la lithologie est souvent contrastée du fait de la
tectonique ou de la sédimentation qui met en relation des unités hydrogéologiques de
nature différentes (Maréchal, 1998), la chimie de l'eau de source qui circule dans ces
différentes unités sera également marquée par la solubilité plus importante des
minéraux carbonatés comparée à la solubilité des minéraux silicatés. La calcite peut par
exemple être disséminée dans les microfissures ou recristallisée dans des filons des
roches de socle (White et al. 1999). La dissolution de ces carbonates tend à amoindrir la
signature chimique des silicates dans la composition des eaux (Clow and Sueker, 2000).
De plus, la dissolution de la calcite est la réaction la plus importante et la plus rapide

43
dans les conditions de subsurface (Morse and Arvidson, 2002) alors que la dissolution du
plagioclase est une des réactions les plus lentes avec un ordre de grandeur de vitesse de
5 à 6 fois moins rapide que celle de la calcite (Blum and Stillings, 1995 ; White and
Brantley, 1995). La chimie peut également avoir une signature sulfatée qui peut avoir
deux origines minéralogique, soit sulfatée lorsque les eaux traverse une structure
sédimentaire évaporitique (A2, A3) soit sulfurée dans les roches de socle ou la pyrite est
présente (Vengeon, 1998, Pili et al., 2004, A3, A12). Dans ce cas, l’altération de la pyrite
libère des protons favorisant ainsi l'altération des autres minéraux alumino-silicatés
(Beaulieu et al., 2011 ; Li et al. 2008). La chimie de l’eau peut être franchement marquée
par la dissolution de minéraux sulfureux, notamment dans des zones de socle
déstructuré, par la création de nouvelles surfaces réactives, paramètre qui intervient
dans les cinétiques de dissolution (A12, O5). Dans ce dernier cas, la double-perméabilité
du socle cristallin, et une bonne connexion du réseau de fissures peuvent influencer à la
fois le temps d'interaction eau-roche (la minéralisation) et les variations temporelles du
signal chimique en réponse à la recharge de l’aquifère (Pili et al. 2004, A18).
5.4 Les zones ateliers
Afin de mieux caractériser le fonctionnement interne des aquifères fissurés des
zones ateliers ont été équipés d’appareils de mesures de paramètres physico-chimiques
et hydrodynamiques sur toutes les composantes de l’écoulement (sources, fissures,
drains) (Tab 1 et 2).
Les sites karstiques, localisés dans la figure 4 ont été sélectionnés en fonction de
l’accessibilité des points de mesure, de la zone d’infiltration (diffuse et concentrée).
Les sites d’aquifères de socle localisés sur la figure sont des versants instables
dont les propriétés physiques se modifient en fonction de la déstabilisation (figure 5). Ce
sont donc des cas particuliers des aquifères de socle, ou les modifications se font à
l’échelle de temps humaine, ce qui permet d’appréhender certains mécanismes de
l’altération, qui ne sont souvent étudiés qu’en laboratoire.
Il s’agit en fait, dans les deux types d’aquifère, d’améliorer la connaissance de la
genèse du signal chimique, de définir les apports de la connaissance de ce signal en
termes de fonctionnement, aussi bien sur le transfert de pression que sur le transfert de
masse et ses effets.
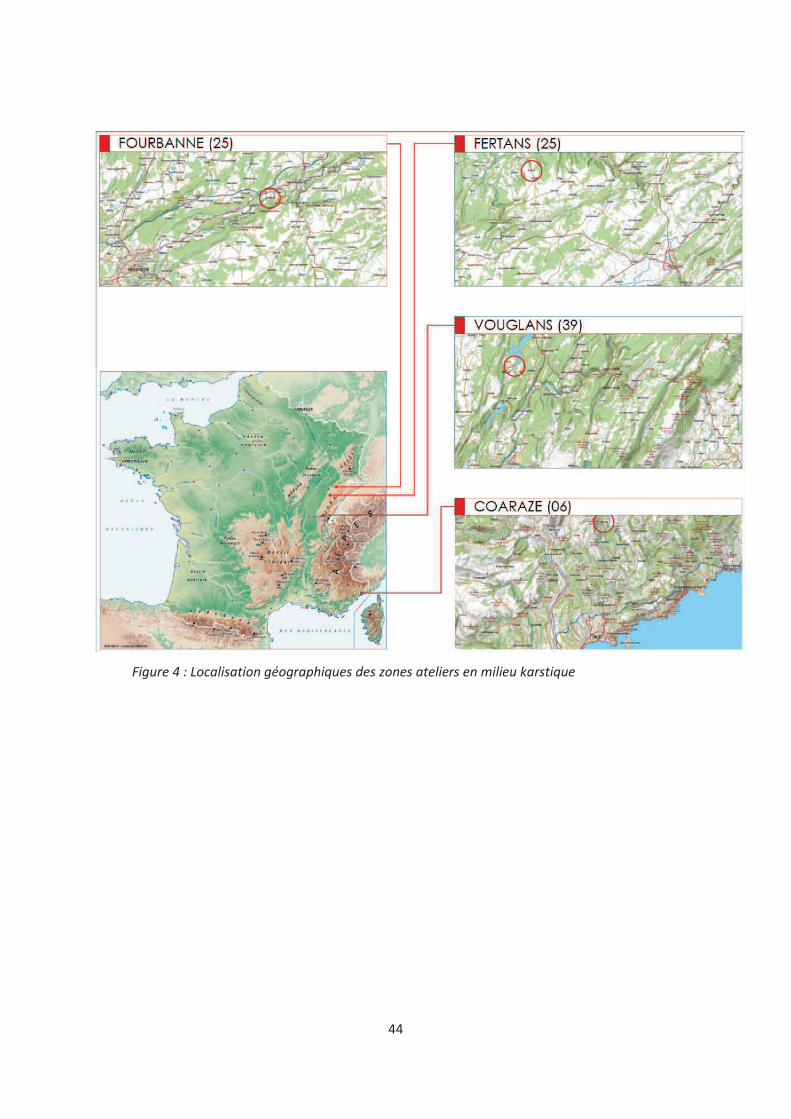
44
Figure 4 : Localisation géographiques des zones ateliers en milieu karstique

45
Figure 5 : Localisation géographiques des zones ateliers en milieu fissuré de socle
Afin d'évaluer le temps de transit des eaux d'infiltration depuis la surface du sol,
un nouveau traceur naturel est expérimenté, le carbone organique dissous qui est un
traceur non conservatif. Il peut non seulement marquer les événements d'infiltration,
mais également évaluer le temps de résidence de l'eau dans le réservoir. Cette méthode
a été développée sur le versant instable de Séchilienne et sur le site du Laboratoire
Souterrain à Bas Bruit de Rustrel (Vaucluse). Sur ces sites, l'enregistrement automatique
de la fluorescence naturelle de l'eau, qui est due aux acides humiques et fulviques
libérés dans le sol par les épisodes d'infiltration, permet de suivre la progression des
épisodes de pluie sur la base des versants. Ce protocole a été appliqué aux sites de
Fertans, Fourbanne et au versant de Valabres où une modification technique des
préleveurs automatiques facilite la conservation du carbone organique dissous pour son
analyse ultérieure.

46
Les tableaux 1 et 2 synthétisent l’ensemble des mesures effectué sur chaque site
Tableau 1 : Synthèse des mesures effectuées sur les différents sites des zones ateliers en
milieu karstique
Coaraze Fertans Fourbanne Vouglans
Localisation des points de mesures
Signal d'infiltration
Diffus dans sol Concentré dans perte
Diffus dans sol
Lac de retenue
Diffus dans sol
Matrice-Drain/ ZNS
Joint de stratification, fracture
1 forage- 1 conduit karstique 28 forages et 2 sources
Matrice-Drain-siphon/ ZS
1 source 1 source 14 forages et 1 source
Métrologie Vanne sur l’exutoire : ouverture et fermeture de la vanne à différents pas de temps
Prélèvements manuels sur les 2 points ; pas de temps de la minute à quelques minutes
Sondes OTT Orpheus installée sur un joint (pas de temps 30s)
Lysimètre interface sol-roche
Préleveurs automatiques d’eau sur les
deux pts: pas de temps tous les 4jours
Sondes OTT CTD
Fluorimètres de terrain
Sonde orpheus (perte)
Sondes ISCO et YSI (conduit et source)
Préleveurs automatiques d’eau sur chaque pt (2 épisodes de crue)
Prélèvement manuel (2 épisodes de crue)
Prélèvements manuels d’eau
Observations hydrochimiques et hydrodynamiques
Paramètres physico-chimiques (conductivité électrique, température, pH), Chimie des éléments majeurs
Mesure indirecte du débit par la hauteur d’eau ou la pression
Fluorescence naturelle
COT/COD
Fluorescence artificielle
COT/COD
COT
13C
Fréquence des mesures et prélèvements
Variable selon expériences
De la minute à quelques minutes
Prélèvements pour
analyses chimiques :
tous les 4 jours sauf pour des suivis d’épisodes de
crues (pas de temps horaire
Mesures physico-chimiques
en continu depuis 2009 de la température, conductivité électrique, hauteur d’eau et de la
fluorescence
Prélèvements pour
analyses chimiques
tous les 4 jours sauf pour le suivi de 2 épisodes de crues (pas de temps horaire)
horaire pour le COT/COD et la fluorescence artificielle en période de crue
Mesures physico-
chimiques
en continu depuis 2009 de la température, conductivité électrique, hauteur d’eau et de la
fluorescence pendant 2ans
Mesures ponctuelles qui couvrent deux saisons hydrologiques (Hautes Eaux et étiage)
Afin d’évaluer les relations entre les différents compartiments, un suivi
hydrogéochimique couplé à des mesures hydrodynamiques (débit des fissures) est mis
en place sur la quasi-totalité des sites. Le suivi de paramètres comprend
l'enregistrement en continu de pression d'eau, température et conductivité (capteurs

47
OTT), de fluorescence naturelle et de turbidité (enregistreurs GGUN). En parallèle, un
échantillonnage séquencé des venues d'eau dans les galeries ou fissures et à les sources
permet un suivi chimique des éléments majeurs.
Tableau 2 : Synthèse des mesures effectuées sur les différents sites des zones ateliers en
milieu fissurés de socle
Séchilienne La Clapière Valabres
Conditions d’émergence des points de mesures
3 fissures
15 sources
18 sources 1 fissure
1 source
Métrologie Prélèvements manuels sur les 20 points ;
Préleveurs automatiques d’eau sur 4 points : pas de temps tous les 4jours
Sondes OTT CDT
Fluorimètres de terrain
Prélèvements manuels
Préleveurs automatiques d’eau sur deux pts
Sonde YSI sur un point
Sonde OTT Orpheus
Préleveurs automatiques d’eau sur chaque pt
Prélèvements manuels
Fluorimètre de terrain
Observations hydrochimiques et hydrodynamiques
Paramètres physico-chimiques (conductivité électrique, température, pH), Chimie des éléments majeurs
Mesure indirecte du débit par la hauteur d’eau ou la pression
Fluorescence naturelle
Fluorescence artificielle
COT/COD
Fluorescence artificielle
Fluorescence naturelle
COT/COD
Fréquence des mesures et des prélèvements
Prélèvements pour
analyses chimiques
Campagnes ponctuelles (1999, 2003)
Campagnes trimestrielles depuis 2010
tous les 4 jours depuis 2010 sur 4points de mesures, puis sur 3pts depuis 2012
Traçage artificiel (2002)
Mesures physico-chimiques
en continu depuis 2010 de la température, conductivité électrique et de la hauteur d’eau
Prélèvements pour
analyses chimiques
Campagne sur deux cycles hydrologiques (1999, 2000) pas de temps hebdomadaire
Suivi de 2000-2004 de 3 pts de mesures (échantillonnage entre 2 et 4 jours, puis sur 1pt depuis 2011 (pas de temps hebdomadaire)
Traçage artificiel (2002 et 2005)
Mesures physico-chimiques
En continu, de 2003-2006 sur 3 pts, puis sur 2 pts depuis 2011 de la température, conductivité électrique et de la hauteur d’eau
Prélèvements pour
analyses chimiques
Suivi de 2003-2004 de 2pts de mesure puis de 2007-2008
Campagnes ponctuelles
Mesures physico-chimiques
En continu, de 2003-2004 et de 2007-2008 de la température, conductivité électrique et de la hauteur d’eau et de la fluorescence
naturelle (2007-2008)
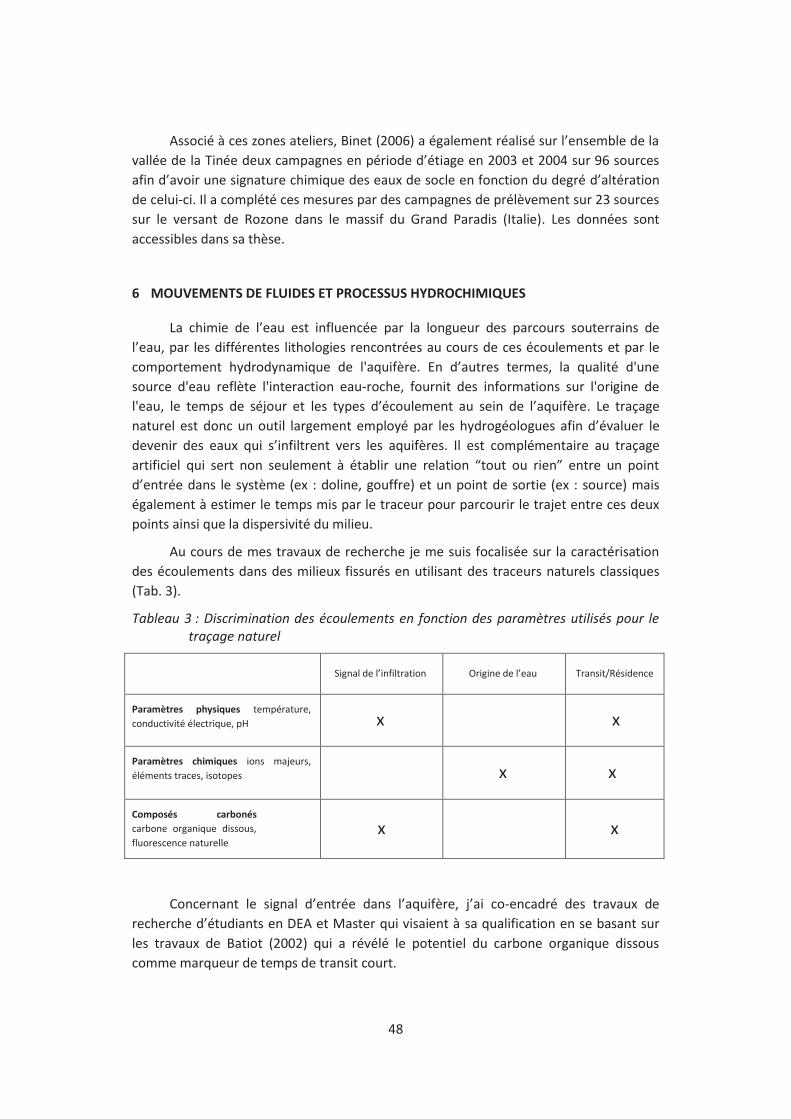
48
Associé à ces zones ateliers, Binet (2006) a également réalisé sur l’ensemble de la
vallée de la Tinée deux campagnes en période d’étiage en 2003 et 2004 sur 96 sources
afin d’avoir une signature chimique des eaux de socle en fonction du degré d’altération
de celui-ci. Il a complété ces mesures par des campagnes de prélèvement sur 23 sources
sur le versant de Rozone dans le massif du Grand Paradis (Italie). Les données sont
accessibles dans sa thèse.
6 MOUVEMENTS DE FLUIDES ET PROCESSUS HYDROCHIMIQUES
La chimie de l’eau est influencée par la longueur des parcours souterrains de
l’eau, par les différentes lithologies rencontrées au cours de ces écoulements et par le
comportement hydrodynamique de l'aquifère. En d’autres termes, la qualité d'une
source d'eau reflète l'interaction eau-roche, fournit des informations sur l'origine de
l'eau, le temps de séjour et les types d’écoulement au sein de l’aquifère. Le traçage
naturel est donc un outil largement employé par les hydrogéologues afin d’évaluer le
devenir des eaux qui s’infiltrent vers les aquifères. Il est complémentaire au traçage
artificiel qui sert non seulement à établir une relation “tout ou rien” entre un point
d’entrée dans le système (ex : doline, gouffre) et un point de sortie (ex : source) mais
également à estimer le temps mis par le traceur pour parcourir le trajet entre ces deux
points ainsi que la dispersivité du milieu.
Au cours de mes travaux de recherche je me suis focalisée sur la caractérisation
des écoulements dans des milieux fissurés en utilisant des traceurs naturels classiques
(Tab. 3).
Tableau 3 : Discrimination des écoulements en fonction des paramètres utilisés pour le
traçage naturel
Signal de l’infiltration Origine de l’eau Transit/Résidence
Paramètres physiques température,
conductivité électrique, pH x x
Paramètres chimiques ions majeurs,
éléments traces, isotopes x x
Composés carbonés
carbone organique dissous,
fluorescence naturelle x x
Concernant le signal d’entrée dans l’aquifère, j’ai co-encadré des travaux de
recherche d’étudiants en DEA et Master qui visaient à sa qualification en se basant sur
les travaux de Batiot (2002) qui a révélé le potentiel du carbone organique dissous
comme marqueur de temps de transit court.
49
Concernant la caractérisation des écoulements dans l’aquifère, j’ai travaillé sur
des données acquises par des suivis en milieu naturel afin d’avoir accès à tous les points
de circulation d’eau de la zone non saturée et de la zone saturée. Les accès directs des
écoulements dans la zone non saturée ont été facilités par l’implantation de suivis dans
des galeries artificielles (conduit karstique, forage, galeries de barrages, galeries
d’amenées d’eau ou de surveillance) comme cela a été le cas à Fourbanne, Fertans,
Vouglans, Valabres ou Séchilienne.
En ce qui concerne la caractérisation des types d’écoulement, j’ai travaillé sur des
données acquises par des suivis en milieu naturel. La discrimination des différents types
d’écoulement à l’exutoire a été possible par une étude combinée de l’ensemble des
signaux chimiques enregistrés dans les différents compartiments. J’ai également réalisé
des suivis chimiques sur le site expérimental de Coaraze afin d’étudier les relations
hydrauliques entre les différents compartiments de celui-ci.
Les mesures hydrochimiques associées aux mesures hydrodynamiques ont permis
de proposer pour ces sites, des schémas conceptuels d’écoulement qui intègrent chaque
composante (Epikarst et Zone Non Saturée, Zone Saturée) et de chaque type (transit
rapide/lent, matrice/fissure) des écoulements identifiés, de fournir des données pour les
modèles théoriques et d’initier le lien entre différentes disciplines, comme
l’hydromécanique ou la géochimie des interactions eau-roche.
Ces différentes approches ont servis à apporter des éléments de réponses aux
verrous scientifiques énoncés dans la thèse d’A. Charmoille, pour les aquifères
karstiques et qui peuvent être étendus aux aquifères fissurés au sens large :
- l’étude hydrochimique autorise-t-elle une résolution suffisante pour détecter
les échanges entre les compartiments de perméabilité contrastés au sein des
aquifères fissurés ? ;
- quels sont les paramètres propres à l’aquifère qui régulent ces échanges et
quelles conséquences ont-ils sur les transferts d’éléments, et en particulier
d’éléments polluants de la zone d’infiltration jusqu’à l’exutoire ? ;
- quelle est l’influence des variations des conditions hydrodynamiques à
l’échelle de l’aquifère sur les modalités d’échanges entre la zone perméable et
la zone peu perméable ? ;
- enfin, les variations de perméabilités sur l’effet des contraintes mécaniques
peuvent-elles entrainer une variation du signal chimique d’un aquifère fissuré
?
6.1 Caractérisation du signal d’infiltration dans les aquifères hétérogènes
Afin de bien comprendre les écoulements dans des aquifères à double
perméabilité, il est nécessaire de caractériser le signal d’entrée dans ces systèmes. Le sol
est le premier compartiment que traverse l’eau de pluie. Dans les eaux du sol et des
eaux de surface, la matière organique est principalement d’origine photosynthétique

50
(Thurmann, 1985). La matière organique allochtone, qui est issue de la dégradation des
végétaux supérieurs, apport de matière organique anthropique provenant des
déjections animales (fumier, lisier), des résidus urbains et/ou industriels (boues de
stations d’épuration, hydrocarbures) ou encore de l’utilisation de produits
phytosanitaires est apportée par infiltration des eaux de pluie. Elle s’oppose à la matière
organique autochtone qui est produite au sein des environnements aquatiques. Le
Carbone Organique Dissous (COD) varie avec la quantité de molécules carbonées
dissoutes et diminue au cours du temps sous l’effet de la dégradation bactérienne. Des
fortes valeurs de COD résiduel seront donc caractéristiques des eaux à court temps de
séjour dans l’aquifère. Le COD regroupe l’ensemble des molécules organiques de taille
inférieure à 0,45µm. Additionné au Carbone Organique Particulaire, composés
organiques de taille supérieure à 0,45µm (COP), ils forment le Carbone Organique Total
(COT). La quasi-totalité du COT provient du sol, faisant de ce dernier un traceur
intéressant de l’infiltration rapide (Emblanch et al., 1998 ; Batiot et al., 2003 ; Celle-
Jeanton et al., 2003 ; Garry, 2007 ; Savoy, 2007 ; Mudarra and Andréo, 2011). Le COT est
habituellement utilisé pour l’étude des pollutions ponctuelles ou pour estimer
l’influence anthropique au sein des aquifères (Baker and Lamon-Black, 2001).
Les composés carbonés ont la propriété d’émettre un signal fluorescent. Ce signal
peut être mesuré grâce à un spectrofluorimètre de terrain (Schnegg, 2003). Les travaux
de recherche d’E. Thiebaud effectués dans le cadre de son DEA que j’ai co-encadré avec
J. Mudry visait à établir une relation entre le COD et la fluorescence naturelle de l’eau.
L’objectif de ces travaux était d’établir un protocole de mesure qui devait permettre
d’utiliser la fluorescence naturelle comme traceur des conditions d’infiltration. Pour
répondre à cette problématique, un suivi hydrochimique couplé à des mesures
hydrodynamiques ont été mis en place dans la galerie creusée dans la zone non saturée
de l’aquifère carbonaté hauterivien et barrémo-bédoulien du Laboratoire Souterrain à
Bas-Bruit situé à Rustrel. Cet aquifère est drainé par la Fontaine de Vaucluse. La
comparaison des deux signaux montre un déphasage variable (de 1 à 2 mois) entre
l’augmentation du débit et le transfert de masse dans la ZN, ce qui montre bien le
potentiel de ce traceur. Cette étude préliminaire a permis d’ouvrir des pistes de
recherche afin de caractériser au mieux le signal d’entrée : cartographie pédologique de
la zone d’infiltration ; calibration de la relation COD/fluorescence de l’eau ; étalonnage
du GGUN par des expériences d’infiltration du sol par de l’eau de pluie en plusieurs
points du site pour tenir compte du couvert végétal et de l’épaisseur du sol ; signal
saisonnier de l’infiltration dans le sol.
La méthodologie développée sur le site de Rustrel a été adaptée afin de
caractériser le signal d’entrée du système naturel de Fertans drainé par une source. Un
accès dans la matrice de la roche est rendu possible grâce à un forage carotté dans le
massif. Ces points d’accès aux circulations sont équipés d’appareils de mesures en
continu (Tab. 1). Des simulations de pluie sur la zone de recharge de la source ont été
menées sur un sol sec puis un sol humique et l’eau d’infiltration dans le sol a été
prélevée grâce à une plaque lysimétrique sur laquelle des mesures de COT ont été

51
réalisées. Ces travaux se sont fait dans le cadre du stage de Master de N. Foraz que j’ai
co-encadré avec J.B. Charlier et J. Mudry. Ils ont montré l’importance de l’état de
saturation du sol dans le drainage (coefficient de drainage trois fois plus important pour
un sol humique par rapport à un sol sec) mais qui n’influe pas sur les concentrations en
DOC qui sont dans les deux cas de l’ordre de 10 mg/L (A14).
La caractérisation de la zone d’infiltration est également fondamentale dans le cas
des instabilités de versant L’étude de la commande hydraulique des instabilités de
versants a souvent été conduite par des essais de corrélation de chronique
pluviométriques, des chroniques de débits avec des chroniques de mouvements de
fractures ou de cibles des glissements de terrain (Rochet et al. 1994; Alfonsi 1997;
Glade, 1998 ; Malet et al., 2003 ; Godt et al., 2006 ). Les essais de corrélation entre la
pluviosité et les débits sont dépendants de la représentativité de la station
météorologique ou limnigraphique par rapport à l’aire d’alimentation de la nappe. Dans
ce contexte, des mesures d’isotopes stables ont été réalisés afin de délimiter la zone de
recharge des instabilités de versants de Séchilienne et de la Clapière. Dans les deux cas,
l’infiltration se fait sur des zones de recharges supérieures aux périmètres de glissement
(A2 ; A3). Ce modèle a été affiné sur le site de Séchilienne, par A. Vallet dans le cadre de
sa thèse que j’ai co-dirigé avec J. Mudry, où il a calibré le gradient isotopique en tenant
compte de l’effet saisonnier. Il a pu également, définir pour chaque source son aire
d’alimentation à partir de mesures isotopiques et de l’analyse de la topographie (A18). Il
est reconnu que la pression interstitielle, accumulée par la recharge des hydrosystèmes,
est l'un des principaux facteurs de déclenchement des glissements de terrain, une
méthodologie a été développée par A. Vallet, afin d’estimer les précipitations efficaces,
paramètre important à prendre en compte pour une évaluation précise des effets
hydrauliques. La méthode de calcul quotidienne de la recharge, basée sur un bilan
hydrique au niveau du sol. La méthode proposée a été conçue pour être suffisamment
simple pour être utilisée par tout spécialiste non hydrogéologue qui souhaite étudier les
relations entre les précipitations et les déplacements de glissements de terrain (A16).
6.2 Caractérisation des transferts au sein de l’aquifère
La caractérisation des transferts entre la ZNS et la ZS est fondamentale
notamment dans l’estimation des ressources en eau. La ZNS est sensible aux transferts
de pression due à l’infiltration, lente au travers de la matrice ou rapide au travers des
conduits, des eaux de pluie. Les effets sur les fissures peuvent être différents
(transmissif ou capacitif) en fonction de l’intensité et du passage de l’onde de pression.
C’est par exemple l’effet piston bien décrit dans les hydrogrammes associés des ondes
de crues dans le karst (Mangin, 1975 ; Bonacci, 2001). L’étude des relations entre la
matrice de la roche qui correspond à des volumes rocheux peu perméables et les
conduits perméables ont été étudiés dans un premier temps par des mesures
hydrauliques que sont le débit, de niveau piezométrique dans les forages, variation de la
pression hydraulique (Guglielmi and Mudry, 2001, Cappa et al., 2005). l’analyse
d’hydrogrammes et le traçage artificiel (Jeannin et Grasso, 1995 ; Jeannin, 1996 ; Pistre
52
et al. 2002). Ces mesures ont également été les paramètres initiaux des modèles
numériques de type boite noire (Mangin, 1984 ; Padilla and Pullido-Bosch, 1995 ; Labat
et al., 2000, Pinault et al., 2001 ; Kurtulus and Razak, 2007, Fleury et al., 2007) ou des
modèles distribués basés sur la physique (Kiraly, 1985 ; Cacas et al., 1990 ; Jourde et al.,
1998; Teutsch and Sauter, 1998 ; Cornaton and Perrochet, 2002). Enfin la composante
« traçage naturel » s’est imposée «logiquement» et elle est devenue une approche
complémentaire de ces études (Mudry, 1987 ; Lastennet et al., 1995 ; Garry et al., 2008 ;
Caetano Bicalho et al., 2012 ; Blondel et al., 2012). Ainsi, des modèles des transferts au
sein de l’aquifère sont établis et deviennent des outils utilisés pour une meilleure
gestion de l’aquifère en terme exploitation et de protection de la ressource (López-
Chicano et al., 2001 ; Barbieri et al., 2005 ; COSTAction 620, 2006 ; Dorflinger and
Plagnes, 2009) ; de mieux comprendre le fonctionnement de ces aquifères fissurés
notamment les processus de la recharge des eaux souterraines (Charideh and Rahman,
2007, Negrel et al., 2011), d’évaluer les zones de mélange d’eau comme par exemple
des intrusions marines (Barbecot et al., 2000). Enfin, la connaissance des différents types
d’écoulement permet d’établir des modèles de transferts d’éléments polluants, comme
peuvent l’être les nitrates, à fortes concentrations (Négrel et al., 2007 ; Katz et
al., 2004).
La caractérisation des transferts entre la ZNS et la ZS est également fondamentale
dans le cas d’estimation des risques dû à l’implantation d’infrastructures dans les
formations carbonatées, comme c’est le cas de barrages, qu’ils soient destinés au
stockage d’eau dans des régions aride à semi-aride ou pour les usines hydroélectriques
(Uromeihy, 2000 ; Turkmen et al., 2002 ; Romanov et al., 2003, Hiller et al., 2011).
L’implantation de telles structures modifie les écoulements naturels qui sont drainés
artificiellement afin d’éviter les surpressions dans les appuis du barrage (Contreras and
Hernández, 2010). L’eau des retenues augmentent les gradients hydrauliques de
plusieurs ordres de grandeur comparées aux écoulements naturels. Ces forts gradients
hydrauliques sous les sites de barrages accélèrent la karstification (Hiller et al., 2011, De
Waele, 2008). Par ailleurs, les variations de charges hydrostatiques dues aux variations
du niveau d’eau dans la retenue d’eau du barrage modifient également les propriétés
hydrauliques des appuis et des fondations du barrage (Guglielmi, 1999 ; Uromeihy,
2000). De tels sites sont des laboratoires expérimentaux à l’échelle d’un massif grâce au
réseau de surveillance de telles structures, qui permettent de mieux comprendre dans
l’espace, des transferts entre les différents compartiments du karst.
Enfin, La caractérisation des transferts entre la zone d’infiltration et la zone noyée
est également fondamentale dans le cas des instabilités de versant. Ces instabilités sont
généralement déclenchées par des facteurs hydrologiques et hydrogéologiques qui
conditionnent l’infiltration, et augmentent la pression d’eau interstitielle (Van Asch et
al., 1999 ; Wieczorek and Guzzetti, 1999 ; Iverson, 2000 ; Bonzanigo et al., 2001 ;
Guglielmi et al., 2005 ; Bogaard et al., 2007). L'effet de l'eau sur ces versants se traduit à

53
la fois par une dégradation chimique et mécanique (Matsukura, 1996 ; Cervi et al.,
2012 ; Cappa et al., 2014). Par ailleurs, le développement d’un profil d’altération dépend
de conditions climatiques particulières (Tardy, 1971 ; Kühnel, 1996) qui sont la pluie
(hydrolyse des minéraux silicatés) et la température (cinétique des réactions). Malgré
cela, le développement de tels profils demandent du temps sous des conditions
tectoniques stables (Wyns, 1991). Les instabilités de versants sont donc des sites
expérimentaux qui permettent d’apporter des éléments de réponse sur les mécanismes
de l’altération de roches de socle en accélérant « naturellement » certains paramètres
comme les cinétiques de dissolution (modification de la surface réactive) lors de leur
dégradation par l’infiltration de l’eau dans un milieu fissuré à double perméabilité.
6.2.1 Epikarst-Zone Non Saturée/ Zone Saturée
C’est dans cette optique que se situent les travaux de recherche d’A. Charmoille
réalisé durant son doctorat. Il a couplé le traçage naturel et artificiel pour identifier des
interactions hydrauliques et mécaniques entre la ZNS et la ZS au sein d’aquifères
fracturés carbonatés. Pour cela, il a tout d’abord mis en évidence les relations entre des
zones à perméabilité variable à l’échelle de la fracture sur le site expérimental de
Coaraze. La source qui draine ce petit aquifère est munie d’une vanne qui permet de
faire varier artificiellement la charge hydraulique dans ce massif fissuré. Les relations
hydrauliques entre les discontinuités du massif fissuré ont été caractérisées par les
variations du signal chimique entre les deux zones en fonction au cours des différentes
expérimentations de mise en charge du massif (A11). Les relations ZNS/ZS ont
également été caractérisées à plus vaste échelle sur deux sites dans le Jura, ce qui
permet de comparer la réponse de ces deux karsts soumis au même climat, mais à
alimentation différente : pertes concentrées + infiltration diffuse (Fourbanne),
infiltration exclusivement diffuse (Fertans). Dans les deux cas, les mesures sont
effectuées aux limites, et à l'intérieur du réservoir pour deux cycles étiage-crue-étiage
dans les deux cas et selon le même type d’investigations hydrochimiques. Dans le cas de
Fourbanne, des colorants fluorescents ont été injectés dans la perte afin de suivre le
devenir de l’infiltration concentrée et dans une doline afin de suivre l’infiltration diffuse
au début de l’épisode pluvieux. Le transit dans la ZNS dépend du type d’infiltration. Dans
le cas d’une infiltration diffuse et en période d’étiage, les eaux de la matrice et des
drains ont un signal chimique contrasté, plus minéralisé pour la matrice et plus
superficielle pour les drains. En période de crue, les eaux de la matrice sont un mélange
entre des eaux minéralisées et des eaux superficielles. Au cours de cette période, le
signal chimique des eaux de la matrice et des drains convergent vers des marqueurs de
temps de transit rapide (A14, O1). Au contraire, l’eau qui s’infiltre dans les pertes
transite dans les discontinuités très perméables et son chimisme subit peu de
modifications lors de son transit au travers de la ZNS. L’arrivée de ce volume d’eau dans
la ZS va diluer Au cours de cet épisode, le signal chimique résultant à l’exutoire montre
une participation à l’alimentation plus importante de l’écoulement de la ZNS par les
conduits perméables

54
Les processus d’écoulement sont complexes, à cause du contraste de
perméabilité. Dans les exemples précédents, l’accès à la ZNS de l’aquifère peut se faire
facilement par l’intermédiaire du réseau de conduits karstiques (Fourbanne) ou par
l’implantation d’un forage dans la zone peu perméable de la roche. L’accès est
néanmoins limité dans l’espace et il est sélectif en termes de fonctionnement. Souvent,
les investigations se limitent à la zone très perméable et à la partie supérieure de
l’aquifère. La spatialisation des points de mesures dans les différents compartiments
peut se faire dans les massifs fissurés qui servent d’appuis rocheux à des barrages
hydrauliques comme c’est le cas à Vouglans (Jura). L’implantation d’un tel réseau de
mesure sert à contrôler les fuites destinées à éviter les surpressions dans les appuis du
barrage et donc un endommagement de l’ouvrage. Par ailleurs, dans ce système
aménagé, les circulations d’eau sont contraintes par des variations des conditions aux
limites hydrauliques et mécaniques. Dans le dernier cas, ces variations sont
conditionnées par le niveau d’eau de la retenue, et produisent des augmentations de la
contrainte appliquée sur les appuis de l’ouvrage (poids d’eau) et des augmentations de
la pression de fluide dans le réseau de discontinuités. Ces variations cumulées
conduisent à des modifications sensibles des propriétés hydrauliques des fractures qui
supportent les écoulements au sein du massif. Les zones à contraste de perméabilité ont
pu être définies et corrélées avec des typologies d’eau dans un milieu à faible contraste
lithologique. L’effet saisonnier est bien marqué dans la chimie de l’eau et il a permis de
définir une zone d’influence de l’infiltration des eaux du lac en pied de voute en fonction
de charge hydraulique de la retenue d’eau du barrage (O4, R6, R7, R9).
6.2.2 Socle instable/socle stable
Dans les mouvements de versants rocheux de grande ampleur, les méthodes
hydrogéologiques classiques ne permettent pas toujours d’appréhender la circulation
des fluides dans ces massifs fissurés (problème de métrologie, durée de vie des appareils
de mesures). C’est pourquoi l’hydrochimie est utilisée afin de caractériser l’origine de
l’infiltration et le transit des flux d’eau dans ces versants fissurés (thèses de S. Binet et A.
Vallet). Les analyses chimiques réalisées sur les différents exutoires des différents sites
ont la particularité d’avoir un signal chimique contrasté. Outre les conditions
d’écoulements proprement dites (impact des écoulements préférentiels notamment),
l’interaction eau-matrice et la nature chimique résultante des eaux revêtent
probablement une grande importance dans la dégradation du massif.
La dualité de la perméabilité de matrice par rapport aux fractures des roches du
socle est également lisible dans la chimie de l’eau. Sur les trois sites d’études (Valabres,
Séchilienne, la Clapière). Par exemple, à Valabres, la comparaison du signal chimique
entre des venues d’eau issues d’une fissure drainant le massif sain et celui d’une source
drainant un secteur décomprimé situé dans la même zone permet de discriminer deux
comportements. Le signal tamponné de la galerie s’oppose au signal plus réactif de la
source face à un épisode d’infiltration. Par ailleurs, le fait qu’il n’y ait pas de restitution
du signal de molécules carbonées associées à un non retour des valeurs initiales de la
conductivité électrique trois mois après l’épisode de pluie traduisent une infiltration

55
diffuse à travers les fissures du massif sain ainsi qu’une dilution durable de ce signal.
(A13).
A Séchilienne, deux faciès chimiques traduisent des écoulements sur la zone
stable et la zone instable du massif. Ces groupes se distinguent essentiellement par les
concentrations en sulfates plus importantes dans la zone instable que dans la zone
stable. Ces fortes concentrations en sulfates peuvent s’expliquer par deux mécanismes
liés à la déformation du versant. La création et/ou la fermeture de fractures et fissures
peuvent conduire à de nouveau chemin d’écoulement sur des zones de pyrites non
altérées (Calmels et al. 2007). La friction et le broyage le long des fractures de zones très
déformées entrainent un rafraichissement des surfaces réactives de la pyrite présentes
dans la roche, augmentant ainsi la vitesse d’altération (A12). Enfin, l’altération de la
pyrite favorise l’altération des silicates (Gaillardet et al. 1999; Dongarrà et al. 2009), d’où
les concentrations plus importantes en calcium et sodium dans les eaux de la zone
instable par rapport à la zone stable. L’acquisition de la minéralisation se fait en grande
partie avec l’interaction des minéraux du socle et les sulfates sont les marqueurs de la
zone instable. La variabilité de minéralisation des différents points de mesures sur la
zone instable provient de l’hétérogénéité du milieu (distribution des minéraux au sein
du socle et fracturation). La minéralisation des sources du versant stable traduit une
altération en condition normale de la roche (A18). Une analyse détaillée des variations
de la conductivité électrique sur deux années hydrologiques met en évidence l’influence
de la recharge dans la zone instable, traduisant un milieu réactif contrairement à la zone
stable ou le milieu est plus inertiel. Par ailleurs, le suivi temporel à haute fréquence
améliore la compréhension des écoulements proposé lors des études précédentes où
l’enrichissement des sulfates était attribué à une venue d’eau d’un synclinal triassique
au-dessus de l’instabilité. L’hypothèse actuelle attribue les variations de concentrations
en sulfates à des mécanismes d’altération différents entre les deux secteurs.
A la Clapière, la concentration en sulfates des eaux a également été identifiée
comme étant un traceur chimique de la dissolution de minéraux sulfureux présents dans
le gneiss qui est fissuré et de gypse du Trias (A2, A12). Effectivement, une grande
variabilité des concentrations en sulfates est observée depuis les sources du haut du
glissement par rapport aux concentrations en sulfates des sources du bas du glissement.
Les différentes concentrations de sulfates résultent de différents chemins d’infiltration
et reflètent également une différence dans les temps de transfert liée à une anisotropie
du matériel géologique entre le sommet et la partie centrale du terrain étudié (A3, A4).
Différentes simulations hydromécaniques (A4), expérimentales par injection d’un grand
volume d’eau suivi par traçage artificiel couplé à des investigations hydrogéophysiques
(A4, A10) ont également permis d’identifier la localisation et la quantité d’eau infiltrée
et leurs effets sur l’instabilité du versant de La Clapière notamment Le rôle des surface
de glissement dans la stabilité du massif. Ces surfaces jouent un rôle d’une discontinuité
pour l’écoulement, par l’augmentation conséquente de la porosité et de la perméabilité
qui a été mesurée lors de l’injection d’un volume d’eau, et draine cette arrivée d’eau
sous le glissement favorisant ainsi la stabilité du massif.
56
7 MOUVEMENTS DE FLUIDES ET MODELISATION GEOCHIMIQUE
Les interactions eau-roche sont régies par des lois à fondement
thermodynamique et cinétique. Dans un système eau-roche, la thermodynamique
permet de calculer si une transformation conduit à une diminution de l'énergie libre de
l'ensemble du système considéré. Si tel est le cas, alors la transformation a tendance à
se produire. Par exemple, si une solution est sous-saturée par rapport à un minéral,
alors celui-ci a tendance à se dissoudre jusqu'à ce que la solution devienne saturée par
rapport au minéral considéré, ce qui définit un nouvel état d'équilibre
thermodynamique. La saturation d’un système correspond au rapport du produit
ionique d’activité et de la constante d’équilibre relatifs à la réaction de dissociation de
chaque minéral. Cependant, la thermodynamique ne s'intéresse qu'à la différence
d'énergie entre l'état initial (le minéral sous-saturé au contact de la solution) et l'état
final (la solution saturée par rapport au minéral considéré). Elle ne renseigne en rien sur
le mécanisme de la réaction qui permet de passer de l'état initial à l'état final, ni sur le
temps nécessaire pour que ce mécanisme soit exécuté. C'est précisément l'objet de
l'étude de la cinétique des réactions chimiques dont la théorie de l'état transitoire
constitue une application aux réactions entre fluides et minéraux (Aagaard et Helgeson,
1977 ; 1982 ; Lasaga, 1981). Lasaga (1984) établit la loi cinétique suivante :
Eq. (1)
A température constante et pour un minéral donné (constante cinétique km
(mol.m-2.s-1 fixée) dans un système eau-roche déterminé (la surface spécifique du
minéral Sp en m², est connue), la vitesse de dissolution d'un minéral M ne dépend que
de la valeur du rapport entre le produit ionique d'activité (Qm) et la constante
thermodynamique d'équilibre (Km) relatifs à la réaction du minéral considéré avec la
solution. La vitesse de dissolution d'un minéral est positive si et seulement si le rapport
Q/K est inférieur à l'unité et un minéral se dissout d'autant plus vite que la valeur de ce
rapport est faible. L'estimation des vitesses de dissolution des minéraux permet de
calculer les flux d'éléments de la roche vers la solution.
Suivant le milieu, la loi cinétique générale de dissolution de l’équation (1)
devient :
Eq. (2)
Eq. (3)
Eq. (4)
Avec kt la vitesse de réaction selon que le milieu soit acide, neutre ou basique, km la constante de vitesse selon le milieu, n l’ordre de la réaction. L’équation (4) est
modifiée pour les minéraux carbonatés, l’activité des protons est remplacée par la
pression partielle de CO2. La vitesse totale de réaction est alors la somme des vitesses

57
selon les trois milieux. Le terme représente l’écart par rapport à l’équilibre
thermodynamique, où lorsque celui-ci est atteint, le minéral ne peut ni se dissoudre ni
précipiter. Les vitesses de dissolution diminuent rapidement en fonction de la
minéralisation de l’eau, pour être nulle à l’équilibre thermodynamique (Mayer et al.,
2002).
7.1 Les modèles géochimiques : de l’expérimental en laboratoire au terrain
Le développement de modèles géochimiques depuis années 1980, ont pour but
d’aider à la compréhension des processus géochimiques et de les interpréter. Deux
types de modélisation ont été développés : la modélisation inverse et la modélisation
prospective. Dans le premier cas, la modélisation est utilisée pour expliquer l’évolution
des compositions chimiques ou isotopiques des eaux de sources plutôt que de prévoir
leur composition future (Plummer et al., 1983 ; Plummer 1984). La modélisation inverse
permet de calculer les transferts de masse lors de l'interaction eau-roche (dissolution,
précipitation et dégazage) qui expliquent la différence de composition entre l'eau
initiale et finale sans forcément connaitre le trajet souterrain de l’eau. Elle est souvent
une étape dans la détermination des processus géochimiques et l’estimation des
paramètres à introduire pour des modélisations géochimiques plus complexes (Marini et
al., 2000 ; Dai and Samper, 2006). La modélisation prospective quant à elle, a surtout été
développée pour prévoir l’évolution d’un système eau-roche dans le cadre de stockage
soit de déchets nucléaires (Trotignon et al., 1999), soit de CO2 (Auqué et al., 2009+
références incluses). Les modèles géochimiques ont fait leur preuve pour comprendre
les réactions géochimiques le long de trajets d’écoulement à une échelle régionale
(Plummer et al., 1990). Enfin l’utilisation de modèle géochimique peut être utilisé pour
évaluer les connexions hydrauliques des aquifères (Lu et al., 2008).
7.1.1 Calage des paramètres des modèles
L’utilisation de ces modèles cinétiques a nécessité l’acquisition de nombreux
paramètres qui ont conduit à des études en laboratoire. C’est le cas, de nombreuses
études expérimentales qui ont conduit à la détermination des vitesses de dissolution des
minéraux silicatés et carbonatés (White and Brantley, 1995 ; Brantley et al., 2008 et les
références citées dans ces articles). Palandri et Kharaka (2004) ont synthétisé l’ensemble
des constantes cinétiques en fonction du milieu considéré (acide, neutre ou basique).
Les mesures expérimentales des vitesses de dissolution de nombreux minéraux sont
systématiquement plus rapide de plusieurs ordre de grandeur que ceux observés sur le
terrain (White and Brantley, 2003 ; Maher et al., 2004). Par exemple, les cinétiques de
dissolution de carbonates et d’oxydes de manganèse ont été calculées à partir de
données de terrain. Ces valeurs sont nettement plus faibles de trois ordres de grandeurs
que celles mesurées en laboratoire (Brown and Glynn, 2003). Plusieurs raisons sont
évoquées pour expliquer ces différences. Les expériences ne reproduisent pas le terrain,
car il est impossible de reproduire toutes les conditions physico-chimiques entre le
laboratoire et le système naturel (Steefel et al., 2005). Parmi les facteurs invoqués qui

58
contribue à la différence de résultat entre les deux approches, l’estimation des surfaces
réactives est la plus citée. La surface réactive est souvent calculée à partir de
considérations géométriques des dimensions des grains (Murphy and Helgeson, 1989 ;
Santamarina et al., 2002) ou par des mesures de surface spécifique par adsorption d'un
gaz ((Méthode Brunauer, Emett et Teller dite BET) (Hodson, 2006). De nombreuses
discussions sont se focalisent autour des différences entre les deux méthodes de
détermination de ces surfaces réactives (Brantley and Mellott, 2000, Lüttge, 2005). Dans
des milieux consolidés, s’ajoute la difficulté de quantifier la surface réactive pour un
matériel minéralogiquement hétérogène et partiellement cimenté. Dans ces cas, il est
généralement admis que la surface réactive des minéraux dans un milieu consolidé est
beaucoup plus faible que celles estimées par une géométrie sphérique ou rugueuse des
minéraux. Cette surface peut être réduite d’un facteur 100 si l’on tient compte de
l’enrobage des minéraux masquant les surfaces fraiches (Zerai el al., 2006, Xu et al.,
2007, Scislewski and Zuddas, 2010) et jusqu’à 1000 si l’on tient compte de la différence
entre la surface totale et la surface réactive (Gaus et al., 2005). La surface réactive peut
également être investiguée par imagerie et ainsi permet de quantifier la surface des
minéraux réellement accessible au fluide qui représente un tiers à un cinquième de la
surface totale en fonction de la porosité du grès (Peters, 2009). La surface spécifique
peut être également déterminée à partir de la chimie de l’eau lors d’expériences de
dissolution en partant du fait que la composition chimique de l’eau dépend du rapport
entre la surface réactive de la roche et le volume d’eau qui réagit avec la roche (R3). La
corrélation entre la concentration de la silice à l’état stationnaire dans les expériences
de dissolution de basalte ou verre basaltique en système fermé avec le rapport masse
de la roche/volume de solution (M/V) permet de déduire une surface réactive pour le
milieu basalte/eau de mer de l’atoll de Mururoa. Les différentes méthodes
d’investigations (chimique, BET et traitement d’image) mettent en évidence de très
fortes variations allant de 0,06 à 0,7 m2/l (par analyse de la dissolution) à 103 à 5 105
m2/l (par mesure par BET) et 50 à 200 m2/l (par traitement d’image). Les mesures
obtenues par BET traduisent en fait le degré d’altération de la roche (présence d’argiles)
plus que la surface des minéraux qui réagit effectivement lors des interactions, alors que
par traitement d’image seul le front d’altération du verre a été pris en compte (C14,
C15).
Enfin, l’utilisation de ces modèles a également nécessité des calages entre
résultats expérimentaux et théoriques. C’est le cas des travaux réalisés dans des roches
poreuses ou les résultats de l’expérimentation de l’interaction fluide-grès montrent que
les transferts de matière entre le fluide et la roche sont importants pour le fluide. C'est
en analysant l'évolution chimique du fluide réactant que l'on peut voir la trace
immédiate de l'altération du grès. Un état stationnaire de dissolution s'établit en
quelques heures. Par ailleurs, les méthodes pétrographiques et les mesures
pétrophysiques permettent quant à elles la mise en évidence de la modification des
paramètres physiques de la roche initiale. Les lieux préférentiels de dissolution ont été
visualisés. Ils se situent aussi bien à la surface des minéraux qu’au contact des grains de
la roche. Les simulations thermodynamiques et cinétiques prévoient la néoformation

59
possible de kaolinite et d'une smectite magnésienne et ceci au bout d'un temps
d'interaction très court (10 minutes). Or, l'analyse des effets de la percolation n'a pas
permis de mettre en évidence la néoformation de ces minéraux argileux malgré les
différentes méthodes d'investigations (RX, MEB, MET et microsonde électronique). Les
précipitations sont probablement très lentes dans l'expérience. Les effets de la
précipitation de ces minéraux néoformés dans la roche, notamment sur la porosité ainsi
que sur les transferts qui en dépendent seront significatifs à plus long terme (A1, B1,
B2).
Les tests de lixiviation sur les régolithes marneux collectés sur le terrain ont pour
but de valider un modèle géochimique transposable ensuite sur les données
hydrochimiques in situ. Les interactions entre l’eau distillée et la roche broyée ont été
réalisées avec un rapport eau-roche identique pour la même durée ce qui permet de
comparer les résultats d’un échantillon à l’autre. Le protocole suivi est celui de Hageman
(2007). L’objectif de la modélisation sur les lixiviats était de confirmer les processus
d’interaction eau-matrice évoqués précédemment et caler l’outil pour la simulation des
processus in situ. La modélisation a été réalisée avec le modèle PHREEQCI 2.17.4799
(Parkhurst and Appelo, 1999) associé à la base de données thermodynamique LLNL. Les
simulations ont été conduites en mode cinétique (prise en compte de la vitesse de
dissolution des minéraux). Plusieurs paramètres demeurent mal connus et ont fait
l’objet d’une procédure de calage. Il s’agit d’une part des proportions réelles des
éléments appartement aux autres phases dans l’analyse minéralogique (gypse, dolomite
et pyrite principalement) et d’autre part de la surface spécifique réactive des minéraux
principaux. Des simulations ont donc été conduites en faisant varier la proportion de
pyrite de 0,1 % à 2 %. Cette gamme semble raisonnable dans la mesure où, si l’on retire
les argiles, la proportion des minéraux des autres phases ne doit pas dépasser 5 % selon
l’analyse minéralogique. Pour le calcul de la surface réactive des minéraux, le modèle
utilisé est celui de Murphy and Helgeson (1989) qui suppose une forme sphérique du
grain. Cette estimation de Sp est évidemment entachée d’une erreur importante. Par
ailleurs, la modification de Sp dans le modèle est une autre manière de moduler la
proportion réelle des différents minéraux, ce qui doit témoigner surtout de la variabilité
naturelle de la composition du régolithe. En conséquence, la modélisation a été tentée
en faisant varier les surfaces réactives de la calcite et de la dolomite dans de larges
gammes. Finalement, les résultats les plus cohérents se trouvent situés dans des
gammes plus resserrées : entre 10 à 30 % de la Sp initiale pour la calcite et entre 50 % et
150 % de la Sp initiale pour la dolomite. Cette situation doit exister pour tous les
minéraux mais elle est plus sensible sur le résultat pour les minéraux les plus solubles.
De nombreuses simulations ont été entreprises et comparées entre elles avec un critère
de qualité quantifiant l’écart entre l’observation et la simulation (A17, CN14)
7.1.2 Stratégie de modélisation
Les modèles géochimiques décrivent les transferts de matières dans les systèmes
eau-roche, en mettant d'abord en œuvre les lois classiques de la thermodynamique. Il
s'agit alors de considérer ce système eau-roche comme un système thermodynamique

60
composé d'un assemblage de constituants: les minéraux des roches et les espèces
chimiques en solution. A température constante, les réactions chimiques qui se
produisent spontanément entre les constituants du système eau-roche conduisent à
une diminution de l'enthalpie libre de ce système thermodynamique. Les lois cinétiques
classiques, intégrées au code de calcul, décrivent les vitesses de dissolution et de
précipitation des minéraux et permettent de donner l'échelle de temps sur laquelle le
système eau-roche évolue vers un nouvel équilibre thermodynamique. L’utilisation des
modèles géochimiques permettent de déterminer les mécanismes qui régissent
l’acquisition de l’eau au contact des minéraux des milieux fissurés (Fig. 6). Pour cela, la
composition minéralogique initiale de la roche est introduite dans le modèle. La
minéralogie est déduite d’analyse des RX sur la roche broyée De ce fait, les
néoformations présentes sur la surface des fractures sont «diluées» par rapport aux
minéraux primaires qui constituent la matrice de la roche. L’analyse de la roche en lame
mince permet d’identifier les phases secondaires qui seront autorisées à précipiter dans
la simulation. Les minéraux primaires introduits dans le modèle se dissolvent au contact
d’une eau initiale qui diffère selon les tests réalisés (eau de pluie, eau de source ou
mélange entre les deux). Les paramètres physiques de l’eau initiale sont représentatifs
des conditions de surface (oxydant et proche de la neutralité). Selon le mode de la
simulation, les paramètres d’entrée sont soit une quantité de minéraux proportionnelle
à leur abondance au sein de la roche (mode thermodynamique) soit des coefficients
cinétiques propres à chaque minéral ainsi que leur surface de contact, ou surface
spécifique, avec le fluide (en mode cinétique).
Plusieurs stratégies de modélisation ont été développées en fonction des
caractéristiques propres à chaque site.
A Vouglans, seul un diagnostic de l’état de saturation des eaux par rapport à la
calcite et à la dolomite a été mis en œuvre afin de caractériser les zones à fort pouvoir
colmatant dans le massif.
A la Clapière, le modèle KINDIS (Madé et al., 1990) basé sur des lois
thermodynamique et cinétique a été utilisé afin d’expliquer la variation de la
composition chimique des sources étagées du site. Un temps de transit relatif des eaux
dans le massif été estimé par comparaison des transferts de matière théoriques et de la
charge dissoute de la chimie des eaux de sources. Une modélisation inverse a permis de
déterminer l’origine des sulfates issue de la dissolution du gypse ou de celle de la pyrite.
A Séchilienne, une modélisation inverse est réalisée à partir de la composition
minéralogique du micaschiste et d’une eau de pluie dont la composition moyenne
reflète des eaux de pluie des Alpes (Atteia, 1994), afin de caractériser les phases
minéralogiques qui sont susceptibles d’expliquer la chimie des sources des versants
stable et instable lors des processus d’interaction eau-roche, d’estimer les transferts de
masse et de confirmer les hypothèses d’écoulements faites à partir des tests de traçage.
Les résultats de ces simulations ont guidé le choix des paramètres d’entrée de la
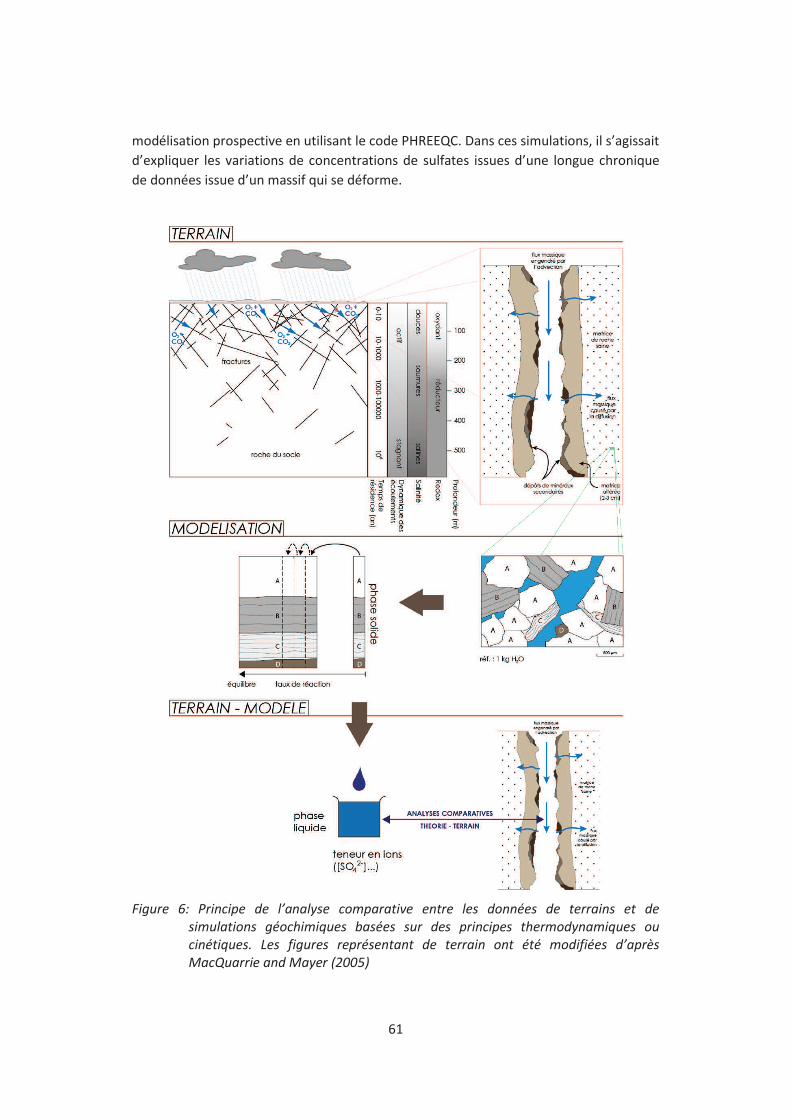
61
modélisation prospective en utilisant le code PHREEQC. Dans ces simulations, il s’agissait
d’expliquer les variations de concentrations de sulfates issues d’une longue chronique
de données issue d’un massif qui se déforme.
Figure 6: Principe de l’analyse comparative entre les données de terrains et de
simulations géochimiques basées sur des principes thermodynamiques ou
cinétiques. Les figures représentant de terrain ont été modifiées d’après
MacQuarrie and Mayer (2005)
62
A Super Sauze, la méthodologie développée, afin de simuler au mieux les
interactions eau-roche a été dans un premier temps de caler le modèle sur des données
expérimentales acquises en laboratoire. Dans un deuxième temps, les paramètres
initiaux du modèles ont été modifiés jusqu’à trouver une solution satisfaisante qui
explique les concentrations mesurées sur le terrain. Le choix de travailler sur ce site, qui
n’appartient pas à la catégorie des « aquifères fissurés » résulte d’une collaboration
avec F. Cervi, en contrat post doctoral que j’ai co-encadré avec mes collègues d’Avignon.
La compréhension des écoulements dans ce régolithe marneux instable a été couplée à
une étude hydrochimique. Cette étude a mis en évidence une très grande variation
spatiale de la composition chimique dans cette structure. La question posée est de
savoir si l’interaction de l’eau de pluie qui recharge la coulée avec les minéraux de la
roche peut expliquer la chimie de l’eau prélevée dans la zone superficielle fracturée de
l’aquifère
7.2 Apport de la modélisation à la compréhension des écoulements
7.2.1 Ecoulement et colmatage (R6, R7, R9)
Parmi les pathologies observées sur certains ouvrages, les irréversibilités
piézométriques dans les fondations rocheuses sont à classer parmi les plus mal connues.
La remontée de la piézométrie, associées ou non à une baisse progressive du débit
global de drainage, sont en général attribuées soit à un « colmatage » du massif de
fondation à l’aval de l’ouvrage, soit à une diminution de l’efficacité du dispositif
d’étanchéité de la fondation à l’amont de l’ouvrage En altérant les systèmes de
drainage, ces colmatages induisent localement des montées de la piézométrie qui sont
susceptibles de menacer la sécurité de l’ouvrage. Les mécanismes à l’origine du
colmatage des appuis rocheux du barrage de Vouglans ont été déterminés à partir de la
modélisation des états d’équilibre. Le résultat majeur est que dès leur entrée dans le
massif rocheux depuis le lac, les eaux sont sursaturées par rapport à la calcite et sont
donc susceptibles de précipiter. Dans le massif, les interactions avec la roche font que
les eaux sont proches de l’équilibre par rapport à la dolomite dans certains secteurs. En
précipitant, les dépôts de calcite colmatent les appuis et maintiennent l’état de pseudo
équilibre avec la dolomie. La cause principale des précipitations est un réajustement
dans l’eau de la pression partielle de gaz carbonique à la pression atmosphérique. Ce
mécanisme se produit dans la zone d’influence des drains, soit par simple variation de
pression partielle de CO2 de l’eau qui passe d’une valeur forte dans les fissures très
fermées de la roche à une valeur plus faible dans les fissures plus ouvertes et le cylindre
très large du drain, soit par dégazage à l’interface zone saturée/zone non saturée qui,
pour un drain dirigé vers le haut peut se situer en limite entre le drain et la roche
encaissante ou même en partie dans le rocher.
7.2.2 Mécanisme d’acquisition de la chimie de l’eau ;
Les analyses chimiques réalisées sur les différents exutoires des différents sites
ont la particularité d’avoir un signal chimique contrasté. Les signaux chimiques les plus
63
contrastés sont ceux mesurés sur les sites de la Clapière et de Super Sauze. Outre les
conditions d’écoulement proprement dites (impact des écoulements préférentiels
notamment), l’interaction eau-matrice et la nature chimique résultante des eaux
revêtent une grande importance. L’hydrogéochimie et la géochimie permettent de
renseigner indirectement sur l’écoulement des nappes dans le versant et directement
sur l’altération des roches.
Exemple du glissement marneux de Super Sauze (O4)
Dans les problèmes d’instabilités de versant à contrôle hydrologique, les
questions de l’origine de l’eau et les modalités de la recharge sont primordiales. Sur le
glissement de Super-Sauze, la recharge locale par la pluie ou la fonte des neiges ainsi
que les mécanismes d’infiltrations préférentielles ont été bien identifiés et décrits
(Malet et al., 2005 ; Debieche et al., 2011 ; Krzeminska et al., 2012). Cependant des
investigations hydrochimiques (A9) et de nouvelles approches de modélisation
(Travelletti, 2011) ont montré que les processus de recharge devaient probablement
intégrer d’autres sources d’eau. Comme pour les eaux issues des lixiviations, le modèle
PhreeqC a été utilisé pour simuler les interactions eau de pluie- marnes afin de
reproduire les conditions in-situ. Les résultats de cette première simulation indique que
le modèle sous-estime la concentration en magnésium mesurée et surestime
grandement la concentration en calcium. Le modèle a ensuite été appliqué en
respectant les données obtenues avec les simulations sur les lixiviats. Le résultat de
cette simulation converge avec celui obtenu avec les lixiviats et valide ainsi, le choix des
paramètres du modèle (proportions respectives en pyrite, calcite, dolomite), mais des
divergences existent encore entre les eaux simulées et les eaux de nappe. Par contre, il
prouve que l’utilisation des données géochimiques et minéralogiques du laboratoire
conduit à surestimer l’intensité des interactions eau-roche car une partie seulement des
minéraux est accessible à l’altération. Afin d’améliorer la simulation, un troisième
groupe de tests a été réalisé en modifiant la nature de l’eau initiale mais en introduisant
une composition d’une eau plus riche en sodium, issue d’une source marneuse à
l’amont du glissement. Cette source draine une partie du massif situé au-dessus du
glissement. Elle sort au sein d’une zone marneuse stable (probablement marne
argovienne) mais le massif dans son ensemble comprend des faciès divers, avec
notamment différentes séries de calcaires. La bonne adéquation entre le modèle et
l’observation prouve la diversité de l’origine de la recharge de la nappe du glissement.
Une partie de la recharge pourrait donc provenir de ces niveaux superficiels. Il faut
également noter que, si on reste dans une gamme de paramétrage acceptable et quelles
que soient les hypothèses de travail, le modèle n’a jamais pu simuler les fortes
concentrations en sodium observées sur le terrain, particulièrement dans la partie
amont du glissement. La modélisation montre clairement que la nature du matériau
marneux, tel qu’on le connait sur le glissement, n’est pas en mesure de produire par
altération les concentrations en sodium observées.
Sur le glissement de Super Sauze, l’étude de la variation spatio-temporelle de
l’hydrochimie couplée à la modélisation indique que les eaux ont des origines diverses.

64
L’intervention d’une eau additionnelle profonde révèle une interaction complexe entre
le système hydrogéologique local et superficiel et un système profond régional.
L’analyse des données hydrogéochimiques tend à indiquer que l’origine de l’eau du
système souterrain de Super-Sauze est à rechercher, au moins en partie, au-delà des
limites topographiques du glissement. La forte concentration en sodium à l’amont
pourrait même montrer qu’une origine évaporitique de l’eau de recharge existe par le
lessivage des facies triasiques à la base du klippe de Lan. C’est aussi à la base des séries
allochtones que l’on trouve le Trias et les faciès à l’origine probable d’une forte
concentration des eaux (cargneules, gypse, argilites). Le drainage de ces eaux dans les
séries autochtones est vraisemblablement favorisé par l’existence de faisceaux de failles
méridiennes d’âge Crétacé supérieur ayant rejoué au Pliocène, et recoupant toutes les
unités autochtones dont les Terres Noires. Ce processus complexe est supposé
participer à l’alimentation du glissement dans la partie amont du système. Il se
surimpose à un système hydrogéologique local alimenté par la pluie et la fonte des
neiges sur l’aire d’extension du glissement. L’intervention du système régional profond
est supposé assez continue. Cette arrivée d’eau « par le bas » dans la partie amont joue
probablement un rôle dans la déstabilisation mécanique et l’érosion chimique à la base
du glissement. Les anomalies chimiques et isotopiques rencontrées dans les eaux de la
coulée correspondent d’ailleurs aux secteurs où le glissement est le plus actif (A9, A17,
CN12 ; CN14).
Exemple du glissement de La Clapière
Le site de La Clapière présente une différenciation chimique des eaux, allant
respectivement d’un faciès Ca-Mg-HCO3 depuis le haut du glissement à un faciès Mg-Ca-
SO4 vers le bas. Cela se traduit également par un degré de minéralisation qui augmente
en suivant le même profil. L’analyse de la chimie de l’eau a montré qu’en pied de
glissement les teneurs en sulfates ne pouvaient résulter d’une interaction eau-gneiss par
infiltration directe d’une eau de pluie ou via le fluvio-glaciaire plaqué sur le socle. Afin
d’expliquer ces fortes concentrations, un modèle géochimique d’interaction eau-roche a
été développé (A2). L'acquisition de la chimie de l'eau de source a été testée en fonction
de la composition chimique de deux types d’eau qui sont le signal d’entrée dans le
système (fonte de neige et eau de pluie) et l'abondance des minéraux primaires (quartz,
plagioclase, muscovite, biotite) et des minéraux accessoires (le feldspath, la calcite, la
chlorite et la pyrite). Sur le versant gneissique de La Clapière, les résultats de la
modélisation géochimique montre que les concentrations des sulfates comprises entre 0
à 130 mg/L mesurées dans les sources de la partie supérieure du glissement sont
compatibles avec la dissolution de la pyrite présente dans le gneiss, quelle que soit la
composition de l’eau initiale. Par contre, les concentrations élevées de sulfates (600-800
mg/L) analysées dans les sources de pied de glissement ne peuvent pas être expliquées
par le résultat des simulations. D’un point de vue hydrogéologique, au sommet de la
pente, l’eau souterraine s’écoule directement par gravité dans une zone décomprimée
fissurée suivant différents chemins d’écoulement. L’eau est guidée par des fissures de
retrait formant des crevasses, remplies partiellement de colluvions, créant des drains
65
linéaires fortement perméables. Cette zone surmonte une zone peu comprimée plus en
profondeur (A4). Des aquifères perchés au sein de des matériaux perméables sont
drainés par des sources pérennes localisées dans cette partie du de la pente. Un
aquifère basal est drainé par des sources en bas de pente et au pied du glissement. Les
résultats de la simulation géochimique tendent à impliquer des écoulements de
l’aquifère basal dans une structure non exposée cachée sous la pente. D’après le
contexte géologique local, ces roches ne peuvent être que des gypses triasiques piégés
sous un chevauchement majeur situé au pied du glissement. L’origine de ces sulfates a
été démontrée par une modélisation inverse réalisée par S. Binet dans le cadre de sa
thèse. Les transferts de matière ont été quantifiés et les résultats prouvent que les
sulfates en pied de glissement sont bien issues en grande partie de la dissolution du
gypse, avec un apport initial de sulfates issus de la dissolution de la pyrite acquise lors
du transit des eaux dans le massif (A12).
Par ailleurs, la comparaison entre les charges totales dissoutes (TDS) dans l’eau
mesurées et calculées permet de préciser le type d’infiltration (eau de pluie ou de fonte
de neige) et d’établir un temps de résidence relatif des eaux dans le massif. L’analyse
des chroniques de données des sulfates (marqueur des eaux du réservoir) et des nitrates
(marqueur des eaux d’infiltration) avec la pluviométrie sur trois sources du glissement
affine ces temps de séjour entre 1 à 20 jours (A4).
Exemple de l’instabilité de Séchilienne
Sur Séchilienne, la modélisation inverse permet de vérifier l’influence du transit
de l’eau dans les formations sédimentaires sur les sources qui drainent le versant.
Quatre faciès chimiques ont été mis en évidence, qui provient de trois origines
différentes : les moraines, les roches carbonatées et les micaschistes. Dans le cas des
sources du versant stable, les résultats montrent que les concentrations en magnésium
proviennent à 90% de la dissolution de la dolomite et 10 % de la dissolution de la
phlogopite. 87% du calcium provient de la dissolution de la dolomite et les 14 % restant
de la dissolution de la calcite. Les fortes concentrations en magnésium résultent d’un
transit des eaux dans la couverture sédimentaire. Dans le cas de la zone instable (venue
d’eau dans une fissure de la galerie de reconnaissance), les concentrations en
magnésium proviennent à 37% de la dissolution de la dolomite et 63 % de la dissolution
de la chlorite. 42% du calcium provient de la dissolution de la dolomite et les 58 %
restant de la dissolution de la calcite. Cela montre que la chimie de la zone instable est
également influencée par une eau transitant dans du matériel plus dolomitique (A18).
Une modélisation prospective des interactions eaux-roche de la zone instable a
été réalisée dans le cadre du stage de recherche de master effectué par C. Baudement,
où il s’agissait d’établir une relation entre la déformation du versant et le signal
hydrochimique (CN11). Un modèle hydrogéologique en trois dimensions du versant a
été élaboré à partir du géo-modeleur Gocad. Les failles cartographiées en surface ont
été extrapolées en profondeur et les indices de fracturations relevés dans les galeries
souterraines permettent de recaler l’emplacement de certaines failles. Une analyse des
états de contraintes sur les principales failles de versant permet de déterminer leur

66
tendance au glissement ou à la dilatance. Cette analyse permet de localiser et de
quantifier les surfaces activées de ces plans de failles. Enfin, une analyse de l’altération
géochimique est réalisée à partir d’un modèle cinétique des interactions eau-roche.
L’ajustement de ce modèle aux valeurs de terrain permet de faire des hypothèses sur le
choix des phases minérales qui participent aux interactions. Dans ce cas, le modèle qui
reproduit le mieux les valeurs mesurées est celui où la calcite est à l’équilibre, de la
dolomite a été introduite comme minéral primaire (suivant les résultats de la simulation
inverse), la pCO2 à une valeur nettement supérieure par rapport à la pression
atmosphérique, ce qui laisse supposer une infiltration dans un sol épais. Ces hypothèses
sont cohérentes avec les résultats de la simulation inverse, même si elle suppose une
origine du calcium par la dissolution de la calcite. Cette acquisition peut se faire au cours
de l’infiltration sur une formation sédimentaire (colluvions en remplissage des fissures
comme c’est le cas à la Clapière).
Durant la simulation, les concentrations en sulfates sont contrôlées par la
dissolution de la pyrite. Le modèle arrive à reproduire les concentrations en sulfates
mesurées sur le terrain. Cette altération libère des protons qui vont consommer les
bicarbonates produits par la dissolution des minéraux carbonatés en libérant du CO2 et
H2O. Ceci explique la gamme de pH (entre 7 et 8) mesurée sur les eaux de Séchilienne
malgré la production de protons. Cette succession de réactions chimiques conduit à
l’appauvrissement en ions bicarbonates par rapport au calcium et magnésium, ce qui
explique qu’ils soient équilibrés par les sulfates. L’oxydation de la pyrite conduit au
dépôt d’une couche d’hydroxyde de fer à sa surface, qui atténue son altération au cours
du temps (diminution de la surface d’interaction). Le pH est stable sur toute la
simulation géochimique (pH initial de 6,22 jusqu’à 7,48). Selon les tests, les marges
d’erreur sont acceptables (±15 mg/L SO4 ; ±10 mg/L Ca ; ±5 mg/L Mg ; ±15 mg/L HCO3).
Les concentrations en sulfates analysées d’une première campagne (1996 et 1997) ainsi
que celles d’une deuxième campagne (2010-2012) sont reportées sur la courbe
théorique des sulfates. Ces deux périodes se différencient nettement sur cette courbe.
La première période de temps est caractérisée par une faible interaction eau-roche
(charge dissoute faible), alors que les données de la deuxième campagne présente une
charge dissoute plus importante, résultant d’une interaction plus conséquente. Trois
hypothèses sont émises pour expliquer cette différence dans la mesure où des
paramètres extérieurs au système n’ont pas variés depuis 1996 (Fig. 7).La première
hypothèse est qu’en raison de la dégradation du massif, les failles drainant l’eau se sont
refermées, le temps de contact de l’eau avec la roche a augmenté et la charge dissoute
de la solution augmente en conséquence. Une autre hypothèse est que l’ouverture de
nouvelles fractures augmente le temps de contact de l’eau avec la roche. L’eau
emprunte des chemins différents dans le réseau de fractures et interagit avec de
nouvelles surfaces de contact. Enfin, la dernière hypothèse met en jeu le comportement
cisaillant de la faille qui peut réactiver de nouvelles surfaces. La pyrite fortement altérée
présente une couche d’oxyde. Le cisaillement permet la réactivation de ces surfaces de
contact en les nettoyants et l’eau se minéralise à nouveau.
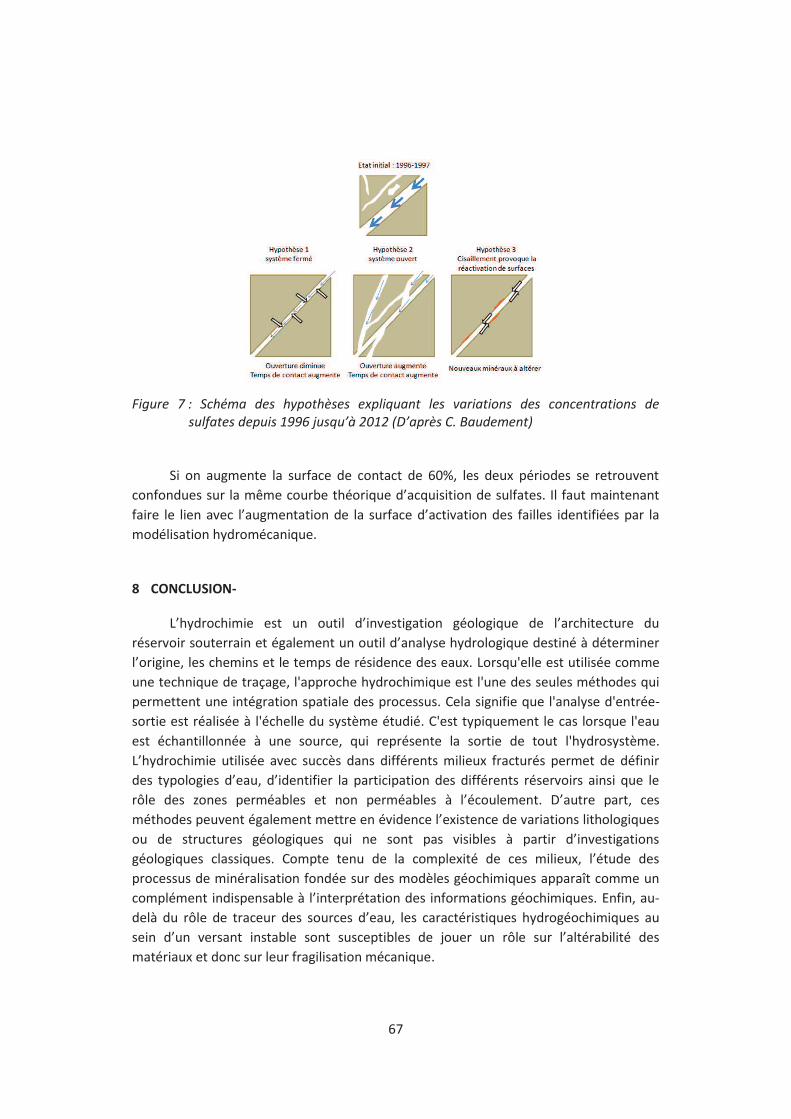
67
Figure 7 : Schéma des hypothèses expliquant les variations des concentrations de
sulfates depuis 1996 jusqu’à 2012 (D’après C. Baudement)
Si on augmente la surface de contact de 60%, les deux périodes se retrouvent
confondues sur la même courbe théorique d’acquisition de sulfates. Il faut maintenant
faire le lien avec l’augmentation de la surface d’activation des failles identifiées par la
modélisation hydromécanique.
8 CONCLUSION-
L’hydrochimie est un outil d’investigation géologique de l’architecture du
réservoir souterrain et également un outil d’analyse hydrologique destiné à déterminer
l’origine, les chemins et le temps de résidence des eaux. Lorsqu'elle est utilisée comme
une technique de traçage, l'approche hydrochimique est l'une des seules méthodes qui
permettent une intégration spatiale des processus. Cela signifie que l'analyse d'entrée-
sortie est réalisée à l'échelle du système étudié. C'est typiquement le cas lorsque l'eau
est échantillonnée à une source, qui représente la sortie de tout l'hydrosystème.
L’hydrochimie utilisée avec succès dans différents milieux fracturés permet de définir
des typologies d’eau, d’identifier la participation des différents réservoirs ainsi que le
rôle des zones perméables et non perméables à l’écoulement. D’autre part, ces
méthodes peuvent également mettre en évidence l’existence de variations lithologiques
ou de structures géologiques qui ne sont pas visibles à partir d’investigations
géologiques classiques. Compte tenu de la complexité de ces milieux, l’étude des
processus de minéralisation fondée sur des modèles géochimiques apparaît comme un
complément indispensable à l’interprétation des informations géochimiques. Enfin, au-
delà du rôle de traceur des sources d’eau, les caractéristiques hydrogéochimiques au
sein d’un versant instable sont susceptibles de jouer un rôle sur l’altérabilité des
matériaux et donc sur leur fragilisation mécanique.
68
L’analyse du signal chimique à l’exutoire de l’aquifère permet une caractérisation
géochimique de l’aquifère dans le temps et dans l’espace. La compréhension de
l’évolution hydrochimique est possible en couplant la mesure hydrodynamique à la
mesure hydrogéochimique. Comprendre les enregistrements des paramètres physico-
chimiques et hydrodynamiques à l’exutoire des aquifères passe avant tout par une
compréhension des liens entre les différents compartiments de ceux-ci (Fig. 8).
Le traçage naturel a permis d’étudier les relations drain-matrice dans le karst
(quantification du stockage), la relation entre phénomènes hydrauliques et
comportement mécanique des fissures d’un massif dans les instabilités de terrain.
Associé à la modélisation géochimique, il a permis la validation de modèles conceptuels
d’écoulement dans les milieux fissurés à double perméabilité.
Tout d’abord, le sol joue un rôle régulateur important dans le temps de transfert
des eaux de recharge, ce compartiment ne doit donc pas être négligé dans les études sur
le fonctionnement des hydrosystèmes. Le processus d’infiltration entre infiltration
diffuse et concentrée) est important dans l’origine des eaux à l’exutoire. Les volumes
d’eau infiltrés de manière diffuse vont être préférentiellement stockés dans les
discontinuités peu perméables de la ZNS. Au contraire, l’eau infiltrée aux pertes va
transiter dans les discontinuités près perméables et subir peu de modifications
chimiques lors de son transit à travers la ZNS. Une fois parvenue dans la ZS, ces eaux
vont se mélanger suivant l’état hydraulique des discontinuités les plus perméables. La
réponse hydrologique du système varie selon le niveau d’eau initial de la nappe.
L'infiltration rapide de l'eau dans les drains semble être un processus principal dans les
périodes de hautes eaux (60% de l’eau de pluie s’infiltre via les conduits), alors qu’en
basse eaux l'eau stockée dans la matrice peut représenter des volumes importants qui
seront chassés des drains par effet piston en début de crue. La participation de l’eau
pré-événementielle varie fortement avec l’intensité de la pluie et de l’état hydrique du
système. En période de basses eaux, il peut y avoir jusqu’à 100% de l’eau pré-
évènementielle drainée par effet piston, sans dilution par l’eau de pluie infiltrée. Au
contraire, en période humide, les écoulements dus à un effet piston sont mineurs par
rapport à l’infiltration rapide des eaux de pluie car seul 20% du volume d’eau des
conduits est de l’eau pré-évènementielle. La différentiation du message chimique
apporté par l'eau en circulation dans les fractures ouvertes du message apporté par
l'eau stockée dans de fines fissures permet également de définir une fonction retard
pour les simulations du transport et de la restitution des éléments polluants.
Enfin, la construction de structures de génie civil entraine des modifications des
écoulements dans la ZNS, notamment par des changements des propriétés hydrauliques
dus à la précipitation de phases secondaires. Selon l’orientation des drains dans le
massif, les dépôts se font dans les secteurs de plus faible vitesse dans le milieu saturé,
soit à l’interface ZS/ZNS dans le milieu non saturé. Il semble qu’il y ait une
correspondance entre les zones à infiltration lente du lac et les zones de colmatage le
plus intense. Inversement, aucune indication sur l’intensité du colmatage des drains
situés dans les zones à infiltration rapide n’a été identifiée
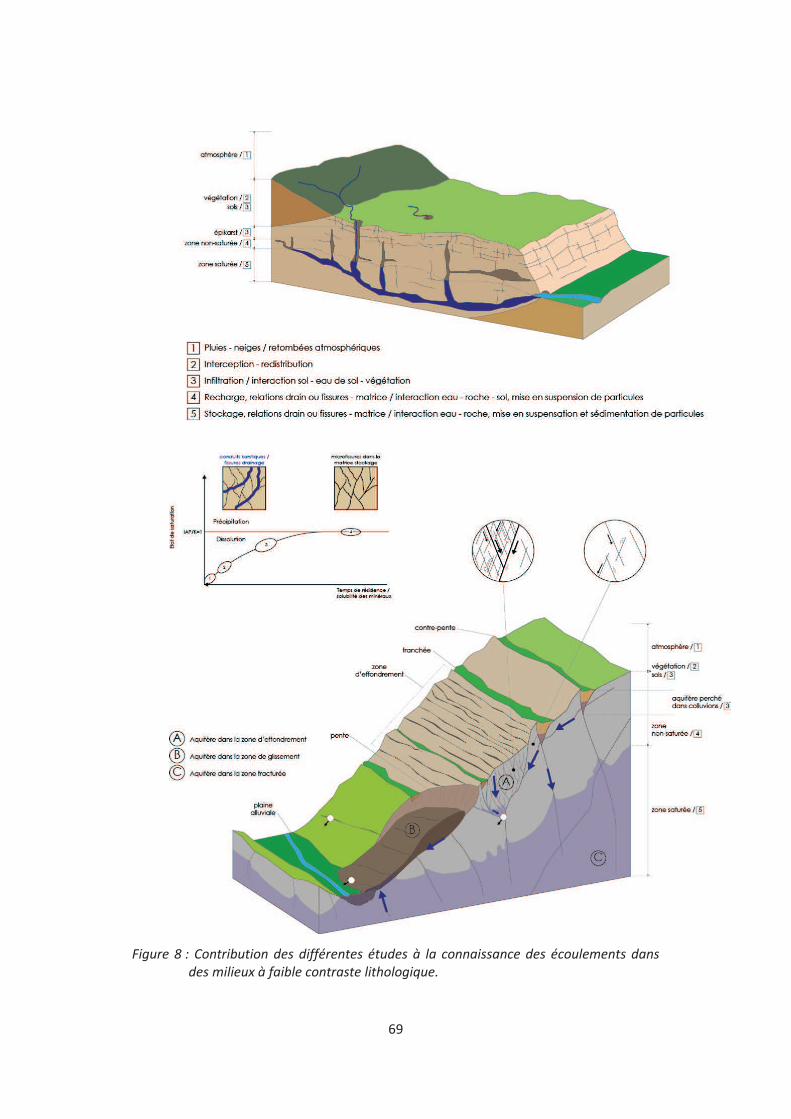
69
Figure 8 : Contribution des différentes études à la connaissance des écoulements dans
des milieux à faible contraste lithologique.
70
L’analyse combinée de traceurs artificiels et naturels permet de discriminer des
zones avec des écoulements préférentiels, réactifs et rapides dans les zones fracturées
contre des écoulements plus diffus, inertiels et lents dans la roche moins fracturée.
Différentes connexions hydrauliques ont été mises en évidence, notamment
l’importance des failles qui jouent le rôle de drains et permet l’écoulement d’eau
infiltrée dans la couverture sédimentaire bien au-delà de l’instabilité. Les surfaces de
glissement à la Clapière, jouent un rôle d’une discontinuité pour l’écoulement, par
l’augmentation conséquente de la porosité et de la perméabilité et draine cette arrivée
d’eau sous le glissement favorisant ainsi la stabilité du massif. Dans les zones non
saturées du milieu sain et peu fracturé, les écoulements se font selon un faible transit et
un faible stockage dans cette zone du massif. Dans les zones décomprimées,
l’écoulement suit deux voies qui correspondent à un réseau de fractures perméables à
faible stockage et un réseau de fractures moins perméables à stockage élevé et à transit
lent. La source naturelle de la zone décomprimée draine donc des milieux à double
perméabilité avec une composante de transit rapide et une composante transit lent qui
est masquée par la première composante.
L’hydrogéochimie et la géochimie permettent de renseigner indirectement sur
l’écoulement des nappes dans le versant et directement sur l’altération des roches. Les
faciès chimiques déterminés traduisent l’origine des écoulements en fonction des
différentes lithologies. La différence de minéralisation donne deux informations selon la
période hydrologique. La variation du signal sur l’année hydrologique indique une
réactivité du milieu lors de la recharge, donc un milieu fissuré bien connecté. Le degré
de minéralisation, résultant des interactions eau-roche est lisible en basse eaux. Ce
degré de minéralisation traduit soit un degré d’altération ou un le temps de séjour plus
ou moins long dans les fissures. La mesure des concentrations en sulfates permet de
localiser dans le temps et dans l’espace l’arrivée des eaux d’infiltration à l’origine des
impulsions mécaniques du versant. Durant la période de faible activité du massif, les
sulfates analysés dans les sources de pied de glissement diminuent en fonction du
temps. Lors de la réactivation du massif, qui créé de nouvelles surfaces réactives, les
concentrations en sulfates augmentent, pour diminuer à nouveau. Ces variations de
sulfates sont expliquées par leur origine, c’est-à-dire l’altération de la pyrite, minéral qui
s’oxyde dans les conditions oxiques de surface. Le même phénomène est observable
dans les massifs fissurés de socle à l’échelle d’une vallée alpine dans lesquels on observe
en plus une réponse différente selon l'état de déformation du réservoir.
Les analyses chimiques réalisées sur les différents exutoires des sites étudiés
résultent de l’interaction eau-matrice et la nature chimique résultante des eaux revêtent
probablement une grande importance dans le processus de dégradation de la roche.
Effectivement, les eaux souterraines ont été très tôt reconnues comme étant des
systèmes à l’équilibre partiel ou à l’état pseudo-stationnaire, c’est-à-dire, où certaines
réactions réversibles sont entraînées par une ou plusieurs réactions irréversibles. Les
eaux naturelles qui semblent être à (ou proche de) l'équilibre avec une phase minérale

71
donnée, selon le calcul de spéciation, peuvent être en fait être sur ou sous-saturées par
rapport à cette même phase minérale, par le jeu d'autres réactions irréversibles. Un des
objectifs futur est de quantifier la détérioration des matériaux en considérant la zone
saine stable comme l’état initial du versant avant tout désordre et la zone mobile
comme l’évolution ultime de celui-ci.
Finalement, la structure des aquifères karstiques se différencient clairement des
aquifères fissurés de socle au niveau de la répartition des écoulements. Néanmoins, les
contrastes de perméabilités ont un effet similaire sur l’écoulement, notamment entre
les échanges entre les zones perméables et les zones peu perméables.
9 MESURES ET OBSERVABLES
9.1 Mesures
La chimie des eaux, est un signal très fin qui permet la localisation dans le temps
et dans l’espace de l’arrivée des eaux d’infiltration à l’exutoire. Elle donne également
des informations globales sur les circulations d’eau à l’échelle de l’aquifère.
L’accès aux différents écoulements dans l’aquifère est également rendu possible
par des accès naturels (conduits karstique) ou anthropiques.
L’accès aux mesures dans un environnement naturel permet un échantillonnage
de l’organisation karstique du milieu et des écoulements hiérarchisés ainsi que des
mesures plus spatiales (échelle du BV) de l’écoulement (Fig. 9).
Figure 9 : Ecoulement en milieu naturel non perturbé
L’accès aux écoulements dans les galeries artificielles permet un échantillonnage
en fonction de la variabilité des unités parce ce que les galeries recoupent de manière
aléatoire les fissures. La mesure plus ponctuelle dans les venues d’eau des fissures
permet d’étudier plus finement les processus, car il y a moins de mélange d’eau (Fig.
10).
Figure 10 : Ecoulement en milieu naturel perturbé

72
Ces mesures sont bien sûr, complémentaires et permettent une meilleure
compréhension des circulations d’eau dans un massif fissuré. Par contre, les galeries
artificielles peuvent modifier les propriétés hydrauliques du réservoir en créant des
gradients hydrauliques plus ou moins forts vers les points de rencontre entre les fissures
et les galeries. Ces modifications hydrauliques peuvent engendrer des modifications du
signal chimique, comme par exemple à Vouglans, où des problèmes de colmatage ont
été rencontrés dans les assises rocheuses du barrage.
L’analyse croisée des données du traçage artificiel et du traçage naturel permet la
discrimination fine des différents types d’eau en fonction de leur origine. Le rôle de
l’infiltration diffuse sur le transit de l’eau par rapport au rôle de l’infiltration concentrée
permet de déterminer des coefficients de retard par rapport à l’infiltration, paramètres
d’entrée à la modélisation hydrodynamique.
Le suivi de la chimie des sources, notamment des éléments majeurs (Ca2+, Mg2+,
K+, Na+, HCO3-, Cl-, SO4
2-, SiO2) couplé à des prélèvements ponctuels (isotopes de l’eau)
permet de renseigner sur la recharge (mécanismes d’écoulement, temps de transit,
inertie du système) ou l’étiage (origine et chemin de l’eau souterraine) du ou des
aquifères. D’autre part, le suivi de traceurs naturels (variable selon les minéraux en
contact avec l’eau) peut également mettre en évidence l’existence de variations
lithologiques ou de structures géologiques qui ne sont pas visibles à partir
d’investigations géologiques classiques.
Les principaux paramètres pertinents de l’étude physico-chimique, calés sur une
étude hydrodynamique fine du système sont :
- les chlorures, nitrates et carbone organique dissous (COD), qui sont de bons
traceurs de l’infiltration et des temps de résidence courts (eau de la zone non saturée).
Les chlorures et nitrates sont des traceurs conservatifs en milieu oxygéné, ils signent les
flux d’eau de lessivage du sol et de l’épikarst. Le COD est un traceur naturel dont la
teneur décroît avec le temps (minéralisation). Originaire de l'activité biologique dans les
sols, sa teneur trace le temps de séjour de l’eau dans le système.
- Le magnésium, le strontium, le calcium, le carbone-13 et la silice sont des
traceurs des séjours plus longs de l’eau, particulièrement dans les réserves noyées. Avec
des cinétiques de dissolution différentes, les alcalino-terreux, par leurs rapports
respectifs (Mg/Ca, Sr/Ca) permettent de différencier, dans un même aquifère, les eaux
d’infiltration des eaux de réserve. Le carbone-13, isotope stable dont l’abondance dans
les eaux des systèmes carbonatés (-11 ‰) est une teneur intermédiaire entre celle de la
pédosphère (-22 ‰) et celle des carbonates marins (0 ‰ par définition) s’échange, au
cours des temps de séjour longs, avec le carbone des carbonates. Sa teneur évolue alors
vers des valeurs moins négatives. En outre, si l’eau est en contact avec le CO2
pédogénique (milieu ouvert de l’épikarst) l’échange isotopique l’appauvrit en 13C. Cet
écart avec les valeurs initiales est utilisable comme traceur du temps de séjour de l’eau
dans l’aquifère. Moins l’échantillon est négatif, plus il aura séjourné longtemps dans
l’hydrosystème.
73
- Les sulfates sont des traceurs conservatifs en milieu oxique, de l’infiltration. Ils
signent les flux d’eau en contact avec les évaporites ou en contact avec des minéraux
sulfureux, essentiellement la pyrite dans les roches de socle. Par contre, les variations de
concentration en sulfates dans l’eau transitant dans les fractures, peuvent être un
indicateur de la dégradation des versants instables. La variation temporelle des
concentrations de ces ions est dépendante de deux facteurs principaux : les conditions
de circulation en milieu perméable qui favorise l’infiltration directe et l’interaction
chimique eau-la roche. Les variations de ces concentrations en sulfates sont expliquées
par l’altération de la pyrite : les pics des concentrations en sulfates sont dus à la
réactivation de nouvelles surfaces minérales lors du déplacement du versant instable qui
génère un endommagement de la roche. La diminution de ces concentrations est due au
mécanisme même de l’altération de ce minéral : une couche d’oxyde de fer se forme à la
surface lors de l’altération, isolant de l’eau les surfaces de la pyrite.
9.2 Observables
L’objectif d’un observatoire est de fournir des mesures qui permettent :
- de caractériser à diverses échelles l’hydrodynamique des aquifères fissurés sous
l’action de forçage climatiques et anthropiques,
- de modéliser les processus,
- d’extraire des observations, de signaux caractérisant un changement de régime,
L'Observatoire Multidisciplinaires des Instabilités de Versants (OMIV) surveille
quatre sites glissements de terrain qui sont représentatifs des mécanismes impliqués
dans les Alpes françaises (roche dure / roche peu consolidée, mouvement lent/rapide
des pentes). Depuis 2007, l'OMIV est un SO INSU. Sur chacun des sites, l'OMIV fournit en
continu des enregistrements en libre accès de la cinématique des glissements de terrain,
la réponse sismique, et, depuis peu, les caractéristiques hydrogéochimiques des fluides
circulant dans le massif. Néanmoins les observations, interprétations et modélisations
développées sont dans un état d’avancement différent selon les sites étudiés, ce qui
requiert à présent un suivi en continu des paramètres hydrogéochimiques selon des
protocoles de prélèvement et d’analyses adaptés. Ces observations doivent permettre
notamment de lever les verrous scientifiques suivants :
- quelles sont les origines (surface, profondeur) des flux d’eau et de matière
transitant au sein ou à proximité de la masse instable ? ;
- quels sont les temps de résidence de ces eaux dans les aquifères ; peut-on
quantifier des flux ? ;
- peut-on identifier des seuils de paramètres hydrogéologiques qui contrôlent un
changement d’état ou de régime dynamique de la masse instable ? ;
74
- existe-il des signatures chimiques spécifiques à des compartiments de
glissements caractérisés par des cinématiques différentes, et les variations dans ces
signatures pourraient-elles être utilisées comme précurseurs de la rupture ? ;
- comment s’organise la relation complexe entre altération chimique,
modifications hydrodynamiques et fragilisation/mouvements du matériau ? ;
- quelles sont les conséquences des mouvements de terrain sur la chimie des eaux
?
L’établissement de chroniques de données (chimie, débit, température et
conductivité de l’eau, évolution du couvert végétal) en fonction des conditions
météorologiques, doit permettre d’approfondir la réflexion menée sur la caractérisation
des écoulements souterrains ou sur les déplacements mesurés sur les sites instables en
fonction des conditions hydrologiques rencontrées. Par exemple, l’utilisation de la
mesure en continu de la chimie des eaux peut servir comme outil préventif d’un
déplacement important lors de changements climatiques.
Les suivis chimiques mis en place par le laboratoire d’hydrogéologie de l’UMR
Chrono-Environnement depuis 1998 sur Séchilienne, et qui s’inscrivent maintenant dans
le cadre de l’OMIV ont permis dans les deux cas de relier le signal chimique, notamment
les concentrations en sulfates à la déformation. Néanmoins, il se pose le problème de
l’acquisition en continu de ce paramètre ou de n’importe quel autre paramètre
chimique corrélable aux mécanismes qui dirigent les mouvements gravitaires. En effet, à
l’heure actuelle, il n’existe pas d’appareil qui permette une acquisition en continu et
avec une bonne résolution de paramètres chimiques. La conductivité mesurée est en
partie expliquée par la concentration en sulfates. La conductivité électrique est
représentative du signal chimique engendré par la dégradation du massif. L’acquisition
en continu de ce paramètre est pertinente pour le site de Séchilienne et peut se
substituer au suivi chimique à partir du moment où le lien est établi entre conductivité-
éléments chimiques-origine des éléments chimiques. L’avantage de l’acquisition de
cette donnée est triple, ce qui peut en faire un outil pour la gestion du risque: mesures
en temps réel, avec un pas de temps très fin et mise en œuvre peu coûteuse (05, CN12,
CN13).
Définition des protocoles pour les sites d’observatoire de l’OMIV
En raison de l’hétérogénéité des milieux étudiés (matériaux remaniés et en
mouvement, comportement rhéologique complexe, matériaux à faible perméabilité de
pores, etc) et de difficultés métrologiques et expérimentales associées, il est difficile de
mettre en place le même type de suivi hydrochimique sur tous les sites.
Le Tableau 4 synthétise l’ensemble des paramètres hydrogéochimiques suivis sur
les sites du SNO-OMIV

75
Tableau 4 : Analyses hydrochimiques réalisées sur les différents sites du SNO-OMIV
Glissements visqueux Versants rocheux
Super-Sauze Avignonet La Clapière Séchilienne
Nombre de campagnes
d’échantillonnage par an 4 1 3 3
Type de prélèvement
Piézomètres
(prélèvements manuels +
collecteur automatique
sur courtes périodes)
Sources +
piézomètres
(prélèvements
manuels)
Source
(1 collecteur automatique
+ prélèvements manuels)
Sources
(2 collecteurs automatiques
+prélèvements manuels)
Nombre d’échantillons par an 20 7-8 50 91
Type d’analyses chimiques par
échantillon
Majeurs (anions et
cations), silice totale
Majeurs,
Traces
Majeurs (anions et
cations), Silice totale
Majeurs (anions et cations),
silice totale
Mesures physique en continu Cond électrique, Temp Cond électrique, temp. Cond électrique, Temp
Mesures physiques ponctuelles Cond électrique, temp,
pH
Cond
électrique,
Temp, pH
Cond électrique, temp, pH Cond électrique, temp, pH
Il en ressort des modes d’instrumentations différents selon les sites qui sont
décrits dans le paragraphe suivant.
Instrumentation sur instabilités visqueuses
Super-Sauze
Aucune source n’étant visible sur le glissement-coulée de Super-Sauze, l’étude
hydrochimique s’appuie sur l’analyse de l’eau d’une batterie de piézomètres répartis sur
l’ensemble du glissement. Le réseau de surveillance piézométrique installé en juin 1996
comportait au départ 30 piézomètres; certains sont encore en place mais un grand
nombre d’entre eux a été cisaillé lors des déplacements du glissement ce qui rend
difficile un suivi régulier et dans des conditions analogues d’une campagne sur l’autre.
Les prélèvements se font par des campagnes d’échantillonnage 4 fois par an par
prélèvement d’eau dans les piézomètres à l’aide d’une pompe immergée 12 V. Compte
tenu des très faibles flux d’eau, les piezomètres sont préalablement vidés puis
l’échantillonnage a lieu le lendemain après un nouveau remplissage des tubes
Les conditions climatiques rendant impossible les études de terrain pendant
l’hiver (couverture neigeuse importante), les campagnes de prélèvement s’échelonnent
du printemps à l’automne.

76
Avignonet
Les prélèvements se font sur des sources, 1 fois par an au moment de la fonte des
neiges (mars/avril, seule période de l'année où des sources existent sur le site). Les
mesures de conductivité/température/pH sont effectuées en même temps (sonde
WTW). 1 piézomètre est échantillonné pour comparaison. Au vu des très faibles flux,
l'eau arrivant dans le piézomètre s'équilibre très rapidement avec l'atmosphère et ne
peut pas être considérée comme représentative des conditions du sous-sol.
Instrumentation sur instabilités rocheuses
Contrairement au cas précédent, les exutoires de ou des nappes sont visibles ce
qui rend possible un suivi en continu des paramètres physiques (température et
conductivité électrique). Il est également possible de suivre la chimie de l’eau à un pas
de temps très serré (par exemple prélèvement tous les 4 jours à Séchilienne). Ce suivi
nous permet de comprendre mieux les écoulements dans un massif métamorphique à
double-perméabilité (transit rapide dans les failles vs. transit lent dans la roche fissurée).
La Clapière
Le suivi des paramètres physiques (température, hauteur d’eau et conductivité
électrique) est réalisé sur deux sources (en pied et en marge) du glissement. Associé à ce
suivi, des prélèvements d’eau sont réalisés sur la source de pied de glissement. Depuis
juin 2012, il existe donc des données synchrones des paramètres physico-chimiques.
Séchilienne
Un suivi de 4 sources (de septembre 2010 à septembre 2012, un prélèvement
tous les 4 jours) a été réalisé dans le cadre d’un projet ANR (SLAMS). Depuis septembre
2012 le suivi de deux de ces sources a été pérennisé dans le cadre du réseau OMIV par le
laboratoire Chrono-Environnement de l’Université de Franche-Comté. Le nombre de
campagnes d’échantillonnage pour ces deux sites est de l’ordre de trois répartis sur
l’année hydrologique dont une campagne lors de la fonte des neiges.
Pour le moment nous travaillons avec Vincent Marc, de l’Université d’Avignon, à
mettre en place un protocole de surveillance des paramètres physico-chimiques qui soit
applicables à tous les sites. Nos efforts portent sur le protocole de prélèvement par
collecteur automatisé, à mettre en place une démarche qualité visant à comparer la
précision et la justesse des mesures élémentaires ou isotopiques, d’homogénéiser les
protocoles de prélèvement/conservation/transport/mesure ne sont pas homogénéisés
et enfin de réfléchir avec Thomas Lebourg de l’OCA Nice à la mise en place d’une
données à mettre en ligne sur le site de l’OMIV.

77
En conclusion, Tous ces éléments montrent que la chimie de l’eau est un
paramètre pertinent pour l’étude des interactions entre l’eau et la matrice de sol dans
les versants instables (processus d’écoulement et altérations). A l’image des variables
plus classiquement étudiées dans ces milieux (hydrologie, déplacement, séismicité), elle
a vocation à intégrer les réseaux de suivi à long terme mis en place dans le cadre des
observatoires.
Au-delà du rôle de traceur des sources d’eau, les caractéristiques
hydrogéochimiques au sein d’un versant instable sont susceptibles de jouer un rôle sur
l’altérabilité des matériaux et donc sur leur fragilisation mécanique. En effet, l’érosion
chimique engendrée par les interactions eau-roche implique une perte de substance qui
peut modifier les caractéristiques hydrodynamiques et rhéologiques des roches. Un
autre exemple est la relation observée par certains auteurs entre la chimie de l’eau
interstitielle et la stabilité physicochimique des minéraux argileux (par exemple, le rôle
dispersif du sodium qui mène à une dégradation de la structure des sols argileux).
L’hydrogéochimie, utilisée avec succès aussi bien dans les massifs rocheux que peu
consolidés, permet de définir des familles d’eaux et d’identifier la participation des
différents réservoirs à l’écoulement dans les versants en mouvement. Enfin, le suivi de
traceurs naturels, couplé à des suivis synchrones de la pluviométrie et des vitesses de
déplacement, apporte une meilleure compréhension du comportement
hydromécanique et potentiellement une identification de précurseurs de la rupture ou
d’accélération importante du massif. Dans ce contexte mon objectif est de mieux
comprendre le rôle de l’altération chimique de la roche et de ses effets, et d’utiliser
cette altération comme marqueur de la déstabilisation des versants instables
10 PERSPECTIVES
10.1 Hydrochimie et couplage avec un modèle de transport réactif
Les lois qui régissent les écoulements sont bien connues et demandent dans leurs
applications de déterminer des paramètres physiques, hydrodynamiques et
hydrodispersifs du milieu considéré. Ces paramètres sont le plus souvent déterminés en
laboratoire à partir des matériaux homogènes, isotropes. Ces données servent à caler
des modèles numériques simples qui tiennent compte de ces lois, mais ne tiennent pas
compte de la complexité du milieu naturel.
La nouvelle génération de modèles numériques incorpore peu à peu la complexité
du milieu naturel en tenant compte, entre autres de l’hétérogénéité des aquifères.
Une des applications directe de ces modèles est de pouvoir prévoir le transport de
masse et la dispersion d’éléments chimiques polluants ou non, dans le réservoir. Par
contre, ces modèles très complexes ne tiennent pas compte des interactions eau-roche
qui ont lieu au sein du réservoir et qui vont modifier la qualité des eaux. Les modèles
géochimiques actuels pour les plus sophistiqués sont capables de simuler les réactions
chimiques qui se produisent au cours des interactions en fonction du temps. On peut

78
prévoir les modifications chimiques de l’eau et les modifications minéralogiques de la
roche, mais évidemment pas leur localisation spatiale. Les changements chimiques de
l’eau interviennent sur sa qualité et sur le contrôle de la dissolution ou la précipitation
des phases minérales de la roche, avec comme conséquence le changement de
propriétés physiques de celle-ci (modification de la porosité et perméabilité). Les
écoulements peuvent être modifiés, quasiment stoppés dans certains cas, ou à l’inverse
augmentés.
Les modèles qui couplent le transport et le transfert de masse sont en plein
développement. Néanmoins, ces codes numériques sont plus ou moins sophistiqués
selon la précision à laquelle les différents phénomènes physiques et chimiques peuvent
être quantifiés. Par ailleurs, ces codes demandent à être validés par des données
expérimentales.
Nous possédons de longues chroniques de données chimiques des eaux. Ces sites
sont plus ou moins complexes selon la nature minéralogique de la roche encaissante, la
fissuration ou la porosité de celle-ci (réservoirs fissurés calcaire ou métamorphiques).
L’objectif est de reconstituer les évolutions chimiques des eaux et des minéraux qui
interagissent lors du transit de l’eau dans les massifs. Pour cela, il serait intéressant de
modéliser ces évolutions des eaux au cours du transport. Les résultats de ces simulations
seront confrontés avec des analyses chimiques des eaux et avec les analyses
minéralogiques fines des minéraux de l’encaissant et des éventuelles authigenèses.
10.2 Hydrochimie et couplage hydromécanique
Les modèles simples produits jusqu'à présent ne permettent pas de répondre
clairement à des questions importantes comme quel rôle les fluides ont-ils sur le
développement de l'endommagement et l'évolution des glissements de terrain?
Compte tenu de la complexité de ces milieux, l’étude des processus de
minéralisation fondée sur des modèles géochimiques apparaît comme un complément
indispensable à l’interprétation des informations hydrogéochimiques. Il s'agit en effet de
comprendre comment s’organise la relation complexe entre altération chimique,
modifications hydromécaniques et fragilisation/mouvements du matériau. Des modèles
géochimiques à bases thermodynamiques et cinétiques ont été établis sur 3 des quatre
sites étudiés. Sur le site de Séchilienne, les derniers travaux menés dans le cadre de
l'ANR SLAMS se sont particulièrement intéressés à la question du rôle des fluides sur
l'instabilité mécanique des versants par une approche observationnelle et numérique.
L'objectif est de progresser dans la compréhension des liens mécaniques entre
processus hydrauliques, sismiques et asismiques dans les glissements de terrain, qui
sont apparus ces dernières années avec le déploiement des réseaux sismologiques et
géodésiques permanents, et le suivi des fluides sur le site de Séchilienne. Ces nouvelles
observations remettent en question les modèles hydromécaniques classiques des
instabilités gravitaires dans lesquels les relations entre écoulements de fluides et
rupture ne sont pas intimement couplées.

79
Pour aborder ces questions et faire des progrès importants dans la
compréhension du mouvement de Séchilienne, il faut combiner le suivi hydrogéologique
et hydrogéochimique des eaux souterraines et le développement de modèles
hydromécaniques reproduisant les observations in situ mesurées sur le site de
Séchilienne. Il faut notamment faire le lien entre les variations de la chimie des eaux due
à l’altération de la roche et la dégradation du massif.
10.3 Hydrochimie et transfert de matière
L'altération géochimique représente une part non négligeable par rapport à
l'altération mécanique dans l'évolution de la rupture des versants rocheux à long terme
(évolution pluriannuelle par endommagement mécanique et géochimique des fractures
et de la matrice rocheuse), moyen terme et court terme (effet saisonnier et instantané
des fluctuations hydromécaniques essentiellement localisé dans les fractures du
versant).
Il s’agit d’étudier la variabilité de la composition de la minéralisation pour
comprendre les échanges et transferts au sein des hydrosystèmes en intégrant les
différents compartiments depuis la zone d’infiltration jusqu’à la source. La
reconstitution des évolutions chimiques des eaux et des minéraux qui interagissent lors
du transit de l’eau dans les massifs doit permettre d’une part d’établir des bilans
d’érosion et de dénudation chimique à une échelle locale et leur contribution aux cycles
biogéochimiques globaux et d’autre part, de localiser et de quantifier au sein d’un
versant montagneux l’érosion chimique et de faire la part entre les zones de transport
réactif et les zones ou le transport est prépondérant. Une des applications majeures de
ces axes de recherche et de faire le lien entre érosion chimique, l’aléa gravitaire et les
changements climatiques. L’érosion chimique est-elle capable d’entraîner une « fatigue
chimique » des géomatériaux ? Ce type d'érosion est-il continu dans le temps et l'espace
ou discontinu par crises ? En quoi l’altération poussée des massifs de socle peut-elle
contribuer au cycle du carbone ?

80
81
BIBLIOGRAPHIE
Aagaard P. . and Helgeson H.C. (1977 : Thermodynamic and kinetic constraints on the dissolution of
feldspars. Geol. Soc. Amer., Abstr. Prog, 9, p. 873
Aagaard P. and Helgeson H.C. 1982: Thermodynamic and kinetic constraints on reaction rates among
minerals and aqueous solutions I : Theoritical considerations. Amer. J. of Sci., 283 pp. 237-285.
Alfonsi, P. 1997. Relation entre les paramètres hydrologiques et la vitesse dans les glissements de terrains.
Exemples de La Clapière et de Séchilienne, Rev. Fr. Géotechnique, (79), 3–12,
Andreo, B., Carrasco, F., Bakalowicz, M., Mudry, J., Vadillo, I., 2002. Use of hydrodynamic and
hydrochemistry to characterise carbonate aquifers. Case study of the Blanca–Mijas unit (Málaga, southern
Spain). Env Geol 43, 108–119. doi:10.1007/s00254-002-0614-z
Aquilina, L., Ladouche, B., Dörfliger, N., 2005. Recharge processes in karstic systems investigated through
the correlation of chemical and isotopic composition of rain and spring-waters. Applied Geochemistry 20,
2189–2206. doi:10.1016/j.apgeochem.2005.07.011
Atteia, O., 1994. Major and trace elements in precipitation on Western Switzerland. Atmospheric
Environment 28, 3617–3624. doi:10.1016/1352-2310(94)00193-O
Auqué, L.F., Acero, P., Gimeno, M.J., Gómez, J.B., Asta, M.P., 2009. Hydrogeochemical modeling of a thermal
system and lessons learned for CO2 geologic storage. Chemical Geology 268, 324–336.
doi:10.1016/j.chemgeo.2009.09.011
Bakalowicz M. 1979 – Contribution de la géochimie des eaux à la connaissance de l’aquifère karstique et de
la karstification. Thèse, Université de Paris VI, Paris, France, 269 p.
Bakalowicz M. 2005 – Karst groundwater: A challenge for new resources. Hydrogeology Journal, 13, 1, p.
148-160.
Bakalowicz M. 2006– Aquifères karstiques. In Aquifères & Eaux Souterraines en France. Tome 1, (ed. Roux
J.C.), BRGM Edition, Orléans, p. 59-73.
Baker, A., Lamont-BIack, J., 2001. Fluorescence of Dissolved Organic Matter as a Natural Tracer of Ground
Water. Ground Water 39, 745–750. doi:10.1111/j.1745-6584.2001.tb02365.x
Banks, D., Reimann, C., Skarphagen, H., 1998. The comparative hydrochemistry of two granitic island
aquifers: the Isles of Scilly, UK and the Hvaler Islands, Norway. Science of The Total Environment 209, 169–
183. doi:10.1016/S0048-9697(98)80108-3
Banton, O. et L. Bangoy. 1997. Hydrogéologie, multiscience environnementale des

82
Barbecot, F., Marlin, C., Gibert, E., Dever, L., 2000. Hydrochemical and isotopic characterisation of the
Bathonian and Bajocian coastal aquifer of the Caen area (northern France). Applied Geochemistry 15, 791–
805. doi:10.1016/S0883-2927(99)00088-8
Barbieri, M., Boschetti, T., Petitta, M., Tallini, M., 2005. Stable isotope (2H, 18O and 87Sr/86Sr) and
hydrochemistry monitoring for groundwater hydrodynamics analysis in a karst aquifer (Gran Sasso, Central
Italy). Applied Geochemistry 20, 2063–2081. doi:10.1016/j.apgeochem.2005.07.008
Barton, C A; Zoback, M D 1992, Self-similar distribution and properties of macroscopic fractures at depth in
crystalline rocks in the Cajon Pass scientific drill hole : J Geophys ResV97, NB4, P5181–5200
Basabe, P.P. 1993. Typologie des eaux souterraines du flysh de la nappe tectonique du Niessen (Préalpes
suisses). Génie civile. Lausanne. Ecole polytechnique fédérale : 200
Batiot, C., Emblanch, C., Blavoux, B., 2003. Carbone organique total (COT) et magnésium (Mg2+) : deux
traceurs complémentaires du temps de séjour dans l’aquifère karstique. Comptes Rendus Geoscience 335,
205–214. doi:10.1016/S1631-0713(03)00027-0
Beaulieu, E., Goddéris, Y., Labat, D., Roelandt, C., Calmels, D., Gaillardet, J., 2011. Modeling of water-rock
interaction in the Mackenzie basin: Competition between sulfuric and carbonic acids. Chemical Geology 289,
114–123. doi:10.1016/j.chemgeo.2011.07.020
Beniston, M., Douglas, G.F., 1996. Impacts of climate change on mountain regions. In: Watson, R.T.,
Zinyowera, M.C., Moss, .R.H., Dokken, D.J. Eds. , Climate Change 1995. Impacts,Adaptations and Mitigation
of Climate Change: Scientific–Technical Analysis. Cambridge Univ. Press, Cambridge, pp.191–213
Berkowitz, B., 2002. Characterizing flow and transport in fractured geological media: A review. Advances in
Water Resources 25, 861–884. doi:10.1016/S0309-1708(02)00042-8
Binet, S., 2006. L’hydrochimie, marqueur de l’évolution à long terme des versants montagneux fracturés
vers de grands mouvements de terrain Application à plusieurs échelles sur la haute vallée de la Tinée
(Mercantour, France) et sur le versant de Rosone (Gran Paradiso, Italie) (Ph.D. thesis). Université de
Franche-Comté, Besançon.
Blanc P. 1986 Structure et hydrodynamique des milieux fissurés. Synthèse bibliographique. Rapport BRGM,
86 SGN 102 EAU
Blavoux B, Mudry J. 1983 Séparation des composantes de l’écoulement d’un exutoire karstique à l’aide des
méthodes physico-chimiques. Hydrogéologie-Géologie de l’Ingénieur; 4 : 269-78.
Blondel, T., Emblanch, C., Batiot-Guilhe, C., Dudal, Y., Boyer, D., 2012. Punctual and continuous estimation
of transit time from dissolved organic matter fluorescence properties in karst aquifers, application to
groundwaters of “Fontaine de Vaucluse” experimental basin (SE France). Environ Earth Sci 65, 2299–2309.
doi:10.1007/s12665-012-1562-x
Blum A.E. and Stillings L.L. 1995 – Feldspar dissolution kinetics. In Chemical Weathering Rates of Silicate
Minerals, vol. 31 (eds. A.F. White ans S.L. Brantley), Mineralogical Society of America, p 291-351.
Bogaard, T., Guglielmi, Y., Marc, V., Emblanch, C., Bertrand, C., Mudry, J., 2007. Hydrogeochemistry in
landslide research: a review. Bulletin de la Societe Geologique de France 178, 113–126.
doi:10.2113/gssgfbull.178.2.113

83
Bonacci O. 2001 – Monthly and annual effective information coefficients in Dinaric karst: Example of the
Gradole karst spring catchment. Hydrological Sciences Journal, 46, 2, p. 287-299.
Bonzanigo, L., Eberhardt, E. and Loew, S. 2001. Hydromechanical factors controlling the creeping Campo
Vallemaggia landslide, in Symposium of landslides, Causes, Impacts and Countermeasures, pp. 13–22, UEF,
Davos, Switzerland.,
Bourlier, P.-Y., Lachassagne, P., Desprats, J.-F., Gille, E., 2005. Nouveaux éléments sur la structure et le
fonctionnement hydrogéologique du plateau basaltique de l’Aubrac (Massif central, France). Première
évaluation des potentialités en eau souterraine. Comptes Rendus Geoscience 337, 663–673.
Brantley, S.L., Bandstra, J., Moore, J., White, A.F., 2008. Modelling chemical depletion profiles in regolith.
Geoderma, Modelling Pedogenesis 145, 494–504. doi:10.1016/j.geoderma.2008.02.010
Brantley, S.L., Mellott, N.P., 2000. Surface area and porosity of primary silicate minerals. American
Mineralogist 85, 1767–1783.
Brouste, L., Marlin, C., Dever, L., 1997. Geochemistry and residence time estimation of groundwater from
the upper aquifer of the Chihuahua desert (Comarca Lagunera, Northern Mexico). Applied Geochemistry 12,
775–786. doi:10.1016/S0883-2927(97)00034-6
Brown, J.G., Glynn, P.D., 2003. Kinetic dissolution of carbonates and Mn oxides in acidic water:
measurement of in situ field rates and reactive transport modeling. Applied Geochemistry 18, 1225–1239.
doi:10.1016/S0883-2927(03)00010-6
Cacas, M.C., Ledoux, E., de Marsily, G., Tillie, B., Barbreau, A., Durand, E., Feuga, B., Peaudecerf, P., 1990.
Modeling fracture flow with a stochastic discrete fracture network: calibration and validation: 1. The flow
model. Water Resources Research 26, 479–489. doi:10.1029/WR026i003p00479
Caetano Bicalho, C., Batiot-Guilhe, C., Seidel, J.L., Van Exter, S., Jourde, H., 2012. Geochemical evidence of
water source characterization and hydrodynamic responses in a karst aquifer. Journal of Hydrology 450–
451, 206–218. doi:10.1016/j.jhydrol.2012.04.059
Calmels, D., Gaillardet, J., Brenot, A., France-Lanord, C., 2007. Sustained sulfide oxidation by physical erosion
processes in the Mackenzie River basin: Climatic perspectives. Geology 35, 1003–1006.
doi:10.1130/G24132A.1
Cappa, F., Guglielmi, Y., Fénart, P., Merrien-Soukatchoff, V., Thoraval, A., 2005. Hydromechanical
interactions in a fractured carbonate reservoir inferred from hydraulic and mechanical measurements.
International Journal of Rock Mechanics and Mining Sciences 42, 287–306.
doi:10.1016/j.ijrmms.2004.11.006
Cappa, F., Guglielmi, Y., Viseur, S., Garambois, S., 2014. Deep fluids can facilitate rupture of slow-moving
giant landslides as a result of stress transfer and frictional weakening. Geophys. Res. Lett. 41,
2013GL058566. doi:10.1002/2013GL058566
Celle-Jeanton, H., Emblanch E., Mudry J. and Charmoille A. 2003. Contribution of time tracers (Mg 2+ , TOC,
δ 13 C TDIC , NO 3 − ) to understand the role of the unsaturated zone: A case study—Karst aquifers in the
Doubs valley, eastern France. Geophysical Research Letters 30. doi:10.1029/2002GL016781
Cervi, F., Ronchetti, F., Martinelli, G., Bogaard, T.A., Corsini, A., 2012. Origin and assessment of deep
groundwater inflow in the Ca’ Lita landslide using hydrochemistry and in situ monitoring. Hydrol. Earth Syst.
Sci. 16, 4205–4221. doi:10.5194/hess-16-4205-2012

84
Charideh, A., Rahman, A., 2007. Environmental isotopic and hydrochemical study of water in the karst
aquifer and submarine springs of the Syrian coast. Hydrogeol J 15, 351–364. doi:10.1007/s10040-006-0072-x
Charlier, J.-B., Cattan, P., Moussa, R., Voltz, M., 2008. Hydrological behaviour and modelling of a volcanic
tropical cultivated catchment. Hydrol. Process. 22, 4355–4370. doi:10.1002/hyp.7040
Charlier, J.-B., Lachassagne, P., Ladouche, B., Cattan, P., Moussa, R., Voltz, M., 2011. Structure and
hydrogeological functioning of an insular tropical humid andesitic volcanic watershed: A multi-disciplinary
experimental approach. Journal of Hydrology 398, 155–170.
Cho, M., Choi, Y., Ha, K., Kee, W., Lachassagne, P., Wyns, R., 2003. Relationship between the permeability of
hard rock aquifers and their weathering, from geological and hydrogeological observations in South Korea.
Groundwater in fractured rocks. International Association of Hydrogeologists Selected Papers, Prague 15–
19.
Clow, D.W., Sueker, J.K., 2000. Relations between basin characteristics and stream water chemistry in
alpine/subalpine basins in Rocky Mountain National Park, Colorado. Water Resour. Res. 36, 49–61.
doi:10.1029/1999WR900294
Compaore,G. (1997) Evaluation de la fonction capacitive des altérites sur un socle granitique. Site
expérimental de Saon (BurkinaFaso). Thèse Doctorat Université Avignon.
Contreras I.A. and Hernández S.H. 2010. Techniques for prevention and detection of leakage in dams and
reservoirs. http://ussdams.com/proceedings/2010Proc/785-814.pdf
Cornaton, F., Perrochet, P., 2002. Analytical 1D dual-porosity equivalent solutions to 3D discrete single-
continuum models. Application to karstic spring hydrograph modelling. Journal of Hydrology 262, 165–176.
doi:10.1016/S0022-1694(02)00033-1
COSTAction 620 2006 – Vulnerability and risk mapping for the protection of carbonate (karst) aquifers, (Ed.
Zwahlen F.), European Commission, Science Research and Development.
Dai, Z., Samper, J., 2006. Inverse modeling of water flow and multicomponent reactive transport in coastal
aquifer systems. Journal of Hydrology 327, 447–461. doi:10.1016/j.jhydrol.2005.11.052
De Waele, J., 2008. Interaction between a dam site and karst springs: The case of Supramonte (Central-East
Sardinia, Italy). Engineering Geology, Engineering and environmental problems in karst Natural and
Anthropogenic Hazards in Karst Areas 99, 128–137. doi:10.1016/j.enggeo.2007.11.010
Debieche, T. -H, Bogaard, T.A., Marc, V., Emblanch, C., Krzeminska, D.M., Malet, J. -P, 2011. Hydrological and
hydrochemical processes observed during a large-scale infiltration experiment at the Super-Sauze mudslide
(France). Hydrological Processes
Dematteis A. 1995 – Typologie géochimique des eaux des aquifères carbonatés des chaînes alpines d’Europe
central et méridionale. (Geochemical typology of groundwaters derived from Alpine carbonate-rock aquifers
of central and southern Europe). PhD thesis, Federal Institute of Technology Lausanne, Lausanne,
Switzerland.
Derron M.H. 1999. Interaction eau-roche de basse temperature : géochimie des métaux dans l’altération
météorique des roches mafiques alpines. Sciences de la Terre. Lausanne. Université de Lausanne : 209
Derron M.H. 2004. Géochimie des eaux de sources et interaction eau-roche dans les Alpes. Quanterra Short
Course 08F ; 18p.

85
Dewandel, B., Lachassagne, P., Wyns, R., Maréchal, J.C., Krishnamurthy, N.S., 2006. A generalized 3-D
geological and hydrogeological conceptual model of granite aquifers controlled by single or multiphase
weathering. Journal of Hydrology 330, 260–284.
Dewandel, B., Lachassagne, P., Zaidi, F.K., Chandra, S., 2011. A conceptual hydrodynamic model of a
geological discontinuity in hard rock aquifers: Example of a quartz reef in granitic terrain in South India.
Journal of Hydrology 405, 474–487.
Dongarrà, G., Manno, E., Sabatino, G., Varrica, D., 2009. Geochemical characteristics of waters in
mineralised area of Peloritani Mountains Sicily, Italy). Applied Geochemistry 24, 900–914.
doi:10.1016/j.apgeochem.2009.02.002
Dörfliger N. & Plagnes V. 2009. Cartographie de la vulnérabilité intrinsèque des aquifères karstiques. Guide
méthodologique de la méthode PaPRIKa. Avec la collaboration de K. Kavouri et J. Gouin ; BRGM RP-57527-
FR, 105pp., 55 ill., 4 ann.
Dubois J.-D. 1993 Typologie des aquifères du cristallin. Exemple des massifs des Aiguilles Rouges et du
mont-Blanc (France, Italie, Suisse). [Typology of crystalline-rock aquifers : Example of the Aiguilles Rouges
and mont-Blanc massifs (France, Italy, Switzerland)]. PhD, Federal Institute of Technology Lausanne,
Lausanne, Switzerland.
eaux souterraines. Presses de l’Université du Québec/AUPELF, 460 pages
Edmunds, W.M., Smedley, P.L., 2000. Residence time indicators in groundwater: the East Midlands Triassic
sandstone aquifer. Applied Geochemistry 15, 737–752. doi:10.1016/S0883-2927(99)00079-7
Emblanch C., Charmoille A., Jimenez P., Andreo B., Mudry J., Bertrand C., Batiot C. and Lastennet R. 2006 –
Variabilité du type et de la qualité de l’information issue du traçage naturel en fonction des caractéristiques
des systèmes étudiés. Quelques exemples français et espagnols. In Proceedings of the 8th Conference on
Limestone Hydrogeology, Neuchâtel, Suisse, 21-23 september 2006, p. 101-104.
Emblanch, C., Blavoux, B., Puig, J.-M., Mudry, J., 1998. Dissolved organic carbon of infiltration within the
autogenic Karst Hydrosystem. Geophysical Research Letters 25, 1459–1462. doi:10.1029/98GL01056
Federico, C., Aiuppa, A., Favara, R., Gurrieri, S., Valenza, M., 2004. Geochemical monitoring of groundwaters
(1998–2001) at Vesuvius volcano (Italy). Journal of Volcanology and Geothermal Research, The Neapolitan
Volcanoes: Vesuvius, Campi Flegrei and Ischia 133, 81–104. doi:10.1016/S0377-0273(03)00392-5
Fénart P. 2002 – Caractérisation du comportement hydromécanique des massifs rocheux fissurés. Thèse,
Université de Montpellier 2, Montpellier, France, 308 p.
Feuga B. and Vaubourg P. 1980 – Principales méthodes de reconnaissance des milieux fissurés : Etat des
connaissances. BRGM Edition, Orléans, 192 p.
Fleury, P., Plagnes, V., Bakalowicz, M., 2007. Modelling of the functioning of karst aquifers with a reservoir
model: Application to Fontaine de Vaucluse (South of France). Journal of Hydrology 345, 38–49.
doi:10.1016/j.jhydrol.2007.07.014
Ford D. and Williams P. 2007 – Karst hydrogeology and geomorphology. John Wiley & Sons Ed., New York,
7th
edition, 576 p.

86
Frengstad, B., Banks, D., Siewers, U., 2001. The chemistry of Norwegian groundwaters: IV. The pH-
dependence of element concentrations in crystalline bedrock groundwaters. Science of The Total
Environment 277, 101–117. doi:10.1016/S0048-9697(00)00867-6
Gabrovsek, F., Romanov, D., Dreybrodt, W., 2004. Early karstification in a dual-fracture aquifer: the role of
exchange flow between prominent fractures and a dense net of fissures. Journal of Hydrology 299, 45–66.
doi:10.1016/j.jhydrol.2004.02.005
Gaillardet, J., Dupré, B., Louvat, P., Allègre, C.J., 1999. Global silicate weathering and CO2 consumption rates
deduced from the chemistry of large rivers. Chemical Geology 159, 3–30. doi:10.1016/S0009-
2541(99)00031-5
Garry B. 2007 – Etude des processus d’écoulements de la zone non-saturée pour la modélisation des
aquifères karstiques. Thèse, Université d’Avignon et des Pays de Vaucluse, Avignon, France, 234 p.
Garry B., Blondel T., Emblanch C., Sudre C., Bilgot C., Cavaillou S., Boyer D. and Auguste M. 2008) –
Contribution of artificial galleries to knowledge of karstic system behavior in addition to natural cavern data.
International Journal of Speleology, 37(1), p. 75-82.
Gaus, I., Azaroual, M., Czernichowski-Lauriol, I., 2005. Reactive transport modelling of the impact of CO2
injection on the clayey cap rock at Sleipner (North Sea). Chemical Geology, Geochemical Aspects of CO2
sequestering Geochemical Aspects of CO2 sequestering 217, 319–337. doi:10.1016/j.chemgeo.2004.12.016
Gdalia L. 1980. Application d’un modèle conceptuel à plusieurs aquifères karstiques de la bordure
méditerranéenne française, correspondance entre les paramètres du modèle et les caractères physiques
des bassins versants. Thèse, Université des Sciences et Techniques du Languedoc, Montpellier France, 163p
Glade, T., 1998. Establishing the frequency and magnitude of landslide-triggering rainstorm events in New
Zealand. Environmental Geology 35, 160–174. doi:10.1007/s002540050302
Godt, J.W., Baum, R.L., Chleborad, A.F., 2006. Rainfall characteristics for shallow landsliding in Seattle,
Washington, USA. Earth Surf. Process. Landforms 31, 97–110. doi:10.1002/esp.1237
Guglielmi Y. 1999 – Apport de la mesure des couplages hydromécaniques à la connaissance
hydrogéologique des réservoirs fissurés : Approche sur site expérimental. Mémoire HDR, Université de
Franche-Comté, Besançon.
Guglielmi, Y., Cappa, F., Binet, S., 2005. Coupling between hydrogeology and deformation of mountainous
rock slopes: Insights from La Clapière area (southern Alps, France). Comptes Rendus Geoscience 337, 1154–
1163. doi:10.1016/j.crte.2005.04.016
Guglielmi, Y., Mudry, J., 2001. Quantitative Measurement of Channel-Block Hydraulic Interactions by
Experimental Saturation of a Large, Natural, Fissured Rock Mass. Ground Water 39, 696–701.
doi:10.1111/j.1745-6584.2001.tb02359.x
Guihéneuf, N., Boisson, A., Bour, O., Dewandel, B., Perrin, J., Dausse, A., Viossanges, M., Chandra, S.,
Ahmed, S., Maréchal, J.C., 2014. Groundwater flows in weathered crystalline rocks: Impact of piezometric
variations and depth-dependent fracture connectivity. Journal of Hydrology 511, 320–334.
doi:10.1016/j.jhydrol.2014.01.061
Guimerà J., Duro L., Jordana S. and Bruno J. 1999 – Effects of ice melting and redox front migration in
fractured rocks of low permeability. Svensk Kärnbränslehantering AB, report n° TR-99-19.

87
Güler, C., Thyne, G.D., 2004. Hydrologic and geologic factors controlling surface and groundwater chemistry
in Indian Wells-Owens Valley area, southeastern California, USA. Journal of Hydrology 285, 177–198.
doi:10.1016/j.jhydrol.2003.08.019
Gunn J. and Lowe D.J. 2000 – Speleogenesis of tectonically active carbonate islands. In Speleogenesis:
Evolution of Karst Aquifers, (eds. Klimchouk A.V., Ford D.C., Palmer A.N. and Dreybrodt W.), National
Speleology Society of America, Huntsville, Alabama, p. 238-243.
Hageman, P.L., 2007. U.S. Geological Survey field leach test for assessing water reactivity and leaching
potential of mine wastes, soils, and other geologic and environmental materials: ( No. book 5, chap. D3),
U.S. Geological Survey Techniques and Methods.
Hahn, J., Lee, Y., Kim, N., Hahn, C., Lee, S., 1997. The groundwater resources and sustainable yield of Cheju
volcanic island, Korea. Environmental Geology 33, 43–53. doi:10.1007/s002540050223
Herrera, C., Custodio, E., 2008. Conceptual hydrogeological model of volcanic Easter Island (Chile) after
chemical and isotopic surveys. Hydrogeol J 16, 1329–1348. doi:10.1007/s10040-008-0316-z
Hesske S. 1995. Typologie des eaux souterraines de la Molasse entre Chambéry et Linz (France, Suisse,
Allemagne, Autriche. GEOLEP-GC Lausanne, Ecole Polytechnique Fédérale
Hiller, T., Kaufmann, G., Romanov, D., 2011. Karstification beneath dam-sites: From conceptual models to
realistic scenarios. Journal of Hydrology 398, 202–211. doi:10.1016/j.jhydrol.2010.12.014
Hilley, G.E., Chamberlain, C.P., Moon, S., Porder, S., Willett, S.D., 2010. Competition between erosion and
reaction kinetics in controlling silicate-weathering rates. Earth and Planetary Science Letters 293, 191–199.
doi:10.1016/j.epsl.2010.01.008
Hodson, M.E., 2006. Does reactive surface area depend on grain size? Results from pH 3, 25 °C far-from-
equilibrium flow-through dissolution experiments on anorthite and biotite. Geochimica et Cosmochimica
Acta 70, 1655–1667. doi:10.1016/j.gca.2006.01.001
Iverson, R. M 2000 Landslide triggering by rain infiltration, Water Resour. Res., 36(7), 1897–1910,
doi:10.1029/2000WR900090,
Jeannin P.Y. 1996 – Structure et comportement hydraulique des aquifères karstiques. Thèse, Université de
Neuchâtel, Neuchâtel, Suisse, 247 p.
Jeannin P.Y. and Grasso A.D. 1995 – recharge respective des volumes de roche peu perméable et des
conduits karstiques, rôle de l’épikarst. Bulletin d’Hydrogéologie, Université de Neuchâtel, Neuchâtel, Suisse,
p. 95-111.
Jourde, H., Bidaux, P., Pistre, S., 1998. Modelisation des ecoulements en reseaux de fractures orthogonales;
influence de la localisation du puits de pompage sur les rabattements. Bulletin de la Societe Geologique de
France 169, 635–644.
Juif L. 1991 – Hydrologie de la haute montagne. Approche du fonctionnement hydrodynamique des
acquifères de Vanoise. Thèse, Université de Franche-Comté, Besançon, France, 257 p.
Katz, B.G., Chelette, A.R., Pratt, T.R., 2004. Use of chemical and isotopic tracers to assess nitrate
contamination and ground-water age, Woodville Karst Plain, USA. Journal of Hydrology 289, 36–61.
doi:10.1016/j.jhydrol.2003.11.001

88
Kilchmann, S., Waber, H.N., Parriaux, A., Bensimon, M., 2004. Natural tracers in recent groundwaters from
different Alpine aquifers. Hydrogeology Journal 12, 643–661. doi:10.1007/s10040-004-0366-9
Kiraly L. 1969 – Statistical analysis of fractures. Orientation density. Geologische Rundschau, 59, p. 125-151.
Kiraly L. 1975 – Rapport sur l’état actuel des connaissances dans le domaine des caractères physiques des
roches karstiques. In Hydrogeology of Karstic Terrains, vol. 3, International Union Geological Sciences, p. 53-
67.
Kiraly L. 1985) – FEM-301. A three-dimensional model for groundwater flow simulation. NAGRA technical
report, 96 p.
Klimchouk A. 2004. Towards defining, delimiting and classifying epikarst:Its origin, processes and variants of
geomorphic evolution Re-published (modified) from: Jones, W.K., Culver, D.C. and Herman, J. (Eds.). 2004.
Epikarst. Proc. of the symposium held October 1 through 4, 2003 Sheperdstown, West Virginia, USA. Karst
Water Institute special publication 9, 23-35
Krauskopf K.B. and Bird D.K. 1995) – Introduction to geochemistry. 3rd
edition. McGraw-Hill edition, New
York, 647 p.
Krzeminska, D.M., Bogaard, T.A., Van Asch, T.W.J., Van Beek, L.P.H., 2012. A conceptual model of the
hydrological influence of fissures on landslide activity. Hydrol. Earth Syst. Sci. 16, 1561–1576.
Kühnel, R.A., 1996. Pétrologie des latérites et des sols tropicaux: by Y. Tardy. Masson, Paris, 1993. 459 pp.
ISBN 2-225-84176-4. Applied Clay Science 10, 412–413. doi:10.1016/0169-1317(96)90004-6
Kurtulus, B., Razack, M., 2007. Evaluation of the ability of an artificial neural network model to simulate the
input-output responses of a large karstic aquifer: the La Rochefoucauld aquifer (Charente, France).
Hydrogeol J 15, 241–254. doi:10.1007/s10040-006-0077-5
Labat, D., Ababou, R., Mangin, A., 2000. Rainfall–runoff relations for karstic springs. Part I: convolution and
spectral analyses. Journal of Hydrology 238, 123–148. doi:10.1016/S0022-1694(00)00321-8
Lachassagne P. and Wyns R. 2006 – Aquifères de socle. In Aquifères & Eaux Souterraines en France. Tome 1,
(ed. Roux J.C.), BRGM Edition, Orléans, p. 43-51.
Lachassagne, P., Wyns, R., Dewandel, B., 2011. The fracture permeability of hard rock aquifers is due neither
to tectonics, nor to unloading, but to weathering processes. Terra Nova 23, 145–161.
Lasaga A. C. Transition state theory , in <Kinetic of geochemical processes , A. Lasaga & R. Kirkpatrick eds,
Reviews in Mineralogy, p.135–169.
Lasaga, A.C., 1984. Chemical kinetics of water-rock interactions. Journal of Geophysical Research: Solid Earth
(1978–2012) 89, 4009–4025.
Lastennet R. 1994 – Rôle de la zone non-saturée dans le fonctionnement des aquifères karstiques, approche
par l’étude physico-chimique et isotopique du signal d’entrée et des exutoires du massif du Ventoux. Thèse
Université d’Avignon, Avignon, France, 239 p.
Lastennet R., Puig J.M., Emblanch C. and Blavoux B. 1995 – Influence de la zone non-saturée sur le
fonctionnement des systèmes karstiques. Mise en évidence dans les sources du nord-Vaucluse.
Hydrogéologie, 4, p. 57-66.
89
Lee, Y.-J., Morse, J.W., 1999. Calcite precipitation in synthetic veins: implications for the time and fluid
volume necessary for vein filling. Chemical Geology 156, 151–170. doi:10.1016/S0009-2541(98)00183-1
Li, S.-L., Calmels, D., Han, G., Gaillardet, J., Liu, C.-Q., 2008. Sulfuric acid as an agent of carbonate weathering
constrained by δ13CDIC: Examples from Southwest China. Earth and Planetary Science Letters 270, 189–
199. doi:10.1016/j.epsl.2008.02.039
López-Chicano, M., Bouamama, M., Vallejos, A., Pulido-Bosch, A., 2001. Factors which determine the
hydrogeochemical behaviour of karstic springs. A case study from the Betic Cordilleras, Spain. Applied
Geochemistry 16, 1179–1192. doi:10.1016/S0883-2927(01)00012-9
Lu, H.-Y., Liu, T.-K., Chen, W.-F., Peng, T.-R., Wang, C.-H., Tsai, M.-H., Liou, T.-S., 2008. Use of geochemical
modeling to evaluate the hydraulic connection of aquifers: a case study from Chianan Plain, Taiwan.
Hydrogeol J 16, 139–154. doi:10.1007/s10040-007-0209-6
Lüttge, A., 2005. Etch pit coalescence, surface area, and overall mineral dissolution rates. American
Mineralogist 90, 1776–1783. doi:10.2138/am.2005.1734
MacQuarrie, K.T.B., Mayer, K.U., 2005. Reactive transport modeling in fractured rock: A state-of-the-science
review. Earth-Science Reviews 72, 189–227. doi:10.1016/j.earscirev.2005.07.003
Maher, K., DePaolo, D.J., Lin, J.C.-F., 2004. Rates of silicate dissolution in deep-sea sediment: In situ
measurement using 234U/238U of pore fluids. Geochimica et Cosmochimica Acta 68, 4629–4648.
doi:10.1016/j.gca.2004.04.024
Malet, J.P., Maquaire, O., Vanash, T.W., 2003. Hydrological behaviour of earthflows developed in clay-
shales: investigation, concept and modelling. The Occurrence and Mechanisms of Flows in Natural Slopes
and Earthfills, Patron Editore, Bologna 175–193.
Malet, J.-P., Van Asch, T.W.J., Van Beek, R., Maquaire, O., 2005. Forecasting the behaviour of complex
landslides with a spatially distributed hydrological model. Natural Hazards and Earth System Science 5, 71–
85
Mandia Y. 1991. Typologie des aquifères évaporitiques du Trias dans le bassin lémanique du Rhône (Alpes
occidentales). Génie Civile. Lausanne , Ecole Polytechnique Fédérale 345
Mangin A. 1975 – Contribution à l’étude hydrodynamique des aquifères karstiques. Thèse, Université de
Dijon, Dijon, France.
Mangin, A., 1984. Pour une meilleure connaissance des systèmes hydrologiques à partir des analyses
corrélatoire et spectrale. Journal of Hydrology 67, 25–43. doi:10.1016/0022-1694(84)90230-0
Maréchal J.C. 1998 – Les circulation d’eau dans les massifs cristallins alpins et leurs relations avec les
ouvrages souterrains. PhD thesis, Ecole Polytechnique Fédérale de Lausanne, Lausanne, Suisse, 295 p.
Maréchal J.C. 2000 – Massif du Mont-Blanc : Identification d’une structure aquifère majeure. La Houille
Blanche, 6, p. 78-86.
Maréchal, J.C., Dewandel, B., Subrahmanyam, K., 2004. Use of hydraulic tests at different scales to
characterize fracture network properties in the weathered-fractured layer of a hard rock aquifer: FRACTURE
NETWORK PROPERTIES IN HARD ROCK. Water Resources Research 40, n/a–n/a.
doi:10.1029/2004WR003137
90
Maréchal, J.C., Perrochet, P., Tacher, L., 1999. Long-term simulations of thermal and hydraulic
characteristics in a mountain massif: The Mont Blanc case study, French and Italian Alps. Hydrogeology
Journal 7, 341–354. doi:10.1007/s100400050207
Maréchal, J.-C., Wyns, R., Lachassagne, P., Subrahmanyam, K., Touchard, F., 2003. Anisotropie verticale de la
perméabilité de l’horizon fissuré des aquifères de socle: concordance avec la structure géologique des
profils d’altération. Comptes Rendus Geoscience 335, 451–460.
Marini, L., Ottonello, G., Canepa, M., Cipolli, F., 2000. Water-rock interaction in the Bisagno valley (Genoa,
Italy): application of an inverse approach to model spring water chemistry. Geochimica et Cosmochimica
Acta 64, 2617–2635. doi:10.1016/S0016-7037(00)00383-5
Matsukura, Y., 1996. The role of the degree of weathering and groundwater fluctuation in landslide
movement in a colluvium of weathered hornblende-gabbro. CATENA 27, 63–78. doi:10.1016/0341-
8162(96)00012-4
Mayer, K.U., Frind, E.O., Blowes, D.W., 2002. Multicomponent reactive transport modeling in variably
saturated porous media using a generalized formulation for kinetically controlled reactions: REACTIVE
TRANSPORT MODELING IN VARIABLY SATURATED MEDIA. Water Resources Research 38, 13–1–13–21.
doi:10.1029/2001WR000862
Michel J.P. and Fairbridge R.W. 1999 Dictionnary of earth sciences/Dictionnaire des sciences de la terre.
Anglais-français/Français-anglais. John Wiley & Sons, Chichester, New York and Masson, Paris, France.
Milanovic P. 2002 The environmental impacts of human activities and engineering constructions in karst
regions. Episodes 25 (1), 13-21.
Milanovic P. 2004 Water Resources engineering in Karst. CRC Press, Boca Raton, USA, 328pp
Morse, J.W., Arvidson, R.S., 2002. The dissolution kinetics of major sedimentary carbonate minerals. Earth-
Science Reviews 58, 51–84. doi:10.1016/S0012-8252(01)00083-6
Mudarra, M., Andreo, B., 2011. Relative importance of the saturated and the unsaturated zones in the
hydrogeological functioning of karst aquifers: The case of Alta Cadena (Southern Spain). Journal of
Hydrology 397, 263–280. doi:10.1016/j.jhydrol.2010.12.005
Mudarra, M., Andreo, B., Baker, A., 2011. Characterisation of dissolved organic matter in karst spring waters
using intrinsic fluorescence: Relationship with infiltration processes. Science of The Total Environment 409,
3448–3462. doi:10.1016/j.scitotenv.2011.05.026
Mudry J. 1987 – Apport du traçage physico-chimique naturel à la connaissance hydrocinématique des
aquifères carbonatés. Thèse, Université de Besançon, Besançon, France, 378 p.
Murphy, W.M., Helgeson, H.C., 1989. Thermodynamic and kinetic constraints on reaction rates among
minerals and aqueous solutions: IV. Retrieval of rate constants and activation parameters for the hydrolysis
of pyroxene, wollastonite, olivine, andalusite, quartz and nepheline. Am. J. Sci 289, 17–101.
Négrel, P., Lemière, B., Grammont, H.M. de, Billaud, P., Sengupta, B., 2007. Hydrogeochemical processes,
mixing and isotope tracing in hard rock aquifers and surface waters from the Subarnarekha River Basin,
(east Singhbhum District, Jharkhand State, India). Hydrogeol J 15, 1535–1552. doi:10.1007/s10040-007-
0227-4

91
Negrel, P., Pauwels, H., Dewandel, B., Gandolfi, J.M., Mascré, C., Ahmed, S., 2011. Understanding
groundwater systems and their functioning through the study of stable water isotopes in a hard-rock aquifer
(Maheshwaram watershed, India). Journal of Hydrology 397, 55–70. doi:10.1016/j.jhydrol.2010.11.033
Padilla, A., Pulido-Bosch, A., 1995. Study of hydrographs of karstic aquifers by means of correlation and
cross-spectral analysis. Journal of Hydrology 168, 73–89. doi:10.1016/0022-1694(94)02648-U
Palandri, J. L., Kharaka, Y. K. 2004. A compilation of rate parameters of water-mineral interaction kinetics for
application to geochemical modeling. Menlo Park, Calif.: U.S. Dept. of the Interior, U.S. Geological Survey
Parkhurst, D.L., Appelo, C.A.J., 1999. User’s guide to PHREEQC (version 2)--A computer program for
speciation, batch-reaction, one-dimensional transport, and inverse geochemical calculations ( No. 99-4259),
U.S. Geological Survey Water-resources Investigations Report.
Périneau A., Emblanch C., Danquigny C., Boyer D. and Poupeney J. 2011 – Hydrodynamic organisation of the
flows in the unsaturated zone of the Fontaine de Vaucluse karst system. First results. EDP Sciences.
Peters, C.A., 2009. Accessibilities of reactive minerals in consolidated sedimentary rock: An imaging study of
three sandstones. Chemical Geology, CO2 geological storage: Integrating geochemical, hydrodynamical,
mechanical and biological processes from the pore to the reservoir scale 265, 198–208.
doi:10.1016/j.chemgeo.2008.11.014
Petley, D., 2012. Global patterns of loss of life from landslides. Geology 40, 927–930. doi:10.1130/G33217.1
Pfeifer H.R. 1977 A model for fluids in metamorphosed ultramafic rocks. Bulletin Suisse de Minéralogie et
Pétrographie 57 (3), 361-396
Pili, É., Perrier, F., Richon, P., 2004. Dual porosity mechanism for transient groundwater and gas anomalies
induced by external forcing. Earth and Planetary Science Letters 227, 473–480.
doi:10.1016/j.epsl.2004.07.043
Pinault, J.-L., Plagnes, V., Aquilina, L., Bakalowicz, M., 2001. Inverse modeling of the hydrological and the
hydrochemical behavior of hydrosystems: Characterization of Karst System Functioning. Water Resources
Research 37, 2191–2204. doi:10.1029/2001WR900018
Pistre, S., Marliac, S., Jourde, H., Bidaux, P., 2002. New Combined Log and Tracer Test Interpretation Method
for Identifying Transfers in Fissured Aquifers. Ground Water 40, 232–241. doi:10.1111/j.1745-
6584.2002.tb02651.x
Plagnes V. 1997 – Structure et fonctionnement des aquifers karstiques. Caractérisation par la géochimie des
eaux. Thèse, Université de Montpellier 2, Montpellier, France, 372 p.
Plummer L.N. 1984 – Geochemical modeling: A comparison of forward and inverse methods. In First
Canadian/American Conference on Hydrogeology. Practical applications of Ground Water Geochemistry,
(eds. Hichton B. and Wallick E.I.), National Water Well Association, Worthington, Ohio, p. 149-177.
Plummer, L.N., Busby, J.F., Lee, R.W., Hanshaw, B.B., 1990. Geochemical Modeling of the Madison Aquifer in
Parts of Montana, Wyoming, and South Dakota. Water Resour. Res. 26, 1981–2014.
doi:10.1029/WR026i009p01981
Plummer, L.N., Parkhurst, D.L., Thorstenson, D.C., 1983. Development of reaction models for ground-water
systems. Geochimica et Cosmochimica Acta 47, 665–685. doi:10.1016/0016-7037(83)90102-3

92
Puigdomenech I., Ambrosi J.P., Eisenlohr L., Lartigue J.E., Banwart S.A., Bateman K., Milodowski A.E., West
J.M., Griffault L., Gustafsson E., Hama K., Yoshida H., Kotelnikova S., Pedersen K., Michaud V., Trotignon L.,
rivas-perez J. and Tullborg E.L. 2001a – O2 depletion in granitic media. The Rex Project. Svensk
Kärnbränslehantering AB, report n° TR-01-05.
Puigdomenech I., Gurban I., Laaksoharju M., Luukkonen A., Lofman J., Pitkanen P., Rhen I., Ruotsalainen P.,
Smellie J., Snellman M., Svensson U., Tullborg E.L., wallin B., Vuorinen U. and Wikberg P. 2001b –
hydrochemical stability of groudwaters surrounding a spent nuclear fuel repository in a 100,000 year
perspective. Posiva Report, n° 2001-06.
Rochet, L., Giraud, A., Antoine, P. and Évrard, H.: La déformation du versant sud du mont-sec dans le secteur
des ruines de Séchilienne (Isère), Bull. Int. Assoc. Eng. Geol., 50(1), 75–87, doi:10.1007/BF02594959, 1994.
Romanov, D., Gabrovšek, F., Dreybrodt, W., 2003. Dam sites in soluble rocks: a model of increasing leakage
by dissolutional widening of fractures beneath a dam. Engineering Geology 70, 17–35. doi:10.1016/S0013-
7952(03)00073-5
Santamarina J.C., Klein K.A., Wang Y.H. and Prencke E. 2002 Specific surface: determination and relevance.
Can. Geotech. J., 39:233-241
Sausse, J., Jacquot, E., Fritz, B., Leroy, J., Lespinasse, M., 2001. Evolution of crack permeability during fluid–
rock interaction. Example of the Brézouard granite (Vosges, France). Tectonophysics 336, 199–214.
doi:10.1016/S0040-1951(01)00102-0
Sauter M. 1992 – Quantification of forecasting of regional groundwater flow and transport in a karst aquifer
(Gallusquelle, Malm, SW Germany). Tübinger Geowissenschaftliche Arbeiten, C13, 151 p.
Savoy L. 2007 – Use of natural and artificial reactive tracers to investigate the transfert of solutes in karst
systems. PhD thesis, Université de Neuchâtel, Neuchâtel, Suisse, 194 p.
Schnegg P.A. 2003 – A new field fluorometer for multi-tracer tests and turbidity measurement applied to
hydrogeological problems. In Proceedings of the Eight International Congress of the Brazilian Geophysical
Society, Rio de Janeiro.
Scislewski, A., Zuddas, P., 2010. Estimation of reactive mineral surface area during water–rock interaction
using fluid chemical data. Geochimica et Cosmochimica Acta 74, 6996–7007. doi:10.1016/j.gca.2010.09.015
Sequeira Braga, M.A., Paquet, H., Begonha, A., 2002. Weathering of granites in a temperate climate (NW
Portugal): granitic saprolites and arenization. CATENA, The interpretation and significance of weathering
mantels 49, 41–56. doi:10.1016/S0341-8162(02)00017-6
Smart, P. L., and H. Friedrich (1986), Water movement and storage in the unsaturated zone of a maturely
karstified carbonate aquifer, Mendip Hills, England, paper presented at the Environmental Problems in Karst
Terraines and Their Solutions Conference, Natl. Water Well Assoc., Bowling Green, Ky.,
Steefel, C.I., DePaolo, D.J., Lichtner, P.C., 2005. Reactive transport modeling: An essential tool and a new
research approach for the Earth sciences. Earth and Planetary Science Letters 240, 539–558.
doi:10.1016/j.epsl.2005.09.017
Tang, C.A., Tham, L.G., Lee, P.K.K., Yang, T.H., Li, L.C., 2002. Coupled analysis of flow, stress and damage
(FSD) in rock failure. International Journal of Rock Mechanics and Mining Sciences, Numerical Methods in
Rock Mechanics 39, 477–489. doi:10.1016/S1365-1609(02)00023-0
93
Tardy, Y., 1971. Characterization of the principal weathering types by the geochemistry of waters from some
European and African crystalline massifs. Chemical Geology 7, 253–271. doi:10.1016/0009-2541(71)90011-8
Teutsch, G. and Sauter, M.: 1998, ‘Distributed Parameter Modeling Approaches in Karst-Hydrological
Investigations’, Bulletin d’Hydrogeologie. 16 , 99–109
Thurmann E. 1985. Organic chemistry of natural water. Nijhoff, Junk, Dordrecht, 497p.
Travelletti, J., 2011. Imagerie multi-paramètres et multi-résolutions pour l’observation et la caractérisation
des mécanismes de glissements-coulées. Thèse de doctorat, Université de Strasbourg.
Trotignon, L., Beaucaire, C., Louvat, D., Jean-François Aranyossy, 1999. Equilibrium geochemical modelling of
Äspö groundwaters: a sensitivity study of thermodynamic equilibrium constants. Applied Geochemistry 14,
907–916. doi:10.1016/S0883-2927(99)00030-X
Turkmen, S., Özgüler, E., Taga, H., Karaogullarindan, T., 2002. Seepage problems in the karstic limestone
foundation of the Kalecik Dam (south Turkey). Engineering Geology 63, 247–257. doi:10.1016/S0013-
7952(01)00085-0
Uromeihy, A., 2000. The Lar Dam; an example of infrastructural development in a geologically active karstic
region. Journal of Asian Earth Sciences 18, 25–31. doi:10.1016/S1367-9120(99)00026-7
Van Asch, T.W.J., Buma, J., Van Beek, L.P.H., 1999. A view on some hydrological triggering systems in
landslides. Geomorphology 30, 25–32. doi:10.1016/S0169-555X(99)00042-2
Vengeon, J. M.: Déformation et rupture des versants en terrain métamorphique anisotrope: Apport de
l’étude des Ruines de Séchilienne, PhD thesis, Université Joseph Fourrier I, Grenoble, 3 November., 1998.
White A.F. and Brantley S.L. 1995 – Chemical weathering rates of silicate minerals: an overview. In Chemical
Weathering Rates of Silicate Minerals, vol. 31 (eds. A.F. White ans S.L. Brantley), Mineralogical Society of
America, p 1-22.
White W.B. 2002 – Karst hydrology: Recent developments and open questions. Engineering Geology, 65, 2-
3, p. 85-105.
White W.B. 2006 – Conceptual models for carbonate aquifers. Ground Water, 7, 3, p. 15-21.
White, A.F., Brantley, S.L., 2003. The effect of time on the weathering of silicate minerals: why do
weathering rates differ in the laboratory and field? Chemical Geology, Controls on Chemical Weathering
202, 479–506. doi:10.1016/j.chemgeo.2003.03.001
White, A.F., Bullen, T.D., Vivit, D.V., Schulz, M.S., Clow, D.W., 1999. The role of disseminated calcite in the
chemical weathering of granitoid rocks. Geochimica et Cosmochimica Acta 63, 1939–1953.
doi:10.1016/S0016-7037(99)00082-4
Wieczorek, G. F. and Guzzetti, F.: A review of rainfall thresholds for triggering landslides, in Mediterranean
storms. Proceedings Plinius conference, vol. 99, pp. 407–414., 1999.
Wyns R. 1991 use of continental paleosurfaces for thematic probability mapping (in French). Géologie de la
France, 3, 3-9
Xu, T., Apps, J.A., Pruess, K., Yamamoto, H., 2007. Numerical modeling of injection and mineral trapping of
CO2 with H2S and SO2 in a sandstone formation. Chemical Geology 242, 319–346.
doi:10.1016/j.chemgeo.2007.03.022

94
Zerai, B., Saylor, B.Z., Matisoff, G., 2006. Computer simulation of CO2 trapped through mineral precipitation
in the Rose Run Sandstone, Ohio. Applied Geochemistry 21, 223–240.
doi:10.1016/j.apgeochem.2005.11.002
95
Liste des figures
Figure 1 : Changement d’échelle de mesure de la perméabilité dans les aquifères
cristallins (Clauser, 1992) ....................................................................................................... 38
Figure 2: Lien entre hydrodynamique et hydrochimie (Binet, 2006) .................................... 40
Figure 3 : Somme des principaux anions (HCO3-+SO4
2-) en fonction de la conductivité électrique dans les eaux des sources alpines (Derron, 1999) ................................................ 41
Figure 4 : Localisation géographiques des zones ateliers en milieu karstique ...................... 44
Figure 5 : Localisation géographiques des zones ateliers en milieu fissuré de socle ............ 45
Figure 6: Principe de l’analyse comparative entre les données de terrains et de
simulations géochimiques basées sur des principes thermodynamiques ou cinétiques. Les figures représentant de terrain ont été modifiées d’après MacQuarrie and Mayer (2005) ..................................................................................................................................... 61
Figure 7 : Schéma des hypothèses expliquant les variations des concentrations de sulfates depuis 1996 jusqu’à 2012 (D’après C. Baudement) ................................................. 67
Figure 8 : Contribution des différentes études à la connaissance des écoulements dans des milieux à faible contraste lithologique ............................................................................ 69
Figure 9 : Ecoulement en milieu naturel non perturbé ......................................................... 71
Figure 10 : Ecoulement en milieu naturel perturbé ............................................................... 71
Liste des tableaux
Tableau 1 : Synthèse des mesures effectuées sur les différents sites des zones ateliers en milieu karstique……………………………………………………………………………………………………………….. 46
Tableau 2 : Synthèse des mesures effectuées sur les différents sites des zones ateliers en milieu fissurés de socle……………………………………………………………………………………………………. 47
Tableau 3 : Discrimination des écoulements en fonction des paramètres utilisés pour le traçage naturel ……………………………………………………………………………………………………………… 48
Tableau 4 : Analyses hydrochimiques réalisées sur les différents sites du SNO-OMIV……… 75

96

97
Annexe : Publications
GUGLIELMI Y., BERTRAND C., COMPAGNON F., FOLLACI J.P. & MUDRY J. (2000) Acquisition of water chemistry in a mobile fissured basement massif : its role in the hydrogeological knowledge of the La Clapière landslide (Mercantour massif, southern Alps, France). J. of
Hydrology, 229, 138-148.
CHARMOILLE A.; BINET S., BERTRAND C.; GUGLIELMI Y. & MUDRY J. (2009) Hydraulic interactions between fractures and bedding planes in a carbonate aquifer studied by means of experimentally induced water-table fluctuations (Coaraze experimental site, southeastern France), Hydrogeology Journal,17: 1607-1616, DOI: 10.1007/s10040-009-0470-y
BINET S., SPADINI L., BERTRAND C., GUGLIELMI Y., MUDRY J. & SCAVIA C. (2009) Variability of groundwater sulfate concentration in fractured rock slope: a tool to identify active unstable areas. Hydrol. Earth Syst. Sci., 13, 2315-2327
CHARLIER J.B., BERTRAND C., BINET S., MUDRY J. & BOUILLIER N. (2010) Use of continuous measurements of dissolved organic matter fluorescence in groundwater to characterize fast infiltration through an unstable fractured hillslope (Valabres rockfall, French Alps), Hydrogeology Journal: Volume 18, Issue 8, 1963-1969, DOI: 10.1007/s10040-010-0670-5
CHARLIER J.B., BERTRAND C. & MUDRY J. (2012) Conceptual hydrogeological model of flow and transport of dissolved organic carbon in a small Jura karst system, J. of hydrology, 460-461, 52-64, http://dx.doi.org/10.1016/j.jhydrol.2012.06.043
VALLET A., BERTRAND C., MUDRY J. BOGAARD T., BAUDEMENT C., REGENT B. Groundwater conceptual model of large landslide: contribution of time-related environmental tracing combined with tracer tests (Séchilienne, western Alps). Soumis à Hydrogeology Journal
BERTRAND C., GUGLIELMI Y., DENIMAL S. & MUDRY J (2014) In Situ Study of hydrochemical response of a fractured-layered carbonate regional aquifer: Comparative analyses of natural infiltration and artificial leakage in a large dam lake (Vouglans, Jura, France) Environmental Earth Sciences, Vol. 1, Bartolomé Andreo (Eds): Hydrogeological and Environmental Investigations in Karst Systems, 978-3-642-17434-6, 214864_1_En, (21)
BERTRAND C, VALLET A. & MUDRY J (2014) Hydrochemical approach of mechanical degradation of the Séchilienne unstable slope. G Lollino et al. (Eds). Engineering Geology for Society and Territory, Vol 2, DOI10.1007/978-3_384

98

Acquisition of water chemistry in a mobile fissured basementmassif: its role in the hydrogeological knowledge of the La
Clapiere landslide (Mercantour massif, southern Alps, France)
Y. Guglielmia, C. Bertranda,*, F. Compagnona, J.P. Follaccib, J. Mudrya
aEA 2642 Strain, Flow, Transfer, Department of Geosciences, University of Franche-Comte, 16, route de Gray, 25030 Besancon, FrancebCETE Mediterranee, avenue de Stalingrad, 06000 Nice, France
Received 1 April 1999; received in revised form 17 December 1999; accepted 27 December 1999
Abstract
Groundwater flowpaths of the La Clapiere landslide are studied by chemical and isotopic water analysis and modeling of the
landslide springs. In our case, it appears that sulfate can be taken as a chemical tracer of the different flowpaths. On the gneissic
slope of La Clapiere, geochemical modeling explains sulfate concentrations from 0 to 130 mg/l by dissolution of sulfurous
minerals present in the gneisses. Such a variability of the concentrations measured in the springs is due to different infiltration
paths: direct paths through the basement ��SO22
4 � � 10–60 mg=l or indirect path through superficial deposits like screes or
fluvio-glacial terrains which cover the basement ��SO22
4 � � 60–130 mg=l�: The high concentrations (600–800 mg/l) cannot be
explained by thermodynamic geochemical simulations, and they reveal Triassic gypsum dissolution hidden under the studied
slope. So, two main flowpaths are differentiated in the La Clapiere landslide: (1) flow through low permeable Triassic deposits
pinched under the foot of the landslide, (2) flow through a more permeable fissured basement with different flow paths; and,
consequently, with different transit times due to the anisotropic nature of the top and the central part of the landslide. q 2000
Elsevier Science B.V. All rights reserved.
Keywords: Landslide; Metamorphic rock; Water chemistry; Sulfate; Oxygen; Thermodynamic modeling
1. Introduction
The La Clapiere landslide mobilizes a huge volume
�55 × 106 m3� of a metamorphic slope in the
Mercantour massif (Follacci et al., 1988). A good
correlation exists between precipitation and landslide
velocity variations (Follacci, 1987, 1999), expressed
by 30–40 mm/day movements during snowmelt flood
periods and 5–10 mm/day during low water periods.
Groundwater drainage in such a landslide cannot be
easily studied by usual hydrogeological methods
(Antoine et al., 1994). This is due to the anisotropy
of the reservoir where piezometric measurements are
not representative. In all cases, boreholes in such a
moving media do not persist through time and so it
is impossible to follow infiltration effects. For these
reasons we develop an original approach based on the
interpretation of chemical variations of groundwaters
infiltrating in an area including the landslide. The
problem in the La Clapiere site is to know if
water content fits with water flows in two or
Journal of Hydrology 229 (2000) 138–148
HYDROL 3946
www.elsevier.com/locate/jhydrol
0022-1694/00/$ - see front matter q 2000 Elsevier Science B.V. All rights reserved.
PII: S0022-1694(00)00166-9
* Corresponding author. Tel.: 133-3-81-66-62-89; fax: 133-3-
81-66-65-58.
E-mail address: [email protected]
(C. Bertrand).

Y. Guglielmi et al. / Journal of Hydrology 229 (2000) 138–148 139
Fig. 1. Hydrogeology of the La Clapiere versant: (A) Hydrogeological map; (B) Isotopical gradient [black squares: calibration springs in
December 1995 (low-water) d18O � 22:10 ln�elevation� 1 4:18 with r � 0:989; black circles: calibration springs in June 1996 (snowmelt)
d18O � 22:92 ln�elevation� 1 10:69 with r � 0:988: Recharge elevation is plotted for calibration springs. white squares: springs sampled in
December 1995 (low-water); white circles: springs sampled in June 1996 (snowmelt). Outlet elevation is plotted for the studied springs. (C)
Piper diagram.

three well-defined areas of the reservoir (landslide,
decompressed area, stable area) or if there are a lot
of possible poles according to the infiltration transit
(e.g. one chemical output per mineralogical facies). In
the first case, chemistry leads directly to the deter-
mination of different drainage zones in the reservoir.
In the second case, the complexity of the drainage
cannot be studied and only variability is associated
with differences in transit times. The methodology
developed here consists in the comparison of hydro-
geological and water chemistry field data with
computed data issued from simulations of water–
rock interactions.
2. Geographical and geological setting
The La Clapiere landslide is located on the left bank
of the NW–SE-flowing Tinee river, near the town of
Saint-Etienne-de-Tinee (Alpes-Maritimes Prefecture,
France; Fig. 1A). It is bordered on its southeastern
side by a major tributary, the Rabuons brook, which
flows from a lake located at an elevation of 2500 m.
Nearby mountain peaks have elevations commonly
exceeding 3000 m. From the summits down to the
Tinee valley (Fig. 2), the whole slope is occupied by
two-mica gneisses of the Variscan Argentera-Mercan-
tour massif (Bogdanoff and Ploquin, 1980). The foli-
ation of the gneisses strikes N1408E on average, and
dips northeastwards with values comprised between
55 and 908. Fracturation of the slope includes three
families of faults: N10–308E, N908E and N110–
1408E. To the south-east of the Rabuons brook side,
the gneisses tectonically lie upon overturned Triassic
sedimentary strata forming a tight syncline with outer
sandstone layers and inner gypsum and cargneules
(cellular tectonized dolomites) layers (Faure-Muret,
1947; Ivaldi et al., 1991). The thrust plane separating
the gneisses from the Triassic strata is exposed in the
Cascaı brook valley. It strikes N1408E and dips about
808NE. Scree and fluvio-glacial deposits locally cover
the gneisses, especially in the upper reaches of the
Rabuons brook.
The base of the La Clapiere landslide is located at
an elevation of 1100 m and is 1 km wide. The toe
progressively overthrusts the Quaternary alluvial
deposits of the Tinee river. The top of the landslide
stands at elevation 1600 m. It consists of a 120-m
Y. Guglielmi et al. / Journal of Hydrology 229 (2000) 138–148140
Fig. 2. Schematic hydrogeological cross-section of the La Clapiere slope showing location of the different water–rock interactions (the cross-
section line appears in Fig. 1).

high, 800-m wide scarp. Due to internal cracks,
scarps, tilted terraces and numerous rock-fall accumu-
lations (screes), the surface of the landslide is quite
irregular. The head and flanks of the landslide are
rimmed by a 200-m wide transitional zone which
makes the transition between the stable slope areas
and the landslide itself. This transitional zone shows
several evidence of incipient instability: trees having
curved trunks, extension cracks, toppled blocks.
3. Hydrogeological setting
The foot of the landslide is drained by a group of
perennial springs with a total discharge estimated at
0.5 l/s (Fig. 1A; springs 14–16). On the upper part of
the landslide, several temporary springs flow on the
top of massive gneisses free from rock cover of the
intermediate area (spring 13). Outside of the land-
slide, spring outlets are observed on the edge of the
transitional dumped zone. Some of these springs
outflow directly from the basement on along different
faults directions (springs 6 and 7) or in the weathered
superficial formations (spring 5). The other springs
outflow indirectly through the fluvio-glacial and
scree deposits (springs 4, 8, 11 and 12). The mean
discharge of a single spring reaches about 0.2 l/s and
the total discharge of these lateral outflows is about
5 l/s. Very locally on the overthrusting basement/
Triassic in the Cascaı talweg, flows of 4–5 l/s were
measured (springs 9 and 10), outlining the importance
of this N1408E direction with regard to drainage. All
these springs drain the basement aquifer which is the
most important one in the La Clapiere slope.
Some springs only drain screes at the top of the
slope (springs 2 and 3) or fluvio-glacial deposits at
the foot of the slope (spring 17). These deposits
which are drained by perennial springs can so be consid-
ered as superficial perched aquifers on the basement.
The existence of perennial and temporary springs is
due to the very discontinuous Mediterranean precipi-
tation, to the lack of infiltration during frost periods in
winter, followed by massive snowmelt; and also to the
size and hydraulic conductivity of the different aqui-
fers: several temporary springs drain very local areas,
whereas springs of the foot of the landslide drain
larger areas with a low permeability.
In order to take into account any significant vari-
ations in such an Alpine mountainous area (Razafin-
drakoto, 1988; Fig. 1B), we used the following
methodology to determine the average recharge alti-
tude of the landslide springs:
• two samplings, performed during a low-water
period (December 1995), and during a snowmelt
flood period (June 1996);
• a selection of local calibration springs located
between 1100 and 2500 m, whose recharge eleva-
tion is known: black squares for low-water and
black circles for snowmelt in Fig. 1B.
All these calibration springs cannot be situated on
the framework of Fig. 1A, because several have been
sampled upstream St-Etienne-de-Tinee (Ublan—alti-
tude 1320 m, Rio de Claı—altitude 1280 m), others
downstream the valley (Bourguet—altitude 1100 m).
But they are all situated on the same side of the Tinee
valley.
• Two isotopic gradients d18O � f �elevation� are
calculated at the scale of the La Clapiere slope,
using 18O content and recharge altitude of the
springs (Compagnon, 1996; Compagnon et al.,
1997): a low-water and a snowmelt gradient can
be calculated thanks to these calibration springs.
Nevertheless, taking into account springs with a
local recharge area to define the gradients could
exhibit some influence of seasonal effect, smoothed
out in larger springs, with a longer residence time
of water. As in other Mediterranean and Alpine
areas (Mudry et al., 1994; Guglielmi et al., 1998),
these gradients fit a semi-logarithmic relation
better than a linear one: the actual evaporation
rate of these sites modulates the infiltration coeffi-
cient versus altitude, according to a semi-logarith-
mic fitting (Blavoux et al., 1992)
2d18O � 22:10 ln�elevation� 1 4:18 with
r � 0:989 in December 1995;
2d18O � 22:92 ln�elevation� 1 10:69 with
r � 0:988 in June 1996:
• The samples from the landslide springs, plotted
Y. Guglielmi et al. / Journal of Hydrology 229 (2000) 138–148 141
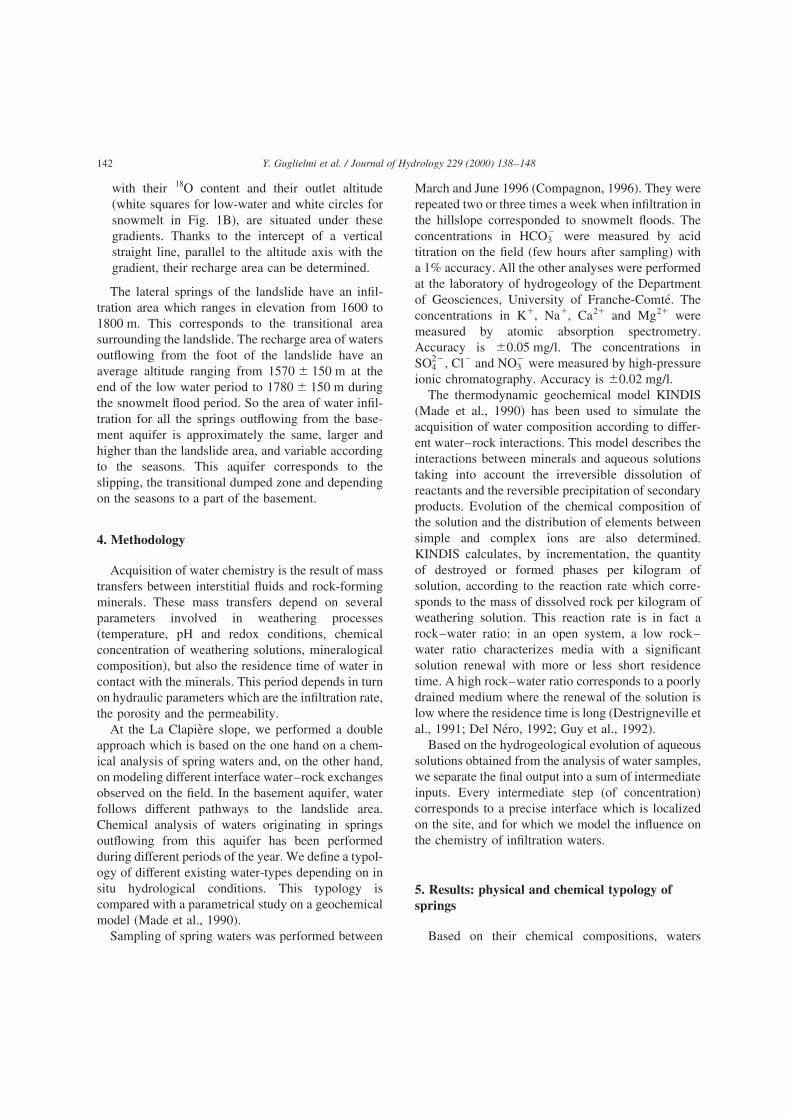
with their 18O content and their outlet altitude
(white squares for low-water and white circles for
snowmelt in Fig. 1B), are situated under these
gradients. Thanks to the intercept of a vertical
straight line, parallel to the altitude axis with the
gradient, their recharge area can be determined.
The lateral springs of the landslide have an infil-
tration area which ranges in elevation from 1600 to
1800 m. This corresponds to the transitional area
surrounding the landslide. The recharge area of waters
outflowing from the foot of the landslide have an
average altitude ranging from 1570 ^ 150 m at the
end of the low water period to 1780 ^ 150 m during
the snowmelt flood period. So the area of water infil-
tration for all the springs outflowing from the base-
ment aquifer is approximately the same, larger and
higher than the landslide area, and variable according
to the seasons. This aquifer corresponds to the
slipping, the transitional dumped zone and depending
on the seasons to a part of the basement.
4. Methodology
Acquisition of water chemistry is the result of mass
transfers between interstitial fluids and rock-forming
minerals. These mass transfers depend on several
parameters involved in weathering processes
(temperature, pH and redox conditions, chemical
concentration of weathering solutions, mineralogical
composition), but also the residence time of water in
contact with the minerals. This period depends in turn
on hydraulic parameters which are the infiltration rate,
the porosity and the permeability.
At the La Clapiere slope, we performed a double
approach which is based on the one hand on a chem-
ical analysis of spring waters and, on the other hand,
on modeling different interface water–rock exchanges
observed on the field. In the basement aquifer, water
follows different pathways to the landslide area.
Chemical analysis of waters originating in springs
outflowing from this aquifer has been performed
during different periods of the year. We define a typol-
ogy of different existing water-types depending on in
situ hydrological conditions. This typology is
compared with a parametrical study on a geochemical
model (Made et al., 1990).
Sampling of spring waters was performed between
March and June 1996 (Compagnon, 1996). They were
repeated two or three times a week when infiltration in
the hillslope corresponded to snowmelt floods. The
concentrations in HCO2
3 were measured by acid
titration on the field (few hours after sampling) with
a 1% accuracy. All the other analyses were performed
at the laboratory of hydrogeology of the Department
of Geosciences, University of Franche-Comte. The
concentrations in K1, Na1, Ca21 and Mg21 were
measured by atomic absorption spectrometry.
Accuracy is ^0.05 mg/l. The concentrations in
SO22
4 ; Cl2 and NO2
3 were measured by high-pressure
ionic chromatography. Accuracy is ^0.02 mg/l.
The thermodynamic geochemical model KINDIS
(Made et al., 1990) has been used to simulate the
acquisition of water composition according to differ-
ent water–rock interactions. This model describes the
interactions between minerals and aqueous solutions
taking into account the irreversible dissolution of
reactants and the reversible precipitation of secondary
products. Evolution of the chemical composition of
the solution and the distribution of elements between
simple and complex ions are also determined.
KINDIS calculates, by incrementation, the quantity
of destroyed or formed phases per kilogram of
solution, according to the reaction rate which corre-
sponds to the mass of dissolved rock per kilogram of
weathering solution. This reaction rate is in fact a
rock–water ratio: in an open system, a low rock–
water ratio characterizes media with a significant
solution renewal with more or less short residence
time. A high rock–water ratio corresponds to a poorly
drained medium where the renewal of the solution is
low where the residence time is long (Destrigneville et
al., 1991; Del Nero, 1992; Guy et al., 1992).
Based on the hydrogeological evolution of aqueous
solutions obtained from the analysis of water samples,
we separate the final output into a sum of intermediate
inputs. Every intermediate step (of concentration)
corresponds to a precise interface which is localized
on the site, and for which we model the influence on
the chemistry of infiltration waters.
5. Results: physical and chemical typology of
springs
Based on their chemical compositions, waters
Y. Guglielmi et al. / Journal of Hydrology 229 (2000) 138–148142
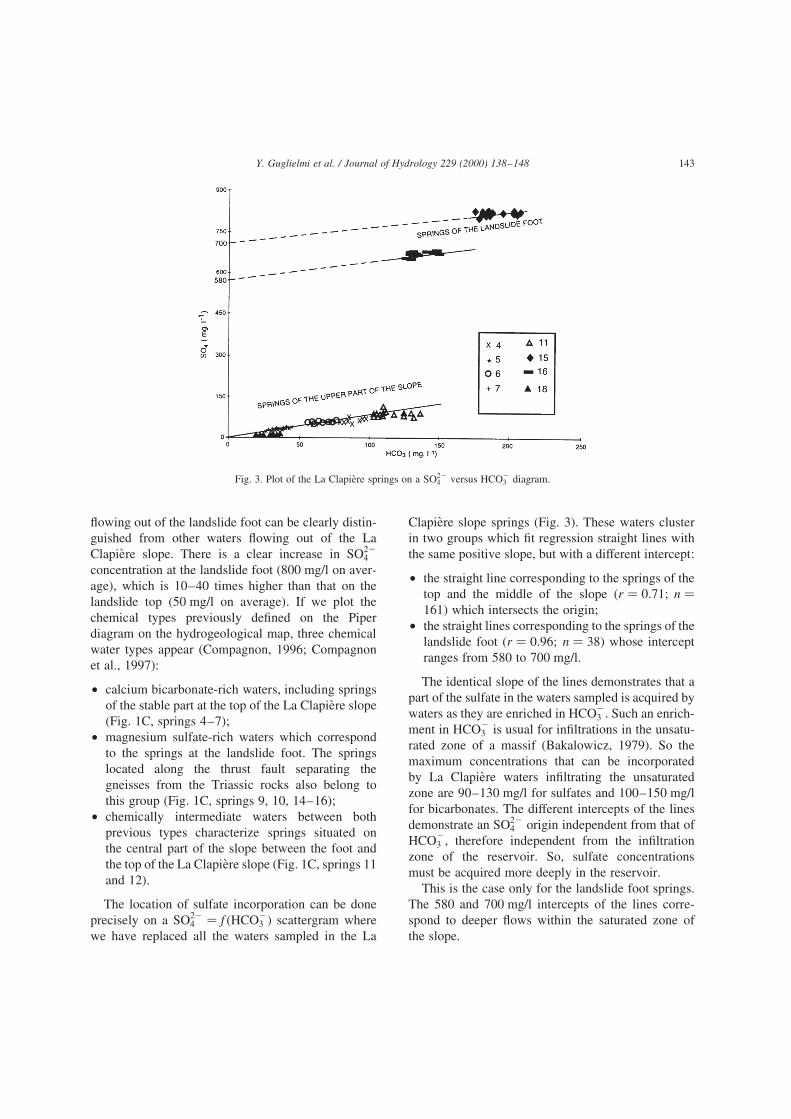
flowing out of the landslide foot can be clearly distin-
guished from other waters flowing out of the La
Clapiere slope. There is a clear increase in SO22
4
concentration at the landslide foot (800 mg/l on aver-
age), which is 10–40 times higher than that on the
landslide top (50 mg/l on average). If we plot the
chemical types previously defined on the Piper
diagram on the hydrogeological map, three chemical
water types appear (Compagnon, 1996; Compagnon
et al., 1997):
• calcium bicarbonate-rich waters, including springs
of the stable part at the top of the La Clapiere slope
(Fig. 1C, springs 4–7);
• magnesium sulfate-rich waters which correspond
to the springs at the landslide foot. The springs
located along the thrust fault separating the
gneisses from the Triassic rocks also belong to
this group (Fig. 1C, springs 9, 10, 14–16);
• chemically intermediate waters between both
previous types characterize springs situated on
the central part of the slope between the foot and
the top of the La Clapiere slope (Fig. 1C, springs 11
and 12).
The location of sulfate incorporation can be done
precisely on a SO22
4 � f �HCO2
3 � scattergram where
we have replaced all the waters sampled in the La
Clapiere slope springs (Fig. 3). These waters cluster
in two groups which fit regression straight lines with
the same positive slope, but with a different intercept:
• the straight line corresponding to the springs of the
top and the middle of the slope �r � 0:71; n �
161� which intersects the origin;
• the straight lines corresponding to the springs of the
landslide foot �r � 0:96; n � 38� whose intercept
ranges from 580 to 700 mg/l.
The identical slope of the lines demonstrates that a
part of the sulfate in the waters sampled is acquired by
waters as they are enriched in HCO2
3 . Such an enrich-
ment in HCO2
3 is usual for infiltrations in the unsatu-
rated zone of a massif (Bakalowicz, 1979). So the
maximum concentrations that can be incorporated
by La Clapiere waters infiltrating the unsaturated
zone are 90–130 mg/l for sulfates and 100–150 mg/l
for bicarbonates. The different intercepts of the lines
demonstrate an SO22
4 origin independent from that of
HCO2
3 ; therefore independent from the infiltration
zone of the reservoir. So, sulfate concentrations
must be acquired more deeply in the reservoir.
This is the case only for the landslide foot springs.
The 580 and 700 mg/l intercepts of the lines corre-
spond to deeper flows within the saturated zone of
the slope.
Y. Guglielmi et al. / Journal of Hydrology 229 (2000) 138–148 143
Fig. 3. Plot of the La Clapiere springs on a SO22
4 versus HCO2
3 diagram.
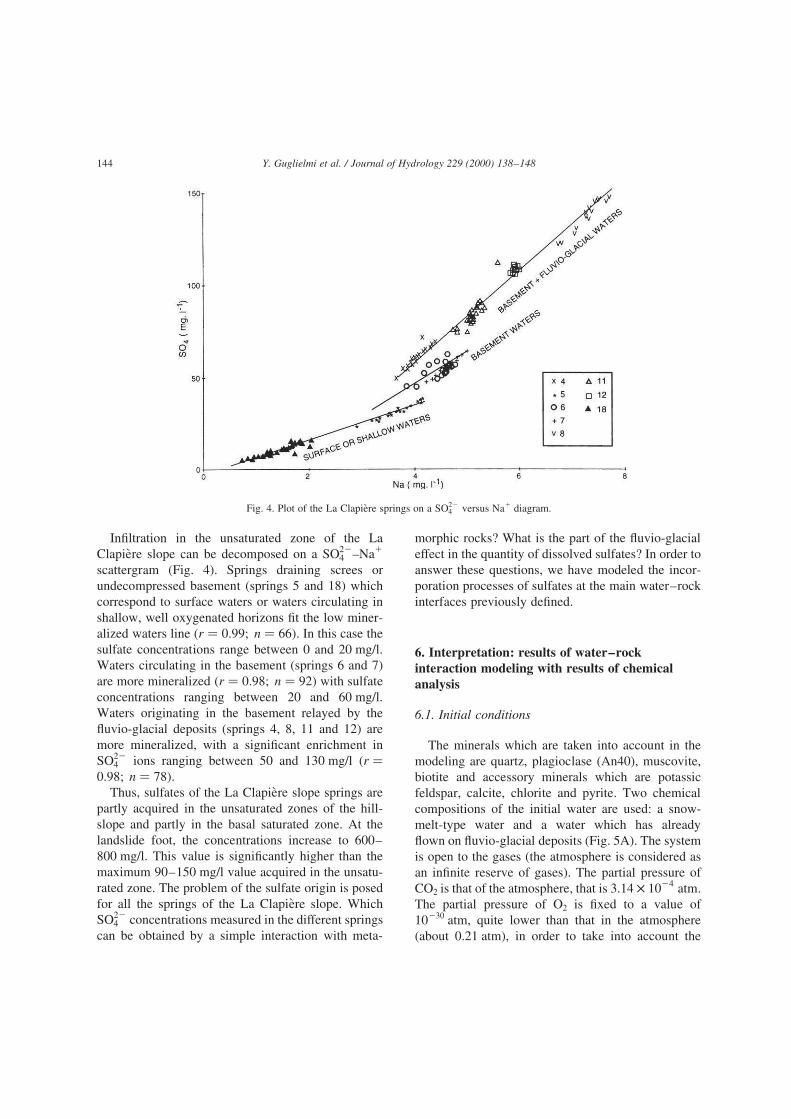
Infiltration in the unsaturated zone of the La
Clapiere slope can be decomposed on a SO22
4 –Na1
scattergram (Fig. 4). Springs draining screes or
undecompressed basement (springs 5 and 18) which
correspond to surface waters or waters circulating in
shallow, well oxygenated horizons fit the low miner-
alized waters line �r � 0:99; n � 66�: In this case the
sulfate concentrations range between 0 and 20 mg/l.
Waters circulating in the basement (springs 6 and 7)
are more mineralized �r � 0:98; n � 92� with sulfate
concentrations ranging between 20 and 60 mg/l.
Waters originating in the basement relayed by the
fluvio-glacial deposits (springs 4, 8, 11 and 12) are
more mineralized, with a significant enrichment in
SO22
4 ions ranging between 50 and 130 mg/l �r �
0:98; n � 78�:
Thus, sulfates of the La Clapiere slope springs are
partly acquired in the unsaturated zones of the hill-
slope and partly in the basal saturated zone. At the
landslide foot, the concentrations increase to 600–
800 mg/l. This value is significantly higher than the
maximum 90–150 mg/l value acquired in the unsatu-
rated zone. The problem of the sulfate origin is posed
for all the springs of the La Clapiere slope. Which
SO22
4 concentrations measured in the different springs
can be obtained by a simple interaction with meta-
morphic rocks? What is the part of the fluvio-glacial
effect in the quantity of dissolved sulfates? In order to
answer these questions, we have modeled the incor-
poration processes of sulfates at the main water–rock
interfaces previously defined.
6. Interpretation: results of water–rock
interaction modeling with results of chemical
analysis
6.1. Initial conditions
The minerals which are taken into account in the
modeling are quartz, plagioclase (An40), muscovite,
biotite and accessory minerals which are potassic
feldspar, calcite, chlorite and pyrite. Two chemical
compositions of the initial water are used: a snow-
melt-type water and a water which has already
flown on fluvio-glacial deposits (Fig. 5A). The system
is open to the gases (the atmosphere is considered as
an infinite reserve of gases). The partial pressure of
CO2 is that of the atmosphere, that is 3:14 × 1024 atm:
The partial pressure of O2 is fixed to a value of
10230 atm, quite lower than that in the atmosphere
(about 0.21 atm), in order to take into account the
Y. Guglielmi et al. / Journal of Hydrology 229 (2000) 138–148144
Fig. 4. Plot of the La Clapiere springs on a SO22
4 versus Na1 diagram.

fact that the redox equilibrium cannot be attained in
natural solutions (Michard, 1989). The 10230 atm
partial pressure of oxygen and pH determine the initial
redox potential of the solution at 560 mV for a snow-
melt water and at 437 mV for a fluvio-glacial type
water (oxidizing medium). During the modeling,
secondary phases allowed to precipitate are siderite
and gibbsite. Calcite is the only primary mineral
allowed to precipitate when it reaches saturation.
The other minerals have too slow precipitation
kinetics to precipitate at these temperatures. Simu-
lations are performed in an open medium.
6.2. Results
Theoretical curves of sulfate incorporation accord-
ing to the weathering rate of the gneisses by snowmelt
waters which are infiltrated directly or through a
fluvio-glacial surficial layer display the same general
shape (Fig. 5B):
• for reaction rates lower than 0.11 g/l, a very
progressive increase of the sulfate concentrations
correlated to a pH increase;
• for reaction rates comprised between 0.11 and
77 g/l, a linear increase of sulfate concentrations
corresponds to a decrease of the pH;
• for reaction rates higher than 77 g/l, a stabilization
of the sulfate concentration corresponds to a
steady-state pyrite dissolution.
During the simulation, sulfate concentrations are
only controlled by oxidizing dissolution of pyrite
which is the only primary mineral of the rock to
release sulfates in solution. The more oxygen there
is in the medium, the less stable is the pyrite, like
under surface weathering conditions (Deutsch,
1997). Only the pH range comprised between 5 and
8 was plotted because it fits to the pH measured on the
field (Fig. 5B). The increase of pH is due to silicate
minerals dissolution (plagioclases) which incor-
porates the protons of the solution and those brought
by pyrite dissolution. Then, when these minerals are
saturated with respect to the solution, the pH
decreases by input of protons coming from the pyrite
dissolution, until reaching values below 6 at the end of
the simulation.
Y. Guglielmi et al. / Journal of Hydrology 229 (2000) 138–148 145
Fig. 5. Simulation of water–rock interactions: (A) initial conditions; (B) simulating pH and sulfate versus reaction rate diagram; (C) plot of
measured data on the simulating pH and sulfate versus reaction rate diagram. Grey bars correspond to sulfate concentration of about 800 mg/l
and pH higher than 7.5, black circles correspond to sulfate concentrations of about 1–130 mg/l and pH ranging from 6 to 7.
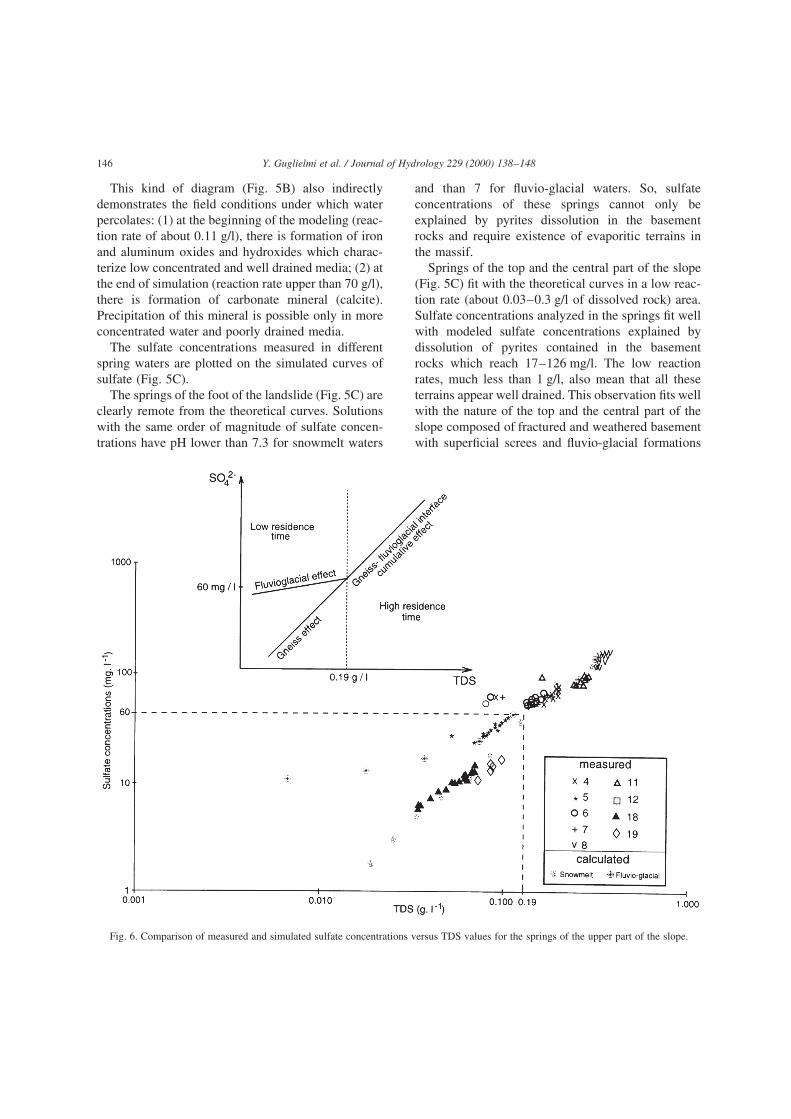
This kind of diagram (Fig. 5B) also indirectly
demonstrates the field conditions under which water
percolates: (1) at the beginning of the modeling (reac-
tion rate of about 0.11 g/l), there is formation of iron
and aluminum oxides and hydroxides which charac-
terize low concentrated and well drained media; (2) at
the end of simulation (reaction rate upper than 70 g/l),
there is formation of carbonate mineral (calcite).
Precipitation of this mineral is possible only in more
concentrated water and poorly drained media.
The sulfate concentrations measured in different
spring waters are plotted on the simulated curves of
sulfate (Fig. 5C).
The springs of the foot of the landslide (Fig. 5C) are
clearly remote from the theoretical curves. Solutions
with the same order of magnitude of sulfate concen-
trations have pH lower than 7.3 for snowmelt waters
and than 7 for fluvio-glacial waters. So, sulfate
concentrations of these springs cannot only be
explained by pyrites dissolution in the basement
rocks and require existence of evaporitic terrains in
the massif.
Springs of the top and the central part of the slope
(Fig. 5C) fit with the theoretical curves in a low reac-
tion rate (about 0.03–0.3 g/l of dissolved rock) area.
Sulfate concentrations analyzed in the springs fit well
with modeled sulfate concentrations explained by
dissolution of pyrites contained in the basement
rocks which reach 17–126 mg/l. The low reaction
rates, much less than 1 g/l, also mean that all these
terrains appear well drained. This observation fits well
with the nature of the top and the central part of the
slope composed of fractured and weathered basement
with superficial screes and fluvio-glacial formations
Y. Guglielmi et al. / Journal of Hydrology 229 (2000) 138–148146
Fig. 6. Comparison of measured and simulated sulfate concentrations versus TDS values for the springs of the upper part of the slope.

with a heterogeneous granulometry, which all are well
aired and rather permeable. The variability of sulfate
concentrations can be explained on a SO22
4 –TDS
(Total Dissolved Solid) scattergram, where the
measured TDS is compared to the one calculated
from the reaction rate (Fig. 6). A TDS lower than
0.19 g/l corresponds to low reaction rates, therefore
a short residence time. It is the case for running waters
of springs 18 and 19, and water flows in well aired
areas of springs 5. Sulfate concentrations of springs 18
and 19 are only explained by dissolution of the base-
ment in contact with snowmelt type waters, while
those of spring 5 originate in basement dissolution
by a fluvio-glacial type water. TDS value higher
than 0.19 g/l correspond to significant reaction rates,
then to longer residence times. It is the case for waters
of springs 4, 6, 7, 8, 11 and 12 originating in the
basement overlaid by fluvio-glacial. In these springs,
acquisition of sulfate concentrations higher than
60 mg/l is mainly regulated by flowpaths, and, conse-
quently by residence time of water in the terrains.
Indeed, for a TDS value higher than 0.19 g/l, SO22
4
concentrations acquired by a snowmelt type water or
by a fluvio-glacial type water are similar (Fig. 6). In
conclusion, drainage of infiltration waters through the
unweathered or weathered basement accounts for low
sulfate concentrations (,20 mg/l). Over 20 and up to
130 mg/l, the drainage of the slope is controlled by
basement-fluvio-glacial interfaces. These interfaces
increase the residence time of waters in the slope.
This is in turn induces a significant modification of
mineralization and pH of water.
7. Conclusion
Comparison of field data with the results of simu-
lations carried out with exposed basement rock
composition enables to constrain hydrogeological
hypotheses.
On the basement slope of La Clapiere, geochemical
modeling explains sulfate concentration of waters
from 0 to 130 mg/l by dissolution of sulfurous miner-
als which exist in the basement. The high concen-
trations (600–800 mg/l) cannot be explained by
results from simulations. The method then strongly
suggests existence of non-exposed rocks hidden
under the studied slope (Fig. 2). In the local geological
context, these rocks can only be Triassic gypsum
which could correspond to the extension of Cascaı
fault under the La Clapiere slope.
Also, simulation of water infiltration directly in the
basement does not explain the variability of 0–
130 mg/l sulfate concentration at springs. The role
of superficial formations which cover the basement
is displayed under two main aspects. Firstly, these
near-surface interfaces, with a different permeability
than the basement, increase the transit time of infil-
trated waters; and secondly, during water residence in
these formations, their concentration is modified. In a
basement area such as La Clapiere, where residence
time of waters in contact with the rock is short (TDS
,0.3 g/l), hydrochemical influence of these super-
ficial deposits explains up to 70% of water chemistry
at the spring.
A geochemical approach combined with the hydro-
geological one shows two main origins of water flow-
paths in the La Clapiere landslide. At the base of the
landslide, groundwaters flow through Triassic depos-
its pinched along N1408E faults located on the eastern
border of La Tinee lineament. At the top and central
parts of the landslide, groundwaters directly flow
through the fissured basement with different flowpaths
depending on the presence of Quaternary deposits,
and, consequently slightly different transit times.
These differences in the landslide drainage can be
correlated with the different mechanical behaviors:
high sliding speeds of the top and the medium and
slow speeds of the base of the landslide (Follacci, 1999).
References
Antoine, P., Giraud, A., Evrard, H., Rochet, L., 1994. A huge slope
movement at Sechilienne, Isere, France. Landslide News, 8,
ISSN 0919-5629.
Bakalowicz, M., 1979. Contribution de la geochimie des eaux a la
connaissance de l’aquifere karstique et de la karstification.
These de Doctorat de sciences naturelles, Universite Pierre et
Marie Curie, Paris VI, 269pp.
Blavoux, B., Mudry, J., Puig, J.M., 1992. Role du contexte geolo-
gique et climatique dans la genese et le fonctionnement du karst
de Vaucluse (Sud-Est de la France). In: Back, W., Paloc, H.
(Eds.), Hydrogeology of Selected Karst Regions, IAH, Interna-
tional Contributions to Hydrogeology, Vol. 13. Heise, Hann-
over, pp. 115–131.
Bogdanoff, S., Ploquin, A., 1980. Les gneiss et migmatites du
massif de l’Argentera (Alpes-Maritimes): apport de deux coupes
geochimiques. Bull. Soc. Geol. Fr. t.XXII (3), 353–358.
Y. Guglielmi et al. / Journal of Hydrology 229 (2000) 138–148 147
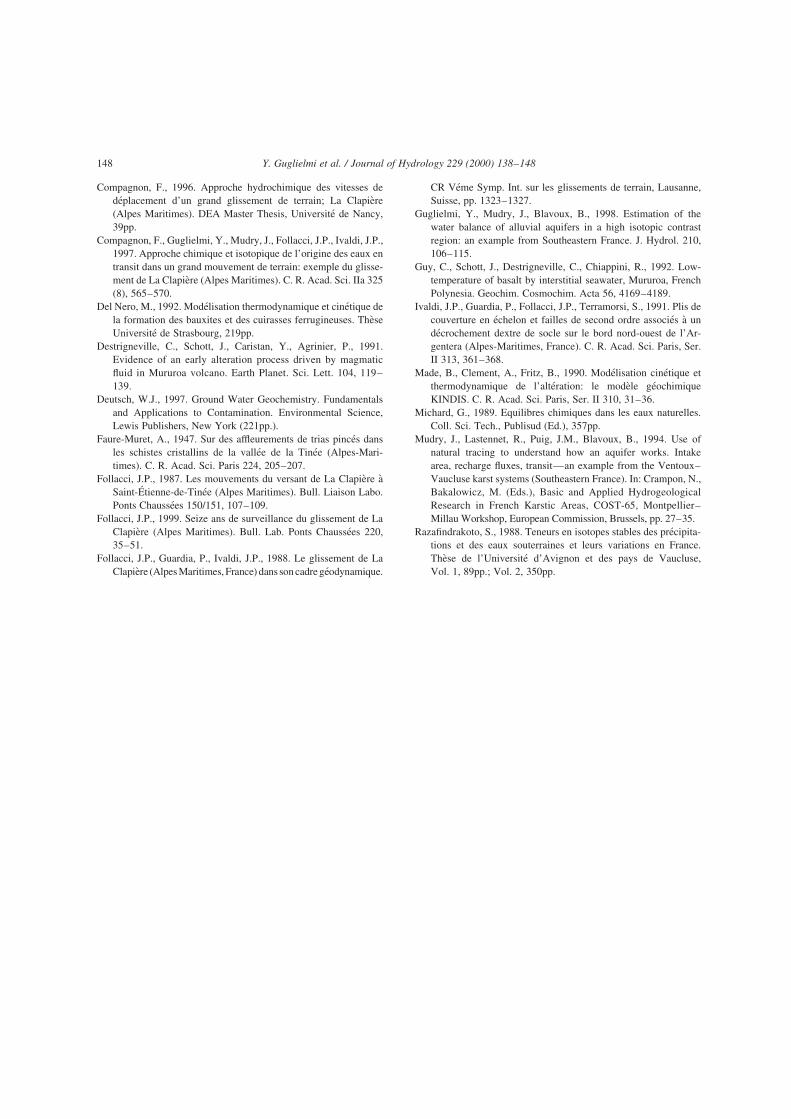
Compagnon, F., 1996. Approche hydrochimique des vitesses de
deplacement d’un grand glissement de terrain; La Clapiere
(Alpes Maritimes). DEA Master Thesis, Universite de Nancy,
39pp.
Compagnon, F., Guglielmi, Y., Mudry, J., Follacci, J.P., Ivaldi, J.P.,
1997. Approche chimique et isotopique de l’origine des eaux en
transit dans un grand mouvement de terrain: exemple du glisse-
ment de La Clapiere (Alpes Maritimes). C. R. Acad. Sci. IIa 325
(8), 565–570.
Del Nero, M., 1992. Modelisation thermodynamique et cinetique de
la formation des bauxites et des cuirasses ferrugineuses. These
Universite de Strasbourg, 219pp.
Destrigneville, C., Schott, J., Caristan, Y., Agrinier, P., 1991.
Evidence of an early alteration process driven by magmatic
fluid in Mururoa volcano. Earth Planet. Sci. Lett. 104, 119–
139.
Deutsch, W.J., 1997. Ground Water Geochemistry. Fundamentals
and Applications to Contamination. Environmental Science,
Lewis Publishers, New York (221pp.).
Faure-Muret, A., 1947. Sur des affleurements de trias pinces dans
les schistes cristallins de la vallee de la Tinee (Alpes-Mari-
times). C. R. Acad. Sci. Paris 224, 205–207.
Follacci, J.P., 1987. Les mouvements du versant de La Clapiere a
Saint-Etienne-de-Tinee (Alpes Maritimes). Bull. Liaison Labo.
Ponts Chaussees 150/151, 107–109.
Follacci, J.P., 1999. Seize ans de surveillance du glissement de La
Clapiere (Alpes Maritimes). Bull. Lab. Ponts Chaussees 220,
35–51.
Follacci, J.P., Guardia, P., Ivaldi, J.P., 1988. Le glissement de La
Clapiere (Alpes Maritimes, France) dans son cadre geodynamique.
CR Veme Symp. Int. sur les glissements de terrain, Lausanne,
Suisse, pp. 1323–1327.
Guglielmi, Y., Mudry, J., Blavoux, B., 1998. Estimation of the
water balance of alluvial aquifers in a high isotopic contrast
region: an example from Southeastern France. J. Hydrol. 210,
106–115.
Guy, C., Schott, J., Destrigneville, C., Chiappini, R., 1992. Low-
temperature of basalt by interstitial seawater, Mururoa, French
Polynesia. Geochim. Cosmochim. Acta 56, 4169–4189.
Ivaldi, J.P., Guardia, P., Follacci, J.P., Terramorsi, S., 1991. Plis de
couverture en echelon et failles de second ordre associes a un
decrochement dextre de socle sur le bord nord-ouest de l’Ar-
gentera (Alpes-Maritimes, France). C. R. Acad. Sci. Paris, Ser.
II 313, 361–368.
Made, B., Clement, A., Fritz, B., 1990. Modelisation cinetique et
thermodynamique de l’alteration: le modele geochimique
KINDIS. C. R. Acad. Sci. Paris, Ser. II 310, 31–36.
Michard, G., 1989. Equilibres chimiques dans les eaux naturelles.
Coll. Sci. Tech., Publisud (Ed.), 357pp.
Mudry, J., Lastennet, R., Puig, J.M., Blavoux, B., 1994. Use of
natural tracing to understand how an aquifer works. Intake
area, recharge fluxes, transit—an example from the Ventoux–
Vaucluse karst systems (Southeastern France). In: Crampon, N.,
Bakalowicz, M. (Eds.), Basic and Applied Hydrogeological
Research in French Karstic Areas, COST-65, Montpellier–
Millau Workshop, European Commission, Brussels, pp. 27–35.
Razafindrakoto, S., 1988. Teneurs en isotopes stables des precipita-
tions et des eaux souterraines et leurs variations en France.
These de l’Universite d’Avignon et des pays de Vaucluse,
Vol. 1, 89pp.; Vol. 2, 350pp.
Y. Guglielmi et al. / Journal of Hydrology 229 (2000) 138–148148


Hydraulic interactions between fractures and bedding planes
in a carbonate aquifer studied by means of experimentally induced
water-table fluctuations (Coaraze experimental site,
southeastern France)
A. Charmoille & S. Binet & C. Bertrand & Y. Guglielmi &J. Mudry
Abstract In aquifers with variable permeabilities, thewater exchanges between high- and low-permeabilityregions are controlled by the hydraulic head gradient.Past studies have addressed this problem mainly consid-ering steady-state hydraulic conditions. To study suchexchanges during water-table fluctuations, a spring insoutheastern France was equipped with a water-gate thatcreates 10-m artificial fluctuations of the water table. Thewater exchanges are discussed with respect to hydro-chemical and pressure measurements in the groundwater.With successive water-table fluctuations the mineralizationand pH decrease, but the bicarbonate content increases inresponse to carbon dioxide dissolution. At this scale ofsingle fractures and surroundings, the hydrochemistryallows water flows from low- or high-permeabilitydiscontinuities to be discriminated. During hydraulic headfluctuations, the waters from low- and high-permeabilitydiscontinuities become mixed. During water-table rise, the
low-permeability matrix contributed to the refilling of thepermeable faults and to the mixing of the waters. Dynamicflows in the opposite direction to the hydraulic gradientcan expel mineralized water, pushing it towards permeablediscontinuities. This mechanism could be the cause of thepeak in the mineralization recorded in some karst springsat the start of flood events.
Keywords Karst . Hydrogeochemistry .
Fractured rocks . Hydraulic properties . France .
Carbonate rocks . Conceptual models . Hydrochemistry .
Unsaturated zone
Introduction
In fractured aquifers that include a low-permeability rockbulk, the main water flow takes place in the network offractures (Rutqvist 1995). The flow in the fractures isfaster than the flow through the rock bulk (Hinds et al.2003). In such fractured aquifers, the fracturing induces asignificant permeability contrast. This characteristic isemphasized in karst systems where some flow paths areextremely developed and form channels or conduits withvery high hydraulic conductivities.
Regarding storage capacity, with the use of a four-component mixing model, Lee and Krothe (2003) showedthat the total discharge at a spring is a mixture of waterfrom drains, soil, and epikarstic and low-permeabilityfeatures. Maloszewski et al. (2002) showed that thevolume stored in the karst channels is very small (lessthan 1%), and suggested that porosity measurements inlow-permeability rock are needed. All these resultshighlight the major role of the permeable conduits as thewater transfer compartment and the important role of thelow-permeability matrix as the water storage compartmentin karst aquifer systems (Lee and Krothe 2003).
To predict the spring flow, several authors (Jeannin andGrasso 1995; Guglielmi and Mudry 2001; Martin and Dean2001) studied the water exchanges between the low-permeability matrix and conduits. They showed a reversible
Received: 13 June 2008 /Accepted: 7 April 2009
* Springer-Verlag 2009
A. CharmoilleINERIS, Parc Technologique ALATA, 60550,Verneuil-en-Halatte, France
S. Binet ())Institut des Sciences de la Terre d'Orléans (ISTO) Universitéd'Orléans – CNRS : UMR6113 – Université FrançoisRabelais - Tours – INSU,1A, rue de la Férollerie, 45071, Orleans, Francee-mail: [email protected]
C. Bertrand : J. MudryLaboratoire Chrono-environnement CNRS : UMR6249 – Universitéde Franche-Comté,16 route de Gray, 25030, Besançon, France
Y. GuglielmiGéoSciences Azur (GA) CNRS : UMR6526 – INSU – IRD :UR082 – Observatoire de la Cote d'Azur – Université de NiceSophia-Antipolis – Université Pierre et Marie Curie - Paris VI,250 rue A. Einstein, 06560, Valbonne, France
Hydrogeology Journal DOI 10.1007/s10040-009-0470-y

relationship related to hydraulic head gradient: low-perme-ability matrices discharge water to conduits, and conduitsdischarge water to low-permeability matrices. These studieswere done at the aquifer scale and do not address the watermix during transient hydraulic heads. Thus an experimentwas proposed, taking place at a sublocal scale, as defined byKiraly (1969), Teutsch and Sauter (1991), Sauter (1992) andWhite (2002) (Fig. 1) to study the water exchanges betweendrains and low-permeability matrices under transient hy-draulic heads.
The purpose of the experiment performed on thenatural test site of the Coaraze spring, in the southernAlps, France, is to define the precise relationships betweenthe permeable fractures and low-permeability matricesunder experimentally induce water-table fluctuations. Theexperiment was performed in a fractured carbonateaquifer. At this experimental site, different water-tablefluctuations (from 0 to 10 m) are generated with a water-gate that enables the control of outflowing waters. Thehydraulic heads in the low- and high-permeability matrixare monitored using pressure measurements, and theexchanges are verified using hydrochemical tracers.
Hydrogeological context
Aquifer geometryThe Coaraze natural laboratory site (Guglielmi and Mudry2001) is located in the external Alps of southeasternFrance, about 30 km north of Nice (Fig. 2). This siteconsists of a small natural reservoir (2 x 15 m) made up ofa 15-m-thick pile of fractured Cretaceous limestone, andlimited at the bottom and the top by impervious
glauconious marl layers (Fig. 2). This small reservoir isfed by water from a fault (see FA in Fig. 1b) which hasdisplaced the impermeable layer of the bottom andconnects this small aquifer to the regional aquifer.
A detailed description of the Coaraze aquifer fracturenetwork can be found in Cappa et al. (2004). The fracturenetwork of the rock mass is characterized by 26 faults(with a pluri-decametric spatial extension) that extendover the boundaries of the studied reservoir and thatspread into three clusters (Figs. 3a, b):
– 3 faults with a N50/N70 strike, dipping 70–90° SE(F11, F12 and F13). These faults have a 2–3 m spacing
– 11 faults with a N120/N140 strike, dipping 75–90° NE(F1 to F10 and F14) and with a 2–m mean spacing
– 12 bedding planes with a N40 strike, dipping 45° SE(S1 to S12) and with spacings ranging between 0.5 and1 m.
Fig. 1 Scales used in scale-dependant permeability studies in karstaquifers (after Kiraly 1969, White 2002)
A
FB
FA
a
b
FRANCE
SPAIN
ITALY
GERMANY
MEDITERRANEAN SEA
NICE
COARAZE SITE
BELGIUM
SWITZERLAND
MATRIX SATURATED WITH WATER
MATRIX ARTIFICIALLY SATURATED WITH WATER
PIEZOMETRIC HEAD
IMPERVIOUS LAYERS
BOUNDARY FAULTSLEGEND:
Fig. 2 Hydrogeological context of the Coaraze experimentalaquifer: a Three-dimensional (3D) view. b Longitudinal crosssection (after Cappa et al. 2004). Elevation (m) is relative to themain spring elevation
Hydrogeology Journal DOI 10.1007/s10040-009-0470-y
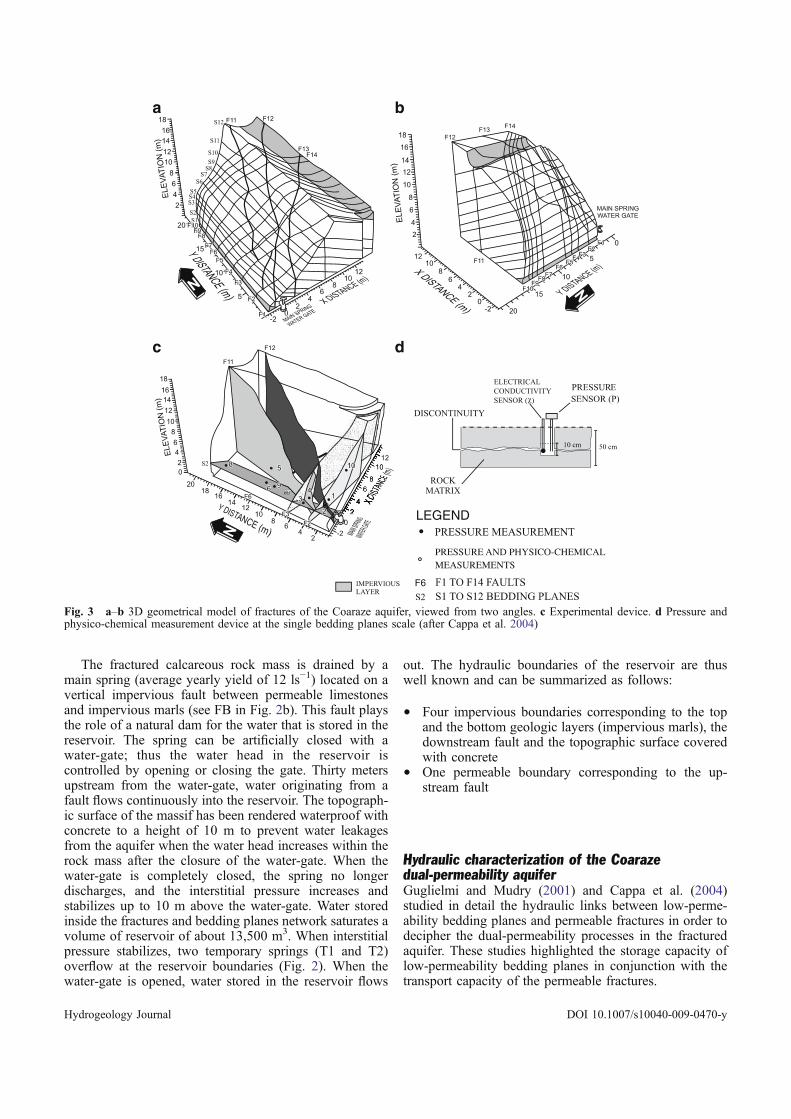
The fractured calcareous rock mass is drained by amain spring (average yearly yield of 12 ls−1) located on avertical impervious fault between permeable limestonesand impervious marls (see FB in Fig. 2b). This fault playsthe role of a natural dam for the water that is stored in thereservoir. The spring can be artificially closed with awater-gate; thus the water head in the reservoir iscontrolled by opening or closing the gate. Thirty metersupstream from the water-gate, water originating from afault flows continuously into the reservoir. The topograph-ic surface of the massif has been rendered waterproof withconcrete to a height of 10 m to prevent water leakagesfrom the aquifer when the water head increases within therock mass after the closure of the water-gate. When thewater-gate is completely closed, the spring no longerdischarges, and the interstitial pressure increases andstabilizes up to 10 m above the water-gate. Water storedinside the fractures and bedding planes network saturates avolume of reservoir of about 13,500 m3. When interstitialpressure stabilizes, two temporary springs (T1 and T2)overflow at the reservoir boundaries (Fig. 2). When thewater-gate is opened, water stored in the reservoir flows
out. The hydraulic boundaries of the reservoir are thuswell known and can be summarized as follows:
& Four impervious boundaries corresponding to the topand the bottom geologic layers (impervious marls), thedownstream fault and the topographic surface coveredwith concrete
& One permeable boundary corresponding to the up-stream fault
Hydraulic characterization of the Coarazedual-permeability aquiferGuglielmi and Mudry (2001) and Cappa et al. (2004)studied in detail the hydraulic links between low-perme-ability bedding planes and permeable fractures in order todecipher the dual-permeability processes in the fracturedaquifer. These studies highlighted the storage capacity oflow-permeability bedding planes in conjunction with thetransport capacity of the permeable fractures.
a b
d
LEGEND
Xz
PRESSURE AND PHYSICO-CHEMICAL
MEASUREMENTS
c
Fig. 3 a–b 3D geometrical model of fractures of the Coaraze aquifer, viewed from two angles. c Experimental device. d Pressure andphysico-chemical measurement device at the single bedding planes scale (after Cappa et al. 2004)
Hydrogeology Journal DOI 10.1007/s10040-009-0470-y
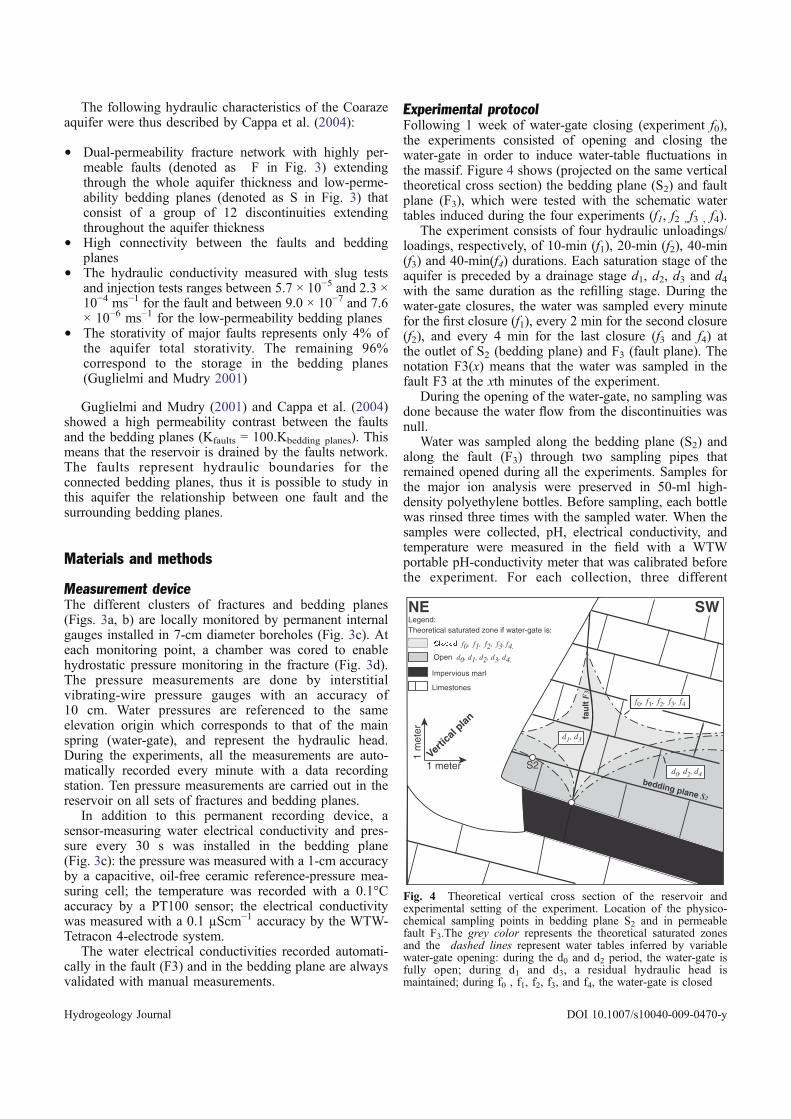
The following hydraulic characteristics of the Coarazeaquifer were thus described by Cappa et al. (2004):
& Dual-permeability fracture network with highly per-meable faults (denoted as F in Fig. 3) extendingthrough the whole aquifer thickness and low-perme-ability bedding planes (denoted as S in Fig. 3) thatconsist of a group of 12 discontinuities extendingthroughout the aquifer thickness
& High connectivity between the faults and beddingplanes
& The hydraulic conductivity measured with slug testsand injection tests ranges between 5.7 × 10⁻⁵ and 2.3 ×10⁻⁴ ms−1 for the fault and between 9.0 × 10⁻⁷ and 7.6× 10⁻⁶ ms−1 for the low-permeability bedding planes
& The storativity of major faults represents only 4% ofthe aquifer total storativity. The remaining 96%correspond to the storage in the bedding planes(Guglielmi and Mudry 2001)
Guglielmi and Mudry (2001) and Cappa et al. (2004)showed a high permeability contrast between the faultsand the bedding planes (Kfaults = 100.Kbedding planes). Thismeans that the reservoir is drained by the faults network.The faults represent hydraulic boundaries for theconnected bedding planes, thus it is possible to study inthis aquifer the relationship between one fault and thesurrounding bedding planes.
Materials and methods
Measurement deviceThe different clusters of fractures and bedding planes(Figs. 3a, b) are locally monitored by permanent internalgauges installed in 7-cm diameter boreholes (Fig. 3c). Ateach monitoring point, a chamber was cored to enablehydrostatic pressure monitoring in the fracture (Fig. 3d).The pressure measurements are done by interstitialvibrating-wire pressure gauges with an accuracy of10 cm. Water pressures are referenced to the sameelevation origin which corresponds to that of the mainspring (water-gate), and represent the hydraulic head.During the experiments, all the measurements are auto-matically recorded every minute with a data recordingstation. Ten pressure measurements are carried out in thereservoir on all sets of fractures and bedding planes.
In addition to this permanent recording device, asensor-measuring water electrical conductivity and pres-sure every 30 s was installed in the bedding plane(Fig. 3c): the pressure was measured with a 1-cm accuracyby a capacitive, oil-free ceramic reference-pressure mea-suring cell; the temperature was recorded with a 0.1°Caccuracy by a PT100 sensor; the electrical conductivitywas measured with a 0.1 µScm−1 accuracy by the WTW-Tetracon 4-electrode system.
The water electrical conductivities recorded automati-cally in the fault (F3) and in the bedding plane are alwaysvalidated with manual measurements.
Experimental protocolFollowing 1 week of water-gate closing (experiment f0),the experiments consisted of opening and closing thewater-gate in order to induce water-table fluctuations inthe massif. Figure 4 shows (projected on the same verticaltheoretical cross section) the bedding plane (S2) and faultplane (F3), which were tested with the schematic watertables induced during the four experiments (f1, f2 ,,f3 , f4).
The experiment consists of four hydraulic unloadings/loadings, respectively, of 10-min (f1), 20-min (f2), 40-min(f3) and 40-min(f4) durations. Each saturation stage of theaquifer is preceded by a drainage stage d1, d2, d3 and d4with the same duration as the refilling stage. During thewater-gate closures, the water was sampled every minutefor the first closure (f1), every 2 min for the second closure(f2), and every 4 min for the last closure (f3 and f4) atthe outlet of S2 (bedding plane) and F3 (fault plane). Thenotation F3(x) means that the water was sampled in thefault F3 at the xth minutes of the experiment.
During the opening of the water-gate, no sampling wasdone because the water flow from the discontinuities wasnull.
Water was sampled along the bedding plane (S2) andalong the fault (F3) through two sampling pipes thatremained opened during all the experiments. Samples forthe major ion analysis were preserved in 50-ml high-density polyethylene bottles. Before sampling, each bottlewas rinsed three times with the sampled water. When thesamples were collected, pH, electrical conductivity, andtemperature were measured in the field with a WTWportable pH-conductivity meter that was calibrated beforethe experiment. For each collection, three different
Limestones
bedding plane S2
fau
lt F
3
NE SW
d0, d2, d4
d1, d3
f0, f1, f2, f3, f4
Vertic
al p
lan
1 m
ete
r
1 meter
F3
S2
Impervious marl
Theoretical saturated zone if water-gate is:
f0, f1, f2, f3, f4. Open d0, d1, d2, d3, d4.
Legend:
Fig. 4 Theoretical vertical cross section of the reservoir andexperimental setting of the experiment. Location of the physico-chemical sampling points in bedding plane S2 and in permeablefault F3.The grey color represents the theoretical saturated zonesand the dashed lines represent water tables inferred by variablewater-gate opening: during the d0 and d2 period, the water-gate isfully open; during d1 and d3, a residual hydraulic head ismaintained; during f0 , f1, f2, f3, and f4, the water-gate is closed
Hydrogeology Journal DOI 10.1007/s10040-009-0470-y

samples were taken, one for alkalinity, one for majordissolved cations, and one for major dissolved anions.
Alkalinity and Ca2+ were measured within the first 12h after the campaign by titration with a potentiometrictitration workstation (model TitraLab 90®, RadiometerAnalytical®); the standard deviation for calcium wasgiven to α 0.005 mmolL−1 or α 0.3% and for alkalinityα 0.007 mmolL−1 or α 0.28%.
The cations K+, Na+, Mg2+ were analyzed with anatomic absorption spectrophotometer (Perkin Elmer1100 B®). The sensitivity of this instrument for the variouscations is as follows: K+: α 0.02 mmolL−1, Mg2+, α0.04 mmolL−1, Na+: α 0.005 mmolL−1.
Anions SO42–, NO3– and Cl– were analyzed by high-
pressure ion chromatography. The chromatograph usedwas a Dionex DX100® equipped with an automaticsampler. The accuracy is α 0.2 mgL−1.
The accuracy of the overall analysis was checked foreach sample by calculating a charge balance. All theanalyses were performed in the Hydrogeology Laboratoryof the Department of Geosciences (University of Franche-Comté).
Results and discussion
Relation between hydrochemical measurementsand aquifer rocksThe measured concentrations indicate an HCO3
− - Ca2+−Mg2+ water type and the time variations of concentrationsare (for more than 80%) explained with these three ions(Table 1). During all the experiments, Ca2+ concentrationsrange from 1.70 to 1.82 mmolL−1 (Δ=0.12), Mg2+
concentrations range from 0.56 to 0.62 mmolL−1
(Δ=0.06). HCO3− concentrations range from 3.90 to
4.25 mmolL−1 (Δ=0.35) and pH range from 7.61 to 7.7.Thus, despite their closeness (4 m) and their highconnectivity, water contained in F3 (high permeability)and S2 (low permeability) are chemically different, with a
low pH and high bicarbonate content for the beddingplane related to the fault. Table 1 shows that the waterfrom the low-permeability matrix presents higher electri-cal conductivity values than the water from the fault.
In this carbonate (CaCO3) and dolomite (CaMg(CO3)2)context, one can assess that carbonate and dolomitedissolution/precipitation are the two main factors control-ling the water chemistry evolution (White 2002). Thesedissociation equations are controlled by the CO2 concen-tration in water (Buhmann and Dreybrodt 1984, 1985;Dreybrodt et al. 1992; Liu and Dreybrodt 1997; Dreybrodtet al. 1997). These reactions can be described with Eqs.(1), (2), and (3) as follows:
CaCO3 þH2OþCO2 < ¼ > 2HCO#3 þCa2þ ð1Þ
CaMgðCO3Þ2þ 2H2Oþ 2CO2 < ¼ > Caþ2 þMgþ2þ4HCO#3
ð2Þ
CO2ðgÞþ 2H2O <¼> HCO#3 þH3O
þ ð3Þ
Based on the concentration measurements, the saturationindexes for these three reactions were calculated with thePHREEQC software and its database for equilibriumconstant and water activity calculations (Table 1).
At the scale of the three experiments, the waters areclose to the equilibrium versus dolomite (saturation indexvalues between –0.01 and 0.1) and slightly oversaturatedversus calcite (saturation index values between 0.24 and0.29). This calculation is coherent with the relativestability of the Ca and Mg measured concentrations. Thewater is close to equilibrium and no reaction betweenwater and calcite/dolomite minerals is considered in theduration of the experiments.
Table 1 Concentration of ions in water in the fault (F3) and in the bedding plane (S2) during the draining refilling experiments, sampled att=0, 40, 60, 90, and 120 min
Units F3 (0) F3 (40) F3 (60) F3 (90) F3 (120) S2 (0) S2 (40) S2 (90)
pH 7.70 7.70 7.67 7.70 7.65 7.61 7.61 7.61Cond (automatic) μScm−1 441 436 442 436 437 445 456 453T(Wa) °C 14.10 13.00 13.10 13.00 14.20 13.30 12.20 12.20
Ca2+ mmolL−1 1.70 1.76 1.77 1.76 1.80 1.79 1.82 1.82Na+ mmolL−1 0.07 0.08 0.08 0.07 0.08 0.08 0.08 0.08K+ mmolL−1 0.02 0.03 0.02 0.02 0.02 0.03 0.02 0.02Mg2+ mmolL−1 0.60 0.58 0.58 0.58 0.60 0.62 0.60 0.60HCO3
− mmolL−1 3.90 3.91 3.99 3.91 4.10 4.25 4.16 4.16F− mmolL−1 0.01 0.00 0.01 0.01 0.01 0.00 0.01 0.01Cl− mmolL−1 0.06 0.07 0.07 0.07 0.07 0.06 0.08 0.08NO3
− mmolL−1 0.01 0.01 0.01 0.01 0.01 0.01 0.01 0.01SO4
2- mmolL−1 0.29 0.39 0.35 0.39 0.31 0.28 0.37 0.38SI Calcite 0.27 0.29 0.27 0.29 0.29 0.26 0.25 0.24SI Dolomite 0.01 0.10 0.01 0.05 0.05 0.04 0.01 −0.01SI CO2(g) −2.37 −2.40 −2.37 −2.40 −2.33 −2.27 −2.28 −2.27(Cat-|An|)/(Cat+|An|) % 0.02 0.00 0.00 0.00 0.00 0.00 0.00 0.00
Hydrogeology Journal DOI 10.1007/s10040-009-0470-y

Water chemistry evolution related to water-tablefluctuationsAlthough no water/rock interaction is observed, the electricalconductivities recorded at the outlet of the bedding plane(S2) and at the outlet of the fault (F3) display an evolutionwith the closures/openings of the water-gate (Fig. 5). Theconductivity measured in the fault ranged from 436 to443 µScm−1; the conductivity measured in the bedding planeranged from 457 to 439 µScm−1 (Fig. 5).
The pH and bicarbonate concentration evolved (Fig. 6)during the experiment. The minimum and maximumvalues are observed during stabilized low water table.The minimum HCO3
− values are about 3.9 mmolL−1 and7.7 for the pH in the drained permeable fault (t0). Themaximum values are about 4.25 mmolL−1 and 7.61,respectively, and appear to be measured in the beddingplane S2 after the stabilized drainage stage (S2 (90)).
CO2 dissolution in the low-permeability matrixWater contained in the low-permeability matrix shows lowpH and high HCO3 values compared to water from thefault. The conductivity increase of 10 µScm−1 (Fig. 5) iscorrelated with a 0.3 mmolL−1 HCO3 increase and0.25 pH decrease and may result from the perturbationof the H2O-CO2−CaCO3 equilibrium.
During the draining stages, if the bedding plane hadbeen dry, the probe would have recorded a null electricalconductivity value. No null values were observed so thebedding plane was never totally dry. In these conditions,where hydraulic head is null, one can assess that thebedding plane is not saturated, which may have enabledthe possible arrival of air. In this hypothesis CO2gas is
dissolved in CO2aq, and allows the water to take HCO3−
ions and protons into solution, according to Eq. (3).Electrical conductivity increase is induced by the HCO3
−
concentration increasing in the bedding plane. The waterrecorded a new CO2 stock arrival in the low-permeabilitymatrix (Fig. 8a). As explained by some authors (Dreybrodtand Buhmann 1991; Dreybrodt et al. 1996, Fourar andBories 1999), this reaction could be very rapid in carbonatedaquifers, as a function of hydraulic parameters and physico-chemical parameters. Here, electrical conductivity curvesshow an increase during draining about 10 min before thestabilization.
Cumulative evolution of water chemistryduring successive water-table fluctuationsWhen the refilling is done, the electrical conductivities,the pH, and the bicarbonates measured in the fault and inthe joint are stabilized around an intermediate value (notedP1, P2, P3, and P4 in Fig. 6). The different volumes ofwater from low- and high-permeability discontinuitiesbecome mixed. It appears that the stabilization point of thebicarbonates for the bedding plane and the fault is evolvedfrom f1 to f4 so P1<P2<P3<P4 (Fig. 6).
The upward evolution of the stabilization point of thebicarbonates reveals a modification created by the cumu-lative draining/refilling stages (Fig. 6). This evolution iscorrelated with a downward evolution of the pH.
This increased cumulative modification may be the resultof CO2 dissolution capacity that increases with the desatura-tion of the low-permeability matrix created by the successivedraining phase. The contrast between water chemistry inlow- and high-permeability matrices increases during theexperiments.
0
2
4
6
435
440
445
450
455
460
t0 t+20 min t+60 min t+140 min Time
Hea
d (
m)
Ele
ctri
cal
Conduct
ivit
y
(µS
cm )
In the fault (F3)
In the bedding plane (S2)
Manual
f2 f3f1
d1 d3d2
P1
P2 P3
Automatic
f0
S2(40)
S2(90)
F3(60)
F3(40)F3(90)
F3(120)
S2(0)
F3(0)
f4
d4
P4
-1
Fig. 5 Hydraulic head evolution through time in S2 and F3, and automatic and manual electrical conductivity records through time in S2and F3 during refilling phases f0, f1, f2, f3, f4 and draining phase d1,d2,d3,d4. P1, P2, P3 and P4 are electrical conductivity stabilization pointsin the bedding planes and the fault for f1, f2, f3., f4 respectively. F3( x) and S2 (x) are the samples taken respectively in the fault and in thebedding plane at the time x (in minutes) from the first opening. These chemical analyses are presented in Table 1
Hydrogeology Journal DOI 10.1007/s10040-009-0470-y
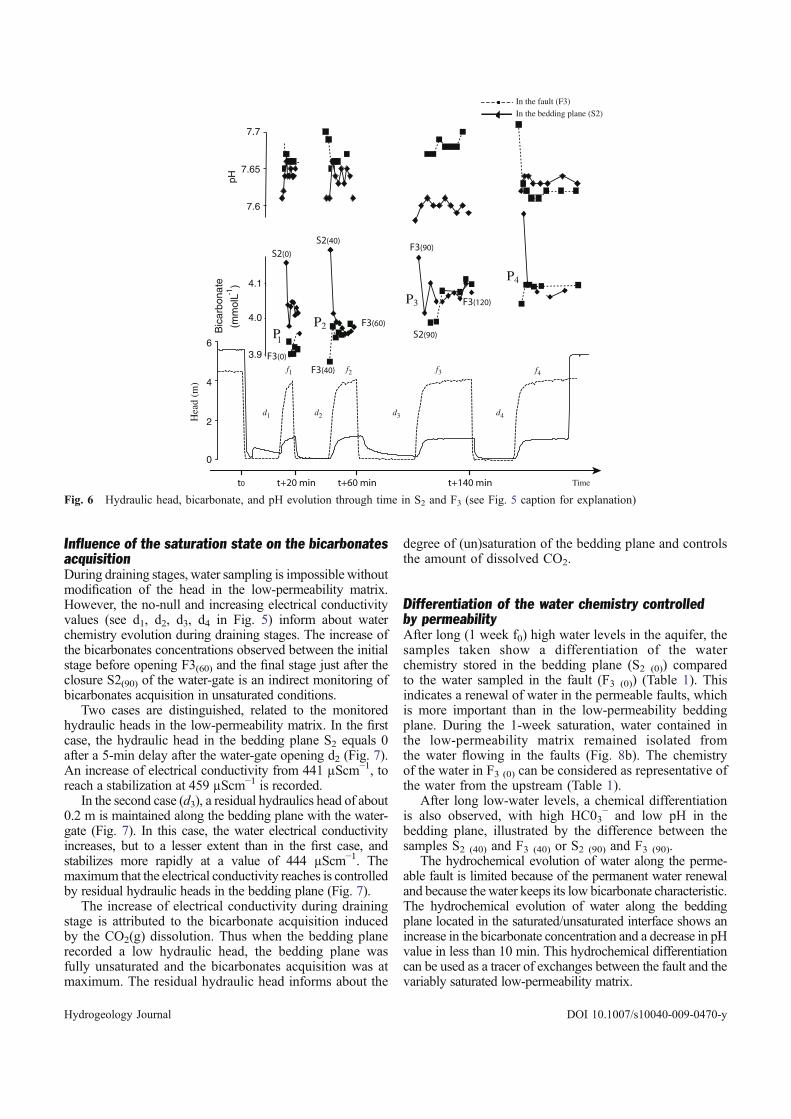
Influence of the saturation state on the bicarbonatesacquisitionDuring draining stages, water sampling is impossible withoutmodification of the head in the low-permeability matrix.However, the no-null and increasing electrical conductivityvalues (see d1, d2, d3, d4 in Fig. 5) inform about waterchemistry evolution during draining stages. The increase ofthe bicarbonates concentrations observed between the initialstage before opening F3(60) and the final stage just after theclosure S2(90) of the water-gate is an indirect monitoring ofbicarbonates acquisition in unsaturated conditions.
Two cases are distinguished, related to the monitoredhydraulic heads in the low-permeability matrix. In the firstcase, the hydraulic head in the bedding plane S2 equals 0after a 5-min delay after the water-gate opening d2 (Fig. 7).An increase of electrical conductivity from 441 µScm−1, toreach a stabilization at 459 µScm−1 is recorded.
In the second case (d3), a residual hydraulics head of about0.2 m is maintained along the bedding plane with the water-gate (Fig. 7). In this case, the water electrical conductivityincreases, but to a lesser extent than in the first case, andstabilizes more rapidly at a value of 444 µScm−1. Themaximum that the electrical conductivity reaches is controlledby residual hydraulic heads in the bedding plane (Fig. 7).
The increase of electrical conductivity during drainingstage is attributed to the bicarbonate acquisition inducedby the CO2(g) dissolution. Thus when the bedding planerecorded a low hydraulic head, the bedding plane wasfully unsaturated and the bicarbonates acquisition was atmaximum. The residual hydraulic head informs about the
degree of (un)saturation of the bedding plane and controlsthe amount of dissolved CO2.
Differentiation of the water chemistry controlledby permeabilityAfter long (1 week f0) high water levels in the aquifer, thesamples taken show a differentiation of the waterchemistry stored in the bedding plane (S2 (0)) comparedto the water sampled in the fault (F3 (0)) (Table 1). Thisindicates a renewal of water in the permeable faults, whichis more important than in the low-permeability beddingplane. During the 1-week saturation, water contained inthe low-permeability matrix remained isolated fromthe water flowing in the faults (Fig. 8b). The chemistryof the water in F3 (0) can be considered as representative ofthe water from the upstream (Table 1).
After long low-water levels, a chemical differentiationis also observed, with high HC03
− and low pH in thebedding plane, illustrated by the difference between thesamples S2 (40) and F3 (40) or S2 (90) and F3 (90).
The hydrochemical evolution of water along the perme-able fault is limited because of the permanent water renewaland because the water keeps its low bicarbonate characteristic.The hydrochemical evolution of water along the beddingplane located in the saturated/unsaturated interface shows anincrease in the bicarbonate concentration and a decrease in pHvalue in less than 10 min. This hydrochemical differentiationcan be used as a tracer of exchanges between the fault and thevariably saturated low-permeability matrix.
0
2
4
6
t0 t+20 min t+60 min t+140 min Time
Hea
d (
m)
Bic
arb
onate
(mm
olL
)
3.9
4.0
4.1
pH
P1
P2
P3
7.65
7.7
7.6
f2 f3f1
d1 d3d2
P4
In the fault (F3)
In the bedding plane (S2)
d4
f4
S2(40)
S2(90)
F3(60)
F3(40)
F3(90)
F3(120)
S2(0)
F3(0)
,
-1
Fig. 6 Hydraulic head, bicarbonate, and pH evolution through time in S2 and F3 (see Fig. 5 caption for explanation)
Hydrogeology Journal DOI 10.1007/s10040-009-0470-y

Water mixing induced by hydraulic head gradientincreasesThe intermediate 441 µScm−1 value, and all the P1, P2, P3and P4 stabilization points (Figs. 5 and 6) show that water inthe unsaturated bedding plane flows towards the fault, andthat water from the fault refilled the bedding plane. Watersfrom the discontinuities of different permeabilities aremixed. The low-permeability matrices contributed to the
refilling of the permeable faults, and to mixing of the waters(Fig. 8c) independently of the regional hydraulic gradient.
During the mixing, electrical conductivities in thebedding plane presented variable responses related to thehydraulic heads:
In the first case, before closure, the hydraulic heads in thefault and in the bedding plane are null (residual hydraulichead is about 0.05 m for d2). When the hydraulic head
CO2
CO2 dissolution
Bedding plane refilling by water
coming from the fault
Piston effect in the bedding plane
a/ Water-gate open, aquifer draining
(Unsaturated zone)c/ Water-gate closed, aquifer refilling
b/ Stabilized system, water-gate closed
(saturated zone)
Fault
Bedding plane
Contact area
between the two walls
of the bedding plane
Water/rock interactions
Flow
Fig. 8 Conceptual model of hydrochemical mixing and reactions of the couple fault/bedding plan as a function of hydraulic headvariations in the Coaraze aquifer, deduced from hydrochemical experiments realized at the metric scale. a Hydrochemical evolution of thecouple fault/bedding plane during aquifer draining. b Hydrochemical evolution of the couple fault/bedding plane during stabilized water-gate closing. c Hydrochemical evolution of the couple fault/bedding plane during aquifer refilling
0
2
4
6
435
440
445
450
455
460
0 2010
0 2010
0 2010
0 2010
Wa
ter
ele
ctri
cal c
on
du
ctiv
ity
(µ
Scm
)
He
ad
(m
)
Time (min)
Time (min)
Time (min)
Time (min)
In the fault (F3)In the bedding plane (S2)
0
435
440
445
450
455
460
0 2010 0 2010
0 2010 0 2010
Wa
ter
ele
ctri
cal c
on
du
ctiv
ity
(µ
Scm
-1)
Time (min)
Time (min)Time (min)
Time (min)
In the fault (F3)In the bedding plane (S2)
Bedding plane refilling Bedding plane draining
f3
f3
f2
f2d2
d2 d3
d3
He
ad
(m
)2
4
6
-1
Fig. 7 Water electrical conductivity in S2 compared to hydraulic head recorded in the bedding plane (S2) and in the fault (F3) duringaquifer draining d2 and d3 and during aquifer refilling f2 and f3 (automatic conductivity record)
Hydrogeology Journal DOI 10.1007/s10040-009-0470-y

increases in the fault and more slowly in the bedding plane,the conductivity falls immediately, reaches an intermediatevalue of 441 µScm−1 again after 10 min, and remains stableuntil the next event (Figs. 5 and 7).
In the second case, a residual hydraulic head about 0.2m isrecorded when the water-gate is closed; 2 min after the water-gate closure, a 10-µScm−1 peak is recorded, then theconductivity again reaches 441 µScm−1 (for example in thedrainage phase d3). The hydraulic head rise in the fault thatbounds the bedding plane induces a dynamic flow in thebedding plane that expels water contained in the beddingplane.
The electrical conductivity peaks (Figs. 5 and 7) are theresult of a piston effect induced by a hydraulic headvariation that occurs in the low-permeability zones of theaquifer and suggest a heterogeneous bedding planesurface. It can be explained by the roughness of the plane(Halihan et al. 1998; Aydin 2001). This confirms thehydraulic model previously proposed (Guglielmi andMudry 2001). During an aquifer refilling, the highlyconductive faults are refilled partly by water coming fromlow-permeability matrices with variable flow rates.
Consequences for a better understandingof hydrochemical measurements realized at karstsprings draining regional aquifersDuring high water-table levels, water contained in thelow-permeability matrix is stored. Water that flows inpermeable zones is continuously renewed. The chemicalevolution of water is limited. If this high water-table stageis interrupted by a low water-table period, hydraulic headin high-permeability faults decreases, but low-permeabil-ity media are not directly affected by this hydraulic headdecrease. The waters from low-permeability media con-tribute to the water feeding the permeable fault. Thismechanism contributes to the mineralization increaserecorded at karst springs during low water levels.
In the unsaturated zone, water is stored in the low-permeability matrix but in less proportion (for the samevolume) than in the saturated zone, and the two-phasewater/air flow induces a mineralization increase moreimportant than in saturated volumes.
During the subsequent aquifer recharge, water inflowcoming from permeable regions will contribute to refillinga part of the low-permeability ones but, at the same time,the low-permeability matrices refill the permeable ones.This mechanism could be the cause of the peak ofmineralization increase recorded in some karst springs atthe beginning of flood events and could explain the (re)mobilization of pollutants stored in the low-permeabilitymatrices when the water table is rising.
Conclusions
In aquifers with a large range of permeabilities, the waterexchanges between high- and low-permeability regionsare controlled by hydraulic head gradient. Previous studies
addressed this problem at the scale of large aquifers duringsteady-state conditions. This work, undertaken at themeso-scale (10 × 10 × 10 m) in the small Coaraze aquifer,with the help of hydrochemical tracing, allows for theprecise characterization of hydraulic relations betweenlow- and high-permeability features of a fractured aquifer,at the scale of a group of discontinuities under experi-mentally induced water-table fluctuations.
In this carbonate aquifer, no water/rock interactions areidentified. However, evolution of the water chemistry isobserved in the low-permeability matrices located at thesaturated/unsaturated interface. With successive and quickwater-table fluctuations, the global mineralization and pHdecrease, but the bicarbonate content increases, which isrelated to gas carbon dioxide dissolution. At the scale of agroup of rock discontinuities, a chemical signature ingroundwater was identified related to the permeability ofthe reservoir.
During hydraulic head fluctuations, the different volumesof water from low- and high-permeability discontinuitiesbecome mixed. During water-table rises, the low-permeabil-ity regions contributed to the refilling of the permeable faultsand to the mixing of the waters. At the same time, flowsopposite to the hydraulic gradient expelled highly mineral-ized water towards the spring. This mechanism could be theorigin of the peak in mineralization recorded in some karstsprings at the start of flood events.
This work highlights the sensitivity of hydrochemistryin characterizing the mixing process, while hydraulicmeasurements do not provide the same accuracy. Theseresults have a direct application in water management,notably in the knowledge of the mechanisms that control(re)mobilization of pollutants in a fractured aquifer duringwater-table fluctuations.
Acknowledgements Dr. Mettetal of the DIREN Franche-Comtéprovided financial support for this study. We thank HydrogeologyJournal’s Associate Editor and the two reviewers of this paper.
References
Aydin A (2001) Fracture void structure: implications for flowtransport and deformation. Environ Geol 40:672–677
Buhmann D, Dreybrodt W (1984) The kinetics of calcite dissolutionand precipitation in geologically relevant situations of karstareas *1: 2. Open system. Chem Geol 48:189–211
Buhmann D, Dreybrodt W (1985) The kinetics of calcite dissolutionand precipitation in geologically relevant situations of karstareas *2: 2. Closed system. Chem Geol 53:109–124
Cappa F, Guglielmi Y, Fenart P, Merrien-Soukatchoff V, Thoraval A(2004) Hydromechanical interactions in a fractured carbonatereservoir inferred from hydraulic and mechanical measure-ments. Int J Rock Mech Mining Sci
Dreybrodt W, Buhmann D (1991) A mass transfer model fordissolution and precipitation of calcite from solutions inturbulent motion. Chem Geol 90:107–122
Dreybrodt W, Buhmann D, Michaelis J, Usdowski E (1992)Geochemically controlled calcite precipitation by CO2 outgas-sing: field measurements of precipitation rates in comparison totheoretical predictions. Chem Geol 97:285–294
Dreybrodt W, Lauckner J, Zaihua L, Svensson U, Buhmann D(1996) The kinetics of the reaction CO2 + H2O -> H+ + HCO3
−
Hydrogeology Journal DOI 10.1007/s10040-009-0470-y

as one of the rate limiting steps for the dissolution of calcite inthe system H2O—CO2—CaCO3. Geochim Cosmochim Acta60:3375–3381
Dreybrodt W, Eisenlohr L, Madry B, Ringer S (1997) Precipitationkinetics of calcite in the system CaCO3
–H2O–CO2: the conver-sion to CO2 by the slow process H++HCO3
− -> CO2+H2O as arate limiting step. Geochim Cosmochim Acta 61:3897–3904
Fourar M, Bories S (1999) Experimental study of air-water two-phase flow in a fracture network. Comptes Rendus del’Academie des Sciences - Series IIB - Mechanics-Physics-Chemistry-Astronomy 327:765–770
Guglielmi Y, Mudry J (2001) Quantitative measurement of channel-block hydraulic Interaction by experimental saturation of alarge, natural, fissured rock mass. Ground Water 39(5):696–701
Halihan T, Wicks CM, Engeln JF (1998) Physical response of akarst drainage basin to flood pulses: example of the Devil’sIcebox cave system (Missouri USA). J Hydrol 204:24–36
Hinds JJ, Bodvarsson GS, Nieder-Westermann GH (2003) Concep-tual evaluation of the potential role of fractures in unsaturatedprocesses at Yucca Mountain. J Contam Hydrol 62-63:111–132
Jeannin P, Grasso AD (1995) Recharge respective des volumes deroche peu perméable et des conduits karstiques, rôle del’épikarst [Low permeability rock and karstic drains, theepikarst role]. Bull d’hydrogéologie 14:95–111
Kiraly L (1969) Anisotropie et hétérogénéité de la perméabilité dansles calcaires fissures [Permeability anisotropy and heterogeneityin fissured limestones]. Eclogae geologicae Helvetiae 62:613–619
Lee ES, Krothe NC (2003) Delineating the karstic flow system inthe upper Lost River drainage basin south central Indiana: usingsulphate and δ34S SO4 as tracers. Appl Geochem 18:145–153
Liu Z, Dreybrodt W (1997) Dissolution kinetics of calcium carbonateminerals in H2O–CO2 solutions in turbulent flow: the role of thediffusion boundary layer and the slow reaction H2O + CO2 -> H+ +
HCO3−. Geochim Cosmochim Acta 61:2879–2889
Maloszewski P, Stichler W, Zuber A, Rank D (2002) Identifying theflow systems in a karstic-fissured-porous aquifer the SchneealpeAustria by modelling of environmental 18O and 3H isotopes. JHydrol 256:48–59
Martin JB, Dean RW (2001) Exchange of water between conduitsand matrix in the Floridian aquifer. Chem Geol 179:145–165
Rutqvist J (1995) Determination of hydraulic normal stiffness offractures in hard rock from well testing. Int J Rock Mech MinSci Geomech Abstr 32:513–523
Sauter M (1992) Quantification and forecasting of regionalgroundwater flow and transport in a karst aquifer (GallusquelleMalm, SW Germany). Tubinger Geowissenschaftliche ArbeitenPart C 13:151
Teutsch G, Sauter M (1991) Groundwater modeling in karstterranes: scale effects data acquisition and field validation.Proceedings of the Third Conference on Hydrogeology EcologyMonitoring and Management of Ground Water in KarstTerranes Nashville TN, pp 17–35
White WB (2002) Karst hydrology: recent developments and openquestions. Eng Geol 65:85–105
Hydrogeology Journal DOI 10.1007/s10040-009-0470-y

Hydrol. Earth Syst. Sci., 13, 2315–2327, 2009
www.hydrol-earth-syst-sci.net/13/2315/2009/
© Author(s) 2009. This work is distributed under
the Creative Commons Attribution 3.0 License.
Hydrology andEarth System
Sciences
Variability of the groundwater sulfate concentration in fractured
rock slopes: a tool to identify active unstable areas
S. Binet1,2,3,5, L. Spadini2, C. Bertrand3, Y. Guglielmi4, J. Mudry3, and C. Scavia5
1Institut des Sciences de la Terre d’Orleans, ISTO, UMR 6113, Universite d’Orleans, CNRS/INSU, Universite Francois
Rabelais, Tours, Campus Geosciences, 1A, rue de la Ferollerie, 45071 Orleans cedex 2, France2Laboratoire de Geophysique interne et tectonophysique, LGIT, UMR 5559, Universite Joseph Fourier, CNRS/INSU,
Observatoire de Grenoble, BP 53, 38041 Grenoble, France3Laboratoire de Chrono-Environnement, LCE, UMR 6249, Universite de Franche-Comte, CNRS/INSU France4GeoSciences Azur (GA), UMR6526, CNRS/INSU/IRD, UR082, Observatoire de la Cote d’Azur, Universite de Nice
Sophia-Antipolis, Universite Pierre et Marie Curie, Paris VI, 250 rue A. Einstein, 06560 Valbonne, France5Dipartemento Ingegneria Strutturale e Geotecnica, DIST, Politecnico di Torino, Corso Duca Abruzzi 24, 10129 Torino, Italy
Received: 29 June 2009 – Published in Hydrol. Earth Syst. Sci. Discuss.: 6 August 2009
Revised: 29 October 2009 – Accepted: 7 November 2009 – Published: 8 December 2009
Abstract. Water chemical analysis of 100 springs from
the Orco and the Tinee valleys (Western Italy and Southern
France) and a 7 year groundwater chemistry monitoring of
the 5 main springs were performed. All these springs drain
from crystalline rock slopes. Some of these drain from cur-
rently active gravitational slope deformations.
All groundwaters flowing through presently unstable
slopes show anomalies in the sulfate concentrations com-
pared to stable aquifers. Particularly, an increase of sul-
fate concentrations was observed repeatedly after each of
five consecutive landslides on the La Clapiere slope, thus at-
testing to the mechanical deformations are at the origin of
this concentration change. Significant changes in the water
chemistry are produced even from slow (mm/year) and low
magnitude deformations of the geological settings.
Pyrite nuclei in open fractures were found to be coated by
iron oxides. This suggests that the increase of dissolved sul-
fate relates to oxidative dissolution of Pyrite. Speciation cal-
culations of Pyrite versus Gypsum confirmed that observed
changes in the sulfate concentrations is predominantly pro-
vided from Pyrite. Calculated amounts of dissolved miner-
als in the springs water was obtained through inverse mod-
elling of the major ion water analysis data. It is shown that
the concentration ratio of calculated dissolved Pyrite versus
calculated dissolved gneiss rock allows us to unambiguously
Correspondence to: S. Binet
distinguish water from stable and unstable areas. This result
opens an interesting perspective for the follow-up of sliding
or friction dynamic in landslides or in (a) seismic faults.
1 Introduction
The water in fractured rock is one of the major triggering
factors that influence the rock stability (Keefer et al., 1987).
The water saturation conditions determines the interstitial
pressure. Changing interstitial pressure may cause fracture
growth and landslides which, in turn, affect the infiltration
conditions and the groundwater pathways (Guglielmi et al.,
2005) and this potentially impacts the water transfer time
and the water saturation conditions (Bonzanigo et al., 2001).
During a deformation event, the combination of all these ef-
fects may affect, in turn, the interstitial pressure and, thus,
the overall stability of the rock masses (Forlati et al., 2001).
Thus, a good hydrogeological knowledge is necessary to re-
alize an accurate stability evaluation.
Because of the variability of crack openings, the transfer
time of individual water molecules differ strongly in these
fractured areas, dependent on the chosen flow path. The
heterogeneity of the fractured rocks and their perpetual dis-
placements makes it difficult to monitor groundwater through
installations of automated devices. Such devices are read-
ily broken and/or lost when installed in unstable areas. To
overcome these difficulties, hydrogeologists had to transfer
Published by Copernicus Publications on behalf of the European Geosciences Union.

2316 S. Binet et al.: A tool to identify active unstable areas
specific hydrogeochemical methods from karstic hydrology
(Mudry, 1990) to the unstable fractured areas (Vengeon,
1998; Guglielmi et al., 2000; Tullen, 2002) in the aim of
characterizing the groundwater flows. The results highlight
– pore water pressure triggers the gravitational deformation
– induce a motion of the entire rocky slope – a propaga-
tion of discontinuities in the rock material (Barla and Chiri-
otti, 1996; Agliardi et al., 2001). It can generate additional
cracks (Scavia, 1995) leading to a porosity and permeability
changes creating a new water pressure distribution (Binet et
al., 2007c).
Thus, in theory this hydro-mechanical deformation phe-
nomenon may generate additional reactive surface areas
which, in turn, can change the chemical weathering rate and
the groundwater chemistry. The aim of the present study is
to characterise the chemical changes of major ions of water
flowing through gravitational active faults compared to in-
active ones in a similar geological context. The changes in
the water chemistry obtained within the framework of a long
survey, indicates that sliding velocity and chemical composi-
tion are closely related. Unstable areas could be unambigu-
ously determined by an original approach, which is based on
the determination of the potentially dissolving minerals in
spring water. This result opens interesting perspectives for
monitoring the deformations and can provide a tool for the
an eventual fracture growth monitoring.
2 Material and methods
2.1 Study sites
“Tinee” (Southern Alps, France) and “Orco” (Rosone slope
in the Eastern Alps, Italy) are two Alpine valleys composed
of gneiss rocks (Fig. 1). These valleys are characterised by
continuous landslide movements (Barla and Chiriotti, 1996;
Casson et al., 2003), which shaped the landscape from the
post-glacial period (Julian and Anthony, 1996). The past
and actual landslides in these valleys may mobilize several
million cubic metres of rock. Due to the inherent risk, both
Italian and French government authorities (Follacci, 1987;
Amatruda et al., 2004) monitor the actual active slope defor-
mations. In Fig. 1, the locations and velocities of the actual
movements are symbolized by grey surfaces. In these areas,
different kinds of deformation were described by Julian and
Anthony (1996). Toppling, in the higher part of the slopes
(1500–2500 m above-sea-level), where cracks and trenches
move typically some mm per year (Fig. 1d). Downhills, ve-
locities of more than one metre per year were recorded in
1997 and 2001 by the French authorities, in the “La Clapiere”
landslide and about 1 to 10 cm in 2001 in the “Rosone”
landslide recorded by Italian authorities. The deformation
velocities are recorded using a distancemeter – tachome-
ter, the detection limits are under 1 cm/an. More detailed
methodologies of the ground deformation monitorings used
in this paper are described in Follacci (1987) and Amatruda
et al. (2004).
The flow and geological conditions are as follows: In
the Tinee valley, the rainwater infiltrates through the frac-
tured gneiss rocks at the top of the hillslope around 1500–
2000 m above sea level (m a.s.l.) and moves to the valley
(1000 m a.s.l.) (Cappa et al., 2004; Binet et al., 2007b). Wa-
ter flows through the cracks, until it reaches 100 m under the
ground surface where it arrives at the saturated zone where
it increases the pore pressure and, thus, participates in the
landslide triggering (Cappa et al., 2004). Local high perme-
able Triassic and Jurassic deposits are pinched in gneiss rock
(see T in the Fig. 1), for example under the foot of the La
Clapiere landslide (Gunzburger and Laumonier, 2002). Such
deposits were observed in the Tinee valley close to the S15
springs and at the top of the Mounier mount (Fig. 1).
In the Orco valley, water flows through a 10 m deep sub-
surface aquifer (developed in the weathered gneiss rocks and
decompressed cracks of the slope. The groundwater recharge
occurs locally in the upper part of the slope by infiltration
at about 2500–1900 m a.s.l. In this valley, the groundwater
will not be in contact with gypsum-rich Triassic formations.
Instead, some of the areas are covered by glacial deposits
which may be the principal aquifers for specific sources. The
main outflow occurs downhill from the Rosone unstable area
(around 1000 m a.s.l) (Binet et al., 2007a).
2.2 Sampling and analysis of the Alpine
crystalline rocks
Our own field trips (Binet et al., 2007a, b), combined with
previous investigations (Mazeran and Feraud, 1974; Feraud
et al., 1975; Gunzburger and Laumonier, 2002) lead to the
establishment of the list of the major rocks and associated
minerals determined in the investigated areas (Table 1).
During the field trips, the cracks retained particular at-
tention, especially when sliding patterns of rock were ob-
served inside these fractures. Figure 4a represents an exam-
ple of fractures (located by a cross in Fig. 1c) dipping West in
the slope direction reactivated by gravity deformation. The
fractures, dipping East (i.e. perpendicular to the sliding di-
rection), are non-reactivate (Guglielmi et al., 2005). Four
Samples from these reactivated and non-reactivated cracks
were carefully recovered to preserve the surfaces exposed to
air and water. 20 mm-sized particles were analysed with a
Jeol 35 CF Scanning electronic microscope. Spot chemi-
cal analysis were obtained froma X-ray Fondis microprobe
analyser.
Hydrol. Earth Syst. Sci., 13, 2315–2327, 2009 www.hydrol-earth-syst-sci.net/13/2315/2009/

S. Binet et al.: A tool to identify active unstable areas 2317
NN
0 5 km
1800m
1800
m
18
00
m
24
00
m
1200m
1200m
1800
m
2400m2400
m
2400m
2400m
24
00
m
2400m
2400
m
24
00
m
Bousiéyas
Le Pra
Corborant
Isola
Isola 2000
St.Sauveur sur Tinée
La Clapière
S15
S7
S6
S5
Mt.Tenibre(3031m)
Cime de Colle Longue(2759m)
Mt.St. Sauveur(2711m)
Mt.Gravieres(2326m)
Mt.Mounier(2817m)
Noyere
Luicetta
Saubieras
St Etiennede Tinée
gallery
Claï Haute
(c)
(d)
A
B
LEGEND:
nn Sampled spring with
Active landslide
River
Spring
France
ItalyTorino
Genève
Nice
50 km
N
(a)
SO / Ca > 0.54
SO / Ca < 0.54
Sampled spring with
Average Annual velocity of the slope S15
S5
Tinée River
(1100 m)
2350
2100
1850
1600
1350
1100
SW
EL
EV
AT
ION
(m
a.s.
l)
0 m 1000 m
NEA B
La Clapière
Sample location for SEM observations
Trench, toppled zone
Fossil landslide
PerrebellaBertodasco
ROSONE
Piantonetto
valley
Orco valley
16
15
14
32
17 18
19
1
5
6
7
23
4
910
8
20
11
12
21
N 0 500m
Ronchi
2000m
1800m
1600m
1400 m
1200 m
1000m
(b)
Metamorphic Alps (for the map A)
<mm/year >cm/yearmm/year
ella
1800m
1800m
1800m
1800m
1800m
1800m
1800m
FRANCE
SPAIN
ITALY
GERMANY
MEDITERRANEAN SEA
BELGIUM
SWITZERLAND
T T T ?
T T T T
T
T
T
TT
T
T
T
T T
T
T
T
T
T TT
T
T ?
T T T T
T T Triassic and Jurassic deposits
T
T
T
T
TTT
TT
T
T
T
T
T
T
T
T
T
T
T
G G Glacial deposits
G
G
G G
G G
13
22
Moglia:
Gera
Water draining soil
Fig. 1. (a) Structural map of the Alps with detailed map of (b) the Rosone slope (Grande Paradiso) and (c) the Tinee Valley (Mercantour
massif) (d) schematic geological cross-section through the “La Clapiere” landslide and localization of the monitored springs.
www.hydrol-earth-syst-sci.net/13/2315/2009/ Hydrol. Earth Syst. Sci., 13, 2315–2327, 2009

2318 S. Binet et al.: A tool to identify active unstable areas
Table 1. Main and secondary minerals observed in the Orco and Tinee valleys. Molar percentage and chemical equations of the dissolution
in a gneiss rock media are assessed for the La Clapiere slope by Guglielmi et al. (2000). Log (K) values come from wateq4f database (Parkust
and Appelo, 2004).
Minerals % molar Log (K) Dissociation equations
Quartz 66 −3.98 SiO2+2H2O ⇔ H4SiO4
Kmica 4.1 11.63 KAl3Si3O10 (OH)2+9H2O+H+ ⇔ K++3H4SiO4+3Al(OH)3
Phlogopite 3.0 −35.19 KMg3AlSi3O10 (OH)2+7H++3H2O ⇔ K++3Mg+2+3H4SiO4+Al(OH)3
Plagioclase solid solution between:
Albite / 4.6 NaAlSi3O8+H++7H2O ⇔ Na++3H4SiO4+Al(OH)3
Anorthite / −9.21 CaAl2Si2O8+2H++6H2O ⇔ Ca+2+2H4SiO4+2Al(OH)3
Plagioclase An 70 8.0 −9 Na0.3Ca0.7Al1.7Si2.3O8+6.3H2O+1.7H+ ⇔ .3Na++ .7Ca+2+1.7Al(OH)3+2.3H4SiO4
Secondary minerals
Pyrite / −18.48 Fe S2+3.75 O2+3.5 H2O ⇔ 4 H++Fe(OH)3+2 SO2−4
Fe oxides / 4.89 Fe(OH)3+3H+ ⇔ Fe+3+3H2O
Gibbsite / 8.11 Al(OH)3+3H+ ⇔ Al+3+3H2O
Gypsum / −4.58 Ca SO4 2H2O ⇔ Ca2++SO2−4 +2H2O
Halite / 1.58 NaCl ⇔ Na++Cl−
Dolomite / −16.54 CaMg(CO3)2 ⇔ Ca+2+ Mg+2+ 2CO−23
Calcite / −8.48 Ca CO3 ⇔ Ca2++CO2−3
2.3 Sampling and analysis of the Alpine crystalline
basement groundwater
2.3.1 Spatial variability of groundwater chemistry
The water composition of a large number of the Tinee and
the Orco valley springs was determined during the low water-
level periods (recession stage).In the Tinee valley, 92 springs
were analyzed during an intensive campaign in August 2003
(Fig. 1c). On the Orco valley, 22 springs were analyzed in
June 2004 (Fig. 1b).
Each sample was classified depending on the geological
environment of catchment (soil, gneiss rock, glacial or Tri-
assic deposits in Fig. 1 based on geological map described
in Faure-Muret, 1955) and on the stability of the correspond-
ing formations (are some rock deformations known in the
catchment or not?). The stable/unstable classification was
based on geomorphological observations and on prior slope
stability studies performed in these two valleys (Forlati et al.,
2001; Julian and Anthony, 1996). The “La Clapiere” region
and the Rosone slope are known to be a very unstable area.
In all these sites, the water flows from soil to the gneiss rock
but in different environments of slope stabilities: Unstable
for S15 and S5 La Clapiere (Tinee) and Bertodosca Rosone
(Orco) springs, and stable for Luicetta (Tinee) and Moglia
(Orco) springs.
Corresponding sulfate and calcium data of all springs are
given in Fig. 3, and Table 2 gives the complete water chemi-
cal analysis for the main springs draining through gneiss rock
of the two valleys.
2.3.2 Temporal variability of groundwater chemistry
Previous studies pointed to the S15 spring, situated down-
stream of the landslide, drains the water flowing through
this unstable area (Guglielmi et al., 2000, 2002). The wa-
ter composition and the temporal variability of this spring
were consequently studied in the framework of a nine year
survey (1995 to 2004). Table 3 presents the complete water
chemical analysis of the S15 spring situated at the foot of the
landslide for ten dates that characterise the surrounding data,
and Fig. 4 represents the sulfate concentrations of the whole
survey.
The periods of freshwater intrusion into the S15
aquifer downstream needs to be identified. The presence
of groundwater Nitrate levels above the detection limit
(>0.001 mmol/L) correlated to meteorological events (snow
melting and rainfall), whereas in the recession stages (low
water period) showed that nitrate contributions decreased be-
low the detection limit. The recession stages where conse-
quently associated with periods of null nitrate concentration.
The sulfate measurements realized during the low water pe-
riod are plotted in Fig. 4 with a square symbol. Such exhaus-
tive long-time surveys are not available for the other sites.
2.3.3 Analytic protocol
Aqueous K, Na, Ca and Mg concentrations were measured
after acidification on a Perkin Elmer A Analyst 100 atomic
absorption spectrometer (AAS); SO−24 , Cl− and NO−
3 were
obtained from High Pressure Ionic Chromatography (HPLC,
Hydrol. Earth Syst. Sci., 13, 2315–2327, 2009 www.hydrol-earth-syst-sci.net/13/2315/2009/

S. Binet et al.: A tool to identify active unstable areas 2319
Table 2. Spatial variability of water quality recorded on the six major springs from the two studied valleys. S5 refers to the spring of the La
Clapiere (Tinee) site. Calculated values of the saturation index (SI) and inversed values of the amount of dissolved minerals (positive values
means dissolution, negative values means precipitation, inversed O2 values exceed the saturation limit, this means that the system is open for
oxygen).
Spring S5 Luicetta Gallery Bertod. Moglia Gera Soil
Sample ID S5(1) S5(2) S5(3) S5(4) S5(5) S5(6) L(1) L(2) G(1) G(2) B(1) M(1) Ge(1) S
Sampling date 12.98 04.99 09.00 06.02 08.03 04.04 05.03 07.04 03.03 04.04 06.04 06.04 06.04 03.03
Aquifer type Toppling zone Stable Stable Unstable Stable Stable Soil
Location Tinee valley Tinee valley Tinee valley Rosone
Measured values
Velocity (mm/mo) <1 <1 <1 <1 <1 <1 / / / / 10 / / /
Rain (mm/mo) 34 117 97 57 40 72 0 0 0 72 0 0 0 /
Yield (l/s) / 0.10 0.10 0.10 0.1 0.15 4.75 4.5 0.05 0.01 2.0 5 0.7 /
Conductivity (µS/cm) 199 136 229 160 189 158 152 163 400 333 28 60 84 28
Temp (◦C) 8.2 8.0 12.0 10.0 11.3 7.7 9.9 11.9 10.1 11.3 6.1 8.1 7 6.40
pH 7.5 7.1 7.9 8.0 7.5 6.9 8.1 8.0 7.9 8.2 7.7 8.0 8.2 5.50
Eh (mV/H2) 460 455 460 625
HCO−3 (mmol/L) 1.20 0.90 0.80 0.80 0.84 0.72 1.1 1.08 2.55 2.29 0.20 0.42 0.44 0.10
Cl− (mmol/L) 0.02 0.02 0.06 0.02 0.08 0.03 0.03 0.04 0.05 0.06 0.02 0.02 0.15 0.02
SO2−4 (mmol/L) 0.48 0.28 0.53 0.50 0.51 0.38 0.19 0.17 0.79 0.59 0.05 0.06 0.07 0.03
Ca2+ (mmol/L) 0.70 0.51 0.56 0.70 0.78 0.47 0.65 0.62 1.85 1.50 0.06 0.18 0.21 0.03
Mg2+ (mmol/L) 0.18 0.12 0.19 0.12 0.13 0.17 0.09 0.09 0.12 0.12 0.02 0.03 0.05 0.02
Na+ (mmol/L) 0.38 0.21 0.22 0.20 0.29 0.26 0.15 0.11 0.22 0.2 0.07 0.08 0.23 0.02
K+ (mmol/L) 0.04 0.04 0.07 0.04 0.04 0.06 0.02 0.03 0.03 0.03 0.04 0.05 0.03 0.02
NO−3 (mmol/L) 0.006 0.019 0.016 0.006 0.006 0.024 0.006 0.006 0.006 0.015 0.035 0.031 0.019 0.000
SO4/Ca 0.69 0.55 0.94 0.71 0.66 0.81 0.29 0.28 0.43 0.39 0.76 0.33 0.32 0.83
Electrical balance % 0.2 −0.8 3.4 −1.6 −4.9 −2.5 −4.6 −3.3 0.0 0.6 3.3 0.8 −5.1 8.57
Calculated values
Fe (mmol/L) 3E-06 4E-06 4E-06 3E-06 3E-06 3E-06 3E-05 4E-06 3E-06 3E-06 1E-06 2E-06 2E-06 4E-4
PCO2 (log(atm)) −2.7 −2.4 −3.2 −3.4 −2.8 −2.3 −3.3 −3.3 −2.8 −3.2 −3.5 −3.3 −3.5 −1.80
Eh (mV/H2) 551 597 460 460 462 457 417 482 542 417 435 478 441 630
SI pyrite −181 −190 −172 −169 −191 −198 −164 −192 −179 −177 −192 −176 −172 −220
SI gypsum −2.1 −2.5 −2.2 −2.1 −2.1 −2.4 −2.5 −2.6 −1.6 −1.8 −4.0 −3.5 −3.4 −4.39
SI calcite −0.9 −1.5 −0.7 −0.5 −0.9 −1.8 −0.3 −0.4 0.3 0.5 −1.9 −1.6 −1.2 −5.60
Inversed values
Pyrite (mmol/L) 0.25 0.12 0.25 0.24 0.24 0.18 0.08 0.08 0.38 0.29 0.013 0.01 0.02
Input
dat
afo
rca
lcula
tion
Plagioclase (mmol/L) 1.01 0.63 0.69 0.74 0.6 0.67 0.6 0.61 2.7 2.25 0.95 0.18 0.52
Phlogopite + Kmica (mmol/L) 0.04 0.02 0.06 0.03 0.03 0.04 0.02 0.02 0.03 0.03 0.01 0.01 0.01
Calcite (mmol/L) / / / / / / / / −0.7 −1.05 / / /
Gibbsite (mmol/L) −1.76 −1.10 −1.20 −1.52 −1.5 −1.2 −1.18 −1.2 −5.3 −5.26 −0.12 −0.32 −0.89
Fe(OH)3(a) (mmol/L) −0.25 −0.12 −0.20 −0.23 −0.2 −0.19 −0.08 −0.1 −0.4 −0.29 −0.01 0 −0.02
O2(g) (mmol/L) 0.97 0.46 0.78 0.88 0.88 0.72 0.31 0.3 1.43 1.07 0.03 0.05 0.05
CO2(g) (mmol/L) 0 0 0 0 0 0 0 0 0 0 0 0 0
Gneiss = 6Plag. + Phlo. 1.05 0.65 0.75 0.77 0.63 0.71 0.62 0.63 2.73 2.28 0.96 0.19 0.53
Py/Gneiss (mmol/L) 0.24 0.18 0.33 0.31 0.38 0.254 0.129 0.13 0.14 0.13 0.01354 0.0526 0.038
Dionex DX 100) measurements, the alkalinity (HCO−
3concentration) was obtained using standard titrimetric meth-
ods. Detection limits are 0.005 and 0.002 mmol/L for AAS
and HPLC tools and the precisions are 5%±1% for AAS,
HPLC and alkalinity.
3 Results: field measurements of water quality and
correlation with unstabilities
3.1 Analysis of in situ gneiss matrix and fractures walls
Gneiss rock is the dominant rock found in both val-
leys. The mineralogical composition, of Tinee gneiss rock
was previously determined by Mazeran and Feraud (1974)
and Feraud (1975): 66% quartz, 3% Biotite, 4% Kmica,
8% Plagioclase solid solution with 70% of Anorthite and
30% of Albite. The global mineralogical composition of the
Rosone gneiss rock described in Amatruda et al. (2004) ap-
pears to be similar to the Tinee gneiss rock.
Inside cracks, secondary minerals such as pyrite, calcite
and amorphous Ferric oxides were found beneath the essen-
tial primary minerals forming the gneiss rock found every-
where else.
The microprobe analysis confirmed the presence of S in
active fractures, and the presence of Fe and O beneath the
usual Si, Al, O, Na, Mg, K, Ca gneiss rock constituting
elements composition. Image analysis revealed that the cor-
responding sulfur (Fig. 2b) and Fe oxide minerals (Fig. 2b),
of active and inactive fractures, are localized.
www.hydrol-earth-syst-sci.net/13/2315/2009/ Hydrol. Earth Syst. Sci., 13, 2315–2327, 2009

2320 S. Binet et al.: A tool to identify active unstable areas
Granular deposits 2 m2m
Fe, O
O, Al, Si, Mg, K, Ca, S,
(a) Cross section (b) sample 1 (c) sample 2
Sliding direction
Fracture activated by the slidingFracture inactive
Sample 2
Sample 1W E
S,
Fe
Fig. 2. Localization and observations of fracture walls: (a) Localization of fractures in a cross-section with sliding displacements along
fracture dipping towards West (b) electronic microscope and micro-probe results in an active (dipping west, sample 1) fracture and (c) in an
inactive (dipping Est, sample 2) fracture covered with a thin ferric layer.
3.2 Water chemistry composition
3.2.1 Dependent on geological formations
The water (four samples) from the soil has a 580–
650 mV/H2 redox value and the bicarbonate concentration is
0.1 mmol/L±0,01. The calculated log of the CO2 pressures
ranges from −1.7 to −1.9. Average values are presented in
Table 2.
The water from gneiss rock (quartz, biotite, Kmica, pla-
gioclase and pyrite) is characterised by low Mg2+ concen-
trations, (0.02 to 0.18 mmol/L) low electric conductivity
(<500 µS/cm), and strongly variable SO2−
4 concentrations
(0.03 to 0.79 mmol/L, Table 2).
The water collected from downstream Triassic-Jurassic
formations is characterised by high SO2−
4 concentra-
tion (>1 mmol/L, “Mont Mounier” downhill springs
and S15, Fig. 3a insert), high electrical conductivi-
ties (>500 µSiemens/cm) and high Mg2+concentrations
(>1.5 mmol/L). This suggests the dissolution of Ca-Mg-SO4
gypsum dolomite Triassic formations (Fig. 1). This applied,
for example, to the S15 spring (Table 3). This variability was
already described in a previous study (Guglielmi et al., 2000;
Binet et al., 2007b). Such water interacted supposedly with
limestones, gypsum and pyrite.
Figure 3 presents the SO4 versus Ca concentration ratios
of the Tinee (Fig. 3a) and the Rosone slope (Fig. 3b) springs.
The data presented are dependent on geological and geomor-
phological conditions. In both valleys, the water from gneiss
rock type are characterised by a constant SO4/Ca ratio of 0.2–
0.3. Triassic rock presents a ratio of 1, but with an offset of
around 0.8 mmol/L of calcium for 0 mmol/L of sulfate. Wa-
ter flowing through Triassic rocks is, thus, characterised by
a ratio of 1 with high concentrations in calcium and sulfate.
A ratio smaller than 0.1 corresponds to the glacial deposit
types, which was only observed in the Rosone slope.
3.2.2 Dependent on stable/unstable zones
In the Tinee valley, the ”La Clapiere” (S15, S5, S6),
“Noyere”, “Pra” and “Saubieras” springs drain from cur-
rently unstable areas (displacements of >1 mm/year, gray
shaded in Fig. 1). The three Rosone slope springs, 14, Berto-
dasco 5 and Perrebella 4, are known to be located in the mov-
ing zone (Fig. 1b, (Amatruda et al., 2004)). The SO4/Ca
concentration ratios of all these waters from unstable slopes
are higher than 0.5 (big circles in Fig. 1), contrary to all wa-
ter from stable zones (Fig. 3). This single parameter allows
the discrimination of moving versus non-moving zones. This
means that the ground movements correlates with excess sul-
fate concentrations in the water compared to calcium.
3.2.3 Dependent on landslide motion
The S15 spring is characterised by a particularly high SO4
concentration during the recession stage. The long observa-
tion period of the S15 spring (Fig. 4) shows that the sulfate
changes with time and relates to the landslide acceleration
(strong accelerations are grey shaded in Fig. 4). Thus, in
4/1996, a 8.5 mmol/L concentration (see S15(0) in Table 3)
after an high acceleration is observed. It then decreases to
7.9 in the low movement period until 12/1996. Similarly in
1999, after a relatively long low movement period (concen-
tration at 6.2 mmol/L in S15 (1 and 2) in May 1999), the
concentrations increased to 7 in December 1999. Two short
increases of the concentrations from 6.8 to 8.8 and to 6 to
6.5 mmol/L is also observed in 2000. The 02/2001 accelera-
tion of the landslide is correlated with 7.4 sulfate concentra-
tion (S15(4)). Then an overall decrease from 2002 (see S15
(7, 8 and 9)). These movements correlate qualitatively and
positively to the landslide acceleration. Note that the S15(5)
analysis is an example of a no null nitrate value. The water
is influenced by fresh water intrusion.
Hydrol. Earth Syst. Sci., 13, 2315–2327, 2009 www.hydrol-earth-syst-sci.net/13/2315/2009/

S. Binet et al.: A tool to identify active unstable areas 2321
Table 3. Temporal variability of water quality recorded on the S15 springs draining the la Clapiere landslide. Calculated values of the
saturation index (SI) and inversed values of the amount of dissolved minerals (positive values means dissolution, negative values means
precipitation, inversed O2 values exceed the saturation limit, this means that the system is open for oxygen).
Spring S15
Sample ID S15(0) S15(1) S15(2) S15(3) S15(4) S15(5) S15(6) S15(7) S15(8) S15(9)
Sampling date 04.96 12.98 05.99 07.00 02.01 04.01 11.01 06.02 09.03 04.04
Aquifer type Moving zone: La Clapiere landslide
Measured values
Velocity (mm/mo) 1500 36 23 66 1437 1241 35 8 22 21
Rain (mm/mo) / 34 90 158 106 31 24 57 71 72
Yield (l/s) 0.20 0.15 0.10 0.10 0.10 0.10 0.10 0.10 0.10 0.12
Conductivity (µS/cm) 1496 1440 1404 1331 1518 902 1523 1508 1519 1198
Temp (◦C) 11.3 8.2 16.6 20.0 9.7 9.4 9.6 12.1 12.4 9.7
pH 7.2 8.0 7.9 74 81 7.5 8.0 7.7 7.9 8.2
Eh (mV/H2) 515 453
HCO−3 (mmol/L) 2.88 3.64 3.00 1.50 1.72 1.25 3.68 3.72 3.68 2.00
Cl− (mmol/L) 0.09 0.17 0.15 0.13 0.13 0.20 0.12 0.18 0.10 0.13
SO2−4 (mmol/L) 8.55 6.76 6.24 6.33 7.45 6.34 7.33 7.92 6.27 6.11
Ca2+ (mmol/L) 4.50 5.75 5.95 4.65 6.12 4.42 5.85 6.35 4.50 4.50
Mg2+ (mmol/L) 4.46 2.23 1.98 2.14 2.29 1.98 2.35 2.52 3.22 1.95
Na+ (mmol/L) 0.72 0.99 0.70 0.86 0.81 0.71 0.84 0.84 0.74 0.94
K+ (mmol/L) 0.15 0.15 0.15 0.19 0.22 0.11 0.22 0.19 0.12 0.23
NO−3 (mmol/L) 0.000 0.000 0.000 0.000 0.000 0.003 0.000 0.013 0.011 0.005
SO4/Ca 1.9 1.2 1.1 1.4 1.2 1.4 1.3 1.3 1.4 1.4
Electrical balance % 3.3 0.7 −3.3 −1.2 −3.2 1.8 2.8 2.6 0.0 1.0
Calculated values
Fe (mmol/L) 2E-6 2E-06 8E-06 2E-05 3E-06 4E-06 3E-06 4E-06 4E-06 3E-06
PCO2 (log(atm)) −3.36 −2.75 −2.58 −2.51 −3.22 −2.91 −3.13 −2.50 −3.35 −3.29
Eh (mV/H2) 550 457 552 562 542 566 479 513 525 412
SI pyrite −181 −184 −192 −185 −168 −188 −176 −179 −179 −161
SI gypsum −0.50 −0.49 −0.59 −0.61 −0.49 −0.64 −0.52 −0.48 −0.84 −0.65
SI calcite 0.30 0.77 0.82 −0.10 0.57 −0.55 0.44 0.58 0.53 0.55
Inversed values
Pyrite (mmol/L) 1.57 0.66 1.28 1.27 1.23 1.66 1.80 1.73 1.53 1.50
Gypsum (mmol/L) 4.27 5.73 3.97 3.93 5.33 3.05 3.33 4.03 3.17 2.95
Plagioclase = An70. (mmol/L) 2.10 2.69 1.83 2.43 2.27 1.7 2.4 2.2 2.13 2.7
Phlogopite + Kmica (mmol/L) 0.13 0.13 0.13 0.17 0.2 0.72 0.2 0.17 0.1 0.21
Dolomite (mmol/L) 4.00 1.7 1.57 1.62 1.67 0.13 1.73 1.99 2.91 1.31
Calcite (mmol/L) −0.9 −2.96 −1.15 −2.66 −2.69 0 −0.81 −1.16 −3.13 −1.7
Gibbsite (mmol/L) −3.72 −4.69 −3.25 −4.31 −4.05 −3.84 −4.28 −3.91 −3.73 −4.8
Fe(OH)3(a) (mmol/L) −1.51 −1.83 −1.28 −1.27 −1.23 −1.66 −1.8 −1.73 −1.53 −1.49
O2(g) (mmol/L) 5.62 2.49 4.78 4.77 4.62 6.23 6.75 6.5 5.74 5.62
CO2(g) (mmol/L) 0 0 0 0 0 0 0 0 0 0
Gneiss = 6Pla. + Phlo. (mmol/L) 2.13 2.82 1.96 2.6 2.47 2.39 2.6 2.37 2.23 2.91
Py/Gneiss (mmol/L) 0.7371 0.234 0.6531 0.4885 0.498 0.6946 0.6923 0.73 0.6861 0.5151
www.hydrol-earth-syst-sci.net/13/2315/2009/ Hydrol. Earth Syst. Sci., 13, 2315–2327, 2009

2322 S. Binet et al.: A tool to identify active unstable areas
2
4
6
8
2 4 6Calcium
Sulfate
S15 (1-10)
S5 (1-6)
S6
S7
Luicetta, L(1); L(2)
Noyéré
Saubieras
Gallery G(1)
Linear correlation
LEGENDStable zone Moving zone > 1 mm/ year
Water from gneissic rock
Water from glacial depositsWater from triassic limestones
11
Perrebella
4
Bertodasco, 514
13
9
18
6
3
2
12
Geological context
0 0.4 0.8 1.2 1.6 2.0
Calcium (mmol/L)
0
0.6
1.0
S
ulfa
te (
mm
ol/L
)
0 0.1 0.2 0.3 0.4
0
0.04
0.08
0.2
Calcium (mmol/L)
S
ulfa
te (
mm
ol/L
)
0.4
0.8
0.02
0.06
0.1
(b) DATA FROM ROSONE SLOPE
(a) DATA FROM TINEE VALLEY
21
Water from soil
Gallery G(2)
0
S=1
Mounier
20S= 0.1
S = 0,3
S = 1
S= 0.3
Fig. 3. Spatial variability of solute concentration measured in the
springs of gneiss rock aquifers: (a) in the Tinee valley ( S15 is in
an insert) and (b) in the Rosone slope. The symbol form is related
to the geological context, the black symbols are related to spring
draining a unstable slope.
4 Modelling of water rock interaction
4.1 Modelling working assumptions
Speciation modelling of the rock-water interactions were per-
formed with the PHREEQC code and the integrated wateq4f
database (Parkust and Appelo, 2004). The model gneiss
rock compositions is based on referenced analysis (see previ-
ous section), except that Biotite was replaced by Phlogopite,
i.e. the end member of the Phlogopite – Siderophillite solid-
solution system, as solubility data for the latter compound
was not available.
The soil water is considered representing the initial chemi-
cal composition of the flowing groundwater (Guglielmi et al.,
2002). The mean bicarbonate concentrations of the four sam-
ples is 0.1 mmol/L±0.1 (analysis Soil in Table 2) , the pH is
5.5±0,5. In these steep slopes, the soil is poorly developed
and soil water represents the initial chemical composition of
the flowing groundwater (Guglielmi et al., 2002). Once infil-
trated into the deeper fractures, the organic matter is consid-
ered entirely degraded and/or outfiltered and not being fur-
ther supplied. This modelling hypothesis is supported by the
oxygenated conditions found in all spring waters (Table 2,
Eh data).
La
nd
slid
e m
otio
n (
mm
/d)
Motion of the landslide (mm/d)
Sulfate for recession stages (mmol/L)
0
50
100
150
200
250
1995
1996
1997
1998
1999
2000
2001
2002
SO
4 (
mm
ol/L
)
S15(1)
S15(4)
S15(5)
S15(6)
S15(7)
S15(1)
S15(4)S15(4)S15(4)S15(4)S15(4)S15(4)S15(4)S15(4)S15(4)S15(4)S15(4)S15(4)S15(4)S15(4)S15(4)S15(4)S15(4)S15(4)S15(4)S15(4)S15(4)S15(4)S15(4)S15(4)S15(4)S15(4)S15(4)S15(4)S15(4)S15(4)S15(4)S15(4)S15(4)S15(4)S15(4)S15(4)S15(4)S15(4)S15(4)S15(4)S15(4)S15(4)S15(4)S15(4)S15(4)S15(4)S15(4)S15(4)S15(4)
Landslide acceleration
S15(3)S15(2)
S15(0)
5
6
7
8
9
Legend :
2003
2004
Sulfate (mmol/L)
Fig. 4. Temporal evolution of the sulfate concentration measured
in a spring draining from an active unstable area (La Clapiere land-
slide). The circles present the whole measurement. The squares
present the measurements realized when nitrate concentration is
null (recession stage). The sulfates, changed during the recession
stage, are related with the landslide velocity (strong accelerations
are grey shaded). Sulfate concentration of year 1998 are not ex-
ploitable. The S15(1, 2, ...) annotations, refer to complete analysis
of the S15 trough time, presented in the Table 3.
In such a system, the gneiss rock dissolution becomes the
dominant process. The pH will gradually increase when the
primary minerals consume H+ ions. The increasing pH leads
finally to precipitation of insoluble mineral phases, and espe-
cially the precipitation of Al(OH)3 and Fe(OH)3. It can be
deduced from Table 1 that seven, two, or respectively one H+
moles are consumed when dissolving one molecular unit of
phlogopite, anorthite and albite or Kmica (in considering that
Silica is released as silicic acid Si(OH)4, and Al as Al(OH)3).
This basis of the hypothesis is inferred from the experi-
mental data set, as all spring water have higher pH and higher
ion concentrations than the soil water. In concordance to
field observations (Fig. 2), Fe-oxide and Al-oxyde precipi-
tation will occur. To note that the few OH− ions bound to
dissolved Al(OH)−4 and Fe(OH)−4 species are not significant
compared to the mass of dissolved OH− ions.
The increase in pH will also lead to a decrease of the PCO2
through the transformation of dissolved CO2 into HCO−
3 .
This mechanism, associated with Ca from the dissolution of
primary minerals, may lead to calcite precipitation. Table 2
shows that 2 of the 13 reported springs have calcite satura-
tion index ≥0.5. The observed calcite in fractures and the
other study on hydrochemistry of gneiss rock (Appello and
Postma, 1996) indicates that calcite precipitation occurs in
these systems and calcite was added as an equilibrium phase
in the model.
The presence of pyrite, attested from field observations, is
considered to be a source of Fe ions. The oxidation to sulfate
and Fe+3, with the associated precipitation of Fe(OH)3 is a
strongly proton-producing process (Eq. 1)
FeS2 +3.75O2 +3.5H2O ⇔ Fe(OH)3 +2SO−24 +4H+ (1)
Finally, the presence of Gypsum is also attested in the Tri-
assic deposits. Gypsum is add in the model only for S15
presented in Table 3. This mineral increases [SO−24 ] and
Hydrol. Earth Syst. Sci., 13, 2315–2327, 2009 www.hydrol-earth-syst-sci.net/13/2315/2009/

S. Binet et al.: A tool to identify active unstable areas 2323
increases the saturation index of calcite, i.e. promotes its
precipitation. Concerning pH, the dissolution of the pri-
mary minerals increases pH, whereas precipitation of calcite
(through deprotonation of HCO−
3 ions), Oxidation of pyrite
and precipitation of iron oxides decreases the pH. Dissolu-
tion of gypsum has no direct effect on pH.
The source and sink terms of individual ions can be out-
lined as follows: SO−24 is provided from pyrite and gypsum.
silica, Al and OH− are finally released from all primary min-
erals. On the side of precipitation, calcite binds excess Ca
and alkalinity, Fe precipitates as Fe(OH)3, and Al precipi-
tates as Al(OH)3. As silica gel and amorphous phases satu-
ration index are negatives, and as quartz and phlogopite have
low kinetics of precipitation, these minerals can be oversatu-
rated.
4.2 Inverse modelling
Dissolved ions in spring water are considered originating
from rocks and gazes. The necessary quantities of miner-
als and gases to be dissolved in the soil water to obtain the
spring water composition, were obtained from inverse mod-
elling with PHREEQC, by specifying the measured concen-
tration of major ions (Ca, Mg, K, Na, SO4, Cl, NO3, alkalin-
ity), pH, temperature (fixed to 8◦C for all conditions) of both,
the soil and the target spring water. The minerals considered
for dissolution in the water are halite (for Cl), quartz, pla-
gioclase, phlogopite, Kmica and pyrite. Minerals considered
potentially precipitating dependent on the calculated satura-
tion index were calcite, dolomite, ferrihydrite, gibbsite. The
model considers CO2 and O2 as two dissolved phases. The
calculated amount of consumed gas will open the discussion
about open/close reservoir conditions. The proton balances
are involved in these calculations. The calculations are ap-
plied to the 6 major springs (13 samples) draining gneiss
fractures from the two study valleys (Table 2). The uncer-
tainty on the calculated ionic balance, is fixed to 15% be-
cause the model is a simplification using only 5 minerals to
describe the gneiss rock.
For the S15 spring (10 samples; approximately one per
year) the same minerals list are considered, adding dolomite,
and gypsum. The modelled amounts of gas and mineral dis-
solved needed to reproduce the spring water compositions
are reported in Table 3.
The system is considered at the equilibrium, however, the
spring water composition is controlled by a continuous dis-
solution process. The equilibrium model results represents a
momentum analysis of kinetically driven reaction during the
transfer of water in the subsurface, which did not arrive at
its end.
(a) 5 6 7 8
0.0
0.2
0.4
0.6
0.8
Gneiss 0.4 mmol
Gneiss 0.2 mmol
Gneiss 0.8
mmol
+ 0.1 Pyrite + 0
.2 G
ysp
um
pH
Ca (
mm
ol/L)
Soil water
A/
S5(3)
S5(2)S5(6)
Gneiss 0. 6 mmol
(b)
B/
pH7.0 7.5 8.0 8.5
2
4
6
8
10
12
14
Pyrite 0.5
mm
ol
Pyrite
1m
mol
Pyrite 0 mmol
Gypsum: 10 mmol
Gypsum: 5 mmol
Gypsum: 0.2 mmol
HC
O3 1
.8 m
mol/L
HC
O3 5
mm
ol/L
S15(9)
S15(4)
S15(6)
S15(1)S15(7)
Ca (
mm
ol/L)
S15(2)
Fig. 5. Calculated evolution of pH and calcium content related
to a 0.2 mmol/L sulfate increase in water flowing in gneiss rock
and comparison with field measurements. (a) evolution in pH
and Ca2+ for dissolving gneiss rock (continuously increasing ba-
sis curve starting from the soil water), with or without contri-
butions from pyrite and gypsum in calcite undersaturation con-
ditions. Sulfate increases are induced from either a 0.1 mmol
of pyrite, either a 0.2 mmol/L of gypsum dissolution, in a Phl-
ogopite + Plagioclase contents fixed to 0.2, 0.4, 0.6, 0.8 mmol/L,
in an undersaturated water in respect to calcite. The model is
confronted to S5 springs measurements dissolving approximately
0.6 mmol/L of gneiss rock, presented in Table 2. (b) sulfate in-
creases are induced from either a 0.1 mmol of pyrite dissolution
in gneiss rock, either a 2 mmol/L of gypsum dissolution in gneiss
rock buffered context (fixed alkalinity = 1 mmol/L, phlogopite + K-
mica + albite + anorthite content = 0.2 mmol/L) in saturated water in
respect to calcite. The model is confronted with S15 spring mea-
surements presented in Table 3.
4.3 Dominant processes controlling the water quality
4.3.1 Origin of sulfates in silicate system water deduced
from pH buffering processes
Figure 5a shows the results of a direct model used to
discuss the inverse modelling. The evolution in pH and
Ca2+ for variable amounts of dissolved gneiss rock (con-
tinuously increasing basis curve starting from the soil wa-
ter), with or without contributions from dissolved pyrite
and gypsum in calcite undersaturation conditions. Sulfate
increases are induced from either a 0.1 mmol/L of pyrite,
www.hydrol-earth-syst-sci.net/13/2315/2009/ Hydrol. Earth Syst. Sci., 13, 2315–2327, 2009

2324 S. Binet et al.: A tool to identify active unstable areas
or from a 0.2 mmol/L of gypsum dissolution, in a Phlo-
gopite + Kmica + plagioclase contents, respectively, fixed to
0.2, 0.4, 0.6, 0.8 mmol/L. The dissolution of equivalent
amounts of sulfate from pyrite or gypsum results in a de-
crease of pH (in the case of pyrite) or in an increase of
[Ca2+] (in the case of Gypsum). These different effects al-
low us to determine the origin of sulfate (pyrite versus gyp-
sum) in the S5 spring. The inversed modelling suggests that
S5(2), S5(3) and S5(6) dissolve 0.6 mmol/L of gneiss rock
(Table 2). These data plotted in Fig. 5a shows that for fixed
amounts of dissolved gneiss rock the spring water pH de-
creases with time but not [Ca2+]; more precisely between 0.1
and 0.8 mmol/L of pyrite needs to be dissolved, versus less
than 0.1 mmol/L of Gypsum. The observed changes through
time in sulfate concentration (S5(2), S5(3) and S5(6)) plotted
in Fig. 5 indicate that the sulfate essentially changes origi-
nates from pyrite.
The interference between gypsum and pyrite, in calcite
saturated conditions observed in the S15 spring, are more
complex (Fig. 5b). Dissolved Ca2+ will partly contribute to
increase [Ca2+], and partly precipitate as calcite, decreasing
by the way the alkalinity and the pH (through deprotonation
of precipitating HCO−
3 ions). In Fig. 5b, Gypsum dissolu-
tion curves are thus no longer vertical. Concerning pyrite,
the protons released (Eq. 1) will (as for Gypsum) displace
the saturation pH of calcite to lower pH values, which means
dissolution of calcite. In this case, both [Ca2+] and alkalin-
ity increase, different to Gypsum dissolution. Parts of the
protons contribute to lower the pH, and parts contribute to
protonate the CO−23 ions released to the solution from cal-
cite. Thus, pyrite dissolution curves in Fig. 5b have also a
negative slope. The S15 spring, saturated with respect to cal-
cite, flows through gypsum and calcite. The sulfate content is
very high (8 mmol/L). The pH versus Ca plot of the S15 time
series (Fig. 5b) shows that 2 to 5 mmol of Gypsum and 0 to
0.5 mmol/L of pyrite contributed to the sulfate measured in
the spring. This shows that Gypsum dominantly contributed
to the sulfate composition in this case, but pyrite is necessary
to explain the recorded time evolution.
4.3.2 O2 and CO2 conditions, and implications for
open/closed model assumption
In the model, the introduced pyrite is entirely oxidized, as
an excess oxygen concentration is introduced. This ensures
that oxygenated conditions prevail at the spring outlet as ex-
perimentally determined (Table 2 and 3). A priori this intro-
duced “reactive pyrite” represents only a minor fraction of
the FeS minerals existing in the field. Potentially, much more
pyrite may be really present, but associated with an insuffi-
cient contact time with water and/or surface area. The very
low saturation index of the pyrite (from −160 to −200) for
a redox reaction confirm that pyrite is controlled by kinetics
processes (Stefansson et al., 2005).
Following the pyrite oxidation (Eq. 1), 3.75 oxygen atoms
are needed to oxidise two sulphur atoms to sulfate. O2 satu-
rated water at 5◦C (Saturation [O2]aq = 0.4 mmol/L) may thus
produce a maximum of 0.21 mmol/L sulfate from pyrite in a
closed system. Most of the inversed O2 values presented in
Table 2 exceed this theoretical value by a factor of one or two.
This means that the system is open for oxygen. Some surface
oxygen supposedly diffuses into the groundwater, thus, con-
tributing to enhance the dissolved oxygen content needed for
the oxidation of pyrite. Here, the groundwater flows mainly
in the unsaturated zone in contact with gases (Binet et al.,
2007b). Hydrogeological context is coherent with an open
system. Note that the regular decrease of sulfate (Fig. 4) be-
tween 2002 and 2003 may discard a seasonal evolution of
O2 or CO2 pressures or of the temperature that controlled the
pyrite oxidation. In other areas, the dissolution of pyrite is
insensitive to seasonal changes (Domenech et al., 2002).
PCO2 values at the spring outlet (Table 2 and 3) range be-
tween −3.32 and −2.7 and are superior to the atmospheric
PCO2 pressure (PCO2=10−3.5 atm.). In the given system
of open fractures, we consider that the system is opened to
the atmosphere. This means that CO2 (together with oxy-
gen) diffuses continuously to the groundwater providing the
necessary acid for the neutralization of the base generated
through the dissolution of the gneiss rock. This generates
the alkalinity (i.e. the HCO−
3 concentration) measured at the
spring outlet. The Inversed modelling indicates that low CO2
exchanges with the atmosphere occurred. Realized a model
without CO2(g), to simulate a closed system do not modify
the calculated solutions presented in Table 2. The soil alka-
linity input (0.1 mmol/L) is sufficient to explain the bicarbon-
ates evolution with the pH increase, but errors range caused
by the alkalinity measurements (±0.1) do not enable to ex-
clude possible CO2 exchanges with the atmosphere.
More importantly, this shows that respiration processes
observed in soil, did not occur in the open fractures as these
processes are known to disturb the groundwater PCO2 val-
ues compared to the atmospheric pressure. This indicates
that the organic matter of soil water was effectively outfil-
tered and/or entirely respirated into the soil before flowing
through the fractures.
4.4 Pyrite availability in unstable areas
Table 2 and 3 show the amounts of dissolved minerals used
to explain the groundwater chemistry. Plagioclase and phlo-
gopite well explain the water chemistry acquisition (Table 2)
and are considered the main reactive minerals in gneiss rock.
The sum of these minerals is considered to represent the
amount of dissolved gneiss rock. The chemistry of water pre-
sented in Table 2 is explained with a dissolution from 0.062
to 2,73 mmol of gneiss rock and from 0.008 to 0.38 mmol of
pyrite per litre. The water from S15 dissolves from 1.9 to
2.9 mmol of gneiss rock, 2.9 to 5.7 mmol of Gypsum, 1.7 to
4 mmol of dolomite and 1.5 to 1.8 mmol of pyrite per litre.
Hydrol. Earth Syst. Sci., 13, 2315–2327, 2009 www.hydrol-earth-syst-sci.net/13/2315/2009/

S. Binet et al.: A tool to identify active unstable areas 2325
The dissolved amount of pyrite normed to the gneiss rock
amount (Py/Gn) is an indicator of the relative pyrite weath-
ering rate. (Table 2 and 3). The Py/Gn ratio range from 0.04
to 0.13 in a stable aquifer and from 0.16 to 0.74 in unstable
aquifers. The significant difference in the relative Py/Gn ra-
tio suggests that the relative weathering rate of the pyrite is
higher in the active fractures.
5 Discussion
5.1 Relationship between physical erosion and chemical
weathering
SO4 time evolution could originate from a mix process, with
water from a pyrite rich reservoir. However, the other ions in
the water are not correlated with the accelerations. When the
sulfate concentrations decrease, the Mg, Cl, Ca and HCO3
concentrations can increase (for example see S15(7) and
S15(8) in Table 3) or can decrease (see S15(0) and S15(1)).
Thus, the mix process between water from the landslide and
a sulfate-rich water can be reasonably discarded.
To discuss the origin of SO4 time evolution requires tak-
ing into account an internal modification of the dissolution
rate of the pyrite correlated with landslide velocity. Within
the fractures, the crystalline rock materials were found to be
covered by iron oxide coatings (Fig. 2c) inferred weathered.
Sulfate anomalies were observed in all the water flowing
through active landslides in the two study valleys (Fig. 3).
These sulfate increases were observed after 5 landslide ac-
celerations, and indicate that a mechanical deformation can
(re) activate sulfate production. Thus, a mechanical effect
can refresh the surfaces, reinitialize the dissolution or create
new fresh fractures (Fig. 2b). This mechanical effect can be
linked to mechanical deformation of the slope, characterised
in these valleys by complex progressive failure propagation
(Barla and Chiriotti, 1996).
During laboratory experiments of pyrite leaching, it
appears that the dissolution rate decreases with time
(Williamson and Rimstidt, 1994; Igarashi et al., 2003;
Weisener et al., 2003). With time, the aging of mineral
decreases the contact surface and the original behaviour of
pyrite dissolution cannot be re-established (Jerz and Rim-
stidt, 2004). For instance, with a 10 year observation scale,
modifications of the groundwater chemistry in an acid moor-
land in the Welsh Uplands is attributed to a decrease in
the weathering rate of pyrite (Forti et al., 1996). On the
other side, at the continental scale, a theoretical model cou-
pling chemical weathering and physical erosion in landslide-
dominated landscapes is proposed to explain the refreshment
of the weathering rate (Gabet, 2007). Here, long-term de-
crease of the weathering rate and the theoretical refreshment
are suggested at the landslide scale.
5.2 Implication for landslide management
A comparison of the weathering rates shows the possibility to
localize current unstable areas with instantaneous measure-
ments. This method enables us to demonstrate the presence
of a current unstable zones in the catchment. In these un-
stable mountainous contexts, the catchments of subsurface
flows are localized. The water infiltrates in the upper part of
open fractures and a part of it discharges downhill from the
bottom of these fractures (Binet et al., 2007). By perform-
ing sampling very close to the potential unstable area, it is
possible to deduce if the sampled zone is moving or not.
If a potentially unstable slope is monitored, water chem-
istry is like a syn-deformation signal that can be used to
recorded the fracture growing or the sliding evolution. With
time, the fracture growing can lead to a catastrophic rupture
(Scavia, 1995) and water chemistry can be a help to the pre-
diction of this catastrophic rupture.
Stable zones record a 0.13 to 0.4 Py/Gn ratio. In the mov-
ing zones, Py/Gn ratio ranges between 0.16 to 0.74. Consid-
ering error range in the weathering rate values, a 0.15 value
can be considered as a threshold value to discriminate be-
tween stable and unstable area. This ratio is establish from
two different alpine valleys (Tinee and Rosone). Extrapolate
this ratio for other slopes means that the water/rock interac-
tion surfaces and the weathering state in the stable areas are
similar. Such hypothesis can be tested using a well-know
stable aquifer before testing the potentially unstable zones.
In the toppled area of the S5 spring, the two high ratios of
the relative weathering rates of pyrite (0.4 for 1998 and 2004)
suggest that the two last accelerations of the La Clapiere
landslide (1997 and 2000) have affected the entire hillslope.
In this area, mm/year displacements are estimated by stabil-
ity calculations (Guglielmi et al., 2005). The hydrochemi-
cal signature is produced even from slow (mm/year) and low
magnitude (toppling) deformations.
The accelerations and the ruptures in the rock deformation
have a very short time scale (form a second to a day).The
changes in chemical signature of groundwater are related to
transport of water (from a day to months in these subsurface
context). If the dissolution rate is changed, it will take some
time for sulfate to reach a new steady state concentration.
No experimental data is available about the refreshed rates of
pyrite. Figure 4 suggests that the changes in transport delay
and in the dissolution rates take from 1 to 6 month to reach
the spring.
The rock deformations are often drive by crack propaga-
tions producing precursor slow movements (Scavia, 1995)
that can be recorded by the water chemistry. In the case
where we can sample water close to (or in) a deformation
area, the transport delay will be reduced and precursor slow
movements could be detected.
www.hydrol-earth-syst-sci.net/13/2315/2009/ Hydrol. Earth Syst. Sci., 13, 2315–2327, 2009
2326 S. Binet et al.: A tool to identify active unstable areas
6 Conclusions
Wet chemical analysis, from the Orco and the Tinee val-
leys (Western Italy and Southern France) were performed.
Some of these springs drain currently active gravitational
slope deformations. The groundwater sulfate concentrations
increased from 0.1 to 1 mmol/L in the weeks following ma-
jor displacement periods of a landslide. This study shows
that unstable areas may potentially be detected by associating
major ions analysis to inverse modelling of chemical equilib-
ria: the calculation of the dissolved pyrite to dissolved gneiss
rock ratio allows an unambiguous determination of the wa-
ter flowing through unstable zones. Here, gneiss rock and
gypsum are the principal dissolving compound, and pyrite is
the minor compound, which is rapidly dissolved, and con-
sequently increasingly present in case its reactive surface
is “refreshed” through the movement of rock masses. The
discrimination of stable and unstable areas is possible even
in the case of slow (mm/year) and low magnitude defor-
mations. This result opens an interesting perspective for a
cost-effective follow-up of sliding or friction dynamics in the
landslides or in the seismic and aseismic faults.
Acknowledgements. This work was supported by the RETINA
project, the French INSU SAMOA project and the Franco Italian
University. We sincerely thank the CETE of Nice and the Arpa
of Torino for their collaborations. A part of this work was
realized in the Mercantour National Parc, under authorization
of the direction. The authors sincerely thank Pr Olivier Fabbri
and the anonymous referees for their constructive comments.
This work could not have been achieved without the technical
support of Maguerite Goetghebeur and Bruno Regent. Grazie mille!
Edited by: A. Guadagnini
The publication of this article is financed by CNRS-INSU.
References
Appelo, C. A. J. and Postma, D.: Geochemistry, groundwater and
pollution, Book A. A. Balkema, Rotterdam, 1996.
Agliardi, F., Crosta, G., and Zanchi, A.: Structural constraints on
deep-seated slope deformation kinematics, Eng. Geol., 59, 83–
102, 1996.
Amatruda, G., Campus, S., Castelli, M., Piane, L., Forlatti, F.,
Morelli, M., Paro, L., Piana, F., Pirulli, M., Ramasco, M., and
Scavia, C.: Identification And Mitigation Of Large Landslide
Risks In Europe: Advances In Risk Assessment, edited by: Bon-
nard, Ch., Forlati, F., and Scavia, C., A. A. Balkema, Imiriland
project, Torino, 2004
Binet, S., Mudry, J., Scavia, C., Campus, S., Bertrand, C., and
Guglielmi, Y.: In situ characterization of flows in a fractured un-
stable slope, Geomorphology, 86, 193–203, 2007a.
Binet, S., Guglielmi, Y., Bertrand, C., and Mudry, J.: Unstable
rock slope hydrogeology: insights from the large-scale study
of the western Argentera-Mercantour hillslopes (South-Eastern
France), B. Soc. Geol. Fr., 178, 159–168, 2007b.
Binet, S., Jomard, H., Lebourg, T., Guglielmi, Y., Tric, E., Bertrand,
C., and Mudry, J.: Experimental analysis of groundwater flow
through a landslide slip surface using natural and artificial water
chemical tracers, Hydrol. Process., 21, 3463–3672, 2007c.
Barla, G. and Chiriotti, E.: Insights into the behaviour of the Large
Deep Seat Gravitational Slope Deformation of Rosone, in the
Piemont Region (Italy), Int. J. Rock Mech. Min., 33, 242–242,
1996.
Bonzanigo, L., Eberhart, E., and Loew, S.: Hydromechanical fac-
tors controlling the crfeeping Campo Vallemaggia, in: Sympo-
sium of landslides, causes, impacts and countermeasures, edited
by: UEF, Davos, 13–22, 2001.
Cappa, F., Guglielmi, Y., Soukatchoff, V. M., Mudry, J., Bertrand,
C., and Charmoille, A.: Hydromechanical modelling of a large
moving rock slope inferred from slope levelling coupled to
spring long-term hydrochemical monitoring: example of the La
Clapiere landslide (Southern Alps, France), J. Hydrol., 291, 67–
90, 2004.
Casson, B., Delacourt, C., Baratoux, D., and Allemand, P.: Sev-
enteen years of the “La Clapiere” landslide evolution analyzed
from ortho-rectified aerial photographs, Eng. Geol., 68, 123–139,
2003.
Domenech, C., De Pablo, J., and Ayora, C.: Oxidative dissolution
of pyritic sludge from the Aznalcollar mine (SW Spain), Chem.
Geol., 190, 339–353, 2002.
Faure-Muret, A.: Etude geologique sur le massif de l’Argentera
Mercantour et ses enveloppes sedimentaires: Memoire a
l’explication de la carte geologique detaillee, Thesis Paris,
Mem.serv. Carte geol, France (ed), 336, 1955.
Feraud, J., Picot, P., Pierrot R., and Vernet, J.: Metallogenie: sur la
decouverte de scheelite, cassiterite, bismuthinite et molydenite
dans les gıtes a arsenopyrite du massif de l’Argentera,
Consequences metallogenetiques et petrogenetiques, Comptes
Rendus de l’Academie des sciences, Paris, 280, 2179–2182,
1975.
Follacci, J. P.: Les mouvements du versant de la Clapiere a Saint
Etienne de Tinee (Alpes Maritimes), Bulletin des Laboratoires
des Ponts et Chaussees, 150, 107–109, 1987.
Forlati, F., Gioda G., and Scavia, C.: Finite element analysis of
a deep-seated slope deformation, Rock Mech. Rock Eng., 34,
135–159, 2001.
Forti, M. C., Neal, C., and Robson, A. J.: Modelling the long-term
changes in stream, soil and ground water chemistry for an acid
moorland in the Welsh uplands: the influence of variations in
chemical weathering, Sci. Total Environ., 180, 187–200, 1996.
Gabet, E. J.: A theoretical model coupling chemical weathering
and physical erosion in landslide-dominated landscapes, Earth
Planet. Sc. Lett., 264, 259–265, 2007.
Guglielmi, Y., Bertrand, C., Compagnon, F., Follacci, J. P., and
Mudry, J.: Acquisition of water chemistry in a mobile fissured
basement massif: its role in the hydrogeological knowledge of
the La Clapiere landslide (Mercantour massif, southern Alps,
Hydrol. Earth Syst. Sci., 13, 2315–2327, 2009 www.hydrol-earth-syst-sci.net/13/2315/2009/
S. Binet et al.: A tool to identify active unstable areas 2327
France), J. Hydrol., 229, 138–148, 2000.
Guglielmi, Y., Vengeon, J., Bertrand, C., Mudry, J., Follacci, J., and
Giraud, A.: Hydrogeochemistry: an investigation tool to evalu-
ate infiltration into large moving rock masses (case study of the
La Clapiere and Sechilienne alpine landslides), Bull. Eng. Geol.
Env., 61, 311–324, 2002.
Guglielmi, Y., Cappa, F., and Binet, S.: Coupling between hydro-
geology and deformation of mountainous rock slopes: Insights
from La Clapiere area (southern Alps, France), C. R. Geosci.,
337, 1154–1163, 2005.
Gunzburger, Y. and Laumonier, B.: A tectonic origin for the fold un-
derlying the Clapiere landslide (NW Argentera-Mercantour mas-
sif, Southern Alps, France) deduced from an analysis of frac-
tures, C. R. Geosci., 334, 415–422, 2002.
Igarashi, T., Hataya, R., and Oyama, T.: Estimation of pyrite oxida-
tion rate by sulfate ion discharged from a catchment, J. Geochem.
Explor., 77, 151–165, 2003.
Jerz, J. K. and Rimstidt, J. D.: Pyrite oxidation in moist air,
Geochim. Cosmochim. Ac., 68, 701–714, 2004.
Julian, M. and Anthony, E.: Aspects of landslide activity in the
Mercantour Massif and the French Riviera, southeastern France,
Geomorphology, 15, 275–289, 1996.
Keefer, D., Wilson, R. C., Mark, R. K., Brabb, E. E., Browm, W.
M., Ellen, S. D., Harp, E. L., Wieczorek, G. F., Alger, C. S.,
and Zatkin, R. S.: Real-Time Landslide Warning During Heavy
Rainfall, Science, 13, 921–925, 1987.
Mazeran, R. and Feraud, J.: Sur la thermoluminescence des quartz
filoniens a BPGC du massif de l’Argentera, Mise en evidence du
caractere polyphase de ces mineralisations, Comptes Rendus de
l’Academie des sciences, Paris, 278, 1147–1150, 1974.
Mudry, J.: Chemical mass flow vs. discharge and the functioning of
karst aquifers, J. Hydrol., 120, 283–294, 1990.
Parkust, D. L. and Appelo, C. A. J.: PhreeQC2 user’s manuel and
programm. Water-Resources Investigations Report, edited by:
US Geological Survey, 2004.
Scavia, C.: A method for the study of crack propagation in rock
structures, Geotechnique, 45, 447–463, 1995.
Stefansson, A., Arnorsson, S., and Sveinbjornsdottir, A. E.: Re-
dox reactions and potentials in natural waters at disequilibrium,
Chem. Geol., 221, 289–311, 2005.
Tullen, P.: Methodes d’analyses du fonctionnement hy-
drogeologique des versant instables, PhD Thesis, ed. EPFL,
Lausanne, 2002.
Vengeon, J. M.: Deformation et rupture des versants en terrain
metamorphique anisotrope, Apport de l’etude des ruines de
Sechilienne, PhD Thesis, ed. University of Grenoble 1, Greno-
ble, 1998.
Weisener, C. G., Smart, R. S. T. C., and Gerson, A. R.: Kinetics
and mechanisms of the leaching of low Fe sphalerite, Geochim.
Cosmochim. Ac., 67, 823–830, 2003.
Williamson, M. A. and Rimstidt, J. D.: The kinetics and elec-
trochemical rate-determining step of aqueous pyrite oxidation,
Geochim. Cosmochim. Ac., 58, 5443–5454, 1994.
www.hydrol-earth-syst-sci.net/13/2315/2009/ Hydrol. Earth Syst. Sci., 13, 2315–2327, 2009


Use of continuous measurements of dissolved organic
matter fluorescence in groundwater to characterize
fast infiltration through an unstable fractured hillslope
(Valabres rockfall, French Alps)
Jean-Baptiste Charlier & Catherine Bertrand &
Stéphane Binet & Jacques Mudry & Nicolas Bouillier
Abstract Continuous measurements of natural fluores-cence of dissolved organic matter (DOM) in groundwaterhave been used to characterize infiltration through anunstable fractured hillslope at the event time scale. Withinthe gneissic Valabres rockfall area in the southern FrenchAlps, two sites, in the unstable massif and in the collapsearea, were continuously monitored for electrical conduc-tivity and for DOM natural fluorescence using a fieldfluorometer, and analyzed weekly for hydrochemical data.Two main results were found. From a methodologicalpoint of view, DOM natural fluorescence was a relevanttracer of fast infiltration in fissured media, knowing thatcontinuous measurements improved the study of infiltra-tion processes at the event time scale. From a hydro-geological point of view, the unstable fractured massifshowed delayed dilution phenomena and the collapseareas showed fast and slow infiltration by piston-typeflows via more or less open fractures. Consequently, fromthis conceptual model one may suppose that, unlike thecollapse zones, the fractured hillslope threatening thevalley is not submitted to strong pore-water pressurevariations.
Keywords Dissolved organicmatter . Groundwaterflow .Unstable slope . Fractured rocks . France
Introduction
Water infiltration is a key process in landslide triggering,and hydrogeochemical studies can give tools to character-ize physical properties of rock slopes (Bogaard et al.2007). In a fracture network within low porosity rock, asmall infiltrated water volume can create large pressure. Inthis setting, fast infiltrations need to be well characterizedin order to determine slope stability accurately.
Because infiltrated water contains large amounts oforganic soil substances, the natural fluorescence (NF) ofdissolved organic matter (DOM) and total organic carbon(TOC) are good tracers to discriminate water origin andflow paths in hydrosystems (e.g. Batiot et al. 2003;Carstea et al. 2009; Pronk et al. 2009). For TOC, a non-conservative tracer, mineralization occurs at the scale of afew weeks; laboratory experiments showed TOC has anexponential decay with time (Batiot 2002), meaning thatthe higher the TOC content, the faster the transit time inthe system. TOC is thus adapted to study transfer time inhydrosystems at the event time scale.
However, the measurement of TOC is technicallydifficult due to continuousmineralization in sampling bottlesand to the difficult automation of such devices in the field. Toovercome these drawbacks, one may use a field fluorometer,developed for artificial dye tracers by Schnegg (2003),which gives continuous measurements of water NF. More-over, knowing that Cumberland and Baker (2007) showedDOM fluorescence and TOC are linearly correlated infreshwater, it is hypothesized that continuous NF measure-ments could be used as a fine infiltration tracer.
This article aims to characterize infiltration flowsthrough an unstable basement massif. The originalcontribution of this work was to use continuous measure-ments of DOM NF in groundwater to monitor infiltrationprocesses at the event time scale. The experimental site is
Received: 29 December 2009 /Accepted: 13 October 2010Published online: 4 November 2010
* Springer-Verlag 2010
J.-B. Charlier ()) :C. Bertrand : S. Binet : J. Mudry :N. BouillierChrono-Environment - UMR UFC/CNRS 6249,University of Franche-Comté,16 route de Gray, F-25030 Besançon, Francee-mail: [email protected].: +33-3-81666550Fax: +33-3-81666558
S. BinetInstitut des Sciences de la Terre d’Orléans - UMR 6113,Université d’Orléans, CNRS/INSU,Université François Rabelais - Tours,1A, rue de la Férollerie, 45071 Orléans, France
Hydrogeology Journal (2010) 18: 1963–1969 DOI 10.1007/s10040-010-0670-5
the Valabres unstable hillslope in the southern FrenchAlps. Two sites were monitored weekly for hydrochemicalstatus and continuously for NF using a field fluorometer.The first site was a gallery draining the unsaturated zoneof a fractured aquifer in the unstable massif, and thesecond was a spring draining a perched aquifer located ina highly fractured collapse zone. On the basis ofcontrasting results for these sites, a conceptual model ispresented of infiltration flows at the event time scale.
Study area and sampling site
Study siteThe Valabres hillslope is located in the Tinée valley in thesouthern Alps (Fig. 1a and b). The relief is marked bydeep valleys with steep slopes, and the land cover ismainly composed of scattered shrubs and bare rockoutcrops. In this area, the geographical relation betweenspring location and geology defines three main aquifertypes (Fig. 1b): (1) a shallow aquifer in the colluvium(glacial deposits and screes), (2) an aquifer in thesedimentary rocks of Jurassic and Triassic ages, and (3)an aquifer in the gneissic rocks, whose springs are locatednear fractures or faults. The hillslope deformation ischaracterized by a continuous collapse area of about2 km² (Fig. 1b) showing a double ridge oriented north–south that extends 2 km in the massif and bounded bycounter-slopes. A decompressed area with open fractureslies between a vertical tectonic fracture towards the north-west and a fracture dipping about 45° towards the south-east. This collapsed area is bounded by undisturbedfractured rock forming stiff, currently unstable cliffs abovethe valley.
If one focuses on gneissic formations (with quartz,mica, plagioclase, K-feldspar, and amphibole), wheremain slope instabilities occur, most of springs are locatedat the middle of the slope, downstream of collapse zones(Fig. 1b). In the Valabres sector, the Tinée River crossesthe regional geological structures. The bottom of themajor trench zone is drained in the south-east by one ofthe most important springs of the valley, the Luicettaspring (Fig 1c).
The presence of a gallery, which enables performinginvestigations inside the rock mass, has served to monitorflows through the unstable massif. A sampling site wasequipped in the gallery, and was coupled with themonitoring of the Luicetta spring, which drains thecollapse area. These two sites in different geomorpholog-ical contexts were monitored physically and chemically.They are presented herein:
& Gallery. Flows from an undisturbed fracture in thegallery were collected to record the hydrologicalresponse of the unsaturated zone in the unstablefractured massif. The gallery has a geometry of2.5 m width and of 2.3 m height, and is located under100 m of overburden gneiss at the sampling site.According to Binet et al. (2007), the estimated
infiltration transit velocity is between 1.10–5 and1.10–4 m/s (response time of 10–20 days).
& Spring. Flows from the Luicetta stream at 750 m abovesea level (ASL), downstream from the Luicetta spring(900 m ASL), are representative of flows in a shallowcollapsed zone. The spring drains the decompressedarea at the convergence of the main fractures (Fig. 2c),which is the boundary between a collapsed zone andthe fractured gneiss. The catchment has an estimatedarea of 10 ha (+/−1 ha) and the spring has a minimumyield of 5 l/s. According to Binet et al. (2007), theestimated infiltration transit velocity ranges between2.10–2 and 8.10–3 m/s (response time of 1–4 days).
MethodMeasurements were conducted from 28 October 2007 to04 April 2008, that is, 160 days of monitoring.
Physical measurements
Daily rainfall intensity is an arithmetic mean of the timeseries of the weather stations of Rimplas and Saint-Etienne de Tinée (METEO France 2009), located 17 km tothe south and 25 km to the north, respectively. Electricalconductivity (EC) and temperature measurements werecarried out every 15 min using automatic field equipment(OTT, Orpheus, Aix-en-Provence, France).
DOM natural fluorescence (NF) was measured using aflow-through field fluorometer, GGUN-FL30 (Albillia,Neuchâtel, Switzerland), initially designed for tracer teststo measure dye tracer concentrations in the field (Schnegg2002, 2003). The field fluorometer is equipped with fouroptical components selected according to the absorption-emission spectra of the chosen artificial dye. Eachcomponent includes a light source (light emitting diodeLED) exciting the fluorescence of the dye, and a photo-detector which yields an electric voltage of amplitudeproportional to the fluorescence. The measured fluores-cence by the photo-detector is filtered by an optical filter.Dye concentrations (in ppb) are determined by calibrationwith solutions of the dye at various concentrations. In thisstudy, for DOM NF measurement, a 370 nm UV LED(suited for Tinopal artificial dye) was used for excitation,and the fluorescence was measured between 440 and540 nm. The calibration of the field fluorometer wascarried out using Tinopal at 10, 100, and 1,000 ppb. Thedetection limit for this tracer ranged between 0.14 and0.2 ppb, and the error on the measurement range wasestimated to be 8% (Schnegg 2002). Measurements werescheduled every 15 min. The light source of Tinopal wasused because its excitation/emission wavelengths are inthe range of organic matter fluorescence at high inten-sities: excitation between 200 and 400, and emissionbetween 300 and 500 (i.e. Baker 2001; Katsuyama andOhte 2002; Blondel 2008; Carstea et al. 2009). In order tocalibrate this probe, Savoy (2007) has shown that a strong
1964
Hydrogeology Journal (2010) 18: 1963–1969 DOI 10.1007/s10040-010-0670-5

linear relationship between TOC and DOM NF (using aGGUN field fluorometer), exists in karstic systems.Moreover, Cumberland and Baker (2007) showed thatDOM fluorescence (using a laboratory spectrofluorometer)and TOC are linearly correlated in freshwater. From theselast results, in various environments, it is hypothesisedthat NF was a consistent signal of DOM in surface andgroundwaters in the presented gneiss formations.
Chemical measurements
Chemical measurements were carried out using anautomatic sampler (Teledyne ISCO, Lincoln, NE) com-prising 24 bottles previously rinsed with distilled water.Automatic samples were collected every 3 months (15October 2007, 22 January 2008, and 11 March 2008). Atthese dates, these samples were completed by manualsamplings to analyze HCO3
– and to calculate the ionicbalances, which were better than 8%, validating water
analysis carried out by automatic samplers. Major ionswere analyzed in the hydrogeological laboratory ofChrono-Environment (University of Franche-Comté,Besançon, France). For automatic samples, HCO3
– wascalculated in order to obtain a null ionic balance.
Results
Analysis of hydrogeological time seriesThe cumulative rainfall depth, P, for the whole monitoringperiod, was 374.4 mm. As shown in Fig. 2, this periodwas characterized by two main events: (1) event 1 with aP of 105 mm over the 5 days associated with 22November 2007, for which there was a maximum rainfallintensity, Px, of 55 mm/day; (2) event 2 with a P of131 mm over the 7 days associated with 11 January 2008,for which there was a Px of 62 mm/day.
Fig. 1 a Location of the Valabres hillslope in the southern French Alps. b Hydrogeological map of the study site indicating the location ofthe gallery and the Luicetta spring. c Deep cross-section A–B showing the geomorphology of the Valabres hillslope
1965
Hydrogeology Journal (2010) 18: 1963–1969 DOI 10.1007/s10040-010-0670-5

The time series of EC in Fig. 2 showed oppositeresponses to rainfall events in the gallery and the springsites. In the gallery, EC values were globally high, rangingfrom 391 to 429 μS/cm. The signal was stable, and afterrainfall event 2, there was a slight decrease of 38 μS/cmattributed to a response time of 14 days and a transit time
of 8.10–5 m/s in the unsaturated zone of the massif. Afterthat decrease, EC reached a stabilized plateau of about404 μS/cm but never rose to the initial signal.
At the spring, the baseline of the EC signal in Fig. 2ranged from 160 to 180 μS/cm, meaning that theresidence time was lower than that of the gallery. One
Fig. 2 Physical and chemical time series monitored in groundwater at the outlet of a fissure in the Gallery, and in streamwater at the outlet of theLuicetta spring. From top to bottom: rainfall (a), natural fluorescence (b), electrical conductivity (c), Ca2+ (d), SO42– (e), HCO3
– (f and g)
1966
Hydrogeology Journal (2010) 18: 1963–1969 DOI 10.1007/s10040-010-0670-5
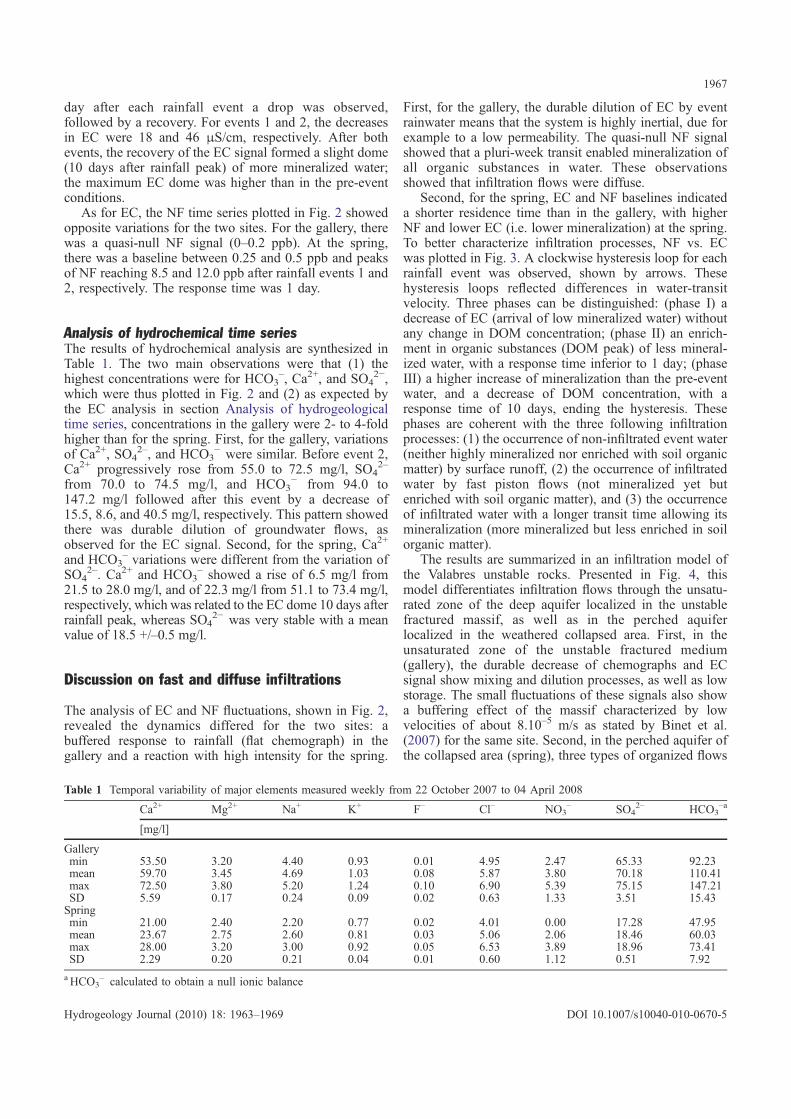
day after each rainfall event a drop was observed,followed by a recovery. For events 1 and 2, the decreasesin EC were 18 and 46 μS/cm, respectively. After bothevents, the recovery of the EC signal formed a slight dome(10 days after rainfall peak) of more mineralized water;the maximum EC dome was higher than in the pre-eventconditions.
As for EC, the NF time series plotted in Fig. 2 showedopposite variations for the two sites. For the gallery, therewas a quasi-null NF signal (0–0.2 ppb). At the spring,there was a baseline between 0.25 and 0.5 ppb and peaksof NF reaching 8.5 and 12.0 ppb after rainfall events 1 and2, respectively. The response time was 1 day.
Analysis of hydrochemical time seriesThe results of hydrochemical analysis are synthesized inTable 1. The two main observations were that (1) thehighest concentrations were for HCO3
–, Ca2+, and SO42−,
which were thus plotted in Fig. 2 and (2) as expected bythe EC analysis in section Analysis of hydrogeologicaltime series, concentrations in the gallery were 2- to 4-foldhigher than for the spring. First, for the gallery, variationsof Ca2+, SO4
2–, and HCO3− were similar. Before event 2,
Ca2+ progressively rose from 55.0 to 72.5 mg/l, SO42–
from 70.0 to 74.5 mg/l, and HCO3− from 94.0 to
147.2 mg/l followed after this event by a decrease of15.5, 8.6, and 40.5 mg/l, respectively. This pattern showedthere was durable dilution of groundwater flows, asobserved for the EC signal. Second, for the spring, Ca2+
and HCO3– variations were different from the variation of
SO42–. Ca2+ and HCO3
– showed a rise of 6.5 mg/l from21.5 to 28.0 mg/l, and of 22.3 mg/l from 51.1 to 73.4 mg/l,respectively, which was related to the EC dome 10 days afterrainfall peak, whereas SO4
2− was very stable with a meanvalue of 18.5 +/–0.5 mg/l.
Discussion on fast and diffuse infiltrations
The analysis of EC and NF fluctuations, shown in Fig. 2,revealed the dynamics differed for the two sites: abuffered response to rainfall (flat chemograph) in thegallery and a reaction with high intensity for the spring.
First, for the gallery, the durable dilution of EC by eventrainwater means that the system is highly inertial, due forexample to a low permeability. The quasi-null NF signalshowed that a pluri-week transit enabled mineralization ofall organic substances in water. These observationsshowed that infiltration flows were diffuse.
Second, for the spring, EC and NF baselines indicateda shorter residence time than in the gallery, with higherNF and lower EC (i.e. lower mineralization) at the spring.To better characterize infiltration processes, NF vs. ECwas plotted in Fig. 3. A clockwise hysteresis loop for eachrainfall event was observed, shown by arrows. Thesehysteresis loops reflected differences in water-transitvelocity. Three phases can be distinguished: (phase I) adecrease of EC (arrival of low mineralized water) withoutany change in DOM concentration; (phase II) an enrich-ment in organic substances (DOM peak) of less mineral-ized water, with a response time inferior to 1 day; (phaseIII) a higher increase of mineralization than the pre-eventwater, and a decrease of DOM concentration, with aresponse time of 10 days, ending the hysteresis. Thesephases are coherent with the three following infiltrationprocesses: (1) the occurrence of non-infiltrated event water(neither highly mineralized nor enriched with soil organicmatter) by surface runoff, (2) the occurrence of infiltratedwater by fast piston flows (not mineralized yet butenriched with soil organic matter), and (3) the occurrenceof infiltrated water with a longer transit time allowing itsmineralization (more mineralized but less enriched in soilorganic matter).
The results are summarized in an infiltration model ofthe Valabres unstable rocks. Presented in Fig. 4, thismodel differentiates infiltration flows through the unsatu-rated zone of the deep aquifer localized in the unstablefractured massif, as well as in the perched aquiferlocalized in the weathered collapsed area. First, in theunsaturated zone of the unstable fractured medium(gallery), the durable decrease of chemographs and ECsignal show mixing and dilution processes, as well as lowstorage. The small fluctuations of these signals also showa buffering effect of the massif characterized by lowvelocities of about 8.10–5 m/s as stated by Binet et al.(2007) for the same site. Second, in the perched aquifer ofthe collapsed area (spring), three types of organized flows
Table 1 Temporal variability of major elements measured weekly from 22 October 2007 to 04 April 2008
Ca2+ Mg2+ Na+ K+ F– Cl– NO3– SO4
2– HCO3–a
[mg/l]
Gallerymin 53.50 3.20 4.40 0.93 0.01 4.95 2.47 65.33 92.23mean 59.70 3.45 4.69 1.03 0.08 5.87 3.80 70.18 110.41max 72.50 3.80 5.20 1.24 0.10 6.90 5.39 75.15 147.21SD 5.59 0.17 0.24 0.09 0.02 0.63 1.33 3.51 15.43Springmin 21.00 2.40 2.20 0.77 0.02 4.01 0.00 17.28 47.95mean 23.67 2.75 2.60 0.81 0.03 5.06 2.06 18.46 60.03max 28.00 3.20 3.00 0.92 0.05 6.53 3.89 18.96 73.41SD 2.29 0.20 0.21 0.04 0.01 0.60 1.12 0.51 7.92
aHCO3– calculated to obtain a null ionic balance
1967
Hydrogeology Journal (2010) 18: 1963–1969 DOI 10.1007/s10040-010-0670-5

were distinguished: (1) a fast transit of surface runoffupstream from the Luicetta outlet (response time <24 h),(2) a fast transit via fast piston effect of water infiltrated inpermeable fractures (transit velocity of about 10–2 m/s)with low water storativity, and (3) a 10-fold slower transitof water enriched in Ca2+ in less permeable media withhigher storativity.
To study flows in fractured media, the main advantageof using continuous NF measurements is to expand theaccuracy of EC when very recent seepage water isobserved (about 1 week). In one case, EC signal at theoutlet of an unstable rock is the result of two features forinfiltrated water: its initial mineralization (rainwater), andits mineralization occurring during the transit time, withpossibilities of water–rock interactions. In the other case,NF signal is the result of infiltration through the soil(enrichment of DOM) and is limited in time, because themineralization of organic substances generates a rapid
decrease of NF concentration (Batiot 2002). Thus, NFmay be an irreplaceable supplement of EC because NF isa relevant tracer of fast infiltration, whereas EC is anintegrating tracer of several concomitant processes as fastinfiltration, or not, and residence time. This method serveswell to discriminate flowpaths and appears to be widelyadapted for fractured and karstic media.
The infiltration model developed using a hydrochem-ical approach may serve to better understand repartitionsand variations of pore-water pressures in unstable hill-slopes. In fact, due to the contrasted infiltration processesin the various fracture networks highlighted in the model,one may suppose that pore-water pressures, whichincrease during the infiltration events, are dissipated bythe collapsed zone and that the fractured hillslope threat-ening the valley is not submitted to strong pore-waterpressure variations. This study calls for further inves-tigations in order to improve hydromechanical modelsdeveloped for unstable hillslopes, including the hetero-geneity of hydrogeological responses highlighted in sucha context.
Conclusion
The aim of this study was to use continuous measure-ments of natural fluorescence (NF) of DOM in ground-water to characterize infiltration at two sites of an unstablehillslope: a fractured medium and a collapsed zone. Theresults showed first that, from a methodological point ofview, a continuous NF signal is a relevant tracer of fastinfiltration that improves the study of flow processes at theevent time scale. Second, from a hydrogeological point ofview, the unstable fractured massif showed delayed
Fig. 3 Plot of natural fluorescence vs. electrical conductivity forstream water at the outlet of the Luicetta spring
Fig. 4 Conceptual model of infiltration flows in the Valabres unstable rock
1968
Hydrogeology Journal (2010) 18: 1963–1969 DOI 10.1007/s10040-010-0670-5
dilution phenomena and the collapse areas showed fastand slow infiltration with piston flow types via more orless open fractures. Finally, the infiltration model designedthrough this hydrochemical approach gives tools to bettercharacterize physical properties in an unstable hillslope.
Acknowledgements This research was financed by INERIS (InstitutNational de l’Environnement Industriel et des Risques) and the FrenchMinistry of Ecology and Sustainable Development, through STAB-ROCK “Impact of climate changes on the stability of rock slopes:observation, experimentation and modeling”. Many thanks to BrunoRegent for the field work.
References
Baker A (2001) Fluorescence excitation-emission matrix character-ization of some sewage-impacted rivers. Environ Sci Technol 35(5):948–953
Batiot C (2002) Étude expérimentale du cycle du carbone enrégions karstiques [Experimental study of the carbon cycle inkarst areas]. PhD Thesis, University of Avignon, France
Batiot C, Liñán C, Andreo B, Emblanch C, Carrasco F, Blavoux B(2003) Use of total organic carbon (TOC) as tracer of diffuseinfiltration in a dolomitic karstic system: the Nerja Cave(Andalusia, southern Spain). Geophys Res Lett 30(22):2179.doi:10.1029/2003GL018546
Binet S, Guglielmi Y, Bertrand C, Mudry J (2007) Unstable rockslope hydrogeology: insights from the large-scale study of thewestern Argentera-Mercantour hillslopes (south-eastern France).Bull Soc Géol Fr 178:159–168
Blondel T (2008) Traçage spatial et temporel des eaux souterrainesdans les hydrosystèmes karstiques par les matières organiques
dissoutes [Spatial and temporal tracing of groundwater inkarstic hydrosystems using dissolved organic matter]. PhDThesis, University of Avignon, France
Bogaard T, Guglielmi Y, Marc V, Emblanch C, Bertrand C, Mudry J(2007) Hydrogeochemistry in landslide research: a review. BullSoc Géol Fr 178:113–126
Carstea EM, Baker A, Pavelescu G, Boomer I (2009) Continuousfluorescence assessment of organic matter variability on theBournbrook River, Birmingham, UK. Hydrol Process 23:1937–1946
Cumberland SA, Baker A (2007) The freshwater dissolved organicmatter fluorescence–total organic carbon relationship. HydrolProcess 21:2093–2099
Katsuyama M, Ohte N (2002) Determining the sources ofstormflow from the fluorescence properties of dissolvedorganic carbon in a forested headwater catchment. J Hydrol268:192–202
METEO France (2009) Rainfall data, 2007–2008. METEO France,Nice, France
Pronk M, Goldscheider N, Zopfi J, Zwahlen F (2009) Percolationand particle transport in the unsaturated zone of a karst aquifer.Ground Water 47(3):361–369
Savoy L (2007) Use of natural and artificial reactive tracers toinvestigate the transfer of solutes in karst systems, PhD thesis,University of Neuchâtel, Switzerland
Schnegg P-A (2002) An inexpensive field fluorometer forhydrogeological tracer tests with three tracers and turbiditymeasurement. XXXII IAH and ALHSUD Congress Ground-water and Human Development. Mar del Plata, Argentina,October 2002, Balkema, Rotterdam, The Netherlands, pp1484–1488
Schnegg P-A (2003) A new field fluorometer for multi-tracer testsand turbidity measurement applied to hydrogeological prob-lems. Proceedings of the Eight International Congress of theBrazilian Geophysical Society, Rio de Janeiro, September 2003,BGS, Rio de Janeiro
1969
Hydrogeology Journal (2010) 18: 1963–1969 DOI 10.1007/s10040-010-0670-5


Conceptual hydrogeological model of flow and transport of dissolved organiccarbon in a small Jura karst system
Jean-Baptiste Charlier ⇑, Catherine Bertrand, Jacques MudryChrono-Environment, UMR UFC/CNRS 6249, University of Franche-Comté, 16, route de Gray, F-25030 Besançon, France
a r t i c l e i n f o
Article history:
Received 6 December 2011Received in revised form 10 June 2012Accepted 15 June 2012Available online 29 June 2012This manuscript was handled by PhilippeBaveye, Editor-in-Chief, with the assistanceof Sheng Yue, Associate Editor
Keywords:
KarstInfiltrationSolute transportRainfall–discharge modelMixing modelDissolved organic carbon
s u m m a r y
This paper aims at characterizing infiltration and solute transport processes in a karst system during floodevents in order to build a conceptual model of hydrogeological functioning. The study site is the smallkarst system of Fertans in the French Jura. Soil cover, rock matrix, and a small spring were monitoredto measure hydrological and hydrochemical parameters, and particularly a continuous dissolved organiccarbon (DOC) signal, which is a relevant environmental tracer of fast infiltration. We used two combinedapproaches. First, from hydrodynamic and hydrochemical data, we identified the system structure(consistent with a dual porosity scheme) and characterized the main processes occurring during floodevents. Second, on the basis of this scheme, we built a new conceptual hydrogeological model coupledwith DOC transport to numerically validate the hydrological functioning. This modelling approach isbased on a rainfall–discharge model to simulate spring flow. Solute transport is modelled using mixingequations, including an empirical retardation factor, as well as a first order solute decay. The modelwas calibrated and validated on a set of nineteen flood events, showing its performances in simulatingspring hydrographs and delayed DOC signals during flood events with various rainfall intensities. Weshowed that the recharge area of the karst system varied largely with low and high groundwater periods,which was attributed to the state of hydraulic connectivity in the unsaturated zone. The soil coverappeared to play an important role of mixing and transfer for the recharge water. The model simulatedthe contributions of pre-event and event waters during flood events and allowed a better quantificationof the available resource. It showed, in particular, that total discharge of some flood events during lowwater periods is mainly composed of pre-event water via piston flow-type processes. Finally, this studyshows that the mixing model can simulate solute transport correctly, taking into account degradationand retardation processes. It highlights the need for a quantitative approach on hydrochemical studiesof karst systems in order to understand them better.
Ó 2012 Elsevier B.V. All rights reserved.
1. Introduction
Karst aquifers are known to be particularly heterogeneous, withtransmissive fractures and conduits embedded in a low permeabil-ity rock matrix. Consequently, karst systems can be affected byeither point-source or diffuse recharge. A dual porosity scheme isoften described for such karst aquifers (Bakalowicz, 2005;Goldscheider et al., 2007). The complex geometry of the conduitnetwork is sometimes the cause of surface and groundwater flow,generating temporal variability on the recharge area according tohydraulic connectivity (e.g. Bonacci, 2001; Bailly-Comte et al.,2009). In depth, the unsaturated zone is now recognized as a mainstorage reservoir, whereas the saturated zone may be seen mainlyas a transmissive zone (e.g. Emblanch et al., 2003; Perrin et al.,2003). Consequently, the characterization of the functioning of
such complex systems remains a great challenge. Since the1970s, two main complementary approaches have been used tostudy the functioning of karst aquifers: hydrodynamic and hydro-chemical approaches.
Due to the high spatial variability of aquifers’ hydrodynamicproperties, karst hydrological models are often conceptual, beinggenerally lumped at the catchment scale (Rimmer and Salingar,2006; Fleury et al., 2007; Butscher and Huggenberger, 2008; Geyeret al., 2008; Jukic and Denic-Jukic, 2009; Tritz et al., 2011). Concep-tual models can be used to test hypotheses in order to understandthe complexity of such hydrological systems (Bakalowicz, 2005) ifwe consider each aquifer reservoir at once (e.g. soil, epikarst, drain,matrix) as storage elements of the karst structure. These modelsappear to be a good compromise between black-box models, whichare empirical and easy to implement with fewer parameters(Mangin, 1984; Padilla and Pulido-Bosch, 1995; Laroque et al.,1998; Labat et al., 2000; Pinault et al., 2001; Kurtulus and Razack,2006), and between distributed models, which are physically con-sistent but need too many parameters, being difficult to implement
0022-1694/$ - see front matter Ó 2012 Elsevier B.V. All rights reserved.http://dx.doi.org/10.1016/j.jhydrol.2012.06.043
⇑ Corresponding author. Present address: BRGM, 1039, rue de Pinville, F-34000Montpellier, France. Tel.: +33 (0)4 67 15 79 77; fax: +33 (0)4 67 64 58 51.
E-mail address: [email protected] (J.-B. Charlier).
Journal of Hydrology 460–461 (2012) 52–64
Contents lists available at SciVerse ScienceDirect
Journal of Hydrology
journal homepage: www.elsevier .com/locate / jhydrol

(Kiraly, 1985; Cacas et al., 1990; Teutsch and Sauter, 1998; Cornatonand Perrochet, 2002). However, good conceptual models need tohave hydrogeological units precisely represented, in order to relatethe model parameters to physically meaningful concepts. In otherwords, conceptual hydrodynamic models should be constrainedusing a complementary approach, such as hydrochemistry.
Variations in hydrochemical parameters (major and trace ele-ments, isotopes, etc.) are commonly used to establish the hydrody-namic function of the karst systems (for a review, see Hunkeler andMudry, 2007). Natural tracers give information about internal pro-cesses, which are generally not observable, such as water transittime, water origin, or groundwater flow conditions. Natural tracerscan help to better constrain conceptual hydrological models, inas-much as the chemistry of infiltration waters gives insights aboutwater flowpaths and storage. An interesting approach for couplinghydrodynamics and hydrochemistry in conceptual models is to usemixing equations to simulate solute transport for conservativecompounds (Lee and Krothe, 2001; Maloszewski et al., 2002; Perrinet al., 2003; Butscher and Huggenberger, 2008; Hartmann et al.,2012). The principal assumptions of this approach are conservationof mass, and instant and complete mixing of solutes in each reser-voir. One important result of such an approach is for instance tohave shown the main role of soil and epikarst on the hydrologicalresponse of a small karst system (Perrin et al., 2003). However,one limitation is the temporal resolution of sampling, which isexpensive.
Due to the high input in organic soil substances in infiltratedwater, organic carbon (OC) – which may be present in particulate(POC) or dissolved (DOC) form – is an interesting tracer of infiltra-tion in karst systems (Emblanch et al., 1998; Batiot et al., 2003;Celle-Jeanton et al., 2003; Mudarra and Andreo, 2011). OC is anon-conservative tracer whose mineralization over time occursat the scale of a few weeks (Batiot, 2002), meaning that it is a use-ful tracer of fast infiltration. It is possible to continuously monitorOC by a field fluorometer (Schnegg, 2003). Such a method has beenapplied successfully in karst media (Savoy, 2007; Pronk et al., 2006,2009; Charlier et al., 2010b) and in fractured media (Charlier et al.,2010a) to characterize the dynamics of infiltration processes. AnOC signal can be used at a high frequency time step in order to im-prove the understanding of flow during flood events when point-source and diffuse infiltrations occur simultaneously.
This paper aims to characterize infiltration and transport pro-cesses in a karst system in order to improve the understanding ofits functioning during flood events, and to develop a lumped modelto simulate flows and transport of non-conservative solutes. The ap-proach combined two steps. In a first experimental step, multipleflowcomponentsweremonitored: input signal by using a lysimeter,hydrochemical responses in drain and matrix, and spring flow andtransport dynamics during flood events. In a secondmodelling step,a numerical conceptual model was developed to simulate springdischarge and solute concentration. The study site is a small springat Fertans in the French Jura, which was monitored to measurehydrological and hydrochemical parameters – and particularly acontinuous DOC signal – in soil cover, rock matrix, and springwaters. DOC was used to better characterize flow and solute trans-port processes during flood events of various intensities.We appliedour transport model on DOC signal to numerically validate thehydrogeological functioning of the karst system.
2. Site and methods
2.1. Study site
The small karst system of Fertans is located in the French Juramountains, on the north of Fertans village (Fig. 1a and b). The
recharge area is 530 m above sea level (ASL) on a carbonate plateau(Amancey plateau) delimited by 150-m-deep valleys. Karst land-forms are visible on the plateau: dolines, karren zones, dry valley,which suggests that karstification is relatively high in the studyzone. The plateau is drained by contact springs at 500 m ASL atthe base of cliffs. One of these springs – the Fertans spring – ismonitored to measure hydrodynamic and hydrochemical parame-ters at the outlet of the karst system.
On the Amancey plateau, the climate is oceanic with a highmountain influence. Rainfall takes place mostly in autumn andwinter and averages 1300 mm yrÿ1. Based on long-term records(METEO France, 2010), the number of rainy days per year is 140on average. These for the most part correspond to low-intensityrainfall events: 50% of rainy days have less than 3 mm of rainfall.Highest intensities range between 15 and 30 mm and represent10% of rainy days.
The soil is a leptosol (IUSS Working Group WRB, 2006) coveredmainly by grassland, and by hardwood. The soil is about 15-cm-thick, but it can be much deeper in dolines. Grasslands are pre-served for bovine farming and are enriched at the end of the winterby 1 year old composted manure.
The geological formations of the Amancey plateau (Fig. 1b) arecompact reef limestones on marl and marly limestone of Oxfordianage (BRGM, 1975). The geological structure is tabular, and thedeformation is characterized by sub-vertical fractures. A field sur-vey carried out on all cliffs of the study zone showed that fractureslonger than 2 m are spaced laterally from 2 to 10 m. Fig. 1c pre-sents the orientation classes of total fracturation and of fractur-ation draining groundwaters. Fractures are mainly oriented N40°,N20°, N0°, and N120° with frequency ranging from 16% to 12%.The springs shown in Fig. 1b are draining fractures orientedN20°, N0°, and N150°.
The Fertans spring drains a fracture oriented N20° at theinterface of the marly-limestone and the compact limestoneformations. The unsaturated zone of the Fertans karst systemis thus composed of a 25-m-deep fractured compact limestoneof Oxfordian age. The recharge area is estimated to be0.45 km2 on the basis of an annual water balance (Charlier,unpublished data).
2.2. Data and measurements
2.2.1. Experimental design
Hourly rainfall and air temperature were recorded by METEOFrance (2010) at the weather station of Coulans-sur-Lison nearEternoz village (468 m ASL), located 9 km south-west of the exper-imental site of Fertans. Monthly potential evapotranspiration wascalculated according to Thornthwaite’s formula (Thornthwaiteand Mather, 1957) from temperature records.
The recharge input signal of the karst system was monitoredusing a lysimeter located in grassland in the supposed rechargearea of the outlet of the karst system (Fig. 1b). The lysimeter con-sisted of a 42 � 42 cm galvanized iron plate and served as a gravitylysimeter designed to collect percolating water samples. In thefield, we dug a 1-m-deep trench and a 20-cm-wide horizontalexcavation in the rock, just a few centimetres below the soil hori-zon. The lysimeter was inserted in the excavation and was wedgedwith wooden blocks and cement.
The gauging station at the Fertans spring outlet consisted ofa 45° V-notch weir. Water levels, electrical conductivity, and watertemperature were recorded in 15-min time steps by automaticfield equipment (OTT, Orpheus, Kempten, Germany). ContinuousDOC and turbidity records at the outlet of the spring are detailedbelow.
A borehole was drilled in the unfractured rock of the cliff neigh-bouring the spring. As shown in Fig. 1d, this borehole aims at
J.-B. Charlier et al. / Journal of Hydrology 460–461 (2012) 52–64 53
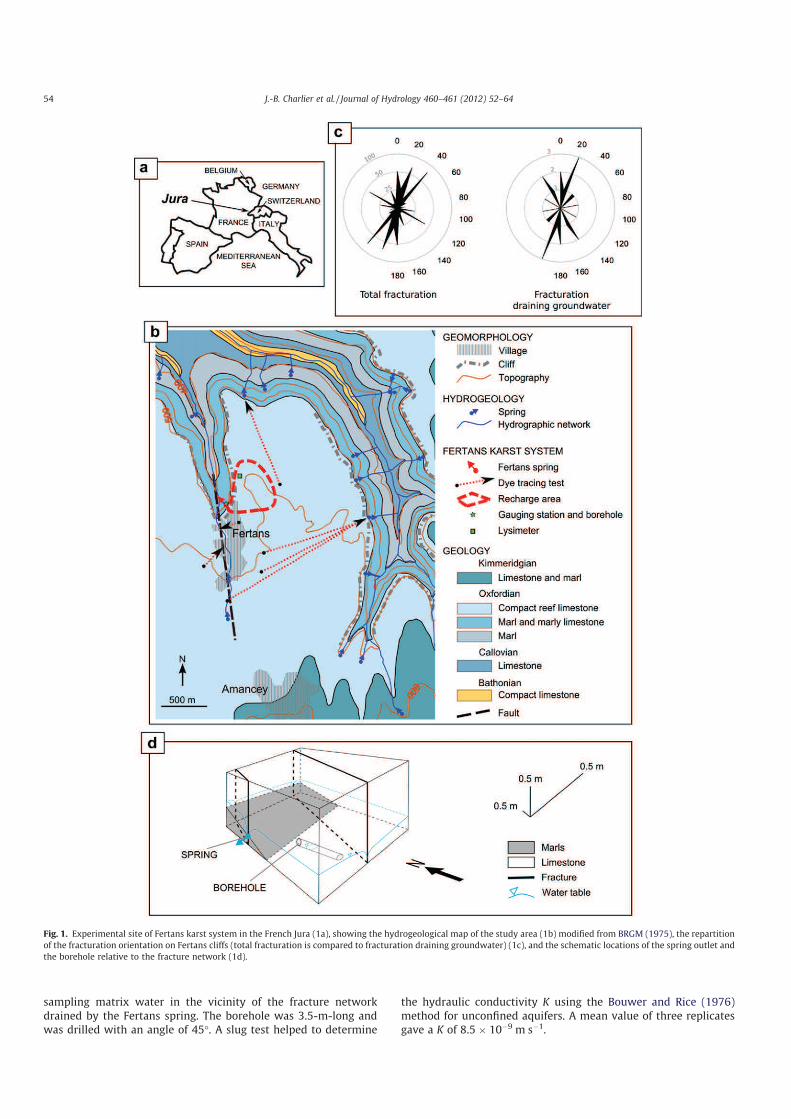
sampling matrix water in the vicinity of the fracture networkdrained by the Fertans spring. The borehole was 3.5-m-long andwas drilled with an angle of 45°. A slug test helped to determine
the hydraulic conductivity K using the Bouwer and Rice (1976)method for unconfined aquifers. A mean value of three replicatesgave a K of 8.5 � 10ÿ9 m sÿ1.
Fig. 1. Experimental site of Fertans karst system in the French Jura (1a), showing the hydrogeological map of the study area (1b) modified from BRGM (1975), the repartitionof the fracturation orientation on Fertans cliffs (total fracturation is compared to fracturation draining groundwater) (1c), and the schematic locations of the spring outlet andthe borehole relative to the fracture network (1d).
54 J.-B. Charlier et al. / Journal of Hydrology 460–461 (2012) 52–64
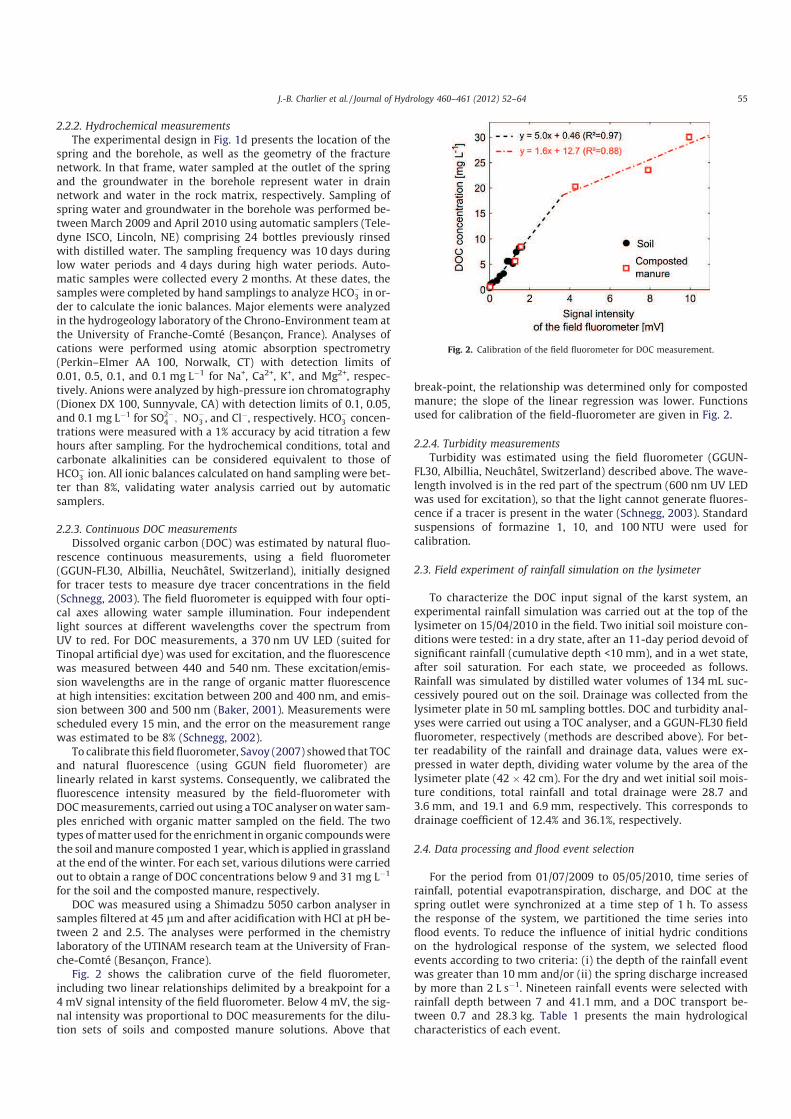
2.2.2. Hydrochemical measurements
The experimental design in Fig. 1d presents the location of thespring and the borehole, as well as the geometry of the fracturenetwork. In that frame, water sampled at the outlet of the springand the groundwater in the borehole represent water in drainnetwork and water in the rock matrix, respectively. Sampling ofspring water and groundwater in the borehole was performed be-tween March 2009 and April 2010 using automatic samplers (Tele-dyne ISCO, Lincoln, NE) comprising 24 bottles previously rinsedwith distilled water. The sampling frequency was 10 days duringlow water periods and 4 days during high water periods. Auto-matic samples were collected every 2 months. At these dates, thesamples were completed by hand samplings to analyze HCOÿ
3 in or-der to calculate the ionic balances. Major elements were analyzedin the hydrogeology laboratory of the Chrono-Environment team atthe University of Franche-Comté (Besançon, France). Analyses ofcations were performed using atomic absorption spectrometry(Perkin–Elmer AA 100, Norwalk, CT) with detection limits of0.01, 0.5, 0.1, and 0.1 mg Lÿ1 for Na+, Ca2+, K+, and Mg2+, respec-tively. Anions were analyzed by high-pressure ion chromatography(Dionex DX 100, Sunnyvale, CA) with detection limits of 0.1, 0.05,and 0.1 mg Lÿ1 for SO2ÿ
4 ; NOÿ3 , and Clÿ, respectively. HCOÿ
3 concen-trations were measured with a 1% accuracy by acid titration a fewhours after sampling. For the hydrochemical conditions, total andcarbonate alkalinities can be considered equivalent to those ofHCOÿ
3 ion. All ionic balances calculated on hand sampling were bet-ter than 8%, validating water analysis carried out by automaticsamplers.
2.2.3. Continuous DOC measurementsDissolved organic carbon (DOC) was estimated by natural fluo-
rescence continuous measurements, using a field fluorometer(GGUN-FL30, Albillia, Neuchâtel, Switzerland), initially designedfor tracer tests to measure dye tracer concentrations in the field(Schnegg, 2003). The field fluorometer is equipped with four opti-cal axes allowing water sample illumination. Four independentlight sources at different wavelengths cover the spectrum fromUV to red. For DOC measurements, a 370 nm UV LED (suited forTinopal artificial dye) was used for excitation, and the fluorescencewas measured between 440 and 540 nm. These excitation/emis-sion wavelengths are in the range of organic matter fluorescenceat high intensities: excitation between 200 and 400 nm, and emis-sion between 300 and 500 nm (Baker, 2001). Measurements werescheduled every 15 min, and the error on the measurement rangewas estimated to be 8% (Schnegg, 2002).
To calibrate this field fluorometer, Savoy (2007) showed that TOCand natural fluorescence (using GGUN field fluorometer) arelinearly related in karst systems. Consequently, we calibrated thefluorescence intensity measured by the field-fluorometer withDOCmeasurements, carried out using a TOC analyser onwater sam-ples enriched with organic matter sampled on the field. The twotypes ofmatter used for the enrichment in organic compoundswerethe soil andmanure composted 1 year, which is applied in grasslandat the end of the winter. For each set, various dilutions were carriedout to obtain a range of DOC concentrations below 9 and 31 mg Lÿ1
for the soil and the composted manure, respectively.DOC was measured using a Shimadzu 5050 carbon analyser in
samples filtered at 45 lm and after acidification with HCl at pH be-tween 2 and 2.5. The analyses were performed in the chemistrylaboratory of the UTINAM research team at the University of Fran-che-Comté (Besançon, France).
Fig. 2 shows the calibration curve of the field fluorometer,including two linear relationships delimited by a breakpoint for a4 mV signal intensity of the field fluorometer. Below 4 mV, the sig-nal intensity was proportional to DOC measurements for the dilu-tion sets of soils and composted manure solutions. Above that
break-point, the relationship was determined only for compostedmanure; the slope of the linear regression was lower. Functionsused for calibration of the field-fluorometer are given in Fig. 2.
2.2.4. Turbidity measurements
Turbidity was estimated using the field fluorometer (GGUN-FL30, Albillia, Neuchâtel, Switzerland) described above. The wave-length involved is in the red part of the spectrum (600 nm UV LEDwas used for excitation), so that the light cannot generate fluores-cence if a tracer is present in the water (Schnegg, 2003). Standardsuspensions of formazine 1, 10, and 100 NTU were used forcalibration.
2.3. Field experiment of rainfall simulation on the lysimeter
To characterize the DOC input signal of the karst system, anexperimental rainfall simulation was carried out at the top of thelysimeter on 15/04/2010 in the field. Two initial soil moisture con-ditions were tested: in a dry state, after an 11-day period devoid ofsignificant rainfall (cumulative depth <10 mm), and in a wet state,after soil saturation. For each state, we proceeded as follows.Rainfall was simulated by distilled water volumes of 134 mL suc-cessively poured out on the soil. Drainage was collected from thelysimeter plate in 50 mL sampling bottles. DOC and turbidity anal-yses were carried out using a TOC analyser, and a GGUN-FL30 fieldfluorometer, respectively (methods are described above). For bet-ter readability of the rainfall and drainage data, values were ex-pressed in water depth, dividing water volume by the area of thelysimeter plate (42 � 42 cm). For the dry and wet initial soil mois-ture conditions, total rainfall and total drainage were 28.7 and3.6 mm, and 19.1 and 6.9 mm, respectively. This corresponds todrainage coefficient of 12.4% and 36.1%, respectively.
2.4. Data processing and flood event selection
For the period from 01/07/2009 to 05/05/2010, time series ofrainfall, potential evapotranspiration, discharge, and DOC at thespring outlet were synchronized at a time step of 1 h. To assessthe response of the system, we partitioned the time series intoflood events. To reduce the influence of initial hydric conditionson the hydrological response of the system, we selected floodevents according to two criteria: (i) the depth of the rainfall eventwas greater than 10 mm and/or (ii) the spring discharge increasedby more than 2 L sÿ1. Nineteen rainfall events were selected withrainfall depth between 7 and 41.1 mm, and a DOC transport be-tween 0.7 and 28.3 kg. Table 1 presents the main hydrologicalcharacteristics of each event.
Fig. 2. Calibration of the field fluorometer for DOC measurement.
J.-B. Charlier et al. / Journal of Hydrology 460–461 (2012) 52–64 55

2.5. Numerical modelling
2.5.1. Model presentation
2.5.1.1. Structure. The model aims at simulating the discharge aswell as the concentration of non-conservative tracers during floodevents. Structure and parameters of the conceptual model arepresented in Fig. 3 and Table 2. The model is based on a classicalkarst model composed of three connected reservoirs: SOIL thatrecharges the aquifer partitioned into a DIFFUSE reservoir (slowresponse in the low permeability rock matrix) and a CONDUIT res-ervoir (fast response in the transmissive fracture network). Thismodelling approach was recently described and tested with goodperformances on rainfall–discharge data of various sites in France(Fleury et al., 2007; Moussu et al., 2011; Tritz et al., 2011).
The temporal variation of solute concentration in a reservoir issimulated using a mixing model including a degradation rate. Totake into account the retardation factor of the solute (i.e. the delaygenerated partly by sorption processes), we added a DELAY reser-voir below the SOIL reservoir (see Fig. 3). This DELAY reservoir con-cerns solute transport only, buffering the solute velocity relative tothe water velocity.
The volume of water stored, called VPISTON, was added to thebasic model to simulate the arrival of pre-event water (i.e. waterinitially stored in the system and drained by piston-type flows) be-fore the arrival of event water (i.e. recently infiltrated rainwater).This storage has a siphon structure and represents the saturatedzone in the CONDUIT. It is drained at the beginning of the event,without being diluted by event water in the CONDUIT. Conse-quently, hydrograph simulations are not affected by VPISTON.
The overflow parameter Qoverflow limits the water stored in theDIFFUSE and CONDUIT reservoirs, and consequently aims at limit-ing peakflows.
The variability of the recharge area is simply controlled by alpha
as a factor of the maximum recharge area A. Using alpha as athreshold for different contributions of the recharge area intro-duced non-linearity in flow and transport.
2.5.1.2. Governing Equations. Each reservoir has one input Vin (L3)and one output Vout (L
3). The volume of water stored, V, in the res-ervoir is obtained using the continuity equation:
dV
dt¼ V in ÿ Vout with Vout ¼ k � V ð1Þ
where k (Tÿ1) is a constant characterizing the recession curve of thereservoir. In this basic model, the temporal change of concentrationof dissolved substances C (M Lÿ3) in the DIFFUSE and CONDUIT res-ervoirs is simulated using a mixing model including a degradationrate k (Tÿ1). This rate is based on a linear law, allowing k to be ex-pressed as a function of the half-life DT50 (T):
dC
dt¼
Cin � V in
VÿC � Vout
Vÿ k � C with k ¼
0:693DT50
ð2Þ
where Cin (M Lÿ3) is the concentration of the input water.
2.5.1.3. Parameters. The model needs a total of 11 parameters thatmay be imposed or calibrated. They are summarized in Table 2. Themodel input is the rainfall, and the outputs are a simulated hydro-graph and chemograph, which were compared to the observedones to test model performances. The model needs four initial con-ditions: (i) initial SOIL storage, estimated according to antecedent
Table 1
Main characteristics of flood events (sorted by increasing initial discharge for each calibration and validation set: events 1–10, and 11–19, respectively – see Table 3).
Eventnumber
Date Antecedent lag fora rainfall event > to10 mm (days)
Rainfalldepth (mm)
Maximumrainfall intensityover 1 h (mm hÿ1)
Initialdischarge (L sÿ1)
Peakflow?tul?> (L sÿ1)
Flowvolume (m3)
DOCtransport (kg)
1 01/05/2010 3.3 20.8 3.2 0.1 0.6 32 0.72 23/07/2009 5.3 18.8 8.3 0.1 3.4 64 1.73 01/11/2009 9.7 25.4 4.8 0.2 4.9 288 6.44 03/09/2009 1.5 21.9 7.5 0.2 4.9 322 7.15 14/11/2009 3.3 15.4 7.0 0.5 4.9 325 4.26 29/12/2009 4.5 41.1 5.4 0.9 4.9 1022 25.37 09/11/2009 1.5 20.0 2.0 1.0 4.9 865 15.08 15/11/2009 0.3 7.0 1.2 1.9 4.2 424 5.09 01/01/2010 1.5 11.6 2.6 1.9 3.8 448 10.9
10 19/02/2010 4.2 13.8 2.8 4.0 4.9 658 14.911 01/09/2009 11.4 15.0 6.8 0.1 1.6 30 1.012 02/09/2009 1.4 17.7 6.8 0.1 4.7 72 2.113 16/07/2009 2.2 23.8 4.6 0.1 3.4 123 3.314 16/02/2010 4.2 20.8 3.0 0.5 4.9 841 21.415 07/11/2009 1.3 11.4 2.8 0.7 4.9 379 6.916 03/11/2009 0.2 20.8 2.6 1.0 4.9 718 14.017 22/02/2010 14.6 20.0 3.0 1.0 4.9 729 16.418 25/02/2010 10.5 12.4 2.8 1.9 4.9 543 11.719 22/12/2009 4.3 35.4 2.6 2.4 4.9 1268 28.3
Fig. 3. Conceptual model showing parameters for flows in blue, and parameters forsolute transport in red (underlined).
56 J.-B. Charlier et al. / Journal of Hydrology 460–461 (2012) 52–64

rainfall level, (ii) initial DIFFUSE storage, calculated from baseflowvalue, (iii) initial CONDUIT storage, equalling zero (water initiallystored in the conduit is localized in the PISTON volume), and (iv)initial spring concentration, equalling CONDUIT, which equals DIF-FUSE concentration.
2.5.2. Application on the study site
2.5.2.1. Sensitivity analysis. A sensitivity analysis was carried out ona single peak flood event (event 15 in Table 1) in order to assessmodel behaviour and to identify the parameters that should be cal-ibrated or imposed. The parameters’ sensitivity for discharge sim-ulations has been largely investigated (Moussu et al., 2011). Thus,in this paper, we focused the sensitivity analysis on parameterscontrolling solute concentrations: VPISTON, Conc.SOIL, kDELAY, andDT50. For each of these four parameters, several DOC simulationswere tested for differences of ±10%, ±25%, and ±50% around the cal-ibrated value. Results are plotted in Fig. 4 and are interpreted asfollows: the fewer the differences in the simulation, the less sensi-tive the parameter. Concerning VPISTON, its increase limited the dilu-tion by event water and increased the DOC peak. Concerning theother parameters, a decrease led to (i) a decreased DOC peak forConc.SOIL, (ii) a higher delay of DOC peak associated to a bufferedeffect for kDELAY, and (iii) a decreased concentration for DT50. Glob-ally, sensitivity increased from DT50, kDELAY, VPISTON, to Conc.SOIL. Asexpected, the two most sensitive parameters controlled thedilution of the tracer in the model reservoirs, whereas the less sen-sitive parameters controlled the shape of the chemograph only.
2.5.2.2. Parameterization. From results of previous works and of thesensitivity analysis, four parameters were estimated: kDIFFUSE andkCONDUIT using recession hydrograph analysis, Qoverflow using hydro-graph analysis, and DT50 from laboratory experiment carried outby Batiot (2002). Finally, seven parameters needed to be cali-brated: alpha, kSOIL, Hmin, SOIL, X, VPISTON, Conc.SOIL, and kDELAY. Eventhough the DOC signal was measured in drainage water, we never-theless chose to calibrate Conc.SOIL because of its high sensitivity inthe model. The two initial conditions for discharge and concentra-tion are data measured at t = 0. Regarding the variability of thehydrological response according to groundwater storage, a lowand a high water period were considered for simulations. The cho-sen baseflow threshold for low and high periods corresponds to acalibrated value equal to 0.4 L sÿ1. Only alpha, kSOIL, and VPISTON
were significantly different between these two periods.
2.5.2.3. Calibration strategy. The model applied on the Fertans karstsystem runs on an hourly time step. To assess the model perfor-mances for all events, the 19 flood events were randomly split be-tween a 10-event set for calibration (events 1–10 in Table 1) and a9-event set for validation (events 11–19 in Table 1). A collectivecalibration procedure was carried out on the calibration set, withfirstly, an optimisation of the discharge simulation usingNash–Sutcliffe’s coefficient of efficiency NS, and secondly, an opti-misation of the chemograph simulation using the determinationcoefficient R2. For collective calibration, the NS criterion for N
events is expressed according to Chahinian et al. (2006) as follows:
NS ¼ 1ÿ
PNi¼1
Pnij¼1ðQoij ÿ QsijÞ
2
PNi¼1
Pnij¼1ðQoij ÿ
�QÞ2
" #
ð3Þ
where j is an index representing the time step in a flood event i(1 6 j 6 ni); ni, the number of time steps in the flood event i; QOij,the observed discharge at time j in the flood event i; QSij, the simu-lated discharge at time j on the flood event i; and �Q , the mean valueof all measured discharge of all flood events. NS criteria range be-tween ÿ1 and 1, with 1 signifying a perfect fit between simulatedand observed hydrograph, and with negative values signifying thatthe arithmetic mean of the observed hydrograph is a better esti-mate than the simulated hydrograph. We considered in this studythat a 0.8 value corresponded to good model performances.
3. Results
The first three sub-sections present results from field measure-ments using hydrodynamic and hydrochemical approaches. Theseexperimental results served as the basis of the modelling approachwhose results are presented in the last sub-section and whichserved to verify the main hypothesis about infiltration and trans-port processes.
3.1. Input signal of the karst system
At the event time scale, the input DOC signal in the system wascharacterized using rainfall simulation on the lysimeter under dryand wet initial soil moisture conditions. Experimental results arepresented in Fig. 5 with, from top to bottom, rainfall, drainageflow-rates, and DOC and turbiditymeasurements in drainagewater.First, comparing dry and wet states, we observed a three-fold
Table 2
Description and calibration value of the model parameters.
Parametername
Reservoir Signification Calibrationvalueb
alphaa all Contribution of the recharge area (-) 7% (low)100% (high)
kSOILa SOIL Recession coefficient (-) 0.30 (low)
0.09 (high)Hmin, SOIL
a SOIL Minimum storage for recharge (mm) 14Xa DIFFUSE and
CONDUITPartition coefficient between DIFFUSE and CONDUIT reservoirs (-) expressed as the contribution ofDIFFUSE
41%
kDIFFUSE DIFFUSE Recession coefficient (-) 0.03kCONDUIT CONDUIT Recession coefficient (-) 0.70VPISTON
a PISTON Total volume of pre-event water (m3) 30 (low)200 (high)
Qoverflow DIFFUSE andCONDUIT
Maximum spring discharge due to overflow (L sÿ1) 4.9
Conc.SOILa DIFFUSE and
CONDUITTracer concentration in recharge water (from SOIL) (mg Lÿ1) 18
DT50 DIFFUSE andCONDUIT
Half-life of the tracer (days) 9
kDELAYa DELAY Recession coefficient (for tracer only) (-) 0.70
a Indicates the calibrated parameters.b When low and high conditions are indicated, it refers to baseflow <0.4 and P0.4 L sÿ1, respectively.
J.-B. Charlier et al. / Journal of Hydrology 460–461 (2012) 52–64 57
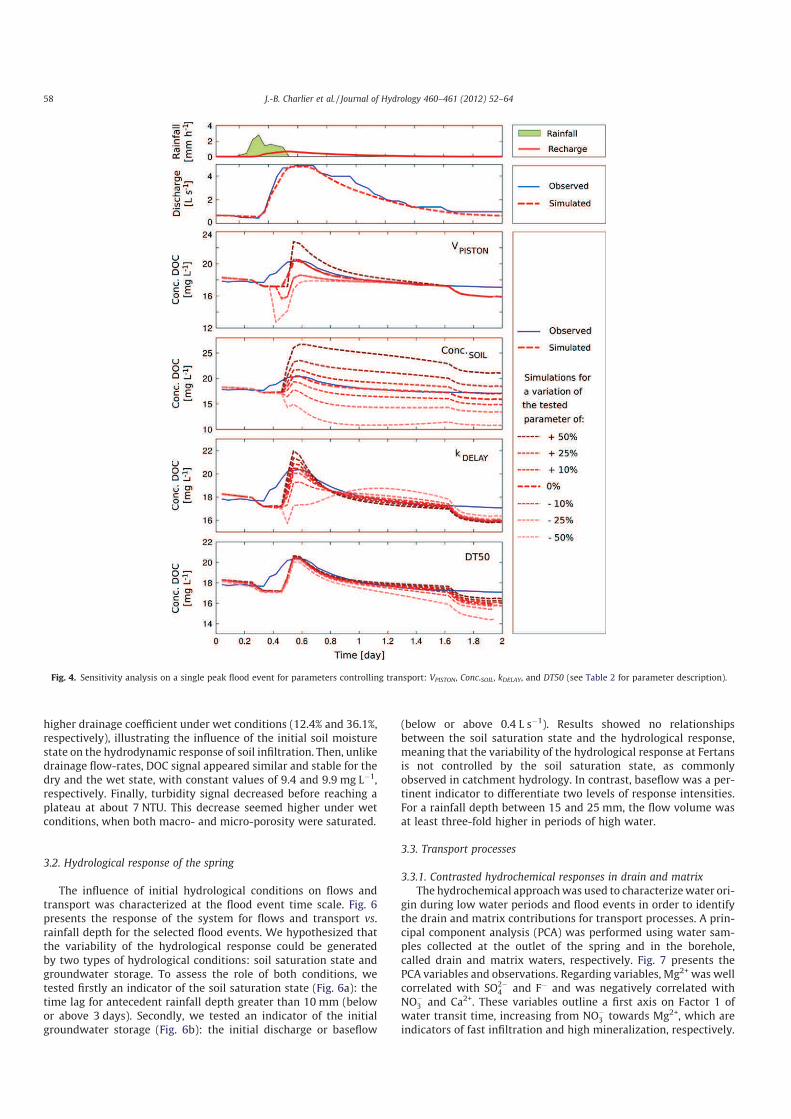
higher drainage coefficient under wet conditions (12.4% and 36.1%,respectively), illustrating the influence of the initial soil moisturestate on the hydrodynamic response of soil infiltration. Then, unlikedrainage flow-rates, DOC signal appeared similar and stable for thedry and the wet state, with constant values of 9.4 and 9.9 mg Lÿ1,respectively. Finally, turbidity signal decreased before reaching aplateau at about 7 NTU. This decrease seemed higher under wetconditions, when both macro- and micro-porosity were saturated.
3.2. Hydrological response of the spring
The influence of initial hydrological conditions on flows andtransport was characterized at the flood event time scale. Fig. 6presents the response of the system for flows and transport vs.rainfall depth for the selected flood events. We hypothesized thatthe variability of the hydrological response could be generatedby two types of hydrological conditions: soil saturation state andgroundwater storage. To assess the role of both conditions, wetested firstly an indicator of the soil saturation state (Fig. 6a): thetime lag for antecedent rainfall depth greater than 10 mm (belowor above 3 days). Secondly, we tested an indicator of the initialgroundwater storage (Fig. 6b): the initial discharge or baseflow
(below or above 0.4 L sÿ1). Results showed no relationshipsbetween the soil saturation state and the hydrological response,meaning that the variability of the hydrological response at Fertansis not controlled by the soil saturation state, as commonlyobserved in catchment hydrology. In contrast, baseflow was a per-tinent indicator to differentiate two levels of response intensities.For a rainfall depth between 15 and 25 mm, the flow volume wasat least three-fold higher in periods of high water.
3.3. Transport processes
3.3.1. Contrasted hydrochemical responses in drain and matrix
The hydrochemical approachwas used to characterizewater ori-gin during low water periods and flood events in order to identifythe drain and matrix contributions for transport processes. A prin-cipal component analysis (PCA) was performed using water sam-ples collected at the outlet of the spring and in the borehole,called drain and matrix waters, respectively. Fig. 7 presents thePCA variables and observations. Regarding variables, Mg2+ was wellcorrelated with SO2ÿ
4 and Fÿ and was negatively correlated withNOÿ
3 and Ca2+. These variables outline a first axis on Factor 1 ofwater transit time, increasing from NOÿ
3 towards Mg2+, which areindicators of fast infiltration and high mineralization, respectively.
Fig. 4. Sensitivity analysis on a single peak flood event for parameters controlling transport: VPISTON, Conc.SOIL, kDELAY, and DT50 (see Table 2 for parameter description).
58 J.-B. Charlier et al. / Journal of Hydrology 460–461 (2012) 52–64

Fig. 5. Soil drainage pattern under experimental rainfall simulation at dry and wet initial soil water saturation states. From top to bottom, cumulative rainfall, drainagecoefficient (cumulative drainage/maximum of cumulative rainfall), dissolved organic carbon (DOC), and turbidity.
Fig. 6. Flood event characteristics showing flow volume and DOC transport vs. rainfall depth, in terms of two initial hydric conditions: the lag time for antecedent rainfallabove 10 mm (6a) and the baseflow (6b).
J.-B. Charlier et al. / Journal of Hydrology 460–461 (2012) 52–64 59

A third group, on Factor 2, shows that Na+ and K+ were well corre-lated and had a nearly independent pattern compared to tracersdetermining Factor 1. Na+ and K+ represent a shallow origin of thewater since they come from anthropogenic activities. RegardingPCA observations, Fig. 7 shows thewater stage for drain andmatrix:lowwater levels in red and flood events in white1. During periods oflow water, matrix waters are aligned on Factor 1, showing a highmineralization in deep layers, whereas drain waters are aligned onFactor 2, showing a more superficial origin with fast infiltration.Hence, matrix and conduit display independent hydrochemical re-sponses. During flood events, matrix waters are a mixing of mineral-ized and shallow waters, and the hydrochemical signals of drain andmatrix converge towards shorter transit times.
3.3.2. Transport dynamics during flood events
To characterize the main infiltration and transport processesduring flood events, the spring response after a single short rainfallevent was studied for various parameters: rainfall, discharge,temperature, electrical conductivity, DOC, and turbidity (Fig. 8).Various delays in the hydrological and hydrochemical responses(shown by vertical dashed lines) revealed flow types. Firstly, whendischarge increased, response was delayed by about 1 h for electri-cal conductivity, DOC, and turbidity. This first phase may be attrib-uted to pre-event water, initially stored in the system, and drainedvia piston-type flows. Secondly, we observed a trough of tempera-ture and electrical conductivity, and a turbidity peak in phase withthe discharge peak. This shows that flood peaks were generated bythe arrival of freshly infiltrated rainwater with a large flux of sus-pended matter. Finally, DOC peak was delayed 2 h from dischargepeak, after the end of the electrical conductivity trough and turbid-ity peak, i.e. after the fresh water transit. For this last phase, wemay hypothesize that the delayed DOC transport is mainly dueto degradation and/or retardation as a consequence of sorptionprocesses, which strongly affect organic compounds.
3.3.3. Application of the numerical conceptual model
For calibration and validation sets, performance criteria are pre-sented in Table 3: NS criterion on discharge was 0.86 and 0.85,respectively, and R2 criterion on DOC concentration was 0.4 and0.36, respectively. The calibration and validation results presentedin Table 3 show good accuracy on hydrograph and chemographsimulation, considering multiple hydrological conditions. For eachflood event of calibration and validation sets, Fig. 9 shows a com-parison between observed and calculated spring flow volume andDOC transport. There was a good fit between observed and simu-lated flow volumes and transport for all events, meaning that the
model was able to simulate water balance and DOC budget atthe time scale of the flood event. Two simulation examples are pre-sented in Fig. 10, for low and high water periods. There was a goodfit between observed and simulated discharge, as for DOC concen-tration, in two cases: a response of low intensity during intermit-tent rainfalls in low water period (top of Fig. 10), and a responseof high intensity in high water period.
4. Discussion and conceptual model
From the results of the hydrochemical and hydrodynamic ap-proaches, we can design the structure of the karst system and out-line the main infiltration and transport processes during floodevents. The hydrological conceptual scheme (Fig. 11) summarizeswater flows from each compartment involved, and the transfer
Fig. 7. Plot based on principal components analysis of hydrochemical sampling from borehole (matrix) and spring (drain).
Fig. 8. Hydrological response of the system after a short duration rainfall; withrainfall P, spring discharge Q, water temperature Temp., electrical conductivity EC,dissolved organic carbon concentration DOC, and turbidity Turb.
1 For interpretation of color in Figs. 1–11, the reader is referred to the web versionof this article.
60 J.-B. Charlier et al. / Journal of Hydrology 460–461 (2012) 52–64
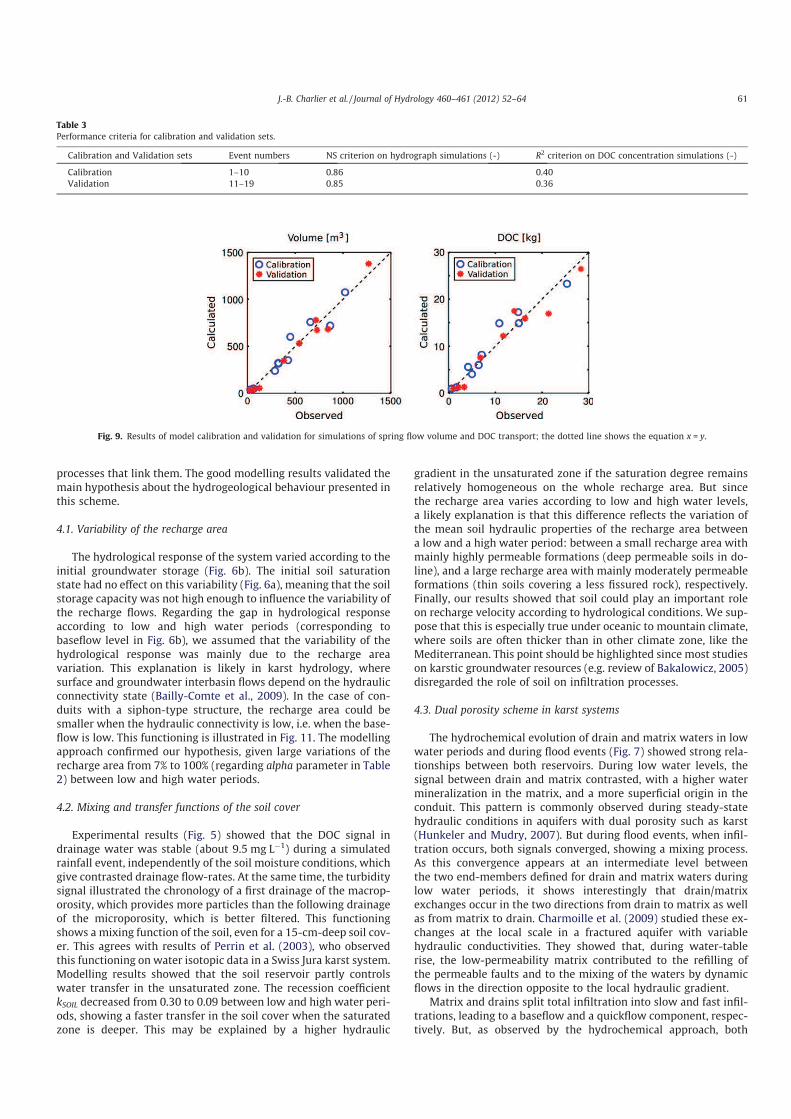
processes that link them. The good modelling results validated themain hypothesis about the hydrogeological behaviour presented inthis scheme.
4.1. Variability of the recharge area
The hydrological response of the system varied according to theinitial groundwater storage (Fig. 6b). The initial soil saturationstate had no effect on this variability (Fig. 6a), meaning that the soilstorage capacity was not high enough to influence the variability ofthe recharge flows. Regarding the gap in hydrological responseaccording to low and high water periods (corresponding tobaseflow level in Fig. 6b), we assumed that the variability of thehydrological response was mainly due to the recharge areavariation. This explanation is likely in karst hydrology, wheresurface and groundwater interbasin flows depend on the hydraulicconnectivity state (Bailly-Comte et al., 2009). In the case of con-duits with a siphon-type structure, the recharge area could besmaller when the hydraulic connectivity is low, i.e. when the base-flow is low. This functioning is illustrated in Fig. 11. The modellingapproach confirmed our hypothesis, given large variations of therecharge area from 7% to 100% (regarding alpha parameter in Table2) between low and high water periods.
4.2. Mixing and transfer functions of the soil cover
Experimental results (Fig. 5) showed that the DOC signal indrainage water was stable (about 9.5 mg Lÿ1) during a simulatedrainfall event, independently of the soil moisture conditions, whichgive contrasted drainage flow-rates. At the same time, the turbiditysignal illustrated the chronology of a first drainage of the macrop-orosity, which provides more particles than the following drainageof the microporosity, which is better filtered. This functioningshows a mixing function of the soil, even for a 15-cm-deep soil cov-er. This agrees with results of Perrin et al. (2003), who observedthis functioning on water isotopic data in a Swiss Jura karst system.Modelling results showed that the soil reservoir partly controlswater transfer in the unsaturated zone. The recession coefficientkSOIL decreased from 0.30 to 0.09 between low and high water peri-ods, showing a faster transfer in the soil cover when the saturatedzone is deeper. This may be explained by a higher hydraulic
gradient in the unsaturated zone if the saturation degree remainsrelatively homogeneous on the whole recharge area. But sincethe recharge area varies according to low and high water levels,a likely explanation is that this difference reflects the variation ofthe mean soil hydraulic properties of the recharge area betweena low and a high water period: between a small recharge area withmainly highly permeable formations (deep permeable soils in do-line), and a large recharge area with mainly moderately permeableformations (thin soils covering a less fissured rock), respectively.Finally, our results showed that soil could play an important roleon recharge velocity according to hydrological conditions. We sup-pose that this is especially true under oceanic to mountain climate,where soils are often thicker than in other climate zone, like theMediterranean. This point should be highlighted since most studieson karstic groundwater resources (e.g. review of Bakalowicz, 2005)disregarded the role of soil on infiltration processes.
4.3. Dual porosity scheme in karst systems
The hydrochemical evolution of drain and matrix waters in lowwater periods and during flood events (Fig. 7) showed strong rela-tionships between both reservoirs. During low water levels, thesignal between drain and matrix contrasted, with a higher watermineralization in the matrix, and a more superficial origin in theconduit. This pattern is commonly observed during steady-statehydraulic conditions in aquifers with dual porosity such as karst(Hunkeler and Mudry, 2007). But during flood events, when infil-tration occurs, both signals converged, showing a mixing process.As this convergence appears at an intermediate level betweenthe two end-members defined for drain and matrix waters duringlow water periods, it shows interestingly that drain/matrixexchanges occur in the two directions from drain to matrix as wellas from matrix to drain. Charmoille et al. (2009) studied these ex-changes at the local scale in a fractured aquifer with variablehydraulic conductivities. They showed that, during water-tablerise, the low-permeability matrix contributed to the refilling ofthe permeable faults and to the mixing of the waters by dynamicflows in the direction opposite to the local hydraulic gradient.
Matrix and drains split total infiltration into slow and fast infil-trations, leading to a baseflow and a quickflow component, respec-tively. But, as observed by the hydrochemical approach, both
Table 3
Performance criteria for calibration and validation sets.
Calibration and Validation sets Event numbers NS criterion on hydrograph simulations (-) R2 criterion on DOC concentration simulations (-)
Calibration 1–10 0.86 0.40Validation 11–19 0.85 0.36
Fig. 9. Results of model calibration and validation for simulations of spring flow volume and DOC transport; the dotted line shows the equation x = y.
J.-B. Charlier et al. / Journal of Hydrology 460–461 (2012) 52–64 61

components contributed to flood events. The modelling approachallows one to quantify matrix and drain contributions of the DIF-FUSE and CONDUIT reservoirs, respectively. Regarding the parti-tion coefficient (X in Table 2), the model shows that about 41% ofthe recharge (effective rainfall) corresponds to diffuse infiltrationand storage in the rock matrix, and that 59% corresponds to fastinfiltration via the conduit network. The contribution of diffuseinfiltration seems to be smaller than in larger scale karst systemsin France like the Durzon spring (57–81%, Tritz et al., 2011) orthe Fontaine de Vaucluse (63%, Fleury et al., 2007). This may bedue to a scale effect linked to the thickness of the saturated zoneof such deeper karst systems.
4.4. Contributions of pre-event and event waters
Pre-event water contribution varied greatly according to rainfallintensities and initial storage. This variability is illustrated by both
examples in Fig. 10. For the event in wet period (bottom of Fig. 10),pre-event water represented 20% of total flood volume before theDOC peak generated by the arrival of rainwater in conduits. In thiscase, piston-type flows are a minor process relative to fast infiltra-tion in conduits. For the event in dry period (top of Fig. 10), theDOC signal remained flat, due to a contribution of pre-event wateronly. In the latter case, 100% of flood water is pre-event waterdrained by piston-type flows without dilution effect by infiltratedrainwater. This functioning illustrates the influence of thesaturated zone thickness on the spring hydrochemical variationsduring flood events.
4.5. Transport processes
Delayed hydrological signals of discharge, electrical conductiv-ity, DOC, and turbidity allowed the main flow-types to be differen-tiated during a flood event (Fig. 8). Regarding turbidity, Pronk et al.
Fig. 10. Simulation examples in low and high water periods.
62 J.-B. Charlier et al. / Journal of Hydrology 460–461 (2012) 52–64
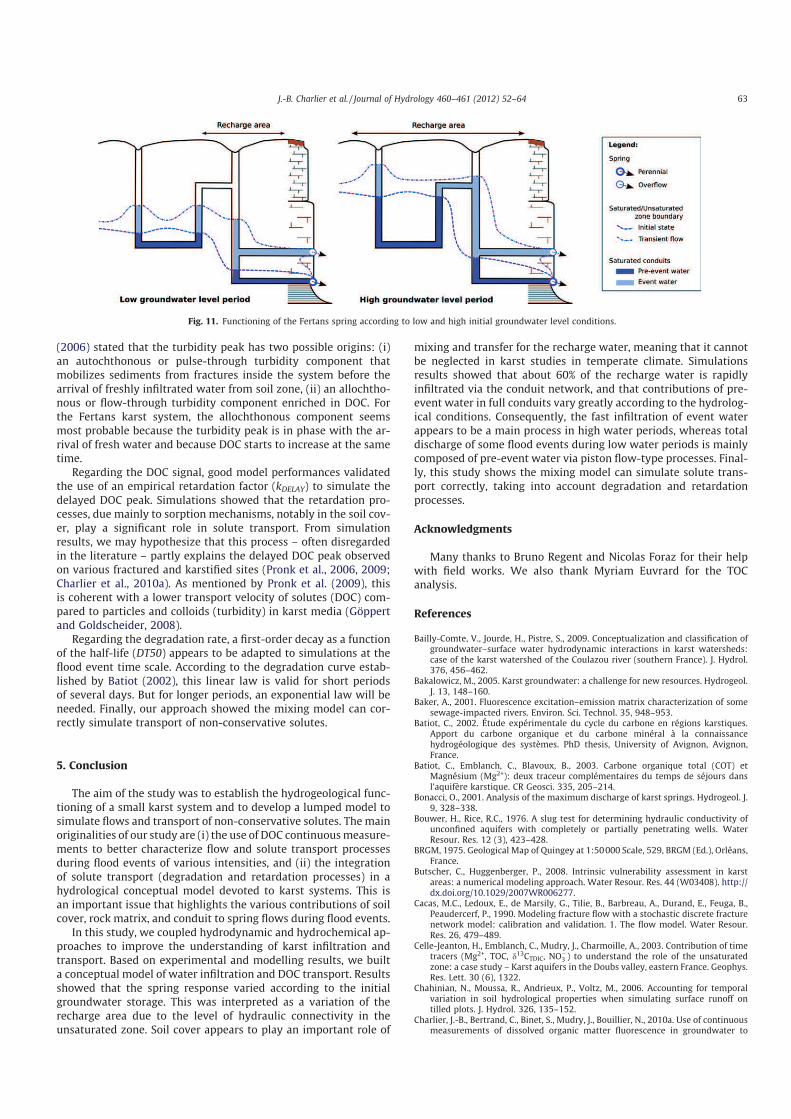
(2006) stated that the turbidity peak has two possible origins: (i)an autochthonous or pulse-through turbidity component thatmobilizes sediments from fractures inside the system before thearrival of freshly infiltrated water from soil zone, (ii) an allochtho-nous or flow-through turbidity component enriched in DOC. Forthe Fertans karst system, the allochthonous component seemsmost probable because the turbidity peak is in phase with the ar-rival of fresh water and because DOC starts to increase at the sametime.
Regarding the DOC signal, good model performances validatedthe use of an empirical retardation factor (kDELAY) to simulate thedelayed DOC peak. Simulations showed that the retardation pro-cesses, due mainly to sorption mechanisms, notably in the soil cov-er, play a significant role in solute transport. From simulationresults, we may hypothesize that this process – often disregardedin the literature – partly explains the delayed DOC peak observedon various fractured and karstified sites (Pronk et al., 2006, 2009;Charlier et al., 2010a). As mentioned by Pronk et al. (2009), thisis coherent with a lower transport velocity of solutes (DOC) com-pared to particles and colloids (turbidity) in karst media (Göppertand Goldscheider, 2008).
Regarding the degradation rate, a first-order decay as a functionof the half-life (DT50) appears to be adapted to simulations at theflood event time scale. According to the degradation curve estab-lished by Batiot (2002), this linear law is valid for short periodsof several days. But for longer periods, an exponential law will beneeded. Finally, our approach showed the mixing model can cor-rectly simulate transport of non-conservative solutes.
5. Conclusion
The aim of the study was to establish the hydrogeological func-tioning of a small karst system and to develop a lumped model tosimulate flows and transport of non-conservative solutes. The mainoriginalities of our study are (i) the use of DOC continuousmeasure-ments to better characterize flow and solute transport processesduring flood events of various intensities, and (ii) the integrationof solute transport (degradation and retardation processes) in ahydrological conceptual model devoted to karst systems. This isan important issue that highlights the various contributions of soilcover, rock matrix, and conduit to spring flows during flood events.
In this study, we coupled hydrodynamic and hydrochemical ap-proaches to improve the understanding of karst infiltration andtransport. Based on experimental and modelling results, we builta conceptual model of water infiltration and DOC transport. Resultsshowed that the spring response varied according to the initialgroundwater storage. This was interpreted as a variation of therecharge area due to the level of hydraulic connectivity in theunsaturated zone. Soil cover appears to play an important role of
mixing and transfer for the recharge water, meaning that it cannotbe neglected in karst studies in temperate climate. Simulationsresults showed that about 60% of the recharge water is rapidlyinfiltrated via the conduit network, and that contributions of pre-event water in full conduits vary greatly according to the hydrolog-ical conditions. Consequently, the fast infiltration of event waterappears to be a main process in high water periods, whereas totaldischarge of some flood events during low water periods is mainlycomposed of pre-event water via piston flow-type processes. Final-ly, this study shows the mixing model can simulate solute trans-port correctly, taking into account degradation and retardationprocesses.
Acknowledgments
Many thanks to Bruno Regent and Nicolas Foraz for their helpwith field works. We also thank Myriam Euvrard for the TOCanalysis.
References
Bailly-Comte, V., Jourde, H., Pistre, S., 2009. Conceptualization and classification ofgroundwater–surface water hydrodynamic interactions in karst watersheds:case of the karst watershed of the Coulazou river (southern France). J. Hydrol.376, 456–462.
Bakalowicz, M., 2005. Karst groundwater: a challenge for new resources. Hydrogeol.J. 13, 148–160.
Baker, A., 2001. Fluorescence excitation–emission matrix characterization of somesewage-impacted rivers. Environ. Sci. Technol. 35, 948–953.
Batiot, C., 2002. Étude expérimentale du cycle du carbone en régions karstiques.Apport du carbone organique et du carbone minéral à la connaissancehydrogéologique des systèmes. PhD thesis, University of Avignon, Avignon,France.
Batiot, C., Emblanch, C., Blavoux, B., 2003. Carbone organique total (COT) etMagnésium (Mg2+): deux traceur complémentaires du temps de séjours dansl’aquifère karstique. CR Geosci. 335, 205–214.
Bonacci, O., 2001. Analysis of the maximum discharge of karst springs. Hydrogeol. J.9, 328–338.
Bouwer, H., Rice, R.C., 1976. A slug test for determining hydraulic conductivity ofunconfined aquifers with completely or partially penetrating wells. WaterResour. Res. 12 (3), 423–428.
BRGM, 1975. Geological Map of Quingey at 1:50000 Scale, 529, BRGM (Ed.), Orléans,France.
Butscher, C., Huggenberger, P., 2008. Intrinsic vulnerability assessment in karstareas: a numerical modeling approach. Water Resour. Res. 44 (W03408). http://dx.doi.org/10.1029/2007WR006277.
Cacas, M.C., Ledoux, E., de Marsily, G., Tilie, B., Barbreau, A., Durand, E., Feuga, B.,Peaudercerf, P., 1990. Modeling fracture flow with a stochastic discrete fracturenetwork model: calibration and validation. 1. The flow model. Water Resour.Res. 26, 479–489.
Celle-Jeanton, H., Emblanch, C., Mudry, J., Charmoille, A., 2003. Contribution of timetracers (Mg2+, TOC, d13CTDIC, NO
ÿ3 ) to understand the role of the unsaturated
zone: a case study – Karst aquifers in the Doubs valley, eastern France. Geophys.Res. Lett. 30 (6), 1322.
Chahinian, N., Moussa, R., Andrieux, P., Voltz, M., 2006. Accounting for temporalvariation in soil hydrological properties when simulating surface runoff ontilled plots. J. Hydrol. 326, 135–152.
Charlier, J.-B., Bertrand, C., Binet, S., Mudry, J., Bouillier, N., 2010a. Use of continuousmeasurements of dissolved organic matter fluorescence in groundwater to
Fig. 11. Functioning of the Fertans spring according to low and high initial groundwater level conditions.
J.-B. Charlier et al. / Journal of Hydrology 460–461 (2012) 52–64 63

characterize fast infiltration through an unstable fractured hillslope (Valabresrockfall, French Alps). Hydrogeol. J. 18, 1963–1969.
Charlier, J.-B., Mudry, J., Bertrand, C., 2010b. Use of dissolved organic carbon tocharacterize infiltration in a small karst system in the French Jura mountains(Fertans, France). In: Andreo, B. et al. (Eds.), Advances in Research in KarstMedia. Springer, Berlin, pp. 151–156.
Charmoille, A., Binet, S., Bertrand, C., Guglielmi, Y., Mudry, J., 2009. Hydraulicinteractions between fractures and bedding planes in a carbonate aquiferstudied by means of experimentally induced water-table fluctuations. (Coarazeexperimental site, southeastern France). Hydrogeol. J. 17 (7), 1607–1616.
Cornaton, F., Perrochet, P., 2002. Analytical 1D dual-porosity equivalent solutions to3D discrete-continuum models. Application to karstic spring hydrographmodelling. J. Hydrol. 262, 165–176.
Emblanch, C., Blavoux, B., Puig, J.M., Mudry, J., 1998. Dissolved organic carbon ofinfiltration within the autogenic karst hydrosystem. Geophys. Res. Lett. 25 (9),1459–1462.
Emblanch, C., Zuppi, G.M., Mudry, J., Blavoux, B., Batiot, C., 2003. Carbon 13 of TDICto quantify the role of the unsaturated zone: the example of the Vaucluse karstsystems (southeastern France). J. Hydrol. 279 (1–4), 262–274.
Fleury, P., Plagnes, V., Bakalowicz, M., 2007. Modelling of the functioning of karstaquifers with a reservoir model: application to Fontaine de Vaucluse (south ofFrance). J. Hydrol. 345, 38–49.
Geyer, T., Birk, S., Liedl, R., Sauter, M., 2008. Quantification of temporal distributionof recharge in karst systems from spring hydrographs. J. Hydrol. 348, 452–463.
Goldscheider, N., Drew, D., Worthington, S., 2007. Introduction. In: Goldscheider, N.,Drew, D. (Eds.), Methods in Karst Hydrogeology, Taylor & Francis, London. Int.Contrib. Hydrogeol. 26, 1–8.
Göppert, N., Goldscheider, N., 2008. Solute and colloid transport in karst conduitsunder low- and high-flow conditions. Ground Water 46 (1), 61–68.
Hartmann, A., Kralik, M., Humer, F., Lange, J., Weiler, M., 2012. Identification of akarst system’s intrinsic hydrodynamic parameters: upscaling from singlesprings to the whole aquifer. Environ. Earth Sci. 65, 2377–2389.
Hunkeler, D., Mudry, J., 2007. Hydrochemical methods. In: Goldscheider, N., Drew,D. (Eds.), Methods in karst hydrogeology. Int. Contrib. Hydrogeol. vol. 26. Taylor& Francis, London, pp. 3–121.
IUSS Working Group WRB (Ed.), 2006. World Reference Base for Soil Resources2006. World Soil Resources Rep. 103. FAO, Rome.
Jukic, D., Denic-Jukic, V., 2009. Groundwater balance estimation in karst by using aconceptual rainfall–runoff model. J. Hydrol. 373, 302–315.
Kiraly, L., 1985. FEM-301. A Three Dimensional Model for Groundwater FlowSimulation. NAGRA Technical Report, 96p.
Kurtulus, B., Razack, M., 2006. Evaluation of the ability of an artificial neuralnetwork model to simulate the input–output responses of a large karsticaquifer: the La Rochefoucauld aquifer (Charente, France). Hydrogeol. J. 15, 241–254.
Labat, D., Ababou, R., Mangin, A., 2000. Rainfall–runoff relations for karstic springs.Part I: Convolution and spectral analyses. J. Hydrol. 238 (3–4), 123–148.
Laroque, M., Mangin, A., Razack, M., Banton, O., 1998. Contribution of correlationand spectral analyses to the regional study of a large karst aquifer (Charente,France). J. Hydrol. 205, 217–231.
Lee, E.S., Krothe, N.C., 2001. A four-component mixing model for water in a karstterrain in south-central Indiana, USA: using solute concentration and stableisotopes as tracers. Chem. Geol. 179 (1–4), 129–143.
Maloszewski, P., Stichler, W., Zuber, A., Rank, D., 2002. Identifying the flow systemsin a karstic-fissured-porous aquifer, the Schneealpe, Austria, by modelling ofenvironmental 18O and 3H isotopes. J. Hydrol. 256, 48–59.
Mangin, A., 1984. Pour une meilleure connaissance des systèmes hydrologiques àpartir des analyses corrélatoire et spectrale. J. Hydrol. 67, 25–43.
METEO France, 2010. Rainfall data, 2009–2010, Besançon, France.Moussu, F., Oudin, L., Plagnes, V., Mangin, A., Bendjoudi, H., 2011. A multi-objective
calibration framework for rainfall–discharge models applied to karst systems. J.Hydrol. 400, 364–376.
Mudarra, M., Andreo, B., 2011. Relative importance of the saturated and theunsaturated zones in the hydrogeological functioning of karst aquifers: the caseof Alta Cadena (southern Spain). J. Hydrol. 397, 263–280.
Padilla, A., Pulido-Bosch, A., 1995. Study of hydrographs of karstic aquifers bymeans of correlation and cross spectral analysis. J. Hydrol. 168, 73–89.
Perrin, J., Jeannin, P.-Y., Zwahlen, F., 2003. Epikarst storage in a karst aquifer: aconceptual model based on isotopic data, Milandre test site, Switzerland. J.Hydrol. 279, 106–124.
Pinault, J.-L., Pauwels, H., Cann, C., 2001. Inverse modeling of the hydrological andthe hydrochemical behavior of hydrosystems: application to nitrate transportand denitrification. Water Resour. Res. 37 (8), 2179–2190.
Pronk, M., Goldscheider, N., Zopfi, J., 2006. Dynamics and interaction of organiccarbon, turbidity and bacteria in a karst aquifer system. Hydrogeol. J. 14, 473–484.
Pronk, M., Goldscheider, N., Zopfi, J., Zwahlen, F., 2009. Percolation and particletransport in the unsaturated zone of a karst aquifer. Ground Water 47 (3), 361–369.
Rimmer, A., Salingar, Y., 2006. Modelling precipitation-streamflow processes inkarst basin: the case of the Jordan river sources, Israel. J. Hydrol. 331, 524–542.
Savoy, L., 2007. Use of Natural and Artificial Reactive Tracers to Investigate theTransfer of Solutes in Karst Systems. PhD. Thesis, University of Neuchâtel,Switzerland, 194p.
Schnegg, P.-A., 2002. An inexpensive field fluorometer for hydrogeological tracertests with three tracers and turbidity measurement. XXXII IAH & ALHSUDCongress Groundwater and Human Development, Balkema, Mar del Plata,Argentina, pp. 1484–1488.
Schnegg, P.-A., 2003. A new field fluorometer for multi-tracer tests and turbiditymeasurement applied to hydrogeological problems. In: Proceedings of the EightInternational Congress of the Brazilian Geophysical Society, Rio de Janeiro.
Teutsch, G., Sauter, M., 1998. Distributed parameter modelling approaches in karst-hydrological investigations. Bull. d’Hydrogéologie 16, 99–109.
Thornthwaite, C.W., Mather, J.R., 1957. Instructions and tables for computingpotential evapotranspiration and the water balance. Publications ofClimatology, Laboratory of Climatology, Dresel Institute of Technology 10 (3),185–311.
Tritz, S., Guinot, V., Jourde, H., 2011. Modelling the behaviour of a karst systemcatchment using non-linear hysteretic conceptual model. J. Hydrol. 397, 250–262.
64 J.-B. Charlier et al. / Journal of Hydrology 460–461 (2012) 52–64

1
Groundwater conceptual model of large landslides: Contribution of time-related 1 environmental tracing combined with tracer tests (Sé chilienne, western Alps) 2
Vallet A.1* , Bertrand C.1, Mudry J.
1, Bogaard T.
2, Fabbri O.
1, Baudement C.
3, Ré gent B.
1 3
1. UMR6249 Chrono-Environnement - Université de Franche-Comté - 16 route de Gray - F-4
25030 Besanç on cedex - France 5
Email: [email protected] 6
2. Water Resources Section, Delft University of Technology, Stevinweg 1, 2628 CN, Delft, 7
The Netherlands 8
3. CEREGE (UMR7330), Aix-Marseille University, CNRS-IRD, Europô le Mé diterrané en de 9
l�Arbois - Avenue Louis Philibert - BP 80 - 13545 Aix-en-Provence cedex 04, France 10
* Corresponding author 11
Abstract 12
The increase of the groundwater level plays an important role in the activation or reactivation 13
of deep-seated landslides and so hydro-mechanical studies require a good knowledge of the 14
hydrogeological behaviour. Anisotropic and heterogeneous medium combined with landslide 15
deformation make classical hydrogeological investigations unsuitable. Hydrogeological 16
investigations recently focused on indirect hydrochemistry methods. Hydrochemistry surveys 17
performed on landslides vary between two extremes: (i) a limited number of field visits 18
allowing snapshot surveys of the hydrogeological conditions and, (ii) dedicated long-term 19
hydrogeological studies with monitoring of a wide range of parameters, including water-level. 20
This study aims at showing that an intermediate level of investigation allows to determine 21
accurately and efficiently a groundwater conceptual model. The proposed method combines 22
three complementary approaches: (i) a one-time multi-tracer test during a high flow period, 23
(ii) a seasonal monitoring of the water stable isotope content and of the water electrical 24
conductivity and (iii) a hydrochemical survey during low flow periods. A study of the 25
Sé chilienne landslide shows a dual-permeability property of the fractured rock aquifer inside 26
which fractures play a major role in the massif drainage. The study also shows the dual-27
permeability properties of the unstable zone with respect to the intact rock mass outside the 28
landslide. This heterogeneity drives to a dual hydrosystem, with a shallow perched aquifer 29
localized in the unstable zone and a deep aquifer in the whole massif hosting the landslide. 30
The landslide perched aquifer is temporary, mainly discontinuous and its extent and 31
connectivity fluctuate according to the seasonal recharge amount. 32
Keywords: conceptual models, tracer tests, stable isotopes, hydrochemistry, landslide 33
1. Introduction 34
If gravity is known as the main factor in landslide motion, water plays a prominent triggering 35
role. An increase of groundwater level plays an important role in the (re)activation of deep-36
seated slope movements (Van Asch et al. 1999; Iverson 2000; Rutqvist and Stephansson 37
2003) and many studies attempted to characterize the relationships between the water 38
infiltration and landslide destabilisation (Alfonsi 1997; Hong et al. 2005; Helmstetter and 39
Garambois 2010; Belle et al. 2013; Chanut et al. 2013) or to model hydro-mechanical 40
coupling (Cappa et al. 2004; Corominas et al. 2005; Guglielmi et al. 2005; Cappa et al. 2006; 41
Bonzanigo et al. 2007; Sun et al. 2009). However, to be accurate and to reflect field 42

2
conditions, such approaches must be based on a relevant and realistic groundwater conceptual 43
model. 44
In the Alps, most deep-seated landslides occur in crystalline bedrocks (Barla and Chiriotti 45
1995; Agliardi et al. 2001). Hydrogeology of fractured rocks is characterized by 46
heterogeneous, anisotropic and discontinuous properties (Maré chal 1998; Cappa et al. 2004; 47
Bogaard et al. 2007). In addition, vertical gradients of the hydraulic conductivity can occur 48
with values ranging from 10-11
to 10-5
m/s towards the decompressed surface areas (Maré chal 49
and Etcheverry 2003). These permeability contrasts may be sufficient to support perched 50
aquifers (Vengeon 1998; Tullen 2002; Cappa et al. 2004; Binet 2006). Heterogeneous, 51
anisotropic and discontinuous properties are accentuated by the landslide deformation and by 52
presence of weathering product (colluvium, clay) filling the open fractures. Consequently, 53
hydrogeological data are highly dependent on the scale of observation (Clauser 1992) and 54
local measurements are rarely representative of the overall behaviour of the landslide aquifer. 55
Most deep-seated landslides have a well-developed destabilization monitoring network with 56
numerous stations and various technologies involved (extensometer, radar, LIDAR, 57
geodesy� ). Hydrogeological studies of landslides are however difficult to carry out because 58
of the scarcity of natural or artificial access points to the aquifer triggering the movement. 59
Direct and local measures of the groundwater levels are not representative of the whole 60
moving rockmass and piezometers have short lifespans. Classical methods of hydrogeological 61
investigation are not appropriate and recent studies focus on indirect methods such as 62
hydrochemistry surveys by monitoring springs for artificial and natural tracers (Guglielmi et 63
al. 2002; Cappa et al. 2004; Binet et al. 2007a; Bogaard et al. 2007; Charlier et al. 2010; Cervi 64
et al. 2012; Debieche et al. 2012; Lin and Tsai 2012). Hydrochemistry surveys enable a 65
spatial integration of the groundwater processes and thus provide general information at the 66
scale of the studied system (Guglielmi et al. 2002; Bogaard et al. 2007). However, indirect 67
information of landslide groundwater provided by spring monitoring is often difficult to 68
obtain. Indeed, most deep-seated near-surface unstable zones are highly unstructured, 69
favouring infiltration and enabling the formation of a perched aquifer (Binet et al. 2007a). 70
Few springs are located in the unstable zone and hydrogeological investigations have to be 71
focused on springs surrounding the landslide. Groundwater commonly flows through the 72
scree cone at the landslide foot toward an alluvial aquifer at the valley bottom. Generally, 73
hydrochemical studies of landslides are limited to major element (Binet et al. 2007a). 74
However, additional parameters can be included in hydrogeological studies to identify and 75
quantify specific processes (recharge area, transit times, balance calculation, water-rock 76
interaction) such as isotope of hydrogen and oxygen contents (Guglielmi et al. 2002), trace 77
elements (Cervi et al. 2012), and the natural fluorescence (Charlier et al. 2010). 78
Because hydrochemistry surveys are time-consuming, expensive and require specific 79
expertise, many landslide studies are based on a few field visits, in order to have a snapshot 80
survey of the hydrogeological conditions. On the contrary, a dedicated hydrogeological study 81
monitors a wide range of parameters, including water-level, on the long term, enabling 82
extensive analysis (Cervi et al. 2012). This study aims at showing that an intermediate level of 83
investigation allows to accurately and efficiently determine or to refine a groundwater model. 84
The proposed method combines three complementary approaches: (1) a one-time multi-tracer 85
test survey during a high flow period, (2) a seasonal monitoring of the water stable isotope 86
content and the water electrical conductivity, and (3) a hydrochemical survey during a low 87
flow periods, to determine: (i) flow path and residence time of the groundwater, (ii) average 88
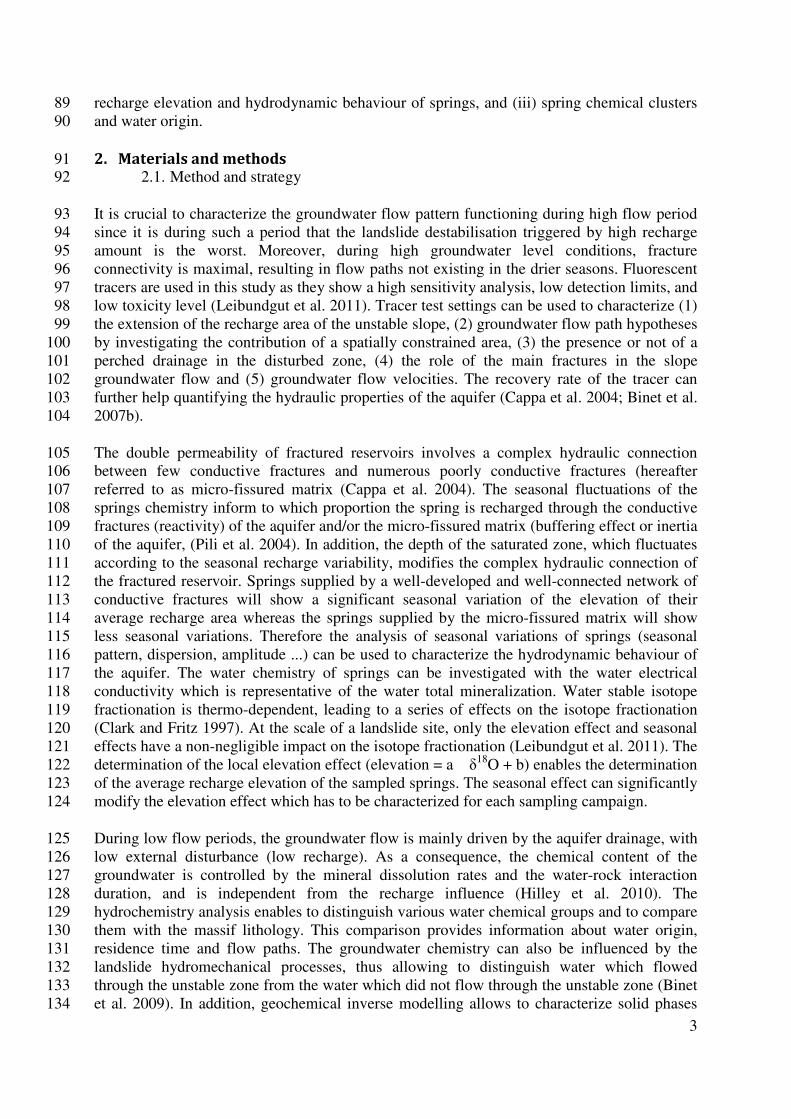
3
recharge elevation and hydrodynamic behaviour of springs, and (iii) spring chemical clusters 89
and water origin. 90
2. Materials and methods 91 2.1. Method and strategy 92
It is crucial to characterize the groundwater flow pattern functioning during high flow period 93
since it is during such a period that the landslide destabilisation triggered by high recharge 94
amount is the worst. Moreover, during high groundwater level conditions, fracture 95
connectivity is maximal, resulting in flow paths not existing in the drier seasons. Fluorescent 96
tracers are used in this study as they show a high sensitivity analysis, low detection limits, and 97
low toxicity level (Leibundgut et al. 2011). Tracer test settings can be used to characterize (1) 98
the extension of the recharge area of the unstable slope, (2) groundwater flow path hypotheses 99
by investigating the contribution of a spatially constrained area, (3) the presence or not of a 100
perched drainage in the disturbed zone, (4) the role of the main fractures in the slope 101
groundwater flow and (5) groundwater flow velocities. The recovery rate of the tracer can 102
further help quantifying the hydraulic properties of the aquifer (Cappa et al. 2004; Binet et al. 103
2007b). 104
The double permeability of fractured reservoirs involves a complex hydraulic connection 105
between few conductive fractures and numerous poorly conductive fractures (hereafter 106
referred to as micro-fissured matrix (Cappa et al. 2004). The seasonal fluctuations of the 107
springs chemistry inform to which proportion the spring is recharged through the conductive 108
fractures (reactivity) of the aquifer and/or the micro-fissured matrix (buffering effect or inertia 109
of the aquifer, (Pili et al. 2004). In addition, the depth of the saturated zone, which fluctuates 110
according to the seasonal recharge variability, modifies the complex hydraulic connection of 111
the fractured reservoir. Springs supplied by a well-developed and well-connected network of 112
conductive fractures will show a significant seasonal variation of the elevation of their 113
average recharge area whereas the springs supplied by the micro-fissured matrix will show 114
less seasonal variations. Therefore the analysis of seasonal variations of springs (seasonal 115
pattern, dispersion, amplitude ...) can be used to characterize the hydrodynamic behaviour of 116
the aquifer. The water chemistry of springs can be investigated with the water electrical 117
conductivity which is representative of the water total mineralization. Water stable isotope 118
fractionation is thermo-dependent, leading to a series of effects on the isotope fractionation 119
(Clark and Fritz 1997). At the scale of a landslide site, only the elevation effect and seasonal 120
effects have a non-negligible impact on the isotope fractionation (Leibundgut et al. 2011). The 121
determination of the local elevation effect (elevation = a * δ18
O + b) enables the determination 122
of the average recharge elevation of the sampled springs. The seasonal effect can significantly 123
modify the elevation effect which has to be characterized for each sampling campaign. 124
During low flow periods, the groundwater flow is mainly driven by the aquifer drainage, with 125
low external disturbance (low recharge). As a consequence, the chemical content of the 126
groundwater is controlled by the mineral dissolution rates and the water-rock interaction 127
duration, and is independent from the recharge influence (Hilley et al. 2010). The 128
hydrochemistry analysis enables to distinguish various water chemical groups and to compare 129
them with the massif lithology. This comparison provides information about water origin, 130
residence time and flow paths. The groundwater chemistry can also be influenced by the 131
landslide hydromechanical processes, thus allowing to distinguish water which flowed 132
through the unstable zone from the water which did not flow through the unstable zone (Binet 133
et al. 2009). In addition, geochemical inverse modelling allows to characterize solid phases 134
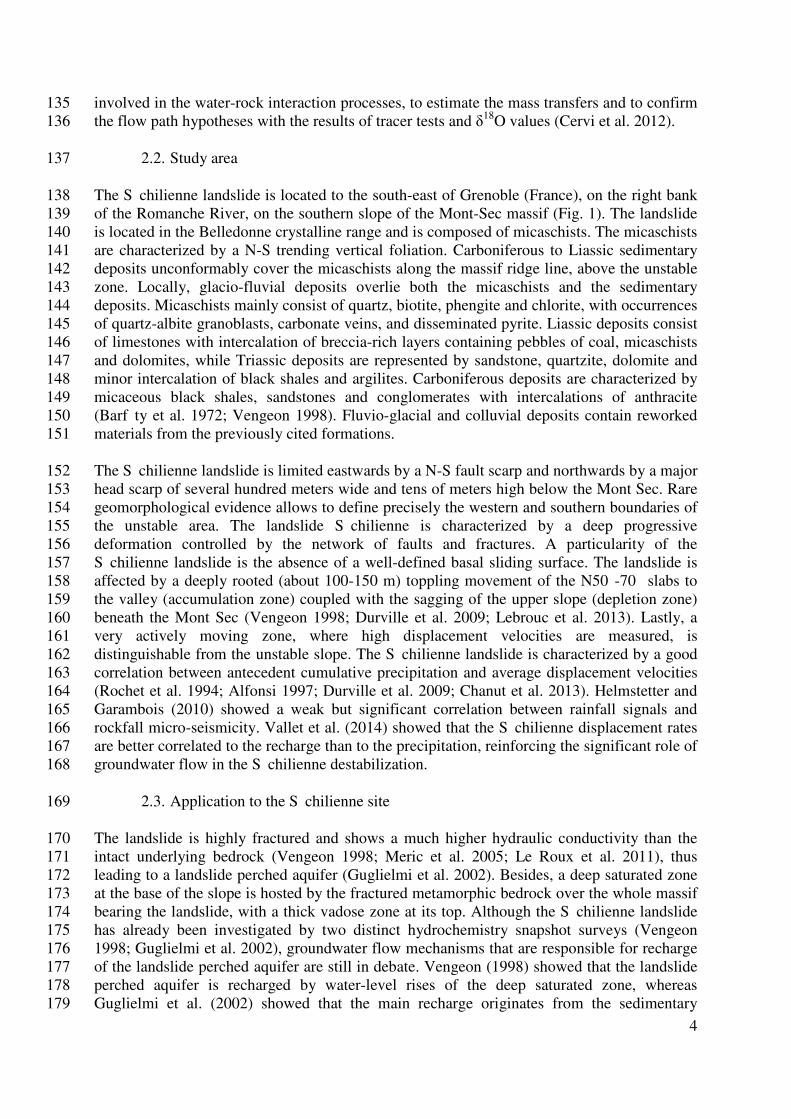
4
involved in the water-rock interaction processes, to estimate the mass transfers and to confirm 135
the flow path hypotheses with the results of tracer tests and δ18
O values (Cervi et al. 2012). 136
2.2. Study area 137
The Sé chilienne landslide is located to the south-east of Grenoble (France), on the right bank 138
of the Romanche River, on the southern slope of the Mont-Sec massif (Fig. 1). The landslide 139
is located in the Belledonne crystalline range and is composed of micaschists. The micaschists 140
are characterized by a N-S trending vertical foliation. Carboniferous to Liassic sedimentary 141
deposits unconformably cover the micaschists along the massif ridge line, above the unstable 142
zone. Locally, glacio-fluvial deposits overlie both the micaschists and the sedimentary 143
deposits. Micaschists mainly consist of quartz, biotite, phengite and chlorite, with occurrences 144
of quartz-albite granoblasts, carbonate veins, and disseminated pyrite. Liassic deposits consist 145
of limestones with intercalation of breccia-rich layers containing pebbles of coal, micaschists 146
and dolomites, while Triassic deposits are represented by sandstone, quartzite, dolomite and 147
minor intercalation of black shales and argilites. Carboniferous deposits are characterized by 148
micaceous black shales, sandstones and conglomerates with intercalations of anthracite 149
(Barfé ty et al. 1972; Vengeon 1998). Fluvio-glacial and colluvial deposits contain reworked 150
materials from the previously cited formations. 151
The Sé chilienne landslide is limited eastwards by a N-S fault scarp and northwards by a major 152
head scarp of several hundred meters wide and tens of meters high below the Mont Sec. Rare 153
geomorphological evidence allows to define precisely the western and southern boundaries of 154
the unstable area. The landslide Sé chilienne is characterized by a deep progressive 155
deformation controlled by the network of faults and fractures. A particularity of the 156
Sé chilienne landslide is the absence of a well-defined basal sliding surface. The landslide is 157
affected by a deeply rooted (about 100-150 m) toppling movement of the N50° -70° slabs to 158
the valley (accumulation zone) coupled with the sagging of the upper slope (depletion zone) 159
beneath the Mont Sec (Vengeon 1998; Durville et al. 2009; Lebrouc et al. 2013). Lastly, a 160
very actively moving zone, where high displacement velocities are measured, is 161
distinguishable from the unstable slope. The Sé chilienne landslide is characterized by a good 162
correlation between antecedent cumulative precipitation and average displacement velocities 163
(Rochet et al. 1994; Alfonsi 1997; Durville et al. 2009; Chanut et al. 2013). Helmstetter and 164
Garambois (2010) showed a weak but significant correlation between rainfall signals and 165
rockfall micro-seismicity. Vallet et al. (2014) showed that the Sé chilienne displacement rates 166
are better correlated to the recharge than to the precipitation, reinforcing the significant role of 167
groundwater flow in the Sé chilienne destabilization. 168
2.3. Application to the Sé chilienne site 169
The landslide is highly fractured and shows a much higher hydraulic conductivity than the 170
intact underlying bedrock (Vengeon 1998; Meric et al. 2005; Le Roux et al. 2011), thus 171
leading to a landslide perched aquifer (Guglielmi et al. 2002). Besides, a deep saturated zone 172
at the base of the slope is hosted by the fractured metamorphic bedrock over the whole massif 173
bearing the landslide, with a thick vadose zone at its top. Although the Sé chilienne landslide 174
has already been investigated by two distinct hydrochemistry snapshot surveys (Vengeon 175
1998; Guglielmi et al. 2002), groundwater flow mechanisms that are responsible for recharge 176
of the landslide perched aquifer are still in debate. Vengeon (1998) showed that the landslide 177
perched aquifer is recharged by water-level rises of the deep saturated zone, whereas 178
Guglielmi et al. (2002) showed that the main recharge originates from the sedimentary 179

5
perched aquifer. Conclusions are mainly based on rough water-balance estimation, geological 180
observations and limited hydrogeology data. Indeed, the Sé chilienne site presents a spatially 181
sparse hydrogeological network. First, no springs are located in the unstable zone. Second, 182
surrounding springs of the massif are subject to high anthropic pressure (water diversion) 183
which makes springs flow measurements impossible and so hinders the analyses. 184
The monitoring network implemented in this study is described in Fig. 1 and Appendix 1. 185
Water sample analyses are described in Appendix 2. Tracer test surveys were performed two 186
campaigns during April 2001 and March 2002. The March 2002 survey was coupled with a 187
hydrochemical survey of the water inflows in the EDF gallery (Appendix 1). Seasonal 188
analysis and hydrochemical surveys spread from September 2010 to September 2012. They 189
include (1) four isotopic campaigns (26 spots) performed quarterly coupled with 12 water 190
electrical conductivity (EC) surveys, (2) 5 hydrochemistry surveys (21 spots) performed in 191
low flow periods, from early June to late September. Hydrochemical data of the G585 gallery 192
(Vengeon 1998), were also integrated in this study. Lastly, water inflows and fracture data 193
observed in the five galleries and their 3D spatialization were compiled in order to 194
approximate the depth to the water level within the unstable slope gallery (Vengeon 1998). 195
The seasonal variations of the recharge area (and also of EC) are estimated for each spring by 196
estimating the standard deviation (SD) based on the seasonal campaigns. An average 197
elevation of the recharge area for each spring is also estimated. 198
2.3.1. Tracer test injection points 199
A 4-tracer test survey was implemented in April 2001 in the Sé chilienne unstable slope 200
recharge area. Four different fluorescent tracers were injected at four strategic locations (Fig. 201
1 and Table 1). A sinkhole (I4) located along the Sabot fault (Fig. 1) was selected as a 202
representative infiltration location of the top sedimentary cover to evaluate the extent of the 203
recharge area. A crack located in the depletion zone (I2) was chosen to represent the 204
infiltration on the summital landslide area. A depression zone (I1) located in the accumulation 205
zone near the mine gallery G900 was chosen to test the hydraulic conductivity of the N70 206
near-vertical fractures. A sink in the mine gallery G585 (I3) was chosen as an injection spot to 207
test the infiltration on the N-S fault zone bordering the rapidly moving landslide zone. Since 208
the EDF gallery was flooded at the time of the survey, a detailed monitoring of the water 209
inflow points was not possible. A second tracer test was performed in March 2002 when the 210
gallery was emptied for maintenance. Due to the impossibility to measure the flow of springs, 211
only the shortest transit times were deduced from the tracer test survey. 212
2.3.2. Estimation of the elevation of the spring recharge area from δ18
O 213
measurements 214
In mountainous areas, a local calibration of the isotopic gradient is generally possible, using 215
springs with well defined recharge areas. In the case of the Sé chilienne landslide, no such 216
springs allow to estimate the isotope elevation gradient. Instead, five rainfall collectors were 217
settled to characterize the δ18
O signal (Fig. 1, appendix 1). The infiltration isotopic signals can 218
be modified from the precipitation initial signal through the soil layers by evaporation 219
processes, leading to a δ18
O enrichment (Gat 1996). Two rainfall collectors were therefore 220
coupled with a lysimeter in order to evaluate the evaporation impact on the actual δ18
O 221
infiltration signal. 222
6
Because the hydrodynamic properties of the aquifers can delay and buffer the infiltration 223
signal, the water which comes out of springs does not generally correspond to the last rainfall 224
period. Therefore, a δ18
O synchronic instantaneous water sampling for both springs and 225
rainfall collectors would not be relevant. To take into account the transit through the aquifer, 226
the spring water δ18
O signal will be compared with the δ18
O signal of a cumulated amount of 227
precipitation which fell during the period between two consecutive spring sampling 228
campaigns (about three months). Thus, the isotopic signal of the rain collectors corresponds to 229
the precipitation δ18
O signal weighted by the three-month rainfall amount. The isotope 230
elevation gradient of precipitation is determined with the δ18
O data of the five rain collectors. 231
The isotope elevation gradient of infiltration will be considered identical to the slope of the 232
isotope elevation gradient of precipitation and only the intercept is adjusted to fit to the 233
lysimeter δ18
O measurements, assuming that evaporation is homogeneous (Fig. 2a). The 234
elevation of the spring recharge area is estimated from the infiltra tion isotope gradients for the 235
April-June and July-September sampling campaigns, for which actual evaporation is 236
significant, and from the precipita tion isotope gradient for the October-December and 237
January-March sampling campaigns. 238
In order to locate the recharge area of the springs, the steepest slope line is drawn for each 239
spring, up to the ridge line, based on a digital elevation model of a 25 meters resolution (Fig. 240
2b). This allows to define a ridge line point associated to each spring. If the δ18
O elevation of 241
a spring recharge area falls within or close to the spring elevation-associated ridge line point 242
elevation interval (materialized by the steepest slope straight line, Fig. 2b), then the recharge 243
area will be considered as local. In this case, the groundwater flow is thought to follow the 244
topographical gradient without any influence or disturbance linked to geological features such 245
as fractures or faults. Otherwise, the δ18
O elevation of the spring recharge area will be placed 246
along the ridge line, at the corresponding elevation, and the recharge area of the springs will 247
be considered as remote. In this case, the groundwater flow is thought to be controlled by 248
geological features. An average elevation of the recharge area for each spring is estimated 249
from the elevation values of the four water sampling campaigns. The difference between this 250
average elevation and the elevation of the associated ridge line point, expressed in function of 251
the percentage, will allow to discriminate groups of springs. 252
2.3.3. Hydrochemistry analysis 253
Groundwater chemistry is discussed using major ion concentrations. The nature and origin of 254
the various springs is established by using a Durov diagram, which allows characterizing the 255
relationships between the chemical type (function of encountered rock types) and the 256
electrical conductivity (degree of mineralization). Hydrochemistry is complex as the alteration 257
of each of the three distinct rocks (moraines, carbonates and micaschists) produces the same 258
ions (Table 2). Major ion combinations are used to characterize the water origin and the flow 259
paths: Ca v s. HCO3 for the sedimentary cover and Na v s. Cl to distinguish a precipitation 260
origin from alteration of the micaschist (albite). In addition, the water content variations for 261
each identified hydrochemical facies are investigated with Stiff diagrams. The hydrochemical 262
facies deduced from the previous analyses are then spatially compared with the distribution of 263
the geological formations. A geochemical inverse model is performed on the spring chemical 264
contents and rock mineral phases, using PHREEQC code (version 3.1.1). The initial water 265
chemistry (Table 3) matches with the average composition of Alpine rain water (Atteia 1994). 266
Minerals representative of the sedimentary cover and micaschist bedrock (Table 3) were 267
chosen based on the work of Vengeon (1998). 268
7
3. Results and discussion 269 3.1. High flow periods: Tracer test survey 270
Among the I4 test (Fig. 3a), the G1 water inflow displays the highest tracer velocity (3 271
km/day). Besides, numerous springs (S13, S16, S20 and S21) located along the N20 Sabot 272
fault are positive, with velocities ranging from 0.45 to 0.84 km/day. The same is observed for 273
the outlet S7 of the EDF gallery (0.88 km/day). The velocity contrast between G1 and the 274
other positive springs indicates that the drainage by the unstable slope bypasses the N20 faults 275
and is supported by near-surface drainage between the sedimentary cover and the unstable 276
slope perched aquifers. This test also demonstrates the prominent role of the Sabot fault and 277
the EDF gallery in the drainage of the slope. For the I2 test, only G1 and S13 were positive 278
(Fig. 3b). A high velocity difference can be observed between the down-slope flow, 7-fold 279
faster than the lateral flow towards the N20 fault (0.55 v s. 0.08 km/day). This difference can 280
be attributed to the dense opened fractures network and to the highest hydraulic gradient 281
alongside the steepest slope. This test demonstrates the significant drainage role of the 282
unstable slope and also the role of the N20 Sabot fault. The I1 test highlights a main westward 283
drainage component, except for S16 and G5 springs (Fig. 3c). In this part of the unstable 284
zone, the groundwater flow is very likely supported by the dense network of N70 fractures 285
and by the EDF gallery. On the contrary, the southeast drainage seems to be supported the 286
Sabot fault. The average velocities range between 0.06 and 0.16 km/day. The first test in the 287
gallery 585 (I3- A test, Fig. 3d) was detected at the EDF gallery outlet (S7), confirming the 288
drainage role of the EDF gallery. Except the S16 spring (0.14 km/day), high velocities (0.49 289
to 2.36 km/day) are observed for the western springs. The second G585 test (I3-B test, Fig. 290
3e) is positive at four kilometric points: 5.28 and 5.50 to the east, demonstrating the influence 291
of the N20 Sabot fault, and 6.32 and 6.40 to the west, confirming the role of the EDF gallery 292
in the collection of a part of the water flowing from the N70 fractures. 293
A comparative analysis of the four tracer tests allows a better characterization of groundwater 294
flow in the massif. The same velocity range, about 0.13 and 2.3 km/day, is observed for the 295
eastern springs and for the EDF gallery outlet (S7) for both the I1 and I3-A tests, respectively, 296
suggesting that the eastern springs are partly recharged by water from the EDF gallery. S7 297
showed high velocities (2.3 km/day) during I3-A test (Fig. 3d) and the EDF gallery water 298
inflows show low velocities (0.4 km/day) during I3-B test, but breakthrough times are similar 299
(about one day). This velocity contrast can be explained by the quasi-instantaneous transit 300
through the EDF gallery which overestimates groundwater velocities to the EDF gallery. S7 301
flow velocity for I1 and I3-A tests can be estimated at 0.06 and 0.4 km/day respectively 302
instead of 0.13 and 2.33 km/day, like for the eastern springs. The I2 test show a high velocity 303
toward G1 (0.55 km/day) as well as the I1 test toward G5 (0.2 km/day). These high velocities 304
reveal a high hydraulic connectivity of the unstable zone promoted by a dense fracture 305
network. The Romanche River (S8) is positive for two tracer tests (I1 and I3-A) meaning that 306
the EDF gallery collects only a part of the slope groundwater, the remaining reaching the river 307
through the alluvium aquifer. Among the three tracer tests (I2, I1, I3-A), a rather 308
homogeneous velocity (0.07 to 0.14 km/day) is observed for S16 and S13. These slow flows, 309
compared to the one observed during the I4 test, demonstrate flow through micro-fissured 310
matrix drained toward the east by N20 faults. 311
3.2. Seasonal analysis 312
The isotopic abundance ratio of a water sample is expressed as δ18
O in � v s. V-SMOW. The 313
determination of the isotopic elevation gradients for the four seasons show significant 314

8
seasonal variations (with values of -0.12� /100m for November-December , -0.25� /100m 315
for January-March, -0.21� /100m for April-June and -0.18� /100m for July-September, Fig. 316
4). These values confirm the seasonal effect on the isotope fractionation and are in accordance 317
with commonly observed values from -0.1� /100m to -0.36� /100m (Leibundgut et al. 2011). 318
S25, S24, S13, S18, S5, S9, S11 and G1 show either unrealistic values (disregarded) or lack 319
of data. 320
The elevation of the recharge area of the S5 and S4 springs are similar and are about 1800 m 321
above the highest massif peak (Peak Oeilly) and below the Romanche river (Fig. 5a), but a 322
distinct seasonal variability (SD of 32 for S5 and 315 m for S4). In addition, is also observed 323
these springs show low values and a low variability of EC (340 µS/cm with SD of 14 µS/cm; 324
Fig. 5c). These two springs seem to be influenced by both the massif slope groundwater and 325
the Romanche water. The Romanche water smoothes the amplitude and the variations of the 326
EC and increases the elevation of the recharge area and its seasonal variability (high 327
sensitivity of drainage surface network from seasonal variations). S4 can not be recharged by 328
the Romanche alluvium aquifer, thus indicating that the open EDF gallery, which withdraws 329
water from the Romanche River, recharges the slope aquifer at its western part. S25 and S24 330
springs show a behaviour similar to that S4 with low values and a low variability of EC (370 331
and 200 µS/cm with SD of 5 µS/cm). The S25 and S24 hydrodynamic behaviours of S25 and 332
S24 are probably due to the recharge of the slope aquifer by the Rif Bruyant stream. The 333
dilution by Rif Bruyant (1010 m asl) certainly caused an underestimation elevation of the 334
recharge area of the slope aquifer water recharging the springs. Therefore the elevation of the 335
recharge area is assumed to be near the Peak Oeilly from which groundwater is drained by the 336
main Sé chilienne fault (Fig. 5d) 337
S21, S15, S14, S20, and S13 springs show mean elevations higher than the elevation of their 338
associated ridge line points (16 % higher on average, Fig. 5b). These springs further show 339
high seasonal variabilities (SD of 100 m and 22 µS/cm on average) with the lowest EC values 340
and recharge areas elevations observed during the high flow period and the reverse for the low 341
flow periods (Fig. 5a and Fig. 5c). These springs are supplied by rapid water flow through 342
fissures during high flow periods (dilution) and drainage through the micro-fissured matrix 343
during low flow periods mobilizing remote recharge area. On the contrary, S9, S10, and S11 344
springs show mean recharge area elevation close to their associated ridge line points (at most 345
4 % higher) with low seasonal variations. These springs show moderate EC variability (SD: 346
15 µS/cm) with no clear seasonal patterns. These results show that their recharge areas are 347
mainly local and little sensitive to the seasonal variations (Fig. 5a, Fig. 5b and Fig. 5c), 348
meaning that the springs flow is controlled by the micro-fissured matrix component. S18 349
spring presents an intermediate hydrodynamic behaviour between the two previous by defined 350
groups. 351
Spring G1 was only sampled twice and it is not possible to assess clearly the seasonal 352
variations. However, the recharge area seems mainly local as the two high flow period 353
surveys show a mean recharge area (1143 m asl) closed to the elevation of the associated 354
ridge line point. G1 shows the highest EC values (840 µS/cm) and the highest EC seasonal 355
variability (SD: 63 µS/cm). These results are interpreted as enhanced water-rock interaction 356
between groundwater and the unstable slope rocks (section 3.3.2, Binet et al. 2009). Spring 357
S12 has a very low conductivity (155 µS/cm), probably due to low water-rock interaction 358
time. It also shows a scattered δ18
O signal. One possible explanation is that this spring is 359
recharged by rapid water flow through sedimentary cover. 360

9
3.3. Low flow periods: hydrochemistry survey 361
The chemical composition of the monitored springs is detailed in Table 4. The Durov diagram 362
(Fig. 6a and Fig. 6b) highlights four distinct water chemical groups reflecting groundwater 363
flow through various geological media. Group 1 corresponds to Ca-HCO3-rich waters (S12) 364
with low EC values (about 100 µS/cm). Group 2 corresponds to Mg-Ca-HCO3-rich waters 365
(S24, S25, S11, S10 and S9) where Ca and Mg are in the same proportions and EC are from 366
200 µS/cm (S24) to 540 µS/cm (S9). Water composition of group 3 varies from Mg-Ca-367
HCO3-SO4-rich waters (G4 and G3), with intermediate Mg-Ca-SO4-HCO3-rich water (G5 and 368
G1), to Mg-Ca-SO4-rich waters (G2). The EC values vary from 300 µS/cm (G4 and G3) to 369
850 µ S/cm (G1). Group 4 corresponds to Ca-Mg-HCO3-SO4-rich waters (S4, S14, S15, S18, 370
S21, S20 and S13) with EC values varying from 350 µ S/cm (S4 and S14) to 520 µ S/cm (S21, 371
S20 and S13). In this study, the inverse model is tested for four springs: S11, S10, S9 372
representative of the stable zone and G1 representative of the unstable zone. 373
3.3.1. Stable zone (Group 1 and 2) 374
The low concentrations of Ca and HCO3 of Group 1, located on the calcite equilibrium line, is 375
representative of water circulating in a carbonate or calcite dominant cover (limestone or 376
moraines) with a short residence time (Fig. 6c). For Group 2 (S24, S25, S11, S10, S9), inverse 377
modelling shows that the Mg concentrations come from 89 % of dolomite and 11 % of 378
phlogopite. 86 % of the Ca is derived from the dolomite and the remaining 14 % from the 379
calcite. Therefore, the high Mg concentrations are explained by water transit through the 380
carbonate materials. However, these spring compositions are above the dolomite equilibrium 381
line (Fig. 6c). This can be explained by the alteration of pyrite which releases protons (Eqn 1) 382
which can consume afterwards the HCO3 produced by dissolution of carbonate minerals (Eqn 383
2), releasing CO2 and H2O (Eqn 3). The δS34
analyzes performed by Vengeon (1998) show 384
that SO4 has a sulfurized origin, due to alteration of pyrite, present only in the micaschist 385
bedrock. 386
���� +��
�∗ � +
�
�∗ �� ↔ ��(�)� + 2��
�� + 4�� ( 1 ) 387
(��,��)(��)� + 2�� + 2�� ↔���� +���� + 4���� ( 2 ) 388
���� +�� ↔ �� + �� ( 3 ) 389
This succession of chemical reactions explains the range of pH (between 7 and 8) measured in 390
the Sé chilienne waters, despite the production of protons (Table 4), and results in a depletion 391
of HCO3 ions with respect to Ca and Mg, the latter being balanced by SO4. The springs of 392
Group 2 are therefore recharged by water which circulated through carbonates and basement 393
formations. The low conductivity of S24 and S25 are explained by the influence of the Rif 394
Bruyant stream, highlighted by the seasonal analysis (see section 3.2). 395
3.3.2. Unstable zone (Group 3) 396
Group 3 (G5, G4, G3, G2, G1) is characterized by the highest SO4 concentrations (Fig. 6 and 397
Table 4) which can be explained by two mechanisms related to the slope deformation. First, 398
the opening and/or closing of fractures and cracks lead to a new flowpath through unaltered 399
pyrite zones (Calmels et al. 2007) and, second, the friction and grinding along fractures due to 400
10
the movement of rock masses cause a refreshment of pyrite reactive surfaces increasing the 401
weathering rate (Binet et al. 2009). Lastly, the alteration of the pyrite promotes the alteration 402
of carbonate and minerals in silicate veins or in colluvial deposits (Gaillardet et al. 1999; 403
Dongarrà et al. 2009), as shown by the high Ca concentrations in G1 (Fig. 6c), and Na in the 404
G710 gallery (Fig. 6d). The acquisition of mineralization occurs mainly with the interaction of 405
the basement minerals and SO4 is clearly the marker of the unstable zone. The difference of 406
the mineralization among the various gallery points is due to heterogeneities in mineral 407
distribution within the basement and fracture network of the unstable zone. The inverse model 408
calculation shows two solutions of mineral assemblage which can explain the Mg content of 409
G1. Mg contents is either explained by water-rock interactions mainly in the basement with a 410
Mg origin of 37 % from dolomite and 63 % from chlorite or explained by water-rock 411
interactions in carbonate materials with a Mg origin of 91 % from dolomite and 9 % from 412
phlogopite. The last scenario can be explained either by major tension cracks filled with 413
colluvial deposits rich in limestone fragments or by water flowing from the sedimentary cover 414
as suggested by the I4 tracer test (Fig. 3a). 415
3.3.3. Mixing zone (Group 4) 416
The group 4 (S4, S14, S15, S18, S21, S20 and S13) is distinguishable from other springs by 417
concentrations of Ca, Na and SO4. The Ca concentrations fall near the calcite equilibrium line 418
(Fig. 6c), reflecting a significant transit in carbonate materials. The SO4 concentrations which 419
are up to 25 % higher than the springs of the stable zone (group 2) can be explained by 420
groundwater flow through the stable bedrock. A mixing test was performed with water of 421
carbonate pole (S12) and with water of the unstable zone (G1) to quantify the contribution of 422
each component. The water composition of group 3 is explained by a water mixing 30 % of 423
the unstable zone water and 70 % of the sedimentary cover water, which is consistent with 424
tracer tests (Fig. 3). However, the mixing computation requires four times more mineralized 425
water than S12 water, meaning that the carbonate component of the mixture has a longer 426
residence time in the sedimentary cover. Lastly, S4 water is also a water mixture from the 427
Romanche river water, the stable zone water and the unstable zone through drainage of the 428
EDF gallery. 429
3.4. Gallery water inflows survey 430
Five galleries and one piezometer (P1) were surveyed (Fig. 7a). The highest gallery (G900) is 431
always dry and no water inflows could be identified. The G710 gallery shows two leakages, 432
one quasi-permanent almost dry in summer (G1), at 150 m from the entrance and one 433
temporary (G2) at 80 m from the entrance. Two leakage zones were also identified for the 434
G670 gallery at 25 m and 70 m from the entrance. G585 gallery shows a temporary (202 m, 435
G3) water inflow and a permanent (160 m, G5) water inflow, and a localized leakage area 436
(170 m, G4). Gallery water inflows are localized near fracture damaged zones (Vengeon 437
1998), reinforcing the prominent role of fracture network in the groundwater flow path 438
bypassing the less pervious matrix. Although the piezometer P1 is currently clogged, the 439
water level fluctuations were recorded between 590 and 602 m asl from November 2009 to 440
April 2010. These water-levels are considered as representative of high groundwater 441
conditions (Fig. 7c). 442
The EDF gallery has the particularity to show bare rock with limited cemented sections 443
(revealing high fractured zones) with water flowing unconfined by gravity from an upriver 444
Romanche withdrawing point. During the excavation of the EDF gallery, perennial springs 445

11
located at Les Rivoirands and Chamoussiè re villages were permanently dried up (Fig. 7a). 446
Numerous and scattered water inflows and leakages occur in the EDF gallery between 5.5 km 447
and 7 km, matching with the dense fractures network of the landslide (Fig. 7a). Between 3.9 448
km and 4.5 km, the Sé chilienne fault completely damaged the zone and many water inflows 449
occur, revealing the prominent drainage role of the fault. To a lesser extent, the Sabot fault 450
seems to have a more localized impact on the EDF gallery water inflows. The hydrochemistry 451
survey shows that SO4 is the marker of the unstable slope (see section 3.3.2). From kilometric 452
points 4 to 5.80, SO4 signal is similar to S9 representative of the stable zone, whereas from 453
kilometric points 6 to 7, the SO4 signal increases and even exceeds the concentration of G1 454
representative of the unstable zone (Fig. 7. The SO4 signal confirms the prominent drainage 455
role of the unstable slope by the EDF gallery. 456
3.5. Groundwater conceptual model 457
3.5.1. Stable zone: Fractures vs. micro-fissured matrix 458
Two main groundwater flow types are identified: rapid and reactive water flow in fractures 459
(S4, S13, S14, S15, S20, S21, S24 and S25) which bypass the bulk of the less pervious and 460
inertial micro-fissured matrix on which S9, S10 and S11 depend (seasonal analysis, Fig. 5). 461
These groundwater flows are characteristic of the double permeability of fractured reservoirs 462
(Maré chal 1998; Cappa et al. 2004). The main N20 Sabot fault plays a major role in the 463
massif drainage, with a rapid transfer from the sedimentary cover, but this fault also drains the 464
unstable zone with much lower velocities (tracer test and seasonal analysis, Fig. 3 and Fig. 5). 465
This is confirmed by the hydrochemistry survey which show that the springs located along the 466
Sabot fault match with a mixing of water which flowed through the sedimentary cover and the 467
unstable slope (Fig. 6, group 4). Therefore, the Sabot fault has a significant spatial influence, 468
draining out the deep aquifer below the unstable slope, likely because of a lowering of 469
groundwater level which causes a west to east hydraulic gradient (tracer test, Fig. 3). Flow 470
velocities (tracer test, Fig. 3), water mixing (hydrochemistry, Fig. 6) and the lack of fractures 471
indicate that the unstable slope drainage is done mainly through the micro-fissured matrix and 472
is minor relatively to the Sabot fault drainage axis (Fig. 8a). The Sé chilienne fault also acts as 473
a major drainage axis and even promotes the water infiltration from Rif Bruyant stream 474
(seasonal analysis, Fig. 5d). Outside of the major fault or fracture zones, the groundwater 475
behaviour is more inertial, being characterized by a longer residence time. This is testified by 476
the hydrodynamical behaviour of the springs of the northern slope of the Mont Sec massif. 477
S18 shows probably an intermediate recharge mechanism, partly by the fractured network and 478
partly by the micro-fissured matrix. Lastly, this study does not bring the any evidence about 479
the perched aquifer identified in the sedimentary cover (Vengeon 1998; Guglielmi et al. 480
2002). 481
3.5.2. Unstable zone: Landslide perched aquifer 482
During the low flow period, the water-level of the piezometer PI drops below 590 m asl and 483
therefore below the boundary of the unstable zone and the no saturated zone has been 484
observed in the galleries (gallery survey, Fig. 7). On the contrary, during almost all the high 485
flow periods, the water-level of P1 (about 600 m asl) suggests a satured zone at the base of the 486
unstable zone below the G710 gallery. Moreover, during high flow periods, a shallow 487
continuous drainage (tracer tests, Fig. 3) occurs through the landslide, draining water from the 488
sedimentary cover (I4 tracer test, Fig. 3a). This recharge mechanism involves a hydraulic 489
connection of the unstable zone with the sedimentary perched aquifer which bypasses the 490
deep aquifer (Fig. 8). This indicates that, in high flow periods, the recharge area is much 491

12
larger than the landslide surface (Guglielmi et al. 2002; Cappa et al. 2004). However, the 492
water from the G710 gallery has mainly a local origin (seasonal analysis, Fig. 5) with a 493
characteristic SO4 concentration explained by mechanical weathering rather than by variations 494
of residence time (hydrochemistry, Fig. 6). This shows that the recharge of the unstable 495
perched aquifer is mainly local and that the contribution of the remote groundwater from the 496
sedimentary cover is minority (Fig. 8). 497
Heterogeneous, anisotropic and discontinuous properties of the landslide (Binet 2006) lead to 498
a perched discontinuous fractured reservoir slope which is better described by numerous 499
disconnected saturated zones rather than by a single one (Cappa et al. 2004, Fig. 7c and Fig. 500
8b). This discontinuous reservoir is temporary since it is rapidly drained by the dense fracture 501
network as demonstrated by intra-annual variability of the leakage flow and chemistry signal 502
of the landslide galleries (seasonal analysis and gallery survey, Fig. 5 and Fig. 7). The 503
recharge is essentially local, enhanced by the trenches and the counterscarps which tend to 504
limit the runoff and to facilitate groundwater infiltration in the landslide area (Binet et al. 505
2007a). During high flow periods, the waters infiltrated in the landslide flow perpendicularly 506
to the slope through the dense network of near-vertical N70 conductive fractures down to a 507
basal continuous perched aquifer (vertical drainage) maintained saturated by the high recharge 508
amount. When the recharge amount is sufficient, the numerous disconnected saturated zones 509
can become temporarily connected, leading to a groundwater flow parallel to the slope down 510
to the landslide (horizontal drainage). This near-surface drainage, above the basal perched 511
aquifer, occurs in the unsaturated zone and is controlled by the N70 fractures near-parallel to 512
the slope. On the contrary, during the dry season, the recharge amount is not sufficient to 513
maintain a continuous perched aquifer in the landslide and only temporarily disconnected 514
saturated zones can occur after storm events. The numerous disconnected saturated zones 515
likely results from the high vertical gradient of the hydraulic conductivity ((Maré chal 1998) 516
and the heterogeneity of the landslide, particularly the tension cracks filled by colluvial 517
deposits and altered materials (Cappa et al. 2004). An interpretative position water level of the 518
perched aquifer during the high flow periods is suggested along the cross-section XYZ (Fig. 519
7c and Fig. 8b). 520
3.5.3. Unstable zone : slope deep aquifer 521
The EDF gallery acts as a main drainage structure for the slope (tracer test, Fig. 3), and 522
especially beneath the unstable zone, where the fracture network is very dense (gallery 523
survey, Fig. 7b). The EDF gallery imposes a constant head of the deep aquifer at about 425 m 524
asl (Fig. 7c). The deep aquifer water-level is also controlled by the constant water head of the 525
Romanche alluvium. The EDF gallery, on its eastern side recharges the deep aquifer with 526
mixed water from the Romanche River and water inflow from the unstable zone. (seasonal 527
analysis and hydrochemistry, Fig. 5 and Fig. 6). The EDF gallery operates as major east-west 528
drain, whose rate and effect are mainly controlled by the N70 crossing fractures (Fig. 8a) 529
Groundwater which is not collected by the EDF gallery flows toward the Romanche alluvium 530
aquifer or to the springs located westward (tracer-test, Fig. 3c and Fig. 3d). All these 531
informations allow to draw an interpretative position of the deep aquifer water-level (Fig. 7c 532
and Fig. 8b). 533
3.5.4. Relationship between groundwater and landslide destabilisation 534
The Sé chilienne landslide shows a two-layer aquifer system constituted by a perched aquifer, 535
hosted by the near-surface reworked rockmass, disconnected from a deep saturated zone. This 536

13
organization is commonly observed on deep-seated landslide sites (Van Asch et al. 1999; 537
Guglielmi et al. 2002; Cappa et al. 2004; Binet et al. 2007a; Pisani et al. 2010; Huang et al. 538
2012) Although the Sé chilienne landslide destabilization is mainly triggered by the (short-539
term) precipitation, time-dependent (long term) factors such as rock weakening and 540
modification of unstable slope hydraulic field pressure are significant at Sé chilienne. Indeed, 541
the long-term displacement velocity monitoring shows that the displacement rates and 542
amplitudes significantly increased with time (exponential trend, Fig. 8c), independently of the 543
recharge amount. The trend is the consequence of a creep deformation process (Chigira 1992; 544
Federico et al. 2012) which has progressively decreased the rock strength. The detrended time 545
series, which is clearly linked to the hydrocycle (Vallet et al. 2014), can be decomposed into 546
seasonal and irregular statistical components, which may be associated to the unstable slope 547
deep aquifer and to the perched aquifer water-level fluctuations, respectively. Indeed, the 548
perched aquifer, characterized by a limited pore water pressure building (Cappa et al. 2014) 549
and a high infiltration rate (Binet et al. 2007a), is more sensitive to rainfall events. On the 550
contrary, the deep aquifer, characterised by a low-permeability and a larger recharge area with 551
a significant evapotranspiration potential (due to its extensive vegetation cover), is more 552
sensitive to seasonal recharge variations. The signal similarity between irregular component 553
and gross rainfall, and seasonal component and recharge (Fig. 8c) demonstrates the possible 554
double influence of the two identified layers aquifer on the unstable slope destabilisation, of 555
which the deep aquifer impact has been recently confirmed by Cappa et al. (2014). 556
4. Conclusions 557
This study highlights the dual-permeability properties of fractured rock reservoirs with 558
preferential water flow in fractures bypassing most of the less pervious and inertial micro-559
fissured matrix (Fig. 7). The major faults/fractures play a foremost role in the massif drainage. 560
The EDF gallery also acts as a major drain in the massif. This survey highlights the hydraulic 561
properties contrast between the unstable zone and the intact rock mass outside the landslide. 562
This vertical heterogeneity leads to a two-layer aquifer, with a shallow perched aquifer 563
localized in the unstable zone and a deep aquifer on the whole massif. The landslide perched 564
aquifer is temporary, mainly discontinuous and its extent and connectivity fluctuate according 565
to short-term recharge amount variations. The perched aquifer is almost dry during the low 566
flow periods. The groundwater flows mainly through a dense network of widely opened 567
fractures. The recharge area of the landslide perched aquifer is mainly local although in high 568
flow periods, the recharge area can become much larger than the landslide surface and 569
includes the remote sedimentary cover perched aquifer. A time series analysis shows that both 570
the perched aquifer and the deep aquifer likely trigger the landslide destabilisation. 571
Seasonal monitoring of natural and artificial tracers allows to characterize the groundwater 572
scheme the unstable slope and the surrounding stable massif. Stable isotopes of strontium 573
survey could better constrain the water-rock interaction processes (sedimentary cover vs. 574
basement). The results obtained in the Sé chilienne landslide show that this method is able to 575
solve various important issues for hydromechanical studies (Cappa et al. 2014). Due to the 576
general scarcity of hydrogeological monitoring networks in landslide sites, the proposed 577
method is suitable to conceive outstanding flow schemes for all landslide types in contexts as 578
well as in soft materials. 579
Acknowledgments 580

14
This research was funded by SLAMS (Sé chilienne Land movement: Multidisciplinary 581
Studies) the program of the Agence Nationale de la Recherche. The meteorological and 582
displacement data were supplied by CEREMA Lyon. The authors gratefully acknowledge the 583
support of Jean-Pierre Duranthon and Marie-Auré lie Chanut (CEREMA Lyon). The authors 584
are also very grateful to Christophe Loup (UMR Chrono-Environnement) for the chemical 585
analyses. The implementation of the monitoring network would not have been possible 586
without the cooperation of Mrs. and Mr. Aymoz, Patrick Boyer from the Office National des 587
Forê ts and Gé rard Cret, mayor of Sé chilienne. 588

15
References 589
Agliardi F, Crosta G, Zanchi A (2001) Structural constraints on deep-seated slope 590
deformation kinematics. Engineering Geology 59:83� 102. doi: 10.1016/S0013-591
7952(00)00066-1 592
Alfonsi P (1997) Relation entre les paramè tres hydrologiques et la vitesse dans les 593
glissements de terrains. Exemples de La Clapiè re et de Sé chilienne. Revue franç aise 594
de gé otechnique 3� 12. 595
Atteia O (1994) Major and trace elements in precipitation on Western Switzerland. 596
Atmospheric Environment 28:3617� 3624. doi: 10.1016/1352-2310(94)00193-O 597
Barfé ty J-C, Bordet P, Carme J, et al. (1972) Notice et carte gé ologique de la France au 598
1/50000, feuille de Vizille numé ro 797. Bureau de recherches gé ologiques et miniè res. 599
Barla G, Chiriotti E (1995) Insights into the behaviour of the large deep-seated gravitational 600
slope deformation of Rosone, in the Piemonte Region (Italy). Proceedings 44th 601
Geomechanics Colloquim. Salzburg, pp 425� 432 602
Belle P, Aunay B, Bernardie S, et al. (2013) The application of an innovative inverse model 603
for understanding and predicting landslide movements (Salazie cirque landslides, 604
Reunion Island). Landslides 1� 13. doi: 10.1007/s10346-013-0393-5 605
Binet S (2006) L�hydrochimie, marqueur de l� é volution à long terme des versants 606
montagneux fracturé s vers de grands mouvements de terrain Application à plusieurs 607
é chelles sur la haute vallé e de la Tiné e (Mercantour, France) et sur le versant de 608
Rosone (Gran Paradiso, Italie). PhD thesis, Université de Franche-Comté 609
Binet S, Guglielmi Y, Bertrand C, Mudry J (2007a) Unstable rock slope hydrogeology: 610
insights from the large-scale study of western Argentera-Mercantour hillslopes (South-611
East France). Bulletin de la Societe Geologique de France 178:159� 168. doi: 612
10.2113/gssgfbull.178.2.159 613
Binet S, Jomard H, Lebourg T, et al. (2007b) Experimental analysis of groundwater flow 614
through a landslide slip surface using natural and artificial water chemical tracers. 615
Hydrol Process 21:3463� 3472. doi: 10.1002/hyp.6579 616
Binet S, Spadini L, Bertrand C, et al. (2009) Variability of the groundwater sulfate 617
concentration in fractured rock slopes: a tool to identify active unstable areas. Hydrol 618
Earth Syst Sci 13:2315� 2327. doi: 10.5194/hess-13-2315-2009 619
Bogaard T, Guglielmi Y, Marc V, et al. (2007) Hydrogeochemistry in landslide research: a 620
review. Bulletin de la Socié té Gé ologique de France 178:113� 126. doi: 621
10.2113/gssgfbull.178.2.113 622
Bonzanigo L, Eberhardt E, Loew S (2007) Long-term investigation of a deep-seated creeping 623
landslide in crystalline rock. Part I. Geological and hydromechanical factors 624

16
controlling the Campo Vallemaggia landslide. Can Geotech J 44:1157� 1180. doi: 625
10.1139/T07-043 626
Calmels D, Gaillardet J, Brenot A, France-Lanord C (2007) Sustained sulfide oxidation by 627
physical erosion processes in the Mackenzie River basin: Climatic perspectives. 628
Geology 35:1003� 1006. doi: 10.1130/G24132A.1 629
Cappa F, Guglielmi Y, Rutqvist J, et al. (2006) Hydromechanical modelling of pulse tests that 630
measure fluid pressure and fracture normal displacement at the Coaraze Laboratory 631
site, France. International Journal of Rock Mechanics and Mining Sciences 43:1062�632
1082. doi: 10.1016/j.ijrmms.2006.03.006 633
Cappa F, Guglielmi Y, Soukatchoff VM, et al. (2004) Hydromechanical modeling of a large 634
moving rock slope inferred from slope levelling coupled to spring long-term 635
hydrochemical monitoring: example of the La Clapiè re landslide (Southern Alps, 636
France). Journal of Hydrology 291:67� 90. doi: 10.1016/j.jhydrol.2003.12.013 637
Cappa F, Guglielmi Y, Viseur S, Garambois S (2014) Deep fluids can facilitate rupture of 638
slow-moving giant landslides as a result of stress transfer and frictional weakening. 639
Geophys Res Lett 41:61� 66. doi: 10.1002/2013GL058566 640
Cervi F, Ronchetti F, Martinelli G, et al. (2012) Origin and assessment of deep groundwater 641
inflow in the Ca� Lita landslide using hydrochemistry and in situ monitoring. Hydrol 642
Earth Syst Sci 16:4205� 4221. doi: 10.5194/hess-16-4205-2012 643
Chanut M-A, Vallet A, Dubois L, Duranthon J-P (2013) Mouvement de versant de 644
Sé chilienne : relations entre dé placements de surface et pré cipitations � analyse 645
statistique. Journé es Alé a Gravitaire 2013 646
Charlier J-B, Bertrand C, Binet S, et al. (2010) Use of continuous measurements of dissolved 647
organic matter fluorescence in groundwater to characterize fast infiltration through an 648
unstable fractured hillslope (Valabres rockfall, French Alps). Hydrogeol J 18:1963�649
1969. doi: 10.1007/s10040-010-0670-5 650
Chigira M (1992) Long-term gravitational deformation of rocks by mass rock creep. 651
Engineering Geology 32:157� 184. doi: 10.1016/0013-7952(92)90043-X 652
Clark ID, Fritz P (1997) Environmental Isotopes in Hydrogeology. CRC Press 653
Clauser C (1992) Permeability of crystalline rocks. Eos, Transactions American Geophysical 654
Union 73:233� 238. doi: 10.1029/91EO00190 655
Corominas J, Moya J, Ledesma A, et al. (2005) Prediction of ground displacements and 656
velocities from groundwater level changes at the Vallcebre landslide (Eastern 657
Pyrenees, Spain). Landslides 2:83� 96. doi: 10.1007/s10346-005-0049-1 658
Debieche T-H, Bogaard T, Marc V, et al. (2012) Hydrological and hydrochemical processes 659
observed during a large-scale infiltration experiment at the Super-Sauze mudslide 660
(France). Hydrological Processes 26:2157� 2170. doi: 10.1002/hyp.7843 661

17
Dongarrà G, Manno E, Sabatino G, Varrica D (2009) Geochemical characteristics of waters in 662
mineralised area of Peloritani Mountains (Sicily, Italy). Applied Geochemistry 663
24:900� 914. doi: 10.1016/j.apgeochem.2009.02.002 664
Durville J-L, Kasperki J, Duranthon J-P (2009) The Sé chilienne landslide: monitoring and 665
kinematics. First Italian Workshop on Landslides. Napoli, Italia, pp 174� 180 666
Federico A, Popescu M, Elia G, et al. (2012) Prediction of time to slope failure: a general 667
framework. Environ Earth Sci 66:245� 256. doi: 10.1007/s12665-011-1231-5 668
Gaillardet J, Dupré B, Louvat P, Allè gre CJ (1999) Global silicate weathering and CO2 669
consumption rates deduced from the chemistry of large rivers. Chemical Geology 670
159:3� 30. doi: 10.1016/S0009-2541(99)00031-5 671
Gat JR (1996) Oxygen and Hydrogen Isotopes in the Hydrologic Cycle. Annual Review of 672
Earth and Planetary Sciences 24:225� 262. doi: 10.1146/annurev.earth.24.1.225 673
Guglielmi Y, Cappa F, Binet S (2005) Coupling between hydrogeology and deformation of 674
mountainous rock slopes: Insights from La Clapiè re area (southern Alps, France). 675
Comptes Rendus Geoscience 337:1154� 1163. doi: 10.1016/j.crte.2005.04.016 676
Guglielmi Y, Vengeon JM, Bertrand C, et al. (2002) Hydrogeochemistry: an investigation 677
tool to evaluate infiltration into large moving rock masses (case study of La Clapiè re 678
and Sé chilienne alpine landslides). Bulletin of Engineering Geology and the 679
Environment 61:311 � 324. 680
Helmstetter A, Garambois S (2010) Seismic monitoring of Sé chilienne rockslide (French 681
Alps): Analysis of seismic signals and their correlation with rainfalls. Journal of 682
Geophysical Research 115:F03016. doi: 10.1029/2009JF001532 683
Hilley GE, Chamberlain CP, Moon S, et al. (2010) Competition between erosion and reaction 684
kinetics in controlling silicate-weathering rates. Earth and Planetary Science Letters 685
293:191� 199. doi: 10.1016/j.epsl.2010.01.008 686
Hong Y, Hiura H, Shino K, et al. (2005) The influence of intense rainfall on the activity of 687
large-scale crystalline schist landslides in Shikoku Island, Japan. Landslides 2:97� 105. 688
doi: 10.1007/s10346-004-0043-z 689
Huang A-B, Lee J-T, Ho Y-T, et al. (2012) Stability monitoring of rainfall-induced deep 690
landslides through pore pressure profile measurements. Soils and Foundations 52:737�691
747. doi: 10.1016/j.sandf.2012.07.013 692
Iverson RM (2000) Landslide triggering by rain infiltration. Water Resources Research 693
36:1897� 1910. doi: 10.1029/2000WR900090 694
Le Roux O, Jongmans D, Kasperski J, et al. (2011) Deep geophysical investigation of the 695
large Sé chilienne landslide (Western Alps, France) and calibration with geological 696
data. Engineering Geology 120:18� 31. doi: 10.1016/j.enggeo.2011.03.004 697
18
Lebrouc V, Schwartz S, Baillet L, et al. (2013) Modeling permafrost extension in a rock slope 698
since the Last Glacial Maximum: Application to the large Sé chilienne landslide 699
(French Alps). Geomorphology 198:189� 200. doi: 10.1016/j.geomorph.2013.06.001 700
Leibundgut C, Maloszewski P, Kü lls C (2011) Tracers in Hydrology. John Wiley & Sons 701
Lin P-Y, Tsai LL-Y (2012) A hydrochemical study of Hungtsaiping landslide area, Nantou, 702
Taiwan. Environ Earth Sci 67:1045� 1060. doi: 10.1007/s12665-012-1564-8 703
Lis G, Wassenaar LI, Hendry MJ (2008) High-Precision Laser Spectroscopy D/H and 704
18O/16O Measurements of Microliter Natural Water Samples. Anal Chem 80:287�705
293. doi: 10.1021/ac701716q 706
Maré chal J-C (1998) Les circulations d�eau dans les massifs cristallins alpins et leurs relations 707
avec les ouvrages souterrains. PhD thesis, Ecole Polytechnique Fé dé rale de Lausanne 708
(EPFL) 709
Maré chal J-C, Etcheverry D (2003) The use of 3H and delta18O tracers to characterize water 710
inflows in Alpine tunnels. Applied Geochemistry 18:339� 351. 711
Meric O, Garambois S, Jongmans D, et al. (2005) Application of geophysical methods for the 712
investigation of the large gravitational mass movement of Sé chilienne, France. Can 713
Geotech J 42:1105� 1115. doi: 10.1139/t05-034 714
Penna D, Stenni B, � anda M, et al. (2010) On the reproducibility and repeatability of laser 715
absorption spectroscopy measurements for δ2H and δ18O isotopic analysis. Hydrol 716
Earth Syst Sci 14:1551� 1566. doi: 10.5194/hess-14-1551-2010 717
Pili É , Perrier F, Richon P (2004) Dual porosity mechanism for transient groundwater and gas 718
anomalies induced by external forcing. Earth and Planetary Science Letters 227:473�719
480. doi: 10.1016/j.epsl.2004.07.043 720
Pisani G, Castelli M, Scavia C (2010) Hydrogeological model and hydraulic behaviour of a 721
large landslide in the Italian Western Alps. Nat Hazards Earth Syst Sci 10:2391� 2406. 722
doi: 10.5194/nhess-10-2391-2010 723
Rochet L, Giraud A, Antoine P, É vrard H (1994) La dé formation du versant sud du mont-sec 724
dans le secteur des ruines de Sé chilienne (Isè re). Bulletin of the International 725
Association of Engineering Geology 50:75� 87. doi: 10.1007/BF02594959 726
Rutqvist J, Stephansson O (2003) The role of hydromechanical coupling in fractured rock 727
engineering. Hydrogeology Journal 11:7� 40. doi: 10.1007/s10040-002-0241-5 728
Sun J, Liu Q, Li J, An Y (2009) Effects of rainfall infiltration on deep slope failure. Science in 729
China Series G: Physics Mechanics and Astronomy 52:108� 114. doi: 10.1007/s11433-730
009-0004-6 731
Tullen P (2002) Mé thodes d�analyse du fonctionnement hydrogé ologique des versants 732
instables. PhD thesis, EPFL 733

19
Vallet A, Bertrand C, Fabbri O, Mudry J (2014) A new method to compute the groundwater 734
recharge for the study of rainfall-triggered deep-seated landslides. Application to the 735
Sé chilienne unstable slope (western Alps). Hydrol Earth Syst Sci Discuss 11:6343�736
6403. doi: 10.5194/hessd-11-6343-2014 737
Van Asch TWJ, Buma J, van Beek LP. (1999) A view on some hydrological triggering 738
systems in landslides. Geomorphology 30:25� 32. doi: 10.1016/S0169-739
555X(99)00042-2 740
Vengeon JM (1998) Dé formation et rupture des versants en terrain mé tamorphique 741
anisotrope: Apport de l� é tude des Ruines de Sé chilienne. PhD thesis, Université 742
Joseph Fourier I 743
744
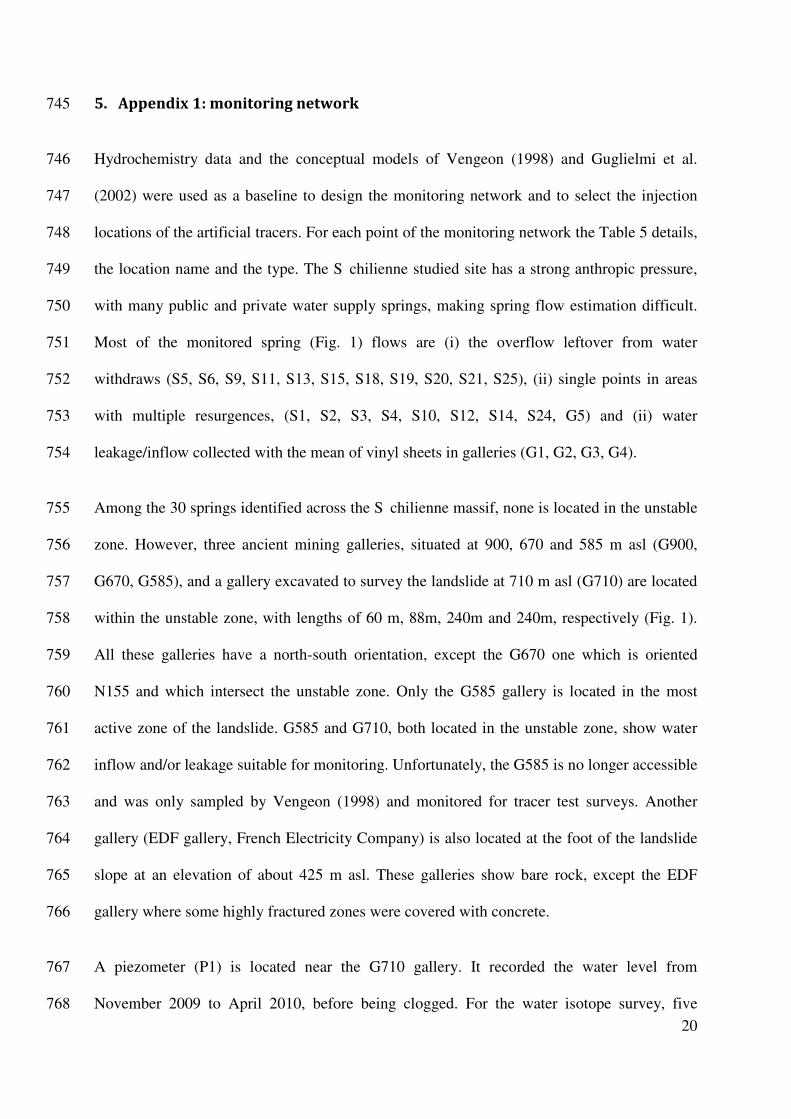
20
5. Appendix 1: monitoring network 745
Hydrochemistry data and the conceptual models of Vengeon (1998) and Guglielmi et al. 746
(2002) were used as a baseline to design the monitoring network and to select the injection 747
locations of the artificial tracers. For each point of the monitoring network the Table 5 details, 748
the location name and the type. The Sé chilienne studied site has a strong anthropic pressure, 749
with many public and private water supply springs, making spring flow estimation difficult. 750
Most of the monitored spring (Fig. 1) flows are (i) the overflow leftover from water 751
withdraws (S5, S6, S9, S11, S13, S15, S18, S19, S20, S21, S25), (ii) single points in areas 752
with multiple resurgences, (S1, S2, S3, S4, S10, S12, S14, S24, G5) and (ii) water 753
leakage/inflow collected with the mean of vinyl sheets in galleries (G1, G2, G3, G4). 754
Among the 30 springs identified across the Sé chilienne massif, none is located in the unstable 755
zone. However, three ancient mining galleries, situated at 900, 670 and 585 m asl (G900, 756
G670, G585), and a gallery excavated to survey the landslide at 710 m asl (G710) are located 757
within the unstable zone, with lengths of 60 m, 88m, 240m and 240m, respectively (Fig. 1). 758
All these galleries have a north-south orientation, except the G670 one which is oriented 759
N155 and which intersect the unstable zone. Only the G585 gallery is located in the most 760
active zone of the landslide. G585 and G710, both located in the unstable zone, show water 761
inflow and/or leakage suitable for monitoring. Unfortunately, the G585 is no longer accessible 762
and was only sampled by Vengeon (1998) and monitored for tracer test surveys. Another 763
gallery (EDF gallery, French Electricity Company) is also located at the foot of the landslide 764
slope at an elevation of about 425 m asl. These galleries show bare rock, except the EDF 765
gallery where some highly fractured zones were covered with concrete. 766
A piezometer (P1) is located near the G710 gallery. It recorded the water level from 767
November 2009 to April 2010, before being clogged. For the water isotope survey, five 768

21
hermetically closed rain collector tanks (C1, C2, C3, C4 and C5) were buried about one meter 769
deep and wrapped with an isotherm cover to avoid isotope fractionation due to the 770
fluctuations of the atmosphere temperature. Rain collector points were installed every 200 m 771
in elevation from 640 to 1520 m asl, covering most of the massif hosting the landslide (Fig. 772
1). Two rain collector locations (C1 and C2), respectively installed in woodland and in 773
grassland (the two main vegetation types of the landslide recharge area), were coupled with a 774
lysimeter. 775
The EDF gallery outlet (S7), the Romanche river (S8 and S22) and the Rif Bruyant stream 776
(S26) were added to the monitoring network. Additionally, the EDF gallery was also 777
monitored for a unique water chemistry survey (March 2002) during maintenance of the EDF 778
gallery. The G900 gallery was used only for tracer test survey. Demolition works of a 779
hydropower plant, after tracing survey, modified the flow path of S16 which is now flowing 780
directly to alluvial aquifer. S23 and S17 were only monitored for the tracer test survey. 781
Special instrumentations and sample rates were implemented for the two tracer tests in 2001 782
and 2002. For the multi-tracing survey performed in April 2001, the monitoring survey lasted 783
for two months, and sample rate was adapted according to survey time by decreasing the 784
sampling resolution (Fig. 1). G5, S5 and S6 springs were monitored with an automatic 785
sampler. Activated charcoal packets and manual water sampling were implemented at S1, S4, 786
S9, S11, S13, S15, S18, S19 and S20. Only charcoal monitoring was performed on the 787
remaining springs. In the reiterated tracer test from gallery G585 (I3-B test), only hand 788
samplings were performed in all water inflows of the EDF gallery, between kilometric points 789
5 and 7 during the 2 days following the injection day (Fig. 3e). 790
791

22
6. Appendix 2: Sample analysis 792
Survey of the tracer tests 793
Artificial tracers (Uranin, Eosin, Rhodamin B and Sodium naphtionate) were extracted from 794
charcoal adsorbents using an eluent (ethanol mixed with ammonia) by a fluorescence 795
spectrometer (Perkin-Elmer L S 3 0 UV-Spectrometer Model). Accuracy depends on the 796
natural organic matter content, which is highly variable through precipitations events 797
Oxygen stable isotope 798
Water samples were collected in glass vials with caps with an additional parafilm to prevent 799
from any possible evaporation. Oxygen stable isotope were analyzed with the Liquid Water 800
Isotope Analyzers method (LWIA) using off-axis integrated cavity output spectroscopy 801
analyzer (OA-ICOS), model DLT-100, manufactured by Los Gatos Research Inc. For more 802
details about method accuracy, precision and repeatability, see Penna et al. (2010) and Lis et 803
al. (2008). Isotopic analyses were performed at the Faculty of Civil Engineering and 804
Geosciences at the Delft University of Technology in the Netherlands. 805
Field measurement 806
The pH, water electrical conductivity and temperature were measured on site with a WTW 807
apparatus model LF30 (a Xylem Inc. branch). The probes were calibrated before each 808
campaign with standard buffer solutions. Measurements are reduced to the standard 809
temperature of 25 ° C with a respective accuracy of 0.1 pH units and 0.1 µ S/cm. 810
Water chemistry analysis 811
23
Water samples were collected in polyethylene bottles and were filtered at 0.45µ m. Analyses 812
of Na+, Ca
2+, K
+, Mg
2+ were performed by atomic absorption spectrometry (AA 100 Perkin�813
Elmer) with detection limits of 0.01; 0.5; 0.1 and 0.1 mg/L, respectively. Analyses of SO42-
, 814
NO3-
and Cl- were performed by high pressure ion chromatography (Dionex DX 100) with 815
detection limits of 0.1; 0.05 and 0.1 mg/L, respectively. The concentrations in HCO3- were 816
measured by acid titration with a N/50 H2SO4, within at most 48 hours after sampling, with 1 817
% accuracy. For the Sé chilienne hydrochemical conditions (pH between 6 and 8.5), total and 818
carbonate alkalinity can be considered as equalling to HCO3- concentration. Only analyses 819
which have a charge balance lower than 10 % were taken into account. Silica was analyzed 820
with a spectrophotometer (Spectroquant, Pharo 300, Merck) using a silica-test kit (Merck) 821
with 3 % accuracy. Chemistry analyses were performed at the Chrono-Environnement 822
laboratory at the University of Franche-Comté . 823
824

24
Table 1 Settings of the multi-tracer test of April 2001 825 Injection location Tracer Date Tracer (kg) Water (m3)
I2 Rhodamine 10-April-2001 10:00 5 8
I1 Sodium napthionate 10-April-2001 13:00 6 30
I4 Uranin 10-April-2001 17:00 8 3
I3 Eosin 11-April-2001 12:00 5 ●
826
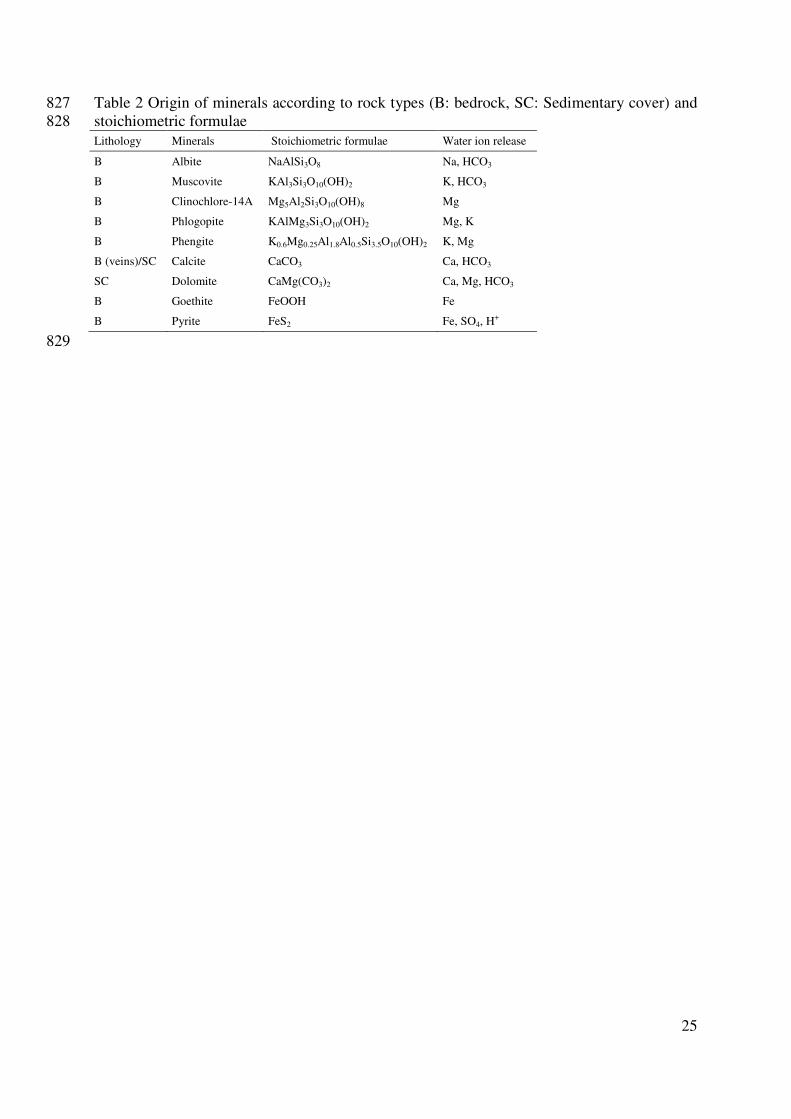
25
Table 2 Origin of minerals according to rock types (B: bedrock, SC: Sedimentary cover) and 827
stoichiometric formulae 828
Lithology Minerals Stoichiometric formulae Water ion release
B Albite NaAlSi3O8 Na, HCO3
B Muscovite KAl3Si3O10(OH)2 K, HCO3
B Clinochlore-14A Mg5Al2Si3O10(OH)8 Mg
B Phlogopite KAlMg3Si3O10(OH)2 Mg, K
B Phengite K0.6Mg0.25Al1.8Al0.5Si3.5O10(OH)2 K, Mg
B (veins)/SC Calcite CaCO3 Ca, HCO3
SC Dolomite CaMg(CO3)2 Ca, Mg, HCO3
B Goethite FeOOH Fe
B Pyrite FeS2 Fe, SO4, H+
829
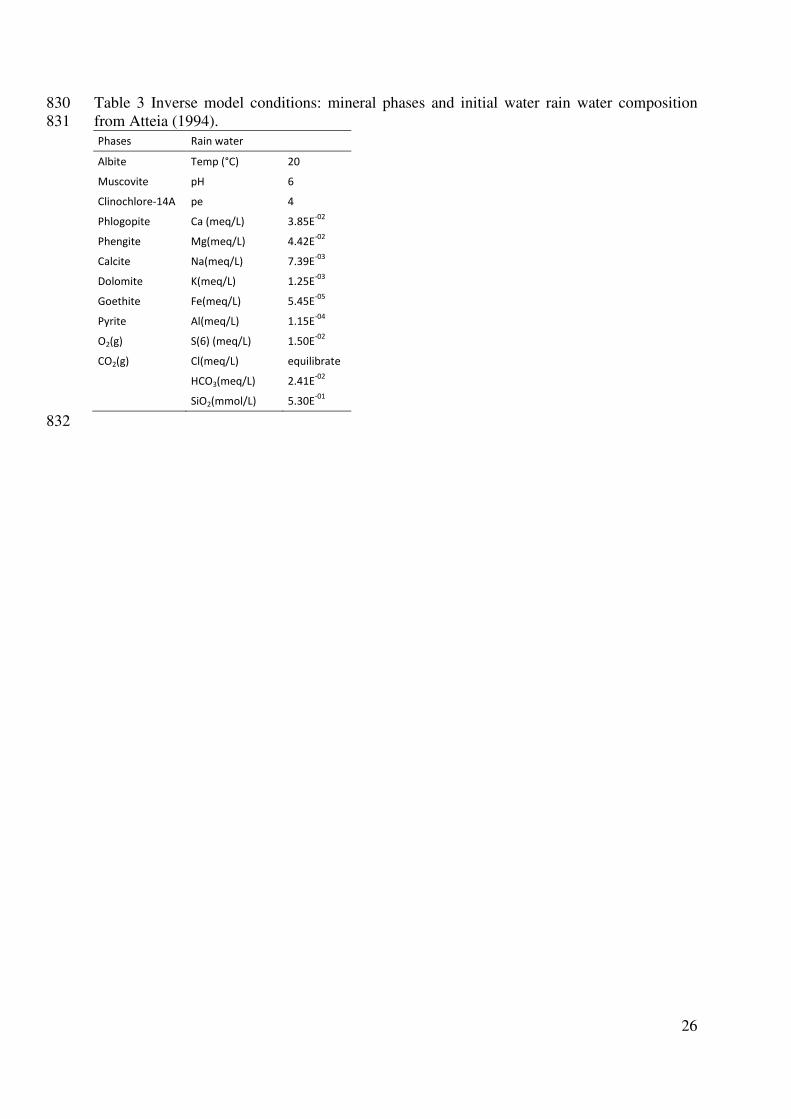
26
Table 3 Inverse model conditions: mineral phases and initial water rain water composition 830
from Atteia (1994). 831
Phases Rain water
Albite Temp (°C) 20
Muscovite pH 6
Clinochlore-14A pe 4
Phlogopite Ca (meq/L) 3.85E-02
Phengite Mg(meq/L) 4.42E-02
Calcite Na(meq/L) 7.39E-03
Dolomite K(meq/L) 1.25E-03
Goethite Fe(meq/L) 5.45E-05
Pyrite Al(meq/L) 1.15E-04
O2(g) S(6) (meq/L) 1.50E-02
CO2(g) Cl(meq/L) equilibrate
HCO3(meq/L) 2.41E-02
SiO2(mmol/L) 5.30E-01
832

27
Table 4 Physico-chemical parameters and major ions of the monitoring springs. Values are 833
the average from the number of gather samples. SN: sample number. HF: Hydrochemical 834
facies, Temp.: temperature (° C), EC: electrical conductivity (µ S/cm), ionic concentrations in 835
meq/L, n.a. = non-analysed. 836
HF Station
ID Water Type SN
Temp.
(field)
pH
(field)
EC
(field)
Ca
meq/l
Mg
meq/l
Na
meq/l
K
meq/l
Cl
meq/l
HCO3
meq/l
SO4
meq/l
SiO2
mmol/l
1 S12 Ca-HCO3 5 10.22 7.72 120.00 0.88 0.21 0.09 0.01 0.03 0.86 0.16 0.14
2 S24 Mg-Ca- HCO3 5 10.30 7.57 202.80 1.05 0.93 0.15 0.01 0.06 1.59 0.41 0.17
S9 Mg-Ca- HCO3 4 12.10 7.52 538.80 2.69 3.16 0.19 0.02 0.06 4.28 1.62 0.16
S10 Mg-Ca- HCO3 4 11.47 7.94 455.80 2.59 2.32 0.16 0.02 0.04 3.84 1.12 0.16
S11 Mg-Ca- HCO3 2 9.90 7.75 440.50 2.50 2.32 0.14 0.02 0.04 3.75 1.06 0.15
S25 Mg-Ca- HCO3 5 13.66 7.86 367.00 1.95 1.87 0.18 0.02 0.08 3.04 0.75 0.16
3 G1 Mg-Ca-SO4- HCO3 4 11.75 8.08 872.50 5.10 4.79 0.26 0.04 0.05 3.43 5.88 0.12
G2 Mg-Ca-SO4 4 12.10 7.67 384.30 1.98 1.80 0.21 0.05 0.05 0.61 3.18 0.23
G3 Mg-Ca- HCO3-SO4 1 10.10 7.05 314.00 1.55 2.09 n.a. n.a. 0.33 2.64 1.03 n.a
G4 Mg-Ca- HCO3-SO4 2 10.55 7.44 446.00 2.03 3.04 n.a. n.a 0.07 2.92 2.29 n.a
G5 Mg-Ca-SO4- HCO3 3 10.10 7.37 629.70 2.22 5.07 n.a. n.a 0.06 3.47 3.92 0.14
4 S4 Ca Mg-HCO3-SO4 5 11.22 7.56 354.80 2.88 0.68 0.21 0.02 0.18 2.05 1.36 0.12
S13 Ca Mg-HCO3-SO4 5 8.62 7.85 522.40 4.20 1.46 0.10 0.02 0.03 3.30 2.30 0.12
S14 Ca Mg-HCO3-SO4 5 11.50 7.77 332.20 2.31 1.07 0.15 0.01 0.09 2.51 0.80 0.13
S15 Ca Mg-HCO3-SO4 5 11.24 7.54 465.20 3.53 1.42 0.13 0.02 0.09 3.25 1.58 0.12
S18 Ca Mg-HCO3-SO4 5 8.92 7.63 481.80 4.06 1.21 0.10 0.01 0.13 3.87 1.36 0.12
S20 Ca Mg-HCO3-SO4 5 10.66 7.50 521.20 4.25 1.41 0.12 0.02 0.06 3.58 1.97 0.12
S21 Ca Mg-HCO3-SO4 3 12.00 7.70 499.70 3.99 1.33 0.12 0.01 0.06 3.40 1.93 0.12
837

28
Table 5 List of the points of the monitoring network with their location name and type 838 Location
code Location name Type
Location
code Location name Type
S1 Vizille Spring S22 Romanche Stream
S2 Vizille Spring S23 Mulet Spring
S3 Vizille Spring S24 Les Aillouds Spring
S4 Vizille Spring S25 Mounier Spring
S5 Dhuy Spring S26 Rif-Bruyant Stream
S6 Reine Spring C1 Gallery 710 rain collector
lysimeter
S7 Gallery EDF Gallery outlet C2 Madeleine rain collector
lysimeter
S8 Romanche Stream C3 Fonafrey rain collector
S9 Cornier Spring C4 Rochassier rain collector
S10 Chemin Mont-Jean Spring C5 Pic-Oeilly rain collector
S11 Mont-Jean Spring G1 Gallery 710-1 Water inflow
S12 Pleney Spring G2 Gallery 710-2 Water inflow
S13 Fonafrey Spring G3 Gallery 585-1 Water inflow
S14 Thiebaud-EDF Spring G4 Gallery 585-2 Water inflow
S15 Thiebeaud-Lavoir Spring G5 Gallery 585-3 Water inflow
S16 Noyer-Chute Spring I1 Gallery 900 Fractures
S17 Clobasse Spring I2 Crevasse Rock crevasse
S18 Clos-Bé nit Spring I3 Gallery 585 Fractures
S19 Finet Spring I4 Rochassier Sinkhole
S20 Les Mathieux Spring P1 Gallery 710 Piezometer
S21 La Bathie Spring
839

29
840
Fig. 1 Site map and monitoring network. The unstable slope boundary is defined according to 841
the geophysical survey of Leroux et al. (2011) 842

30
843
Fig. 2 Illustration of the methods implemented for the δ18
O analysis. (a) Determination of the 844
isotope elevation gradient for precipitation and infiltration. (b) Spatial analysis of the δ18
O 845
elevation of the spring recharge area 846
847
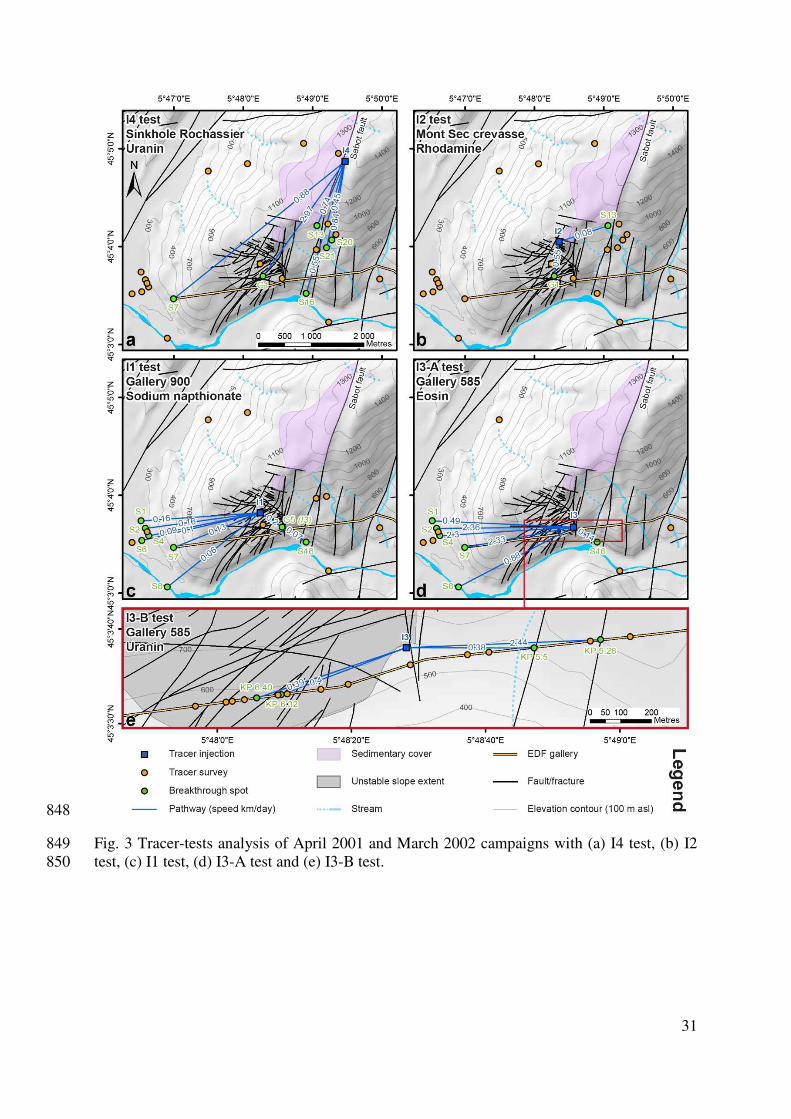
31
848
Fig. 3 Tracer-tests analysis of April 2001 and March 2002 campaigns with (a) I4 test, (b) I2 849
test, (c) I1 test, (d) I3-A test and (e) I3-B test. 850

32
851
Fig. 4 Isotope elevation gradients for the four seasonal water sampling campaigns 852

33
853
Fig. 5 Seasonal analysis of δ18
O and electrical conductivity of springs. (a) Seasonal δ18
O 854
estimated elevation of springs plotted relatively to spring elevation, associated ridge line 855
elevation, and δ18
O estimated elevation of surface network (Romanche and Rif Bruyant). (b) 856
Difference between the average spring recharge area elevation and the associated ridge line 857
point elevation. (c) Seasonal analysis of electrical conductivity plotted relatively to surface 858
network signal (Romanche and Rif Bruyant). (d) Spatial analysis of the δ18
O elevation the 859
spring recharge area 860

34
861
Fig. 6 Hydrochemistry analysis with (a) Durov diagram, (b) spatial analysis and Stiff 862
diagrams and scatter plots of chemical concentrations: (c) Ca vs. HCO3 and (d) Na vs. Cl 863

35
864
Fig. 7 Gallery survey. (a) Spatial analysis of water inflows. (b) SO4 concentration of the EDF 865
gallery water inflows. (c) Cross-section analysis of water inflows. The cross-section of the 866
unstable zone is modified after Lebrouc et al. (2013). The unstable slope boundary is defined 867
according to the geophysical survey of Leroux et al. (2011) 868
869

36
870
Fig. 8 Sketch of the groundwater conceptual model. (a) Spatial sketch. (b) Cross-section 871
sketch. (c) Time series analysis of A13 extensometer displacement. The cross-section of the 872
unstable zone is modified after Lebrouc et al. (2013). The unstable slope boundary is defined 873
according to the geophysical survey of Leroux et al. (2011) 874

In Situ Study of Hydrochemical Response
of a Fractured-Layered Carbonate
Regional Aquifer: Comparative Analyses
of Natural Infiltration and Artificial
Leakage of a Large Dam Lake
(Vouglans, Jura, France)
C. Bertrand, Y. Guglielmi, S. Denimal, J. Mudry and G. Deveze
Abstract Leakage detection and prediction of fractured rocks is an important
question in hydropower engineering. Some of large water reservoirs are built in
karstic carbonate areas. In order to understand underground circulations in the
limestone/dolomite foundation of Vouglans dam (Jura, France), analysis of
groundwater chemistry, according to geological conditions, is used. Statistical
analyses (PCA and DFA) are used (i) to characterise more precisely the low
contrast in chemical composition resulting from the interaction between surface
water, groundwater and carbonate environment, and (ii) to reclassify individuals in
homogeneous groups with respect to the variables studied. Three hydrodynamic
behaviours were determined in the sector. The area of influence of the rapid transit
of the lake water varies with the seasons, and particularly in response to changes of
the water level of the lake. The hydrostatic pressure of the water column has an
influence on the opening and closing of cracks at the bottom of the dam.
C. Bertrand (&) � S. Denimal � J. Mudry
Chrono-Environnement, UMR 6249/CNRS University of Franche Comté,
16 Route de Gray, 25000 Besançon, France
e-mail: [email protected]
Y. Guglielmi
CEREGE UMR7330, CNRS - Aix-Marseille Université, 3 Place Victor Hugo,
13331 Marseille, France
G. Deveze
DIN/CEIDRE - Département TEGG, Service Géologie Géotechnique,
905 Avenue Du Camp de Menthe, 13097 Aix En Provence Cedex 02, France
Ó Springer-Verlag Berlin Heidelberg 2015
B. Andreo et al. (eds.), Hydrogeological and Environmental Investigations
in Karst Systems, Environmental Earth Sciences 1,
DOI 10.1007/978-3-642-17435-3_21
181

1 Introduction
Leakage detection and prediction of fractured rocks is a relevant question in
hydropower engineering, CO2 sequestration in geological reservoirs/cap rock
systems, tunnels and storage caverns, and in general fluid manipulations in the
subsurface. Most of the dams have been experiencing these problems with respect
to degrees of security and related sustainability in their lives. It can be useful to
survey dam seepage by environmental isotopes and groundwater chemical anal-
yses, according to geological condition. Some abundant information is provided by
change of chemical and environmental isotope compositions after surface water
seeping into stratums (Käss 1998; Mudry et al. 2008; Plata and Araguas 2002). In
many cases, leakage passage existing in dam foundations can be detected by
analysing hydrochemistry and isotope of groundwater in boreholes or springs
(Kendall and McDonnel 1998). Large water reservoirs are sometimes built in
karstified carbonate areas (De Waele 2008). The understanding and evaluation of
environmental impacts of such human activities in karst are important to find a
balance between development and preservation of these complex hydrogeological
systems (Milanovic 2002, 2004). Moreover, in this managed system, water flows
are constrained by varying hydraulic and mechanical limit conditions. In this latter
case, these variations are conditioned by the water level in the reservoir, and
induce increases of the stress applied on the dam’s abutment (water weight) and
pressure increase of the fluid, through the discontinuity network. These cumulative
variations lead to significant changes in hydraulic properties of fractures, which
convey water fluxes through the massif. Artificial tracer methods using purpose-
fully drilled wells have been widely applied to detect the bypass routes of reservoir
water in dam foundations built in carbonate terrain (Silar 1988). We propose to use
natural tracing to constrain the hydrodynamic behaviour in the dam at two dif-
ferent hydrological contrasted seasons.
2 Study Site
2.1 Presentation
The Vouglans dam (Jura, France) is situated on the Ain course, in the outer area of
the Jura. It is positioned on a large tabular structure oriented north–south. Runoff
on the massif supporting the dam is guided by open discontinuities in the rock.
These discontinuities are in the form of karstic long sub-horizontal lines, parallels
to the stratification plans. They are interconnected by aligned vertical wells, fol-
lowing fault planes. The foundations of the dam have been concerned by two types
of treatment: injections to form a grout curtain, and a drainage system consisting of
tunnels and open drill holes. Drains allow to reduce water pressure in rocky
foundation and piezometers allow the control of this water pressure, especially to
182 C. Bertrand et al.

avoid uplift of the flood reception of slab spillways. The Vouglans massif is
drained by a series of stepped sources (source de la Vierge, 430 m a.s.l.; source de
la route, 385 m a.s.l.; source de la Porcherie, 330 m a.s.l.). The dam is an arch dam
(Fig. 1) with a development peak of 427 m and a height of 103 m above the bed of
the Ain. An ‘‘upstream’’ fissure is also observed, corresponding to a decollement
zone between concrete and foundation upstream of the dam. Its average thickness
is 25 m at the base and 6 m at the crest. In the dam, stepped galleries allow the
control of the dam’s deformation. These galleries continue in rock support, where
drains allow the control of lake leakage. The reservoir is located in the present
valley of Ain river. The lake shows 1,600 ha area, and contains 605 mm3 of water
volume. Its maximum depth is 100 m. The lake shows an amplitude variation of
water level of about 34 m.
2.2 Measurements
In the massif and in the lake, physical and chemical parameters (pH, temperature,
electrical conductivity, major cations and anions) have been measured in low
water (June 2002) and high water (March 2004) periods, corresponding to two
different levels of the lake water: 427 and 420.5 m a.s.l..
A total of 34 drains distributed in the entire dam have been sampled: on the
right bank, six samples (numbers 1–6) have been taken in three galleries (348, 370
Fig. 1 Location and geological map of the Vouglans dam (Jura, France)
In Situ Study of Hydrochemical Response … 183

and 392 m a.s.l.). On the left side of the dam, two drains have been sampled
(numbers 7 and 8) in two galleries (respectively, 365 and 338 m a.s.l.). At the base
of the dam: 26 samples (numbers 9–34) have been collected in the perimeter
gallery (303 m a.s.l.). Two points representative of the lake water are called 35 and
36. A sampling on three springs has also been performed at the ‘source de la
Porcherie’ (n° 38; 330 m a.s.l.), the ‘source de la Route’ (n° 39; 385 m a.s.l.), and
‘source de la Vierge’ (n° 40; 430 m a.s.l.).
The pH, electrical conductivity and temperature were measured in the field with
a WTW (LF30) apparatus. pH and electrical conductivity probes were calibrated
on a regular basis with standard buffer solutions. Two depth profiles of temperature
(°C), electrical conductivity (lS/cm), and pH were obtained, using a specific probe
(‘‘Seabird’’ SBE19 probe CDT probe, accuracy: T ± 0.1 °C, electrical conduc-
tivity ±0.5 %, pH ± 0.01).
Water samples were collected in polyethylene bottles and were filtered at
0.45 lm. Analyses of Na+, Ca2+, K+, Mg2+ were performed by atomic absorption
spectrometry (AA 100 Perkin–Elmer) with detection limits of 0.01; 0.5; 0.1 and
0.1 mg/L, respectively. Anion analyses of SO42-, NO3
-, Cl- were performed by
high pressure ion chromatography (Dionex DX 100) with detection limits of 0.1;
0.05 and 0.1 mg/L, respectively. The HCO3- concentrations were measured by
acidic titration with a N/50 H2SO4, maximum 48 h after sampling(), with 1 %
accuracy. For the Vouglans hydrochemical conditions (pH between 6 and 8.5),
total and carbonate alkalinity can be considered as equalling HCO3- ion con-
centration. The calculated charge balance error for the reported analyses was
performed with the PHREEQC code (Parkhurst and Appelo 1999). Analyses which
display a charge balance lower than 10 % were only taken into account. Chemical
analyses were performed at the Chrono-Environnement laboratory at the Univer-
sity of Franche-Comté in France.
3 Results
3.1 Different Water Source
Statistical analyses are used to characterise more precisely the low contrast in
chemical composition, resulting from the interaction between surface water,
groundwater and infiltration in a carbonated medium (PCA). The discriminant
factor analysis is used in order to reclassify individuals in homogeneous groups in
term of the variables studied (DFA).
3.1.1 Hydrochemical Groups
A principal component analysis (PCA) with the XLstat software has been per-
formed, using all samples collected in the site, that is to say 11 physical and
184 C. Bertrand et al.

chemical variables and 75 observations for the 2002 and 2004 data analysis.
Averages values were used for both chemical profiles of the lake.
Figure 2 presents the PCA variables and observations. Regarding variables
(Fig. 2a), bicarbonates are well correlated with electrical conductivity and are
negatively correlated with potassium and sulphate. These variables outline a first
axis on Factor 1 of surface water infiltration: potassium represents a shallow water
origin, potassium being stored mainly in plants and partially leached during the
decomposition of organic matter (Chaudhuri et al. 2007). Another origin is the
human activity as manure application on calcareous soils (Griffioen 2001; Charlier
et al. 2012). Bicarbonates are in turn essentially acquired during the interaction
between the soil and the epikarst. On axis 2 Magnesium is anti-correlated to chlo-
rides, nitrates and sodium. All of them are independent tracers defined by axis 1.
Magnesium is a residence time tracer of carbonate reservoirs. He opposes anthro-
pogenic markers that characterise superficial waters. Epikarst springs display high
bicarbonates values and high electrical conductivity, while lake waters are char-
acterised by high values of chloride, sodium and nitrates.
Regarding PCA observations, Fig. 2b shows the distribution of sampling points
around these four poles. Points representative of the saturated zone are located in
the galleries, on the right and left sides of the dam, as well as some central drains
of the perimeter gallery. The springs ‘source de la Vierge’ and ‘source de la Route’
are draining epikarst waters. Surface waters are grouped around the lake waters
and are found in some of the drains of the perimeter gallery. Infiltration of surface
water can be found in the drains of the right side and in the perimeter gallery.
Fig. 2 Principal component analysis of the samples taken into the abutments and the drains of
the dam and the lake. a Diagram variables. b Diagram of individuals (°1: June 2002 campaign, 1:
March 2004 campaign)
In Situ Study of Hydrochemical Response … 185

3.1.2 Seasonal Effect
DFA enables displaying, analyzing and above all predicting, using a set of
standardised variable set, belonging to a group of individuals to predefined groups.
It intends to compare, within a statistical population separated in a priori separated
groups, intergroup variance to intragroup variance. In the framework of our study,
75 samples have been dispatched into principal and supplementary individuals. In
order to have equally weighted belonging groups, only four principal individuals
have been defined in each pole (Mudry 1991). The 59 other samples have been
declared as supplementary, with the aim of classifying them into the different poles
(Group 1 infiltration water; group 2: saturated zone water, group 3: surface water,
group 4: epikarstic water), according to the hydrological season (Table 1) The
supplementary individuals which have been assigned are mainly situated in the
perimeter gallery (points 12–29). In a general way, points declared in the ‘epi-
karstic water’ group have be reassigned either in the ‘infiltration water’ or ‘shal-
low water’ groups for the winter samples, which indicates inflows from different
origins and transfer time, with respect to seasons. For any other point, there is no
assignment.
The variable diagram (Fig. 3a) displays an opposition along axis 2 between a
groundwater pole (Mg) and a surface water one (Na, Cl and NO3). Along axis 1,
infiltration pole is opposed to epikarst one. Individuals are classified according to
these poles (Fig. 3b), with a very noticeable dispersion around the pole for the
points ‘supp./epikarst’, ‘supp./infiltration superficial water’ and part of points
‘supp./saturated zone water’, which expresses influence of the other poles. DFA
evidences mixtures between various poles. Epikarst pole is the lowest classified
one, because bicarbonates are present in each pole.
Table 1 Assignment of sup-
plementary elements with
respect to hydrological sea-
son (low water to high water
periods)
Point Group
3 3 ? 1
6 2 ? 4
12 4 ? 3
13 4 ? 3
15 4 ? 1
19 4 ? 1
21 1 ? 4
22 1 ? 3
25 3 ? 4
26 4 ? 1
29 1 ? 2
Group 1 infiltration water; group 2 saturated zone water, group 3
shallow water, group 4 epikarstic water
186 C. Bertrand et al.

3.2 Hydrodynamic Behaviours
The correlation between concentrations of chloride versus magnesium is used to
distinguish three groups of drains according to their flow type (Fig. 4):
• drains that are directly influenced by the lake (chloride concentrations above
3.8 mg/L, and magnesium concentrations below 5 mg/L). These drains are
characterised by circulation of water from the lake, with short residence time;
• drains that are influenced by water of the saturated zone (chloride concentra-
tions below 2 mg/L, and magnesium concentrations above 17 mg/L), which are
typical of groundwater circulation with a long residence time;
• drains that have chloride and magnesium concentrations in between the pre-
vious values, which correspond to water mixtures between lake and ground-
water along the drains.
4 Effect of Lake Level Variation
Both in winter and in summer, we differentiate three cases in this area:
• drains directly influenced by rapid transit of the lake;
• drains directly influenced by a slow water transit from deep reservoir, bearing
the signature of water-rock carbonate interactions with a long residence time;
• drains influenced by mixing between lake and deep reservoir waters.
Fig. 3 Discriminant analysis (DFA) of the samples taken into the abutments and the drains of the
dam and the lake. a Diagram of variables. b Diagram of individuals (°1: June 2002 campaign, 1:
March 2004 campaign). N = 4*4, 59 supplementary elements
In Situ Study of Hydrochemical Response … 187

In summer (Fig. 5a), only five drains are influenced by rapid transit of the lake
waters. In this season, the area of influence of the rapid transit of the lake waters
affects mainly drains upstream of the dam, and the closest one. The mixing zone
between lake water and groundwater is close to the foot of the arch dam. Only
drains beneath the stilling basin are not influenced by the lake. In winter (Fig. 5b),
the area of influence of the rapid transit of the lake extends to drains a little more
distant than the previous one, but still very close to the foot of the arch. Then the
waters of the lake are mixed in the deep aquifer, and only drains beneath the
stilling basin are not influenced by the lake (similar to winter results).
So the difference between winter and summer hydrodynamic behaviour comes
from the downstream propagation of the influence zone of lake waters. When the
reservoir is full and the dam is cold (high water period), arch moves downstream
and the ‘crack open’, spreading the lake water in the basin.
Fig. 4 Correlation between chloride and magnesium contents (mg/L) of samples taken into the
abutments and the drains of the dam and the lake
188 C. Bertrand et al.

5 Conclusion
This hydrochemical investigation enables defining water typologies in a lowly
contrasted environment, due to the common carbonated context, and providing a
conceptual model of water fluxes within the dam.
Tracers highlighted by CPA and DFA enable to classify water types previously
described in three groups: (i) recent waters, with a short residence time (dam
reservoir water), (ii) ‘old’ waters, with a large residence time (deep groundwater)
and (iii) intermediate waters, originating from mixtures between both components.
Water infiltrations in the Vouglans dam’s abutments originate predominantly from
the lake upstream of the dam. On both banks, the shallowest perched groundwa-
ters, especially the saturated layers situated between 395 and 410 m a.s.l. right
bank are partly recharged by surface infiltrations, and partly from the lake leak-
ages. Deeper groundwaters, and groundwater of the bottom of the valley are
Fig. 5 Identification of drains sensitive to the zone of influence of lake waters. a Low water
period (June 2002); b High water period (March 2004), c cross section of the dam and
localization of a part of drain network
In Situ Study of Hydrochemical Response … 189
recharged only by the lake or by underground inflows from the perched ground-
waters. Hydraulic circulations through the foundations are well characterised. The
significant seasonal effect observed at the wall footer or the designation of drains
‘intercepting the upstream fissure in any season’ or ‘only cold arch /full reservoir’
is made possible by hydrochemical measurements.
Acknowledgments This work was financed by EDF. We gratefully acknowledge G. Castanier
(Service Géologie Géotechnique DIN/CEIDRE—Département TEGG Aix en Provence Cedex).
References
Charlier JB, Bertrand C, Mudry J (2012) Conceptual hydrogeological model of flow and transport
of dissolved organic carbon in a small Jura karst system. J Hydrol 460–461:52–64. doi:10.
1016/j.jhydrol.2012.06.043
Chaudhuri S, Clauer N, Semhi K (2007) Plant decay as a major control of river dissolved
potassium: a first estimate. Chem Geol 243:178–190
De Waele J (2008) Interaction between a dam site and karst springs: The case of Supramonte
(Central-East Sardinia, Italy). Eng Geol 99:128–137
Griffioen J (2001) Potassium adsorption ratios as an indicator for the fate of agricultural
potassium in groundwater. J Hydrol 254:244–254
Käss W (1998) Tracing techniques in hydrogeology. A.A. Balkema, Rotterdam, p 518
Kendall C, McDonnell JJ (eds) (1998) Isotope tracers in catchment hydrology. Elsevier Science
B.V., Amsterdam, 839p
Milanovic P (2002) The environmental impacts of human activities and engineering constructions
in karst regions. Episodes 25(1):13–21
Milanovic P (2004) Water resources engineering in karst. CRC Press, Boca Raton, p 328
Mudry J (1991) L’analyse discriminante, un puissant moyen de validation des hypothèses
hydrogéologiques. Revue des Sciences de l’Eau (Québec - Paris) 4:19–37
Mudry J, Andreo B, Charmoille A, Liñan C, Carrasco F (2008) Some applications of geochemical
and isotopic techniques to hydrogeology of the caves after research in two sites (Nerja cave-S
Spain, and Fourbanne spring system-French Jura) internat. J Speleo 37(1):67–74
Parkhurst DL, Appelo CAJ (1999) User’s guide to PHREEQC (version 2), a computer program
for speciation batch reaction, one dimensional transport and inverse geochemical calculations.
Water resources research investigations report 99-4259, 321p
Plata Bedmar A, Araguas Araguas L (2002) Detection and prevention of leaks from dams. A.A.
Balkema Publishers, Rotterdam, p 419
Silar J (1988) Can water losses from reservoirs in karst be predicted? In: Yuan D (ed)
Proceedings of the international association of hydrogeologists, vol 2. IAHS Publication No.
176, Wallingford, pp 1148–1152
190 C. Bertrand et al.

383Hydrochemical Approach of MechanicalDegradation of the Séchilienne Unstable Slope
C. Bertrand, A. Vallet, and J. Mudry
Abstract
Water chemistry is a very fine signal which allows fine location in time and space of the arrival
of infiltration water inducing mechanical instability pulses of the landslide. This tool is
designed to understand the complex relationship between chemical weathering, hydrome-
chanical changes and weakening/motion of the unstable rock slope. For this purpose, a
hydrogeochemical groundwater monitoring has been established since 2010 on the site of
Séchilienne (France). Electrical conductivity is representative of the chemical signal generated
by the degradation of the massif. The continuous measurement of this parameter is relevant to
the site of Séchilienne and can replace chemical monitoring. The benefit of acquiring this data
is threefold: real-time measurements, with a short time step, and inexpensive implementation
work, enabling to use it as a tool for risk management.
Keywords
Groundwater monitoring Electrical conductivity Water chemistry Risk management
383.1 Introduction
Water chemistry is a very acute signal which allows fine
location in time and space of the arrival of infiltration water
inducing mechanical instability pulses of the landslide.
Chemical measurements have been performed on several
unstable slopes. For example, Binet (2006), Binet et al.
(2009) showed that the measurement of sulfate concentra-
tions allowed locating in time and space the arrival of
infiltration water inducing mechanical instability pulses of
the La Clapière landslide (Southern Alps). In this case, the
measurement of sulfate concentrations therefore meets the
criteria of an observable in a measurement observatory.
Nevertheless, there arises the problem of continuous acqui-
sition of this parameter or any other chemical parameter
correlated to the mechanisms that control the gravitational
movements. Indeed, at present, there is no device that allows
a continuous acquisition of chemical parameters, with good
selectivity and good resolution. On the other side, it is
possible to make indirect measurements, which is that of
electrical conductivity of water, easily measured continu-
ously. Indeed, the electrical conductivity is related to min-
eralization of water, above all major elements. It is necessary
to correlate electrical conductivity with the major ion con-
centrations. If we do not currently have a sufficient chronicle
of physical-chemical data at La Clapière (conductivity,
temperature, pH and major ion concentrations) this is not the
case for Séchilienne (Northern Alps) where all these
parameters are monitored continuously for electrical con-
ductivity, and measured with a 4-day time step for chemistry
since 2010. In this context, it is proposed to define chemical
observables that meet this goal by using chronicles of
physical-chemical data in three points of the recharge area.
The aim is to better understand the role of chemical
weathering of the rock and its effects, and to use this alter-
ation as a marker of unstable slope destabilization.C. Bertrand (&) A. Vallet J. Mudry
OSU-THETA—UMR6249 Chrono-Environnement,
CNRS—Université de Franche-Comté, 16 route de Gray,
25030 Besançon cedex, France
e-mail: [email protected]
G. Lollino et al. (eds.), Engineering Geology for Society and Territory – Volume 2,
DOI: 10.1007/978-3-319-09057-3_383, © Springer International Publishing Switzerland 2015
2137

383.2 Background and Method
383.2.1 Network Monitoringand Hydrochemical Survey
The selection of the monitoring network is based on a tracer
test conducted in 2002 by the University of Franche-Comté.
Despite the field constraints (strongly anthropized catchment
area to the East of the instability, and lack of active springs
on the unstable slope), two points were identified. They
seem to better frame the flow mechanisms of the Séchili-
enne’s slope aquifer, which hydrodynamic behavior influ-
ences destabilization (Fig. 383.1).
These are Fonafrey spring (FON) and a water outlet
issuing from a fissure in the survey gallery (G710) for which
instrumentation was implemented (Vallet 2012). The other
outlets are monitored periodically, with a three-month
sampling rhythm. An autosampler (major cations and
anions), a OTT probe (temperature, pressure, conductivity),
a weir-gauge (flow) were installed in each of these three
points. The measurements are made on short time-steps (4
days for the water sampler, 5–30 min for probes), that can be
modified to fit the aquifer recharge conditions. At each field
campaign (every 3 months), a sampling of all springs is
performed, and water chemistry is analyzed. The measured
parameters are temperature, electrical conductivity, pH and
major cations and anions. During these campaigns, bicar-
bonate ions are also analyzed in the laboratory within 48 h
after water samples collection. The specific electrical con-
ductivity measurements, carried out on the three points, are
used to check the validity of the continuous measurements,
and to recalibrate them if needed. The displacement of the
unstable slope is also monitored by measurement stations
based on different technologies (gauges, radar, infrared, in-
clinometers and GPS). These stations are located throughout
the slope, and data collection is continuous.
383.3 Results
383.3.1 Relationship Chemistry-ElectricalConductivity
Electrical conductivity reflects water mineralization.
A multiple linear regression was performed to determine the
major ions that contribute mostly to the water mineralization,
and then to changes in the electrical conductivity. In the case
of the G710, electrical conductivity is correlated with SO4
(0.844), Ca (0.731) and Mg 0.709). Temporal variations in
electrical conductivity clearly represent the concentrations of
sulfates. The multiple linear regression was performed with
the chemical data of the 15-point campaigns, spread over 3
years. The coefficients of determination are significant for
sulfate (R2 = 0.712) and to a lesser extent for calcium (R2 =
0.534) and magnesium (R2 = 0.503).
383.3.2 Relationship Chemistry-Precipitations
Figure 383.2 shows sulfate concentrations versus time, in
G710 and FON waters. In this graph, the effective rainfall is
also represented as a function of time. The available soil
water storage capacity used for calculating effective rainfall
is 105 mm (Vallet et al. 2014).
Sulfate concentrations vary seasonally. Concentrations
decrease in the rainy season and increases during the dry
season (e.g. April–August 2011). This trend is more pro-
nounced for sulfate concentrations resulting from FON.
FON drains rapidly water circulating in fault zones. The
medium is very reactive, and chemistry is influenced by
dilution (high water period) and water-rock interaction (low
water period). The unstable slope in turn is recharged by a
large area, although the contribution of remote flows seems
minor compared to local infiltration. The G710 drains a rapid
Fig. 383.1 Site map and
monitoring network: green circle
continuous monitoring: black
circle: ponctual monitoring
2138 C. Bertrand et al.

water flow through fault zones (Vallet 2012; Bertrand et al.
2013). In this area, sulfate concentration can be explained by
the groundwater flowing in widely open and transmissive
with constant opening and closing of fissures, which modify
water-rock interactions. Water chemistry is characterized by
a more or less rapid circulation, explaining the seasonal
variations and the water-rock interaction with a destructured
environment, explaining the increasing concentration trend
of chemical elements.
383.3.3 Relationship Chemistry-Degradationof the Massif
If sulfate concentrations measured at FON are influenced by
recharge, and the concentrations of the same ion are
increasingly influenced by the water-rock interaction in the
output point in G710. Then the difference between both
signals reflects the influence of rock weathering only.
The displacement signal is correlated to the sulfate signal:
each increase in displacement corresponds to an increase in
sulfate concentration, which follows a synchronous lowering
of both parameters (Fig. 383.3).
During the low activity period of the massif, sulfates
decrease with time. During the reactivation of the massif,
sulfate concentrations increase, and then decrease again.
These sulfate concentration changes are explained by their
origin, namely the alteration of pyrite mineral that oxidizes
in the atmospheric redox conditions. The oxidation of pyrite
creates a “protective” surface which slows down alteration,
resulting in a decrease in sulfate concentrations in water at
constant pyrite surface. Upon reactivation of the movement,
two phenomena may occur: (i) the movement creates new
fissures in the massif, providing new surfaces for pyrite
alteration; (ii) the movement creates crushed zones con-
taining oxidized pyrite which shatter into smaller minerals
but featuring fresh surfaces to weathering.
383.4 Conductivity as Reliable ObservableData of Unstable Slope
Electrical conductivity measured in the gallery G710 is
correlated with calcium, magnesium and sulfate. The tem-
poral variations of these ion concentrations are dependent on
two main factors: (i) water circulation in permeable media,
that promotes direct infiltration and chemical water–rock
interaction; (ii) degradation of the unstable slope. Never-
theless, there arises the problem of continuous acquisition of
this parameter, or any other chemical parameter correlated to
the mechanisms that control the gravity movements. Indeed,
at present, there is no device that allows a continuous
acquisition with good selectivity and good resolution of
chemical parameters. By against, it is possible to make an
indirect measurement, which is that of the electrical con-
ductivity of water, easily measured on a continuous base.
Indeed, the electrical conductivity is correlated to major
element mineralization. Figure 383.4 shows the temporal
0
200
400
août-10 févr.-11 août-11 févr.-12 août-12 févr.-13 août-13
[SO
4]
(mg
/L) FON G710
0
20
40
60
Eff
ecti
ve
ra
infa
ll (
mm
)Fig. 383.2 Effective rainfall and
seasonal variations in sulfate
concentrations (mg/l) from
gallery G710 and FON waters
100
200
300
août-10 février-11 août-11 février-12 août-12 février-13 août-13
[SO
4(G
71
0)]
-[S
O4
(FO
N]
(mg
/L)
0
5
10
15
20
Sp
eed
(m
m/d
ay)Fig. 383.3 Difference in the
measured sulfate concentrations
in G710, and FON (G710-FON:
red curve). Displacement
measured at extensometer A13
(black curve)
383 Hydrochemical Approach of Mechanical Degradation 2139

variation of the measured electrical conductivity in gallery
G710, and simultaneously the time variation of displacement
measured by the extensometer A13. The synchronous
effective rainfall, conductivity and displacement peaks are
distinguished by the red areas (Fig. 383.4).
The conductivity and displacement curves display the
same shape, namely an increase in conductivity during an
unstable slope event, and a decrease when the slope is not
reactive. The maximum conductivity peaks and maximum
displacement peaks are not synchronous, the latter being
always subsequent. The lack of electrical conductivity data
for the period July–October 2012 cannot enable estimating a
reliably delta. The delta between other peaks range between
16 and 25 days during the period September–January
2010–April 2012, and between 4 and 8 days beyond this
period. This decrease in delta is due to the fact that from
October 2012, the reactivity of the unstable slope accelerated
to a climax in December 7, 2012. This behavior results in a
sharp increase in the electrical conductivity, reaching a value
of 945 μS/cm in November 26, 2012, which is the highest
value of the recording from September 2010, with a 11-day
shift between both signals.
Thereafter, the conductivity signal stabilizes around an
average value of 730 µS/cm, which represents by against the
lowest value recorded since monitoring began. This can be
explained by the fact that the strong displacement activity in
December 2012 has sufficiently damaged the unstable slope
to change the hydrodynamic conditions of the environment;
it’s as if the medium was more interconnected, thus
increasing the drainage around the faulted network sur-
rounding the gallery point. Unfortunately we have no flow
measurements which could confirm this hypothesis.
383.5 Conclusion
Water chemistry is a very acute signal which allows location
in time and space of the arrival of infiltration water inducing
mechanical instability pulses of the landslide.
Chemical monitoring implemented in Séchilienne
allowed to connect chemical signal, including sulfate con-
centrations, to deformation. The measured conductivity is
mainly explained by sulfate concentration.
Nevertheless, there arises the problem of continuous acqui-
sition of this parameter or any other chemical parameter cor-
related to the mechanisms that lead gravitational movements.
Indeed, at present, there is no device allowing a continuous
acquisition of chemical parameters with good resolution.
The electrical conductivity is representative of the
chemical signal generated by the degradation of the massif.
The continuous acquisition of this parameter is relevant to
the site of Séchilienne and can replace chemical monitoring.
The benefit of acquiring this data is threefold: (i) real-time
measurements, with a short time step; (ii) inexpensive
implementation work; (iii) enabling to use it as a tool for risk
management.
In the framework of the Unstable Slope Movement
Observatory (OMIV), Chrono-Environment pursues acquir-
ing long-term field measurements in the Séchilienne site.
References
Bertrand C, Marc V Vallet A, Mudry J, Schmitt AD (2013) Apport de
l’hydrogéochimie pour la caractérisation des mouvements gravi-
taires Journées de Aléas Gravitaires, Grenoble
0
20
40
60
Eff
ec
tiv
e r
ain
fall (
mm
)
0
5
10
15
20
août-10 févr.-11 août-11 févr.-12 août-12 févr.-13 août-13
Sp
ee
d (
mm
/da
y)
600
800
1000
août-10 févr.-11 août-11 févr.-12 août-12 févr.-13 août-13
Ele
ctr
ica
l c
on
du
cti
vit
y
(µS
/cm
)
Fig. 383.4 Temporal variations
of effective rainfall, electrical
conductivity measured in the
gallery and displacement
measured by extensometer A13
2140 C. Bertrand et al.

Binet S (2006) L’hydrochimie, marqueur de l’évolution à long terme
des versants montagneux fracturés vers les grands mouvements de
terrain. Thèse de l’Université de Franche-Comté, p 214
Binet S, Spadini L, Bertrand C, Guglielmi Y, Mudry J, Scavia C (2009)
Variability of groundwater sulfate concentration in fractured rock
slope: a tool ti identify active unstable areas. Hydrol Earth Syst Sci
13:2315–2327
Vallet A (2012) Synthèse des deux premières années de thèse présentée
devant le comité de pilotage
Vallet A, Bertrand C, Fabbri O, Mudry J (2014) A new method to
compute the groundwater recharge for the study of rainfall-triggered
deep-seated landslides—application to the Séchilienne unstable
slope (western Alps). Hydrol Earth Syst Sci Discuss 11:6343–6403.
doi:10.5194/hessd-11-6343-2014
383 Hydrochemical Approach of Mechanical Degradation 2141
Copyright © 2022 FDOKUMEN