Appraisal of WaSH (Water-Sanitation-Hygiene) Infrastructure ...
22
1 ISEIS Journal of Environmental Informatics Journal of Environmental Informatics 35(1) 1-22 (2020) www.iseis.org/jei Appraisal of WaSH (Water-Sanitation-Hygiene) Infrastructure using a Composite Index, Spatial Algorithms and Sociodemographic Correlates in Rural India S. Chaudhuri 1 * , M. Roy 1 , and A. Jain 2 1 Center for Environment, Sustainability and Human Development Jindal School of Liberal Arts and Humanities, O.P. Jindal Global University, Sonipat, Haryana 131001, INDIA 2 Jindal Global Business School, O.P. Jindal Global University Sonipat, Haryana 131001, INDIA Received 23 January 2017; revised 01 November 2017; accepted 16 November 2017; published online 21 October 2018 ABSTRACT. Rationale: A great wealth of studies expound on the impact of water and sanitation facilities on sustainable human development. But even though water-sanitation nexus is acknowledged in WaSH (Water-Sanitation-Hygiene) literature, they are seldom assessed collectively. In rural India, open defecation is still a major threat to human health, as much as potable water quality. Unfortunately, no study yet exists that attempts to assess the WaSH sector in a holistic sense. Objective: Present study was aimed to integrate multiple WaSH parameters into a composite WaSH Quality Index (WaSHQI) for rural India, within a geospatial framework, and understand potential effects of different sociodemographic factors that are likely to influece WaSH profile development. Methods: District-wise data for (i) within-premises latrine facility, (ii) water source type (safe/treated tap), (iii) water source location (near home/away from home), and (iv) wastewater drainage (closed/open) were mapped at nationwide scale. Gini Coefficients were computed for each parameter to elucidate spatial inequality. The parameters were integrated in various combinations to compute a composite index for each district called, WaSHQI. In the process, four hypothetical scenarios were generated (grading from most conservative to most liberal). The WaSHQI was later (a) merged with spatial algorithms (Mor an’s I and LISA) ) to identify WaSH-hotspots and (b) correlated with a range of sociodemographic factors (e.g., literacy, household density, caste). Results: Under a conservative aproach (presumably the most hygienic WaSH scenario), a vast expanse through central India were significantly (p < 0.001) lagging in multiple WaSH facilities and appeared as major hotspots that deserve urgent management actions. On the other hand, northwestern states (Punjab and Haryana) registered a better WaSH profile owing to a number of progressive social reforms. Significant (p < 0.01) correlations between the WaSHQI and literacy levels, especially that of female, in the hotspots called for more in-depth region-specific investigations in future. Rural WaSH sector in India is marked by intense spatial inequality/heterogeneity, calling for spatially-optimized interventions. Using multiple geospatial alrorithms and statistical analyses the study demonstrated the spatially interconnected nature of the WaSH and argued that policy decisions have to address the parameters collectively. Future Implications: WaSHQI can offer the decision-makers a semi-quantitative approximation of overall WaSH infrastructural inadequacy at any level of administrative hierarchy anywhere in the world. However, some efforts to exapand/diversify the potentials WaSHQI (accounting for additional socioeconomic parameters) could be pursued on the premise of developing a WaSH informatics system to track regional progress/lag over time. Keywords: WaSH quality index, LISA, Moran’s I, Gini coefficient, open defecation, wastewater drainage, literacy 1. Introduction Ensuring adequate supply of safe potable Water, access to basic Sanitation, that leads to public health and Hygiene (WaSH) form the crux of sustainable human development paradigms around the world (Schwemlien et al., 2016). In re- cent times, appraisal of WaSH facilities has emerged as a critical concern to the government, owing to myriad issues over water-borne diseases ensuing from lack of appropriate WaSH facilities, especially in middle- and low-income coun- * Corresponding author. Tel.: +91-8697012078; fax: +91-8396907477. E-mail address: [email protected] (S. Chaudhuri). ISSN: 1726-2135 print/1684-8799 online © 2020 ISEIS All rights reserved. doi:10.3808/jei.201800398 tries (Fewtrell and Colford, 2005; Yates et al., 2015). In India, poor/inadequate WaSH infrastructure, and associated unhy- gienic practices, not only accentuate human health hazards (diarrhea, dysentery etc.) but affect overall social dynamics, especially in rural areas (Mara et al., 2010). After 25 years of global monitoring (1990 ~ 2015) of WaSH performance by the Joint Monitoring Program (JMP), established by the WHO-UNICEF as part of the Millennium Development Goal (MDG), it might plague the decision- makers to realize that still about 800 million people do not have ‘at-home’ water sources; 2.4 billion people (37% of global population) lack access to improved sanitation facilities, with about one billion (15% of global population) practicing open defecation (WHO-UNICEF, 2015). Majority of the latter population resides in South- and Southeast Asian countries.
-
Upload
khangminh22 -
Category
Documents
-
view
0 -
download
0
Transcript of Appraisal of WaSH (Water-Sanitation-Hygiene) Infrastructure ...

1
ISEIS Journal of
Environmental
Informatics
Journal of Environmental Informatics 35(1) 1-22 (2020)
www.iseis.org/jei
Appraisal of WaSH (Water-Sanitation-Hygiene) Infrastructure using a Composite Index,
Spatial Algorithms and Sociodemographic Correlates in Rural India
S. Chaudhuri 1 *, M. Roy1, and A. Jain2
1Center for Environment, Sustainability and Human Development Jindal School of Liberal Arts and Humanities, O.P. Jindal Global University,
Sonipat, Haryana 131001, INDIA
2 Jindal Global Business School, O.P. Jindal Global University Sonipat, Haryana 131001, INDIA
Received 23 January 2017; revised 01 November 2017; accepted 16 November 2017; published online 21 October 2018
ABSTRACT. Rationale: A great wealth of studies expound on the impact of water and sanitation facilities on sustainable human
development. But even though water-sanitation nexus is acknowledged in WaSH (Water-Sanitation-Hygiene) literature, they are
seldom assessed collectively. In rural India, open defecation is still a major threat to human health, as much as potable water quality.
Unfortunately, no study yet exists that attempts to assess the WaSH sector in a holistic sense. Objective: Present study was aimed to
integrate multiple WaSH parameters into a composite WaSH Quality Index (WaSHQI) for rural India, within a geospatial framework, and
understand potential effects of different sociodemographic factors that are likely to influece WaSH profile development. Methods:
District-wise data for (i) within-premises latrine facility, (ii) water source type (safe/treated tap), (iii) water source location (near
home/away from home), and (iv) wastewater drainage (closed/open) were mapped at nationwide scale. Gini Coefficients were
computed for each parameter to elucidate spatial inequality. The parameters were integrated in various combinations to compute a
composite index for each district called, WaSHQI. In the process, four hypothetical scenarios were generated (grading from most
conservative to most liberal). The WaSHQI was later (a) merged with spatial algorithms (Moran’s I and LISA) ) to identify
WaSH-hotspots and (b) correlated with a range of sociodemographic factors (e.g., literacy, household density, caste). Results: Under a
conservative aproach (presumably the most hygienic WaSH scenario), a vast expanse through central India were significantly (p <
0.001) lagging in multiple WaSH facilities and appeared as major hotspots that deserve urgent management actions. On the other hand,
northwestern states (Punjab and Haryana) registered a better WaSH profile owing to a number of progressive social reforms.
Significant (p < 0.01) correlations between the WaSHQI and literacy levels, especially that of female, in the hotspots called for more
in-depth region-specific investigations in future. Rural WaSH sector in India is marked by intense spatial inequality/heterogeneity,
calling for spatially-optimized interventions. Using multiple geospatial alrorithms and statistical analyses the study demonstrated the
spatially interconnected nature of the WaSH and argued that policy decisions have to address the parameters collectively. Future
Implications: WaSHQI can offer the decision-makers a semi-quantitative approximation of overall WaSH infrastructural inadequacy at
any level of administrative hierarchy anywhere in the world. However, some efforts to exapand/diversify the potentials WaSHQI
(accounting for additional socioeconomic parameters) could be pursued on the premise of developing a WaSH informatics system to
track regional progress/lag over time.
Keywords: WaSH quality index, LISA, Moran’s I, Gini coefficient, open defecation, wastewater drainage, literacy
1. Introduction
Ensuring adequate supply of safe potable Water, access to
basic Sanitation, that leads to public health and Hygiene
(WaSH) form the crux of sustainable human development
paradigms around the world (Schwemlien et al., 2016). In re-
cent times, appraisal of WaSH facilities has emerged as a
critical concern to the government, owing to myriad issues
over water-borne diseases ensuing from lack of appropriate
WaSH facilities, especially in middle- and low-income coun-
* Corresponding author. Tel.: +91-8697012078; fax: +91-8396907477.
E-mail address: [email protected] (S. Chaudhuri).
ISSN: 1726-2135 print/1684-8799 online
© 2020 ISEIS All rights reserved. doi:10.3808/jei.201800398
tries (Fewtrell and Colford, 2005; Yates et al., 2015). In India,
poor/inadequate WaSH infrastructure, and associated unhy-
gienic practices, not only accentuate human health hazards
(diarrhea, dysentery etc.) but affect overall social dynamics,
especially in rural areas (Mara et al., 2010).
After 25 years of global monitoring (1990 ~ 2015) of
WaSH performance by the Joint Monitoring Program (JMP),
established by the WHO-UNICEF as part of the Millennium
Development Goal (MDG), it might plague the decision-
makers to realize that still about 800 million people do not
have ‘at-home’ water sources; 2.4 billion people (37% of
global population) lack access to improved sanitation facilities,
with about one billion (15% of global population) practicing
open defecation (WHO-UNICEF, 2015). Majority of the latter
population resides in South- and Southeast Asian countries.

S. Chaudhuri et al. / Journal of Environmental Informatics 35(1) 1-22 (2020)
2
Appallingly, India claims the lion’s share of the same: 66% of
the global population practicing open defecation, among
which 90% live in the rural areas (Routray et al., 2015). India
hosts the highest density of open defecators in the world,
twice the global average (Coffey et al., 2014) which aggra-
vates shallow groundwater quality, water distribution net-
works, and soil systems, which in turn undermines public
health system (Patil et al., 2014).
In the current era of the UN’s Sustainable Development
Goals (2015 ~ 2030), a daunting task is to gage progress to-
wards the global WaSH target under SDG 6: improved water
and sanitation for all by 2030. In rural India, importance of
basic sanitation facilities and safe potable water on sustain-
able human development is yet to be fully realized by
Chaudhuri and Roy, (2017a). The JMP estimates indicated
that only about 30% of the Indian rural populace enjoy access
to improved sanitation facilities. Rampant open defecation
practices in rural areas lead to numerous diseases (Clasen et
al., 2014; O’Rielly and Louis, 2014), including diarrhea (Kumar
and Das, 2014) and stunting (Spears et al., 2013) among
children. Lack of appropriate WaSH facilities has also been
linked to morbidity as well as mortality (Shakya et al., 2015).
India hosts the largest global tally of diarrheal deaths for
children less than 5 years of age (Patil et al., 2014). The above
observations call for a nationwide WaSH informatics system,
to continuously monitor, develop, revise and implement well-
informed policy measures in regions lacking WaSH infras-
tructural facilities as well as identify regions (hotspots) that
would require in-depth studies in future to identify major
challenges therein.
An interesting trait of the studies made in WaSH sector in
India is that, they approached issues of water and sanitation
Table 1. State-wise Number of Districts, Villages, Rural Households and Rural Population as % of State Population in India
State/UT* No. of Districts No. of Villages No. of Rural Households Rural Population (% of
Total State Population)
Jammu & Kashmir (J&K) 22 6337 1,553,433 73
Himachal Pradesh (HP) 12 17,882 1,312,510 90
Punjab (PN) 21 12,168 3,358,113 63
Chandigarh* 1 5 7,140 3
Uttarakhand (UK) 13 15,745 1,425,086 70
Haryana (HR) 21 6,642 3,043,756 65
NCT of Delhi* 9 103 79,574 2
Rajasthan (RJ) 33 43,264 9,494,903 75
Uttar Pradesh (UP) 72 97,814 25,685,942 78
Bihar (BR) 38 39,073 16,862,940 89
Sikkim (SK) 4 425 93,288 75
Arunachal Pradesh (AR) 16 5,258 200,210 77
Nagaland (NG) 11 1,400 277,491 71
Manipur (MN) 9 2,515 385,520 71
Mizoram (MZ) 8 704 105,812 48
Tripura (TR) 4 863 616,582 74
Meghalaya (MG) 7 6,459 430,573 80
Assam (AS) 27 25,372 5,420,877 86
West Bengal (WB) 19 37,469 13,813,165 68
Jharkhand (JH) 24 29,492 4,729,369 76
Odisha (OR) 30 47,675 8,089,987 83
Chhattisgarh (CG) 27 19,567 4,365,568 77
Madhya Pradesh (MP) 50 51,929 11,080,278 72
Gujarat (GJ) 26 17,843 6,773,558 57
Daman & Diu* 2 19 12,744 25
Dadra & Nagar Haveli* 1 65 36,094 53
Maharashtra (MH) 35 40,959 13,214,738 55
Andhra Pradesh (AP) 23 26,286 14,234,387 67
Karnataka (KA) 30 27,397 7,946,657 61
Goa (CA) 2 320 128,208 38
Lakshadweep* 1 6 2,710 22
Kerala (KL) 14 1,017 4,149,641 52
Tamil Nadu (TN) 32 15,049 9,528,495 52
Puducherry* 4 90 95,018 32
Andaman & Nicobar Islands* 3 396 58,530 62
*Union Territories (UT). There are currently 7 UTs in India.
**Letters in the parentheses indicate state acronyms used in the study.

S. Chaudhuri et al. / Journal of Environmental Informatics 35(1) 1-22 (2020)
3
individually, rather than collectively. In other words no study
till date attempted to combine water and sanitation into a
composite measure to assess holistic spatial dimensions of the
problem. An additional issue therein is, majority of the studies
ignored parameters (e.g., wastewater drainage) that should
enjoy equal importance in WaSH policy making. In addition,
majority of the studies were based on survey-based results
over smaller spatial extent (e.g., single village or village clus-
ters) which made the findings rather contextual.
In light of above observations, the present study proposes
to devise a composite WaSH quality Index (WaSHQI), by
integrating multiple parameters to capture nationwide spatial
dimensions in the WaSH infrastructural facilities in rural India
and map them to visualize any recognizable patterns (hetero-
geneity/inequality). Fundamental idea pursued through this
study was to identify the WaSH hotspots (where facilities are
starkly lacking), with statistical significance, to offer the pol-
icy-makers viable means to strategize optimal interventions to
achieve nationwide homogeneity in rural public service
systems. To achieve the goal the study was divided into five
components including (a) thematic mapping of district-wise
percentages (raw data) of rural households having different
attributes for latrine (within premises), potable water (source
type and location), and wastewater drainage (closed or open)
facilities; (b) obtaining a numerical sense for inter- and
intra-state spatial inequality in the above-mentioned parame-
ters (c) assimilating the parameters into a single index
(WaSHQI) to obtain a nationwide overview of the rural WaSH
sector; (d) integrate WaSHQI with various global (Moran’s I)
and local (Local Indicators of Spatial Association) spatial
algorithms to map WaSH infrastructural inadequacies within a
defined window of statistical significance (0.05 < p < 0.001),
and (e) understand likely influences of different sociodemo-
graphic traits (e.g., literacy) on WaSH profile development. A
major impetus to conduct such a study was to explore possi-
bilities to developing a robust WaSH informatics system that
can be a major tool for the policy-makers to track WaSH de-
velopmental trajectory across space and time.
2. Materials and Methods
There are 29 states in India and seven Union Territories.
In 2011, the rural population accounted for about 69% of the
national total (GoI, 2014). In states of Himachal Pradesh,
Bihar, Assam and Odisha, rural population accounted for
about 83% of the states’ total population. According to Census
2011 database, there were over 597,000 villages in India with
over 207,116,576 rural households (Table 1). States of Uttar
Pradesh (UP), Madhya Pradesh (MP), Rajasthan (RJ), Odisha
(OR), Maharashtra (MH), Bihar (BR) and West Bengal (WB)
account for about 51% of the villages in the country. The Pro-
visional Total suggested over 833 million people (~ 70% of
the total population) dwelled in the rural areas in India.
A considerable fraction of the Indian rural demography
comprises of the reserved sections: the Scheduled Caste (SC)
and Scheduled Tribes (ST). By census definition, the SC and
ST represent various “officially designated reserved popula-
tion of historically disadvantaged people”. In modern assess-
ments, they are often deemed untouchables as well and in
some states, labeled as dalits (the oppressed) (Kumar, 1992).
Officially, these reserved sections came into being in the
post-independent era by the Constitution Order of 1950. As
per the census 2011 database, the SCs and STs, respectively,
represent about 16.6% (18.45% in case of rural) and 8.6%
(11.25% for rural) of the total national population (Table 2).
By far, the State of Uttar Pradesh (UP) hosts the highest pop-
ulation of SCs in the country followed by West Bengal (WB),
Bihar (BR), Andhra Pradesh (AP), Tamil Nadu (TN), Maha-
rashtra (MH), Rajasthan (RJ), and Karnataka (KA).
Lack of adequate WaSH infrastructure is a ubiquitous is-
sue throughout India. According to the census estimates, over
69% of rural households in India lacked latrine facilities
within premises in 2011 (Table 2). About 22% rural house-
holds lacked water sources within premises while 63% lacked
wastewater drainage facility.
Present study derived cross-sectional data from the Cen-
sus of India database for 2011 (GoI, 2014). Census data is by
far the most authentic and complete governmental database
listing information from households to village, constitutional
Table 2. State-wise Scheduled Caste and Scheduled Tribe
Population as Percentages of Total Rural Population
State Name % SC % ST
Andhra Pradesh (AP) 19.24 9.28
Arunachal Pradesh (AR) 0.00 74.07
Assam (AS) 6.80 13.67
Bihar (BR) 16.61 1.37
Chhattisgarh (CG) 12.81 36.87
Goa (GA) 1.71 15.88
Gujarat (GJ) 6.57 23.12
Haryana (HR) 22.53 0.00
Himachal Pradesh (HP) 26.01 6.06
Jammu & Kashmir (J&K) 8.24 15.44
Jharkhand (JH) 12.58 31.40
Karnataka (KA) 20.01 9.15
Kerala (KL) 10.41 2.47
Madhya Pradesh (MP) 15.73 27.16
Maharashtra (MH) 12.18 14.63
Manipur (MN) 2.73 45.56
Meghalaya (MG) 0.49 90.11
Mizoram (MZ) 0.06 96.58
Nagaland (NG) 0.00 92.84
Odisha (OR) 17.78 25.72
Punjab (PN) 37.45 0.00
Rajasthan (RJ) 18.51 16.88
Sikkim (SK) 4.45 36.57
Tamil Nadu (TN) 25.45 1.77
Tripura (TR) 16.14 41.20
Uttar Pradesh (UP) 22.97 0.66
Uttarakhand (UK) 21.27 3.76
West Bengal (WB) 27.49 7.81
*Data cited for 29 states of India. **Letters in the parentheses indicate state acronyms used in the study.

S. Chaudhuri et al. / Journal of Environmental Informatics 35(1) 1-22 (2020)
4
blocks, districts and finally the state. To assess the WaSH
Figure 1. Framework of analytical methods followed in the study.
Note: Yellow boxes contain the main spatial/statistical methods used. Corresponding equations in the text are marked in green.

S. Chaudhuri et al. / Journal of Environmental Informatics 35(1) 1-22 (2020)
5
performances, census data were extracted from the Census
database (H-series: Household Amenities) for district-wise
percentages of rural households with (a) within-premises la-
trine facilities, (b) water source types, (c) water source loca-
tions (at-home and near-home), and (d) wastewater drainage
facility (open and closed). The “within-premises latrine fa-
cility” data were also obtained from Census, 2001 database for
temporal assessment. However, this data was only available at
state level.
In addition, information for a number of sociodemo-
graphic attributes were obtained from the Census 2011 data-
base, including district-wise (a) number of rural households
and household densities, (b) Scheduled caste (SC) and Sched-
uled Tribes (ST), as representative of the reserved population,
and (c) literate population (total and female). The SC/ST
groups were considered as a major sociodemographic driver
in the present study owing to their lower literacy (elaborated
in Appendix 2) that leads to lack of environmental awareness
and/or sense of hygiene and thus to inappropriate WaSH prac-
tices that may put the whole village community at risk.
The initial part of the analysis comprised of spatial map-
ping of district-wise household percentages of different WaSH
infrastructural facilities (thematic mapping) (Figure 2, 4 ~ 6).
For each parameter, districts were color-coded on the map
using a roughly 25% interval, to present a visual appraisal of
the existing scenario. The thematic mapping of WaSH param-
eters essentially laid out the foundations to all subsequent
advanced spatial analyses.
Following thematic mapping, Gini coefficients were cal-
culated to estimate spatial inequality in the geographic distri-
bution of different WaSH facilities, using the following equa-
tion (Figure 1):
2 1 1
1
2
n n
j ij iG Y Y
n u − == − (1)
where G = Gini coefficient
n = sample size (number of districts)
u = average value of the study parameter
|Yj – Yi| = absolute value of the difference between districts
Gini coefficient values range between 0 (perfect equality
in WaSH facilities; i.e., no heterogeneity) and 1 (perfect in-
equality; extreme heterogeneity) (Wagstaff et al., 1991), with
following categories for G: < 0.20: good equality; 0.20 ~ 0.30:
fair equality; 0.30 ~ 0.40: reasonable equality; 0.40 ~ 0,50:
high inequality; > 0.50: stark inequality (Fang et al., 2013).
Table 3. Nationwide Gini Coefficient Computed for Different
WaSH Infrastructural Facilities, Considering all Districts in India
Parameter Type Within
Premises
Away From
Premises
Water Source (location) 0.42 0.26
Latrine (location) 0.69 0.38
Closed Open
Wastewater Drainage (type) 0.46 0.31
Safe Treated Tap
Water Source (chemical quality) 0.38 0.62
*Open Defecation is considered as Away From Premises facility. **Higher the Gini value higher the spatially inequality.
Table 4. Nationwide Percentages of Rural Households Have Different Types of Wash Facilities
Latrine: Within-premises (30.74)* Latrine: Away from Premises (69.2)
Flush/Pour flush: 19.43 Public latrine 1.94
• Piped sewer 2.20 Open defecation 67.32
• Septic tank 14.70
• Other 2.53
Pit:
• Slab/Ventilated 8.19
• Without slab/Open pit 2.35
Safe Water Source (82.73)** Within-premises Water Source (77.94)**
Tap: 30.82 At-Home 35.00
• Treated 17.86 Near-Home 42.94
• Untreated 12.96 Away from Home 22.06
Hand pump 43.63
Tube well/Bore well 8.28
Others (river, tank, spring) 17.27
Within-premises Wastewater Drainage Facility (36.76)***
Open 5.75
Closed 31.01
None 63.24
*within-premises latrine facility.
**total safe water source (Tap + Hand Pump + Tube well/Bore well).
***within-premises wastewater drainage facility (Open + Closed); within-premises water source (At-Home + Near-Home); near-home water source indicates water source available with 500 meter of household.

S. Chaudhuri et al. / Journal of Environmental Informatics 35(1) 1-22 (2020)
6
Fundamental idea of computing the Gini coefficient was
to obtain a semiquantitative appraisal of the magnitude of
spatial inequality in WaSH facilities in India, as a whole, as
much as highlighting inter-state differences (how inequal the
states are from each other?). To achieve such dual purpose
Gini Coefficients were calculated in two different ways, by
considering each WaSH parameter:
a) For all the districts taken as a whole for India (re-
sulting in one nationwide Gini coefficient for each
WaSH parameter respectively) (Table 3) and
b) For districts within each state to obtain state-wise
Gini coefficient
While the first approach resulted in a single value for
each WaSH parameter and was used to estimate nationwide
spatial inequality. The latter yielded state-wise values for each
parameter that were appended to state maps to elucidate in-
ter-state inequalities. Such portrayal will help visualizing the
zonal structure of spatial inequality across the nation that may
help the policy makers implement spatially-optimized inter-
ventions to achieve nationwide WaSH homogeneity.
The WaSH Quality Index (WaSHQI) was computed by
considering four WaSH parameters: (1) drinking water source
(‘safe’ and ‘treated tap’); (2) drinking water source location
(‘at-home’ and ‘near-home’); (3) within-premises latrine fa-
cility; (3) wastewater drainage facility (‘open’ and ‘closed’)
using following equations:
( )WaSHQI
n n
n
Q W
W
=
(2)
where Qn = District-wise observed value for each WaSH pa-
rameter
Wn = Weight factor for each WaSH parameter
The weight factor (Wn) for each WaSH parameter was
determined using following equation:
...4n iW K S= (3)
where Wn = Weight factor for each WaSH parameter
K = Proportionality constant
S = Standard value for each WaSH parameter
The weight factor (Wn) for each WaSH parameter varies
directly with corresponding standard value (S) assuming that
higher the ‘S’, the higher the WaSHQI, and ‘better’ the WaSH
infrastructure. For the present purpose, the national total for
each WaSH parameter was taken as its standard value (Table
4). The proportionality constant (K) was derived as follows:
4
1
1
ii
KS
=
=
(4)
The WaSHQI values were scaled between 0 and 100, and
divided into five categories namely, WaSHQI < 20 = Very
Poor; 20 ~ 40 = Poor; 40 ~ 60 = Moderate; 60 ~ 80 = Fair; >
80 = Excellent. For each district, WaSHQI values were gen-
erated for four scenarios, considering various combinations of
subcategories (open/close drainage) of WaSH parameters.
A fundamental premise tested through conceptualization
of WaSHQI was to explore potentials of developing a range of
scenarios, by combining different sub-categories of each
WaSH parameter, grading from Most Conservative (most
ideal) to Most Liberal (somewhat acceptable). For example,
having latrine, water source and closed wastewater drainage
facilities within premises may be regarded as the most desir-
able WaSH scenario (Most Conservative) from health and hy-
giene perspective. Such idealistic accommodations, however,
may be highly demanding based on socioeconomic frame-
work and level of availability of governmental support. Under
the circumstances, the district/village may want to resort to
relatively relaxed accommodations (Liberal Approach). Four
such hypothetical scenarios were computed and presented
cartographically as visual summary of viable WaSH manage-
ment options.
More than often, a major need for the policy-makers is to
have a clear understanding of the underlying spatial structure
(heterogeneity) in the WaSH infrastructure. In other words, if
any statistically significant geographic pattern can be iden-
tified in WaSH facilities which might be used with certain
level of confidence to implement zone-wise management
strategies to optimize resource use. To characterize spatial
heterogeneity in WaSH parameters across the nation, Moran’s
I and Local Indicators of Spatial Association (LISA) were
computed, using district-wise WaSHQI values, which might
aid in smart decision-making by prioritizing zones (cluster of
districts/states) that will require urgent management actions in
days ahead.
Moran’s I was computed using the following equation:
( )( )
( )
1 0
2
1
I
n n
ij i ji j
n
o ii
W x X x Xn
S x X
= =
=
− −=
−
(5)
where n = total number of observations (districts) of WaSHQI
i and j = spatial location of districts with respect to each
other
Wij = spatial weight matrix
So = product sum of the spatial weight matrix
xi = WaSHQI value at location i,
xj = WaSHQI value at location j
X = mean of value x
The product sum of the spatial weight matrix, So was
computed as:
1 1
n n
o iji jS W
= == (6)

S. Chaudhuri et al. / Journal of Environmental Informatics 35(1) 1-22 (2020)
7
Moran’s I is a global indicator of spatial association that
yields a single statistic for the entire area (India as a whole, in
this case) by averaging out the local variations (e.g., dis-
trict-wise WaSHQI variability), which can lead to local ‘non-
stationarity’ phenomena (Anselin, 1995). Moran’s I is essen-
tially an extension of Pearson’s product-moment correlation
coefficient with the numerator representing a covariance func-
tion while the denominator represents the sample variance
(Moran, 1950). Analogous to Pearson’s correlation coefficient,
values of Moran’s I can vary from +1 (strong positive spatial
autocorrelation between the spatial units) to −1 (strong
negative spatial autocorrelation) through 0, which suggest
random pattern between adjacent spatial units (districts) (Ping
et al., 2004). Positive spatial autocorrelation implies that dis-
tricts with high WaSHQI values are contiguous within a
defined neighborhood, while negative spatial autocorrelation
indicates clustering of low WaSHQI values (Chaudhuri et al.,
2012; Chaudhuri and Ale, 2014). A scatterplot was generated
in the process with four quadrants depicting four different
types of spatial autocorrelation between the districts. The
scatterplot was obtained by using Monte-Carlo randomization
allowing for 999 permutations.
Building upon the premise of Moran’s I, Local Indicator
of Spatial Association (LISA) illustrates the spatial autocorre-
lation phenomena with two maps: one depicts the clustering
of (dis)similar WaSHQI districts, while the other yields the
statistical significance associated with each cluster. As the
name suggests, LISA represents local scenario of spatial au-
tocorrelation within a defined neighborhood, using following
equation:
1LISA
n
i ij jiZ W Z
== (7)
where Z = standardized variable of interest
For both Moran’s I and LISA, a first-order queen conti-
guity between the adjoining spatial units was assumed to de-
rive the spatial weight matrix. The spatial weight matrix (Wij)
was row-standardized and, by convention, equaled to zero.
To understand potential influences of various sociodem-
ographic traits on WaSH profile development in rural India,
Spearman Rank correlations were performed between district-
wise WaSHQI values and corresponding sociodemographic
attributes namely, district-wise (a) rural household density, (b)
ratio of general:reserved population (SC + ST), (c) percentages
of total literate population, and (d) percentages of female
literate population. District-wise correlation analyses were
conducted in two ways, (a) entire India and (b) within the
hotspot of WaSH infrastructural inadequacy as identified by
the LISA. Fundamental purpose of including the reserved
population (SC and ST) in the analyses was to obtain a
first-hand clue for the policy-makers if regions (districts/states)
with greater abundance of the same, as compared to general
population, also are the regions challenged by WaSH infra-
structural inadequacy. To best of our knowledge no such at-
tempts have yet been made at nationwide scale in India. Such
assessment may provide useful insights to understanding how
social processes may influence (undermine or support) WaSH
infrastructural development.
Thematic cartography was carried out using the ESRI
ArcGIS software suits. For Moran’s I and LISA, an open-
sourced platform called GeoDa was used. Gini coefficients
and WaSHQI computations were performed on MS Excel and
results were presented graphically (e.g., nationwide Gini co-
efficients) using Grapher v.6, and/or appended to spatial maps
using ArcGIS Spatial Data Join function for visual appraisal.
3. Results and Discussions
3.1. Thematic Mapping
Thematic depiction of latrine facilities revealed (a) an
appalling inadequacy of within-premises latrine facilities in
the rural areas and (b) raging spatial heterogeneity across the
nation (Figure 2). For example, over 300 districts in India
lacked within-premises latrine facilities for more than three-
fourth of their rural households Rajasthan (RJ), Madhya
Pradesh (MP), Uttar Pradesh (UP), Bihar (BR), Jharkhand
(JH), Chhattisgarh (CG), and Odisha (OR). About 200 dis-
tricts had latrine facilities for over half of their rural house-
holds. These relatively “better” districts occurred in three spa-
tial clusters: (a) the north-east region (NER): comprising of
states of Assam (AS), Arunanchal Pradesh (AR), Nagaland
(NG), Manipur (MN), Mizoram (MZ), Tripura (TR) and
Meghalaya (MG); (b) the north-west: comprising the states of
Himachal Pradesh (HP), Uttarakhand (UK), Punjab (PN), and
Figure 2. Nationwide spatial distribution of district-wise
percentages of rural households having latrine facility
within premises.
Note: “HH” = Household. Vide relevant text for state acronyms.

S. Chaudhuri et al. / Journal of Environmental Informatics 35(1) 1-22 (2020)
8
Haryana (HR); and (c) Kerala (KL) in the southern India.
However, a redeeming feature in the rural WaSH sector
was 11% drop, between 2001 and 2011, in households resort-
ing to open defecation (Figure 3a). The improvement came
mostly by rise in abundance of flush/flush pour latrine types
(7% households in 2001 to 19% in 2011). Steepest rises were
noted from states of Jammu and Kashmir (K&K), HP, PN, UK,
HR, Sikkim (SK) and the NER (Figure 3b). On the other hand,
abundance of pit latrines did not improve appreciably: from
10% to 11% over a decade (Figure 3b). Overall, 14 states had
over 50% of rural households with latrine facilities within
premises in 2011 as compared to only about 8 states in 2001
which marked some significant development (Figure 3).
However, for most states, rate of improvement appeared slow.
For example, in JH, CG, BR, UP, and MP, the decadal rise
amounted less than five percentage points.
An apprehension that recently surfaced in rural WaSH
sector is the physical existence of latrines built on govern-
mental enterprises. In other words, corruption at different
levels of local/regional bureaucracy, leading to rampant tam-
pering with governmental records and relevant funds to attain
Open Defecation Free (ODF) status. Several instances were
noted where government-subsidized latrines exist only on
papers as the bureaucrats often tend to falsify official records
and hog the funds for themselves (Tyagi, 2017). Ground-
truthing shot up appalling scenarios. For example, audit report
by the Controller and Auditor General (CAG) of India re-
leased in December 2015 found that 2008 and 2013, govern-
ments of at least 16 states have exaggerated the data by over
190% of the actual constructions (The Hindu, 2016). On
certain occasions, public school grounds have been turned
into open-latrines where hundreds of villagers regularly re-
lieve themselves. This gains added significance in view of
child/infant mortality (Hathi et al., 2017) and stunting (Rah et
al., 2015) in rural India owing to open defecation.
In addition, regular monitoring (and maintenance) of the
government-subsidized latrines to assess/maintain their func-
tional status, is seldom performed. In a nationwide survey
conducted by the Ministry of Drinking Water and Sanitation
in 2012 ~ 2013, about 1.39 crore (30%), out of total 7.41
crore, household toilets in India appeared defunct/dysfunc-
tional (Bansal, 2016). This indicates that, even though latrines
are being built on governmental enterprises, they fall out of
use after a while and villagers effectively revert back to their
original practices (open defecation).
Lack of latrine facilities within premises was, however,
not the only concern to the rural WaSH sector. Assessment of
within-premises wastewater drainage (WWD) facility dis-
tinguished two spatial clusters: (a) the northwestern states
comprising of HR, PN, and parts of UP where > 75% of rural
households had WWD facility within premises, and (b) rest of
India with a grieving lack (Figure 4a). In states of MP, RJ, and
the NER, over half, while in West Bengal (WB), OR, JH and
CG, over 75% of the rural households lacked WWD within
premises. Overall, about 450 districts lacked WWD for over
50% of their rural households.
To add to the grievance, majority of rural households had
open WWD (Figure 4b). Excepting Goa (26% of rural house-
holds), HP (20%), KL (18%), and GJ (11.5%), closed WWD
facilities were insubstantial in rest of India. Overall, only
about 37% of all rural households had any form of WWD
facility within premises, which underscored the general lack
of awareness about health and hygiene at household levels.
Such ignorance is a major threat to public health in India that
eventually exposes a vast majority of the population to diar-
rheal diseases (Kumar and Joseph, 2012; Gupta et al., 2017).
In the past few years, diarrhea has emerged as the third lead-
ing cause of child (< 5 years) mortality in India, accounting
for up to about 13% of the all annual deaths among children
(Lakshminarayanan and Jayalakshmy, 2015).
But apart from lack of appropriate latrine and WWD fa-
cilities within premises, other critical concerns in the rural
WaSH sector in India involve safe (chemical-biological qual-
ity) and sustainable water supply (location of water sources)
infrastructure. About 610 districts had access to drinking wa-
ter sources within premises (at-home + near-home) for over
half their rural households (Figure 5a). In states of PN, HR,
UP, TN and KL, over 90% rural households enjoyed such
privileges. But a distressing fact was that, about 43% rural
households in the country still had to rely upon near-home (at
distances < 500 m from home) water sources. In 20 states, the
near-home type dominated over the at-home type with the
highest differences (> 25 percentage points) observed in states
of NER, MP, CG, JH, OR, and RJ (Figure 5b). To add to the
grievance, about 23% rural households had to access water
sources away-from-home (distances > 500 m).
Accessing water at external sources could have tremen-
dous negative environmental and/or health outcomes in mul-
tiple ways:
• Hauling water from distant sources raises chances of
contamination and salinization (via pathogen attack,
dust etc.) and thus elevates human health risks.
• Lack of at-home water sources tend to prohibit la-
trine usage within premises (Alexander et al., 2016).
In other words, it is often a major reason in rural
areas to take to open defecation. Cleansing after
defecation is a lengthy ritual in rural India that may
range from washing the clothes to ablution. It is
therefore a common practice for the villagers to
defecate at locations in vicinity of sustainable water
supply (e.g., stream, pond etc.) (Chaudhuri and Roy,
2017b). Such practices, however, only accentuate
risks of water quality degradation, ultimately telling
upon human health.
But other than physical impacts of having to access water
at external sources, there could be myriad social issues that
should be factored into WaSH policy making as well:
• It aggravates chances of physical abuse for women
(Kumar, 2015), who are usually the ones in a rural
family assigned with such chores, which leads to
long-term psychological trauma.

S. Chaudhuri et al. / Journal of Environmental Informatics 35(1) 1-22 (2020)
9
• It raises likelihood of conflict and violence (over the
first right to water) among the villagers that under-
mines rural social dynamics. It largely ensues from
caste hierarchy in India - women from lower castes
are humiliated and are usually the last ones to get
access.
• In arid-semi arid regions of western India (states of
Rajasthan and Gujarat in particular), women have to
travel about 5 ~ 6 kilometers or more on average
every day to get to the water source that takes up
most of their day time. Often it would have require
several trips to fulfill daily water needs. A common
threat on such trips is animal attacks e.g., (snake/
scorpion bites).
• Even women in their late pregnancy are expected to
fetch water, which affects their health, as much as
that of the fetus. Such compulsive behavior may
even lead to miscarriage.
• Travelling for water on daily basis interferes with
Figure 3. Comparison of % of rural households with different types of latrine facilities between 2001 and 2011: (a)
nationwide, (b) & (c) state-wise.
Note: Vide relevant text for state acronyms.

S. Chaudhuri et al. / Journal of Environmental Informatics 35(1) 1-22 (2020)
10
• education, which impedes literacy and in turn lowers
awareness levels about hygienic WaSH practices.
• Girls, since their early childhood, are expected to
accompany their mothers as well, which bears heavy
on the health, education, and eventually development.
• In certain regions of the country (state of Maharash-
tra in particular), people tend to marry multiple
times out of the argument “more women more wa-
ter” (Water Wives). In other regions, whereas, peo-
ple hesitate to marry off their daughters due to lack
of sustainable source of water. On both occasions,
however, the rural social dynamics get hampered.
Current rural developmental paradigms in India advocate
for an inclusive growth model (Chaudhuri, 2017). Such
approaches aim for collective upliftment of rural livelihood by
accounting for diverse challenges ranging from poverty to
literacy, public health, women empowerment etc. Access to
sustainable water supply should at the core of this model for
its influence on human health and collective social wellbeing
(e.g., gender inequality and low female literacy levels).
Figure 4. (a) Nationwide spatial distribution of district-wise percentages of rural households having wastewater drainage
(WDD) facility within premises, and (b) state-wise percentages of rural households with different WWD facilities.
Note: “HH” = Household. Vide relevant text for state acronyms.

S. Chaudhuri et al. / Journal of Environmental Informatics 35(1) 1-22 (2020)
11
Interestingly, health and wellbeing is a key facet in the UN’s
framework of Sustainable Development Goal (SDG 3), just as
gender inequality (SDG 4) and literacy (SDG 3). These issues
also form the pillars of the inclusive growth model proposed
for rural India, as much as in other developing nations, and
would require mutually reinforcing policy measures.
But concerns about the rural water sector in India is not
just about access to a sustainable source. A major hitch is the
chemical quality as well. And herein lay a puzzling fact about
the governmental estimates. As per the census 2011 database,
75% of the districts in India had access to safe drinking water
sources for over 50% of their rural households. About 240
districts had it for over 90% (Figure 6a). The latter districts
mainly occurred in states of UP, HR, PN, and HP in the
northwest, while TN and parts of Telengana (TS) and Karna-
taka (KA) in the south.
This might appear promising at first glance. But in reality,
governmental accounts may be questioned on the premise of
Figure 5. (a) Nationwide spatial distribution of district-wise percentages of rural households having within-premises water
source (At Home + Near Home), and (b) state-wise percentages of rural households with different water sources locations.
Note: “HH” = Household. Vide relevant text for state acronyms.

S. Chaudhuri et al. / Journal of Environmental Informatics 35(1) 1-22 (2020)
12
the very concept of safe water in India (Chaudhuri and Roy,
2017b). In India safe water sources include a variety of
sources: tap (treated + untreated), hand pump and tube well/
bore well. Majority of these sources, however, are either
unsafe (e.g., untreated tap water) by definition, or so being
sourced to groundwater (e.g., hand pumps and bore/tube
wells). Groundwater contamination/salinization is a well-
documented fact in India (Chaudhuri and Roy, 2016). High
levels of arsenic (Guha Mazumder et al., 2016) fluoride
(Dahariya et al., 2015), iron (Behera et al., 2012; Achary,
2014), nitrate (Trivedi et al., 2012), salinity (Lorenzen et al.,
2011), and various microbial species (Megha et al., 2015) are
reported from across the nation that lower the potable water
quality of groundwater resources and thus questions its safety.
Additional concerns over groundwater include lack of regular
monitoring for quality and steady depletion. These factors fur-
ther challenge its long-term sustainability for water sources.
To avoid ambiguity, treated tap should ideally be taken as
the only safe water source. State-wise percentages of rural
households having access to treated tap water sources, how-
ever, portrayed a grim scenario throughout the nation (Figure
6b). Excepting states of HP and Goa, treated tap water sources
accounted for less than 50% of all potable water infrastructure
in the country. In states of WB, BR, CG, JH, OR and several
Figure 6. (a) Nationwide spatial distribution of district-wise percentages of rural households having safe and (b) state-wise
percentages of different water source types.
Note: “HH” = Household. Vide relevant text for state acronyms.

S. Chaudhuri et al. / Journal of Environmental Informatics 35(1) 1-22 (2020)
13
NER states, treated tap water accounted for < 10% of all wa-
ter sources, indicating potential health hazards.
3.2. Gini Coefficient: Assessing WaSH Spatial Inequality
Thematic mapping of WaSH infrastructure shot up
broader views raging spatial heterogeneity in WaSH facilities.
Gini coefficients provided a semi-quantitative measure of the
magnitude of the heterogeneity (inequality, in other words)
within and between the states (Figure 7a ~ d). Good to Rea-
sonable Equality were observed all across central Indian states
of CG, BR, JH, OR, MP, RJ and KA, for most WaSH facilities,
except Safe Water. This might appear gratifying on account of
homogeneity in infrastructural facilities. Comparison of Fig-
ure 7 with Figures 2 and 4 ~ 5, however, revealed that these
states were homogenous only due to appallingly low WaSH
facilities which demonstrates grieving lags across vast rural
reaches of the nation that require urgent intervention to com-
ply with the national motto “improved WaSH for all”. High
inequality in majority owed largely to the lack of safe water
sources. On the other hand Gini coefficients for PN, HR, UK
and HP, in the northwestern regions, displayed Good to Rea-
sonable Equality with significantly higher percentages of WaSH
facilities including greater availability/accessibility of safe
water sources.
To summarize spatial inequality, Gini coefficients, were
further computed using all districts across the country and
aggregated at the national level. Nationwide Gini revealed
high inequality for water source and WWD within premises,
which showcased a patchy WaSH management action across
the nation (Table 3). On the other hand, facilities away from
premises appeared with reasonable equality implying, despite
numerous progressive reforms implemented by the Govern-
ment of India, a large fraction of rural households in India still
have to rely upon external facilities. For latrine, open defeca-
Figure 7. State-wise Gini Coefficients computed using corresponding district-wise percentages of WaSH facilities to illustrate
spatial inequality.
Note: Map legend represent Gini inequality classes as described in the corresponding text. Vide relevant text for state acronyms.

S. Chaudhuri et al. / Journal of Environmental Informatics 35(1) 1-22 (2020)
14
tion (equivalent to away from home facility) appeared with
reasonably equality. Similar trend was also observed for
treated tap and safe water sources.
A grave impediment to implementing nationwide uni-
form WaSH reform policies is the spatial inequality in the
WaSH sector. Drawing from that, spatial attributes of WaSH
identified through the present analysis should form the cor-
nerstone of any future WaSH informatics system, based on
which reform policies are to be spatially-optimized. State-wise
Gini coefficients can be especially useful to estimate intra-state
inequality, arguing for identification of major factors leading
to such spatial differences and devise appropriate interventions
to vie for a more ‘homogenized’ public services system.
3.3. WaSHQI: Towards a Composite Index
The WaSHQI was computed to generate four scenarios
(Figure 8a ~ d) for each district, using subcategories of the
four WaSH parameters in various combinations, sequentially
grading from “most conservative” (scenario I) to “most lib-
eral” (scenario IV) as follows:
Scenario I (Most Conservative): Treated tap water +
at-home water source + within-premises latrine + with-
in-premises closed WWD
Scenario II (Conservative): Treated tap water + with-
in-premises water sources (at-home + near-home) + with-
in-premises latrine + within-premises WWD (closed + open)
Scenario III (Liberal): Safe water + at-home water source
+ within-premises latrine + within-premises closed WWD
Scenario I (Most Liberal): Safe water + within-premises
water source (at-home + near-home) + within-premises latrine
+ within-premises (closed + open) WWD
The propelling force for drawing up such a gradational
scale of assessment was to anticipate potential (health/
hygiene) impacts of different WaSH facilities. For example,
due to inherent ambiguity over safe water source, it was only
Figure 8. District-wise WaSHQI values computed under four scenarios ranging from (a) scenario I: most conservative to (d)
scenario IV: most liberal.
Note: HH Lat: within-premises latrine; HHW: within-premises water source (at-home + near-home); All WWD: within-premises wastewater
drainage facility (open + closed).

S. Chaudhuri et al. / Journal of Environmental Informatics 35(1) 1-22 (2020)
15
included in liberal approaches (scenarios III ~ IV). By the
same token, treated tap was evaluated within conservative
approaches (scenario I ~ II). Following similar argument, the
most conservative approach (scenario I) included a combina-
tion of closed WWD and at-home water source, besides latrine
facility within premises. Fundamentally, the idea was “how
ideally the rural WaSH sector can be developed in days ahead
so as to minimize health hazards to support sustainable human
development”? This formed the fundamental basis of our
conservative approach that combined the ideal WaSH facilities.
The conservative approaches (scenario I ~ II), infrastruc-
tural inadequacy appeared a dismal reality throughout the
nation, especially in central India (Figure 8a ~ b). About 580
districts ranked as very poor/poor on the WaSHQI rating in
(scenario I (Figure 8a). States of OR, CG, JH and MP ap-
peared with such traits in their entirety. Only a handful of
states−PN, HR, UK, KL, and Sikkim (SK)−ranked fair under
the conservative approaches: a matter that should be probed
further to identify the beneficent factors and develop possible
means to replicate them through rest of the nation.
The WaSH scenario lunged on an improving trajectory as
treated tap water was replaced by safe water through scenarios
III ~ IV (Figure 8c ~ d). With introduction of such flexibility in
the framework, most part of the country begun ranking fair to
good. Interestingly, certain regions still continued to rank poor
to moderate even under liberal approaches. For example, sev-
eral districts across states of OR, CG, JH, RJ, J and K and the
NER, ranked moderate, which implied that regardless of pa-
rameters selected, these regions have persistent inadequacies
that need urgent actions. About 90 districts in the country
ranked as moderate or worse even under the most liberal ap-
proach (scenario IV). In contrast, vast areas through PN, HR,
HP, KL and TN ranked fair to good (Figure 8d). Overall, the
WaSHQI cartograms revealed that certain regions in India may
be faring well while some others are starkly lagging behind
(Ghosh and Carincross, 2015). This also underscored need of a
WaSH informatics system, maintained and revised with latest
monitoring updates that will map nationwide WaSH inad-
equacies to prioritize regions for management action.
Better WaSH conditions in the northwest may have re-
sulted from several factors: (a) availability water sources in
close vicinity (Pal and Gupta, 2008), (b) adoption of a par-
ticipatory approach marked by flourishing of Community Led
Total Sanitation (CLTS) programs, and (c) improving rural
economy due to recent agricultural boom (e.g., commercial
fruit cultivation) through the 2000s. The latter entailed higher
literacy/awareness levels for basic hygiene principles, in turn
prompting them to adopt to appropriate sanitation practices.
Interestingly, a recent campaign named, “No Toilet No Bride”
in states of HR and PN, have had positive impacts on people’s
attitude towards adopting safe WaSH practices, prompting
them to build latrine facilities within premises. The campaign,
launched by the state governments in 2005, used various
forms of social/public media to prompt the families having
marriage-age girls to demand latrine facility of the potential
suitors. The campaign’s ingenuity largely led to about a 15%
rise in male investment in building sanitation facilities within
premises (Stopnitzky, 2012). The effect of the campaign ap-
peared four times larger in marriage markets where women
are scarce as compared to that where women are abundant.
Overall, composite index approaches, such as WaSHQI,
have following merits: (i) ability to incorporate data from
multiple sources in an objective, rapid and reproducible fash-
ion (ii) effective in communicating overall status of WaSH to
the government, experts, researchers, NGOs, as well as public,
(iii) flexibility to accommodate a wide variety of input pa-
rameters owing to simplistic design, (iv) can be used for any
administrative unit along the hierarchy, (v) tolerance to miss-
ing data values, (vi) ideal for regional comparisons etc. In-
cluding the entire spectrum of administrative hierarchy, from
household to state level, WaSHQI can provide easy yet in-
formative insights. Due to ease of computation and open-
sourced database, this method can be replicated in anywhere
without major alteration.
3.4. Moran’s I and LISA: District-wise Spatial Auto-
correlative Structure in WaSH
Computation of Moran’s I yielded, +0.72 (Figure 9) and
+0.25, respectively, for the ‘most conservative’ (scenario I)
(Figure 10a) and ‘most liberal’ (scenario IV). Clustering of
high-high and low-low districts, occuring on diagonally op-
postite quadrants of the Moran’s scatterplot with a statistically
significant Moran’s I implied storng positive spatial associa-
tion between districts with similar WaSH infrastructural traits
(Figure 5a). The scatterplot also indicated that a vast number
of dstricts in the country lacked any identifiable spatial dis-
position as they occurred rather randomly. Overall, the Mo-
ran’s scatterplot, provided some initial clues that WaSH policy
reforms (and interventions) would need a spatial component,
Figure 9. Moran’s scatterplot for Scenario I (most
conservative) depicting main types of spatial
autocorrelation between the districts.

S. Chaudhuri et al. / Journal of Environmental Informatics 35(1) 1-22 (2020)
16
rather than be uniform across the nation. Being a global
statistic, however, Moran’s I failed to address some central
issues typically encountered in decision-making such as:
• Which districts are clustered in terms of their
WaSHQI values?
• Is the clustering phenomena statistically significant?
• Are there any spatial outliers?
To seek answers to the above-mentioned questions, LISA
was computed for scenario I and IV, as they represented the
potential end-members of WaSH infrastructural development,
to capture the entire spectrum of WaSH (Figure 10). The
LISA, built upon the spatial foundation set by Moran’s I, de-
picted the clustering phenomena in terms of statistically sig-
nificant spatial contiguity among the districts with high/low
WaSHQI values, giving rise to four spatial patterns:
(i) High-High clustering (positive spatial autocorrela-
tion): High-WaSHQI districts in spatial contiguity
with high-WaSHQI districts
(ii) Low-Low (negative spatial autocorrelation): Low-
WaSHQI districts spatially contiguous
(iii) Spatial outliers: High-WaSHQI districts contiguous
with low-WaSHQI districts and vice versa
(iv) Random: Districts devoid of spatial clustering
The LISA practically divided the country into two dis-
tinct spatial cluster of districts marked by contrasting WaSH
characteristics. The better part, denoted by the High-High
clusters (positive spatial autocorrelation between districts
having mutually high WaSHQI rating), primarily occurred in
two regions (a) HR, PN and HP in the northwest and (b) KL
and parts of TN in the south, including 104 districts in total
(Figure 9a). The less promising part, as mapped by the
Low-Low clusters (negative spatial autocorrelation) on the
Figure 10. Moran’s I and LISA for (a) scenario I: Most Conservative and (b) scenario IV: Most Liberal, to understand spatial
clustering phenomena.
Note: Moran’s I and LISA were computed using district-wise WaSHQI values.

S. Chaudhuri et al. / Journal of Environmental Informatics 35(1) 1-22 (2020)
17
other hand, extended from West Bengal (WB) in the east to RJ
in the west across OR, CG, JH and MP encompassing about
170 districts through central India.
LISA for Scenario I conformed to the earlier findings
(Figure 8a): under a more conservative approach, WaSH in-
frastructural facilities are highly variable (heterogeneous),
marked by intense spatial inequality. Interestingly, 29 districts,
mostly occurring in the states of WB, Telengana (TS), and AP,
emerged as spatial outliers (High-Low or Low-High district
clusters), which indicated that districts with dissimilar WaSH
traits occurred in spatial contiguity. This obviates further in-
vestigation in future so as to understand underlying factors
leading to such anomalous spatial assemblages.
The significance map associated with the LISA depic-
tions established the spatial clustering phenomena within a
given window of statistical significance (0.05 < p < 0.001)
that should assist the decision-makers develop/implement
policy reforms with certain degree of confidence (Figure 10a).
For example, 114 districts, where the spatial clustering phe-
nomena occurred with highest level of statistical significance,
p < 0.001, may be looked in with greater emphasis so as to
identify the major socioeconomic/demographic factors giving
rise to such anomalous spatial assemblage. Knowledge earned
through this could be translated in other parts of the country
on the premise of adopting similar WaSH management inter-
ventions.
As discussed earlier, due to its liberal approach, scenario
IV approved of any combination of parameters, which implied
that majority of the districts were expected to pass for infra-
structural adequacy and therefore will be clustered. The LISA
illustration, however, brought up a rather perplexing view:
even though a vast region, through the central and southern
states, ranked fair on the WaSHQI rating (Figure 6d), no sta-
tistically significant spatial clustering was, however, evident
in its LISA counterpart (Figure 10b). In fact, majority of the
districts (487 districts) did not show any statistically signifi-
cant clustering. This indicated that simple thematic cartog-
raphy alone can be over-ambitious if used for policy-making,
which demands statistical confidence. And herein lay the cen-
tral idea of integrating WaSHQI with spatial algorithms: to
help the decision-makers look beyond traditional maps and
identify the hotspots with statistical significance and de-
vise/implement policy interventions accordingly.
Overall, 89 districts from states of OR, CG, JH, BR, MP
and RJ were selected as WaSH hotspots for correlation anal-
yses (Figure 11). What prioritized these districts was: they
appeared as Low-Low clusters in Scenario I (Most Conserva-
tive), with highest level of significance (p < 0.001). Ideologi-
cally, the Most Conservative scenario should be the most de-
sirable WaSH situation and districts lagging on such should
receive special attention.
3.5. Correlation to Sociodemographic Traits
Spearman Rank correlation analyses performed between
the district-wise WaSHQI values and a number of sociodem-
ographic attributes at the nationwide scale revealed significant
positive association (ρ: 0.40; p < 0. 05) between WaSHQI and
corresponding percentage of total rural literate population
(Table 5) only, which indicated how literacy plays a positive
role in building mass awareness among the rural population
and nurture right mental dispositions to adopting improved
WaSH-practices, such as building latrines and/or WWD facil-
ities at home.
On the other hand, significant negative correlation was
found between district-wise WaSHQI values and rural house-
hold density (ρ: −0.38; p < 0.05), which probably indicated
space-crunch in congested areas may bar latrine construction
(Manisha et al., 2016). The WaSHQI values varied directly
with (a) general to reserved (SC + ST) population ratio (ρ:
0.44; p < 0.01), (b) percentage of total rural literate (ρ: 0.49; p
< 0.01) (Table 5). Positive correlations between WaSHQI and
caste indicated that regions dominated by reserved population,
tend to lack appropriate WaSH support. This probably leads
from the fact that the reserved populations frequently include
the tribal groups who have been historically marginalized
-socially, economically, culturally, and educationally; and as a
result lack in appropriate mental/intellectual dispositions for
hygiene/environmental benefits of improved WaSH facilities
(Banda et al., 2007). It is also not uncommon to find that even
when government-subsidized facilities are available in these
regions, they are of little use to the reserved population, who
on account of various sociodemographic factors are often
housed on village periphery. Under the circumstances, shear
distance between their home and these facilities act as a de-
motivating factor to using them (Bonu and Kim, 2009).
Figure 11. Study area selected by LISA analysis for
Spearman correlation analysis.
Note: RJ: Rajasthan; MP: Madhya Pradesh; UP: Uttar Pradesh;
CG: Chhattisgarh, JH: Jharkhand; OR: Odisha; WB: West
Bengal.

S. Chaudhuri et al. / Journal of Environmental Informatics 35(1) 1-22 (2020)
18
A major revelation to be apparent was significant positive
association between WaSHQI and rural female literate popu-
lation (ρ: 0.55; p < 0. 01), which strongly corroborated with
previous studies suggesting that higher female literacy entails
increased awareness and right attitudes for hygienic WaSH
practices at home (Gius and Subramanium, 2015; Coffey et al.,
2017). Open defecation is unsafe for rural women in India as
it aggravates chances of abuse (Gius and Subramanium, 2015)
besides multiple health and educational consequences. To
avoid such undesirable circumstances, rural women either
tend to group up for open defecation or urge the family heads
to build latrine at home. The latter tendency increases with
increasing literacy/awareness that raises sense of dignity and
self-esteem. However, building latrines at home incurs addi-
tional expenses and such demands are frequently turned down.
In fact, building appropriate latrine facilities at home seldom
enjoys priority to prospective homeowners as it is still con-
sidered rather a luxury than necessity. Such tendencies are
more apparent with lower literacy levels.
Rural literacy (7+ years) levels are still far from desired
levels with pronounced gender gap. According to the census
of India database, about 57.9% of rural females were literate
in 2011 as compared to about 77.1% of males (GoI, 2014).
Nationally, about 64.6% females were literate against about
80% males. Appallingly, among the reserved populations (SC
and ST), female literacy levels averaged around 40% (of re-
served female population) (Figure 12).
Low literacy is a major impediment (Manisha, 2016)
against implementing safe WaSH practices (Behera, 2014). A
plethora of mutually reinforcing factors undermines the rural
literacy sector. Majority of the rural tribal population in the
country still consider their children as economic assets and
would prefer for them to work to support the familial expens-
es instead of wasting valuable time on education, which is
deemed rather a luxury. An issue in this regard is school hours,
which frequently conflict with the daily work hours of the
children, making the parents disinterested and eventually
keeping the children from attending schools on regular basis
and/or drop out in early childhood. As added aggravation, the
schools in the tribal areas largely lack adequate infrastructural
facilities (buildings, library, teachers etc.). In this regard, free
mid-day meal plan for students in government-subsidized
schools is a major incentive for the poor parents to have their
children attending school. It is however, owing to corruption
and misappropriation of funds in local administration, that
meal plans are not implemented with desired rigor in rural
areas, except for in papers, that acts against the attendance.
Often the meal itself appears of poor quality (rotten/under-
cooked/old etc.) that disenchants the students. For girls, an
issue commonly encountered in most rural schools is lack of
separate toilet facilities. For girls of menstruating ages this is
a major dissuasive factor to attending schools on regular basis.
Often the travel-time to school appears too high, thus acting
against the students’ will to attend schools as not all villages
have schools, particularly girls’ schools. For girls, travel also
aggravates chances of physical/psychological abuse, which
makes the parents apprehensive.
In addition, the teaching staff in the tribal schools often
lack right mental disposition to appreciate the tribal ways of
life (customs, taboos, religious beliefs, superstitions etc.),
which effectively scares the children away. Rooted in this,
tribal groups foster strong reservations against receiving edu-
cation from the outsiders (school teachers in villages often
come from urban areas), which they believe will anger their
deities. In addition, many tribal clans believe that formal edu-
cation will make their children more defiant. Such behavior is
especially apprehended for the female, who may become less
docile under the influence of modernity and challenge rural
norms. Schooling also leads to out-migration-from villages to
urban areas- in search of prosperous livelihoods. Such aspira-
tions are believed to severe familial ties and result in es-
trangement and thus disapproved. Overall, a large number of
factors, mostly rooted in social beliefs and taboos, make
schooling a threat to sociocultural practices and thus discouraged.
Last but not the least, scientific facts about WaSH and
health benefits are not always taken seriously in rural schools,
as it often contradicts with rural social/religious customs/
beliefs or the teachers are not adequately trained themselves
for such purposes (Chaudhuri and Roy, 2017a). Such ignorance/
incompetency, however, keep WaSH from receiving due
Table 5. Comparative Evaluation of Spearman Rank
Correlation Coefficients Computed between Washqi and
Different Sociodemographic Attributes for India
(Considering all Districts) and the Study Area (Selected
89 Districts) Identified as Hotspots by LISA Analysis
India (nationwide) Study Area (LISA Hotspot)
Household
density
0.22 Household density 0.33*
General/(SC + ST) 0.19 General/(SC + ST) 0.44*
% Total literate 0.36* % Total literate 0.49**
% Female literate 0.40* % Female literate 0.55**
*significant at p < 0.05
**significant at p < 0.01
Figure 12. State-wise rural female literate population for
SC and ST sections expressed as corresponding state-wise
total SC and ST population in 2011.
Note: Solid red line indicates the national tally for SC and STs
that hovers around 41%. Several states lack SC population. Vide
relevant text for state acronyms.
S. Chaudhuri et al. / Journal of Environmental Informatics 35(1) 1-22 (2020)
19
importance in the academic curricula. This fails to inculcate a
positive sense of hygiene among students, even those who
attend schools regularly. Unfortunately, all these issues also
act against the proposed inclusive growth model of rural
development, as discussed earlier, and undermines the public
health sector.
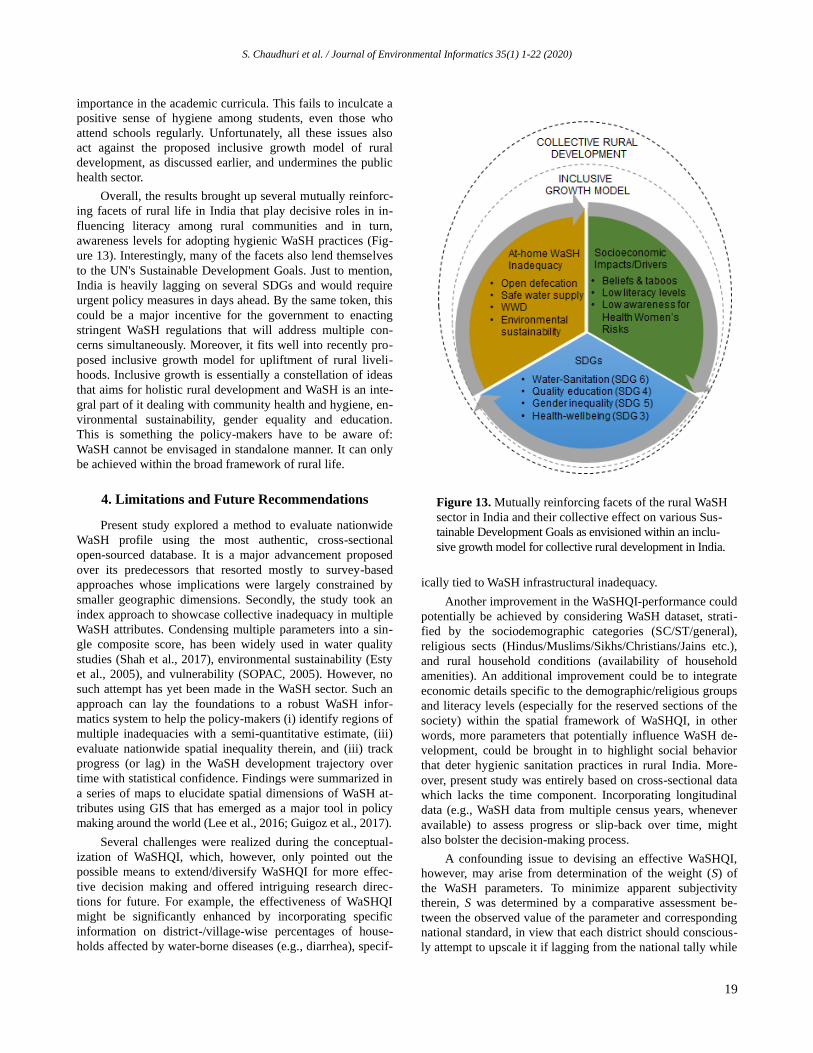
Overall, the results brought up several mutually reinforc-
ing facets of rural life in India that play decisive roles in in-
fluencing literacy among rural communities and in turn,
awareness levels for adopting hygienic WaSH practices (Fig-
ure 13). Interestingly, many of the facets also lend themselves
to the UN's Sustainable Development Goals. Just to mention,
India is heavily lagging on several SDGs and would require
urgent policy measures in days ahead. By the same token, this
could be a major incentive for the government to enacting
stringent WaSH regulations that will address multiple con-
cerns simultaneously. Moreover, it fits well into recently pro-
posed inclusive growth model for upliftment of rural liveli-
hoods. Inclusive growth is essentially a constellation of ideas
that aims for holistic rural development and WaSH is an inte-
gral part of it dealing with community health and hygiene, en-
vironmental sustainability, gender equality and education.
This is something the policy-makers have to be aware of:
WaSH cannot be envisaged in standalone manner. It can only
be achieved within the broad framework of rural life.
4. Limitations and Future Recommendations
Present study explored a method to evaluate nationwide
WaSH profile using the most authentic, cross-sectional
open-sourced database. It is a major advancement proposed
over its predecessors that resorted mostly to survey-based
approaches whose implications were largely constrained by
smaller geographic dimensions. Secondly, the study took an
index approach to showcase collective inadequacy in multiple
WaSH attributes. Condensing multiple parameters into a sin-
gle composite score, has been widely used in water quality
studies (Shah et al., 2017), environmental sustainability (Esty
et al., 2005), and vulnerability (SOPAC, 2005). However, no
such attempt has yet been made in the WaSH sector. Such an
approach can lay the foundations to a robust WaSH infor-
matics system to help the policy-makers (i) identify regions of
multiple inadequacies with a semi-quantitative estimate, (iii)
evaluate nationwide spatial inequality therein, and (iii) track
progress (or lag) in the WaSH development trajectory over
time with statistical confidence. Findings were summarized in
a series of maps to elucidate spatial dimensions of WaSH at-
tributes using GIS that has emerged as a major tool in policy
making around the world (Lee et al., 2016; Guigoz et al., 2017).
Several challenges were realized during the conceptual-
ization of WaSHQI, which, however, only pointed out the
possible means to extend/diversify WaSHQI for more effec-
tive decision making and offered intriguing research direc-
tions for future. For example, the effectiveness of WaSHQI
might be significantly enhanced by incorporating specific
information on district-/village-wise percentages of house-
holds affected by water-borne diseases (e.g., diarrhea), specif-
ically tied to WaSH infrastructural inadequacy.
Another improvement in the WaSHQI-performance could
potentially be achieved by considering WaSH dataset, strati-
fied by the sociodemographic categories (SC/ST/general),
religious sects (Hindus/Muslims/Sikhs/Christians/Jains etc.),
and rural household conditions (availability of household
amenities). An additional improvement could be to integrate
economic details specific to the demographic/religious groups
and literacy levels (especially for the reserved sections of the
society) within the spatial framework of WaSHQI, in other
words, more parameters that potentially influence WaSH de-
velopment, could be brought in to highlight social behavior
that deter hygienic sanitation practices in rural India. More-
over, present study was entirely based on cross-sectional data
which lacks the time component. Incorporating longitudinal
data (e.g., WaSH data from multiple census years, whenever
available) to assess progress or slip-back over time, might
also bolster the decision-making process.
A confounding issue to devising an effective WaSHQI,
however, may arise from determination of the weight (S) of
the WaSH parameters. To minimize apparent subjectivity
therein, S was determined by a comparative assessment be-
tween the observed value of the parameter and corresponding
national standard, in view that each district should conscious-
ly attempt to upscale it if lagging from the national tally while
Figure 13. Mutually reinforcing facets of the rural WaSH
sector in India and their collective effect on various Sus-
tainable Development Goals as envisioned within an inclu-
sive growth model for collective rural development in India.

S. Chaudhuri et al. / Journal of Environmental Informatics 35(1) 1-22 (2020)
20
districts that equals or better the same should be acknowl-
edged with due credit. Therefore, in effect, determination of S
resulted from expert decision, which could obviously be im-
proved in future by exploring more robust numeric means to
vie for objectivity.
5. Conclusions
Through the course of the study it appeared that vast
stretches between central to west India (comprising of states
of CG, CG, BR, OR, MP, RJ) severely lacks multiple WaSH
facilities, including improved latrine facilities at home. On the
other hand, states of northwest India (HR, PN, HP etc.) appear
with better traits marking intense spatial heterogeneity that
needs to be addressed with spatially-optimized policy reforms
in days ahead.
However, a major realization that emerged was that, la-
trine facilities cannot be the sole concern of the deci-
sion-makers. Rural WaSH sector in India is plagued by a vari-
ety of issues. For example, the central Indian states severely
lack closed wastewater drainage facility within premises that
aggravates human health risks. To aggravate the situation, true
identity of safe drinking water sources is yet to be resolved in
India. In recent years, water quality has emerged as an im-
portant consideration in decision-making in view of ensuring
human health and sustainable development around the world
(Tan et al., 2015). By the same token, considerations about
safe and sustainable water supply should sit at the core of
WaSH policy-making in India or elsewhere.
One way or the other, lack of appropriate WaSH infra-
structure is not only affecting health/environmental outcomes
in rural India, but also influencing social dynamics in a varie-
ty of ways that need to be addressed with urgency. The study
hinted upon importance of literacy as it plays a central role in
building awareness, especially among the rural reserved pop-
ulation. For rural women, importance of literacy cannot be
emphasized enough, and should be a major stand on behalf of
the government to ensure/promote hygienic WaSH practices
in days ahead. In this regard, a great deal of effort needs to be
divested to address the age-old social taboos among the rural
populace against formal school education. Apparently, gov-
ernmental efforts to instill the urge of adopting hygienic sani-
tation practices is yet to gain desired momentum in rural areas
owing to a variety of reasons that need closer scrutiny in days
ahead.
Using a single statistic to characterize the WaSH sector,
in a country as vast and diverse as India, might be simplifi-
cation of the underlying complexities (e.g., overlapping spheres
of literacy, economy, social practices, and age-old taboos).
This study, however, can mark a modest beginning to estab-
lish a nationwide WaSH-informatics system. The WaSHQI
can be taken as an easy-to-use yet effective tool to monitor
trajectory of WaSH infrastructural development, within a
collective framework. Multiple scenarios may provide the
policy-makers with a certain degree of flexibility to select
optimal management interventions based on timeframe and
resource availability. Such approaches can especially be
useful to the rural health care administration to decide on the
desired rigor of the policy reforms to meet the needs.
Acknowledgments. The authors would like to thank the Dean of the
Jindal School of Liberal Arts and Humanities (JSLH), Professor
Kathleen Modrowski for supporting this study.
Conflict of Interests. The authors declare that they have no compet-
ing interests.
References
Achary, G.S. (2014). Studies on ground water pollution due to iron
content in Bhubaneswar, Odisha, India. Int. J. Curr. Eng. Technol.
4(1), 88-93.
Alexander, K., Allton, C., Felsman, C., Hahn, M., Okegba, T., Palmer,
D., Taglieri, J., and Thibert, M. (2016). Ending open defecation in
India: Insights on implementation and behavior change for Swachh
Bharat Abhiyan. Graduate Workshop Policy Report. Woodrow Wison
School of Public and International Affairs, Princeton University.
Anselin, L. (1995). Local Indicators of Spatial Association -- LISA.
Geogr. Anal., 27, 93-115, https://doi.org/10.1111/j.1538-4632.1995.
tb00338.x
Banda, K., Sarkar, R., Gopal, S., Govindarajan, J., and Harijan, B.B.
(2007). Water handling, sanitation and defecation in rural southern
India: A knowledge, attitudes and practices study. Trans. R. Soc.
Trop. Med. Hyg., 101(11), 1124-1130. https://doi.org/10.1016/j.
trstmh.2007.05.004
Balamurugan, M. and Ravichandran, J. (2014). Environmental
sanitation index for the state of Tamil Nadu, India. Int. Res. J. Env.
Sci., 3(5), 54-59.
Barnard, S., Routray, P., Majorin, F., Peletz, R., Boisson, S., Sinha, A.,
and Clasen, T. (2013). Impact of Indian Total Sanitation Campaign
on Latrine Coverage and Use: A Cross-Sectional Study in Orissa
Three Years following Programme Implementation. PloS One.
8(8), e7438, https://doi.org/10.1371/journal.pone.0071438
Behera, M. (2014). Status and problems of educational scenario of
particularly vulnerable tribal groups in Odisha: Government
initiatives. J. Econ. Soc. Develop. 10(1), 131-143.
Behera, B., Das, M., and Rana, G.S. (2012). Studies of groundwater
pollution due to iron content and water quality in and around,
Jagldalpur, Bastar District, Chattisgarh, India. J. Chem. Pharma-
ceutical Res., 4(8), 3803-3807.
Bonu, S. and Kim. H. (2009). Sanitation in India: Progress,
differentials, correlates and challenges. South Asia Occasional
Paper Series, v. 2. Asian Development Bank.
Chaudhuri, S. (2017). How inclusive has been our growth? https://
www.thestatesman.com/opinion/how-inclusive-has-been-our-grow
th-1502501664.html
Chaudhuri, S. and Roy, M. (2017). Rural-urban spatial inequality in
water and sanitation facilities in India: A cross-sectional study
from household to national level. Appl. Geogr.. 85:27-38. https://
doi.org/10.1016/j.apgeog.2017.05.003.
Chaudhuri, S. and Roy, M. (2017). Drinking water sources in India:
How safe is Safe? Current Science., 113(3):393-402.
Chaudhuri, S. and Roy. M. (2016). Reflections of groundwater
quality and urban-rural disparity in drinking water sources in
Haryana. Int. J. Sc. Res. Develop., 4(4), 837-843.
Chaudhuri, S. and Ale. S. (2014). Long-term (1930-2010) trends in
groundwater levels in Texas: Influences of soils, landcover and
water use. Sci Tot. Environ., 490, 379-390, https://doi.org/10.1016/

S. Chaudhuri et al. / Journal of Environmental Informatics 35(1) 1-22 (2020)
21
j.scitotenv.2014.05.013.
Chaudhuri, S., Ale, S., Delaune, P., and Rajan. N. (2012). Spatio-
temporal variability of groundwater nitrate concentration in Texas:
1960-2010. J. Environ. Qual., 41, 1806-1817, https://doi.org/
10.2134/jeq2012.0022.
Clasen, T., Boisson, S., Routray, P., Torondel, B., Bell, M., Cumming,
O., Ensink, J., Freeman, M., Jenkins, M., Odagiri, M., Ray, S.,
Sinha, A., Suar, A., and Schmidt, W.P. (2014). Effectiveness of a
rural sanitation programme on diarrhoea, soil-transmitted helminth
infection, and child malnutrition in Odisha, India: a cluster-
randomised trial. Lancet Glob Health., 2(11), e645-53. https://doi.
org/10.1016/S2214-109X(14)70307-9
Coffey, D., Gupta, A., Hathi, P., Spears, D., Srivastav, N., and Vyas, S.
(2017). Understanding open. Eco. Political Weekly. 52(1):59-66.
Coffey, D., Gupta, A., Hathi, P., Khurana, N., Spears, D., Srivastav, N., and Vyas, S. 2014. Revealed preferences for open defecation:
Evidence from a new survey in ru defecation in rural India. Eco.
Political Weekly, 49(38):43-55.
Dahariya, N.S., Rajhans, K.P., Yadav, A., Ramteke, S., Sahu, B.L.,
and Pate, K.S. (2015). Fluoride contamination of groundwater and
health hazard in India. J. Water. Rrsour. Protect, 7(17), 1416-1428. https://doi.org/10.4236/jwarp.20 15.717115.
Esty, D.C., Levy, M.A., Srebotnjak, T., and de Sherbinin, A. (2005).
2005 Environmental Sustainability Index: Benchmarking National
Environmental Stewardship. Yale Center for Environmental Law
& Policy, New Haven.
Fang, Z., Zhu, J., and Deng, R. (2013). Estimating Gini coefficient
based on Huran report and poverty line. Open J.l of Stati., 3,
167-172, https://doi.org/10.4236/ojs.2013.33018.
Fewtrell, L. and Colford Jr, J.M. (2005). Water, sanitation and
Hygiene in developing countries: interventions and diorrhea – a
review. Water Sci. Technol., 52(8), 133-42.
Ghosh, A. and Cairncross, S. (2015). The uneven progress of
sanitation in India. Water Sanitation Hyg Develop., 4(1), 15-22,
https://doi.org/10.2166/washdev.2013.185.
GoI (Government of India). (2014). Census of India 2011 databook
for PC, http://censusindia.gov.in/
Gius, M. and Subramanium, R. (2015). The relationship between
inadequate sanitation facilities and economic well-being of women
in India. J. Eco. Develop. Stud., 3(1), 11-21, https://doi.org/10.
15640/jeds.v3n1a2.
Guha Mazumder, D.N., Ghosh, A., Majumdar, K.K., Ghosh, N., Saha,
C., and Guha Mazumder, R.N. (2010). Arsenic contamination and
its health impact on population of district of Nadia, West Bengal,
India. Indian J. Community Med., 35(2), 331–338, https://doi.org/
10.4103/0970-0218.66897
Guigoz, Y., Giuliani, G., Nonguiema, A., Lehmann, a., Mlisa, A., and
Ray, N. (2017). Spatial data infrastructures in Africa: A gap
analysis. J. Environ. Inf., 30(1):53-62, https://doi.org/10.3808/jei.
201500325.
Gupta, A., Sadanand, N., Chandra, S., Tandon, S., and Jayathilak, V.
(2017). Open drains are one of Delhi's biggest problems. The Wire.
https://thewire.in/106146/delhi-sanitation-open-drains/
Hathi, P., Haque, S., Pant, L., Coffey, D., and Spears, D. (2017).
Place and Child Health: The Interaction of Population Density and
Sanitation in Developing Countries. Demography. 54(1), 337-360,
https://doi.org/10.1007/s13524-016-0538-y.
Kumar, A. (2015). Discrepancies in sanitation statistics of rural India.
Economic and Political Weekly, 50(2).
Kumar, A. and Das, K.C. (2014). Drinking water and sanitation facility in India and its linking with diarrhea among children under
five: Evidences from recent data. Int. J. Human. Social Sci. Invent.,
3(4), 55-60.
Kumar, S.G. and Joseph, N. (2012). Drainage and Sewerage system
in urban India. Indian J. Occup. Environ. Med., 16(3), 150-151,
https://doi.org/10.4103/0019-5278.111767.
Lakshminarayanan, S. and Jayalakshmy, R. (2015). Diarrheal dis-
eases among children in India: Current scenario and future per-
spectives. J. Nat. Sc. Biol. Med., 6(1), 24-28, https://doi.org/10.
4103/0976-9668.149073
Lee, C., Kim, K., Park, Y., and Lee, H. (2016). GIS-based reach file
generation for efficient TMDLs implementation. J. Environ. Inf.,
28(1):45-60, https://doi.org/10.3808/jei.201600336
Lorenzen, G., Sprenger, C., Baudron, P., and Gupta, D. (2011). Origin
and dynamics of groundwater salinity, in alluvial plains of western
Delhi and adjacent territories of Haryana State, India. Hydrol.
Process, 26(15), 2333-2345, https://doi.org/10.1002/hyp.8311.
Manisha, M. (2016). Sustainable sanitation in India: Need of the
Hour. Indian J. Occup. Environ. Med., 20(1), 68-69, https://doi.
org/10.4103/0019-5278.183849
Mara, D., Lane, J., Scott, B., and Trouba, D. (2010). Sanitation and
Health. PLoS Med., 7(11), e1000363, https://doi.org/10.1371/journal.
pmed.1000363.
Megha, P.U., Kavya, P., Murugan, S., and Harikumar, P.S. (2015).
Sanitation mapping of groundwater contamination in rural village
in India. J. Environ. Protect, 6, 34-44, https://doi.org/10.4236/jep.
2015.61005
Moran, P.A.P. (1950). Notes on continuous stochastic phenomena.
Biometrika, 37, 17–23, https://doi.org/10.2307/2332142.
O'Rielly, K. and Louis, E. (2014). The toilet tripod: Understanding
successful sanitation in rural India. Health Place, 29, 43-51,
https://doi.org/10.1016/j.healthplace.2014.05.007.
Pal, M. and Gupta, V. (2008). Community sanitation campaign: A
study in Haryana. Economic and Political Weekly, 43(33).
Park, M.J., Clements, A.C.A., Gary, D.J., Sadler, R., Laksono, B.,
and Stewart, D.E. (2016). Quantifying accessibility and use of
improved sanitation: towards an comprehensive indicator of the
need for sanitation interventions. Sci. Report, 6. https://doi.org/10.
1038/srep30299.
Patil, S.R., Arnold, A.F., Salvatore, A.L., Briceno, B., Ganguly, S.,
Colford, J.M., and Gertler, P.J. (2014). The Effect of India's Total
Sanitation Campaign on Defecation Behaviors and Child Health in
Rural Madhya Pradesh: A Cluster Randomized Controlled Trial.
PLoS Med., 11(8), e1001709, https://doi.org/10.1371/journal.pmed.
1001709.
Ping, J., Green, C., Zartman, R., and Bronson, K. (2004). Exploring
spatial dependence of cotton yield using global and local
autocorrelation statistics. Field Crops Res., 89, 219-236, https://
doi.org/10.1016/j.fcr.2004.02.009.
Raman, R., Kaur, R., and Kumar, B. (2014). GIS and spatial analyses
of housing and household amenities and assets in Haryana. Indian
Cartogr. 34.
Rao, N.S. (2008). Factors controlling the salinity in groundwater in
parts of Guntur District, Andhra Pradesh, India. Environ. Monit.
Assess., 138(1), 327-431.
Rao, N.S. (2008). Iron content in groundwaters of Visakhapatnam
environs Andhra Pradesh, India. Environ. Monit. Assess., 136(1),
437-447.
Routray, P., Schmidt, W.P., Boisson, S., Clasen, T., and Jenkins, M.W.
(2015). Socio-cultural and behavioural factors constraining latrine
adoption in rural coastal Odisha: an exploratory qualitative study.
BMC Public Health, 15, 880, https://doi.org/10.1186/s12889-015-
2206-3
Bansal, S. (2016). What numbers tell us about Open Defecation in
India. http://www.thehindu.com/data/What-numbers-tell-us-about-
Open-Defecation-in-India/article15422326.ece
Schwemlein, S., Cronk, R., and Bartram, J. (2016). Indicators for
Monitoring Water, Sanitation, and Hygiene: A Systematic Review
of Indicator Selection Methods. Int. J. Environ. Res. Public Health,
13(3), 333, https://doi.org/10.3390/ijerph13030333.
Shah, K.A. and Joshi, G. 2017. Evaluation of water quality index for

S. Chaudhuri et al. / Journal of Environmental Informatics 35(1) 1-22 (2020)
22
River Sabarmati, Gujarat, India. Appl. Water Sci., 7(3):1349-1358.
https://doi.org/10.1007/s13201-015-0318-7.
Shakya, H.B., Christakis, N.S., and Fowler, J.H. (2015). Social
network predictors of latrine ownership. Soc. Sci. Med., 125,
129-138, https://doi.org/10.1016/j.socscimed.2014.03.009.
Sinha, A., Nagel, C.R., Thomas, E., Schmidt, W.P., Torondel, B.,
Boisson, S., and Clasen, T.F. (2016). Assessing latrine use in rural
India: A cross-sectional study comparing reported use and passive
latrine use monitors. Am. J. Trop. Med. Hyg., 95(3):720-727,
https://doi.org/10.4269/ajtmh.16-0102.
SOPAC (South Pacific Applied Geoscience Commission), (2005).
Building Resilience in SIDS. The Environmental Vulnerability
Index (EVI) 2005. SOPAC Technical Report, Suva, Fiji Islands.
Spears, D., Ghosh, A., and Cumming, O. (2013). Open Defecation
and Childhood Stunting in India: An Ecological Analysis of New
Data from 112 Districts. PLoS ONE, 8(9), e73784. https://
doi.org/10. 1371/journal.pone.0073784.
Stopnitzky, Y. (2012). The bargaining power of missing women:
Evidence from a sanitation campaign in India. Munich Personal
RePEc Archive, 37841. https://doi.org/10.2139/ssrn.2031273.
Suthar, S., Bishnoi, P., Singh, S., and Patil, N.S. (2009). Nitrate
contamination of groundwater in some rural areas in Rajasthan,
India. J. Hazard. Mat., 171(1-3), 189-199, https://doi.org/10.1016/
j.jhazmat.2009.05.111
Tan, X., Xia, X.L., Li, S.Y., and Zhang, Q.F. (2015). Water quality
characteristics and integrated assessment based multistep corre-
lation analysis in Danjiangkou Reservoir, China. J. Environ. Inf.,
25(1):60-70, https://doi.org/10.3808/jei.201500296
The Hudu. (2016). Most of rural India still opts for open defecation:
NSS report. http://www.thehindu.com/data/Most-of-rural-India-
still-opts-for-open-defecation-NSS-report/article14249527.ece
Trivedi, H.B. and Vediya, S.D. (2012). Assessment of nitrate conta-
mination of groundwater samples in Bhiloda Taluka of Sabarkantha
District, Gujarat. Int. J. Pharmacy Life Sci., 3(11), 2103-2106.
Tyagi, G. (2017). Is India really winning its war on open defecation?
Diplomat. http://thediplomat.com/2017/05/is-india-really-winning-
its-war-on-open-defecation/
Wagstaff, A., Paci, P., and van Doorslaer, E. (1991). On the measure-
ment of inequalities in health. Soc. Sci. Med., 33(5), 545-57. https:
//doi.org/10.1016/0277-9536(91)90212-U.
Webb, A.L., Stein, A.D., Ramakrishnan, U., Hertzberg, V.S., Urizer,
M., and Martorell, R. (2006). A simple index to measure hygiene
behavior. In. J. Epidem. 35, 1469-1477.
WHO/UNICEF. (2015). Progress on Sanitation and Drinking Water–
2015 Update and MDG Assessment. WHO; New York, NY, USA.
Yates, T., Lantagne, D. Mintz, E., and Quick. R. (2015). The impact
of water, sanitation, and hygiene interventions on the health and
well-being of people living with HIV: a systematic review. J.
Acquir. Immune. Defic. Syndr., 68(3):S318-30, https://doi.org/10.
1097/QAI.0000000000000487.