2018 School Water, Sanitation and Hygiene Assessment
144
2018 School Water, Sanitation and Hygiene Assessment MAIN REPORT Tanzania February 2020
-
Upload
khangminh22 -
Category
Documents
-
view
4 -
download
0
Transcript of 2018 School Water, Sanitation and Hygiene Assessment

2018 School Water, Sanitationand Hygiene Assessment
MAIN REPORT
Tanzania
February 2020


2018 School Water, Sanitation and Hygiene AssessmentMAIN REPORT__________________
Tanzania
February 2020

2018 School Water, Sanitation and Hygiene Assessment | Main Reportii

2018 School Water, Sanitation and Hygiene Assessment | Main Report iii
Content
Foreword ix
Acknowledgement xi
Abbreviations xii
Executive Summary xiii
Chapter 1: Introduction 1 1.1 Background Information 2
1.2 Global Overview of WASH in Schools 3
1.3 Overview of WASH in Schools in Tanzania 4
1.4 National School WASH Assessment 5
1.5 Objective 5
Chapter 2: Methodology and Implementation 7 2.1 Sample Design 8
2.2 Survey Implementation 11
Chapter 3: Characteristics of Schools in Tanzania 14 3.1 Average Number of Pupils/Students per School 15
3.3 Average Number of Teachers per School 17
3.4 Average Number of Classrooms in Use per School 19
3.5 Access and Sources of Electricity in Schools 21
3.6 Provision of Meals for Pupils 23
Chapter 4: Water Services 25 4.1 Accessibility to Drinking Water in Schools 26
4.2 Availability of Water Services According to JMP Classifi cations 28
4.3 Drinking Water Availability from the Main Source 30
4.4 Location of the School Water Source 33
4.5 Treatment of Drinking Water 33
4.6 Accessibility to Water Services to the Youngest Children and Pupils with Limited Mobility and Poor Vision 35
4.7 Utilization of School Water Facilities by Community 36
Chapter 5: Sanitation Services 38 5.1 Types of Sanitation, Availability and Accessibility 39
5.2 Sanitation Services According to the JMP Classifi cations 40
5.3 Use of Improved Single-Sex and Improved Usable/Functional Toilets 43

2018 School Water, Sanitation and Hygiene Assessment | Main Reportiv
5.4 Accessibility to Sanitation Services to the Youngest Children (in primary schools) and Children with Physical Disability and Impaired Vision 45
5.5 Pupils Drop Hole Ratio 46
5.6 Location of Sanitation Facilities 50
5.7 Cleanliness of Toilets in Schools 50
5.8 Methods Used to Empty Filled-up Latrines/Toilets 51
5.9 Presence of Urinal Facilities 53
Chapter 6: Hygiene 55 6.1 Presence of Handwashing Facilities 56
6.2 Types of Handwashing Facilities 58
6.3 Availability of Water and Soap 60
6.4 Classifi cations of Hygiene Services According to the Joint Monitoring Programme (JMP) 63
6.5 Location of Handwashing Facilities 64
6.6 Accessibility to Handwashing Facilities for the Youngest Children and Pupils with Limited Mobility and Impaired Vision 66
6.7 Hygiene Education 67
6.8 Teachers trained in WASH 68
6.9 Menstrual Hygiene Management (MHM) Services 68
6.10 Components of MHM Provided at the School 70
6.11 Provision of Menstrual Hygiene Products for Adolescent Girls 70
6.12 Presence of a Separate Room/Space for Menstrual Hygiene Management 73
6.13 Frequency of Disposal of Menstrual Hygiene Materials 74
6.14 Type of Mechanisms for the Disposal of Menstrual Hygiene Materials 74
Chapter 7: Operation and Maintenance 76 7.1 Funding for Maintenance of School WASH Facilities 77
7.2 Responsibility for Repair and Maintenance of the WASH Facilities 80
7.3 Responsibility for Cleanliness of Toilet Facilities 81
Chapter 8: Pupils’ Engagement 83 8.1 Engagement in WASH/Mazingira/Afya Clubs 84
8.2 School WASH Club Meetings 87
8.3 Presence of Visual Promotion for Good WASH Behaviour 87
Chapter 9: Summary of Key Findings, Policy Implication and Recommendations 91
Annex A: Additional Tables 97
Annex B: Questionnaires 103

2018 School Water, Sanitation and Hygiene Assessment | Main Report v
Table 1.1: Global goals and targets related to WASH in schools 3
Table 2.1: Final sample allocation of schools by region and by level of school, Tanzania, 2018 9
Table 2.2: Percentage distribution of surveyed schools (weighted), and weighted and unweighted numbers of schools, by background characteristics, Tanzania, 2018 10
Table 3.1: Average and median number of primary and secondary schools’ pupils/students by residence, ownership, type of school and model of school, Tanzania, 2018 15
Table 3.2: Average and median number of primary and secondary schools’teachers by location, ownership status, type of school and model of school, Tanzania, 2018 17
Table 3.3: Average, median and total number of classrooms by location, level of school, ownership status and model of school, Tanzania, 2018 19
Table 3.4: Percentage of schools with electricity by background characteristics, Tanzania, 2018 21
Table 3.5: Percentage of schools providing meal by background characteristics, Tanzania, 2018 23
Table 4.1: Percentage distribution of schools by source of drinking water and location, Tanzania, 2018 26
Table 4.2: Percentage distribution of schools by source of drinking water, level of school and ownership status, Tanzania, 2018 27
Table 4.3: Percentage of schools with basic water services, limited water services and no water services by background characteristics, Tanzania, 2018 29
Table 4.4: Percentage of schools with drinking water currently available at the school, was available in the two weeks before the survey, and is available throughout a year by location, ownership, level of school, type of school, model of school and region, Tanzania, 2018 31
Table 4.5: Percentage of schools with water treatment method with regard to the location, level and ownership status of school, Tanzania, 2018 34
Table 4.6: Percentage distribution of schools by location, level, ownership status and accessibility of drinking water facilities to the youngest children and those with limited mobility or vision, Tanzania, 2018 35
Table 4.7: Percentage distribution of schools by location, ownership, model, level and community utilization of school water supply services, Tanzania, 2018 37
Table 5.1: Percentage distribution of schools by type of sanitation facilities, location and level of school, Tanzania, 2018 40
Tables

2018 School Water, Sanitation and Hygiene Assessment | Main Reportvi
Table 5.2: Percentage of schools with basic sanitation, limited sanitation and no sanitation services by type and model of school, Tanzania, 2018 42
Table 5.3: Percentage of schools with improved sanitation, improved and usable sanitation, improved and single-sex sanitation, and improved usable and single-sex sanitation facilities by background characteristics, Tanzania, 2018 44
Table 5.4: Percentage of schools with at least one usable toilet accessible to the youngest children and pupils with physical disability impaired vision by background characteristics, Tanzania, 2018 45
Table 5.5: Average number of pupils/students per drop hole by location, level of school, ownership, model of school and region, Tanzania, 2018 49
Table 5.6: Percentage on the location of sanitation facilities in schools by location, ownership status, and level of school, Tanzania, 2018 51
Table 5.7: Percentage of schools by perception of cleanliness of the students’ toilets, by location, ownership status, level of school, type of school and model of school, Tanzania, 2018 52
Table 5.8: Percentage of schools by methods used to empty fi lled-up latrines, Tanzania, 2018 53
Table 5.9: Percentage of schools with urinal facilities by location, level, ownership status, type and model of school, Tanzania, 2018 54
Table 6.1: Percentage of schools reported and observed to have handwashing facilities by location, level of school, ownership status, type of school, model of school and region, Tanzania, 2018 57
Table 6.2: Percentage of schools with handwashing facilities by location, level, ownership status, type of school and model of school, Tanzania, 2018 59
Table 6.3: Percentage distribution of schools observed to have water and soap, water only, soap only and neither water nor soap at their handwashing facilities by background characteristics, Tanzania, 2018 61
Table 6.4: Percentage of schools with handwashing facilities by background characteristics and location of handwashing facilities, Tanzania, 2018 65
Table 6.5: Percentage of schools with handwashing facilities accessible to the youngest children and schools with hand washing accessible to pupils with physical disabilities or impaired vision by background characteristics, Tanzania, 2018 66
Table 6.6: Percentage distribution of schools teaching hygiene education by background characteristics, Tanzania, 2018 67
Table 6.7: Percentage of schools with teachers trained or oriented on WASH by background characteristics, Tanzania, 2018 69
Table 6.8: Percentage of schools providing MHM services by background characteristics, Tanzania, 2018 70
Table 6.9: Percentage of schools providing hygiene products by background characteristics, Tanzania, 2018 72

2018 School Water, Sanitation and Hygiene Assessment | Main Report vii
Map 3.1: Percentage of schools with electricity by region, Tanzania, 2018 22
Map 3.2: Percentage of schools providing meals to the pupils by region, Tanzania, 2018 24
Map 4.1: Percentage of schools with basic water services by region, Tanzania, 2018 30
Map 5.1: Percentage of schools with basic sanitation services by region, Tanzania, 2018 43
Map 6.1: Percentage of schools observed to have basic hygiene services by region,Tanzania, 2018 64
Table 6.10: Percentage of schools with a private room for menstrual hygiene services by background characteristics, Tanzania, 2018 73
Table 7.1: Percentage of schools with funds for maintenance and repair of school WASH facilities by location, level of school, ownership status of school, type of school, model of school and region, Tanzania, 2018 78
Table 7.2: Percentage of schools by location, level of school, ownership status ofschool, type of school, model of school and entity responsible for maintenance and repair of school WASH facilities, Tanzania, 2018 80
Table 7.3: Percentage of schools by location, level of school, ownership status of school, type of school, model of school and the entity responsible for cleaning schools’ toilet facilities, Tanzania, 2018 82
Table 8.1: Percentage of schools with pupils/students engaged in WASH/health and Mazingira Clubs by location, level of school, ownership, type of school, model of school and region, Tanzania, 2018 85
Table 8.2: Percentage of schools by location, level, ownership status, type and model of school, region and whether or not the school had visual promotion for good WASH behaviour, Tanzania, 2018 88
Table A2.1.1: Distribution of schools by region, level of school and Ownership status, Tanzania, 2018 97
Table A2.1.2: Final sample allocation of schools by region and ownership status, Tanzania, 2018 98
Table A4.1: Percentage of schools with basic, limited and no water services by region, Tanzania, 2018 99
Table A5.1: Percentage of schools with basic, limited and no sanitation services by region, Tanzania, 2018 100
Table A6.1.1: Percentage of schools with basic, limited and no hygiene services by region, Tanzania, 2018 101
Maps

2018 School Water, Sanitation and Hygiene Assessment | Main Reportviii
Figure 1.1: New JMP service ladders for monitoring WASH in schools 4
Figure 3.1: Percentage of schools by main source of electricity, Tanzania, 2018 22
Figure 4.1: Percentage distribution of schools with basic water services, limited water services and no water services by location, level of school and ownership status, Tanzania, 2018 28
Figure 4.2: Percentage of schools with water source located on school premises by location, level of school and ownership status, Tanzania, 2018 33
Figure 4.3: Percentage of schools that treated their water prior to drinking by location, level of school, model of school and ownership status, Tanzania, 2018 34
Figure 5.1: Percentage distribution of schools with basic sanitation services, limited sanitation services and no sanitation services by location, level and ownership status, Tanzania, 2018 41
Figure 5.2: Percentage of schools that meet the recommended number of pupils per drop hole ratio by level of school, model of school, location and school ownership status, Tanzania, 2018 47
Figure 5.3: Percentage of schools that meet the recommended number of pupils per drop hole ratio by region, Tanzania, 2018 48
Figure 6.1: Percentage of schools with water and soap, water only, soap only and neither water nor soap at the handwashing facilities from reported and observed data, Tanzania, 2018 60
Figure 6.2: Percentage of schools observed to have water and soap at their handwashing facilities by region, Tanzania, 2018 62
Figure 6.3: Percentage of schools with hygiene services by location, level of school and ownership status, Tanzania, 2018 63
Figure 6.4: Percentage of schools teaching hygiene education by mode of teaching, Tanzania, 2018 68
Figure 6.5: Percentage distribution of schools by components of MHM provided by the school, Tanzania, 2018 71
Figure 6.6: Percentage distribution of menstrual hygiene materials provided to the adolescent girls in schools, Tanzania, 2018 72
Figure 6.7: Percentage of schools with a separate room/space for MHM service by availability of water or soap, Tanzania, 2018 74
Figure 6.8: Percentage distribution of schools by the frequency of disposal of menstrual hygiene materials 74
Figure 6.9: Type of mechanisms for disposal of menstrual hygiene materials 75
Figure 8.1: Engagement of pupils in school WASH/MAZINGIRA/Health clubs, Tanzania, 2018 84
Figure 8.2: Percentage of schools holding WASH club meetings by the frequency of the WASH meetings, Tanzania, 2018 87
Figures

2018 School Water, Sanitation and Hygiene Assessment | Main Report ix
Foreword
This report presents the fi ndings of the 2018 School Water, Sanitation and Hygiene (SWASH) Assessment survey. This survey was implemented through a multi-sectoral collaboration of the National Bureau of Statistics (NBS) and the Offi ce of the Chief Government Statistician (OCGS) Zanzibar; the Ministry of Education, Science and Technology (MoEST); the Ministry of Education and Vocational Training, Zanzibar (MoEVT); President’s Offi ce Regional Administration and Local Government (PO–RALG); and President’s Offi ce Regional Administration, Local Government and Special Departments (PO–RALGSD), Zanzibar.
The 2018 School Water, Sanitation and Hygiene (SWASH) Assessment is the fi rst comprehensive, nationally representative survey of primary and secondary schools designed to provide information about the status of safe drinking water, adequate sanitation and hygiene facilities as well as appropriate hygiene practices in Tanzania. Results from this assessment will be used to validate and complement administrative data that the ministries collect from schools on water, sanitation and hygiene services.
The main objective of the SWASH Assessment was to provide up-to-date national data and information on WASH services in primary and secondary schools in Tanzania. This assessment also provides baseline data for reporting, monitoring, and tracking progress on national and global targets, including Sustainable Development Goal (SDG) targets and indicators; specifi cally those in Goal 4 (ensure inclusive and quality education for all and to promote lifelong learning) and Goal 6 (ensure availability and sustainable management of water and sanitation for all).
I, therefore, take this opportunity to encourage policymakers, planners and other stakeholders in WASH, education and health sectors to use these fi ndings to plan, implement, monitor and evaluate their programmes for improving water, sanitation and hygiene services in schools. Advantage should be taken on the availability of this information to inform various processes in educational programmes in Tanzania to ensure that children enjoy a healthy and friendly learning environment that could allow them to be healthier, and more attentive learners. This will also help in improving pupils’/students’ school attendance and their cognitive abilities that, in future, will be instrumental in fulfi lling their dreams.
I would like to call upon all policymakers, planners and other stakeholders in WASH, education and health sectors to adopt and devise integrated and sustainable planning so as to enhance and achieve Goals 6 and 4 that will ensure availability and sustainable management of water and sanitation for all, and attain inclusive and quality education for all promoting lifelong learning.
I also would like to take this opportunity to thank all partners in this exercise: the NBS, OCGS, the Ministry of Education, Science and Technology, President’s Offi ce Regional Administration and Local Government (PO–RALG), the President’s Offi ce Regional Administration, Local Government and Special Departments, Zanzibar and the Ministry of Education and Vocational Training, Zanzibar for active participation and technical inputs.

2018 School Water, Sanitation and Hygiene Assessment | Main Reportx
Special thanks are extended to the United Nations Children’s Fund (UNICEF) for fi nancing this important undertaking, which has led to the availability of updated data and information that will inform policymakers’ decisions. This will further ensure that children in schools learn in a dignifi ed and healthy environment through access to improved water, sanitation and hygiene services.
Engineer Joseph M. NyamhangaPermanent SecretaryPresident’s Offi ce – Regional Administration and Local GovernmentFebruary 2020

2018 School Water, Sanitation and Hygiene Assessment | Main Report xi
Acknowledgement
The successful completion of the fi rst nationally representative survey on SWASH Assessment was made possible by a number of collaborators. The National Bureau of Statistics (NBS) and the Offi ce of Chief Government Statistician (OCGS) would like to take this opportunity to recognize their contributions.
First and foremost, we would like to extend our sincere gratitude to the Government of the United Republic of Tanzania and UNICEF for providing fi nancial assistance that led to the smooth implementation of the 2018 Tanzania SWASH Assessment survey.
We would also like to thank the team from UNICEF Tanzania for their technical assistance provided at all stages: from preparation to implementation of this survey. We are even more grateful for the guidance and support of the survey’s Technical Committee members who came from various organizations including the President’s Offi ce, Regional Administration and Local Government; President’s Offi ce, Regional Administration, Local Government and Special Departments, Zanzibar (PO–RALGSD); the Ministry of Education, Science and Technology; the Ministry of Education and Vocational Training, Zanzibar; WaterAid Tanzania; the Ministry of Land, Housing, Water and Energy Zanzibar, the Water Supply and Sanitation Collaborative Council (WSSCC), and Sanitation and Water Action (SAWA).
Last but not least, the NBS and the OCGS are grateful to the Regional and District Education Offi cers who provided the needed guidance to reach the selected schools. We are also grateful to the fi eld teams and other offi cials and administrators of the schools visited for their co-operation. We also thank the survey respondents for their willingness and patience in providing relevant information.
It is not possible to mention each and every one of those who contributed to the development of this report; however, the NBS values the participation of all those who contributed in one way or another to the successful completion of this important survey.
Dr. Albina ChuwaStatistician GeneralNational Bureau of StatisticsFebruary 2020

2018 School Water, Sanitation and Hygiene Assessment | Main Reportxii
Abbreviations
CAPI Computer-Assisted Personal Interview
CEDAW Conventions on the Elimination of All Forms of Discrimination against Women
CRC Convention on the Rights of the Child
FYDP II Five-Year Development Plan II
JMP Joint Monitoring Programme
MHM Menstrual Hygiene Management
MoEST Ministry of Education, Science and Technology
MoEVT Ministry of Education and Vocational Training, Zanzibar
NBS National Bureau of Statistics
NGOs Non-Governmental Organizations
NSC National Sanitation Campaign
OCGS Offi ce of the Chief Government Statistician, Zanzibar
PO-RALG President’s Offi ce, Regional Administration and Local Government
PO-RALGSD President’s Offi ce, Regional Administration, Local Government and Special Departments, Zanzibar
SAWA Sanitation and Water Action
SDGs Sustainable Development Goals
SNV Netherlands Development Organization
SWASH School Water, Sanitation and Hygiene
UN United Nations
UNICEF United Nations Children’s Fund
URT United Republic of Tanzania
WASH Water, Sanitation and Hygiene
WB World Bank
WHO World Health Organization
WSSCC Water Supply and Sanitation Collaborative Council

2018 School Water, Sanitation and Hygiene Assessment | Main Report xiii
Executive Summary
Development Plan (FYDP II) has also set the target for access to improved sanitation facilities at 75 per cent in rural areas. The Zanzibar Vision 2020 and Zanzibar Strategy for Growth and Reduction of Poverty have set targets of 100 per cent for households’ use of improved toilet facilities and access to safe and clean water.
Rationale for the School
WASH AssessmentRecognizing insuffi ciencies in the quantity and quality of data available on school WASH in Tanzania, the National Bureau of Statistics and the Offi ce of Chief Government Statistician in collaboration with the Ministry of Education, Science and Technology (MoEST); President’s Offi ce Regional Administration and Local Government (PO–RALG); the Ministry of Education and Vocational Training, Zanzibar; President’s Offi ce, Regional Administration, Local Government and Special Departments, Zanzibar (PO–RALGSD); and UNICEF conducted a nation-wide School WASH Assessment survey in 2018.
The 2018 Tanzania SWASH Assessment is the fi rst comprehensive nationally representative survey of primary and secondary schools that was designed to provide information about the availability of safe drinking water, adequate sanitation and hygiene services.
Objectives of the 2018
School WASH AssessmentThe Tanzania School WASH Assessment aimed at determining the national coverage
BackgroundAdequate access to water, sanitation and hygiene (WASH) services is a fundamental human right. It is essential for the realization of all human rights and is necessary for the attainment of better health, education, nutrition and other indices of human development. WASH also contributes to other development goals, particularly those related to poverty and economic growth, urban services, gender equality, resilience and climate change. Access to water and sanitation is interlinked with a number of other key issues and has signifi cant impact on children’s lives and their ability to develop and thrive.
The SDGs have included WASH in schools and have specifi ed indicators for global monitoring of SDG 6 targets 6.1 and 6.2: universal access to WASH – and SDG 4 target 4.a: inclusive and eff ective learning environments for all. These targets and indicators for WASH in schools focus on achieving a basic minimum level of service by 2030. To eff ectively monitor this, the WHO/UNICEF Joint Monitoring Programme for Water Supply, Sanitation and Hygiene (JMP) has introduced new service ladders that identify availability of WASH services at three levels of basic, limited and no service.
In Tanzania the SDGs are being implemented in the framework of Tanzania Development Vision 2025 and the Five-Year Development Plan II (FYDP II 2016/17 to 2020/21); Zanzibar Vision 2020 and Zanzibar Strategy for Growth and Reduction of Poverty (MKUZA III). As part of its Vision 2025, the Government has pledged universal access to safe drinking water by 2025. The Second Five-Year

2018 School Water, Sanitation and Hygiene Assessment | Main Reportxiv
estimates for water, sanitation and hygiene services in schools and establishing baselines for the standard SDG targets and indicators to allow harmonized monitoring, cross-country comparability and regional or global aggregation.
The School WASH Assessment collected information on the number of pupils, teachers and classrooms; services on water, sanitation, and hygiene available at the school; pupil’s engagement in WASH programmes; operation and maintenance of the WASH facilities including funding for maintenance; and responsibility for cleanliness of the facilities.
Sample for the Tanzania
School WASH AssessmentThe sample design of the 2018 School WASH Assessment survey was a stratifi ed random sample of 2,396 schools (2,240 schools from Tanzania Mainland and 156 schools from Zanzibar) selected with equal probability systematic sampling. The sample also provides representative results for urban and rural areas as well as for each of the 26 regions of Tanzania Mainland and the fi ve regions of Zanzibar.
Main ResultsThe 2018 Assessment survey has established the situation of WASH services in schools in the areas of drinking water, sanitation and hygiene. Other important areas, that the survey covered, included operations and maintenance arrangements and children engagement in planning, implementation and monitoring of WASH services. The key results under these components are outlined below.
School Water ServicesThe results from the survey indicate that 68.2 per cent of the schools have an improved source1 of drinking water. Schools in urban areas seem to have better access to an improved source of drinking water than schools in rural areas (84.2 per cent against 63.8 respectively). The most common improved sources of drinking water in Tanzania schools are water piped into school premises (29.5 per cent), tube wells or boreholes (12.1 per cent) and protected wells (9.8 per cent).
Seventy-six per cent of primary schools with drinking water sources in Tanzania provide drinking water to the youngest children in the school. Two thirds of the primary and secondary schools with drinking water sources have made it possible for pupils with limited mobility or vision to access drinking water at school.
Classifi ed with respect to the WHO/UNICEF Joint Monitoring Programme (JMP) ladders for WASH in Schools, more than half of schools in Tanzania (55.3 per cent) had basic drinking water services (had improved sources of drinking water with water available during the assessment). Seven out of ten schools in urban areas (70.5 per cent) had basic water services, while slightly more than half of the rural based schools (51.0 per cent) had basic water services. High regional variations were noticed and the percentage of schools with basic water services ranged from 29.7 per cent in Songwe Region to 91.9 per cent in Kusini Pemba Region.
Thirteen per cent of schools had limited water services, meaning that they had improved sources but water was not available at the time of the assessment. On the other hand, 31.8 per cent of schools had no water
1 ‘Improved drinking water sources include sources that by nature of their construction or active intervention are protected from outside contamination, particularly faecal matter. These include piped water, boreholes or tube wells, protected dug wells, and protected springs/wells.

2018 School Water, Sanitation and Hygiene Assessment | Main Report xv
services, meaning that they either relied on unimproved sources, such as unprotected dug wells, unprotected springs/surface water, or had no water services at all.
The survey further established that two third of schools in Tanzania (67.3 per cent) did not treat their water prior to drinking. For the schools that treated water, the most common methods used were chlorination (50.4 per cent) and boiling (39.3 per cent).
School Sanitation ServicesEighty-nine per cent of the schools had improved toilet facilities, regardless of quality. The three most common types of toilet facilities in Tanzanian schools were pit latrine with washable slabs (41.8 per cent), fl ush to pit latrines (19.7 per cent) and ventilated improved pit latrines (14.0 per cent). Less than one per cent of schools in Tanzania were found to have no toilet facilities.
Thirty per cent of schools had basic sanitation services (improved single-sex sanitation facilities usable at the time of the assessment). Slightly more than a half of schools in urban areas (51.0 per cent) had basic sanitation services compared to 24.3 per cent of schools in rural areas.
In addition, 58.4 per cent of schools were providing limited sanitation services (had improved facilities that were either not single-sex or not usable). Thirteen per cent of schools owned by the Government had no sanitation services compared to only 2.4 per cent of non-government schools. Schools without sanitation services either relied on unimproved facilities, such as pit latrines without a slab, or had no sanitation facility at all. Schools in rural areas were more likely to have no sanitation services than schools in urban areas (13.4 per cent and 4.0 per cent, respectively).
Ninety-four per cent of all-girls schools had basic sanitation services compared to 65.2 per cent of all-boys schools and 28.7 per cent of co-education schools.
There were marked regional variations in the availability of basic sanitation services in schools: the percentage of schools with basic sanitation services ranged from 4.4 per cent in Rukwa Region to 84.4 per cent in Kaskazini Pemba Region.
More than a quarter (26.0 per cent) of primary schools with sanitation services had at least one usable toilet that was accessible to the youngest children at the school. Only 12.2 per cent of schools had at least one usable toilet that was accessible to pupils with physical disability or limited vision.
Twenty-eight per cent of schools in Tanzania met the minimum standard for the number of pupils per drop hole (20 girls and 25 boys per drop hole) set by the Government.
School Hygiene ServicesSix out of ten schools (63.8 per cent) in Tanzania had handwashing facilities. Urban schools (75.3 per cent) were more likely to have handwashing facilities than rural schools (60.6 per cent). The coverage of basic hygiene services in Tanzania was low (17.6 per cent) as only approximately two out of ten schools had handwashing facilities with soap and water available at the time of the survey.
Government-owned schools had a smaller percentage of schools with basic hygiene services (14.4 per cent), compared to schools owned by non-government institutions (39.0 per cent).
Signifi cant variations in the availability of basic hygiene services in schools were found across regions, ranging from 1.4 per cent in Songwe Region to 47.2 per cent in Kilimanjaro.

2018 School Water, Sanitation and Hygiene Assessment | Main Reportxvi
Twenty-eight per cent of schools in Tanzania had limited hygiene services (water was available but no soap available at the time of the assessment). On the other hand, more than fi ve out of ten schools (54.8 per cent) had no hygiene services at all.
Eight out of ten schools that had handwashing facilities also had facilities accessible to the youngest children. Fifty-nine per cent of the schools with handwashing facilities had facilities that are accessible to pupils with physical disability or limited vision.
While 66.8 per cent of schools in Tanzania provided Menstrual Hygiene Management (MHM) services, only one-quarter of the schools had a disposal mechanism for menstrual hygiene waste. Of the Tanzanian schools that provided MHM services, 84.2 per cent provided MHM education and 49.0 per cent provided MHM materials (for example sanitary pads, pants etc.).
Twenty-four per cent of schools in Tanzania that had disposal mechanisms used incinerators for disposal of menstrual hygiene materials followed by sanitary disposal pits (22.8 per cent) and burning chambers (19.5 per cent).
Hygiene education was delivered in 95.8 per cent of schools in Tanzania. There was no signifi cant variations in the teaching of hygiene in terms of level of the school (primary or secondary), ownership and location.
Forty-four per cent of schools in Tanzania had teachers who were trained in hygiene promotion. Primary school teachers (49.2 per cent) were more likely to be trained in hygiene promotion than those working in secondary schools (33.3 per cent).
Operation and MaintenanceFifty-one per cent of schools in Tanzania had funds to cover the maintenance and repair of school WASH facilities at the time of the
survey. Sixty-fi ve per cent of schools had funds to maintain and repair school WASH facilities in urban areas at the time of the survey, compared to 47.0 per cent of schools in rural areas.
Non-government schools were more likely to have allocated funds to cover the maintenance and repair of school WASH facilities (86.3 per cent) than government schools (45.6 per cent).
Across regions, the proportion of schools that had funds (at the time of the survey) to cover the maintenance and repair of school WASH facilities was the highest in Mwanza (70.0 per cent) and the lowest in Kaskazini Unguja (24.3 per cent).
Overall, students or pupils were responsible for cleaning toilets facilities in almost all government schools (99.1 per cent) compared to 50.5 per cent in non-government schools. On the other hand, 57.5 per cent of non-government schools employed cleaning staff compared to less than one per cent of the government schools (0.8 per cent).
Pupils Engagement
Findings from the survey indicate that 63.6 per cent of all schools had WASH/Health/Mazingira clubs’ activities. Zanzibar had a slightly higher per cent of schools with these clubs (66.8 per cent) than Tanzania Mainland (63.5 per cent). As part of implementing activities of the clubs, many schools were conducting WASH meetings weekly (43.3 per cent) or monthly (38.3 per cent).
Among schools with WASH clubs, while 27.9 per cent had visual materials for promotion of good WASH behaviours, only 21.5 per cent had their visual materials displayed on the school premises.

2018 School Water, Sanitation and Hygiene Assessment | Main Report 1
Chapter 1
Introduction

2018 School Water, Sanitation and Hygiene Assessment | Main Report2
1.1 Background
InformationWater, sanitation and hygiene (WASH) is important in its own right, and is also necessary for the attainment of better health, education, nutrition and other indices of human development. WASH also contributes to other development goals, particularly those relating to poverty and economic growth, urban services, gender equality, resilience and climate change. Access to water and sanitation is interlinked with a number of other key issues and has signifi cant impact on children’s lives and their ability to develop and thrive.
In 20102, the UN General Assembly recognised access to water and sanitation as a basic human right, and essential to the realization of all human rights. Likewise, two human treaties – the Convention on the Rights of the Child (CRC)3 and the Conventions on the Elimination of All Forms of Discrimination against Women (CEDAW) – have directly specifi ed the right to water and sanitation as an essential right. This recognition is a testament to the fundamental nature of these basics in every person’s life. The rights to water and sanitation require that these basics are adequate, accessible, safe, acceptable and aff ordable for all and without any discrimination. This is emphasized in the SDG 6 and its respective targets, which advocate for availability and sustainable management of water and sanitation for all, a call that requires “leaving no one behind”.
Inadequate and inequitable access to water and sanitation services, along with inappropriate hygiene practices, in households and institutions largely deter eff orts to realize the rights of every child,
2 The United Nations; Resolution 64/292; The Human Rights to Water and Sanitation: Resolution adopted by the General Assembly on 28 July 2010. <https://www.un.org/ga/search/view_doc.asp?symbol=A/RES/64/292>
3 The United Nations Resolution 44/25; Convention on the Rights of the Child: Resolution adopted by the General Assembly on 20 November 1989. <https://www.ohchr.org/Documents/ProfessionalInterest/crc.pdf>
4 The United Nations Children’s Fund, Child friendly schools manual, UNICEF, New York, 2009.<www.unicef.org/publications/fi les/Child_Friendly_Schools_Manual_EN_040809.pdf>
especially the most deprived, to live in a safe and clean environment. In Tanzania, children and young people, who comprise over 60 per cent of the population, are especially aff ected by the lack of safe water, proper sanitation and inappropriate hygiene practices.
Providing children with safe, dignifi ed, inclusive and reliable school WASH services helps to make the learning environment pleasant and healthy, boosts education achievement and promotes gender equity. It largely contributes to overcoming exclusion from, and discrimination within, education, particularly for girls and children from disadvantaged communities. On the other hand, off ering children with high-quality hygiene education provides them with the basis for healthy and productive lives, and creates future demand for safe water and sanitation services. When integrated with a community programme, it can turn children into agents of change for the whole community. However, most schools in developing countries lack even basic water and sanitation facilities, and hygiene education programmes are often inadequate.4
The appalling situation of WASH services in schools result in obstacles that mostly aff ect adolescent girls as they go through puberty. For adolescent girls, the absence of privacy and dignity owing to lack of improved sanitation facilities has especially negative impacts on health and safety, self-esteem, education and well-being. The situation could lead to stress, shame, embarrassment, confusion and fear. Challenges may stem from a variety of sources: lack of knowledge about menstruation, insuffi cient access to menstrual hygiene materials, and inadequate school WASH facilities for girls that could enable them to change in a private space and discreetly

2018 School Water, Sanitation and Hygiene Assessment | Main Report 3
dispose of menstrual hygiene materials. There is growing evidence that inadequate WASH facilities limits school enrolment, attendance, leads to early dropout and aff ects performance and completion of education.
1.2 Global Overview of
WASH in SchoolsGlobally, access to WASH services in schools remains a matter of serious concern that requires concerted eff orts and urgent attention. The 2018 WHO/UNICEF Joint Monitoring Programme (JMP) for Water Supply, Sanitation and Hygiene report on WASH in schools, that presents the fi rst global estimates for the new SDG indicators, has established that in 20165 about 31 per cent of schools had no basic drinking water services, implying that nearly 570 million children worldwide lacked basic drinking water services at their schools. The report has also observed disparities between the percentage of primary schools (25 per cent) and secondary schools (17 per cent) having no basic drinking water services. The situation is particularly dire in sub-Saharan
Table 1.1: Global goals and targets related to WASH in schools
SDG Targets
Goal 6: Ensure availability and sustainable management of water and sanitation for all
6.1 By 2030, achieve universal and equitable access to safe and aff ordable drinking water for all
6.2 By 2030, achieve access to adequate and equitable sanitation and hygiene for all and end open defecation, paying special attention to the needs of women and girls, and those in vulnerable situations
Goal 4: Ensure inclusive and quality education for all and promote lifelong learning
4.a Build and upgrade education facilities that are child, disability and gender sensitive and provide safe, non-violent, inclusive and eff ective learning environments for all
4.a.1 Increase the proportion of schools with access to: (a) electricity, (b) the Internet for pedagogical purposes, (c) computers for pedagogical purposes, (d) adapted infrastructure and materials for students with disabilities, (e) basic drinking water, (f) single-sex basic sanitation facilities, and (g) basic handwashing facilities (as per the WASH indicator defi nitions)
5 Drinking water, sanitation and hygiene in schools: global baseline report 2018. New York: United Nations Children’s Fund (UNICEF) and World Health Organization, 2017
Africa where 47 per cent of schools have no drinking water service.
The availability of functional and private school toilets can positively impact health and learning outcomes, particularly for girls. The JMP report further indicates that in 2016, over 620 million children worldwide (34 per cent) lacked access to basic sanitation services in their schools. Among them, over 410 million (23 per cent) had no sanitation services at all at their schools. Coverage of basic sanitation services was lower in rural schools (57 per cent compared to 66 per cent of total schools), and in primary schools (63 per cent) compared to secondary schools (72 per cent).
In terms of hygiene, the report established that 53 per cent of schools had basic hygiene services defi ned as handwashing facilities, with water and soap available at the time of the survey. Nearly 900 million children worldwide lacked access to basic hygiene services in their schools. The coverage of hygiene services was below 50 per cent in Oceania and sub-Saharan Africa.

2018 School Water, Sanitation and Hygiene Assessment | Main Report4
The SDGs aim for universal access to WASH and inclusive and eff ective learning environments for all. These have included WASH services in schools and have specifi ed indicators for the global monitoring of SDG targets 6.1 and 6.2: universal access to WASH – and SDG target 4.a: inclusive and eff ective learning environment for all (Table 1.1).
SDG targets and indicators for WASH in schools focus on achieving a basic minimum level of service by 2030. To eff ectively monitor this, the WHO/UNICEF Joint Monitoring Programme (JMP) for WASH has introduced new service ladders that are clearly elaborated in Figure 1.1.
1.3 Overview of WASH in
Schools in TanzaniaIn Tanzania today, more children are attending schools as parents heed to the national call for education of their children. This is the result
of a number of successful policy initiatives, most notably the abolition of school fees and improvement on the quality of education through various programmes. The fee-free education policy, introduced in 2015, has had positive eff ects in increasing the number of pupils enrolled in schools across the country.
However, the increased number of pupils enrolled in schools means that the infrastructure in existing schools is overloaded and is supporting numbers of pupils that far exceed the initial design loads. This means that even where WASH facilities had been provided they are now insuffi cient to meet the needs of all pupils enrolled. Overloaded WASH facilities can remain functional only up to a certain point, even assuming the presence of good operations and maintenance regime. Added to this is the fact that most investments in schools under the education sector have focused on educational infrastructures, often overlooking WASH facilities.
Figure 1.1: New JMP service ladders for monitoring WASH in schools6
6 WHO/UNICEF JMP (2018). For further information see https://washdata.org
Service Level Drinking Water Sanitation Hygiene
Drinking water from an improved source and water is available at the school
Improved sanitation facilities at the school that are single-sex and usable (available, functional and private)
Hand-washing facilities with water & soap available at the schoolBasic
Service
There is an improved source (piped water, protected well/spring, rainwater, bottled water), but water not available at the time of survey
There are improved facilities (fl ush/pour fl ush, pit latrine with slab, composting toilet), but not sex-separated or not usable
Hand-washing facilities with water but no soap available at the school Limited
Service
Drinking water from an unimproved source or no water source at the school
Unimproved sanitation facilities or no sanitation facilities at the school
No hand-washing facilities available or no water available at the school
No Service

2018 School Water, Sanitation and Hygiene Assessment | Main Report 5
According to the 2018 statistics from PO–RALG7 in Mainland, and the Ministry of Education and Vocational Training8 in Zanzibar, Tanzania had 18,002 primary schools. Of this, 94 per cent (16,922) are owned and operated by the Government and 6 per cent are run by non-government institutions. These schools accommodate more than 9.6 million school children of which 97 per cent (9.3 million) are enrolled in government schools. The country also had over 5,022 secondary schools that off er post-primary education.
Low access to WASH services in schools has been a persistent problem over decades and contributes to poor and unhealthy learning environment. The school WASH mapping that was conducted in 2010 by UNICEF, WaterAid and the Netherlands Development Organization (SNV), covering 2,697 schools in 16 districts, established a dire situation indicating that 38 per cent of government primary schools had no water supply on the school premises and only 46 per cent had access to improved toilets. Existing facilities seldom benefi tted children with mobility disabilities as only 4 per cent of schools had suitable sanitation facilities for them. The mapping further revealed that, in schools with functional latrines, 52 per cent of facilities for girls had no doors to off er privacy.
1.4 National School WASH
AssessmentMonitoring and data management are necessary for evidence-based policy-making, planning and service delivery. In Tanzania, monitoring and data management for WASH services in the sector are often conducted by a range of diff erent actors within the Government, including diff erent ministries in charge of water, sanitation, health or planning. The sources of data and methods applied to produce national
and sub-national estimates often vary within the country and between diff erent agencies. Donors, UN agencies and non-governmental organizations (NGOs) often use their own approaches to collect and monitor data for their own projects. Lack of coordination among diff erent stakeholders result in diffi culties in collating data from diff erent sources, measuring trends and duplication of eff orts. It also results in contradictory conclusions in the assessment of school WASH status and progress. Addressing this situation requires harmonization and clear coordination of these eff orts. This will ensure that the Government and all school WASH stakeholders have access to credible data to underpin planning, and to ensure service delivery for scaling-up of WASH in schools.
The prevailing situation on monitoring and data management has led to a lack of up-to-date data and information on school WASH. The last meaningful assessment that covered only 16 districts was done in 2009/2010. Available information through routine monitoring by the education sector provides very basic information and is usually limited to the number of toilet stances per school. It provides little information on the quality and adequacy of services measured against the school WASH guidelines. The need for a national assessment to establish the status of WASH services in Tanzanian schools was very important to help fi ll in the current critical data gap.
1.5 ObjectiveThe overall objective of this assessment was to determine the national coverage estimates for water, sanitation and hygiene services in schools, thus helping to establish baselines for the standard SDG targets indicators to allow harmonized monitoring, cross-
7 BEST 20178 Zanzibar Statistical Education Abstract 2017

2018 School Water, Sanitation and Hygiene Assessment | Main Report6
country comparability and regional or global aggregation.
Specifi c objectives of this undertaking were to:
1. Fill in data gaps to inform sector programme-planning, strategies for scaling up school WASH services, and policy advocacy in eff orts towards fulfi lling children’s right to better education
2. Inform equity/policy advocacy, resource mobilization, allocation and better targeting
3. Obtain information that will be used to create awareness of the scale of the problem and how it aff ects educational outcomes for school children, especially girls
4. Establish database for data defi nitions and appropriate data sets for the management and monitoring of school WASH in the country
5. Help strengthen the routine data collection system in the education sector to consider the quality of WASH services provided to students and staff in data collection

2018 School Water, Sanitation and Hygiene Assessment | Main Report 7
Chapter 2
METHODOLOGY AND IMPLEMENTATION

2018 School Water, Sanitation and Hygiene Assessment | Main Report8
The 2018 School Water, Sanitation and Hygiene Assessment (SWASH) was a sample survey of all formal and active schools in Tanzania. This chapter provides detailed information on the sample design of the Tanzania School WASH Assessment and some key aspects of the implementation of the assessment.
2.1 Sample DesignThe survey was designed to provide national-level representative results by school level, that is, primary and secondary schools; and by managing authority, that is government and non-government-owned schools. The survey was also designed to provide representative results for rural-urban areas, Tanzania Mainland and Zanzibar, and for 31 regions of Tanzania (26 regions of Tanzania Mainland and the fi ve regions of Zanzibar).
2.1.1 Sampling Frame
The sampling frame used, for the 2018 School WASH Assessment, was a complete list of all formal schools in Tanzania. The list was provided by the President’s Offi ce, Regional Administration and Local Government (PO–RALG) in Tanzania Mainland and the Ministry of Education and Vocational Training in Zanzibar. The list consisted of 23,024 schools (22,410 schools of Tanzania Mainland and 614 schools of Zanzibar) – among them,18,002 were primary schools and 5,022 were secondary schools. Among all schools, 20,233 were managed by the Government and 2,791 were managed by non-government institutions.
The classifi cation of school levels in Tanzania Mainland is diff erent from that in Zanzibar. The structures of school level in Tanzania Mainland are pre-primary and primary, and secondary; while in Zanzibar, the levels of schools are pre-primary and primary, primary only, basic (primary and secondary) and secondary.
For the purpose of this assessment, the sampling frame of the levels of schools in Zanzibar was modifi ed to match that of schools in Tanzania Mainland. All pre-primary and primary, primary only and basic schools from the sample were grouped as primary schools. Table A 2.1.1 in Annex A presents a detailed distribution of schools in a sampling frame by region, level of school and the managing authority.
2.1.2 Sampling Procedure
The sample design of the 2018 School WASH Assessment used a stratifi ed random sampling methodology whereby a total sample of 2,396 schools was selected (2,240 schools in Tanzania Mainland and 156 schools in Zanzibar). The distribution of selected schools in each region was proportional to the number of schools in each region. In order to achieve comparable survey precision across regions, regions with small number of schools were oversampled. For the same reason, secondary schools were also oversampled, whereas primary schools were under sampled because they were relatively in larger numbers compared to secondary schools. In each region, the schools to participate in the assessment were systematically selected. The sample size allocation is shown in Table 2.1.
Stratifi cation was accomplished by separating the schools by school level within each region. To achieve implicit stratifi cation, it was desirable to sort the sampling frame based on management authority and it was done independently within the sampling stratum. The sampled schools in each region were then systematically selected from the sorted list of schools using a fi xed sampling interval and a random start. Table A2.1.2 in Annex A provides details about the fi nal sample allocation (according to the management authority) of schools by region, which used the above described sampling procedure.

2018 School Water, Sanitation and Hygiene Assessment | Main Report 9
Table 2.1: Final sample allocation of schools by region and by level of school, Tanzania, 2018
Regions Level of schools Number of schools
Primary Secondary
Dodoma 68 32 100
Arusha 65 35 100
Kilimanjaro 76 42 118
Tanga 82 37 119
Morogoro 76 33 109
Pwani 60 27 87
Dar es Salaam 58 44 102
Lindi 54 22 76
Mtwara 65 24 89
Ruvuma 68 29 97
Iringa 49 28 77
Mbeya 63 32 95
Singida 53 27 80
Tabora 70 26 96
Rukwa 44 18 62
Kigoma 60 28 88
Shinyanga 60 23 83
Kagera 76 34 110
Mwanza 76 36 112
Mara 70 30 100
Manyara 48 21 69
Njombe 41 18 59
Katavi 22 9 31
Simiyu 42 21 63
Geita 49 16 65
Songwe 36 17 53
Tanzania Mainland 1,531 709 2,240
Kaskazini Unguja 17 9 26
Kusini Unguja 16 9 25
Mjini Magharibi 35 12 47
Kaskazini Pemba 14 14 28
Kusini Pemba 16 14 30
Zanzibar 98 58 156
Tanzania 1,629 767 2,396

2018 School Water, Sanitation and Hygiene Assessment | Main Report10
2.1.3 Sampling Weights
In order for the sample estimates from the 2018 School WASH survey to be representative at the national, regional, school-type and managing authority levels, sampling weights were employed during analysis. Similarly, sampling weights were used to account for unequal allocation of sampled schools to diff erent school types and regions. Since the School WASH Assessment sample is a stratifi ed random sample, survey sampling weights were calculated based on
school design weights after adjusting for non-response at the sampling stratum level. The school design weight for each sampled school in each stratum equals to the inverse of its probability of selection.
During data analysis, using statistical software (STATA), the analytic weights option was used to produce weighted results. With the analytic weights option, the total number of unweighted cases (total number of sampled schools) equals the total number of weighted cases at the national level (Table 2.2).
Background characteristics Percentage distribution of surveyed schools (Weighted)
Number of schools surveyed
Weighted Unweighted
Level of school
Primary school 68.8 1,640 1,612
Secondary school 31.2 745 773
Ownership status
Government 86.8 2,069 2,066
Non-Government 13.2 316 319
Region
Dodoma 4.3 102 100
Arusha 4.4 105 100
Kilimanjaro 5.5 131 118
Tanga 5.6 135 119
Morogoro 5.1 121 109
Pwani 4.3 102 87
Dar es Salaam 4.6 109 97
Lindi 3.0 72 76
Mtwara 3.5 83 89
Ruvuma 4.5 106 97
Iringa 2.9 68 77
Mbeya 4.0 96 94
Singida 2.9 69 79
Tabora 4.2 101 96
Table 2.2: Percentage distribution of surveyed schools (weighted), and weighted and unweighted numbers of schools, by background characteristics, Tanzania, 2018
(Continued)

2018 School Water, Sanitation and Hygiene Assessment | Main Report 11
Background characteristics Percentage distribution of surveyed schools (Weighted)
Number of schools surveyed
Weighted Unweighted
Rukwa 2.0 48 62
Kigoma 3.5 83 88
Shinyanga 3.0 72 83
Kagera 5.3 127 107
Mwanza 5.2 124 112
Mara 4.5 106 99
Manyara 3.5 84 69
Njombe 2.7 64 59
Katavi 1.1 26 31
Simiyu 2.8 66 63
Geita 2.9 69 65
Songwe 2.1 51 53
Kaskazini Unguja 0.4 9 26
Kusini Unguja 0.4 9 26
Mjini Magharibi 1.1 25 47
Kaskazini Pemba 0.4 10 28
Kusini Pemba 0.5 12 29
Tanzania 100.0 2,385 2,385
(Continued)
2.2 Survey
Implementation
2.2.1 Questionnaire Design
and Type
The 2018 School WASH Assessment questionnaires were developed after a series of meetings by technical staff from the NBS, the OCGS, the President’s Offi ce, Regional Administration and Local Government (PO–RALG), the Ministry of Education, Science and Technology (MoEST) in Tanzania Mainland and the Ministry of Education and Vocational Training, Zanzibar and UNICEF. Core and extended questions for WASH in schools from WHO/UNICEF JMP were included and adapted to refl ect relevant issues in Tanzania
along with questions proposed by the ministries responsible for education in both Tanzania Mainland and Zanzibar. Inputs were also solicited from various key stakeholders representing government ministries and agencies, NGOs and international donors. The fi nal drafts of the questionnaires were discussed at a stakeholders’ meeting organized by the NBS in September, 2018. The adapted questionnaires were translated from English into Kiswahili and pretested from 1 to 7 October 2018 in Kilimanjaro Region.
The 2018 School WASH Assessment used three main types of data collection tools:
School Water, Sanitation and Hygiene Facility Questionnaire: This questionnaire collected information mainly

2018 School Water, Sanitation and Hygiene Assessment | Main Report12
on school identifi cation, water sources and availability, sanitation and hygiene services, operation and maintenance, and pupils’ engagement.
School Water, Sanitation and Hygiene Observation Questionnaire: This questionnaire was used as a check list to guide observations on the availability of school duty rosters and health messaging, drinking water services, handwashing stations and toilets.
Local Government Level Questionnaire: This questionnaire was used to capture information for monitoring implementation of National Sanitation Campaign (NSC) at the Council level.
Final versions of the English questionnaires have been included as Annex B to this report. The School WASH Assessment facility questionnaire and the School WASH Assessment Observation questionnaire were loaded in tablets and administered as computer-assisted personal interviews (CAPI). The Local Government Level questionnaire was administered as a paper questionnaire but the data were entered and edited immediately after the collection.
2.2.2 Pilot Test
A pilot test was conducted in Kilimanjaro Region for seven days, from 1 to 7 October 2018. The main objective of the pilot exercise was to determine the strengths and shortcomings of the questionnaires and to ensure reliable formatting, wording and ordering of questions. This helped to refi ne and fi nalize the questionnaires. The exercise involved technical members from the NBS, the OCGS, the MoEST, Tanzania Mainland, the MoEVT, Zanzibar, PO–RALG, and UNICEF, Tanzania.
Prior to the pilot test, classroom instructions were given to interviewers over three days, followed by two days of fi eld practice and two days for feedback from the fi eldwork.
2.2.3 Main Training of the
Field Staff
The main training of interviewers and supervisors took place in Dar es Salaam Region from 23 to 31 October 2018. A total of 70 interviewers and 18 supervisors were recruited across the country to participate in the training.
The training was conducted through lectures, classroom presentations, mock interviews, role plays and fi eld practice. Interviewers were evaluated through in-class exercises, quizzes and observations made especially during fi eld practices. Towards the end of the classroom training, the trainees were assigned to 18 teams (15 teams in Tanzania Mainland and 3 teams in Zanzibar), each team consisting of one supervisor, three interviewers and one driver to conduct data collection exercise.
2.2.4 Data Collection and
Activities
Data collection exercise was conducted from 1 November 2018 to 10 December 2018 by the 18 fi eld teams mentioned above. The interviewers were responsible for fi lling in the electronic questionnaires on tablets and the supervisors were responsible for reviewing all questions for completeness, quality, and consistency before transferring data electronically to the NBS headquarters daily. The system allowed real time checks and data access to the server.
Face-to-face interviews were used as a method of data collection in which the

2018 School Water, Sanitation and Hygiene Assessment | Main Report 13
questionnaire was administered by the enumerator to the head teacher or any other knowledgeable representative at the school. Direct observations and spot checks were used to complete observation questionnaires to establish whether schools adhered to acceptable WASH guidelines for safe and healthy learning environments. Additionally, supervisors had roles of overseeing fi eldwork logistic activities and completing the Local Government questionnaire at the council level. Respondents for this questionnaire were the Councils’ school WASH Coordinators.
Fieldwork supervision and quality control visits were coordinated at the NBS and the OCGS headquarters. Technical people from the NBS, the OCGS, the MoEST, Tanzania Mainland, the PO-RALG and the MoEVT, Zanzibar and UNICEF constituted the quality control teams. They periodically visited teams to review their work and monitor data quality.
2.2.5 Data Processing
In the 2018 School WASH Assessment, data processing was done concurrently with data collection in the fi eld. This was done by entering information on tablets. Using the Internet, team supervisors transferred data to a server located at the NBS headquarters in Dodoma on a daily basis. Processing of the data allowed for regular monitoring of team performance and data quality. Feedback was individually tailored for each team. Data cleaning and fi nalization were completed in December, 2018.
2.2.6 Response Rate
The fi nal school response rate is in reference to the original number of schools selected. Out of the 2,396 selected schools, two non-government schools denied taking part in the survey and nine schools could not be reached. The remaining 2,385 schools were successfully interviewed, yielding a response rate of 99.5 per cent.

2018 School Water, Sanitation and Hygiene Assessment | Main Report14
Chapter 3
CHARACTERISTICS OF SCHOOLS IN TANZANIA

2018 School Water, Sanitation and Hygiene Assessment | Main Report 15
This chapter presents background information on primary and secondary schools in Tanzania with the aim of assessing availability and level of use of school facilities by pupils/students and school staff . For example, details in terms of school population and available facilities, such as the average number of pupils/students or classes and pupils per school are good indicators of the pressure exerted on school infrastructure including WASH facilities.
3.1 Average Number of
Pupils/Students per
SchoolThe results of the 2018 School WASH Assessment indicate that; by level of school, the average number of pupils/students per school is 642 pupils and 440 students for primary and secondary schools respectively. The average number of pupils/students in both primary schools and secondary schools is higher in Zanzibar (825 and 618 in primary and secondary schools respectively) than in the Mainland (638 and 434 respectively).
Urban schools were found to have a higher average number of pupils/students per school (876 for primary schools and 544 for secondary schools) than schools in rural areas (592 pupils and 391 students respectively). Non-Government schools had signifi cantly lower average number of primary school pupils (259) and secondary school students (294) than schools owned by the Government (675 pupils for primary schools and 489 students for secondary schools).
Co-education secondary schools had a higher average number of students (446) than schools with only girls (372) and those with boys only (398). Furthermore, secondary schools with both day and boarding students tended to have a higher average number of students (514) than boarding only (379) and day only (436) schools.
Diff erences exist across regions in Tanzania with primary schools in Dar es Salaam having the highest average number of pupils (1,359) and Kilimanjaro having the lowest (283). On the other hand, the highest average number of students for secondary schools is found in Mjini Magharibi Region (804), whereas the lowest is found in Lindi Region (228) (Table 3.1).
Background characteristics Primary schools Secondary schools
Average Median Average Median
Mainland/Zanzibar
Mainland 638 516 434 355
Zanzibar 825 618 618 503
Location of School
Rural 592 505 391 337
Urban 876 606 544 475
Ownership Status
Government 675 548 489 411
Non-Government 259 227 294 213
Table 3.1: Average and median number of primary and secondary schools’ pupils/students by residence, ownership, type of school and model of school, Tanzania, 2018
(Continued)

2018 School Water, Sanitation and Hygiene Assessment | Main Report16
Background characteristics Primary schools Secondary schools
Average Median Average Median
Model of School
Boarding School 270 92 379 324
Day Schools 651 521 436 363
Both (Boarding and Day) 419 333 514 441
Region
Dodoma 636 583 401 373
Arusha 461 412 470 400
Kilimanjaro 283 232 416 335
Tanga 494 455 437 406
Morogoro 543 468 370 275
Pwani 418 322 399 315
Dar es Salaam 1,359 596 487 167
Lindi 358 315 228 169
Mtwara 435 387 337 324
Ruvuma 487 435 498 438
Iringa 449 413 445 435
Mbeya 483 373 467 339
Singida 657 614 305 257
Tabora 765 687 492 487
Rukwa 832 754 360 298
Kigoma 762 745 345 318
Shinyanga 781 653 361 324
Kagera 725 595 402 396
Mwanza 928 811 626 654
Mara 711 715 454 366
Manyara 535 528 449 402
Njombe 511 504 423 303
Katavi 1,150 905 577 587
Simiyu 1,026 992 321 238
Geita 973 776 648 645
Songwe 462 309 471 386
Kaskazini Unguja 699 658 528 460
Kusini Unguja 443 448 497 462
Mjini Magharibi 750 258 804 774
Kaskazini Pemba 1,080 849 462 379
Kusini Pemba 1,110 896 565 468
Tanzania 642 516 440 363
(Continued)

2018 School Water, Sanitation and Hygiene Assessment | Main Report 17
3.3 Average Number of
Teachers per School
According to the 2018 School WASH Assessment, the average number of teachers per school was 12 and 14 for primary and secondary schools, respectively. Like the number of pupils, the average numbers of teachers in both primary and secondary schools were higher in Zanzibar (36 and 23 respectively) than in the Mainland (11 and 14 respectively).
As expected, urban schools were found to have a signifi cantly higher average number of teachers (27 for primary schools and 21 for secondary schools) than schools in rural areas (8 and 10 teachers respectively).
Findings also revealed that government schools had a higher average number of teachers per school for both primary (12) and secondary (16) schools than the non-government-owned schools (eight for primary schools and seven teachers for secondary schools).
Secondary schools with both day and boarding students and day only schools had a higher average number of teachers (15) than only boarding schools (9) did.
Among all the regions surveyed, Mjini Magharibi Region had the highest average number of teachers per school for both primary schools (49) and secondary schools (35); whereas, Lindi Region had the lowest average number of teachers per school for both primary (5) and secondary (4) schools (Table 3.2).
Background characteristics Primary schools Secondary schools
Average Median Average Median
Mainland/Zanzibar
Mainland 11 6 14 8
Zanzibar 36 24 23 14
Location of School
Rural 8 6 10 8
Urban 27 18 21 12
Ownership Status
Government 12 6 16 10
Non-Government 8 4 7 4
Model of School
Boarding School 7 12 9 6
Day School 12 6 15 8
Both (Boarding and Day) 11 8 15 8
Region
(Continued)
Table 3.2: Average and median number of primary and secondary schools’ teachers by location, ownership status, type of school and model of school, Tanzania, 2018

2018 School Water, Sanitation and Hygiene Assessment | Main Report18
Background characteristics Primary schools Secondary schools
Average Median Average Median
Dodoma 10 8 14 8
Arusha 15 12 21 12
Kilimanjaro 10 8 18 12
Tanga 10 6 15 10
Morogoro 11 8 16 14
Pwani 11 6 18 16
Dar es Salaam 40 26 22 6
Lindi 5 4 4 2
Mtwara 6 4 7 6
Ruvuma 7 4 14 8
Iringa 11 10 18 10
Mbeya 11 6 15 8
Singida 7 4 7 6
Tabora 11 6 10 8
Rukwa 8 8 7 4
Kigoma 8 4 6 6
Shinyanga 11 8 11 8
Kagera 9 6 9 8
Mwanza 17 8 16 10
Mara 8 6 6 4
Manyara 8 6 18 12
Njombe 12 8 13 14
Katavi 13 10 9 12
Simiyu 9 8 6 6
Geita 11 4 13 8
Songwe 6 6 12 10
Kaskazini Unguja 39 38 20 18
Kusini Unguja 26 28 24 20
Mjini Magharibi 49 20 35 30
Kaskazini Pemba 17 18 8 6
Kusini Pemba 29 30 15 14
Tanzania 12 6 14 8
(Continued)

2018 School Water, Sanitation and Hygiene Assessment | Main Report 19
3.4 Average Number of
Classrooms in Use per
School
The 2018 School WASH Assessment results show that, on average, a school in Tanzania had eight classrooms that were being used at the time of the assessment. Zanzibar had a relatively higher average number of classrooms that were being used (12) than the Mainland (8). In urban schools, an average of 11 classrooms was being used as compared to an average of 8 classrooms being used in rural schools.
Primary schools in Tanzania had a relatively smaller average number of classrooms in use at the time of the assessment than secondary schools did.
On the other hand, while schools having both day and boarding facilities had an average of 12 classrooms in use at the time of the survey, boarding and day schools had an average of ten and eight classrooms in use, respectively (Table 3.3).
Schools in the Mjini Magharibi Region had the highest average number of classrooms in use (13) while the Lindi Region had schools with the lowest average number of classrooms in use (6) (Table 3.3).
Background characteristics Average number Median Total
Mainland/Zanzibar
Mainland 8 7 182,132
Zanzibar 12 10 7,205
Location of School
Rural 8 7 135,759
Urban 11 9 53,578
Level of School
Primary school 8 7 119,467
Secondary school 10 8 69,870
Ownership Status
Government 8 7 160,652
Non-Government 9 8 28,686
Model of School
Boarding School 10 8 12,739
Day School 8 7 156,393
Both (Boarding and Day) 12 10 20,205
Region
Dodoma 8 7 7,413
(Continued)
Table 3.3: Average, median and total number of classrooms by location, level of school, ownership status and model of school, Tanzania, 2018

2018 School Water, Sanitation and Hygiene Assessment | Main Report20
Background characteristics Average number Median Total
Arusha 10 9 9,875
Kilimanjaro 8 7 10,434
Tanga 8 7 10,064
Morogoro 7 7 8,583
Pwani 8 7 7,791
Dar es Salaam 12 10 12,570
Lindi 6 6 4,389
Mtwara 7 6 5,459
Ruvuma 8 8 8,382
Iringa 9 8 5,736
Mbeya 9 8 8,431
Singida 7 6 4,344
Tabora 7 7 7,161
Rukwa 8 7 3,553
Kigoma 7 7 5,845
Shinyanga 9 7 5,907
Kagera 8 7 9,678
Mwanza 9 8 10,268
Mara 8 7 8,057
Manyara 8 7 6,786
Njombe 9 8 5,340
Katavi 9 7 2,174
Simiyu 8 8 5,182
Geita 7 7 4,674
Songwe 8 7 4,037
Kaskazini Unguja 11 11 934
Kusini Unguja 11 11 953
Mjini Magharibi 13 11 3,136
Kaskazini Pemba 10 9 960
Kusini Pemba 11 10 1,222
Tanzania 8 7 189,337
(Continued)

2018 School Water, Sanitation and Hygiene Assessment | Main Report 21
3.5 Access and Sources of
Electricity in SchoolsThe 2018 School WASH Assessment collected information on whether a school was connected to electricity or not.
Almost half of the schools in Tanzania (49.9 per cent) had electricity regardless of the source (Table 3.4). The coverage of schools with electricity in Zanzibar (94.9 per cent) was signifi cantly higher than that of schools in Tanzania Mainland (48.7 per cent). As expected, schools located in urban areas were more likely to have electricity (76.6 per cent) than those in rural areas (42.3 per cent).
Schools owned by non-government organization were more likely to have electricity (95.3 per cent) than government-owned schools (43.0 per cent).
While only about four out of ten primary schools (35.6 per cent) had electricity, eight out of ten secondary schools (81.6 per cent) were connected to electricity. Almost all boarding schools (98.5 per cent) were connected to electricity.
Map 3.1 indicates signifi cant diff erences across regions of Tanzania with respect to electricity connectivity among schools. While almost all schools (100 per cent) in Kusini Pemba and Mjini Magharibi regions were connected to electricity, only 27.5 per cent of schools in Shinyanga Region had electricity.
Background characteristics Schools with electricity Number of schools
Mainland/Zanzibar
Mainland 48.7 2,320
Zanzibar 94.9 65
Location of School
Rural 42.3 1,857
Urban 76.6 528
Level of School
Primary school 35.6 1,640
Secondary school 81.6 745
Ownership Status
Government 43.0 2,069
Non-Government 95.3 316
Model of School
Boarding School 98.5 127
Day School 43.0 2,077
Both (Boarding and Day) 95.5 181
Tanzania 49.9 2,385
Table 3.4: Percentage of schools with electricity by background characteristics, Tanzania, 2018

2018 School Water, Sanitation and Hygiene Assessment | Main Report22
Kagera50.5
Geita35.7
27.5
Tabora40.8
Katavi56.6
Rukwa35.3
Morogoro35.6
Tanga42.7
Manyara45.8
Arusha63.0
Singida38.0
Kilimanjaro55.9
Ruvuma38.1
Pwani43.1
Dodoma37.8
Kigoma46.9
Simiyu46.1Mwanza
46.4
Mara35.9
Iringa68.0
Songwe38.6
Mbeya46.6
Dar es Salaam94.0
DRC
ZAMBIA
MALAWI Lake Nyasa
BURUNDI
RWANDA
UGANDA
Lake Victoria
KENYA
Lake Tanganyika
L. Rukwa
Shinyanga
Njombe75.4
Lindi49.2
Mtwara70.5
IndianOcean
Up to 35.9035.91 – 43.0943.10 – 56.5956.60 – 75.40> 75.40
Legend:Percentage of schools with electricity
Mjini Magharibi 100.0
Kaskazini Pemba 92.9
Kusini Pemba 100.0
Kaskazini Unguja 83.0
Kusini Unguja 88.3
Indian Ocean
MOZAMBIQUE
0 50 100 150 Km
N
L.Natron L.Eyasi
L.Manyara
Map 3.1: Percentage of schools with electricity by region, Tanzania, 2018
Overall, the main source of electricity for schools in Tanzania was connection to the National grid supplied by TANESCO (40.8 per cent), followed by solar power (13 per cent).
About 3 per cent of schools in Tanzania used generators as the main source of electricity and less than one per cent used other sources of electricity (Figure 3.1).
Figure 3.1: Percentage of schools by main source of electricity, Tanzania, 2018
45
40
35
30
25
20
15
10
5
0TANESCO Solar Generator Other
40.8
13.0
2.80.4

2018 School Water, Sanitation and Hygiene Assessment | Main Report 23
3.6 Provision of Meals for
Pupils
Information on the provision of meals for pupils was also collected in the 2018 School WASH Assessment. Meal include any food (breakfast, lunch or dinner) provided to the pupils/students. About half of the schools (49.7 per cent) in Tanzania provided meals to pupils/students. While about half of the schools (50.3 per cent) in Tanzania Mainland provided meals to the pupils/students, only 28.2 per cent of the schools in Zanzibar did so. Urban schools (54.9 per cent) were more likely to provide meals to the pupils/students than rural based schools (48.2 per
cent). Furthermore, a higher percentage of secondary schools (64.4 per cent) provided meals to their students than primary schools (43.0 per cent).
More than nine out of ten non-government schools provided meals to their-pupils/students, compared to only to about four out of ten government-owned schools that provided meals to pupils/students.
As expected, all boarding schools provided meals to their students whereas; 42.2 per cent of the day schools and 97.7 per cent of schools with both day and boarding facilities provided meals to their pupils/students (Table 3.5).
Background characteristics Percentage Number of schools
Mainland/Zanzibar
Mainland 50.3 2,320
Zanzibar 28.2 65
Location of School
Rural 48.2 1,857
Urban 54.9 528
Level of School
Primary school 43.0 1,640
Secondary school 64.4 745
Ownership Status
Government 43.1 2,069
Non-Government 92.8 316
Model of School
Boarding School 100.0 127
Day School 42.4 2,077
Both (Boarding and Day) 97.7 181
Total 49.7 2,385
Table 3.5: Percentage of schools providing meal by background characteristics, Tanzania, 2018

2018 School Water, Sanitation and Hygiene Assessment | Main Report24
Map 3.2 shows that signifi cant diff erences existed among schools in regions of Tanzania with respect to the provision of food to pupils/students.
While Njombe Region had the highest percentage of schools off ering meals to their pupils/students (96.9 per cent), Kusini Pemba Region had the lowest percentage of schools (4.1 per cent) providing food to their pupils/students.
Map 3.2: Percentage of schools providing meals to the pupils by region, Tanzania, 2018
L. Rukwa
Lake Nyasa
Lake Nyasa
Lake Tanganyika
Kagera32.1
Geita34.5
Shinyanga30
Tabora37.7
Katavi50.0
Rukwa19.7
Njombe96.9
Morogoro45.6
Tanga55.1
Manyara64.1
Arusha84.9
Singida25 .0
Kilimanjaro89.9
Ruvuma70.0 Mtwara
54.5
Lindi46.0
Pwani42.1
Dodoma18.2
Kigoma24.9
Simiyu24.0Mwanza
49.9
Mara38.4
Iringa82.1
Songwe62.7
Mbeya52.4
Dar es Salaam54.9
DRC
ZAMBIA
MALAWI
BURUNDI
RWANDA
UGANDA
KENYA
Lake Victoria
Indian Ocean
Kaskazini Unguja 21.2
Kaskazini Pemba 7.1
Kusini Pemba 9.5
Kusini Unguja 7.3
Mjini Magharibi 29.5
Indian Ocean
Up to 7.107.11 – 32.0932.10 – 50.0050.01– 70.00> 70.00
Legend:Percentage of schools providing meals
L. Rukwa
MOZAMBIQUE
0 50 100 150 Km
N
Lake Nyasa
L.Natron L.Eyasi
L.Manyara

2018 School Water, Sanitation and Hygiene Assessment | Main Report 25
Chapter 4
WATER SERVICES

2018 School Water, Sanitation and Hygiene Assessment | Main Report26
Suffi cient and reliable safe water supply in schools helps to prevent spreading of infectious and waterborne diseases among pupils/students. Providing safe drinking water can be achieved by ensuring that water comes from an improved source or is treated prior to drinking. Generally, water sources are categorized as improved or unimproved.
Improved water sources are those which, by nature of their design and construction, have the potential to deliver safe water by preventing water contamination. Improved sources include piped water, boreholes or tube wells, protected dug wells, protected springs, and rainwater.
Unimproved sources include unprotected dug wells or springs and surface water (e.g. lakes, rivers, streams, ponds, canals, irrigation ditches).
4.1 Accessibility to
Drinking Water in
SchoolsNationally, the proportion of schools with access to an improved source of drinking water was 68.2 per cent. While 17.6 per cent of schools in Tanzania used unimproved sources of water, 14.2 per cent did not have any source of water (Table 4.1).
Nearly all schools in Zanzibar (96.0 per cent) obtained their drinking water from an improved source as compared to 67.4 per cent of schools in Tanzania Mainland. Furthermore, 18.0 per cent of schools in Tanzania Mainland used unimproved source of drinking water compared to only 2.4 per cent of schoolsin Zanzibar.
Sources of water Tanzania mainland
Zanzibar Rural Urban Tanzania
Improved Source 67.4 96.0 63.8 84.2 68.2Piped into school grounds 29.1 43.5 24.2 48.2 29.5
Public tap/standpipe off school grounds 2.3 1.5 2.4 1.9 2.3
Piped water from elsewhere 2.7 2.4 2.8 2.6 2.7
Tube well or Borehole 11.8 25.4 10.9 16.6 12.1
Protected Well 9.5 20.8 9.7 10.3 9.8
Protected Spring 3.3 0.9 3.9 1.1 3.3
Rainwater with roof catchment 8.3 0.6 9.4 3.4 8.1
Rainwater, but no roof catchment 0.4 0.0 0.5 0.0 0.4
Packaged Bottled Water 0.0 0.9 0.0 0.1 0.0
Unimproved Source 18.0 2.4 20.3 8.2 17.6Unprotected Well 5.2 2.4 6.1 1.7 5.1
Unprotected Spring 3.0 0.0 3.5 0.9 2.9
Water Vendor or Tanker 1.0 0.0 0.6 2.3 1.0
Surface Water (River, Pond, Lake, Dam etc) 6.4 0.0 7.5 2.1 6.3
Other Sources 2.4 0.0 2.6 1.2 2.3
No Water Source 14.6 1.6 16.1 7.7 14.2Total 100 100 100 100 100
Table 4.1: Percentage distribution of schools by source of drinking water and location, Tanzania, 2018

2018 School Water, Sanitation and Hygiene Assessment | Main Report 27
Schools in urban areas were more likely to have access to an improved source of drinking water (84.2 per cent) compared to those in rural areas (63.8 per cent). About two out of ten schools in rural areas used unimproved source of water and 16.1 per cent had no water source. On the contrary, in urban settings, only 8.2 per cent of schools used unimproved source of water, whereas, 7.7 per cent did not have any source of drinking water for pupils/students.
Piped water into school premises was the most common type of improved source of drinking water for 29.5 per cent in Tanzanian schools,
followed by tube wells or boreholes (12.1 per cent) and protected wells (9.8 per cent).
Data on the availability of water sources in terms of the level of school indicates that 62.8 per cent of primary schools and 80.3 per cent of secondary schools had access to improved source of drinking water. Furthermore, the fi ndings show signifi cant diff erences in the use of improved source of water with regard to school managing authorities: 90.6 per cent of non-government schools had access to improved source of drinking water compared to 64.8 per cent of government schools (Table 4.2).
Sources Level of schools Ownership status
Primary school
Secondary school
Government Non-Government
Improved Source 62.8 80.3 64.8 90.6
Piped into school grounds 25.5 38.1 27.1 45.1
Public tap/standpipe off school grounds
2.4 2.1 2.3 1.8
Piped water from elsewhere 1.9 4.5 2.6 3.3
Tube well or Borehole 11.0 14.7 10.6 22.4
Protected Well 10.1 9.3 9.7 10.9
Protected Spring 3.2 3.4 3.2 3.7
Rainwater with roof catchment 8.1 8.1 8.9 3.1
Rainwater, but no roof catchment 0.5 0.1 0.4 0.0
Packaged Bottled Water 0.1 0.0 0.0 0.3
Unimproved Source 19.5 13.1 19.1 7.8
Unprotected Well 5.9 3.3 5.8 1.0
Unprotected Spring 3.5 1.7 3.3 0.6
Water Vendor or Tanker 0.7 1.4 0.5 3.7
Surface Water (River, Pond, Lake, Dam etc)
6.9 4.8 6.9 1.9
Other Sources 2.5 1.9 2.6 0.6
No Water Source 17.7 6.6 16.1 1.8
Total 100 100 100 100
Table 4.2: Percentage distribution of schools by source of drinking water, level of school and ownership status, Tanzania, 2018

2018 School Water, Sanitation and Hygiene Assessment | Main Report28
4.2 Availability of Water
Services According to
JMP ClassificationsThe SDG targets and indicators for WASH in schools focus on achieving a basic minimum level of water services by 2030. To eff ectively monitor this, the JMP introduced the concept of service ladder that categorizes water services into three levels: basic water service, limited water service and no water service.
Basic water service means that a school has drinking water from an improved source (piped water, protected well/spring, rainwater, bottled water) and water is available at the school at the time of the survey. Limited service means school has an improved source, but water was not available at the time of survey. No water service means the school had either drinking
water from an unimproved source or no water source at the school at all. Information on the availability of water at the time of the survey was derived from observation data rather than from information provided by the respondents.
The 2018 School WASH Assessment shows that more than half of schools in Tanzania (55.3 per cent) had basic drinking water services, 12.9 per cent had limited water services and 31.8 per cent did not have any water service (Figure 4.1).
Zanzibar had a higher percentage of schools with basic water services (82.9 per cent) than Tanzania Mainland (54.5 per cent). Thirteen per cent of schools in Tanzania Mainland and Zanzibar depended on limited water services. Only 4.1 per cent of schools in Zanzibar did not have water services compared to 32.5 per cent of schools in Tanzania Mainland.
Figure 4.1: Percentage distribution of schools with basic water services, limited water services and no water services by location, level of school and ownership status, Tanzania, 2018
100
80
60
40
20
0
Tanz
ania
Mai
nlan
d
Zanz
ibar
Rur
al
Urb
an
Prim
ary
Seco
ndar
y
Gov
ernm
ent
Non
-Gov
ernm
ent
Ownership statusLevel of schoolsLocationMainland/Zanzibar
Basic water services Limited water services No water services
31.8
12.9
55.3
32.5
12.9
54.5
82.9
51.070.5
49.368.5
51.282.2
13.7
35.2 8.39.5
11.7
19.837.2
13.5
13.7
15.8
12.7
36.313.04.1
Perc
ent

2018 School Water, Sanitation and Hygiene Assessment | Main Report 29
Seven out of ten schools in urban areas (70.5 per cent) had basic water services, whereas slightly more than half of schools in rural areas (51.0 per cent) had basic water services. While there was no signifi cant diff erence in the availability of limited water services between schools in urban (13.7 per cent) and rural (12.7 per cent) areas, the situation was quite diff erent for schools with no water services where it was established that 36.3 per cent of rural schools had no water services compared to 15.8 per cent of urban schools.
With regard to the level of school, 68.5 per cent of secondary schools had basic water services compared to 49.3 per cent of primary schools. Fourteen per cent of primary schools and 11.7 per cent of secondary schools had limited water services, while 37.2 per cent of primary schools and 19.8 per cent of secondary schools did not have any water service.
Furthermore, schools owned by non-government institutions were more likely to
have basic water services (82.2 per cent) than schools owned by the Government (51.2 per cent). The rates of limited water services and no water services were very low in schools owned by non-government institutions (8.3 per cent and 9.5 per cent, respectively) compared to government owned schools (13.7 per cent and 35.2 per cent, respectively).
The 2018 School WASH survey shows that boarding schools (81.8 per cent) and schools with both day and boarding facilities (85.4 per cent) were more likely to have basic water services than day schools (51.0 per cent). In addition, day schools were more likely to have no water services (35.0 per cent) than boarding schools (6.9 per cent) and schools with both day and boarding facilities (12.1 per cent) (Table 4.3).
Regional variations were highly visible in the percentages of schools with basic water services, ranging from 29.7 per cent in Songwe Region to 91.9 per cent in Kusini Pemba Region (Map 4.1).
Table 4.3: Percentage of schools with basic water services, limited water services and no water services by background characteristics, Tanzania, 2018
Background characteristics Basic water services
Limited water services
No water services
Number of schools
Tanzania 55.3 12.3 31.8 2,385
Type of school
Girls only 76.7 23.3 0.0 40
Boys only 93.5 0.0 6.5 30
Mixed 54.4 12.9 32.7 2,315
Model of school
Boarding School 81.8 11.3 6.9 127
Day School 51.0 14.0 35.0 2,077
Both (Boarding and Day) 85.4 2.5 12.1 181

2018 School Water, Sanitation and Hygiene Assessment | Main Report30
Map 4.1: Percentage of schools with basic water services by region, Tanzania, 2018
4.3 Drinking Water
Availability from the
Main SourceThis part provides more understanding on the availability of drinking water from the main source of the school during the time of the survey, all days in the two weeks preceding the survey, and throughout the school academic year. Unlike for JMP Classifi cations, availability of water in this section does not consider the type of source of water (improved or not improved).
About eight out of ten schools (80.4 per cent) in Tanzania had drinking water available from the main source at the time of the survey and 79.5 per cent of schools had drinking water two weeks before the survey. However, only 66.6 per cent of schools had water from the same source throughout a school year.
More than eight out of ten (84.1 per cent) schools in urban areas had water available
from their main source at the time of the survey, compared to 79.3 per cent of schools in rural areas. A similar pattern was observed with regard to the availability of water two weeks prior to the day of interview (82.4 per cent and 78.6 per cent for urban and rural schools, respectively) and throughout the school year (72.8 per cent and 64.7 per cent for urban and rural schools, respectively).
The results also show that secondary schools were more likely to have drinking water available from the main source at the time of interview (86.3 per cent) than primary schools (77.4 per cent). While there was no diff erence in terms of the availability of water throughout a school year between primary (66.7 per cent) and secondary schools (66.3 per cent), secondary schools were more likely to have water two weeks preceding the survey (81.8 per cent) than primary schools (78.3 per cent).
Signifi cant diff erences were seen in the availability of water in schools with regard
Lake Nyasa
MOZAMBIQUE
0 50 100 150 Km
Geita47.7
KENYA
Kagera55.2
Shinyanga44.6
Tabora43.6
Katavi55.9
Rukwa39.0
Njombe61.7
Morogoro61.2
Tanga48.5
Manyara61.0
Arusha76.5
Singida48.1
Kilimanjaro75.7
Ruvuma65.3
Mtwara45.0
Lindi48.5
Pwani46.4
Dodoma41.2
Kigoma49.9
Simiyu33.5Mwanza
54.6
Mara49.5
Iringa66.3
Songwe29.7
Mbeya62.5
Dar es Salaam
68.3DRC
ZAMBIA
MALAWI
BURUNDI
RWANDA
UGANDA
Indian Ocean
Lake Victoria
L. Rukwa
Up to 39.039.10 – 49.9049.91 – 55.9055.91– 68.30> 68.30
Legend:Percentage of schools with access to water services
Kaskazini Unguja 81.1
Kaskazini Pemba 60.0
Kusini Pemba
91.9
Mjini Magharibi
88.2Kusini
Unguja 83.8
Indian Ocean
Lake Tanganyika
N
Lake Nyasa
L.Natron L.Eyasi
L.Manyara

2018 School Water, Sanitation and Hygiene Assessment | Main Report 31
to ownership status. Seventy-nine per cent of government-owned schools had water available from the main source at the time of the interview compared to 90.9 per cent of schools owned by non-government institutions. A similar pattern was observed with respect to the availability of water in the two weeks preceding the survey, whereby 92.9 per cent of non-government-owned schools and 77.1 per cent of government-owned schools had water available from the main source two weeks preceding the survey; and 84.9 per cent of non-government-owned secondary schools and 63.3 per cent of government-owned schools had water
available from the main source throughout the school year.
The percentages of schools with drinking water from their main sources at the time of the survey ranged from 62.3 per cent in Simiyu Region to 92.0 per cent in Mjini Magharibi. While Mjini Magharibi remains the region with the highest percentage of schools having regular water on all days in the two weeks preceding the survey (93.0 per cent) and throughout the school year (86.0 per cent), Kaskazini Pemba had the lowest percentages (52.9 per cent and 24.3 per cent, respectively) (Table 4.4).
Table 4.4: Percentage of schools with drinking water currently available at the school, was available in the two weeks before the survey, and is available throughout a year by location, ownership, level of school, type of school, model of school and region, Tanzania, 2018
Background characteristics
Percentage of schools with drinking water from the main source:
available at the time of interview
available in the previous two weeks
available throughout the school year
Mainland/Zanzibar
Mainland 80.2 79.5 66.5
Zanzibar 86.8 80.0 70.1
Location of School
Rural 79.3 78.6 64.7
Urban 84.1 82.4 72.8
Level of School
Primary school 77.4 78.3 66.7
Secondary school 86.3 81.8 66.3
Ownership Status
Government 78.5 77.1 63.3
Non-Government 90.9 92.9 84.9
Type of school
Girls only 76.7 89.0 91.6
Boys only 100 98.2 84.4
Mixed 80.2 79.0 65.8
Model of school
Boarding school 88.7 94.4 87.1
(Continued)

2018 School Water, Sanitation and Hygiene Assessment | Main Report32
Background characteristics
Percentage of schools with drinking water from the main source:
available at the time of interview
available in the previous two weeks
available throughout the school year
Day school 78.1 77.5 64.3
Both (Boarding and Day) 97.4 88.5 74.8
Region
Dodoma 63.9 69.8 44.2
Arusha 83.9 84.5 69.3
Kilimanjaro 90.8 80.3 74.2
Tanga 78.4 81.0 82.2
Morogoro 82.5 79.4 67.7
Pwani 77.5 87.0 71.0
Dar es Salaam 76.9 86.4 79.5
Lindi 88.2 79.0 73.0
Mtwara 65.5 58.6 51.4
Ruvuma 90.8 86.2 69.6
Iringa 85.8 73.3 75.3
Mbeya 75.9 82.7 61.9
Singida 80.5 74.2 53.5
Tabora 72.4 77.4 50.4
Rukwa 78.5 80.9 79.9
Kigoma 79.7 65.6 53.0
Shinyanga 64.3 61.9 59.1
Kagera 81.8 89.8 67.9
Mwanza 76.1 80.5 63.1
Mara 88.9 69.5 42.4
Manyara 85.2 79.2 67.1
Njombe 86.0 89.5 81.9
Katavi 88.2 83.2 83.1
Simiyu 62.3 64.9 38.3
Geita 88.4 91.9 74.6
Songwe 79.7 89.5 79.6
Kaskazini Unguja 87.5 69.2 65.8
Kusini Unguja 83.8 86.6 79.3
Mjini Magharibi 92.0 93.0 86.0
Kaskazini Pemba 70.1 52.9 24.3
Kusini Pemba 91.9 78.4 71.6
Tanzania 80.4 79.5 66.6
(Continued)

2018 School Water, Sanitation and Hygiene Assessment | Main Report 33
4.4 Location of the School
Water SourceSixty-three per cent of the schools had their water sources on the school premises. This means that 37.0 per cent of the schools had their water sources off the school premises.
Schools in Zanzibar were more likely to have their water sources on their premises (78.5 per cent) than schools in the Mainland (62.9 per cent).
Eighty-four per cent of schools in urban areas had their water source located on the school premises as compared to 56.9 per cent of schools located in rural areas. About three quarter (75.3 per cent) of secondary schools and 57.3 per cent of primary schools had their water sources located on school premises.
The results further indicate that 59.8 per cent of government schools and 83.5 per cent non-government schools had their water sources on the school premises (Figure 4.2).
4.5 Treatment of Drinking
WaterFigure 4.3 shows that 32.7 per cent of the primary and secondary schools in Tanzania
treated their water prior to drinking. This means that more than two thirds (67.3 per cent) of schools in Tanzania did not treat their water prior to drinking.
On the other hand, only 32.0 per cent of schools in Tanzania Mainland and 53.3 per cent of those in Zanzibar treated their drinking water. About half of schools in urban areas (48.2 per cent) and slightly more than a quarter (27.8 per cent) of schools in rural areas treated their drinking water prior to drinking.
Signifi cant diff erences in treating drinking water were observed in terms of ownership, whereby 77.3 per cent of the non-government schools treated their drinking water compared to only 24.7 per cent of the government schools (Figure 4.3).
Nevertheless, appropriate treatment methods (that is, boiling, fi ltration, solar disinfection, chlorination and fl occulants) were mostly used by schools that treated water before consumption. The most commonly used methods were chlorination, boiling and fi ltration, which were being used by 50.4 per cent, 39.3 per cent and 8.5 per cent of schools, respectively (Figure 4.3). Boiling and chlorination were the most commonly used methods for water treatment across several background characteristics.
Figure 4.2: Percentage of schools with water source located on school premises by location, level of school and ownership status, Tanzania, 2018
100
80
60
40
20
0
Tanz
ania
Mai
nlan
d
Zanz
ibar
Rur
al
Urb
an
Prim
ary
Seco
ndar
y
Gov
ernm
ent
Non
-Gov
ernm
ent
Ownership statusLevel of schoolsLocationMainland/Zanzibar
63.4 62.9 59.8
83.575.3
57.3
84.2
56.9
78.5
Perc
ent

2018 School Water, Sanitation and Hygiene Assessment | Main Report34
Water treatment types
Location Level of schools Ownership status
Rural Urban Primary school
Secondary school
Government Non-Government
Tanzania
Filtration 8.4 8.7 9.8 6.1 7.7 9.9 8.5
Strain through a cloth
2.0 2.2 2.0 2.1 1.9 2.3 2.0
Boiling 43.6 31.2 40.6 36.8 37.8 41.9 39.3
Chlorination/ bleach e.g., water Guard
47.7 55.3 51.2 48.8 53.4 45.0 50.4
Solar disinfection 0.5 0.9 0.5 0.8 0.5 0.9 0.6
Let it stand or settle
1.1 0.7 0.8 1.2 1.0 0.9 1.0
Flocculant e.g., pure water purifi er
3.2 9.9 3.1 9.9 2.5 11 5.5
Other 0.9 2.9 0.6 3.4 0.8 3.1 1.6
Don't know 0.0 0.5 0.3 0.0 0.3 0.0 0.2
Table 4.5: Percentage of schools with water treatment method with regard to the location, level and ownership status of school, Tanzania, 2018
Figure 4.3: Percentage of schools that treated their water prior to drinking by location, level of school, model of school and ownership status, Tanzania, 2018
Ownership status
Level of schools
LocationMainland/Zanzibar
Perc
ent
32.7 32.024.7
77.3
34.531.7
48.2
27.8
53.3
69.8
27.5
56.7
Tanz
ania
Mai
nlan
d
Zanz
ibar
Rur
al
Urb
an
Prim
ary
Seco
ndar
y
Gov
ernm
ent
Non
-Gov
ernm
ent
Boar
ding
Sch
ool
Day
Sch
ool
Both
Sch
ool
Boarding/Day school
100
80
60
40
20
0

2018 School Water, Sanitation and Hygiene Assessment | Main Report 35
4.6 Accessibility to Water
Services to the
Youngest Children and
Pupils with Limited
Mobility and Poor
VisionThe 2018 Tanzania School WASH Assessment collected information on access to water services to the youngest children in primary schools and pupils with limited mobility or vision for both primary and secondary schools. The information was collected from the schools that had water sources.
Overall, the results show that in Tanzania, more than three quarters (75.8 per cent) of primary schools with a water source had drinking water accessible to the youngest children. On the other hand, 65.5 per cent
of both primary and secondary schools had water sources that were accessible to pupils with limited mobility or vision (Table 4.6).
The fi ndings also revealed that primary schools in Zanzibar were more likely to have their water sources accessible to youngest children (94.3 per cent) than those in Mainland Tanzania (75.3 per cent). Likewise, 85.0 per cent of schools in Zanzibar had water sources accessible to those with limited mobility or vision compared to 64.8 per cent of the schools in the Mainland.
Seventy-four per cent of primary schools in rural areas and 84.9 per cent of primary schools in urban areas had drinking water sources accessible to the youngest children. On the other hand, 62.6 per cent of schools (both primary and secondary schools combined) in rural areas and 74.7 per cent in urban areas had water sources accessible to pupils with limited mobility or vision.
Table 4.6: Percentage distribution of schools by location, level, ownership status and accessibility of drinking water facilities to the youngest children and those with limited mobility or vision, Tanzania, 2018
Background characteristics
Drinking water accessible to the youngest children at the school (Primary schools)
Number of schools
Drinking water accessible to pupils/students with limited mobility or vision (Primary and Secondary schools)
Number of schools
Mainland/Zanzibar
Mainland 75.3 1,287 64.8 1,977
Zanzibar 94.3 37 85.0 63
Location of School
Rural 73.7 1,074 62.6 1,555
Urban 84.9 250 74.7 485
Level of School
Primary school 75.8 1,324 64.4 1,347
Secondary school N/A N/A 67.6 693
Ownership Status
Government 74.8 1,201 64.1 1,731
Non-Government 85.8 123 73.2 309
Tanzania 75.8 1,324 65.5 2,040

2018 School Water, Sanitation and Hygiene Assessment | Main Report36
Furthermore, there was no signifi cant diff erence between primary and secondary schools with regard to having water sources accessible to pupils with limited mobility or vision (64.4 per cent versus 67.6 per cent).
More results show that non-government primary schools (85.8 per cent) were better equipped with water facilities accessible to the youngest children than government-owned primary schools (74.8 per cent). The same pattern was observed for schools with water sources accessible to pupils and students with limited mobility or vision (73.2 per cent for non-government schools and 64.1 per cent for government schools).
4.7 Utilization of School
Water Facilities by
CommunityThe 2018 Tanzania School WASH Assessment collected information on whether the community utilized school water services. The information collected includes collection of and payment for water from the schools’ water sources by members of the community. In 31.8 per cent of schools in Tanzania, community members collected water from the school source and community members were paying for the water in about 15.7 per cent of the schools.

2018 School Water, Sanitation and Hygiene Assessment | Main Report 37
Table 4.7: Percentage distribution of schools by location, ownership, model, level and community utilization of school water supply services, Tanzania, 2018
Background characteristics Percentage of schools with:
Community members collecting water from the school water source
Community members paying for the school water they collect
Mainland/Zanzibar
Mainland 31.5 16.1
Zanzibar 41.6 7.0
Location of School
Rural 38.1 15.9
Urban 18.4 14.7
Level of School
Primary school 35.2 15.8
Secondary school 26.9 15.5
Ownership Status
Government 34.1 16.7
Non-Government 23.0 9.6
Model of School
Boarding School 27.3 4.9
Day School 33.6 17.3
Both (Boarding and Day) 22.3 8.2
Tanzania 31.8 15.7
While it was more common for schools in Zanzibar to allow community members to collect water from the school sources (41.6 per cent) than for those in the Mainland (31.5 per cent), it was less common for the community to pay for water in Zanzibar (7.0 per cent) than in the Mainland (16.1 per cent).
The percentage of schools whose community utilized school water services was higher in rural areas (38.1 per cent) than in urban areas (18.4 per cent). While the rural percentage was slightly higher than the national average, the urban percentage was lower than the national average. The percentage of schools charging community members for water from school
sources was almost the same for rural (15.9 per cent) and urban (14.7 per cent) schools.
The results further show that at school level, primary schools were more likely to have their communities utilizing school water services (35.2 per cent) than in secondary schools (26.9 per cent). However, 16 per cent of both primary and secondary schools were charging community members for the water collected from school water sources. On the other hand, community members were more likely to collect water from government school water sources (34.1 per cent) than in non-government school water sources (23.0 per cent) (Table 4.7).

2018 School Water, Sanitation and Hygiene Assessment | Main Report38
Chapter 5
SANITATION SERVICES

2018 School Water, Sanitation and Hygiene Assessment | Main Report 39
Adequate sanitation is a basic human right, and access to it for every person is compelling. It focuses on provision of facilities and services that ensure safe management of human excreta from the toilet to containment and storage, safe use and disposal to reduce adverse eff ects on users and other people. Improved sanitation services play an important role in ensuring dignity and achieving human right to sanitation, and has an important gendered aspect due to the diff erent needs, in terms of privacy, dignity and safety of girls and boys. The lack of adequate sanitation is a major cause of infectious diseases, such as cholera, typhoid and dysentery among others.It impacts the well-being of students (especially of girls) in terms of school attendance, anxiety and safety.
Regardless of the general cleanliness and quality, sanitation facilities can be categorized as improved or unimproved. Improved sanitation facilities are those that have been designed to hygienically separate excreta from human contact. It includes fl ush/pour fl ush to piped sewer system, septic tanks or pit latrines, ventilated improved pit latrines, composting toilets or pit latrines with slabs. Unimproved facilities include pit latrines without a slab or platform, hanging latrines and bucket latrines.
This section presents fi ndings on types of sanitation, the availability and accessibility of single-sex toilets and usable/functional toilets, pupil/toilet ratio for boys and girls, location of sanitation facilities, toilet cleanliness and the presence of urinal facilities.
5.1 Types of Sanitation,
Availability and
AccessibilityThe 2018 Tanzania School WASH Assessment also collected information on the provision
of adequate sanitation in schools, including types of toilets commonly used. The fi ndings revealed that 88.7 per cent of the schools used improved toilet facilities: fl ush/pour fl ush to piped sewer system, septic tanks or pit latrines, ventilated improved pit latrines, composting toilets or pit latrines with slabs, regardless of the quality that categorises the facility off ering basic sanitation services. The three most common types of toilet facilities in Tanzanian schools were: pit latrine with washable slabs (41.8 per cent), fl ush to pit latrines (19.7 per cent) and ventilated improved pit latrines (14.0 per cent) (Table 5.1).
Less than one per cent of schools in Tanzania had no toilet facilities. Since the policy of the Government clearly state that a school cannot be established without sanitation facilities, it should be noted that the absence of toilet facilities in this small number of schools could have been a temporary situation due to collapsing of the toilets as a result of rains or other reasons. Schools in Zanzibar were likely to use improved sanitation facilities (98.2 per cent) than schools in Mainland (88.4 per cent). Almost all schools in Zanzibar had some sort of a toilet facility. The use of improved sanitation facilities was higher in urban schools (96.0 per cent) than schools in rural areas (86.6 per cent). On the other hand, 12.8 per cent of schools in rural areas used unimproved toilet facilities compared to 3.9 per cent of schools in urban areas.
In terms of the school level, use of improved toilet facility was higher among secondary schools (95.9 per cent) than among primary schools (86.6 per cent). Thirteen per cent of primary schools used unimproved toilet facilities compared to only 4.1 per cent of secondary schools. All secondary schools had some type of toilet facility, while 0.6 per cent of the primary schools had no toilet facilities (Table 5.1).

2018 School Water, Sanitation and Hygiene Assessment | Main Report40
5.2 Sanitation Services
According to the JMP
ClassificationsAs is the case with water services, WHO/UNICEF JMP ladder classifi cations for sanitation services are categorized into three levels: basic sanitation service, limited sanitation service and no sanitation service.
The school is categorized as having basic sanitation service if it has improved and single-sex sanitation facilities, usable at the time of the survey. Usable means sanitation facilities should be available, functional and
private. Limited sanitation service means improved sanitation facilities at the school that are either not single-sex or not usable at the time of the survey. No service means toilet facilities are unimproved (pit latrines without a slab or platform, hanging latrines and bucket latrines), or there are no toilets or latrines in the school at all. Information on types of facilities for the surveyed schools was verifi ed against the observations data as reported by the interviewers.
As reported in the observation questionnaire, usability of toilets looked into the quality of sanitation facilities. Adequate sanitation
Table 5.1: Percentage distribution of schools by type of sanitation facilities, location and level of school, Tanzania, 2018
Types of sanitation services
Tanzania Tanzania mainland
Zanzibar Rural Urban Primary school
Secondary school
Improved Sanitation
88.7 88.4 98.2 86.6 96 86.6 95.9
Flush to piped sewer system
1.0 0.9 4.3 0.5 2.8 0.5 2.0
Flush to septic tank 12.1 12.5 0.4 10.2 19.0 10.2 17.6
Flush to pit latrine 19.7 19.1 41.8 16.2 32.1 16.2 29.7
Ventilated improve pit latrine
14.0 13.5 32.7 12.6 19.1 12.6 16.7
Pit latrine with slab (washable)
41.8 42.5 19.0 47.2 23.1 47.2 30.0
Unimproved Sanitation
10.9 11.1 1.8 12.8 3.9 12.8 4.1
Flush to somewhere else
0.4 0.4 0.0 0.4 0.6 0.4 0.5
Pit latrine with slab not (not washable)
6.0 6.1 0.6 7.3 1.3 7.3 2.1
Pit latrine without slab/open pit
3.6 3.6 1.2 4.2 1.1 4.2 0.8
Other 0.9 0.9 0.0 0.9 0.9 0.9 0.6
No toilets or latrine/bush/fi eld
0.5 0.5 0.0 0.6 0.1 0.6 0.0
Total 100.0 100.0 100.0 100.0 100.0 100.0 100.0

2018 School Water, Sanitation and Hygiene Assessment | Main Report 41
services off er safety, dignity and privacy to users (pupils/students). Qualitative assessment was done in terms of functioning doors and windows, cleanliness (toilets without smells, faeces, fl ies), structure of the building (no cracks, visible holes or unstable) and state of the platform/slab (secured, without holes, no erosion or not safe). Information on the quality of sanitation services is available from observation data.
By factoring in the quality elements, the 2018 Tanzania School WASH Assessment fi ndings show that more than half of the primary and secondary schools in Tanzania (58.4 per cent) had limited sanitation services, meaning that they had improved sanitation facilities that were either not single-sex or not usable. It should be noted that almost all school toilets were single-sex, therefore the largest percentage of limited sanitation is attributable to the usability of toilets,
rather than to non-single-sex toilet facilities. Almost a third of those schools (30.3 per cent) had improved single-sex sanitation facilities usable at the time of the assessment and was hence classifi ed as providing basic sanitation services. Furthermore, 11.3 per cent of schools were classifi ed as having no sanitation services, meaning that they used unimproved facilities, such as pit latrines without a slab, or had no sanitation facility at all.
The assessment on sanitation showed that more than a half of schools in Zanzibar (58.3 per cent) had basic sanitation services compared to 29.5 per cent of those in Mainland. On the other hand, schools in Tanzania Mainland were more likely to have both limited and no sanitation services (58.9 per cent and 11.6 per cent, respectively) than schools in Zanzibar (39.9 per cent and 1.8 per cent, respectively) (Figure 5.1).
Figure 5.1: Percentage distribution of schools with basic sanitation services, limited sanitation services and no sanitation services by location, level and ownership status, Tanzania, 2018
100
80
60
40
20
0
Tanz
ania
Mai
nlan
d
Zanz
ibar
Rur
al
Urb
an
Prim
ary
Seco
ndar
y
Gov
ernm
ent
Non
-Gov
ernm
ent
Ownership statusLevel of schoolsLocationMainland/Zanzibar
11.3
58.4
30.3
11.6
58.9
29.5
58.3
24.351.0
21.8
48.824.2
69.6
63.0
12.7 2.428.0
47.1
4.114.6
63.5
44.9
4.0
62.2
13.4
39.9
1.8
Perc
ent
Basic sanitation services Limited sanitation services No sanitation services

2018 School Water, Sanitation and Hygiene Assessment | Main Report42
Slightly more than fi ve out of ten schools in urban areas (51.0 per cent) had basic sanitation services compared to about two out of ten schools in rural areas (24.3 per cent). About 13 per cent of rural schools however, were found having no sanitation services compared to about four per cent of urban schools.
Almost two thirds of the primary schools (63.5 per cent) and 47.1 per cent of secondary schools had limited sanitation services. About 48.8 per cent of secondary schools off ered basic sanitation services compared to 21.8 per cent of primary schools. Furthermore, primary schools were more likely to have no sanitation services (14.6 per cent) than secondary schools (4.1 per cent).
With regard to ownership status, the use of basic sanitation services was much higher among schools managed by non-government institutions (69.6 per cent) than those managed by the Government (24.2 per cent). Majority of government-owned school had limited sanitation services (63.0 per cent) and 12.7 per cent had no sanitation services. About 2.4 per cent of non-government schools had no sanitation services and 28.0 per cent had limited sanitation services.
More than two thirds of boarding schools (66.7 per cent) and 70.2 per cent of schools with both boarding and day facilities had basic sanitation services compared to only a quarter (24.5 per cent) of the day schools. Day schools on the other hand, were more likely to have a higher percentage of limited sanitation services (62.9 per cent) compared to boarding schools (28.1 per cent), and schools with both day and boarding facilities (28.5 per cent). More than one out of ten day schools (12.6 per cent) had no sanitation services (Table 5.2).
There were marked regional disparities in the availability of basic sanitation services among schools, whereby the percentage of schools with basic sanitation services ranged from 4.4 per cent in Rukwa Region to 84.4 per cent in Kaskazini Pemba Region (Map 5.1). Moreover, fi ve regions had more than 50.0 per cent of schools with basic sanitation services: Kaskazini Pemba (84.4 per cent), Mjini Magharibi (57.4 per cent), Dar es Salaam (57.2 per cent), Kusini Unguja (54.5 per cent) and Kusini Pemba (52.7 per cent). The rest of the regions had less than 50.0 per cent of the schools with basic sanitation services. Regions with relatively smaller percentages of schools with basic sanitation services were:
Table 5.2: Percentage of schools with basic sanitation, limited sanitation and no sanitation services by type and model of school, Tanzania, 2018
Background characteristics
Basic sanitation services
Limited sanitation services
No sanitation services
Number of schools
Type of school
Girls only 93.7 6.3 0.0 40
Boys only 65.2 21.4 13.4 30
Mixed 28.7 59.8 11.5 2,315
Model of School
Boarding School 66.7 28.1 5.1 127
Day School 24.5 62.9 12.6 2,077
Both (Boarding and Day) 70.2 28.5 1.3 181
Tanzania 30.3 58.4 11.3 2,385

2018 School Water, Sanitation and Hygiene Assessment | Main Report 43
Rukwa (4.4 per cent), Simiyu (5.8 per cent), Katavi (9.7 per cent), Songwe (11.2 per cent) and Kagera (15.8 per cent).
5.3 Use of Improved
Single-Sex and
Improved Usable/Functional Toilets
Single-sex sanitation facilities mean that the toilets are separated for boys and girls, while usable means sanitation facilities are available for use, functional and private.
Table 5.3 provides more information on the percentage of schools with improved sanitation, improved and usable sanitation, improved and single-sex sanitation, and improved, usable and single-sex sanitation services in terms of diff erent background characteristics. The use of improved and
improved usable and single-sex sanitation (basic sanitation) has been explained in parts 5.1 and 5.2.
This part presents fi ndings with respect to “improved and usable sanitation” and “improved and single-sex sanitation” attributes.
Generally, most of the schools in Tanzania had improved and single-sex sanitation facilities with toilets separated for boys and girls (82.6 per cent). However, the percentage of toilets that were usable was much lower (32.5 per cent) (Table 5.3).
Across all background characteristics, there seem to be slight variations in terms of the availability of single-sex improved sanitation facilities. However, diff erences were observed in the case of improved and usable sanitation facilities. For example, the percentage of improved and usable toilets in Zanzibar was
Map 5.1: Percentage of schools with basic sanitation services by region, Tanzania, 2018
L. Rukwa 31.0Mbeya
Mara19.1
30.0
Simiyu5.8
Kagera15.8
Geita34.6
Shinyanga17.8
Tabora34.6
Katavi9.7
Rukwa4.4
Njombe46.5
Morogoro25.8
Tanga36.4
Manyara26.6
Arusha48.9
Singida18.4
Kilimanjaro37.2
Ruvuma39.8 Mtwara
22.9
Lindi23.6
Pwani33.0
Dodoma18.6
Kigoma22.0
Mwanza
40.6
Iringa
Songwe11.2
DRC
ZAMBIA
MALAWI
BURUNDI
RWANDA
UGANDA
KENYA
Indian Ocean
Lake Victoria
Up to 11.2011.21 – 26.6026.61 – 43.2043.21– 57.40> 57.41
Legend:Percentage of schools with access to sanitation services
Kaskazini Unguja 43.2
Kaskazini Pemba 84.4
Kusini Pemba 52.7
Indian Ocean
Mjini Magharibi 57.4
Kusini Unguja 54.5
MOZAMBIQUE
0 50 100 150 Km
N
L.Natron L.Eyasi
L.Manyara
Lake Nyasa
Lake Tanganyika
Dar es Salaam57.2
Lake Nyasa

2018 School Water, Sanitation and Hygiene Assessment | Main Report44
almost twice that of the Mainland (58.3 per cent against 29.5 per cent). A similar pattern was observed for schools in rural and urban areas (24.3 per cent against 51.0 per cent) and in terms of the level of school (21.8 per cent for primary school and 48.8 per cent for secondary schools).
Signifi cant diff erences were also observed in terms of ownership status of schools. While only about two out of ten (26.1 per cent) government schools had improved and usable sanitation facilities, almost seven out of ten (74.6 per cent) non-government schools had improved and usable sanitation facilities.
Table 5.3: Percentage of schools with improved sanitation, improved and usable sanitation, improved and single-sex sanitation, and improved usable and single-sex sanitation facilities by background characteristics, Tanzania, 2018
Background characteristics
Improved sanitation
Improved usable sanitation
Improved and single-sex sanitation
Improved, usable and single-sex sanitation (Basic sanitation)
Number of schools
Mainland/Zanzibar
Mainland 88.4 31.6 82.5 29.5 2,320
Zanzibar 98.2 67.4 84.2 58.3 65
Location of School
Rural 86.6 26.2 80.9 24.3 1,857
Urban 96.0 54.8 88.6 51.0 528
Level of School
Primary school 85.4 23.3 79.6 21.8 1,640
Secondary school 95.9 53.0 89.1 48.8 745
Ownership Status
Government 87.3 26.1 81.3 24.2 2,069
Non-Government 97.6 74.6 90.8 69.6 316
Type of School
Girls only 100.0 93.7 96.6 93.7 40
Boys only 86.6 65.2 86.6 65.2 30
Mixed 88.5 31.1 82.3 28.7 2,315
Model of School
Boarding school 94.9 74.0 84.7 66.7 127
Day school 87.4 26.4 81.5 24.5 2,077
Boarding and day 98.7 73.9 93.3 70.2 181
Tanzania 88.7 32.5 82.6 30.3 2,385

2018 School Water, Sanitation and Hygiene Assessment | Main Report 45
5.4 Accessibility to Sanitation Services to the Youngest Children (in primary schools) and Children with Physical Disability and
Impaired VisionAvailability and accessibility of toilets/latrine facilities to the youngest children in primary schools and pupils/students with physical disability or limited vision in all schools contribute to increased enrolment, retention and completion for these two groups.
The fi ndings from the assessment show that only 26.0 per cent of primary schools in Tanzania had at least one usable toilet that was accessible to the youngest pupils. Likewise, only 12.2 per cent of schools in Tanzania (both primary and secondary) had at least one usable toilet accessible to pupils/students with physical disability or impaired vision (Table 5.4).
In Zanzibar, 49.0 per cent of schools had at least one usable toilet accessible to pupils with physical disability or impaired vision. Furthermore, the fi ndings indicate that 70.3 per cent of primary schools (in Zanzibar) had at least one toilet/latrine accessible to the
Table 5.4: Percentage of schools with at least one usable toilet accessible to the youngest children and pupils with physical disability impaired vision by background characteristics, Tanzania, 2018
Background characteristics
Percentage of schools with
At least one usable toilet/latrine that is accessible to the youngest
pupils (Primary schools only)
At least one usable toilet/latrine that is accessible to the pupil with
physical disability or impaired vision (Primary and Secondary
schools)
Percentage Number of schools Percentage Number of schools
Mainland/Zanzibar
Mainland 24.9 1,574 11.2 2,320
Zanzibar 70.3 38 49.0 65
Location of School
Rural 23.0 1,328 10.6 1,857
Urban 39.7 284 17.6 528
Level of school
Primary school 26.0 1,612 10.3 1,640
Secondary school N/A N/A 16.2 745
Ownership status
Government 22.9 1,485 11.1 2,069
Non-Government 62.1 127 19.4 316
Tanzania 26.0 1,612 12.2 2,385

2018 School Water, Sanitation and Hygiene Assessment | Main Report46
youngest pupils. On the other hand, 11.2 per cent of both primary and secondary schools in Tanzania Mainland had at least one usable toilet accessible to pupils with physical disability or impaired vision, while 24.9 per cent of primary schools had at least one toilet/latrine accessible to the youngest pupils.
Presence of at least one usable toilet accessible to pupils with physical disability or impaired vision was higher in urban schools (17.6 per cent) than in rural schools (10.6 per cent). A similar pattern was observed for primary schools with at least one usable toilet/latrine accessible to the youngest pupils (39.7 per cent for urban and 23.0 per cent for rural schools). Also, availability of at least one usable toilet/latrine that was accessible to pupils with physical disability or impaired vision was much higher in secondary schools (16.2 per cent) than in primary schools (10.3 per cent).
More than six out of ten (62.1 per cent) non-government primary schools had at least one usable toilet/latrine that was accessible to the youngest children compared to 22.9 per cent of government-owned schools. Similarly, non-government schools were more likely to have at least one usable toilet/latrine that was accessible to pupils with physical disability or impaired vision (19.4 per cent) compared to government-owned schools (11.1 per cent).
5.5 Pupils Drop Hole Ratio
In order to ensure provision of quality education in the country, the Government of Tanzania has set Basic Standards9 in education delivery that are to be adhered to by all education providers and stakeholders. These Basic Education Standards articulate the necessary educational inputs required to
ensure the provision of quality education on an equitable basis throughout the country. One of the indicators under the infrastructure standards is the number of pupils/students who can use or are using one toilet (pupils to latrine ratio). The agreed standard is at least one drop hole/stance for 20 girls and one drop hole for 25 boys and special toilets for pupils with disability.
The 2018 School WASH survey examined the extent to which this standard was being observed; where it established that only 27.5 per cent of schools in Tanzania met the minimum standards for pupils per drop hole ratio (Figure 5.2).
Twenty-eight per cent of schools in Tanzania Mainland had met the recommended pupil per drop hole ratio compared to 17.0 per cent of schools in Zanzibar. On the other hand, urban schools were more likely to meet the recommended pupils per drop hole ratio (38.9 per cent) than schools in rural areas (24.2 per cent).
Signifi cant diff erences in pupils per drop hole ratio were found with respect to the level and ownership of schools. Pupils per drop hole ratio for secondary schools (49.3 per cent) was much higher than for primary schools (17.6 per cent). Furthermore, only two out of ten government-owned schools (18.7 per cent) met the recommended number of pupils per drop hole ratio compared to eight out of ten non-government-owned schools (85.1 per cent). Ninety-six per cent of all-girls schools and 81.2 per cent of all-boys schools met the recommended pupils per drop hole ratio.
Signifi cant diff erences also existed in terms of the number of pupils per drop hole ratio across regions. While the largest percentage of schools that met the recommended number
9 Basic Standards for Pre-Primary and Primary Education in Tanzania, URT 2009.

2018 School Water, Sanitation and Hygiene Assessment | Main Report 47
of pupils per drop hole ratio was found in Kilimanjaro Region (65.9 per cent), the smallest percentage was found in Kaskazini Pemba Region (2.9 per cent) (Figure 5.3).
Findings of the 2018 School WASH Assessment indicate that on average, in Tanzania, 57 girls and 63 boys use one drop hole, way above the government norm of 20 girls and 25 boys per drop hole.
Schools in Zanzibar had the highest mean number of pupils/students per drop hole (111 girls and 114 boys) compared to schools in Tanzania Mainland (56 girls and 61 boys). There were no signifi cant diff erences in the average number of pupils per one drop hole between schools in rural areas (58 girls and 63 boys) and schools in urban areas (55 girls and 61 boys).
Furthermore, primary schools in Tanzania had more children that use one drop hole (average of 67 girls and 73 boys) compared to 35 girls and 39 boys in secondary schools.
Signifi cant gap on the average number of pupils/students per drop hole was observed between non-government and government schools. The average in non-government schools was 15 girls and 17 boys compared to 63 girls and 69 boys in government owned schools. On average, almost all non-government schools surveyed meet the government minimum standard of number of pupils/students per drop hole.
Suffi ciency of pupil to drop hole ratio varied greatly across regions of Tanzania. In Mainland, Kilimanjaro Region is well served in this regard, with an average of 23 girls and 25 boys per drop hole, while Simiyu Region is the least served where one drop hole serves 102 girls and 120 boys, respectively. On the other hand, all regions in Zanzibar had schools with more than average of 75 pupils per drop hole, with Kaskazini Pemba Region having a ratio of 174 girls and 172 boys. Such high number of users places a heavy burden on existing
Figure 5.2: Percentage of schools that meet the recommended number of pupils per drop hole ratio by level of school, model of school, location and school ownership status, Tanzania, 2018
Ownership status
Level of schools
Location of the schools
Mainland/Zanzibar
Perc
ent
27.5 27.818.7
85.1
49.3
17.639.0
24.217.0
96.0
81.2
25.6
Tanz
ania
Mai
nlan
d
Zanz
ibar
Rur
al
Urb
an
Prim
ary
Seco
ndar
y
Gov
ernm
ent
Non
-Gov
ernm
ent
Boar
ding
Sch
ool
Day
Sch
ool
Both
Sch
ool
Boarding/Day school
100
80
60
40
20
0
Girl
s O
nly
Boys
Onl
y
Mix
ed
Type of schools
87.5
20.7
63.4

2018 School Water, Sanitation and Hygiene Assessment | Main Report48
Figure 5.3: Percentage of schools that meet the recommended number of pupils per drop hole ratio by region, Tanzania, 2018
65.8
51.4
48.3
47.5
46.6
37.1
37.0
34.0
33.7
32.5
28.6
27.5
25.3
22.3
22.2
22.1
20.1
19.9
19.1
18.6
18.0
16.7
15.9
13.8
13.6
12.7
12.2
12.0
10.5
9.2
8.1
2.9
Kilimanjaro
Njombe
Iringa
Dar es Salaam
Pwani
Mbeya
Manyara
Arusha
Lindi
Songwe
Mjini Magharibi
Tanzania
Mtwara
Mwanza
Rukwa
Kigoma
Tanga
Dodoma
Kagera
Ruvuma
Katavi
Morogoro
Kusini Unguja
Shinyanga
Singida
Kaskazing Unguja
Simiyu
Geita
Tabora
Mara
Kusini Pemba
Kaskazini Pemba

2018 School Water, Sanitation and Hygiene Assessment | Main Report 49
Table 5.5: Average number of pupils/students per drop hole by location, level of school, ownership, model of school and region, Tanzania, 2018
Background characteristics Mean number of pupils/students per hole Number of schoolsGirls Boys
Mainland/Zanzibar
Mainland 56 61 2,320
Zanzibar 111 114 65
Location of School
Rural 58 63 1,857
Urban 55 61 528
Level of School
Primary school 67 73 1,640
Secondary school 35 39 745
Ownership Status
Government 63 69 2,069
Non-Government 15 17 316
Model of School
Boarding School 11 15 127
Day School 62 68 2,077
Both (Boarding and Day) 28 27 181
Region
Dodoma 55 61 102
Arusha 34 37 105
Kilimanjaro 23 25 131
Tanga 54 59 135
Morogoro 54 59 121
Pwani 35 39 102
Dar es Salaam 56 66 109
Lindi 45 48 72
Mtwara 46 47 83
Ruvuma 47 48 106
Iringa 30 33 68
Mbeya 41 40 96
Singida 64 66 69
Tabora 80 85 101
Rukwa 58 68 48(Continued)

2018 School Water, Sanitation and Hygiene Assessment | Main Report50
facilities, making maintenance challenging and also discouraging usage of the toilet facilities by pupils/students (Table 5.5).
5.6 Location of Sanitation
FacilitiesThe 2018 School WASH Assessment investigated the location of the sanitation facilities to assess how convenient it was for its users. Sanitation facilities for a majority of schools in Tanzania schools were located within the school buildings or outside the school buildings, but on the school premises (97.8 per cent). Only 2.2 per cent of them were located off the premises (Table 5.6).
The pattern was almost the same for all other background characteristics as shown in Table 5.6 except for ownership status, where the fi ndings indicate that 9.7 per cent of non-government schools had their toilets located
Background characteristics Mean number of pupils/students per hole Number of schoolsGirls Boys
Kigoma 69 87 83
Shinyanga 82 88 72
Kagera 60 65 127
Mwanza 79 90 124
Mara 62 74 106
Manyara 54 45 84
Njombe 26 31 64
Katavi 98 110 26
Simiyu 102 120 66
Geita 95 97 69
Songwe 49 52 51
Kaskazini Unguja 91 114 9
Kusini Unguja 77 77 9
Mjini Magharibi 97 90 25
Kaskazini Pemba 174 172 10
Kusini Pemba 133 147 12
Tanzania 57 63 2,385
(Continued)
off schools’ premises compared to only 1.1 per cent of government-owned schools.
5.7 Cleanliness of Toilets
in SchoolsHaving a toilet in place does not necessarily mean that people will use it. The toilet may not function, not being maintained or may be unhygienic, compelling people into avoiding them. In schools and other public places, it is very important to keep toilets clean to encourage children to use, and for them to enjoy their basic rights to adequate sanitation and better learning environment.
In light of this, the 2018 School WASH Assessment asked respondents to provide their views on how clean their school toilets were. Interviewers also used their own observations to confi rm the views provided by

2018 School Water, Sanitation and Hygiene Assessment | Main Report 51
the respondents. The responses were divided into four categories – very clean, clean, somewhat clean and not clean.
Overall, it was observed that only 9.4 per cent of school toilets were very clean, 43.9 per cent were considered clean, 43.5 per cent were regarded as somewhat clean, while 3.2 per cent of the toilets were found to be not clean.
Toilets in urban schools were more likely to be very clean (17.3 per cent) and clean (48.1 per cent) compared to (7.2 per cent and 42.7 per cent respectively) of schools in rural areas. A similar pattern was observed for secondary schools where 13.6 per cent of toilets were observed as very clean and 47.3 per cent were observed as clean whereas, for primary schools, 7.6 per cent were observed as very clean and 42.3 per cent as clean. In terms of the ownership status, non-government schools had 30.5 per cent very clean toilets and 50.2 per cent clean toilets compared to
Background characteristics
Within school building/outside building, but on premises
Off premises/in and out of the building
Number of schools
Mainland/Zanzibar
Mainland 97.8 2.2 2,320
Zanzibar 95.1 4.9 65
Location of School
Rural 98.5 1.5 1,857
Urban 95.2 4.8 528
Level of School
Primary school 99.2 0.8 1,640
Secondary school 94.7 5.3 745
Ownership Status
Government 98.9 1.1 2,069
Non-Government 90.3 9.7 316
Tanzania 97.8 2.2 2,385
Table 5.6: Percentage on the location of sanitation facilities in schools by location, ownership status, and level of school, Tanzania, 2018
6.2 per cent and 42.9 per cent respectively in government schools. Signifi cant disparity was observed in terms of the very clean toilets category with respect to type of school. About 51.4 per cent of toilets in all-girls’ schools were found to be very clean compared to a meagre 5.7 per cent in all-boys schools. Only 8.8 per cent of toilets in co-education schools were very clean. (Table 5.7).
5.8 Methods Used to
Empty Filled-up
Latrines/ToiletsProviding adequate sanitation does not end with building toilets. On-site systems will eventually reach a limit capacity – excreta will decompose in the pit and the pit will fi ll up, which will then have to be emptied. Filled-up toilets will become unusable, which will leave schools without basic sanitation and this might lead to health hazards.

2018 School Water, Sanitation and Hygiene Assessment | Main Report52
Table 5.7: Percentage of schools by perception of cleanliness of the students’ toilets, by location, ownership status, level of school, type of school and model of school, Tanzania, 2018
Background characteristics
Very clean Clean Somewhat clean Not clean Number of schools
Mainland/Zanzibar
Mainland 9.2 43.9 43.8 3.1 2,320
Zanzibar 19.6 43.3 31.9 5.2 65
Location of School
Rural 7.2 42.7 46.8 3.3 1,857
Urban 17.3 48.1 31.7 2.8 528
Level of School
Primary school 7.6 42.3 46.3 3.8 1,640
Secondary school 13.6 47.3 37.2 1.9 745
Ownership Status
Government 6.2 42.9 47.3 3.6 2,069
Non-Government 30.5 50.2 18.7 0.7 316
Type of School
Girls only 51.4 35.4 13.3 0.0 40
Boys only 5.7 64.4 29.9 0.0 30
Mixed 8.8 43.8 44.2 3.3 2,315
Model of School
Boarding School 27.4 49.9 22.8 0.0 127
Day School 6.9 42.8 46.7 3.6 2,077
Both (Boarding and Day) 26.1 51.8 20.9 1.2 181
Tanzania 9.4 43.9 43.5 3.2 2,385
Choosing the most appropriate and eff ective emptying mechanisms for safe and hygienic containment of excreta is very important to prevent diseases and protect users. Emptying excreta from a pit is an unpleasant task and can be extremely hazardous, both in terms of public health and safety. Considering this importance, the 2018 School WASH Assessment investigated methods that were commonly employed by schools for emptying fi lled-up toilets.
The results indicate that, the most common method used to empty fi lled-up toilets/latrines in Tanzanian schools was digging a new pit (46.9 per cent), followed by tank collectors (40.3 per cent). While the most common method for emptying toilets in Tanzania Mainland was digging new pits (47.4 per cent), use of gulpers/tank collectors to empty fi lled-up toilets/latrines was the most commonly used method in Zanzibar (59.7 per cent).

2018 School Water, Sanitation and Hygiene Assessment | Main Report 53
About 79 per cent of urban schools mainly used gulpers/tank collectors to empty fi lled-up toilets/latrines compared to 63.0 per cent of rural schools that mainly dug new pits to replace fi lled-up toilets. (Table 5.8).
5.9 Presence of Urinal
FacilitiesGenerally, the use of urinals in Tanzanian schools was low. About 2.7 per cent of schools reported to having urinals for both girls and boys. While 21.7 per cent of schools reported to having urinal facilities for boys, less than one per cent (0.5 per cent) of schools had urinal
facilities for girls. Urinals were not common in Zanzibar as 94.7 per cent of schools reported to having no urinals for their students.
Schools in urban areas (34.4 per cent) were more likely to have urinals for boys compared to schools in rural areas (18.1 per cent). Urinal facilities for boys were more common in secondary schools (27.2 per cent) than in primary school (19.2 per cent).
Thirty-seven per cent of non-government-owned schools had urinal facilities for boys compared to 19.3 per cent of government-owned schools (Table 5.9).
Types of methods Tanzania Mainland Zanzibar Rural Urban
Gulpers/Tank collectors 40.3 39.9 59.7 22.4 78.6
Digging in new pits 46.9 47.4 20.6 63.0 12.6
Manually emptied 6.6 6.4 19.7 7.0 5.8
Other 6.2 6.3 0.0 7.7 3.1
Total 100.0 100.0 100.0 100.0 100.0
Table 5.8: Percentage of schools by methods used to empty fi lled-up latrines, Tanzania, 2018

2018 School Water, Sanitation and Hygiene Assessment | Main Report54
Note: 10 schools had missing information on the presence of urinals
Background characteristics
Availability of urinals for: Number of schoolsGirls
studentsBoys students
Both for boys and girls students
No urinals
Mainland/Zanzibar
Mainland 0.5 22.2 2.7 74.6 2,310
Zanzibar 0.0 5.3 0.0 94.7 65
Location of School
Rural 0.2 18.1 2.4 79.4 1,848
Urban 1.5 34.4 3.6 60.5 527
Level of School
Primary school 0.2 19.2 3.1 77.5 1,630
Secondary school 1.1 27.2 1.8 70.0 745
Ownership Status
Government 0.3 19.3 2.2 78.1 2,059
Non-Government 1.4 37.4 5.5 55.7 316
Type of School
Girls only 1.6 0.0 0.0 98.4 40
Boys only 0.0 56.6 0.0 43.4 30
Mixed 0.5 21.7 2.7 75.2 2,305
Model of School
Boarding School 0.5 36.3 1.7 61.5 127
Day School 0.4 19.6 2.5 77.5 2,077
Both (Boarding and Day)
1.2 36.2 5.1 57.5 181
Tanzania 0.5 21.7 2.7 75.2 2,375
Table 5.9: Percentage of schools with urinal facilities by location, level, ownership status, type and model of school, Tanzania, 2018

2018 School Water, Sanitation and Hygiene Assessment | Main Report 55
Chapter 6
HYGIENE

2018 School Water, Sanitation and Hygiene Assessment | Main Report56
Promoting hygiene is a key intervention in schools. It encourages a child to practise good hygiene early on, both in school and at home, and this fosters healthy behaviours for life. The success of any school WASH intervention will not be determined by the number of constructed toilets or the number of hand pumps or water systems installed. It is largely predicated on, and determined by, what students practise. Key hygiene interventions include teacher training, formation and training of SWASH clubs, and teaching hygiene education. The main aim of forming and strengthening school WASH clubs is to foster positive attitudes towards good hygiene practices and proper use and maintenance of WASH facilities in schools.
Good and eff ective education about hygiene is as important as good water supply systems or sanitary facilities. Life skills-based hygiene education allows children to learn about water and sanitation related behaviours and how these lead to good or bad health. The idea is that when children understand and think together about their situations and practices, they can plan and act to prevent diseases, now and in the future. Global experience has shown that children are enthusiastic promoters of their newly acquired hygiene skills and can potentially be eff ective agents of change within their homes and communities. If messaging and practices are consistent with the cultural environment, children’s advocacy can lead to better hygiene practices at homes and in communities.
This section presents fi ndings of the 2018 Tanzania School WASH Assessment on hygiene, paying particular attention to two major components: hand hygiene and menstrual hygiene management (MHM).
Hand hygiene involves any action of hand cleansing, especially washing hands with soap and water to avoid the growth of germs on hands. The practices of hand hygiene are
performed by teachers, pupil and other staff within the school environment. However, hand hygiene can be practised only if handwashing facilities are in a proper condition and are maintained regularly.
6.1 Presence of
Handwashing FacilitiesHandwashing facilities in schools refer to any infrastructure (fi xed or mobile) that enables students to wash their hands eff ectively using running water from piped water with taps, sink with tap, water tank with tap, bucket with tap, and tippy tap among others. A shared bucket used for dipping hands is not considered an eff ective handwashing facility.
Table 6.1 provides information on the percentage of schools that were reported and observed to have handwashing facilities with regard to location, level of school, ownership, type of school, and model of school and region. Generally, fi ndings from observations are always less than the reported ones for all background characteristics.
The 2018 School WASH Assessment fi ndings show that handwashing facilities were present in more than six out of ten (63.8 per cent) schools in Tanzania. The percentage of schools reported to having handwashing facilities was higher in Zanzibar (78.1 per cent) than in Tanzania Mainland (63.4 per cent).
Presence of handwashing facilities were more likely in urban schools (75.3 per cent) than schools in rural areas (60.6 per cent). On the other hand, there were small diff erences, with regard to presence of handwashing facilities, between primary schools (63.1 per cent) and secondary schools (65.5 per cent). Handwashing facilities seem to be more common in non-government schools (89.2 per cent) than in government schools (60.0 per cent).

2018 School Water, Sanitation and Hygiene Assessment | Main Report 57
Table 6.1: Percentage of schools reported and observed to have handwashing facilities by location, level of school, ownership status, type of school, model of school and region, Tanzania, 2018
Background characteristics
Percentage of schools with handwashing facilities Number of schoolsReported Observed
Mainland/Zanzibar
Mainland 63.4 54.3 2,320
Zanzibar 78.1 72.1 65
Location of School
Rural 60.6 52.0 1,857
Urban 75.3 64.6 528
Level of School
Primary school 63.1 53.4 1,640
Secondary school 65.5 57.9 745
Ownership Status
Government 60.0 50.4 2,069
Non-Government 89.2 83.9 316
Type of School
Girls only 93.4 93.4 40
Boys only 92.8 94.8 30
Mixed 62.9 53.6 2,315
Model of School
Boarding School 87.0 83.1 127
Day School 61.2 51.4 2,077
Both (Boarding and Day) 77.7 74.6 181
Region
Dodoma 63.2 41.4 102
Arusha 91.6 81.7 105
Kilimanjaro 79.5 76.0 131
Tanga 62.4 49.1 135
Morogoro 60.5 60.7 121
Pwani 68.7 58.5 102
Dar es Salaam 84.1 67.9 109
Lindi 58.7 52.7 72
Mtwara 45.8 36.9 83
Ruvuma 81.3 71.3 106(Continued)

2018 School Water, Sanitation and Hygiene Assessment | Main Report58
Background characteristics
Percentage of schools with handwashing facilities Number of schoolsReported Observed
Iringa 92.8 82.2 68
Mbeya 62.6 58.3 96
Singida 67.1 55.4 69
Tabora 55.6 43.6 101
Rukwa 52.1 24.6 48
Kigoma 27.8 26.0 83
Shinyanga 68.2 59.0 72
Kagera 43.0 43.4 127
Mwanza 65.5 50.8 124
Mara 52.3 46.3 106
Manyara 53.0 44.8 84
Njombe 79.4 73.8 64
Katavi 62.0 54.3 26
Simiyu 50.7 42.4 66
Geita 45.9 39.9 69
Songwe 59.6 45.4 51
Kaskazini Unguja 71.5 67.2 9
Kusini Unguja 79.1 72.1 9
Mjini Magharibi 88.5 80.0 25
Kaskazini Pemba 62.7 55.6 10
Kusini Pemba 73.2 73.2 12
Tanzania 63.8 54.8 2,385
(Continued)
Regionally, there were large variations with respect to presence of handwashing facilities in schools: ranging from 27.8 per cent in Kigoma Region to 92.8 per cent in Iringa Region.
6.2 Types of Handwashing
FacilitiesOverall, the most common types of handwashing facilities used in Tanzanian schools were tippy taps (41.7 per cent) and piped water with taps (33.8 per cent). Buckets or basins with taps were used by 15.3 per
cent of schools with handwashing facilities (Table 6.2).
Schools with handwashing facilities in Zanzibar were more likely to use piped water with taps (95.0 per cent) than schools in Tanzania Mainland (31.7 per cent). However, the use of tippy tap was more common in Tanzania Mainland (43.0 per cent) than in Zanzibar (4.2 per cent).
Within schools with handwashing facilities, use of tippy taps was much higher in rural schools (48.6 per cent) than in those in

2018 School Water, Sanitation and Hygiene Assessment | Main Report 59
urban areas (22.1 per cent). Piped water with taps was more commonly used in urban schools (61.7 per cent) than in rural schools (23.9 per cent).
With regard to the school level, secondary schools were more likely to use piped water
with taps as handwashing facility (55.6 per cent) than primary schools (23.5 per cent). The pattern was diff erent with regard to the use of tippy taps: only 19.4 per cent of secondary schools used tippy taps compared to 52.2 per cent of primary schools.
Table 6.2: Percentage of schools with handwashing facilities by location, level, ownership status, type of school and model of school, Tanzania, 2018
Background characteristics
Types of handwashing facilities Number of schoolsPiped
water with taps
Storage tank with taps
Buckets/basins with tap
Buckets/basins without tap
Hand-poured water system
Tippy tap
Other
Mainland/Zanzibar
Mainland 31.7 5.7 15.7 9.6 6.6 43.0 2.3 1,402
Zanzibar 95.0 4.1 4.1 7.2 5.0 4.2 0.8 119
Location of School
Rural 23.9 5.7 14.3 10.3 6.6 48.6 2.7 1,111
Urban 61.7 5.8 18.0 7.2 6.2 22.1 1.2 410
Level of School
Primary school 23.5 5.9 14.3 9.4 6.0 52.2 2.6 1,015
Secondary school 55.6 5.1 17.4 9.7 7.7 19.4 1.7 506
Ownership Status
Government 24.3 5 14.3 9.9 7.1 49.5 2.5 1,238
Non-Government 75.7 8.5 19.5 7.6 4.1 7.6 1.5 283
Type of School
Girls only 89.0 5.9 15.6 8.8 0.0 4.8 0.0 28
Boys only 85.9 2.4 14.7 4.0 2.0 8.3 0.0 22
Mixed 31.4 5.7 15.3 9.6 6.8 43.3 2.4 1,471
Model of School
Boarding School 78.8 8.4 9.4 5.5 3.4 8.0 1.8 92
Day School 25.7 5.3 15.3 10.5 7.1 47.3 2.3 1,293
Both (Boarding and Day)
71.5 7.3 20.2 3.6 4.1 17.7 2.7 136
Tanzania 33.8 5.7 15.3 9.5 6.5 41.7 2.3 1,521

2018 School Water, Sanitation and Hygiene Assessment | Main Report60
6.3 Availability of Water
and SoapHandwashing is one of the best ways to prevent the spread of germs and protect people from contracting dangerous or even fatal infections (which can lead to children missing school). Washing hands with soap and water is the eff ective way to get rid of germs in most situations. It reduces the risks of people contracting infections and prevents germs from spreading from one person to another and across an entire community.
Besides recording responses (reported by respondents) with regard to the availability of water and soap for schools with handwashing facilities on the day of the survey, fi eldwork interviewers in the 2018 Tanzania School WASH Assessment also observed the availability of water and soap at various handwashing facilities. Figure 6.1 presents a comparison of results obtained from both reported and observed data. The two approaches mentioned above are expected to yield diff erences between reported and
observed data since respondents may have over-reported the availability of water and soap.
For example, though almost half of the schools with handwashing facilities (47.4 per cent) reported to have water and soap at handwashing facilities on the day of the survey, data from observations revealed that only 32.1 per cent of schools actually had water and soap at handwashing facilities.
Although through interview, 43.1 per cent of schools reported having only water and 9.2 per cent of schools having neither water nor soap at their handwashing facilities on the day of the survey, data from observations indicated that 50.3 per cent of schools actually had only water and 16.4 per cent had neither water nor soap.
Table 6.3 provides data on the percentages of schools observed to have water and soap, water only, soap only and neither water nor soap at their handwashing facilities with regard to the various background characteristics. In terms of school location, schools in urban
Figure 6.1: Percentage of schools with water and soap, water only, soap only and neither water nor soap at the handwashing facilities from reported and observed data, Tanzania, 2018
Neither water, nor soap
Soap onlyWater onlyWater & soap
Perc
ent
47.4
9.2
16.4
1.20.3
50.3
43.1
32.1
60
50
40
30
20
10
0
Reported Observed

2018 School Water, Sanitation and Hygiene Assessment | Main Report 61
areas were more likely to have water and soap at their handwashing facilities (36.0 per cent) compared to schools in rural areas (30.8 per cent). Likewise, non-government schools with handwashing facilities were more likely to have water and soap (46.5 per cent) than government schools (28.5 per cent).
On the other hand, schools with girls only had a higher percentage of their handwashing facilities having soap and water (42.8 per cent) than schools with boys only (32.4 per cent) and
co-education schools (31.8 per cent). Findings also revealed that only 6.6 per cent of non-government schools had neither water nor soap at their handwashing facilities as compared to 18.9 per cent of government schools.
Across the regions, the percentage of schools with both water and soap available at the handwashing facilities was highest in Kilimanjaro region (62.1 per cent), and smallest in Songwe Region (3.1 per cent) (Figure 6.2).
Table 6.3: Percentage distribution of schools observed to have water and soap, water only, soap only and neither water nor soap at their handwashing facilities by background characteristics, Tanzania, 2018
Background characteristics
Water and soap
Water only
Soap only Neither water, nor soap
Number of schools
Mainland/Zanzibar
Mainland 32.4 49.8 1.2 16.6 1,278
Zanzibar 25.3 62.7 0.0 12.0 47
Location of School
Rural 30.8 49.5 1.0 18.7 980
Urban 36.0 52.6 1.8 9.7 345
Level of School
Primary school 32.4 46.6 1.5 19.4 888
Secondary school 31.6 57.7 0.5 10.3 437
Ownership Status
Government 28.5 51.4 1.2 18.9 1,057
Non-Government 46.5 45.7 1.1 6.6 268
Type of School
Girls only 42.8 53.3 0.0 3.8 38
Boys only 32.4 58.5 0.0 9.1 28
Mixed 31.8 50.0 1.2 16.9 1,259
Model of School
Boarding School 36.9 56.3 0.0 6.8 107
Day School 30.6 49.4 1.3 18.6 1,081
Both (Boarding and Day) 40.7 52.2 0.9 6.2 1,37
Tanzania 32.1 50.3 1.2 16.4 1,325

2018 School Water, Sanitation and Hygiene Assessment | Main Report62
Figure 6.2: Percentage of schools observed to have water and soap at their handwashing facilities by region, Tanzania, 2018
62.1
51.6
48.5
41.8
40.2
38.6
36.9
35.8
35.1
35.0
34.9
34.0
32.1
31.5
31.2
30.6
27.8
25.5
25.5
24.4
24.2
21.9
20.9
19.4
18.4
14.2
12.9
12.9
11.4
10.1
6.0
3.1
Kilimanjaro
Arusha
Tabora
Kagera
Iringa
Shinyanga
Mjini Magharibi
Morogoro
Mwanza
Geita
Pwani
Kigoma
Tanzania
Kaskazini Unguja
Dar es Salaam
Singida
Njombe
Mara
Tanga
Katavi
Mbeya
Rukwa
Dodoma
Lindi
Mtwara
Manyara
Kusini Pemba
Kaskazini Pemba
Simiyu
Kusini Unguja
Ruvuma
Songwe
0 10 20 30 40 50 60 70

2018 School Water, Sanitation and Hygiene Assessment | Main Report 63
6.4 Classifications of
Hygiene Services
According to the Joint
Monitoring Programme
(JMP)Much as like water and sanitation services, the JMP ladder classifi cations for hygiene services is categorized into three levels – basic, limited or no hygiene services.
Basic hygiene service means that handwashing facilities with soap and water are available at the time of the survey interview. Limited hygiene service means that handwashing facilities with water are available, but no soap is available at the time of the survey interview. If a school has handwashing facilities but no water and soap, or does not have handwashing facility, the school is classifi ed as having no hygiene services at all.
This section presents results obtained from observations data collected for the hygiene module that was included in the 2018 Tanzania School WASH Assessment Observation Questionnaire. Interviewers observed the availability of services and infrastructure on site, instead of simply relying on the respondents’ data. Therefore, results from observation data may represent the actual situation regarding the availability of key components for classifying hygiene services.
By using classifi cations of hygiene services according to the JMP, it was observed that, about 17.6 per cent schools in Tanzania had basic hygiene services, 27.6 per cent had limited hygiene services and more than half of schools (54.8 per cent) had no hygiene services (Figure 6.3).
While there was a slight variation in the availability of basic hygiene services among schools in Zanzibar (18.2 per cent) and those
Figure 6.3: Percentage of schools with hygiene services by location, level of school and ownership status, Tanzania, 2018
Basic hygiene services Limited hygiene services No hygiene services
100
80
60
40
20
0
Tanz
ania
Mai
nlan
d
Zanz
ibar
Rur
al
Urb
an
Prim
ary
Seco
ndar
y
Gov
ernm
ent
Non
-Gov
ernm
ent
Ownership statusLevel of schoolsLocationMainland/Zanzibar
54.8
27.6
17.6
55.3
27.1
17.6 18.2 16.0 23.2 17.3 18.3 14.439.0
25.9
59.7
22.6
38.4
33.4
48.357.8
24.933.9
42.8
25.7
58.2
45.2
36.5
Perc
ent

2018 School Water, Sanitation and Hygiene Assessment | Main Report64
in the Mainland (17.6 per cent), signifi cant diff erences were observed for limited services (45.2 per cent for Zanzibar and 27.1 per cent for the Mainland) and for no hygiene services (36.5 per cent for Zanzibar and 55.3 per cent for the Mainland).
Schools in urban areas had a higher percentages of basic hygiene services (23.2 per cent) and limited hygiene services (33.9 per cent) compared to schools in rural areas (16.0 per cent and 25.7 per cent, respectively). It was also observed that 58.2 per cent of rural schools had no hygiene services compared to 42.8 per cent in urban areas.
Noticeable diff erences for basic hygiene services were observed with regard to ownership of schools. The survey has established that 39.0 per cent of non-government-owned schools had basic hygiene services which was more than
twice that of government-owned schools (14.4 per cent). About 60 per cent of government-owned schools had no hygiene services compared to only 22.6 per cent of non-government-owned schools.
Remarkable variations in the availability of basic hygiene services in school were found across regions: ranging from 1.4 per cent in Songwe Region to 47.2 per cent in Kilimanjaro Region (Map 6.1).
6.5 Location of
Handwashing FacilitiesLocation of handwashing facilities plays a key role in children washing their hands every time they visit the toilet. If handwashing facilities in schools are poorly located and inaccessible, children may fi nd it hard to access.
Map 6.1: Percentage of schools observed to have basic hygiene services by region, Tanzania, 2018
Kagera18.1
Geita14.0
Shinyanga22.8
Tabora21.1
Katavi13.3
Rukwa5.4
Njombe20.5
Morogoro21.7
Tanga12.5
Manyara6.4
Arusha42.2
Singida16.9
Kilimanjaro47.2
Ruvuma4.3
Mtwara6.8
Lindi10.2
Pwani20.4
Dodoma8.7
Kigoma8.8
Simiyu4.8Mwanza
17.8
Mara11.8
Iringa33.1
Songwe1.4
Mbeya14.1
DRC
ZAMBIA
MALAWI
BURUNDI
RWANDA
UGANDA
KENYA
L. Rukwa
Lake Victoria
Indian Ocean
Up to 5.405.41 – 10.2010.21 – 18.1018.11– 29.51> 29.51
Legend:Percentage of schools withaccess to basic hygience services
Kaskazini Unguja 21.2
Kaskazini Pemba 7.1
Kusini Pemba 9.5
Mjini Magharibi 29.5 Kusini Unguja
7.3
Indian Ocean
MOZAMBIQUE
0 50 100 150 Km
Lake TanganyikaN
Lake Nyasa
L.Natron L.Eyasi
L.Manyara
Dar es Salaam21.2

2018 School Water, Sanitation and Hygiene Assessment | Main Report 65
The 2018 Tanzania School WASH Assessment investigated the location of handwashing facilities in important areas: inside or near toilets, food preparation areas, dining areas, classrooms, teachers’ offi ces, dormitory or other relevant areas.
Results indicate that eight out of ten schools in Tanzania (81.1 per cent) had their handwashing facilities located inside/outside toilets or near toilets, followed by those located within the school yard (33.3 per cent). A similar pattern was observed for most of the background characteristics as detailed in Table 6.4.
Table 6.4: Percentage of schools with handwashing facilities by background characteristics and location of handwashing facilities, Tanzania, 2018
Background characteristics
Handwashing location Other
Toilets Food preparation area
Dining areas
Classrooms School yard
Teachers offi ce
Dormitory
Mainland/Zanzibar
Mainland 81.4 9.2 9.9 4.5 31.3 6.9 5.2 2.7
Zanzibar 73.9 3.1 0.6 0.0 91.0 0.0 1.2 0.8
Location of School
Rural 81.3 7.0 5.8 3.5 29.9 6.6 3.5 2.8
Urban 80.6 14.7 20.2 6.6 42.8 6.8 9.4 2.3
Level of School
Primary school 80.7 5.2 5.2 4.6 31.7 4.4 1.1 1.4
Secondary school
82.0 17.0 18.7 3.7 36.6 11.4 13.4 5.2
Ownership Status
Government 80.4 4.7 2.6 3.5 31.0 6.3 1.7 2.6
Non-Government
84.4 28 40.2 7.7 43.2 8.2 20.0 2.8
Type of School
Girls only 94.9 48.2 59.0 2.2 43.2 4.5 36.3 13.0
Boys only 100.0 31.2 59.8 0.0 43.3 20.9 34.2 0.0
Mixed 80.4 7.6 7.3 4.5 32.8 6.4 3.7 2.4
Model of School
Boarding School
83.0 34.1 48.4 4.6 40.6 9.8 31.1 7.2
Day School 80.7 4.9 3.8 4.1 31.0 5.9 0.1 2.3
Both (Boarding and Day)
83.4 26.4 31.5 6.5 48.6 10.7 29.7 1.7
Tanzania 81.1 9.0 9.6 4.3 33.3 6.6 5 2.6

2018 School Water, Sanitation and Hygiene Assessment | Main Report66
6.6 Accessibility to
Handwashing Facilities
for the Youngest
Children and Pupils
with Limited Mobility
and Impaired VisionIn terms of equitable accessibility, the 2018 Tanzania School WASH Assessment fi ndings show that more than eight out of ten primary schools (84.7 per cent) with handwashing facilities had facilities that were accessible to the youngest children, while 58.6 per cent of schools (both primary and secondary) with handwashing facilities had facilities that were accessible to pupils with limited mobility or vision.
Primary schools in Zanzibar were more likely to have handwashing facilities that were accessible to the youngest children (88.4 per cent) compared to 84.6 percent in Tanzania Mainland. Likewise, 77.3 per cent of both
primary and secondary schools in Zanzibar had handwashing facilities accessible to children with limited mobility or impaired vision compared to 58.0 per cent in Tanzania Mainland.
There was a slight diff erence between rural and urban primary schools, with respect to the accessibility to handwashing facilities for the youngest children (84.1 per cent for rural and 87.1 per cent for urban). Furthermore, 64.1 per cent of urban schools (primary and secondary) had handwashing facilities accessible to children with limited mobility and impaired vision compared to 56.7 per cent of schools in rural areas.
Almost no diff erences were noticed (for handwashing facilities accessible to pupils/ students with limited physical mobility or impaired vision) with respect to levels of schools and ownership of schools. However, non-government primary schools were more likely having handwashing facilities accessible to the youngest children (93.3 per cent) than government-owned primary schools (83.6 per cent) (Table 6.5).
Table 6.5: Percentage of schools with handwashing facilities accessible to the youngest children and schools with hand washing accessible to pupils with physical disabilities or impaired vision by background characteristics, Tanzania, 2018
Background characteristics
Schools with handwashing facilities accessible to the youngest children (Primary schools only)
Number of schools
Schools with handwashing facilities accessible to those with physical disability or impaired vision
Number of schools
Mainland/Zanzibar
Mainland 84.6 986 58.0 1,471
Zanzibar 88.4 29 77.3 50
Location of School
Rural 84.1 803 56.7 1,124
Urban 87.1 212 64.1 397
Level of School
Primary school 84.7 1,015 58.6 1,034
Secondary school N/A N/A 58.7 487
Ownership Status
Government 83.6 898 58.3 1,240
Non-Government 93.3 117 59.9 281
Tanzania 84.7 1,015 58.6 1,521

2018 School Water, Sanitation and Hygiene Assessment | Main Report 67
6.7 Hygiene EducationTeaching students about hygiene involves dissemination of health information and proper practice aimed at empowering children. Hygiene education motivates them into adopting responsible hygiene practices for themselves, their schools and the entire community.
Results from the 2018 Tanzania School WASH Assessment show that almost all schools in Tanzania were teaching hygiene education (95.8 per cent).
Table 6.6 indicates that there were slight variations in the percentages of schools teaching hygiene education in terms of background characteristics. Hygiene education in schools was over 92.0 per cent for each of the characteristics.
Hygiene education is delivered in various ways, such as a component of the core curriculum, as an integral part of a special module on life skills, as a standalone module on hygiene or through school-sponsored extra curriculum programmes (e.g. school WASH clubs). The survey has revealed that hygiene education in Tanzanian schools was most commonly taught as a component of the core curriculum or as part of a science subject in about 68.3 per cent of the school teaching hygiene education. About 25 per cent of schools taught hygiene through school-sponsored extra curriculum programmes and 22.4 per cent taught hygiene as an integral part of a special module on life skills. However, 16.2 per cent of schools taught hygiene without following any special recommended module (Figure 6.4).
Background characteristics Percentage of schools teaching hygiene education
Number of schools
Mainland/Zanzibar
Mainland 95.9 2,320
Zanzibar 92.5 65
Location of School
Rural 95.9 1,857
Urban 95.6 528
Level of School
Primary school 97.2 1,640
Secondary school 92.8 745
Ownership Status
Government 95.9 2,069
Non-Government 95.2 316
Type of School
Girls only 94.3 40
Boys only 93.7 30
Mixed 95.9 2,315
Tanzania 95.8 2,385
Table 6.6: Percentage distribution of schools teaching hygiene education by background characteristics, Tanzania, 2018

2018 School Water, Sanitation and Hygiene Assessment | Main Report68
Figure 6.4: Percentage of schools teaching hygiene education by mode of teaching, Tanzania, 2018
Perc
ent 68.3
16.224.6
14.0
100
80
60
40
20
0As a component
of core curriculum/ part of science
subject
As an integral part of a special
module on healthy living/
life skills
As a stand alone special
module on hygiene
Through school extra curriculum program (school/
WASH clubs)
No special module
22.4
6.8 Teachers trained in
WASHThe survey found out that 44.2 per cent of schools had teachers trained in WASH (Table 6.7). Teachers in Zanzibar were more likely to be trained in WASH (54.6 per cent) than teachers in Mainland (43.9 per cent). The percentage of teachers taught on WASH was higher for urban schools (51.2 per cent) than for rural schools (42.3 per cent). However, there was no diff erence in the proportion of teachers trained in WASH with respect to ownership of schools (44.1 per cent for government schools and 45.3 per cent for non-government schools).
6.9 Menstrual Hygiene
Management (MHM) Services
Menstrual hygiene management (MHM) is an essential aspect of hygiene for women and adolescent girls. Inappropriate management and practices of menstrual hygiene can
have adverse impact on health, education and psychosocial outcomes for women and girls. In schools, poor menstrual hygiene may lead to absenteeism, dropping out of school, compromised dignity, and various sexual and reproductive health concerns that can have substantial and long-term health and socio-economic eff ects for adolescent girls. Additionally, this could lead to other forms of social exclusion.
Schools are a potentially important setting in relation to MHM. In schools, the capacity of adolescent girls to manage their periods is aff ected by a number of factors that includes inadequate access to safe and private toilets, lack of clean water and soap for personal hygiene, and limited access to aff ordable and hygienic sanitary materials and disposal options. All these factors prevent them from managing their menstruation safely and hygienically. The continued silence around menstruation, combined with limited access to information, at home and in schools results in millions of girls having very little knowledge about what happens to their bodies when they menstruate and how they need to deal with

2018 School Water, Sanitation and Hygiene Assessment | Main Report 69
it. As a result, menstruating girls often feel ashamed and embarrassed, they either miss school or drop out of school. Nevertheless, school settings are also more conducive to reaching out to adolescent girls and helping them improve their knowledge, attitudes and practices in relation to MHM.
Given the multiple challenges that adolescent girls face with regard to inadequate menstrual hygiene management services in schools, MHM is not only a sanitation matter, but it is
also an important step towards safeguarding the dignity and bodily integrity of women and girls.
The 2018 Tanzania School WASH Assessment also collected information on MHM services for adolescent girls in schools. The information pertained to only all-girls schools or co-education schools. The assessment found out that two thirds (66.8 per cent) of Tanzanian schools (excluding schools with boys only) provided MHM services to adolescent girls (Table 6.8).
Background characteristics Percentage of schools with teachers trained/oriented on WASH
Number of schools
Mainland/Zanzibar
Mainland 43.9 2,320
Zanzibar 54.6 65
Location of School
Rural 42.3 1,857
Urban 51.2 528
Level of School
Primary school 49.2 1,640
Secondary school 33.3 745
Ownership Status
Government 44.1 2,069
Non-Government 45.3 316
Type of School
Girls only 42.0 40
Boys only 1.3 30
Mixed 44.8 2,315
Model of School
Boarding School 29.3 127
Day School 45.2 2,077
Boarding and Day 44.0 181
Tanzania 44.2 2,385
Table 6.7: Percentage of schools with teachers trained or oriented on WASH by background characteristics, Tanzania, 2018

2018 School Water, Sanitation and Hygiene Assessment | Main Report70
Percentage of MHM services was much higher in Tanzania Mainland schools (68.0 per cent) than in Zanzibar (21.3 per cent). In addition, urban schools were more likely to provide MHM services (70.9 per cent) than rural schools (65.6 per cent) did.
In terms of school level, 71.1 per cent of secondary schools provided MHM services to adolescents girls compared to 64.9 per cent of primary schools.
While more than seven out of ten (71.3 per cent) of non-government schools provided MHM services, only 66.1 per cent of government-owned schools provided MHM services to their pupils/students.
6.10 Components of MHM
Provided at the School
Of the schools that provided MHM services, most of them (84.2 per cent) provided MHM education as a component of MHM services, while only 49.0 per cent provided MHM materials (e.g. sanitary pads, pants etc.). Results also show that 16.7 per cent of schools that provided MHM services had changing rooms with basic amenities (water, waste bin, soap and emergency supplies), while 6.8 per cent of schools had changing rooms without basic amenities (Figure 6.5).
Table 6.8: Percentage of schools providing MHM services by background characteristics, Tanzania, 2018
Background characteristics Percentage of schools providing MHM services
Number of schools
Mainland/Zanzibar
Mainland 68.0 2,296
Zanzibar 21.3 65
Location of School
Rural 65.6 1,846
Urban 70.9 515
Level of School
Primary school 64.9 1,642
Secondary school 71.1 719
Ownership Status
Government 66.1 2,067
Non-Government 71.3 294
Type of School
Girls only 90.2 40
Mixed 66.4 2,321
Model of School
Boarding School 74.4 100
Day School 65.9 2,080
Boarding and Day 72.6 181
Tanzania 66.8 2,361

2018 School Water, Sanitation and Hygiene Assessment | Main Report 71
6.11 Provision of Menstrual
Hygiene Products for
Adolescent GirlsThe 2018 School WASH Assessment fi ndings indicate that half of schools (50.8 per cent) with girl students provided only a certain type of menstrual hygiene products to adolescent girls.
While more than half of schools in Tanzania Mainland (51.4 per cent) provided some type of hygiene products to adolescent girls, only three out of ten schools (29.9 per cent) in Zanzibar provided hygiene products to adolescent girls. Making hygiene products available to adolescent girls was more common in urban schools (62.5 per cent) than in rural schools (47.6 per cent).
There were remarkable diff erences in the provision of hygiene products with regard
to the level of school – 68.8 per cent of secondary schools provided hygiene products to adolescent girls compared to 43.0 per cent of primary schools. There was only a slight diff erence in the provision of hygiene products in terms of ownership of schools (50.4 of government schools and 53.6 per cent of non-government schools) (Table 6.9).
To manage their menstruation safely and with dignity adolescent girls in schools use diff erent materials and strategies. Menstrual hygiene materials are those used to catch menstrual fl ow, such as cloths, reusable and disposable pads, menstrual cups and tampons. The 2018 National school WASH Assessment investigated on this and established that disposable sanitary pads accounts for the majority (60.5 per cent) of menstrual materials used by adolescent girls in schools that were providing (Figure 6.6).
Figure 6.5: Percentage distribution of schools by components of MHM provided by the school, Tanzania, 2018
Perc
ent
16.7
84.2
49.0
100
80
60
40
20
0Changing room/special room for
adolescent girls with basic amenities
Changing room/special room for adolescent girls
without basic
MHM materials (e.g. sanitary pads, pants)
MHM education
6.8

2018 School Water, Sanitation and Hygiene Assessment | Main Report72
Table 6.9: Percentage of schools providing hygiene products by background characteristics, Tanzania, 2018
Background characteristics Percentage of schools providing hygiene products
Number of schools
Mainland/Zanzibar
Mainland 51.4 2,296
Zanzibar 29.9 65
Location of School
Rural 47.6 1,846
Urban 62.5 515
Level of School
Primary school 43.0 1,642
Secondary school 68.8 719
Ownership Status
Government 50.4 2,067
Non-Government 53.6 294
Type of School
Girls only 50.4 40
Mixed 50.8 2,321
Model of School
Boarding School 44.6 100
Day School 49.3 2,080
Boarding and Day 71.2 181
Tanzania 50.8 2,361
Figure 6.6: Percentage distribution of menstrual hygiene materials provided to the adolescent girls in schools, Tanzania, 2018
Others,including menstrual cups, tampons, a piece of colth (khanga)
Local sanitary towel
Re-usable sanitary
Disposable sanitary parts
Perc
ent
60.5
0.58.3
3.6
70
60
50
40
30
20
10
0

2018 School Water, Sanitation and Hygiene Assessment | Main Report 73
6.12 Presence of a
Separate Room/Space
for Menstrual Hygiene
ManagementA private space/room with soap, handwashing facilities, emergency pads and privacy is an important determinant of proper MHM in schools. The 2018 School WASH Assessment showed that about one-quarter (24.7 per cent) of schools (excluding all schools with boys only) in Tanzania reported to having a private space/room for menstrual hygiene management. Schools in Tanzania Mainland were more likely to have a separate room/space for MHM services (24.9 per cent) than schools in Zanzibar (19.3 per cent).
The fi ndings also indicate that urban schools (38.0 per cent) were more likely to have separate rooms for MHM than rural schools (21.1 per cent). However, in terms of the level of school, the fi ndings show that there was a slight diff erence between primary schools (23.4 per cent) and secondary schools (27.7 per cent) with regard to having separate rooms/space for MHM services. On the other hand, non-government schools were two times more likely (46.6 per cent) having separate rooms/space for MHM services than government schools (21.6 per cent) (Table 6.10).
Table 6.10: Percentage of schools with a private room for menstrual hygiene services by background characteristics, Tanzania, 2018
Background characteristics Percentage of schools with a private room for menstrual hygiene services
Number of schools
Mainland/ZanzibarMainland 24.9 2,296
Zanzibar 19.3 65
Location of SchoolRural 21.1 1,846
Urban 38.0 515
Level of SchoolPrimary school 23.4 1,642
Secondary school 27.7 719
Ownership StatusGovernment 21.6 2,067
Non-Government 46.6 2,94
Type of SchoolGirls only 35.3 40
Mixed 24.6 2,321
Model of SchoolBoarding School 36.3 100
Day School 22.7 2,080
Boarding and Day 42.2 181
Tanzania 24.7 2,361

2018 School Water, Sanitation and Hygiene Assessment | Main Report74
Figure 6.8: Percentage distribution of schools by the frequency of disposal of menstrual hygiene materials, Tanzania, 2018
Twice per month3.1%
Every day39.9%
Once per month14.5%
Once per week42.4%
Overall, more than half of the schools with separate rooms/spaces for menstrual hygiene services had water and soap at the time of the survey, 19.1 per cent had water but no soap and 2.1 per cent had only soap. Twenty-three per cent of schools with a separate room for menstrual hygiene services had neither water nor soap at the time of the interview (Figure 6.7).
6.13 Frequency of Disposal
of Menstrual Hygiene
Materials
Overall, 42.4 per cent of schools providing menstrual hygiene services in Tanzania disposed of menstrual hygiene materials once every week, 39.9 per cent of schools disposed of menstrual hygiene materials every day, 14.5 per cent of schools disposed of once every month and 3.1 per cent disposed of twice every month (Figure 6.8).
Figure 6.7: Percentage of schools with a separate room/space for MHM service by availability of water or soap, Tanzania, 2018
No water, no soap
Soap, but no water
Water, but no soap
Water & soap available
Perc
ent
56.3
22.5
2.1
19.1
70
60
50
40
30
20
10
0
6.14 Type of Mechanisms
for the Disposal of
Menstrual Hygiene
MaterialsThe 2018 School WASH Assessment fi ndings revealed that 23.9 per cent of schools in Tanzania used incinerators as a mechanism

2018 School Water, Sanitation and Hygiene Assessment | Main Report 75
Figure 6.9: Type of mechanisms for disposal of menstrual hygiene materials, Tanzania, 2018
Burning (not special chambers)
Latrine pits
Burning chambers
Incinerators
Perc
ent
23.9
1.7
4.2
18.7
25
20
15
10
5
0Sanitary disposal
pits
Waste pits
Services provider
Others
19.522.8
1.2
8.1
pits (8.1 per cent) and burning in places other than the ones specially reserved for burning sanitary materials (4.2 per cent). It was further established that only 1.2 per cent of schools use outsourced service providers to dispose of menstrual hygiene materials (Figure 6.9).
for disposal of menstrual hygiene materials, 22.8 per cent used sanitary disposal pits, 19.5 per cent used burning chambers and 18.7 per cent of schools used waste pits. Other mechanisms used for the disposal of menstrual hygiene materials included latrine

2018 School Water, Sanitation and Hygiene Assessment | Main Report76
Chapter 7
OPERATION AND MAINTENANCE

2018 School Water, Sanitation and Hygiene Assessment | Main Report 77
The provision of adequate WASH services in schools has demonstrated quantifi able improvements for both health and educational outcomes. Unfortunately, school WASH interventions face serious challenges to sustainability. Experience has demonstrated sharp declines over time in the functionality of WASH infrastructures and the provision of key inputs like soap and treated drinking water. Moreover, WASH facilities that are not maintained and used adequately not only cannot off er the intended benefi ts, but also can actually lead to the transmission of diseases.
Operation and maintenance (O&M) of WASH facilities implies regular maintenance of equipment or system and normally consists of inspecting, cleaning, servicing, preserving and adjusting as required. School WASH facilities’ maintenance and repair include purchasing soaps, replacing taps and pumps, pipe networks, point of use water treatment, and emptying septic tanks among others. This warrants continued access to handwashing facilities, sanitary facilities, and clean and safe drinking water. If proper operation and maintenance is not instituted, facilities will quickly deteriorate and cease to off er intended services.
To ensure sustainability of WASH facilities, schools, in collaboration with key stakeholders including communities, school management committees and school boards need to have reliable systems in place to keep water supply systems, toilets and handwashing facilities usable and clean. WASH facilities such as toilets are considered usable only if they are accessible, private, functional and clean for children to use them. To achieve this, the engagement of everyone, teachers, parents, students and community members is very important as the O&M of WASH facilities is a shared responsibility. Having a functional
O&M plan will enable schools to have a clear picture of the resources needed, ways to mobilize them, responsibilities of each stakeholder, and various other tasks involved. This plan will form a basic structure for O&M arrangements.
7.1 Funding for
Maintenance of School
WASH Facilities
Sound O&M system requires checks and balances, established procedures, a system for regular monitoring, clear roles and responsibilities as well as subsequent follow-ups to ensure functionality. Furthermore, reliable and steady funding mechanisms are an important element of strong O&M systems.
In Tanzania, institutional arrangements for operations and maintenance of WASH services in schools continue to encounter enormous challenges given the multi-sectoral nature of the sub-sector. To some extent, this multi-faceted nature has led to the inadequacy of existing structures in relation to O&M of WASH facilities. The ministries responsible for education (MoEST for Mainland and MoEVT in Zanzibar) are responsible for the overall coordination of SWASH; whereas PO–RALG and PO–RALGSD are respectively responsible for management and implementation. Other ministries responsible for water and health, along with the respective local government departments and schools, are also involved. Such complexity in institutional set-up has important implications for O&M of WASH services. In light of this, the 2018 School WASH Assessment investigated the extent to which O&M for WASH in schools was being implemented and its implications for the sustainability of WASH services.

2018 School Water, Sanitation and Hygiene Assessment | Main Report78
The assessment has revealed that 51.0 per cent of schools had funds to maintain and repair school WASH facilities at the time of the survey interview (Table 7.1). Schools on the Mainland were more likely to have funds allocated for maintenance and repair of school WASH facilities (51.3 per cent) than those in Zanzibar (40.5 per cent). Sixty-fi ve per cent of urban schools had funds to maintain and repair of school WASH facilities as compared
to 47.0 per cent of schools in rural areas. Non-Government schools were more likely to have funds for the repair and maintenance of school WASH facilities than government schools (86.3 per cent and 45.6 per cent respectively). Across regions, Mwanza Region had the highest percentage (70.0 per cent) of schools with funds for repair and maintenance, and Kaskazini Unguja Region had the lowest percentage (24.3 per cent).
Table 7.1: Percentage of schools with funds for maintenance and repair of school WASH facilities by location, level of school, ownership status of school, type of school, model of school and region, Tanzania, 2018
Background characteristics Percentage Number of schools
Mainland/Zanzibar
Mainland 51.3 2,320
Zanzibar 40.5 65
Location of School
Rural 47.0 1,857
Urban 65.1 528
Level of School
Primary school 45.3 1,640
Secondary school 63.5 745
Ownership Status
Government 45.6 2,069
Non-Government 86.3 316
Type of School
Girls only 89.4 40
Boys only 80.6 30
Mixed 49.9 2,315
Model of School
Boarding School 82.9 127
Day School 46.7 2,077
Both (Boarding and Day) 77.2 181
Region
Dodoma 31.6 102
(Continued)

2018 School Water, Sanitation and Hygiene Assessment | Main Report 79
Background characteristics Percentage Number of schools
Arusha 56.3 105
Kilimanjaro 60.3 131
Tanga 53.2 135
Morogoro 44.2 121
Pwani 55.5 102
Dar es Salaam 63.0 109
Lindi 37.2 72
Mtwara 39.9 83
Ruvuma 51.7 106
Iringa 53.3 68
Mbeya 40.3 96
Singida 45.1 69
Tabora 42.6 101
Rukwa 31.8 48
Kigoma 42.6 83
Shinyanga 58.4 72
Kagera 64.0 127
Mwanza 70.0 124
Mara 59.3 106
Manyara 40.4 84
Njombe 43.9 64
Katavi 38.9 26
Simiyu 63.2 66
Geita 68.8 69
Songwe 37.9 51
Kaskazini Unguja 24.3 9
Kusini Unguja 25.1 9
Mjini Magharibi 54.8 25
Kaskazini Pemba 34.4 10
Kusini Pemba 39.1 12
Tanzania 51.0 2,385
(Continued)
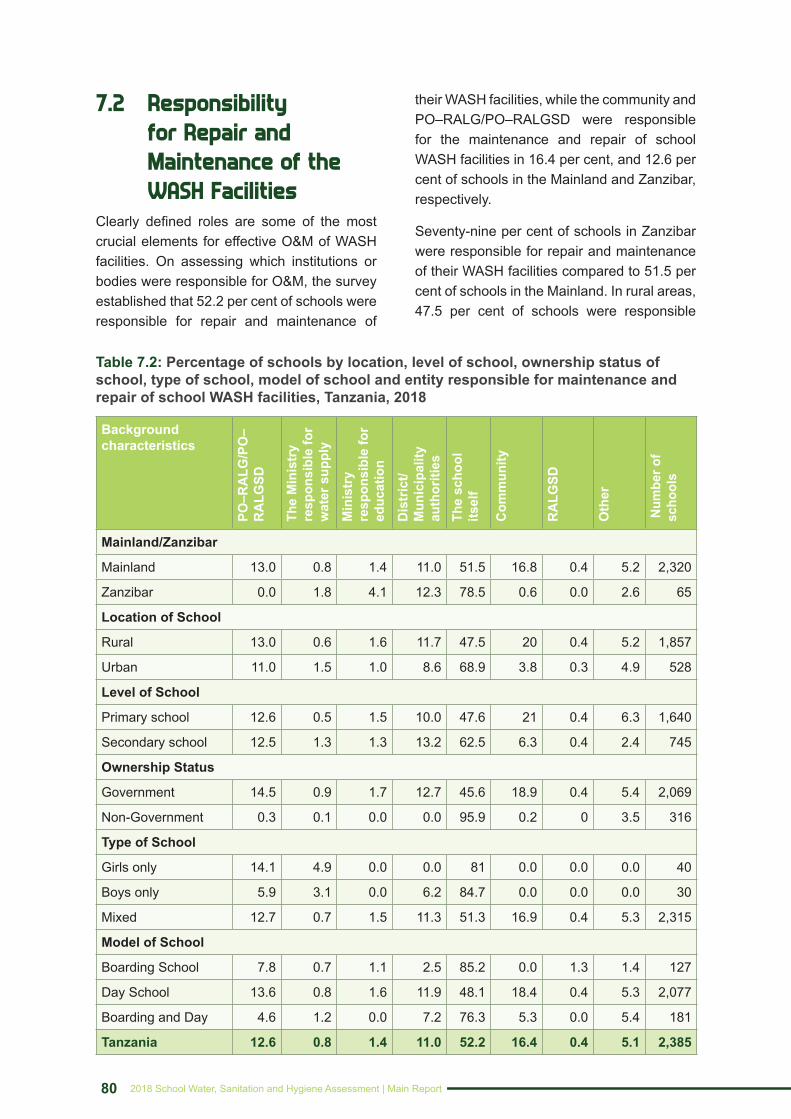
2018 School Water, Sanitation and Hygiene Assessment | Main Report80
7.2 Responsibility
for Repair and
Maintenance of the
WASH FacilitiesClearly defi ned roles are some of the most crucial elements for eff ective O&M of WASH facilities. On assessing which institutions or bodies were responsible for O&M, the survey established that 52.2 per cent of schools were responsible for repair and maintenance of
their WASH facilities, while the community and PO–RALG/PO–RALGSD were responsible for the maintenance and repair of school WASH facilities in 16.4 per cent, and 12.6 per cent of schools in the Mainland and Zanzibar, respectively.
Seventy-nine per cent of schools in Zanzibar were responsible for repair and maintenance of their WASH facilities compared to 51.5 per cent of schools in the Mainland. In rural areas, 47.5 per cent of schools were responsible
Table 7.2: Percentage of schools by location, level of school, ownership status of school, type of school, model of school and entity responsible for maintenance and repair of school WASH facilities, Tanzania, 2018
Background characteristics
PO–R
ALG
/PO
–RA
LGSD
The
Min
istry
re
spon
sibl
e fo
r w
ater
sup
ply
Min
istry
re
spon
sibl
e fo
r ed
ucat
ion
Dist
rict/
Mun
icip
ality
au
thor
ities
The
scho
ol
itsel
f
Com
mun
ity
RALG
SD
Oth
er
Num
ber o
f sc
hool
s
Mainland/Zanzibar
Mainland 13.0 0.8 1.4 11.0 51.5 16.8 0.4 5.2 2,320
Zanzibar 0.0 1.8 4.1 12.3 78.5 0.6 0.0 2.6 65
Location of School
Rural 13.0 0.6 1.6 11.7 47.5 20 0.4 5.2 1,857
Urban 11.0 1.5 1.0 8.6 68.9 3.8 0.3 4.9 528
Level of School
Primary school 12.6 0.5 1.5 10.0 47.6 21 0.4 6.3 1,640
Secondary school 12.5 1.3 1.3 13.2 62.5 6.3 0.4 2.4 745
Ownership Status
Government 14.5 0.9 1.7 12.7 45.6 18.9 0.4 5.4 2,069
Non-Government 0.3 0.1 0.0 0.0 95.9 0.2 0 3.5 316
Type of School
Girls only 14.1 4.9 0.0 0.0 81 0.0 0.0 0.0 40
Boys only 5.9 3.1 0.0 6.2 84.7 0.0 0.0 0.0 30
Mixed 12.7 0.7 1.5 11.3 51.3 16.9 0.4 5.3 2,315
Model of School
Boarding School 7.8 0.7 1.1 2.5 85.2 0.0 1.3 1.4 127
Day School 13.6 0.8 1.6 11.9 48.1 18.4 0.4 5.3 2,077
Boarding and Day 4.6 1.2 0.0 7.2 76.3 5.3 0.0 5.4 181
Tanzania 12.6 0.8 1.4 11.0 52.2 16.4 0.4 5.1 2,385

2018 School Water, Sanitation and Hygiene Assessment | Main Report 81
for repair and maintenance of their WASH facilities while the community was responsible for 20.0 per cent of schools. In urban areas, 68.9 per cent of schools were responsible for repair and maintenance of WASH facilities while District/Municipality authorities were responsible for repair and maintenance of 8.6 per cent of schools.
Sixty-three per cent of secondary schools and 47.6 per cent of primary schools were responsible for repair and maintenance of their WASH facilities. While in secondary schools the second entity responsible for the maintenance of school WASH facilities was the district/municipal authority (13.2 per cent), the community was the second entity in primary schools (21.0 per cent).
In government schools, the authorities responsible for repair and maintenance of school WASH facilities were the schools themselves (45.6 per cent) and the community (18.9 per cent), whereas nearly all non-government schools (95.9 per cent) were responsible for the repair and maintenance of their school WASH facilities (Table 7.2).
7.3 Responsibility for
Cleanliness of Toilet
FacilitiesClean and well-maintained WASH facilities can be a key motivation for users to continue using the facilities. Defi ning clearly who is responsible for cleaning WASH facilities and having proper mechanisms to guide implementation is very important. In Tanzania responsibilities for cleaning WASH facilities
in schools are assigned to schoolchildren,or janitors.
Overall, it was seen that pupils were responsible for cleanliness of school toilet facilities. Ninety-three per cent of schools in Tanzania had assigned the cleanliness of the schools’ toilets to their pupils/students. Only 8.3 per cent of the schools had hired cleaning staff to clean the schools’ toilets. Schools in Tanzania Mainland (93.0 per cent were more likely to assign pupils/students the responsibility of cleaning school toilets than schools in Zanzibar (78.4 per cent). Twenty per cent of schools in Zanzibar involved teachers to clean toilets, whereas in Tanzania Mainland only 7.9 per cent of schools required teachers to clean toilets.
Students were responsible for cleaning toilets in 97.1 per cent of schools in rural areas compared to 76.9 per cent of schools in urban areas. On the other hand, schools in urban areas (26.8 per cent) used cleaning staff more than schools in rural areas (3.0 per cent).
There was a slight diff erence between primary and secondary schools that assigned pupils/students to clean school toilet facilities (92.1 per cent and 93.9 per cent, respectively) (Table 7.3.).
Generally, 99.1 per cent of Government schools had assigned pupils/students the responsibility of cleaning toilets compared to 50.5 per cent of non-government schools. Moreover, more than half of non-government schools (57.5 per cent) hired janitors for cleaning school toilet facilities compared to only 0.8 per cent of government schools.

2018 School Water, Sanitation and Hygiene Assessment | Main Report82
Background characteristics Cleaning staff Teachers Pupils Others Number of schools
Mainland/Zanzibar
Mainland 7.9 1.6 93.0 0.7 2,229
Zanzibar 22.2 20.2 78.4 0.0 156
Location of School
Rural 3.0 2.3 97.1 0.4 1,857
Urban 26.8 1.5 76.9 1.5 528
Level of School
Primary school 7.2 2.5 92.1 0.6 1,640
Secondary school 10.6 1.3 93.9 0.7 745
Ownership Status
Government 0.8 2.2 99.1 0.4 2,069
Non-Government 57.5 1.1 50.5 2.4 316
Type of School
Girls only 33.9 0.0 78.7 0.0 40
Boys only 19.1 0.0 96.4 0.0 30
Mixed 7.7 2.2 92.8 0.7 2,315
Model of School
Boarding School 25.8 0.0 85.4 0.0 127
Day School 4.7 2.3 94.8 0.5 2,077
Boarding and Day 37.5 0.8 72.5 2.8 181
Tanzania 8.3 2.1 92.6 0.6 2,385
Table 7.3: Percentage of schools by location, level of school, ownership status of school, type of school, model of school and the entity responsible for cleaning schools’ toilet facilities, Tanzania, 2018

2018 School Water, Sanitation and Hygiene Assessment | Main Report 83
Chapter 8
PUPILS’ ENGAGEMENT

2018 School Water, Sanitation and Hygiene Assessment | Main Report84
According to the National school WASH guidelines, the main objective of establishing a WASH Club is to raise awareness among pupils/students and develop skills related to water, hygiene and sanitation through fun and practical activities. To meet such a broad objective, WASH club membership should represent students from all grades under their teachers’ guidance. The WASH club can organize itself into committees according to various WASH elements and appoint committee leaders or chairpersons.
The existence of school WASH clubs empowers pupils/students to play active roles in deciding and implementing issues related to WASH in schools. The clubs also off er pupils/students opportunities to become ‘agents of change’ within their respective communities by performing actions towards improving WASH practices. In some schools there are also other groups like Mazingira and Afya clubs, which in most cases, have similar objectives as the school WASH clubs do.
This chapter describes results of pupils'/students’ engagement in WASH club activities. Respondents were asked to list the clubs that were available in their respective schools and their roles.
8.1 Engagement in WASH/Mazingira/Afya Clubs
The survey results revealed that more than one third of schools in Tanzania (36.4 per cent) did not have any groups that pupils/students could engage themselves in, to implement issues related to WASH in schools. This means that almost two-thirds of schools (63.6 per cent) had students engaged in any one of the groups (WASH clubs, Mazingira club or Health club).
Furthermore, one-quarter of schools had Mazingira clubs, while 21.5 per cent of schools had both health and Mazingira clubs. WASH clubs and health clubs were present in 8.3 per cent (each) of the schools in Tanzania (Figure 8.1).
While students in Zanzibar were mostly engaged in school health clubs and Mazingira clubs (35.9), students in Mainland schools were mostly engaged in Mazingira clubs (25.6 per cent). The percentage of schools with no such clubs for their pupils/students in Zanzibar (33.2 per cent) was not that diff erent from that of schools in Tanzania Mainland (36.5 per cent). Likewise, a similar pattern
Figure 8.1: Engagement of pupils in school WASH/MAZINGIRA/Health clubs, Tanzania, 2018
School WASH club8.3%
School MAZINGIRA clubs25.4%
Not engaged in any club36.4%
HEALTH club & MAZINGIRA clubs
21.5%
School HEALTH clubs8.3%

2018 School Water, Sanitation and Hygiene Assessment | Main Report 85
was observed in schools with no such clubs in rural (36.2 per cent) and urban (37.1 per cent) areas.
With reference to the level of the school, the percentage of secondary schools with WASH clubs was smaller (3.7 per cent) than the percentage of primary schools (10.4 per cent). School Mazingira clubs were more common in secondary schools (33.7 per cent) than in primary schools (21.7 per cent), whereas,
both health and Mazingira clubs were more common in primary schools (22.5 per cent) than in secondary schools (19.3 per cent).
The 2018 School WASH Assessment revealed that WASH clubs were less common in both non-government (2.8 per cent) and government schools (9.2 per cent), while Mazingira clubs were more common in non-government schools (29.5 per cent) than in government schools (24.8 per cent) (Table 8.1).
Table 8.1: Percentage of schools with pupils/students engaged in WASH/health and Mazingira Clubs by location, level of school, ownership, type of school, model of school and region, Tanzania, 2018
Background characteristics
School WASH Club
School HEALTH club
School MAZINGIRA club
School HEALTH club and MAZINGIRA club
Not in any club
Number of schools
Mainland/Zanzibar
Mainland 8.3 8.4 25.6 21.1 36.5 2,320
Zanzibar 8.1 4.1 18.7 35.9 33.2 65
Location of School
Rural 8.2 9.0 24.6 21.9 36.2 1,857
Urban 8.6 5.7 28.5 20.0 37.1 528
Level of School
Primary school 10.4 9.2 21.7 22.5 36.2 1,640
Secondary school 3.7 6.4 33.7 19.3 36.9 745
Ownership Status
Government 9.2 9.3 24.8 22.2 34.6 2,069
Non-Government 2.8 2.1 29.5 17.0 48.6 316
Type of School
Girls only 4.2 0.0 58.5 14.3 23.0 40
Boys only 0.0 0.0 48.1 14.3 37.6 30
Mixed 8.5 8.6 24.6 21.7 36.6 2,315
Model of School
Boarding School 1.3 0.0 44.1 18.2 36.3 127
Day School 9.1 9.3 23.3 21.7 36.6 2,077(Continued)

2018 School Water, Sanitation and Hygiene Assessment | Main Report86
Background characteristics
School WASH Club
School HEALTH club
School MAZINGIRA club
School HEALTH club and MAZINGIRA club
Not in any club
Number of schools
Co-education 4.5 3.0 36.7 21.0 34.8 181
Region
Dodoma 4.9 29.8 14.0 25.0 26.3 102
Arusha 11.1 5.3 22.0 37.1 24.6 105
Kilimanjaro 17.6 2.9 21.2 24.1 34.2 131
Tanga 13.6 1.3 29.6 21.8 33.7 135
Morogoro 0.0 5.2 30.1 29.9 34.8 121
Pwani 8.6 16.5 27.6 9.4 37.9 102
Dar es Salaam 6.2 0.6 31.4 19.0 42.8 109
Lindi 7.6 3.8 54.6 10.6 23.3 72
Mtwara 10.5 3.8 23.8 10.7 51.2 83
Ruvuma 15.6 6.6 27.0 18.0 32.8 106
Iringa 27.7 1.6 19.7 20.2 30.8 68
Mbeya 6.3 16.5 20.4 5.6 51.2 96
Singida 5.3 7.8 9.2 46.9 30.8 69
Tabora 10.7 4.8 22.5 37.8 24.2 101
Rukwa 1.2 1.0 8.6 30.9 58.2 48
Kigoma 8.1 14.9 13.5 18.4 45.2 83
Shinyanga 9.1 8.2 31.7 35.3 15.7 72
Kagera 4.1 4.9 28.1 17.3 45.6 127
Mwanza 9.0 13.3 28.8 20.2 28.7 124
Mara 1.3 17.1 30 9.6 42.1 106
Manyara 6.4 2.3 30.8 11.5 49.0 84
Njombe 10.3 0.0 29.5 4.6 55.5 64
Katavi 0.0 7.6 34.8 27.3 30.3 26
Simiyu 0.0 10.9 35.9 33.9 19.3 66
Geita 0.3 22.5 17.0 22.3 37.9 69
Songwe 10.4 8.3 20.5 4.6 56.3 51
Kaskazini Unguja 8.5 7.3 25.1 39.0 20.1 9
Kusini Unguja 4.5 4.5 20.7 21.9 48.5 9
Mjini Magharibi 11.5 2.3 10.8 30.7 44.7 25
Kaskazini Pemba 4.2 10.0 22.8 45.8 17.2 10
Kusini Pemba 6.8 0.0 25.7 47.2 20.3 12
Tanzania 8.3 8.3 25.4 21.5 36.4 2,385
(Continued)

2018 School Water, Sanitation and Hygiene Assessment | Main Report 87
With respect to the type of schools, Mazingira clubs were more common in girls’ schools (58.5 per cent) than in boys’ schools (48.1 per cent) and co-education schools (24.6 per cent).
There were regional disparities in the percentages of schools with no pupils/students engaged in WASH clubs. Shinyanga Region had the smallest percentage of schools with pupils engaged in any of the clubs (15.7) and Rukwa Region had the highest percentage (58.2 per cent). While Iringa Region had the largest percentage of schools with WASH clubs (27.7 per cent), Dodoma Region had the largest percentage of schools with school Health clubs (29.8 per cent), Lindi Region had the highest percentage of schools with Mazingira clubs (54.6 per cent), and Kusini Pemba Region had the highest percentage of schools with both health and Mazingira clubs (47.2 per cent).
8.2 School WASH Club
MeetingsAccording to the Tanzania school WASH guidelines, pupils/students are supposed
to meet at least once a week or a month. The fi ndings show that schools followed this guidance with 43.3 per cent of schools convening once every week, 38.3 per cent meeting once every month and 2.2 per cent meeting on a daily basis (Figure 8.2).
8.3 Presence of Visual
Promotion for Good
WASH BehaviourThe display of diff erent messages on the school premises or the school building is one of the proxy indicators used for measuring the presence of WASH activities and the promotion of WASH activities at a school. This was assessed through observations of messages and posters pasted or painted on school walls promoting good hygiene practices, such as key steps for appropriate handwashing.
The 2018 School WASH Assessment observed that only 21.5 per cent of all schools displayed visual promotion messages for WASH at the time of the visit and very few schools (6.4 per cent) had visual promotions available (but not displayed) at the time of the
Figure 8.2: Percentage of schools holding WASH club meetings by the frequency of the WASH meetings, Tanzania, 2018
Don’t knowWeekly, but not
everyday
Daily
Perc
ent
2.24.3
50
40
30
20
10
0Monthly, but
not every week
Past school year, but not every month
Others
43.3
38.3
1.1
10.9

2018 School Water, Sanitation and Hygiene Assessment | Main Report88
visit. This implies that a whopping 72.1 per cent of surveyed schools did not have visual materials for the promotion of proper WASH behaviours at the time of the visit.
Thirty per cent of schools in Zanzibar and 21.2 per cent in Tanzania Mainland had WASH messages displayed in school surroundings. Generally, schools in urban areas (24.6 per cent) were more likely to follow WASH guidelines by displaying visual promotion messages at schools compared to schools in rural areas (20.6 per cent) (Table 8.2). There was no signifi cant diff erence between primary and secondary schools with regard to the display of visual materials promoting good WASH behaviours. Only two out of ten schools at both levels used visual promotion at the time of the survey.
Display of WASH messages in terms of ownership of schools indicates that 28.9 per cent of non-government schools and 20.3 per cent of government schools were promoting appropriate WASH behaviours through visual materials.
Forty-one per cent of girls-only schools displayed visual promotion for good WASH behaviours compared to 25.2 per cent of boys-only schools and 21.1 per cent of co-education schools.
Display of materials for promotion of good WASH behaviours was slightly higher in boarding schools (33.8 per cent) than in schools with both boarding and day facilities (31.0 per cent) and in day schools (19.9 per cent).
Regional disparities were also observed with regard to presence of materials for the promotion of good WASH behaviours. Pwani Region had the highest number of schools with materials for the promotion of desirable WASH behaviours displayed (47.3 per cent) while Simiyu Region (5.9 per cent) had the fewest. Kigoma Region had the highest percentage (93.3 per cent) of schools with no materials for visual materials for promotion of good WASH behaviours (Table 8.2).
(Continued)
Background characteristics
Visual promotion for good WASH behaviour displayed
No visual promotion for good WASH behaviour
Visual promotion reported but not displayed at the time of visit
Number of schools
Mainland/Zanzibar
Mainland 21.2 72.2 6.5 2,320
Zanzibar 30.0 68.8 1.2 65
Location of School
Rural 20.6 73.1 6.3 1,857
Urban 24.6 68.6 6.8 528
Level of School
Primary school 21.8 71.0 7.2 1,640
Secondary school 20.6 74.7 4.7 745
Table 8.2: Percentage of schools by location, level, ownership status, type and model of school, region and whether or not the school had visual promotion for good WASH behaviour, Tanzania, 2018

2018 School Water, Sanitation and Hygiene Assessment | Main Report 89
Background characteristics
Visual promotion for good WASH behaviour displayed
No visual promotion for good WASH behaviour
Visual promotion reported but not displayed at the time of visit
Number of schools
Ownership Status
Government 20.3 73.2 6.5 2,069
Non-Government 28.9 65.1 6.0 316
Type of School
Girls only 40.9 59.1 0.0 40
Boys only 25.2 74.8 0.0 30
Mixed 21.1 72.3 6.6 2,315
Model of School
Boarding School 33.8 64.7 1.5 127
Day School 19.9 73.7 6.4 2,077
Both (Boarding and Day) 31.0 59.3 9.7 181
Region
Dodoma 19.2 69.4 11.4 102
Arusha 17.3 73.3 9.5 105
Kilimanjaro 29.5 70.5 0.0 131
Tanga 19.5 71.8 8.7 135
Morogoro 24.9 60.9 14.3 121
Pwani 47.3 48.5 4.2 102
Dar es Salaam 38.4 55.9 5.7 109
Lindi 17.1 78.0 4.9 72
Mtwara 16.9 73.1 10.1 83
Ruvuma 24.8 64.4 10.8 106
Iringa 25.5 63.1 11.4 68
Mbeya 14.5 84.5 1.0 96
Singida 17.6 73.4 9.1 69
Tabora 14.3 85.0 0.7 101
Rukwa 18.2 72.8 9.0 48
Kigoma 6.7 93.3 0.0 83
Shinyanga 27.4 69.3 3.2 72
Kagera 14.2 85.3 0.5 127
Mwanza 18.1 71.8 10.1 124
Mara 19.6 73.8 6.5 106
Manyara 13.7 80.8 5.5 84
(Continued)
(Continued)

2018 School Water, Sanitation and Hygiene Assessment | Main Report90
Background characteristics
Visual promotion for good WASH behaviour displayed
No visual promotion for good WASH behaviour
Visual promotion reported but not displayed at the time of visit
Number of schools
Njombe 25.3 71.0 3.7 64
Katavi 28.2 67.7 4.1 26
Simiyu 5.9 84.8 9.3 66
Geita 18.0 66.6 15.4 69
Songwe 24.0 76.0 0.0 51
Kaskazini Unguja 20.9 74.9 4.2 9
Kusini Unguja 28.0 67.6 4.5 9
Mjini Magharibi 39.4 60.6 0.0 25
Kaskazini Pemba 22.8 77.2 0.0 10
Kusini Pemba 24.4 75.6 0.0 12
Tanzania 21.5 72.1 6.4 2,385
(Continued)

2018 School Water, Sanitation and Hygiene Assessment | Main Report 91
Chapter 9
SUMMARY OF KEY FINDINGS, POLICY IMPLICATION AND RECOMMENDATIONS

2018 School Water, Sanitation and Hygiene Assessment | Main Report92
Key FindingsThe 2018 National School WASH Assessment investigated a range of indicators and background characteristics of the core WASH themes (water, sanitation and hygiene). Assessed also were access, availability and functionality of WASH facilities in schools. The fi ndings have revealed some disparities in service provision among other things. Overall, the fi ndings provide an opportunity to guide, prioritize, and improve planning and delivery of school WASH services in Tanzania.
The results of the assessment conducted in 2,385 primary and secondary schools selected with equal probability systematic sampling, through a stratifi ed random sample, provides representative results for each of the 26 regions of Tanzania Mainland and the fi ve regions of Zanzibar with respect to diff erent background characteristics such as location of the school (rural and urban areas), ownership of the school (Government or non-Government) etc. Consequently, the fi ndings can be relied upon to inform decision-making, planning and policy formulation. It is hoped that the results presented, conclusions drawn from and actions recommended will help to stimulate debate and lead to strategic decisions and actions for improving and scaling up school WASH services in Tanzania. Furthermore, this being the fi rst national representative survey of WASH in schools, the fi ndings provide national-level estimates and baselines on various indicators for WASH in schools, paving the way for measuring future progress.
The key fi ndings summarized according to the WHO/UNICEF JMP ladders for monitoring WASH in schools are classifi ed into three levels of service: no service, limited service and basic service. The SDGs target the attainment of a basic service level whereby all schools should be enabled to provide basic
WASH services (drinking water, sanitation and hygiene) by 2030.
Though 68.2 per cent of primary and secondary schools had access to an improved source of drinking water, only 55.3 per cent were providing basic drinking water services, and 12.9 per cent had limited water services as water was not available at the time of the survey even though they had improved water sources. Appropriate actions are required to investigate and understand the factors leading to intermittent water supply in all schools which had improved water sources. This not only will help to tackle the situation, but also could promptly raise the proportion of schools with a basic service. Furthermore, 31.8 per cent of the schools that had no water services require urgent attention. With regard to on-site water treatment before drinking, only 32.7 per cent of the surveyed primary and secondary schools in Tanzania treated their water prior to making it available for drinking.
The assessment also identifi ed issues in terms of the quality of toilets in schools. The results indicate that schools in Tanzania had high overall coverage of sanitation services (88.7 per cent). However, only 30.3 per cent were providing a basic sanitation services with respect to the WHO/UNICEF JMP ladder for sanitation. The results therefore indicate that over half the schools in Tanzania (58.4 per cent) had limited sanitation services. This means that though they had improved toilets, they also had issues related to quality, functionality, compromised privacy, and operation and maintenance of the facilities. Special eff orts are required to improve these facilities by addressing the existing gaps which could, in a short time, increase the number of schools off ering basic sanitation services. This would accelerate the Government’s eff orts towards meeting SDG targets, but more importantly, would enable children to learn in secure and protective environments.

2018 School Water, Sanitation and Hygiene Assessment | Main Report 93
Additionally, very few schools met the Government minimum standards of pupil to drop hole ratio. The recommended standard for Tanzanian schools is one toilet per 20 girls and one toilet per 25 boys. Only 27.5 per cent of schools surveyed met the national “minimum” standards, with huge regional variations. In the Mainland, Kilimanjaro Region had the highest number of schools meeting the standard (65.8 per cent) and Mara had the lowest coverage with only (9.2 per cent) of its schools meeting the minimum standard. In Zanzibar, Mjini Magaharibi had the highest number of schools (only 28.6 per cent) meeting the minimum standard) and Kaskazini Pemba had the lowest number (only 2.9 per cent) of schools meeting the standard.
The vast majority of schools did not have basic hygiene services, meaning that they did not have functional handwashing facilities or did not provide soap for handwashing. The survey revealed that approximately only two out of ten schools had basic hygiene services, defi ned as a handwashing facilities with water and soap available at the time of the survey.
Many schools in Tanzania (95.8 per cent) reported teaching hygiene education, though diff erences with respect to the mode of teaching were noted. The survey revealed that most schools (68.3 per cent) taught hygiene education as a component of the core curriculum or as part of the science subject. It is important that schools that do not currently off er hygiene education do so to ensure that children learn critical WASH behaviours in their formative years.
While 84.2 per cent of schools provided MHM education as a component of MHM services, only 16.7 per cent of schools had changing rooms with basic amenities (water, waste bin, soap and emergency supplies of sanitary pads). Inadequate sanitation facilities such
as lack of sex-separated toilets with optimum privacy are some of the major constraints to adolescent girls' consistent school attendance. Infrastructural improvements in schools should prioritize the construction of private and single-sex sanitation facilities, washing and MHM facilities for girls based on the standards as prescribed in the school WASH guidelines for both Mainland and Zanzibar. This should be undertaken along with other related WASH interventions.
Equity issues are clearly observed across diff erent background characteristics. Disaggregation of data has helped to shed light on the disparities between rural and urban schools, primary and secondary schools, government and non-government schools and among regions. It was evident that WASH services deprivations were higher for children in rural schools and primary schools. For example, the results have revealed that with respect to drinking water, 37.2 per cent of primary schools had no service at the time of the survey compared to 19.9 per cent of secondary schools. While 15.8 per cent of schools in urban areas had no drinking water services, the situation was more serious for schools in rural areas where 36.3 per cent had no services.
Basic sanitation was very low in rural schools (24.3 per cent) compared to schools in urban areas (51.0 per cent). Basic sanitation was also very low in primary schools (21.8 per cent) compared to secondary schools (48.8 per cent).The coverage of basic hygiene services was 16.0 per cent in rural schools compared to 23.2 per cent in urban schools, with a slight diff erence observed between primary (17.3 per cent) and secondary (18.3 per cent) schools. With respect to operations and maintenance, 65.1 per cent of urban schools had funds to maintain and repair school WASH facilities compared to 47.0 per cent of schools in rural areas.

2018 School Water, Sanitation and Hygiene Assessment | Main Report94
The availability of at least one usable toilet that is accessible to pupils with physical disability or impaired vision was higher in secondary schools (16.2 per cent) than in primary schools (10.3 per cent). About 19 per cent of non-government schools were found to have at least one usable toilet/latrine that was accessible to pupils with physical disability or impaired vision compared to 11.1 per cent of Government schools.
Overall it appears that the situation is better in urban schools than in rural schools, in secondary schools than in primary schools, and in non-government schools than in government schools. These fi ndings should inform the development of a need-based national plan to address the disparities and inequities revealed in the assessment.
The operation and maintenance of WASH facilities, with respect to the availability of funds, remains the primary challenge. These problems should be systematically addressed to ensure that WASH facilities continue to provide intended services to schoolchildren and to avoid costs incurred in replacing damaged facilities due to poor maintenance.
Recommendations and
Policy ImplicationsThe gaps established in the National School WASH Assessment point to the major areas of actions to be undertaken by the government and the key stakeholders to address limited access to adequate WASH services in schools. So far, eff orts to improve water supply, sanitation and hygiene in schools have been piecemeal and on a small scale. For the government to reach targets on quality of education and retention of students in schools, especially girls, it is essential to scale up eff orts to improve WASH services in schools across the whole of Tanzania.
For informed decision-making, it is recommended that, these results should be looked into beyond national averages that could mask large variations across various background characteristics. Regional disparities should also be considered while planning, implementing and managing WASH services in schools. This will ensure coherent and equitable allocation of resources based on needs when making improvements to school WASH services. This will further reduce disparities and inequities given the fact that primary schools and schools in rural areas face the greatest challenges. As such, these should be prioritized to help narrow the gap which could continue widening if current trends continue.
Governments and development partners should establish a solid process and eff ective management model to address sustainability and inequity issues emerging from the assessment and employ strategies that will enable going to scale. To achieve this, it is recommended that a national costed plan of action with a realistic budget be developed to guide implementation of WASH in schools. This would be an important initiative given the current situation where resources for school WASH interventions are scattered among agencies and often as sub-components under larger budget lines. The national costed plan of action will further guide decision makers as they plan future eff orts to scale up actions against inadequate WASH services in schools.
Considering the availability of resources and existing capacities and opportunities, the most practical means of improving school WASH services would be through the adoption of a progressive approach. The progressive approach should aim to upgrade services from no service through basic services across all WASH dimensions. Ultimately, this would ensure healthier learning environments and

2018 School Water, Sanitation and Hygiene Assessment | Main Report 95
improve learning outcomes. It would also improve attendance and retention rates.
Children with access to basic WASH services in schools and who have learnt appropriate WASH practices are more likely to positively infl uence WASH practices at their homes, among family members and in the wider community. In this respect, a national handwashing with soap campaign should be initiated in all schools to emphasize the importance of positive WASH practices. Such a campaign can be achieved on a meagre budget and yet yield great benefi ts for schoolchildren. Such a campaign can be held at the national, regional or even at district level.
Key stakeholders including parents, communities, the private sector, government and institutions (research, academic, etc.) should be engaged in fostering multi-sectoral partnerships and actions on MHM. Successful implementation could lead to expanded MHM initiatives. It could also reduce barriers to education for girls, fi ght stigma, contribute to positive health and enable girls to consistently attend school.
More robust O&M mechanisms and strategies need to be instituted to ensure that WASH services are sustainable and functional. This will reduce frequent new investments in construction of WASH facilities which are very expensive. This can be achieved through active involvement of key stakeholders including students, teachers, parents, the private sector, local government and respective ministries. Existing roles and responsibilities among key stakeholders need to be rejuvenated for successful implementation of future O&M plans. Furthermore, fi nancial incentives can be initiated by rewarding well performing schools to encourage the eff ective use and maintenance of WASH facilities.
Increased access to basic WASH services in schools and its sustainability require the involvement, commitment and support of the ministries of education, PO–RALG/PO–RALGSD and other related ministries, such as health, water, public works, fi nance, government agencies like the newly formed Rural Water Supply and Sanitation Agency (RUWASA) and water authorities, among others.
Without the political commitment and allocation of suffi cient resources, WASH in schools is likely to remain externally subsidized. This would lead to continued low progress towards moving to scale towards ensuring that every school in Tanzania has adequate WASH services for a better learning environment. It is recommended to identify high level political champions to support eff orts at ensuring that school WASH is given the priority it deserves in every school if SDG targets of leaving no one behind are to be attained.
It is recommended that the JMP’s core questions for assessing WASH in schools is included in routine data collection in the education sector. If successfully implemented, it will facilitate annual collection of data on key indicators that will further help in measuring progress and enabling periodic reporting of both national and global indicators (including SDG tracking).
Finally, it is important to point out that improving WASH services is not the fi nish line for improving school children’s health and attaining their right to WASH and education. The goal is to empower children and help them achieve their dreams. While WASH strongly contributes to the attainment of this goal, other factors need to be duly considered and addressed as well.

2018 School Water, Sanitation and Hygiene Assessment | Main Report96
ANNEXES

2018 School Water, Sanitation and Hygiene Assessment | Main Report 97
Table A2.1.1: Distribution of schools by region, level of school and Ownership status, Tanzania, 2018
Regions Primary Secondary Total of schoolsOwnership status Number
of primary schools
Ownership status Number of secondary schoolsGovernment Non-
GovernmentGovernment Non-
Government
Dodoma 728 44 772 188 33 221 993
Arusha 527 227 754 143 97 240 994
Kilimanjaro 892 88 980 218 113 331 1,311
Tanga 990 47 1037 241 44 285 1,322
Morogoro 841 55 896 183 60 243 1,139
Pwani 558 60 618 111 64 175 793
Dar es Salaam
376 319 695 140 187 327 1,022
Lindi 498 7 505 116 7 123 628
Mtwara 660 8 668 135 12 147 815
Ruvuma 763 25 788 146 54 200 988
Iringa 481 23 504 107 61 168 672
Mbeya 704 32 736 152 64 216 952
Singida 528 21 549 142 22 164 713
Tabora 770 21 791 153 23 176 967
Rukwa 359 11 370 68 22 90 460
Kigoma 635 16 651 128 52 180 831
Shinyanga 563 48 611 116 24 140 751
Kagera 889 74 963 191 59 250 1,213
Mwanza 855 111 966 200 73 273 1,239
Mara 773 62 835 170 36 206 1,041
Manyara 602 38 640 138 18 156 796
Njombe 484 17 501 86 35 121 622
Katavi 177 2 179 32 6 38 217
Simiyu 522 11 533 140 12 152 685
Geita 576 35 611 102 12 114 725
Songwe 398 11 409 86 26 112 521
Tanzania Mainland
16,149 1,413 17,562 3,632 1,216 4,848 22,410
(Continued)
ANNEX A: ADDITIONAL TABLES

2018 School Water, Sanitation and Hygiene Assessment | Main Report98
Regions Primary Secondary Total of schoolsOwnership status Number
of primary schools
Ownership status Number of secondary schoolsGovernment Non-
GovernmentGovernment Non-
Government
Kaskazini Unguja
54 8 62 24 0 24 86
Kusini Unguja
52 6 58 22 0 22 80
Mjini Magharibi
67 128 195 45 2 47 242
Kaskazini Pemba
53 4 57 37 2 39 96
Kusini Pemba
59 9 68 39 3 42 110
Zanzibar 285 155 440 167 7 174 614
Tanzania 16,434 1,568 18,002 3,799 1,223 5,022 23,024
(Continued)
Status Ownership Status Number of schools
Government Non-Government
Dodoma 92 8 100
Arusha 67 33 100
Kilimanjaro 97 21 118
Tanga 111 8 119
Morogoro 96 13 109
Pwani 71 16 87
Dar es Salaam 49 53 102
Lindi 74 2 76
Mtwara 87 2 89
Ruvuma 87 10 97
Iringa 65 12 77
Mbeya 82 13 95
Singida 75 5 80
Tabora 90 6 96
Rukwa 57 5 62
Kigoma 78 10 88(Continued)
Table A2.1.2: Final sample allocation of schools by region and ownership status, Tanzania, 2018

2018 School Water, Sanitation and Hygiene Assessment | Main Report 99
(Continued)
Status Ownership Status Number of schools
Government Non-Government
Shinyanga 75 8 83
Kagera 97 13 110
Mwanza 94 18 112
Mara 89 11 100
Manyara 64 5 69
Njombe 53 6 59
Katavi 30 1 31
Simiyu 60 3 63
Geita 60 5 65
Songwe 48 5 53
Tanzania Mainland 1,948 292 2,240
KaskaziniUnguja 24 2 26
Kusini Unguja 23 2 25
Mjini Magharibi 24 23 47
Kaskazini Pemba 26 2 28
Kusini Pemba 27 3 30
Zanzibar 124 32 156
Tanzania 2,072 324 2,396
(Continued)
Table A4.1: Percentage of schools with basic, limited and no water services by region, Tanzania, 2018
Regions Basic water services
Limited water services
No water services
Number of schools
Dodoma 41.2 17.4 41.4 102
Arusha 76.5 11.6 11.8 105
Kilimanjaro 75.7 7.9 16.4 131
Tanga 48.5 16.3 35.2 135
Morogoro 61.2 11.3 27.5 121
Pwani 46.4 18.8 34.8 102
Dar es Salaam 68.3 20.3 11.4 109
Lindi 48.5 10.9 40.6 72
Mtwara 45.0 21.4 33.6 83
Ruvuma 65.3 8.3 26.4 106
Iringa 66.3 13.0 20.6 68

2018 School Water, Sanitation and Hygiene Assessment | Main Report100
Regions Basic water services
Limited water services
No water services
Number of schools
Mbeya 62.5 13.1 24.4 96
Singida 48.1 9.2 42.7 69
Tabora 43.6 8.8 47.6 101
Rukwa 39.0 10.7 50.3 48
Kigoma 49.6 15.4 35.0 83
Shinyanga 44.6 15.7 39.7 72
Kagera 55.2 9.6 35.2 127
Mwanza 54.6 16.7 28.8 124
Mara 49.5 6.2 44.3 106
Manyara 61.0 10.6 28.4 84
Njombe 61.7 12.8 25.5 64
Katavi 55.9 3.7 40.4 26
Simiyu 33.5 20.7 45.8 66
Geita 47.7 6.0 46.4 69
Songwe 29.7 14.6 55.7 51
Kaskazini Unguja 81.1 11.6 7.3 9
Kusini Unguja 83.8 16.2 0.0 9
Mjini Magharibi 88.2 7.8 3.9 25
Kaskazini Pemba 60.0 29.9 10.0 10
Kusini Pemba 91.9 8.1 0.0 12
Tanzania 55.3 12.9 31.8 2,385
(Continued)
Table A5.1: Percentage of schools with basic, limited and no sanitation services by region, Tanzania, 2018
Regions Basic sanitation services
Limited sanitation services
No sanitation services
Number of schools
Dodoma 18.6 51.8 29.6 102
Arusha 48.9 51.1 0.0 105
Kilimanjaro 37.2 55.4 7.4 131
Tanga 36.4 55.2 8.4 135
Morogoro 25.8 65.7 8.5 121
Pwani 33.0 47.5 19.5 102
Dar es Salaam 57.2 37.8 5.1 109
Lindi 23.6 64.5 11.9 72 (Continued)

2018 School Water, Sanitation and Hygiene Assessment | Main Report 101
Regions Basic sanitation services
Limited sanitation services
No sanitation services
Number of schools
Mtwara 22.9 53.6 23.5 83
Ruvuma 39.8 51.9 8.2 106
Iringa 30.0 45.5 24.5 68
Mbeya 31.0 65.1 3.8 96
Singida 18.4 57.3 24.3 69
Tabora 34.6 53.3 12.1 101
Rukwa 4.4 57.7 37.9 48
Kigoma 22.0 65.4 12.6 83
Shinyanga 17.8 63.2 19.0 72
Kagera 15.8 79.8 4.4 127
Mwanza 40.6 59.4 0.0 124
Mara 19.1 74.7 6.2 106
Manyara 26.6 70.3 3.1 84
Njombe 46.5 44.5 9.0 64
Katavi 9.7 57.2 33.2 26
Simiyu 5.8 85.4 8.8 66
Geita 34.6 51.0 14.3 69
Songwe 11.2 70.0 18.8 51
Kaskazini Unguja 43.2 48.3 8.5 9
Kusini Unguja 54.5 41.1 4.5 9
Mjini Magharibi 57.4 42.6 0.0 25
Kaskazini Pemba 84.4 15.6 0.0 10
Kusini Pemba 52.7 47.3 0.0 12
Tanzania 30.3 58.4 11.3 2,385
(Continued)
(Continued)
Table A6.1.1: Percentage of schools with basic, limited and no hygiene services by region, Tanzania, 2018
Regions Basic hygiene services
Limited hygiene services
No hygiene services
Number of schools
Dodoma 8.7 15.7 75.6 102
Arusha 42.2 29.8 28.0 105
Kilimanjaro 47.2 25.5 27.3 131
Tanga 12.5 30.2 57.3 135
Morogoro 21.7 31.2 47.1 121

2018 School Water, Sanitation and Hygiene Assessment | Main Report102
Regions Basic hygiene services
Limited hygiene services
No hygiene services
Number of schools
Pwani 20.4 24.3 55.3 102
Dar es Salaam 21.2 42.9 35.9 109
Lindi 10.2 35.7 54.1 72
Mtwara 6.8 22.5 70.7 83
Ruvuma 4.3 57.0 38.7 106
Iringa 33.1 43.4 23.5 68
Mbeya 14.1 37.3 48.6 96
Singida 16.9 17.9 65.2 69
Tabora 21.1 13.6 65.3 101
Rukwa 5.4 17.7 76.9 48
Kigoma 8.8 14.0 77.1 83
Shinyanga 22.8 15.4 61.8 72
Kagera 18.1 11.4 70.4 127
Mwanza 17.8 23.5 58.7 124
Mara 11.8 20.6 67.6 106
Manyara 6.4 31.1 62.5 84
Njombe 20.5 43.9 35.6 64
Katavi 13.3 37.3 49.4 26
Simiyu 4.8 23.2 72.0 66
Geita 14.0 16.3 69.7 69
Songwe 1.4 27.0 71.6 51
Kaskazini Unguja 21.2 31.3 47.5 9
Kusini Unguja 7.3 55.9 36.8 9
Mjini Magharibi 29.5 48.8 21.7 25
Kaskazini Pemba 7.1 28.6 64.3 10
Kusini Pemba 9.5 54.2 36.3 12
Tanzania 17.6 27.6 54.8 2,385
(Continued)

2018 School Water, Sanitation and Hygiene Assessment | Main Report 103
ANNEX B: QUESTIONNAIRES
2018 Tanzania School Water, Sanitation and Hygiene Assessment Questionnaire
Consent
Find The Head Teacher or any Other Teacher in Charge of The School Who is Present at The School. Read The Following Greeting:
Good day! My name is _____________________. I am here on behalf of the National Bureau of Statistics (NBS); the Offi ce of Chief Government Statistician (OCGS), Zanzibar and the Ministry of Education, Science and Technology; President’s Offi ce Regional Administration and Local Government (PO–RALG); the Ministry of Education and Vocational Training, Zanzibar; and President’s Offi ce Regional Administration, Local Government and Special Department (PO–RALGSD). We are conducting an Assessment on School Water, Sanitation and Hygiene (WASH) to assist the Government in knowing more about SWASH services in Tanzania.
Now I will read a statement explaining the study.
Your school was selected to participate in this study. We will be asking you questions about various issues regarding water, sanitation and hygiene. Information collected about your school during this study may also be used by the Government, local and international organizations and researchers for further studies that aim at improving WASH services in Tanzanian schools.
Neither your name nor the names of any other workers who participate in this study will be included in the data set or in any report; however, there is little chance that any of these respondents may be identifi ed later. Still, we are asking for your help in order to collect this information.
You may refuse to answer any question or choose to stop the interview at any time. However, we hope you will answer the questions, because the information is much needed for the benefi t of the schools and the nation at large.
If there are questions for which someone else is the most appropriate person to provide the information, we would appreciate if you introduce us to that person to help us collect that information.
At this point, do you have any questions about the study? Do I have your agreement to proceed?
Interviewer's Signature Indicating Consent Obtained
___________________________________________
Was Consent Given? 1. YES 2. NO –> Thank The Respondent and Stop The Interview
Interviewer’s Name and Code: __________________________________________
2 0 1 8

2018 School Water, Sanitation and Hygiene Assessment | Main Report104
1.0 School Identifi cation
Question No. Question Codes
101Region: _____________________________________
102Council: ____________________________________
103Ward/Shehia: _______________________________
104Village/Mtaa: ______________________________
105School Name: _______________________________
106 School Registration Number:
107 Ownership Status of the School:
1. Government
2. Faith-based
3. Company
4. Private
108 Location of the School:
1. Rural
2. Urban
109 Type of School:
1. Pre-primary and primary
2. Primary only
3. Pre-primary and primary and secondary
4. Primary and secondary
5. Secondary only
110 Is this a Boarding or Day School?
1. Boarding
2. Day school
3. Both (boarding and day)
110A What is the type of students?
1. Girls only
2. Boys only
3. Mixed
111 Number of Shifts:
1. One shift
2. Two shifts
3. Three shifts
4. Shift for some classes

2018 School Water, Sanitation and Hygiene Assessment | Main Report 105
2.0 School Details
Question No. Question Codes
201 Interviewee Name:
202 Position at School:
1. Head teacher
2. Teacher
3. Other (specify)_____________
203 Gender of Interviewee:
1. Male
2. Female
204 Number of Teachers who Work at this School: Female:
Male:
205 Number of Teachers at Work Today: Female:
Male:
205A Number of Temporary/Contract Teachers Female:
Male:
206 Number of Pupils Enrolled: Girls:
Boys:
207 Number of Girls/Boys with Vision or Physical Disability? Girls:
Boys:
208 Number of Classrooms in Use:
209 Does the School have Electricity?
1. Yes
2. No
209A What is the main source of electricity in this school? 1. TANESCO/ZECO
2. Solar
3. Generator (Private Source)
4. Gas (Industrial)
5. Natural gas
6. Gas (Biogas)
7. Electric (Wind)
8. Other, specify
(Continued)

2018 School Water, Sanitation and Hygiene Assessment | Main Report106
Question No. Question Codes
209B What are the uses of electricity in this school? 1. Lighting in the toilets in the night
2. Pumping water from the wells
3. For Offi ce works
4. For studying in the classrooms
5. Pumping drinking water
6. Pumping water for other uses
210 Does the School Provide Meals for Pupils?
1. Yes
2. No
211 Does the School have a Dining Room/Hall?
1. Yes
2. No
212 Was Deworming Program Service Provided in this School in the last 12 months?
1. Yes
2. No 301
213 How Many Times Deworming Program services was Provided?
(Continued)

2018 School Water, Sanitation and Hygiene Assessment | Main Report 107
3.0 Water Sources and Availability
I am now going to ask you a few questions about your school’s water facilities.
Question No.
Question Codes
301 What is the main source of drinking water provided by the school? (Check One – Most Frequently Used)
IF “51” or “52” continue to 301A
IF “95”► Skip TO 320
ELSE go to 302
Water Sources List Code
Piped Water
Piped Into School Grounds 11
Public Tap/Standpipe Off School Grounds
12
Piped Water From Elsewhere 13
Tube Well or Borehole 21
Dug Well
Protected Well 31
Unprotected Well 32
Water From Spring
Protected Spring 41
Unprotected Spring 42
Rainwater
Rainwater With Roof Catchment (Such as Gutters)
51
Rainwater, But no Roof Catchment 52
Water Vendor or Tanker 61
Surface Water (e.g., River, Pond, Lake, Dam, Stream, Canal, Irrigation Channel)
81
Packaged Bottled Water 91
No Water Source 95
Other, Specify 98
301A How big is your rain water storage tank? ________________ Litres
302 Where is that water source located? 1. On school grounds
2. Off school grounds
3. No water available
303 How long does it take to go there, get water, and come back? Time___________ (in minutes)
304 Do you pay for water from that source? 1. Yes
2. No ► skip to 306(Continued)

2018 School Water, Sanitation and Hygiene Assessment | Main Report108
Question No.
Question Codes
305 How much do you pay? Value____________
(Circle One of The Following)
1. Per Jerry Can
2. Per Litre
3. Per Month
306 Is drinking water from the main source currently available at the school?
1. Yes
2. No
307 In the previous two weeks, was drinking water from the main source available at the school throughout each school day?
1. Yes
2. No
308 Is drinking water from the main source typically available throughout the school year?
1. Yes, always – go to 3102. No
309 For how long is drinking water unavailable from the main source throughout the school year?
1. >= 30 Days total
2. 31 Days - 3 months
3. 4- 6 Months
4. 7-9 Months
5. 10-12 Months
310 Is drinking water accessible to those with limited mobility or vision?
1. Yes
2. No
311 Is drinking water accessible to the youngest children in the school?
1. Yes
2. No
312 How many drinking water points (e.g. taps) are at the school?
313 Does the school do anything to the water from the main source to make it safe to drink?
1. Yes
2. No ► skip to 319
314 What treatment method is used?
(Circle all that apply)A. Filtration
B. Strain Through a Cloth
C. Boiling
D. Chlorination/Bleach e.g., Water Guard
E. Solar Disinfection
F. Let It Stand or Settle
G. Flocculant e.g., Pur=Water Purifi er
H. Other, Specify_____________
I. Don’t Know
(Continued)
(Continued)

2018 School Water, Sanitation and Hygiene Assessment | Main Report 109
Question No.
Question Codes
315 Only ask if there is a source at the school compound, otherwise go to 401: Does the community collect water from the school source?
1. Yes
2. No ► skip to 320
316 Do community members pay for the school water they collect?
1. Yes
2. No ► skip to 320
317 How much do community members pay for the water they collect from the school?
Value_________________________
(Circle One of The Following)
1. Per Jerry Can
2. Per Litre
3. Per Month
318 How much money is collected per month for use of the facilities? Value_________________________
319 How much of the money collected per month for use of the facilities is provided to the school per month?
Value_________________________
320 Are pupils allowed to bring drinking water from home?
1. Yes
2. No
4.0 Sanitation
Question No.
Question Codes
401 What type of student toilets/latrines are at the school?
(Ask most common: show picture)
1. Flush to piped sewer system
2. Flush to septic tank
3. Flush to pit latrine
4. Flush to somewhere else
5. Flush, don’t know where
6. Ventilated improved pit latrine
7. Pit latrine with slab (washable)
8. Pit latrine with slab (not washable)
9. Pit latrine without slab/open pit
10. Composting toilets
11. Hanging latrines
12. Bucket latrines
13. No toilets or latrines/bush/fi eld
14. Other (mention)
(Continued)
(Continued)

2018 School Water, Sanitation and Hygiene Assessment | Main Report110
Question No.
Question Codes
402 How many toilets/latrines are at the school? (Insert number)
Girls Only Toilets
Boys Only Toilets
Common Use Toilets
Total number
Number that are usable (availble, functional, private)
Female Teacher Toilets
Male Teacher Toilet
Shared Toilets
Total number
Number that are usable (available, functional, private)
403 Does the school have urinals? 1. Yes, for girls only
2. Yes, for boys only
3. Yes, for both boys and girls
4. No urinals
Q404 – 413 should only be asked to co-education or girls only schools
404 Are water and soap available in a private space for girls to manage their menstrual hygiene?
1. Yes, water and soap
2. Water, but not soap
3. No water/no private space
405 Are there covered bins for collection of used menstrual hygiene materials in girls’ toilets?
1. Yes
2. No
406 Does the school provide any type of menstrual hygiene product for adolescent girls (e.g. sanitary pads, tampons or cups)?
1. Yes, for free
2. Yes, for purchase
3. No
406 A How does the school support access to menstrual hygiene products?
1. Emergency pads
2. School purchase outlets
3. School budget for free
4. Income generating activities (school initiative)
(Continued)
(Continued)

2018 School Water, Sanitation and Hygiene Assessment | Main Report 111
Question No.
Question Codes
407 Which menstrual products are used by adolescent girls?
1. Disposable sanitary pads
2. Reusable sanitary
3. Menstrual cups
4. Tampons
5. Other (specify)
408 Are there disposal mechanisms for menstrual hygiene waste at the school?
1. Yes
2. No► skip to 410
409 What type of mechanism is used for disposal of menstrual hygiene?
1. Incinerators
2. Burning chambers
3. Sanitary disposal pits
4. Waste pits
5. Service provider
6. None
410 How frequent are the used menstrual hygiene materials disposed?
1. Every day
2. Once per week
3. Once per month
4. Twice per month
411 Are there provisions for Menstrual Hygiene Management (MHM) available at the school?
1. Yes
2. No
412 Which of the following provisions for menstrual hygiene management (MHM) are available at the school?
Circle all that apply
Changing room/special room for adolescent girls with basic amenities
Changing room/special room for adolescent girls without basic amenities
MHM materials (e.g. Sanitary pads, pants)
MHM education
413 If the school provides MHM Education, who is responsible for providing it?
1. Matron
2. Health teachers
3. Nurse
4. School councilors
5. School wash club
6. Other (mention) _____________________
(Continued)
(Continued)

2018 School Water, Sanitation and Hygiene Assessment | Main Report112
Question No.
Question Codes
414 How many times per week are the student toilets cleaned?
1. Every day
2. 2-4 Times per week
3. Once per week.
4. 6 Times per week
5. They are not cleaned
415 In general, how clean are the student toilets?
1. Very clean
2. Clean
3. Somewhat clean
4. Not clean
416 Is there at least one usable toilet/latrine that is accessible to the youngest children at the school?
1. Yes
2. No
417 Is there at least one usable toilet/latrine that is accessible to those with physical disability or impaired vision?
1. Yes
2. No
418 Where are the student toilets located? 1. Within school building
2. Outside building, but on-premises
3. Off -premises
4. In and out of the building
419 When are students permitted to use the school toilets/latrines?
1. At all times during the school day
2. During specifi c times the school day
3. There are no toilets available for use at the school
420 Do the students use anal cleansing materials currently available to all students?
1. Yes
2. No ► skip to 422
421 If yes, what types? 1. Leaves
2. Toilets paper
3. Cobs
4. Stones
5. Papers
6. Clothes
7. Water
8. Others (specify)
422 Is there suffi cient light in the student toilets on the day of the survey/questionnaire?
1. All toilets
2. Some toilets
3. None
(Continued)
(Continued)

2018 School Water, Sanitation and Hygiene Assessment | Main Report 113
Question No.
Question Codes
423 Are latrines or septic tanks emptied (or latrines safely covered) when they fi ll up?
1. Yes
2. No
424 How are fi lled-up latrines emptied? 1. Connected to sewer system
2. Gulpers/tank collectors
3. Sewerage tank
4. Digging in new pits
5. Manually empting
6. Other specify ........................
425 Are the school toilet secured from community members use?
1. Yes
2. No
5.0 Hygiene
Question No.
Question Codes
501 Are there handwashing facilities at the school?
1. Yes
2. No► skip to 510
502 What type of handwashing facilities does the school have?
May be more than one
A. Piped water with taps
B. Storage tank with taps
C. Basins or buckets without taps
D. Hand-poured water system (such as from bucket or water container
E. Tippy tap (kibuyu chirizi)
F. Other, mention_____________
503 Where are hand washing facilities located at the school? (Mark all that apply)
Toilets
Food preparation area
Dining area
Classrooms
School yard
Teachers offi ce
Dormitories
Other_____________________
(Continued)
(Continued)

2018 School Water, Sanitation and Hygiene Assessment | Main Report114
Question No.
Question Codes
504 How many hand washing facilities are located at the school? (Insert number of taps)
A. As a component of core curriculum/part of science subject
B. As an integral part of a special module on healthy living/life skills
C. As a stand alone special module on hygiene
D. Through schools sponsored extra curriculum program (school wash clubs)
E. No special module
505 Are both soap and water currently available at the hand washing facilities?
1. Yes, water and soap
2. Water only
3. Soap only
4. Neither water or soap
506 Are there hand washing facilities accessible to those with physical disability or impaired vision?
1. Yes
2. No
507 Are there hand washing facilities accessible to the youngest children at the school?
1. Yes
2. No
508 Is there any hand washing activities? 1. Yes
2. No
509 How many times per week are group handwashing activities conducted for all students?
1. At least once Per school day
2. 2-4 Days per Week
3. Once per week
510 Is hygiene education taught at the school?
1. Yes
2. No ► skip to 512
511 How is hygiene education taught?
512 How many teachers in the school who deal with WASH?
(Insert number of teachers)
512 A Does the school have teachers trained/oriented on WASH?
1. Yes
2. No ► skip to 514
513 How many were trained/oriented? Female...............
Male.................
(Continued)
(Continued)

2018 School Water, Sanitation and Hygiene Assessment | Main Report 115
Question No.
Question Codes
514 How is solid waste (garbage) from the school disposed off ?
(Ask for most common)
1. Collected by municipal waste system
2. Burned on premises
3. Buried and covered on premises
4. Openly dumped on premises
5. Other, specify ……………………….
Boarding School
515 Are there separate facilities for girls and boys to bathe?
Not to be asked in a single sex school
1. Yes
2. No► skip to 517
516 How many bathing areas are available?
Female...............
Male.................
517 Are there separate facilities for students and residential staff to bathe?
1. Yes
2. No
518 Is there at least one bathing area that is accessible for females with limited mobility and a separate one for females with limited mobility?
1. Yes
2. No
519 Is there at least one bathing area that is accessible for males with limited mobility and a separate one for males with limited mobility?
1. Yes
2. No
520 For how many months of the school year is the school unable to provide water for students for bathing?
Months........................
6.0 Operation and Maintenance
Question No.
Question Codes
601 What entity has the primary responsibility for maintenance and repair of school WASH facilities?
1. PO–RALG/PO–RALGSD
2. The ministry responsible for water supply
3. Ministry responsible for education
4. District/municipal authorities
5. The school itself
6. Community
7. Another body (specify)………………
8. Don’t know
(Continued)
(Continued)

2018 School Water, Sanitation and Hygiene Assessment | Main Report116
Question No.
Question Codes
602 Does the school currently have funds available to cover the maintenance and repair of school WASH facilities? (e.g., purchasing soap, replacing taps and pumps, emptying septic tanks)?
1. Yes
2. No
603 Are the school water facilities successfully maintained and repaired when required?
1. Yes— skip to om6062. No
3. Partially
604 Is the school’s water supply system currently functional?
1. Functional ► skip to 6062. Partially functional
3. Not functional
605 If the water supply system is not functional or partially functional at the time of visit.
What are the main reasons?
Check all that apply
A. Unclear responsibilities for operation and/or maintenance
B. Poor operation and/or maintenance practices
C. Lack of spare parts
D. Lack of operational consumables (fuel, electricity, etc)
E. Poor initial design of the system
F. Age of the system
G. Other (specify….)
606 Are the school sanitation facilities successfully maintained and repaired when required?
1. Yes
2. No
3. Partially
607 Is the school’s sanitation facility currently functional?
1. Functional ► skip to 6082. Partially functional
3. Not functional
608 If the sanitation facility is not functional or partially functional at the time of visit.
What are the main reasons?
Check all that apply
A. Unclear responsibilities for operation and/or maintenance
B. Poor operation and/or maintenance practices
C. Lack of spare parts
D. Lack of operational consumables (lack of cleaning material, etc)
E. Poor initial design of the of the sanitation facility
F. Age of the facility
G. Lack of emptying services
H. Other (specify….)
(Continued)
(Continued)

2018 School Water, Sanitation and Hygiene Assessment | Main Report 117
Question No.
Question Codes
609 Who is responsible for cleaning the toilet facility?
1. Cleaning staff
2. Teachers
3. Students/pupils
4. Community members
5. Other, specify
610 If students/pupilsWhat are the respective responsibilities of girls and boys?
1. Girls usually clean their own toilets
2. Boys usually clean their own toilets
3. Girls usually clean boys toilets
4. Boys usually clean girls toilets
5. Girls usually clean teachers toilet
6. Boys usually clean teachers toilet
611 Are cleaning tools and disinfectants available?
1. Yes
2. No
612 Is there a daily cleaning schedule available and is it being followed?
1. Yes
2. No
613 Did the School Committee discuss School WASH in its last meeting? (Check last minutes)
1. Yes
2. No
614 Is there agreed mechanism of maintenance of water supply system and sanitation facility?
1. Yes
2. No
Question No.
Question Codes
701 Does this school currently have pupils involved in any type of school health club/school WASH club/school Mazingira Club?
1. Yes, school wash club
2. Yes, school health club ► skip to 706 3. Yes, school Mazingira club skip to 7064. Yes, school health club and Mazingira club
5. No ► skip to 708
702 How many members of the school WASH club are there?
_____________ Members
(Enter “99” for “don’t know”)
7.00 Pupil Engagement
I am now going to fi nish up this interview with a few last questions on pupil engagement around WASH activities in this school.
(Continued)
(Continued)

2018 School Water, Sanitation and Hygiene Assessment | Main Report118
Question No.
Question Codes
702A How many girls and boys are members of the school WASH club? ____________ Girls
____________ Boys
703 How often do school WASH club members meet?
1. Daily
2. Weekly, but not everyday
3. Monthly, but not every week
4. Within the past school year, but not every month
5. Other, specify _____________________
6. Don’t know
704 Do school WASH club members do activities outside of the school in the surrounding community?
1. Yes
2. No
705 Does the school health club/Mazingira club include WASH activities in their club activities?
1. Yes
2. No ► skip to 708
706 What type of WASH activities does the school health club/Mazingira club engage in?
(Multiple responses possible. Circle all that apply.)
A. Cleaning latrines
B. Cleaning handwashing/drinking water containers
C. Cleaning rainwater harvesting tank(s)
D. Collecting water
E. Treating drinking water
F. Promoting good hygiene behavior in the school through art, drama, and/or poetry
G. Other, specify___________
H. 99. Don’t know
707 Is there any visual promotion of good WASH behavior at this school (i.e. talking walls promoting WASH messages)?
(Verify by observation if response is yes)
1. Yes, available and displayed at the time of visit
2. No
3. Yes, but not displayed at the time of visit
Thank you very much for your time. We have reached the end of the interview. Do you have any further questions for me?
(Continued)

2018 School Water, Sanitation and Hygiene Assessment | Main Report 119
2018 TanzaniaSchool Water, Sanitation and Hygiene (WASH) Assessment
Observation Questionnaire
1.00 Observations: Duty Rosters & Health MessagingObserve the school’s walls, classrooms, and head teacher’s offi ce to see whether there are any duty rosters and/or health messaging on display. Complete the following questions based on your observations
O101 Duty roster displayed for water collection? 1. Yes2. No
O102 Duty roster displayed for water treatment? 1. Yes2. No
O103 Duty roster displayed for cleaning drinking/handwashing containers? 1. Yes2. No
O104 Duty roster displayed for cleaning latrines? 1. Yes2. No
O105 Duty roster displayed for cleaning rain water (RWH) tanks? 1. Yes2. No
O106 Do you observe any visual promotion of good WASH behavior at this school (i.e. talking walls promoting WASH messages)?
1. Yes2. No
2.00 Observations: Drinking Water observationsAsk to inspect the school’s drinking water facilities and mark the observations below. Answer the questions using your own observations.
O201 Was drinking water provided to students today? 1. Yes2. No
O202 Are there designated containers for storing drinking water that the pupils drink from directly?
1. Yes2. No
O203 What type of storage containers do pupils drink directly from? (Multiple responses possible. Circle all that apply.)
A. Vessels with narrow mouth and tapB. Rainwater TankC. Vessels with narrow mouth and
no tap D. Wide mouth container with tapE. Wide mouth container with no tapF. Storage container, greater than
100 LitresG. Other, specify _____________
O204 Are there designated containers for treatment of drinking water?
1. Yes2. No

2018 School Water, Sanitation and Hygiene Assessment | Main Report120
3.00 Observations: Handwashing Station observationsAsk to inspect the school’s handwashing facilities and mark the observations below. Answer the questions using your own observations.
O301 Does the school have dedicated handwashing stations?
1. Yes2. No ► Skip to 4.00
O302 How many dedicated handwashing stations are at this school? ____________ stations
O303 Are there separate handwashing containers for girls and boys?
1. Yes, girls only2. Yes, boys only3. Yes, girls and boys4. No Handwashing containers
O304 Did the school provide water for handwashing for students today?
1. Yes2. No
O305 Distance from girls’ latrines to the nearest functioning handwashing containers/stations
1. Yes2. No
O306 Did the school provide soap for handwashing for the students today? ___________________meters
O307 Distance from girls’ latrines to the nearest functioning handwashing containers/stations ___________________meters
O308 Are there any visual promotion of good WASH behaviours at this school?
1. Yes2. No ► Skip to 4.00
O309 Where are they displayed? A. WallsB. BangoC. Other, Specify__________
O310 How many toilet blocks does this school have?
Insert Number of Blocks

2018 School Water, Sanitation and Hygiene Assessment | Main Report 121
4.00 Observations: LatrinesFor each latrine toilet block, 15 observations will be conducted. The list of observations and response options are found in the column on the left of the table and each latrine block occupies one vertical column with 15 spaces for entry. Do not include latrines blocks that have been closed and are no longer in use.
-- Fill in table on the following page --
Block 1 Block 2 Block 3 Block 4 Block 5
O401 Total # of toilets in a block: (enter number)
O402 Type1. Flush to piped sewer system
2. Flush to septic tank
3. Flush to pit latrine
4. Flush to somewhere else
5. Flush, don’t know where
6. Ventilated improved pit latrine
7. Pit latrine with slab (washable)
8. Pit latrine with slab (not washable)
9. Pit latrine without slab/open pit
10. Composting toilets
11. Hanging latrines
12. Bucket latrines
13. No toilets or latrines/bush/fi eld
14. Urinals
99. Other (mention)
O403 Who uses the toilets in this latrine block? (Write all that apply)
1.Teachers 3. Girls
2. Boys 4. Shared
5. Not assigned
O404 How long ago were the toilets in this block built? (Ask to confi rm)1. Below 12 months
2. Within past year
3. 1 to 2 years ago
4. 2 to 3 years ago
5. Over 3 years ago
99. Don’t know
O405 Number of toilets with doors (enter number)
(Continued)

2018 School Water, Sanitation and Hygiene Assessment | Main Report122
Block 1 Block 2 Block 3 Block 4 Block 5
O406 Number of toilets with functioning doors (close completely, reach the fl oor/ provide privacy, have no large holes)
O407 Number of toilets with windows(enter number)
O408 Number of toilets with functioning windows (can close and open)
O409 Cleanliness: Smell1. No smell 3. All smell inside
2. Some smell 4. Smell inside and inside outside
O410 Cleanliness: Feces1. All clean 3. All toilets dirty
2. Some slightly 4. Feces present dirty
O411 Cleanliness: Flies1. None 3. Some fl ies in all
2. Some fl ies in 4. Flies inside & a few outside
O412 Slab/fl oor material1. Earth/sand
2. Dung
3. Wood planks
4. Palm/bamboo
5. Ceramic tiles, terrazzo
6. Cement/concrete
7. Plastic
88. Other (specify)
O413 Structure: Platform/Slab1. Secure 3. Holes under platform
2. Some erosion 4. Unstable/unsafe
(Continued)
(Continued)

2018 School Water, Sanitation and Hygiene Assessment | Main Report 123
Block 1 Block 2 Block 3 Block 4 Block 5
O414 Wall material1. No wall
2. Grass/palm
3. Cane/Trunk/Bamboo
4. Poles with mud
5. Stone with mud
6. Wood/timber
7. Cement/concrete
8. Stone with lime/cement
9. Sun-dried brocks/mud brick
10. Burnt bricks
11. Cement block
12. Metal
88. Other (specify)
O415 Structure: Superstructure 1. No cracks 3. Visible holes
2. Some cracks 4. Unstable
O416 Roofi ng materials1. No roof
2. Grass/thatch/palm leaf/mud
3. Rustic mat
4. Palm/bamboo
5. Wood planks
6. Iron sheet
7. Concrete
8. Tiles
88. Other (specify)
O417 If the toilets have ventilation pipes, are they functioning (covered from pit to roof, screened, not broken)?
1. Yes
2. No
3. Toilets do not have ventilation pipes
(Continued)

2018 School Water, Sanitation and Hygiene Assessment | Main Report124