Applying green metrics to optimise the energy consumption footprint of IT service centres
17
158 Int. J. Space-Based and Situated Computing, Vol. 2, No. 3, 2012 Copyright © 2012 Inderscience Enterprises Ltd. Applying Green Metrics to optimise the energy-consumption footprint of IT service centres Alexander Kipp*, Tao Jiang and Jia Liu High Performance Computing Center Stuttgart, Nobelstr, 19, 70569 Stuttgart, Germany E-mail: [email protected] E-mail: [email protected] E-mail: [email protected] *Corresponding author Mariagrazia Fugini, Monica Vitali and Barbara Pernici Politecnico di Milano, Piazza Leonardo da Vinci 32, 20133 Milano, Italy E-mail: [email protected] E-mail: [email protected] E-mail: [email protected] Ioan Salomie Technical University of Cluj-Napoca, 15 C Daicoviciu Str., 3400 Cluj-Napoca, Romania E-mail: [email protected] Abstract: This paper presents a novel approach to characterise applications with respect to their energy consumption by using a set of energy-related metrics, called Green Metrics. These indicators are based on energy consumption measurements, such as indices of computing resource usage, of environmental impact, of development costs required to (re)design an application in order to optimise its energy consumption footprint, and of organisational factors related to application management. Our approach is framed in the Green Active Management of Energy in IT Service Centres (GAMES) EU project, with a particular focus on green IT. In this paper, we define Green Metrics enabling to characterise an application in terms of the energy it consumes at run time. Such metrics are the basis for measuring the ‘Greenness’ of an application and to detect where it consumes and wastes energy. Hints are provided to improve applications design and execution. Using two application scenarios, we show how monitoring and evaluation of Green Metrics enables to improve energy efficiency. Keywords: energy efficiency measurement; energy-aware IT systems; performance measurement; Green Metrics. Reference to this paper should be made as follows: Kipp, A., Jiang, T., Liu, J., Fugini, M., Vitali, M., Pernici, B. and Salomie, I. (2012) ‘Applying Green Metrics to optimise the energy-consumption footprint of IT service centres’, Int. J. Space-Based and Situated Computing, Vol. 2, No. 3, pp.158–174. Biographical notes: Alexander Kipp holds a Diploma in Computer Science. Since 2006, he has been employed at the High Performance Computing Centre (HLRS) at the University of Stuttgart, working at Cloud-/VO-/Web service-related research projects on both national and international level. He is the Deputy Head of the ‘Intelligent Service Infrastructures’ Department at HLRS, which focuses on realising next generation cross domain service infrastructures. In this context, he is responsible for the Green-IT activities of HLRS. His research interest lies in the area of adaptive and energy aware service infrastructures, in particular in the area of service virtualisation and the corresponding technologies. Tao Jiang holds a Masters (Diplom-Informatiker) in Computer Science. He is working as a Research Associate and PhD student at the High Performance Computing Center Stuttgart (HLRS) of the University of Stuttgart. His research interests lies in the area of dynamic workflow, IT security, parallel computing, cloud computing, distributed data access and integration and energy efficient computing. He is currently involved in the European FP7 Reseach Project GAMES (Green Active Management of Energy in IT Service centres).
Transcript of Applying green metrics to optimise the energy consumption footprint of IT service centres
158 Int. J. Space-Based and Situated Computing, Vol. 2, No. 3, 2012
Copyright © 2012 Inderscience Enterprises Ltd.
Applying Green Metrics to optimise the energy-consumption footprint of IT service centres
Alexander Kipp*, Tao Jiang and Jia Liu High Performance Computing Center Stuttgart, Nobelstr, 19, 70569 Stuttgart, Germany E-mail: [email protected] E-mail: [email protected] E-mail: [email protected] *Corresponding author
Mariagrazia Fugini, Monica Vitali and Barbara Pernici Politecnico di Milano, Piazza Leonardo da Vinci 32, 20133 Milano, Italy E-mail: [email protected] E-mail: [email protected] E-mail: [email protected]
Ioan Salomie Technical University of Cluj-Napoca, 15 C Daicoviciu Str., 3400 Cluj-Napoca, Romania E-mail: [email protected]
Abstract: This paper presents a novel approach to characterise applications with respect to their energy consumption by using a set of energy-related metrics, called Green Metrics. These indicators are based on energy consumption measurements, such as indices of computing resource usage, of environmental impact, of development costs required to (re)design an application in order to optimise its energy consumption footprint, and of organisational factors related to application management. Our approach is framed in the Green Active Management of Energy in IT Service Centres (GAMES) EU project, with a particular focus on green IT. In this paper, we define Green Metrics enabling to characterise an application in terms of the energy it consumes at run time. Such metrics are the basis for measuring the ‘Greenness’ of an application and to detect where it consumes and wastes energy. Hints are provided to improve applications design and execution. Using two application scenarios, we show how monitoring and evaluation of Green Metrics enables to improve energy efficiency.
Keywords: energy efficiency measurement; energy-aware IT systems; performance measurement; Green Metrics.
Reference to this paper should be made as follows: Kipp, A., Jiang, T., Liu, J., Fugini, M., Vitali, M., Pernici, B. and Salomie, I. (2012) ‘Applying Green Metrics to optimise the energy-consumption footprint of IT service centres’, Int. J. Space-Based and Situated Computing, Vol. 2, No. 3, pp.158–174.
Biographical notes: Alexander Kipp holds a Diploma in Computer Science. Since 2006, he has been employed at the High Performance Computing Centre (HLRS) at the University of Stuttgart, working at Cloud-/VO-/Web service-related research projects on both national and international level. He is the Deputy Head of the ‘Intelligent Service Infrastructures’ Department at HLRS, which focuses on realising next generation cross domain service infrastructures. In this context, he is responsible for the Green-IT activities of HLRS. His research interest lies in the area of adaptive and energy aware service infrastructures, in particular in the area of service virtualisation and the corresponding technologies.
Tao Jiang holds a Masters (Diplom-Informatiker) in Computer Science. He is working as a Research Associate and PhD student at the High Performance Computing Center Stuttgart (HLRS) of the University of Stuttgart. His research interests lies in the area of dynamic workflow, IT security, parallel computing, cloud computing, distributed data access and integration and energy efficient computing. He is currently involved in the European FP7 Reseach Project GAMES (Green Active Management of Energy in IT Service centres).
Applying Green Metrics to optimise the energy-consumption footprint of IT service centres 159
Jia Liu is working as a Research Assistant at the High Performance Computing Center Stuttgart (HLRS), University of Stuttgart. His research interests mainly focus on energy efficient computing and energy aware job scheduling. He is currently working on the European FP7 Research Project GAMES (Green Active Management of Energy in IT Service centres).
Mariagrazia Fugini is a Professor of Computer Engineering at Politecnico di Milano. She received her PhD in Computer Engineering in 1987. Her research interests are in information system security and development, e-government, trust and reputation in distributed applications, risk management in working environments, and development of sustainable information systems. Her work contributes directly to the development of national job marketplace planning policy as well as management practice. She participated in several EU and national projects (ITHACA, SEEMP, WS-Diamond, Borsa Lavoro Lombardia) and is involved in the EU Projects GAMES, on energy-aware systems, and TOISE (Trusted Computing for European Embedded devices).
Monica Vitali is a PhD student of Computer Engineering at Politecnico di Milano. Her research interests include IS energy efficiency, adaptive and self-adaptive systems, service-oriented architectures, artificial intelligence, machine learning and imitation learning, evolutionary algorithms and self-organising systems. She participated to the following European projects: GAMES (Green Active Management of Energy in IT Service centres) and HUMANOBS (Humanoids That Learn Socio-Communicative Skills).
Barbara Pernici is a Full Professor of Computer Engineering at Politecnico di Milano. Her research interests include information systems modelling and design, service management, workflow management systems and IS energy efficiency. She participated in many European projects, among which GAMES (Green Active Management of Energy in IT Service centres), S-Cube, WS-Diamond, WIDE, F3, EQUATOR and ITHACA. Within the International Federation for Information Processing (IFIP), she served as the Chair of Technical Committee 8 (TC8, Information Systems), of Working Group 8.1 (Information Systems Design) and as a Vice-Chair of Working Group 2.14/6.12/8.10 (Service-Oriented Software).
Ioan Salomie received his PhD in Electrical Engineering from the Technical University of Cluj-Napoca, Romania in 1994. Currently, he is a Professor of Computer Science with the Computer Science Department of the Technical University of Cluj-Napoca and also the Head of the Distributed Systems Research Laboratory of the same institution. His research interests include distributed systems, context awareness and autonomic computing, service-oriented computing and systems, bio-inspired computing and systems, knowledge engineering and intelligent systems.
This paper is a revised and expanded version of a paper entitled ‘Green metrics for energy-aware IT systems’ presented at the Fifth International Conference on Complex, Intelligent, and Software Intensive Systems (CISIS-2011), Seoul, 30 June to 2 July 2011.
1 Introduction
Applications made aware of the energy they consume in terms of resources both at the software and hardware level are gaining attention in academia and industry through techniques allowing networked applications to be designed and executed to consume less energy. To sustain this attention, we are working towards methods and techniques supporting the design, development, and execution of applications along the perspectives of energy awareness (Ardagna et al., 2008; Ferreira et al., 2009). Our work is framed in the EU project GAMES (http://www.green-datacenters.eu.), aimed at developing methodologies, models, and tools to reduce the environmental impact of IT service centres. By energy-awareness we refer to applications being characterised by indicators, called Green Performance Indicators (GPIs), tracing which resources and of what type (e.g., processor, memory, but also quality of service – QoS, or human resources) the application requires to run, as well as how much effort (e.g.,
in terms of costs) is required during development, execution, and maintenance along its lifecycle. This paper focuses on such indicators and on their related metrics. In particular, this paper concentrates on IT resource usage and energy consumption. Research on metrics and measurements for green methodologies of IT and data centres are continuously in progress to achieve economical, environmental, and technological sustainability. Several sets of metrics have been proposed to measure data centre efficiency, e.g., by The Green Grid consortium (http://www.thegreengrid.org), Uptime Institute (http://www.uptimeinstitute.org/), Transaction Performance Processing Council (TPC) (http://www.tpc.org) and other initiatives. However, there is no widely accepted metric set (Williams and Curtis, 2008), allowing for an easy measuring and monitoring of energy consumed and potentially wasted by a data centre.
In our previous work (Ferreira et al., 2009), we presented a new metric related to energy efficiency for a single service, which maps the relationship between energy
160 A. Kipp et al.
consumption and execution time. In this way, we can compute both quality and energy metrics for each service, and can design a constraint-based quality and energy-aware service composition. In the approach presented in this paper, we consider Green Metrics for service applications from the perspective of hardware and virtual machine usage. We propose a comprehensive approach to Green Metrics giving an overall ‘green’ characterisation of applications, through the definition of four clusters of metrics, allowing for a measurement of the energy consumption impact of an application in a given (logical) context. In order to highlight the impact of our metrics, we apply some of them in high performance computing (HPC) environment, where scientific applications are executed (Yu and Buyya, 2005), as well as to cloud computing environment executing a business process (BPs) application. Within these scenarios, energy-awareness can be evaluated and improved. Our approach starts from the observation to determine a potential for contributing to energy efficiency both at the machine (CPU, disk, I/O, virtual machine configuration) level and at the level of applications. For example, considering applications as BPs made as a composition of services, an application could require less resources or adapt its behaviour to its current context by running in energy-saving mode, for instance, using less energy-consuming services, or low data redundancy or by renegotiating the QoS level.
We also introduce actions that can be set in place to improve the application ‘greenness’. Namely, several runs of the application on different configurations eventually enable to measure the values of Green Metrics (e.g., CPU utilisation rate or job durations) and to identify where and for which cause energy waste occurs in the system. This can be achieved by examining various execution patterns along time through continuous monitoring of the infrastructure in GAMES. Consequently, it is possible to identify how energy waste can be avoided by setting in place a set of corrective actions, called green actions, implementing adaptation mechanisms for applications, which makes them energy-aware. Adaptivity is a central characteristic of GAMES. By adjusting IT resource utilisation, used services and data, and/or the expected QoS, applications can be executed in a more energy efficient way. The paper is organised as follows. First, we discuss related work. Then, the GAMES project and the scenarios are introduced. Green Metrics are then illustrated, in particular focusing on those which have been used in the test bed presented in this paper, namely (IT resource usage and quality Green Metrics). Evaluations and examples within BPs and HPC environments use are given. Finally, we present some evaluation results deriving from the GAMES framework prototype being developed in the project.
2 Related work
Over the past decade, along with the rapid growth in the size, number and performance of service centres, the energy cost and the energy consumption by these IT service centres
have also dramatically increased (Forrest et al., 2008). Therefore, energy efficiency is a critical consideration for evaluation of computing systems, in particular with respect to HPC environments.
However, traditional benchmarks are focused on the determination of the highest achievable computing capability with no, or partial, consideration of energy efficiency. On the contrary, it would be useful to include energy efficiency measurement into supercomputing performance benchmarking or in business applications, with the purpose of both improving the system’s efficiency and of maximising the work/applications completed over a given time slot with respect to energy consumption.
The well-known Green500 list (http://www.green500.org/) was launched in 2006 to rank the most energy-efficient supercomputers by using the high performance LINPACK (HPL) benchmark along with associated power measurement methods to measure floating point operation per watt. In order to test the major components of a HPC system including the processor, memory subsystem and interconnection to predict the real-world performance, the high productivity computing systems (HPCS) (http://icl.cs.utk.edu/hpcc/) programme at the Defence Advanced Research Projects Agency (DARPA) released the high performance computing challenge (HPCC) suite of Benchmarks in 2003. HPCC examine the performance of HPC architecture using kernels with more challenging memory access patterns and provide benchmarks that bind the performance of many real applications as a function of memory access pattern characterised by the memory access spatial and temporal localities (Takahashi et al., 2005). Furthermore, beyond the performance measurement, some studies have shown insight to where and how power is consumed within HPC systems. For instance, the supercomputer manufacturer SiCortex (http://en.wikipedia.org/wiki/SiCortex) has released the Green Computing Performance Index (GCPI) based on the HPCC suite of benchmarks for measuring system-level server energy efficiency on a broad range of performance metrics. As described in Song et al. (2009), HPCC benchmarks can be used for identifying application power profiles by functions and components in a high performance cluster, correlating applications memory access patterns to power consumption for these benchmarks, and exploring how energy consumption scales with system size and workload. The Standard Performance Evaluation Corporation (SPEC), a non-profit corporation which has been formed to establish, maintain and endorse a standardised set of relevant benchmarks that can be applied to the newest generation of high-performance computers (http://www.spec.org/). California Green Business Program (http://www.greenbusinessca.org) lists a set of metrics for measuring environmental benefits of Green business practices. However, the scope of these metrics is beyond IT and data centre and considers almost all elements of business. Moreover, the Transaction Processing Performance Council (TPC) (http://www.tpc.org/ information/benchmarks.asp) and the Storage Performance
Applying Green Metrics to optimise the energy-consumption footprint of IT service centres 161
Council (SPC) (http://www.storageperformance.org/results) have also developed industry standard performance benchmarks for different IT resources. These benchmark approaches are mostly developed by adding energy efficiency measurement to existing performance benchmarks and aiming at indicating the energy efficiency of a HPC system and its components for exploring the energy scalability. They differ from each other and focus on various dimensions: hardware components, workload and type of application, metric attributes and accuracy and calibration requirements. A detailed analysis and comparison of these energy and performance benchmarking can be found in Poess et al. (2010) and Fanara et al. (2009).
Research towards energy efficient software began with estimating the energy consumption of the processor by instruction level power models (Tiwari et al., 1994). Earlier research focused on energy efficiency of software addressed methodologies targeting on memory related power consumption (Brooks et al., 2000) and apply code transformation (Catthoor et al., 1998). However, in all these research works, the energy consumption of a given application is estimated upon the specific hardware architecture. Software methodologies, designs, and software development tools that can enhance the energy efficiency of application software in mobile systems are presented in Steigerwald et al. (2007). According to Steigerwald et al. (2007), computational efficiency, data efficiency, and context awareness can contribute to create energy-aware applications. However, this paper does not focus on the energy consumption for design and management of software applications, thus missing a complete picture of energy consumption of software and service applications. The work in Sekiguchi et al. (2009) regards a set of server energy efficiency measures and metrics. It envisions the requirements for new metrics considering Green IT as a technology to be harmonised as a hardware, software, architecture, and QoS solution. However, this approach does not take into account the entire lifecycle of an IT service centre as a whole.
Energy-related issues have been addressed also in data management and software systems groups (Harizopoulos et al., 2009). However, energy-awareness still needs to find methods and tools in the area of BP management. In fact, various initiatives are active in the area of energy-aware computing, such as GREEN-NET (Costa et al., 2009) which describes its framework based on three components: an ON/OFF model based on an energy aware resource infrastructure (EARI), an adapted resource management system (OAR) for energy efficiency and a trust delegation component to assume network presence of sleeping nodes. In Watson et al. (2009), it is discussed how organisations have recognised environmental sustainability as an urgent problem; however, still the information systems community is slow in acknowledging and tackling the problem from the software and applications viewpoint. Considering a more practical approach, the organisational supply chain is described in Schmidt et al. (2009), where a sustainable IS management framework is proposed, outlining some steps
based on a resource identification view. This framework suggests how to identify measures in order to control and minimise systems impacts considering ecological and social dimensions over three different types of IT products (hardware, software, and services). A Green IT framework is proposed in Mann et al. (2009), which provides clearly defined concepts related to green information technology and devises a practical implementation for sustainability-based feedback mechanisms. Our approach is built on top of existing mechanisms that provide relevant information about the infrastructure layer, in particular, information about power consumption and resource allocation/usage. Such approaches tackle the problem at a lower level, like the heterogeneous resource identification proposed by Zenker and Rajub (2008). In our previous work (Ferreira et al., 2009), we have proposed a novel energy-aware resource allocation mechanisms and policies for BPs. These mechanisms were intended to minimise the energy consumption of the process layer, the infrastructure layer, and the control layer of a data centre. By being able to compute both quality and energy metrics for each service, we have designed a service-based process by executing a novel constraint-based quality and energy-aware service composition algorithm.
Current approaches also aim at optimising the application code by analysing and adapting it manually (Bischof et al., 2011). However, this manual processing can be optimised by using Green Metrics in order to determine potential energy wastes in advance. In particular with respect to HPC environments, it is essential to refer to historical energy consumption profiles, being reflected by corresponding metrics (Martinovic and Krpic, 2011).
Within the GAMES project, energy benchmarks will be used to measure Green Metrics, named GPIs. These are an extension to the general concept of key performance indicators for measuring characteristics of processes on different levels in information systems. The selection of adequate benchmarks depends on the GPIs definition and the energy consumption that should be measured on certain levels. Therefore, besides the mentioned benchmarks, other existing performance benchmarks could be used by simply adding energy measurements to measure the required metrics. Some key considerations to be taken in account when developing benchmarks for energy efficiency measurement are described in the initial server energy measurement protocol (Koomey et al., 2006) released by EPA in 2006 and in the ENERGY STAR Test Procedure for Determining the Power Use of Computer Servers at Idle and Full Load (Appendix A to the ENERGY STAR specification for Computer servers 9 released by EPA in 2009) and by the Green Grid consortium.
3 Applications and their Green Metrics
Energy consumption is an intrinsic element of applications with respect to both, development and execution viewpoints. For instance, applications can be designed to save energy, introducing indicators and annotations
162 A. Kipp et al.
indicating the probability of executing some branches in the programme workflow, or indicating the quantities, types, and localisation of used data. From the execution viewpoint, indicators related to energy consumption are indices of resource (CPU, I/O, and disk) usage on a given execution or virtualisation configuration. In this section, we investigate which indicators can be used for energy-related inspection of applications, by describing two kinds of applications which we are examining in GAMES to define such Green Metrics and to evaluate our approach: HPC and BP applications. These two use cases allow for the inspection and analysis of differing resource consumption, and thus energy consumption, profiles. First, we introduce the main features of our test applications, and then we present the Green Metrics, focusing on those that we will use in our tests.
3.1 HPC applications
HPC applications are scientific workflows which make an extensive use of IT resources, such as CPU, data storage, and parallel computing resources. Our metrics are associated to these applications to express the green properties of HPC applications at run time. In fact, HPC jobs are provided as workflows of services where the relevant issues are resource usage at run time based on different machine configurations. In our previous work (Ferreira et al., 2009; Cappiello et al., 2010), we discussed the notion of energy awareness and application annotation with respect to different levels of processor usage, data storage usage and environment, as well as user-related requirements. The rationale of examining energy is backed by the claim that “most application platforms are based on a best-effort model, which treats all requests uniformly, without any type of service differentiation or prioritization” (Chatterjee et al., 2005). Scientific workflows (Yu and Buyya, 2005) allow building complex applications to manage and process large datasets, and to execute scientific experiments on distributed resources. Such application scenarios require energy-awareness since they massively use computing resources and incorporate scheduling algorithms which can be made strongly dependent on QoS vs. energy metrics. On the other side, HPC is attaining great benefits from software engineering approaches giving such applications methods and metrics for designing and maintaining them in a modular style (Basili et al., 2008). Hence, in future work, also design time related factors are going to be included in tests of HPC applications.
3.2 BP applications
BPs constitute another category of applications which provide a useful scenario where energy-awareness can be evaluated. BP applications are intended as an activity or set of activities aimed at accomplishing an organisational goal. Currently, BP engineering focuses on defining processes as composite executions of services (in particular web-services based processes). Basically, BPs are service workflows where the composition of services is the ground for creating
new added-value processes, and component services are invoked dynamically. Considering BPs both at design and run time, the increased complexity of service-based software requires to be able to guarantee that the system includes up-to-date and accurate information, that the QoS agreed with services consumers is respected, and that BP management occurs constantly by continuously rethinking of its sub-processes and tasks structure to achieve efficiency and compliance to the organisation requirements.
In such perspective, the analysis of energy consumption (and waste) is a relevant aspect in modern BP applications. In fact, different BP can have different behaviours about energy consumption, depending on their inherent characteristics, such as use of resources, amount of used data, or human resources/costs employed in BP development and reengineering.
In this paper, the benchmark chosen to analyse BPs under the energy viewpoint is TPC-C (http://www.tpc.org/ tpcc/), an online transaction processing benchmark where the BP is described as a mix of concurrent transactions. TPC-C simulates a complete computing environment where users execute transactions against a database. As a working example, the benchmark describes an online selling service centred on five main activities (transactions):
1 entering orders
2 delivering orders
3 recording payments
4 checking the status of orders
5 monitoring the level of stock at the warehouses.
3.3 Assumptions
In the definition of Green Metrics, we assume that the functional part (namely, the structure of the HPC/BP application) has been decided (design time), and that Green Metrics depend both on the application structure (namely, data flow, control flow, type of employed volatile object or database requirements) and on the specific hardware and software infrastructure configuration. In other words, the application is seen as a package with both inherent and IT configuration-dependent green properties.
As presented in detail in Kipp et al. (2012), our Green Metrics are structured in four clusters:
• IT resource usage metrics
• lifecycle metrics
• energy impact metrics
• organisational metrics.
In addition, in Kipp et al. (2012), we describe as well how these metric clusters can be applied to the logical structure of an IT service centre. The complete set of Green Metrics according to these clusters is listed in Table 1.
In this paper, we will illustrate only the metrics being applied in the presented use cases and experimental results
Applying Green Metrics to optimise the energy-consumption footprint of IT service centres 163
by providing a short description why and how the corresponding metric has been used. A detailed overview and definition of all referred metrics in Table 1 is given in Kipp et al. (2012).
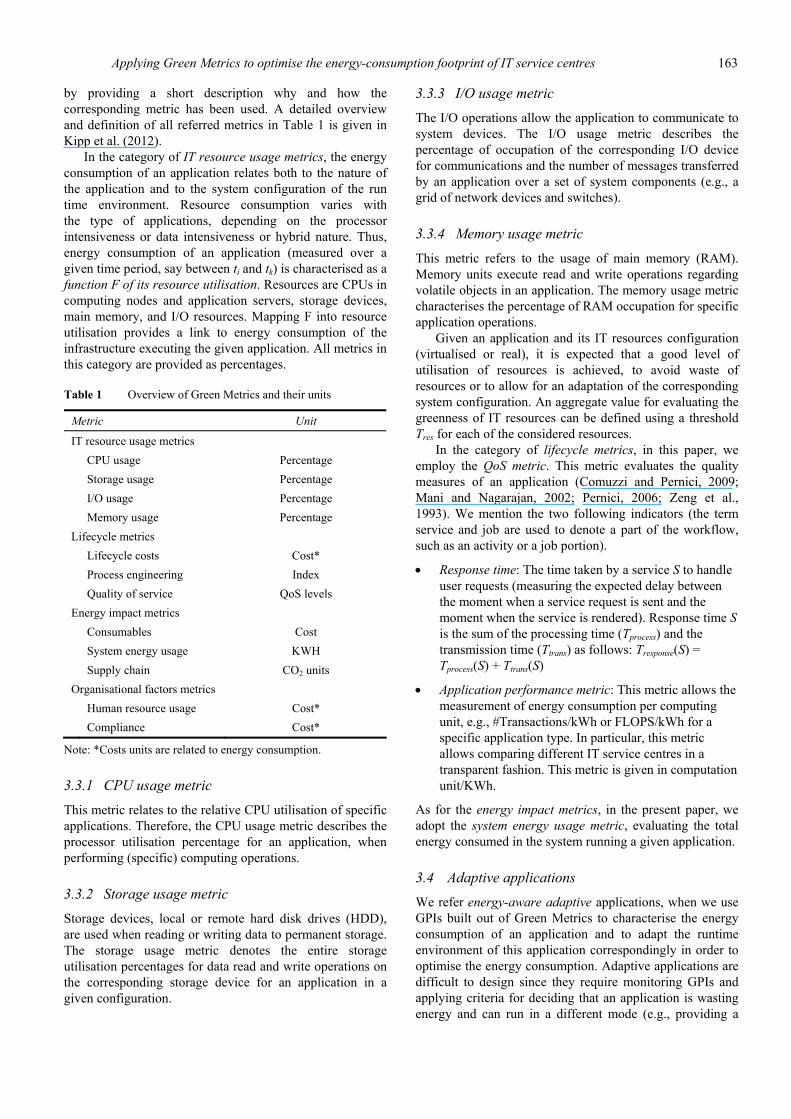
In the category of IT resource usage metrics, the energy consumption of an application relates both to the nature of the application and to the system configuration of the run time environment. Resource consumption varies with the type of applications, depending on the processor intensiveness or data intensiveness or hybrid nature. Thus, energy consumption of an application (measured over a given time period, say between ti and tk) is characterised as a function F of its resource utilisation. Resources are CPUs in computing nodes and application servers, storage devices, main memory, and I/O resources. Mapping F into resource utilisation provides a link to energy consumption of the infrastructure executing the given application. All metrics in this category are provided as percentages.
Table 1 Overview of Green Metrics and their units
Metric Unit
IT resource usage metrics CPU usage Percentage Storage usage Percentage I/O usage Percentage Memory usage Percentage Lifecycle metrics Lifecycle costs Cost* Process engineering Index Quality of service QoS levels Energy impact metrics Consumables Cost System energy usage KWH Supply chain CO2 units Organisational factors metrics Human resource usage Cost* Compliance Cost*
Note: *Costs units are related to energy consumption.
3.3.1 CPU usage metric
This metric relates to the relative CPU utilisation of specific applications. Therefore, the CPU usage metric describes the processor utilisation percentage for an application, when performing (specific) computing operations.
3.3.2 Storage usage metric
Storage devices, local or remote hard disk drives (HDD), are used when reading or writing data to permanent storage. The storage usage metric denotes the entire storage utilisation percentages for data read and write operations on the corresponding storage device for an application in a given configuration.
3.3.3 I/O usage metric
The I/O operations allow the application to communicate to system devices. The I/O usage metric describes the percentage of occupation of the corresponding I/O device for communications and the number of messages transferred by an application over a set of system components (e.g., a grid of network devices and switches).
3.3.4 Memory usage metric
This metric refers to the usage of main memory (RAM). Memory units execute read and write operations regarding volatile objects in an application. The memory usage metric characterises the percentage of RAM occupation for specific application operations.
Given an application and its IT resources configuration (virtualised or real), it is expected that a good level of utilisation of resources is achieved, to avoid waste of resources or to allow for an adaptation of the corresponding system configuration. An aggregate value for evaluating the greenness of IT resources can be defined using a threshold Tres for each of the considered resources.
In the category of lifecycle metrics, in this paper, we employ the QoS metric. This metric evaluates the quality measures of an application (Comuzzi and Pernici, 2009; Mani and Nagarajan, 2002; Pernici, 2006; Zeng et al., 1993). We mention the two following indicators (the term service and job are used to denote a part of the workflow, such as an activity or a job portion).
• Response time: The time taken by a service S to handle user requests (measuring the expected delay between the moment when a service request is sent and the moment when the service is rendered). Response time S is the sum of the processing time (Tprocess) and the transmission time (Ttrans) as follows: Tresponse(S) = Tprocess(S) + Ttrans(S)
• Application performance metric: This metric allows the measurement of energy consumption per computing unit, e.g., #Transactions/kWh or FLOPS/kWh for a specific application type. In particular, this metric allows comparing different IT service centres in a transparent fashion. This metric is given in computation unit/KWh.
As for the energy impact metrics, in the present paper, we adopt the system energy usage metric, evaluating the total energy consumed in the system running a given application.
3.4 Adaptive applications
We refer energy-aware adaptive applications, when we use GPIs built out of Green Metrics to characterise the energy consumption of an application and to adapt the runtime environment of this application correspondingly in order to optimise the energy consumption. Adaptive applications are difficult to design since they require monitoring GPIs and applying criteria for deciding that an application is wasting energy and can run in a different mode (e.g., providing a
164 A. Kipp et al.
reduced yet acceptable level of QoS). GPIs group the Green Metrics, from low (system-) level to high (application- and business-) level. GPIs can relate either to whole service centres or to a specific application, including its services and data, its environment, development platform, and human resources, costs, and development time.
The data related to our Green Metrics can be collected directly by physical sensors by the GAMES monitoring tools (Kipp et al., 2011b), and then some metrics are aggregated from low level metrics in the form of GPIs in the GAMES assessment tool. This proceeding allows reflecting energy efficiency at various logical levels within an IT service centre. A detailed overview about the hierarchical aggregation and layering of GPIs is given in Kipp et al. (2012). In particular, metrics are aggregated in a hierarchical approach, allowing for the aggregation of information being collected at a low level (CPU, memory, network, etc.) and at a more abstract view of the IT infrastructure, e.g., computing nodes, HPC clusters, up to the whole IT service centre. Such a comprehensive overview allows the assessment of ‘greenness’ of applications at different (hierarchical) levels. For instance, in order to measure the IT resource usage metrics at the application or workflow level, the CPU, memory, storage usage rate on each computing node that is used to run the application or tasks of a workflow is measured and aggregated as a GPI element. Moreover, the QoS requirements of an application in terms of performance and energy efficiency need to be collected from users at a high level (e.g., in terms of ‘expected response time’) and then to be mapped onto GPIs that specify how user requirements can be fulfilled, out of the measured system level metrics.
4 Using Green Metrics
Green Metrics can be used to monitor applications during their whole lifecycle with a manifold aim:
1 to adaptively configure the application platform, so that the application can be tuned to be executed in a more energy-efficient way
2 to capture the energy losses that can be associated to application code, so that these can be redesigned in a more energy-efficient way, e.g., by using evolved tools able to include application annotations, such as branching probabilities of workflow parts, or failure rates of some activities
3 to certify an application at a given class of energy efficiency as a long-term objective.
Therefore, Green Metrics have to be used according to a design and evolution methodology that:
1 generates GPIs computed using Green Metrics
2 considers Green Metrics inclusion in the application
3 analysis monitored energy consumption and IT resource consumption patterns
4 suggests green actions that can be applied to adapt the run-time environment as well as the application to operate at the correct QoS level whilst taking into account the according energy consumption.
The computation of GPIs based on our Green Metrics introduced in Kipp et al. (2012) and applied to concrete use cases within this paper is detailed in Cappiello et al. (2011). In the following, we outline the methodological steps with focus on IT resource usage metrics and quality metrics within our scenarios.
4.1 Green actions for IT resource usage
Green actions are a way of achieving adaptive applications for energy saving, thus also decreasing the corresponding costs. These actions aim at improving energy consumption by intervening on the metrics as follows [we list the metric and a set of possible actions directly impacting the energy consumption, which can be applied by according controlling mechanisms, e.g., Cioara et al. (2011)]:
• CPU usage metric: augment CPU usage percentage, de-allocate unused CPUs, allocate CPUs to larger code portions, pre-allocate CPU to workflow activities with a higher probability of being executed (higher branching probability in workflow), balance workload of each single CPU, change CPU frequency mode.
• Storage usage metric: reduce number of records to be stored, improve read-write operations performances, extend transfer channel from-to the database system, cache larger quantities of data on the basis of last-used policies, accumulate data transfer operation at a given time moment to avoid continuous input/output, improve quality of indexed for data retrieval.
• I/O usage metric: minimise data transfer among different CPUs, reduce number of messages to devices, avoid unnecessary write operations, concentrate write operations at a given time instant altogether, expand the I/O channel data transfer rate.
• Memory usage metric: pre-allocate memory bars to large application code portions, minimise memory partitioning in pages, de-allocate libraries when unused according to a least-used policy, minimise read operations in the code, switch-off unused memory bars, accept allocation only of code portions larger than N lines (N to be determined through several runs), lower uncertainty about estimated application variable that contribute to determine memory overflow, select appropriate occupation factors for each memory component in the memory bars.
4.2 Green actions for quality metrics
Considering the intrinsic heterogeneity of resources in IT service centres and their varying required capabilities of computational power and thus energy consumption
Applying Green Metrics to optimise the energy-consumption footprint of IT service centres 165
characteristics, a service request for heterogeneous resources is normally allocated to available resources based on some scheduling policies. Imposing QoS constraints over service requests, scheduling policies are typically revised to achieve for optimum performance. However, in some cases it might be sensible to adjust the QoS settings of the runtime environment, including the hardware and software environment, in order to achieve a better energy-efficiency whilst providing the correct results in time. Applying our metrics allows us to determine the energy-efficiency of applications and IT infrastructures at various levels, and thus also to determine the optimal QoS settings from an energy-efficiency related viewpoint. In this way, activities of the workflow with less critical execution time constraints could be executed in slower servers, hence consuming less electrical energy and thereby reducing their overall cost/price.
Generally, consumers expect high QoS that may require higher performance, resulting in higher energy consumption. However, the expected QoS can be delivered by efficient resource utilisation. Negotiating and establishing a service level agreement between consumers and providers can be seen as a way of achieving greenness in QoS. Contributions to energy can be made by trade-offs of shared processing power and lower performance.
Supporting different levels of QoS for a single activity of the workflow can make the activity run in different IT resource configurations. This kind of distribution based on differentiated QoS can eventually result in energy saving.
Service providers can pro-actively provide high QoS to the service requesters, by using different familiar approaches like caching and load balancing of service requests.
Another case regards aborting an activity execution due to a failure. Repair may be a time and energy consuming task. Thus, making an application recoverable (recoverability above) is a desired QoS property at design time for which various repair strategies have to be defined (see for instance, Friedrich et al., 2010). Sample strategies are substituting the faulty activity (more energy consuming) or redoing it (less energy consuming although another activity has to wait until the re-done activity is finalised).
In both cases, a service can be made energy efficient: if an activity has high failure rate (observed from logs over various runs), then availability should be guaranteed by a green action that adapts the execution mode, for example, executing redundant activities. Conversely, if an activity has a low failure rate, substitution can be suitable at a given energy cost, while the redo/retry action can be considered as adoptable when the failure rate is close to zero.
5 BP case study
In order to test BP applications, we used an open source implementation of the TPC-C benchmark, namely
TPCC-UVa (Llanos and Palop, 2006). This implementation reflects all the characteristics of the benchmark.
The application, together with its database, has been installed on a virtual machine. This is an important decision in setting the saving energy policy. In fact, several studies (i.e., Marty and Hill, 2007; Imada et al., 2009) discuss how virtualisation is an important feature for saving energy, in that it allows for a guided efficient allocation of resources among all applications which are concurrently running on the system at a given time. Virtualisation enables also a dynamic environment where resource allocation can change as the load of an application increases/decreases responding to different request rates. The BP application has been installed and executed on an Ubuntu10.10 virtual machine hosted in a Windows XP machine. The used hypervisor is VMWare.
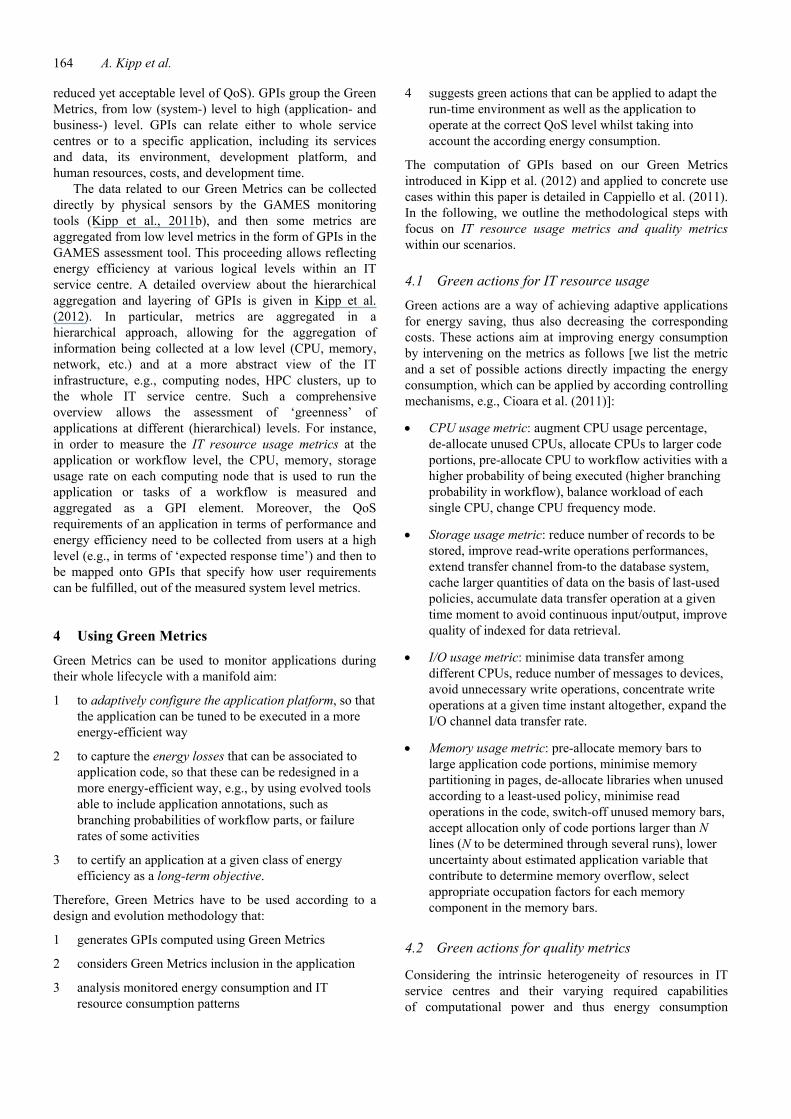
In detail, a set of indicators has been evaluated with several configurations for the virtual machine. The set of indicators chosen to monitor the application are related to resource usage metrics (CPU, memory, storage and I/O usage) and to QoS metrics (application performance and response time). The application performance indicator in this case is computed as the ratio between the number of transactions executed and the energy cost of the application. Data about resource usage has been collected directly from the operating system of the virtual machine running the TPC-C application. Data about QoS metrics have been retrieved from the log of the benchmark while information about energy consumption of the application has been estimated using PowerInformer (http://software.intel.com/ en-us/articles/intel-powerinformer/), an open-source tool developed by Intel, able to compute power consumption by a single application.
Table 2 Different configurations of the virtual machine for each test
Test 1 Test 2 Test 3 Test 4
CPU 4 cores 3 cores 2 cores 1 core
Memory 512 MB 512 MB 512 MB 512 MB
Disk 10 GB 10 GB 10 GB 10 GB
Test 5 Test 6 Test 7
CPU 2 cores 2 cores 2 cores
Memory 1 GB 2 GB 512 MB
Disk 10 GB 10 GB 5 GB
The tested system configurations are reported in Table 2. In each test, different parameters about the virtual machine configuration have been changed in order to compare the efficiency of different configurations. The parameters that have been changed running the tests are the number of CPU cores allocated to the virtual machine running the application, the memory size and the amount of disk allocated.
166 A. Kipp et al.
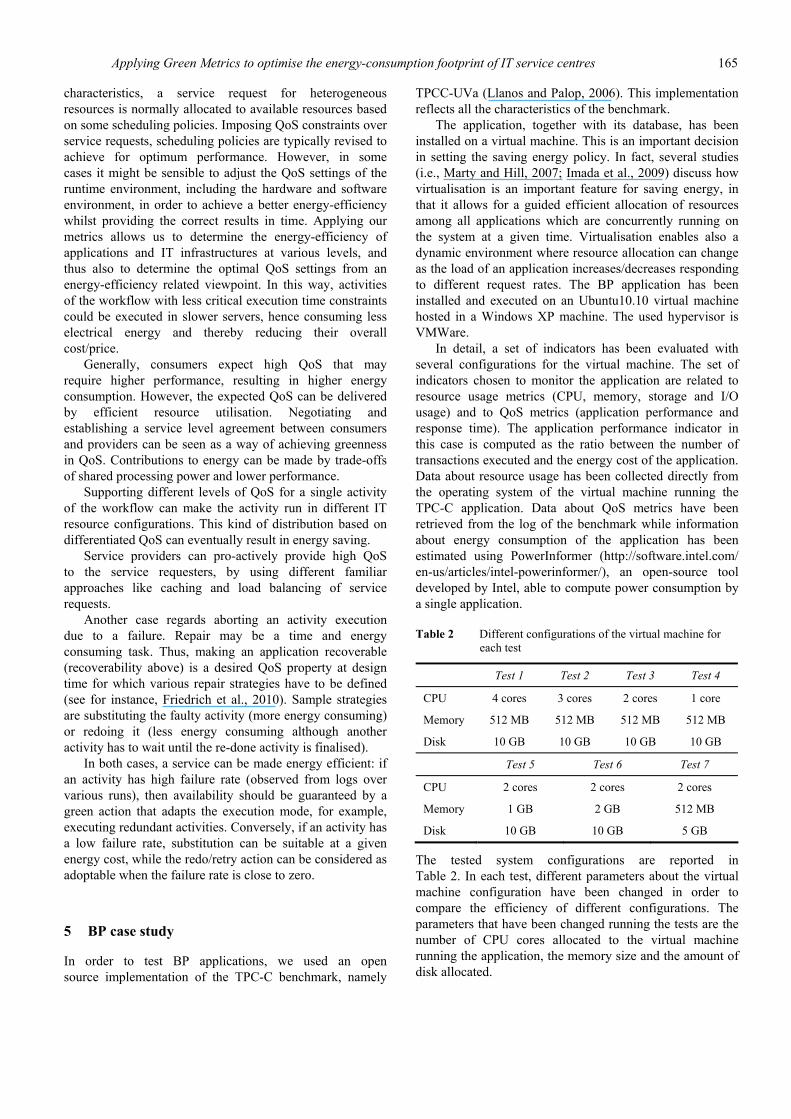
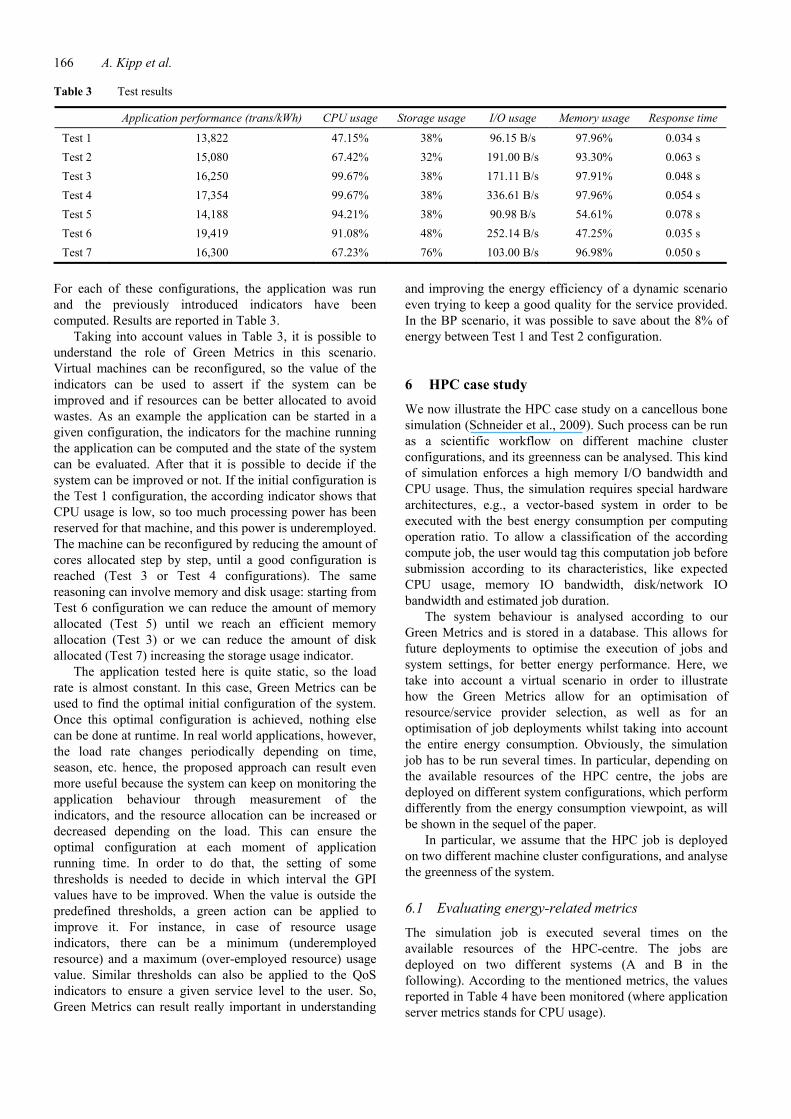
Table 3 Test results
Application performance (trans/kWh) CPU usage Storage usage I/O usage Memory usage Response time
Test 1 13,822 47.15% 38% 96.15 B/s 97.96% 0.034 s Test 2 15,080 67.42% 32% 191.00 B/s 93.30% 0.063 s Test 3 16,250 99.67% 38% 171.11 B/s 97.91% 0.048 s Test 4 17,354 99.67% 38% 336.61 B/s 97.96% 0.054 s Test 5 14,188 94.21% 38% 90.98 B/s 54.61% 0.078 s Test 6 19,419 91.08% 48% 252.14 B/s 47.25% 0.035 s Test 7 16,300 67.23% 76% 103.00 B/s 96.98% 0.050 s
For each of these configurations, the application was run and the previously introduced indicators have been computed. Results are reported in Table 3.
Taking into account values in Table 3, it is possible to understand the role of Green Metrics in this scenario. Virtual machines can be reconfigured, so the value of the indicators can be used to assert if the system can be improved and if resources can be better allocated to avoid wastes. As an example the application can be started in a given configuration, the indicators for the machine running the application can be computed and the state of the system can be evaluated. After that it is possible to decide if the system can be improved or not. If the initial configuration is the Test 1 configuration, the according indicator shows that CPU usage is low, so too much processing power has been reserved for that machine, and this power is underemployed. The machine can be reconfigured by reducing the amount of cores allocated step by step, until a good configuration is reached (Test 3 or Test 4 configurations). The same reasoning can involve memory and disk usage: starting from Test 6 configuration we can reduce the amount of memory allocated (Test 5) until we reach an efficient memory allocation (Test 3) or we can reduce the amount of disk allocated (Test 7) increasing the storage usage indicator.
The application tested here is quite static, so the load rate is almost constant. In this case, Green Metrics can be used to find the optimal initial configuration of the system. Once this optimal configuration is achieved, nothing else can be done at runtime. In real world applications, however, the load rate changes periodically depending on time, season, etc. hence, the proposed approach can result even more useful because the system can keep on monitoring the application behaviour through measurement of the indicators, and the resource allocation can be increased or decreased depending on the load. This can ensure the optimal configuration at each moment of application running time. In order to do that, the setting of some thresholds is needed to decide in which interval the GPI values have to be improved. When the value is outside the predefined thresholds, a green action can be applied to improve it. For instance, in case of resource usage indicators, there can be a minimum (underemployed resource) and a maximum (over-employed resource) usage value. Similar thresholds can also be applied to the QoS indicators to ensure a given service level to the user. So, Green Metrics can result really important in understanding
and improving the energy efficiency of a dynamic scenario even trying to keep a good quality for the service provided. In the BP scenario, it was possible to save about the 8% of energy between Test 1 and Test 2 configuration.
6 HPC case study
We now illustrate the HPC case study on a cancellous bone simulation (Schneider et al., 2009). Such process can be run as a scientific workflow on different machine cluster configurations, and its greenness can be analysed. This kind of simulation enforces a high memory I/O bandwidth and CPU usage. Thus, the simulation requires special hardware architectures, e.g., a vector-based system in order to be executed with the best energy consumption per computing operation ratio. To allow a classification of the according compute job, the user would tag this computation job before submission according to its characteristics, like expected CPU usage, memory IO bandwidth, disk/network IO bandwidth and estimated job duration.
The system behaviour is analysed according to our Green Metrics and is stored in a database. This allows for future deployments to optimise the execution of jobs and system settings, for better energy performance. Here, we take into account a virtual scenario in order to illustrate how the Green Metrics allow for an optimisation of resource/service provider selection, as well as for an optimisation of job deployments whilst taking into account the entire energy consumption. Obviously, the simulation job has to be run several times. In particular, depending on the available resources of the HPC centre, the jobs are deployed on different system configurations, which perform differently from the energy consumption viewpoint, as will be shown in the sequel of the paper.
In particular, we assume that the HPC job is deployed on two different machine cluster configurations, and analyse the greenness of the system.
6.1 Evaluating energy-related metrics
The simulation job is executed several times on the available resources of the HPC-centre. The jobs are deployed on two different systems (A and B in the following). According to the mentioned metrics, the values reported in Table 4 have been monitored (where application server metrics stands for CPU usage).
Applying Green Metrics to optimise the energy-consumption footprint of IT service centres 167
Table 4 Estimated energy footprint of a cancellous bone simulation system in two configurations
System A System B
Application server usage
(avg) 95% CPU usage
(avg) 83% CPU usage
I/O usage metric (avg) 8 GB/s (avg) 6 GB/s Memory usage metric
(avg) 93% memory usage
(avg) 60% memory usage
Application performance metric
20 GFLOPs/KWh 18 GLOPs/KWh
The application server usage metric allows for getting an overview about the CPU utilisation and the amount of disk I/O operations. In particular, this allows for determining if the deployment decision for the job under the current setup has been appropriate. E.g., if the job just produces a medium CPU payload, this might imply a reduction of the clock speed of the CPU without affecting the entire job execution time whilst reducing the entire energy consumption.
The I/O usage metric allows determining the average memory operational (I/O) performance, which is a relevant value for HPC jobs. In particular, this allows determining whether a job has a high impact on the memory performance. For example, if a job with a supposed high CPU payload causes a medium CPU payload during execution whilst outbidding the available memory I/O bandwidth, we consider that this would imply that the memory I/O channel might be a performance bottleneck. This means also that deploying this kind of job on a machine with improved memory I/O bandwidth might allow for a smoother execution of the job, and thus for a better energy efficiency of the entire job execution.
The memory usage metric allows for determining the average memory usage, considering also peak usages. In particular, this metric determines if potentially too many memory modules are active in the system. In that case, for future deployments, unnecessary memory bars can be turned off and switched on again on demand, thus allowing for additional energy saving.
The performance metric provides a value relevant for comparison of different IT service centres against performance values according to the energy consumption.
According to the measurements reported in Table 4, System A performs better for this kind of job than System B, although System A has a higher CPU payload during the job execution whilst System B has a lower CPU payload. System A provides a better memory interaction, thus a better and more energy efficient processing for this kind of jobs. Thus, System A allows for 20 GFLOPS/KWh whilst System B just allows for 18 GFLOPS/KWh, so for future deployments of such kind of jobs System A should be chosen if possible in order to allow for better energy efficiency.
In summary, the evaluation of these measured values shows a better energy efficiency of System A for this job type due to a better memory I/O ratio and a better usage of the available memory, whilst System B has to supply
memory that is not used by the job/application. A potential solution to improve the performance values for System B would be switching off some of the unused memory modules.
Applying these metrics to HPC jobs is a first step toward the consideration of Green Metrics for the entire IT service centre. This measured metrics will allow deriving high level and more abstract views on the involved system. In particular, this will allow gaining a better overview of the energy consumption at a fine granularity, according to the selected QoS needs. This will also allow the definition of high level SLA that can be mapped to low-level system metrics, hence obtaining an optimisation of the entire energy consumption of the whole IT service centre.
Finally, applying these Green Metrics to the HPC infrastructure would lead to the development of new kinds of business models; in particular this would allow, e.g., to offer different tariffs to the customers, depending on their deployed job types and related carbon emissions, or to negotiate service level agreements with customers, whenever lower QoS (e.g., response time) can be accepted in favour of energy savings.
6.2 Evaluation
The evaluation of the presented concepts is now given by applying two types of local control loops (LCLs) to the HPC test bed, namely the fuzzy logic and bio-inspired LCLs. LCLs are used to optimise the energy consumption for a specific server in a service centre according to the relevant Green Metrics values. The energy consumption optimisation process is achieved by identifying the server over provisioned hardware resources and executing dynamic frequency scaling (DFS) actions to put those resources into low-power states. This section is going to concentrate on the evaluation results of applying the control loops to our test bed environment. A detailed description of the control loops is given in Cioara et al. (2011).
In order to build a baseline to compare the impact of the GAMES framework with respect to the entire energy consumption, we first have to reflect on the evaluation results of HPC use case execution without enabling the GAMES framework.
For the evaluation of the GAMES LCLs, we applied three different scenarios, namely the execution of the mentioned simulation without any controller, as well as with the LCLs realising different internal reasoning, learning and decision taking mechanisms. In order to assess the differences between the executions with different LCLs, the following aspects of the IT environment have been monitored and evaluated:
• power consumption (using the system energy usage metric)
• CPU usage (using the CPU usage metric)
• CPU frequency (monitoring the frequency mode of the CPU).
168 A. Kipp et al.
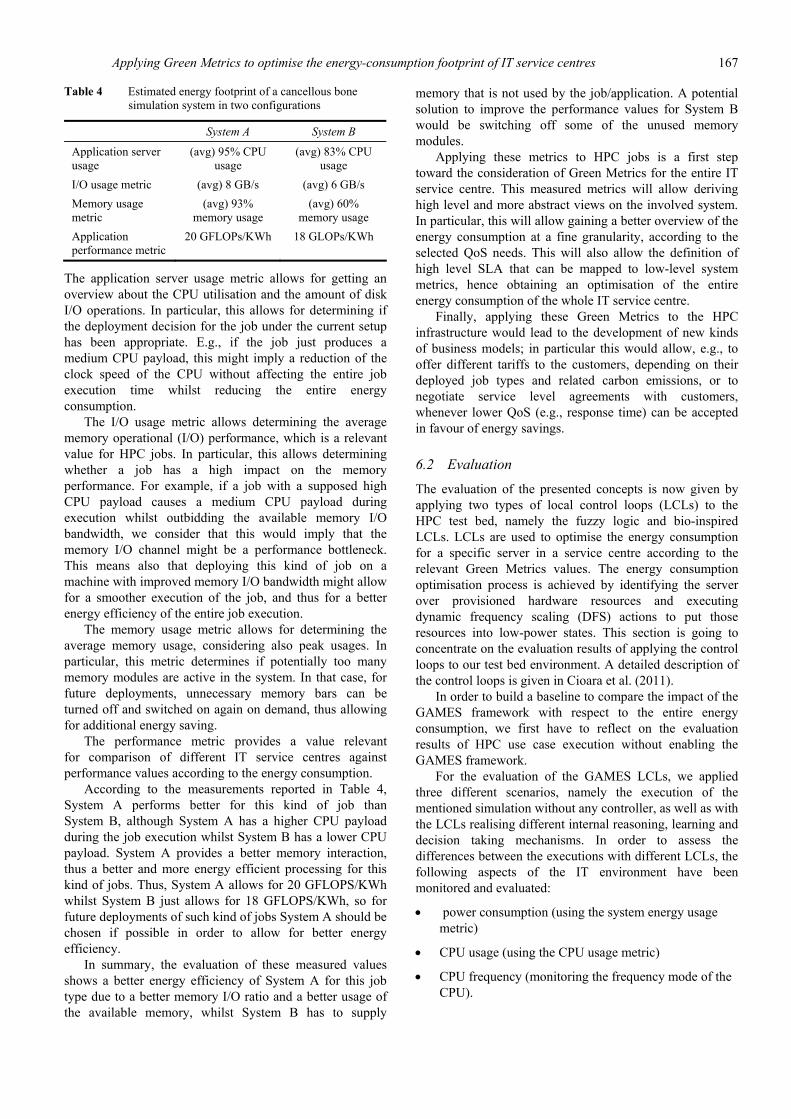
These values allow for a performance assessment of the energy-aware controllers. Furthermore, in order to eliminate the influences of unknown factors and disturbances, the trial has been executed five times for each use case with same computational conditions. Afterwards, the measured data for each category has been post-processed by computing the mean values at each sampling time for every case, accordingly. This proceeding enables us to improve the precision of the measurements for verifying and evaluating the performance of the controllers by eliminating the potential measurement errors caused by the corresponding power metres. Furthermore, although always the same computation has been executed, it is not foreseeable when a specific computing node gets occupied by a certain compute job. So, by taking into account the mean values for the entire cluster, this effect is also considered within our measurement, ensuring that the following evaluation results allow for a meaningful comparison of the corresponding execution modes. Figure 1 depicts the CPU behaviour and the related power consumption of the entire cluster by executing the cancellous bone simulation process with no use of LCLs.
6.3 GAMES-enabled execution
The evaluation results of the execution of the HPC use case by applying the LCLs are as follows.
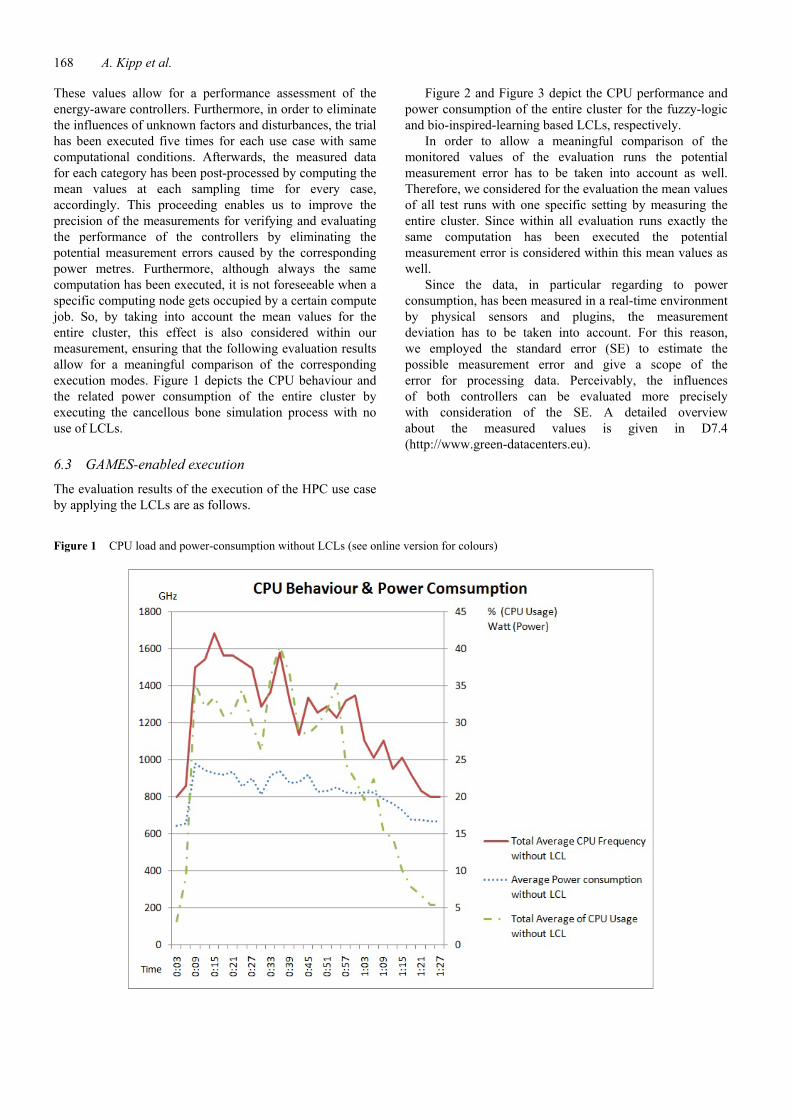
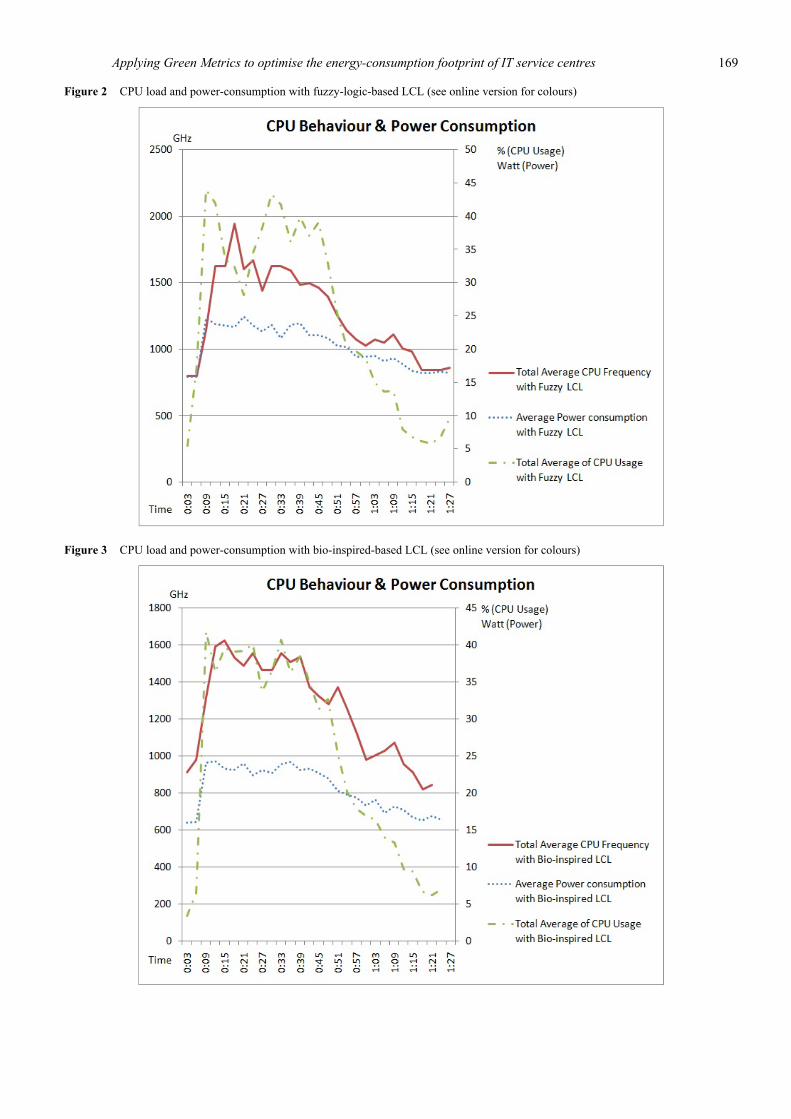
Figure 2 and Figure 3 depict the CPU performance and power consumption of the entire cluster for the fuzzy-logic and bio-inspired-learning based LCLs, respectively.
In order to allow a meaningful comparison of the monitored values of the evaluation runs the potential measurement error has to be taken into account as well. Therefore, we considered for the evaluation the mean values of all test runs with one specific setting by measuring the entire cluster. Since within all evaluation runs exactly the same computation has been executed the potential measurement error is considered within this mean values as well.
Since the data, in particular regarding to power consumption, has been measured in a real-time environment by physical sensors and plugins, the measurement deviation has to be taken into account. For this reason, we employed the standard error (SE) to estimate the possible measurement error and give a scope of the error for processing data. Perceivably, the influences of both controllers can be evaluated more precisely with consideration of the SE. A detailed overview about the measured values is given in D7.4 (http://www.green-datacenters.eu).
Figure 1 CPU load and power-consumption without LCLs (see online version for colours)
Applying Green Metrics to optimise the energy-consumption footprint of IT service centres 169
Figure 2 CPU load and power-consumption with fuzzy-logic-based LCL (see online version for colours)
Figure 3 CPU load and power-consumption with bio-inspired-based LCL (see online version for colours)
170 A. Kipp et al.
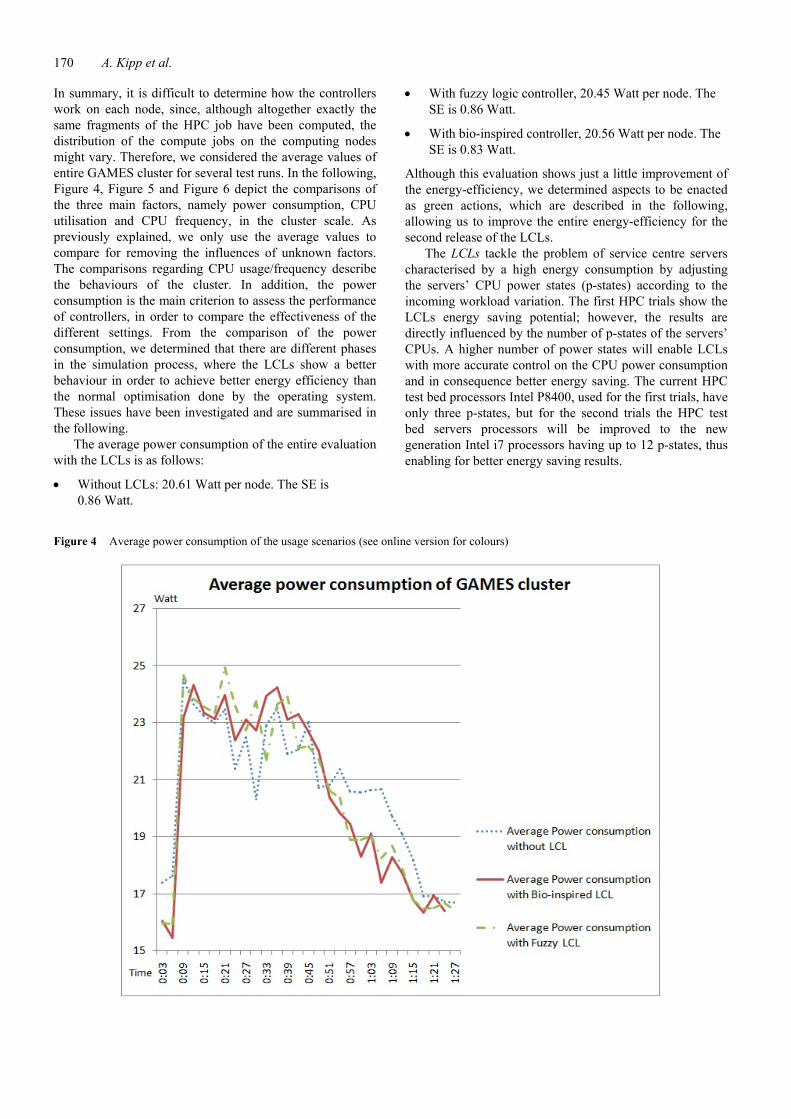
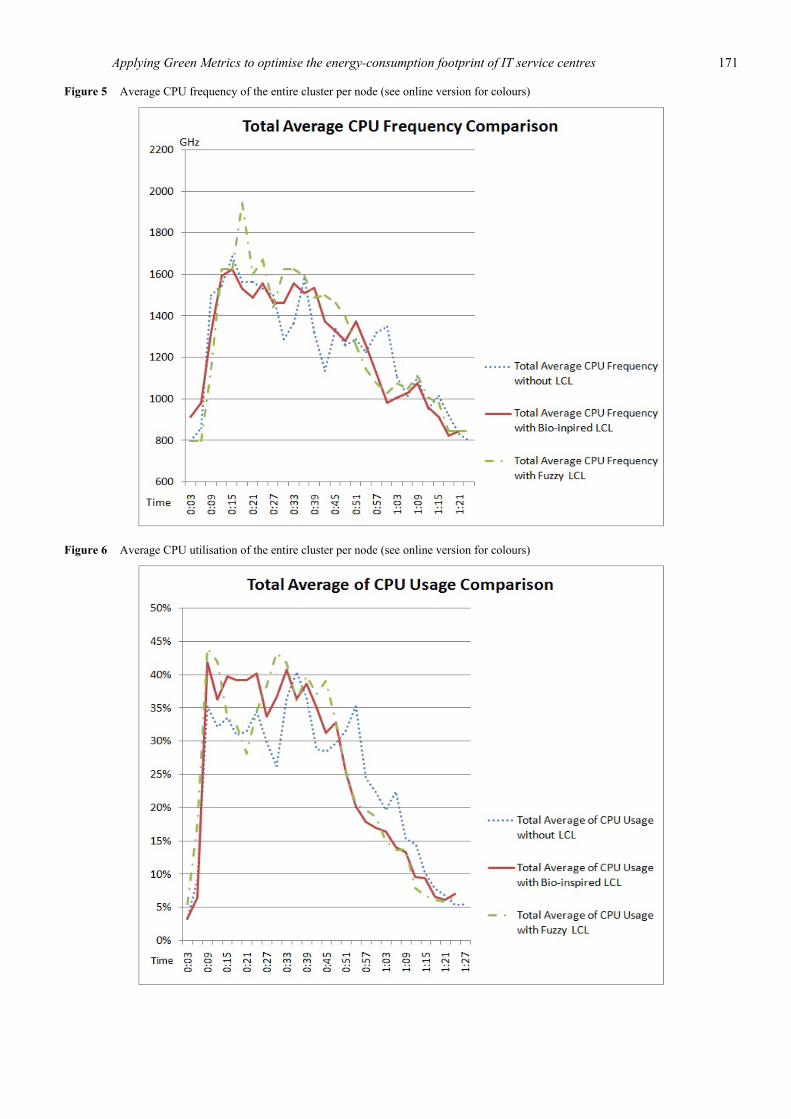
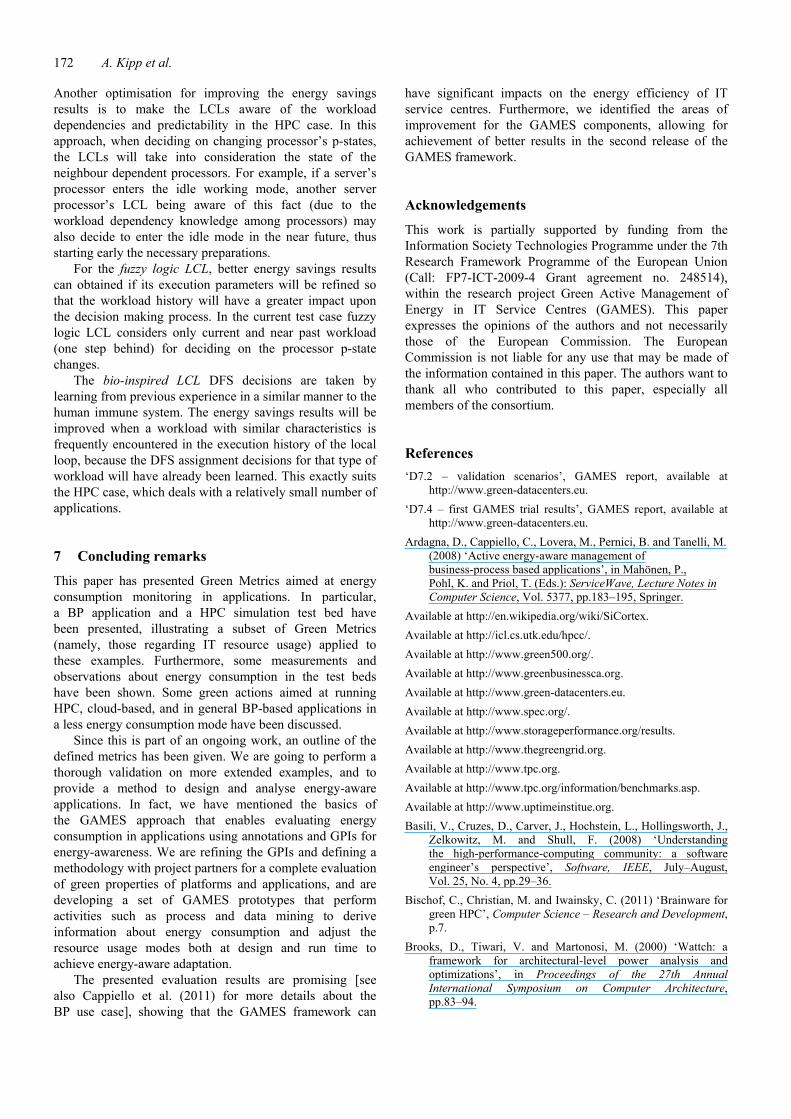
In summary, it is difficult to determine how the controllers work on each node, since, although altogether exactly the same fragments of the HPC job have been computed, the distribution of the compute jobs on the computing nodes might vary. Therefore, we considered the average values of entire GAMES cluster for several test runs. In the following, Figure 4, Figure 5 and Figure 6 depict the comparisons of the three main factors, namely power consumption, CPU utilisation and CPU frequency, in the cluster scale. As previously explained, we only use the average values to compare for removing the influences of unknown factors. The comparisons regarding CPU usage/frequency describe the behaviours of the cluster. In addition, the power consumption is the main criterion to assess the performance of controllers, in order to compare the effectiveness of the different settings. From the comparison of the power consumption, we determined that there are different phases in the simulation process, where the LCLs show a better behaviour in order to achieve better energy efficiency than the normal optimisation done by the operating system. These issues have been investigated and are summarised in the following.
The average power consumption of the entire evaluation with the LCLs is as follows:
• Without LCLs: 20.61 Watt per node. The SE is 0.86 Watt.
• With fuzzy logic controller, 20.45 Watt per node. The SE is 0.86 Watt.
• With bio-inspired controller, 20.56 Watt per node. The SE is 0.83 Watt.
Although this evaluation shows just a little improvement of the energy-efficiency, we determined aspects to be enacted as green actions, which are described in the following, allowing us to improve the entire energy-efficiency for the second release of the LCLs.
The LCLs tackle the problem of service centre servers characterised by a high energy consumption by adjusting the servers’ CPU power states (p-states) according to the incoming workload variation. The first HPC trials show the LCLs energy saving potential; however, the results are directly influenced by the number of p-states of the servers’ CPUs. A higher number of power states will enable LCLs with more accurate control on the CPU power consumption and in consequence better energy saving. The current HPC test bed processors Intel P8400, used for the first trials, have only three p-states, but for the second trials the HPC test bed servers processors will be improved to the new generation Intel i7 processors having up to 12 p-states, thus enabling for better energy saving results.
Figure 4 Average power consumption of the usage scenarios (see online version for colours)
Applying Green Metrics to optimise the energy-consumption footprint of IT service centres 171
Figure 5 Average CPU frequency of the entire cluster per node (see online version for colours)
Figure 6 Average CPU utilisation of the entire cluster per node (see online version for colours)
172 A. Kipp et al.
Another optimisation for improving the energy savings results is to make the LCLs aware of the workload dependencies and predictability in the HPC case. In this approach, when deciding on changing processor’s p-states, the LCLs will take into consideration the state of the neighbour dependent processors. For example, if a server’s processor enters the idle working mode, another server processor’s LCL being aware of this fact (due to the workload dependency knowledge among processors) may also decide to enter the idle mode in the near future, thus starting early the necessary preparations.
For the fuzzy logic LCL, better energy savings results can obtained if its execution parameters will be refined so that the workload history will have a greater impact upon the decision making process. In the current test case fuzzy logic LCL considers only current and near past workload (one step behind) for deciding on the processor p-state changes.
The bio-inspired LCL DFS decisions are taken by learning from previous experience in a similar manner to the human immune system. The energy savings results will be improved when a workload with similar characteristics is frequently encountered in the execution history of the local loop, because the DFS assignment decisions for that type of workload will have already been learned. This exactly suits the HPC case, which deals with a relatively small number of applications.
7 Concluding remarks
This paper has presented Green Metrics aimed at energy consumption monitoring in applications. In particular, a BP application and a HPC simulation test bed have been presented, illustrating a subset of Green Metrics (namely, those regarding IT resource usage) applied to these examples. Furthermore, some measurements and observations about energy consumption in the test beds have been shown. Some green actions aimed at running HPC, cloud-based, and in general BP-based applications in a less energy consumption mode have been discussed.
Since this is part of an ongoing work, an outline of the defined metrics has been given. We are going to perform a thorough validation on more extended examples, and to provide a method to design and analyse energy-aware applications. In fact, we have mentioned the basics of the GAMES approach that enables evaluating energy consumption in applications using annotations and GPIs for energy-awareness. We are refining the GPIs and defining a methodology with project partners for a complete evaluation of green properties of platforms and applications, and are developing a set of GAMES prototypes that perform activities such as process and data mining to derive information about energy consumption and adjust the resource usage modes both at design and run time to achieve energy-aware adaptation.
The presented evaluation results are promising [see also Cappiello et al. (2011) for more details about the BP use case], showing that the GAMES framework can
have significant impacts on the energy efficiency of IT service centres. Furthermore, we identified the areas of improvement for the GAMES components, allowing for achievement of better results in the second release of the GAMES framework.
Acknowledgements
This work is partially supported by funding from the Information Society Technologies Programme under the 7th Research Framework Programme of the European Union (Call: FP7-ICT-2009-4 Grant agreement no. 248514), within the research project Green Active Management of Energy in IT Service Centres (GAMES). This paper expresses the opinions of the authors and not necessarily those of the European Commission. The European Commission is not liable for any use that may be made of the information contained in this paper. The authors want to thank all who contributed to this paper, especially all members of the consortium.
References ‘D7.2 – validation scenarios’, GAMES report, available at
http://www.green-datacenters.eu. ‘D7.4 – first GAMES trial results’, GAMES report, available at
http://www.green-datacenters.eu. Ardagna, D., Cappiello, C., Lovera, M., Pernici, B. and Tanelli, M.
(2008) ‘Active energy-aware management of business-process based applications’, in Mahönen, P., Pohl, K. and Priol, T. (Eds.): ServiceWave, Lecture Notes in Computer Science, Vol. 5377, pp.183–195, Springer.
Available at http://en.wikipedia.org/wiki/SiCortex. Available at http://icl.cs.utk.edu/hpcc/. Available at http://www.green500.org/. Available at http://www.greenbusinessca.org. Available at http://www.green-datacenters.eu. Available at http://www.spec.org/. Available at http://www.storageperformance.org/results. Available at http://www.thegreengrid.org. Available at http://www.tpc.org. Available at http://www.tpc.org/information/benchmarks.asp. Available at http://www.uptimeinstitue.org. Basili, V., Cruzes, D., Carver, J., Hochstein, L., Hollingsworth, J.,
Zelkowitz, M. and Shull, F. (2008) ‘Understanding the high-performance-computing community: a software engineer’s perspective’, Software, IEEE, July–August, Vol. 25, No. 4, pp.29–36.
Bischof, C., Christian, M. and Iwainsky, C. (2011) ‘Brainware for green HPC’, Computer Science – Research and Development, p.7.
Brooks, D., Tiwari, V. and Martonosi, M. (2000) ‘Wattch: a framework for architectural-level power analysis and optimizations’, in Proceedings of the 27th Annual International Symposium on Computer Architecture, pp.83–94.
Applying Green Metrics to optimise the energy-consumption footprint of IT service centres 173
Cappiello, C., Fugini, M., Gangadharan, G., Ferreira, A.M., Pernici, B. and Plebani, P. (2010) ‘Toward energy-aware adaptive business processes’, COOPIS’10 Conf., Crete, Greece, October.
Cappiello, C., Fugini, M.G., Mello Ferreira, A., Pernici, B., Plebani, P. and Vitali, M. (2011) ‘Business process co-design for energy-aware adaptation’, IEEE International Conference on Intelligent Computer Communication and Processing (ICCP2011), Special Session on Green Computing, Cluj-Napoca, Romania, 25–27 August.
Cappiello, C., Fugini, M.G., Pernici, B. and Plebani, P. (2011) ‘Green information systems for sustainable IT’, in D’Atri, A., Ferrara, M., George, J.F. and Spagnoletti, P. (Eds.): Information Technology and Innovation Trends in Organizations, pp.153–160, Springer Verlag.
Catthoor, F., Greef, E.D. and Suytack, S. (1998) Custom Memory Management Methodology: Exploration of Memory Organisation for Embedded Multimedia System Design, Kluwer Academic Publishers, Norwell, MA, USA.
Chatterjee, M. et al. (2005) ‘Differential QoS support in web services management’, SOA World Magazine, 13 September.
Cioara, T., Salomie, I., Anghel, I. et al. (2011) ‘A dynamic power management controller for optimizing servers’ energy consumption in service centers’, in Proceedings of the First International Workshop on Services, Energy % Ecosystem (SEE 2010/ISOC2010), pp.158–168, available at http://www.springerlink.com/content/p5647x53u8xj6029/ (accessed on 09.02.2012).
Comuzzi, M. and Pernici, B. (2009) ‘A framework for QoS-based web service contracting’, ACM Transactions on the Web (TWEB), June, Vol. 3, No. 3, pp.10:1–10:52.
Costa, G.D., Gelas, J.P., Georgiou, Y., Lefevre, L., Orgerie, A.C., Pierson, J.M., Richard, O. and Sharma, K. (2009) ‘The green-net framework: energy efficiency in large scale distributed systems’, in Proceedings of the IEEE Int’l. Symposium on Parallel and Distributed Processing, IEEE, pp.1–8.
Fanara, A., Haines, E. and Howard, A. (2009) ‘The state of energy and performance benchmarking for enterprise servers’, in Proceedings of the First TPC Technology Conference, TPCTC 2009, Lyon.
Ferreira, A.M., Kritikos, K. and Pernici, B. (2009) ‘Energy-aware design of service-based applications’, in Baresi, L., Chi, C-H. and Suzuki, J. (Eds.): ICSOC/ServiceWave, Lecture Notes in Computer Science, Vol. 5900, pp.99–114.
Forrest, W., Kaplan, J.M. and Kindler, N. (2008) ‘Data centers: how to cut carbon emissions and costs’, McKinsey on Business Technology, available at http://www.mckinseyquarterly.com/Data_centers_How_to_ cut_carbon_emissions_and_costs_2255 (accessed on 09.02.2012).
Friedrich, G., Fugini, M., Mussi, E., Pernici, B. and Tagni, G. (2010) ‘Exception handling for repair in service-based processes’, IEEE Trans. on Software Engineering, Special Issue on Exception Handling, March, Vol. 36, No. 2, pp.198–215.
Harizopoulos, S., Shah, M. and Ranganathan, P. (2009) ‘Energy efficiency: the new holy grail of data management systems research’, in Proc. 4th Biennial Conference on Innovative Data Systems Research (CIDR).
Imada, T., Sato, M. and Kimura, H. (2009) ‘Power and QoS performance characteristics of virtualized servers’, in Proceedings of the 10th IEEE/ACM International Conference on Grid Computing.
Intel® PowerInformer, Available at http://software.intel.com/ en-us/articles/intel-powerinformer/.
Kipp, A., Jiang, T. and Fugini, M. (2011a) ‘Green Metrics for energy-aware IT systems’, in Proceedings of the Fifth International Conference on Complex, Intelligent, and Software Intensive Systems (CISIS-2011), pp.241–248.
Kipp, A., Schubert, L., Liu, J., Jiang, T., Christmann, W. and vor dem Berge, M. (2011b) ‘Energy consumption optimisation in HPC service centres’, in Proceedings of the Second International Conference on Parallel, Distributed, Grid and Cloud Computing for Engineering, pp.1–16.
Kipp, A., Jiang, T., Fugini, M. and Salomie, I. (2012) ‘Layered green performance indicators’, Future Generation Computer Systems, May, Vol. 28, No. 2, pp.478–489.
Koomey, J., Belady, C., Wong, C., Snevely, R., Nordman, B., Hunter, E., Lange, K., Tipley, R., Darnell, G., Accapadi, M., Rumsey, P., Kelley, B., Tschudi, W., Moss, D., Greco, R. and Brill, K. (2006) Server Energy Measurement Protocol, available at http://www.energystar.gov/ia/products/ downloads/Finalserverenergyprotocol-v1.pdf (accessed on 09.02.2012).
Llanos, D. and Palop, B. (2006) ‘TPCC-UVa: an open-source TPC-C implementation for parallel and distributed systems’, in Proc. of IPDPS, IEEE, p.389.
Mani, A. and Nagarajan, A. (2002) ‘Understanding quality of service for web services’, available at http://www.ibm.com/developerworks/webservices/library/ws-quality/index.html (accessed on 09.02.2012).
Mann, H., Grant, G. and Mann, I.J.S. (2009) ‘Green IT: an implementation framework’, in Proceedings of the AMCIS.
Martinovic, G. and Krpic, Z. (2011) ‘Towards green HPC blueprints’, in Proceedings of the Second International Conference on Cloud Computing, GRIDs, and Virtualisation, pp.113–118.
Marty, M. and Hill, M. (2007) ‘Virtual hierarchies to support server consolidation’, in Proceedings of the 34th ISCA.
Pernici, B. (Ed.) (2006) Mobile Information Systems: Infrastructure and Design for Adaptivity and Flexibility, Springer-Verlag New York, Inc., Secaucus, NJ, USA.
Poess, M., Nambiar, R.O. and Vaid, K. (2010) ‘Energy benchmarks: a detailed analysis’, in Proceedings of E-Energy 2010, Passau.
Schmidt, N.H., Erek, K., Kolbe, L.M. and Zarnekow, R. (2009) ‘Towards a procedural model for sustainable information systems management’, in HICSS’ 09: Proceedings of the 42nd Hawaii Int’l. Conference on System Sciences, IEEE Computer Society, Hawaii, USA, pp.1–10.
Schneider, R., Faust, G., Hindenlang, U. and Helwig, P. (2009) ‘Inhomogeneous, orthotropic material model for the cortical structure of long bones modelled on the basis of clinical CT or density data’, Computer Methods in Applied Mechanics and Engineering, 15 May, Vol. 198, Nos. 27–29, pp.2167–217.
Sekiguchi, S., Itoh, S., Sato, M. and Nakamura, H. (2009) ‘Service aware metric for energy efficiency in green data centers’, available at http://www.iea.org/work/2009/standards/Sekiguchi.pdf (accessed on 09.02.2012).
Song, S., Ge, R., Feng, X. and Cameron, K.W. (2009) ‘Energy profiling and analysis of the HPC challenge benchmarks’, International Journal of High Performance Computing Applications, August, Vol. 23, No. 3, pp.265–276.

174 A. Kipp et al.
Steigerwald, B., Chabukswar, R., Krishnan, K. and Vega, J.D. (2007) ‘Creating energy efficient software’, available at ftp://download.intel.com/software/pdf/CreatingEnergyEfficientSoftware.pdf (accessed on 09.02.2012).
Takahashi, I.L., Dongarra, J.J., Koester, D., Rabenseifner, R., Lucas, B., Kepner, J., Mccalpin, J. and Bailey, D. (2005) Introduction to the HPC Challenge Benchmark Suite, available at http://escholarship.org/uc/item/6sv079jp.pdf (accessed on 09.02.2012).
Tiwari, V., Malik, S. and Wolfe, A. (1994) ‘Power analysis of embedded software: a first step towards software power minimization’, IEEE Transactions on VLSI Systems, Vol. 2, No. 4, pp.437–445.
TPC-C, Available at http://www.tpc.org/tpcc/. Watson, R., Boudreau, M.C. and Chen, A. (2009) ‘Information
systems and environmentally sustainable development: energy informatics and new directions for the is community’, MIS Quarterly, Vol. 34, No. 1, pp.23–38.
Williams, J. and Curtis, L. (2008) ‘Green: the new computing coat of arms?’, IT Professional, Vol. 10, No. 1, pp.12–16.
Yu, J. and Buyya, R. (2005) ‘A taxonomy of scientific workflow systems for grid computing’, SIGMOD Rec., Vol. 34, No. 3, pp.44–49.
Zeng, L., Benatallah, B., Dumas, M., Kalagnanam, J. and Sheng, Q. (1993) ‘Quality driven web services composition’, in Proceedings of the 12th World Wide Web Conference (WWW), 2003. Reasoning about Naming Systems. ACM Trans. Program. Lang. Syst., November, Vol. 15, No. 5, pp.795–825, DOI= http://doi.acm.org/10.1145/161468.16147.
Zenker, N. and Rajub, J. (2008) ‘Resource measurement for services in a heterogeneous environment’, in ICTTA’ 08: Proceedings of the 3rd Int’l. Conference on Information and Communication Technologies: From Theory to Applications, IEEE Communications Society, Damascus, Syria, pp.1–15.