APPLICATIONS OF GEOGRAPHICAL INFORMATION SYSTEM (GIS) IN THE ANCIENT TOWN KELENDERIS IN TURKEY
13
19. Applications of Geographical Information Systems to Natural History Museum research projects in Belize By Penn, M.G 1 ABSTRACT This paper reviews GIS research at The Natural History Museum, London (NHM), which is focused on Belize. The need for spatial research in forestry is examined and an explanation is given for some of the problems associated with studying forest communities at different scales. The use of GIS is suggested as a mechanism for integrating multiple scale data sets and thus enabling multi-scale modelling of forest ecosystems. The objectives, methods and significance of GIS research projects at the NHM are considered with a discussion of future developments of this work and its importance within natural resource management in Belize. GEOGRAPHICAL RESEARCH IN BELIZE The scale at which processes are perceived to happen has long been recognized as very important although extremely difficult to quantify and study. This is due to the complex relationship between space and time (Cleland et al., 1994). Changes affecting large spatial areas generally occur over long time periods, whereas changes over very small (micro) areas often take place within a short period. Nevertheless small scale changes may greatly influence events at progressively larger scales. (Figure 19.1). Hence they are an integral part of a larger regional system. With this in mind, it follows that the scale at which we study processes within spatial ecological studies is of particular importance. For instance, tropical forests 1 Botany Department, Natural History Museum, London 1
Transcript of APPLICATIONS OF GEOGRAPHICAL INFORMATION SYSTEM (GIS) IN THE ANCIENT TOWN KELENDERIS IN TURKEY

19. Applications of Geographical Information Systems to
Natural History Museum research projects in Belize
By
Penn, M.G1
ABSTRACT
This paper reviews GIS research at The Natural History Museum, London(NHM), which is focused on Belize. The need for spatial research inforestry is examined and an explanation is given for some of theproblems associated with studying forest communities at differentscales. The use of GIS is suggested as a mechanism for integratingmultiple scale data sets and thus enabling multi-scale modelling offorest ecosystems. The objectives, methods and significance of GISresearch projects at the NHM are considered with a discussion offuture developments of this work and its importance within naturalresource management in Belize.
GEOGRAPHICAL RESEARCH IN BELIZE
The scale at which processes are perceived to happen haslong been recognized as very important although extremelydifficult to quantify and study. This is due to thecomplex relationship between space and time (Cleland etal., 1994). Changes affecting large spatial areasgenerally occur over long time periods, whereas changesover very small (micro) areas often take place within ashort period. Nevertheless small scale changes maygreatly influence events at progressively larger scales.(Figure 19.1). Hence they are an integral part of alarger regional system.
With this in mind, it follows that the scale at which westudy processes within spatial ecological studies is ofparticular importance. For instance, tropical forests
1 Botany Department, Natural History Museum, London
1

are commonly perceived as species-rich communities with arelatively uniform structure (Connell, 1978), ostensiblyas a result of their long history within which to reachan equilibrium in an apparently unchanging climate. Thiswas a widely accepted paradigm until Hubbell (1979)argued that a system as complex as a tropical forest,with many mechanisms acting on the community even with astable climate, was unlikely to be in equilibrium.Randomly selected areas of tropical forest may looksuperficially similar on the ground, but satelliteimagery shows clearly defined areas of differingvegetation at the macro and meso levels, often stronglycorrelated with differences in geology, topography andhydrology. (Figure 19.2).
Figure 19.1: Dependent and independent factors at micro, meso and macro scales which affect the overall forest system (Micro scale -
2
Flora
ForestEcologic
al
Hydrology
Geology Fauna
Disturbances
Climate
HumanInfluence
SoilsMultiple factors at micro through to regional scales.
Micro ScalesMeso ScalesMacro Scales

very local scale, less than 20 m; Meso Scale - plot scale up to c. 1km; Macro Scale - regional scale).
Figure 2: Shows a Spot XS image draped over a Digital Terrain Model (DTM), viewing east along the Upper Raspaculo, Belize. Each colour represents a different vegetation type that is known to be altitude and hydrology dependent.
In addition to this variations at larger scales, plot-based studies have revealed a further scale of variationthat operates at the geographical micro scale. He et al(1996) detected these small-scale changes on 50 ha plotin Malaysia, but concluded that what he termed“unidentified causes” were responsible for it. Work in1993 on a 1 ha plot in the Raspaculo basin of Belize(Sutton & Penn, 1994) showed much greater diversity atthe micro scale than expected, bearing in mind the areahad been carefully selected for its apparent uniformity.From initial studies on tree distribution and widelyspaced sampling of soils along a transect running throughthe plot, it was proposed that micro soil variation is animportant determinant in this local pattern.
Tropical forests are dynamic interrelated systems; awhole forest has to be seen as one entity with many
3

different parts adapting to changing inputs at the micro,meso and macro scales. Recognition of the importance ofspatial relationships between soil, water and forestresources have grown rapidly during the last decade(Sessions et al. 1994) although an assessment of therelative importance at different scales has not yet beencarried out. A major difficulty arises when studyingtropical ecosystems, in respect of how you take detailedfindings from micro scale surveys of processes andincorporate them into the wider view of the forestenvironment as ecological units.
A critical step for resolving the dilemma would be thedevelopment of a methodology for the collection andsynthesis of environmental data at multiple scales. Thiswould allow integration of detailed, process-orientedstudies at plot level, for example soil, moisture andbiological productivity with reconnaissance level studiesof tropical forest cover types. With the continuedenhancement and improvement of satellite sensors theresource manager now has regional scale informationavailable at a multitude of resolutions, e.g. Spot XS at20m resolution to hyperspectral data at less than 3m.Linking surveys from the ground, air and from satellitesensors is very much at an early stage. The use of theintegrative technology offered by GIS/Remote Sensing,coupled with an appropriately focused and systematicprogramme of scientific data collection, offers thepossibility of establishing a firm base of scientificdata on the relationship of soil and water to foreststructure, capable of analysis at multiple scales andcapable of incorporating variation through time(Gonzalez, 1994).
This work could be considered pioneering in that it aimsto bring together different scientific fields, includinginter alia remote sensing, plant and animal taxonomy and soilsciences/hydrology into a single model for both Life andEarth sciences using the integrative methodology of GIS.This innovative approach allows the development of aprotocol for studying soil and moisture variation at themicro scale, assessment of the importance of these
4
factors in influencing species composition, productivityof trees at local scales, and delivers a system forextrapolating the findings to multiple geographicalscales.
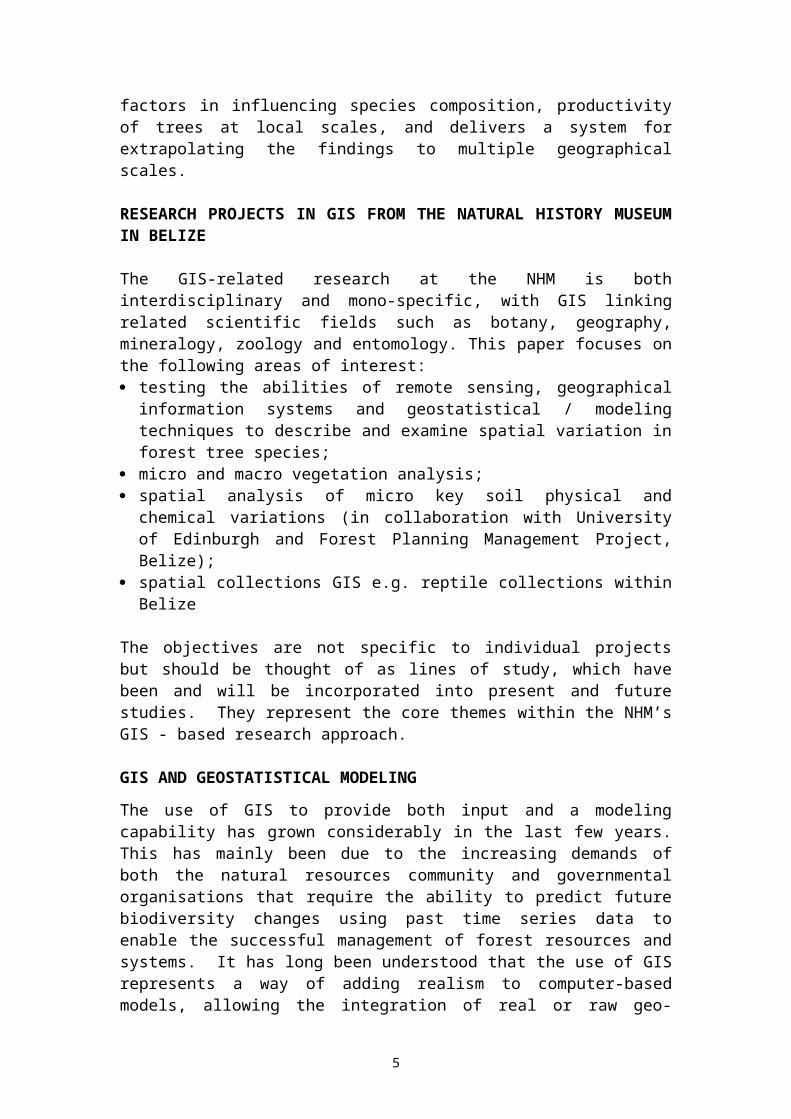
RESEARCH PROJECTS IN GIS FROM THE NATURAL HISTORY MUSEUMIN BELIZE
The GIS-related research at the NHM is bothinterdisciplinary and mono-specific, with GIS linkingrelated scientific fields such as botany, geography,mineralogy, zoology and entomology. This paper focuses onthe following areas of interest: testing the abilities of remote sensing, geographicalinformation systems and geostatistical / modelingtechniques to describe and examine spatial variation inforest tree species;
micro and macro vegetation analysis; spatial analysis of micro key soil physical andchemical variations (in collaboration with Universityof Edinburgh and Forest Planning Management Project,Belize);
spatial collections GIS e.g. reptile collections withinBelize
The objectives are not specific to individual projectsbut should be thought of as lines of study, which havebeen and will be incorporated into present and futurestudies. They represent the core themes within the NHM’sGIS - based research approach.
GIS AND GEOSTATISTICAL MODELING
The use of GIS to provide both input and a modelingcapability has grown considerably in the last few years.This has mainly been due to the increasing demands ofboth the natural resources community and governmentalorganisations that require the ability to predict futurebiodiversity changes using past time series data toenable the successful management of forest resources andsystems. It has long been understood that the use of GISrepresents a way of adding realism to computer-basedmodels, allowing the integration of real or raw geo-
5

referenced data directly with a model. Work at the NHMhas concentrated on two fronts: firstly the use ofinterpolation methods such as kriging and semi-variogramsto map spatially dependent points and, secondly, thedevelopment of vegetation models integrating both plot-based and regional scale data (hierarchical scaleapproach).
The first approach is based on the understanding thatdata points collected near to each other are morelikely to be similar than distant points. A degree ofspatial dependency occurs, thus in its simplest form adegree of weighting can be added. GEOSTATS is a meansof assessing the effect of location, on samplevariables, (Johnston 1998). Kriging uses a semi-variogram to model and produce a trend surface map baseof sample points and to incorporate the spatialvariability of the data collected. Kriging has beenshown by Atkinson (1997) to produce a degree ofsmoothing which can lead to the production of some whatrandom or misleading boundaries, which bear littleresemblance to the original scatter of points. Toovercome this, stochastic imaging is used to reapplythe variance lost through the smoothing techniques,which ensures that the spatial statisticalcharacteristics of the original data re-occur in theestimated value. The use of semi-variograms inconjunction with satellite classification techniquesand the use of textural algorithms have helped toimprove analysis of canopy roughness, crown sizes andwithin-stand species variation (very much dependent onresolution of imagery used). This work has enabledsome discrimination at species group and species leveland has led to a more representative vegetationclassification allowing discrimination of differentcanopy structures and successional variation.
In the second approach GIS-based models are beingdeveloped to link plot-based botanical data withremotely sensed regional satellite data to characterizedifferent vegetation types/zones. These GEO modelshave to take into account the complex structures and
6

interrelated nature of ecosystems / biodiversitysystems, as well as the effect of scale and time onecological and botanical processes.
MICRO AND MACRO VEGETATION ANALYSIS
Research first started two years ago on “micro and macrovegetation analysis” and work is continuing to try andimprove the accuracy of a vegetation classification basedon SPOT XS data for the Chiquibul forest reserve. Theforest classification of this region is based on the useof 20m-resolution imagery, and has been corrected forrelief distortions and spatial anomalies. In order toenhance within-stand variation it was necessary to useselected vegetation indices and very detailed andspecific ground truthing data (this has been collected byNHM researchers over the last few years). The mix ofdata available has produced an ever-evolving vegetationclassification for the Chiquibul Reserve, which has beenused in the following ways: to delimit different forest structures and speciesgroups;
to enable some delimitation of open, complex and maturecanopy structures;
to classify isolated but similar forest types; to approximate aerial coverage of individual forestclasses;
to study the underlying relationship between geology,soils and tree species presence or absence;
to provide input to micro, macro and meso research.
Recent work by Penn & Sutton (in preparation) hasproduced a regional scale classification for theChiquibul reserve. This is discussed in a forthcomingpublication but, in brief, the classification uses allexisting data from Wright (1959), Iremonger & Brokaw(1996) as well as extensive personal knowledge of thereserve. This combined with satellite data has produceda classification with approximately 20 main classes withdominant plant species listing for all classes.
7
The enhancement and updating of this classification iscontinuing and with the advent of new sensors with betterresolution and spectral coverage, the discrimination offorest types/classes can only improve. Ultimately thisunderpins the natural resources management support systemand provides a valuable source of data for NHM’s spatialmodeling research.
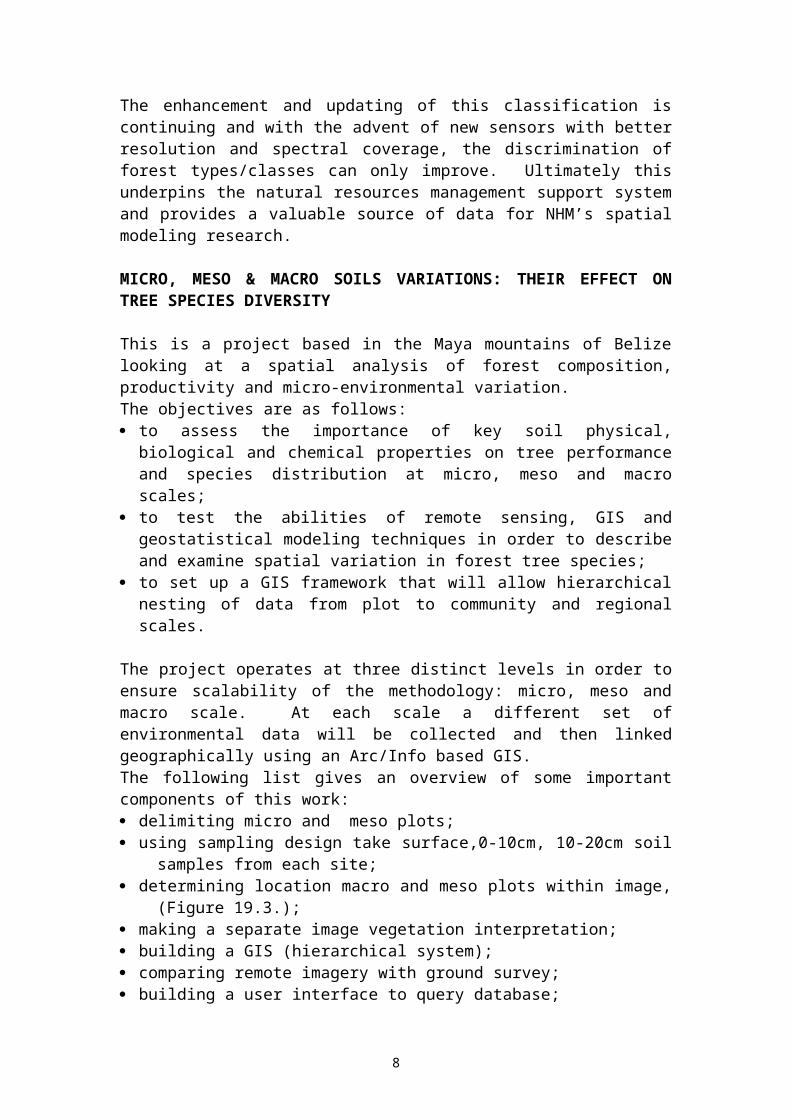
MICRO, MESO & MACRO SOILS VARIATIONS: THEIR EFFECT ONTREE SPECIES DIVERSITY
This is a project based in the Maya mountains of Belizelooking at a spatial analysis of forest composition,productivity and micro-environmental variation.The objectives are as follows: to assess the importance of key soil physical,biological and chemical properties on tree performanceand species distribution at micro, meso and macroscales;
to test the abilities of remote sensing, GIS andgeostatistical modeling techniques in order to describeand examine spatial variation in forest tree species;
to set up a GIS framework that will allow hierarchicalnesting of data from plot to community and regionalscales.
The project operates at three distinct levels in order toensure scalability of the methodology: micro, meso andmacro scale. At each scale a different set ofenvironmental data will be collected and then linkedgeographically using an Arc/Info based GIS.The following list gives an overview of some importantcomponents of this work: delimiting micro and meso plots; using sampling design take surface,0-10cm, 10-20cm soil
samples from each site; determining location macro and meso plots within image,
(Figure 19.3.); making a separate image vegetation interpretation; building a GIS (hierarchical system); comparing remote imagery with ground survey; building a user interface to query database;
8

testing the relationship of soil properties and scalevariation to tree distribution and yield potential;
analysing research data using spatial andgeostatistical techniques.
A B
Figure 3: Shows a hierarchical sample structure used within the LasCuevas plot, Chiquibul Reserve, at the micro and macro scale togetherwith topographic data, contours in metres (A) and calcium carbonatelevels (B). Note the considerable variation across such a small 60 X60m area.
The use of GIS in this and other GIS based projectsallows multi-disciplinary solutions and approaches tointerrelated research themes, as well as providing a toolfor spatial related research: It will help build a betterunderstanding of forest dynamics in a hierarchical mannerfrom plot to regional scales (Furley et al. in press)
SPATIAL COLLECTIONS
The NHM holds significant amounts of geographicalspecimen data, some of which is databased and easilyaccessible to GIS systems. With the development andintroduction of a standard database system for the NHM(Informix), it has become possible to represent thecollections the institution holds in an accessible anduser-friendly graphical system. A system has beendeveloped based on the ArcView 3.2 GIS, a slimmed down
9

GIS that is designed to provide simple manipulativespatial capabilities for the casual user.
Using GIS it is possible to query and extract data frommost database formats, allowing specimen data to beoverlaid on other relevant data layers, e.g. geology,climatic, soil data, etc. This enables rapiddistribution maps and querying to take place, e.g. recentbotanical collections at The Natural History Museum havebeen incorporated into an ArcView based GIS, as havereptile and amphibian records.
The ability to represent the NHM collections spatially isvery important, as simply plotting a distribution map ofspecies gives the researcher a broad view of thegeographical spread of a species, and can help to assessthe species richness of an area. It can also reveal thescarcity of collections or over-concentration of work insome areas to the detriment of others, which is often thecase where accessibility plays a major role.
10

Figure 4: Shows how Natural History collections are often collectednear to tracks and roads as well as in specific areas like the Mayamountains. (Data provided by P.Stafford and represents Reptilecollections within Belize. Note that most collections have takenplace within 5 miles of a track or road).
SUMMARY AND THE NEXT FEW YEARS
The ability to model and predict the past, present andfuture effects of changing or static environmentalvariables on ecosystems has become widely accepted asfundamental to their successful management. How this canbe achieved is open to many scenarios. The NHM’s GISresearch is based on the premise that scientific subjectsare often interrelated and have both direct and indirectimpact on an overall system. For instance, the fauna andflora effect soils and vice versa, likewise climateaffects vegetation and vice versa.
A linked modeling approach of integrating differentrelated scientific fields is fundamental to the successof any short or long-term approach to studying forestryecosystems as one integrated entity. This philosophy isbeing utilized to help link plot-based studies toregional scale satellite based vegetation surveys and inthe “micro variation of soils project” in collaborationwith Edinburgh University.
GIS has now become an integral part of the NHM researchbased at its field centre at Las Cuevas, Chiquibul ForestReserve, in the southern Maya Mountains. It offers aspatial component to model not just botanical work butalso spatial entomology work.
Over the next few years this approach will be integratedand used to enhance the base data available for Natural
11

Resource Managers and to link different scientificdisciplines together using GIS. This will help assessbiodiversity for the Chiquibul Reserve using common geo-referenced data formats and lead to a betterunderstanding of forest dynamics and composition within amulti-scalar approach.
ACKNOWLEDGMENTSSpecial thanks to Neil Bird, FPMP and the Belize Forest Departmentfor allowing the use of the long term Las Cuevas and the San Pastorexperimental logging plots.
REFERENCES
Atkinson, P.M. 1997. Scale and scale dependence. In Van Gardingen,P.R., Foody, G.M & Curran, P.J. (Eds) Scaling up: From Cell to Landscape.Society for Experimental Biology Seminar Series, 63. Pp. 35-60.Cambridge: Cambridge University Press. Cleland, D.T., Crow, T. R., Hart, J. B. & Padley, E. A. 1994.Resource management perspective: Remote Sensing and GIS support fordefining, Mapping and Managing Forest Ecosystems. In Sample, V.A(Ed.) Remote Sensing and GIS in Ecosystem management. Pp. 243-264.Washington: Island Press. Connell, J. H. 1978. Diversity in tropical rain forests and coralreefs. Science 199, 1302-1310.Furley, P.A. & Dargie, T.D. 1994. Monitoring change in land use andthe environment. In Furley, P.A. (Ed.). The forest frontier. Pp. 68-85.London: Routledge. Furley, P. A., Penn, M. G., Bird, N. & Murray, M. M. (in press)Spatial analysis of micro-environmental change and forest compositionin Belize. Netherlands: Kluwer Gonzalez, O. J. & Zak, D.R. 1994. Geostatistical analysis and soilproperties in a secondary dry forest, St Lucia, West Indies. Plant &Soil 163, 45-54.He, F., Legendre, P. & LaFrankie, J. V. 1996. Spatial pattern ofdiversity in tropical rain forest in Malaysia. Journal of Biogeography 23,57-74.Hubbell, S. P. 1979. Tree dispersion, abundance and diversity in atropical dry forest. Science 203, 1299-1309.Johnston, C. A. 1998. Methods in Ecology: Geographic Information Systemsin Ecology. Oxford: Blackwell Science.Johnston, C., Cohen, Y. & Pastor, J. 1996. Modelling of spatiallystatic and dynamic ecological processes. In Goodchild, M.F.,Steyaert, L. & Parks, B. (Eds.). GIS and Environmental Modeling: Progress andResearch Issues. Pp. 149-155. Fort Collins: GeoinformationInternational.Iremonger, S. & Brokaw, N.V.L. 1996. Vegetation Classificationfor Belize. In Towards a National Protected Area Systems Plan for Belize. BelizeCity: Programme for Belize & Inter-American Development Bank
12
Sessions, J., Crim, S. & Johnson, N. K. 1994. Resource ManagementPerspective: Geographical Information Systems and decision models inforestry management planning. In Sample, V. (Ed.). Remote sensing and GISin ecosystems management. Pp. 63-91. Washington: Island Press.Stafford, P. J. & Meyer, J. R. 1998. A Guide to the Reptiles ofBelize. San Diego: Academic Press. Sutton, D. A. & Penn, M. G. 1994. Biodiversity. A model for the studyof biodiversity and biological resources using plot-based studies,GIS and Remote Sensing. In Rogers, A.D.F., Sutton, D.A. & Stafford,P.J (Eds). Report of the Joint Services Scientific expedition to the Upper Raspaculo river,Belize, Central America. Pp. 73-90. London: The Natural HistoryMuseum/Ministry of Defence.Wright, A.C.S., Romney, D. H., Arbuckle, R. H. & Vial, V. E. 1959.Land in British Honduras. Report of the British Honduras land use survey team. Colonialresearch publications No.24. London: Her Majesty's StationeryOffice.
13