
Application of Response Surface Methodology to Enhance Phenol Removal from Refinery Wastewater by...
13
Research Article Application of Response Surface Methodology to Enhance Phenol Removal from Refinery Wastewater by Microwave Process Sherif A. Younis, 1 Waleed I. El-Azab, 1 Nour Sh. El-Gendy, 1 Shuokr Qarani Aziz, 2 Yasser M. Moustafa, 1 Hamidi Abdul Aziz, 3 and Salem S. Abu Amr 3 1 Egyptian Petroleum Research Institute, 1 Ahmed El-Zomor Street, El-Zohour Region, Nasr City, Cairo 11727, Egypt 2 Civil Engineering Department, College of Engineering, University of Salahaddin-Hawler, 44002 SUH, Erbil, Iraq 3 School of Civil Engineering, Engineering Campus, 14300 Nibong Tebal, Penang, Malaysia Correspondence should be addressed to Nour Sh. El-Gendy; [email protected] Received 6 January 2014; Accepted 3 April 2014; Published 28 April 2014 Academic Editor: Tanmay Basak Copyright © 2014 Sherif A. Younis et al. is is an open access article distributed under the Creative Commons Attribution License, which permits unrestricted use, distribution, and reproduction in any medium, provided the original work is properly cited. Phenol contaminated petroleum refinery wastewater presents a great threat on water resources safety. is study investigates the effect of microwave irradiation on removal of different concentrations of phenol in an attempt for petroleum refinery wastewater treatment. e obtained results show that the MW output power and irradiation time have a significant positive effect on the removal efficiency of phenol. e kinetic reaction is significantly affected by initial MW output power and initial phenol concentrations. Response surface methodology (RSM) was employed to optimize and study the interaction effects of process parameters: MW output power, irradiation time, salinity, pH, and H 2 O 2 concentration using central composite design (CCD). From the CCD design matrix, a quadratic model was considered as an ultimate model (R 2 = 0.75) and its adequacy was justified through analysis of variance (ANOVA). e overall reaction rates were significantly enhanced in the combined MW/H 2 O 2 system as proved by RSM. e optimum values for the design parameters of the MW/H 2 O 2 process were evaluated giving predicted phenol removal percentage of 72.90% through RSM by differential approximation and were confirmed by experimental phenol removal of 75.70% in a batch experiment at optimum conditions of 439 W MW power, irradiation time of 24.22 min, salinity of 574 mg/L, pH 5.10, and initial H 2 O 2 concentration of 10% (v/v). 1. Introduction e main recalcitrant organic material found in petroleum refinery wastewater (PRWW) effluent is phenol due to its high water solubility behavior (86 g/L) and resistance to conventional physicochemical treatment methods, for exam- ple, oil separation, coagulation, and flocculation [1, 2]. e phenol concentration in the PRWW effluent is generally in the range of 20–200 mg/L [3, 4], while US Environmental Protection Agency, WHO study in 1998, and Environmental Egyptian Law Number 4, 1994 for wastewater considered phenols as priority pollutants and lowered their content in the wastewater stream to less than 1 mg/L as maximum con- centration limit [5]. Due to the phenol propensity to initiate carcinogenic and mutagenic effects on terrestrial as well as aquatic biota and human [6], PRWW effluent needs additional treatment before its final disposal to reduce the phenol concentrations in the wastewaters to accomplish the requirements for discharge in the receiving body and comply with relevant Egyptian and international standards for water recycling and reuse. Over the past few decades, advanced oxidation processes (AOP) have received increasing attention for the destruction of phenolic pollutants commonly found in wastewaters [7, 8] as it provides total destruction of the pollutant without any generation of byproducts, thereby causing less harm to the environment [9]. Among these AOP, microwave (MW) technology has attracted a great deal of attention as energy- efficient AOP to tertiary treatment of different organic pollu- tants in wastewater [10–13]. Hindawi Publishing Corporation International Journal of Microwave Science and Technology Volume 2014, Article ID 639457, 12 pages http://dx.doi.org/10.1155/2014/639457
-
Upload
independent -
Category
Documents
-
view
5 -
download
0
Transcript of Application of Response Surface Methodology to Enhance Phenol Removal from Refinery Wastewater by...

Research ArticleApplication of Response Surface Methodology toEnhance Phenol Removal from Refinery Wastewater byMicrowave Process
Sherif A Younis1 Waleed I El-Azab1 Nour Sh El-Gendy1 Shuokr Qarani Aziz2
Yasser M Moustafa1 Hamidi Abdul Aziz3 and Salem S Abu Amr3
1 Egyptian Petroleum Research Institute 1 Ahmed El-Zomor Street El-Zohour Region Nasr City Cairo 11727 Egypt2 Civil Engineering Department College of Engineering University of Salahaddin-Hawler 44002 SUH Erbil Iraq3 School of Civil Engineering Engineering Campus 14300 Nibong Tebal Penang Malaysia
Correspondence should be addressed to Nour Sh El-Gendy nourepriyahoocom
Received 6 January 2014 Accepted 3 April 2014 Published 28 April 2014
Academic Editor Tanmay Basak
Copyright copy 2014 Sherif A Younis et alThis is an open access article distributed under theCreativeCommonsAttribution Licensewhich permits unrestricted use distribution and reproduction in any medium provided the original work is properly cited
Phenol contaminated petroleum refinery wastewater presents a great threat on water resources safety This study investigates theeffect of microwave irradiation on removal of different concentrations of phenol in an attempt for petroleum refinery wastewatertreatmentTheobtained results show that theMWoutput power and irradiation timehave a significant positive effect on the removalefficiency of phenol The kinetic reaction is significantly affected by initial MW output power and initial phenol concentrationsResponse surface methodology (RSM) was employed to optimize and study the interaction effects of process parameters MWoutput power irradiation time salinity pH andH
2O2concentration using central composite design (CCD) From the CCD design
matrix a quadratic model was considered as an ultimate model (R2 = 075) and its adequacy was justified through analysis ofvariance (ANOVA) The overall reaction rates were significantly enhanced in the combined MWH
2O2system as proved by RSM
Theoptimumvalues for the design parameters of theMWH2O2processwere evaluated giving predicted phenol removal percentage
of 7290 through RSM by differential approximation and were confirmed by experimental phenol removal of 7570 in a batchexperiment at optimum conditions of 439W MW power irradiation time of 2422min salinity of 574mgL pH 510 and initialH2O2concentration of 10 (vv)
1 Introduction
The main recalcitrant organic material found in petroleumrefinery wastewater (PRWW) effluent is phenol due to itshigh water solubility behavior (86 gL) and resistance toconventional physicochemical treatment methods for exam-ple oil separation coagulation and flocculation [1 2] Thephenol concentration in the PRWW effluent is generally inthe range of 20ndash200mgL [3 4] while US EnvironmentalProtection Agency WHO study in 1998 and EnvironmentalEgyptian Law Number 4 1994 for wastewater consideredphenols as priority pollutants and lowered their content inthe wastewater stream to less than 1mgL as maximum con-centration limit [5] Due to the phenol propensity to initiatecarcinogenic and mutagenic effects on terrestrial as well
as aquatic biota and human [6] PRWW effluent needsadditional treatment before its final disposal to reduce thephenol concentrations in the wastewaters to accomplish therequirements for discharge in the receiving body and complywith relevant Egyptian and international standards for waterrecycling and reuse
Over the past few decades advanced oxidation processes(AOP) have received increasing attention for the destructionof phenolic pollutants commonly found in wastewaters [78] as it provides total destruction of the pollutant withoutany generation of byproducts thereby causing less harm tothe environment [9] Among these AOP microwave (MW)technology has attracted a great deal of attention as energy-efficient AOP to tertiary treatment of different organic pollu-tants in wastewater [10ndash13]
Hindawi Publishing CorporationInternational Journal of Microwave Science and TechnologyVolume 2014 Article ID 639457 12 pageshttpdxdoiorg1011552014639457
2 International Journal of Microwave Science and Technology
MWenergy belongs to nonclassical source of energy withseparate bands of electromagnetic radiation and frequenciesranging from 300MHz to 300GHz [14 15] The applicationof MW as advanced oxidation technology has already beenapplied to industrial domestic and medical science andtreatment of environmental organic pollution and so forth[16ndash20] Applying MW radiation for waste destruction isattracting due to its molecular-level heating which leads tohomogeneous and quick thermal reactions [21 22] as thedipoles within a dielectric material in an alternating MWelectric field attempt to realign themselves according to theapplied power The ability to absorb this energy by themolecules depends upon functional groups and volumeof thematerial involved in the process [15 23ndash25]
The aim of this work is to use MW irradiation in batchmode as AOP to study the kinetics of phenol removal fromPRWW sample to optimize the operating conditions Due tothe reasonable cost and high oxidizing power of hydrogenperoxide as a homogeneous oxidizing agent response surfacemethodology (RSM)was applied to optimize and enhance theprocess of phenol removal throughout a combination systemof MWH
2O2to enhance the removal efficiency The experi-
mental design matrix was developed through a central com-posite design (CCD) using the studied variables MW outputpower irradiation time salinity pH and initial hydrogenperoxide concentrations
2 Materials and Methods
21 Reagents and Apparatus Analytical grade phenol (gt98purity) and hydrogen peroxide (30 wv) were purchasedfrom Sigma Aldrich USA while all other chemical reagentsemployed in this study were of analytical grade A stocksolution containing 1000mgL phenol was prepared and thendiluted to the required concentration using the authenticwastewater solution according to the experimental condi-tions The authentic wastewater (synthetic water) solutionused in this work was prepared according to the physico-chemical characteristics of petroleum refinery effluents col-lected from wastewater treatment plant at Cairo Oil RefiningCompany (CORC) in Egypt at different dates and time inter-vals (data not shown) and was composed of NaCl 048 g KCl0019 g MgSO
40074 g Na
2SO40009 g CaCl
2012 g MgCl
2
004 g NaHCO3018 g and CaSO
4003 g dissolved in
1000mL deionized water (182MΩ cm)A modified domestic MW oven (Electrolux Model
EMM2005) with frequency 2450MHz and maximum outputpower of 800 Watt was used to supply MW irradiation asshown in Figure 1
HPLC instrument model Agilent 1200 series equippedwith autosampler and photodiode array detector (set at fullscan range 190ndash400 nm) was used to analyze the phenolconcentrations under the following conditions C8 reversedphase (46 times 25 cm 300 A 5 120583m) column isocratic programwith 60 acetonitrile 40 water (vv) flow rate 10mLminand sample size 10 120583L
22 Experimental Conditions All the experiments were con-ducted using MWH
2O2system in a 250mL capacity quartz
Cooling water inCooling water out5
2
3
6
1
4
Figure 1 Schematic diagram of the MW reactor for PRWWtreatment (1)MW source (2) time adjuster (3) power adjuster (4)pyrex vessel reactorwith reactionmixture (5) condenser connectingwith circulating water bath adjusted at 5∘C (6)magnetic stirrer
flask reactor with a working volume of 25mL The phenolsolutions with different concentrations (10 25 and 50mgL)were irradiated at different MW power levels 100 150 300450 and 600Watt and at different irradiation times intervalsranging from 1 to 40min
The initial salinity of the solution range (200ndash1000mgL)was adjusted by adding NaCl initial pH range (pH 5ndash9) was adjusted by 01M NaOH or HCl and the initialH2O2concentrations range (1 to 10 vv) was employed to
decontaminate authentic PRWW containing different con-centrations of phenol After the MW removal process thephenol concentration in the samples was determined usingHPLC The listed removal efficiency by MW was the arith-metic average of the results derived from duplicate experi-ments
23 Kinetic Study The kinetic study was carried out atdifferent MW powers (100ndash600W) at a fixed initial phenolconcentration of 10mgL and at different concentrations ofphenol (10 25 and 50mgL) at a fixed MW output powerof 450W Three different kinetic models were tested for theobtained data to elucidate the removal processes (1)ndash(3) asfollows
(1) zero-order kinetic model [26]
119862119905= minus1198961119905 + 119862119900 (1)
(2) first-order kinetic model [7]
ln119862119905= minus1198962119905 + ln119862
119900 (2)
(3) second-order kinetic model [27]1
119862119905
= minus1198963119905 +
1
119862119900
(3)
where 119862119900and 119862
119905were the initial and final con-
centration (mgL) respectively while 1198701(mgmin)
1198702(minminus1) and 119870
3(mgminus1minminus1) are rate constant
for zero- first- and second-order kinetic modelsrespectively and 119905 is irradiation time (min)
International Journal of Microwave Science and Technology 3
Table 1 The considered levels of independent variables for thephenol removal by CCD
Independent variables Symbol Variable levelsminus1 0 +1
(1) MW Power (Watt) 119860 300 450 600(2) MW Irradiation Time (min) 119861 10 20 30(3) Salinity (mgL) 119862 200 600 1000(4) pH 119863 5 7 9(5) H2O2 ( vv) 119864 1 55 10
24 Validity of KineticModels Thevalidity of eachmodel wasdetermined by the following statistical error functions
(1) The sum of the squares of errors (ERRSQ) [28]119899
sum
119894=1
(119862119905Calc minus 119862119905exp)
2
119894 (4)
(2) The hybrid fractional error (HYBRID) [29 30]
100
119899 minus 119901
119899
sum
119894=1
100381610038161003816100381610038161003816100381610038161003816100381610038161003816
(119862119905exp minus 119862119905calc)
2
119894
119862119905exp
100381610038161003816100381610038161003816100381610038161003816100381610038161003816
(5)
where 119862119905exp and 119862
119905calc are the experimental andcalculated phenol concentration (mgL) respectivelyat time (119905) and 119899 is the number of data points and 119875is the number of parameters in the model
25 Experimental Design The design of experiments wasintended to reduce the number of experiments with a widerange of combinations of independent variables In thepresent study CCD with five independent variables eachwith three levels (coded as minus1 0 and +1 for low mediumand high levels resp) was used for the experimental designmodel (Table 1) The ranges of the independent variables arebased on the conditions screened prior to optimization (datanot shown) Studies were conducted batchwise according to astatistically designed experimental matrix under MWH
2O2
process (Table 2) formulated by the Design Expert 8017(State-Ease Inc Minneapolis USA) software in order to mapthe whole region and obtain reaction conditions at whichmaximum phenol removal was attained
The CCD containing a total of 50 experiments with eightreplicates at the central points to estimate the experimentalerror was employed to investigate the selected variableseffect initial MW power output irradiation time (min)salinity initial pH and initial hydrogen peroxide concen-tration (119860 119861 119862 119863 and 119864 resp) on the response function(phenol removal) The mathematical relationship betweenthe response function (119884) and independent variables (119909) wasgenerated to fit a general quadratic polynomialmodel (6) thatwas selected as the most appropriate equation to representthe experimental data using response surface regression asfollows
119884 = 120573119900+
5
sum
119894=1
120573119894120594119894+
5
sum
119894=1
1205731198941198941205942
119894+
4
sum
119894=1
5
sum
119895=119894+1
120573119894119895120594119894120594119895 (6)
where 119884 is the predicted response or dependent variable thatis the phenol removal efficiency () in studied MWH
2O2
process 119909119894 119909119895are the independent variables 120573
119900is the con-
stantmodel coefficient 120573119894120573119894119894120573119894119895is the interaction coefficient
for linear quadratic and second-order terms respectivelycalculated from experimental data
3 Result and Discussion
31 Kinetics of the Phenol Removal The trends in the removalof phenol under different MW irradiation power and timeintervals experiments are shown in Figure 1 The obtainedresults revealed that MW irradiation significantly enhancesthe removal efficiency of phenol The removal percentagerecorded asymp 2872 plusmn 315 300 plusmn 285 4320 plusmn 2904943 plusmn 195 and 5126 plusmn 210 at 100 150 300 450 and600WMW after 40min respectively
The removal efficiency for phenol pollutant graduallyincreased with the increase of the studied MW outputpower and irradiation time within the range 100ndash600W and1ndash40min respectively This indicates that MW output powerand irradiation time exert a positive effect on phenol removalthat is enhancing phenol removal efficiency Similar observa-tionwas reported by Papadaki et al [31] andZalat andElsayed[32]
Also the higher removal efficiency at MW output power(ge300W) and irradiation time (ge10min) (Figure 2) indicatedthat the overall dominating mechanism for explanation ofphenol removal by MW could be expressed as thermalcracking (localized pyrolysis or selective heat) caused byoxygen-deficient zoneswithinwater due to the heat generatedby the absorption of MW energy by water and phenol(hydrophilic nature) which is characterized by a permanentor induced polarization due to its high dielectric loss factor[7 33 34] Where the absorption coefficient (120572) of MWpower is a function of the temperature that is a function ofMW power and irradiation time intervals [11 21 35]
In this study with the increase of MW irradiation powerand time up to 300 Watt and 10min respectively thetemperature of authentic wastewater increases to 90∘C (asrecorded by temperature controller) and consequently watertransparency leading to deeper penetration of MW radiationto phenol molecules and results increment of MW elec-tromagnetic field absorption the dipoles within the phenolpollutant attempt to realign themselves according to theapplied MW field This generates internal friction resultingin high energy absorption by phenol that induced polariza-tion of phenol and thermal removal by pyrolysis to theirelemental constituents This means that phenol removal byMW alone is highly significant Chien [13] reported thatthe absorption coefficient decreases from 22 to 03 cmminus1 forwater as the temperature increases from 2 to 95∘C
Furthermore it can be seen that the removal rate of phe-nol increases until attaining approximately highest removalvalues at MW output power of 450 Watt for all studied rangeof MW power while with higher MW irradiation power(600W) more heat could be generated but no significantremoval values were attained Therefore in view of cost
4 International Journal of Microwave Science and Technology
Table 2 Design matrix for the phenol decomposition process by CCD
Run number 119860 119861 119862 119863 119864 Phenol decomposition MW power (Watt) Time (min) Salinity (mgL) pH H2O2 () Predicted Experimental
1 600 10 1000 5 1 4439 47052 600 30 1000 9 1 3625 38903 600 10 1000 9 1 2709 17604 600 30 200 9 10 4823 51455 300 10 200 9 10 4736 45476 450 20 1000 7 55 5469 68497 600 10 200 5 10 5017 55138 300 10 1000 5 10 5551 50749 450 20 600 5 55 6119 697910 300 30 1000 5 1 4965 594411 600 10 1000 5 10 5660 512412 300 30 200 9 1 4237 467913 600 30 1000 5 1 5786 564314 300 10 200 9 1 3150 427015 450 20 600 7 55 5697 526516 600 30 1000 9 10 5532 599217 300 10 1000 9 1 2402 272118 600 10 200 5 1 5047 573119 450 20 600 7 55 5697 577620 300 30 200 5 10 6584 669021 450 20 600 7 55 5697 510822 600 30 200 5 10 6317 658423 450 20 600 7 10 6850 674424 300 30 200 5 1 5987 591225 600 20 600 7 55 5004 559726 450 20 600 7 1 5522 636127 300 10 200 5 1 4468 303928 600 30 1000 5 10 6857 592129 300 10 200 5 10 5217 588530 600 30 200 9 1 4167 448131 600 30 200 5 1 6498 585732 450 20 600 9 55 4797 467033 450 20 600 7 55 5697 559034 300 10 1000 5 1 3551 324335 300 20 600 7 55 4984 512436 300 10 1000 9 10 5239 525837 600 10 1000 9 10 4768 553838 450 20 600 7 55 5697 539139 600 10 200 9 10 3955 305040 450 20 600 7 55 5697 489441 450 10 600 7 55 4944 572142 300 30 1000 5 10 6814 703143 300 30 1000 9 1 3385 203044 450 30 600 7 55 6085 604245 300 30 1000 9 10 6072 610046 300 30 200 9 10 5672 546347 450 20 600 7 55 5697 546848 450 20 600 7 55 5697 514649 600 10 200 9 1 3148 282050 450 20 200 7 55 5573 4927
International Journal of Microwave Science and Technology 5
00
100
200
300
400
500
600
0 1 5 10 20 30 40
Rem
oval
()
Irradiation time (min)
100W150W300W
450W600W
Figure 2 Removal of 10mgL phenol under different MW irradia-tion powers (100ndash600 Watt) and time intervals (1ndash40min)
effectiveness and MW power saving the fixed output MWpower of 450W was chosen for further experiments as anoptimum MW power to study the effect of different initialphenol concentrations (10ndash50mgL) on their removal byMWtreatment system
The profiles of phenol illustrating the removal efficiencywith time at different concentrations (10ndash50mgL) at a fixedMW output power 450W are depicted in Figure 3 It can beobserved that the removal efficiency () for phenol at thestudied concentrations range was almost unchanged underMW treatment process recording asymp 4943plusmn095 5229plusmn040and 5042 plusmn 102 after 40min at 10mgL 25mgL and50mgL initial phenol concentration respectively This indi-cates that the removal efficiency of phenol byMW irradiationwas not factor of the studied initial phenol concentrationswhile it was a factor of MW irradiation power and timeinterval
The kinetic study of phenol removal was analyzed usingthe experimental data obtained with various initial MWpower (100ndash600 W) and different initial phenol concentra-tions (10ndash50mgL) The correlation coefficient (1198772) the rateconstant (119870) half-lives (119905
12) and the statistical error analysis
values for studied kinetic models are listed in Tables 3(a)and 3(b) Due to the high correlation coefficient (1198772) valuesfor all kinetic models for studied experiments the statisticalerror analysis values were used to confirm the fitting ofkinetic models with experimental data According to theresults listed in Tables 3(a) and 3(b) the experimental datafor phenol removal at different MW output power were bestfitted with zero-order kinetic model at low MW irradiationpower (100 and 150W) with1198772 values asymp 097 and lowest erroranalysis values as represented in Figure 4(a) however underhigher MW irradiation power range from 300 to 600W the
000010020030040050060070080090100
0 10 20 30 40Time (min)
10 mgL25 mgL50 mgL
CtCo
Figure 3 Effect of initial phenol concentration on removal effi-ciency by MW at 450W
observed kinetics shifted to first-order kinetic model withlowest error analysis values and 1198772 values of 097ndash099 higherthan that of the zero-order kinetic model (1198772 075ndash094) asrepresented in Figure 4(b) Furthermore the experimentaldata at different initial phenol concentrations were best fittedwith a first-order kinetic model with 1198772 values of 099and lowest error analysis values under MW treatment atphenol concentration range from 10 to 25mgL Howeverunder higher phenol concentration of 50mgL the observedkinetics shifted to second-order kinetic model with 1198772 valuesof 099 and lowest error analysis values as illustrated inFigure 5
Obviously from the results listed inTables 3(a) and 3(b) itcan be observed that the initialMWoutput power and phenolconcentrations had influence on both of the rate constants(119870) and half-lives (119905
12) the rate constants increased and half-
lives decreased gradually as the MW output power increasedup to 450WattMW power with approximately no significantdifference between 450W and 600WMW output powerWhile the 119905
12had no significant difference between different
initial phenol concentrations at fixed output MW power of450 watt These observations could confirm that the removalefficiency of phenol by MW irradiation does not depend onphenol concentrations although it significantly depends onMW irradiation power
Zhao et al [36] andZhao andFei [37] reported that underMW irradiation alone at 750W phenol is degraded slowlyvia pyrolysis with a pseudofirst-order kinetic AdditionallyPrasannakumar et al [7] reported that phenol removal byMW irradiation (180W) at different concentrations (100ndash500mgL) in the presence of H
2O2followed the first-order
kinetic model
32 Process Optimization and Interactions between Indepen-dent Variables RSM was successfully used in optimizingthe studied parameters (ie output MW power irradiationtime salinity pH and initial hydrogen peroxide concen-tration) for removal of phenol at 10mgL concentration
6 International Journal of Microwave Science and Technology
05
101520253035
0 5 10 15 20 25 30 35 40
Rem
oval
()
Time (min)
100W-experimental data150W-experimental data
100W zero-order kinetic150W zero-order kinetic
(a) 100ndash150 Watt
0
10
20
30
40
50
60
0 5 10 15 20 25 30 35 40
Rem
oval
()
Time (min)
300W-experimental data450W-experimental data600W-experimental data
300W-first-order kinetic450W-first-order kinetic600W-first-order kinetic
(b) 300ndash600 Watt
Figure 4 Comparison between experimental and theoretical removal efficiency on 10mgL phenol at different MW irradiation power (100ndash600W) (symbols experimental results line theoretical results)
0
10
20
30
40
50
60
0 10 20 30 40
Rem
oval
( )
Time (min)
10mgL25mgL50mgL
10mgL first-order kinetic25mgL first-order kinetic50mgL second-order kinetic
Figure 5 Comparison between experimental and theoreticalremoval efficiency of phenol at different initial phenol concentra-tions (10ndash50mgL) (symbols experimental results line theoreticalresults)
by MWH2O2operation The experimental design matrix
derived from CCD and the experimental and predicted per-centage removals of phenol (response) are shown in Table 2A total of 50 experiments were required to calculate twentycoefficients of the quadratic model equation and the per-centage removal of phenol was taken as the response of thesystem From the CCD design the following quadratic equa-tion (7) can be considered as the ultimate model resultingfrom statistical analysis in terms of coded factors for removalefficiency of phenol under MWH
2O2treatment system as
follows
119884MW = minus476478 + 032609119860 + 181231119861
minus 593751 times 10minus4119862 + 671491119863
minus 23867119864 minus 312368 times 10minus41198602
minus 18214 times 10minus31198612minus 109588 times 10
minus61198622
minus 059681198632+ 024163119864
2minus 112134
times 10minus5119860119861 + 128939 times 10
minus6119860119862
minus 4846 times 10minus3119860119863 minus 288442 times 10
minus3119860119864
minus 647831 times 10minus6119861119862 minus 53935
times 10minus3119861119863 minus 838298 times 10
minus4119861119864
+ 531206 times 10minus5119862119863 + 173821
times 10minus4119862119864 + 023244119863119864
(7)
The quality of the models fitted was judged from coeffi-cients of correlation (1198772) Also the validity of the fittedmodelwas evaluated through analysis of variance (ANOVA) andits statistical significance was controlled by 119865-test [38] Theanalysis of variance (ANOVA) for quadraticmodel is given inTable 4
The value of the determination coefficient (1198772) forthe quadratic polynomial model (7) was calculated to be075 This means that approximately 75 of the varianceis attributed to the variables and indicated a moderatesignificance of the model with 25 of the total variations notsatisfactorily explained by the model Confirmation of theadequacy of the regression model was reflected also by thegood agreement between experimental and predicted valuesof response variables as shown in Table 2 which ensures thegood adjustment of the above model to experimental dataWhere the actual removal efficiency ranged from 176 to7031 and its corresponding predicted values are 2709 and6814 respectively ldquoAdeq Precisionrdquo measures the signal tonoise ratio A ratio greater than 4 is desirable The ratio of
International Journal of Microwave Science and Technology 7
Table 3 (a) Kineticmodel parameters for decomposition of 10mgLphenol at different initial MW output powers (Watt) (b) Reactionrate constants (119870) observed on decomposition of phenol withdifferent initial concentrations (119862
0) at 450Watt MW power
(a)
Initial MW output power 100 150 300 450 600Zero-order kinetics1198772 097 097 087 094 0751198701(mgmin) 0065 0065 0099 0119 011411990512
(min) 7657 7657 5035 4219 4401ERRSQ 1212 052 494 1305 3874HYBRID 3376 222 23979 1986 21554
First-order kinetics1198772 096 097 098 098 0971198702(minminus1) 0008 0008 0013 0017 001711990512
(min) 8887 8774 5173 4101 4151ERRSQ 1974 254 433 1052 367HYBRID 52173 821 1745 1467 23252
Second-order kinetics1198772 097 098 099 099 0971198703(mgminus1minminus1) 0001 0001 0002 0003 000311990512
(min) 11111 10000 5263 4000 4000ERRSQ 2840 829 16759 1158 1968HYBRID 71852 2352 61377 1674 97469
Half-life for zero-order 11990512 = [1198620]2119896 first-order 11990512 = ln(2)119896 second-order 11990512 = 1119896[1198620]
(b)
Initial phenol concentrations 10mgL 25mgL 50mgLZero-order kinetics1198772 094 097 0971198701(mgmin) 0119 0314 063311990512
(min) 4219 3983 3948ERRSQ 1305 6698 2725HYBRID 1986 3393 6365
First-order kinetics1198772 098 099 0991198702(minminus1) 0017 0018 001811990512
(min) 4101 3851 3894ERRSQ 1052 4791 2697HYBRID 1467 2555 5698
Second-order kineticsR2 098 099 0991198703(mgminus1sdotminminus1) 0003 0001 0000511990512
(min) 4000 3636 4000ERRSQ 1158 5747 2394HYBRID 1674 2915 3385
Half-life for zero-order 11990512 = [1198620]2119896 first-order 11990512 = ln(2)119896 second-order 11990512 = 1119896[1198620]
8475 indicated an adequate signal This model is reliable andcan be used to navigate the design space
ANOVA analysis (Table 4) indicated that the model isstatistically significant at 95 confidence level (Table 4)
Table 4 ANOVA test for the phenol removal efficiency
Source Sum ofsquares df Mean
square 119865 Value 119875 valueProb gt 119865
Model 556495 20 27825 423 00002119860 034 1 034 5201119864 minus 003 09430119861 110751 1 110751 1684 00003119862 921 1 921 014 07109119863 148381 1 148381 2256 lt00001119864 149865 1 149865 2279 lt000011198602 12219 1 12219 186 018331198612 818 1 818 012 072681198622 761 1 761 012 073621198632 1411 1 1411 021 064661198642 5917 1 5917 090 03507119860119861 091 1 091 0014 09071119860119862 1916 1 1916 029 05935119860119863 6763 1 6763 103 03189119860119864 12129 1 12129 184 01849119861119862 214 1 214 0033 08580119861119863 3724 1 3724 057 04578119861119864 458 1 458 0070 07938119862119863 578 1 578 0088 07690119862119864 31338 1 31338 477 00373119863119864 14003 1 14003 213 01552Residual 190700 29 6576Lack offit 185033 22 8411 1039 00020
Pureerror 5667 7 810
Cor total 747195 491198772= 075 Adeq Precision = 8475
with Fisherrsquos test (119865 value) of 423 and very low probability(119875 value) of 00002 The lack of fit test is performed bycomparing the viability of the current model residuals to thevariability between observations at replicate settings of thefactorsThe lack of fit was statistically significant with 119865 valueof 1039 and 119875 value of 0002 A significant lack of fit suggeststhat there may be some systematic variation unaccountedfor in the hypothesized model [39] This may be due to theexact replicate values of the independent variables in themodel that provide an estimate of pure error Therefore theform of the model was chosen (quadratic model) to explainthe relationship between the studied independent factors andthe response (phenol removal ) was found to satisfactorilyrepresent the present phenol removal process Similar obser-vation was reported by Prasannakumar et al [7]
The empirical predicted quadratic model for response(phenol removal ) in terms of process variables is plottedin three-dimensional (3D) diagrams (Figure 6) to investigatethe interaction among the variables and to determine theoptimum combination of studied parameters for maximumremoval efficiency of phenol from aqueous solution
8 International Journal of Microwave Science and Technology
421 468 515 562 609
3000 3750
4500 5250
6000
100 150
200 250
300
MW power (W)
Time (min)
Phen
ol d
ecom
posit
ion
()
(a)
421 468 515 562 609
300 375
450 525
600
200 400
600 800
1000
MW power (W)
Salinity (mgL)
Phen
ol d
ecom
posit
ion
()
(b)
421 468 515 562 609
300 375
450 525
600
5 6
7 8
9
MW power (W)
pH
Phen
ol d
ecom
posit
ion
()
(c)
421 468 515 562 609
300 375
450 525
600
100 325
550 775
1000
MW power (W) H
2 O2
Phen
ol d
ecom
posit
ion
()
(d)
441 507 573 640 706
500 600
700 800
900
100 325
550 775
1000
pH
H2 O
2
Phen
ol d
ecom
posit
ion
()
(e)
Figure 6 3D surface plot with counterdiagram presenting the effect of output MW power irradiation time salinity pH and initialH2O2dosage (vv) on phenol decomposition efficiency
International Journal of Microwave Science and Technology 9
Figure 6(a) represents the effects of varying initial MWoutput power and irradiation time on removal efficiencyof phenol () at constant salinity 600mgL pH 70 andinitial H
2O2concentration 55 It is obvious that both the
initial MW power and irradiation time have more powerfuleffect on response factor However the removal efficiency ofphenol increases with an increase initialMWpower from 300to 525W and further increase in initial MW power woulddecrease the removal efficiency of phenol Also it can beobserved that there was a region with neither an increasingnor a decreasing trend in response factor This phenomenonconfirms that there was an existence of optimum removalprocess variables to achieve maximum percentage of phenolremoval According to this interaction effects the maximumremoval efficiency of phenol was asymp5776 at initial MWpower asymp450W and asymp20min irradiation time
Figure 6(b) represents the effects of varying initial MWoutput power and salinity at irradiation time 20min pH 7and initial H
2O2concentration 55 It is clearly mentioned
that the effectiveness of MW power was higher than salin-ity for phenol decomposition Although the decompositionpercentage was increased by increasingMWpower howeverMW higher than 450 would reduce the removal efficiency ofphenol
Figure 6(c) illustrates the effect of varying initial MWoutput power and pH on removal efficiency of phenol () atirradiation time 20min initial H
2O2concentration 55 and
salinity 600 (mgL) Both pH and MW power contributed inphenol removal The removal () increased at low pH valuesand MW ranges from 400 to 500
Figure 6(d) shows the effects of varying initial MWoutput power and initial H
2O2concentration on removal
efficiency of phenol () at irradiation time 20min salinity600 (mgL) and pH 7 It is obvious that phenol removal ()was increased by increase of initial H
2O2concentration at
optimum 400ndash500MW powerFigure 6(e) represents the effects of varying pH and initial
H2O2concentration on removal efficiency of phenol () at
irradiation time 20min salinity 600 (mgL) and MW power450 Both pH and hydrogen peroxide have interactive effectson phenol removal () The maximum removal () wasobtained at highest initial H
2O2concentration and lowest pH
valueThese observed positive interactions were further con-
firmed substantiated by analyzing the 119865 statistics and 119875values from Table 4 it was found that the 119860 119861 119862 119863 1198641198602 1198612 1198622 1198632 1198642 and 119860119861 119860119862 119860119863 119860119864 119861119862 119861119863 119861119864 119862119863119862119864 119863119864 terms were of high and moderate significance inexplaining the individual and interaction effects respectivelythat is the large values of 119865 test for all regressions implythat phenol removal efficiency can be adequately explainedby the model equation and the smaller the value of ldquo119875rdquo themore significant the corresponding coefficient term (ie thepattern of interaction among the factors) [40ndash42] Table 4shows that the interaction of initial pH and H
2O2was
significant with 119875 values lt 00001 and was found to besolely responsible for achieving a relatively higher removalpercentage as predicted by the 3D response surface (Figure 6)and this is evident from (7) while negligible effect occurred
703128
571343
439558
307773
175989
minus1000 minus0500 0000 0500 1000
Perturbation
(D)
(D)
(C) (C)(E)
(E)
(A (A))(B)
(B)
Deviation from reference point
Rem
oval
of p
heno
l
Design Expert plotRemoval of phenol
Actual factors
(A) Power = 45000
(B) Time = 2000
(C) Salinity = 60000
(D) pH = 700
(E) H2O2= 550
Figure 7 Perturbation plots showing the optimum values of thetested variables
by changing initial salinity (119862) which was reflected by thecorresponding ldquo119875rdquo value (119875 asymp 071)
The increase in phenol removal efficiency with increase ofhydrogen peroxide concentration may be due to the increaseof HO∙ radicals production from H
2O2due to the excitation
of molecules to higher vibrational and rotational levelsunder microwave electromagnetic irradiation field that leadsaccording to the stated hypothesis to mechanochemical dis-sociation with the formation of hydroxyl radical groups Theformed hydroxyl radical is highly powerful oxidizing agenthaving an oxidation potential of 233V which may undergo avariety of rapid and nonselective reactions with most organicand many inorganic solutes the most important beinghydroxylation and oxidation removal of phenol [7] Thisindicates that the existence of superheated aqueous phasesat MWH
2O2system may lead to phenol pyrolysis which is
important in removal pathways But according to Zalat andElsayed [32] it was believed that phenol removal is not due toselective heat effect only however thermal and nonthermaleffects are responsible for the removal enhancement mecha-nism by MW irradiation
The effect of each factor was further assessed by the use ofperturbation plots (Figure 7) to show the comparative effectsof all independent variables on phenol removal efficiency Inthis study a perturbation curvature confirmed that phenolremoval efficiency was very sensitive to the four variablefactors initial MW power irradiation time initial pH andinitial hydrogen peroxide concentration The comparativelysemiflatsalinity curve shows less sensitivity of phenol removalefficiency towards the salinity Thus the salinity of aqueoussolution with the studied range of experiments has no major
10 International Journal of Microwave Science and Technology
Table 5 Optimum values of the process parameter for maximum phenol decomposition efficiency under MW process
Treatment Process Input power (Watt) Time (min) Salinity (mgL) pH H2O2 () Phenol decomposition Experimental Predicted
MW Process 439 2422 57410 510 1000 7570 7290
function in the removal efficiency of phenol compared to theother four factors
Furthermore the optimization process was carried out todetermine the optimum value of phenol removal efficiencyusing the Design Expert 8017 software Accordingly theoptimum working conditions for maximum phenol removalpercentage under MWH
2O2treatment process were pre-
sented in Table 5 The predicted maximum removal percent-age was asymp7290 at initial MW power of 439W irradiationtime of 2422min solution salinity of 5741mgL initial pHof 50 and initial H
2O2concentration of 10 To support the
optimized data as given by numerical modeling under opti-mized conditions confirmatory experiments were conductedwith parameters as evaluated using the quadratic modeland the experimental phenol removal percentage obtainedwas 7570 (Table 5)The experimental results approximatelyagree with those obtained using response surface analysisconfirming that RSM can be used effectively to optimizeprocess parameters in a complex process using the statisticaldesign of experiments Also it confirmed the good fit of thequadraticmodel to explain the relationship between the stud-ied variable factors and the response (removal efficiency ofphenol) byMWH
2O2treatment process Standard deviation
and percent error were calculated for validation of experi-ments Recording average of asymp198 and 370 respectivelyindicating that process optimization by RSM was able andreliable to optimize phenol removal by MWH
2O2treatment
process
4 Conclusions
The removal efficiency of phenol under MW treatmentprocesses under different operating conditions increases withincreasingMWoutput power and irradiation times Also thephenol removal () at different initial phenol concentrations(10ndash50mgL) was almost unchanged under studied MWtreatment process (ranged from asymp 4943 plusmn 095 to 5229 plusmn040 after 40min) indicating that the removal efficiency ofphenol by MW irradiation was not factor of phenol initialconcentration in the studied range of concentrations
A kinetic study confirmed that the overall phenol removalrate follows zero-order kinetic model at low MW power (100and 150W) and first-order kinetics at higher MW power(300ndash600W) for initial phenol concentrations (10ndash25mgL)However kinetic reaction shifted to second-order kineticmodel for initial phenol concentration of 50mgL at 450WMW power
A combined process of H2O2with MW improves the
removal efficiency of phenol as proved by RSM WhereMWH
2O2system improves the generation of hydroxyl rad-
icals from H2O2due to the excitation of molecules to higher
vibrational and rotational levels Optimization of the process
variables for phenol removal using RSM by employing CCDdesign matrix of experiments was as follows MW poweroutput of 439 Watt irradiation time of 2422min salinityof 57410mgL pH 510 and initial H
2O2concentration of
1000 (vv) with predicted and experimental percentageremoval of phenol of 7290 and 7570 respectively
Finally it can be proposed that MW radiation with H2O2
is an effective treatment method for the removal of phenolfrompetroleum refinery wastewater in a batch system Futurework is recommendable in an attempt to apply this treatmentsystem in a continuous reactor
Abbreviation
AOP Advanced oxidation processMW MicrowaveRSM Response surface methodologyCCD The central composite designW Watt119862119900 Initial phenol concentration (mgL)119862119905 Phenol concentration at any time (mgL)1198772 Correlation coefficient1198701 Zero-order rate constant (mgmin)1198702 First-order rate constant (minminus1)1198703 Second-order rate constant (mgminus1minminus1)
ERRSQ The sum of the squares of errorsHYBRID The hybrid fractional error function119909119894 119909119895 Independent variables
119884 Predicted response
Greek Letters
120572 Variables for the axial points120573119894 Interaction coefficient120573119900 The constant model coefficient
Conflict of Interests
The authors declare that there is no conflict of interestsregarding the publication of this paper
References
[1] B Chen M Yuan and H Liu ldquoRemoval of polycyclic aromatichydrocarbons from aqueous solution using plant residue mate-rials as a biosorbentrdquo Journal of Hazardous Materials vol 188no 1ndash3 pp 436ndash442 2011
[2] T Sasaki and S Tanaka ldquoAdsorption behavior of some aromaticcompounds on hydrophobic magnetite for magnetic separa-tionrdquo Journal of HazardousMaterials vol 196 pp 327ndash334 2011
International Journal of Microwave Science and Technology 11
[3] T P Ryynanen Reduction of waste water loads at petrochemicalplants [MS thesis] Department of Chemical and BiologicalEngineering Division of Chemical Environmental ScienceChalmers University of Technology Goteborg Sweden 2011
[4] S Ishak A Malakahmad and M H Isa ldquoRefinery wastewaterbiological treatment a short reviewrdquo Journal of Scientific andIndustrial Research vol 71 no 4 pp 251ndash256 2012
[5] K F Al-Sultani and F A Al-Seroury ldquoCharacterization theremoval of phenol from aqueous solution in fluidized bedcolumn by rice husk adsorbentrdquo Research Journal of RecentSciences vol 1 no ISC-2011 pp 145ndash151 2012
[6] B Mukhetjee J Turner and B Wrenn ldquoEffect of oil com-position on chemical dispersion of crude oilrdquo EnvironmentalEngineering Science vol 28 no 7 pp 497ndash506 2011
[7] B R Prasannakumar I Regupathi and T Murugesan ldquoAnoptimization study on microwave irradiated decomposition ofphenol in the presence ofH
2O2rdquo Journal of Chemical Technology
and Biotechnology vol 84 no 1 pp 83ndash91 2009[8] S Beszedes Z Laszlo Z H Horvath G Szabo and C Hodur
ldquoComparison of the effects of MW irradiation with differentintensities on the biodegradability of sludge from the dairy-and meat-industryrdquo Bioresource Technology vol 102 pp 814ndash821 2011
[9] W Li Q Zhou and T Hua ldquoRemoval of organic matter fromlandfill leachate by advanced oxidation processes a reviewrdquoInternational Journal of Chemical Engineering vol 2010 ArticleID 270532 10 pages 2010
[10] J P Robinson S W Kingman and O Onobrakpeya ldquoMicro-wave-assisted stripping of oil contaminated drill cuttingsrdquoJournal of Environmental Management vol 88 no 2 pp 211ndash218 2008
[11] L P Yang W Y Hu H M Huang and B Yan ldquoDegradation ofhigh concentration phenol by ozonation in combination withultrasonic irradiationrdquo Desalination and Water Treatment vol21 no 1ndash3 pp 87ndash95 2010
[12] IDManariotisHKKarapanagioti andCVChrysikopoulosldquoDegradation of PAHs by high frequency ultrasoundrdquo WaterResearch vol 45 no 8 pp 2587ndash2594 2011
[13] Y-C Chien ldquoField study of in situ remediation of petroleumhydrocarbon contaminated soil on site using microwaveenergyrdquo Journal of Hazardous Materials vol 199-200 pp 457ndash461 2012
[14] P Klan and V Cirkva ldquoMicrowave photochemistryrdquo in Micro-waves in Organic Synthesis A Loupy Ed Chapter 14 pp 463ndash486 Wiley-VCH 2002
[15] Y F Zhao and J Chen ldquoApplications of microwaves in nuclearchemistry and engineeringrdquo Progress in Nuclear Energy vol 50no 1 pp 1ndash6 2008
[16] Y Y Shu T L Lai H-S Lin T C Yang andC-P Chang ldquoStudyof factors affecting on the extraction efficiency of polycyclicaromatic hydrocarbons from soils using open-vessel focusedmicrowave-assisted extractionrdquoChemosphere vol 52 no 10 pp1667ndash1676 2003
[17] Y Y Shu R C Lao C H Chiu and R Turle ldquoAnalysis ofpolycyclic aromatic hydrocarbons in sediment reference mate-rials by microwave-assisted extractionrdquo Chemosphere vol 41no 11 pp 1709ndash1716 2000
[18] D-H Han S-Y Cha and H-Y Yang ldquoImprovement of oxida-tive decomposition of aqueous phenol bymicrowave irradiationin UVH
2O2process and kinetic studyrdquoWater Research vol 38
no 11 pp 2782ndash2790 2004
[19] J G Mei S M Yu and J Cheng ldquoHeterogeneous catalyticwet peroxide oxidation of phenol over delaminated Fe-Ti-PILCemploying microwave irradiationrdquo Catalysis Communicationsvol 5 no 8 pp 437ndash440 2004
[20] A Zhihui Y Peng and L Xiaohua ldquoDegradation of 4-Chlorophenol by microwave irradiation enhanced advancedoxidation processesrdquo Chemosphere vol 60 no 6 pp 824ndash8272005
[21] M A Aramendıa J C Colmenares S Lopez-Fernandez et alldquoPhotocatalytic degradation of chlorinated pyridines in titaniaaqueous suspensionsrdquo Catalysis Today vol 138 no 1-2 pp 110ndash116 2008
[22] D H Lataye I M Mishra and I D Mall ldquoAdsorption of 2-picoline onto bagasse fly ash from aqueous solutionrdquo ChemicalEngineering Journal vol 138 no 1ndash3 pp 35ndash46 2008
[23] L L Bo M W Li X Quan S Chen D M Xue and C B LildquoTreatment of high concentration organic wastewater bymicro-wave catalysisrdquo in Proceedings of the 3rd International Confer-ence onMicrowave andMillimeterWave Technology ProceedingsBeijing China 2002
[24] D H Bremner R Molina F Martınez J A Melero and YSegura ldquoDegradation of phenolic aqueous solutions by highfrequency sono-Fenton systems (USndashFe
2O3SBA-15ndashH
2O2)rdquo
Applied Catalysis B vol 90 no 3-4 pp 380ndash388 2009[25] M R Doosti R Kargar and M H Sayadi ldquoWater treatment
using ultrasonic assistance a reviewrdquo Proceedings of the Inter-national Academy of Ecology and Environmental Sciences vol 2no 2 pp 96ndash110 2012
[26] YQingshan L Yongjin andM Lingling ldquoKinetics of photocat-alytic degradation of gaseous organic compounds on modifiedTiO2AC composite photocatalystrdquoChinese Journal of Chemical
Engineering vol 20 no 3 pp 572ndash576 2012[27] C Capellos and B H Bielski Kinetic Systems Mathematical
Description of Chemical Kinetics in SolutionWiley-InterscienceNew York NY USA 1972
[28] Y C Wong Y S Szeto W H Cheung and G McKay ldquoAdsorp-tion of acid dyes on chitosanmdashequilibrium isotherm anal-ysesrdquo Process Biochemistry vol 39 no 6 pp 693ndash702 2004
[29] J Y Farah N S El-Gendy and L A Farahat ldquoBiosorption ofAstrazone Blue basic dye from an aqueous solution using driedbiomass of Bakerrsquos yeastrdquo Journal of Hazardous Materials vol148 no 1-2 pp 402ndash408 2007
[30] G Cimino A Passerini and G Toscano ldquoRemoval of toxiccations and Cr(VI) from aqueous solution by hazelnut shellrdquoWater Research vol 34 no 11 pp 2955ndash2962 2000
[31] M Papadaki R J Emery M A Abu-Hassan A Dıaz-BustosI S Metcalfe and D Mantzavinos ldquoSonocatalytic oxidationprocesses for the removal of contaminants containing aromaticrings from aqueous effluentsrdquo Separation and Purification Tech-nology vol 34 no 1ndash3 pp 35ndash42 2004
[32] O A Zalat and M A Elsayed ldquoA study on microwave removalof pyridine from wastewaterrdquo Journal of Environmental Chemi-cal Engineering vol 1 no 3 pp 137ndash143 2013
[33] V L Vaks G A Domrachev Y L Rodygin D A Selivanovskiiand E I Spivak ldquoDissociation ofwater bymicrowave radiationrdquoRadiophysics and Quantum Electronics vol 37 no 1 pp 85ndash881994
[34] P M Robitaille ldquoWater hydrogen bonding and the microwavebackgroundrdquo Progress in Physics vol 2 pp L5ndashL8 2009
[35] X Quan Y Zhang S Chen Y Zhao and F Yang ldquoGenerationof hydroxyl radical in aqueous solution by microwave energy
12 International Journal of Microwave Science and Technology
using activated carbon as catalyst and its potential in removal ofpersistent organic substancesrdquo Journal of Molecular Catalysis AChemical vol 263 no 1-2 pp 216ndash222 2007
[36] D Zhao J Cheng and M R Hoffmann ldquoKinetics of micro-wave-enhanced oxidation of phenol by hydrogen peroxiderdquoFrontiers of Environmental Science and Engineering in Chinavol 5 no 1 pp 57ndash64 2011
[37] D Zhao and K Fei ldquoSynergetic kinetics of phenol degradationinwater by usingmicrowaveH
2O2systemrdquo Journal of Chemical
Industry and Engineering vol 59 no 1 pp 101ndash105 2008[38] A I Khuri and J A Cornell Response Surfaces Design and
Analysis Marcel Dekker New York NY USA 1987[39] J Virkutyte V Vickackaite and A Padarauskas ldquoSono-
oxidation of soils degradation of naphthalene by sono-Fenton-like processrdquo Journal of Soils and Sediments vol 10 no 3 pp526ndash536 2010
[40] M Clarke and R E Kempson Introduction To the Design andAnalysis of Experiments Arnold London UK 1997
[41] K Ravikumar K Pakshirajan T Swaminathan and K BaluldquoOptimization of batch process parameters using responsesurface methodology for dye removal by a novel adsorbentrdquoChemical Engineering Journal vol 105 no 3 pp 131ndash138 2005
[42] R Wachter and A Cordery ldquoResponse surface methodologymodelling of diamond-like carbon film depositionrdquo Carbonvol 37 no 10 pp 1529ndash1537 1999
Submit your manuscripts athttpwwwhindawicom
VLSI Design
Hindawi Publishing Corporationhttpwwwhindawicom Volume 2014
International Journal of
RotatingMachinery
Hindawi Publishing Corporationhttpwwwhindawicom Volume 2014
Hindawi Publishing Corporation httpwwwhindawicom
Journal ofEngineeringVolume 2014
Hindawi Publishing Corporationhttpwwwhindawicom Volume 2014
Shock and Vibration
Hindawi Publishing Corporationhttpwwwhindawicom Volume 2014
Mechanical Engineering
Advances in
Hindawi Publishing Corporationhttpwwwhindawicom Volume 2014
Civil EngineeringAdvances in
Acoustics and VibrationAdvances in
Hindawi Publishing Corporationhttpwwwhindawicom Volume 2014
Hindawi Publishing Corporationhttpwwwhindawicom Volume 2014
Electrical and Computer Engineering
Journal of
Hindawi Publishing Corporationhttpwwwhindawicom Volume 2014
Distributed Sensor Networks
International Journal of
The Scientific World JournalHindawi Publishing Corporation httpwwwhindawicom Volume 2014
SensorsJournal of
Hindawi Publishing Corporationhttpwwwhindawicom Volume 2014
Modelling amp Simulation in EngineeringHindawi Publishing Corporation httpwwwhindawicom Volume 2014
Hindawi Publishing Corporationhttpwwwhindawicom Volume 2014
Active and Passive Electronic Components
Advances inOptoElectronics
Hindawi Publishing Corporation httpwwwhindawicom
Volume 2014
RoboticsJournal of
Hindawi Publishing Corporationhttpwwwhindawicom Volume 2014
Chemical EngineeringInternational Journal of
Hindawi Publishing Corporationhttpwwwhindawicom Volume 2014
Control Scienceand Engineering
Journal of
Hindawi Publishing Corporationhttpwwwhindawicom Volume 2014
Antennas andPropagation
International Journal of
Hindawi Publishing Corporationhttpwwwhindawicom Volume 2014
Hindawi Publishing Corporationhttpwwwhindawicom Volume 2014
Navigation and Observation
International Journal of
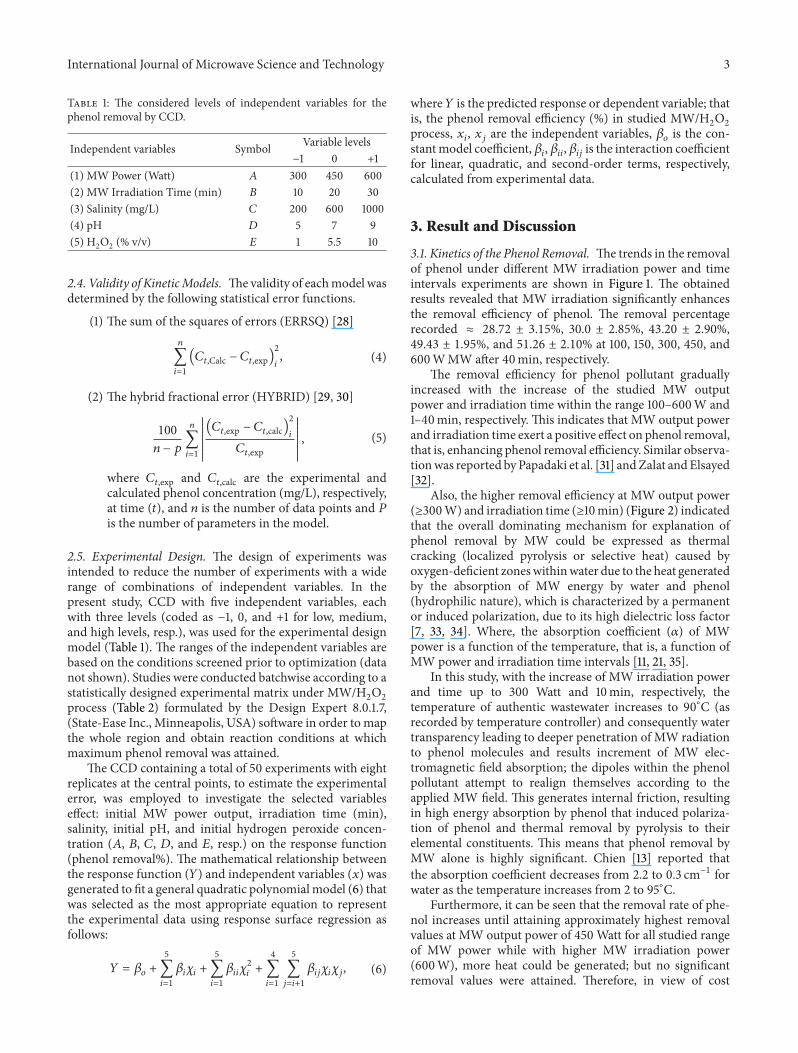