Analysis of tsunami impact scenarios at an oil refinery
22
ORIGINAL PAPER Analysis of tsunami impact scenarios at an oil refinery Ana Maria Cruz • Elisabeth Krausmann • Giovanni Franchello Received: 10 December 2009 / Accepted: 23 October 2010 / Published online: 10 November 2010 Ó Springer Science+Business Media B.V. 2010 Abstract This work analyses the potential consequences of two tsunami scenarios and their impacts on an oil refinery located in Sicily. Two credible tsunamis originating in the Tyrrhenian Sea were selected based on historical data. The potential for damage and hazardous materials releases resulting from the tsunami impacts to a refinery was assessed. The results obtained by the JRC tsunami propagation and inundation code HyFlux2 indicate that in both scenarios there would be eighteen storage tanks (of 43 located within 400 m from the shoreline) at the refinery subject to flooding. Water flow velocities were found to be generally low, \ 1 m/s, except for a central section of the refinery near the shoreline where the water flow velocities reach 3–4 m/s. These results indicate that any damage would most likely occur due to buoyancy loads particularly in the western part of the facility where inundation levels are higher and storage tanks are less protected. Potential damage caused by impact of floating debris may be a problem in the central area of the refinery near the shoreline due to high flow velocities (3–4 m/s) in both tsunami scenarios. Small hazardous materials releases could occur due to breakage of connected pipes and flanges caused by floating off of almost empty storage tanks or other equipment. Salt water intrusion could affect electrical equipment, such as control panels, pumps, and motors that are not raised above the inundation level. We conclude that in the two tsunami scenarios analysed, the risk to nearby residents and neighbouring facilities from potential hazardous materials releases, fires or explosions triggered by the tsunamis is likely to be small. Nonetheless, recommendations are made on prevention measures to reduce the risk of tsunami-triggered accidents and to mitigate their consequences if they do occur. The results of this study are limited by the uncertainty in the input data and most importantly by the accuracy of the elevation data and the model resolution. A. M. Cruz (&) Á E. Krausmann Á G. Franchello European Commission, Joint Research Centre, Institute for the Protection and Security of the Citizen, TP 361, Via E. Fermi, 2749, 21027 Ispra, VA, Italy e-mail: [email protected] A. M. Cruz Natural and Technological (Natech) Disaster Risk Management, 11 rue Jean Mermoz, 33800 Bordeaux, France 123 Nat Hazards (2011) 58:141–162 DOI 10.1007/s11069-010-9655-x
-
Upload
independent -
Category
Documents
-
view
3 -
download
0
Transcript of Analysis of tsunami impact scenarios at an oil refinery
ORI GIN AL PA PER
Analysis of tsunami impact scenarios at an oil refinery
Ana Maria Cruz • Elisabeth Krausmann • Giovanni Franchello
Received: 10 December 2009 / Accepted: 23 October 2010 / Published online: 10 November 2010� Springer Science+Business Media B.V. 2010
Abstract This work analyses the potential consequences of two tsunami scenarios and
their impacts on an oil refinery located in Sicily. Two credible tsunamis originating in the
Tyrrhenian Sea were selected based on historical data. The potential for damage and
hazardous materials releases resulting from the tsunami impacts to a refinery was assessed.
The results obtained by the JRC tsunami propagation and inundation code HyFlux2indicate that in both scenarios there would be eighteen storage tanks (of 43 located within
400 m from the shoreline) at the refinery subject to flooding. Water flow velocities were
found to be generally low, \1 m/s, except for a central section of the refinery near the
shoreline where the water flow velocities reach 3–4 m/s. These results indicate that any
damage would most likely occur due to buoyancy loads particularly in the western part of
the facility where inundation levels are higher and storage tanks are less protected.
Potential damage caused by impact of floating debris may be a problem in the central area
of the refinery near the shoreline due to high flow velocities (3–4 m/s) in both tsunami
scenarios. Small hazardous materials releases could occur due to breakage of connected
pipes and flanges caused by floating off of almost empty storage tanks or other equipment.
Salt water intrusion could affect electrical equipment, such as control panels, pumps, and
motors that are not raised above the inundation level. We conclude that in the two tsunami
scenarios analysed, the risk to nearby residents and neighbouring facilities from potential
hazardous materials releases, fires or explosions triggered by the tsunamis is likely to be
small. Nonetheless, recommendations are made on prevention measures to reduce the risk
of tsunami-triggered accidents and to mitigate their consequences if they do occur. The
results of this study are limited by the uncertainty in the input data and most importantly by
the accuracy of the elevation data and the model resolution.
A. M. Cruz (&) � E. Krausmann � G. FranchelloEuropean Commission, Joint Research Centre, Institute for the Protection and Security of the Citizen,TP 361, Via E. Fermi, 2749, 21027 Ispra, VA, Italye-mail: [email protected]
A. M. CruzNatural and Technological (Natech) Disaster Risk Management, 11 rue Jean Mermoz, 33800Bordeaux, France
123
Nat Hazards (2011) 58:141–162DOI 10.1007/s11069-010-9655-x

Keywords Tsunami � Tsunami propagation and inundation � Risk assessment �Industrial facility � Flooding � Hazardous materials
1 Introduction
Engineered structures in coastal regions exposed to tsunami (or storm-surge) inundation
can be subject to a variety of concomitant damaging phenomena (Rossetto et al. 2007;
Robertson et al. 2007). These include uplifting due to submersion of structures, overturning
and displacement due to wave loading, debris impact, or foundation failure caused by
liquefaction-induced scour in sandy subsurface deposits. The impact of a tsunami on a low-
lying coastal industrial area could therefore result in damage to or collapse of industrial
buildings, tanks and other equipments. If damaged equipment or buildings are used for
storing or processing hazardous materials, these could be accidentally released with
potentially devastating consequences on the population and the environment. Furthermore,
since tsunami inundation could affect a wide swath of land, the risk in densely industri-
alized areas could be elevated.
The oil refinery fires triggered by the 1964 Niigata earthquake and tsunami in Japan
serve as an example of the potentially catastrophic effects of a tsunami when it affects a
large industrial complex located near residential areas. During this event, a 4 m tsunami
was triggered by an Mw = 7.6 magnitude earthquake, which initially caused fires in five
storage tanks and oil spills in hundreds more at two oil refineries in Niigata (Iwabuchi et al.
2006; IRIS SeismoArchives 2010). The tsunami hit the already earthquake-stricken
facilities resulting in:
• additional damage to storage tanks and plant processing equipment by collision with
tsunami-driven objects and by the hydrodynamic forces of the tsunami (Iwabuchi et al.
2006).
• the spreading of leaked oil by the tsunami current into the harbour and on inundated
land (Iwabuchi et al. 2006).
• the spreading of burning crude oil carried by the flood waters causing the fires to extend
to other parts of the plant including the heating furnace, the heat recovery boiler, the
reactor of the catalytic conversion process, the hydrolysis treatment equipment, and the
bottom of the hydrolysis reactor for the desulphurization process (Akatsuka and
Kobayashi 2008).
• the spreading of ignited crude oil carried by the flood waters into residential areas and
the destruction of 286 houses by the fire (Iwabuchi et al. 2006; Akatsuka and
Kobayashi 2008).
Oil and gas spills were also reported following a tsunami triggered by the Kocaeli
earthquake of 17 August 1999 in Turkey (Steinberg and Cruz 2004) and during the recent
Indian Ocean tsunami of 26 December 2004 (Borrero 2005; Van Dijk 2008).
Tsunami and consequent floodwaters can impose different loads on buildings, including
industrial facility buildings and equipment. These include hydrostatic loads, buoyant loads,
hydrodynamic loads, surge loads, breaking wave loads and impact loading, which results
from floating debris (Yeh et al. 2005). Current structural design codes focus on loading due
to riverine floods and storm waves, providing little guidance for loads specifically induced
by tsunami effects on coastal structures (Yeh et al. 2005). In addition, there is little
guidance on how industrial facilities can prevent or mitigate tsunami effects. This is in part
because there is scant empirical data that relate the various damage states of industrial
142 Nat Hazards (2011) 58:141–162
123

equipment versus flood water depths and water flow velocities. Furthermore, although
efforts to assess the vulnerability of buildings to tsunamis exist (e.g., Dall’Osso et al. 2009;
Dominey-Howes and Papathoma 2007), there are no specific methodologies available to
carry out vulnerability and risk assessments of tsunami impact to industrial facilities.
In this work, we analyse the potential consequences of tsunami impact on an industrial
facility that houses and processes hazardous materials. The work was performed under the
European Union’s 6th Framework Programme Project TRANSFER (2010) as part of its
Work Package 8 on scenarios of large tsunami impact and risk assessment and reduction.
This study focused on a case study of tsunami impact on the northern coast of Sicily, which
has been identified as a tsunami-prone region under the TRANSFER project. Two credible
tsunami-source scenarios were selected based on historical data and modelled, and the
potential for damage and hazardous materials releases resulting from the tsunami impacts
to an industrial facility located in this area was assessed. This work presents the results and
analysis of our study and makes recommendations for tsunami risk reduction.
2 Background
A tsunami is a sea wave of local or distant origin that results from large-scale water-body
displacements associated with large earthquakes, major submarine slides, or large volcanic
eruptions. It is characterized as a shallow water wave and differs from wind-generated
waves in its period and wavelength. Local bathymetry, undersea features and the slope at
the beach modify the tsunami as it approaches the shore, and the effects at the shoreline can
change considerably within short distances. See Fig. 1 for a definition of tsunami inun-
dation terms. Generally, run-up heights tend to be greatest near where the offshore
bathymetry is steeper. Furthermore, if a tsunami approaches the coast during astronomical
high tides, the run-up heights may be even greater.
Southern Italy has been (and could be in the future) affected by tsunamis generated both
in the Eastern Mediterranean (e.g., in the Hellenic Arc) and also locally (in the Tyrrhenian
Fig. 1 Definition of tsunami inundation terms (adapted from Anderson 2007)
Nat Hazards (2011) 58:141–162 143
123
and Ionian Seas) (Lorito et al. 2008). Tsunamis in these regions are associated with
earthquakes, volcanic eruptions and landslides (Papadopoulos and Fokaefs 2005).
Although tsunamis originating in the Mediterranean Sea are less frequent than those in the
Pacific or Indian oceans, they have caused extensive damage and loss of life (Lorito et al.
2008). Devastating tsunamis occurred following earthquakes of equivalent Mw = 6.9 and
7.2 in 1783 and 1908, respectively, in the Messina Straits in Southern Italy (Papadopoulos
and Fokaefs 2005; Tinti et al. 2004). The most updated tsunami catalogue for the Italian
region, put together by Tinti et al. (2004), contains data for 67 tsunamis observed in the
Italian seas. More than 50% of these affected Southern Italy.
The northern coast of Sicily, of interest for this study, could be at risk by tsunamis
generated by earthquakes along the southern Tyrrhenian source zone. Lorito et al. (2008)
estimated the average maximum wave height to be around 0.2 m. Waves of 0.5 m and
higher would affect only few localities around the northern coast of Sicily such as Palermo,
Trapani and Milazzo (Lorito et al. 2008). Tsunami waves resulting from volcanic erup-
tions, volcano-associated submarine slides and landslides, and mass failure (submarine and
land slides) have historically affected the coasts of Italy as well. Approximately 18% of the
tsunamis in the updated catalogue of Italian tsunamis (Tinti et al. 2004) are volcano
associated; less than 3% are due to mass failure. One recent example occurred in December
2002 following a phase of explosive activity of the Stromboli volcano. The tsunami was
caused by a massive submarine landslide followed by a sub-aerial landslide from an
elevation of 650 m above sea level on the north-west slope of Stromboli Island (Maramai
et al. 2005). Tsunami waves as high as 8–10 m were recorded in Stromboli, and smaller
waves were observed as far as 170 km at Mondello, northern Sicily and on the island of
Ustica.
3 Methodology and assumptions
3.1 Data and model description
Based on tsunami source data for two credible tsunami scenarios provided by the Uni-
versity of Bologna (Armigliato 2008, personal communication), tsunami flow velocities
and maximum water surface levels along the northern coast of Sicily were simulated using
the JRC code HyFlux2 (Franchello 2008, 2010; Franchello and Krausmann 2008),
developed to simulate severe inundation scenarios due to dam breaks, flash floods and
tsunami-wave run-up.
The code solves the shallow water equations using a finite volume method. The
interface flux is computed by a Flux Vector Splitting method based on a Godunov-type
approach. A second-order scheme is applied to the water surface level and velocity, pro-
viding results with high accuracy (Franchello 2008). Physical models are included to deal
with bottom steps and shorelines. The second-order scheme together with the shoreline-
tracking method makes the model well-balanced with respect to mass and momentum
conservation laws, providing results that are reliable and robust (Franchello 2010).
HyFlux2 was validated on 1D analytical test cases (Franchello 2008), a 2D run-up
numerical case study and finally with the Okushiri tsunami run-up problem (Franchello
2010). A validation with the Malpasset dam-break case study was also carried out
(Franchello and Krausmann 2008).
The numerical model was run in a cascade of nested simulations from coarse to fine grid
size: a grid size of 400 9 400 m in the abyssal plain, 100 9 100 m in the continental
144 Nat Hazards (2011) 58:141–162
123

shelf, a smaller grid size (20 9 20 m) near the shore, and a fine grid size (5 9 5 m) in the
run-up zone. The simulation results with the coarser grid were used as boundary condition
for the simulation with the finer grid.
The two scenarios were (a) an earthquake along the Capo Vaticano fault in Calabria and
(b) a landslide at Stromboli. Source data for both scenarios were provided by the
TRANSFER project partners at University of Bologna and included for scenario (a) the
water surface elevation at 0 s and for scenario (b) the velocity and water surface elevation
fields at 100 s, calculated by a finite element model.
The simulations for both scenarios were run assuming that the waves arrive when the
sea is at the maximum tide level (worst-case scenario). Data collected for the simulations
included digital elevation model (DEM) data at a 100 9 100 m grid size (SRTM DTED,
3 arcseconds), bathymetry data in the far field at a 1,000 9 1,000 m grid size
(SRTM30_plus, 30 arcseconds), and in the near field vector data corresponding to iso-
lines—digitized from a nautical map—for the northern coast of Sicily. Isolines were also
digitized for the specific area where the refinery is located, and then interpolated to a raster
grid, assuming a constant upward slope from the shoreline (0 m) to the railroad tracks that
cross the refinery from west to east. Figure 2 presents a map of the DEM used for the study
region in the near field. The tanks were modelled as bottom steps (see Franchello 2008)
without additional DEM refinement. The hydrostatic and hydrodynamic load exerted by
the wave on the tank wall was evaluated using the expression F/b = � qh (gh ? cDv2),
where F is the force [N], b the obstacle width [m], q the water-debris density [kg/m3], h the
water depth [m], g the acceleration of gravity [m/s2], v the velocity normal to the obstacle
[m/s] and cD a drag coefficient. This load was calculated at each time step, and a maximum
value was determined for each cell of the entire space domain.
Data about the studied refinery, whose name and location are not disclosed to protect its
identity, were obtained from previous work carried out by Giardina (2000) and through
review of safety reports and other pertinent documents. These data were compared with
recent satellite images of the industrial facility obtained from Google Earth. Storage tank
dimensions and maximum storage quantities were estimated based on measurements taken
from the Google Earth satellite image of the refinery using typical height to diameter ratios
for large atmospheric storage tanks, and assuming tanks were filled to 75% capacity
Fig. 2 Map of DEM data (in metres) for the study region (total map width = 2,315 m). Dots show thelocation of storage tanks. The tank walls were modelled as bottom steps
Nat Hazards (2011) 58:141–162 145
123
(Austin 1988; Sinnott 1989). The refinery’s official website was also reviewed. Data on
total number of storage tanks and quantity of chemicals stored and processed reported on
the refinery’s website were used to check the accuracy of the estimated tank dimensions.
The weight of each tank was estimated to determine buoyancy of empty tanks subjected
to flooding. In general, weight loads considered for design purposes include vessel shell,
vessel fittings (e.g., manways and nozzles), internal fittings (e.g., plates, heating and
cooling coils), external fittings (e.g., ladders, platforms), auxiliary equipment, which is not
self-supported (e.g., condensers, agitators), insulation and the weight of the liquid to fill the
vessel (Sinnott 1989). In this particular case, we were interested in the total weight of the
shell and fittings excluding the contents. A more detailed discussion on the method used to
estimate the tank shell thickness and tank weight is presented in Cruz et al. (2009). In
general, when refinery specific data were not available, typical generic data for this type of
facility were used for the calculations.
A field visit was carried out in order to collect data on altitudes (elevation above sea
level) and latitude/longitude coordinates at various reference points to compare and vali-
date topographic (DEM) data used for the tsunami inundation modelling. Furthermore,
features that might influence tsunami wave propagation and inundation were documented.
The field visit included data collection offsite as the refinery did not grant an on-site visit.
3.2 Study limitations
The study has a number of limitations, which are due to the assumptions made and the
uncertainties in the input data. The most important limitation concerns the accuracy of the
bathymetry and DEM data used in the simulations. As was discussed in Sect. 3.1, the DEM
was obtained by digitizing a nautical map. Thus, uncertainty results in the modelled
tsunami maximum water surface levels. The present study could be improved by using a
more accurate bathymetry and topography at the refinery as well as data concerning
containment walls, building structures and other plant features, and re-running the simu-
lation model with the 20 9 20 m and 5 9 5 m grid size DEM. Even very small changes in
local bathymetry and the slope at the beach can result in very different effects at the
shoreline within short distances. These inaccuracies will undoubtedly introduce an error in
the estimation of tsunami loads that depend on the maximum water surface levels and
velocity estimated at each tank.
The source data for the tsunami simulations provided by the University of Bologna are
based on simulations using historical data. While these results are certainly subject to
parameter and modelling uncertainties, we assume them to be negligible with respect to the
above-mentioned DEM uncertainty. The uncertainty in the model used for simulating the
tsunami propagation and inundation derives from the fact that HyFlux2 is a 2D model, and
it is therefore unable to capture 3D wave effects, such as turbulence and wave breakdown
on the shore. However, the model was tested validated against experimental tsunami wave
run-up output showing satisfactory results (Franchello 2010). Recently, the code was
assessed with respect to the 29 September 2009 Samoa tsunami (Annunziato et al. 2009),
showing good agreement with DART buoys and tide gauge measurements, and preliminary
results suggest that the model indicates inundation in areas where inundation was observed.
Finally, there is uncertainty in the present study concerning the exposed elements
(location, dimensions, distances, etc.) at the refinery such as storage tanks, pipes, pro-
cessing equipment, building structures and other plant features. An updated floor plan of
the refinery including accurate DEM data at each tank and major process equipment would
provide more reliable results on the vulnerability assessment.
146 Nat Hazards (2011) 58:141–162
123
4 Scenario development and analysis
4.1 Description of the oil refinery
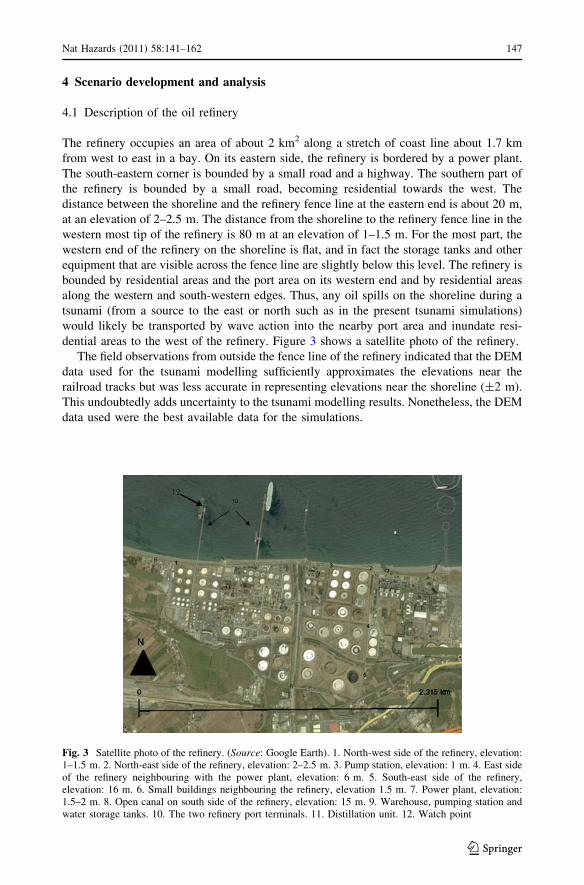
The refinery occupies an area of about 2 km2 along a stretch of coast line about 1.7 km
from west to east in a bay. On its eastern side, the refinery is bordered by a power plant.
The south-eastern corner is bounded by a small road and a highway. The southern part of
the refinery is bounded by a small road, becoming residential towards the west. The
distance between the shoreline and the refinery fence line at the eastern end is about 20 m,
at an elevation of 2–2.5 m. The distance from the shoreline to the refinery fence line in the
western most tip of the refinery is 80 m at an elevation of 1–1.5 m. For the most part, the
western end of the refinery on the shoreline is flat, and in fact the storage tanks and other
equipment that are visible across the fence line are slightly below this level. The refinery is
bounded by residential areas and the port area on its western end and by residential areas
along the western and south-western edges. Thus, any oil spills on the shoreline during a
tsunami (from a source to the east or north such as in the present tsunami simulations)
would likely be transported by wave action into the nearby port area and inundate resi-
dential areas to the west of the refinery. Figure 3 shows a satellite photo of the refinery.
The field observations from outside the fence line of the refinery indicated that the DEM
data used for the tsunami modelling sufficiently approximates the elevations near the
railroad tracks but was less accurate in representing elevations near the shoreline (±2 m).
This undoubtedly adds uncertainty to the tsunami modelling results. Nonetheless, the DEM
data used were the best available data for the simulations.
Fig. 3 Satellite photo of the refinery. (Source: Google Earth). 1. North-west side of the refinery, elevation:1–1.5 m. 2. North-east side of the refinery, elevation: 2–2.5 m. 3. Pump station, elevation: 1 m. 4. East sideof the refinery neighbouring with the power plant, elevation: 6 m. 5. South-east side of the refinery,elevation: 16 m. 6. Small buildings neighbouring the refinery, elevation 1.5 m. 7. Power plant, elevation:1.5–2 m. 8. Open canal on south side of the refinery, elevation: 15 m. 9. Warehouse, pumping station andwater storage tanks. 10. The two refinery port terminals. 11. Distillation unit. 12. Watch point
Nat Hazards (2011) 58:141–162 147
123
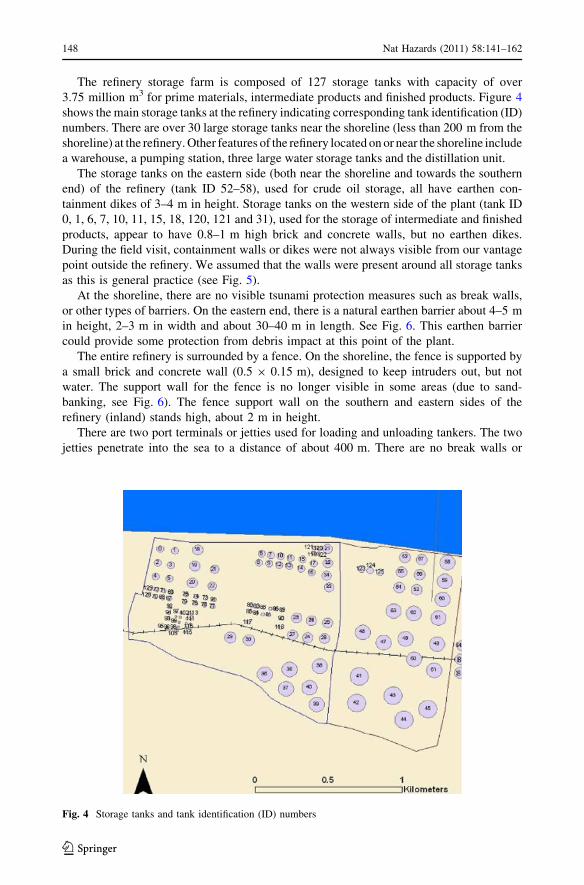
The refinery storage farm is composed of 127 storage tanks with capacity of over
3.75 million m3 for prime materials, intermediate products and finished products. Figure 4
shows the main storage tanks at the refinery indicating corresponding tank identification (ID)
numbers. There are over 30 large storage tanks near the shoreline (less than 200 m from the
shoreline) at the refinery. Other features of the refinery located on or near the shoreline include
a warehouse, a pumping station, three large water storage tanks and the distillation unit.
The storage tanks on the eastern side (both near the shoreline and towards the southern
end) of the refinery (tank ID 52–58), used for crude oil storage, all have earthen con-
tainment dikes of 3–4 m in height. Storage tanks on the western side of the plant (tank ID
0, 1, 6, 7, 10, 11, 15, 18, 120, 121 and 31), used for the storage of intermediate and finished
products, appear to have 0.8–1 m high brick and concrete walls, but no earthen dikes.
During the field visit, containment walls or dikes were not always visible from our vantage
point outside the refinery. We assumed that the walls were present around all storage tanks
as this is general practice (see Fig. 5).
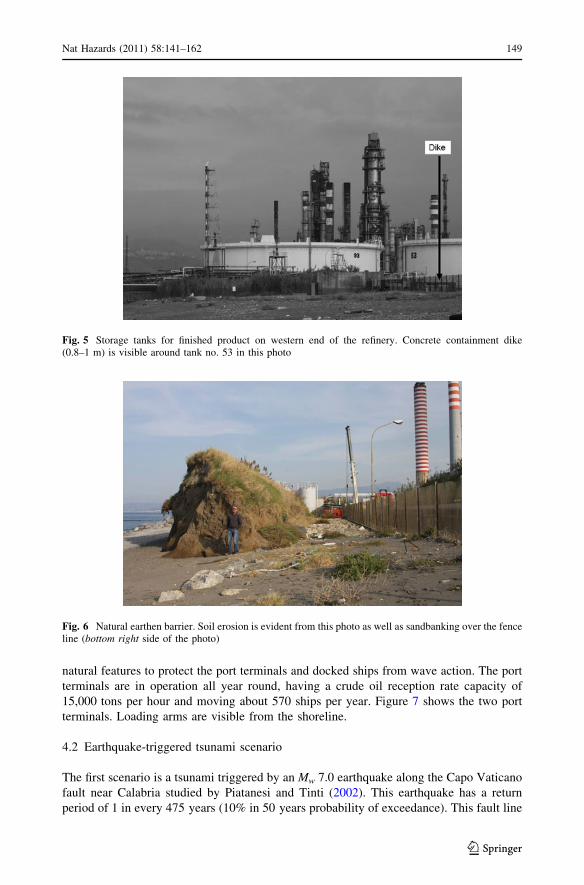
At the shoreline, there are no visible tsunami protection measures such as break walls,
or other types of barriers. On the eastern end, there is a natural earthen barrier about 4–5 m
in height, 2–3 m in width and about 30–40 m in length. See Fig. 6. This earthen barrier
could provide some protection from debris impact at this point of the plant.
The entire refinery is surrounded by a fence. On the shoreline, the fence is supported by
a small brick and concrete wall (0.5 9 0.15 m), designed to keep intruders out, but not
water. The support wall for the fence is no longer visible in some areas (due to sand-
banking, see Fig. 6). The fence support wall on the southern and eastern sides of the
refinery (inland) stands high, about 2 m in height.
There are two port terminals or jetties used for loading and unloading tankers. The two
jetties penetrate into the sea to a distance of about 400 m. There are no break walls or
Fig. 4 Storage tanks and tank identification (ID) numbers
148 Nat Hazards (2011) 58:141–162
123
natural features to protect the port terminals and docked ships from wave action. The port
terminals are in operation all year round, having a crude oil reception rate capacity of
15,000 tons per hour and moving about 570 ships per year. Figure 7 shows the two port
terminals. Loading arms are visible from the shoreline.
4.2 Earthquake-triggered tsunami scenario
The first scenario is a tsunami triggered by an Mw 7.0 earthquake along the Capo Vaticano
fault near Calabria studied by Piatanesi and Tinti (2002). This earthquake has a return
period of 1 in every 475 years (10% in 50 years probability of exceedance). This fault line
Fig. 5 Storage tanks for finished product on western end of the refinery. Concrete containment dike(0.8–1 m) is visible around tank no. 53 in this photo
Fig. 6 Natural earthen barrier. Soil erosion is evident from this photo as well as sandbanking over the fenceline (bottom right side of the photo)
Nat Hazards (2011) 58:141–162 149
123

is believed to be the source of an earthquake and tsunami in Calabria on 8 September 1905,
which devastated many towns and villages and resulted in more than 500 victims. The
tsunami source conditions were provided in the form of an ANSI file containing data on
longitude, latitude and wave amplitude in metres (Armigliato 2008, personal communi-
cation). The wave amplitudes were input into the HyFlux2 model as initial conditions for
the tsunami propagation and run-up simulation. Figure 8 shows the initial conditions
for this tsunami scenario.
Although the Capo Vaticano fault is about 75 km from the area of interest, the earth-
quake would be felt in the north-eastern part of Sicily. Modified Mercalli Intensity (MMI)
values in this area for the earthquake were estimated at IV-IIV (Guidoboni et al. 2007)
based on historical records of the 8 September 1905 earthquake. Previous earthquake
experience shows that the likelihood of moderate damage (e.g., failure of some connected
Fig. 7 Loading arms are visible in this photograph at the port terminals of the refinery
Fig. 8 Initial conditions of theearthquake-triggered tsunamialong the Capo Vaticano fault(Armigliato 2008, personalcommunication)
150 Nat Hazards (2011) 58:141–162
123
pipes, repairable damage to tank support systems, moderate likelihood of release of tank
contents) at these MMI levels would be less than 5% (Seligson et al. 1996). Thus, the
facility would most likely experience no damage or just light damage such as slight
movement of tanks from tank supports due to the earthquake forces. No hazardous
materials releases would be expected due to the earthquake shaking.
The results of our tsunami propagation modelling show that the earthquake would
produce a large tsunami wave, which would propagate across the south-eastern Tyrrhenian
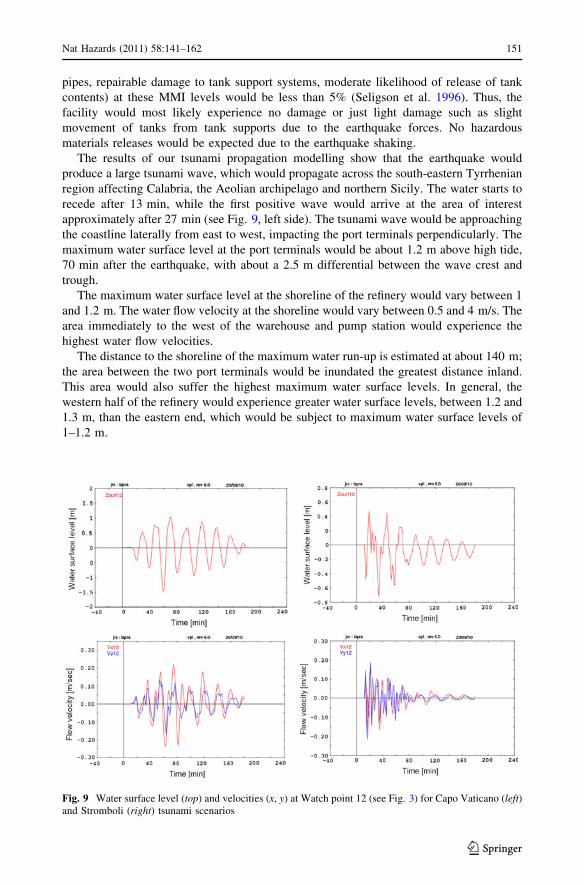
region affecting Calabria, the Aeolian archipelago and northern Sicily. The water starts to
recede after 13 min, while the first positive wave would arrive at the area of interest
approximately after 27 min (see Fig. 9, left side). The tsunami wave would be approaching
the coastline laterally from east to west, impacting the port terminals perpendicularly. The
maximum water surface level at the port terminals would be about 1.2 m above high tide,
70 min after the earthquake, with about a 2.5 m differential between the wave crest and
trough.
The maximum water surface level at the shoreline of the refinery would vary between 1
and 1.2 m. The water flow velocity at the shoreline would vary between 0.5 and 4 m/s. The
area immediately to the west of the warehouse and pump station would experience the
highest water flow velocities.
The distance to the shoreline of the maximum water run-up is estimated at about 140 m;
the area between the two port terminals would be inundated the greatest distance inland.
This area would also suffer the highest maximum water surface levels. In general, the
western half of the refinery would experience greater water surface levels, between 1.2 and
1.3 m, than the eastern end, which would be subject to maximum water surface levels of
1–1.2 m.
Fig. 9 Water surface level (top) and velocities (x, y) at Watch point 12 (see Fig. 3) for Capo Vaticano (left)and Stromboli (right) tsunami scenarios
Nat Hazards (2011) 58:141–162 151
123
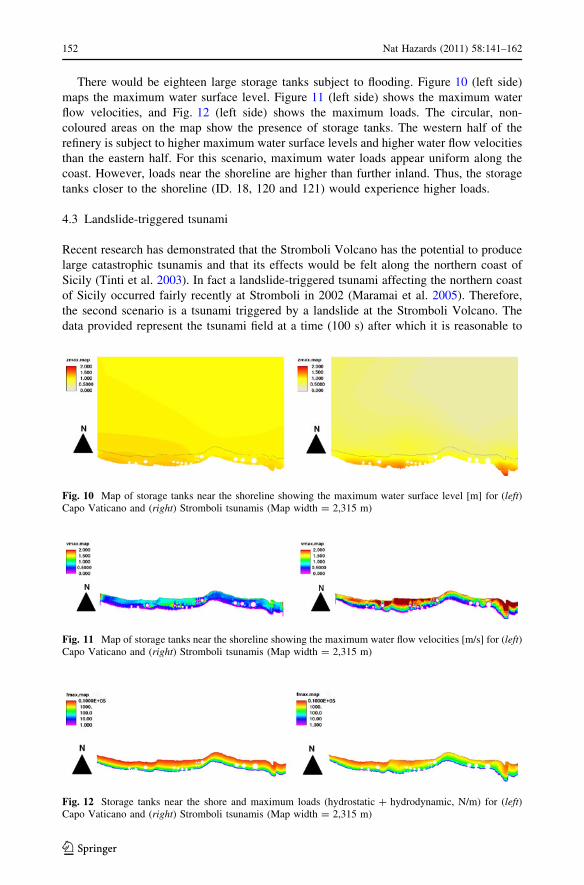
There would be eighteen large storage tanks subject to flooding. Figure 10 (left side)
maps the maximum water surface level. Figure 11 (left side) shows the maximum water
flow velocities, and Fig. 12 (left side) shows the maximum loads. The circular, non-
coloured areas on the map show the presence of storage tanks. The western half of the
refinery is subject to higher maximum water surface levels and higher water flow velocities
than the eastern half. For this scenario, maximum water loads appear uniform along the
coast. However, loads near the shoreline are higher than further inland. Thus, the storage
tanks closer to the shoreline (ID. 18, 120 and 121) would experience higher loads.
4.3 Landslide-triggered tsunami
Recent research has demonstrated that the Stromboli Volcano has the potential to produce
large catastrophic tsunamis and that its effects would be felt along the northern coast of
Sicily (Tinti et al. 2003). In fact a landslide-triggered tsunami affecting the northern coast
of Sicily occurred fairly recently at Stromboli in 2002 (Maramai et al. 2005). Therefore,
the second scenario is a tsunami triggered by a landslide at the Stromboli Volcano. The
data provided represent the tsunami field at a time (100 s) after which it is reasonable to
Fig. 10 Map of storage tanks near the shoreline showing the maximum water surface level [m] for (left)Capo Vaticano and (right) Stromboli tsunamis (Map width = 2,315 m)
Fig. 11 Map of storage tanks near the shoreline showing the maximum water flow velocities [m/s] for (left)Capo Vaticano and (right) Stromboli tsunamis (Map width = 2,315 m)
Fig. 12 Storage tanks near the shore and maximum loads (hydrostatic ? hydrodynamic, N/m) for (left)Capo Vaticano and (right) Stromboli tsunamis (Map width = 2,315 m)
152 Nat Hazards (2011) 58:141–162
123
assume that the forcing due to the landslide is over and that what remains is the pure
tsunami propagation (Armigliato 2008, personal communication). The wave amplitude and
velocity components for the second scenario were then input into the HyFlux2 model for
the tsunami propagation and run-up simulations. Note that for the landslide scenario not
only the wave amplitude but also the velocity components were input to the model.
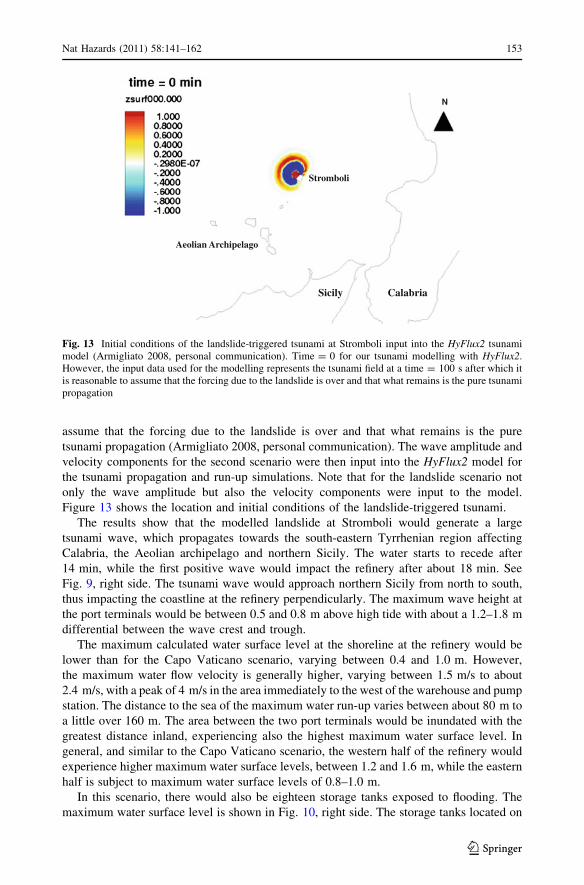
Figure 13 shows the location and initial conditions of the landslide-triggered tsunami.
The results show that the modelled landslide at Stromboli would generate a large
tsunami wave, which propagates towards the south-eastern Tyrrhenian region affecting
Calabria, the Aeolian archipelago and northern Sicily. The water starts to recede after
14 min, while the first positive wave would impact the refinery after about 18 min. See
Fig. 9, right side. The tsunami wave would approach northern Sicily from north to south,
thus impacting the coastline at the refinery perpendicularly. The maximum wave height at
the port terminals would be between 0.5 and 0.8 m above high tide with about a 1.2–1.8 m
differential between the wave crest and trough.
The maximum calculated water surface level at the shoreline at the refinery would be
lower than for the Capo Vaticano scenario, varying between 0.4 and 1.0 m. However,
the maximum water flow velocity is generally higher, varying between 1.5 m/s to about
2.4 m/s, with a peak of 4 m/s in the area immediately to the west of the warehouse and pump
station. The distance to the sea of the maximum water run-up varies between about 80 m to
a little over 160 m. The area between the two port terminals would be inundated with the
greatest distance inland, experiencing also the highest maximum water surface level. In
general, and similar to the Capo Vaticano scenario, the western half of the refinery would
experience higher maximum water surface levels, between 1.2 and 1.6 m, while the eastern
half is subject to maximum water surface levels of 0.8–1.0 m.
In this scenario, there would also be eighteen storage tanks exposed to flooding. The
maximum water surface level is shown in Fig. 10, right side. The storage tanks located on
Calabria
Aeolian Archipelago
Stromboli
Sicily
N
Fig. 13 Initial conditions of the landslide-triggered tsunami at Stromboli input into the HyFlux2 tsunamimodel (Armigliato 2008, personal communication). Time = 0 for our tsunami modelling with HyFlux2.However, the input data used for the modelling represents the tsunami field at a time = 100 s after which itis reasonable to assume that the forcing due to the landslide is over and that what remains is the pure tsunamipropagation
Nat Hazards (2011) 58:141–162 153
123
the western half of the refinery, particularly the area between the two port terminals is
subject to a higher maximum water surface level. The area beyond the eastern side of the
refinery, where the power plant begins, would be subject to a maximum water surface level
of 1.4 m.
Figure 11 (right side) shows the maximum water flow velocities. The areas subject to
the highest maximum water surface levels are also subject to the highest water flow
velocities, as in the Capo Vaticano tsunami scenario. However, in this case, the highest
water loads (hydrostatic ? hydrodynamic) are not evenly distributed, but would be higher
in the western half of the refinery and the eastern end beyond the refinery fence line. See
Fig. 12, right side.
5 Discussion
In these two hypothetical, but credible, tsunami scenarios, there could be up to 18 storage
tanks affected by flooding. Both tsunami scenarios are consistent in that they indicate
higher exposure to flooding of the western half of the refinery, and in particular, the area
between the two port terminals. Overall, the Stromboli tsunami produces slightly higher
water flow velocities, while the Capo Vaticano tsunami results in greater water depths at
the exposed tanks.
In order to understand the potential impact of the modelled tsunami scenarios at the
refinery, the vulnerability of the exposed equipment needs to be assessed. However, there
are only scarce simplified equipment damage models available in the literature to assess
damage probabilities of industrial equipment due to tsunami impact or flooding.
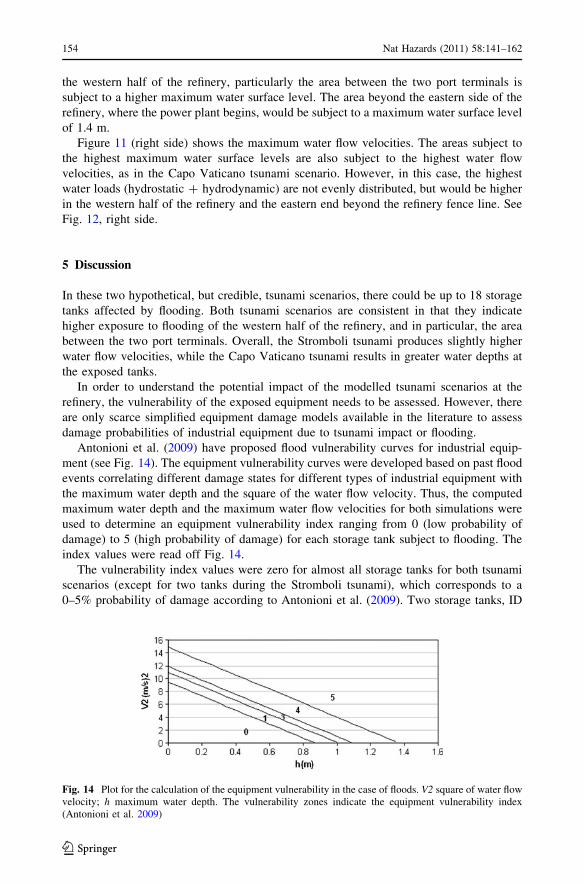
Antonioni et al. (2009) have proposed flood vulnerability curves for industrial equip-
ment (see Fig. 14). The equipment vulnerability curves were developed based on past flood
events correlating different damage states for different types of industrial equipment with
the maximum water depth and the square of the water flow velocity. Thus, the computed
maximum water depth and the maximum water flow velocities for both simulations were
used to determine an equipment vulnerability index ranging from 0 (low probability of
damage) to 5 (high probability of damage) for each storage tank subject to flooding. The
index values were read off Fig. 14.
The vulnerability index values were zero for almost all storage tanks for both tsunami
scenarios (except for two tanks during the Stromboli tsunami), which corresponds to a
0–5% probability of damage according to Antonioni et al. (2009). Two storage tanks, ID
Fig. 14 Plot for the calculation of the equipment vulnerability in the case of floods. V2 square of water flowvelocity; h maximum water depth. The vulnerability zones indicate the equipment vulnerability index(Antonioni et al. 2009)
154 Nat Hazards (2011) 58:141–162
123
120 and 121, which are located to the west of the centre of the refinery near the shoreline,
had index values of 1 for the Stromboli tsunami, which translates to a probability of
damage higher than 5%. Because the equipment vulnerability curves in Fig. 14 were
developed based on limited empirical data (mostly from riverine and hurricane related
flood events), the values computed in the study provide only an indication of potential
consequences and should not be considered definitive.
Water flow velocities are generally small for the Capo Vaticano scenario, but may reach
values of 1 m/s or higher at some tanks for the Stromboli tsunami. Under slow submersion
(water flow velocities \1 m/s), damage would be restricted to failure of flanges and
connections mostly due to floating off of unanchored empty or almost empty storage tanks
and attached appurtenances and pipes.
Antonioni et al. (2009) identified three damage threshold limit values for structural
damage with loss of containment and with consequent release of hazardous materials: (a)
high water level condition: water level, h [ 1 m and minimum velocity required:
v = 0.25 m/s; (b) high water flow condition: v [ 2 m/s and water level, h = 0.5 m; and
(c) high risk condition: water flow velocity, v C 1 m/s, and water level, h C 1 m. Thus,
under high water level conditions and low water velocity, buoyant loads are mostly
responsible for any damage and resultant releases of hazardous materials.
The forces exerted on each tank by the flood waters and the resulting buoyant force
were estimated for each tank assuming that the flood waters had overtopped existing
concrete or earthen containment walls around tanks.1 While these barriers serve the pur-
pose of retaining accidental releases from the tanks, they have not been designed to keep
flood waters out. However, it could be assumed that they would provide some level of
flood protection to the individual tanks as long as the walls are not damaged or overtopped.
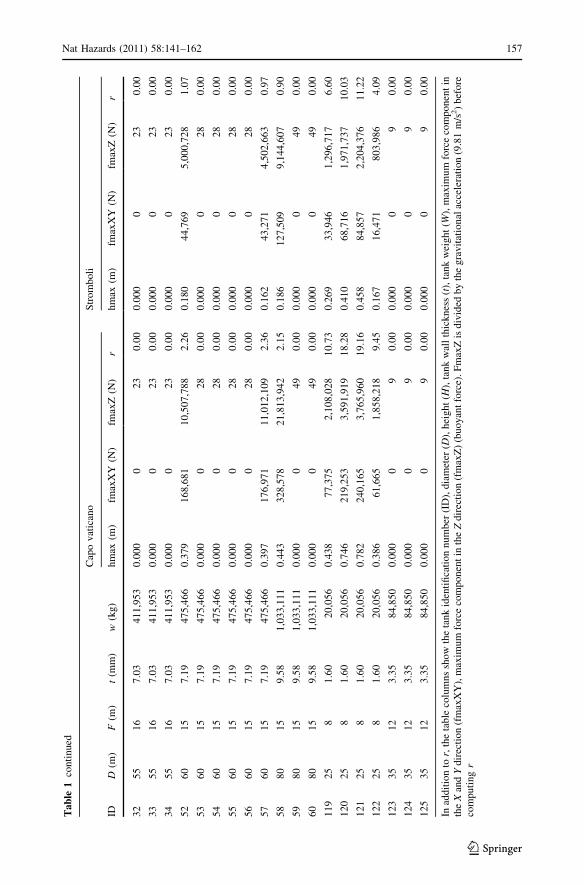
The ratio, r, of the buoyant force to the weight of the tank was calculated for both
tsunami scenarios for all storage tanks subject to flooding. The results are shown in
Table 1. Empty (or almost empty) storage tanks with an r [ 1 could float off if not
properly anchored and suffer damage. There would be 14 storage tanks in the Capo
Vaticano scenario and 13 storage tanks in the Stromboli scenario with r [ 1. These storage
tanks are located near the shoreline just to the west of the centre of the refinery protected
by low concrete walls and they could float off if the walls are overtopped by the flood
waters. In both scenarios, buoyancy loads could also affect low-lying pipes, particularly
those located at the pump station and that are 10–20 m from the shoreline where water
depths are greater than 1 m and are not protected by containment dikes or walls. Floating
off of pipes could result in pipe breaks and consequent releases of hazardous materials if
these are in operation or if they have not been properly de-inventoried before the tsunami.
The flood waters run inland as far as 140 m in both scenarios. Inundation in this area is
likely to result in salt water intrusion on low-lying equipment such as pumps and motors,
electrical panels and electronic control equipment, particularly at and near the pump station
and warehouse, as well as at the western half of the refinery where water depths are greater.
Damage to electric and/or electronic control equipment could result in process upsets and
possible accidental releases of hazardous materials. The inundation may also overcome the
internal plant drainage system, possibly causing waste oil to be lifted by the floodwaters,
which may spark fires and explosions upon contact with an ignition source (e.g., hot
refinery parts).
1 The containment wall around the tank and other equipment was not modelled. As mentioned above, thetopography is considered smooth due to the linear interpolation of isolines with the exception of the tankwalls, which were modelled as bottom steps.
Nat Hazards (2011) 58:141–162 155
123

Tab
le1
Rat
io(r
)o
fb
uo
yan
tfo
rce
tow
eig
ht
of
emp
tyst
ora
ge
tan
kin
dic
atin
gb
uo
yan
cyo
fem
pty
tan
ks
for
the
Cap
oV
atic
ano
and
Str
om
bo
lits
un
amis
Cap
ov
atic
ano
Str
om
bo
li
IDD
(m)
F(m
)t
(mm
)w
(kg)
hm
ax(m
)fm
axX
Y(N
)fm
axZ
(N)
rhm
ax(m
)fm
axX
Y(N
)fm
axZ
(N)
r
04
01
54
.79
1,6
43
,359
0.1
73
37
,69
12
,13
4,8
85
1.3
30
.191
37
,69
12
,348
,40
71
.46
14
01
54
.79
16
4,3
59
0.1
18
18
,38
81
,45
7,0
25
0.9
00
.166
31
,42
72
,042
,66
41
.27
24
01
54
.79
16
4,3
59
0.0
00
01
20
.00
0.0
00
01
20
.00
34
01
54
.79
16
4,3
59
0.0
00
01
20
.00
0.0
00
01
20
.00
44
01
54
.79
16
4,3
59
0.0
00
01
20
.00
0.0
00
01
20
.00
54
01
54
.79
16
4,3
59
0.0
00
01
20
.00
0.0
00
01
20
.00
64
01
54
.79
16
4,3
59
0.4
39
12
5,3
31
5,4
04
,784
3.3
60
.346
86
,86
04
,263
,87
82
.65
74
01
54
.79
16
4,3
59
0.3
45
81
,53
74
,24
6,2
95
2.6
40
.305
71
,62
83
,756
,73
62
.33
84
01
54
.79
16
4,3
59
0.0
14
63
51
69
,14
60
.11
0.0
34
4,5
89
41
5,3
76
0.2
6
94
01
54
.79
16
4,3
59
0.0
23
1,5
85
27
8,3
09
0.1
70
.023
2,1
33
28
7,7
91
0.1
8
10
40
15
4.7
91
64
,35
90
.187
33
,91
92
,30
2,7
47
1.4
30
.205
37
,15
32
,526
,44
31
.57
11
40
15
4.7
91
64
,35
90
.166
29
,22
92
,03
9,9
80
1.2
70
.166
27
,16
52
,047
,40
31
.27
12
40
15
4.7
91
64
,35
90
.000
01
20
.00
0.0
00
01
20
.00
13
40
15
4.7
91
64
,35
90
.000
01
20
.00
0.0
00
01
20
.00
14
40
15
4.7
91
64
,35
90
.000
01
20
.00
0.0
00
01
20
.00
15
40
15
4.7
91
64
,35
90
.060
6,5
20
73
5,2
96
0.4
60
.075
8,5
31
92
5,3
06
0.5
7
16
40
15
4.7
91
64
,35
90
.000
01
20
.00
0.0
00
01
20
.00
17
40
15
4.7
91
64
,35
90
.000
01
20
.00
0.0
00
01
20
.00
18
55
16
7.0
34
11
,95
30
.503
25
5,3
56
11
,72
6,2
38
2.9
00
.403
18
0,1
64
9,3
96
,13
12
.33
19
55
16
7.0
34
11
,95
30
.000
02
30
.00
0.0
00
02
30
.00
20
55
16
7.0
34
11
,95
30
.000
02
30
.00
0.0
00
02
30
.00
21
45
17
6.1
12
66
,06
30
.000
01
60
.00
0.0
00
01
60
.00
22
45
17
6.1
12
66
,06
30
.000
01
60
.00
0.0
00
01
60
.00
31
55
16
7.0
34
11
,95
30
.626
36
7,3
27
14
,59
0,5
28
3.6
10
.327
10
4,1
22
7,6
17
,76
91
.89
156 Nat Hazards (2011) 58:141–162
123
Tab
le1
con
tin
ued
Cap
ov
atic
ano
Str
om
bo
li
IDD
(m)
F(m
)t
(mm
)w
(kg)
hm
ax(m
)fm
axX
Y(N
)fm
axZ
(N)
rhm
ax(m
)fm
axX
Y(N
)fm
axZ
(N)
r
32
55
16
7.0
34
11
,95
30
.000
02
30
.00
0.0
00
02
30
.00
33
55
16
7.0
34
11
,95
30
.000
02
30
.00
0.0
00
02
30
.00
34
55
16
7.0
34
11
,95
30
.000
02
30
.00
0.0
00
02
30
.00
52
60
15
7.1
94
75
,46
60
.379
16
8,6
81
10
,50
7,7
88
2.2
60
.180
44
,76
95
,000
,72
81
.07
53
60
15
7.1
94
75
,46
60
.000
02
80
.00
0.0
00
02
80
.00
54
60
15
7.1
94
75
,46
60
.000
02
80
.00
0.0
00
02
80
.00
55
60
15
7.1
94
75
,46
60
.000
02
80
.00
0.0
00
02
80
.00
56
60
15
7.1
94
75
,46
60
.000
02
80
.00
0.0
00
02
80
.00
57
60
15
7.1
94
75
,46
60
.397
17
6,9
71
11
,01
2,1
09
2.3
60
.162
43
,27
14
,502
,66
30
.97
58
80
15
9.5
81
,03
3,1
11
0.4
43
32
8,5
78
21
,81
3,9
42
2.1
50
.186
12
7,5
09
9,1
44
,60
70
.90
59
80
15
9.5
81
,03
3,1
11
0.0
00
04
90
.00
0.0
00
04
90
.00
60
80
15
9.5
81
,03
3,1
11
0.0
00
04
90
.00
0.0
00
04
90
.00
11
92
58
1.6
02
0,0
56
0.4
38
77
,37
52
,10
8,0
28
10
.73
0.2
69
33
,94
61
,296
,71
76
.60
12
02
58
1.6
02
0,0
56
0.7
46
21
9,2
53
3,5
91
,919
18
.28
0.4
10
68
,71
61
,971
,73
71
0.0
3
12
12
58
1.6
02
0,0
56
0.7
82
24
0,1
65
3,7
65
,960
19
.16
0.4
58
84
,85
72
,204
,37
61
1.2
2
12
22
58
1.6
02
0,0
56
0.3
86
61
,66
51
,85
8,2
18
9.4
50
.167
16
,47
18
03
,98
64
.09
12
33
51
23
.35
84
,85
00
.000
09
0.0
00
.000
09
0.0
0
12
43
51
23
.35
84
,85
00
.000
09
0.0
00
.000
09
0.0
0
12
53
51
23
.35
84
,85
00
.000
09
0.0
00
.000
09
0.0
0
Inad
dit
ion
tor,
the
tab
leco
lum
ns
sho
wth
eta
nk
iden
tifi
cati
on
nu
mb
er(I
D),
dia
met
er(D
),h
eigh
t(H
),ta
nk
wal
lth
icknes
s(t
),ta
nk
wei
gh
t(W
),m
axim
um
forc
eco
mp
on
ent
inth
eX
and
Ydir
ecti
on
(fm
axX
Y),
max
imum
forc
eco
mponen
tin
the
Zd
irec
tio
n(f
max
Z)
(bu
oyan
tfo
rce)
.F
max
Zis
div
ided
by
the
gra
vit
atio
nal
acce
lera
tio
n(9
.81
m/s
2)
bef
ore
com
pu
tin
gr
Nat Hazards (2011) 58:141–162 157
123

Water flow velocities at the shoreline just to the west of the pump station and warehouse
are high, reaching 3–4 m/s in both scenarios. Debris (e.g., drift wood, small boats, lumber)
being transported by the tsunami wave in this area close to the shoreline could result in
damage to the refinery fence line along the beach front. If the fence line was breached or
overtopped, debris could result in possible damage to building structures, storage con-
tainers, pipes or other exposed elements in this area.
High water flow velocities (2–4 m/s) and water depths[1 m in the Stromboli scenario,
combined with possible turbulence near the shoreline, could result in soil erosion and
localized scour particularly around the area just to the west of the warehouse and pump
station, up to the second port terminal, and at the far eastern side of the refinery where
some soil erosion and scouring is already present. The refinery fence line support wall
could also be subject to scouring in this area. Weakening of the support wall would
increase the likelihood of the fence line being overturned. Overall, erosion and scour would
most likely not represent a large threat to storage tanks at the refinery, but would mainly
undermine protection barriers such as the natural protection barrier, and the refinery fence
line that could serve to filter small debris, as well as the foundations of some equipment
located near the shoreline.
The likelihood of major hazardous materials releases from damage to storage tanks is
low in the previous scenarios. However, small leaks from damaged flange connections and
broken pipes due to floating off of empty or almost empty storage tanks are possible in both
tsunami scenarios. Damage from debris impact, erosion and scour appears not to be a
major issue in terms of potential releases, or at least not as a direct result. Oil spills and
other hydrocarbon releases (e.g., LPG) could result from broken loading/unloading arms
and pipe breaks at the port terminals, particularly during the Capo Vaticano tsunami. Since
the Capo Vaticano tsunami impacts the coastline laterally, the two port terminals would
receive the wave impact perpendicularly. Thus, any ships docked on the east side of the
port terminals could have a forcing effect on the pier structures and could cause some
damage, while a ship moored on the west side would be pushed away from the pier
possibly tearing pipe connections and leading to oil spills. In fact, an oil spill at this
refinery was observed following the Stromboli tsunami of December 2002. Two oil tankers
moored at the wharfs were at risk of having their mooring lines broken when the tsunami
wave displaced them 10 m laterally. A small oil spill was reported as a result of the single
tsunami wave observed (Maramai et al. 2005). It is not clear if the spill was caused because
the moored tankers were still in the process of (un)loading or if transfer was stopped but
they were still connected to the wharf via the transfer arms.
6 Consequence analysis
The quantity of hazardous materials releases triggered by either of the two tsunamis is
likely to be small, thus also reducing the likelihood of major fires or explosions. Therefore,
the risk of potential harmful consequences from chemical releases, fires or explosions to
residential areas and neighbouring facilities is likely to be small. Nonetheless, even small
amounts of oil can form a thin film over flood waters and can be dispersed and transported
quickly throughout large areas. Any damage in this case will be restricted to coating of
surfaces with oil, although oil spills have been reported to disperse completely leaving
almost no trace. This would be the case if high turbulence occurs as was observed during
the Indian Ocean tsunami (Van Dijk 2008). If floating oil catches fire (e.g., due to contact
158 Nat Hazards (2011) 58:141–162
123
with very hot surfaces or another ignition source), the fire could be spread over large areas
very quickly. In this case, the refinery itself and its workers could be at risk.
Releases of flammable gases such as LPG due to damaged flanges or broken pipe
connections may occur. In the case of LPG, the port terminals are particularly vulnerable.
Any release could lead to the formation of a vapour cloud and possibly vapour cloud
explosion (VCE). According to an accident scenario taken from Giardina (2000) involving
a break of the transfer hose and the resulting overpressure, nearby residents would prob-
ably not be affected unless the vapour cloud is carried as far as the nearest residences about
500 m away. An explosion, however, could cause damage to the port terminals and other
ships, and could trigger domino effects.
7 Tsunami risk reduction measures
Our results indicate that the risk of damage and hazardous materials releases caused by the
two modelled tsunami scenarios would be low. Nevertheless, these are just two of the
possible credible scenarios that could affect the refinery. In addition, other industrial
establishments are located in tsunami-prone regions all over the globe. The study results
highlighted the possible weak points in the design and protection of industrial infra-
structures when subject to tsunami waves. Therefore, measures to prevent tsunami-trig-
gered chemical accidents and/or to mitigate their consequences need to be put into place to
ensure effective risk reduction.
Limiting industrial development in tsunami-prone areas is the most efficient way to
minimize the hazard associated with the tsunami impact. However, land-use-planning
restrictions for existing installations are difficult to implement. In this case, supplementary
measures are required to protect hazardous facilities. Offshore breakwalls or other types of
barriers onshore can be efficient in reducing the tsunami force (Ergin and Balas 2006;
Jayappa 2008; Maheshwari et al. 2005; Harris and Wilson 2008). They could also keep
tsunami-driven debris from washing into the plant. The studied refinery does not have any
breakwalls, which leaves the two oil terminals fully exposed to potential tsunami wave
action. In the eastern part, there is a stretch of earthen barrier that would protect any piping
and equipment lying behind it from the full force of the incoming waves. It does not,
however, run along the full length of the refinery and would therefore provide little
protection from inundation. This situation is exacerbated by the fact that the modelled
tsunamis are generated in the near field, with resulting short tsunami warning lead times.
According to our analysis, the first wave would arrive at the refinery after 18 min in the
Stromboli scenario and 27 min from Capo Vaticano. This time may be sufficient for
de-inventorying of pipes and emergency shutdown only. The time required for de-inven-
torying of connected pipes and pipelines will depend on the characteristics of the substance
being transported, the diameter and length of the pipe, and whether or not the pipeline is
feeding a process that can be quickly and safely shutdown. Careful analysis of the pro-
cesses and emergency planning and preparedness may help to reduce potential losses due
to tsunami impacts.
Tankers moored at the refinery’s oil terminals would require a warning lead time of a
few hours to stop (un)loading and move into deep waters to reduce the risk of a major oil
spill (Eskijian 2006). In addition, in the Capo Vaticano scenario the incoming tsunami
waves would hit the terminals laterally. Any moored tanker would suffer vertical but also
lateral displacement. Transfer needs to be rapidly stopped and the loading arms discon-
nected to minimize the risk of an oil spill during the tsunami.
Nat Hazards (2011) 58:141–162 159
123
In the absence of external barriers, all structures containing hazardous materials and all
systems critical for the safety of the installation need to be protected from wave-load
damage and water intrusion. Submersion and subsequent buoyancy are of particular con-
cern for storage tanks that may float off their foundations, thereby tearing pipe connections
and resulting in the release of possibly flammable and/or toxic materials. Adequate
anchoring should keep tanks and other equipment from floating off under most conditions.
In addition, a minimum quantity of material could be left in these to ensure that they would
not suffer buoyancy in the case of flooding. Since it was not possible to visit the studied
refinery, we could not determine the type of anchoring or restraint systems utilized on-site.
We noticed earthen containment dikes and brick or concrete walls around the storage tanks
visible from the plant perimeter. While their purpose is to retain accidental releases from
the tanks rather than keeping the flood waters out, they would probably provide some flood
protection if the walls are not overtopped and if there is no erosion that could compromise
the integrity of the dikes.
Structural tsunami risk reduction measures need to be supplemented by organizational
measures to effectively minimize the risk of a tsunami impact. This includes the drawing
up of tsunami hazard management plans both at plant and community level, monitoring of
construction practices and compliance with building codes. Moreover, when planning for
preventing tsunami-triggered chemical accidents, the impact of a possibly preceding
earthquake needs to be taken into account. This is applicable to both shore protection
systems and industrial facilities, which when weakened would have less resistance to an
impacting tsunami wave.
8 Conclusions
This paper analyses the potential impacts of two tsunamis originating in the Tyrrhenian Sea
and their consequences at an industrial facility located on the coast in north-eastern Sicily.
The results of the tsunami simulations indicate that in both scenarios, there would be 18
storage tanks at the refinery subject to flooding, with tanks closer to the shoreline suffering
close to 1 m inundation.
The study results indicate that there is low likelihood of damage to storage tanks due to
hydrodynamic loads in either scenario. Water flow velocities in most areas are less than
1 m/s, indicating that any damage would likely occur due to hydrostatic uplift forces due to
buoyancy loads particularly in the western part of the facility where inundation levels are
higher and storage tanks are less protected. Nevertheless, storage tanks in this part of the
refinery do have concrete containment dikes and these may provide some flood protection.
Thus, damage due to buoyancy loads would occur only if the containment dikes were
damaged by flood waters or if they were overtopped.
Debris impact loads could be a problem particularly in the area to the west of the
pump station and warehouse in both tsunami scenarios where water flow velocities reach
3–4 m/s. Debris impact could result in some damage to building structures, storage
containers, pipes or other exposed elements.
The refinery port terminals would be at risk of tsunami wave loads and possible damage,
particularly during the Capo Vaticano tsunami because the wave would impact the piers
perpendicularly. Thus, any ships docked at the port terminals could have a forcing effect on
the pier structures possibly causing some damage. Furthermore, ships moored on the west
side would be pushed away from the pier possibly tearing pipe connections and leading to
oil spills.
160 Nat Hazards (2011) 58:141–162
123
The likelihood of hazardous materials releases from inundated storage tanks is low.
However, small releases could occur due to breakage of connected pipes and flanges due to
buoyancy loads. Flooding of electrical equipment, such as control panels, pumps and
motors, not raised above the inundation level could result in salt water intrusion leading to
possible short circuit, hampering of safety and mitigation systems, process upsets and
possible hazardous materials releases.
We conclude that the risk of harmful consequences of tsunami-triggered hazardous
materials releases, fires or explosions to nearby residents and neighbouring facilities is
likely to be small. Nonetheless, uncertainty in the data used in the simulations, particularly
bathymetry and DEM means that different inundation values could be observed than those
obtained for the present study. Whatever the case, we recommend that the minimum of
preventive and preparedness measures be taken to reduce the risk of tsunami-triggered
damage, in particular, tsunami-induced chemical accidents and to mitigate their conse-
quences if these events do occur.
Acknowledgments This work was performed in the frame of and co-funded by the European Union’s 6thFramework Programme project Tsunami Risk and Strategies for the European Region (TRANSFER). Theauthors also acknowledge Dr. Alberto Armigliato from the University of Bologna for his help with preparingthe input data set for the tsunami propagation and inundation modelling.
References
Akatsuka H, Kobayashi H (2008) Fire of petroleum tank, etc. by Niigata earthquake. Failure knowledgedatabase, Japan science and technology agency. http://shippai.jst.go.jp/en/Detail?fn=0&id=CB1012035&kw=Environment Accessed Apr 2008
Anderson C (2007) State of Hawai’i multi-hazard mitigation plan update 2007. Hazards, climate andenvironment program, University of Hawaii with the Hawaii state hazard mitigation forum, the Hawaiistate earthquake advisory committee, the Hawaii state hurricane advisory committee, and the fourcounty planning efforts, including the county of Kauai, the county of Maui, the county of Hawaii, andthe city and county of Honolulu. http://www.scd.state.hi.us/2007_hmp.html Accessed 16 Dec 2008
Annunziato A, Franchello G, Ulutas E, De Groeve T (2009) 29 Sept 2009 Samoa Tsunami, EUR report24068 EN, European communities
Antonioni G, Bonvicini S, Spadoni G, Cozzani V (2009) Development of a general framework for the riskassessment of Na-Tech accidents. Reliab Eng Saf Syst 94:1442–1450
Austin GT (1988) Shreve’s chemical process industries, 5th edn. McGraw-Hill International Editions,Chemical Engineering Series, Singapore, p 859
Borrero JC (2005) Field survey northern Sumatra and Banda Aceh, Indonesia, after the tsunami andearthquake of 26 December 2004. Preliminary report. Earthquake Engineering Research Institute,Feb 9
Cruz AM, Franchello G, Krausmann E (2009) Assessment of tsunami risk to industry in southern Italy. EURReport 23801, European communities
Dall’Osso F, Gonella M, Gabbianelli G, Withycombe G, Dominey-Howes D (2009) Assessing the vul-nerability of buildings to tsunami in Sydney. Nat Haz Earth Syst Sci 9:2015–2026
Dominey-Howes D, Papathoma M (2007) Validating a tsunami vulnerability assessment model (the PTVAModel) using field data from the 2004 Indian Ocean tsunami. Nat Haz 40(1):113–136
Ergin A, Balas CE (2006) Damage risk assessment of breakwaters under tsunami attack. Nat Hazards39:231–243
Eskijian ML (2006) Mitigation of seismic and meteorological hazards to marine oil terminals and other pierand wharf structures in California. Nat Hazards 39:343–351
Franchello G (2008) Modeling shallow water flows by a high resolution Riemann solver. EUR 23307 EN,European communities
Franchello G (2010) Shoreline tracking and implicit source terms for a well balanced inundation model. Int JNum Meth Fluids 63:1123–1146
Nat Hazards (2011) 58:141–162 161
123

Franchello G, Krausmann E (2008) HyFlux2: a numerical model for the impact assessment of severeinundation scenario to chemical facilities and downstream environment. EUR 23354 EN, EuropeanCommunities
Giardina G (2000) Applicazione della metodologia HARIA2 alla pianificazione di emergenza nell’area diMilazzo. Master thesis, University of Pisa
Guidoboni E, Ferrari G, Mariotti D, Comastri A, Tarabusi G, Valensise G (2007) Catalogue of StrongEarthquakes in Italy (461 B.C.-1997) and Mediterranean Area (760 B.C.-1500). CFTI4Med, INGV-SGA. Available from http://storing.ingv.it/cfti4med/
Harris SP, Wilson DO (2008) Mitigating hurricane storm surge perils at the DeLisle plant. Process Saf Prog27(3):177–184
IRIS SeismoArchives (2010) http://www.iris.edu/seismo/quakes/1964niigata/. Accessed 24 June 2010Iwabuchi Y, Koshimura Shunichi, Imamura Fumihiko (2006) Study on oil spread caused by the 1964
Niigata earthquake tsunami. J Disaster Res 1(1):157–168Jayappa KS (2008) Coastal problems and mitigation measures including the effects of tsunami. Curr Sci
94(1):14–15Lorito S, Tiberti MM, Basili R, Piatanesi A, Valensise G (2008) Earthquake-generated tsunamis in the
Mediterranean Sea: scenarios of potential threats to southern Italy. J Geophys Res 113:B01301. doi:10.1029/2007JB004943
Maheshwari BK, Sharma ML, Narayan JP (2005) Structural damages on the coast of Tamil Nadu due totsunami caused by December 26, 2004 Sumatra earthquake. ISET J Earthq Technol 42(2–3):63–78
Maramai A, Graziani L, Alessio G, Burrato P, Colini L, Cucci L, Nappi R, Nardi A, Vilardo G (2005) Near-and far- field survey report of the 30 December 2002 Stromboli (Southern Italy) tsunami. Mar Geol215:93–106
Papadopoulos GA, Fokaefs A (2005) Strong tsunamis in the Mediterranean Sea: a re-evaluation. ISET JEarthq Technol 42(4):159–170 Paper No. 463
Piatanesi A, Tinti S (2002) Numerical modelling of the September 8, 1905 Calabrian (southern Italy)tsunami. Geophys J Int 150(1):271–284
Robertson IN, Riggs HR, Yim SCS, Young YL (2007) Lessons from hurricane Katrina storm surge onbridges and buildings. J Waterw Port Coast Ocean Eng 2007:463–483
Rossetto T et al (2007) The Indian Ocean tsunami of December 26, 2004: observations in Sri Lanka andThailand. Nat Hazards 42:105–124
Seligson HA, Eguchi RT, Tierney KJ, Richmond K (1996) Chemical hazards, mitigation and preparednessin areas of high seismic risk: a methodology for estimating the risk of post-earthquake hazardousmaterials release. Technical report NCEER-96-0013, Buffalo, New York
Sinnott RK (1989) Chemical engineering volume 6 (in SI units): an introduction to chemical engineeringdesign. In: Coulson JM, Richardson JF (eds) Volumes in the chemical engineering. Pergamon Press,Oxford, p 838
Steinberg LJ, Cruz AM (2004) When natural and technological disasters collide: lessons from the Turkeyearthquake of August 17, 1999. Nat Hazards Rev 5(3):121–130
Tinti S, Pagnoni G, Zaniboni F, Bortolucci E (2003) Tsunami generation in Stromboli Island and impact onthe south-east Tyrrhenian coasts. Nat Hazards Earth Syst Sci 3:299–309
Tinti S, Maramai A, Graziani L (2004) The new catalogue of Italian tsunamis. Nat Hazards 33(3):439–465TRANSFER (2010) Tsunami risk and strategies for the European region. www.transferproject.eu. Accessed
24 June 2010Van Dijk S (2008) Environmental impact assessment: tsunami Indonesia. United Nations, office for the
coordination of humanitarian affaires, Banda Aceh, Aceh, Indonesia. http://humanitarianinfo.org/sumatra/reference/assessments/doc/other/report_def_draft_send_2601.pdf Accessed March 2008
Yeh H, Robertson I, Preuss J (2005) Development of design guidelines for structures that serve as tsunamivertical evacuation sites. Washington State Department of Natural Resources, Washington Division ofGeology and Earth Resources, open file report 2005-4, November
162 Nat Hazards (2011) 58:141–162
123