Application of Quality Function Deployment in redesigning website: a case study on TV3
23
Munich Personal RePEc Archive Application of quality function deployment in redesigning website: A case study on TV3 Rafikul Islam and Mohiuddin Ahmed and Masliza Alias International Islamic University Malaysia (IIUM) 2007 Online at http://mpra.ub.uni-muenchen.de/11336/ MPRA Paper No. 11336, posted 5. November 2008 01:47 UTC
-
Upload
independent -
Category
Documents
-
view
0 -
download
0
Transcript of Application of Quality Function Deployment in redesigning website: a case study on TV3

MPRAMunich Personal RePEc Archive
Application of quality functiondeployment in redesigning website: Acase study on TV3
Rafikul Islam and Mohiuddin Ahmed and Masliza Alias
International Islamic University Malaysia (IIUM)
2007
Online at http://mpra.ub.uni-muenchen.de/11336/MPRA Paper No. 11336, posted 5. November 2008 01:47 UTC
Int. J. Business Information Systems, Vol. 2, No. 2, 2007 195
Copyright © 2007 Inderscience Enterprises Ltd.
Application of Quality Function Deployment in redesigning website: a case study on TV3
Rafikul Islam Department of Business Administration, Faculty of Economics and Management Sciences, International Islamic University Malaysia, Jalan Gombak, 53100 Kuala Lumpur, Malaysia E-mail: [email protected] *Corresponding author
Mohiuddin Ahmed Department of Computer Science, Faculty of Information and Communication Technology, International Islamic University Malaysia, Jalan Gombak, 53100 Kuala Lumpur, Malaysia E-mail: [email protected]
Masliza Hj. Alias Sistem Televisyen (M) Bhd, No. 3 Persiaran Bandar Utama, Bandar Utama, 47800 Petaling Jaya, Malaysia E-mail: [email protected]
Abstract: Internet technology has been used by most of the organisations in the world today. One of the primary vehicles of information gathering and dissemination in today’s world is organisational website. This research evaluates the performance of the present TV3 (a popular private television station in Malaysia) website. By means of an online survey and a few focus group discussions, it also identifies the website viewer requirements and their corresponding importance level. Subsequently, the technical requirements are identified that can fulfill the viewer requirements. A House of Quality (HOQ) is built to find the relationship between the viewer and technical requirements. The Quality Function Deployment (QFD) exercise provides the prioritised technical requirements, which is expected to guide the TV3 website development and maintenance team in its future website redesigning project. The findings of the research are also expected to provide some insight in other organisations in similar need.
Keywords: Quality Function Deployment; QDF; website development; website quality evaluation; TV3; Malaysia.
Reference to this paper should be made as follows: Islam, R., Ahmed, M. and Alias, M.Hj. (2007) ‘Application of Quality Function Deployment in redesigning website: a case study on TV3’, Int. J. Business Information Systems, Vol. 2, No. 2, pp.195–216.

196 R. Islam, M. Ahmed and M.H. Alias
Biographical notes: Rafikul Islam received his MSc degree in Applied Mathematics from Calcutta University in 1988. Subsequently he obtained his PhD in Operations Research from Indian Institute of Technology, Kharagpur in 1996. Presently he is working as an Associate Professor in the Department of Business Administration, International Islamic University Malaysia. His articles have appeared in European Journal of Operational Research, Military Operations Research, Journal of Engineering Manufacture, Journal of International Business and Entrepreneurship Development, International Journal of Business Information Systems, IIUM Journal of Economics and Management, etc. Dr. Islam’s research area includes multiple criteria decision making, operations and quality management.
Mohiuddin Ahmed is an Assistant Professor in the Computer Science Department at the International Islamic University Malaysia (IIUM). Before joining IIUM, he was working in Goldman Sachs, NY, USA, as a Programme Analyst in the Global Control Division. Prior to that, he was an adjunct faculty member in the Department of Electrical and Computer Engineering in North Carolina A&T State University (NC A&T SU). He obtained his MS and PhD degrees, both in Electrical Engineering, from NC A&T SU, USA in 1993 and 2000, respectively. His current research interests include high performance computing (HPC), Artificial Neural Network (ANN), ANN application in signal and image processing, etc.
Masliza Hj. Alias obtained her Bachelor degree in Arts in Finance from Michigan State University and Masters in Business Administration from the International Islamic University Malaysia in 2006. She has been working at the MIS Department of TV3 for the last eight years. Her major area of research interest is information quality management.
1 Introduction
A website is a place where people can obtain information about something in which they are interested. Today, internet technology has made websites a major source of any type of information. In other words, whenever people need to find some information in the area of A to Z, they are turning more and more to the internet in lieu of any other source. The internet offers capabilities similar to those of newspapers (i.e. text and graphics), radio (i.e. audio) and TV (i.e. video), all in one package (Karayanni and Baltas, 2003). Websites can influence several aspects of the value proposition, as they enable direct interaction, have virtually no variable costs, and compared to traditional media, are more flexible and superior in targeting the users (Huizingh, 2002). Consequently, organisations across the world are paying increasing attention to the website design, up-to-date contents, ease of navigation and the ability to interact online.
TV3, a private television channel in Malaysia, is the most popular free-to-air TV station in Malaysia. By having a high quality website, it may further help to extend its brand equity, coverage, and corporate image. Johnson and Griffith (2002) mention that a well-designed website helps reinforce the firm’s brand equity, while a poorly designed website can devalue the established brand equity.

Application of Quality Function Deployment in redesigning website 197
The TV3 website has been revamped and redesigned four times in the span of eight years since it was first launched in 1997. The revamp exercise was based on TV3’s plan to have a fresh look on the website as well as to add on more interactivity and contents for viewers. At TV3, Management Information System (MIS) department is responsible for developing and maintaining the website.
At every revamping exercise of the website, the objective was to satisfy the viewers’ requirements as much as possible. After the last 2004 revamp exercise, the management hoped to get all the positive comments from the viewers. This was because management spent considerable amount of money to pay the outside vendor who helped TV3 to revamp the website. However, contrary to management’s expectation, it received many negative feedbacks from the viewers via emails and phone calls. Among the comments are: Information is not up-to-date, TV programme schedule provides irrelevant synopsis, no video or live streaming of TV3 programmes and the website is not user-friendly.
It was strongly felt that there were bigger issues that needed to be addressed first before going to redesign the website in future. Before any future redesigning exercise takes place, an evaluation of the website will help TV3 to identify and understand the important factors that can contribute to enhance its quality and to become a high quality website. This evaluation and analysis will assist TV3 to recognise the viewer requirements and to find ways how TV3 can satisfy these requirements. In this background, the present study is conducted whose objectives are the following:
to evaluate the present performance of TV3 website
to identify and prioritise viewer requirements to further improve the effectiveness of the website
to identify and prioritise the technical requirements that can fulfill the viewers’ requirements.
In the evaluation phase, particular emphasis was placed on the usability of the website. Usability is a broad concept in system design and is defined differently by different Human Computer Interface (HCI) scholars (Hassan and Li, 2005). There are a few basic principles that relate to the web environment such as user-friendly navigation, up-to-date information, minimal download time, relevance to users and high quality content. The present research will identify whether the usability of TV3 website has met its viewer expectations.
Quality Function Deployment was identified as an appropriate methodology to address the above objectives (particularly, the latter two) of the present research. The following section provides a brief account of previous work related to the present topic of investigation.
2 Literature review
Website effectiveness is dependent on its ease-of-use navigation, content and design of usability features and acceptable loading time for the site to appear on the screen. The real challenge is to identify and develop design factors that can
1 make a website usable and serviceable, avoiding users frustration or dissatisfaction

198 R. Islam, M. Ahmed and M.H. Alias
2 create more stimulating, visually pleasing, comprehensive and commercially viable websites
3 help attract users to a website, maintain their interest in the website, and encourage them to return to the website again (Zhang and Dran, 2000).
Johnson and Griffith (2002) mention that satisfied website viewers may come again to view the website, may stay longer at the site and may inform others about the site. In order to generate satisfied users, the authors propose that the website design must stand up to basic design standards – quality photographs, well-written content, clearly defined navigators and professionally designed graphic art.
Chase (2004) finds that a sizeable percentage of firms create their websites and then ignore them for long period, leaving the information stale and outdated. Fu et al. (2002) mention that the major objective of having a website is to satisfy the users requirements and to make them logging on frequently. As the interest of its users change over time, a website that does not change itself will become outdated and less useful.
Brick and mortar businesses have several strategies to ensure that their customers return to their store and make more purchases. Excellent services are crucial in order to retain customers. This is also true for the companies who are engaged in e-commerce. A poorly designed layout and out-of-date content website gives negative impression to the customers. Therefore, companies need to have a website that live up to customers’ expectations (Iwaarden et al., 2003). Donthu (2001) mentions that just as service quality differentiates the winners from the losers in traditional retailing, website quality differentiates the winners from the losers online.
Kim, Shaw and Schneider (2003) conducted a study in benchmarking website design within industry groups and identified six criteria for website evaluation: business function, corporate credibility, contents reliability, website attractiveness, systematic structure and navigation. Based on these six criteria, the authors evaluated 245 Korean websites within 12 industry groups. The survey instrument consisted of students who enrolled in an introductory Information System course and they were asked to select 20 websites in three or four industries of their choice. Their research has shown that the online malls have a mean value of 3.96, which is significantly higher than the overall average. The authors concluded that the websites of online malls were better than any other industry.
Hassan and Li (2005) have developed a model to evaluate the usability and extent usefulness of websites. The model considers the following seven factors: screen appearance, content, accessibility, navigation, media use, interactivity and consistency. The model was applied to test the usability of the websites of four political parties in Malaysia: Barisan Nasional (BN), Parti Islam Semalaysia (PAS), Democratic Action Party (DAP) and Angkatan Belia Islam Malaysia (ABIM). In another study, Otto et al., (2000) investigated the relationship between web page download time and various elements of user satisfaction including content, format, ease of use, appeal of graphics, etc. In their research, they took a sample of 60 college sophomores who registered an introductory MIS course. The authors found out that the loading time of 15 sec. or less did not have an adverse effect on user satisfaction.

Application of Quality Function Deployment in redesigning website 199
3 Quality Function of Deployment
Quality Function of Deployment (QFD) is a tool for designing manufacturing (service) processes in response to customers needs by translating what the customers want into what the organisation produces. Two Japanese Professors namely, Professor Shigeru Mizuno and Professor Yoji Akao jointly developed QFD in late 1960s. Their purpose was to develop the quality assurance method that would incorporate customers’ needs into the design of a product before it was manufactured. Before the development of QFD, quality control methods were primarily aimed at fixing a problem during or after manufacturing of the product.
QFD was first applied at the Kobe Shipyards of Mitsubishi Heavy Industry in designing of an oil tanker in 1972. Toyota used the tool in 1977 in designing a new van. The application saved Toyota’s start-up cost for the van significantly. QFD was introduced to USA in 1983 when US Society for Quality Control published Akao’s work in Quality Progress. In the same year, Cambridge Research (now Kaizen Institute) invited Akao to give a seminar on QFD in Chicago. After this seminar, before the US executives, Akao delivered a series of talks sponsored by Bob King and GOAL/QPC in Boston. Because of QFD’s flexibility, comprehensiveness, in US the methodology drew widespread attention from the business community that were facing tough Japanese competition.
Apart from Japan, Akao and Mazur (2003) claimed that QFD is successful in Argentina, Chile, Columbia and many other Latin-American countries. Not only that, the tool has also been widely used in European countries such as Italy, UK, Sweden, Germany, Austria, Spain, France, Denmark and the Netherlands. Other than Europe, Latin-America, USA and Japan, QFD has gained interest in South Africa, Iran, Malaysia, Thailand and Indonesia.
The major vehicle through which QFD is implemented is House of Quality (HOQ). The diagram is known as HOQ because its architecture is similar to a house. Like a normal house (which has foundation, walls and roof), HOQ has a number of components, which are:
customer requirements
technical requirements
relationship between customer and technical requirements
relationship among technical requirements
prioritised customer requirements
prioritised technical requirements.
Of the above components, prioritised technical requirements form the foundation of the house. Customer requirements and prioritised customer requirements form the walls. Relationships between customer and technical requirements form the main body of the house. Relationships among technical requirements form the roof of the house. Technical requirements form the ceiling of the house. The general architecture of the house has been shown in Figure 1.

200 R. Islam, M. Ahmed and M.H. Alias
Figure 1 General architecture of a house of quality
3.1 QFD Applications
QFD has been applied in many industries, e.g., communication (Kim, Park and Seo, 1997), Construction (Rahman, Kwan and Woods, 1999), Finance (Partovi, 1999), Education (Motwani et al., 1996), Information Technology (Tan, Xie and Chia, 1998; Haag et al., 1996), Marketing (Mohr-Jackson, 1996; Lu and Kuei, 1995). Quality Function Deployment Institute (QFDI) www.qfdi.org based in the USA states that:
“Quality Function Deployment (QFD) is the only comprehensive quality system aimed specifically at satisfying the customer throughout the development and business process”.
Every year QFDI organises an international symposium and invites companies throughout the world, which have applied QFD. Past conferences have been held in USA, Japan, Sweden, Germany, Australia, Brazil and Turkey. The following companies have attended the symposium and have shared their experiences in using QFD: General Motors, Ford, Mazda, Motorola, Xerox, Kodak, IBM, P&G, HP, AT&T, Boeing, Nokia, Texas Instruments, etc. Following are some of the common reasons stated by the companies in favour of using QFD:

Application of Quality Function Deployment in redesigning website 201
with QFD we can prioritise our goals and objectives to select the best strategies, technologies and vendors
international business is our future. QFD lighted the path to foreign markets
to lower cost and increase reliability, we want to reuse as many common parts as possible. QFD has given us the means to differentiate components where there is customer value, and communise those that are invisible to the user
to develop a hybridised product from two of our best selling lines, QFD helps us include the most important features from each
we configured our space-age robotics into an award-winning attraction at Jurassic Park, QFD brought it to life.
Following are some of the benefits shared by the users of the QFD:
customer satisfaction
reduction of product development cycle time
fewer engineering changes in the later stage
reduced chance of oversight during the design process
an environment of teamwork
consensus decisions.
Here we provide a review of some specific, relevant applications. Hamilton and Selen (2004) conducted a study by using a concept of integrated services in meeting the user needs. Their approach was to find ways on how integrated services can be delivered over the web in a service chain that involved multiple partners. In this study, QFD methodology was applied to a real estate service environment in Australia.
A framework for customised web interfacing in the service chain was developed by Fine as mentioned by Hamilton and Selen (2004). There are three categories in web interfacing:
1 web interface
2 web design processes and functionalities
3 service chain.
These functionalities are then translated into technical web design features and web design functions. A three-step procedure is also involved:
1 linking customer needs to website functionalities
2 linking website functionalities to collaborating service chain partners
3 build, structure and deploy information throughout the service chain.
Barnes and Vidgen (2003) evaluated quality of a Forum on Strategic Management Knowledge Exchange (FSMKE) website before and after the redesign exercise. The authors used WebQual as the survey instrument, and they analysed and compared data with the user perception before and after the redesign process took place. Using the
202 R. Islam, M. Ahmed and M.H. Alias
WebQual survey questionnaires, the authors considered four factors for evaluation, namely usability, information quality, service interaction and overall look of website. By using the method, FSMKE was able to identify areas for improvement and as a result, the WebQual index was increased by 20 points after the website redesign exercise. Users’ feedbacks indicated that the site quality improved significantly.
Using ServQual (tangibles, reliability, responsiveness, assurance and empathy), Iwaarden et al. (2003) identified perceived important quality characteristics for using websites. They identified the following characteristics as the most important: fast access, easier navigation and presentation of complete overview before making the purchase decision, and the simplicity in the registration process.
4 Research methodology
We used two approaches for data collection, namely online survey and focus groups. A questionnaire was developed that consisted of three parts: Part A: demographic information – gender, age group, higher level of education, marital status, number of children and MyTV3 membership. Part B: rating a number of statements using 1–5 points Likert scale (1 = strongly disagree, 5 = strongly agree). Part C: rating a number of factors from least important to extremely important (1 = least important, 10 = extremely important) (Besterfield et al., 2003). At the end, the respondents were also asked to provide additional comments.
The questionnaire was posted at http://survey.tv3.com.my and kept for three weeks. Invitations were sent out to about 2000 people who were randomly selected from TV3 audience database. However, only 209 completed questionnaires were received out of which exactly 200 were valid.
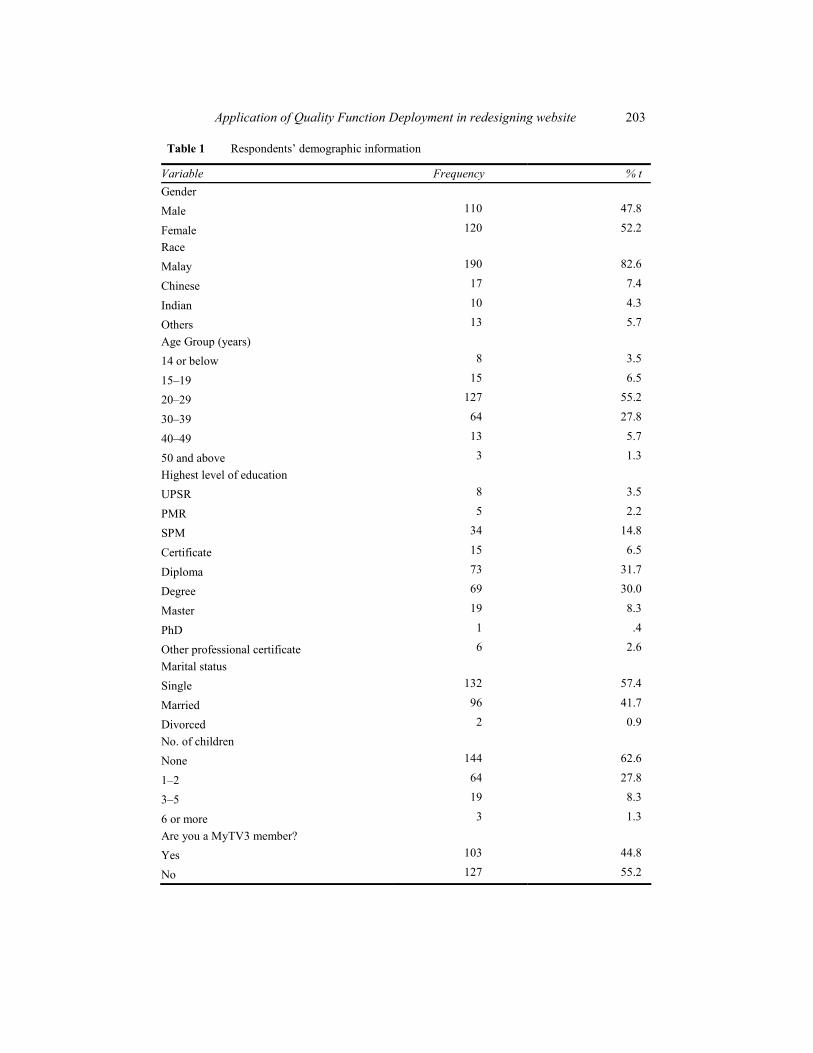
Conducting focus group sessions with the respondents also collected data. For focus group sessions, the respondents were selected from the researchers’ contact database and acquaintances. The researchers managed to get 30 respondents for the focus group sessions. Since it was difficult to gather all of them in one session due to schedule clashes, the researchers decided to arrange about 5–10 people per session. Before the session started, a clear explanation was given on the objectives of conducting the session and how to answer each question. The respondents were required to answer all the questions in the survey form. The demographic information of the valid respondents is provided in the Table 1. SPSS version 11 was used to compute frequencies, descriptive statistics and also to run t-test.
The focus groups sessions enabled the researchers to meet face-to-face and had a two-way conversation with the respondents. The respondents could express their opinions and thoughts directly to the researchers. Survey alone was not sufficient enough to listen to the viewers’ comments and suggestions, as most of the respondents did not express their opinion on the questionnaire.
Application of Quality Function Deployment in redesigning website 203
Table 1 Respondents’ demographic information
Variable Frequency % t
Gender Male 110 47.8
Female 120 52.2 RaceMalay 190 82.6
Chinese 17 7.4
Indian 10 4.3
Others 13 5.7 Age Group (years) 14 or below 8 3.5
15–19 15 6.5
20–29 127 55.2
30–39 64 27.8
40–49 13 5.7
50 and above 3 1.3 Highest level of education UPSR 8 3.5
PMR 5 2.2
SPM 34 14.8
Certificate 15 6.5
Diploma 73 31.7
Degree 69 30.0
Master 19 8.3
PhD 1 .4
Other professional certificate 6 2.6 Marital status Single 132 57.4
Married 96 41.7
Divorced 2 0.9 No. of children None 144 62.6
1–2 64 27.8
3–5 19 8.3
6 or more 3 1.3 Are you a MyTV3 member? Yes 103 44.8
No 127 55.2
204 R. Islam, M. Ahmed and M.H. Alias
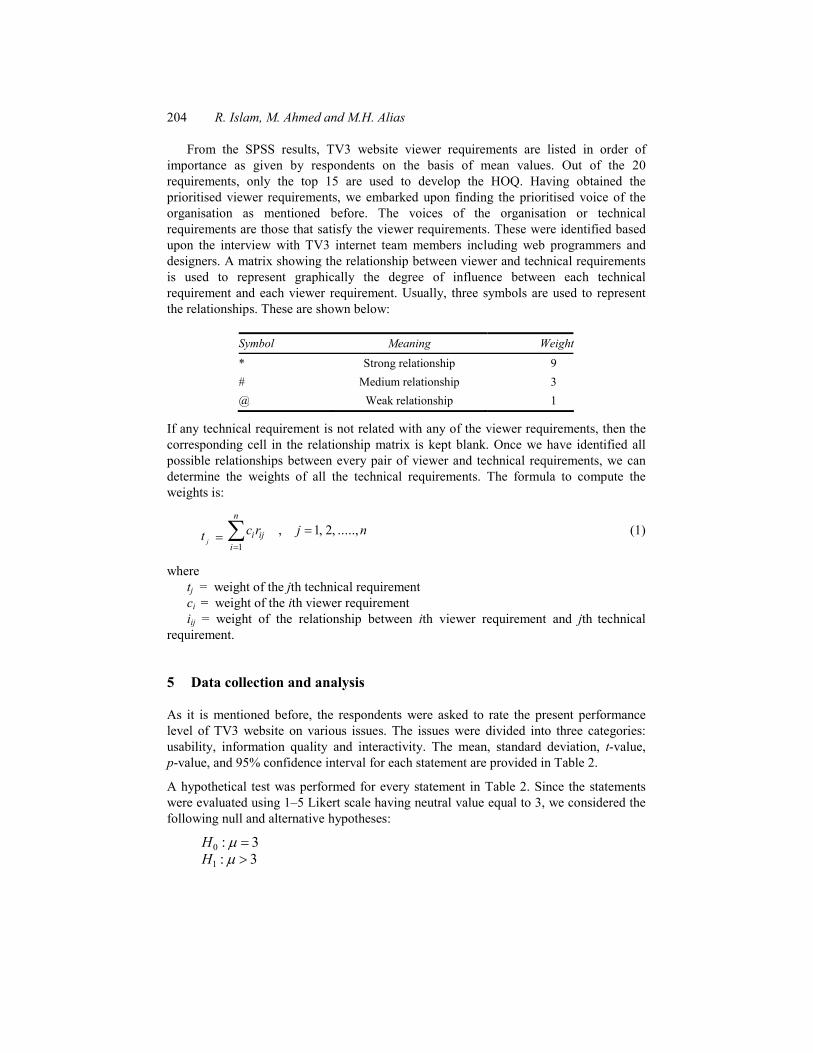
From the SPSS results, TV3 website viewer requirements are listed in order of importance as given by respondents on the basis of mean values. Out of the 20 requirements, only the top 15 are used to develop the HOQ. Having obtained the prioritised viewer requirements, we embarked upon finding the prioritised voice of the organisation as mentioned before. The voices of the organisation or technical requirements are those that satisfy the viewer requirements. These were identified based upon the interview with TV3 internet team members including web programmers and designers. A matrix showing the relationship between viewer and technical requirements is used to represent graphically the degree of influence between each technical requirement and each viewer requirement. Usually, three symbols are used to represent the relationships. These are shown below:
Symbol Meaning Weight
* Strong relationship 9 # Medium relationship 3 @ Weak relationship 1
If any technical requirement is not related with any of the viewer requirements, then the corresponding cell in the relationship matrix is kept blank. Once we have identified all possible relationships between every pair of viewer and technical requirements, we can determine the weights of all the technical requirements. The formula to compute the weights is:
1
, 1, 2, .....,j
n
i iji
c r j nt (1)
where tj = weight of the jth technical requirement ci = weight of the ith viewer requirement iij = weight of the relationship between ith viewer requirement and jth technical
requirement.
5 Data collection and analysis
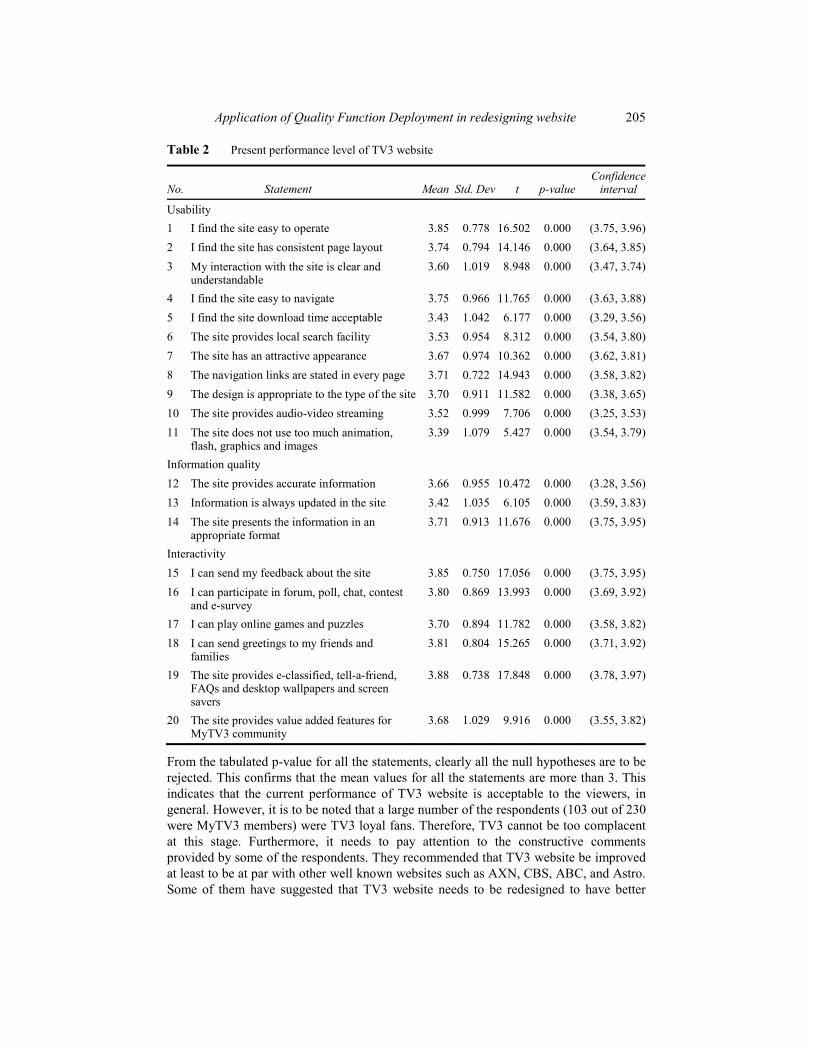
As it is mentioned before, the respondents were asked to rate the present performance level of TV3 website on various issues. The issues were divided into three categories: usability, information quality and interactivity. The mean, standard deviation, t-value, p-value, and 95% confidence interval for each statement are provided in Table 2.
A hypothetical test was performed for every statement in Table 2. Since the statements were evaluated using 1–5 Likert scale having neutral value equal to 3, we considered the following null and alternative hypotheses:
0
1
: 3: 3
HH
Application of Quality Function Deployment in redesigning website 205
Table 2 Present performance level of TV3 website
No. Statement Mean Std. Dev t p-value Confidence
interval
Usability 1 I find the site easy to operate 3.85 0.778 16.502 0.000 (3.75, 3.96)2 I find the site has consistent page layout 3.74 0.794 14.146 0.000 (3.64, 3.85)3 My interaction with the site is clear and
understandable 3.60 1.019 8.948 0.000 (3.47, 3.74)
4 I find the site easy to navigate 3.75 0.966 11.765 0.000 (3.63, 3.88)5 I find the site download time acceptable 3.43 1.042 6.177 0.000 (3.29, 3.56)6 The site provides local search facility 3.53 0.954 8.312 0.000 (3.54, 3.80)7 The site has an attractive appearance 3.67 0.974 10.362 0.000 (3.62, 3.81)8 The navigation links are stated in every page 3.71 0.722 14.943 0.000 (3.58, 3.82)9 The design is appropriate to the type of the site 3.70 0.911 11.582 0.000 (3.38, 3.65)10 The site provides audio-video streaming 3.52 0.999 7.706 0.000 (3.25, 3.53)11 The site does not use too much animation,
flash, graphics and images3.39 1.079 5.427 0.000 (3.54, 3.79)
Information quality 12 The site provides accurate information 3.66 0.955 10.472 0.000 (3.28, 3.56)13 Information is always updated in the site 3.42 1.035 6.105 0.000 (3.59, 3.83)14 The site presents the information in an
appropriate format 3.71 0.913 11.676 0.000 (3.75, 3.95)
Interactivity 15 I can send my feedback about the site 3.85 0.750 17.056 0.000 (3.75, 3.95)16 I can participate in forum, poll, chat, contest
and e-survey 3.80 0.869 13.993 0.000 (3.69, 3.92)
17 I can play online games and puzzles 3.70 0.894 11.782 0.000 (3.58, 3.82)18 I can send greetings to my friends and
families 3.81 0.804 15.265 0.000 (3.71, 3.92)
19 The site provides e-classified, tell-a-friend, FAQs and desktop wallpapers and screen savers
3.88 0.738 17.848 0.000 (3.78, 3.97)
20 The site provides value added features for MyTV3 community
3.68 1.029 9.916 0.000 (3.55, 3.82)
From the tabulated p-value for all the statements, clearly all the null hypotheses are to be rejected. This confirms that the mean values for all the statements are more than 3. This indicates that the current performance of TV3 website is acceptable to the viewers, in general. However, it is to be noted that a large number of the respondents (103 out of 230 were MyTV3 members) were TV3 loyal fans. Therefore, TV3 cannot be too complacent at this stage. Furthermore, it needs to pay attention to the constructive comments provided by some of the respondents. They recommended that TV3 website be improved at least to be at par with other well known websites such as AXN, CBS, ABC, and Astro. Some of them have suggested that TV3 website needs to be redesigned to have better

206 R. Islam, M. Ahmed and M.H. Alias
looks and make the navigation easier. Further, some of them were not happy with too much usage of flash and animation. Also, according to some of them, the site was taking too much time to appear on the screen.
Twenty requirements were identified from TV3 website users’ point of view and the respondents were requested to assign importance level using 1–10 scale. The results are shown in Table 3. From the weights assigned, we pick up the top 15 viewer requirements as shown in Table 4. Table 3 Viewer requirements and their corresponding importance level
No. Statement n Mean Std. Dev Rank
Usability
1 Easy to operate 230 7.72 2.020 11
2 Consistent page layout 230 7.33 1.875 16
3 Clarity and understandability in interaction with the site 230 8.11 1.714 6
4 Easy to navigate 230 8.17 1.877 5
5 Loading time for the site to appear on the screen 230 7.97 2.004 8
6 Local search facility in the site 230 7.64 1.914 12
7 An attractive appearance 230 7.87 1.960 9
8 Navigation links in every page 230 7.44 1.943 14
9 Website design 230 7.83 1.926 10
10 Availability of audio-video on demand and Live Net cast streaming
230 7.60 2.059 13
11 Moderate usage of animation, flash, graphics and images
230 7.37 1.977 15
12 Availability in two languages- Bahasa Melayu and English
230 8.22 2.083 4
Information quality
13 Accurate information 230 8.84 1.703 2
14 Updating information on time 230 8.90 1.645 1
15 Presents the information in an appropriate format and languages
230 8.53 1.864 3
Interactivity
16 Possibility of sending feedback through the website 230 8.01 1.956 7
17 Facility to participate in forum, poll, chat, contest and e-survey
230 7.32 2.154 17
18 Playing online games and puzzles 230 5.81 2.493 20
19 Facility to send greetings 230 6.43 2.450 19
20 Other extra features 230 6.64 2.487 18

Application of Quality Function Deployment in redesigning website 207
Table 4 Top 15 viewer requirements and their corresponding weights
Code no. Viewer requirements Weight
J1 Updating information on time 8.90 J2 Accurate information 8.84 J3 Presents the information in an appropriate format 8.53 J4 Availability in two languages – Bahasa Melayu and English 8.22 J5 Easy to navigate 8.17 J6 Clarity and understandability in interaction with the site 8.11 J7 Possibility of sending feedback through the website 8.01 J8 Loading time for the site to appear on the screen 7.97 J9 An attractive appearance 7.87 J10 Website design 7.83 J11 Easy to operate 7.72 J12 Local search facility in the site 7.64 J13 Availability of audio–video on demand and Live Net cast streaming 7.60 J14 Navigation links in every page 7.44 J15 Moderate usage of animation, flash, graphics and images 7.37
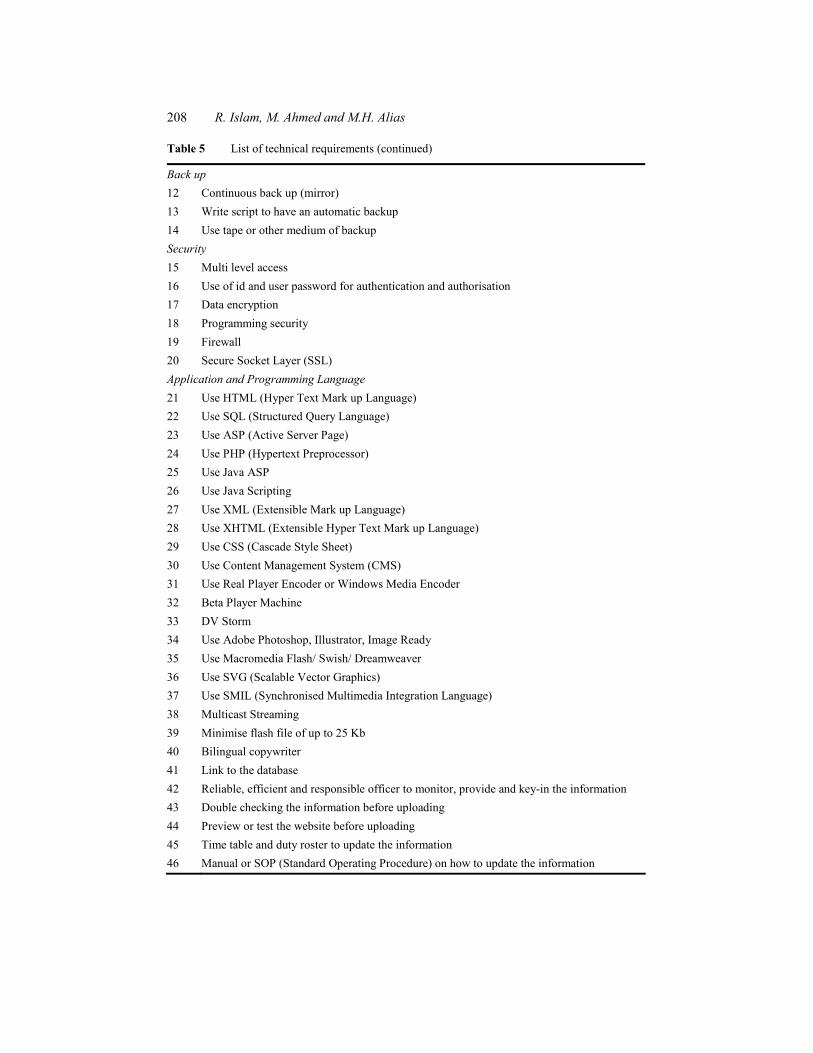
Altogether 74 technical requirements were identified in consultation with the IT personnel working in TV3. These are divided into six categories: Network, Server, Backup, Security, Application and Programming Language, and Web Design and User Interface. Details are shown in Table 5. Table 5 List of technical requirements
Network
1 Giga byte ethernet network 2 Broadband network 3 Wireless technology Server
4 Media streaming server (audio/video) 5 Database server 6 Test server 7 Live server 8 Graphic server 9 Cache server 10 User authentication server 11 E-mail server
208 R. Islam, M. Ahmed and M.H. Alias
Table 5 List of technical requirements (continued)
Back up
12 Continuous back up (mirror) 13 Write script to have an automatic backup 14 Use tape or other medium of backup Security
15 Multi level access 16 Use of id and user password for authentication and authorisation 17 Data encryption 18 Programming security 19 Firewall 20 Secure Socket Layer (SSL) Application and Programming Language
21 Use HTML (Hyper Text Mark up Language) 22 Use SQL (Structured Query Language) 23 Use ASP (Active Server Page) 24 Use PHP (Hypertext Preprocessor) 25 Use Java ASP 26 Use Java Scripting 27 Use XML (Extensible Mark up Language) 28 Use XHTML (Extensible Hyper Text Mark up Language) 29 Use CSS (Cascade Style Sheet) 30 Use Content Management System (CMS) 31 Use Real Player Encoder or Windows Media Encoder 32 Beta Player Machine 33 DV Storm 34 Use Adobe Photoshop, Illustrator, Image Ready 35 Use Macromedia Flash/ Swish/ Dreamweaver 36 Use SVG (Scalable Vector Graphics) 37 Use SMIL (Synchronised Multimedia Integration Language) 38 Multicast Streaming 39 Minimise flash file of up to 25 Kb 40 Bilingual copywriter 41 Link to the database 42 Reliable, efficient and responsible officer to monitor, provide and key-in the information 43 Double checking the information before uploading 44 Preview or test the website before uploading 45 Time table and duty roster to update the information 46 Manual or SOP (Standard Operating Procedure) on how to update the information
Application of Quality Function Deployment in redesigning website 209
Table 5 List of technical requirements (continued)
Web design and User Interface
47 Font size of 9 points or less for footer text such as copyright notices 48 Navigation link of up to 3 words per link 49 Use color to distinguish visited and unvisited links 50 Make ‘Search’ box available for the entire site 51 Layout design follows the eye-tracking routine (Z-pattern) 52 Navigation bar placed at upper left corner, upper right corner or top horizontal bar of the
screen 53 Navigation links must be less than 10 categories 54 Use pull down menu for sub-navigation links 55 Navigation links must be short, simple and easy to understand 56 Place only one graphical (banner) ads on one page 57 Contents and images are not too cluttered on one page 58 Only one dominant image on one page 59 Use meaningful graphics that relate to the contents 60 Avoid using too many frames on one page 61 Use font that easy to read such as Times New Roman, Century Gothic, Arial, Helvetica,
Sans Serif 62 Avoid horizontal scrolling 63 Create url or domain name less than 75 characters 64 Never have a link that point to the current page 65 Make it easy to access anything recently featured on the homepage 66 Archive old contents 67 Include a short site description in the window title 68 Include a tagline that explicitly summarises what the site or company does 69 Text must be easy for the users to scan and read 70 Use subheads, bulleted lists, highlighted keywords, short paragraphs, the inverted pyramid,
and a simple writing style 71 Write a window title with good visibility in search engines and bookmarks 72 Group all corporate information in one distinct area 73 Guide users a clear starting point for the site’s top high-priority tasks they will undertake
when visiting the site 74 Provide a site map
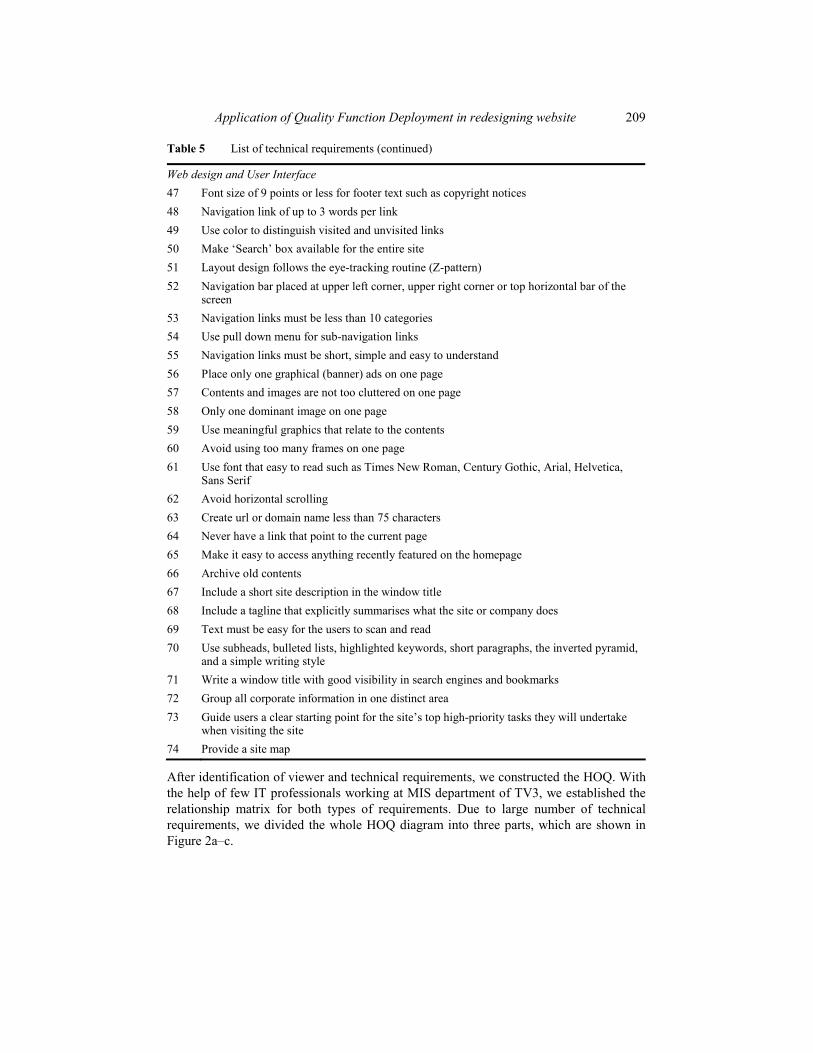
After identification of viewer and technical requirements, we constructed the HOQ. With the help of few IT professionals working at MIS department of TV3, we established the relationship matrix for both types of requirements. Due to large number of technical requirements, we divided the whole HOQ diagram into three parts, which are shown in Figure 2a–c.

210 R. Islam, M. Ahmed and M.H. Alias
Figure 2 (a) HOQ for the viewer requirements and technical requirements (network, server, backup, and security).

Application of Quality Function Deployment in redesigning website 211
Figure 2 (b) HOQ for the viewer requirements and technical requirements (Application and Programming language).

212 R. Islam, M. Ahmed and M.H. Alias
Figure 2 (c) HOQ for the viewer requirements and technical requirements (Web design and user interface).
Application of Quality Function Deployment in redesigning website 213
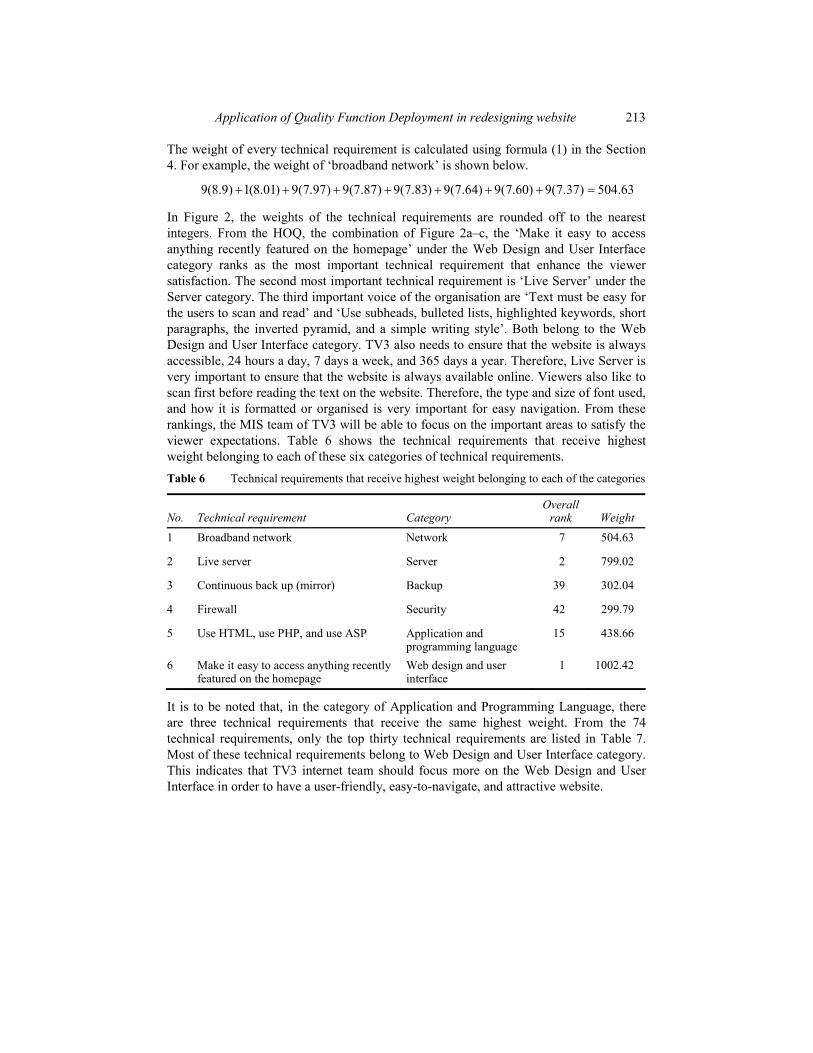
The weight of every technical requirement is calculated using formula (1) in the Section 4. For example, the weight of ‘broadband network’ is shown below.
63.504)37.7(9)60.7(9)64.7(9)83.7(9)87.7(9)97.7(9)01.8(1)9.8(9
In Figure 2, the weights of the technical requirements are rounded off to the nearest integers. From the HOQ, the combination of Figure 2a–c, the ‘Make it easy to access anything recently featured on the homepage’ under the Web Design and User Interface category ranks as the most important technical requirement that enhance the viewer satisfaction. The second most important technical requirement is ‘Live Server’ under the Server category. The third important voice of the organisation are ‘Text must be easy for the users to scan and read’ and ‘Use subheads, bulleted lists, highlighted keywords, short paragraphs, the inverted pyramid, and a simple writing style’. Both belong to the Web Design and User Interface category. TV3 also needs to ensure that the website is always accessible, 24 hours a day, 7 days a week, and 365 days a year. Therefore, Live Server is very important to ensure that the website is always available online. Viewers also like to scan first before reading the text on the website. Therefore, the type and size of font used, and how it is formatted or organised is very important for easy navigation. From these rankings, the MIS team of TV3 will be able to focus on the important areas to satisfy the viewer expectations. Table 6 shows the technical requirements that receive highest weight belonging to each of these six categories of technical requirements. Table 6 Technical requirements that receive highest weight belonging to each of the categories
No. Technical requirement Category Overall
rank Weight
1 Broadband network Network 7 504.63
2 Live server Server 2 799.02
3 Continuous back up (mirror) Backup 39 302.04
4 Firewall Security 42 299.79
5 Use HTML, use PHP, and use ASP Application and programming language
15 438.66
6 Make it easy to access anything recently featured on the homepage
Web design and user interface
1 1002.42
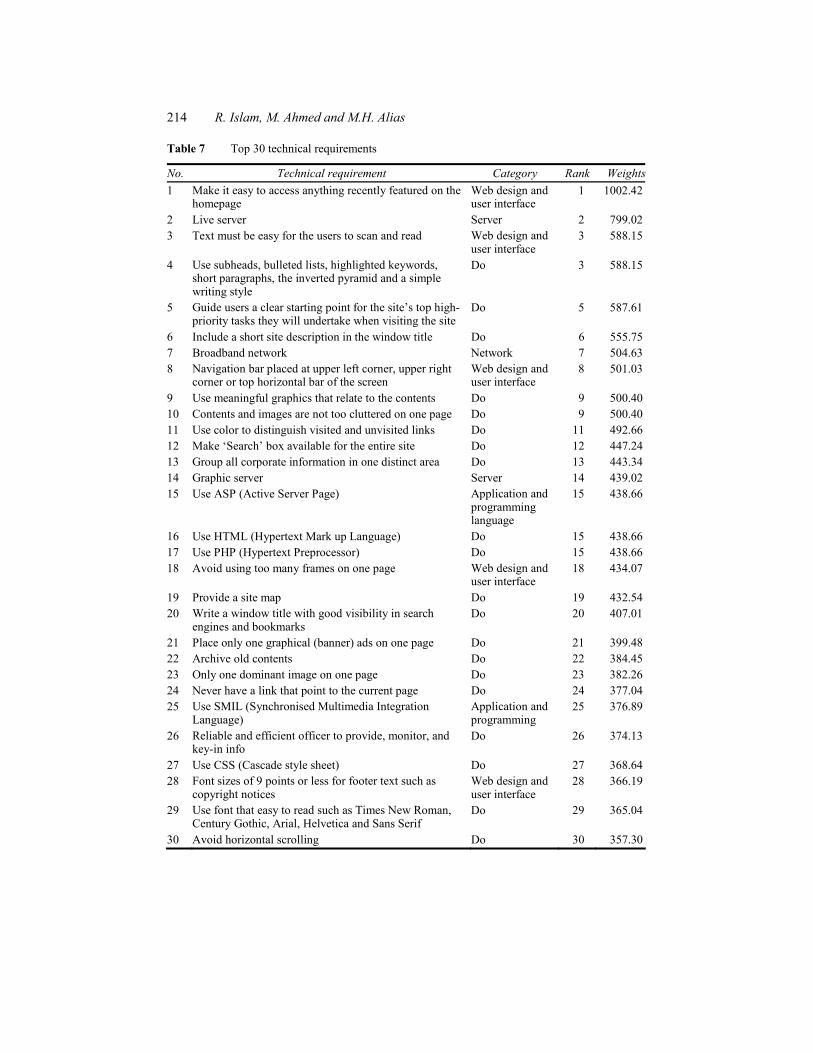
It is to be noted that, in the category of Application and Programming Language, there are three technical requirements that receive the same highest weight. From the 74 technical requirements, only the top thirty technical requirements are listed in Table 7. Most of these technical requirements belong to Web Design and User Interface category. This indicates that TV3 internet team should focus more on the Web Design and User Interface in order to have a user-friendly, easy-to-navigate, and attractive website.
214 R. Islam, M. Ahmed and M.H. Alias
Table 7 Top 30 technical requirements
No. Technical requirement Category Rank Weights1 Make it easy to access anything recently featured on the
homepage Web design and user interface
1 1002.42
2 Live server Server 2 799.02 3 Text must be easy for the users to scan and read Web design and
user interface 3 588.15
4 Use subheads, bulleted lists, highlighted keywords, short paragraphs, the inverted pyramid and a simple writing style
Do 3 588.15
5 Guide users a clear starting point for the site’s top high-priority tasks they will undertake when visiting the site
Do 5 587.61
6 Include a short site description in the window title Do 6 555.75 7 Broadband network Network 7 504.63 8 Navigation bar placed at upper left corner, upper right
corner or top horizontal bar of the screen Web design and user interface
8 501.03
9 Use meaningful graphics that relate to the contents Do 9 500.40 10 Contents and images are not too cluttered on one page Do 9 500.40 11 Use color to distinguish visited and unvisited links Do 11 492.66 12 Make ‘Search’ box available for the entire site Do 12 447.24 13 Group all corporate information in one distinct area Do 13 443.34 14 Graphic server Server 14 439.02 15 Use ASP (Active Server Page) Application and
programming language
15 438.66
16 Use HTML (Hypertext Mark up Language) Do 15 438.66 17 Use PHP (Hypertext Preprocessor) Do 15 438.66 18 Avoid using too many frames on one page Web design and
user interface 18 434.07
19 Provide a site map Do 19 432.54 20 Write a window title with good visibility in search
engines and bookmarks Do 20 407.01
21 Place only one graphical (banner) ads on one page Do 21 399.48 22 Archive old contents Do 22 384.45 23 Only one dominant image on one page Do 23 382.26 24 Never have a link that point to the current page Do 24 377.04 25 Use SMIL (Synchronised Multimedia Integration
Language) Application and programming
25 376.89
26 Reliable and efficient officer to provide, monitor, and key-in info
Do 26 374.13
27 Use CSS (Cascade style sheet) Do 27 368.64 28 Font sizes of 9 points or less for footer text such as
copyright notices Web design and user interface
28 366.19
29 Use font that easy to read such as Times New Roman, Century Gothic, Arial, Helvetica and Sans Serif
Do 29 365.04
30 Avoid horizontal scrolling Do 30 357.30
Application of Quality Function Deployment in redesigning website 215
6 Conclusions
Website is an important channel of any organisation through which it disseminates information about the organisation. Every website has its intended viewers and they have their own requirements. To maximise the viewer satisfaction, organisations are expected to pay adequate attention to fulfill their expectations/requirements. As it has been mentioned in the paper, though TV3 website has been revamped a number of times, but still many viewers provided negative comments. This is apparently due to the fact that viewers’ articulated requirements were not considered seriously in any of the previous design exercises. The present research is claimed to be a systematic attempt to apply QFD to enhance the overall effectiveness of the TV3 website. The research has found the important viewer requirements and prioritised technical requirements that are purported to satisfy the viewer requirements. TV3 website management team is expected to take the findings of this research in its future redesigning exercise of the website and this may push them one step forward to fulfilling their vision to have the best private TV station in Malaysia. The findings of the research are equally useful to other similar organisations in course of maintaining an effective and user-friendly website.
Acknowledgement
The researchers are thankful to all respondents whose support was crucial to complete the research.
References Akao, Y. and Mazur, G. (2003) ‘The leading edge in QFD: past, present and future’, International
Journal of Quality & Reliability Management, Vol. 20, pp.20–35. Barnes, S.J. and Vidgen, R. (2003) ‘Measuring website quality improvements: a case study of the
forum on strategic management knowledge exchange’, Industrial Management + Data System, Vol. 103, pp.297–309.
Besterfield, D., Besterfield, C., Besterfield, G. and Besterfiled, M. (2003) Total Quality Management (3rd ed.). Columbus, OH: Prentice Hall.
Chase, E. (2004) ‘Project managing website development’ The British Journal of Administrative Management, October/November, Issue 43, pp.22–23.
Donthu, N. (2001) ‘Does your website measure up?’ Marketing Management, Vol. 10, pp.29–32. Fu, Y., Shih, M., Creado, M. and Ju, C. (2002) ‘Reorganizing websites based on user access
patterns’, International Journal of Intelligent Systems in Accounting, Vol. 11, pp.39–53.
Haag, S., Raja, M.K. and Schkade, L.L. (1996) ‘Quality Function Deployment usage in software development’, Communications of the ACM, Vol. 39, pp.41–49.
Hamilton, J. and Selen, W. (2004) ‘Enabling real estate service chain management through personalized web interfacing using QFD’, International Journal of Operations and Production Management, Vol. 24, pp.270–288.
Hassan, S. and Li, F. (2005) ‘Evaluating the usability and content usefulness of websites: a benchmarking approach’, Journal of Electronic Commerce in Organizations, Vol. 3, pp.46–67.
Huizingh, E. (2002) ‘The antecedents of website performance’, European Journal of Marketing, Vol. 36, pp.1225–1247.

216 R. Islam, M. Ahmed and M.H. Alias
Iwaarden, J., Wiele, T., Ball, L. and Millen, R. (2003) ‘Applying ServQual to websites: an exploratory study’, The International Journal of Quality & Reliability Management, Vol. 20, pp.919–935.
Johnson, T. and Griffith, D. (2002) ‘5 steps to online success’, Marketing Management, Vol. 11,pp.34–39.
Karayanni, D. and Baltas, G. (2003) ‘Website characteristics and business performance: some evidence from international business-to-business organizations’, Marketing Intelligence and Planning, Vol. 21, pp.105–114.
Kim, K., Park, K. and Seo, S. (1997) ‘A matrix approach for telecommunications technology selection’, Computers and Industrial Engineering, Vol. 33, pp.833–836.
Kim, S., Shaw, T. and Schneider, H. (2003) ‘Website design benchmarking within industry groups’, Internet Research, Vol. 13, pp.17–26.
Lu, M.H. and Kuei, C.H. (1995) ‘Strategic marketing planning: a Quality Function Deployment approach’, International Journal of Quality & Reliability Management, Vol. 12, pp.85–96.
Mohr-Jackson, I. (1996) ‘Quality Function Deployment: a valuable marketing tool’, Journal of Marketing Theory & Practice, Vol. 4, pp.60–67.
Motwani, J., Kumar, A. and Mohamed, Z. (1996) ‘Implementing Quality Function Deployment for improving quality in education: an example’, Journal of Professional Services Marketing,Vol. 14, pp.149–159.
Otto, J., Najdawi, M. and Caron, K. (2000) ‘Web-user satisfaction: an exploratory study’, Journal of End User Computing, Vol. 12, pp.3–10.
Partovi, F.Y. (1999) ‘A Quality Function Deployment approach to strategic capital budgeting’, The Engineering Economist, Vol. 44, pp.239–260.
Rahman, H.A., Kwan, C.L. and Woods, P.C. (1999) ‘Quality Function Deployment in construction design: application in low cost housing design’, International Journal of Quality & Reliability Management, Vol. 16, pp.591–605.
Tan, K.C., Xie, M. and Chia, E. (1998) ‘Quality Function Deployment and its use in designing information technology systems’, International Journal of Quality & Reliability Management,Vol. 15, pp.634–645.
Zhang, P. and Dran, G. (2000) ‘Satisfiers and dissatisfiers: A two-factor model for website design and evaluation’, Journal of the American Society for Information Science, Vol. 51, pp.1253–1268.