Application of Multivariate Statistically Based Algorithms for Civil Structures Anomaly Detection
10
Chapter 32 Application of Multivariate Statistically Based Algorithms for Civil Structures Anomaly Detection Masoud Malekzadeh, Mustafa Gul, and F. Necati Catbas Abstract Two multivariate statistics based damage detection algorithms are explored in conjunction with optical fiber sensors for long-term application of Structural Health Monitoring. Two newly developed data driven methods are investigated, for bridge health monitoring, here based on strain data captured by Fiber Bragg Grating (FBG) sensors from 4-span bridge model. The most common and critical damage scenarios were simulated on the representative bridge model equipped with FBG sensors. Acquired strain data were processed by both Moving Principal Component Analysis (MPCA) and Moving Cross Correlation Analysis (MCCA). The efficiency of FBG sensors, MPCA and MCCA for detecting and localizing damage is explored. Based on the findings presented in this paper, the MPCA and MCCA coupled with FBG sensors can be deemed to deliver promising results to observe and detect both local and global damage implemented on the bridge structure. Keywords Structural health monitoring • Fiber Bragg Grating Sensors • Advanced multivariate statistics • Damage detection 32.1 Introduction 32.1.1 Structural Health Monitoring Throughout the recent decades, also due to inspiration by the results derived from several studies on lifetime performance of civil infrastructures, Structural Health Monitoring (SHM) is progressing as an inevitable multi-disciplinary technology for condition assessment of infrastructure systems [1]. SHM can be considered as a novel technology for proactive management of different structures such as bridges, buildings, airplanes. Steps for SHM implementations are concisely summarized and illustrated in Fig. 32.1. It is fairly clear, as also shown in Fig. 32.1, that the first two stages of SHM are the most fundamental and critical phases in order to entirely accomplish the predefined SHM related objectives. The first stage, referred as monitoring and measurement, highly relies on having a wisely designed and well-distributed network of sensors. This mission can be achievable only by employing advance precise measurement devices including superior sensors and data acquisition systems. Speaking of superior sensors, optical sensors and in particular Fiber Bragg Grating (FBG) sensors are popular alternatives to the traditional sensors in terms of several aspects, such as spatial resolution, durability, stability and immunity to electrical noise [2–5]. FBG strain sensors hold a great deal of potential for civil structural health monitoring. M. Malekzadeh • F.N. Catbas () Department of Civil, Environmental and Construction Engineering, University of Central Florida, Orlando, FL 32816 USA e-mail: [email protected]; [email protected] M. Gul Department of Civil and Environmental Engineering, University of Alberta, Edmonton, AB, Canada T6G 2W2 e-mail: [email protected] F.N. Catbas et al. (eds.), Topics in Dynamics of Civil Structures, Volume 4: Proceedings of the 31st IMAC, A Conference on Structural Dynamics, 2013, Conference Proceedings of the Society for Experimental Mechanics Series 39, DOI 10.1007/978-1-4614-6555-3 32, © The Society for Experimental Mechanics, Inc. 2013 289
Transcript of Application of Multivariate Statistically Based Algorithms for Civil Structures Anomaly Detection

Chapter 32Application of Multivariate Statistically Based Algorithmsfor Civil Structures Anomaly Detection
Masoud Malekzadeh, Mustafa Gul, and F. Necati Catbas
Abstract Two multivariate statistics based damage detection algorithms are explored in conjunction with optical fibersensors for long-term application of Structural Health Monitoring. Two newly developed data driven methods areinvestigated, for bridge health monitoring, here based on strain data captured by Fiber Bragg Grating (FBG) sensors from4-span bridge model. The most common and critical damage scenarios were simulated on the representative bridge modelequipped with FBG sensors. Acquired strain data were processed by both Moving Principal Component Analysis (MPCA)and Moving Cross Correlation Analysis (MCCA). The efficiency of FBG sensors, MPCA and MCCA for detecting andlocalizing damage is explored. Based on the findings presented in this paper, the MPCA and MCCA coupled with FBGsensors can be deemed to deliver promising results to observe and detect both local and global damage implemented on thebridge structure.
Keywords Structural health monitoring • Fiber Bragg Grating Sensors • Advanced multivariate statistics • Damagedetection
32.1 Introduction
32.1.1 Structural Health Monitoring
Throughout the recent decades, also due to inspiration by the results derived from several studies on lifetime performance ofcivil infrastructures, Structural Health Monitoring (SHM) is progressing as an inevitable multi-disciplinary technology forcondition assessment of infrastructure systems [1]. SHM can be considered as a novel technology for proactive managementof different structures such as bridges, buildings, airplanes. Steps for SHM implementations are concisely summarizedand illustrated in Fig. 32.1. It is fairly clear, as also shown in Fig. 32.1, that the first two stages of SHM are the mostfundamental and critical phases in order to entirely accomplish the predefined SHM related objectives. The first stage,referred as monitoring and measurement, highly relies on having a wisely designed and well-distributed network of sensors.This mission can be achievable only by employing advance precise measurement devices including superior sensors and dataacquisition systems. Speaking of superior sensors, optical sensors and in particular Fiber Bragg Grating (FBG) sensors arepopular alternatives to the traditional sensors in terms of several aspects, such as spatial resolution, durability, stability andimmunity to electrical noise [2–5]. FBG strain sensors hold a great deal of potential for civil structural health monitoring.
M. Malekzadeh • F.N. Catbas (�)Department of Civil, Environmental and Construction Engineering, University of Central Florida, Orlando, FL 32816 USAe-mail: [email protected]; [email protected]
M. GulDepartment of Civil and Environmental Engineering, University of Alberta, Edmonton, AB, Canada T6G 2W2e-mail: [email protected]
F.N. Catbas et al. (eds.), Topics in Dynamics of Civil Structures, Volume 4: Proceedings of the 31st IMAC, A Conference on StructuralDynamics, 2013, Conference Proceedings of the Society for Experimental Mechanics Series 39, DOI 10.1007/978-1-4614-6555-3 32,© The Society for Experimental Mechanics, Inc. 2013
289

290 M. Malekzadeh et al.
Fig. 32.1 Individual stagesinvolved in SHM process
Fig. 32.2 Comparing parametricand nonparametric methods
Having a well-distributed network of sensor provides the opportunity of measuring desired structural parameters over criticalareas along the monitored structure, however processing this data and extracting the useful information is still a challengingstep and tackled in so called signal processing stage of Fig. 32.1.Basically, damage detection approaches in SHM fall intotwo main classes: model-based (parametric) methods and model-free (nonparametric) methods [6–9]. These methodologiesfollow specific procedures and are applicable in distinct contexts. The flowchart presented in Fig. 32.2 sheds light on thecritical aspects of parametric and non-parametric damage detection algorithms.
Herein, in order to simultaneously explore the first two stages of SHM, FBG sensors as one the most superior sensortechnologies are selected to evaluate the detectability of two advanced statistical data driven algorithms. To the best ofthe authors’ knowledge, the application of aforementioned data driven methods to the bridge monitoring has not beeninvestigated by considering several common damage scenarios. Moreover, taking advantages of optical fiber in this typeof data analysis framework is another unique aspect of this study. Therefore, the main contribution of this study is employingand investigating the efficiency of FBG sensors along with two innovative data driven damage detection algorithms underdifferent scenarios for bridge structures. A comparative study was conducted to evaluate the efficiency of both movingprincipal component analysis (MPCA) and moving cross correlation analysis (MCCA) for the purpose of bridge monitoringapplication. For that reason, the 4-span laboratory bridge model, which is representative of mid-span real life bridges,is equipped with several FGB sensors at the critical locations and tested by simulating different type of critical damagescenarios.

32 Application of Multivariate Statistically Based Algorithms for Civil Structures Anomaly Detection 291
32.2 Fiber Optic Sensors
32.2.1 FOS and Fiber Bragg Grating (FBG) Sensors
There has been a dramatic increase in the FOS implementations in the context of SHM due to aforementioned advantagesbrought by these types of sensors. FBG sensors, which are point types of sensors, are among the widely used FOS. The basicworking principles of FOS and FBG sensors are reflection and filtration of different wavelengths of light [3]. Beside the FBGsensors, Brillouin Optical Time Domain Analysis (BOTDA) and Brillouin Optical Time Domain Reflectometry (BOTDR)two of the widely used distributed types of FOS [4]. For FBG sensors, grating property enables the optical fiber to transmitthe entire wavelength except the particular reflected wavelength entitled as grating process. A brief introduction to theory ofthe optical fiber is presented in the following section.
32.2.2 Theory Behind the FBG Sensors
As it is briefly discussed above, the FBG function is fundamentally based upon reflection and filtration of the wavelengthwhich travels throughout the grated segment. The reflection of pre-defined wavelength occurs, as soon as the launchedbroadband light reaches the grated segment of fiber optic line. This reflected wavelength is referred as Bragg wavelength andit is expressed by the following equation:
�B D 2neƒ (32.1)
where �B represents of the Bragg wavelength, while ne and ƒ are the effective refractive index and the grating periodrespectively (illustrated in Fig. 32.3). When strain is induced, the Bragg wavelength is expected to have a proportional shift.The strain can be determined by analyzing the change in the wavelength. According to this principle, FBG can sense anypossible changes, shift forward or backward, in the period of scattered wavelength and based on that it can measure strain ingrating segment. The wavelength shift is proportional to strain, and absolute strain can be measured by using this shift [5].
Fig. 32.3 Measurement principal of Fiber Brag Grating (FBG) sensor

292 M. Malekzadeh et al.
32.3 Damage Detection Algorithm
32.3.1 Moving Principal Component Analysis (MPCA)
Two main concerns, delay in abnormally detection along with computational time issue, inspired revision of classical PCA tomake it more practical for long term SHM. Real life employment of SHM involves dealing with large amount of multivariatedata. Only a small portion of abnormal data, in comparison to overall data, is available at the time when damage occurs. Bymeans of PCA, the damage will be detectable only when the principal components (eigenvectors) are influenced by abnormalbehavior. Subsequently, eigenvectors are subjected to change only if certain amount of abnormal data captured and possiblyaffected the overall structure of data. This feature makes PCA less effective for long term SHM implementation. Movingprincipal component analysis (MPCA) was proposed by Posenato et al. [8] to address this challenge. Basically, MPCAcomputes the PCA within moving windows with a constant size.
A sensitive damage index is selected based on PCA outputs. The damage index (Dsi ) chosen for this study is square rootof the sum of the squares of the first two principal components as shown in Eq. (32.2).
DSi Dq
.P C1/2i C .P C2/2
i (32.2)
where (PC1)i and (PC2)i are the first and the second principal components of sensor i respectively. The reason to justincorporate the first two principal components in the damage index is that the most useful information in the data is coveredby the first few principal components values. In fact, the first principal component corresponds to the direction of in, whichthe projected data has the most variance while the second one is perpendicular to the first component. In other words, sincemore than 95% of the variance (calculated based on the preliminary study) is covered by the first two principal components,these two components are only incorporated in the damage index. It should be mentioned that the number of principalcomponents that should be considered depends on the data and there is not any prescription for all cases. However in themost cases the most variance is covered by the first two or three components. Therefore, if any damage occurred in structurethen it should affect the data and consequently variance of data and should be detected by this damage index.
32.3.2 Cross Correlation Analysis (CCA)
The Cross Correlation Analysis (CCA) was recently proposed by the authors [7] and the methodology is based on comparingthe correlation matrices for the baseline and damaged cases. The cross correlation coefficients of the strain data at onelocation and all other locations are calculated to create the first row of the cross-correlation matrix. Then, the same procedureis repeated for all of the sensors and a full cross-correlation coefficient matrix is created. After obtaining these matrices forbaseline and damaged conditions, they are compared to detect and locate the damage. When comparing two signal pairs, thecorrelation can be obtained using the following formula:
�ij .t/ DPn
kD1
�Sj .tk/ � �i
� �Sj .tk/ � �j
�rPn
kD1 .Si .tk/ � �i /2
qPnk
�Sj .tk/ � �j
�2
(32.3)
where rij is the correlation between the sensors i and j, n is the total number of time observations during the monitoringduration, Si(tk) and Sj(tk) are the values from the sensors i and j at time tk, and, mi, mj are the mean values of the data fromthe sensors i and j. However, CCA method is not very appropriate for long term monitoring of structure specifically forautomated long-term assessment.
32.3.2.1 Moving Cross Correlation Analysis (MCCA)
Due to the above-mentioned discussion about CCA drawbacks, Moving Cross Correlation Analysis (MCCA) is proposedas a promising upgraded version of CCA adapted for long term SHM. Determining a fixed size-moving window, explainedin MPCA section, that move along the time is a common aspect of MPCA and MCCA. The same matrix of data structureis developed and CCA is conducted for each individual window. Therefore, performing CCA for each moving window,

32 Application of Multivariate Statistically Based Algorithms for Civil Structures Anomaly Detection 293
Fig. 32.4 Conversion of responses to frequency domain and filtering out the high frequency response
correlation coefficient value is computed as correlation of sensor i and j. For detecting any possible abnormal behavior, thematrix of data is separated unequally into two segments as training and monitoring segments. The baseline behavior for eachpair of sensors, sensors i and j, are defined by the confidence interval developed based on correlation coefficients obtainedin the training phase. In the following step, the generated confidence intervals in training phase are considered as damagecriteria for each pair of sensor throughout the monitoring phase. In other words, if the observed correlation coefficients for agiven sensor i and j in monitoring phase exceed the confidence interval for the same sensors in training phase, then it can beclaimed that possible abnormal behavior is in progress in the structure.
32.3.3 Filtering Out the High Frequency Data
Prior to applying MPCA and MCCA to the raw data captured from FBG sensors, which were distributed over the bridge;a critical issue is pre-processing of the data. The data consists of both low and high frequency strain responses. Howeverhigh frequency part is not desired in this study since the correlation values are inversely affected by this high frequency data.As a result, high frequency data should be filtered out by using a low pass filter. It is shown in Fig. 32.4 that the first twovibration modes of the bridge are around 5 and 7.5 Hz. After this pre-processing, damage detection algorithm can be appliedfor evaluation of the structure.
32.4 Experimental Studies
32.4.1 Structure Description and Instrumentation (UCF 4-Span Bridge)
For the sake of evaluating these algorithms using FBG sensors, several experiments with a laboratory bridge model weredesigned and conducted taking three common damage scenarios into consideration. The structure consists of two 120 cmapproach (end) spans and two 304.8 cm main spans with a 3.18 mm thick, 120 cm wide steel deck supported by two HSS25 � 25 � 3 girders separated 60.96 cm from each other. Using the 4-span bridge model in the UCF structural laboratory(Fig. 32.5), it is feasible to simulate and test a variety of damage scenarios that are commonly observed in bridge type

294 M. Malekzadeh et al.
Fig. 32.5 Structural description and applied load (UCF 4-span Bridge)
structures [10, 11]. It is possible to simulate most of the common boundary conditions, including rollers, pin, and fixedsupport. In addition to these, the bolts connecting the girders and deck can be loosened or removed at different locationsto modify the stiffness of the system and to simulate damage. In other words, the first feature provides the opportunity tosimulate the global damage scenarios while; the second one is desirable for local damage simulations. It should be pointedout that even though the structure is not a scaled down model of a specific bridge, its responses are representative of typicalvalues for medium-span bridges.
32.4.2 Damage Scenarios
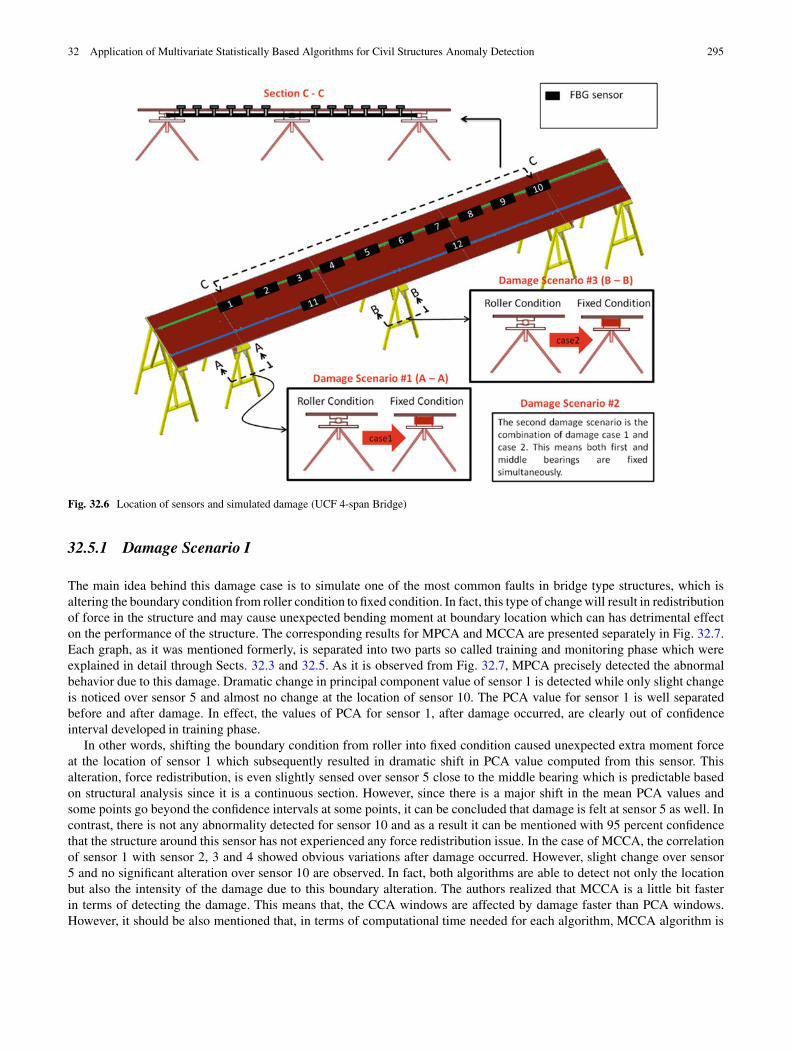
Inspired by discussions with the Department of Transportation (DOT) engineers, several critical and common damagescenarios were identified and simulated on the 4-span bridge model. A crucial type of damage which was observed inbridges is alterations in boundary conditions. These types of alterations may cause stress redistributions and in most casesit may result in additional load in different elements. Therefore, three cases were devoted to this type of damage using theadvantage of the ability to shift from pinned to fix or roller condition or vice versa. The damage scenarios implemented inthis study are illustrated in Fig. 32.6.
32.5 Damage Assessment
Total number of 30 data sets, 15 from baseline condition and 15 from damage condition, has been considered in this study.Each data set consisted of approximately 10000 to 13000 data points. This results in a main matrix with 360175 rows (datapoints or measurements) and12 columns (number of FBG sensors or variables). Taking this information into account, the sizeof the moving window was chosen as 13000 � 12 while the moving rate (or window overlap) is selected as 2000 points. Inorder to develop a confidence interval, the first 50000 points have been considered as training (baseline) phase for both MPCAand MCCA algorithms. In fact, the first 193875 points (measurements) out of 360175 points are captured from a baselinestructure while only the first 50000 points are involved in developing the confidence interval. Since this is multivariate dataanalysis, the results of selective sensors are presented instead of individual sensors. Alternatively, for MCCA illustration,correlation of sensors 1, 5 and 10 with sensors 2, 3 and 4 will be presented respectively.
32 Application of Multivariate Statistically Based Algorithms for Civil Structures Anomaly Detection 295
Fig. 32.6 Location of sensors and simulated damage (UCF 4-span Bridge)
32.5.1 Damage Scenario I
The main idea behind this damage case is to simulate one of the most common faults in bridge type structures, which isaltering the boundary condition from roller condition to fixed condition. In fact, this type of change will result in redistributionof force in the structure and may cause unexpected bending moment at boundary location which can has detrimental effecton the performance of the structure. The corresponding results for MPCA and MCCA are presented separately in Fig. 32.7.Each graph, as it was mentioned formerly, is separated into two parts so called training and monitoring phase which wereexplained in detail through Sects. 32.3 and 32.5. As it is observed from Fig. 32.7, MPCA precisely detected the abnormalbehavior due to this damage. Dramatic change in principal component value of sensor 1 is detected while only slight changeis noticed over sensor 5 and almost no change at the location of sensor 10. The PCA value for sensor 1 is well separatedbefore and after damage. In effect, the values of PCA for sensor 1, after damage occurred, are clearly out of confidenceinterval developed in training phase.
In other words, shifting the boundary condition from roller into fixed condition caused unexpected extra moment forceat the location of sensor 1 which subsequently resulted in dramatic shift in PCA value computed from this sensor. Thisalteration, force redistribution, is even slightly sensed over sensor 5 close to the middle bearing which is predictable basedon structural analysis since it is a continuous section. However, since there is a major shift in the mean PCA values andsome points go beyond the confidence intervals at some points, it can be concluded that damage is felt at sensor 5 as well. Incontrast, there is not any abnormality detected for sensor 10 and as a result it can be mentioned with 95 percent confidencethat the structure around this sensor has not experienced any force redistribution issue. In the case of MCCA, the correlationof sensor 1 with sensor 2, 3 and 4 showed obvious variations after damage occurred. However, slight change over sensor5 and no significant alteration over sensor 10 are observed. In fact, both algorithms are able to detect not only the locationbut also the intensity of the damage due to this boundary alteration. The authors realized that MCCA is a little bit fasterin terms of detecting the damage. This means that, the CCA windows are affected by damage faster than PCA windows.However, it should be also mentioned that, in terms of computational time needed for each algorithm, MCCA algorithm is

296 M. Malekzadeh et al.
Fig. 32.7 MPCA (top) and MCCA (bottom) results for selected sensors (Case1)
superior. Also, significantly more complicated mathematical calculations are involved in MPCA. This can become criticalissue when dealing with large amounts of real time data from a real life structure. Therefore, depending on the applicationand the priority, one of these algorithms can be selected and implemented.
32.5.2 Damage Scenario II
The second damage scenario was designed and implemented to simulate the situation in which a number of bearings areexperiencing the fixing issue. For that reason, the middle bearing was fixed in addition to the first one. The results for thiscase are summarized in Fig. 32.8. In second case, the sensor 1 again shows the most dramatic change similar to case 1.However, in this case an abrupt jump is observed in the location of sensor 5 (close to the middle bearing). This damage isperhaps the most severe damage scenario which is simulated in this study and it can be noticed from the results. The PCAand coefficient values for both sensor 1 and 5 show obvious change after damage occurred. In fact, all the sensors located onthe first span experienced the same situation.
32.5.3 Damage Scenario III
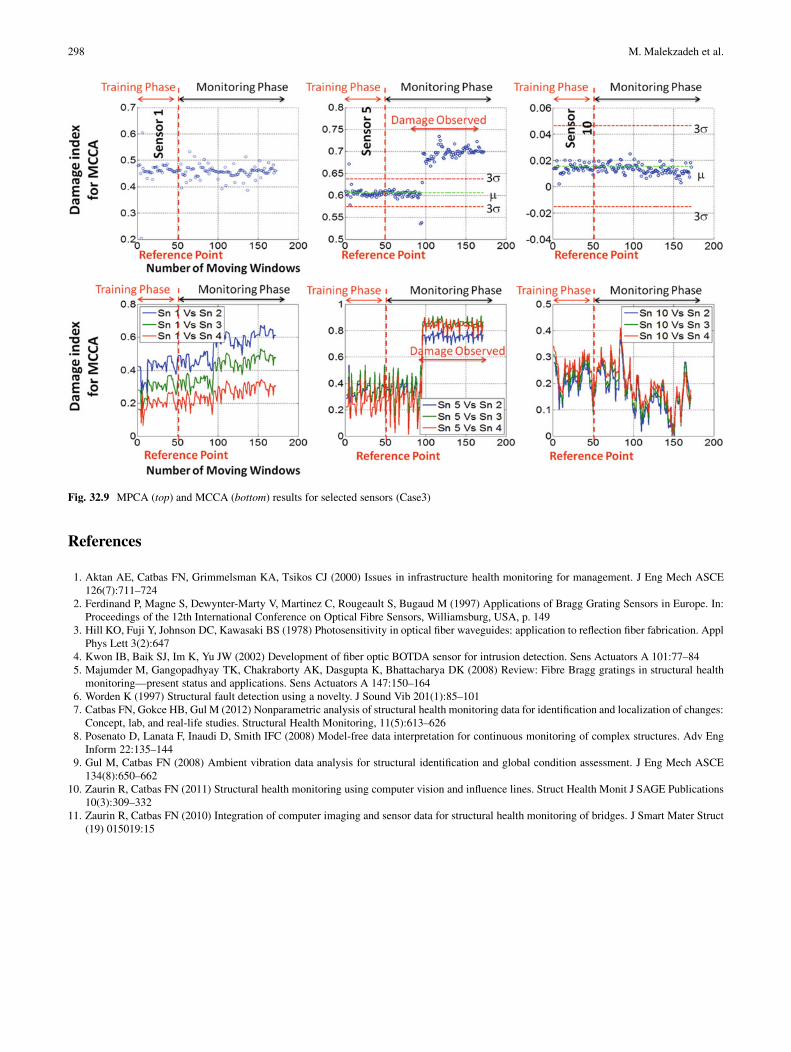
MPCA and MCCA outcomes for the third case are plotted in Fig. 32.9. Since only the middle boundary condition is altered,only sensor 5 experienced a significant change. However, it is expected to have some minor unexpected force redistributionnear the first and the last boundary. It is observed from MPCA results that only sensor 5 expresses damage while almostthere is no significant variation detected around sensor 1 and sensor 10.

32 Application of Multivariate Statistically Based Algorithms for Civil Structures Anomaly Detection 297
Fig. 32.8 MPCA (top) and MCCA (bottom) results for selected sensors (Case2)
32.6 Conclusions
The damage detection ability of two advance multivariate statistical based algorithms is investigated for long-term bridgemonitoring application taking advantage of FBG sensors. MPCA and MCCA are two methods which show promising resultsfor real life and long term SHM. The effectiveness of these algorithms was tested using laboratory bridge structure and fiberoptic sensors. The most common and critical damage scenarios have been selected and simulated on the structure includingthree global damage scenarios. Afterwards, the proficiencies of MPCA and MCCA are tested for each case in detection,localization and intensity aspects. The results conceal that these methods are very promising for long term monitoringof structures. It was also noted that each method has its own advantages and disadvantages as expected. It was realizedthat coefficient values in moving windows are affected from damage before these effects are notices with the PCA values.This means that damage can be reported by MCCA ahead of MPCA. In addition to that, MCCA is superior in terms ofcomputational time. This is due to the fact that MPCA algorithm involves more complex and time-consuming procedureand calculations. This aspect may make the MCCA more desirable for real life application in which dealing with the largeamounts of data is the main challenge. It is also observed that, MPCA algorithm has a better performance in detectingminor structural changes. It can be concluded that the principal components values are more sensitive to minor variation andalteration than correlation values. This aspect was noticed in almost every damage scenarios.
Acknowledgements The authors would like to acknowledge Dr. Il-Bum Kwon from KRISS Korea for his expertise and support for the fiber opticsensing development and work at the University of Central Florida. For this, the authors are grateful to Dr. Kwon for his guidance and know-how. The research project described in this paper is supported by the Federal Highway Administration (FHWA) Cooperative Agreement AwardDTFH61-07-H-00040. The authors would like to express their profound gratitude to Dr. Hamid Ghasemi of FHWA for his support of this research.The authors would also like to acknowledge the contributions of their research collaborators and their research team. The opinions, findings, andconclusions expressed in this publication are those of the authors and do not necessarily reflect the views of the sponsoring organization.
298 M. Malekzadeh et al.
Fig. 32.9 MPCA (top) and MCCA (bottom) results for selected sensors (Case3)
References
1. Aktan AE, Catbas FN, Grimmelsman KA, Tsikos CJ (2000) Issues in infrastructure health monitoring for management. J Eng Mech ASCE126(7):711–724
2. Ferdinand P, Magne S, Dewynter-Marty V, Martinez C, Rougeault S, Bugaud M (1997) Applications of Bragg Grating Sensors in Europe. In:Proceedings of the 12th International Conference on Optical Fibre Sensors, Williamsburg, USA, p. 149
3. Hill KO, Fuji Y, Johnson DC, Kawasaki BS (1978) Photosensitivity in optical fiber waveguides: application to reflection fiber fabrication. ApplPhys Lett 3(2):647
4. Kwon IB, Baik SJ, Im K, Yu JW (2002) Development of fiber optic BOTDA sensor for intrusion detection. Sens Actuators A 101:77–845. Majumder M, Gangopadhyay TK, Chakraborty AK, Dasgupta K, Bhattacharya DK (2008) Review: Fibre Bragg gratings in structural health
monitoring—present status and applications. Sens Actuators A 147:150–1646. Worden K (1997) Structural fault detection using a novelty. J Sound Vib 201(1):85–1017. Catbas FN, Gokce HB, Gul M (2012) Nonparametric analysis of structural health monitoring data for identification and localization of changes:
Concept, lab, and real-life studies. Structural Health Monitoring, 11(5):613–6268. Posenato D, Lanata F, Inaudi D, Smith IFC (2008) Model-free data interpretation for continuous monitoring of complex structures. Adv Eng
Inform 22:135–1449. Gul M, Catbas FN (2008) Ambient vibration data analysis for structural identification and global condition assessment. J Eng Mech ASCE
134(8):650–66210. Zaurin R, Catbas FN (2011) Structural health monitoring using computer vision and influence lines. Struct Health Monit J SAGE Publications
10(3):309–33211. Zaurin R, Catbas FN (2010) Integration of computer imaging and sensor data for structural health monitoring of bridges. J Smart Mater Struct
(19) 015019:15