Recovery of macrobenthos in defaunated tropical estuarine sediments
Upload
independentCategory
view
2download
0
Journal of Hydrology (2006) 331, 434–445
ava i lab le at www.sc iencedi rec t . com
journal homepage: www.elsevier .com/ locate / jhydro l
Application of factor and cluster analysis forcharacterization of river and estuarine watersystems – A case study: Mahanadi River (India)
Unmesh Chandra Panda a,*, Sanjay Kumar Sundaray b, Prasant Rath c,Binod Bihari Nayak d, Dinabandhu Bhatta e
a Wetland Research Center, Chilika Development Authority, Bhubaneswar 751 001, Indiab Department of Chemistry, S.C.S. (Autonomous) College, Puri 752 001, Orissa, Indiac Department of Chemistry, Kalinga Institute of Industrial Technology (Deemed University), Bhubaneswar 751 024, Indiad Regional Research Laboratory, Bhubaneswar 751 013, Orissa, Indiae Department of Chemistry, Utkal University, Bhubaneswar 751 004, Orissa, India
Received 19 August 2005; received in revised form 14 May 2006; accepted 19 May 2006
Summary In order to establish the natural and anthropogenic processes and factors responsi-ble for enrichment of hydrological features, R-mode factor analysis and cluster analysis areapplied for three different sets of data i.e. total, fresh and saline influenced stations in Maha-nadi river systems. The results of R-mode factor analyses reveal that anthropogenic contribu-tion of nutrients is responsible for lowering DO and pH level of water, though its intensity isdifferent in fresh and saline systems as well as in different seasons. The different magnitudeof biochemical oxygen demand (BOD) loading with respect to total nitrogen and phosphorusdemonstrated the intensity of organic pollution in different water systems. The removal of sil-icate in saline system is clearly visible through factor analysis and different mode of associationof TSS is reflected seasonally. The relationships among the stations are highlighted by clusteranalysis represented in dendrograms to categorize different level of contamination. Consider-ing the diversity of the mechanisms played in estuarine and river water systems, it is felt thatstatistically their data should be treated separately on the basis of influence of salinity. It isconfirmed from our results that the relative importance water quality characteristics varieswith specific system. This study presents necessity and usefulness of multivariate statisticaltechniques for evaluation and monitoring network for effective management of fresh and estu-arine systems.
�c 2006 Elsevier B.V. All rights reserved.
KEYWORDSFactor analysis;Cluster analysis;River and estuarinesystems;Water quality;Mahanadi river;India
0d
022-1694/$ - see front matter �c 2006 Elsevier B.V. All rights reserved.oi:10.1016/j.jhydrol.2006.05.029* Corresponding author. Tel.: +91 94372 04580.E-mail address: [email protected] (U.C. Panda).
Application of factor and cluster analysis for characterization of river and estuarine water systems 435
Introduction
River plays a major role in assimilation or carrying off muni-cipal and industrial wastewater and runoff from agriculturalland. The municipal and industrial wastewater dischargeconstitutes a constant polluting source, whereas, the sur-face run-off is a seasonal phenomenon. Seasonal variationsin rainfall, surface run-off, interflow, ground water flowand pumped in and outflows have strong effects on river dis-charge and subsequently on the concentration of pollutantsin river water (Vega et al., 1998). Rivers constitute the maininland water resources for domestic, industrial and irriga-tion purpose; similarly estuaries are complex and dynamicenvironments, which receive large amount of anthropogenicdissolved contaminants from nearby urban areas and indus-trial sites. River water however is more concentrated withrespect to the nutrients, which is coming from landdrainage.
The multivariate statistical techniques are the appropri-ate tool for a meaningful data reduction and interpretationof multi-constituent chemical and physical measurements(Massart et al., 1988). The multivariate statistical tech-niques such as cluster analysis (CA) and factor analysis(FA) have widely been used as unbiased methods in analysisof water quality data for drawing meaningful conclusions(Vega et al., 1998; Helena et al., 2000; Voncina et al.,2002; Raghunath et al., 2002; Simeonov et al., 2003; Simeo-nova et al., 2003; Simeonov et al., 2004; Singh et al., 2004).The multivariate analysis is widely used to characterizedand evaluate river water quality and it is useful for evidenc-ing temporal and seasonal variations caused by natural andanthropogenic processes (Jayakumar and Siraz, 1997; Vegaet al., 1998; Reisenhofer et al., 1998; Helena et al., 2000;Singh et al., 2004).
Cluster analysis helps in grouping objects (cases) intoclasses (clusters) on the basis of similarities within a classand dissimilarities between different classes. The classcharacteristics are not known in advance but may be deter-mined from the analysis. The results of CA help in interpret-ing the data and indicate patterns (Vega et al., 1998).Factor analysis, which includes principal component analy-sis (PCA) is a very powerful technique applied to reducethe dimensionality of a data set consisting of a large numberof inter-related variables, while remaining as much as pos-sible the variability present in data set. This reduction isachieved by transforming the data set into a new set of vari-ables, the principal components (PCs), which are orthogonal(non-correlated) and are arranged in decreasing order ofimportance. Mathematically, the PCs are computed fromcovariance or other cross-product matrix, which describesthe dispersion of the multiple measured parameters to ob-tain eigenvalues and eigenvectors. Principal componentsare the linear combinations of the original variables andthe eigenvectors (Wunderlin et al., 2001). Varifactors(VFs), a new group of variables are obtained by rotatingthe axis defined by PCA. Varimax rotation distributes thePC loadings such that their dispersion is maximized by mini-mising the number of large and small coefficients (Richman,1986). Besides considerable data reduction, entire data setvariability is described through few VFs/PCs without losingmuch information. Further, grouping of the studied vari-
ables according to their common features by VFs helps indata interpretation (Vega et al., 1998; Morales et al.,1999; Helena et al., 2000; Simeonov et al., 2003; Singhet al., 2004).
Study area
Geographical setting
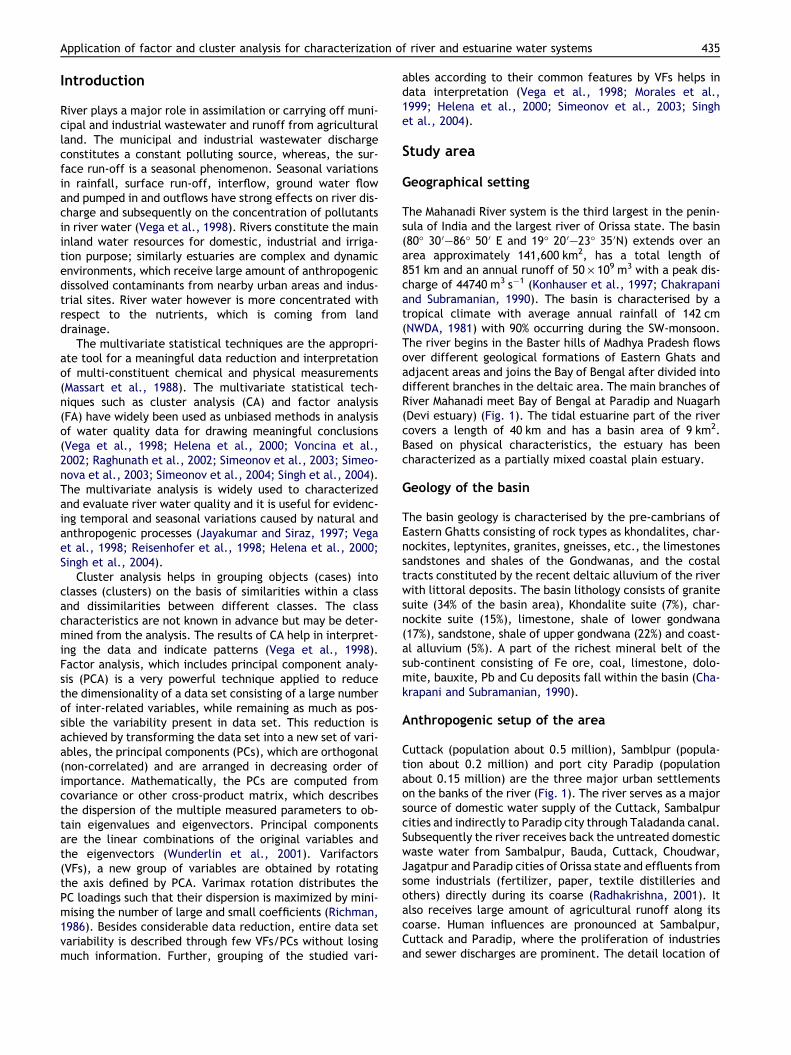
The Mahanadi River system is the third largest in the penin-sula of India and the largest river of Orissa state. The basin(80� 30 0–86� 50 0 E and 19� 20 0–23� 35 0N) extends over anarea approximately 141,600 km2, has a total length of851 km and an annual runoff of 50 · 109 m3 with a peak dis-charge of 44740 m3 s�1 (Konhauser et al., 1997; Chakrapaniand Subramanian, 1990). The basin is characterised by atropical climate with average annual rainfall of 142 cm(NWDA, 1981) with 90% occurring during the SW-monsoon.The river begins in the Baster hills of Madhya Pradesh flowsover different geological formations of Eastern Ghats andadjacent areas and joins the Bay of Bengal after divided intodifferent branches in the deltaic area. The main branches ofRiver Mahanadi meet Bay of Bengal at Paradip and Nuagarh(Devi estuary) (Fig. 1). The tidal estuarine part of the rivercovers a length of 40 km and has a basin area of 9 km2.Based on physical characteristics, the estuary has beencharacterized as a partially mixed coastal plain estuary.
Geology of the basin
The basin geology is characterised by the pre-cambrians ofEastern Ghatts consisting of rock types as khondalites, char-nockites, leptynites, granites, gneisses, etc., the limestonessandstones and shales of the Gondwanas, and the costaltracts constituted by the recent deltaic alluvium of the riverwith littoral deposits. The basin lithology consists of granitesuite (34% of the basin area), Khondalite suite (7%), char-nockite suite (15%), limestone, shale of lower gondwana(17%), sandstone, shale of upper gondwana (22%) and coast-al alluvium (5%). A part of the richest mineral belt of thesub-continent consisting of Fe ore, coal, limestone, dolo-mite, bauxite, Pb and Cu deposits fall within the basin (Cha-krapani and Subramanian, 1990).
Anthropogenic setup of the area
Cuttack (population about 0.5 million), Samblpur (popula-tion about 0.2 million) and port city Paradip (populationabout 0.15 million) are the three major urban settlementson the banks of the river (Fig. 1). The river serves as a majorsource of domestic water supply of the Cuttack, Sambalpurcities and indirectly to Paradip city through Taladanda canal.Subsequently the river receives back the untreated domesticwaste water from Sambalpur, Bauda, Cuttack, Choudwar,Jagatpur and Paradip cities of Orissa state and effluents fromsome industrials (fertilizer, paper, textile distilleries andothers) directly during its coarse (Radhakrishna, 2001). Italso receives large amount of agricultural runoff along itscoarse. Human influences are pronounced at Sambalpur,Cuttack and Paradip, where the proliferation of industriesand sewer discharges are prominent. The detail location of

Figure 1 Map showing station locations.
436 U.C. Panda et al.
major sewer and industrial effluent discharge points alongwith their main product, volume of effluent and their pollu-tant characteristics were presented in Table 1.
Literature review and thought process
Number of works were carried out on the role of differenturban and industrial effluents upon the water quality ofMahanadi river and estuarine systems (Upadhyay, 1988; Cha-krapani and Subramanian, 1990; Chakrapani and Subrama-nian, 1993; Das et al., 1997; Nanda and Tiwari, 2001;Radhakrishna, 2001; Nayak et al., 2002; Das, 2003; Sundarayet al., 2005), but no study has been carried out for evaluat-ing water quality using multivariate statistics.
In recent years, various statistical procedures based onmultivariate data, taken from river-estuarine system havebeen used to formulate environmental classification, whichhelps for better understanding of chemical processes occur-ring under river-estuarine environment. It is the normalpractice to analyses the whole river-estuarine system takingthem a single population. Considering the diversity of themechanisms played in estuarine and river water systems,it is felt that statistically they should be treated separatelyon the basis of influence of salinity. Thus in order to betterunderstanding of natural and anthropogenic flux responsiblefor characterization of water quality of Mahanadi river-estu-arine system, varimax rotated factor analyses and clusteranalyses are carried out for all stations, river stations andestuarine stations separately for two seasonal data sets.
Materials and methods
Sampling and analytical methods
The water samples were collected from 31 stations alongthe coarse of Mahanadi river system starting from Hirakudreservoir to the estuary points i.e. at Paradip and Nuagarh(Fig. 1). Samples were collected at three points (1/4, 1/2
and 3/4) across the river width, with the help of countryboats, thrice in the month of April 2002 (pre-monsoon)and September 2002 (monsoon). The mean value of threesets of data is taken for consideration. The onboard mea-surements of pH and conductance as well as fixation of DOwere carried out immediately after the collection of sam-ple. Other parameters such as NO2–N, NO3–N, NH4–N, totalnitrogen (TN), PO4–P, total phosphorus (TP), SiO4–Si, TSS,TDS, Cl�, SO2�
4 , hardness, alkalinity, Na, K, Ca and Mg wereanalysed following standard guidelines and procedures(APHA, 1998). Each analysis was done in triplicate and themean value was taken. DO and BOD were measured usingWinkler’s method. Cellulose nitrate membrane filters ofpore sized 0.45 lm was used for determination of TSS.The analytical data quality was ensured through carefulstandardization, procedural blank measurements, spikedand duplicate samples.
Data treatment and multivariate statistical methods
Multivariate analysis of the river and estuary water qualitydata sets was performed through cluster and factor analysistechniques (Wunderlin et al., 2001; Simeonova et al., 2003;Simeonov et al., 2003; Singh et al., 2004). The above statis-tical analyses were applied on experimental data standard-ized through z-scale transformation in order to avoid missclassification due to wide differences in data dimensionality(Liu et al., 2003). Further more, the standardization proce-dure eliminates the influence of different units of measure-ments and renders the data dimensionless.
Cluster analysis was applied to the water quality datasets with a view to group the similar sampling sites (spatialvariability) spread over the stretch and in the resulted den-drogram. Hierarchical agglomerative CA was performed onthe normalized data set by means of the Ward’s method,using euclidean distances as a measure of similarity. Thismethod uses the analysis of variable approach to evaluatethe distances between clusters, attempting to minimise

Table 1 List of major municipal township and industries along with their pollutant characteristics on the Mahanadi river basin
Major sewage/industries Location Product Approx. vol.of wastewater discharge
No. oftreatmentplant
Main pollutant
Sambalpur township U/s of st. 4 and 5 atBinakhandi,Sambalpur
– 264.54 M m3/year Nil Nutrients, BOD, oil,heavy metals,pathogenic bacteria
Cuttack township U/s of st. 16 atShikharpur and U/s ofst. 27 Khathjodi down,Cuttack
– 708.944 M m3/year Nil Nutrients, BOD, oil,heavy metals,pathogenic bacteria
Paradip township U/s of st. 25 atAtharbanki, Paradip
– – Nil Nutrients, BOD, oil,heavy metals,pathogenic bacteria
Indian Aluminium Co.,Hirakud
U/s of st. 4 atSambalpur
Aluminium 560 m3/day Nil Flouride,COD
Hirakud IndustrialWorks, Hirakud
U/s of st. 4 atSambalpur
Engineering goods 80 m3/day Nil Oil , grease, SS, COD
Hira cables, Hirakud U/s of st. 4 atSambalpur
Aluminiumconductor
72 m3/day Nil pH, oil and grease,SS, COD
Re-rolling mills,Hirakud
U/s of st. 4 atSambalpur
Conting andforging
156 m3/day Nil SS, BOD
IPINIT vanaspati,Jagatpur, Cuttack
U/s of st. 16 atShikharpur, Cuttack
Vanaspati,soap stock
80 m3/day Nil SS, BOD
Tatagarh Paper MillsChoudwar, Cuttack
U/s of st. 16 atShikharpur, Cuttack
Pulp and paper – Nil BOD, COD, SS pH
Orissa Textiles Mills,Choudwar, Cuttack
U/s of st. 16 atShikharpur, Cuttack
Cotton textiles 1507 m3/day Nil pH, BOD, dyes
Central Orissa StrawBoards, Jagatpur,Cuttack
U/s of st. 16 atShikharpur, Cuttack
Paper and duplexboards
181.5 m3/day Nil BOD, COD, SS pH
Paradip PhosphatesLtd., Paradip
U/s of st. 25 atAtharbanki, Paradip
Fertiliser anddiammoniumphosphate
3264 m3/day One pH, BOD, nutrients,flouride
Oswal FertiliserLtd., Paradip
U/s of st. 23 at Oswaldown, Paradip
Fertiliser anddiammoniumphosphate
4085 m3/day One pH, BOD, Nutrients,flouride
East Coast Brewariesand Distilleries Ltd.,Paradip
U/s of st. 25 atAtharbanki, Paradip
Breweries 376 m3/day Nil BOD, SS, pH, mineralacids, sugars
Application of factor and cluster analysis for characterization of river and estuarine water systems 437
the sum of squares of any two clusters that can be formed ateach step. Factor analysis was performed on correlation ma-trix of rearranged data (standardized data through z-scaletransfer matrix) for three different water systems. The var-iance/covariance and factor loadings of the variables witheigenvalues were computed. Data sets were processed usingroutines taken from SPSS-10.0 statistical software. Factorand cluster analyses were combined to assess the degreeof contamination, determination of chemical processesand to trace the diffusion paths.
The statistical analyses viz. factor and cluster analyseswere carried out for 21 parameters of 31 stations. The datawere divided into two different groups on the basis of chlo-ride concentration of the water for both the seasons. Sta-tions 1–19 and 26–28 were considered fresh/river waterinfluenced stations, whereas stations 20–25 and 29–31were considered as estuarine characterised stations forpre-monsoon and some extend for monsoon seasons. Thevarimax rotated factor analyses were carried out for total,
fresh and saline water systems, and factor loading were cal-culated using eigenvalue greater than 1 and sorted by theresults having values greater than 0.4 considering the signif-icant influence towards the geo-chemical processes (Sahuet al., 1998; Panigrahy et al., 1999; Rath et al., 2000).
Results and discussion
The water quality data of Mahanadi river systems for 21parameters with their range, mean and standard deviationamong 31 different stations are summarized in Table 2.For better understanding the distributions among the sta-tions were divided into two sets of data i.e. fresh water sys-tem and estuarine system.
Factor analysis
The sorted rotated factor analyses results along with eigen-values and percentages of variance for total stations, river

Table 2 Water quality parameters with ranges average value and standard deviation in 31 different stations of Mahanadi river – estuarine systems during two different seasons
Variables Fresh Saline
Pre-monsoon Monsoon Pre-monsoon Monsoon
Range Average Standarddeviation
Range Average Standarddeviation
Range Average Standarddeviation
Range Average Standarddeviation
pH 6.68–7.63 7.39 0.22 6.85–7.96 7.58 0.25 3.23–8.03 7.26 1.56 4.89–8.08 7.45 0.97Conduct. 142–697.5 315.3 142.9 128.4–361.2 158.8 47.5 3476–22535 13666.1 6861.3 165.5–4402.5 1017.0 1442.9DO 5.87–7.99 7.17 0.60 6.02–8.9 7.73 0.89 3.4–7.79 6.83 1.38 5.37–8.13 7.42 0.85BOD 0.29–5.06 1.36 1.16 0.44–3.03 1.08 0.71 0.55–6.27 2.05 1.74 0.38–4.75 1.42 1.31TDS 72.71–361.7 176.0 77.6 66.68–167.2 83.8 20.6 1767–11716 7260.5 3663.9 87.8–7301.5 1034.5 2365.9TSS 3.0–18.6 8.7 4.2 42–96.4 72.12 13.56 7.5–27.2 14.1 6.1 31–86.2 63.80 18.76Cl 9.93–100.68 19.98 20.88 4.26–63.81 13.5 11.8 1038–13152 5531.9 3771.4 25.6–4413.5 582.70 1439.61SO4 1.29–28.1 15.07 6.29 1.58–9.36 3.24 1.60 55.3–175 118.8 39.9 2.36–360.5 50.12 117.06SiO4 4.0–14.37 5.24 2.26 3.49–9.58 4.77 1.22 1.33–5.34 3.14 1.08 4.023–6.78 4.74 0.86NO2 0.168–3.118 0.613 0.773 0.132–2.898 0.528 0.641 0.137–0.859 0.397 0.222 0.187–7.539 1.15 2.40NO3 1.25–45.65 9.76 10.73 4.25–26.72 9.84 5.63 2.91–34.35 9.69 9.52 5.33–53.28 12.96 15.29NH3 2.76–28.52 6.60 5.32 1.33–19.15 4.84 3.50 5.70–69.45 15.58 20.65 2.134–11.78 4.89 3.19Total N 12.7–183.3 33.9 39.0 15.17–78.32 29.66 16.35 14.74–320.12 67.38 96.63 14.13–124.58 33.61 34.53PO4 1.01–32.67 5.46 8.82 1.01–12.8 4.02 2.87 1.11–95.66 30.02 36.93 2.86–86.89 15.78 27.03Total P. 1.68–54.77 11.07 15.04 3.04–42.56 9.76 9.51 2.21–310.55 75.70 108.04 7.3–270.32 42.33 85.72Hardness 86.9–143.69 107.82 13.27 52.98–93.97 69.98 12.93 434.9–2587.1 1592.8 824.4 100.56–1575 417.9 467.8Alkalinity 69–158 85.64 20.19 64–98 73.09 8.24 21–115 88.8 27.1 28–92 71.9 18.9Na 9.6–94.5 21.95 20.90 7.3–55.9 13.74 9.90 502.3–4752.7 2543.8 1501.7 10.9–2643 556.1 862.6K 2.1–15.2 4.50 3.77 1.93–6.9 2.80 1.21 34.60–214.2 121.4 64.2 2.41–117.8 29.31 39.41Ca 18.81–29.34 23.09 2.71 10.28–21.30 14.51 2.47 34.90–144.8 99.6 39.1 18.42–113.32 43.85 28.69Mg 8.85–17.79 12.19 1.78 4.78–13.28 8.20 2.78 76.99–544.1 326.7 177.1 13.26 313.98 74.95 96.66
Units: DO, BOD, TDS, TSS, Cl, SO4, SiO4, hardness, alkalinity, Na, K, Ca and Mg are in mg L�1 NO2, NO3, NH4, total nitrogen, PO4 and total phosphorus are in lmol L�1 EC is in lS cm�1.
438U.C.Pan
daetal.

Table 3 R-mode varimax rotated factor analyses of hydrological parameters in Mahanadi river-estuarine system (total no. of observations = 31)
Total Fresh Saline
Variable Factor 1 Factor 2 Factor 3 Variable Factor 1 Factor 2 Factor 3 Variable Factor 1 Factor 2 Factor 3
Pre-monsoonCa 0.991 NH3–N 0.895 NH3–N 0.979Na 0.991 TN 0.871 0.432 pH �0.978K 0.985 NO3–N 0.829 0.445 DO �0.977Hardness 0.978 NO2–N 0.753 0.577 TN 0.977Cl� 0.977 PO4–P 0.724 0.469 0.455 BOD 0.976EC 0.975 TP 0.678 0.519 Alkalinity �0.958TDS 0.974 EC 0.658 0.654 TP 0.955Mg 0.969 pH �0.654 �0.500 NO3–N 0.945SO4 0.901 DO �0.549 NO2–N 0.939
PO4–P 0.821pH �0.971 TSS 0.841NH3–N 0.935 K 0.459 0.813 Na 0.989TN 0.910 SiO3–Si 0.480 0.808 K 0.981DO �0.892 Cl� 0.502 0.796 Ca 0.967TP 0.404 0.885 SO4 0.726 Hardness 0.959
Na 0.583 0.692 Cl� 0.957BOD 0.786 0.415 TDS 0.646 0.661 TDS 0.953PO4–P 0.482 0.755 BOD 0.550 0.598 EC 0.952Alkalinity �0.657 0.540 Mg 0.936
Ca 0.877 SiO3–Si �0.846NO2–N 0.899 Hardness 0.869 SO4 0.557 0.696SiO3–Si �0.477 0.808 Mg 0.782NO3–N 0.629 0.638 Alkalinity 0.545 0.759 TSS 0.970TSS 0.627
Eigenvalues 10.738 5.825 2.271 Eigenvalues 15.104 2.186 1.213 Eigenvalues 10.767 7.590 1.128% Var 51.1 27.7 10.8 % Var 71.9 10.4 5.8 % Var 51.3 36.1 5.4
Cum % 51.1 78.8 89.6 Cum % 71.9 82.3 88.1 Cum % 51.3 87.4 92.8
MonsoonCl� 0.936 Na 0.906 pH �0.984Na 0.933 SO4 0.905 TN 0.975EC 0.930 Cl� 0.901 NO2–N 0.969SO4 0.93 SiO3–Si 0.886 TP 0.963TDS 0.929 K 0.867 0.445 Na 0.959pH �0.924 EC 0.859 0.471 Cl� 0.958TP 0.921 TDS 0.849 0.473 NO3-N 0.955K 0.912 NH3–N 0.771 0.551 K 0.952NO2–N 0.895 pH �0.618 0.462 SO4 0.950PO4–P 0.893 EC 0.949NO3–N 0.815 0.507 TN 0.853 TDS 0.947TN 0.759 0.502 PO4–P 0.833 PO4–P 0.945Alkalinity �0.723 0.479 TP 0.486 0.824 BOD 0.909BOD 0.690 0.485 NO3–N 0.471 0.808 Alkalinity �0.894
Alkalinity 0.421 0.792 DO �0.858 �0.426Hardness 0.953Mg 0.948 TSS 0.863 NH3–N 0.718 0.608Ca 0.928 Mg 0.792 TSS �0.618
Hardness 0.413 0.748NH3–N 0.865 Ca 0.724 Hardness 0.924SiO3–Si 0.838 BOD 0.630 0.661 Mg 0.918DO �0.409 �0.681 NO2–N 0.618 0.623 Ca 0.879
DO �0.440 �0.543 SiO3–Si �0.683TSS 0.949
Eigenvalues 13.739 2.622 2.029 1.215 Eigenvalues 13.221 2.551 1.649 Eigenvalues 16.426 2.535 1.105% Var 65.4 12.5 9.7 5.8 % Var 63.0 12.1 7.9 % Var 78.2 12.1 4.2Cum % 65.4 77.9 87.6 93.3 Cum % 63.0 75.1 83.0 Cum % 78.2 90.3 94.5
Application of factor and cluster analysis for characterization of river and estuarine water systems 439
and estuarine stations are carried out separately and pre-sented in Table 3.
Rotation of the axis defined by factor analysis produceda new set of factors, each one involving primarily a sub setof the original variables with a little overlap as possible, sothat the original variables are divide into groups. The fac-tor analysis of the present data sets of Mahanadi riverestuarine systems further sorted by the contribution of less
significant variables (<0.4 factor score). A varimax rotation(raw) of the different varifactors of eigenvalue greaterthan 1, were further cleaned up by this technique and invarifactors original variables participated more clearly(Table 3). Liu et al., 2003 classified the factor loading as‘‘strong’’, ‘‘moderate’’ and ‘‘week’’ corresponding toabsolute loading values of >0.75, 0.75–0.50 and 0.50–0.40 respectively.

440 U.C. Panda et al.
Pre-monsoon seasonTotal stations. There are three factors or PCs, explaining89.6% of the total variance for pre-monsoon, which issufficient to give a good idea of data structure. Factor-1accounted for 51.1% of the total variance, which is strongpositively loaded with Na, K, Ca, Mg, Hardness, Cl�, EC,SO2�
4 and TDS, which can be interpreted as a mineral com-ponent of the estuarine water. This clustering of variablespoints to a common origin for these minerals likely fromseawater.
The second factor explained 27.7% of the total varianceis found to be strongly associated with NH4–N, TN, TP,PO4–P, NO3–N and BOD, with strong negative loading ofpH, DO and moderate loading of alkalinity. Strong negativeloading of pH and DO in factor 2 with positive scores of TN,TP and inorganic nutrients represents anthropogenic pollu-tion sources and can be explained that high levels of dis-solved organic matter consume large amount of oxygen,which undergoes decomposition processes leading to for-mation of organic acids, CO2 and ammonia. Hydrolysis ofthese acids, dissolution of CO2 in water column (Vegaet al., 1998; Singh et al., 2004) and/or oxidation of NHþ4ions under oxic conditions by the nitrification processes(Kim et al., 2003; Kim et al., 2005) cause a decrease ofwater pH values. The latter process demonstrates the low-ering of pH in presence of excess ammonia, which origi-nates from fertilizer industries, manufacturing urea andcommercial composites.
RCOOH�! �RCOO� þ Hþ
CO2 þ H2O�!H2CO3 ¢Hþ þ HCO�3NHþ4 þ 2O2
�! �NO�3 þ H2 Oþ 2Hþ
Among the above three processes, the second process is themost likely to be dominating one in the present study envi-ronment, as it is supported by the negative factor loading ofalkalinity (bicarbonates).
The third factor is loaded with NO2–N, NO3–N, SiO3–Siand TSS. In this factor, TSS may be responsible for increas-ing NO2–N, SiO3–Si, NO3–N and BOD.
Fresh water. Factor-1 contributed 71.9% of the totalvariance. All the inorganic and organic form of nitrogenand phosphorous along with EC, TDS, Na, Cl�, BOD andalkalinity are strong to moderately correlated, where asDO and pH are moderate negatively loaded. The nutrientsduring this season originate from anthropogenicsources such as waste disposal activities from sewers/industries.
The second factor contributed 10.4% of total variance. Inthis factor TSS along with K, SiO3–Si, Cl�, SO2�
4 , Na, TDS,BOD, EC and NO2–N are positively loaded with weak nega-tive loading of pH. This factor can be attributed to the sec-ondary pollution sources of the river systems. The presenceof suspended solids in this factor indicates towards theirorigin from the runoff of the agricultural field and solidwaste disposal activities of Cuttack township. From thephysico-chemical data matrix, it was found that the TSSload was highest at Kathajodi down stations (downstreamof Cuttack township sewage discharge point) along withsome non point sources, most probably from land drainage(Sundaray et al., 2005).
The third factor is loaded with Ca, hardness, Mg, alkalin-ity along with weakly loaded with phosphorous and nitro-gen. This factor explained 5.8% of the total variance andrepresents mineral related hydrochemistry of the river.
Saline water. The factor-1 of estuarine water system con-tributed 51.3% of the total variance. This factor is strongnegatively loaded with pH, DO and alkalinity along withpositive loading of all nutrients (except SiO4–Si) andBOD. This indicates the contribution of organic pollutantload from Paradip municipal sewage through Atharbankicreak and the industrial activities in the estuarine regionof Mahanadi river. The untreated acidic effluents fromthe fertilizer plants are mainly responsible for increasingammonia, nitrogen and phosphorous concentration (Nayaket al., 2002).
Na, K, Ca, hardness, Cl, TDS, EC, Mg and SO2�4 with neg-
ative SiO4–Si are loaded in second factor suggesting theircontribution from saline source. This factor represented36.1% of the total variance. With increasing salinity in theestuarine region, the dissolved silica is removed by adsorp-tion on the suspended sediments (Bien et al., 1958; Liss andSpencer, 1970). The presence of large amount of siliceousmaterials in association with sea-salts is favourable for abi-ological removal of silicate from the water column in theestuarine region of Mahanadi.
TSS in the third factor loaded independently. This factorcontributes 5.4% of the total variance. The single loading ofTSS in this factor may be correlated with re-suspended sed-iments through churning action by tidal currents.
Monsoon seasonTotal stations. There are four factors or PCs explaining93.3% of the total variance. Factor-1 contributed 65.4% ofthe total variance, which is strongly loaded with Cl�, Na,EC, SO2�
4 , TDS, TP, K, NO2–N, NO3–N, PO4–P and TN withmoderate factor score of BOD along with negative loadingof pH, alkalinity and DO. This factor is loaded with both min-erals and nutrients indicating towards the origin in river run-off from the agricultural field along with waste disposalactivity. This results suggested that most of the variationis explained by soluble salts (natural) and inorganic/organicnutrient pollutants (anthropogenic).
The second factor is accounting for only 12.5% of thetotal variance and strong positively loaded with hardness,Ca and Mg. This clustering of variables points to commonsources of natural processes of dissolution of soil constitu-ents from the Mahanadi river catchments mainlycarbonates.
The third factor is strongly loaded with NH4–N, SiO3–Siand weekly loaded with NO2–N, TN, alkalinity and BOD withnegative DO. TSS in this season is independently loaded infactor 4 probably from land drainage.
Fresh water. Factor-1 contributed 63.0% of the total vari-ance. The sewage from the major townships (Cuttack, Sam-balpur and Paradip), and most of the industrial effluents inthe catchments are acidic in nature and carries higher levelof Na, SO2�
4 , Cl�, SiO4–Si, K, EC, TDS, ammonia, etc. Thehigher solubility of the parameters in acidic sewage/efflu-ents is responsible for their inverse relationship with pH.SO2�
4 , Na, K, Cl�, EC, and NH4–N during the monsoon season

Application of factor and cluster analysis for characterization of river and estuarine water systems 441
are contributed from the leachates of solid wastes (munici-pal and hospital) that enter into river water through smallchannels. The absence of negative loading of DO reflectsthe inorganic contribution rather than organic pollution.
The second factor contributes 12.1% of total variance. Inthis factor nutrients (except SiO4–Si) and alkalinity are sec-ondary pollution sources, which is responsible for loweringthe DO of the river system.
In the third factor, TSS from the catchment washing isresponsible for increasing the Mg, hardness, Ca, BOD andNO2–N. This factor explains 7.9% of the total variance.
Saline water. The factor-1 of estuarine system contributed78.2% of the total variance, where all the nutrients alongwith Na, Cl, K, SO2�
4 , EC, TDS and BOD are equally responsi-ble for depressing DO, pH and alkalinity. The negative load-ing of alkalinity and moderately negative loading of TSS inthis factor indicates that these above parameters are mainlycontributed from the industrial activities, sewers from ma-jor townships and saline sources.
This second factor contributed 12.1% of the total vari-ance, where positive hardness, Mg, Ca and NH3 loaded withnegative DO. This is primarily a hardness factor. SiO4–Si infactor-3 is loaded independently suggesting their enrich-ment from land drainage through floodwater.
Cluster analysis
The relationships among the stations are obtained throughcluster analyses using Word’s method (linkage betweengroup), euclidian distance as similarity measure and synthe-sized in dendrograms (Fig. 2). The physico-chemical param-eters like pH, EC, DO, BOD, TDS, TSS, Cl�, SO2�
4 , hardness,alkalinity, Na, K, Ca, Mg, SiO4–Si, NO2–N, NO3–N, NH4–N,TN, PO4–P and TP are used as variables. The dendrogramsare performed separately for total stations, fresh water sys-tem and saline water system for better assessment regard-ing the level of contamination and showed a sequence inthe association, displaying the information as degree of con-tamination. The dendrograms indicate the status of pollu-tion as well as the effect of contamination into thestations, which are categorized into different groups.
Total stationsThere are three and four major groups obtained from pre-monsoon and monsoon season respectively, taking total sta-tions and the possible groupings are summarised below.
Groups Pre-monsoon Monsoon
I. 11–12–10–13–14–7–8–1–2–26–6–15–16–19–3–9–27–18–28–4–5–27
18–19–17–9–10–8–12–7–14–13–11–2–3–4–1–28–6–15–16–26–27–20–5
II. (20–29) 21–29–22–30–23–31
III. (23–24–31)–(22–25)–(21–30)
24
IV. – 25
In pre-monsoon season the group-I is related with freshwater influenced and group-III is related with estuarine
water characteristics, where as group-II is related withslightly influenced by saline water. Monsoon season consistsof four groups. These four grouping of stations are mainlybased upon the chloride/saline concentrations rather thanpollution characteristics.Fresh waterIn fresh water system, cluster analysis is rendered asdendrograms (Fig. 2(a) and (b)), where all twenty-two sam-pling sites on the river water system are grouped into three(pre-monsoon) and four (monsoon) statistically significantclusters. The clustering procedure generated three majorgroups of sites in a very convincing way, as the sites ingroups have similar characteristics features and naturalbackground source types.
Groups Pre-monsoon Monsoon
I. 11–12–10–13–14–7–8–1–2–26–6–15
(18–19–17)–(9–10–8–12–7–14–13–(11))
II. (16–19)–(3–9–17–18–28–4)
(2–3–4)–(1–28)–6
III. 5–27 15–16–26–27IV. – 5
In pre-monsoon season group-I may be considered asnatural background type or less polluted group of stationsand group-II may be related to slightly polluted stations,however group-III as highly polluted group of stations.This group III consists of stations 5 and 21, which arehighly influenced by sewage of Sambalpur and Cuttacktown respectively (downstream of sewage dischargepoints). In monsoon season the degree of contaminationis clearly reflected among the groups. Group-III (stations15, 16, 26 and 27) and Group-IV (station 5) are relatedwith the stations affected by the sewage from Cuttackand Sambalpur town respectively, whereas Group-I andGroup-II are related with less polluted and moderate pol-luted regions. The stations 15 and 26 are present at downstream of two small drainage channels near Tulasipur andPuri Ghat of Cuttack city, which are linked with solidwaste dumping sites of largest hospital of state (S.C.B.Hospital) and Cuttack Municipality respectively. The chan-nels are almost dry in pre monsoon season but carry theleachates from dumping sites in monsoon season, whichmay be responsible for the change of the pollution statusof the mentioned stations.
Saline waterThere are three and two major groups are visualized in thesaline water system for pre-monsoon and monsoon seasonsrespectively, which is summarised as below.
Groups Pre-monsoon Monsoon
I. 20–29 (21–29–20–22–30)–(23–31–24)II. 22–25–21–30 25III. (23–24)–31 –

Figure 2 (a) Dendrogram showing relationship among stations in Mahanadi river-estuarine system during pre-monsoon season (no.of variables – 15). (b) Dendrogram showing relationship among stations in Mahanadi river-estuarine system during monsoon season(No. of variables – 15).
442 U.C. Panda et al.

Fig. 2 (continued)
Application of factor and cluster analysis for characterization of river and estuarine water systems 443
In pre-monsoon season, group-I consists of stations hav-ing less saline, whereas group-II and group-III consist of highsaline influenced stations. Further group-II is related withmoderately and group-III is highly seawater-influenced sta-
tions. This grouping is mainly based upon seawater charac-teristics. In case of monsoon season, group-I may beconsidered as stations related with less polluted, whereasgroup-II as highly polluted stations.

444 U.C. Panda et al.
Conclusion
Factor analysis of all the three sets of data for pre monsoonseason, the high positive loading of nutrients along withnegative scores of DO and pH demonstrate that compara-tively acidic nature of sewage/effluents are the major con-tribution of nutrients and mostly the DO is utilized tobreakdown organic matter and to release nutrients (Shirod-kar and Jayakumar, 1990). Comparatively high negative fac-tor loading of DO, pH and alkalinity in saline systemdemonstrate high intensity of pollution in the estuarine sys-tem than river/fresh water system. The association of TSS,K, SiO4–Si, Cl
�, SO2�4 , Na, BOD and NO2–N in factor 2 of fresh
water region of pre-monsoon season is related with anthro-pogenic activities like sewage from different townships.
In monsoon season, the factor-1 of all the three setsmay be related with pollution sources of agriculturalrun-off. Comparatively higher contribution of nutrientsmay be from the land drainage is observed in factor-2of fresh water region, however its contribution in salinesystem is not found.
Low factor scores of BOD are found in fresh water systemin comparison to saline for both the season imply that mag-nitude of microbial pollution are more saline/estuarinesystem.
The different mode of enrichment of parameters isclearly reflected for two different water quality systems.
It implies that for rapid assessment of water quality, onlyone site in each cluster (either fresh or saline water sys-tems) may serve as good in spatial assessment of the waterquality as the whole network (Singh et al., 2004). It is evi-dent that CA technique is useful in offering reliable classifi-cation of fresh and estuarine water systems in the wholeregion and make possible to design a future spatial samplingstrategy in an optimal manner for getting good conclusiveresult.
Acknowledgements
The authors are thankful to Head, Department of chemistry,Utkal University, Bhubaneswar for providing necessaryfacilities.
References
APHA, AWWA, WEF, 1998. Standard methods for the examination ofwater and wastewater. 20th edition, American Public HealthAssociation, Washington DC, USA.
Bien, G.S., Contois, D.E., Thomas, W.H., 1958. The removal ofsoluble silica from fresh water entering the sea. Geochimica etCosmochimica Acta 14, 35–54.
Chakrapani, G.J., Subramanian, V., 1990. Preliminary studies onthe geo-chemistry of the Mahanadi basin, India. ChemicalGeology 81, 241–253.
Chakrapani, G.J., Subramanian, V., 1993. Rates of erosion andsedimentation in the Mahanadi river basin India. Journal ofHydrology 149, 39–48.
Das, J., 2003. Geochemistry of trace elements in the groundwater of Cuttack city, India. Water Air and Soil Pollution 147,129–140.
Das, J., Das, S.N., Sahoo, R.K., 1997. Semidiurnal variation of somephysico-chemical parameters in the Mahanadi estuary, EastCoast of India. Indian Journal of Marine Sciences 26, 323–326.
Helena, B., Pardo, R., Vega, M., Barrado, E., Fernandez, J.M.,Fernandez, L., 2000. Temporal evolution of groundwater com-position in an alluvial (Pisuerga river, Spain) by principalcomponent analysis. Water Research 34, 807–816.
Jayakumar, R., Siraz, L., 1997. Factor analysis in hydro geochem-istry of coastal aquifers – a preliminary study. EnvironmentalGeochemistry 31 (3/4), 174–177.
Kim, R.K., Lee, J., Chang, H.W., 2003. Characteristics of organicmatter as indicators of pollution from small-scale livestock andnitrate contamination of shallow groundwater in an agriculturalarea. Hydrological Processes 17, 2485–2496.
Kim, J., Kim, R., Lee, J., Cheong, T., Yum, B., Chang, H., 2005.Multivariate statistical analysis to identify the major factorsgoverning groundwater quality in the coastal area of Kimje,South korea. Hydrological Processes 19, 1261–1276.
Konhauser, K.O., Powell, M.A., Fife, W.S., Longstaffle, F.J.,Tripathy, S., 1997. Trace element geochemistry of river sedi-ment, Orissa state, India. Journal of Hydrology 193, 258–269.
Liss, P.S., Spencer, C.P., 1970. Abiological process in the removalof silicate from seawater. Geochimica et Cosmochimica Acta 34,1073–1088.
Liu, C.W., Lin, K.H., Kuo, Y.M., 2003. Application of factoranalysis in the assessment of ground water quality in ablackfoot disease area in Taiwan. Science of the TotalEnvironment 313, 77–89.
Massart, D.L., Vandeginste, B.G.M., Deming, S.N., Michotte, Y.,Kaufman, L., 1988. Chemometrices: A Textbook. Elsevier,Amsterdam.
Morales, M.M., Marti, P., Liopis, A., Campos, L., Sagrado, S., 1999.An environmental study by factor analysis of surface sea watersin the gulf of Valencia (Western Mediterranean). AnalyticaChimica Acta 394, 109–117.
Nanda, S.N., Tiwari, T.N., 2001. Effect of discharge of municipalsewage on the quality of river Mahanadi at Sambalpur. IndianJournal of Environmental Protection 21 (4), 336–343.
Nayak, B.B., Das, J., Panda, U.C., Acharya, B.C., 2002. Industrialeffluents and municipal sewage contamination of Mahanadiestuarine water, Orissa. Proceedings, Published Allied PublishersPvt. Limited, New Delhi, India, pp. 77–86.
NWDA. (National Water Development Agency), 1981. Mahanadimaster plan-water balance studies. National Water DevelopmentAgency, New Delhi, 150pp.
Panigrahy, P.K., Das, J., Das, S.N., Sahoo, R.K., 1999. Evaluation ofthe influence of various physico-chemical parameters on coastalwater quality, around Orissa, by factor analysis. Indian Journalof Marine Sciences 28, 360–364.
Radhakrishna, I., 2001. Saline fresh water interface structure inMahanadi delta region, Orissa, India. Environmental Geology 40(3), 369–380.
Raghunath, R., Murthy, T.R.S., Raghavan, B.R., 2002. The utility ofmultivariate statistical techniques in hydrogeochemical studies:an example from Karnataka, India. Water Research 36, 2437–2442.
Rath, P., Bhatta, D., Sahoo, B.N., Panda, U.C., 2000. Multi-variate statistical approach to study physio-chemical charac-teristics in Nandira-Brahmani river. Pollution Research 4,201–210.
Reisenhofer, E., Adami, G., Barbieri, P., 1998. Using chemical andphysical parameters to define the quality of karstic fresh waters(Timavo River, North-eastern Italy): a chemometric approach.Water Research 32, 1193–1203.
Richman, M.B., 1986. Rotation of principal components. Journal ofClimatology 6, 293–335.
Sahu, K.C., Panda, U.C., Mohapatra, D.M., 1998. Geo-chemistryand minerology of sediments in Rushikulya estuary, East

Application of factor and cluster analysis for characterization of river and estuarine water systems 445
coast of India. Chemical Environmental Research 7 (1&2),77–92.
Shirodkar, P.V., Jayakumar, D.A., 1990. Nutrients and dissolvedoxygen in the upper 1000 m in equatorial Western Indian Ocean.Indian Journal of Marine Sciences 19, 47–52.
Simeonova, P., Simeonov, V., Andreev, G., 2003. Analysis of thestruma river water quality. Central European Journal of Chem-istry 2, 121–126.
Simeonov, V., Stratis, J.A., Samara, C., Zachariadis, G., Voutsa, D.,Anthemidis, A., Sofoniou, M., Kouimtzis, Th., 2003. Assessmentof the surface water quality in Northern Greece. Water Research37, 4119–4124.
Simeonov, V., Simeonova, P., Tsitouridou, R., 2004. Chemometricquality assessment of surface waters two case studies. Chemicaland Engineering Ecology 11 (6), 449–469.
Singh, K.P., Malik, A., Mohan, D., Sinha, S., 2004. Multivariatestatistical techniques for the evaluation of spatial and temporalvariations in water quality of Gomti River (India) – a case study.Water Research 38, 3980–3992.
Sundaray, S.K., Panda, U.C., Nayak, B.B., Bhatta, D., 2005.Behaviour and distribution pattern of nutrients in river–estua-rine waters of Mahanadi, Orissa, India. Asian Journal of Water,Environment and Pollution 2 (1), 77–84.
Upadhyay, S., 1988. Physico-chemical characteristics of the Maha-nadi estuarine eco-system. East coast of India. Indian Journal ofMarine Sciences 17, 19–23.
Vega, M., Pardo, R., Barrado, E., Deban, L., 1998. Assessmentof seasonal and polluting effects on the quality of riverwater by exploratory data analysis. Water Research 32,3581–3592.
Voncina, D.B., Dobcnik, D., Novic, M., Zupan, J., 2002. Chemo-metric characterisation of the quality of river water. AnalyticaChimica Acta 462, 87–100.
Wunderlin, D.A., Diaz, M.P., Ame, M.V., Pesce, S.F., Hued, A.C.,Bistoni, M.A., 2001. Pattern recognition techniques for theevaluation of spatial and temporal variations in water quality. Acase study: Suquia river basin (Cordoba-Argentina). Waterresearch 35, 2881–2894.
Copyright © 2022 FDOKUMEN