
Application of an energy management and control system to assess the potential of different control...
10
Energy and Buildings 42 (2010) 2258–2267 Contents lists available at ScienceDirect Energy and Buildings journal homepage: www.elsevier.com/locate/enbuild Application of an energy management and control system to assess the potential of different control strategies in HVAC systems Guillermo Escrivá-Escrivá ∗ , Isidoro Segura-Heras, Manuel Alcázar-Ortega Institute for Energy Engineering, Universidad Politécnica de Valencia, Camino de Vera, s/n, edificio 8E, escalera F, 2 a planta, 46022 Valencia, Spain article info Article history: Received 19 February 2010 Received in revised form 18 May 2010 Accepted 20 July 2010 Keywords: Energy saving strategies Energy management and control system HVAC split system Demand response abstract The significant and continuous increment in the global electricity consumption is asking for energy saving strategies. Efficient control for heating, ventilation and air-conditioning systems (HVAC) is the most cost- effective way to minimize the use of energy in buildings. In this framework, an energy management and control system (EMCS) has been developed to schedule electricity end-uses in the campus of the Universidad Politécnica de Valencia (UPV), Spain. This paper presents an evaluation performed by using the EMCS of different control strategies for HVAC split systems. It analyzed the effect of different schedules for a common air-conditioning device and demand response strategies are tested in several situations. The economic saving is calculated taking into account the electricity contract clauses. Finally, a test is made for the control of a group of similar devices in order to reduce the maximum peak power in consumption and to obtain a flexible load shape with the HVAC loads. The studies are then extrapolated to a larger system, the whole University campus, for which energy and economic savings are quantified. © 2010 Published by Elsevier B.V. 1. Introduction Nowadays, due to the requirements for the indoor air quality, the visual and thermal comfort levels have been increased [1,2]. Heating, ventilation and air-conditioning systems (HVAC) repre- sent an important share of the electricity consumption (about 30%) in a building [3]. This implies that important energy and economic savings can be achieved by improving the efficiency in these sys- tems, and therefore a substantial reduction in the environmental impacts can be also achieved [4]. There are several types of air- conditioning systems: the split and the centralized systems are the most usual configurations. An efficient use and control of these systems could result in important energy and economical savings without affecting the users comfort. Common centralized systems can be more efficiently managed, since they usually have an associ- ated central control unit in which internal temperatures of several rooms and presence control devices are included [5–8]. Efficiency improvement actions are more difficult to implement for split sys- tems because several units supply comfort to different areas and no centralized control system usually exists. Nevertheless, these split systems offer a large potential for savings. About 1500 HVAC split systems are spread out around the cam- pus of the Universidad Politécnica de Valencia (UPV) [9] and they ∗ Corresponding author. Tel.: +34 963 879 240; fax: +34 963 877 272. E-mail address: [email protected] (G. Escrivá-Escrivá). are being connected gradually to an energy management and con- trol system (EMCS) [10]. Each device requires a skilful management to achieve an efficient operation. Many studies have analyzed different control strategies for indi- vidual air-conditioning equipments [11–14]. This paper focuses on the evaluation of different control strategies that can be imple- mented in the developed ECMS for HVAC split devices installed in premises of the UPV developed in order to get an optimal strategy to apply throughout the whole University. Results of var- ious tests were analyzed. These tests focused on strategies that can be applied using the technology tools installed by means of the project DERD [10]. In particular, energy saving strate- gies of disconnection have been studied. A major impact on the University electric shape load is expected making possible for inte- gration of the University in demand response programs in the future. In Section 2, the EMCS architecture and the objectives of the project for the University are introduced. Section 3 outlines the HVAC physical system studied including the characteristics of the site and the HVAC split device. The proposed methodology and the parameters of the test are presented in Sections 4 and 5 respec- tively. Afterwards, in Sections 6 and 7 savings and results are commented for different kinds of disconnection tests. An appli- cation is carried out for a group of devices working under a load displacement condition and an extrapolation to the whole Univer- sity is set in Section 8, including an evaluation of the flexibility obtained in the aggregated load shape and the corresponding 0378-7788/$ – see front matter © 2010 Published by Elsevier B.V. doi:10.1016/j.enbuild.2010.07.023
-
Upload
independent -
Category
Documents
-
view
2 -
download
0
Transcript of Application of an energy management and control system to assess the potential of different control...
Ao
GI
a
ARRA
KEEHD
1
tHsistictswcaritcs
p
0d
Energy and Buildings 42 (2010) 2258–2267
Contents lists available at ScienceDirect
Energy and Buildings
journa l homepage: www.e lsev ier .com/ locate /enbui ld
pplication of an energy management and control system to assess the potentialf different control strategies in HVAC systems
uillermo Escrivá-Escrivá ∗, Isidoro Segura-Heras, Manuel Alcázar-Orteganstitute for Energy Engineering, Universidad Politécnica de Valencia, Camino de Vera, s/n, edificio 8E, escalera F, 2a planta, 46022 Valencia, Spain
r t i c l e i n f o
rticle history:eceived 19 February 2010eceived in revised form 18 May 2010ccepted 20 July 2010
a b s t r a c t
The significant and continuous increment in the global electricity consumption is asking for energy savingstrategies. Efficient control for heating, ventilation and air-conditioning systems (HVAC) is the most cost-effective way to minimize the use of energy in buildings. In this framework, an energy managementand control system (EMCS) has been developed to schedule electricity end-uses in the campus of the
eywords:nergy saving strategiesnergy management and control systemVAC split systememand response
Universidad Politécnica de Valencia (UPV), Spain. This paper presents an evaluation performed by usingthe EMCS of different control strategies for HVAC split systems. It analyzed the effect of different schedulesfor a common air-conditioning device and demand response strategies are tested in several situations. Theeconomic saving is calculated taking into account the electricity contract clauses. Finally, a test is madefor the control of a group of similar devices in order to reduce the maximum peak power in consumptionand to obtain a flexible load shape with the HVAC loads. The studies are then extrapolated to a largersystem, the whole University campus, for which energy and economic savings are quantified.
. Introduction
Nowadays, due to the requirements for the indoor air quality,he visual and thermal comfort levels have been increased [1,2].eating, ventilation and air-conditioning systems (HVAC) repre-
ent an important share of the electricity consumption (about 30%)n a building [3]. This implies that important energy and economicavings can be achieved by improving the efficiency in these sys-ems, and therefore a substantial reduction in the environmentalmpacts can be also achieved [4]. There are several types of air-onditioning systems: the split and the centralized systems arehe most usual configurations. An efficient use and control of theseystems could result in important energy and economical savingsithout affecting the users comfort. Common centralized systems
an be more efficiently managed, since they usually have an associ-ted central control unit in which internal temperatures of severalooms and presence control devices are included [5–8]. Efficiencymprovement actions are more difficult to implement for split sys-ems because several units supply comfort to different areas and no
entralized control system usually exists. Nevertheless, these splitystems offer a large potential for savings.About 1500 HVAC split systems are spread out around the cam-us of the Universidad Politécnica de Valencia (UPV) [9] and they
∗ Corresponding author. Tel.: +34 963 879 240; fax: +34 963 877 272.E-mail address: [email protected] (G. Escrivá-Escrivá).
378-7788/$ – see front matter © 2010 Published by Elsevier B.V.oi:10.1016/j.enbuild.2010.07.023
© 2010 Published by Elsevier B.V.
are being connected gradually to an energy management and con-trol system (EMCS) [10]. Each device requires a skilful managementto achieve an efficient operation.
Many studies have analyzed different control strategies for indi-vidual air-conditioning equipments [11–14]. This paper focuses onthe evaluation of different control strategies that can be imple-mented in the developed ECMS for HVAC split devices installedin premises of the UPV developed in order to get an optimalstrategy to apply throughout the whole University. Results of var-ious tests were analyzed. These tests focused on strategies thatcan be applied using the technology tools installed by meansof the project DERD [10]. In particular, energy saving strate-gies of disconnection have been studied. A major impact on theUniversity electric shape load is expected making possible for inte-gration of the University in demand response programs in thefuture.
In Section 2, the EMCS architecture and the objectives of theproject for the University are introduced. Section 3 outlines theHVAC physical system studied including the characteristics of thesite and the HVAC split device. The proposed methodology and theparameters of the test are presented in Sections 4 and 5 respec-tively. Afterwards, in Sections 6 and 7 savings and results are
commented for different kinds of disconnection tests. An appli-cation is carried out for a group of devices working under a loaddisplacement condition and an extrapolation to the whole Univer-sity is set in Section 8, including an evaluation of the flexibilityobtained in the aggregated load shape and the corresponding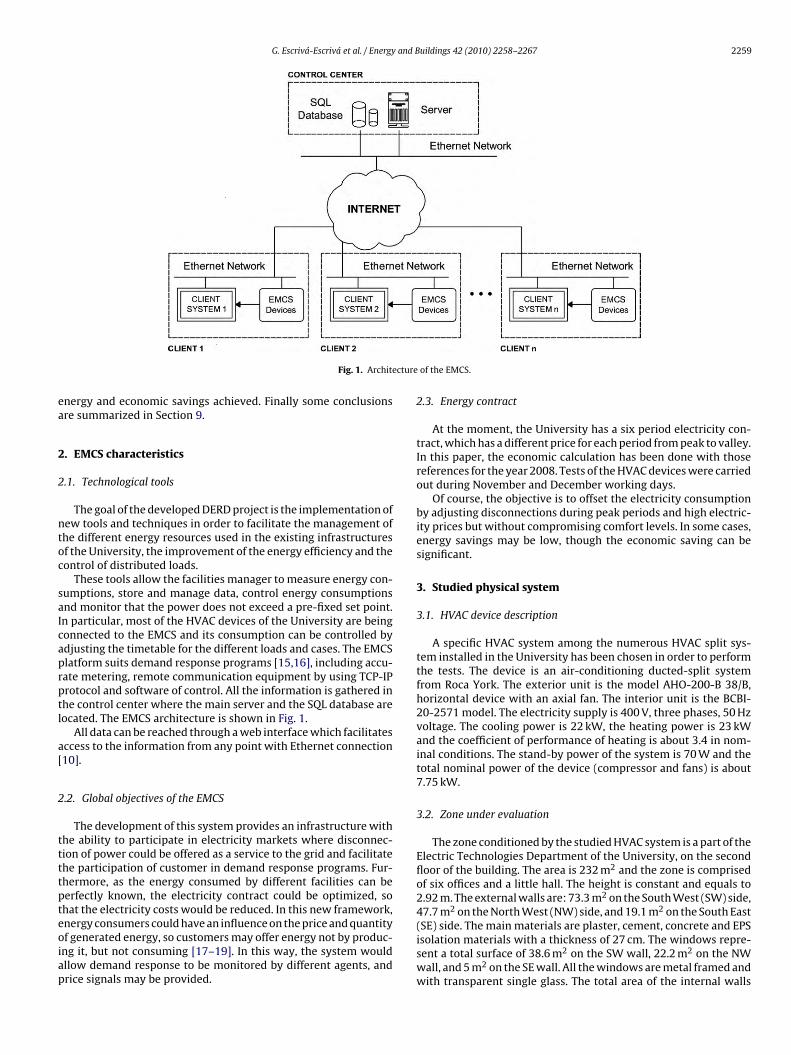
G. Escrivá-Escrivá et al. / Energy and Buildings 42 (2010) 2258–2267 2259
cture
ea
2
2
ntoc
saIcaprptl
a[
2
ttttpteoiap
Fig. 1. Archite
nergy and economic savings achieved. Finally some conclusionsre summarized in Section 9.
. EMCS characteristics
.1. Technological tools
The goal of the developed DERD project is the implementation ofew tools and techniques in order to facilitate the management ofhe different energy resources used in the existing infrastructuresf the University, the improvement of the energy efficiency and theontrol of distributed loads.
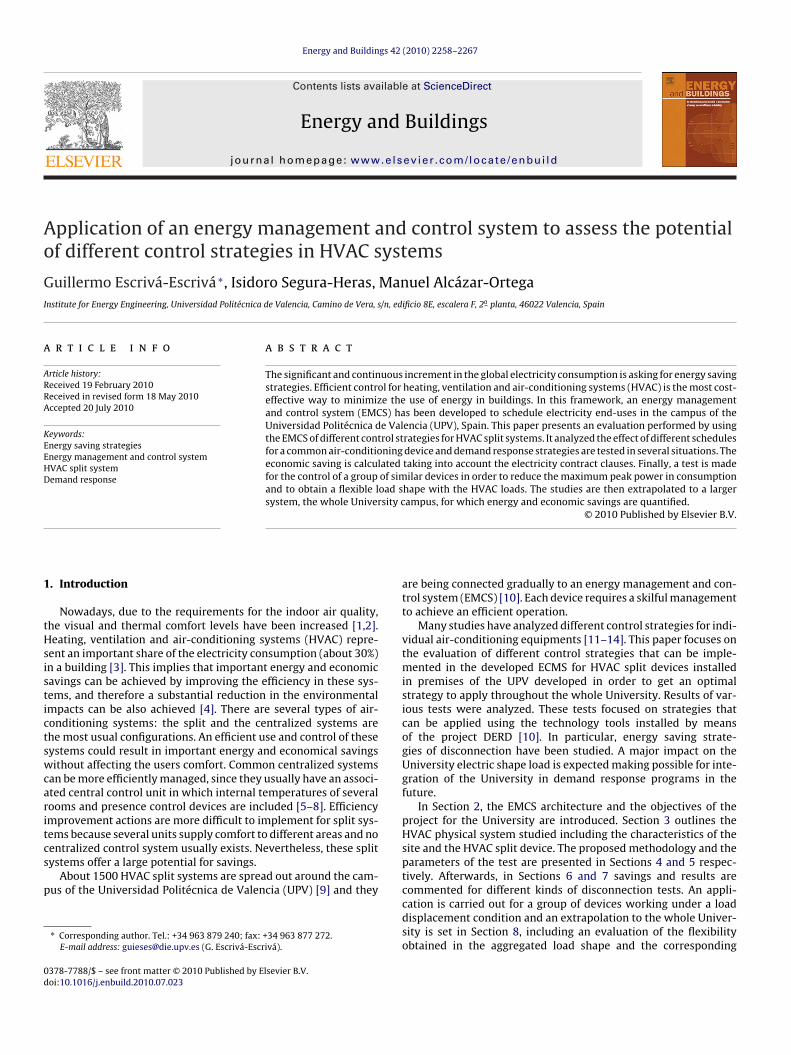
These tools allow the facilities manager to measure energy con-umptions, store and manage data, control energy consumptionsnd monitor that the power does not exceed a pre-fixed set point.n particular, most of the HVAC devices of the University are beingonnected to the EMCS and its consumption can be controlled bydjusting the timetable for the different loads and cases. The EMCSlatform suits demand response programs [15,16], including accu-ate metering, remote communication equipment by using TCP-IProtocol and software of control. All the information is gathered inhe control center where the main server and the SQL database areocated. The EMCS architecture is shown in Fig. 1.
All data can be reached through a web interface which facilitatesccess to the information from any point with Ethernet connection10].
.2. Global objectives of the EMCS
The development of this system provides an infrastructure withhe ability to participate in electricity markets where disconnec-ion of power could be offered as a service to the grid and facilitatehe participation of customer in demand response programs. Fur-hermore, as the energy consumed by different facilities can beerfectly known, the electricity contract could be optimized, sohat the electricity costs would be reduced. In this new framework,
nergy consumers could have an influence on the price and quantityf generated energy, so customers may offer energy not by produc-ng it, but not consuming [17–19]. In this way, the system wouldllow demand response to be monitored by different agents, andrice signals may be provided.of the EMCS.
2.3. Energy contract
At the moment, the University has a six period electricity con-tract, which has a different price for each period from peak to valley.In this paper, the economic calculation has been done with thosereferences for the year 2008. Tests of the HVAC devices were carriedout during November and December working days.
Of course, the objective is to offset the electricity consumptionby adjusting disconnections during peak periods and high electric-ity prices but without compromising comfort levels. In some cases,energy savings may be low, though the economic saving can besignificant.
3. Studied physical system
3.1. HVAC device description
A specific HVAC system among the numerous HVAC split sys-tem installed in the University has been chosen in order to performthe tests. The device is an air-conditioning ducted-split systemfrom Roca York. The exterior unit is the model AHO-200-B 38/B,horizontal device with an axial fan. The interior unit is the BCBI-20-2571 model. The electricity supply is 400 V, three phases, 50 Hzvoltage. The cooling power is 22 kW, the heating power is 23 kWand the coefficient of performance of heating is about 3.4 in nom-inal conditions. The stand-by power of the system is 70 W and thetotal nominal power of the device (compressor and fans) is about7.75 kW.
3.2. Zone under evaluation
The zone conditioned by the studied HVAC system is a part of theElectric Technologies Department of the University, on the secondfloor of the building. The area is 232 m2 and the zone is comprisedof six offices and a little hall. The height is constant and equals to2.92 m. The external walls are: 73.3 m2 on the South West (SW) side,47.7 m2 on the North West (NW) side, and 19.1 m2 on the South East
(SE) side. The main materials are plaster, cement, concrete and EPSisolation materials with a thickness of 27 cm. The windows repre-sent a total surface of 38.6 m2 on the SW wall, 22.2 m2 on the NWwall, and 5 m2 on the SE wall. All the windows are metal framed andwith transparent single glass. The total area of the internal walls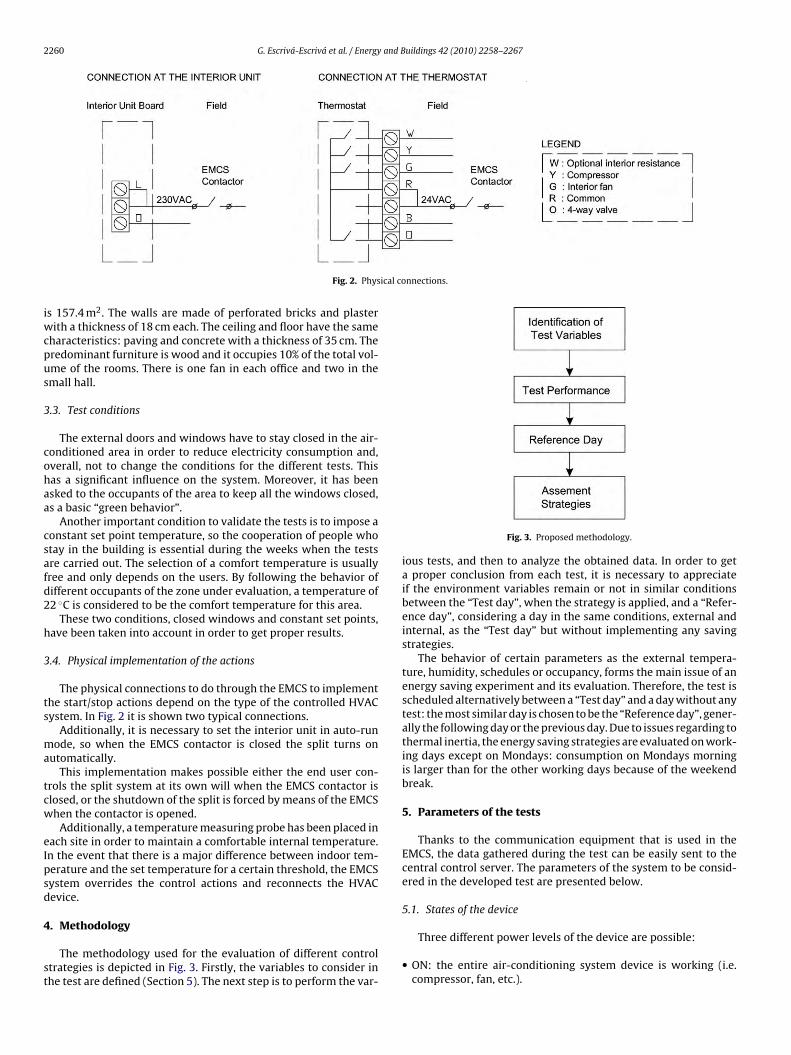
2260 G. Escrivá-Escrivá et al. / Energy and Buildings 42 (2010) 2258–2267
ical connections.
iwcpus
3
cohaa
csafd2
h
3
ts
ma
tcw
eIpsd
4
st
Fig. 2. Phys
s 157.4 m2. The walls are made of perforated bricks and plasterith a thickness of 18 cm each. The ceiling and floor have the same
haracteristics: paving and concrete with a thickness of 35 cm. Theredominant furniture is wood and it occupies 10% of the total vol-me of the rooms. There is one fan in each office and two in themall hall.
.3. Test conditions
The external doors and windows have to stay closed in the air-onditioned area in order to reduce electricity consumption and,verall, not to change the conditions for the different tests. Thisas a significant influence on the system. Moreover, it has beensked to the occupants of the area to keep all the windows closed,s a basic “green behavior”.
Another important condition to validate the tests is to impose aonstant set point temperature, so the cooperation of people whotay in the building is essential during the weeks when the testsre carried out. The selection of a comfort temperature is usuallyree and only depends on the users. By following the behavior ofifferent occupants of the zone under evaluation, a temperature of2 ◦C is considered to be the comfort temperature for this area.
These two conditions, closed windows and constant set points,ave been taken into account in order to get proper results.
.4. Physical implementation of the actions
The physical connections to do through the EMCS to implementhe start/stop actions depend on the type of the controlled HVACystem. In Fig. 2 it is shown two typical connections.
Additionally, it is necessary to set the interior unit in auto-runode, so when the EMCS contactor is closed the split turns on
utomatically.This implementation makes possible either the end user con-
rols the split system at its own will when the EMCS contactor islosed, or the shutdown of the split is forced by means of the EMCShen the contactor is opened.
Additionally, a temperature measuring probe has been placed inach site in order to maintain a comfortable internal temperature.n the event that there is a major difference between indoor tem-erature and the set temperature for a certain threshold, the EMCSystem overrides the control actions and reconnects the HVACevice.
. Methodology
The methodology used for the evaluation of different controltrategies is depicted in Fig. 3. Firstly, the variables to consider inhe test are defined (Section 5). The next step is to perform the var-
Fig. 3. Proposed methodology.
ious tests, and then to analyze the obtained data. In order to geta proper conclusion from each test, it is necessary to appreciateif the environment variables remain or not in similar conditionsbetween the “Test day”, when the strategy is applied, and a “Refer-ence day”, considering a day in the same conditions, external andinternal, as the “Test day” but without implementing any savingstrategies.
The behavior of certain parameters as the external tempera-ture, humidity, schedules or occupancy, forms the main issue of anenergy saving experiment and its evaluation. Therefore, the test isscheduled alternatively between a “Test day” and a day without anytest: the most similar day is chosen to be the “Reference day”, gener-ally the following day or the previous day. Due to issues regarding tothermal inertia, the energy saving strategies are evaluated on work-ing days except on Mondays: consumption on Mondays morningis larger than for the other working days because of the weekendbreak.
5. Parameters of the tests
Thanks to the communication equipment that is used in theEMCS, the data gathered during the test can be easily sent to thecentral control server. The parameters of the system to be consid-ered in the developed test are presented below.
5.1. States of the device
Three different power levels of the device are possible:
• ON: the entire air-conditioning system device is working (i.e.compressor, fan, etc.).
and Buildings 42 (2010) 2258–2267 2261
••
ao
5
saact
5
sco
5
tu
5
psfta
5
t(at1
W
(tvtr
W
frad
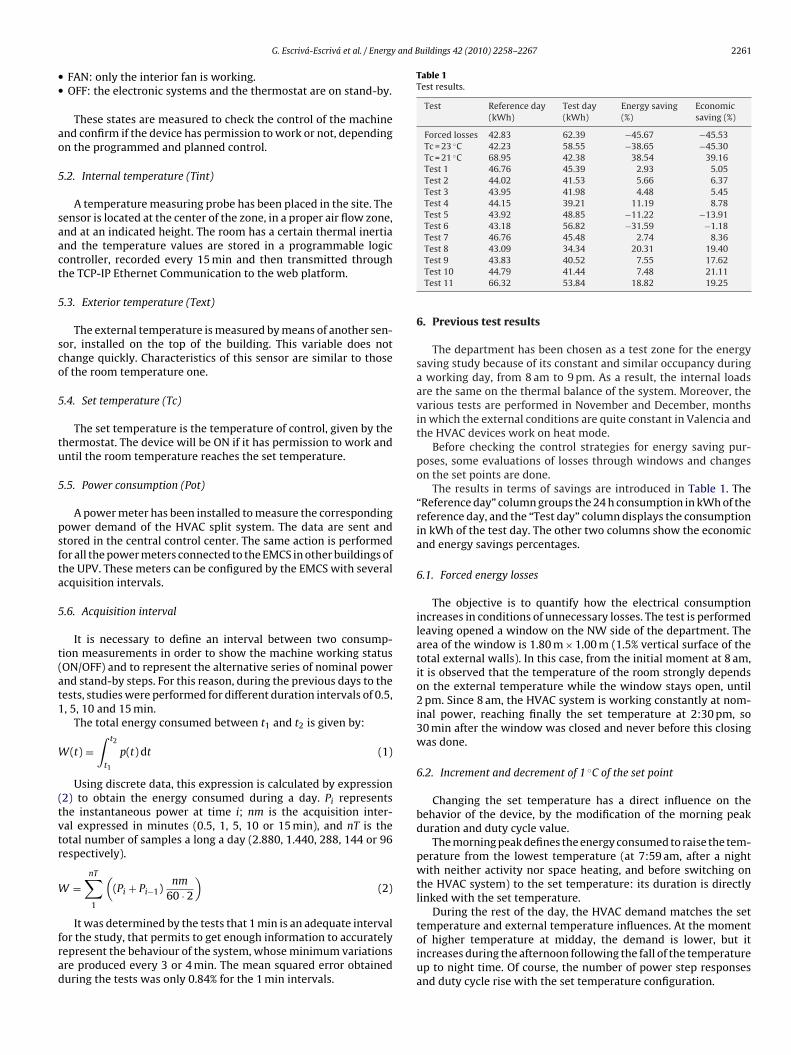
Table 1Test results.
Test Reference day(kWh)
Test day(kWh)
Energy saving(%)
Economicsaving (%)
Forced losses 42.83 62.39 −45.67 −45.53Tc = 23 ◦C 42.23 58.55 −38.65 −45.30Tc = 21 ◦C 68.95 42.38 38.54 39.16Test 1 46.76 45.39 2.93 5.05Test 2 44.02 41.53 5.66 6.37Test 3 43.95 41.98 4.48 5.45Test 4 44.15 39.21 11.19 8.78Test 5 43.92 48.85 −11.22 −13.91Test 6 43.18 56.82 −31.59 −1.18Test 7 46.76 45.48 2.74 8.36Test 8 43.09 34.34 20.31 19.40
G. Escrivá-Escrivá et al. / Energy
FAN: only the interior fan is working.OFF: the electronic systems and the thermostat are on stand-by.
These states are measured to check the control of the machinend confirm if the device has permission to work or not, dependingn the programmed and planned control.
.2. Internal temperature (Tint)
A temperature measuring probe has been placed in the site. Theensor is located at the center of the zone, in a proper air flow zone,nd at an indicated height. The room has a certain thermal inertiand the temperature values are stored in a programmable logicontroller, recorded every 15 min and then transmitted throughhe TCP-IP Ethernet Communication to the web platform.
.3. Exterior temperature (Text)
The external temperature is measured by means of another sen-or, installed on the top of the building. This variable does nothange quickly. Characteristics of this sensor are similar to thosef the room temperature one.
.4. Set temperature (Tc)
The set temperature is the temperature of control, given by thehermostat. The device will be ON if it has permission to work andntil the room temperature reaches the set temperature.
.5. Power consumption (Pot)
A power meter has been installed to measure the correspondingower demand of the HVAC split system. The data are sent andtored in the central control center. The same action is performedor all the power meters connected to the EMCS in other buildings ofhe UPV. These meters can be configured by the EMCS with severalcquisition intervals.
.6. Acquisition interval
It is necessary to define an interval between two consump-ion measurements in order to show the machine working statusON/OFF) and to represent the alternative series of nominal powernd stand-by steps. For this reason, during the previous days to theests, studies were performed for different duration intervals of 0.5,, 5, 10 and 15 min.
The total energy consumed between t1 and t2 is given by:
(t) =∫ t2
t1
p(t) dt (1)
Using discrete data, this expression is calculated by expression2) to obtain the energy consumed during a day. Pi representshe instantaneous power at time i; nm is the acquisition inter-al expressed in minutes (0.5, 1, 5, 10 or 15 min), and nT is theotal number of samples a long a day (2.880, 1.440, 288, 144 or 96espectively).
=nT∑1
((Pi + Pi−1)
nm
60 · 2
)(2)
It was determined by the tests that 1 min is an adequate intervalor the study, that permits to get enough information to accuratelyepresent the behaviour of the system, whose minimum variationsre produced every 3 or 4 min. The mean squared error obtaineduring the tests was only 0.84% for the 1 min intervals.
Test 9 43.83 40.52 7.55 17.62Test 10 44.79 41.44 7.48 21.11Test 11 66.32 53.84 18.82 19.25
6. Previous test results
The department has been chosen as a test zone for the energysaving study because of its constant and similar occupancy duringa working day, from 8 am to 9 pm. As a result, the internal loadsare the same on the thermal balance of the system. Moreover, thevarious tests are performed in November and December, monthsin which the external conditions are quite constant in Valencia andthe HVAC devices work on heat mode.
Before checking the control strategies for energy saving pur-poses, some evaluations of losses through windows and changeson the set points are done.
The results in terms of savings are introduced in Table 1. The“Reference day” column groups the 24 h consumption in kWh of thereference day, and the “Test day” column displays the consumptionin kWh of the test day. The other two columns show the economicand energy savings percentages.
6.1. Forced energy losses
The objective is to quantify how the electrical consumptionincreases in conditions of unnecessary losses. The test is performedleaving opened a window on the NW side of the department. Thearea of the window is 1.80 m × 1.00 m (1.5% vertical surface of thetotal external walls). In this case, from the initial moment at 8 am,it is observed that the temperature of the room strongly dependson the external temperature while the window stays open, until2 pm. Since 8 am, the HVAC system is working constantly at nom-inal power, reaching finally the set temperature at 2:30 pm, so30 min after the window was closed and never before this closingwas done.
6.2. Increment and decrement of 1 ◦C of the set point
Changing the set temperature has a direct influence on thebehavior of the device, by the modification of the morning peakduration and duty cycle value.
The morning peak defines the energy consumed to raise the tem-perature from the lowest temperature (at 7:59 am, after a nightwith neither activity nor space heating, and before switching onthe HVAC system) to the set temperature: its duration is directlylinked with the set temperature.
During the rest of the day, the HVAC demand matches the set
temperature and external temperature influences. At the momentof higher temperature at midday, the demand is lower, but itincreases during the afternoon following the fall of the temperatureup to night time. Of course, the number of power step responsesand duty cycle rise with the set temperature configuration.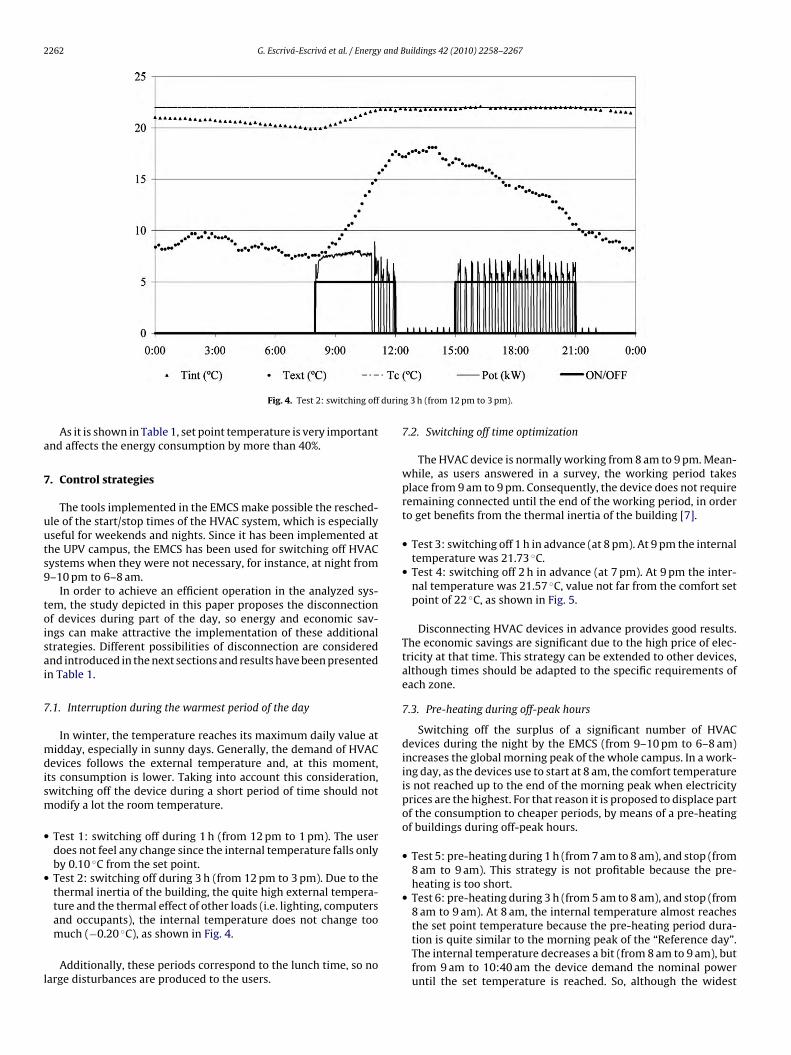
2262 G. Escrivá-Escrivá et al. / Energy and Buildings 42 (2010) 2258–2267
durin
a
7
uuts9
toisai
7
mdism
•
•
l
Fig. 4. Test 2: switching off
As it is shown in Table 1, set point temperature is very importantnd affects the energy consumption by more than 40%.
. Control strategies
The tools implemented in the EMCS make possible the resched-le of the start/stop times of the HVAC system, which is especiallyseful for weekends and nights. Since it has been implemented athe UPV campus, the EMCS has been used for switching off HVACystems when they were not necessary, for instance, at night from–10 pm to 6–8 am.
In order to achieve an efficient operation in the analyzed sys-em, the study depicted in this paper proposes the disconnectionf devices during part of the day, so energy and economic sav-ngs can make attractive the implementation of these additionaltrategies. Different possibilities of disconnection are considerednd introduced in the next sections and results have been presentedn Table 1.
.1. Interruption during the warmest period of the day
In winter, the temperature reaches its maximum daily value atidday, especially in sunny days. Generally, the demand of HVAC
evices follows the external temperature and, at this moment,ts consumption is lower. Taking into account this consideration,witching off the device during a short period of time should notodify a lot the room temperature.
Test 1: switching off during 1 h (from 12 pm to 1 pm). The userdoes not feel any change since the internal temperature falls onlyby 0.10 ◦C from the set point.Test 2: switching off during 3 h (from 12 pm to 3 pm). Due to thethermal inertia of the building, the quite high external tempera-ture and the thermal effect of other loads (i.e. lighting, computers
and occupants), the internal temperature does not change toomuch (−0.20 ◦C), as shown in Fig. 4.Additionally, these periods correspond to the lunch time, so noarge disturbances are produced to the users.
g 3 h (from 12 pm to 3 pm).
7.2. Switching off time optimization
The HVAC device is normally working from 8 am to 9 pm. Mean-while, as users answered in a survey, the working period takesplace from 9 am to 9 pm. Consequently, the device does not requireremaining connected until the end of the working period, in orderto get benefits from the thermal inertia of the building [7].
• Test 3: switching off 1 h in advance (at 8 pm). At 9 pm the internaltemperature was 21.73 ◦C.
• Test 4: switching off 2 h in advance (at 7 pm). At 9 pm the inter-nal temperature was 21.57 ◦C, value not far from the comfort setpoint of 22 ◦C, as shown in Fig. 5.
Disconnecting HVAC devices in advance provides good results.The economic savings are significant due to the high price of elec-tricity at that time. This strategy can be extended to other devices,although times should be adapted to the specific requirements ofeach zone.
7.3. Pre-heating during off-peak hours
Switching off the surplus of a significant number of HVACdevices during the night by the EMCS (from 9–10 pm to 6–8 am)increases the global morning peak of the whole campus. In a work-ing day, as the devices use to start at 8 am, the comfort temperatureis not reached up to the end of the morning peak when electricityprices are the highest. For that reason it is proposed to displace partof the consumption to cheaper periods, by means of a pre-heatingof buildings during off-peak hours.
• Test 5: pre-heating during 1 h (from 7 am to 8 am), and stop (from8 am to 9 am). This strategy is not profitable because the pre-heating is too short.
• Test 6: pre-heating during 3 h (from 5 am to 8 am), and stop (from8 am to 9 am). At 8 am, the internal temperature almost reaches
the set point temperature because the pre-heating period dura-tion is quite similar to the morning peak of the “Reference day”.The internal temperature decreases a bit (from 8 am to 9 am), butfrom 9 am to 10:40 am the device demand the nominal poweruntil the set temperature is reached. So, although the widest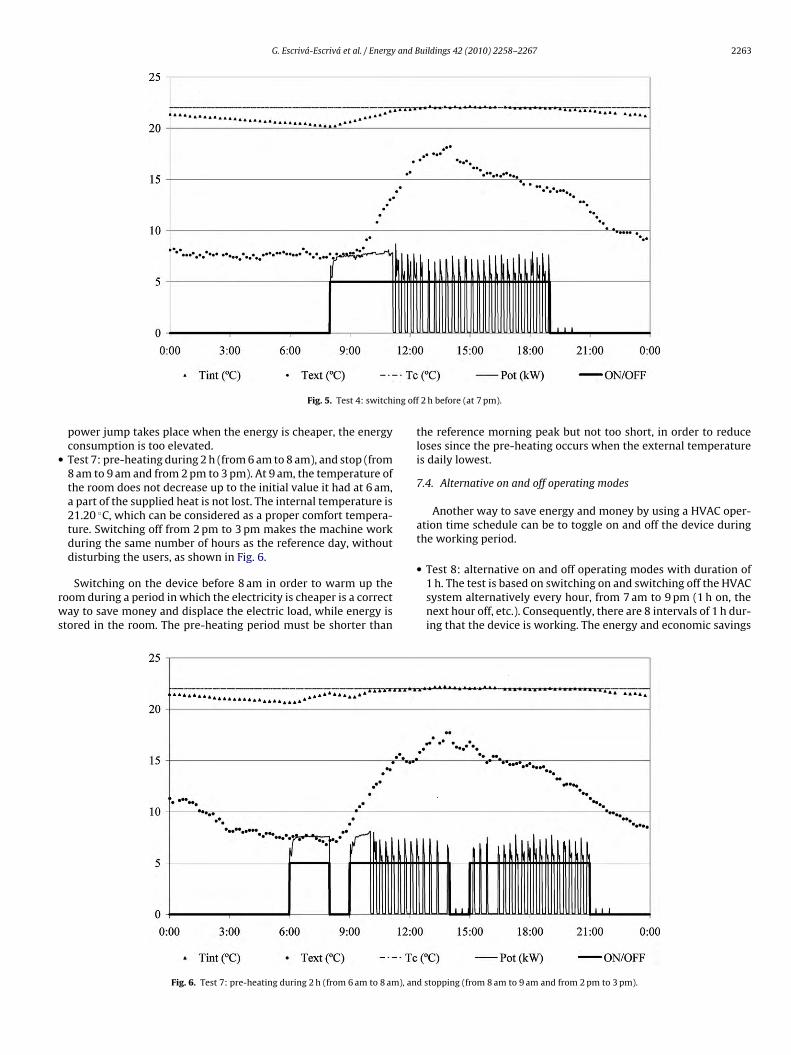
G. Escrivá-Escrivá et al. / Energy and Buildings 42 (2010) 2258–2267 2263
ing off
•
rws
Fig. 5. Test 4: switch
power jump takes place when the energy is cheaper, the energyconsumption is too elevated.Test 7: pre-heating during 2 h (from 6 am to 8 am), and stop (from8 am to 9 am and from 2 pm to 3 pm). At 9 am, the temperature ofthe room does not decrease up to the initial value it had at 6 am,a part of the supplied heat is not lost. The internal temperature is21.20 ◦C, which can be considered as a proper comfort tempera-ture. Switching off from 2 pm to 3 pm makes the machine workduring the same number of hours as the reference day, withoutdisturbing the users, as shown in Fig. 6.
Switching on the device before 8 am in order to warm up theoom during a period in which the electricity is cheaper is a correctay to save money and displace the electric load, while energy is
tored in the room. The pre-heating period must be shorter than
Fig. 6. Test 7: pre-heating during 2 h (from 6 am to 8 am), an
2 h before (at 7 pm).
the reference morning peak but not too short, in order to reduceloses since the pre-heating occurs when the external temperatureis daily lowest.
7.4. Alternative on and off operating modes
Another way to save energy and money by using a HVAC oper-ation time schedule can be to toggle on and off the device duringthe working period.
• Test 8: alternative on and off operating modes with duration of1 h. The test is based on switching on and switching off the HVACsystem alternatively every hour, from 7 am to 9 pm (1 h on, thenext hour off, etc.). Consequently, there are 8 intervals of 1 h dur-ing that the device is working. The energy and economic savings
d stopping (from 8 am to 9 am and from 2 pm to 3 pm).
2264 G. Escrivá-Escrivá et al. / Energy and Buildings 42 (2010) 2258–2267
ng mo
•
t
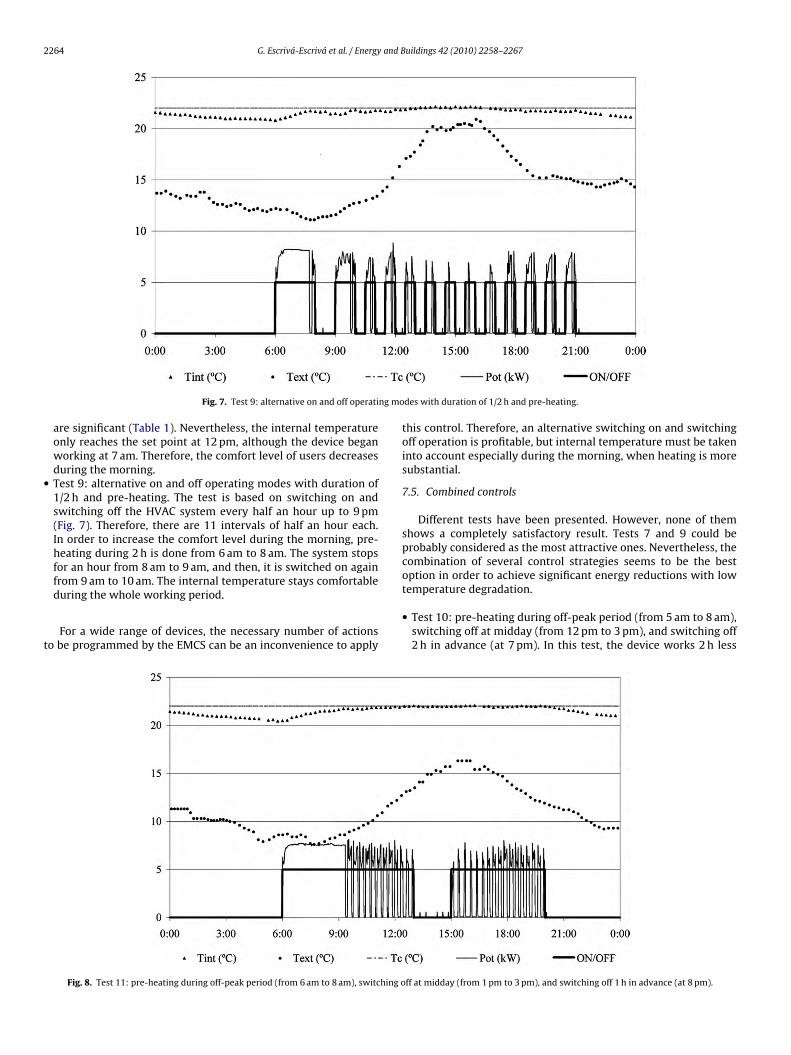
Fig. 7. Test 9: alternative on and off operati
are significant (Table 1). Nevertheless, the internal temperatureonly reaches the set point at 12 pm, although the device beganworking at 7 am. Therefore, the comfort level of users decreasesduring the morning.Test 9: alternative on and off operating modes with duration of1/2 h and pre-heating. The test is based on switching on andswitching off the HVAC system every half an hour up to 9 pm(Fig. 7). Therefore, there are 11 intervals of half an hour each.In order to increase the comfort level during the morning, pre-heating during 2 h is done from 6 am to 8 am. The system stopsfor an hour from 8 am to 9 am, and then, it is switched on againfrom 9 am to 10 am. The internal temperature stays comfortable
during the whole working period.For a wide range of devices, the necessary number of actionso be programmed by the EMCS can be an inconvenience to apply
Fig. 8. Test 11: pre-heating during off-peak period (from 6 am to 8 am), switching o
des with duration of 1/2 h and pre-heating.
this control. Therefore, an alternative switching on and switchingoff operation is profitable, but internal temperature must be takeninto account especially during the morning, when heating is moresubstantial.
7.5. Combined controls
Different tests have been presented. However, none of themshows a completely satisfactory result. Tests 7 and 9 could beprobably considered as the most attractive ones. Nevertheless, thecombination of several control strategies seems to be the bestoption in order to achieve significant energy reductions with low
temperature degradation.• Test 10: pre-heating during off-peak period (from 5 am to 8 am),switching off at midday (from 12 pm to 3 pm), and switching off2 h in advance (at 7 pm). In this test, the device works 2 h less
ff at midday (from 1 pm to 3 pm), and switching off 1 h in advance (at 8 pm).
and B
•
iaeho
iaesz
vasst
G. Escrivá-Escrivá et al. / Energy
than in the “Reference day”. The room accumulates energy dur-ing the morning, and its temperature remains on the acceptablethreshold of comfort during the whole day (21.53 ◦C at 9 pm).The economic savings are significant because the morning peakconsumption is moved to a lower price period.Test 11: pre-heating during off-peak period (from 6 am to 8 am),switching off at midday (from 1 pm to 3 pm), and switching off1 h in advance (at 8 pm). The combination of the same strategiesas above but in a less aggressive way, with shorter off periods,makes energy savings be significant. The internal temperatureis really close to the set temperature during the whole day(Fig. 8).
Therefore, a combination of such actions as pre-heating dur-ng off-peak periods, switching off at midday, and switching off indvance in the evenings seems to be the best energy saving strat-gy. That makes possible to take advantage of low prices in the firstours in the morning, warm periods at midday and thermal inertiaf buildings in the evening.
Furthermore, these combined controls are the most interest-ng ones to implement through the EMCS in the whole campus,lways paying attention to the duration of the actions according toach situation. This control does not need too many actions and thewitch-off intervals can be configured with respect to the physicalone needs, with the collaboration of the users.
It is significant to denote that the duration of the actions might
ary depending on the time of the year, the external temperature,nd the physical characteristics of the each zone. It is possible totore in the database of the EMCS all the data for each controlledplit system, so the actions can be performed each time followinghe corresponding timetable.Fig. 9. Load displacement of se
uildings 42 (2010) 2258–2267 2265
8. Extrapolation to the whole campus
As a previous study to the extrapolation of the results tothe whole campus, a test has been conducted to implement thededuced control strategies in a group of seven splits HVAC systems,similar to the device in the previous study.
8.1. Load displacement of a group of similar HVAC split systems
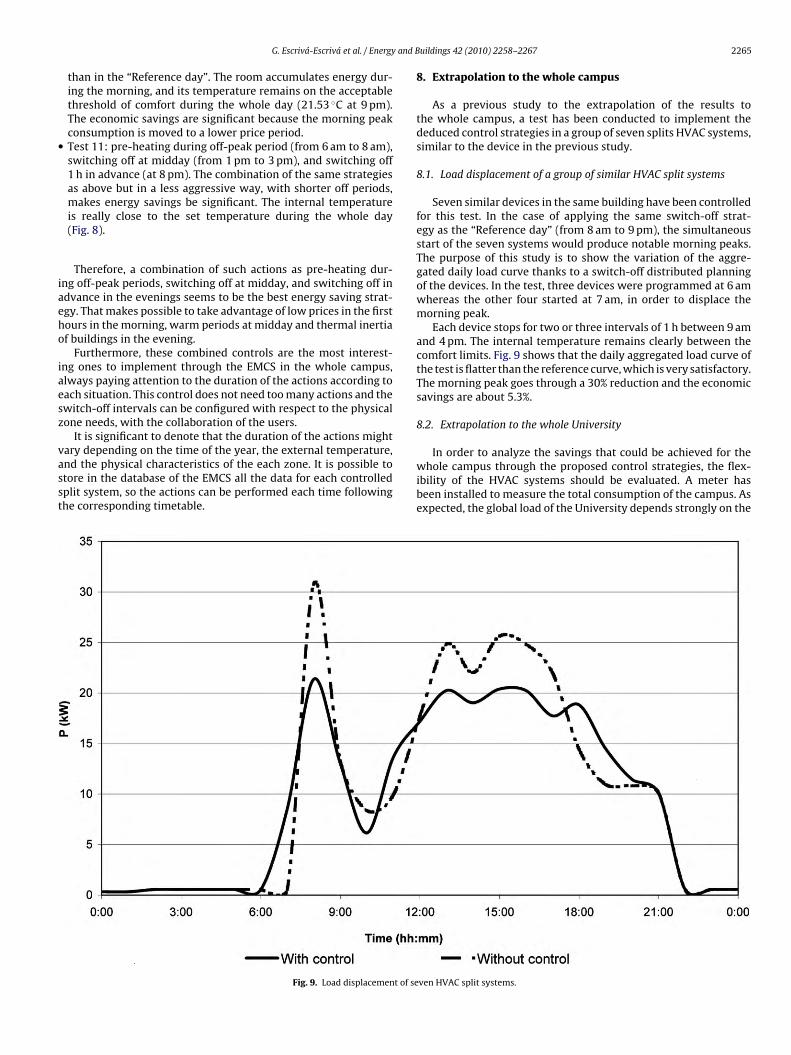
Seven similar devices in the same building have been controlledfor this test. In the case of applying the same switch-off strat-egy as the “Reference day” (from 8 am to 9 pm), the simultaneousstart of the seven systems would produce notable morning peaks.The purpose of this study is to show the variation of the aggre-gated daily load curve thanks to a switch-off distributed planningof the devices. In the test, three devices were programmed at 6 amwhereas the other four started at 7 am, in order to displace themorning peak.
Each device stops for two or three intervals of 1 h between 9 amand 4 pm. The internal temperature remains clearly between thecomfort limits. Fig. 9 shows that the daily aggregated load curve ofthe test is flatter than the reference curve, which is very satisfactory.The morning peak goes through a 30% reduction and the economicsavings are about 5.3%.
8.2. Extrapolation to the whole University
In order to analyze the savings that could be achieved for thewhole campus through the proposed control strategies, the flex-ibility of the HVAC systems should be evaluated. A meter hasbeen installed to measure the total consumption of the campus. Asexpected, the global load of the University depends strongly on the
ven HVAC split systems.
2266 G. Escrivá-Escrivá et al. / Energy and Buildings 42 (2010) 2258–2267
n to the whole University.
ed
twflcp
ddsc
tet
ecandso
sp1bi
tnbtsp
Table 2Extrapolation results to total University consumption.
HVAC University
Withcontrol
Withoutcontrol
Withcontrol
Withoutcontrol
Maximum power (kW) 7,282 6,739 11,093 11,268Average power (kW) 4,150 4,193 7,423 7,467Energy (kWh) 99,588 100,635 178,159 179,206
Fig. 10. Extrapolatio
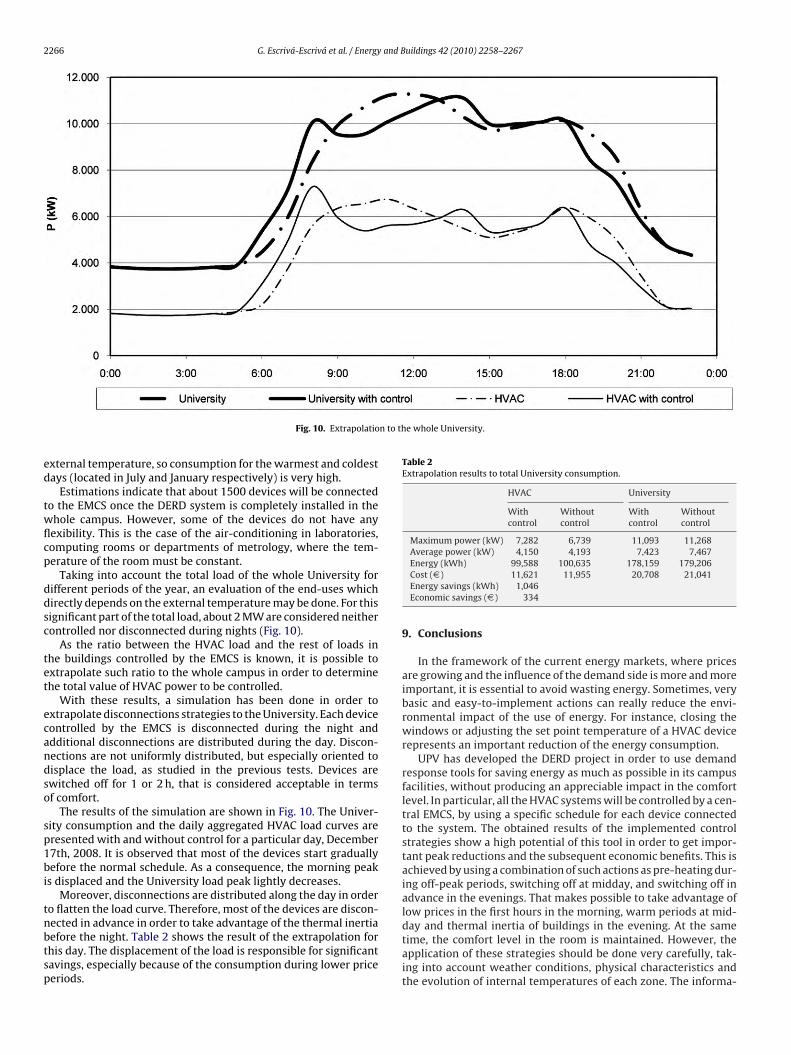
xternal temperature, so consumption for the warmest and coldestays (located in July and January respectively) is very high.
Estimations indicate that about 1500 devices will be connectedo the EMCS once the DERD system is completely installed in thehole campus. However, some of the devices do not have anyexibility. This is the case of the air-conditioning in laboratories,omputing rooms or departments of metrology, where the tem-erature of the room must be constant.
Taking into account the total load of the whole University forifferent periods of the year, an evaluation of the end-uses whichirectly depends on the external temperature may be done. For thisignificant part of the total load, about 2 MW are considered neitherontrolled nor disconnected during nights (Fig. 10).
As the ratio between the HVAC load and the rest of loads inhe buildings controlled by the EMCS is known, it is possible toxtrapolate such ratio to the whole campus in order to determinehe total value of HVAC power to be controlled.
With these results, a simulation has been done in order toxtrapolate disconnections strategies to the University. Each deviceontrolled by the EMCS is disconnected during the night anddditional disconnections are distributed during the day. Discon-ections are not uniformly distributed, but especially oriented toisplace the load, as studied in the previous tests. Devices arewitched off for 1 or 2 h, that is considered acceptable in termsf comfort.
The results of the simulation are shown in Fig. 10. The Univer-ity consumption and the daily aggregated HVAC load curves areresented with and without control for a particular day, December7th, 2008. It is observed that most of the devices start graduallyefore the normal schedule. As a consequence, the morning peak
s displaced and the University load peak lightly decreases.Moreover, disconnections are distributed along the day in order
o flatten the load curve. Therefore, most of the devices are discon-
ected in advance in order to take advantage of the thermal inertiaefore the night. Table 2 shows the result of the extrapolation forhis day. The displacement of the load is responsible for significantavings, especially because of the consumption during lower priceeriods.Cost (D ) 11,621 11,955 20,708 21,041Energy savings (kWh) 1,046Economic savings (D ) 334
9. Conclusions
In the framework of the current energy markets, where pricesare growing and the influence of the demand side is more and moreimportant, it is essential to avoid wasting energy. Sometimes, verybasic and easy-to-implement actions can really reduce the envi-ronmental impact of the use of energy. For instance, closing thewindows or adjusting the set point temperature of a HVAC devicerepresents an important reduction of the energy consumption.
UPV has developed the DERD project in order to use demandresponse tools for saving energy as much as possible in its campusfacilities, without producing an appreciable impact in the comfortlevel. In particular, all the HVAC systems will be controlled by a cen-tral EMCS, by using a specific schedule for each device connectedto the system. The obtained results of the implemented controlstrategies show a high potential of this tool in order to get impor-tant peak reductions and the subsequent economic benefits. This isachieved by using a combination of such actions as pre-heating dur-ing off-peak periods, switching off at midday, and switching off inadvance in the evenings. That makes possible to take advantage oflow prices in the first hours in the morning, warm periods at mid-
day and thermal inertia of buildings in the evening. At the sametime, the comfort level in the room is maintained. However, theapplication of these strategies should be done very carefully, tak-ing into account weather conditions, physical characteristics andthe evolution of internal temperatures of each zone. The informa-
and B
td
ptc
A
t1
R
[
[
[
[
[
[
[
[
G. Escrivá-Escrivá et al. / Energy
ion about the specific duration of each action can be stored in theatabase of the EMCS for the different situations.
An extrapolation of these techniques has been completed andromising saving in energy and costs are deduced. Works to finishhe implementation of the system are now in progress in the wholeampus and a further study will be done with the final situation.
cknowledgement
This research work has been possible with the support ofhe Universidad Politécnica de Valencia (Spain) by the grant #CE9990032.
eferences
[1] D. Kolokotsa, D. Tsiavos, G.S. Stavrakakis, K. Kalaitzakis, E. Antonidakis,Advanced fuzzy logic controllers design and evaluation for buildings’ occu-pants thermal–visual comfort and indoor air quality satisfaction, Energy andBuildings 33 (July (6)) (2001) 531–543.
[2] ASHRAE, Ventilation for Acceptable Indoor Air Quality, Standard 62-1999,American Society for Heating, Refrigerating and Air-Conditioning Engineers,Atlanta, GA, 1999.
[3] M.W. Ellis, E.H. Mathews, Needs and trends in building and HVAC system designtools, Building and Environment (37) (2002) 461–470.
[4] D.W. Aitken, S.T. Bull, L.L. Billmann, The climate stabilization challenge: canrenewable energy sources meet the target? Renewable Energy World (Novem-ber (7)) (2004).
[5] Tianzhen Hong, S.K. Chou, T.Y. Bong, Building simulation: an overview ofdevelopments and information sources, Building and Environment (35) (2000)347–361.
[6] W. Kastner, G. Neugschwandtner, S. Soucek, H.M. Newman, Communicationsystems for building automation and control, Proceedings of the IEEE 93 (June(6)) (2005).
[7] G. Escrivá, C. Álvarez, I. Valencia, Method for modelling space conditioningaggregated daily load curves: application to a university building, Energy andBuildings 42 (2010) 1275–1282.
[
[
uildings 42 (2010) 2258–2267 2267
[8] C. Selcuk Canbay, A. Hepbasli, G. Gokcen, Evaluating performanceindices of a shopping centre and implementing HVAC control princi-ples to minimize energy usage, Energy and Buildings (36) (2004) 587–598.
[9] Maintenance Service, Universidad Politécnica de Valencia, Inventario deequipos e instalaciones, 2009.
10] G. Escrivá, M. Alcázar, C. Álvarez, Integral management system for the energyefficiency improvement in commercial facilities: application to the PolytechnicUniversity of Valencia, in: International Conference on Renewable Energies andPower Quality, April 2009.
11] M. Ilic, J.W. Black, J.L. Watz, Potential benefits of implementing load control,in: Proceedings of the IEEE Power Engineering Society Winter Meeting, vol. 1,New York, January 2002, pp. 177–182.
12] A. Molina, A. Gabaldón, M. Kessler, J.A. Fuentes, Application of smoothingtechniques to solve the cooling and heating residential load aggregationproblem, in: Proceedings of the VIIth International Conference on Probabilis-tic Methods Applied to Power Systems, vol. 2, September 2002, pp. 879–886.
13] C. Alvarez, R.P. Malhamé, A. Gabaldón, A class of models for load managementapplication and evolution revisited, IEEE Transactions on Power Systems 4 (7)(1992) 1435–1443.
14] M. Anderson, M. Buehner, P. Young, D. Hittle, C. Anderson, J. Tu, D.Hodgson, An experimental system for advanced heating, ventilating andair-conditioning (HVAC) control, Energy and Building (39) (2007) 136–147.
15] C. Álvarez, A. Gabaldón, A. Molina, Assessment and simulation of the responsivedemand potential in end user facilities: application to a university customer,IEE Proceedings on Generation Transmission and Distribution 150 (January)(2003) 61–66.
16] D.S. Kirschen, Demand-side view of electricity markets, IEEE Transactions onPower Systems 18 (May (2)) (2003) 520–527.
17] G.C. Heffner, Configuring Load as a Resource for Competitive Electricity,Markets—Review of Demand Response Programs in the U.S., and Around theWorld, Environmental Energy Technologies Division, Ernest Orlando Lawrence
Berkeley National Laboratory, University of California, Berkeley, California,November 2002.18] International Energy Agency, The Power to Choose. Demand Response in Lib-eralised Markets, IEA Publications, 2003.
19] K. Spees, L.B. Lave, Demand response and electricity market efficiency, TheElectricity Journal 20 (April (3)) (2007) 69–85.