
Application of a Space-Time Stochastic Model for Downscaling Future Rainfall Projections
8
Application of a Space-Time Stochastic Model for Downscaling Future Rainfall Projections Bhupendra A. Raut Research Fellow, School of Mathematical Sciences, Monash University, Clayton, Melbourne, VIC-3800, Australia. E-mail: [email protected] Lorenzo de la Fuente Research Fellow, School of Mathematical Sciences, Monash University, Clayton, Melbourne, VIC-3800, Australia. E-mail: [email protected] Alan W. Seed Senior Research Scientist, Centre for Australian Weather and Climate Research, Bureau of Meteorology, GPO Box 1289K, Melbourne. [email protected] Christian Jakob Professor, School of Mathematical Sciences, Monash University, Clayton, Melbourne, VIC-3800, Australia. E-mail: [email protected] Michael J. Reeder Professor, School of Mathematical Sciences, Monash University, Clayton, Melbourne, VIC-3800, Australia. E-mail: [email protected] Abstract A space-time statistical downscaling model, based on current NWP techniques, is being developed at Monash University in collaboration with Bureau of Meteorology. This model, in combination with regional climate models, will provide high-resolution projections of the future rainfall over the major Australian cities together with reliable estimates of the uncertainty in these projections. These results will be used to design a storm water harvesting system over Australian cities. The brief description of the methodology is as follows. City-scale rainfall patterns are classified into 5-6 clusters using a K-means algorithm and 22 years of AWAP data. A multiplicative cascade model will be used to generate a high resolution rainfall distribution scenario for the given area average precipitation from the coarser climate model output. Parameters such as predominant cloud motion, convective-stratiform fraction, mean and standard deviation of rainfall are required to generate a space-time distribution of rainfall. These are computed using 10 minute interval radar data and shown to be significantly different for these rainfall classes. The space-time cascade model will use the pre-calculated parameters to downscale the area averaged daily rainfall at finer space-time resolution. Due to the computational efficiency of statistical model and the need for only coarser resolution parameters from dynamical model, space-time model can be run many (perhaps a hundred) times with slightly perturbed initial conditions, thereby generating an estimate of the uncertainty in the modeled time series. ISBN 978-1-922107-62-6 © 2012 Engineers Australia HWRS 2012 579
Transcript of Application of a Space-Time Stochastic Model for Downscaling Future Rainfall Projections

Application of a Space-Time Stochastic Model for Downscaling Future Rainfall Projections
Bhupendra A. Raut
Research Fellow, School of Mathematical Sciences, Monash University, Clayton, Melbourne, VIC-3800, Australia.
E-mail: [email protected]
Lorenzo de la Fuente
Research Fellow, School of Mathematical Sciences, Monash University, Clayton, Melbourne, VIC-3800, Australia.
E-mail: [email protected]
Alan W. Seed Senior Research Scientist, Centre for Australian Weather and Climate Research,
Bureau of Meteorology, GPO Box 1289K, Melbourne. [email protected]
Christian Jakob
Professor, School of Mathematical Sciences, Monash University, Clayton, Melbourne, VIC-3800, Australia.
E-mail: [email protected]
Michael J. Reeder Professor, School of Mathematical Sciences, Monash University, Clayton,
Melbourne, VIC-3800, Australia. E-mail: [email protected]
Abstract
A space-time statistical downscaling model, based on current NWP techniques, is being developed at Monash University in collaboration with Bureau of Meteorology. This model, in combination with regional climate models, will provide high-resolution projections of the future rainfall over the major Australian cities together with reliable estimates of the uncertainty in these projections. These results will be used to design a storm water harvesting system over Australian cities. The brief description of the methodology is as follows.
City-scale rainfall patterns are classified into 5-6 clusters using a K-means algorithm and 22 years of AWAP data. A multiplicative cascade model will be used to generate a high resolution rainfall distribution scenario for the given area average precipitation from the coarser climate model output. Parameters such as predominant cloud motion, convective-stratiform fraction, mean and standard deviation of rainfall are required to generate a space-time distribution of rainfall. These are computed using 10 minute interval radar data and shown to be significantly different for these rainfall classes. The space-time cascade model will use the pre-calculated parameters to downscale the area averaged daily rainfall at finer space-time resolution.
Due to the computational efficiency of statistical model and the need for only coarser resolution parameters from dynamical model, space-time model can be run many (perhaps a hundred) times with slightly perturbed initial conditions, thereby generating an estimate of the uncertainty in the modeled time series.
ISBN 978-1-922107-62-6 © 2012 Engineers Australia HWRS 2012579

1. INTRODUCTION
Synoptic scale circulation patterns have a profound effect on daily rainfall accumulation and distribution. Due to the impact of rainfall events on highly populated urban areas and river catchments, several attempts have been made to exploit this relation for the downscaling of climate projections and nowcasting purposes (Katz and Parlange, 1993; Hughes and Guttorp, 1994; Cheng et al., 2010). Precipitation at the smaller scales is more stochastic in nature, hence the downscaling and NWP models usually account for the local dynamical processes as a stochastic component. Foufoula-Georgiou and Krajewski (1995) and the references therein have comprehensive discussion of the stochastic rainfall models, especially multiplicative cascade models of early 1990s. The key to these models is to find a link between large-scale weather patterns and the small-scale precipitation distribution.
Studies suggest several methods for classification of synoptic fields such as SLP in to a manageable number of clusters that can be linked to rainfall distribution (Hay et al., 1991, Huth et al., 2008 ). However, the pressure field is smoothly varying with a more-or-less Gaussian nature, unlike the highly variable and peaky precipitation field. In addition, the high frequency of dry/light rain days further skews the distribution.
This paper presents the clustering of rain field and its link to large- scale pressure patterns along with separation of cascade parameters used for stochastic models. This is a deviation from the conventional approach of clustering of synoptic pressure patterns and then to link it with rainfall. The description of model parameters and the method is given in Seed et al. (1999). It is a multiplicative cascade model that generates an ensemble of space-time rainfall series at a very high resolution. This model is being used successfully for nowcasting (~3 hours lead time) purpose at BoM. The following sections briefly describe model parameters, data and the clustering method. Results and discussion are presented in the subsequent section.
2. METHODOLOGY
2.1 Multiplicative Cascade Model
The multiplicative cascade model (Seed et al. 1999) generates stochastic series of rainfall that reproduces the observed space-time statistical behavior. This model uses scaling properties of rainfall where power spectra of rainfall are assumed to exhibit a power law of the following form
P(k) ∝ k−β
The exponent (β) is determined by the slope of the power spectra on log-log plot. As β is indicative of smoothness, larger values (> 2 for 2-diementional field) suggest convectively organized rainfall and smaller values indicate widespread rain.
The standard deviation or variance of the cascade levels is a power law of the cascade scale if the field is multifractal or self affine (Harris et al 1998). This scaling law is expressed as
σL2
σL0
2
⎡
⎣ ⎢ ⎢
⎤
⎦ ⎥ ⎥
=LL0
⎡
⎣ ⎢
⎤
⎦ ⎥
Hs
where L0 is the scale at the top of the cascade which has variance and Hs is the spatial scaling exponent. Hs is related to the slope of the power spectrum by
σL0
2
34th Hydrology and Water Resources Symposium 19-22 November 2012, Sydney, Australia
ISBN 978-1-922107-62-6 © 2012 Engineers Australia HWRS 2012580

sHD 2+=β
where, D is the dimension of the data; D = 2 in our case.
Although the expected log-log plot is a straight line, in the observed precipitation field, a scale break is observed at about 40km. Therefore, a set of two exponents (β1 and β2 or Hs1 and Hs2) above and below this scale is used in this model. The other spatial model parameters are mean and variance and auto-correlation at each cascade level.
The propagation of the rain field is used to advect the resulting cascade. In its current setting, the model calculates these parameters in real time from radar scans and simulates few hours of ensemble forecast.
In this paper, it is shown that the required parameters differ significantly for the rainfall classes obtained from the K-means algorithm. This has implications in downscaling of climate projections.
2.2 K-means
K-means algorithm (Anderberg, 1973) clusters n vectors of any dimensionality, in to k classes using the Euclidean distance as a metric of similarity. Each cluster is associated with its centroid and the members of the clusters are more closely spaced than the non-members (Pope et al, 2009). Clustering by Euclidean distance is a characterization of both magnitude and pattern.
Suppose, n vectors are given by xi . Then k-means partitions this in to k sets Sj such that
dist(Eucl) = xi − μ j
2
i∈S j
∑j =1
k
∑ is minimized.
where xi is a vector representing the ith data point and μj is the geometric centroid of the data points in Sj. The Euclidean distance could be easily replaced with other distance metrics like cosine distance or correlation distance.
This clustering algorithm is iterative. In the first step all the vectors assigned to closest of the k arbitrary centroids (the seeds). In the second step a new centroid is calculated from these vectors and closest points are assigned to this new centriod. The second step is repeated until the change in centroid is very small.
2.3 Data
Gridded daily rainfall accumulation at 5 km resolution is obtained from Australian Water Availability Project (AWAP, Raupach et. al., 2008a and 2008b, Jones et al. 2009). Sea level pressure (SLP) and 10m wind vectors are taken from ECMWF Reanalysis (ERA-I). The AWAP and ERA-I data used are from the common period 1989-2010.
Radar reflectivity data is at 1 km resolution and 5-10 minutes temporal resolution over the domain of 250×250 Km. The radar data over Melbourne is available for the period 2003-2010.
All the days on which the area-averaged rainfall is more than 0.1 mm, are separated and the K-means clustering method used to cluster rainfall patterns into several classes. To find the optimum number of clusters, cascade parameters are compared for different number of clusters. It is noted that five rainfall clusters over the Melbourne domain can segregate the cascade parameters effectively.
34th Hydrology and Water Resources Symposium 19-22 November 2012, Sydney, Australia
ISBN 978-1-922107-62-6 © 2012 Engineers Australia HWRS 2012581

3. RESULTS AND DISCUSSION 3.1 Clustering on rainfall
The k-means clustering technique outlined in section 2.2, requires a pre-determined number of clusters. We clustered the data into sets of 2 to 9 clusters and the cascade parameters for each set of clusters are plotted. The maximum number of clusters for which parameters are differentiable are chosen as optimal for the given city.
Figure 1 shows five rainfall clusters over Melbourne radar domain and the Table 1 summarises the statistics for the clusters. The percentage of occurrence of each cluster type is shown at the top left corner of the map. In spite of the several artifacts, the radar rainfall is in good agreement with the AWAP rainfall patterns for each cluster. It should be noted that the radar data were available only for a third of the period of AWAP data. The mean SLP pattern for each of the rain cluster is also different indicating a close relationship between large-scale SLP patterns and city-scale rainfall.
The light rain days (cluster 1) are mostly characterized by mean westerly flow. The most extreme events are in cluster 5 and are associated with low-pressure systems over the domain. Clusters 2, 3 and 4 are examples of passing fronts. The difference in the rainfall pattern between cluster 2 and 4 is purely due to location of the front with respect to Melbourne.
Table 1: Summary statistics for the 5 rainfall clusters over the Melbourne.
Cluster No.
Annual Occurrences
Mean Intensity
(mm/day)
Annual Accumulation
(mm)
Synoptic Wind-SLP Pattern
1 162 0.6 100 Westerly Winds 2 17 7.1 125 Front to the West, Northerly Winds
3 10 14.1 142 Front over the city. Possible Northerly to Easterly rotation
4 34 5.2 176 Front to the East, Westerlies 5 3 25.2 82 Low, mainly Northerly winds.
Total 226 -- 625 --
34th Hydrology and Water Resources Symposium 19-22 November 2012, Sydney, Australia
ISBN 978-1-922107-62-6 © 2012 Engineers Australia HWRS 2012582
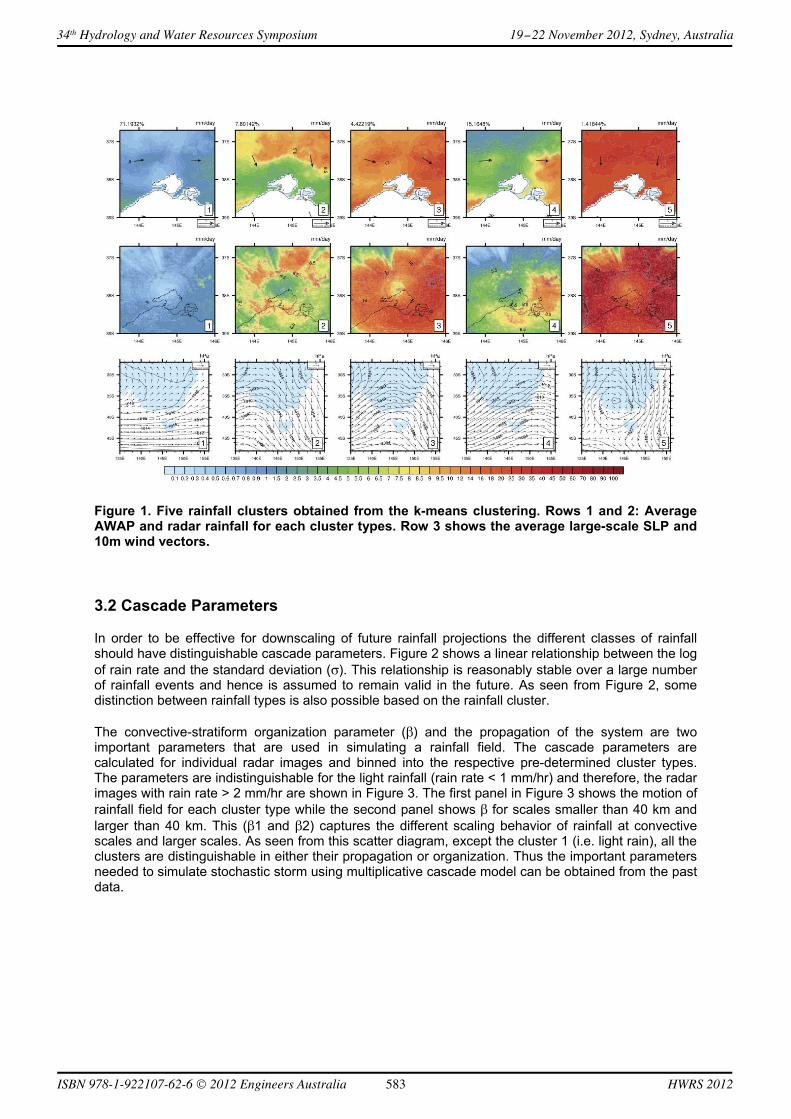
Figure 1. Five rainfall clusters obtained from the k-means clustering. Rows 1 and 2: Average AWAP and radar rainfall for each cluster types. Row 3 shows the average large-scale SLP and 10m wind vectors.
3.2 Cascade Parameters
In order to be effective for downscaling of future rainfall projections the different classes of rainfall should have distinguishable cascade parameters. Figure 2 shows a linear relationship between the log of rain rate and the standard deviation (σ). This relationship is reasonably stable over a large number of rainfall events and hence is assumed to remain valid in the future. As seen from Figure 2, some distinction between rainfall types is also possible based on the rainfall cluster. The convective-stratiform organization parameter (β) and the propagation of the system are two important parameters that are used in simulating a rainfall field. The cascade parameters are calculated for individual radar images and binned into the respective pre-determined cluster types. The parameters are indistinguishable for the light rainfall (rain rate < 1 mm/hr) and therefore, the radar images with rain rate > 2 mm/hr are shown in Figure 3. The first panel in Figure 3 shows the motion of rainfall field for each cluster type while the second panel shows β for scales smaller than 40 km and larger than 40 km. This (β1 and β2) captures the different scaling behavior of rainfall at convective scales and larger scales. As seen from this scatter diagram, except the cluster 1 (i.e. light rain), all the clusters are distinguishable in either their propagation or organization. Thus the important parameters needed to simulate stochastic storm using multiplicative cascade model can be obtained from the past data.
34th Hydrology and Water Resources Symposium 19-22 November 2012, Sydney, Australia
ISBN 978-1-922107-62-6 © 2012 Engineers Australia HWRS 2012583

Figure 2: Mean areal rain rate and σ (both in log co-ordinate) for all the available radar scans of the respective cluster days.
Figure 3: Cascade parameters required by the model are calculated from the radar data. Left panel shows mean displacement of rain field per time step for each of the clusters and the right panel shows β1 and β2 for scales below and above 40 km.
34th Hydrology and Water Resources Symposium 19-22 November 2012, Sydney, Australia
ISBN 978-1-922107-62-6 © 2012 Engineers Australia HWRS 2012584

3.3 Back-identification
It is critical for this method to identify the type of the day based on the coarser-scale information produced by climate models. Figure 4 shows the range of the area-averaged daily accumulation of rainfall for each cluster type. Along with the overlapping range of rainfall accumulation there is significant distinction in the cluster types. Along with the SLP pattern shown in the Figure 1, the magnitude of daily accumulation should give reasonably good identification of cluster type for any day.
Figure 4: Box plot shows variation of daily accumulation of rainfall with respect to cluster type using AWAP data for 1989-2010.
4 DISCUSSION
Sections 3.1 to 3.3 presents a scheme to implement a nowcasting weather generator for climate downscaling applications. It is shown that the cluster analysis on the daily accumulation of rainfall can be useful in differentiating physical characteristics of rainfall at very high temporal resolution (here radar scan interval 5-10 minutes). The parameters required for the multiplicative cascade model are distinguishable in the different rainfall regimes. The SLP pattern and area average daily accumulation can together be use to identify a day type. A different set of cascade parameters for the specific cluster type can be use to generate several realizations of precipitation. As all this information can be taken from the coarser resolution climate models, it is possible to generate high-resolution stochastic space-time rainfall series.
5 ACKNOWLEDGMENTS
This work received funding from Cooperative Research Centre (CRC) for Water Sensitive Cities. ERA-I data is obtained from ECMWF and the AWAP is obtained with the help of Dr. Ailie Gallant. The Bureau of Meteorology provided the Radar reflectivity data.
34th Hydrology and Water Resources Symposium 19-22 November 2012, Sydney, Australia
ISBN 978-1-922107-62-6 © 2012 Engineers Australia HWRS 2012585

6 REFERENCES
Anderberg, M. (1973). Cluster analysis for applications. Academic Press, New York.
Cheng, C. S. et al., (2010). A Synoptic Weather Typing Approach to Simulate Daily Rainfall and Extremes in Ontario, Canada: Potential for Climate Change Projections. Journal of Applied Meteorology and Climatology, 49(5), pp.845-866.
Foufoula-Georgiou, E. and Krajewski, W. (1995), Recent advances in rainfall modelling, estimation and forecasting, Revives of Geophysics 1125-1137.
Harris, D., Menabde M., Seed A., Austin G. (1998). Breakdown coefficients and scaling properties of rain fields, Non-linear Processes in Geophysics, 5 (2) 93-104.
Hay, L.E. et al., (1991), Simulation of Precipitation by Weather Type Analysis. Water Resources Research, 27(4), pp.493-501.
Hughes, P. & Guttorp, P., A class of stochastic models for relating synoptic atmospheric patterns to regional hydrologic phenomena. Water Resour. Res., 30(5), 1535–1546, doi:10.1029/93WR02983.
Huth, R. et al., (2008), Classifications of atmospheric circulation patterns: recent advances and applications. Annals of the New York Academy of Sciences, 1146, pp.105-52.
Katz, R.W. & Parlange, M.B., (1993). Effects of an index of atmospheric circulation on stochastic properties of precipitation. Water Resources Research, 29(7), p.2335.
Pope, Mick, Christian Jakob, Michael J. Reeder, 2009: Objective Classification of Tropical Mesoscale Convective Systems. J. Climate, 22, 5797–5808. doi: http://dx.doi.org/10.1175/2009JCLI2777.1
Raupach M.R., P.R. Briggs, V. Haverd, E.A. King, M. Paget, and C.M. Trudinger (2008a), Australian Water Availability Project (AWAP) CSIRO Marine and Atmospheric Research Component: Final Report for Phase 3.
Raupach M.R., P.R. Briggs, V. Haverd, E.A. King, M. Paget, and C.M. Trudinger (2008b), Australian Water Availability Project. CSIRO Marine and Atmospheric Research.
Seed, A.W., Shrikanthan, R. & Menabde, M., (1999). A space and time model for design storm rainfall. J. Geophys. Res, 104(D24), pp.31623-31630.
34th Hydrology and Water Resources Symposium 19-22 November 2012, Sydney, Australia
ISBN 978-1-922107-62-6 © 2012 Engineers Australia HWRS 2012586