
APPENDIX B - Minerva Access
371
A Conceptual Model for Assessing Risks and Building Resilience for Urban Infrastructure System: An Indonesian Case dissertation submitted in total fulfilment of the requirement for the degree of Doctor of Philosophy Presented by: Citra Satria Ongkowijoyo B.Sc.-Civil Eng. (Petra Christian University, Indonesia) M.Sc.-Construction Eng. (National Taiwan University of Science and Technology, Taiwan) ORCID identifier: orcid.org/0000-0002-3124-2980 Supervisor: Dr. Hemanta Kumar Doloi Advisory Committee: A/Prof. Alan March Dr. Toong-Khuan Chan Dr. Anna C. Hurlimann Melbourne School of Design Faculty of Architecture, Building and Planning Department of Construction and Property November 2017
-
Upload
khangminh22 -
Category
Documents
-
view
1 -
download
0
Transcript of APPENDIX B - Minerva Access

A Conceptual Model for Assessing Risks and Building
Resilience for Urban Infrastructure System: An
Indonesian Case
dissertation submitted in total fulfilment of the requirement for the degree of
Doctor of Philosophy
Presented by:
Citra Satria Ongkowijoyo B.Sc.-Civil Eng. (Petra Christian University, Indonesia)
M.Sc.-Construction Eng. (National Taiwan University of Science and Technology, Taiwan)
ORCID identifier: orcid.org/0000-0002-3124-2980
Supervisor:
Dr. Hemanta Kumar Doloi
Advisory Committee:
A/Prof. Alan March
Dr. Toong-Khuan Chan
Dr. Anna C. Hurlimann
Melbourne School of Design
Faculty of Architecture, Building and Planning
Department of Construction and Property
November 2017


Page i
“Life isn't about waiting for the storm to pass, ...
It's about learning to dance in the rain.”
― Vivian Greene

Page ii
-This page intentionally left blank-

ABSTRACT
Page iii
ABSTRACT
The urban infrastructure (UI) systems fundamentally underpin the ceaseless and mobile
process of urban life in the myriad of ways. The continuous reliance of modern and high
paced society on huge and complex systems of UI stretched across geography creates its
inevitable vulnerabilities. While the UI system poses significant complexity and challenges
to the society under dynamic and uncertain condition, extreme event and unexpected
conditions may lead to failures. The failures can undermine the successful realization of the
reliable UI serviceability, thus, affecting the whole communities which defiantly dependent
to the UI systems.
Recently, resilience concept has been acknowledged and applied to minimize specifically
direct and indirect losses from hazards through enhanced resistance and robustness to
extreme events, as well as more effective recovery strategies. Particularly, the resilience
approach is rooted in the well-established framework of risk analysis (RA). Nonetheless,
current resilience analysis (REA) lacks the consideration of RA as a unified process within
REA body. While, it is also acknowledged that in the dynamic environment of risk resilient
UI context common RA mainly spotlighted the static behavior of risk characteristic.
Researcher and practitioners focusing on either RA or REA without a mutual consideration
of the assessment processes, face severe inefficiency and that may eventually result in
substandard building of resilient plan and strategy. Accordingly, this research suggests that
risk and resilience analyses are complementary and should be applied in an integrated
perspective. To fill the knowledge gaps this research develop a conceptual risk-based REA
framework which give a focus on UI system robustness dimension, which consist of several
quantitative methods, such as; Failure Mode Effect and Criticality Analysis, Fuzzy and Grey
theory, and Social Network Analysis. The methods account for uncertainty in the analysis
processes, including; people perceptions and judgments towards risk as well as the risks
interaction.
The risk impact characteristic and mechanism, such as; risk magnitude, risk causality and
interaction pattern, and the impact of the risks on the urban community, are processed
following the analysis model proposed. The risk criticality model is then presented as a core
element within UI system robustness capacity analysis developed in this research. The

ABSTRACT
Page iv
recovery analysis is, further, proposed towards enhancing the robustness capacity after
disturbances occurred within recovery function transition over time.
To validate and exemplify the reliability and applicability of the framework, this research
applied the framework using a water supply infrastructure system, in Surabaya-Indonesia,
as a main case study. A data collection strategy, rigorous quantification processes, output
analyses followed by comprehensive discussion and findings towards the framework
application in the case study is demonstrated in this dissertation. The result shows that
appropriate measurement of the risk criticality model is inevitably crucial towards obtaining
overall robustness and recovery assessment.
Importantly, the increasing value of robustness capacity of UI system is not only influenced
by the recovery scenarios applied, but also the complexity in which influenced by the time
dimensions, spatial dimensions and by interdependencies between different economic
sectors that are interested in the recovery process. The simulation illustrates the benefits of
implementing the right recovery action. This indicates that it is possible to arrive at an
‘optimal recovery strategy’ that would enable the system to bounce back quickly and
efficiently considering the figure-of-merit of interest.
This research has provided fundamental contributions to the body of knowledge and, to the
implication of the comprehensive risk and robustness assessment considering its value to
the built environment and dependent communities. The findings have shedded lights on the
understanding of dynamic risk propagation and underlying affect in both risk events and
dependent community. The framework and assessment techniques are not limited to the
case study alone but also in various types of civil infrastructure systems.
Keywords: Urban infrastructure; social network; impact mechanism; system resiliency;
robustness capacity; risk management.

DECLARATION
Page v
DECLARATION
This is to certify that:
➢ The dissertation comprises only my original work towards the Ph.D., except where
indicated in the Preface,
➢ Due acknowledgement has been made in the text to all other material used,
➢ The dissertation is fewer than 100.000 words in length, exclusive of Tables, Figures,
Bibliographies and Appendices.
Citra Satria Ongkowijoyo November 2017

DECLARATION
Page vi
-This page intentionally left blank-

ACKNOWLEDGEMENT
Page vii
ACKNOWLEDGEMENT
This dissertation could not have been completed without the great support that I have
received over the years from many exemplary people around me. I firstly wish to offer my
most heartfelt thanks to the almighty God. Without his blessing and gifts, it is impossible for
me to complete this extraordinarily education journey. Further, I also would like to express
my gratitude to the following people;
To University of Melbourne, thank you for the rare and special opportunity I could have for
pursuing Doctorate degree. Without both Melbourne International Fee Remission
Scholarship (MIFRS) and Melbourne International Research Scholarship (MIRS) scholarship
schemes, I realized it is impossible for me to do this course. Further, I also thank you for the
generous funds and opportunity so that I could go for presenting my research at the
international conferences across the world.
Particularly, I also thank the International Strategic Alliance for providing me the funding
and opportunity to participate the APRU Multi-Hazards Summer School in Tohoku University,
Sendai-Japan (2015) as a representative of The University of Melbourne.
To my research advisors, Dr Hemanta Kumar Doloi. Thank you for the advice, kindness,
support, patient, and willingness that allowed and guided me to pursue Doctorate degree
and research on topics for which I am truly passionate. I see the same drive and passion in
your own research efforts, and I thank you for letting me do the same. Thank you for all the
meetings and chats over the years. You recognized that I at times needed to work alone but
also made sure to check in on me so that I stayed on the right path.
To all of my advisory members, for whom I indebted; Associate Professor Alan March; Dr.
Toong-Khuan Chan; and Dr. Anna Hurlimann. I believe that this study is still far from perfect
yet thank you for all of your support and critical thought during my study. Without all of the
critical thoughts and suggestions, I believe this dissertation would not have been as good as
we wanted.
To Jane Trewin, Ceira Barr and all whom I cannot announce the name. As the department’s
graduate advisor and research ethic, you have been an ever presents beacon of support,

ACKNOWLEDGEMENT
Page viii
encouragement, and advice. Thank you for keeping your office door open and available for
all the times when I needed it.
To Associate Professor Chris Heywood, I am far more grateful for and appreciative of the
conversations we have had. Thank you.
To my Mom and Dad. You have encouraged my academic interests from day one, even when
my curiosity led to incidents that were kind of hard to explain. Thank you.
To both of my sisters, Indahwati and Fentje Laurensia, thank you the ongoing encouragement
over the years.
To my brother, Cendranata. While I have taken my own directions at times, I have always
appreciated the path that you have blazed before me. You may be the first doctor in our family,
but you are now no longer the only one.
To my lovely wife; Yuanita Gondorejo. From the day I even have not started and began this
graduate school, you have become one of my precious partners whom patiently wait for me
to go through whole of the Ph.D., processes. We have seen, supported each other and gone
through both good times and bad. You are a great partner and a rock of stability in my life.
Our relationship was strong before and I hope it will continue to be as strong in the future. I
will always remember the great conversations we had over time, and I know that we will
reach our dream together in further time.
To all of the graduate students who did or are doing assistive technology and creativity work.
In the last several years, I have seen a large and active assistive literature and technology
research group come into being at the university. Thank you for the community and the
conversations. Continue doing the great work both at University of Melbourne and wherever
you go in life.
To my study participants. While I have said the same for others in this list, it is literally true
that this dissertation could not have been completed without your participation. Thank you.
To anyone that may I have forgotten. I apologize. Thank you as well.

LIST OF FIGURES
Page ix
TABLE OF CONTENTS
ABSTRACT ........................................................................................................................................ III
DECLARATION .................................................................................................................................. V
ACKNOWLEDGEMENT .................................................................................................................. VII
TABLE OF CONTENTS ..................................................................................................................... IX
LIST OF FIGURES ........................................................................................................................... XV
LIST OF TABLES ......................................................................................................................... XVIII
LIST OF PUBLICATIONS .............................................................................................................. XXI
LIST OF ABBREVIATIONS ........................................................................................................ XXIII
NOMENCLATURES ....................................................................................................................... XXV
CHAPTER 1 INTRODUCTION ......................................................................................................... 1
1.1 Introduction ................................................................................................................................................... 1
1.2 Research Background and Motivation .............................................................................................. 1
1.3 Rationale of the Research ........................................................................................................................ 2
1.4 Research Questions .................................................................................................................................... 5
1.5 Research Aim and Objectives ................................................................................................................ 6
1.6 Synopsis of the Research Design, Methodology and Sources of Data ................................ 7
1.7 Research Scope and Boundaries .......................................................................................................... 8
1.8 Significance of the Research................................................................................................................... 9
1.9 Dissertation Structure............................................................................................................................... 9
1.10 Chapter Summary...................................................................................................................................12
CHAPTER 2 URBAN INFRASTRUCTURE SYSTEM ROLE AND CAPACITY .......................... 13
2.1 Introduction .................................................................................................................................................13
2.2 Understanding Urban Infrastructure ..............................................................................................13
2.2.1 The Nature of Urban Infrastructure.....................................................................................15
2.2.2 Urban Infrastructure System Roles ......................................................................................18
2.2.3 The Urban Infrastructure Relationship with Urban Community...........................20
2.3 Vulnerable Urban Infrastructure System and its’ Impact towards Disruptions .........23
2.4 Resilient Urban Infrastructure System towards Disturbances ...........................................24
2.4.1 Definitions and Formulations .................................................................................................29
2.4.2 The Four Properties of Resilience .........................................................................................30

LIST OF FIGURES
Page x
2.5 Chapter Summary .............................................................................................................................................. 31
CHAPTER 3 RISK ANALYSIS AND RESILIENCE RELATIONSHIP ERROR! BOOKMARK NOT
DEFINED.
3.1 Introduction ................................................................................................................................................ 33
3.2 Understanding Risk Concept in Urban Infrastructure System Context .......................... 33
3.3 Risk Characteristic and its’ Impact Mechanism ......................................................................... 35
3.3.1 The Magnitude of Risk (Risk Priority Level) ................................................................... 35
3.3.2 Risk Impact Connection and Interaction Pattern ......................................................... 37
3.3.3 Risk Causality, Ripple Impact and Propagation Pattern ............................................ 40
3.3.4 Social Amplification of Risk ..................................................................................................... 42
3.4 Risk Analysis and Approaches Review ........................................................................................... 47
3.4.1 Shortage of Conventional Risk Analysis Method........................................................... 50
3.4.2 Knowledge Gaps on The RA Model towards Risk Impact to Community .......... 52
3.4.3 Knowledge Gaps on Risk Causality and Interaction Pattern Analysis Model .. 55
3.4.4 The Logic for Developing Critical RA Model.................................................................... 57
3.5 Risk and Resilience (Analysis) Relationship ............................................................................... 60
3.6 The Resilience Analysis Model Review and Evaluation ......................................................... 64
3.7 Chapter Summary ..................................................................................................................................... 65
CHAPTER 4 RESEARCH DESIGN AND METHODOLOGY ........................................................ 67
4.1 Introduction ................................................................................................................................................ 67
4.2 Research Design ........................................................................................................................................ 68
4.3 Employing Mixed Method Approach ............................................................................................... 71
4.3.1 Mixed Method Design Classification ................................................................................... 72
4.3.2 External Validity ........................................................................................................................... 73
4.4 Case Study Approach .............................................................................................................................. 75
4.5 Research Ethics and Conduct .............................................................................................................. 77
4.6 Approaches and Strategies to Data Collection ............................................................................ 78
4.6.1 Plain Language Statement (Cover Letter) ........................................................................ 78
4.6.2 Confidentiality and Anonymity of Participants ............................................................. 80
4.6.3 Questionnaire and Interviews Design Arrangement .................................................. 81
4.6.4 A Pilot Study ................................................................................................................................... 83
4.6.5 Public Verification and Systematic Observation ........................................................... 83
4.7 Population Arrangement and Sampling Methods ..................................................................... 84
4.7.1 Sampling Strategy Applied ...................................................................................................... 85

TABLE OF CONTENTS
Page xi
4.7.2 Judgmental or Purposive Sampling ......................................................................................86
4.7.3 Convenience and Snowball Sampling..................................................................................86
4.7.4 Survey Participants ......................................................................................................................87
4.8 The Time Dimension Design ................................................................................................................88
4.9 Empirical Analysis Methods and Techniques Applied ............................................................89
4.9.1 Failure Mode Effect and Criticality Analysis Method ...................................................91
4.9.2 Fuzzy Theory ..................................................................................................................................94
4.9.3 Social Network Analysis ............................................................................................................97
4.9.3.1 One-mode and Two-mode (Affiliation) Network ........................................ 98
4.9.3.2 Building Network Structure and Visualization ............................................ 99
4.9.3.3 Network Topology Decipherment Measurements ..................................... 101
4.9.4 True Empirical Experiments (Computational Simulation).................................... 104
4.9.5 Quasi-Experimental Design .................................................................................................. 105
4.9.6 Assumptions of Science Applied......................................................................................... 106
4.10 Chapter Summary................................................................................................................................ 107
CHAPTER 5 CONCEPTUAL FRAMEWORK AND ANALYSIS MODELS ............................... 109
5.1 Introduction .............................................................................................................................................. 109
5.2 Conceptual Framework Development ......................................................................................... 109
5.3 The Preliminary Phase......................................................................................................................... 111
5.3.1 Establishing the Context ......................................................................................................... 111
5.3.2 Determine Risk Measurement and Input Data Process........................................... 113
5.3.3 Initial Data Processing............................................................................................................. 114
5.4 Phase 1: Risk Magnitude Analysis .................................................................................................. 115
5.4.1 Determined Fuzzy Linguistic Rules................................................................................... 117
5.4.2 Risk Decision Matrix Development ................................................................................... 119
5.4.3 Defuzzification Process ........................................................................................................... 119
5.4.4 Defining Comparative, Standard and Different Series Matrix .............................. 120
5.4.5 Calculating Grey Relation Coefficient ............................................................................... 122
5.4.6 Degree of Relation Determination ..................................................................................... 123
5.5 Phase 2: Risk Causality and Interaction Pattern Analysis .................................................. 123
5.5.1 Stakeholder and Risk Event Identification .................................................................... 125
5.5.2 Collecting The Data from Community.............................................................................. 126
5.5.3 Preliminary Matrix Development ...................................................................................... 127
5.5.4 Produced Global Matrix with Weight Relation Link .................................................. 128

TABLE OF CONTENTS
Page xii
5.6 Phase 3: Risk Impact to Community Analysis .......................................................................... 130
5.6.1 Data Collection from The Community ............................................................................. 132
5.6.2 Developing Stakeholder-Risk Affiliation Matrix ......................................................... 132
5.7 Phase 4: Risk Criticality Analysis ................................................................................................... 135
5.8 Phase 5: System Robustness Analysis ......................................................................................... 136
5.8.1 System of Interest Definition ............................................................................................... 137
5.8.2 Figure-of-Merit or System Function ................................................................................. 138
5.8.3 Disruptive Event ........................................................................................................................ 139
5.8.4 Recovery System Action as a Function of Time .......................................................... 140
5.8.5 Main Shock Function Transition Model Development ............................................ 141
5.8.6 Main Stress Function Transition Model Development ............................................ 143
5.9 Phase 6: System Recovery Analysis .............................................................................................. 145
5.10 Assumptions Applied ........................................................................................................................ 149
5.11 Chapter Summary ............................................................................................................................... 149
CHAPTER 6 FRAMEWORK VALIDATION: APPLICATION TO A CASE STUDY ................ 151
6.1 Introduction ............................................................................................................................................. 151
6.2 Case Study Background ...................................................................................................................... 151
6.2.1 Indonesia UWS Infrastructure System and Regulation........................................... 152
6.2.2 Surabaya Water Supply Infrastructure System ........................................................... 154
6.3 Stakeholder Groups Identification ................................................................................................ 157
6.4 Risk Events Identification .................................................................................................................. 162
6.5 Data Collection Process and Respondent Profile ................................................................... 169
6.6 Chapter Summary .................................................................................................................................. 172
CHAPTER 7 DATA PROCESSING, SIMULATION AND ANALYSIS ....................................... 175
7.1 Introduction ............................................................................................................................................. 175
7.2 Initial Data Processing ........................................................................................................................ 176
7.3 Phase 1-Data Processing, Simulation and Analysis ............................................................... 177
7.4 Phase 2-Data Processing, Simulation and Analysis ............................................................... 180
7.5 Phase 3-Data Processing, Simulation and Analysis ............................................................... 191
7.6 Phase 4-Data Processing, Simulation and Analysis ............................................................... 199
7.7 Phase 5-Data Processing, Simulation and Analysis ............................................................... 202
7.7.1 Shock Impact Analysis Model and Simulation............................................................. 202
7.7.2 Shock and Stress Impact Analysis Model and Simulation ..................................... 208
7.7.3 Critical Risk-River Pollution and Contamination (R5) ............................................ 211

TABLE OF CONTENTS
Page xiii
7.8 Phase 6-Data Processing, Simulation and Analysis ............................................................... 213
7.8.1 What is Included within The Recovery Scenarios ...................................................... 213
7.8.2 Recovery Analysis towards Enhancing Robustness Capacity ............................... 213
7.9 Chapter Summary .................................................................................................................................. 219
CHAPTER 8 FINDINGS AND DISCUSSION ............................................................................... 221
8.1 Introduction .............................................................................................................................................. 221
8.2 Review of the Previous Chapters .................................................................................................... 221
8.3 Discussion and Findings towards Preliminary Risk Analyses .......................................... 223
8.4 Joint Risk Analysis: The Analysis of Critical Risk .................................................................... 227
8.5 Robustness and Recovery Model Analysis Discussion and Findings ............................ 229
8.6 Summary of Findings............................................................................................................................ 231
8.7 Chapter Summary .................................................................................................................................. 234
CHAPTER 9 SUMMARY AND CONCLUSION............................................................................ 237
9.1 Introduction .............................................................................................................................................. 237
9.2 Summary of Content ............................................................................................................................. 237
9.3 Chronological Development of Research Objectives and its Achievements .............. 240
9.4 Limitation of the Current Research ............................................................................................... 245
9.5 Recommendations for Further Work ........................................................................................... 248
9.6 Implication of the Research............................................................................................................... 252
9.6.1 Theoretical Implications ........................................................................................................ 253
9.6.2 Practical Implications .............................................................................................................. 255
9.7 Closure ......................................................................................................................................................... 258
BIBLIOGRAPHY ............................................................................................................................ 261
APPENDIX A .................................................................................................................................. 283
APPENDIX B .................................................................................................................................. 289
APPENDIX C .................................................................................................................................. 317
APPENDIX D .................................................................................................................................. 331

TABLE OF CONTENTS
Page xiv
-This page intentionally left blank-

LIST OF FIGURES
Page xv
LIST OF FIGURES
Figure 2-1. The downstream system between infrastructure users and consumers (Source:
Frischmann, B. M. [19]). ................................................................................................................... 19
Figure 2-2. The interrelationship basic model of UI systems with the community. ................. 22
Figure 2-3. The basic notion of hazard and risk impact. ........................................................................ 24
Figure 2-4. Four main properties of resilience. .......................................................................................... 26
Figure 2-5. Performance response curve of a system on a disruptive event. (Source:
Ouyang, M., L. Duen as-Osorio, and X. Min [69]). ................................................................... 28
Figure 3-1. Example of risk likelihood and severity in a risk matrix. (Source: Komendantova,
N., et al. [84]).......................................................................................................................................... 36
Figure 3-2. An example of interconnected risk map in electricity infrastructure. (Source:
Correa-Henao, G. J., J. M. Yusta, and R. Lacal-Ara ntegui [80]). ........................................ 38
Figure 3-3. A propagation pattern of the domino effect. (Source: Khakzad, N., et al., [91]). 41
Figure 3-4. The conceptual framework of social amplification of risk. (Source Kasperson, R.
E., et al. and Kasperson, J. X., et al. [81, 82]). ........................................................................... 43
Figure 3-5. The conceptual model of risk and its impact in UIs context. ....................................... 45
Figure 3-6. The standard framework of RA. (Source: ISO/IEC, ISO/IEC FDIS 31010:2009,
[99]). .......................................................................................................................................................... 48
Figure 3-7. Risk analysis correlation with UI system robustness. ..................................................... 62
Figure 3-8. Assessing critical risk in further potential uncertain condition. ............................... 63
Figure 4-1. The research design framework. ............................................................................................... 70
Figure 4-2. Trapezoidal Fuzzy set of number A . (Source: Figure from: Silva, M.M., et al.
[161])......................................................................................................................................................... 96
Figure 4-3. (a) An example of one-mode network and (b) Two-mode network. ....................... 99
Figure 4-4. (a) Non-directional and (b) Directional relationship tie. (Source Park, H., et al.
[184]).......................................................................................................................................................100
Figure 4-5. (a) Non-directional and (b) directional matrix structure. ..........................................100
Figure 5-1. Empirical framework development. ......................................................................................110
Figure 5-2. Flowchart of Fuzzy-based FMECA. .........................................................................................116
Figure 5-3. Trapezoidal Fuzzy membership of the traditional rating for O, S and D. .............118
Figure 5-4. Trapezoidal Fuzzy membership of the linguistic term moderate. ..........................119
Figure 5-5. Risk causality and interaction pattern analysis model flowchart. ..........................125
Figure 5-6. Risk impact to community analysis model flowchart. ..................................................131
Figure 5-7. Robustness analysis conceptual model flowchart. .........................................................137

LIST OF FIGURES
Page xvi
Figure 5-8. Delivery function transition in resilience. .......................................................................... 138
Figure 5-9. Main shock function transition over time. ......................................................................... 142
Figure 5-10. Main stress function transition over time. ...................................................................... 144
Figure 5-11. Recovery function transition over time. ........................................................................... 146
Figure 6-1. General UWS infrastructure system in Indonesia. ......................................................... 153
Figure 6-2. Surabaya city position in Indonesia. ..................................................................................... 155
Figure 6-3. Brantas river basin map and the split streams of Brantas river. ............................. 156
Figure 6-4. The supply chain of Surabaya water supply and its’ stakeholder groups. .......... 159
Figure 6-5. The conceptual model of UWS system risks affecting community. ........................ 163
Figure 6-6. Identified risk events for Surabaya water supply infrastructure system. ........... 164
Figure 6-16. Total respondents from eight stakeholder groups. ..................................................... 170
Figure 7-1. Risk causality and interaction pattern network topology based on DC. ............. 185
Figure 7-2. Risk causality and interaction concentric map based on DC. ................................... 185
Figure 7-3. Risk causality and interaction pattern network topology based on BC. .............. 186
Figure 7-4. Risk causality and interaction concentric map based on BC. .................................... 187
Figure 7-5. Risk causality and interaction pattern network topology based on CC. .............. 187
Figure 7-6. Risk causality and interaction concentric map based on CC. .................................... 188
Figure 7-7. Risk causality and interaction pattern network topology based on EC. .............. 188
Figure 7-8. Risk causality and interaction concentric map based on EC. .................................... 189
Figure 7-9. Risk causality and interaction pattern network topology based on SC. .............. 190
Figure 7-10. Risk causality and interaction concentric map based on SC. ................................. 190
Figure 7-11. Risk impact to community network visualization based on DEG. ....................... 193
Figure 7-12. Risk impact to community network visualization based on DC. .......................... 193
Figure 7-13. Risk impact to community concentric map based on DC. ........................................ 194
Figure 7-14. Risk impact to community network visualization based on BC............................ 194
Figure 7-15. Risk impact to community concentric map based on BC. ........................................ 195
Figure 7-16. Risk impact to community network visualization based on CC. ........................... 195
Figure 7-17. Risk impact to community concentric map based on CC. ........................................ 197
Figure 7-18. Risk impact to community concentric map based on EC. ........................................ 198
Figure 7-19. Risk causality and interaction network based on DC, BC, CC, EC and SC. ........ 203
Figure 7-20. Risk causality and interaction concentric map based on DC, BC, CC and EC. . 204
Figure 7-21. Risk causality and interaction concentric map based on SC. ................................. 204
Figure 7-22. Risk impact to community network based on DEG, DC, BC, CC and EC. ............ 205
Figure 7-23. Risk impact to community concentric map based on DEG, DC, BC, and CC. ... 205

LIST OF FIGURES
Page xvii
Figure 7-24. Risk impact to community concentric map based on EC. .........................................206
Figure 7-25. The UI system robustness capacity towards R5 effect over period of time. ....209
Figure 7-26. River pollution in Surabaya caused by the industry wastage. ................................212
Figure 7-26. Resilience analysis for pollution and contamination risk (R5)..............................215
Figure A-1. Fieldwork fund grant letter. .......................................................................................................285
Figure A-2. Application letter (in Bahasa). .................................................................................................286
Figure A-3. The PLS (in English) used in the fieldwork. .......................................................................287
Figure A-4. The PLS (in Bahasa) used in the fieldwork. .......................................................................288
Figure C-1. Gunung Sari Floodgate (front) managed by Jasa Tirta-I public corporation.
(Source: http://kodim0832.blogdetik.com/2016/10/11/pantauan-babinsa-
karah-pintu-air-rolak-gunung-sari-status-aman)..............................................................319
Figure C-2. Gunung Sari Floodgate (back) managed by Jasa Tirta-I public corporation.
(Source: http://travpacker.blogspot.com.au/2015/05/bangunan-sejarah-
bendungan-rolak-songo.html). ...................................................................................................319
Figure C-3. Physical UWS infrastructure system managed by PDAM. ...........................................319
Figure C-4. Water treatment plant owned and operated by PDAM. (Source:
http://kelanakota.suarasurabaya.net/news/2014/144689-250-Ribu-Pelanggan-
PDAM-Surabaya-Tak-Dapat-Pasokan-Air). ............................................................................320
Figure C-5. Trans-logistic business in Surabaya, a business which need UWS service.
(Source: https://thestoryofwardana.files.wordpress.com/2013/05/guariglia-
cityscape-urban-city-architectural-9.jpg). .............................................................................320
Figure C-6. Activity of beverage plant which need a non-stop UWS service. (Source:
https://coca-colaamatil.co.id/cctour). ....................................................................................320
Figure C-7. Surabaya water supply is definitely required for bottled water industry. (Source:
http://www.harianterbit.com/hanterhumaniora/read/2017/05/08/81009/0/4
0/KPPU-Diminta-Netral-dalam-Menyikapi-Kasus-AMDK#). .......................................321
Figure C-8. Plaza as both commercial and public space which need water supply. (Source:
https://www.gotomalls.com/blog/2016/11/10-mall-terbaik-di-surabaya/). ...321
Figure C-9. An open space in Surabaya equipped with ready-to-drink water facilities.
(Source: https://www.flickr.com/photos/eastjava/4874286030). .........................321

LIST OF TABLES
Page xviii
LIST OF TABLES
Table 2-1. The four properties of resilience and its definition. ........................................................... 30
Table 3-1. Conventional RA drawbacks summary. .................................................................................... 52
Table 4-1. Factors affecting external validity. ............................... Error! Bookmark not defined.
Table 4-2. The general network topology indicator applied. ............................................................ 102
Table 5-1. The example of participants list with its identity. ............................................................ 115
Table 5-2. The example of risk events list with its identity. ............................................................... 115
Table 5-3. Traditional ratings for occurrence (O). .................................................................................. 117
Table 5-4. Traditional ratings and TFN for severity (S). ...................................................................... 118
Table 5-5. Traditional ratings and TFN for detectability (D). ............................................................ 118
Table 5-6. Example of comparative series. ................................................................................................. 121
Table 5-7. Example of Grey relation coefficient. ...................................................................................... 122
Table 5-8. Grey relation coefficient and degree of Grey relation information. ......................... 123
Table 5-9. The network indicator in the context of risk causality and its interaction. ......... 129
Table 5-10. The network indicator in the context of risk affecting community. ...................... 134
Table 6-1. Summarized stakeholder groups. ............................................................................................. 160
Table 6-2. Determined risk events and the description. ...................................................................... 165
Table 6-3. Respondents number. ..................................................................................................................... 171
Table 6-4. Respondents demographic data based on the age group. ............................................ 171
Table 6-5. Respondents demographic data based on the education level. ................................. 171
Table 6-6 Respondents demographic data based on working experience. ................................ 171
Table 7-1. Variables and mathematical symbols adopted. ................................................................. 176
Table 7-2. The risk magnitude output based on local and global analysis. ................................ 177
Table 7-3. R-R network topology decipherment simulation output .............................................. 183
Table 7-4. Risk magnitude and normalized S-R network topology decipherment. ................ 192
Table 7-5. Risk magnitude and risk criticality simulation outputs. ............................................... 200
Table 7-6. Shock impact and network topology simulation output. .............................................. 207
Table 7-7. System robustness capacity level simulation output. ..................................................... 208
Table 7-8. System-of-interest F t( ) facing R5 simulation output. ..................................................... 216
Table B-1. R-R matrix with global interrelationship value ................................................................. 310
Table B-2. Dichotomized R-R matrix ............................................................................................................. 311
Table B-3. S-R matrix from input data (1). ................................................................................................. 312
Table B-4. S-R matrix from input data (2). ................................................................................................. 313
Table B-5. S-R matrix from input data (3). ................................................................................................. 314
LIST OF TABLES
Page xix
Table B-5. S-R matrix from input data (4). ..................................................................................................315
Table B-7. S-R matrix from input data (4). ..................................................................................................316
Table C-1. Scenario-1 for simulation-based recovery strategy .........................................................322
Table C-2. Scenario-2 for simulation-based recovery strategy .........................................................323
Table C-3. Scenario-3 for simulation-based recovery strategy .........................................................324
Table C-4. Scenario-4 for simulation-based recovery strategy .........................................................325
Table C-5. Scenario-5 for simulation-based recovery strategy .........................................................326
Table C-6. Shock impact simulation output. ...............................................................................................327
Table C-7. Stress impact simulation output. ..............................................................................................327
Table C-8. Expected recovery simulation output. ....................................................................................328
Table C-9. Scenario-1 recovery simulation output. ................................................................................328
Table C-10. Scenario-2 recovery simulation output. ..............................................................................329
Table C-11. Scenario-3 recovery simulation output. ..............................................................................329
Table C-12. Scenario-4 recovery simulation output. ..............................................................................330
Table C-13. Scenario-5 recovery simulation output. ............................................................................. 330

LIST OF TABLES
Page xx
-This page intentionally left blank-

LIST OF PUBLICATIONS
Page xxi
LIST OF PUBLICATIONS
The following papers were produced to disseminate some results from the work undertaken
by the author during the period of this research.
International Journal Papers
201X Citra S. Ongkowijoyo and Hemanta K. Doloi, Risk Criticality-based Resilient
Assessment Model for Urban Infrastructure System: With a Focus on Restoration
Modeling and Analysis, International Journal of Reliability Engineering and System
Safety. (Under Review)
201X Citra S. Ongkowijoyo and Hemanta K. Doloi, Participatory-based Urban
Infrastructure System Risk Causality and Interaction Pattern Analysis using Social
Network Analysis, International Journal of Reliability Engineering and System
Safety. (Under Review)
201X Citra S. Ongkowijoyo and Hemanta K. Doloi, A Network-based Risk Analysis Model
for Assessing Urban Infrastructure Risk Impact to Community, Built Environment
Project and Asset Management. (Under Review)
2017 Citra S. Ongkowijoyo and Hemanta K. Doloi, Determining Critical Infrastructure
Risks using Social Network Analysis, International Journal of Disaster Resilience in
The Built Environment. (Published)
Conference Papers
2017 Citra S. Ongkowijoyo and Hemanta K. Doloi, Risk-based Resilience Assessment
Model Focusing on Urban Infrastructure System Restoration, Procedia Engineering
for 7th International Conference on Building Resilience 2017 (ICBR-2017), 27-29
November, Bangkok-Thailand.
2017 Citra S. Ongkowijoyo and Hemanta K. Doloi, Understanding of Impact and
Propagation of Risk based on Social Network Analysis, Procedia Engineering for 7th
International Conference on Building Resilience 2017 (ICBR-2017), 27-29
November, Bangkok-Thailand.
2016 Citra S. Ongkowijoyo and Hemanta K. Doloi, Setting the Priority of Risks To
Community based on Social Network Analysis, 6th International Conference on
Building Resilience (ICBR-2016) 2016, 7-9 September, Auckland-New Zealand.
2016 Citra S. Ongkowijoyo and Hemanta K. Doloi, Analyzing Community Hazard in

LIST OF PUBLICATIONS
Page xxii
Urban Infrastructure System, 6th International Conference on Building Resilience
2016 (ICBR-2016), 7-9 September, Auckland-New Zealand.
2016 Citra S. Ongkowijoyo and Hemanta K. Doloi, Analyzing The Risk Criticality of
Infrastructure System on The Community, American Society in Civil Engineering
(ASCE) for Construction Research Congress 2016 (CRC-2016), 31 May-2 June, San
Juan-Puerto Rico.

LIST OF ABBREVIATIONS
Page xxiii
LIST OF ABBREVIATIONS
BC Betweenness Centrality
BIM Building Information Modelling
BN Bayesian Network
BUMD Badan Usaha Milik Daerah
BUMN Badan Usaha Milik Negara
CC Closeness Centrality
CI Critical Infrastructure
CIP Critical Infrastructure Protection
DAS Daerah Aliran Sungai
DC Degree Centrality
DEA Domino Effect Analysis
DEDE Dust Explosion Domino Effect
DEG Degree
DMs Decision Makers
FDIS Final Draft International Standard
FMECA Failure Mode Effect and Criticality Analysis
EC Eigenvector Centrality
ERM Enterprise Risk Management
GRM Global Risk Matrix
HazId Hazard Identification
HAZOP Hazard and Operability
HEAG Human Ethics Advisory Group
HREC Human Research Ethics Committee
IFIs Infrastructure Failure Interdependencies
IKM Indeks Kepuasan Masyarakat
IRB Institutional Research Board
LTS Large Technical System
MCS Monte Carlo Simulation
MGSE Melbourne Graduate School of Education
PDAM Perusahaan Daerah Air Minum
PLS Plain Language Statement
PU Pekerjaan Umum

LIST OF ABBREVIATIONS
Page xxiv
QRA Quantitative Risk analysis
RA Risk Analysis
RAI Research Aim
REA Resilience Analysis
RO Research Objective
RPN Risk Priority Number
RPV Risk Priority Value
RQ Research Question
SAR Social Amplification of Risk
SC Status Centrality
SNA Social Network Analysis
SOI System-of-Interest
SPM Standar Pelayanan Minimal
SPP Standar Pelayanan Publik
SRA Society of Risk Analysis
TFN Trapezoidal Fuzzy Number
UWS Urban Water Supply
UI Urban Infrastructure
WCDR World Conference on Disaster Reduction
WTP Water Treatment Plant
WEF World Economic Forum

NOMENCLATURES
Page xxv
NOMENCLATURES
O Risk occurrence (likelihood)
S Risk severity
D Risk detectability
( )n kR Risk decision factor of risk n
( )F r Risk decision factor defuzzification
Relative defuzzification value identifier
( )Ar Trapezoidal Fuzzy Number membership function
( ),n i jr r The degree of relation between potential causes and optimum decision factor
( )nn R Risk Priority Value (RPV)
R-R Risk causality and interaction matrix
nmR An interaction between risk event n and risk event m
Risk event interaction capacity value
Risk event interaction capacity value coefficient
[R-R]
DC ( )nR Degree centrality of network topology from R-R analysis
[R-R]
BC ( )nR Betweenness centrality of network topology from R-R analysis
[R-R]
CC ( )nR Closeness centrality of network topology from R-R analysis
[R-R]
EC ( )nR Eigenvector centrality of network topology from R-R analysis
[R-R]
SC ( )nR Status centrality of network topology from R-R analysis
S-R Stakeholder-risk associated matrix
K The logic matrix (or relation/disjoint) of the S-R network
* #
g
i nS R S R Stakeholder-associated risk
[S-R]
DC ( )nR Degree centrality of network topology from S-R analysis
[S-R]
BC ( )nR Betweenness centrality of network topology from S-R analysis
[S-R]
CC ( )nR Closeness centrality of network topology from S-R analysis
[S-R]
EC ( )nR Eigenvector centrality of network topology from S-R analysis
B Boolean domain

LIST OF ABBREVIATIONS
Page xxvi
( )A
f x Membership function of a Fuzzy set
( )A
f v Degree of preference in favor
( )Ax Trapezoidal Fuzzy Number membership function
( )n
R Critical risk event n (stress event)
0S Original state of system-of-interest
dS Disrupted state of system-of-interest
fS Recovered state of system-of-interest
het Disruptive event time
hdt Initial set of recovery action started (slack time start)
t Initial substantive recovery action time
ft Time that system-of-interest recovered
( )F • Figure-of-merit (FOM) for specific system-of-interest state
( )G • Decreasing state value
S State value
0( )F t Delivery function value of the system corresponding to state 0S
( )he
F t Delivery function value of the system corresponding to state dS at time het
E Set of all disruptive events
( )n
R Shock impact from risk event n
( )n
R Normalized stress impact value
ROB.( )
nF R Robustness level of the system withstanding towards risk event n impact
I Random variable expressed as function of the mean
Lm Mean of the random variable function
I Standard deviation of the random variable I
a Multiplier of the standard deviation corresponding to a specific level of losses

CHAPTER 1-INTRODUCTION
Page 1
CHAPTER 1
INTRODUCTION
CHAPTER HEADINGS Introduction Research Background and Motivation Rationale of the Research Research Aim and Objectives Research Questions Synopsis of the Research Design, Methodology and Sources of Data Research Scope and Boundaries Significance of the Research Dissertation Structure Chapter Summary
1.1 Introduction
This Chapter provides a brief motivation of the research through introducing the research
background and highlighting the rationale of the research. Based on the research problem,
the aim of the research followed by research objectives and several key questions are
established. The Chapter continues to describe the synopsis of research design, methodology
and sources of data, research scopes and boundaries, and research significance. This Chapter
then discusses the research methodology that comprises mathematical algebraic and
modeling methods. The dissertation structure and brief description of the first Chapter are
presented and summarized in the last part of this Chapter.
1.2 Research Background and Motivation
On our rapidly urbanizing planet, everyday life of the world’s swelling population of
urbanities is increasingly sustained by vast and unknowably complex system of urban
infrastructure (UI) and technology stretched across demographic space. The UI system are
interdependent, spatially diverse, vast and complex which are made of many interacting
components assembled by design to provide optimal performance, reliable operation and
functional. Within our built environment, UI plays a crucial role, not only as the backbone of
socio-economic development but also community wellbeing.
The UI system fundamentally underpins the ceaseless and mobile process of city life
in a myriad of ways. While UI system provides the fundamental background to modern urban
everyday life, however its’ system often hidden, assumed, even naturalized. The continuous
reliance of urban dwellers on huge and complex systems of UI stretched across geography

CHAPTER 1-INTRODUCTION
Page 2
creates its inevitable vulnerabilities. Therefore, when UI services are taken for granted,
paradoxically, it is often the moment when the disruption occurs, the dependence of cities on
UI networks become more visible.
On the practical side of the issue, as a matter of fact, UI are witnessing more and more
system-level breakdowns, which emerge from small perturbations that cascade to large-
scale consequences. In UI sectors, the hazardous events can potentially exert significant
failure on the functionality of one infrastructure and another, which finally affecting
community wellbeing. Despite suffering significant traumatic conditions of extreme
deprivation, serious threat and major stress, UI system manage to endure and recover fully.
This unique ability has been called ‘resilience’, a term taken from the physics of materials.
Recently, it emerges as a new concept towards the capacity to recover from extremes
of trauma and stress. Accordingly, resilience reflects a dynamic confluence of factors that
promotes positive adaptation despite exposure to adverse life experience [1]. Therefore, it
is not surprising that UI protection and resilience have become a national and international
priority which calls for the analysis of UI vulnerability and the evaluation of their resilient
properties, for ensuring their protection and resilience [2, 3].
As a result, there is a significant need to measure, monitor and maintain the reliability
and potential vulnerabilities of UI system. In any study of both UI and community resilience,
risk and vulnerability assessment of great importance plays a crucial role. The assessment
stands as the basis of building an effective response strategy for the preparedness, response
and further fostering the recovery period of the infrastructure in both pre-and post-extreme
event period, assuring the UI serviceability towards a disturbance. Therefore, managing risks
for UI system is inevitably important step towards ensuring its continue serviceability for
supporting both the UI systems and the whole community.
From this, research is required to gain a comprehensive understanding in the issues
of urban UI complexity and inherent risk including its impact nature. Considering the UI
system’s complexity, which are supported by various aspect, such as; physical-engineering,
cybernetic or organizational, and by environment (demographical, natural) and operational
context (political/ legal/ institutional, and economic) [4], the discussion towards UI system
facing the disturbance during its service life leads to the requirement of an integrated and
unified assessment model of UI system resilience [5, 6].
1.3 Rationale of the Research
The built environment such as UI system provides the essential physical basis for modern

CHAPTER 1-INTRODUCTION
Page 3
societies and have multi-dimensional impact on public safety and economic prosperity at
regional and national levels. Past experiences have shown that such systems are exposed to
various natural and manmade hazards. The resulting damage to the systems may cause
human causalities and disrupt the normal day-to-day life of people in the short run. This
damage may also impose significant direct and secondary economic losses due to business
interruption that may not ever fully recover [7].
With extensive globalization and connectivity, the effects of natural and manmade
disasters (intentional and unintentional) may no longer be restricted to any demographic or
political vicinity. Severe disruptions are also becoming more unpredictable, more frequent
and more damaging. When a disaster strikes particular UI systems, the affected community
requires immediate help and action to survive, resources, and efforts to recover in a short
time. Accordingly, the concepts of ‘risk management’ have become keywords when dealing
with hazardous events.
Understanding the nature and reducing the level of risk impact pertaining to an UI in
general is a major task in infrastructure risk management. Moreover, the UI systems are faced
with continuously changing operating environments due to dynamics of external as well as
internal variables. As this happens the nature of disturbance events (hazards) also takes a
variety of forms calling for more rigorous continuous and holistic analysis of risk
management practice [8]. One way to mitigate and prepare the UI system facing the
disturbances is by building-in reserve capacity that may be exploited when the system is in
need.
Meanwhile, the community needs to be ‘prepared’ and less ”vulnerable”, in order to
achieve a high ‘resilience’ [9]. Unlike, risk analysis (RA), the resilience approach
acknowledges the dynamic nature of complex systems and postulates the ability of the
system to flexibly accommodate potential disturbances effects without irreversible or
unacceptable declines in performance, structure and function. Preparing for these adverse
events as if they are inevitable requires regular evaluation of operational procedures, safety
procedures and policy guidelines, RA methods, and counter measures, which are the key
aspects in resilience analysis (REA).
Resilience is an integrated concept that allows multiple risks, shocks and stresses and
their impacts on ecosystem and community at large. Resilience also refers to the drivers of
change that influence systems in the transformation processes. It focuses attention on a set
of institutional, community and individual capacities and particularly on learning, innovation
and adaptation. Strengthening resilience can be associated with windows of opportunities

CHAPTER 1-INTRODUCTION
Page 4
for change, often opening after disturbance.
The concept of resilience may underpin organizational philosophy changes that is
required to manage risks from a holistic picture, ensure safety and efficiency throughout the
life cycle of the system [8]. Importantly, an alternative approach to resilience is to start from
the basis of effective risk management, recognizing the inherent similarities between risk
and resilience as organizing frames and the extent to which RA and risk management provide
a window on resilience.
In addition, an UI system that is effective in managing risk is likely to become more
resilient to shocks and stresses event, though the exact relationship needs to be tested
empirically. Managing risk in this context means reducing risk, transferring and sharing risk,
preparing for impact and responding and recovering efficiently. It also involves being
prepared for surprises-those disturbance events beyond the lived experience or occurring
very infrequently. Thus, there is a need to go beyond the intuitive definition and provide a
comprehensive quantitative of system.
Therefore, there is an urgent need to develop a novel REA model particularly
departing from a concept of uncertainty, dynamic and complex UI system risk characteristic
and environment. This research aims to develop a risk-based REA conceptual framework for
assessing, measuring and evaluating the UI system robustness capacity. The model retaining
to use of risk criticality model for expressing the dynamic and complex risk characteristics
about highly uncertain, unforeseeable and unknowable behavior in UI environment as well
as the adventitious people perceptions towards risk and UI security.
The REA is distinguished from RA in several ways. Principally, conventional RA
methods are used to determine the negative consequences of potential undesired events, and
to mitigate the organization’s exposure to those undesirable outcomes. Further, risk as a
measure of potential loss of any type and is associated with the uncertainty about and
severity of the consequences of a disruptive activity [10]. In contrast, resilience is an
endowed or enriched property of a system that is capable of effectively combating (absorbing,
adapting to or rapidly recovery from) disruptive events.
The resilience approach emphasizes an assessment of the system’s ability to; (i)
Anticipate and absorb potential disruptions; (ii) Develop adaptive means to accommodate
changes within or around the system; and (iii) Establish response behaviors aimed at either
building the capacity to withstand the disruption or recover as quickly as possible after an
impact. Meanwhile, resilience could be viewed as the “intrinsic capacity of a system,
community or society predisposed to a shock and, or stress event to adapt and survive by

CHAPTER 1-INTRODUCTION
Page 5
changing its non-essential attributes and rebuilding itself”.
Furthermore, emphasizing the concept of UI system resilience means to focus on the
quality of life of the community at risk and to develop opportunities to enhance a better
outcome. The challenge, notwithstanding, lies in comprehensively integrating quantitatively
REA with RA beyond conventional mechanism for endowing a system with necessary
capabilities to cope with disturbance events.
Interestingly, risk and resilience approaches share four key characteristic; (i) They
provide an holistic framework for assessing systems and their interaction, from the
household and communities through to the sub-national and national level, (ii) They
emphasize capacities to manage hazards or disturbances, (iii) They help to explore options
for dealing with uncertainty, surprises and changes, (iv) They focus on being proactive [11].
While resilience clearly has attractions as a unifying concept and as a vision with
political currency in uncertain times, achieving positive outcomes will require policy makers
and practitioners to fall back on more familiar concepts with which they have practical
experience. Risk and risk management provide this familiarity and, similarly, allow a cross-
disciplinary, cross-issue discussion.
From the discussion above, it is ascertained that RA plays pivotal roles as the
foundation of REA. However, previous REA processes lack of considering the risk analysis)
dimension. Accordingly, this issue prevents the development of a metric to measure
resilience in a generic and consistent manner. Such a risk metric would greatly enable
development of resilient systems, comparison of resilience strategies and support of
resilience related decisions during design and operation.
1.4 Research Questions
The study of UI in the face of disturbance and its effect to the community and resilient level
received high attention in the academia and industry recently. Particularly, robust REA
output lies in the comprehensive RA. Accordingly, various RA methods have been proposed
in the past either by using empirical data or, qualitative or quantitative assessment, in a way
of deterministic, stochastic or dynamic method. Nonetheless, in many conventional RA
methods development, the focus is usually in quantitative analysis, evaluation of the risks
and that to single event environment.
Meanwhile, knowing the inherent hazard in UI system and its resilience context, the
ability of particular UI system to withstand the disturbance (risk event) and maintain its
serviceability level is called as ‘robustness’. Accordingly, the robustness analysis in the UI

CHAPTER 1-INTRODUCTION
Page 6
system, importantly refers to the REA which is considering RA as its’ pivotal element. In
addition, it is acknowledged that conventional RA methods mostly underestimated the
existence of risk nature, characteristic and impact mechanisms as well as the stakeholder
engagements towards assessment processes.
Therefore, it misleads the REA output which yields on ineffectiveness on the resilience
plan and strategy building. In the light of these knowledge gaps, there’s a need to develop a
novel conceptual framework which capable to model and analyze the UI system resiliency in
the face of risk nature, characteristic, impact mechanism complexity and dependent relations
with the community. Correspondingly, this research raised several questions (RQs) which
stated below:
RQ1: What the risk characteristic and impact mechanism that are significant in defining the
critical risk?
RQ2: How to conceptually model the variables and functions, and empirically quantify the
critical risk based on the risk characteristic and impact mechanism?
RQ3: How to empirically derive the risk-criticality analysis model into system-of-interest
robustness analysis as a function of time?
RQ4: How the system-of-interest robustness capacity against particular risk can be
empirically assessed and enhanced over post-disturbance period?
1.5 Research Aim and Objectives
It is acknowledged that both RA and REA have an intricate connection. The issue of risk being
connected to resilience is receiving relative high attention in both academia and industry
recently especially in its concept of system resiliency. Based on research background,
rationale and questions raised in previous section, the overarching aim of this research (RAI)
is:
RAI: To develop a conceptual risk-based resilience assessment framework which focuses on
urban infrastructure system robustness dimension.
To achieve RAI above, this research formulates several research objectives (ROs), as
follows:

CHAPTER 1-INTRODUCTION
Page 7
RO1: To determine the risk characteristics and impact mechanisms based on literatures.
RO2: To explore risk analysis methods literature and evaluate its shortages in UI context.
RO3: To identify and develop risk function and analysis model respectively towards
measuring the critical risk upon its’ impact mechanisms.
RO4: To establish system-of-interest robustness analysis model as a function of time
RO5: To develop system-of-interest recovery analysis model.
RO6: To undertake a case study investigation to test the applicability and validate the
conceptual assessment model.
1.6 Synopsis of the Research Design, Methodology and Sources of Data
This dissertation follows a research design with an in-depth review of literatures pertaining
to; UI system and its role for supporting the urban activities, UI serviceability degradation
and its impact post-disturbance, the concept of risk including its impact nature and
characteristic, and the general system-of-interest resilience discussions. Importantly, this
research also evaluates the previous literature in the area of UI system RA and REA that
outlines the argument and discuss the shortcomings in the conventional methods.
In this research, both quantitative and qualitative research designs were adopted to
provide comprehensive analysis, discussing and understanding towards the framework in
both conceptual and practical context. This research applies several empirical methodologies
to establish the risk criticality and robustness analysis functions. The empirical methods
include; Failure Mode Effect and Critical Analysis (FMECA), Fuzzy theory, Grey theory and
Social Network Analysis (SNA).
Further, a dichotomize method to determine the weight for each of the matrix element
to mimic the real risk interrelationship and behavior is also proposed within the framework
for supporting participatory-based two mode network analysis. A holistic approach is then
utilized, integrating risk magnitude, risk ripple and propagation impact between risk events,
and risk impact to community to establish the risk criticality analysis model.
Moreover, to build the system robustness analysis model, this research establishes the
shock and stress impact capacity model of risk that affect the UI system. To exemplify the
framework towards assessing and evaluating UI system robustness level, a five scenario-
based recovery strategy is developed as a guidance for building the mitigation plan and
intervention strategy to enhance both UI system and community resilience. To examine five
recovery strategies, an ‘expected’ recovery strategy model which acts as a benchmark is

CHAPTER 1-INTRODUCTION
Page 8
defined using simplified trigonometric recovery function.
This work takes the form of a case-study of the urban water supply (UWS)
infrastructure in the Indonesian context to test and validate the applicability and usefulness
respectively of the framework. The research is conducted in the form of a survey and
interview, with data being gathered from various stakeholder groups as research
participants via face-to-face and email-based communication. A combination of quantitative
and qualitative approaches was used in the data analysis. Data for this research was collected
using design-based questionnaire with both closed-response (nominal, forced choice
alternative category and Likert response format) and open-ended type of questions.
Regarding the data collection, it is not quite sufficient for the author to collect the data
only from the participants which basically are the individuals who are dependent and
affected by the presence of the particular UI system. Therefore, participants of this research
expand to the stakeholder groups on the entire UI system supply chain. The supply chain
comprises its services and stakeholder groups from government and local institution,
experts and also the lay people. Accordingly, to collect the data, this research applied the
purposeful-stratified simple random sampling method.
The research input data, simulation output analysis and interpretation are drawn
from four main sources, namely; literature related to UWS infrastructure system, UI system
risk management and REA, participants point of view (obtained from face-to-face interview)
and, rational explanation. The rational explanation refers to the two basic assumptions of
science; the first is to determined behavior which in the explanation that one can observe or
confirm through public verification. Second, the behavior follows a lawful pattern that can be
studied, in which the explanation makes clear and logical link between the cause and effect
[12]. Explanations that are not rational are not scientific.
1.7 Research Scope and Boundaries
This research is confined within the following scope and boundaries:
- It is acknowledged that resilience has four properties, that is; (i) Rapidity, (ii)
Redundancy, (iii) Robustness and (iv) Resourcefulness. In this research, the
conceptual framework of REA developed is confined on the robustness property.
- The proposed analysis models are constrained towards assessing risk at the discrete
and single point time (non-continuous time series risk event).
- Instead of positive consequences, the risk events identified consider negative
consequences only.

CHAPTER 1-INTRODUCTION
Page 9
- The assessment input is based on both expert and laypeople perception in terms of
measuring the risk based on determined risk criticality function.
- The proposed conceptual framework focuses on the UI system RA and REA of post-
disturbance period, which means that the system performance has not interrupted by
the extreme event in the present time.
- Several simplified and determined assumptions applied within the proposed
framework mainly due to the limitations of; (i) Understanding risk characteristic,
impact and its mechanism, (ii) The community dynamic with their divergent
perceptions towards risk, (iii) Limited computational resources available at the time,
and (iv) Limited knowledge in hand to mimic the real condition.
1.8 Significance of the Research
This research brings several significances both to the body of knowledge and practical
situation, which describes below:
- This research is the first attempt to propose a novel risk-based REA framework for
assessing UI system robustness capacity a unified resilience model. Importantly, in
real world the framework could be a practical tool that supports decision making in
UI system RA and building community resilience.
- This research contributes to fill the risk management and resilience knowledge gaps
by examining that both risk and REA viewed as a unified paradigm.
- It supports community participation within preliminary RA processes, leading to
measure the function of risk criticality.
- The framework provides a new understanding towards the comprehensive RA which,
not only pegged by single element (e.g., risk magnitude which measured by its
decision factors) but also; (i) People perceptions towards risk, (ii) The dynamics of
risk impact and propagation mechanism affecting other risks, and (iii) The dissimilar
of relationship and impact affecting stakeholder members.
- The framework and analysis model support and enhance the stakeholder ability to
perceive, understand, assess the UI system risks as well as to collaborate and
communicate in an effective and efficient way; thereby supporting and achieving the
effective of decision making and higher performance in strategic UI risk management.
1.9 Dissertation Structure
This dissertation overall structure is composed of nine theme Chapters including the

CHAPTER 1-INTRODUCTION
Page 10
introductory Chapter. Chapter one introduces the research study by discussing the research
background and rationale. Further, by highlighting the research gaps on literatures basis, the
research questions are then formulated to state the position for the investigation and
argument. Correspondingly, the overarching research aim following by a number of research
objectives are then formulated to accomplish the research aim. An overview of the research
design and several methods apply also describes at a glance in the synopsis section. Further,
the research scopes and boundaries described as a research restriction towards making the
research focus on the main aim. Finally, the research significance describes the contribution
of this research.
Chapter two begins by laying out the theoretical dimensions of the UI system concept
and its important role to the urban flow. The literature review is delivered based on several
references and through previous studies discussions which come with arguments. The
discussion continues to explain the disturbances (extreme events) affecting UI system
serviceability. Accordingly, the discussion shifting towards the effects of disturbances on UI
serviceability. The discussion then subsequently moves ahead towards how disturbed UI
system affecting the urban flow. Following the previous discussion, then the relation between
UI risks and the community is explored. An argument towards shortcomings of the
conventional RA methods relating with the issue discussed previously is establish, further.
Chapter three provides an in-depth literature review towards; the inherent of risk in
UI context and, its behavior. The discussion continues to review RA methods as well as its
drawback pertain to latent risk characteristics and impact mechanisms. Shifting from the
previous discussion, the discussion alters and begin to discuss the system resilience capacity
in the context of UI system. Four properties of resilience which assemble the entire resilience
context is briefly considered. Additionally, the argument on literature review pertaining to
drawbacks of the UI system REA methods is then developed. In the last section, Chapter three
concludes the research needs towards various gaps defined in Chapter 2 and 3.
Chapter four presents the research design and methodology as well as the
development of both framework and analysis models. A description on how this research
integrate stakeholders to various aspects of the research is explained. The case study
approach, research ethics, data collection method and strategy following by the population
arrangement and sampling technique are discussed thoroughly. This Chapter’s goal is to
provide sufficient detail action plan for getting from RQs and, RAI to ROs to be answered and
accomplished, and to some conclusions toward RQs.
Chapter five discusses the conceptual framework developed in this research. The

CHAPTER 1-INTRODUCTION
Page 11
framework consists of six main phases which each holds different analysis models. The initial
and first four main phases established poses the integrated guidance stream to the final
phases which is the UI system robustness and recovery analysis model development. This
Chapter also reviews preliminary data processing, a number of empirical models and
simulation techniques applied. A comprehensive mathematical functions and vigorous
equations adopted followed by the establishment of new formulas are explained in this
Chapter.
Chapter six describes the background of the Surabaya city water supply
infrastructure system as main case study. The stakeholder groups based on literatures and
field investigation towards water supply chain system investigation is determined.
Hereinafter, the inherent risk events which potentially could arise in the Surabaya water
supply infrastructure system are identified. Further, structured data collection process and
preliminary results obtained (such as; participant demographics) are then presented and
described. Finally, collected data from the fieldwork are initially processes and discusses
before employ the empirical analysis.
Chapter seven discusses the extensive data input, data conversion, data
manipulation and information processing, computational simulation output, numerical
analysis and preliminary outcome, and interpretation. The preliminary RAs output are
discussed step by step. Throughout three preliminary RAs outputs, the risk criticality
simulation and result can be constructed and analyzed respectively. From here, the REA and
scenario-based recovery action strategies simulation output are presented in the last part of
the Chapter.
Chapter eight draws upon the entire empirical calculation and simulation, tying up
the various theoretical and empirical strands in order to discuss the findings from a number
of computational simulations generated and obtained in the previous Chapter. The theme is
not only to discuss the interview and data simulation results undertaken during the data
processing, but also the case study facts that can be brought up as ground argument
supporting the findings. Importantly, this Chapter also examine and review several research
objectives and questions which is answered within the research bodies.
Chapter nine summaries and concludes the dissertation by providing an overall
discussion that merges the critical findings supporting the ROs accomplishment. The main
contribution, the theoretical and practical implication, limitations and directions for further
research are also provided in Chapter nine. Following the reference list, supplementary
information (i.e., the research ethical approval and the questionnaires, and supplementary

CHAPTER 1-INTRODUCTION
Page 12
Tables as well as the Figures) are provided in Appendices section.
1.10 Chapter Summary
This Chapter has predominately presents the research prologue which consists of several
sub-sections to explore the knowledge gaps and research needs. The research key questions
compliance with both RAI and ROs are established. The contribution of this research as to
fill the knowledge and practical gaps in the area of UI system risk and resilience management
is highlighted. Moreover, this Chapter also briefly discussed the research design and methods,
research scope and limitation, and research significance. A structure of this dissertation is
exhibited at the end Chapter in order to make this dissertation accessible and
understandable.

CHAPTER 2-URBAN INFRASTRUCTURE SYSTEM ROLE AND CAPACITY
Page 13
CHAPTER 2
URBAN INFRASTRUCTURE SYSTEM ROLE AND CAPACITY
CHAPTER HEADINGS Introduction Understanding Urban Infrastructure Vulnerable UI System and its Impact towards Disruption Resilient UI System towards Disturbances Chapter Summary
2.1 Introduction
This Chapter intends to build an understanding towards urban infrastructure (UI) system
role and its’ importance for the urban flow. Widespread studies on the concept and nature of
UI system in the context of urban development are carried out and discussed. The
exploration of UI system vulnerability towards extreme events and various disturbances are
then reviewed and discussed thoroughly. Further, a discussion pertaining to the degraded
performance of UI serviceability-when the system encounter disruptions during its service-
life affecting urban community is presented. The last part of this Chapter ends with the
discussion related to the existing concept of UI system resilience.
2.2 Understanding Urban Infrastructure
The vital networks of UIs are necessary for the functioning of the 21st century urban complex.
An urban complex with urban health outcomes which dependent on many interactions and
feedback loops [13]. As a result, prediction within the planning process is fraught with
difficulties and unintended consequences are common. Accordingly, the presence of a
sophisticated range of infrastructure types provide a basis for human activity which is critical
to the function of the modern urban environment. While, UI systems integrate cities as
shared spaces of common life, it also supports urban territories into zones of differential
access and exclusion [14].
Further, UI can be defined as the network of services (other than public buildings)
that allows the circulation of people, materials, and information within the city to support
various society activities [15]. There are no settled universal theories or even definition of
what constitutes the system of ‘infrastructure’. Frischmann, B. M., defined “infrastructure” as
generally conjures up the notion of a large-scale physical resource made by humans for
public consumption where this standard definitions of infrastructure refers to the
CHAPTER 2-URBAN INFRASTRUCTURE SYSTEM ROLE AND CAPACITY
Page 14
‘underlying framework of a system” or the “underlying foundation” of a system [14].
Some infrastructure types include (but not limited to): roads, public or collective
transit, water supply and distribution system, drainage network, electric power generation
and distribution system, telecommunication network system. Often taken to exemplify the
designs of public power and formal planning, the realities of UI more usually involve
unsteady integrations of public, private and informal infrastructures.
Meanwhile, the American heritage dictionary defines infrastructures as ‘an
underlying base or foundation, especially for an organization or system’ [15]. Zio, E., defined
infrastructure as a large scale, man-made systems that function interdependently to produce
and distribute essential goods (such as energy, water and data) and services (such as
transportation, banking and health care) [16]. Moreover, the term of infrastructure is applied
to a variety of systems but is most often associated with the physical structure that makes
cities work.
In the meantime, UIs retain powerful images of stability which often regarded as
‘symbols of the complexity, ubiquity and the embodied power of modern technology’ [17].
Central to the entire discipline of infrastructure, infrastructure can be seen in the concept of
common management. According to Frischmann, B. M., infrastructure is examined as a
commons [14]. The terms ‘commons’ generally conjures up the notion of a shared
community resource and often brings to mind the related concept of open access, or, more
generally openness.
Commons typically are distinguished from open access because commons are open
only to community members and often subject to a particular governance regime, while
open-access resources are open to the public without ownership or attendant in governance
regimes. In view of this, common management refers to the situation in which a resource is
accessible to all members of a community on nondiscriminatory terms, meaning terms that
do not depend on the users’ identity or intended use.
Further, common management is used to capture a nondiscriminatory sharing
strategy, which can be implemented through a variety of public and private institution,
including open access, common property, and other resource management or governance
regimes [14]. The general value of the common management strategies is that it maintains
openness, does not discriminate among users or uses of the resource and eliminates the need
to obtain approval or a license to use the resource.

CHAPTER 2-URBAN INFRASTRUCTURE SYSTEM ROLE AND CAPACITY
Page 15
2.2.1 The Nature of Urban Infrastructure
To understand the nature of the infrastructure, it is necessary to understand the purpose,
aims and the type of infrastructure. Infrastructure can be classified based on its type by a
number way which is a key element in order to understand the nature of the urban
environment. Accordingly, the infrastructure classification indicates the complexity of urban
living and its dimensions which are social, environmental, cultural and economic but
founded on the provision of tangible and concrete structures.
The presence of infrastructure type and classification demonstrate the breath of
infrastructure concerns and the elements necessary to provide the foundations of the
modern urban flow. The benefit of establishing a classification of infrastructure types and
consideration of the urban environment in terms of infrastructure types is that comparisons
between different planning systems can be made effectively [18].
Following the most frequently distinction, Ennis, F., classified the type of
infrastructure based on ‘hard’ and ‘soft’ infrastructure [18]. The former refers to
infrastructure networks such as; electricity, gas, telecommunications, water, sewerage and
transport, while the latter refers to community (e.g., emergency services, community centers,
schools), environmental infrastructure (landscaping, open space) and so on.
Ennis, F., also distinct the infrastructure based on ‘marketable’ and ‘non-marketable’
infrastructure [18]. The marketable infrastructure refers to physical, economic and housing.
Meanwhile the non-marketable infrastructure refers to community, health, education and
environmental infrastructure where the provision of these would be considered as loss-
making by the private sectors. Thus, the non-marketable infrastructure held no attraction.
Meanwhile, Frischmann, B. M., classified an infrastructure as a ‘traditional and non-
traditional’ infrastructure [14]. Three generalizations about traditional infrastructure help
set the stage. First, the government has played and continues to play a significant and widely
accepted role in ensuring the provision of many traditional infrastructures. Second,
traditional infrastructures generally are managed in an openly accessible manner whereby
all members of a community who wish to use the resources may do so on equal and
nondiscriminatory terms. Third, traditional infrastructures generate significant spillovers
(positive externalities) that result in large social gains.
Familiar examples of “traditional infrastructure’, include; (i) Transportation systems,
such as highway systems, railway systems, airline systems, and ports; (ii) Communication
systems, such as telephone networks and postal services; (iii) Governance systems, such as
court systems and, (iv) Basic public services and facilities, such as school, sewers, and water

CHAPTER 2-URBAN INFRASTRUCTURE SYSTEM ROLE AND CAPACITY
Page 16
systems. The list could be expanded considerably but the point is simply to bring to mind the
range of traditional infrastructure resources on which urban community rely daily.
The ‘non-traditional’ infrastructures, on the other hand, refers to complex dynamic
processes, that are associated with natural ecosystem, social and cultural processes. In short,
the ‘non-traditional’ infrastructure typically provide additional institutional support, in the
form of public subsidies for basic research or in the form of command-and-control regulation.
The example of ‘non-traditional’ infrastructure includes; environmental and intellectual
infrastructures.
Again, Frischmann, B. M., also classified an infrastructure based on its resources
topology such as; commercial, public, social and mixed infrastructure [19]. Commercial
infrastructure resources support production of a wide variety of private goods, while public
and social infrastructure resources are used to produce a wide variety of public and social
goods, respectively. Many traditional infrastructures, including transportation and
communications infrastructures, contribute to the production of a wide range of public and
social goods because of the ways in which they connect communities and social systems.
In spite of knowledge about the infrastructure type classification, an important
consideration towards infrastructure is the characteristic of infrastructure itself which are
important to determine the infrastructure behavior. Rinaldi, S. M. et al. provides a clear
explanation towards several main infrastructure characteristics including; spatial
(demographical) scales, temporal scales, operational factors, and organizational
characteristics [3]. Spatial scales can vary widely in infrastructure analyses. Pertinent spatial
scales range from individual parts to the meta-structure composed of interdependent
infrastructures and the environment.
Closely related is the notion of demographic scales, given that infrastructures span
physical space ranging in scale from cities, regions, and nations to international levels.
Infrastructure dynamics span a vast temporal range. Relevant time scales of interest vary
from milliseconds (e.g., power system operation) to hours (e.g., gas, water, and transportation
system operations) to years (e.g., infrastructure upgrades and new capacity). Operational
factors influence how infrastructures react when stressed or perturbed. Finally,
organizational characteristic can be key factors in determining the operational characteristic
of infrastructures, with important security and risk implications.
These factors are closely related to security and risk as well as the operating
procedures; operator education and training; backups and redundant systems; emergency
workarounds; contingency plans, including periodic reviews and updates; and security

CHAPTER 2-URBAN INFRASTRUCTURE SYSTEM ROLE AND CAPACITY
Page 17
policies, including implementation and enforcement. Another contribution related to the
dynamic nature of infrastructure can be seen in the Chapter four of book written by
Frischmann, B. M. [14]. Frischmann, B. M., examined the dynamic nature of infrastructure
and gives suppression that infrastructures evolve over time, at different rates and in different
manners, depending on the infrastructure in question.
Changes may occur, for example, by exogenous changes in the environment, changes
in demand, emergence of unforeseen uses, new knowledge about the relative values of
different uses, and supply-side change in design, management, or priority. These drivers may
interact and influence each other dynamically in incredibly complex ways. Following Graham,
S. and C. McFarlane, following the notion of the infrastructure nature, the infrastructure is a
changing set of processes that are often lively, powerful, and uncertain [20].
On the other hand, Moss, T., seen the infrastructure system as a Large Technological
Systems (LTS) concept [21]. Based on the premise, nonetheless, LTS cannot be understood
solely in terms of their technological components but as complex systems which link material
technologies with organizations, institutional rules and cultural values [21]. Similarly, Little,
R. G., seen the infrastructure as a LTS which by their nature are intricate constructions of
technology, people, and governance structures [22] .
Even if it were possible to fully model the technical components of the system, the
human and organizational aspects of LTS make predicting the behavior of the system in
duress with a significant degree of accuracy and precision somewhat illusory [22]. The
development of LTS is determined not by technological advancement alone but also by the
interplay between various components. Importantly, the purpose of LTS theory is to explain
how actors, technologies, markets and regulations interact to shape the initiation, evolution
and expansion of large technological systems [23].
Bowker, G.C. and S.L. Star, stated one of the eight defining characteristics of LTS that
achieve the cultural status of “infrastructure” is that they “become visible upon breakdown”
[24]. The study further wrote that “the normally invisible quality of working infrastructure
becomes visible when it breaks. Even when there are meticulous backup mechanisms and
procedures, their existence highlights the now visible infrastructure.
Central to the argument of LTS concept are three characteristics introduced by
Hughes, T. P., that is: system-builders, momentum and reverse salient [25]. The combined
impact of these three characteristics of LTS is visible in the various phases of development
which each LTS experiences. Although the boundaries between the different phases are fluid,
each phase is regarded as distinctive in terms of the principal actors involved and the

CHAPTER 2-URBAN INFRASTRUCTURE SYSTEM ROLE AND CAPACITY
Page 18
openness of the structures to change.
2.2.2 Urban Infrastructure System Roles
The UI, consists of huge and complex mechanism with significant incoherent connections of
numerous dependent infrastructure systems [26]. Thus, UI system’s incapacity or
destruction has a significant impact on health, safety, security, economics and social well-
being. A failure in such UI system, or the loss of its service (serviceability degradation), can
be damaging to a single society and its economy, while it could also cascade across
boundaries causing failures in multiple infrastructures with potential catastrophic
consequences [4, 16].
Furthermore, all of the UIs have one property in common-they are all dynamic-
complex adaptive systems which are also highly interdependent on a set of critical products
and services (complex collections of interacting components in which change often occurs as
a result of learning processes), both physically and through a pervasive use of information
and communication technologies [3, 18, 27, 28]. It is also considered a separate system that
in kind of weaving together in all sorts of mutually dependent manner. As a result, disruption
in one tends to cascade to others very quickly.
Besides, UI is also characterized by its relationship to other infrastructure, agents,
possible disruptions, possible interventions, jurisdictions and markets. For that reason, each
components of an infrastructure consist of a small part of the intricate web that forms the
overall infrastructure. Consequently, it is of the utmost importance to government, business,
and the public at large to understand the nature of UI and take measures necessary to ensure
that the flow of services provided by particular system continues unimpeded in the face of a
broad range of both natural and manmade hazards (extreme events).
The UI system are multifaceted by nature, for instances; physical-engineering,
cybernetic or organizational, and by environment (demographical, natural) and operational
context (political/ legal/ institutional, economic, etc). A number of examples of UIs sectors
which provides services can be seen in [3, 29-31]. The UI system are complex which made by
many components interacting in a network structure. Most often, the components are
physically and functionally heterogeneous, and organized in a hierarchy of subsystems that
contributes to the system function. This leads to both structural and dynamic complexity [4].
The structural complexity derives from; (i) Heterogeneity of components across
different technological domains due to increased integration among systems, (ii) Scale and
dimensionality of connectivity through a large number of components (nodes), highly

CHAPTER 2-URBAN INFRASTRUCTURE SYSTEM ROLE AND CAPACITY
Page 19
interconnected by: (a) Dependences, i.e., undirectional relationship: a component depends
on another through a link, but this other one does not depend on the former through the
same link, and (b) Interdependencies, i.e., bidirectional relationships: a component depends
on another through some links, and this latter component likewise depends on the former
component through the same and, or other links.
On the other hand, dynamic complexity manifests through the emergence of (even
unexpected) system behavior in response to local changes in the environmental and
operational conditions of its components. Further, emergence is another dynamic property
of complex systems, which appears only at a macro level manifesting itself by the arising of
novel and coherent structures, patterns and behavioral properties.
The design politics of how UIs developed, governed and integrated is core to the ways
that the common life of cities is conceived and realized. The UIs is made up around objects
and networks, but also around human associations, labor and interactions-an embodied
urbanism involving auto-infrastructures which is rigged together from public provisions,
private concession and informal improvisations. It is an exemplary instance of how an urban
order emerges ‘from the relation of people to things, as well as from the relation of people to
each other [14].
In the context of urban living and infrastructure provision, Frischmann, B. M.,
proposed a point of view that infrastructure can be interpreted as a resource where it
satisfies these three criteria [19]. In the context of urban living and infrastructure provision,
which are; (i) The resource may be consumed non-rivalrously for some appreciable range of
demand, (ii) Social demand for the resource is driven primarily by downstream productive
activities that require the resource as an input and, (iii) The resource may be used as an input
into a wide range of goods and services, which may include private goods, public goods, and
social goods [19].
Figure 2-1. The downstream system between infrastructure users and consumers (Source: Frischmann, B. M. [19]).

CHAPTER 2-URBAN INFRASTRUCTURE SYSTEM ROLE AND CAPACITY
Page 20
Following the third criteria, Figure 2-1 shows the downstream systems that arise
between and among infrastructures users and consumers of the outputs produced. The UIs
seen as a resource to the community whose dependent on it. Meanwhile, providing
infrastructures for the human action in the context of urban living is a complex task for the
nation considering the wide range of mechanism, the dynamic of society and the
infrastructure itself considering many inherent aspects (i.e., economic, social, cultural,
political and technical). The UIs is a means to other ends, and the effectiveness, efficiency,
and reliability of its contribution to the other ends must ultimately be the measure of
infrastructure performance. A focus on the UI provision within the urban context is critical
to develop an understanding of how UIs does not simply exist, but occurs [20].
2.2.3 The Urban Infrastructure Relationship with Urban Community
The UIs are vehicles of movement and becoming, ways of mediating the constantly oscillating
intersections of various times, spaces, economics, constraint and possibilities making up city
life [32]. While the existence of UIs shapes the cities by fulfilling community needs in various
ways, conversely urban community works maintaining the UI system in order to ensure the
reliability of respective UI system serviceability (e.g., both government and non-government
bodies boundary). This linkage between systems and services is critical to understanding the
complex relationships that exist between the physical systems, the people and the
enterprises they serve.
The UIs conventionally seen as a technical matter of; the networks and the variable
flows through them. However, such a conventional sense is inflected by the modern
understanding of UI as an object of material and ‘conscious design’ in the city. Furthermore,
the UIs consist of social interaction and creativity. The design of UIs is in part a technical
project, but is, moreover, a social and political project that integrates the city as a space of
collective provision, or segments in into uneven patterns of infrastructural access and
exclusion.
The individual makes use of the UIs to create opportunities and to develop their
abilities and skills, to advance their desire to enjoy the good life. The UI is therefore the social
and cultural action which is made possible by the existing UIs. The buildings and equipment
provide empty spaces which are of significance for human activities. In turn, the UIs
themselves are created by ideas and concepts which emerge from the human activity which
occurs in the superstructure. This notion leads to further discussion with respect to the
relationship between infrastructure systems and the community.

CHAPTER 2-URBAN INFRASTRUCTURE SYSTEM ROLE AND CAPACITY
Page 21
Accordingly, several studies have been acknowledged pertaining the relationship
between UI system and the community. Ennis, F., drew together a number of researches in
the topic of the provision of UI by consider the means of local actors securing the
infrastructure from various actors in the context of negotiation [18]. The study has examined
the relationships between developer and planning agencies and the institutional framework
which have provided the parameters for securing contributions towards infrastructure.
Furthermore, this relationship has been clearly stated in the study conducted by Mau,
B. and J. Leonard, in which infrastructure services have always been foregrounded in the lives
of more precarious social groups, that result either of socio-spatial differentiation strategies
or infrastructure crises [33]. Graham, S., in his study, discussion highlights the way in which
the technological circulations sustained by infrastructural assemblages inseparably blend
together the social relations of urban life and the relations between cities with the natural
and biospheric processes open which they rely [17].
A critical approach to infrastructure as a less transparent and less complete kind of
‘assemblage’ are not considered solely on the complex and often incoherent connection of
socio-material elements (expressed and submerged as infrastructural stuff). Instead, the
human actors, incidental materials, policies and plans, and information systems both virtual
and social-that generate, distribute and appropriate basic services and resources in the city
[26]. Certainly, the design of UIs is in part a technical project, but is, moreover, a social aspect
and political project that integrates the city as a space of collective provision, or segments in
into uneven patterns of infrastructural access and exclusion.
The interconnected UI system is an integrated part for supporting human needs in the
urban living circumstances. Thus, a clear relationship exists between the UI and dependent
community [22, 34-37]. Therefore, to understand the complex relationships that exist
between the physical UI systems and, the people (including the enterprise they serve), it is
important to explore the various factors and interrelationship pattern between the UI system
and the stakeholder groups. Figure 2-2, depicts the basic model of interrelationship between
UI systems with community. Accordingly, the existing interrelationship between UIs system
and the community is inevitably crucial towards ensuring the security and continuity of UIs
system serviceability.
The basic model illustrates how urban community are responding to the signals in the
way that they (as the UI system stakeholders) provide, manage, regulate and harness the
utility services as a response which create for more efficient form of resource use.
Nonetheless, during the previous time, past studies commonly discussed the planning of

CHAPTER 2-URBAN INFRASTRUCTURE SYSTEM ROLE AND CAPACITY
Page 22
infrastructure networks which tends to be conceived as the rational management of resource
with little regard to the dynamic, contextually contingent strategies of infrastructure
stakeholders (e.g., regulator and operators) and users [38].
In UI system supply chain, each phase of developments is characterized by different
dominant actor groups, and today there are other actors besides those engaged on the supply
side of utility services who have a say in how they develop. Importantly, the interrelationship
concept aforementioned followed by a traditional logic of infrastructure management which
is coming under pressure from a variety of emerging challenge [39].
Urban
Infrastructure
Urban
CommunityMutual
relationship
Resources
Users
Service that shape the urban life
Managing the infrastructure
Figure 2-2. The interrelationship basic model of UI systems with the community.
The relationships between UI system and the various actors (stakeholders) has been
supported by a considerable amount of literatures published. For instances; Guy, S. and S.
Marvin, emphasized the need to develop an alternative analytical framework which
recognizes infrastructure systems as socio-technical networks [38]. The study offers a new
understanding of the interrelationships between physical production processes shaping the
construction of cities and the changing social dynamics or urban consumption.
Ennis, F., examined the relationships between several actors society and the
infrastructure development [36]. Furthermore, Li, T.H.Y., S.T. Ng, and M. Skitmore, studied
and proposed a systematic method of analyzing stakeholder concerns relating to public
infrastructure and construction projects by examining the degree of consensus and/or
conflict involved [35]. The relationship between UI system and the urban community has
been widely investigated and recognized, both the UI system and community have a very
strong relationship which crucial for the building of decision and policy strategies towards
the security advancement of UIs superiorly.
While the existence of mutual relationship between UI system and the community
give substantial emphasis on the UI serviceability improvement, nonetheless, the continued

CHAPTER 2-URBAN INFRASTRUCTURE SYSTEM ROLE AND CAPACITY
Page 23
reliance of urban dwellers on huge and complex UI stretched across geography creates its
inevitable vulnerabilities [22].
2.3 Vulnerable Urban Infrastructure System and its’ Impact towards Disruptions
The UIs are exposed and challenged by potential disruptive factors coming from many types
of hazardous events, including; natural and man-made, environments. Some of the examples
are; natural hazards (e.g., global warming, heavy solar storms), climate changes, component
aging and failure, sharp load demand increase, intentional attacks, disease outbreaks, food
(distribution) shortages, financial crashes, and organized (cyber-) crime, or cyber warfare.
Further, increasing interdependencies in the UIs system in somewhat uncontrollable
manner, creates unprecedented events of dangerous hazards and damaging events which can
spread rapidly and globally throughout the system. The UI faces a range of potentially serious
hazards. In addition to natural hazards, experience demonstrates that excessively prolonged
service lives, aging materials, and inadequate maintenance all negatively affect infrastructure.
Accordingly, urbanities often have few or no real alternatives when the complex UIs
that always managed well to serve society are disrupted or even removed [36]. While UI
services are taken for granted, it is often the moment when the disruption occurs, such as;
electricity blackout, the server is down, the subway has a strike, or the water pipe ceases to
function that the dependence of cities on infrastructure networks becomes most visible.
Additionally, not only the UI vulnerabilities emerged from natural hazard but also
various inherent hazards which yield on the disrupted and degraded UI system serviceability
following the unavoidable disruption of urban life. As discussed by Oh, E., and Oh et al.
through a basic cell model of the interrelationship between UI system hazard (also refers to
risk) and urban community, the diffusion path of risk impact develops at the advanced stages
increase the complexity for risk mitigation [40, 41].
With increasing community losses due to hazards, more emphasis is being placed on
improved risk management strategies that consider, not only to economic and environmental
loss but also to social loss [40-43]. Because society relies on the continuous agency of UI to
do various daily activities, urbanites often have few or no real alternatives when the complex
UIs that sometimes manage to achieve this are removed or disrupted. Hereafter, the
interrelationship between the UI and associated community is also one of the key
components to understand hazard impact mechanism.
Figure 2-3, depicts the basic notion of UI system hazard and its impact specifically on
the affected urban community. It describes a single disruption that can devastate the urban

CHAPTER 2-URBAN INFRASTRUCTURE SYSTEM ROLE AND CAPACITY
Page 24
life as they mutually-interrelated with one another. Despite the formidable array of threats
confronting UIs, many problems will occur simply due to the complexity of these systems
[22]. It is noteworthy to mention the disrupted UI will automatically affect its’ serviceability
level which disrupts the city as urban community. This issue has been supported by the fact
that will be discussed thoroughly from past studies.
Urban
Community
Hazardous
event
Trigger
Trigger
Trigger
Trigger
Trigger
Haz
ard
s a
nd
th
reat
s
Prevention
(proactive)
Specific
harm
Initiating
event
Urban
Infrastructure Serviceability
Risk
Impact
Disrupted
serviceabilityImpact
Figure 2-3. The basic notion of hazard and risk impact.
Little, R. G., discussed a range of potentially serious threats to UI [22]. For example; in
addition to natural hazards, experience demonstrates that excessively prolonged service
lives, aging materials, and inadequate maintenance all negatively affect infrastructure.
Graham, S., studied the disrupted cities as a manifest when UI fails to deliver its’ service to
the community [17]. Mei, R., H. Chuanfeng, and L. Liang, developed an analytical framework
with empirical applications to address infrastructure failure interdependencies (IFIs) in the
context of electrical power outages which failure leads not only to failures of other
infrastructure systems but also creates the greatest societal concern [44].
Previous studies have indicated that UIs exposed to many types of hazards which its
vulnerability generates various impacts and consequences both to UIs systems and
dependent community. For this reason, Critical Infrastructure Protection (CIP) has gained
high importance in all nations, with particular focus being placed traditionally on physical
protection and asset hardening [30, 45-47]. To protect infrastructures, it requires modeling
their component fragilities under different hazards and, then, analyzing their system-level
risk and vulnerability.
2.4 Resilient Urban Infrastructure System towards Disturbances
In recent years, lessons learned from some catastrophic accidents have extended the focus
on the ability of infrastructures to withstand, adapt and rapidly recover from the effect of a

CHAPTER 2-URBAN INFRASTRUCTURE SYSTEM ROLE AND CAPACITY
Page 25
disruptive events and, hence, the concept of resilience [48-54]. As a result, the UI system
should not only be reliable but also able to recover from disruptions [55].The outcomes of
the 2005 World Conference on Disaster Reduction (WCDR) confirmed the significance of the
entrance of the term resilience into disaster discourse and gave birth to a new culture of
disaster response [4].
Following the 2005 WCDR agreement, government policy nowadays also evolves the
efforts that would allow infrastructures to continue operating at some level, or quickly return
to full operation after the occurrence of disruptive events [47]. As the consequence resilience
is a nowadays considered as a fundamental attribute for infrastructure that should be
guaranteed by the design, operation, and management. Accordingly, infrastructure is not just
a matter of the system which provides a service to fulfill community needs but also as a key
towards developing system for community operations and resilience [54].
Resilience comes from the Latin word “resilio” that literary means “to leap back” and
denotes a system attribute characterized by the ability to recover from challenges or
disruptive events [56, 57]. The Merriam-Webster dictionary defines resilience as “the ability
to recover from or adjust easily to misfortunate or change”. Henry, D., and J. Emmanuel
Ramirez-Marquez, discussed word resilience with its origins in the Latin word ‘‘resiliere’’,
which means to ‘‘bounce back” [58].
Resilience is surely a popular buzzword today, yet from a physical, to a sociological
perspective of the common understanding, the concept is to be able to ‘‘spring back after
receiving a hit”. While this concept is reasonably consistent with the meaning of the word
resilience, it is not evident in the concept of resilience as defined, described and applied in
many technical disciplines over the years and especially in Infrastructure Engineering in
recent years [7, 47, 54, 59].
Subsequently, the concept of resilience is developed predominantly and
independently in disciplines like ecology, psychology and physics (specifically in material
science). At the turn of the century, there were several different opinions, definitions, and
classifications of resilience within many disciplines. With extensive globalization and
connectivity, the effects of natural and manmade hazards (intentional and unintentional)
may no longer be restricted to any demographic or political vicinity. Severe disruptions are
also becoming more unpredictable, more frequent, and more damaging.
In this respect, as evidenced by the continuous use of the word resilience in the
systems engineering community, the essence of the resilience concept seems to be an
essential component of systems and enterprises. Resilience is closely linked to the notion of

CHAPTER 2-URBAN INFRASTRUCTURE SYSTEM ROLE AND CAPACITY
Page 26
‘vulnerability’. In furtherance of building up a resilient system, vulnerability must be
minimized. Furthermore, resilience may be considered as the “quality that enables an
individual, community or organization to cope with, adapt to and recover after an extreme
event” [60]. The concept of resilience, nowadays, used in practice varies by disciplines and
applications [7, 48, 51, 61-63]. Resilience can be understood as [4]:
“The ability of the system to reduce the chance of shock, to absorb a shock if it occurs and
to recover quickly after a shock (re-establish normal performance)”
, and it is characterized by four properties, that is; robustness, redundancy, resourcefulness,
rapidity, and further four interrelated dimensions; technical, organizational, social and
economic. Mainly resilience fundamentally consists of four main properties, which is;
rapidity, redundancy, robustness, and resourcefulness. The four properties can be seen and
described in Figure 2-4 and Table 2-1 respectively.
Robustness
Rapidity
Resourcefulness
Resilience
Redundancy
Figure 2-4. Four main properties of resilience.
Manyena, S. B., defined resilience as the capacity of a system surviving from
aggressions and shocks by changing its non-essential attributes and rebuilding itself [64].
Chertoff, M. (2009), stated a resilience terms as a capacity of an asset, system, or network to
maintain its function during or to recover from a terrorist attack or other incident [65]. Other
discussion brought by Haimes, Y. Y., defined resilience as the ability of the system to
withstand a major disruption within acceptable degradation parameters and to recover

CHAPTER 2-URBAN INFRASTRUCTURE SYSTEM ROLE AND CAPACITY
Page 27
within an acceptable time and composite costs and risks [66].
Moreover, Cimellaro, G. P., A. M. Reinhorn, and M. Bruneau, viewed resilience as the
intrinsic capacity of a system, community or society predisposed to a shock or stress to adapt
and survive by changing its non-essential attributes and rebuilding itself [9]. In addition, a
recent definition of resilience is given by the Society for Risk Analysis (SRA) glossary [67].
SRA defined resilience as the ability of the system to sustain or restore its basic functionality
following a risk source or an event (even unknown), the sustainment of system operation
and associated uncertainties.
Meanwhile, Woods, D. D., N. Leveson, and E. Hollnagel, defined resilience as a new
paradigm for safety engineering, which proactively integrates several aspects [56]. That is;
(i) The accident preventive tasks of anticipation (imagining what to expect) and monitoring
(knowing what to look for), (ii) The in-accident tasks of responding (knowing what to do and
being capable of doing it) and learning (knowing what has happened); (iii) The mitigative
tasks of absorbing (damping the negative impact of the adverse effect) and the recovery tasks
of adaptation (making intentional adjustment to come through a disruption); (v) Restoration
(returning to the normal state) [56].
Further, Bocchini, P., et al. studied a comparison between infrastructure sustainability
and resilience and concluded that both of them have a vast number of similarities and
common characteristics [68]. The conclusion is based on the findings which they combined
the structural analyses with social and economic aspects. The study also relied on the
techniques for the life-cycle analysis and decision making.
To better understand the implementation of resilience concept in the context of UI
system, a three-stage resilience concept has been put as a core consideration. Figure 2-5 is a
typical three stages infrastructure system performances response curve adopted from
Ouyang, M., L. Duen as-Osorio, and X. Min [69]. As seen, the three-stage resilience concept of
infrastructure system namely; disaster prevention, damage propagation and, assessment
and recovery had been discussed and documented well in a number of studies [7, 48, 51, 69].
The first stage, ( )00 t t , is the disaster prevention stage that spans are normal
operation to the onset of initial failure. The first stage mainly reflects a resistant capacity of
the system as its ability to prevent any possible hazards and reduce the initial damage level.
Two indexes “hazard frequency” and “initial damage level” have together describe the
resistant capacity concept and taken as the resilience that correlates in the first stage of
resilience concept.
The second stage, ( )0 1t t t , is the damage propagation process after the initial

CHAPTER 2-URBAN INFRASTRUCTURE SYSTEM ROLE AND CAPACITY
Page 28
failures occurred. The second stage reflects an absorptive capacity of the system as the
degree to which it absorbs the impacts of initial damage and minimizes the consequences,
such as cascading failures. The highest impact level ( )1 I− is applied to measure the
absorptive capacity and regarded as the resilience that correlates in the second stage. The
third stage is the recovery process during which system damage information is collected for
assessment, and resources are allocated to reach restore performance.
Figure 2-5. Performance response curve of a system on a disruptive event. (Source: Ouyang, M., L. Duen as-Osorio, and X. Min [69]).
It is important to note that the new steady-state performance level (point B) may be
better or worse than the original performance state. This is reasonable as the steady-state
has a very close relationship which is correlated directly to the robustness of building
disaster prevention strategy which processed in the first stage of resilience concept. Further,
this stage reflects the restorative capacity (i.e., the ability of the system to repair quickly and
effectively). Recovery time and cost together represent the restoration capacity and help to
characterize resilience in the third stage.
The third stage constitutes together a typical infrastructure response cycle to the
disruptions. The first stage of resilience concept is focuses on the local level impacts,
translating hazard into components level failures. The second stage of resilience concept
emphasizes the system-level effects and translating initial local components failures into
system-level consequences. The third stage of resilience concept characterizes the
restoration response, translating external efforts into system recuperation. Accordingly, to
enhance system resilience the improvement strategies can be arranged in a different stage.
Almost every paper that has been written in three-stages resilience concept [7, 61, 66,
69-71], in the same vein, the first stage (resistant capacity) plays crucial roles which
CHAPTER 2-URBAN INFRASTRUCTURE SYSTEM ROLE AND CAPACITY
Page 29
inevitable affecting both second and third stage. Thus, the first resilience stage effects and
finally shapes the goal of realizing respective infrastructure system resiliency. Loss and
recovery, and thus resilience of infrastructure, does not make practical sense without
consideration of both.
To establish a common framework for resilience, a unified terminology is adapted
from previous studies conducted by Cimellaro, G.P., A.M. Reinhorn [9], and M. Bruneau, and
Cimellaro, G.P. and D. Solari [72]. The discussion towards basic definitions and formulations
of four resilience properties and the simplified recovery function models are explained in the
next sub-section.
2.4.1 Definitions and Formulations
Definition 1. Resilience is defined as a function indicating the capability to sustain a level of
functionality or performance for a given building, bridge, lifeline networks, or community,
over a period defined as the control time ( )LCT that is usually decided by owners, or society
(usually is the life cycle, life span of the system).
Definition 2. The recovery time ( )RET is the period necessary to restore the functionality of
a structure, an infrastructure system (water supply, electric power, hospital building, etc., or
a community), to a desired level that can operate or function the same, close to, or better than
the original one. The recovery time ( )RET is a random variable with high uncertainties that
includes the construction recovery time and the business interruption time and it is usually
smaller than the control time ( )LCT . It typically depends on the extreme events (hazards)
intensities and on the location of the system with its given resources such as capital,
materials and labor, following the major disturbance events.
Definition 3. Hazards resilient infrastructure system is a infrastructure that can withstand
an extreme event, natural or man-made, with a tolerable level of losses, and is able to take
mitigation action consistent with achieving that level of protection.
The resilience is defined graphically as the normalized shaded area underneath the
functionality function of a system (see figure 2-5), defined as Q t( ) . Q t( ) is a non-stationary
stochastic process and each ensemble are a piecewise continuous function, where the
functionality Q t( ) is measured as a dimensionless (percentage) function of time.

CHAPTER 2-URBAN INFRASTRUCTURE SYSTEM ROLE AND CAPACITY
Page 30
2.4.2 The Four Properties of Resilience
While defining resilience is clearly challenging, identifying the features of organizations and
other social units that make them resilient is even more difficult. Resilience is an important
concept for disaster management of complex system. There are four properties along which
resilience can be improved [9, 72]. These are robustness, resourcefulness, redundancy, and
rapidity. These properties can be better. The definition for each of the resilience property
including with its mathematical representation from Figure 2-5 can be seen in Table 2-1
below.
Table 2-1. The four properties of resilience and its definition.
Property Definition Robustness Robustness referring to engineering systems. It is the ability of elements, systems or
other units of analysis to withstand a given level of stress or demand without suffering degradation of loss of function. It is therefore the residual functionality right after the extreme event (Figure 2-1) and can be represented by the following relation
1Robustness (%)( , );I II m = − (2-1)
where, I is a random variable expressed as function of the mean Lm and the standard
deviation I . A more explicit definition of robustness is obtained when the dispersion
of the losses is expressed directly as follows
1Robustness (%)( );I II m a= − + (2-2)
where, a is a multiplier of the standard deviation corresponding to a specific level of
losses. A possible way to decrease uncertainty in robustness of the system is to reduce the dispersion in the losses represented by I . In this definition, robustness reliability
is therefore also the capacity of keeping the variability of losses within a narrow band, independently of the event itself.
Rapidity It is the capacity to meet priorities and achieve goals in a timely manner in order to contain losses and avoid future disruption. Mathematically it represents the slope of the functionality curve (Figure 2-1) during the recovery-time and it can be expressed by the following equation
0 0Rapidty for ( )
; E
dQ tt t t t
dt= + (2-1)
where, d/dt is the differential operator; Q t( ) is the functionality of the system. An
average estimation of rapidity can be defined by knowing the total losses and the total recovery time to reach again 100% of functionality, as follows
Rapidty (average recovery rate in percentage/time)E
I
t= (2-2)
where I is the loss, or drop of functionality, right after the extreme event occurs. Redundancy It is the quality of having alternative paths in the structure by which remain stable
following the failure of any single elements. In other words, it describes the availability of alternative resources in the process of a system. Further, it is the extent to which elements, systems, or other units of analysis exist that are substitutable, i.e., capable [of] satisfying functional requirements in the event of disruption, degradation, or loss of functionality. Simply, it describes the availability of alternative resources in the loss or recovery process. Redundancy is a very important attribute of resilience, since it represents the capability to use alternative resources, when the principal ones are either insufficient or missing. If the system is resilient, there will always be at least one scenario allowing recovery, irrespective of the extreme event. If this condition is not met by the system, then changes to the system can be made, such as duplicating components to provide alternatives in case of failure. Moreover, redundancy should be developed in the

CHAPTER 2-URBAN INFRASTRUCTURE SYSTEM ROLE AND CAPACITY
Page 31
system in advance and it should exist in a latent form as a set of possibilities to be enacted through the creative efforts of responders.
Resourcefulness It is the capacity to identify problems, establish priorities and mobilize resources when condition exist that threaten to disrupt some element, system or other unit of analysis. Resourcefulness and redundancy are strongly interrelated. One of the major concerns with the increasingly intensive use of technology in emergency management, is the tendency to over-rely on these tools, so that if technology fails, or it is destroyed, the response falters. To forestall this possibility, many planners advocate redundancy Changes in resourcefulness and redundancy will affect the shape and the slope of the recovery curve and the recovery time. It also affects rapidity and robustness. It is through redundancy and resourcefulness (as means of resilience) that the rapidity and robustness (the ends of resilience) of an entire system can be improved.
For ensuring the adequate protection and resilient of UIs system, vulnerability and
risk must be analyzed and assessed in order to prepare to address them by design, operation,
and management. According to Zhang, P. and S. Peeta, the concept of risk is fairly mature
whereas that of vulnerability is still evolving [73]. The next Chapter briefly recalls the
concept of risk and resilience correlation and relationships, as they are the main
considerations to the context UIs protection.
2.5 Chapter Summary
Collectively, this Chapter outlines a critical role of UI system towards its continuity service to
support urban life. The built environment such as UI system is playing a critical role as a
backbone towards supporting urban community daily life. Importantly, it also provides the
essential physical basis for modern societies. For this reason, the UI systems have multi-
dimensional impact on public safety and economic prosperity at both regional and national
levels.
Past experiences have shown that such systems are exposed to various natural and
man-made hazards. With extensive globalization and connectivity, the effects of natural and
man-made hazards (intentional and unintentional) may no longer be restricted to any
demographic or political vicinity. The resulting damage to the systems may cause human
causalities and disrupt the normal day-to-day life of people. Worse, the damages and its’
consequences may also impose significant direct and secondary economic losses due to the
business interruption that may not ever fully recover [7].
Severe hazards are also becoming more unpredictable, more frequent, and more
damaging. When hazard occurs and strikes particular UI systems, the community affected
requires immediate help and action to survive. Correspondingly, the concepts of ‘risk
management’ have become keywords when dealing with hazardous events especially in UI
system case. In addition, the UI system also requires supporting resources, and efforts to
recover in a short time.

CHAPTER 2-URBAN INFRASTRUCTURE SYSTEM ROLE AND CAPACITY
Page 32
Regarding the UI system giving reliable service to the community, the mutual-
relationship between UI system and community is an important aspect towards managing
the respective system. Subsequently, the literature review presented in this section also
outlines that the affiliation between UI system and the community is pivotal towards the
improvement of UI system serviceability and one of the key components to understand
hazard impact mechanisms.
To withstand various unexpected disturbances, correspondingly, both the risk
management and emerging concept of resilience seems promising to be considered and
applied within the UI management. Predominantly, this Chapter provides important insight
into the preliminary discussion of UI system resilience. Together, several studies have
brought up in this Chapter highlighted and suggested the need for managing UI system in the
face of disturbances.

CHAPTER 3-RISK ANALYSIS AND RESILIENCE RELATIONSHIP
Page 33
CHAPTER 3
RISK ANALYSIS AND RESILIENCE RELATIONSHP
CHAPTER HEADINGS Introduction Understanding Risk Concept in UI System Context Risk Characteristic and Impact Mechanism Risk Analysis and Approaches Review Risk and Resilience Assessment Correlation Resilience Assessment Model Review and Evaluation Chapter Summary
3.1 Introduction
This Chapter vividly explores the understanding of hazard and risk in general context. Then
the discussion of hazard and risk shifts into the urban infrastructure (UI) system context.
The characteristic of risk is explored which focus on the dynamic behaviors and mechanisms
of its impact. The sub-Chapter continues to account the ‘social amplification of risk’ concept
as a pivotal aspect towards assessing risk characteristic and impact mechanism in UI system
context.
Further, this chapter continues to review the literature and deliver the investigation
of affiliation between risk and resilience concept. Both risk and resilience analysis
relationship are discussed thoroughly. Following the literature review, an argument built
upon shortages pertaining to conventional risk analysis (RA) models and resilience analysis
(REA) models. Finally, the need for developing risk-based REA framework as well as the
supporting analysis models discusses in the last section of this Chapter.
3.2 Understanding Risk Concept in Urban Infrastructure System Context
To make clear distinction, this research distinguishes the word ‘risks’ from ‘hazards’. Hazard
describes the potential of harm or other consequences of interest. In conceptual terms,
hazard characterizes the inherent properties of the risk agent and related processes. While,
risk, describes the potential effects the hazard is likely to cause on specific target such as
buildings, ecosystems or human organisms and their related probabilities [74]. Moreover,
risk is understood as an uncertain consequence of an event or an activity with respect to
something that human’s value and, is a measure of the potential loss occurring due to natural
or human activities.
The recent definition of risk in Society for Risk Analysis (SRA) glossary is; the

CHAPTER 3-RISK ANALYSIS AND RESILIENCE RELATIONSHIP
Page 34
consequences of a future activity, such as the operation of a UI where the consequences are
with respect to something that human value. The consequences are often seen in relation to
some reference values (planned values, objectives, et cetera) and the focus is normally on
negative, undesirable consequences [4]. Risk, further, is expressed as a combination of the;
likelihood of an adverse event, the vulnerability of people, places, and things to that event,
and the consequences that event occur. Such consequences can be either positive or negative
(e.g., injury, or loss of life, reconstruction costs, loss of economic activity and environmental
losses), depending on the values that people associated with them.
The consequences of UI system failure can range from the merely annoying to the
decidedly catastrophic [75]. Further, risk is a useful analytical concept that gives meaning to
those uncertainties of life that poses a danger to people or things. Potential losses are the
adverse consequences of such activities in form of loss of human life, adverse health effects,
loss of property, and damage to the natural environment. Meanwhile, from an engineering
point of view, the risk or potential loss is associated with exposure of the recipients to hazard,
and commonly can be expressed as a combination of the probability or frequency of the
hazard and its consequences.
Following a study conducted by Jochen Scholl, H. and B. Joy Patin, extreme event
presents the ultimate challenge to life, wellbeing, property, and in particular to response
efforts [53]. Taken for examples; two years after the Tohoku earthquake, tsunami, and
nuclear meltdown catastrophe of 2011, during which 20,000 people lost their lives,
thousands were injured, and an estimated 300,000 persons were displaced not to mention
the enormous infrastructural damage inflicted, the recovery to pre-event levels of life was
the farther away, the closer the distance to the sites of impacts.
Similarly, in New Zealand the Canterbury/Christchurch earthquake of 2009 with
several aftershocks and new shocks within two years slowed down the recovery efforts [53].
This phenomenon leaving vast “red zones” for which recovery and rebuilding were estimated
to take years. Both events among others gave evidence that particular communities in their
planning and preparedness efforts had not considered catastrophic (or extreme) events of
this unprecedented magnitude possible. Hence, the pre-established means of response and
mitigation methods were rendered insufficient.
Following the fact aforementioned, the built environment such as UI system is subject
to a formidable array of both natural and man-made hazards. In the natural realm (e.g.,
earthquakes, extreme winds, floods, snow and ice, volcanic activity, landslides, tsunamis, and
wildfires), as well as the man-made realm (e.g., change pattern of urbanization, poor

CHAPTER 3-RISK ANALYSIS AND RESILIENCE RELATIONSHIP
Page 35
management, communication error, political disputes, economic and financial instability
including the technological failure), all poses some degree of risk to UI systems. Even so,
there is not much literature providing attention towards the inherent UI system risk and its
characteristic specifically for its impact.
Although forensic analysis of past failures improves the urban community’s ability
to; (i) Meticulously forecast and predict UI system serviceability performance, and (ii) To
design and construct the UI systems based on its performance approaches to withstand the
negative effects of various hazards, nonetheless failures can be expected to continue to occur.
Thus, to evaluate the inherent risks in UI system, experts and decision makers (DMs) are
required to understand the complex nature and dynamic characteristic of risk impact.
3.3 Risk Characteristic and its’ Impact Mechanism
This section moves to the discussion towards the characteristics and impact mechanisms of
risk where these issues have been underestimated in the UI risk management and resilience
studies in previous time. There are not many literatures explore and present the discussion
related to the characteristic and mechanism of risk impact. Particularly, engineers, academia
and industry people focused on the discussion of risk impact which is less comprehensive.
Several studies discussed the dynamic characteristic of risk impact, can be seen in [76-80].
Risk impact analysis is usually considered to be “simple and linear” in most literature
(i.e., focus on the risk magnitude measurement that is; probability and severity). Such
analysis output thus, leads to lose crucial information and further unreliable. A number of
studies discussed the UI system risk impact affecting community in the context of
socioeconomic, environment and sociocultural can be seen in [15, 81-83].
Meanwhile, in terms of risk impact, ‘dynamic’ refers to the consequence of risk impact
which affect non-linearly and in non-isolated space (i.e., correlating and affecting other risk
event and community in the form of impact propagation or cascading effect). Both the terms
have gone through less attention in former RA and management studies especially in UI
system context.
3.3.1 The Magnitude of Risk (Risk Priority Level)
The magnitude of risk, or sometimes called by ‘risk priority level’ is one of the main
dimensions towards analyzing risk. This analysis has become very popular in applications,
such as; highway construction RA, office building RA, climate change risk management, and
enterprise risk management (ERM). The application of risk magnitude analysis is currently

CHAPTER 3-RISK ANALYSIS AND RESILIENCE RELATIONSHIP
Page 36
so widespread in important applications.
The risk magnitude analysis is based on a function which translated into risk decision
factors. The risk magnitude has been gained attention in academia field since its easier for
experts to understand the processes and the analysis result. This analysis method is a very
valuable tool for the risk management practitioner. Conventionally, risk magnitude can be
plotted in the risk matrix map. The risk map plots the likelihood of an event against the
impact (or severity) should the event materialize.
Figure 3-1 is an illustration of a simple risk matrix map, sometimes referred to as a
heat map. The risk matrix map is a common method for illustrating the likelihood and impact
of the risk event. The term likelihood is used rather than frequency, because the word
frequency implies that risk event will absolutely occurs, and the map is registering how often
particular event take place. Accordingly, likelihood is a broader word that includes frequency,
but also refers to the chance of an unlikely event happening. While, the vertical axis is used
to indicate risk impact.
Figure 3-1. Example of risk likelihood and severity in a risk matrix. (Source: Komendantova, N., et al. [84]).
The word impact is used rather than the word magnitude, so that the same style of
risk map can be used to illustrate hazard and control risk. Further, severity implies that the
risk event is undesirable and therefore, related to the hazard risk. Accordingly, the risk
matrix map presents a visual two-dimensional display of the “ranking” of risk event in terms

CHAPTER 3-RISK ANALYSIS AND RESILIENCE RELATIONSHIP
Page 37
of a likelihood and impact scale that is relevant to the UI system problem interest.
Accordingly, it helps in interpreting historical experience and translating the expert opinions
in a consistent manner.
In this way, the risk magnitude analysis method allows stakeholders to display the
total risk index ranking of different UI system risk events affecting urban community based
on the expected losses that are quantitatively derived for different sectors (human,
environment, economy, and intangibles). The analysis of risk magnitude allows experts and
DMs to construct a composite impact score for each hazard scenario.
This can be done by the mathematical aggregation of a set of individual impact
indicators that measure multi-dimensional concepts which is usually does not have common
units of measurement. In this way, the analysis towards risk magnitude allows the users to
consider the input for different risk scenarios following various dimensions and indicators.
The risk magnitude analysis is not limited to, for instances; infrastructure (interruption in
fresh water, gas, energy, telecommunications, and transportation systems) and intangibles
(public security, political implications, psychological implications and loss to cultural values).
3.3.2 Risk Impact Connection and Interaction Pattern
Following the report made by the World Economic Forum (WEF) on global risks, the issues
most likely to impact on society, and makes recommendations on actions required is that risk
are becoming more interconnected and frequent [85]. The UI system which seen as a Large
Technical System (LTS) is exposed to numerous interdependent risks with various nature.
Considerably this issue found to burden both expert and decision maker towards managing
UI risks. Another significant concept which inevitably important to risk characteristic, is that;
each of risk event has a connectedness (interrelationship and interaction) with other risk
event in a specific risk network boundary.
The connectedness emerges from the concept of risk causality which affect and
influence other risk events. Such as the causality dynamic and interaction pattern are
phenomena resulted from an “impact escalation”. The impact escalation, resulted not only
the primary but also secondary risk events, triggered by an “escalation vectors”-also known
as the magnitude of the physical effects-originated by the principal scenario. Accordingly,
risk is a highly multi-dimensionality which contextually embedded within many different
processes. Therefore, managing risk inaccurately are constantly leads to the increasing of
risk consequences and negative coping activities. Figure 3-2 depicts the example of risk
interconnected network in a case of electricity infrastructure.

CHAPTER 3-RISK ANALYSIS AND RESILIENCE RELATIONSHIP
Page 38
The concept of interconnected risk event has been described well in a number of
studies. For instances; Correa-Henao, G. J., J. M. Yusta, and R. Lacal-Ara ntegui, described the
concept of interconnectedness of risk event and proposed a RA method using risk maps
which tested in the case of electricity infrastructures [80]. The study presented semi-
quantitative assessment strategy that incorporates the creation of risk charts within a risk
management framework engages an intuitive graphical representation in order to identify
the most significant threats affecting infrastructure networks.
Figure 3-2. An example of interconnected risk map in electricity infrastructure. (Source: Correa-Henao, G. J., J. M. Yusta, and R. Lacal-Ara ntegui [80]).
Risk interaction is considered as the existence of a possible precedence relationship
between two risk events nR and m
R . A components relationship (whether functional,
structural or physical) means that risks, which may be related (e.g., product functions, quality,
delay or cost), can be linked since a problem on one component may have an influence on
another. When performing the risk causality and interaction identification, new risk events
may appear for two reasons. Some are a consequence or cause of other risks already present
in the preliminary list; others are seen as intermediary risks. This process is useful to explain
the link between two or more existing risk events which the identification is done on direct
cause–effect relationship.
Fang, C., et al. presented an approach based on network theory to deal with risk
interactions in large engineering projects [86]. A topological analysis based on network

CHAPTER 3-RISK ANALYSIS AND RESILIENCE RELATIONSHIP
Page 39
theory is presented, which aims to identify the key elements of interrelated risks structure
that has potential impact affecting a large engineering project. The application of some
network theory indicators to the project risk management field improves the understanding
of risks and their potential interactions. In their study, the identification of risk interactions
is the step of determining the cause-effect relationship between various risks which is also
playing a significant role for building the project risk network structure.
Further, Vidal, L.-A. and F. Marle, discussed the risks interaction in a large scale project
[87]. The study highlighted the importance of identify and assess the risks interaction of the
identified risk within the project system. Following the underlying risk of positive feedback
and amplification, analyzing risks interaction within the project complexity is suitable to
avoid the negative aspects and seize at the same time the opportunities that risk impact
creates.
In the case of UI system management, the main consequence is that any change in any
components within UI system may thus affect other components in an unpredictable way
because of the risk impact propagation. Several risk map methods have been proposed to
analyze the risks interconnection. The methods allow for a better representation of the
interrelationships among the various risks, and is widely applied for threat identification in
the infrastructure sector cases [80, 86, 87].
Further, an interconnected risk map is a useful tool for decision making because it
simplifies the perception of risks in an integrated manner. The approach assists the discovery
and analysis of the various threats to infrastructures, including the threats that are the most
critical. The construction of the risk map requires the use of descriptive and analytical
instruments to collect data from primary and secondary sources at respective infrastructure
asset owners and operators.
Accordingly, interconnected risk map simplifies the identification of the risk
components by grouping them into categories (e.g., technical and non-technical). Some of
the popular risk map approaches are, for instances; COSO audit maps which is facilitate the
monitoring and auditing of risks in the financial sector; Enterprise risk maps which is
facilitate the categorization of enterprise risk into the defined risk types [15,16,18,19].
Another characteristic of the risk impact is that: the “domino” or “cascading” (or
“propagation”) effect which discusses in the next section. Several definitions are reported in
the literature to identify domino accidental scenarios. In a situation where several key
factors are changing simultaneously in dynamic circumstances, it is misleading to speak of
individual factors disrupting the development of technological system. In the context of RA,

CHAPTER 3-RISK ANALYSIS AND RESILIENCE RELATIONSHIP
Page 40
the term domino effect denotes ‘chain of accidents’, or situations when a single accident
generated by an accident in one unit causes secondary and higher order accidents in other
units.
3.3.3 Risk Causality, Ripple Impact and Propagation Pattern
The following definition of domino effect will be assumed: an accident in which a primary
event propagates to nearby equipment, triggering one or more secondary events resulting
in overall consequences more severe than those of the primary event [76]. In UI system
context, the ripple effect within the system affected not only to the common urban flow such
as; economic, environment and the community whom highly dependent, but also; the
digitality, cultures and politics [36].
The severe ‘domino’ accident that took place in the past made aware of the potential
threat posed by the escalation hazards since the first “Seveso” Directive (Council Directive
82/501/EEC) dealing with the control of major accident hazards [77]. Presently, the
identification and assessment of the possible ‘domino’ scenarios both on-site and off-site are
compulsory for the industrial sites falling under the obligations of the “Seveso-II” Directive
(Council Directive 96/82/EC), as amended by Directive 2003/105/EC.
The severity of an accident where domino effects took place leads to important efforts
for the prevention of the accidental scenario. Technical standards and legislation concerned
with the control of major accident hazard often include measures to assess, control and
prevent domino effects. The three elements characterized a domino event; (i) A primary
accidental scenario which is trigger the domino effect, (ii) A propagation effect following the
primary event due to the escalation vectors effect caused by the primary event on secondary
targets, (iii) One or more than one secondary accidental scenarios.
An example of propagation patterns of the domino effect is depicted in Figure 3-3
below. The domino effect of risk events has been discussed well in several studies [76, 77,
88-91]. Accordingly, the study of domino effects in the literature has primarily been focusing
on proposing and developing the probability or on domino effect frequency estimation.
Further, the probability of occurrence and adverse impacts of such ‘domino’ or ‘cascading’
effects are increasing due to increasing congestion in our world complexes (e.g., increasing
density of human population).
The domino effect happens only if its accident (overall) severity is higher or at least
comparable place, or when an accident in a unit (known as a ‘primary event’) triggers other
accidents by means of escalation vectors [91]. Escalation vectors are the physical effects (e.g.,

CHAPTER 3-RISK ANALYSIS AND RESILIENCE RELATIONSHIP
Page 41
fire impingement, fire engulfment, heat radiation, overpressure, or explosion-induced
projectile fragments) which is depending on various factors such as the type of the primary
event and the distance between the accident epicenter and nearby units.
Figure 3-3. A propagation pattern of the domino effect. (Source: Khakzad, N., et al. [91]).
Further, potential secondary units are those the adjacent units that are more likely
contribute to the domino effect. The inclusion of secondary units in the domino effect not
only intensifies the accident which is causing more severe consequences, but also support
the domino effect to escalate to the next level by impacting tertiary units. The escalation
vectors originating from secondary events in turn trigger other accidents in tertiary units
either by themselves or through synergistic effects.
Meanwhile, the concept of domino effect in the quantitative assessment of escalation
hazard is a key tool to understand the credible and critical scenarios of complex urban life.
Thus, the quantitative assessment result of domino effect is significant towards identifying
the critical hazard events and prioritizing actions in order to address the escalation hazard.
Further, the actions identified also support the prevention and protection in the area of
building risk mitigation and strategy planning.
Nonetheless, modelling and analyzing the domino effects are very challenging
particularly in complex processes depending on the problem context. Most of the past RA
studies deal with accident in a single event impact manner. In reality, accident in one unit can
cause a secondary accident in a nearby unit, which in turn may trigger a tertiary accident,
and so on. Although a remarkable progress in the risk and safety analysis of individual
accident scenarios which is limited to a single unit has been achieved in recent years, domino
accidents have gained less attention in the context of quantitative risk analysis (QRA) both
because of their lower probability and higher complexity [91].
The analysis of potential escalation of primary scenarios leading to severe accidents

CHAPTER 3-RISK ANALYSIS AND RESILIENCE RELATIONSHIP
Page 42
due to domino effect is of utmost importance. A number of studies discussed the domino
effect in various case studies are well documented [76, 77, 88-91]. For instance, Khan, F. I.
and S. A. Abbasi., proposed a systematic method called Domino Effect Analysis’ (DEA) [88].
The method is based on a deterministic model used in conjunction with probabilistic
analysis.
This sub-section concludes that the domino effect element in RA should be applied as
an integral part of all RA initiatives. The next sub-section will go through another risk impact
mechanism that is; risk impact to community. The discussion will firstly deliver a significant
concept of how society responds and affected by risk which is called by “the social
amplification of risk”.
3.3.4 Social Amplification of Risk
Social amplification of risk (SAR) denotes the phenomenon by which information processes,
institutional structures, social group behavior and individual responses shape the social
experience of risk, thereby contributing to risk consequences [81]. The interaction between
risks and social processes makes it clear that, as applied within SAR framework, risk has a
meaning only to the extent that it treats how people think about the world and its
relationships.
Thus, there is no such thing as ‘true’ (absolute) and ‘distorted’ (socially determined)
risk. Rather the information system and characteristics of the public responses that compose
social amplification are essential elements in determining the nature and magnitude of risk.
Figure 3-4 depicts the conceptual framework of SAR which demonstrates the possibility that
social amplification may (quantitatively and qualitatively), increase the direct impact.
The analogy of dropping a stone into a pond is apt here, as it illustrates the spread of
these higher-order impacts associated with the SAR. The ripples spread outward, first
encompassing the directly affected victims of the first group, then touching the next higher
institutional level (a company or an agency) and, in more extreme cases reaching other parts
of the industry or other social arenas with similar problems.
The SAR was one of the most perplexing issues and problems in RA. It is why some
relatively minor risk events, as assessed by technical experts, often elicit strong public
concerns and result in substantial impacts upon society and economy [81]. The main
argumentation is that risk events interact with psychological, social, institutional, and
cultural processes in ways that can heighten or attenuate public perceptions of risk and
related risk behavior.
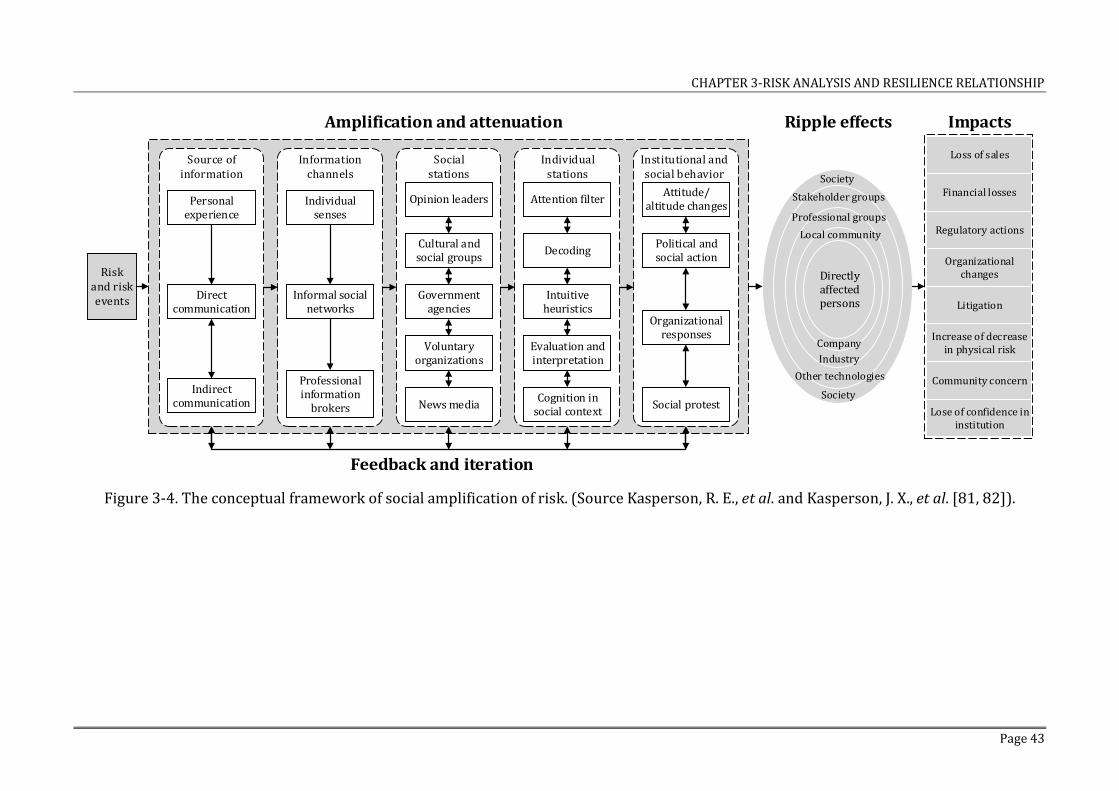
CHAPTER 3-RISK ANALYSIS AND RESILIENCE RELATIONSHIP
Page 43
Risk and risk events
Personal experience
Direct communication
Indirect communication
Source of information
Individual senses
Informal social networks
Professional information
brokers
Information channels
Opinion leaders
Government agencies
News media
Social stations
Cultural and social groups
Voluntary organizations
Attention filter
Intuitive heuristics
Cognition in social context
Individual stations
Decoding
Evaluation and interpretation
Attitude/altitude changes
Organizational responses
Social protest
Institutional and social behavior
Political and social action
Directly affected persons
Company
Industry
Other technologies
Society
Society
Stakeholder groups
Professional groups
Local community
Loss of sales
Financial losses
Regulatory actions
Organizational changes
Litigation
Increase of decrease in physical risk
Community concern
Lose of confidence in institution
Ripple effects ImpactsAmplification and attenuation
Feedback and iteration
Figure 3-4. The conceptual framework of social amplification of risk. (Source Kasperson, R. E., et al. and Kasperson, J. X., et al. [81, 82]).
CHAPTER 3-RISK ANALYSIS AND RESILIENCE RELATIONSHIP
Page 44
The general phenomenon of the SAR is composed by various aspects, that is; the social
structures and processes of risk experience; the resulting repercussions on individual and
group perceptions; and, the effects of these responses on community, society and economy.
The roots of social amplification lie in the social experience of risk, both in direct personal
experience and in indirect, or secondary experience which is through information received
about the risk, risk events and management systems [81].
Meanwhile, when direct personal experience is lacking or minimal, individuals learn
about risk from other persons and from the media. Information flow becomes a key
ingredient in public response and acts as a major agent of amplifications. Attributes of
information that may influence the social amplification are volume, the degree to which the
information is disputed, the extent of dramatization, and the symbolic connotations of the
information.
Understanding this interaction for different risk events, for different social
experiences and for different cultural groups is an important issue in the RA. The UI system
is a complex and crucial asset which regulated, controlled, supported, and also exploited by
various stakeholders (who dependent and affected by the UI system). Departing from the
SAR framework understanding aforementioned, different individual or groups within the
urban community will be eventually associated and affected to risk event dissimilarly.
The issue of community-associated to risks has been documented well in the study
conducted by Yang, R.J. and P.X.W. Zou, [92]. The study is conducted to analyze the
stakeholder-associated risks in green building project. Further, the study emphasized most
risks are interrelated and associated with internal or external stakeholders. Another studies
of the UI system facing disturbances with its impact affecting community (in the context of
socioeconomic, environment and sociocultural) received enormous attention to both
academia and public interests can be seen in [15, 16, 27, 28, 30, 81-83, 93-97].
Figure 3-5 depicts the conceptual model of risk impact affecting community.
Following the SAR framework, the information system may amplify risk event in two major
stages (or amplifiers); (i) The transfer of information about risk event by intensifying or
weakening signals that are part of the information that individuals and social groups
received, (ii) The response mechanisms of society by filtering the multitude of signals with
respect to the attributes of the risk and their importance.
Accordingly, signal arises through direct personal experience with a risk event or
through the receipt of information about the risk event. These signals are processed by social,
as well as individual, amplification ‘station’. For example, scientists or scientific institutions,

CHAPTER 3-RISK ANALYSIS AND RESILIENCE RELATIONSHIP
Page 45
reporters and the mass media, politicians and government agencies, or other social groups
and their members). The SAR will spawn behavioral responses, which, in turn, will result in
secondary impacts. Secondary impact is then perceived by social groups and individuals so
that another stage of amplification may occur to produce the third-order impact.
Risk impact propagation scenario
Hazardous
event
Impact
Impact
Impact
Impact
Trigger
Trigger
Trigger
Trigger
Trigger
Trigger
Haz
ards
and thre
ats
Prevention
(proactive)
Mitigation
(reactive)
Barrier
Specific
harm
Initiating
event
Accident scenario
Risk cause and impacts as a hazardous event trigger
Uncertainty
Affected
community
Figure 3-5. The conceptual model of risk and its impact in UIs context.
Further, the third-order impact thereby may spread, or ‘ripple’, to other parties,
distant locations (or even to future generations). Each order of impact will not only
disseminate social and political impacts but may also trigger (risk amplification) or hinder
(risk attenuation) positive changes for risk reduction. The concept of SAR is, therefore,
dynamic as it takes into account the learning and social interactions resulting from
experience with risk.
A study conducted by Kasperson et al. argued that social amplification can also
account for the observation that some events will produce ‘ripples’ of secondary and tertiary
consequences that may spread far beyond the initial impact of the event [81]. Furthermore,
some events may even eventually impinge upon previously unrelated technologies or
institutions. This rippling of impacts is an important element of risk amplification, since it
suggests that the process can extend (in risk amplification) or constrain (in risk attenuation)
the temporal, sectoral and demographical scales of impacts.
In addition, it also points up that each order of ripple impact, may not only allocate
social and political effects but may also trigger or hinder managerial interventions for risk
reduction. Moreover, a research conducted between Clark University and Decision Research,
which involved a large comparative Geographical analysis of 128 hazard events (e.g., biocidal
hazards, persistent/delayed hazards, rare catastrophes, deaths from common causes, global

CHAPTER 3-RISK ANALYSIS AND RESILIENCE RELATIONSHIP
Page 46
diffuse hazards and natural hazard events), has concluded that social amplification
processes are as important as direct physical consequences in determining the full array of
potential risk consequences [81, 82].
Another qualitative study by conducted by Kasperson and colleagues yielded
complementary findings to the quantitative cross-risk work [81, 82]. The components of the
SAR framework explored included; the physical impacts, information flow, social-group
mobilization and rippling effects. Further, a number of interviews with key participants are
also conducted in each case. Following the literature review mentioned above, in the context
of disturbed UI system, a discussion leads to the following conclusions. The study concluded
that, first, based on the case study the attenuation/intensification of risk impact effects
across various groups and at different scales.
Second, the economic benefits associated with risks appear to be a significant source
of attenuation at the local level. Risk events, when they undergo substantial amplification
and result in unexpected public alarms (or ‘social shock’), often surprise communities. The
extreme attenuation of certain risk events often continuing to grow in effects until reaching
disaster proportions. Despite, the significant consequences for the risk bearers and society
more generally, risk events and its impact virtually unnoticed and untended.
Understanding the amplification dynamics, thus, requires an insight into how risk-
related decisions (i.e., related to organizational self-interest, messy inter-and intra-
organizational relationships, economically related rationalizations, and ‘rule of thumb’
considerations), often struggle with the view of RA as a scientific enterprise. Given the
inherent complexity of risk communication and social processes, it is clear that the
assessment of risk cannot be expected to yield on a simple or direct prediction regarding
which issues are likely to experience amplification/attenuation effect in advance.
The concept of SAR can, in principle, provides the necessary theoretical base for a
more comprehensive and powerful analysis of risk as well as the risk management in modern
societies. Conclusively, the robust and comprehensive RA contribution could be to draw upon
social amplification to improve society’s capability anticipating new or emerging risks. While
examining the UI system and risk impact characteristic as well as the role of community
characteristics, it is clear that most (if not all) of the risk events are associated with
stakeholders. Furthermore, based on the SAR framework, both social amplification and
attenuation through serious disjuncture between expert and public assessments of risk and
varying responses among different publics.

CHAPTER 3-RISK ANALYSIS AND RESILIENCE RELATIONSHIP
Page 47
3.4 Risk Analysis and Approaches Review
Risk analysis (RA) has existed for almost four decades and has reached a wide range of
applications. The RA has a purpose of revealing and identifying potential failures modes and
hazards in various systems and operations in order to prevent before they manifest. Further,
the RA goal is that to describe and characterize both the knowledge and lack of knowledge
with uncertainty being a key element of risk [4, 67]. Additionally, RA is the process of
characterizing, managing, and informing others about existence, nature, magnitude,
prevalence, contributing factors, and uncertainties of the potential losses.
Specifically, the RA is a formal and systematic analysis to identify or quantify
frequencies or probabilities and magnitude of losses to recipient due to exposure to hazards
(physical, chemical, or microbial agents) from failures involving natural events and failures
of hardware, software, and human systems. Accordance to the risk impact, in the UI context,
the loss may be external to the system. The loss is caused by the system to one or more
recipients (e.g., humans, organizations, economic assets, and environment). In other hand,
the loss may be internal to the system which is causing damage only to the system itself.
In line with the SRA concept, risk describes the (future) consequences potentially
arising from the operation of UI systems and from community activities as well as the
associated uncertainty [67]. Correspondingly, consequences are usually seen in negative,
undesirable terms with respect to the planned objectives. Meanwhile, accident scenarios are
also a relevant part of risk which is the combinations of risk events potentially leading to the
undesired consequences. The RA has classically been defined to address three key questions,
that is: (1) What can go wrong?, (2) What is the likelihood that it could go wrong?, (3) What
are the consequences of failure? [98].
The first question leads to the identification of undesirable set of scenarios (e.g.,
accident). The second question demands to estimate the probabilities (or frequencies) of the
risk scenarios. While the third question refers to the magnitude of potential losses
estimation. This triplet definitions emphasizes the development of accident scenarios as an
integral part of the definition and analysis of risk. Therefore, in the preliminary processes of
RA, risk scenarios are one of the most important products of RA. Figure 3-6 depicts the
boundary of risk assessment within risk management framework.
The RA process focuses on scenarios that lead to hazardous events. The general RA
methodology becomes one that allows the identification of all possible risk scenarios,
calculation of their individual probabilities, and a consistent description of the consequences
that result from each risk scenarios. Therefore, RA may require a multidisciplinary approach

CHAPTER 3-RISK ANALYSIS AND RESILIENCE RELATIONSHIP
Page 48
since risks may cover a wide range of causes and consequences. Different RA tools and
techniques may be appropriate in different context.
Communication
and consultation
Monitoring and
review
Establishing the context
Risk identification
Risk analysis
Risk evaluation
Risk treatment
Risk assessment
Figure 3-6. The standard framework of RA. (Source: ISO/IEC, ISO/IEC FDIS 31010:2009, [99]).
Further, the purpose of RA is to provide evidence-based information analysis to make
informed decisions on how to treat particular risks and how to select between mitigation
options. Accordingly, the RA techniques and some of the principal benefit of performing RA
can be seen in Final Draft International Standard (FDIS) [99]. Importantly, RA is the main
risk management input into strategy formulation since it focuses on improved decision
making.
Although RA is vitally important, it is by oneself useful if the assessment conclusions
are used to inform decisions and/or to identify the appropriate risk responses for the type
of risk under consideration. A five important points towards RA has been discussed well by
Cox Jr, L. A., [79]. These five important points of RA emerge in related to; the existing of
complexity characteristics of engineering systems and their models, high RA demand by the
society, the significant role of formal RA for managing and regulating risks, various
categories of risks, and the trends of using RA methods in engineering field.
The UI basic systems are at risk from threats that community may not yet foresee.
Therefore, in the context of ensuring adequate protection and resilience of UI system,
vulnerability and risk must be analyzed and assessed towards preparing to address them by
design, operation, and management. Nonetheless, many professionals, including; emergency
managers, but also extending to elected officials, urban planners, and the like, make
decisions that intentionally or unintentionally influence community resilience, are

CHAPTER 3-RISK ANALYSIS AND RESILIENCE RELATIONSHIP
Page 49
unfamiliar with the existing concept of interrelationships between UI system and urban
community.
The RA and risk management drive major core activities associated with UI
protection and resilience, including executive and managerial decision making for
prioritization of programs and investments. Importantly, risk qualitative measures and
quantitative metrics also needed for supporting the design, deployment and employment of
protection, and resilience management strategies by measuring their effectiveness and
efficiency.
Meanwhile, vulnerability and RA are both foundational concepts and analytic
disciplines solidly rooted in a structured and systematic approach. The concepts and analytic
disciplines should be deeply ingrained in the practical application of UI system protection
and resilience. The reason for their application is straight forward to identify and understand
the hazards and vulnerabilities of UI system. Thus, DMs are able to identify proper measures
to implement for UI system protection and resilience.
Moreover, prudent risk management demands that stakeholders anticipate the
hazards and threats to their physical UI design systems that are inherently safer and more
resilient, and further be prepared to restore the system when they fail [22]. In a UI system
perspective, the goals of vulnerability and RA for informing protection and resilience
decision making are [100]:
- Given UI system and its planned objectives, is to identify the set of events and event
sequences that can cause damages and loss effects with respect to the UI system
serviceability;
- Identify the relevant set of “initiating risk events’ and evaluate their cascading impact
on a subset of elements for the overall UI system.
The ultimate goal of UI system protection and ensuring resilience is to identify
obvious and hidden vulnerabilities to be able to act for managing and reducing impact before
they manifest as failures. On the study conducted by, Zio, E., vulnerability and RA are
considered for their central role to support decision making for proper infrastructure
protection and guaranteeing the UI system resilience [4].
The comprehensive of mitigation and recovery strategy for infrastructure minimizing
risk impact and reaching its normal serviceability state (or similar before the extreme event
occurs, see 1st stage of resilience concept in Figure 2-5) are tightly correlated. This
correlation is based on the great preliminary of RA with long-term plan consideration and
proper participatory of decision making by various stakeholders. In the UI system REA, the

CHAPTER 3-RISK ANALYSIS AND RESILIENCE RELATIONSHIP
Page 50
objective of RA is to deliberate a reliable analysis output towards inherent risks and inform
DMs prior making comprehensive decision. This renders questionable of the suitable
classical RA methods.
3.4.1 Shortage of Conventional Risk Analysis Method
The conventional RA perspective focuses to answer several questions, that is “what can go
wrong?”, “what is the likelihood that it could go wrong?”, “what is the consequences of
failure?”. This research proposed a novel risk criticality analysis method which might go and
cope one step further towards building urban UIs resilience. Accordingly, many types of
conventional RA methods have been developed by applying complex mathematical models.
Further, the models also applied to gauge and define the significant risk events.
There are a number of conventional RA methods, such as; Hazard and Operability
(HAZOP), Hazard Identification (HazId), fault tree and event tree analysis, risk matrix, failure
modes effect and criticality analysis, aggregate exposure and risk model, risk priority scoring,
hierarchical RA [4, 98, 101-107]. As there are various conventional RA methods, however,
this research found a number of shortcomings. For instances; fault tree analysis which is
typically found on a decomposition of the system into subsystems, basic elements and their
subsequent decomposition for quantification [27]. The pre-defined causal chains which are
identified by using event tree analysis seem inappropriate to identify the dynamic risk
impact pattern, and vulnerabilities emerging in an UI system relationship complexity with
the community.
Deshmukh et al. presented a severity assessment tool to determine the reduced
serviceability level of UI, especially after a disaster stage [108]. The proposed model is found
to be able to determine both the social and economic impact on communities and industries
respectively. The advantage of the model is that it can explore and evaluate the reduction in
the serviceability of the respective UI functionality due to impaired UI system. Moreover,
Zhang et al., proposed Fuzzy comprehensive evaluation method for assessing unexpected
accidents and potential latent risks in water supply infrastructure [109].
Other studies which have stressed the development of RA methods in infrastructure
context can be seen in [106, 110-112]. These studies have provided valuable methods in
order to deliver the output information for DMs to support both community and UI system
being resilient. Although a conventional experience-based risk identification and assessment
methods are more practical, however the input data only promotes the representation of the
specific expert group. Such isolated assessment processes without relying on a formal

CHAPTER 3-RISK ANALYSIS AND RESILIENCE RELATIONSHIP
Page 51
quantitative assessment of the probable consequences on the affected communities made
the analysis output incomprehensive.
In the UI case context, the RA still confined only to the technical risks [113, 114].
Conventional RA methods are focus on giving high attention to the magnitude, probabilistic
variable, and weight value consideration to determine the crucial risk event. However, it is
found that the analysis of crucial risks in terms of its priority level impact to urban
community and propagation dynamic are still missing. Without questioning, the analysis of
risk characteristic, negative impact, and adverse effect of UI system to urban community
could be far more complex, unpredictable, and difficult to manage.
Importantly, the critical level of individual risk is not only related to the RA processes
and results, but also to the individual capability, resources availability and other external
factors and constraints [92]. This complexity inevitably rises spontaneously from the
different pattern and behavior of risk ripple impact towards dynamic circumstances
including the urban community. Therefore, it is clear that the risk event is a complex and
dynamic which difficult to obtain long-term forecasting reliable enough.
Accordingly, the traditional risk-based approaches that incorporate risk and
vulnerability analyses need to be extended to a broader scope. The extension of the scope
should give wider consideration than the standard analysis for the identification of hazards
and the probabilistic quantification of their occurrence. The extension must be driven by the
need for more confidence in the treatment of both surprises and black-swan risks. Thus, the
treatment has to put forward through improved understanding of systems and processes,
and the aim of improving the ability to predict what may be coming [4].
Correspondingly, it is considered conventional RA methods in UI system vulnerability
incapable to capture the (structural and dynamic) complexities facing multi-risks. Therefore,
a study beyond the traditional, centralized, and isolated RA methods, which considering
different range of risk profiles including with various risk characteristics, needs to be
developed further to achieve comprehensive risk evaluation. Based on the discussion above,
this research highlights several drawbacks and limitations of conventional RA methods
which described in Table 3-1.
Based on the identified conventional RA shortages, the preliminary conclusion
towards the UI systems RA is that the analysis cannot carried out with conventional methods
of system decomposition and logic modeling. Therefore, the shortage of conventional RA
methods leads to losses crucial information, issues obscurity, and thus cause managerial
uncertainty towards building comprehensive risk mitigation strategy towards developing UI

CHAPTER 3-RISK ANALYSIS AND RESILIENCE RELATIONSHIP
Page 52
system resilience.
Table 3-1. Conventional RA drawbacks summary.
No Conventional RA method drawbacks 1 It does not provide information on the interrelationship existing between the UI system inherent risks
and communities [115]. 2 Conventional RA methods tend to view, analyze, and evaluate risk events in a subjective,
compartmentalized, linear, isolated and fragmented manner, monotonous, and static which turn in capable to deal with the UI system RA complexity issue. Therefore, conventional RA methods need to be extended beyond the casual analysis, such as; event-chain description of impact and consequences (causality).
3 Conventional RA methods lack to consider and accommodate stakeholder engagement and divergent perceptions respectively
to achieve the objective and reliable strategic outcomes since it shortages lie on the insufficient capacity to recognize the importance of community in terms of exchanging information between divergent stakeholder perceptions.
4 It is limited to the use of linear analysis when assessing the risk and its impact on infrastructure development without consider the complex system [116-119]. There is a tendency headed on the inward-looking perspective that treats risks impact in isolation from one another.
5 Conventional RA neglects the higher-order impacts and thus greatly underestimate the variety of adverse effects attendant on certain risk event (and thereby underestimate the overall risk impact from the event).
6 It lacks an integrative method that provide guidelines on how to model and measure; the complex nature and characteristic of risk, and community response to the risk. This results in a reaffirmation of technical RA and provides least definite answer (however narrow or misleading) to urgent UI system risk problems.
7 The inherent tendency to promote the effectiveness and robustness of assessment process and analysis result respectively lacks societal impact consideration.
3.4.2 Knowledge Gaps on The RA Model towards Risk Impact to Community
The UI system consists of huge and complex mechanisms with significant incoherent
connections of numerous dependent infrastructure systems [26]. The interconnected UI
systems is an integrated part for supporting human needs in the urban living circumstances.
It is, thus clear that the relationship between the UI system and community inevitably exists
and inseparable [22, 34-37]. For that the reason, the continuous reliance of urban dwellers
on UI stretched across geography creates its inevitable vulnerabilities [22]. Importantly,
without knowing the individual impacts on stakeholder arising in risk events, resilience
planning is not effective.
The disrupted infrastructures, will automatically affect its serviceability followed by
the unavoidable disruption and various consequences to urban life. Henceforth, the
interrelationships between the UI and associated community is the key components to
understand the risk impact mechanisms. Oh, E., Oh et al., and Bocchini, P., et al, discussed the
interrelationsihp between risks and community through a conceptual model of basic cell [40,
41, 68]. The studies highlighted the diffusion path of risk impact develops at the advanced
stages increase the complexity for risk mitigation.
Risk impact cascades, systemic risks, normal accidents, and trans-boundary risks are

CHAPTER 3-RISK ANALYSIS AND RESILIENCE RELATIONSHIP
Page 53
all terms used to describe risks that arise out of the non-linear and multifaceted interactions
between components within broad, open-ended, and complex socio-technical systems [120].
Accordingly, applying conventional RA paradigm and method that focus solely on single
metric of risk will return on the ‘out-of-dated’ and less comprehensive analysis output.
Several attempts have been made to reduce the risk impact and consequences by breaking
down and simplifying the UI system components. However, this process often ended up
merely shifting risks to different areas and creating new, and even more, catastrophic risks.
Investigating the association of UI system risk and community, thus, have to go
beyond the usual cause-consequences analysis to be able to focus on spill-over clusters of
failures. Accordingly, efforts are increasingly directed toward grappling with complexity and
approaching RA in its entirety. In the light of RA method importance, it is found that the
functionalities of major previous RA methods developments were limited. Such limitation is
due to most of them built on the consideration of linear RA without considering the dynamic
of risk impact (i.e., the risk causality, interaction capacity and impact to urban community).
Particularly, current RA research applies various approaches from a wide perspective
which attempt to move from simple, linear and siloed model toward more holistic one that
embrace complexity. With the increasing of community losses due to the risk consequences,
more emphasis is being placed on improved RA methods and mitigation strategies that
consider social loss [40-43, 121]. In other hand, the discussion towards sequential relation
to community-risk associated problem are not well established and thus poses significant
challenge to the RA method development.
A number of RA methods have been developed by integrating complex mathematical
models to gauge and determine the significant risk event. For instances; fault tree analysis,
which are typically founded on a decomposition of the system into subsystems, basic
elements and, their subsequent decomposition for quantification [27]. The pre-defined
causal chains of risk which is identified by event tree analysis seem inappropriate towards
identifying the hidden risk and vulnerabilities emerging in UI system relationship
complexity with the community.
Correa-Hena et al. proposed semi-quantitative method which leverage both risk maps
and chart for assessing risk in electricity infrastructure [80]. Zhang et al. proposed Fuzzy
comprehensive evaluation method for assessing unexpected accidents and potential latent
risks in water supply infrastructure. As dicussed above, despite the existance of the vigorous
RA methods in the risk management literature, the inherent tendency to promote the
effectiveness and robustness of assessment processes, and analysis result lack of societal

CHAPTER 3-RISK ANALYSIS AND RESILIENCE RELATIONSHIP
Page 54
impact consideration.
To fill these gaps, Deshmukh et al. presented a severity assessment tool to determine
and assess both the social and economic impact on communities due to disturbed and
reduced UI serviceability level after disaster occured [108]. The model has been validated in
the real case research of the 2008 Midwest floods. Following the structured analysis, the
presented tool found to be flaw as it has mainly focused on what the risks are and how they
may impact on the objectives.
People’s perception toward risk events is the product of individual intuition which
reflects their self-vulnerability point of view in both the pre-and post-disturbance periods.
It is particularly, reflects the different individual (or groups) within the community
associated who has affected by risk impact will be influenced differently as per by their social
and cultural environment.
Henceforth, former RA cannot be expected to yield on a direct prediction regarding
what risk event is significant to the community. It is thus, necessary to highlight the pattern
of stakeholder-risks relationship to promote the comprehensiveness of effective decision
making towards the dynamic and complex of risk impact characteristics. This complexity
rises spontaneously from the different pattern and latent behavior of risk impact towards
community.
On this ground, Yang and Zou, proposed a theoretically innovative and practically
applicable ‘stakeholder-associated risk’ analysis from a social network perspective [92]. The
one-mode network analysis is applied to analize the risks and their interactions in the
complex green building projectsbased on network topology. The study measured network
tie strength using risk decision factors between different risk events nodes as well as
associated impact to another nodes. As the study proposed a RA in a novel way, nonetheless,
this research found several shortages such as; the input data only promotes the limited
representation of expert groups judgments.
Further, such an analysis process lack of a formal quantitative assessment of the
probable consequences on the affected communities made the analysis ouput less accurate.
The application of one-mode network analysis method applied is lack of comprehensive
dichotomize processes towards mimicing the interrelationship behavior between risk
impact and the community. Such analysis processes has tended towards inward looking
perspectives that treats risks in isolation from one another. Thus, it leads to information loss
and extensiveless analysis output.
In practice, there is no ‘silver bullet solution’ to the problem of analyzing the risks in

CHAPTER 3-RISK ANALYSIS AND RESILIENCE RELATIONSHIP
Page 55
terms of its impact affecting urban community. Rather, a novel RA model necessary need to
be developed which in certain degree allows to structuraly measure, analyze and determine
the significant risk based on the social relationships between risk and individual (as a part
of urban community). This relationship important as it reflects the understanding of how
various UI system risk events affecting community (individualy) differently. Therefore, a
model which capable of capturing complexity connections between risks and stakeholders
individually will be highly realistic for addressing the knowledge gap.
3.4.3 Knowledge Gaps on Risk Causality and Interaction Pattern Analysis Model
In the UI system context, the risk impact dynamic within the system affected not only to the
dependent community but also to the common urban flow, such as; economic, environment,
digitality, cultures and politics [36]. The risk characteristics (i.e., the causality dynamic and
interaction pattern) are phenomena resulted from an “impact escalation”. The impact
escalation is emerged from not only the primary but also secondary risk events, and thus
triggered by an “escalation vectors”. The escalation vectors also known as the magnitude of
the physical effects, originated by the principal risk scenario.
This phenomenon has increased the exposure to systemic risk, characterized by
cascading of failures which can have significant impacts at the UI system scale. The
unexpected absence UI system function works to underline the very (albeit useless)
presence of the vast stretched out system that usually remains so invisible. To date there are
various efforts increasingly being directed toward grappling with complexity and dynamic
towards risk identification, analyses, and management approach in its entirety. The concept
of risk causality, propagation sequence and interaction pattern has been studied well.
For instances; Vidal and Marle, proposed a method to analyze risk interconnections
using risk map [87]. The method allows for a better representation of the interrelationships
among the various risks to avoid the negative aspects of its impact. It is, however, this
research found that the method has a shortage as the method lack of an analysis processes
towards appraising the interaction links proportion or scale between risk events. To fill the
previous study gap, Lindhe, A., et al. developed an integrated probabilistic RA method by
adopting the event tree analysis method and validated onto the drinking water systems case
[122].
The study offers a useful overview of how risk emerge and the impact probability
towards influencing other risks can be assessed. Nonetheless, risk event tree analysis
method has a shortfall in capturing the messy entanglement between roots (initial) and

CHAPTER 3-RISK ANALYSIS AND RESILIENCE RELATIONSHIP
Page 56
branches (secondary) of particular risk. It is based on a linear inductive thinking on the chain
of events resulting from an accident initiator. This can be a way to implement the concepts
of predictability and unpredictability within the uncertain space and time, with respect to
‘common-cause variations’ (predictable in view of historical experience and knowledge) and
“special-cause variations” (unpredictable because beyond experience and knowledge) [4,
123, 124].
Following the shortcoming that has been found from the study conducted by Lindhe,
A., et al. [122]; Fang, C., et al. fill the gap by presenting network-based RA approach to deal
with the risk causality and interactions characteristic [86]. The approach aims at identifying
both key and secondary elements in the structure of interrelated risks. Another study in
relation to analyze the risk causality and propagation pattern sequence is conducted by
Khakzad, N. [125]. The study proposed a probability-based risk causality and propagation
sequence analysis method. The proposed method adopting the Bayesian network (BN)
method to model both the spatial and temporal evolutions of domino effects, and also to
quantify the most probable sequence of accidents.
John, A., et al. presented a model approach that employs Bayesian belief networks to
model various disruption risks interactions as influencing variables in a seaport system
[112]. Further, Yuan, Z., et al. developed a methodology for the probability estimation of dust
explosion domino effect based on BN method [126]. By applying on the flexibility structure
and robust reasoning engine of BN method, the likely propagation route of potential domino
effects along with the probabilities can be assessed. Although BN has been applied
extensively in the academia nowadays, however the method complexity made its application
less popular and difficult into real world problem.
Another shortfall is that, BN method inadequacy to accommodate community
participation towards giving divergent input data. Underestimate the data collection leads to
produce simulation and analysis miscue. Particularly, analyzing risk causality and
propagation pattern using social network analysis (SNA) approach receives more attention
recently. The SNA is relatively straightforward perhaps best known as an approach for
analyzing groups of people. Moreover, SNA has applied to understand how hazards spread
and interact with each other.
For instance; LaRocca, S. and S. Guikema, employed the network theoretic approach
for RA in complex infrastructure system [127]. Ongkowijoyo, C. and H. Doloi, developed an
integrated method for assessing UI system risks where network analysis applied to analyze
the risk impact propagation [128]. Moreover, Clark-Ginsberg, A., demonstrated how the tools

CHAPTER 3-RISK ANALYSIS AND RESILIENCE RELATIONSHIP
Page 57
of network analysis can be employed to develop network maps using participatory data set
and discussed the utility of such displays in designing interventions to reduce risk
consequences [120].
Although SNA has been applied in various RA studies, nonetheless, the application of
SNA in analyzing the risk causality, impact propagation, and interaction pattern in the
context of UI system is still an unexplored area. Furthermore, towards obtaining the input
data, SNA lacks of defining the boundaries of the set nodes in which to be included in the
network [129]. Moreover, another issue which still missing is that SNA method lacks the
interrelationship weight value between the risk impacts and interactions with other risks.
Based on above discussion, this research also intends to remedy the conventional RA
model omissions towards the assessment of single risk event with respect to its dynamic
causality, propagation pattern and connectedness with other risk events. Therefore, building
a novel RA method which capable to capture and model the phenomena of a risk impact
characteristics and mechanism dimension mentioned previously is the importance of this
research.
Based on the literature review discussed thoroughly, it can be concluded that
conventional RA method cannot be expected to turnout on a simple result regarding which
risk event in UI system is likely significant. Accordingly, a major challenge is to define the
critical risk based on the understanding of how the dynamic of risks characteristics and its
impact mechanisms affects UI system and community. Based on the identified critical risk,
thus the UI system robustness then can be assessed comprehensively.
The previous paragraph ended the discussion towards responding the first research
question stated in the first Chapter (RQ1, can be seen below as a reminder). In this research,
it is concluded that risk impact characteristic that need to be considered as the element to
define critical risk, is that; (i) The magnitude of risk which formed by various decision factors,
(ii) The risk causality and interaction capacity with other risks, and (iii) The impact of risk
affecting community-individually.
RQ1: What the risk characteristic and impact mechanism that are significant in defining the
critical risk?
3.4.4 The Logic for Developing Critical RA Model
Assessing UI system risk can be daunting as the UI, which usually seen in a traditional

CHAPTER 3-RISK ANALYSIS AND RESILIENCE RELATIONSHIP
Page 58
perspective, cannot be observed in a single technical element. This due to the UI systems
create a social value downstream by serving a wide variety of end-users (as an individual or
group) who rely on access to the system and another system. Forasmuch as, certain
assessment techniques are required to involve individuals and further require a particular
approach to undertaking RA. It is important that the adopted approach is consistent with the
culture of the community and the problem context.
Based on literature review sections previously, it is clearly that, assessing inherent
risks in UI systems is inevitably crucial to the development of both UI system and community
resilience. Therefore, assessing UI system risks in a real world using single conventional RA
method is inadequate to accommodate the complexity and dynamical of both UI system flow
and risk impact characteristics (and mechanism). As a number of latent risk impact
characteristics have been discussed previously, further discussion goes to some challenges
toward assessing UI system risks that have emerged and need to be considered.
This research pays several issues toward several challenges of developing UI system
RA method. These challenges are; First, dynamic risk impact in real-life environment.
Following the risk impact characteristic and mechanism discussed previously, it is clear that
conventional RA point of view (predominantly focus on the calculation of risk decision factor
to measure risk) is old-fashioned and incapable to deal with the UI system risk impact
characteristic and mechanism. Conventional RA is, therefore, unable to produce robust
analysis result. Modifying conventional RA processes which can simulate risk impact
characteristic and mechanism in current changed real-life circumstances would be of the
advantage.
Second, public perceptions towards risks. Better UI management decisions can be
resolved and made when the needs, preferences, and desires of the community are fully
examined. The importance of the stakeholder engagement in the decision making processes
regarding the complex system of UI and its’ risks is absolutely necessary [93]. The broad
stakeholder opinions are important as it is delineating the technical risk estimation based
on the only conventions of an elite group of professional risk assessors. This isolated
deliberation may leads to the claim of no more validity degree than competing estimates of
the lay public [84, 105, 130].
From here, challenge emerges as different individual have their own perceptions
toward risks within the assessment processes. Community perception towards risk, its’
impact, risk reduction measures and the role of public institutions in UI system risk
preparedness are vital for the successful development and implementation of risk mitigation

CHAPTER 3-RISK ANALYSIS AND RESILIENCE RELATIONSHIP
Page 59
strategies, measures and policies [105]. As the UI sector supporting urban flows, the decision
making towards building risk evaluation and mitigation strategy plan should importantly
consider both expert and laypeople thinking and perception which will enhance UI risks
mitigation response.
The effective implementation of the UI system protection plan depends on the degree
to which government and private sector partners engaged in a systematic, effective, and
multidirectional information sharing. Thus, deciding and managing crucial decision making
requires a joint learning process, comprehensive collaboration between different
institutions and organizations. Importantly, the collaboration has to be compelled by multi-
stakeholders to support the development of joint agendas and spreads new ideas.
However, the consequences are associated with special concerns that individuals,
social groups or different cultures may attribute to the RA process and output. The strength
of a non-technical dimension account for aspects of societal and psychological risk
experience, and perception knowledge supporting the RA. Thus, it is become an additional
dimension of the RA processes that alerts and makes aware the DMs towards the RA quality,
and the confidence that can be placed in its results [4].
Public perceptions towards risk represent what people observe in reality and forged
through the experience of actual harm (the consequence of risk). Both perceptions and
experience turn up in the sense that human lives are lost, health impacts can be observed,
the environment is damaged or buildings collapse. Further, public perception is the product
of intuitive biases, economic interest, and reflects cultural values of more generally. The
public perceptions (both experts and lay people) towards risks have been gaining a lot of
attention in academia field.
A number of studies discussing the people perception of risk, both in the psychology
and sociology point of view have been studied well, For instance; Aven, T., and B. S. Krohn,
proposed a new perspective on RA which add the description and/or measurement of the
strength of the people knowledge [131]. Another studies towards this issue can be seen in
[81, 82, 132-134]. The experience of risk therefore, is not only an experience of physical
harm, but also the result of processes by which groups and individuals learn to acquire or
create interpretation of risk.
Departure from this understanding, risk experience can be properly assessed only
through the interaction among the physical harms attached to a risk event and the social, and
cultural processes. In addition, this interaction shapes the interpretations of that risk event,
secondary and tertiary consequences that emerge, including the actions taken by DMs and

CHAPTER 3-RISK ANALYSIS AND RESILIENCE RELATIONSHIP
Page 60
publics. Following the SAR framework, the characteristic of both a risk and risk events have
become portrayed through various risk signals (images, signs and symbols). These signals in
turn interact with a wide range of psychological, social, institutional or cultural processes in
ways that intensify or attenuate perceptions of risk and its manageability [63, 81].
Past studies have been shown the existence of a controversy and debate which
exacerbated the divergences assessment between expert and public, and often erode
confidence in the RA and decision process. Based on the above explanation, making the
practice of RA more sensitive to issues aforementioned is thus one of the most challenging
tasks confronting the societal risk management. Henceforth, the development of RA methods
need further attention in its scientific elements to accommodate the information exchange
in a community-wide conversation that leads to different viewpoints of understanding the
risk.
Third, build an advance model which can imitate and simulate solidly the uncertainty
and stochasticity of risk impact behaviors and mechanisms. Following the risk impact
characteristic and mechanism discussed previously, as far as author acknowledged there is
no study ever attempt to propose an RA method which integrates three risk impact
characteristics and mechanisms (i.e., risk magnitude, risk causality and interaction pattern,
and the risk impact effect to community), altogether within single framework.
A difficulty emerges, perhaps due to the; shortage of knowledge towards risk impact
characteristic and mechanism and the community perceptions towards risk in previous time,
as well as the limitation of the RA modeling and simulation techniques. Modeling and
analyzing the risk by reductionist methods are likely to fail to capture the behavior of the
complex systems that make up the UI system. Therefore, a novel approach is needed that
able to look into UI systems from a holistic viewpoint to provide reliable RA outputs for
enhancing REA and control.
3.5 Risk and Resilience (Analysis) Relationship
The resilience s distinguished from risk in several ways. Principally, risk is used to determine
negative consequences of potential undesired events, and to mitigate the exposure of
undesirable outcomes. Further, risk is a measure of potential loss of any type and is
associated with the uncertainty about and severity of the consequences of a disruptive
activity [10]. On the other hand, resilience is an endowed or enriched property of a system
that is capable of effectively combating (absorbing, adapting to or rapidly recovery from)
disruptive events.

CHAPTER 3-RISK ANALYSIS AND RESILIENCE RELATIONSHIP
Page 61
The resilience approach emphasizes an assessment of the system’s ability to; (i)
Anticipate and absorb potential disruptions; (ii) Develop adaptive system to accommodate
changes within or around the system; and (iii) Establish response behaviors aimed at either
building the capacity to withstand the disruption and, or recover as quickly as possible after
disturbed. Resilience could also be viewed as the “intrinsic capacity of a system, community
or society predisposed to a shock and, or stress event to adapt and survive by changing its
non-essential attributes and rebuilding itself” [51, 57, 112].
Furthermore, emphasizing the concept of UI system resilience, means to focus on the
quality of community life at risk and to develop opportunities to enhance a better outcome.
Nevertheless, the challenge lies in a process to integrate both quantitative analysis between
resilience analysis REA and RA beyond conventional perspective (models and techniques)
for endowing a system with necessary capabilities to cope with disturbance events.
Interestingly, risk and resilience approaches share four key characteristics, that is; (i)
They provide a holistic framework for assessing systems and their interaction, from the
household and communities through to the sub-national and national level, (ii) They
emphasize capacities to manage hazards (or disturbances), (iii) They help to explore options
for dealing with uncertainty, surprises and changes, (iv) They focus on being proactive [11].
Figure 3-7 depicts the relationship between risk and system robustness.
However, little known that risk and resilience concepts have very close relationship.
Some studies have examined UI resilience strategy for improving UI system involvement,
however, a few studies have investigated the important role of RA involvement in defining
the UI system resiliency specifically. On the other hand, other previous studies have been
quantitative in nature and conducted from a technical and empirical perspective, providing
no insight into the role of risk management knowledge in defining the UI resilience.
From here, it is undoubtedly that the REA for UI system has to go beyond conventional
approach. Likewise, the existing quantitative models to measure and assess UI system
resiliency are also not consistent with the concept of risk management. While resilience has
clearly attracted as both unifying concept and vision with political currency in uncertain
times, achieving positive outcomes will require policy makers and practitioners to fall back
on more familiar concepts with practical experience. Correspondingly, both risk and risk
management provide familiarity and similarity, to allow a cross-disciplinary and cross-issue
discussion.
The advantages of adopting RA elements within the REA leads to strengthening the
analysis outcomes by providing a cross-comparable metrices. The metrices have the scope

CHAPTER 3-RISK ANALYSIS AND RESILIENCE RELATIONSHIP
Page 62
related to the overlaps and opportunities identification for integrated diverse disciplinary
and policy approaches towards managing UI system risks. On this ground, the success of
building UI system resilience plan and strategy lies on the comprehensive RA [4, 69].
Conventional RA methods commonly focus on the assessment of hazardous event and
scenario where has been identified and determined (conditional) in the present time where
the extreme event has not been actually occurred.
EconomicalTechnical and
OperationalSocial
Impact to the community
Hazard event and uncertainty within every aspects of urban water supply infrastructure system.
Ro
bu
stn
ess
Risk Criticality
End User Governmental
Commercial & Industrial Information exchange within multi-
level multi-sector stakeholder
Ris
k I
mp
act
Mit
iga
tio
n p
lan
an
d d
eci
sio
n m
ak
ing
str
ate
gy
Figure 3-7. Risk analysis correlation with UI system robustness.
On the other hand, the infrastructure resilience concept has emphasized that the
preparedness strategy in the context of RA need to go beyond the traditional paradigm. Less
comprehensive RA, thus yields on the poor and ineffective REA and decision making
respectively. It is therefore, RA plays pivotal roles as the foundation of REA. Notwithstanding,
previous studies on resilience system analysis lack of considering the RA dimension within
the REA processes. This issue prevents the development of a metric to measure resilience in
a comprehensive and consistent manner. Such a risk metrics element within REA would
greatly support the deep analysis output.
Therefore, enable to promote the development of resilient UI systems by; producing
a resilience strategies comparison and support of resilience related decisions during design
and operation. Thus, conventional RA methods must be expanded and complemented with
methods for probing surprising events which can potentially emerge from the UI and risk
complexity, once triggered by an initiating event. The integration between those two analysis

CHAPTER 3-RISK ANALYSIS AND RESILIENCE RELATIONSHIP
Page 63
models would give comprehensive UI system analysis result in the pre-and post-hazard
performance of the system.
Risk assessment in the current state
(before the disturbance occurs)
Figure 3-8. Assessing critical risk in further potential uncertain condition.
The ability to portray, model and simulate the effects of disturbances in UI system
case is an important aspect of robust RA processes and further recovery planning.
Correspondingly, the plan will significantly affect the building of both UI system and
community resilience improvement. One strategy for developing UI systems resilience better
than before is to apply the “adjoint” approach and simulation method. The method may be
particular interest for generating deductive (anticipatory, backwards) scenarios, where the
analysis starts from a future imagined event/state of the total system facing the disturbance
and thus question what is needed for the system to recover reaching the normal state.
Mitchell, T. and K. Harris, highlights some of the advantages of adopting a risk
management lens to strengthening resilience [11]. However, the test and validation using the
case study provided are illustrative rather than exhaustive. Moreover, context specificity is
paramount to determine which set of risk management options are required in any given
context. It may be that one set of management options for addressing risk may be entirely
inappropriate for another given time and/or place.
Correspondingly, an advanced model and analysis techniques, and simulation
methods are inevitably needed for supporting the decision making towards building the UI
system protection plan and strategy. Therefore, improving the resiliency of UI system against
systemic failures. The integration between RA model and REA, can be the tool for the UI
system resilience quantification. This tool allows for the evaluation and comparison of the

CHAPTER 3-RISK ANALYSIS AND RESILIENCE RELATIONSHIP
Page 64
different protection and recovery strategies effectiveness that are proposed to avoid and
reduce the adverse consequences of disruptive events.
3.6 The Resilience Analysis Model Review and Evaluation
Literature from a wide range of disciplines in which REA models and techniques in the
context of UI systems will be reviewed in this section. It should be noted that this review is
limited to literature that contain a metric and/or formula for measuring system resiliency.
The shortcomings of previous REA models will also be explored as a discussion platform
towards obtaining knowledge gaps in the context of UI system REA. The REA framework
from previous studies mainly have been developed to quantify the resilience of various
systems against natural hazards or the intelligent actions of adversaries.
A number of studies have discussed the development and implementation of REA
frameworks. For instances, Cimellaro, G. P., A. M. Reinhorn, and M. Bruneau, presented the
quantitative evaluation towards disaster resilience and proposed the unified terminology for
a common reference framework [9]. The evaluation of disaster resilience is based on
dimensionless analytical functions related to the variation of functionality during a period of
interest, including the losses in the disaster and the recovery path.
Henry, D. and J. Emmanuel Ramirez-Marquez, proposed generic metrics and formula
for quantifying system resilience [58]. The paper also described the key parameters
necessary to analyze system resilience such as; disruptive events, restoration components,
and overall resilience strategy. Ouyang, M., L. Duen as-Osorio, and X. Min, proposed a new
multi-stage framework to analyze infrastructure resilience [69]. For each stage, a series of
resilience-based improvement strategies are highlighted, and an appropriate correlation of
resilience identified. These strategies, then combined to establish an expected annual
resilience metric for both single hazards, and concurrent multiple hazard types.
Francis, R. and B. Bekera, proposed REA framework and its metrics for measuring
resilience [8]. The proposed framework consists of several aspects, that is; system
identification, resilience objective setting, vulnerability analysis, and stakeholder
engagement. Subsequently, both the framework and metrics are promoting the development
of methodology investigating “deep” uncertainties in REA. The methodology is also retaining
the use of probability for expressing uncertainties about highly uncertain, unforeseeable, or
unknowable hazards in design and management activities.
Meanwhile, Shafieezadeh, A. and L. Ivey Burden, proposed a probabilistic framework
for scenario-based REA of infrastructure systems [7]. The method accounts for uncertainties

CHAPTER 3-RISK ANALYSIS AND RESILIENCE RELATIONSHIP
Page 65
in the analysis process. Such as; the correlation of the earthquake intensity measures,
fragility assessment of structural components, estimation of repair requirements, the repair
process, and the service demands. Furthermore, Ouyang, M. and Z. Wang, adopted an existing
REA framework for single system to interdependent systems [51]. The study also focused in
modelling REA of multi-systems’ joint restoration processes.
The purpose of this literature review is to explores and present various REA methods
are currently applied. The majority approaches and methods available to measure resilience
system, particularly to systems aforementioned, reflect strongly the diversity of disciplines
and sectors that have appropriated the term. Much of the works on infrastructure resilience
have draws on understanding of the system vulnerability and seeks to measure the
vulnerability levels rather than resilience itself.
Meanwhile, the exercises of measuring resilience in previous studies are also highly
variable, depend on the understanding and weight given to concepts (e.g., coping, capacity,
vulnerability and adaptive capacity). Nonetheless, this research found a significant
shortcoming from the previous REA methods. The shortcoming is that the method lack of
consistency in its quantitative approach. The intended shortcoming is that; previous REA
methods lack of quantitative approach to consider the complex risk characteristics and
dynamic impact mechanisms which leads to produce a severe and inaccurate analysis output.
The context-specific nature of risk, the dynamic nature of change and the complexity
of capacities associated with UI system resilience are making the systemic measurement
challenging and leading to a simpler frame for evaluation to be considered. Correspondingly,
this research concludes that; REA and RA are complementary and suggests that both should
be integrated in a unify perspective. Thus, there is a need for developing a novel and robust
UI system REA model which capable to capture the complex risk characteristics and impact
mechanism dynamics that would be useful for developing an effective recovery strategies
[58].
3.7 Chapter Summary
Understanding the risk characteristics and impact mechanisms as well as reducing the level
of risk impact pertaining to an UI system in general are the major tasks in infrastructure risk
management. In this section, the latent risk characteristics and impact mechanisms assigned
to show that risk impact not only affecting single urban life aspect, such as; community
health, safety and cost, but also in a perspective of socioeconomic, psychological and
sociocultural as a whole.

CHAPTER 3-RISK ANALYSIS AND RESILIENCE RELATIONSHIP
Page 66
Departing from the literature review and discussion abovementioned, this research
concludes that; in the situation of disturbed UI system, the unbounded nature, characteristic
and impact mechanisms of risks imperatively should be considered and seen as a unified and
integrated dimension in both RA and REA. Following this finding, nonetheless, conventional
RA methods are having several limitations and no longer capable to cover and analyze those
issues.
Specifically, conventional RA methods are mainly fragmented and isolated which
incapable to consider the integration between different range of risk profiles, characteristics
and impact mechanism. The ability to portray, model and simulate the risk dynamic
characteristics and its impact mechanisms in UI system is crucial towards building robust
RA and REA. To this, a framework is needed to build and integrated method which capable
to view the risk problem from resilience perspectives which suitable for coping with the high
complexity of the UI system and the related uncertainties.
Accordingly, there is an urge need to initially develop a novel integrated RA method
which includes a variety analysis method which can systematically capture and interpreted
such complexities from different characteristic perspectives into complete data,
understandable and reliable expediting the risk evaluation processes. Henceforth, methods
of “adjoint” simulation may be the particular interest for generating deductive (anticipatory,
backwards) scenarios. The scenario where research be able to start both RA and REA from a
future imagined event/state of the total system and question what is needed for this system
to recover.
For the REA method development purposes, the point is that the conventional RA not
sufficient to identify and quantify efficiently the complexity of risk in the context of UI system.
Additionally, the analysis cannot be carried out only with the classic methods of system
decomposition and logic analysis. From this point, there’s an overarching need to propose a
holistic risk-based REA framework which in certain degree capable to; (i) View the
complexity problem from different perspectives (topological and functional, static and
dynamic under the existing uncertainties), (ii) Portray, analyze and evaluate the crucial risk
issues in particular UI system (both in static and dynamic manner, both in the present and
future of time-prediction), (iii) Promote the comprehensiveness of risk mitigation plan as
well as the resilience action.

CHAPTER 4-RESEARCH DESIGN AND METHODOLOGY
Page 67
CHAPTER 4
RESEARCH DESIGN AND METHODOLOGY
CHAPTER HEADINGS Introduction Research Design Employing Mixed Method Approach Case Study Approach Research Ethics and Conduct Applied Approaches and Strategies to Data Collection Population Arrangement and Sampling Methods The Time Dimension Design Empirical Analysis Methods and Techniques Applied Chapter Summary
4.1 Introduction
This Chapter explains theoretically the research design and methodology applied for this
research. The research design built within this research will be explored in the step-by-step
explanation. Research design is an action plan for getting from ‘here’ to ‘there’, where ‘here’
refers to the; research aim (RAI), research objectives (ROs) and initial set of research
questions (RQs) to be answered, and ‘there’ is some sort of conclusion (answer) about these
questions. Between ‘here’ and ‘there’, this research applied a number of major steps,
including;
- The development of conceptual framework and analysis models
- Relevant data collection processes and initial data processing
- Simulation and analysis of relevant data, and
- The discussion and findings
- Conclusion summarization towards answering the RAI, ROs and RQs.
This Chapter explains the research strategy applied in this research. Here, research
strategy can be defined as the way in which the research objectives can be questioned. There
are two types of research strategies, namely ‘quantitative research’ and ‘qualitative research’.
Quantitative research is designed to empirically identify the presence and magnitude of
differences between individuals and/or groups of individuals [12]. Further, it is also typically
designed to test predetermined hypothesis that are formed based on existing theory
(deductive process).
While, qualitative research is typically more focused on sense-making in a purer
sense. It is often functions to develop theory from the data that are collected (an inductive

CHAPTER 4-RESEARCH DESIGN AND METHODOLOGY
Page 68
process). Further, qualitative research tends to focus more on rich description of a
phenomenon than on its quantification. Thus, instead of relying on numbers, counts, and
frequency-type data, qualitative research will often involve the collection and analysis of
detailed observations, stories or narrative histories, sounds, pictures, or video.
Additionally, qualitative methods often bring a new or fresh perspective to existing
research in fields of science that have been dominated by quantitative methods. Deciding on
which type of research to follow depends on the purpose of the study and the type and
availability of the information that is required. Accordingly, this research adopted the
combination of those two research strategies, that is; ‘mixed-method research’ [135]. Mixed-
methods research can be seen as [136];
‘the type of research in which a researcher or team of researchers combines elements of
qualitative and quantitative research approaches (e.g., use of qualitative and quantitative
viewpoints, data collection, analysis and inference techniques) for the broad purposes of
breadth and depth of understanding and corroboration.’
A more important implication is that the combination of quantitative and qualitative
methods benefits researchers in multiple ways, providing the researchers with improved
information and richness of detail that is not obtained when singular methods are utilized.
To start, this Chapter firstly examines and explores the research design flowchart. Second,
this Chapter explains the mixed method approach in-depth. Then, the case study approach
and appointed UI sector as the main case study is explained thoroughly, followed by the
approaches and strategies to data collection.
The discussion continues to the arrangement of population and sampling methods.
Further, the time dimension frame design for this research is also discussed. The last section
deliberates approaches and strategies towards empirical analysis methods and techniques
applied in this research. The Chapter summary section ends this Chapter by giving a general
summarization and discussion of the research design and methodology applied in this
research.
4.2 Research Design
This research began with the introduction to explain the problems and gaps of conventional
UI system are REA models. The research commenced with reviewing the existing literature
to compile background knowledge and identify research gaps, which led to a main research
aim. The main research aim then leads to the emergence of research objectives. The research
CHAPTER 4-RESEARCH DESIGN AND METHODOLOGY
Page 69
objectives were then subsequently interpreted for the purpose of developing the research
questions.
The next part is the literature review which plays a major role in order to explore and
describe; the basic theory and background of the UI system, its important role in the urban
flow and community who are highly dependent on those systems, as well as the risk and
resilience concept in UI systems. Then, the literature review shifts to discuss the existing
concept of RA and REA in the UI system. Following the risk and resilience concept in the UI
system context discussed previously, the literature review goes to explore the risk within the
UI system, the characteristic of risk and its impact.
The deficiencies of conventional RA in UI resilient context and the need for developing
a novel robust RA model are then explored. Moreover, the risk and resilience assessment
general model, and the concept towards the development of UI system resilience are
discussed as the basis for the risk-based REA model. The sequence of this research continues
to explain theoretically the research design and methodology applied.
The research design encompasses the strategies, plans and steps adopted to answer
the research questions [12, 135, 137]. It is important to form a basis for meeting the
established ROs, which in turn helps to answer the RQs. Furthermore, the setting towards
conducting the research is also a main aspect need to be decided. This decision will
substantially affect the research design and methodology develops and applies respectively.
Figure 4-1 presents the research design flowchart that was designed to achieve both this
research aim, objectives, and questions.
In addition, the choice of research setting is affected by the potential costs of the
setting, its convenience, ethical considerations and the research question that this research
is trying to address [135]. Generally, research design involves a series of choices. The two
most fundamental choices are, what is being studied and how to determine the best
approach to do so [138]. Other important decisions include the type of sample and methods
of data collection to be applied, how to measure the variables, and how best to analyze the
research concepts.
Based on the knowledge gained from the literature review parts, the next step is to
develop the conceptual framework. The building of a conceptual framework consists of
several RA models, which finally applied to support the UI REA. Various empirical analysis
contained within the framework and several techniques applied are discussed in detail in
the section 4.9. To validate the framework, specific UI system case study is chosen. The
validation is follow the mixed-method design as mentioned earlier.

CHAPTER 4-RESEARCH DESIGN AND METHODOLOGY
Page 70
In-depth Literature Review
Preliminary lit. review and problem identification
Defining knowledge gap
Introduction
Research Design and Methodology
Framework Validation
Data Processing, Simulation and Analysis
Findings and Discussion
Summary and Conclusion Remarks
Research aim
Research objectives
Research questions
Case study
Data collection
Initial data processing
Dissertation writing
Data simulation
Experts Interviews
Empirical Framework and Analysis Models Development
Data collected from fieldwork
Figure 4-1. The research design framework.
This research follows the embedded mixed methods design, integrating a wide survey
using design-based questionnaires administered in face-to-face interviews. The data
collected is then processed computationally. Additionally, the analysis section applies several
empirical methods and the quasi-experiment using computational simulation. The
discussion towards case study results are then continued and interpreted.
A number of findings, both in the context of the proposed method and the case study
round up the respective section. Finally, research conclusion and research value (significant),
are discussed. The research limitation and recommendations for future research are

CHAPTER 4-RESEARCH DESIGN AND METHODOLOGY
Page 71
explored as well in the very last part of this research. Finally, the research report was
prepared.
4.3 Employing Mixed Method Approach
As mentioned above, this research adopts the embedded mixed method research design in
which quantitative data plays the primary role. The notion of combining research methods
was first suggested by constructivists Lincoln and Guba in 1985 [139]. Since then, mixed
method approaches have become increasingly accepted and applied due to their value in
widening the range of research and delivering better results of the subject under
investigation [140].
The validation process of the evaluation tool developed in this study was conducted
within the context of a case study. Case study is an inquiry strategy in which the researcher
explores in-depth a program, event, activity, process of one or more individuals [140].
Creswell et al. (2007) also added that cases are bounded by time and activity, and researchers
collect information using a variety of data collection procedures over a sustained period
[141].
Using case study as a research approach requires employing more than one source of
data, which makes it appropriate for this research to adopt a mixed-method approach. Thus,
in this research, both quantitative and qualitative approaches are used to implement the
study’s specific ROs and answer the RQs. Furthermore, Creswell and Plano Clark, defined
mixed method research as [141]:
‘Deal[ing] with theoretical suppositions as well as ways/ processes of investigation to steer
the route of gathering and analyzing data by blending qualitative and quantitative techniques
in various stages of the study to carry out a better study of the issue compared with the use
of single methodology only.’
Further, Creswell and Plano Clark noted that mixing quantitative and qualitative
methods positively influences the research and is better than employing one method type
alone [141]. Mixing two methods allows the strengths of each type to cover the limitations
of the other. For instance, the detail provided by the qualitative approach can lend support
to the quantitative data. In addition, mixing method in research is more realistic, as it allows
participants to use both numbers and words in their perspectives and responses. Therefore,
in social science research problems specifically, both quantitative and qualitative data are
required for best outcomes [142].

CHAPTER 4-RESEARCH DESIGN AND METHODOLOGY
Page 72
4.3.1 Mixed Method Design Classification
Creswell and Plano Clark, through their comprehensive review of previous studies, aimed to
classify mixed method designs, identified the six most used mixed methods designs are
provide a useful framework for researchers attempting to design their studies [140].
Accordingly, Creswell and Clark recommend researchers to select a design that best matches
their research problems to ensure that the outcome of their study design is ‘rigorous,
persuasive and of high quality’. They introduced six mixed method designs, that is; the
convergent parallel design, the explanatory sequential design, the exploratory sequential
design, the embedded design, the transformative design, and the multiphase design.
In the convergent parallel design, the researcher uses quantitative and qualitative
approaches in parallel during the same phase of the research process. Both approaches have
the same importance to the research. In this approach, the analysis is independent for each
approach and the result from each approach is mixed during the final interpretation. The
explanatory sequential design involves the researcher first collecting and analyzing the
quantitative data that has priority for answering the RQs. Based on the outcome, the
qualitative phase is designed, followed by collection and analysis of the qualitative data. The
researcher then interprets how the qualitative results explain the quantitative results.
In contrast, in the exploratory sequential design, the researcher starts with collecting
and analyzing the qualitative data that has priority, to build up the results. Based on the
result of this phase, the quantitative phase is designed, followed by collecting and analyzing
the quantitative data to test the qualitative results. The researcher then interprets how the
quantitative results help to generalize the findings. Further, the embedded design sees the
researchers collecting and analyzing both quantitative and qualitative data within a
traditional quantitative or qualitative design approach.
In this approach, either the quantitative or qualitative data can be prioritized,
depending on the major design approach. In the qualitative design, or a minor qualitative
approach within the main quantitative design, the approach is to enhance the overall design
and support the findings of the main strand in some way. In addition, the approach can be
added before, during or after the main approach.
Meanwhile, the transformative design involves the researcher using a theoretical-
based framework. The design goes beyond the above four basic mixed method designs.
Researchers use the transformative design when seeking to address issues of social justice
and calls for change. The priority approach in this design could be quantitative, qualitative,
or equal, either in parallel or sequentially timed. The multiphase design goes beyond the first

CHAPTER 4-RESEARCH DESIGN AND METHODOLOGY
Page 73
four basic mixed method designs. This design can mix all four basics mixed method designs
over its duration. Each mixed method design can stand alone as a study, feeding into a
subsequent study. The multiphase design is usually used in long-term, large-scale research.
While discussing six basic mixed method designs, this research applied the embedded
mixed methods design which mainly depends on quantitative data, with qualitative data
playing a secondary role in supporting this research. Creswell, described the embedded
design approach as ‘giving less priority’, the secondary method (quantitative or qualitative)
is embedded, or nested, within the predominant method (quantitative or qualitative) [140].
This embedding may mean that the secondary method addresses a different question than
the primary method.
The purpose of the embedded design is to provide broader insights into the subject
of investigation than would be possible using the predominant method alone. Using the
embedded design, the researcher can collect two types of data simultaneously in a single
data collection phase [140]. This design is usually adopted when the researcher is
comfortable with the research being driven by one type of data as the primary orientation,
and does not have adequate resources to place equal priority on both types of data [141].
This research attempted to apply the embedded mixed method approach, where the
quantitative method was the primary approach, and the qualitative method was the
embedded approach, for enhancing, supporting and understanding the quantitative data.
Quantitative data was collected using design-based questionnaires and semi-structured
interviews. During this approach, some qualitative data was embedded to support and
explain the reasons behind the quantitative data. For instance, respondents were asked to
indicate their degree of awareness with the level of risk detectability by selecting a number
on a Likert type scale.
During the interviews, respondents were express asked to the reasons behind their
selection. These reasons constitute the embedded qualitative data to provide insight into
respondents’ quantitative judgements. While the quantitative data are the main data for the
analysis, the qualitative data helps to understand the phenomena behind respondents’ low
or high level of awareness and perceptions. The next phase of this research is the explanation
of the case study approach, to test and validate the developed conceptual framework and
analysis models. This following section explains the case study approach.
4.3.2 External Validity
The general design of this research is experimental where two important (often conflicting)

CHAPTER 4-RESEARCH DESIGN AND METHODOLOGY
Page 74
attributes needed to be considered carefully, that is; internal and external validity. The ability
of the research design to adequately test hypotheses is known as its internal validity.
Essentially, internal validity is the ability of the research design to test the hypothesis that it
was designed to test. Meanwhile, a study has external validity to the degree that its results
can be extended (generalized) beyond the limited research setting and sample in which they
were obtained.
Mook, noted that a the purpose of collecting data in the laboratory is to predict real-
life behavior in the real world [143]. Further, Mook pointed that much of the research
conducted in the laboratory is designed to determine one of the following:
- Whether something can happen, rather than whether it typically does happen.
- Whether something we specify ought to happen (according to some hypothesis)
under specific conditions in the lab does happen there under those conditions.
- What happened under conditions not encountered in the real world.
In each of these cases, the objective is to gain insight into the underlying mechanisms
of behavior rather than to discover relationships that apply under normal conditions in the
real world. Following the understanding from discussion above, this research adopts the
concept of external validity as part of the research design. In contrast, Bordens, K. S. and B.
B. Abbott, discussed the threats to external validity (Table 4-1) [135].
Table 4-1. Factors affecting external validity.
Factor Description Reactive testing Occurs when a pretest affects participants’ reaction to an
experimental variable, making those participants’ responses unrepresentative of the general population.
Interactions between participant selection biases and the independent variable
Effects observed may apply only to the participants included in the study, especially if they are a unique group.
Reactive effects of experimental arrangements
Refers to the effects of highly artificial experimental situations used in some research and the participant’s knowledge that he or she is a research student.
Multiple treatment interference Occurs when participants are exposed to multiple experimental treatments in which exposure to early treatments affects responses to latter treatments.
The question of external validity may be less relevant in basic research settings that
seek theoretical reasons to determine what will happen under conditions not usually found
in natural settings or that examine fundamental processes expected to operate under a wide
variety of conditions. The degree of external validity of a study becomes more relevant when
the findings are expected to be applied directly to real-world settings. In such studies,
external validity is affected by several factors. Using highly controlled laboratory settings is
one such factor. Nevertheless, data obtained from a tightly controlled laboratory may not

CHAPTER 4-RESEARCH DESIGN AND METHODOLOGY
Page 75
generalize to more naturalistic situations in which behavior occurs.
4.4 Case Study Approach
By using case study as a research design approach, researchers can explore and explain a
program, event, activity, process or one, or more individuals [144]. Schramm, defined case
study as an attempt to clarify ‘a decision or set of decisions’, why they were taken, how they
were implemented and with what result [145]. Yin, in turn, defined it as practical research
that examines an existing phenomenon in its authentic context, and which is particularly
useful when the borders between the phenomenon and its context are not apparent [146].
Yin also noted that case study is ‘a comprehensive research strategy’.
Furthermore, Babbie, stated that the most important reason for using case study as
the research design approach is that it is descriptive [138]. For this research, the case study
approach was used to explain how empirical framework and analysis models were
developed to assess and measure the level of UI system robustness capacity. Handling the
concept of stakeholders’ involvement in defining the UI system RA and REA elements results
in a better understanding of why risk is highly correlated with the level of UI system
robustness.
Currently, it is impractical to conduct an analysis for all elements of resilience due to
knowledge and time constraints. Therefore, the conceptual framework and analysis models
for evaluating the level of UI system robustness was tested through single UI sector case
study. To use case study as a form of research design, it is necessary to justify the case study
approach, the number of cases and the criteria for selecting those cases. The case study
approach can help to find replication logic in the research. The case study intends to test and
verify the applicability of the conceptual framework and analysis models proposes in this
research.
Moreover, the application to a real UI system case enables the usefulness and
practicality of the conceptual framework and analysis models to be tested. There are various
UI sectors which were noticed as crucial to the urban flow (refers to critical infrastructure-
CI). For instance; some of the UI sectors are; electricity, gas and oil, transportation and traffic,
water and sewage, energy, emergency services, finance and insurance, jurisdiction, space,
buildings, and food.
While there are plenty of UI systems, this research appointed the urban water supply
(UWS) infrastructure system as the case problem. The UWS system is the most valuable part
of the public infrastructure worldwide [147]. Urban utilities and municipalities are

CHAPTER 4-RESEARCH DESIGN AND METHODOLOGY
Page 76
entrusted with the responsibility of managing and expanding them for current and future
generations. Infrastructures inexorably age and degrade, while society places increasing
demands for levels of service, risk management and sustainability. The UWS infrastructure
as a case study which is in Indonesia (focus on Surabaya city) were selected non-randomly
to represent the problem boundary.
Specifically, the proposed empirical framework and model analysis applied to the
case of the Surabaya city (the second largest metropolitan city in Indonesia) water supply
infrastructure was used to test the method usability, applicability and reliability. In this
research, notably, the water supply infrastructure system in Surabaya city has been chosen
as a single case study in this research. The selected case study was expected to bring more
interpretations and results towards the research objectives and questions.
Despite being awarded as the leading public utility sector (water supply) in Indonesia,
the problems and challenges that the Surabaya water supply infrastructure system
confronted has been discussed in previous studies [148-152]. With the aforementioned
discussion, research aim and objectives, this research selected Surabaya UWS system as a
single case study based on the following criteria:
- It is the well-known fact that no development of any kind of infrastructure system and
urban flow can occur without water.
- Compared to other UI sectors, the study towards water supply infrastructure system
in urban areas is oftentimes underestimated and less noticed.
- The case of UWS infrastructure system, especially for Surabaya city, has high
community structure (stakeholder) complexities, which make stakeholder-risk
associated analysis more meaningful due to the relatively complex stakeholder
interests.
- There has not been any study previously attempted towards assessing the assessment
of risk in the context of impact especially for the case of Surabaya water supply
infrastructure system.
- There has not been any study previously conducted towards analyzing the UWS
system resilience based on the RA as the analysis foundation.
- Accessibility to collect the data necessary.
- Convenience and openness towards collecting the information beyond the survey.
Based on the criteria aforementioned, Surabaya city water supply infrastructure was
selected as the case study for the purpose of testing and validating the proposes conceptual
framework and analysis models. This case study is discussed detail in Chapter 6.

CHAPTER 4-RESEARCH DESIGN AND METHODOLOGY
Page 77
4.5 Research Ethics and Conduct
Before conducting data collection in the field, this research sought approval between the
Institutional Research Board (IRB) and the ethical code of the University of Melbourne. The
size and complexity of an IRB varies depending on the size of the institution and the type of
research that is conducted. In here, the IRB is composed of researchers, research panel
members, faculty and department board, and other professionals who understand the legal
and ethical standards that guide research.
As per the University of Melbourne policy, all research projects involving humans are
subject to prior review and approval by The University of Melbourne Human Research Ethics
Committee (HREC). Research involving human subjects cannot and must not proceed until
clearance and approval have been obtained. The researcher, who aimed to conduct research
involving humans as participants, submitted an application to the Melbourne School of
Design (Faculty’s) Human Ethics Advisory Group (MSD HEAG) for review, endorsement, and
approval.
Following these policy and rules, the researcher submitted a detailed description of
this research (research proposal) and conducted the ‘research confirmation’ by presenting
and answering a series of questions. The members of the IRB further reviewed the material
and then informed the researcher that this research may proceed. In the University of
Melbourne, for ethics purposes, research projects are classified as being either 'high risk' or
'low risk' depending on the nature of the enquiry being undertaken and the nature of the
participants.
As a general indication, projects involving children, persons undergoing medical
treatment or any person likely to be seen as vulnerable will be 'high risk'. Nonetheless, in
some cases, high-risk research which using specialized procedures, unique populations and,
or high-hazards risk assessed by the HREC requires special assessment. Meanwhile, research
projects involving consenting adults with non-controversial subject matter will be 'low-risk'.
Low-risk research projects generally take less time to approve than high-risk. This
research proposal was classified and passed the assessment by the HREC as a low-risk
research project which required a minor modification to parts of the research to protect the
rights of the participants. Once all things were considered appropriate, the fieldwork fund
was granted from the university for the researchers to do the data collection (Figure A-1).

CHAPTER 4-RESEARCH DESIGN AND METHODOLOGY
Page 78
4.6 Approaches and Strategies to Data Collection
As with all research, the selection of specific procedures represents a balancing act between
the need for information and the feasibility of the procedure. What follows is a review of the
data collection techniques this research applied. This section provides the reader with a
detailed description of how this research collected the data [135]. The goal of writing the
data collection approach and strategy section is to allow the reader to evaluate the
appropriateness of the data collection techniques this research adopted.
Importantly, this information will help the reader understand how the data relates to
research objectives and questions, and how the internal and external validity of this
research’s conclusions can be evaluated. Most method sections have three subsections in
which it is described; (1) How researchers identified and obtained the sample they studied,
(2) The materials, equipment, and measures researchers used to collect the data, and (3) The
specific procedures researchers followed during the research (e.g., permit/application letter
in Bahasa which depicts in Figure A-2).
Furthermore, another important aspect is the necessity of voluntary informed
consent which is the hallmark of all research involving human participants. Researchers
cannot coerce or force people to participate in any research. For all human research, the
researcher must show that the people who participate in the study did so of their own free
will. In addition, the participants must understand that they are free to withdraw from study
at any time and for any reason without penalty [12]. Unlike other research forms which apply
and delivery an informed consent contract to the participant candidates, this research offers
all of the participants the Plain Language Statement which is discussed below.
4.6.1 Plain Language Statement (Cover Letter)
Since this research needs to construct and apply the design-based questionnaire to obtain
the data needed, the next step is to write the Plain Language Statement (PLS) to accompany
the questionnaire. The PLS is a clear and succinct description of the research project and the
nature of participation. Furthermore, a PLS is essential to enable participants to make an
informed decision on whether they will take part in the project. The letter should explain the
purpose of the questionnaire in order to encourage a high response. The content of the
covering letter is particularly in postal questionnaires because it is the only way to persuade
the subjects to respond the questionnaire. Nachmias and Nachmias [153], wrote:

CHAPTER 4-RESEARCH DESIGN AND METHODOLOGY
Page 79
‘A cover letter must succeed in overcoming any resistance or prejudice the respondent may
have against the survey. It should; (1) identify the sponsoring organization or the persons
conducting the study, (2) explain the purpose of the study, (3) tell why it is important that
the respondent answer the questionnaire, and (4) assure the respondent that the
information provided will be held in strict confidence.’
Researchers generally need to obtain the prior informed consent of participants
before involving them in this research project. Prospective participants are given
information about this research in the form of the PLS, and their consent is recorded by their
signature on a consent form.
In this research, a PLS was written in plain, simple language in a style appropriate for
the intended participants. A generic PLS template has been designed by the University of
Melbourne to assist researchers in preparing their own statement. Nonetheless, this
research modifies the template to reflect the needs of this project. The PLS developed in this
research can be seen in Appendix A within this dissertation. The developed PLS follows the
standard PLS guidelines;
- Clearly identify the University of Melbourne (i.e., by prominent placement of the
University’s logo) and the department(s)/ school(s)/faculty(-ies) involved. If printed,
the PLS should be on a University of Melbourne letterhead.
- Clearly identify the title of the project, and the name(s) and contact details of the
Principal Researcher and Other Researchers.
- Clearly explain the purpose of the research project.
- Clearly explain what participants will be asked to do and provide an estimated time
commitment.
- Clearly explain any risks arising from participation, as well as any procedures or
measures in place to minimize such risks.
- Describe any expected benefits to the wider community. If applicable, also describe
any expected benefits to participants.
- State that involvement in the project is voluntary and that participants are free to
withdraw from participation at any time. Explain any implications of withdrawal,
including whether it will be possible for participants to withdraw any data already
collected from or about them.
- Describe the arrangements in place to protect the confidentiality of participants’ data
and advise participants of any legal limitations to such confidentiality. If the sample
size for the project is small, advise participants that this may make them identifiable.

CHAPTER 4-RESEARCH DESIGN AND METHODOLOGY
Page 80
- The project HREC number (which is the ethics ID number assigned by Themis) and
the date and version number of the PLS must appear on the PLS. If the PLS is printed,
put this information in the footer.
- Explain what will happen to participants’ data after the research project ends (i.e.,
how long it will be retained, whether it might be used again for future research and if
so who would have access).
- Include the following statement:
“This research project has been approved by the Human Research Ethics Committee of The
University of Melbourne. If you have any concerns or complaints about the conduct of this
research project, which you do not wish to discuss with the research team, you should contact
the Manager, Human Research Ethics, Research Ethics and Integrity, University of Melbourne,
VIC 3010. Tel: +61 3 8344 2073 or Email: [email protected]. All
complaints will be treated confidentially. In any correspondence please provide the name of the
research team or the name or ethics ID number of the research project.”
If any participants will be in a dependent relationship with any of the researchers,
state that decisions about participation will not affect the dependent relationship. Another
specific requirement applies in the PLS developed for this research:
“The project will have nothing to do with your carrier.”
In some contexts, a PLS may need to vary from the expected format to accommodate
recruitment of cultural groups with different ethical expectations and assumptions. Prior to
the data collection, the developed PLS is attached into the first page of questionnaire set. The
PLS built and applied for this research can be seen in Figure A-3 and A-4.
4.6.2 Confidentiality and Anonymity of Participants
All information/data that this research collected is confidential. Confidentiality means that
the identity of all participants remains a secret. In most cases, confidentiality is easy to
preserve. To maintain confidentiality, this research used a unique but meaningless number
to identify each of the participants (see Appendix B for the questionnaire both in English and
Bahasa). In addition, this research publishes its result by typically presenting the data as
averages across (stakeholder) groups rather than highlighting the performance of individual
people along with their names and home addresses.

CHAPTER 4-RESEARCH DESIGN AND METHODOLOGY
Page 81
Confidentiality is required by this research interest and IRBs (HREC) for research
with human participants. It is important to realize, however, that confidentiality and
anonymity are not the same thing. Whereas confidentiality refers to the protecting of
information provided by your research participants, anonymity refers to the participants
identity protection. This research applies the anonymity towards the data collection.
Meanwhile, true anonymity is rare, and is only achieved when the research project collects
no personally identifying information from participants. Such information could include
names, personal data (such height, weight, age, sex), and even personality characteristics.
4.6.3 Questionnaire and Interviews Design Arrangement
Although the general research objectives should be generated before choosing the specific
research technique or data-gathering procedure, it is often the case that the data collection
method chosen will influence the way the researcher ask the questions. For this reason, the
question this research asked can be open-ended or close-ended question design, allowing
respondents to tell us as much or as little as they wish. The design-based questionnaire
developed in this research adopts the ‘closed-response question’ design.
The primary feature of the closed-response question is that the researcher supplies
the responses options for the participants in the field [12]. The questionnaire developed in
this research consists of four main parts. In the first part, the respondent will be asked to
provide general data needed, such as; the demographical information (age, education level,
occupation, institution name and related position, work experience, phone number and
email). In the second part of the questionnaire, the numerical responses question format is
adopted.
The numerical responses format (often referred to as the Likert format) is one of the
most popular options for the closed-response format questionnaire for two primary reasons
[12]. First, it offers a clear and unambiguous ordinal scale of measurement. Second, this type
of question format can be used to the same format for many different questions. Therefore,
researchers can combine the responses to multiple questions to yield an overall or average
score [12]. In this research, participants are asked to rate the risk decision factors
measurement determined previously (occurrence, severity and detectability) for each of the
risk events using the Likert scale (between 1-10) by circling the Likert scale for each risk
decision factors available.
In the third part of the questionnaire, participants asked to choose their best position
as the stakeholder in the context of the UI system discussed in this research. The third part

CHAPTER 4-RESEARCH DESIGN AND METHODOLOGY
Page 82
of the questionnaire adopts the ‘category response question format’. In here, the category is
the UI system stakeholder groups identified and determined previously. The answer options
for this category represent a stakeholder groups category that each participant represents.
In this research, the question treats the options as mutually exclusive and forces the
participants to select only one category.
In the last section of part three, participants are given a chance to describe another
stakeholder group and its technical function which they represented but was not stated
within the questionnaire. The fourth part of the questionnaire is composed of two subparts
which each of them interrelated. In the first subpart, participants were asked to make a
choice of what kind of risk event would threat or even affect them personally (the risk
occurred previously or might occur in the further time). For this question, the participant
can give their preferences by giving a tick in the blank box sheet (√) provided.
For the second subpart question, participants were asked to state; ‘what stakeholder
group would be affected by each of the risk that participants have chosen in the first subpart
question previously’ by giving a tick (√) in the stakeholder groups category provided. In the
end of the questionnaire section, participants are given a chance to express their thoughts
towards this research and the questionnaire following the open-ended question design. The
design-based questionnaire discussed and applied in this research can be seen in Appendix
A. Furthermore, another approach to data collection applied in this study was interviewing
the participant.
There are many ways of interview strategies within the research processes, ranging
from face-to-face interviews to questionnaires sent through the mail or administered over
the internet. This research employs the personal interview, especially face-to-face interviews.
The face-to-face interview was adopted since it tends to encourage a high degree of
cooperation by participants. In addition, people are likely to answer an interviewer’s
questions instead of checking the ‘Don’t know’ box on a questionnaire. This should not be
terribly surprising, after all, it is difficult to skip or ignore a question when other participants
ask a direct question.
Other advantages of this method of measurement are that the interviewer
(researcher) can ensure that the participant understands the questions and asks follow-up
questions to clarify participants’ responses. In summary, personal interviews can yield a
great deal of rich information. There is no single format for the personal interview.
Interviews can be highly structured or unstructured. Similarly, the interview may be limited
to two people or may involve a small group [12]. The questionnaire designed and used for

CHAPTER 4-RESEARCH DESIGN AND METHODOLOGY
Page 83
collecting data from the participants for this research can be seen in Appendix B in this
dissertation.
4.6.4 A Pilot Study
Whenever construct a questionnaire for research, it is advisable to complete a pilot study
before collecting the final data from the whole sample. A pilot study provides a trial run for
the questionnaire, which involves testing the wording of the question, identifying ambiguous
questions, testing the technique applied to collect the data, measuring the effectiveness of
the standard invitation to respondents, and so on. Bell, described a pilot study as [154];
‘Getting the bugs out of the instrument (questionnaire) so that subjects in your main study
will experience no difficulties in completing it and so that you can carry out a preliminary
analysis to see whether the wording and format of questions will present any difficulties
when the main data are analyzed.’
Bell (ibid.) went further and noted that you should ask your guinea pigs the following
questions: (1) “How long did it take you to complete?”, (2) “Were the instructions clear?”, (3)
“Were any of the questions unclear or ambiguous? If so, will you say which and why?”, (4)
Did you object to answering any of the questions?”, (5) “In your opinion, has any major topic
been omitted?”, (6) “Was the layout of the questionnaire clear/attractive?”, (7) “Any
comments?”.
This research conducted the pilot study prior to disseminating the final design-based
questionnaire to the whole population. A number of prospective participants were asked to
fill the preliminary design-based questionnaire and interviewed towards the questionnaire
they answered. Around five participants consisting of both experts and laypeople agreed to
do the pilot study. Following the comments, the design was in some way revised and modified
in order to build a better format and better content for the questionnaire.
4.6.5 Public Verification and Systematic Observation
Public verification is another important feature of empirical research. Using the empirical
method requires this research to rely on researcher senses when gathering data. If designing
the research so that it can be publicly verified, then this research is measuring things in a
way that others can replicate with similar results. Therefore, public verification implies that
anyone who uses the same procedure should be able to observe the same general outcome.
Public verification also means that anyone with the appropriate equipment can repeat an

CHAPTER 4-RESEARCH DESIGN AND METHODOLOGY
Page 84
experiment.
The facet of public verification is extremely important. The ability to repeat or
replicate experiments gives the researcher greater confidence in the general applicability of
the results. The more times the researcher (or concerned people) can repeat an experiment
and obtain similar results, the more likely this research is pivotal and not just due to chance.
Further, systematic observation refers to the way we go about collecting information.
In the data collection, this research intends to make the observations under specific
conditions, ruling out alternative explanations for the outcomes this research analysis might
be observing. Finally, the overarching goal of systematic observation is to examine a
particular phenomenon under as many relevant situations as possible. In this research, once
the analysis and output were produced, the author conducted another interview to the
determined experts (and lay people) to discuss and obtain more interpretations of the result.
In addition, interview can be one of the most important sources of information for research
that adopts a case study approach [146, 155].
Yin, mentioned that semi-structured interviews are often used to maximize the
flexibility of the interview and provide the capability to shape the interview to suit
individuals [155]. Semi-structured interviews allow the researchers to follow interesting
and unexpected points raised by participants to collect further information on those points.
This style of interview also enables the researcher to seek explanations to findings from
earlier-administered quantitative questions. Moreover, semi-structured interviews are
guided by pre-formulated written questions that are designed to extract information of
research interest, with participants’ answers recorded following specified protocols [156].
4.7 Population Arrangement and Sampling Methods
Sampling is a critical component of any research project [135]. Consequently, researchers
need to define the sampling population and the procedures for creating the sample. The
purpose of a research usually dictates the characteristics of the sample that researchers
should describe. At very least, researchers need to indicate the number of men and women
in the study as well as the average age of the participants. If the research depends on specific
subject variables (e.g., ethnicity, level of education, annual household income), then
researchers should summarize those characteristics as well.
In addition to indicating how the research recruited and selected the participants,
researchers should describe whether and how to compensate or reward them. Similarly, the
research should indicate whether and why researchers lost the data for any member of the

CHAPTER 4-RESEARCH DESIGN AND METHODOLOGY
Page 85
original sample. Mistakes happen. Sometimes the equipment does not work, the researchers
makes a mistake, or the participant does not understand the instructions or refuses to
complete the study. Report errors like these if they occur. As with human research,
researchers should then describe additional subject variables that related to the purpose of
respective research.
4.7.1 Sampling Strategy Applied
Creswell, differentiated between two general types of sampling strategy: random and
purposeful [140] . Random sampling fits better with a quantitative research approach aimed
at generalizing findings to a population, as it attempts to seek for statistical generalization
through the selected individuals. Conversely, purposeful sampling is not random;
researchers intentionally select participants and/or specify the fields in which certain
phenomena can be studied.
Purposefully sampling is defined as selecting a participant or a group of participants
according to the specific inquiries or objectives of the study, and in accordance with
participants’ profiles [157]. Purposeful sampling, also known as judgmental or selective
sampling [158, 159], is used in this research. This is the most common sampling strategy for
this type of research, with the researchers selecting the most productive sample to answer
the research questions [158].
Marshall, M. M., also stated that ‘this can involve developing a framework of the
variables that might influence an individual’s contribution and will be based on the
researcher’s practical knowledge of the researcher area, the availability literature and
evidence from the study itself’ [158]. Purposeful sampling allows the researcher to
intentionally choose participants who can provide information about a certain fact to be
studied. It is suitable for research that uses a case study approach in an attempt to seek
analytical generalization, as is the case in this study.
Although purposeful sampling is classified for use with the qualitative approach [140,
157], based on the logic that the sample size will be small compared to if traditional
qualitative sampling strategies were used, it was found that this sampling method was
appropriate for all phases of the research. Nonetheless, random sampling would prohibit a
focus on the target demographic and prevent collection of the data necessary to achieve the
aim of this research [160]. Thus, participants were selected non-randomly, by virtue of their
position, work experience and background knowledge, using purposeful sampling and
snowballing strategies.

CHAPTER 4-RESEARCH DESIGN AND METHODOLOGY
Page 86
4.7.2 Judgmental or Purposive Sampling
Because the populations in this research are extremely large (UI system stakeholder, which
is urban community), it is impractical or impossible to truly sample from the population.
Consequently, this research uses a sample drawn from a sampling frame or subset of the
larger target population. Ideally the sampling frame would be a complete list of every
member of the population, but in the real world it is usually a subset of the target population
to which the researcher has or can gain access.
The final sample itself in this research is a random selection from this sampling frame
or another subsample of the population that is based on convenience. The sample that a
researcher settles on is a representative subset of individuals drawn from the sampling
frame, which is a representative subset of the more general population. The logic of sampling
applied in this research is deceptively simple. First, take a representative sample from the
sampling frame. The representative sample should be manageable in size and share the same
characteristics as the sampling population. However, in this research, this requirement is
insurmountable to be met.
Next, conduct the study and collect the data. In this research, the sample is assumed
to be the population representative. Thus, it can be concluded that ‘what is true of the sample
will be true of the population’. The description of using samples in this research to generalize
about the population sounds simple and straight forward. Apart from the size of a sample, to
be useful, samples must also actually represent the population. Because this research intends
to generalize the population, a sampling design need to ensure that the sample is an accurate
model of the population.
4.7.3 Convenience and Snowball Sampling
Another sampling method applied in this research is convenience sampling, which is the
most common type of nonprobability sampling. In contrast to probability sampling,
convenience sampling means that the researcher uses members of the population who are
easy to find. Interviewing lay people who know each other or people who walk by a
particular street corner are examples of convenience sampling. In this case, this research
allows the individual’s behavior to determine who will, and more importantly who will not,
be a part of the study participants.
For convenience sampling, the individuals’ behaviors determine whether they could
become part of a study’s sample. Consequently, convenience sampling can bias the results

CHAPTER 4-RESEARCH DESIGN AND METHODOLOGY
Page 87
and interpretation of the data [12]. Despite these drawbacks, however, there are times when
a convenience sample may be the only way to collect the data. Many good research studies
have been done using a convenience sample. However, the specific results of any one
particular study may be an artifact of the sample.
The growth of science is dependent on a body of knowledge that builds on preexisting
research. This is especially true for convenience samples, and the results of individual
studies should be examined in light of existing and future research. Since the stakeholders of
particular UI system (which is determined as case study) consists of both experts and lay
people from different level and institution, therefore applying convenience sampling in the
data collection processes is less appropriate and difficult to obtain important participants.
This reason emerges because of the lack of researchers’ capacity to reach and identify
important stakeholders, and to meet them in order to do the survey and the interview.
Moreover, the participants in this research, which is referred to as a cohort, can sometimes
share a particular feature. Sometimes the members of a cohort are difficult to find and recruit
for research. The members of the cohort may wish to remain anonymous, or there is no list
identifying the members of the cohort. In this research, the researcher wishes to access a
population to which he or she would not normally have access.
In such situations, thus, this research uses the snowball sampling [12]. To sample
from the cohort, this research needs to find a member of the cohort and use him or her
(respective participant) to find other members of the cohort. In this research, further,
Snowball sampling has been applied successfully to study human behavior in populations as
diverse as gangs, employees of specific business, and illicit drug users.
4.7.4 Survey Participants
The sample is the consequence of the procedure this research uses to collect the data. A
sample can be determined as representative of a population by examining the methods used
by the researcher to collect the data. As mentioned earlier, the population for this research
is the individual within the stakeholder groups of the specific UI system determined as a case
study to be analyzed in this research. Following the selected case study mentioned in
previous Chapter, thus the population of this research is indeed the whole Surabaya city
people who nominated and grouped within the stakeholder groups determined. However, it
is impractical to do fieldwork in which the participant comes from all of the Surabaya city
people.
Therefore, this research applied the non-probabilistic sampling which also considers

CHAPTER 4-RESEARCH DESIGN AND METHODOLOGY
Page 88
the aspect of ‘cluster sampling’ procedures to towards the data collection processes. Cluster
random sampling is another variation on simple random sampling [12]. Simple random
sampling is the most basic of the sampling procedures. Simple random sampling occurs
whenever each member of the population has an equal probability of selection. The steps
involved in conducting a simple random sample are clear-cut. First, estimate the size of the
population. Next, generate random numbers to determine which members of the population
to select. In the final stage, collect the data and conduct the study.
Further, cluster sampling is defined as a sampling technique in which the population
is divided into already existing groupings (clusters), and then a sample of the cluster is
selected randomly from the population. The term cluster refers to a natural, but
heterogeneous, intact grouping of the members of the population. Technically, random
numbers are independent of each other. Independence means that each number has an equal
chance of selection and the selection of one number has no effect on the selection of another
number.
This research wishes to include a sample of each stakeholder group in the sample. In
order to not bias the sample, the size of the subgroups in the sample should equal the relative
size of the subgroups in the population. Nonetheless, this research exempted the
requirement as it is impractical in the field. To conduct the cluster sampling, first step is to
identify the specific stakeholder groups in the population and attempt to estimate their
relative size. Next, the researcher can use simple random or sequential sampling within each
subgroup. The result is a representative sample. Notably, however, the size of the stakeholder
groups in the sample will not be the same relative size as the population.
4.8 The Time Dimension Design
This research followed the embedded mixed methods design as its research strategy, with
case study applied to test and provide explanation, and validation towards the proposed
empirical framework and analysis models. In this section, the time-related options that pass
over all the previous considerations concerning the research design and strategies are
discussed. Time plays a significant role in the research design and execution. Importantly,
mixed-method strategies differ in two major aspects: the time sequence of data collection
and the type of data (that is quantitative or qualitative).
To identify the appropriate approach to investigate the research problem,
consideration towards two aspects aforementioned should be clear. Regarding the time
sequence of data collection, research design is classified into cross-sectional sequential

CHAPTER 4-RESEARCH DESIGN AND METHODOLOGY
Page 89
design and longitudinal design [12, 135, 138]. A cross-sectional sequential design involves
collecting data at one point in time. This design is suitable for researchers conducting large-
scale surveys on many variables and from participants who are demographically dispersed.
On the other hand, a longitudinal design is suitable for researchers conducting in-depth
interviews and observations. This design becomes cumbersome in quantitative studies
which use large-scale surveys.
Due to time constraints, research objectives and researcher limitations, this research
applied the cross-sectional sequential design; as longitudinal design requires data to be
collected over a long period which was not appropriate for current research. The cross-
sectional sequential design is an alternative method that allows the researcher to examine
developmental transitions over a shorter period of time. In addition, an advantage of the
cross-sectional design is that it permits researcher to obtain useful developmental data in a
relatively short period of time.
In this research context, even though UI system risk may or may not have happened
during its’ life time, this research aimed to develop a conceptual framework which consist of
various analysis models which are useful as evaluation tools for measuring UI system
robustness within the specific range of time. Specific point of time was chosen in the data
collection, risk, robustness and recovery analysis models conducted. This due to at this point
(it is assumed) experts and DMs need to decide the mitigation plan and resilience strategy
towards developing the UI system back better. Therefore, this research collected data cross-
sectionally at the ‘non-specific’ UI system life time phase. During the data collection,
stakeholders asked to state their perception towards risk events impact level at that point in
time of the UI system provides its serviceability to urban community.
4.9 Empirical Analysis Methods and Techniques Applied
Empirical analysis involves gathering of data by observation and experimentation with the
goal of learning something. One important characteristic of empirical analysis is that is
involves measurement, or the converting of observations into numbers. There are different
types of measurement, but just about all can be grouped as either self- or other observation,
in which researchers use his own senses or someone else uses his or her own senses to
collect information on how community interact with their environments.
Empirical methods are not the only way to gain insight into challenging questions.
Within the social science, just about everything people “know” has come from scientists’
efforts to observe and experience the phenomena of interest. Mathematicians, for example,

CHAPTER 4-RESEARCH DESIGN AND METHODOLOGY
Page 90
do not use empirical analysis, but instead discover new ideas using deduction and formal
proofs [12].
This research utilized and integrated a number of analysis approaches following with
the modeling and simulation methodologies, such as; Failure Mode Effect and Criticality
Analysis (FMECA), Fuzzy-set theory and Social Network Analysis (SNA). The FMECA applied
to calculate and measure the risk magnitude based on the determined risk decision factors.
Then, the Trapezoidal Fuzzy Number (TFN) applied within the processes of FMECA method
with the intention of accommodates the divergent perceptions and judgments made by
people (both experts and lay people) towards valuing risk decision factor.
Further, as several novel RA models also develops, this research applied the SNA
method in order to model, simulate and analyze several issues of risk impact mechanisms
mentioned in Chapter 3 previously, that is; the risk impact causality and interaction pattern,
and the impact of risk to the urban community. By applying the SNA method, the simulation
can theoretically illustrate, exhibit and clarify towards risk events dynamic behavior. This
can be obtained based on how risk events affect and interact with others by its impact within
specific risk network. The theoretical and discussion towards those methods in general can
be seen below.
To conduct the UI system REA (which focus on the system robustness analysis), this
research applied the empirical experiments (computational simulation) in the last phase of
the conceptual framework. The value of the true experiment is that it allows us to control
and remove potential threats to internal validity. Specifically, the true experiment allows
researchers to ensure that the independent variable comes before the dependent variable,
that the independent and dependent variables are related, and that this research can account
for alternative explanations.
Three critical features set a true experiment apart from other research methods: (1)
The independent variable is a manipulated variable under the researcher’s control, (2) The
researchers use random assignment to place individuals into the different research
conditions, and (3) The researchers can create one or more control conditions. The hallmark
of a true experiment is that the researcher directly controls or manipulates the level of the
independent variable. In the other research designs, the researcher might use subject
variables that he or she cannot control as the independent variable under study.
By contrast, in the true experiment, the researcher can select a truly controllable or
manipulable independent variable that can be applied over different experimental
conditions to examine its effects on an outcome of interest. This research adopts a

CHAPTER 4-RESEARCH DESIGN AND METHODOLOGY
Page 91
quantitative independent variable which is a variable represented by an ordinal or more
sophisticated type of measurement scale. Therefore, this research has an ability to control
over the treatment condition that participants experience. Random assignment is another
necessary component of the true experiment. Random assignment occurs when each
participant in an experiment has an equal chance of experiencing any one of k-number of
possible research conditions.
4.9.1 Failure Mode Effect and Criticality Analysis Method
To measure the risk magnitude, this research applied one of the most recognized RA method
called Failure Mode Effect and Criticality Analysis (FMECA). In some studies, the method has
appeared under different names and with somewhat different content. The FMECA is a
complex engineering analysis methodology used to identify potential failure modes, failure
causes, failure effects and problem areas affecting the system’s or product’s mission success,
hardware and software reliability, maintainability, and safety [161]. The method is based on
a session of systematic brainstorming aimed at uncovering the failures that might occur in a
system of process [162].
The FMECA also provides a structured process for assessing failure modes and
mitigating the effects of those failure modes through corrective actions [163]. Moreover,
FMECA is an analysis technique for defining, identifying and eliminating known and/or
potential failures, problems, errors and so on from system, design, process and/or service
before they reach the customer. The strong points of the FMECA are that it gives a systematic
overview of the important failures in the system and that it forces the designer to evaluate
the reliability of their system. In addition, it represents a good basis for more comprehensive
quantitative analyses, such as fault tree analyses and event tree analyses.
Moreover, the main objective of FMECA is to identify potential failure modes, evaluate
the causes and effects of different component failure modes, and determine what could
eliminate or reduce the chance of failure. The results of the analysis can help analysts to
identify and correct the failure modes that have a detrimental effect on the system and
improve its performance during the stages of design and production. Nonetheless, FMECA
gives no guarantee that all critical components failures have been revealed. Through a
systematic review such as FMECA, most weaknesses of the system as a result of individual
component failures will, however, be revealed.
The FMECA procedure starts by analyzing all of the systems step by step; that is, by
examining the system and sub-system functions. The system elements of FMECA and its

CHAPTER 4-RESEARCH DESIGN AND METHODOLOGY
Page 92
description including;
• Potential failure modes and causes: The failure (or risk) of particular system of UI sector
should be defined clearly.
• Potential effect of failures: The consequence of each failure mode (risk events) should be
carefully examined and recorded.
• Failure detections and compensation: All of the failures, risk events should be corrected
to eliminate the cause and to maximize reliability.
• Assigning severity, occurrence and detection: The current research risk event ranking is
developed based on the risk decision factors.
Furthermore, the main advantage of FMECA method is that is capable producing the
magnitude level of risk in the numerical value so that DMs can easily interpreting the result
confidently and build the further risk mitigation strategies. Another advantage is that FMECA:
it is widely used and easy to understand and interpret; provides a comprehensive hardware
review; suitable for complex system; flexible such that the level of detail can be adapted to
the objectives of the analysis; systematic and comprehensive. The method represents a
systematic analysis of the components of the system to identify all significant failure modes
and to see how important they are for the system’s performance.
FMECA divides up into design and production. Potential latent problems can be
analyzed, possible defects can be pinpointed before they are passed on to the customer, their
effects on the overall system can be studied and the right control decisions can be taken, in
either of these two stages [162]. However, FMECA method can be unsuitable for analyzing
systems with much redundancy (several components that can perform the same function
such that failure of one unit does not result in system failure). In such systems, it will not be
so interesting to analyze individual components failures, since these cannot directly affect
the function of the system.
Following the UI system complex problem circumstances in the real world, further,
the interest is then focused on combinations of two or more events that together can cause
system failure. The analysis of multi-risks using FMECA method has been applied to many
study areas. For instances; Wall, M., et al. explained how to utilize FMECA for Floating
Production, Storage and Offloading (FPSO) of vessels and other Floating Storage Units (FSUs)
[164]. Vinnem, J. E., et al. after classifying FMECA as a qualitative RA, gave many examples of
offshore accidents lessons learned from past experiences [165]. Another studies applied
FMECA method to analyze the risk or failure event can be seen in [162, 166-168].
In addition, the study on assessing the risk in the context of UI system still received

CHAPTER 4-RESEARCH DESIGN AND METHODOLOGY
Page 93
little attention in the academia field. According to FMECA, the risk priorities of failure modes
are generally determined through the Risk Priority Number (RPN), which assesses based on
risk decision factors. Nevertheless, based on the literature review previously, assessing risk
based solely on its magnitude (which is measured by its risk decision factors) is definitely
not enough and too rough, affecting further decision output.
The traditional observation of FMECA based on crisp RPN is not supportive and
robust enough in priority ranking of failure modes. Of the shortcomings described in the
reviewed literature, the ones that have received significant attention from the literature can
be seen as being risk factor and RPN related issues. For instance, the relative importance
among the three risk decision factors, that is occurrence (O), severity (S), and detection (D),
is not considered. Different combinations of O, S and D may produce the same value of RPN;
and the risk decision factors are difficult to be precisely estimated.
Further, there’s no study that even standardized the combination of the risk decision
factor to measure the RPN. This research determined to apply the three risk decision factors
aforementioned. The occurrence factor measures the likelihood of a failure mode being
occurred. The severity is the expected consequence of the failure. The ability to realize the
error before its consequences affect the costumers, is measured by the detection factor
(detectability).
Various scoring guidelines exist, and in this research, the RA model uses the 10-point
linguist scale for evaluating the O, S and D factors, as suggested and applied in many
applications of FMECA [105, 161, 167-171]. The ability to realize the error/ failure/
disturbance before its consequences affect both the system and community is measured by
the detection factor. Then, the RPN is conventionally defined as;
( ), ,f O S D
O S D
=
=
RPN
(5-1)
Even though FMECA has been seen as robust method towards analyzing failure on the
respective system, a number of FMECA limitation has attracted many authors in the research
fields. Liu, H.-C., L. Liu, and N. Liu, reviewed 75 FMECA papers published between 1992 and
2002 in the international journals and categorized them according to the approaches used
to overcome the limitation of the conventional RPN method [172]. Perhaps the main
disadvantage of using the FMECA method is that; first, all components are analyzed and
documented, also the failures of little or no consequences.
Another drawback of FMECA is the method just considers subjective judgment when

CHAPTER 4-RESEARCH DESIGN AND METHODOLOGY
Page 94
single expert deliberates his/her opinion towards judging the risk decision factor. To
comprehensively analyze the UI system risk, it is impractical to homogenize all experts and
decision makers (DMs) approach and policy [38]. The analysis of UI risks considering multi-
experts (both lay people and experts) engagement is of great issue which need to take in
order to produce reliable output. Even using the mean value to accommodate multi-experts
judgments, nonetheless, the analysis output is insufficient and unreliable [79, 173].
To deal with the issue of divergent stakeholder perceptions and judgments when they
assess risk decision factors, some studies proposed and applied other substitute methods,
such as; Fuzzy theory [172, 173]. Currently, the Fuzzy methods and linear programming
method have been proposed as an effective solution for the calculations of Fuzzy RPNs [168].
Based on the observed and surveyed literature, Fuzzy rule-base system is the most popular
method for prioritizing the failure modes [172].
Following the previous discussions, this research therefore utilized and applied the
Fuzzy theory within conventional FMECA processes towards accommodating divergent
stakeholder judgments. Considering the subjective aspect of the decision risk factors valued
by stakeholders, this research adopts a Fuzzy assessment for each risk decision factors (O, S
and D elements) using a specific scale for each risk decision factors. The Fuzzy-based
methods proposed in the FMECA improves the accuracy of the failure criticality analysis by
compromising the easiness and transparency of the conventional method. The detail
explanation of Fuzzy-set theory and further Fuzzy-based FMECA is deliberated in next sub-
sections.
4.9.2 Fuzzy Theory
People perceptions and judgments towards valuing risk decision factors is the main and
crucial input within the process of RA in order to produce robust RA output. Nonetheless, it
should be noted that people’s perception and judgment are dissimilar and divergent due to
influence by their sociocultural aspects. The assessment on how the information gathering
and exchange objectively can support recognizing the resultant mix of risk perceptions.
To accommodate people judgments towards giving adjustment of risk decision factor
this research has applied Fuzzy-set theory. According to Pedrycz, Ekel, and Parreiras, the
Fuzzy set theory is one of the most fundamental concepts of science and engineering,
because it can manage inaccurate information by manipulating mathematical terms [174].
The notion of Fuzzy sets is quite intuitive and transparent as it captures the essence of how
things are perceived and described in everyday life.

CHAPTER 4-RESEARCH DESIGN AND METHODOLOGY
Page 95
The concept of a Fuzzy set manages the representation of classes/categories that has
boundaries that are ill-defined or flexible by means of characteristic functions taking values
in an ordered set of membership values [175]. Therefore, Fuzzy set A is, by definition, the
membership function that maps the elements of the universe X to the unit interval [0,1], as
follows [175]:
0 1: [ , ]A X → (5-2)
A Fuzzy set A in X is therefore characterized by a membership function ( )
Af x
,
which associates each point X with a real number in the interval [0,1] with a value of ( )
Af x
representing the association level of X with the set A . Therefore, the closer to one the
value of ( )
Af x
is assumed to be, the greater the membership of the element X is to the set
A [175]. Assuming that A reflects a preference for the values of a variable x in X and
because x is a decision variable and the Fuzzy set A is an elastic constraint characterizing
the feasible values and the DM’s preferences, ( )
Af v
denotes the degree of preference in favor
of v as the value of x . This interpretation prevails in Fuzzy optimization and decision
analysis [174].
The form of the membership functions reflects the problem at hand for which the
Fuzzy sets are constructed. It is also essential to assess the type of Fuzzy set from the
standpoint of its suitability for managing the ensuing optimization procedures [174]. The
most commonly used categories of membership functions all defined in the universe of real
numbers are: triangular, trapezoidal, Gaussian, and Exponential-like membership functions.
A trapezoidal Fuzzy number A , which is used in this research, can be described according to
its membership function as follows:
( )
1
1
1 1
1 1
1 2
2
2 2
2 2
2
0 if
if
1 if
if
0 if
,
,
,
A
x a
x aa x b
b a
x b x b
x ab x a
b a
x a
− −
= −
−
(5-3)
where, A can also be represented by ( )1 1 2 2
, , ,A a b a b= as depicted in Figure 4-2
below.

CHAPTER 4-RESEARCH DESIGN AND METHODOLOGY
Page 96
Figure 4-2. Trapezoidal Fuzzy set of number A . (Source: Figure from: Silva, M. M., et al. [161]).
If 1 2,
MA b b a= = = A is a triangular Fuzzy number:
( ) ( )1 2 1 2, , , , ,
M M MA a a a a a a a= =
.
Further, basic operations of Fuzzy set theory can be reviewed below. They are extensions of
the corresponding crisp numbers, supporting the determination of the Fuzzy number. For
more details, see [174, 176, 177]. Let ( ) ( )1 1 1 2 2 2 3 3 4 4
and , , , , , ,A a b b a A a b b a= = be two non-
negative trapezoidal Fuzzy numbers then:
( ) ( )
( )1 2 1 1 2 2 3 3 4 4
1 3 1 3 2 4 2 4
+
, , , , , ,
, , ,
A A a b b a a b b a
a a b b b b a a
+ =
= + + + + (5-4)
( ) ( )
( )1 2 1 1 2 2 3 3 4 4
1 3 1 3 2 4 2 4
, , , , , ,
, , ,
A A a b b a a b b a
a a b b b b a a
− = −
= − − − − (5-5)
( ) ( )1 1 1 2 2 2 2 1 1
, , , , , ,A a b b a a b b a− = − = − − − − (5-6)
( ) ( )
( )1 2 1 1 2 2 3 3 4 4
1 3 1 3 2 4 2 4
, , , , , ,
, , ,
A A a b b a a b b a
a a b b b b a a
=
(5-7)
As presented in the previous subsection, the model proposes in this research uses the
10-point linguist (Likert) scale for evaluating the O, S, and D factors. Considering the
difficulty of precisely evaluating the three risk factors, they are evaluated by experts using
determination linguistic variables. According to Pedrycz et al. the notion of linguistic
variables can be regarded as variables that have values that are Fuzzy sets and assume values
consisting of words or sentences expressed in a certain language [174], or in Zadeh’s words ;
“variables whose values are not numbers but words or sentences in a natural or artificial
language” [178].
Further, Zadeh, notes that the main contribution of Fuzzy logic is a methodology for
computing with words, which is a necessity when the available information is too imprecise

CHAPTER 4-RESEARCH DESIGN AND METHODOLOGY
Page 97
to justify the use of numbers and is useful when there is a tolerance for imprecision that can
be exploited to achieve tractability, robustness, a low solution cost, and a better rapport with
reality [179]. For the reasons presented, the use of Fuzzy theory and, more precisely, the use
of linguistic variables can be justified.
Notably, another crucial drawback of Fuzzy-based FMECA to assess UI system risks is
the method is too incomplete and inappropriate to be applied and considered as a single
method. This drawback emerges as Fuzzy-based FMECA is not comprehensive to be applied
to develop risk mitigation plan and strategy for evaluating risk event considering its’
dynamic impact characteristics as mentioned in previous Chapters 3. Therefore, for this
issue, this research integrates and applies the Fuzzy-based FMECA with network and
topology analysis to assess the risk impact. The network and topology analysis method
applied in this research is SNA which describes below.
4.9.3 Social Network Analysis
The SNA is a methodology used to identify the conditions of social structures by analyzing
the interactions and interrelationships between a set of actors [180-186]. Conceptually, SNA
emphasizes the relational measures among components rather than their individual
attributes. According to Wasserman, S. and K. Faust, a social network is a social structure
made of actors (nodes) that are connected by one or more specific type of relations (ties),
such as friendship, firm alliance, or international trade[187]. Since introduced, the
superiority and a number of SNA advantages has been applied and discussed well in several
past studies [183-185, 188-192].
For instance, SNA has been applied to investigate various relationships among
various entities (e.g., individuals and organizations) and knowledge diffusion in the social
sciences, engineering and economics [184]. Lee, specifically compared development
patterns between the automobile industry and the semiconductor industry from the
network perspective using SNA [193]. Several network studies have also been conducted in
the construction domain. Wambeke, B., M. Liu, and S. Hsiang, applied the SNA to generate a
series of 14 social networks for the trades involved within a construction project [183].
In addition, Wong et al. examined the differences in robust project network designs
between domestic and global projects [194]. Meanwhile, Taylor et al. and, Taylor and
Bernstein, suggested a hybrid approaches that connected social network theory with
learning dynamics and building information modeling (BIM) practice [195, 196]. Prell, C., K.
Hubacek, and M. Reed, presented a case study from the Peak District National Park in the

CHAPTER 4-RESEARCH DESIGN AND METHODOLOGY
Page 98
United Kingdom, where the study applied SNA to inform stakeholder analysis. The
information on the study analysis helped the experts to identify which individuals and
categories of stakeholder played more central roles in the network and which were more
peripheral.
Further, Chai, C. L., et al., applied SNA, to study human interactions and to analyze
characteristics of the CI network [197]. Another study in CI fields using SNA was conducted
by Zhang, W.-J., et al. [97]. The study applied SNA to identify and analyze the vulnerability of
CI system. Lienert, J., F. Schnetzer, and K. Ingold, investigated the fragmentation in water
infrastructure planning, to understand how actors from different decision levels and sectors
are represented, and which interests they follow [186]. It is found that the SNA successfully
confirmed the present of strong fragmentation by concluding that there’s a little
collaboration between the water supply and wastewater sector, and few ties between local,
cantonal, and national actors.
Moreover, there also a number of studies which gave a great emphasize and attention
towards SNA method application to assess risk in the context of risk impact network,
relationships, correlation and interconnection. For instances; Fang, C., et al. presented a
network topology analysis based on network theory which aims at identifying key elements
in the structure of interrelated risks potentially affecting a large engineering project [86].
Further, Yang, R. J. and P. X. W. Zou, which developed a SNA based stakeholder-
associated RA method to assess and analyze the risks and their interactions in complex green
building projects [92]. Accordingly, based on SNA method structure, the network analysis
can be conducted by either one-mode or two-mode network analysis. The discussion for one-
mode and two-mode network analysis method are discussed in the next sub-section.
4.9.3.1 One-mode and Two-mode (Affiliation) Network
In SNA studies, usually an event-event or actor-actor relationship can be modeled by using a
node-node connection. This is known as one-mode network data since the basic data consist
of one types of node in which there are only connection between them (see Figure 4-3a).
Nonetheless, several studies have focused on data in which they have ties among a single set
of events, and the ties are measured directly. Further, as touched on elsewhere, our real world
often has the situation where we cannot collect ties among the same events directly. However,
it can infer or predict ties based on belonging to the same groups.
Therefore, some basic data consist of two types of nodes in which there are only
connections between the two types and not within. This is known as two-mode data
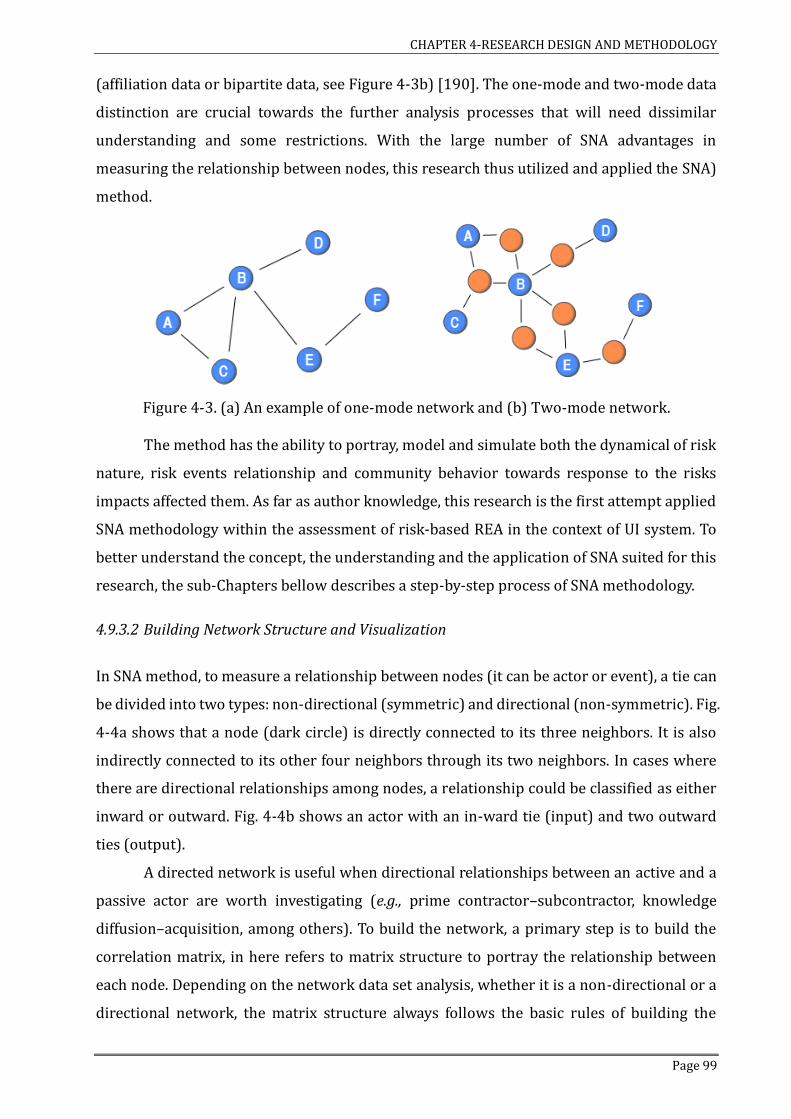
CHAPTER 4-RESEARCH DESIGN AND METHODOLOGY
Page 99
(affiliation data or bipartite data, see Figure 4-3b) [190]. The one-mode and two-mode data
distinction are crucial towards the further analysis processes that will need dissimilar
understanding and some restrictions. With the large number of SNA advantages in
measuring the relationship between nodes, this research thus utilized and applied the SNA)
method.
Figure 4-3. (a) An example of one-mode network and (b) Two-mode network.
The method has the ability to portray, model and simulate both the dynamical of risk
nature, risk events relationship and community behavior towards response to the risks
impacts affected them. As far as author knowledge, this research is the first attempt applied
SNA methodology within the assessment of risk-based REA in the context of UI system. To
better understand the concept, the understanding and the application of SNA suited for this
research, the sub-Chapters bellow describes a step-by-step process of SNA methodology.
4.9.3.2 Building Network Structure and Visualization
In SNA method, to measure a relationship between nodes (it can be actor or event), a tie can
be divided into two types: non-directional (symmetric) and directional (non-symmetric). Fig.
4-4a shows that a node (dark circle) is directly connected to its three neighbors. It is also
indirectly connected to its other four neighbors through its two neighbors. In cases where
there are directional relationships among nodes, a relationship could be classified as either
inward or outward. Fig. 4-4b shows an actor with an in-ward tie (input) and two outward
ties (output).
A directed network is useful when directional relationships between an active and a
passive actor are worth investigating (e.g., prime contractor–subcontractor, knowledge
diffusion–acquisition, among others). To build the network, a primary step is to build the
correlation matrix, in here refers to matrix structure to portray the relationship between
each node. Depending on the network data set analysis, whether it is a non-directional or a
directional network, the matrix structure always follows the basic rules of building the

CHAPTER 4-RESEARCH DESIGN AND METHODOLOGY
Page 100
matrix.
Figure 4-4. (a) Non-directional and (b) Directional relationship tie. (Source Park, H., et al. [184]).
To show the connectivity between nodes in the undirected network, the symmetric
adjacency matrix consists of binary number (binary matrix), either 0 to show if there’s no
relation between nodes or 1 to show if there’s a relation between nodes with the condition
of X→Y = Y→X. For directed data, however, the adjacency matrix is not necessarily symmetric,
and the row and column sums may be different. The matrix for directed network has the
same structure except with the condition of X→Y ≠ Y→X. The example matrix for both
undirected and directed network can be seen in Figure 4-5 (which in this research called as
Risk Structure Matrix, RSM).
A valued network will be applied as well within this research in some points within
the processes of RA and will be described in a further sub-Chapter. This network direction
understanding is pivotal towards building the network structure which ultimately effect on
the network visualization. Further, the total number of nodes in a network graph is equal to
the number of elements in N , that is, | |V N= . Correspondingly, the number of edges in a
graph is equal to the number of elements in , that is, W K= [127].
A B C D A B C D
A 0 1 0 1 A 0 1 0 1
B 1 0 1 1 B 0 0 1 1
C 0 1 0 0 C 0 1 0 0
D 1 0 1 0 D 1 0 1 0
(a) (b)
Figure 4-5. (a) Non-directional and (b) directional matrix structure.
Any given graph can be uniquely represented by an N N adjacency matrix. If there
exists an edge from some vertex i to vertex j , then the element N is 1; otherwise, it is 0.
Undirected graphs always have symmetric adjacency matrices. In some applications, it is
useful to not only specify whether an edge exists, but to assign the edge a value, typically a
number in the range [0,1] [127, 181, 182, 198].

CHAPTER 4-RESEARCH DESIGN AND METHODOLOGY
Page 101
One of the first things most people want to do with network data is construct a visual
representation of it-in short, draw a picture. Seeing the network can provide a qualitative
understanding that is hard to obtain quantitatively. A network diagram consists of a set of
points representing nodes and a set of lines representing ties. Various characteristics of the
point and lines, such as color, size and shape, can be used to communicate information about
the nodes and the relationships among them [198].
It is crucial to distinguished between network elements and their graphical
representation-that is, between nodes and the points that represent them, and between ties
and the lines that represent them. A study discussed the spatial orientation of nodes and
things that are considered important in visualizing properties, and attributes of nodes and
edges or ties in network graphs followed by a series of examples illustrating some possible
ways to address some visualization issues can be seen in [198].
The ability to visualize a social network is one of the attractive features of SNA. When
done correctly, visualization allows the researchers to obtain a simple qualitative
understanding of the network structure. The use of good layouts to emphasize properties of
the network is key, graphical layout algorithms are highly effective and widely used. In
addition, the use of shape, size and color to capture nodal attribute properties can further
enhance the effectiveness of any visualization. In a similar ways, color, thickness and line
style can be used to emphasize properties of edges.
Exploring a network structure by calculation is much more concise and precise than
visual inspection [183]. Each of the networks mathematically can be represented by a graph
( ),G N K , in which (depends on the networks discussed) the identified actors/events are
mapped intoN nodes (or vertices) connected by K weighted arrows (or edges, or links) [86,
92]. For directed networks, the elements of K are ordered pairs of distinct vertices, while
for undirected graphs, the element of K are unordered pairs of distinct vertices.
4.9.3.3 Network Topology Decipherment Measurements
Network topology can be described by a variety of measures. This section explores in detail
several basic network topology within SNA method utilized in this research. For instance, the
network characteristic, the network measurement in the context of centrality which is the
most widely used concepts in SNA, a partition and a method to assess a complex and large
network. Depending on the nature of the network ties within the RA processes, each of the
SNA measurements can be interpreted in a variety of ways. Then modification and
adjustment for each of SNA measurement formula is further needed.

CHAPTER 4-RESEARCH DESIGN AND METHODOLOGY
Page 102
Table 4-2. The general network topology indicator applied.
Meas. Description Equation Network measures.
De
nsi
ty
It is defined as the ratio of existing ties in a network to the maximum number of ties possible in everyone in the group is connected with everyone else. Density can be interpreted as the probability that a tie exist between any pair of randomly chosen nodes; however, the absolute number can be hard to access [198]. Further, density is an indication of how knitted a network is [86, 92, 197].
( )Density( 1)
KG
N N=
− (4-8)
where, N is the number of node. In principle,
the advantage of density over the simple number of ties (or total tie strength) is that it adjusts for the number of nodes in the network. Roughly saying, density is simply the number of ties in the network, expressed as a proportion of the number possible.
Co
he
sio
n
The idea of cohesion is connectedness or ‘knittedness’. Depending on the nature of ties in the network, the term ‘cohesion’ may not necessarily correspond to sociological cohesion. Cohesion measures “the distance, or the number of links, to reach nodes in a network”, and is based on the shortest path [92, 198]. The cohesion is a measure of the complexity of network based on network reachability. The cohesion defined in Eq. (4-9) is a measure of the complexity of network based on network reachability. This measure is based on the definition of adjacency matrices (AdjM). The AdjM defines how many paths of length 1 there are from each node to each other node. In general, it can be shown that the powers of the
AdjM, give the number of walks of length z from each node to each other node. The higher the cohesion, the more complexity of the risk network is.
( )
,
, ;
AdjM
Cohesion ( )1
zi j
i j i IG
N N
=
−
(4-9)
Node/ link measures
De
gre
e o
f C
en
tra
lity
(D
C)
The DC measures the number of ties of a given type that a node has. A node’s degree can be calculated without having information about the full network in which they are embedded. As such, it could be argued that it is not really a measure of a centrality, which defined above as a property of a node’s position in the network. In
terms of the adjacency matrix X of an undirected matrix, DC is simply the row (or
column) sums of the adjacency matrix. If id is the
DC of actor i and ijx is the ( )i j, entry of the
adjacency matrix. An advantage of DC is that it is basically interpretable in all kinds of networks, including disconnected networks. On contrary, a disadvantage of DC is that it is a relatively coarse measure of centrality [198].
DegCi ij
j
x= (4-10)

CHAPTER 4-RESEARCH DESIGN AND METHODOLOGY
Page 103
Ou
t-D
eg
ree
an
d,
In-D
eg
ree
It counts the number of outgoing ties (arcs) whereas; In-Degree counts the number of incoming ties. Depending on the social relation in question, we might interpret Out-Degree as the ‘gregariousness’ or ‘expansiveness’ of the node and the In-Degree as the ‘prestige’ or ‘popularity’ of the node. Degree of nodes provides an indication of the immediate connectivity characteristic. ‘In-degree’ refers to incoming relations (impacted by) and ‘out-degree’ to out-coming relations (impact to). The degree of each node is the weight sum of links which are incident from the node. They are presented in Eqs. 4-11 and 4-12 and indicate the links
between risk * nS R and its neighbors. Eq. 4-13
shows the difference between the in-degree and out-degree values of one risk. The higher the difference, the stronger impact of the risk to others comparing to the impact received by the risk [92].
,=InDeg SRMi j i
j G
(4-11)
,OutDeg = SRM i i j
j G
(4-12)
=GapDeg OutDeg InDeg i i i− (4-13)
Be
twe
en
ne
ss C
en
tra
lity
(B
C)
BC is a measure of how often a given node falls along the shortest path between two other nodes [198]. It reflects the amount of brokerage each node has between all other nodes in the network. More specifically, it is calculated for a given focal node by computing, for each pair of nodes other than the focal node, what proportion of all the shortest paths from one to the other pass through the focal node. These proportions are summed across all pairs and the result is a single value for each node in the network. The formula for the BC of node j can be stated as (4-14). Betweenness
reaches its maximum value when the node lies along every shortest path between every pair of other nodes. BC is typically interpreted in terms of the potential for controlling flows through the network-that is, playing a gatekeeping or toll-taking role. Nodes with high betweenness are in a position to threaten the network with disruption of operations. More generally, high-betweenness nodes are in a position to filter information and to color or distort it as they pass it along.
BetCijk
jiki k
g
g
= (4-14)
where, ijkg is the number of geodesic paths
connecting i and k through j , and ikg is
the total number of geodesic paths connecting
i and k . A node’s betweenness is zero when it
is never along the shortest path between any two others. This can occur when the node is an isolate, or when every alter of a node is connected to every other alter.
Eig
en
ve
cto
r C
en
tra
lity
(E
C)
Eigenvector centrality can be described from a number of different perspectives. Eigenvector centrality can be interpreted as a measure of popularity in the sense that a node with high eigenvector centrality is connected to nodes that are themselves well connected. Here, eigenvector centrality can be presented as a variation of degree centrality in which the number of nodes adjacent to a given node counted (similar to degree centrality) [198], but weight each adjacent node by its centrality. The formula for the eigenvector centrality of node j is given by;
EigenVi ij j
j
x e= (4-15)

CHAPTER 4-RESEARCH DESIGN AND METHODOLOGY
Page 104
Clo
sen
ess
Ce
ntr
ali
ty (
CC
) Closeness is an inverse measure of centrality in the sense that large numbers indicate that a node is highly peripheral, while small numbers indicate that a node is more central [198]. In a flow context, closeness centrality typically interprets in terms of the minimum time until arrival of something flowing through the network. A node that has a high normalized closeness score is a short distance from most order, so information originating at a random node can potentially reach the central node very quickly. Since the diffusion process tends to introduce distortion, the information received by central nodes expected to have higher fidelity on average. Thus, a high normalized closeness would seem a significant advantage for a node (in the case of something useful being transmitted). The formula for the closeness centrality of node
i is given by equation (4-16).
,
1Close =
i ji j d (4-16)
Sta
tus
Ce
ntr
ali
ty (
SC
)
Status centrality (Katz centrality) computes the relative influence of a node within a network by measuring the number of the immediate neighbors and also all other nodes in the network that connect to the node under consideration through their immediate neighbors [92] (Eq. 4-17). The in-status centrality indicates the extent to which a node is affected by others; whereas, out-status centrality indicates the extent to which a risk can affect the others. Regarding the influence of a risk, the out-status centrality is used as the outcome measure. The higher the out-status centrality values the greater the impact of the node.
( )1
,1 ;
StaC = AdjM d di
i jd j G i j
−
= (4-17)
4.9.4 True Empirical Experiments (Computational Simulation)
The risk criticality analysis is the main model and gate towards assessing the UI system
resilience. While the UI system robustness analysis also considered risk-critical as the base
model, deciding optimum recovery strategy in the form of various variables is a daunting
task. A variety of reasons to simulate rather than conduct research in the real world is
decided in the UI system robustness analysis. This research chooses a scenario-based
simulation because the behavior of interest could not be studied ethically, and impractical in
the real world.
Further, a simulation may be used because studying a behavior under naturally
occurring conditions is expensive and time consuming. In a simulation, this research attempt
to re-create (as closely as possible) a real-world situation in the virtual-world. Carefully
designed and executed simulation may increase the generality of results. Because this
strategy has been used with increasing frequency lately. This research simulates the sixth
phase of the conceptual framework, that is recovery analysis, for practical reasons. By

CHAPTER 4-RESEARCH DESIGN AND METHODOLOGY
Page 105
conducting a simulation, this research gains the advantage of retaining control over variables
while studying the behavior under relatively realistic conditions.
Accordingly, the more realistic the simulation, the greater are the chance that the
results will be applicable to the simulated real-world phenomenon. As far as possible, a
simulation should be as realistic as possible. However, a simulation may not have to be highly
realistic to adequately test and validate the conceptual framework in this research. The
importance of the “realism” of a simulation depends in part on the definition of realism that
this research adopts. Meanwhile, the term mundane realism refers to the degree to which a
simulation mirrors the real-world event [12, 135]. In contrast, experimental realism refers
to the degree to which the simulation psychologically involves the participants in the
experiment.
For reaching highest robustness capacity (value) for respective UI system and
improving the generality of scenario-based simulation; the variable, formula, and equation
boundary must be properly designed by observing the actual situation and study it carefully,
identify the crucial elements and then try to reproduce them in the computational simulation.
This research determined five recovery scenarios to be simulated. Empirically, the recovery
strategy formed in the application of random number applied within the system robustness
variables.
The simulation conducts for every scenario over time-period boundary. Notably, the
scenario-based simulation, thus, will produce dissimilar UI system robustness level over
time. The dissimilar robustness level obtained between five simulations will then discuss in
the end part of analyses section. The computational simulation processes for the five
recovery strategies in this research refer to the ‘Quasi-experimental design”. This research
design is discussed in the next sub-section.
4.9.5 Quasi-Experimental Design
In some circumstances, a true experiment is either impractical or unethical. Further, there’s
a condition in which data collection not be able to randomly assign participants to different
treatment conditions although this research can randomly select one (or several) group of
participants to receive a treatment while the other group acts as a control group. In other
cases, it is unethical to subject people to same treatment condition or fail to provide them
with treatment. But fateful events occur naturally that allow us to determine how people
react to specific conditions. There are two of the more common quasi-experimental
techniques, the nonequivalent control-group design and the interrupted time series [12].
CHAPTER 4-RESEARCH DESIGN AND METHODOLOGY
Page 106
The term quasi-experimental literally means that the research resembles an
experiment. In a quasi-experimental there is an independent variable and a dependent
variable, and the researcher wants to determine whether introduction of the independent
variable produces a change in the dependent variable. In addition, there is a control group of
individuals who do not experience the independent variable. Consequently, the researcher
can compare the difference in outcome between the treatment and control groups. The
missing component from this research is the random assignment of participants to the
treatment conditions.
Furthermore, the primary advantage of the quasi-experiment is the lack of random
assignment that means that researcher can never fully rule out alternative explanations for
the effect this research observe [135]. Another advantage of the quasi-experiment is that
researcher can collect useful information that will allow this research to examine the effects
of the independent variable on the dependent variable. Moreover, quasi-experimental design
allows this research to evaluate the impact of a quasi-independent variable under naturally
occurring conditions.
The quasi-experiment is another useful tool that the researcher can select when the
circumstances of the research prohibit the conventional true experiment. In the recovery
analysis model development within the system-of-interest resilience overtime context,
instead of applying the time series quasi-experimental design, this research applied the
interrupted time series quasi-experimental design. The research made repeated measures
of the frequency or rate of behavior in a sample of participants before and after a critical
event (disturbance point).
Similar to most quasi-experiments, this research may not be able to control when the
critical event occurs but can use its presence to examine interesting aspects of human
behavior. In this case, the research manipulating the independent variable and simply take
advantage of a naturally occurring event. Therefore, the research needs to establish a clear
causal relationship among variables. However, quasi-experimental research does have
drawbacks that affect the internal and external validity of the research [135].
4.9.6 Assumptions of Science Applied
No computer program or Geographical procedure can create gold from straw; the quality of
any empirical analysis depends on both the analysis model and the quality of the original
data. Unfortunately, many people treat the computer and geographies as magical machines
that somehow tell the truth. The phrase, “garbage-in-garbage-out” means that the output of

CHAPTER 4-RESEARCH DESIGN AND METHODOLOGY
Page 107
any computer program is no better than the data you ask it to analyze. These observations
mean that user need to proceed with caution when using software packages [12]. All sciences
make the same basic assumptions about their subject matter.
This research adopts several assumptions within the analysis models develop which
some also discussed in Chapter 5. Several assumptions decided and applied within the
analysis models describes in-depth below;
- Entire participants (individual stakeholders) is equal and has identical importance
weight. Thus, this research exempted the application of weight value within the
empirical analysis processes.
- There are several concepts towards analyzing UI system risks (e.g., consequences lead
to; system deprivation, cost loss and environmental harm). Nonetheless, this research
only considers the risk impact characteristics, that is; risk magnitude, risk causality
and interaction pattern, and risk effect to urban community.
- The identified risk events assumed has the same significant (or importance) weight.
Thus, this research exempted the application of weight value within the empirical
analysis processes.
- Although the risk characteristic and nature are dynamic and stochastic, the
conceptual framework and analysis models proposes in this research is deterministic
design.
- The threshold value for dichotomizing the preliminary input for one-mode risk
matrix is decided in an ad-hoc way by the author.
- The data collection, processing and simulation are performed in the non-continuous
(discrete) time manner.
- Although it is true that UI system has various stakeholder groups which need to be
identified, however because of research time and author capacity limitation this
research cannot cover all of the stakeholder groups in the respective case study.
- The scenario-based recovery strategy variable simulation formed in the application
of random number determined in an ad-hoc way by the author.
4.10 Chapter Summary
The primary theme if this Chapter was designing a research method that reduces the effects
of unwanted sources of error and bias towards achieving the research aim as well as its
objectives. Because research is a uniquely human enterprise, there are many opportunities
for the researcher’s behavior to bias the participants’ behavior as well as the researcher’s

CHAPTER 4-RESEARCH DESIGN AND METHODOLOGY
Page 108
interpretation of the UI system risk and its impact characteristic as well as the UI system
resilience. Therefore, this section examined the sequence of important events for the
research process, from defining the purpose of the study to the final interpretation of the
data to examine where and how bias can enter the research process.
The goal of the research design is to provide sufficient detail so that interested
readers can evaluate not only the quality of the research background and the data collection
procedure but also the overall research quality. This section describes in detail the sequence
of significant events experienced during the research. Further, the research design section
describes on how this research assigned participants to various conditions of the research
as well as researcher to control procedures.
This Chapter also outlined the research methodology used along with the research
design, research approaches, research strategy and activities, and finally the data analysis
and interpretation strategy. The structure of the research process, including the major steps
taking to conduct the research, were explained alongside a flowchart depicting the research
process. A specific instruction towards the design-based questionnaire gives to the
participants also explored and discussed where the procedure section consists of an
important series of stages that required careful description.
Next the leading to a rationale for selecting the embedded mixed methods design,
with the primary approach being quantitative, and the qualitative method being the
secondary, embedded approach, for enhancing, supporting and understanding the
quantitative data. The conceptual REA framework develops in this research could be
explained and validated on all types of UI types and sectors. However, due to time and
knowledge constraints, the case study approach was selected for this purpose. The use of the
UWS infrastructure system in Indonesian context as a case studies and a cross-sectional
survey approach were also justified.
This Chapter, further, explained how the developed research questions would be
answered. In addition, this Chapter also discussed the empirical methods applied, such as;
FMECA, Fuzzy theory and SNA techniques, as used in this research towards achieving both
the research aim and objectives. The reasons for selecting various empirical methods and
techniques and the logical techniques for data analysis were explicated. This Chapter also
presented and discussed the methodology and strategies towards the relevant analysis
undertaken in the research. The empirical framework and analysis model development are
discussed in more detail in the next Chapter,

CHAPTER 5-CONCEPTUAL FRAMEWORK AND ANALYSIS MODELS
Page 109
CHAPTER 5
CONCEPTUAL FRAMEWORK AND ANALYSIS MODELS
CHAPTER HEADINGS Introduction Conceptual Framework Development Phase 1-Risk Magnitude Analysis Phase 2-Risk Causality and Interaction Pattern Analysis Phase 3-Risk Impact to Community Analysis Phase 4-Risk Criticality Analysis Phase 5-System Robustness Capacity Analysis Phase 6-System Recovery Analysis Assumptions Applied Chapter Summary
5.1 Introduction
The importance of UI system to urban flow, the inherent UI system hazards affecting both its’
system and community in the concept of SAR, as well as several RA and REA methods have
been reviewed in preceding Chapters. An evaluations and arguments have also been
developed towards exposing both conventional RA and REA methods shortages as they are
constantly regard as two disparities in previous studies. On the other hand, however,
building UI system and community resilience are requiring comprehensive RA as the basis
for further REA. This Chapter spotlights the conceptual assessment framework, which
consists of several analysis models, develops in this research towards filling the knowledge
gaps mentioned previously.
The analysis models develop within the conceptual framework are, described
sequentially in the six phases. This section provides an extra information for the logic,
methods and techniques behind the conceptual framework proposes. The conceptual
framework develops intent to feel the gaps towards existing RA and REA models that are
insufficient for responding both the research aim and key questions. Furthermore, the
conceptual risk-based REA framework assists the understanding of the correlational
patterns of interconnections across ideas, methods, models and observations.
5.2 Conceptual Framework Development
Following the nature of study, this research set out the stages supporting the building of risk-
based REA conceptual framework through an action moves from beginning to end
(i.e., answering the research aim and key questions). The overall purpose of developing

CHAPTER 5-CONCEPTUAL FRAMEWORK AND ANALYSIS MODELS
Page 110
conceptual framework is to make research findings meaningful and generalizable. A
conceptual framework develops in this research explain narratively and graphically the main
concepts, and the relationship among various concepts mentioned in previous Chapters. The
proposed conceptual framework flowchart shown in Figure 5-1 below.
Phase 1:Risk magnitude
Phase 2:Risk causality and interaction pattern
Phase 3:Risk impact to community
Stress impact
Phase 4: Risk criticality model development
Shock impact
2-Mode SNAFuzzy-based FMECA
1-Mode SNA
System-of-Interest Resilience Analysis
Urban In
frast
ructu
re S
ystem
Urban Comm
unity
Inherent Hazards
Ris
k Impact
Interrelated
Pro
ble
m B
ou
nd
ary
Pro
ble
m B
ou
nd
ary
Function elements
integration
Maximum Function
Max. robustness level
Expected robustness level
Scenario-based resilience action
Optimum recovery strategy
Yes
Simulation domain
System robustness capacity model development
No
Comparison and analysis
Phase 6: Recovery function development
Data processing
Simulation and analysis
Initial Phase
Data collected
Fieldwork
Phase 5: Robustness assessment model development
Figure 5-1. Empirical framework development.
The proposed framework consists of one preliminary phase and another six main
phases. The preliminary phase intends to establish the context. While, the six main phases
including; (i) Risk magnitude analysis, (ii) Risk causality and interaction pattern analysis, (iii)
Risk impact to community analysis, (iv) Risk criticality model development, (v) Robustness
analysis model development, and (vi) Recovery function and analysis model development.
To avoid definition ambiguity and make clear distinction, this dissertation will use ‘risk’

CHAPTER 5-CONCEPTUAL FRAMEWORK AND ANALYSIS MODELS
Page 111
word instead of ‘hazard’ word. Note that, in further discussion, there will be any ‘hazard’
words applied that actually refers to ‘risk’.
The conceptual framework proposes is essential by taking into consideration the
stakeholders point-of-view and experience in giving their perception towards risk as an
input data. Further, the conceptual framework proposes will help to guide the decision
makers making choices about UI system RA and REA on the basis of their interrelationship.
Prior to initiate Phase-1, the conceptual framework is started with the ‘preliminary phase’
which focuses on the four aspects stated in the outer circle of the Figure 5-1 (i.e., UI system,
urban community, inherent risks and its impact).
5.3 The Preliminary Phase
Accordingly, the preliminary phase consists of; (i) Defining the UI system and the problem
that will be discussed, (ii) Identifying the urban community as the UI system’s stakeholder,
(iii) Determining the inherent risk events within the determined UI system and, (iv)
Understanding and analyzing the characteristics and mechanisms of the risk impact. In
addition, the preliminary phase is crucial stage to determine specific UI sector as a case study.
Note that, the preliminary phase will affect and influence the further phases development
and analysis process. Heretofore, the four elements within preliminary phase are explored
in paragraphs bellow.
5.3.1 Establishing the Context
The first step in preliminary phase of the conceptual framework is establishing the context.
In here, the establishment of context refers to the problem scope determination that this
research intents to assess. This step is significant since it is the process towards deciding
structurally the specific UI sector as a case study and, defining the problem and analysis
boundary (i.e., identifying the inherent UI system risk events and appropriate stakeholders,
and settling the risk decision factors).
In this research, events which interrupt the normal function of particular UI system,
and may result in harm, are referred as disruptive events (refers to risk events). Further, an
event without consequences may be referred as an ‘incident’, or more informally as a “near
miss” or “close call”. In the UI system RA, the risk identification should cover the full portfolio
of risks, for instance; risks of natural and technological hazards, the risk of conflict and
violence, the effects of economic shocks, and the flow on effects of global and regional shocks.
Furthermore, risk identification should include one-off big events (intensive risk) as

CHAPTER 5-CONCEPTUAL FRAMEWORK AND ANALYSIS MODELS
Page 112
well as regular smaller scale events (extensive risks). The risk identification in this
preliminary phase should facilitate and support the further analysis towards the
identification of; commonalities and interlinkages between different possible events, the
sequencing of events, the potential for one event to trigger new risks and multiply exposures,
and possible flow-on impacts across borders and between communities.
The risk events identification is the next step within preliminary phase. The RA aimed
at determining (risk) events which can affect the performance of a determined UI system
objectives negatively [199]. Risk event identification is usually the first important step for
common RA, aimed at discovering the major types of event that exist within an UI system
which could affect urban community (as an object) positively or negatively [86]. There are
several approaches that can be taken for identifying UI system risk events, such as; analogy-
based, heuristic-based or analytic-based [86]. The result of these analyses is the stable lists
of risk events.
Nonetheless, it is impractical identifying thousands of inherent risk events in UI
system context. Therefore, a problem and discussion boundary towards determining UI
system risk events is required. Once the UI system risk events are identified and determined,
the identification need to be carried out to determine specific UI stakeholders. In this
research the stakeholder refers to the person, groups or organizations, with varying degrees
of responsibility and authority that are affected by or can support the continuity of
respective UI system serviceability.
Following the expert group working paper ‘joint risk analysis-the first step in
resilience programming’ [200], four key groups of stakeholders that matter to be considered
and involved in the RA process:
- Those who are capable to provide inputs data (including academics, local and
international scientists, experts, development actors, think tanks, operators of critical
infrastructure, and the broader private sector)
- Those using the results to prioritize and guide policy, and programming decisions
(including development, humanitarian and climate change actors, and government)
- Risk owners who are responsible for managing the impacts of each risk (including
individuals, communities, private sector, and state institutions)
- Stakeholders whose lives, assets or resources that are exposed to risks.
Furthermore, in the case of UI system RA which related to community roles, the lead
should be a person who is perceived to represent the range of interests of the community. In
exceptional circumstances, the leadership role could also be played by a prominent actor in

CHAPTER 5-CONCEPTUAL FRAMEWORK AND ANALYSIS MODELS
Page 113
the international community [200]. Nonetheless, in fact, there is no specific method towards
identifying and determining the stakeholder of specific UI sector.
Stakeholder, in this context, is a main part of the urban community. The urban
communities in circumstance are created when group of people affected by the same
incident or have a common immediate need, such as the terrorist attacks of the London
transport system in July 2007, or major industrial accidents [85]. These groups of individuals
are unlikely to have the same interest but may form a community in the aftermath of risk
event. Although the sense of community may be temporary, however, some community
circumstances grow and sustain in the long term following a disturbance (or disaster).
In this research, the UI stakeholders employs both expert and laypeople from variety
of levels and professions. In addition, each of them have its own cultural perspective and
associated ontology and epistemology of risk [113]. Importantly, the stakeholders will affect
the key decisions regarding; ‘who to involve in the RA exercise and process’ (e.g., to shape
data collection and input data). In some way, RA can be undertaken by either top-down or
bottom-up approach which is considering the importance of stakeholder engagement in the
RA and making decision processes towards building UI system more resilient.
5.3.2 Determine Risk Measurement and Input Data Process
The next step is determining risk measurements (parameters). In this research, the risk
measurements are referred as ‘risk decision factor’ [114, 170, 171, 201-203]. Importantly,
the variation of risk decision factors need to be determined firstly as the basic measurement
and formula applied during the RA. Additionally, the standard risk formula have been
involving in the past decades [105]. Previous studies applied various risk decision factors,
for instance; frequency, probability, likelihood, severity, consequences, exposure,
detectability, community perception, vulnerability, cost impact, threat, and so on [16, 79,
204].
Depends on the analysis and research context, nonetheless, there’s no fixed rules
regarding to the decision on choosing and applying the specific (combination) risk decision
factors. One option to determine risk decision factors can be done in an ad-hoc approach.
Nonetheless, previous studies discussed the shortage of conventional RA which mainly
measured solely its two risk decision factors (i.e., likelihood and severity) [105]. To fill this
knowledge gap, this research applies third risk decision factors as a complementary to
measure and compute the risk magnitude, that is; ‘Detectability’ (D).
Based on the established risk decision factors, further, data needs to be collected that

CHAPTER 5-CONCEPTUAL FRAMEWORK AND ANALYSIS MODELS
Page 114
accurately captures the objective perceptions (from relevant stakeholders) towards
particular risk events. Primarily, the conceptual framework proposes in this research is
incorporating a variety of analysis models to identify and analyze risks in the initial phase of
REA. The analysis models are based on the people perceptions towards risk in the form of
risk decision factor within the whole processes towards assessing risk.
Thus, identification and determination of the particular UI system stakeholder groups
will present the competing evidence based upon their own perceptions, experiences and
social agenda. Nonetheless, this process can be a very daunting task as researchers need to
understand the nature, structure and supply chain of the respective UI system. This task can
be done by conducting literature review, interviewing various types and levels of experts
who involved in the particular UI sector, and draw a conclusion based on the data collected.
Further, it is important to note that, there are many of stakeholder groups involved
within single UI sector since different region (either country, state, or city) will have
dissimilar policy towards managing particular UI system. The last step within preliminary
phase is to collect the data. This process intends to qualitatively obtain the people’s
perception towards UI system risks. To achieve this, the development of a design-based
questionnaire is essential.
The design-based questionnaire is a significant far developing the platform to
facilitate people’s perception and knowledge towards UI system risks into an analysis. Note
that, the design-based questionnaire has to understandable such that clear to be interpreted
by participants. The data are then initially processed and transformed numerically using
several scientific methods. The initial data processing is discussed in the next sub-section.
Moreover, the methods and framework processes applied and developed are explored in the
next section (Phase 1-5).
5.3.3 Initial Data Processing
In the initial data processing, respondents were identified and coded as iS , where i is the
total respondent who participated in the questionnaire which had been disseminated in the
field. As many as 126 questionnaires were successfully obtained representing the 126
respondents. From this, the stakeholder identification number was coded as 1 126~S S . It
should be noted that, 126 respondents are part of eight stakeholder groups defined as g
iS
where g specifies the stakeholder groups determined based on the Surabaya water supply
infrastructure system (i.e., G1, G2, …, M3). The example of the list of participants can be seen

CHAPTER 5-CONCEPTUAL FRAMEWORK AND ANALYSIS MODELS
Page 115
in Table 5-1 below.
Table 5-1. The example of participants list with its identity.
Participant ID Group (g) Geographical data
1S … …
…. … …
126S … …
Hereafter, the identified risk events are also coded as nR , where n refers to the total
number of identified risk events. In this research, 30 risk events were identified and
determined as the problem boundary. Thus, 30n = where risk events can be coded as
1 30~R R . The data variables are very crucial towards making a clear distinction between the
analysis sequences and its meaning within the conceptual framework develops in this
research. The example list of risk events can be seen in Table 5-2 below.
Table 5-2. The example of risk events list with its identity.
Risk ID Risk event Category
1R … …
…. … …
30R
…
…
After, stakeholder groups and participants as well as the risk events identified,
following the framework develops, the next step (Phase 1) is to analyze the risk magnitude.
The Phase 1 and another Phases are discussed in the further sections.
5.4 Phase 1: Risk Magnitude Analysis
First phase intends to analyze the risk magnitude. In previous period, the conventional group
decision making model and process may not be able to provide participants preferences for
alternatives to a certain degree. This is due to the lack of precise or insufficient level of
knowledge related to the problem, or even the difficulty in explaining explicitly the degree
to which one alternative is better than others. Thus, this research adopts the well-known RA
method named Failure Mode Effect and Criticality Analysis (FMECA) [167, 168, 170, 171].
The FMECA further, integrated with Fuzzy Theory [176, 177], to accommodate the
dissimilarity of stakeholder perspectives.
Figure 5-2 shows the flowchart of the Fuzzy-based FMECA model. The Fuzzy-based
FMECA output is the risk priority number (RPN) where the normalized value is called as risk
priority value (RPV). Based on both RPNs and RPVs, the risk events ranking can be assigned

CHAPTER 5-CONCEPTUAL FRAMEWORK AND ANALYSIS MODELS
Page 116
and determined. In this research, the main risk decision factors as the risk magnitude
function can be derived as equation 5-1 below.
( )
( ), ,
f
f O S D
Risk magnitude= Likelihood, Severity, Detectability
= (5-1)
Identify and determine
the stakeholder groups
Identify and determine
the hazards events
Design-based
questionnaire
Preliminary stepSpecific urban infrastructure
system case study boundary
Data processing
Applying Fuzzy linguistic terms to
measure the risk decision factors
Crisp defuzzification decision matrix F(x)
Determine risk decision factor and matrix
Data collection
Establish comparative series (xi) Establish standard series (x0)
Different series developed (D0)
Compute relation coefficientIntroduce the group
weight of risk factor
Determined degree of relation
Risk ranking
Risk Priority Number (RPN)
Risk Priority Value (RPV)
Normalize
Descending order
Figure 5-2. Flowchart of Fuzzy-based FMECA.
The likelihood of occurrences (O) is the probability, which is a form of the uncertainty,
the risk event being occurred. While, the impact/severity (synonymous to vulnerability) (S)
refers to the extent of risk impact on communities and industries [108, 115]. In some
evidently, disaster events, the risk impact and consequences are surprisingly greater than
what it was expected. This is because of the community’s lack of knowledge in terms of facing
and treating the specific risk. Than the next decision factor is the detectability (D), that refers
to the specific risk being detected by community putting their awareness and knowledge
[161, 170, 205, 206].
Furthermore, the Likert scale approach is applied to measure the risk decision factors

CHAPTER 5-CONCEPTUAL FRAMEWORK AND ANALYSIS MODELS
Page 117
for risk magnitude analysis that have been determined previously as per the judgement of
the participants. However, this research found that former data collection and data
processing approach in RA is improper or insufficient due to inaccuracy in results. This is
due to the vagueness, ambiguity and uncertainty existing in the evaluating process of the risk
decision factors generated from different stakeholder perspectives [167, 171, 173].
A risk perception is characterized by the intuitive judgment of individual and groups
on risks in the limited and uncertain information context. To construct an objective
experience-based RA, this research apply the Fuzzy-rules to represent and accommodate the
assessments of an expert, sector or representative, associated with his/her level of
confidence [28]. Fuzzy logic systems are knowledge-based or rule-based systems
constructed from human knowledge in the form of Fuzzy IF–THEN rules [167, 173].
The Fuzzy-based FMECA model is carried out in the integrated manner with the use
of Fuzzy-set theory [176, 177], Grey theory [123, 171, 207], and conventional FMECA. This
integration is required for accommodating and embracing the divergent perceptions and
opinion from both expert and laypeople. The Fuzzy methods have been proposed as an
effective solution for uncertain preferences condition within the group decision making [162,
170-173]. An important contribution of Fuzzy-set theory is that it provides a systematic
procedure for transforming a knowledge base into non-linear mapping.
5.4.1 Determined Fuzzy Linguistic Rules
The initial stage of Fuzzy-based FMECA model is to set up the membership function in a
linguistic term representing the risk decision factors (i.e., occurrences (O), severity (S) and
detectability (D). To generate the Fuzzy rule base for generating RPNs, the respondents are
asked to mention the various combinations of the risk decision factors considered using the
linguistic term. In this study the Trapezoidal Fuzzy Number (TFN) rules applied to represent
the rating scale of linguistic term (see; Tables 5-3 to 5-5, and Fig. 5-3) [105, 167, 168, 171].
Table 5-3. Traditional ratings for occurrence (O).
Prob. of Occurrence Possible failure rate Rating TFN Almost certain ≥1/2 10 (8,9,10,10) Very High 1/3 9 (7,8,9,10) High 1/8 8 (6,7,8,9) Moderate high 1/20 7 (5,6,7,8) Moderate 1/80 6 (4,5,6,7) Moderately low 1/400 5 (3,4,5,6) Low 1/2000 4 (2,3,4,5) Slight 1/15.000 3 (1,2,3,4) Remote 1/150.000 2 (0,1,2,3) Almost never 1/1.500.000 1 (0,0,1,2)

CHAPTER 5-CONCEPTUAL FRAMEWORK AND ANALYSIS MODELS
Page 118
Table 5-4. Traditional ratings and TFN for severity (S).
Effect Severity of effect Rating TFN
Hazardous without warning
Failure is hazardous and occurs without warning. It suspends operation of the system and/or involves noncompliance with government regulations
10 (8,9,10,10)
Hazardous with warning
Failure involves hazardous outcomes and/or noncompliance with government regulations or standards
9 (7,8,9,10)
Very high Product is inoperable with loss of primary function. The system is inoperable
8 (6,7,8,9)
High Product performance is severely affected but functions. The system may not operate
7 (5,6,7,8)
Moderate Product performance is degraded. Comfort or convince functions may not operate
6 (4,5,6,7)
Low Moderate effect on product performance. The product requires repair
5 (3,4,5,6)
Very low Small effect on product performance. The product does not require repair
4 (2,3,4,5)
Minor Minor effect on product or system performance 3 (1,2,3,4) Very minor Very minor effect on product or system performance 2 (0,1,2,3) None No effect 1 (0,0,1,2)
Table 5-5. Traditional ratings and TFN for detectability (D).
Detectability Criteria (Detection-%) Rating TFN
Absolutely uncertainty
Design control will not and/or cannot detect a potential cause/mechanism and subsequent failure mode; or there is no design control (0-5)
10 (8,9,10,10)
Very remote Very remote chance the design control will detect a potential cause/mechanism and subsequent failure mode (6-15)
9 (7,8,9,10)
Remote Remote chance the design control will detect a potential cause/mechanism and subsequent failure mode (16-25)
8 (6,7,8,9)
Very low Very Low chance the design control will detect a potential cause/mechanism and subsequent failure mode (26-35)
7 (5,6,7,8)
Low Low chance the design control will detect a potential cause/mechanism and subsequent failure mode (36-45)
6 (4,5,6,7)
Moderate Moderate chance the design control will detect a potential cause/mechanism and subsequent failure mode (46-55)
5 (3,4,5,6)
Moderately high Moderately high chance the design control will detect a potential cause/mechanism and subsequent failure mode (56-65)
4 (2,3,4,5)
High High chance the design control will detect a potential cause/mechanism and subsequent failure mode (66-75)
3 (1,2,3,4)
Very high Very High chance the design control will detect a potential cause/mechanism and subsequent failure mode (76-85)
2 (0,1,2,3)
Almost certain Design control will almost certainly detect a potential cause/mechanism and subsequent failure mode (86-100)
1 (0,0,1,2)
1 2 3 4 5 6 7 8 9 10 Rating
Membership
1.0
0
1 2 3 4 5 6 7 8 9 10Traditional rating
Figure 5-3. Trapezoidal Fuzzy membership of the traditional rating for O, S and D.

CHAPTER 5-CONCEPTUAL FRAMEWORK AND ANALYSIS MODELS
Page 119
5.4.2 Risk Decision Matrix Development
The risk decision matrix has to be developed first for every identified risk event (Eq. 5-2).
The matrix shows the risk and the linguistic terms describing each decision factor of the risk
evens, 1 1 1 2 2 2( ) ( ) ( ) , ( ) ( ) ( ) ,RF , ,..., , ,...,k k k k k k k rr r r r r r R= , where ( )n kr denotes the k decision
factors of risk event denoted by nx . The risk decision factors information series described
below.
1 1 1 1
2 2 2 2
(1) (2) ( )
(1) (2) ( )
(1) (2) ( )n n n n
r r r r k
r r r r kr
r r r r k
= = (5-2)
5.4.3 Defuzzification Process
The next stage requires a formulation of crisp number to represent each of the linguistic
terms assigned. The application of the Fuzzy sets combined with Grey theory requires the
‘defuzzification’ of the membership functions (Fig. 5-3). This research applied the common
defuzzification method for obtaining the Fuzzy set crisp number [167, 171]. The equation is
stated below.
( )
( ) ( )0
0 0
( )
n
iin n
i ij i
b cF r
b c a d
=
= =
−=
− − −
(5-3)
As an example, considering the linguistic term of ‘Moderate’ for the (D) as shown in
Figure 5-4, the defuzzification ( )F r to produce a crisp value is shown below respectively.
0 1
0 1 0 1
6 0 5 0 =0.458
6 0 5 0 3 10 4 10
( )b c b c
F rb c b c a d a d
− + −
− + − − − + −
− + −
− + − − − + −=
=
1 2 3 4 5 6 7 8 9 10 Rating
Membership
1.0
0
c=0 d=10b0=6a0=3 a1=4 b1=5
Moderate
Figure 5-4. Trapezoidal Fuzzy membership of the linguistic term moderate.

CHAPTER 5-CONCEPTUAL FRAMEWORK AND ANALYSIS MODELS
Page 120
The value ofc and d will remain the same for the defuzzification of all linguistic
terms. The values 0a and 0b are rating values at the extreme limits of each linguistic term
where the membership function is 0 and, 1a and 1
b are the two maximum rating values when
the membership function is 1. Further, the Fuzzy risk decision matrix can be defuzzified to
generate a crisp belief decision matrix which is shown as follows:
1 1 1
2 2 2
1
2
(1) (2) ( )
(1) (2) ( )( )
(1) (2) ( )n n n
r
r
n
Fr
Fr
Fr
r r k
r r kF r
R R R k
= = (5-4)
5.4.4 Defining Comparative, Standard and Different Series Matrix
The defuzzified values of decision risk matrix are used to generate the comparative series,
which is represented in the form of a matrix. In this stage, the standard series for the
variables are generated by producing the optimal level of all risk decision factors in the form
of a matrix. The difference between the standard and comparative series is then calculated,
thus the results are used to determine the Grey relation coefficient. Using the value of the
Grey relation coefficient for all risk decision factors variables, the degree of Grey relation of
each event can be calculated.
A comparative series reflects the various linguistic terms and risk decision factors of
the study. (e.g., Low, Moderate, High, etc). In addition, the comparative series can be
represented in a form of a matrix as shown in Eq. (5-5). An information series with k
components of risk decision factors can be expressed as, ( )(1), (2),..., ( ) ,i i ii r r r k rr = where
( ), 1,....,ir k k K= denotes the risk decision factors of ir . For the application of this matrix,
the value of ( )ir k represents the defuzzified crisp number describing each linguistic variable
considered for the identified risks.
1 1
1 1
(1) ( )
(1) ( )
(1) ( )
i
i
i
i i i
r r kr
r r krr
R R R k
= = (5-5)
For instance, consider three risk events, A, B and C, where the linguistic terms have
been assigned for the three variables of decision factors considered as shown in Table 5-6.
Note that, the values in brackets represent the defuzzified value for the values of the
associated linguistic term.

CHAPTER 5-CONCEPTUAL FRAMEWORK AND ANALYSIS MODELS
Page 121
Table 5-6. Example of comparative series.
Hazard Occurrence Severity Detectability A High (0.708) Moderate (0.521) Very high (0.208) B Moderate high (0.625) Low (0.458) Absolutely impossible (0.869) C Slight (0.291) Hazardous with warning (0.791) Remote (0.708)
The information in Table 5-6 can be represented in a matrix form to reflect the
comparative series, as seen below:
0.708 0.521 0.208
0.625 0.458 0.869
0.291 0.791 0.708
High Moderate Very high
Moderate high Low Absolutely impossible
Slight Hazardous with warning Remote
A
B
C
=
=
The next stage is building the standard series which is an objective series that reflects
the ideal or desired level of all the risk decision factors. The standard series for the risk
decision factors are generated by following the optimal level of all decision factors for the
risk events. From a safety point of view, the lowest level for all the risk decision factors is
desired, that is; the lowest level of the linguistic terms describing the risk decision factors
0 0 0 0( ), ( ),..., ( ) Almost never, None, Almost certainr r k r k R k
= = . This term can be expressed as a
matrix below.
0
0 00
0 00
0 0 0
, 1,...,
(1) ( )
(1) ( )
(1) ( )
k K
r r kr
r r krr
R R R k
=
= = (5-6)
When the linguistic term ‘Almost never’ is defuzzified, the crisp number obtained is
0.130. This information is represented in the same way as the comparative series (in a matrix
form). As an example, the standard matrix for each of the risk decision factor can be formed
as below:
0
0
0
0.130 0.130 0.130
0.130 0.130 0.130
0.130 0.130 0.130
Almost never, None, Almost certainAlmost never, None, Almost certainAlmost never, None, Almost certain
A
B
C
==
The difference between the comparative and standard series 0D , is calculated and
reflected in a form of a matrix which is equated as below:
01 01 01
0
(1) (2) ( )
(1) ( )n n
k
D
k
=
(5-7)

CHAPTER 5-CONCEPTUAL FRAMEWORK AND ANALYSIS MODELS
Page 122
where, 0 0( ) ( ) ( )ij k r k r k −= and 0 ( )r k are the standard series, while ( )ir k is the comparative
series. For example, from the above calculation, the difference of the comparative and
standard series can be estimated as below:
0
0.130 0.708 0.130 0.521 0.130 0.208
0.130 0.625 0.130 0.458 0.130 0.869
0.130 0.291 0.130 0.791 0.130 0.708
0.578 0.391 0.078
0.495 0.328 0.739
0.161 0.661 0.578
D
− − −
− − −
− − −
=
=
5.4.5 Calculating Grey Relation Coefficient
In Grey theorem, the information, such as; operation, mechanism, structure, and behavior
are neither deterministic nor totally unknown, but are partially known. The Grey theorem
explores system behavior using relation analysis and model construction. It also deals with
making decisions characterized by the incomplete information. After the difference between
two series0D is estimated. The next stage is calculating the Grey relation coefficient which is
obtained using Eq. (5-8).
( )0 0
00 0
min min ( ) ( ) max max ( ) ( )( ), ( )
( ) ( ) max max ( ) ( )
i ii k i k
ii i
i k
r k r k r k r kr k r k
r k r k r k r k
− + −=
− + − (5-8)
where, 0( )r k is the minimum or maximum value from the standard series, and ( )ir k is the
minimum or maximum value from the comparative series. Further, is an identifier,
( )1,0 , which is only affecting the relative value of risk without changing the priority. In
this research, it is assumed that 0.5 = . The Grey relation coefficient estimation from the
example applied previously is stated below. Following Eq. 5-8 for event A, the O is given as:
0 0
0 1 0
min min ( ) ( ) max max ( ) ( )
( ) ( ) max max ( ) ( )
0.078 (0.5)(0.739)0.472
0.578 (0.5)(0.739)
i ii k i kO
ii k
r k r k r k r k
r k r k r k r k
=
− + −=
− + −
+=
+
Similarly, the Grey relation for the other linguistic variables of another risk decision
factors (i.e., Severity S and Detectability D ), can be further estimated. The results of these
calculations, including for risks events B and C, are summarized in Table 5-7 below:
Table 5-7. Example of Grey relation coefficient.

CHAPTER 5-CONCEPTUAL FRAMEWORK AND ANALYSIS MODELS
Page 123
Risk O S D
A 0.472 0.588 1.000 B 0.517 0.641 0.403 C 0.843 0.433 0.472
5.4.6 Degree of Relation Determination
The degree of relation from a group of stakeholders, ( ),i jr r denotes the relationship
between the potential causes and the optimum value of the decision factors. The degree of
relation for each risk can then be calculated following Eq. 5-9.
( ) 1
, ( ), ( ) , 1,...,K
n ni j i jk
r r r k r k k K=
= = (5-9)
For instance; the Grey relation for event A can be calculated as:
( ) 0.472 0.588 1.000 2.060,A i jr r + + = = . Accordingly, the degree of Grey relation for events B
and C are calculated in the same way. Finally, the degree of Grey relation value is normalized
using Eq. 4-10.
, 1, 2,..min
n
nn n N
n
= Norm Γ (RPV)Γ
Γ (5-10)
The normalization intends to produce a RPV for respective risk event. Importantly,
the RPV will be used as an important element of RA in the further phases of the conceptual
framework. This entails that the RPVs with the highest value gets the highest priority for
attention. Based on the analysis result derived from Fuzzy-based FMECA model, the
identified risk events then ranked according to the descending order of the RPVs. The
summary of the results for the example applied is shown in Table 5-8. From Table 5-8, it can
be seen that risk event B would be at the top of the list for priority then followed by risk
events C and A.
Table 5-8. Grey relation coefficient and degree of Grey relation information.
Risk O S D Grey relation (RPNs) RPVs Ranking A 0.472 0.588 1.000 2.060 0.757 3 B 0.517 0.641 0.403 1.561 1 1 C 0.843 0.433 0.472 1.748 0.893 2
5.5 Phase 2: Risk Causality and Interaction Pattern Analysis
This phase examines how single risk event associates to another risk events. This phase also
realizes the risk relationships in the context of a threat of one risk event affecting, triggering,
or influencing another risk events. To analyze how risk propagating its impact, affecting both
other risk events, this phase applies Social Network Analysis (SNA). The SNA is concerned

CHAPTER 5-CONCEPTUAL FRAMEWORK AND ANALYSIS MODELS
Page 124
with the “structure and patterning” of the relationship and seeks to identify both the
relationship cause and effects [92]. Meanwhile, the social network theory views an UI system
as a systems environment which is supported by various relationships of aspects (e.g., social,
environmental, and economical).
The purpose of applying SNA is to examine how the behavior and relationship
structure of risk impact which is affecting not only to the community (actor) but also to other
risk events. This research, however, found the shortage of conventional SNA method as it
applies the expected value to measure an interrelationship between each event using
conventional Likert scale approach which generates a similar problem with FMECA method
discussed previously. Therefore, this study proposes Fuzzy-based SNA by integrating a
former SNA method with Fuzzy-rules to accommodate various stakeholder perceptions
towards the measurement of node interrelationship.
The proposed method focusing on the community participation towards assessing
risk impact, consequences and relationship variation. The main empirical method applied in
this study is the SNA. The SNA is an interdisciplinary endeavor which incorporates
mathematical, geographical, and computing methodologies which evolved from sociology
and anthropology. The advantage of SNA is its capability to captures, models and simulates,
and analyses the complex relationship between various nodes [208].
The method has been demonstrated by the high frequency of application in various
areas, not only in social science [184, 188, 189, 192, 209-211] but also in engineering field
[97, 183, 184, 186, 188, 191, 212-214], and risk management area [86, 92, 97, 127, 215].
Nonetheless, the application of SNA in UI system RA model development towards analyzing
the risk causality and interaction pattern is still an unexplored area. Further, another
challenge is that; the SNA is either not designed to capture the risk causality impact or
interconnections pattern that shape RA robustly.
Therefore, to examine the way of ‘structuring and patterning’ the risk causality and
interaction pattern robustly, therefore, this study applied a modified-participatory method
towards capturing the complex relationship of risks in datasets during the SNA processes.
To obtain community perceptions and preferences towards UI system risks, the data
collected, then processed into the preliminary matrix before finally used to simulate and
produce the risk network maps and topology decipherment respectively. The data
processing also includes calculating and defining the weight value for risks interrelationship.
Participatory methods describe a “….family of approaches, methods and behaviors to
enable local people to share, enhance and analyze their knowledge of life and conditions, and

CHAPTER 5-CONCEPTUAL FRAMEWORK AND ANALYSIS MODELS
Page 125
to plan, act, monitor and evaluate” [216]. Participatory data is developed through interactive
processes that involves discussions, exercises, and other types of facilitated activities.
Development professionals often use participatory tools to help understand risks [120]. The
risk causality and interaction pattern analysis model flowchart are depicted in Figure 5-5.
The flowchart stages are discussed in the following sub-sections.
R2
R3
R4Rn
R1 S1R1
S1R2
S1R3
S1R4S1Rn
S1-Hazard associated affecting S2
S1
Hazard event related (affecting) to single expert (S1)
R7
R10
R12
Rn
R5
S2R5
S2R7
S2R10
S2R12
S2Rn
S2
Hazard event related (affecting) to single expert (Sn)
S1-Hazard associated affecting S*
Stakeholder group
boundary
Stakeholder group
boundary
….Stakeholder group
boundary
S*
Risk-Risk network matrix
S1 judgment
boundary
Local S.R-S.R network matrix
Dichotomize
S 2 R 5 S 2 R 7 S2R 10 S 2 R 12 S 2 R n ●●● S * R #
S 1 R 1 1 1 1 1 1 . .
S 1 R 2 1 1 1 1 1 . .
S 1 R 3 1 1 1 1 1 . .
S 1 R 4 1 1 1 1 1 . .
S 1 R n 1 1 1 1 1 . .
●●● . . . . . . .
S * R # 1 1 1 1 1 . .
Global S.R-S.R network matrix
S 2 R 5 ●●● ●●● S * R #
S 1 R 1 … … … …
●●● … … … …
●●● … … … …
S * R # … … … …
Large scale adjacency matrix
Collide and unified all of the local matrices
data into single global matrix
Rij=1, if there’s any relation between
one Rn with another Rn.Otherwise, Rij=0
Global R-R adjacency matrix
1 2
1
2
n
n
R R R
R
R
R
1 2
1
2
0 1 1
0 0 0
0 1 0
n
n
R R R
R
R
R
Network analysis and discussion
Identify and determine
the stakeholder groups
Data collection
Identify and determine
the hazards events
Targeted respondents
Design-based
questionnaire
Preliminary stepSpecific urban infrastructure
system case study boundary
Network visualizationTopology measurement- Degree (link)
- Degree centrality
- Closeness centrality
- Betweenness centrality
- Eigenvector centrality
Model Simulation
Risk picture, analysis and evaluation
Data processing
Figure 5-5. Risk causality and interaction pattern analysis model flowchart.
5.5.1 Stakeholder and Risk Event Identification
The first stage refers to the preliminary phase of the conceptual framework. Any social
network study requires to begin with defining who and what is the actor, and event
respectively in the research scope [185]. In addition, it also requires to considers the tie
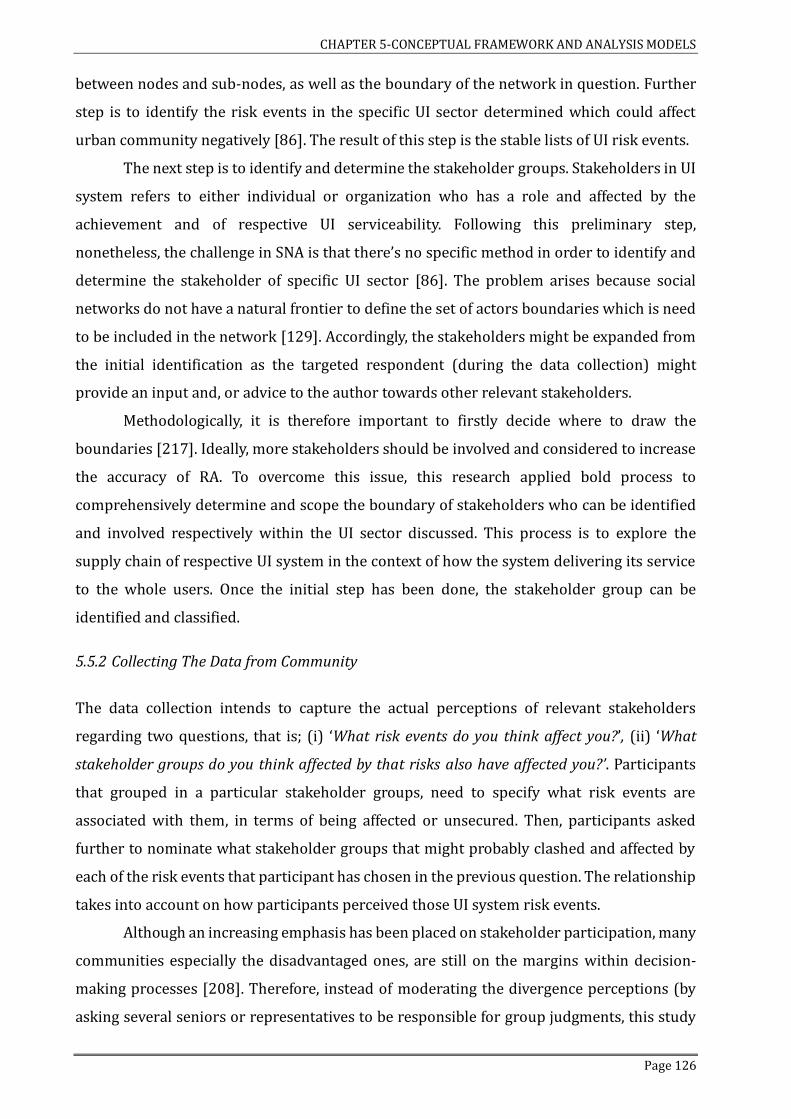
CHAPTER 5-CONCEPTUAL FRAMEWORK AND ANALYSIS MODELS
Page 126
between nodes and sub-nodes, as well as the boundary of the network in question. Further
step is to identify the risk events in the specific UI sector determined which could affect
urban community negatively [86]. The result of this step is the stable lists of UI risk events.
The next step is to identify and determine the stakeholder groups. Stakeholders in UI
system refers to either individual or organization who has a role and affected by the
achievement and of respective UI serviceability. Following this preliminary step,
nonetheless, the challenge in SNA is that there’s no specific method in order to identify and
determine the stakeholder of specific UI sector [86]. The problem arises because social
networks do not have a natural frontier to define the set of actors boundaries which is need
to be included in the network [129]. Accordingly, the stakeholders might be expanded from
the initial identification as the targeted respondent (during the data collection) might
provide an input and, or advice to the author towards other relevant stakeholders.
Methodologically, it is therefore important to firstly decide where to draw the
boundaries [217]. Ideally, more stakeholders should be involved and considered to increase
the accuracy of RA. To overcome this issue, this research applied bold process to
comprehensively determine and scope the boundary of stakeholders who can be identified
and involved respectively within the UI sector discussed. This process is to explore the
supply chain of respective UI system in the context of how the system delivering its service
to the whole users. Once the initial step has been done, the stakeholder group can be
identified and classified.
5.5.2 Collecting The Data from Community
The data collection intends to capture the actual perceptions of relevant stakeholders
regarding two questions, that is; (i) ‘What risk events do you think affect you?’, (ii) ‘What
stakeholder groups do you think affected by that risks also have affected you?’. Participants
that grouped in a particular stakeholder groups, need to specify what risk events are
associated with them, in terms of being affected or unsecured. Then, participants asked
further to nominate what stakeholder groups that might probably clashed and affected by
each of the risk events that participant has chosen in the previous question. The relationship
takes into account on how participants perceived those UI system risk events.
Although an increasing emphasis has been placed on stakeholder participation, many
communities especially the disadvantaged ones, are still on the margins within decision-
making processes [208]. Therefore, instead of moderating the divergence perceptions (by
asking several seniors or representatives to be responsible for group judgments, this study

CHAPTER 5-CONCEPTUAL FRAMEWORK AND ANALYSIS MODELS
Page 127
exempts this issue by asking participant individually and independently regarding their
affectedness and relation against various determined risk events. Correspondingly, the data
collected from different individuals does not need to be combined or averaged to produce
the global result.
5.5.3 Preliminary Matrix Development
Risk causality and interaction pattern (interconnections) are numerous and would be
difficult to convey with a narrative. Consequently, the data obtained from survey is then,
processed, and the preliminary matrix named ‘local stakeholder-risk associated (S.R)’ matrix
[S.R]’, constructed. The [S.R]’ is developed to inform and facilitate the identification of
relations among ‘stakeholders-risk associated’ based on stakeholder groups boundary. The
[S.R]’ follows and extends the concept of matrices applied within the network studies [86,
92, 218, 219]. The equation 5-11 below applied to develop the [S.R]’.
1
0 otherwiseg gi n j m
g g
i n j mn N m M g G
i n j m S R S R
S R S RS R
→
=
,( , )( , ) ,
.,
(5-11)
In this research, a qualitative scale of entries from Boolean domain B 0,1= issued
for assessing the interactions and interrelationship of (S.R). The value of 1 indicates that
respective individual stakeholder i (from particular group g ), which is associated or
affected with specific risk event n g
i nS R
, express that their risk events affects other
stakeholder groups and 0 is vice versa. Subsequently, the global S.R matrix [S.R]’’ can be
developed using equation 5-12 bellow. The [S.R]’’ is a matrix referred to as a ‘one-mode
incidence matrix’ or an ‘affiliation matrix’ which shown a non-tie directly between (S.R)
nodes, only ties connecting (S.R) to (S.R).
, , , ,( , )( , ) ,
1.
0 otherwise
,,G Gi n j m
g g
i n j mi I n N g G j J m M g G
i n j m S R S R
S R S RS R
→
=
(5-12)
Once the [S.R]” formed, the next step is to build the global risk matrix (GRM) using
equation 5-13. The GRM is described by a rectangular matrix ,
.,,
GRMn m
nm R RR R = . The GRM
is the logic matrix (or relation/disjoint K ) of the network which shows the preliminary risk-
risk connectivity and interaction. In GRM structure, the risks interaction is considered as the

CHAPTER 5-CONCEPTUAL FRAMEWORK AND ANALYSIS MODELS
Page 128
existence of a possible precedence relationship between two risk events and n m
R R .
The UI system risks are the product of a complex set of networked processes. Hence,
a relationship component (whether functional, structural or physical) means that risks,
which may be related can be linked, since a risk (risk events or disturbances) on one
component may have an influence on another. Nevertheless, GRM cannot used as a main data
set to the network simulation and topology analysis. This due to the GRM element is the
result of summarized various participants perception towards their associated risk events
and the impact which is affecting other specific stakeholder groups.
, , , ,
,,
,, , , ,
,,. ,
,,n m
I J N M Gg g
nm nm i n j m nmR Ri j n m g
R R R S R S R R= = → (5-13)
The GRM is a matrix that shows, approximately, how risk events are related. Since risk
events can be represented as nodes, and connections as edges, the GRM (which is an
adjacency matrix) offers the essential foundation to perform network analysis. Many current
network models have ignored the interaction strength between nodes and assume that each
link is equivalent. Nonetheless, in real world, many networks are intrinsically weighted.
The nodes and links have different weights, and the variations of their interaction
strength are significant for carrying out their basic analysis functions. Henceforth, this
research develops model to define the nodes interaction weight value for the GRM. By
applying the nodes interaction weight value, the risk network can be analyzed more precise
by weighting how risk events influenced each other.
5.5.4 Produced Global Matrix with Weight Relation Link
To deal within the issue mentioned in previous sub-section, this research applied the
dichotomize method prior to the network simulation. In this step, the GRM .nm
R R is
dichotomized to obtain a value for each matrix sheet, regarded as a weighted interaction link
between risk events. Although there are several dichotomize methods in network studies
[220, 221], unfortunately, there is no silver bullet towards appointing the most effective
dichotomize method.
Above all, one of the problem with dichotomizing the respective matrix prior to do
the network simulation, is that; there can be a loss information [198]. Hence, this research
proposes a novel dichotomize model to determine the interrelationship link weight value of
UI system risk events. The dichotomize equation is defined as equation 5-14 bellow.

CHAPTER 5-CONCEPTUAL FRAMEWORK AND ANALYSIS MODELS
Page 129
( ) 1
,. .
,,n m
nm nmnm R RR R R R R −= = (5-14)
where; ( ),, ,max .
,,n m
nm R Rn N m M n mR R
=
denotes the risk events interaction capacity defined
as the weighted link with specific threshold. While, is a coefficient pointed as 0.2 which is
determined in an Ad-Hoc approach. Notably, this research assumed that risk impact does not
affect itself. In the GRM structure, hence, each risk event does not has link with itself (loop
impact and interaction link). Following this assumption, therefore 0nn mm
R R= = .
Table 5-9. The network indicator in the context of risk causality and its interaction.
SNA indicators Description Degree (DEG) Indicates the number of risk events that particular risk associated and/ or
influenced. This network indicator indicates the immediate connectivity characteristic of particular rick event (as a node).
Degree Centrality (DC) Exposes the potentiality of a specific risk propagate its impact and connectivity to other risk events through the network.
Betweenness Centrality (BC) Reveals the incidence with which given risk node falls between two other risk nodes. It represents the node as a gatekeeper or a toll-taking role for controlling risk impact flows through the network. Particular risk events with high BC value have potential capacity and power towards threaten to stop transmitting, making other risk event use less efficient paths to spread its impact and affect one another within the network.
Closeness Centrality (CC) Point out the distance of a risk event to connect with others by focusing on the shortest paths. Particularly, CC specify the capacity for risk event disseminating its impact to whole risk events. A risk event node that has a high CC score can also potentially reach and affect the central risk network very quickly.
Eigenvector Centrality (EC) The EC takes into consideration the centrality of the other trades to which one is connected. This network measurement appraises the risk event popularity in the sense that a node with high EC is connected to nodes that are themselves well connected.
Status Centrality (SC) Computes the relative influence of a node within a network by measuring the number of immediate neighbors and also all other nodes in the network that connect to the node under consideration through their immediate neighbors
The final GRM is then applied to model and simulate in an one-mode network analysis
which then used to generate the risk network topology representations. Further, a
topological analysis is performed on this network, with the aim of giving complementary
information and prioritizing some risks in relation to their structure and position in the risk
network. Several network topology representations are utilized to decipher the structural
configurations of the risk events nodes relations by calculating a number of SNA indicators.
The SNA indicator applied in this research is; degree (DEG), degree centrality (DC),
betweenness centrality (BC), closeness centrality (CC), eigenvector centrality (EC) and status
centrality (SC). The basic description for each of the network topologies applied can be seen
in [180, 186, 189, 191]. Specifically, the SNA indicators and its descriptions for the risk
causality and interaction pattern analysis shown in Table 5-9. The higher centrality score

CHAPTER 5-CONCEPTUAL FRAMEWORK AND ANALYSIS MODELS
Page 130
indicates that certain risk event nodes, through their numerous link to others, are emerging
as key figures in holding this network together.
5.6 Phase 3: Risk Impact to Community Analysis
Communication between stakeholder groups in the UI system context is paramount to the
UI system’s reliable service. Thus, involving stakeholders in the process of assessing risks
makes a lot of sense. The stakeholders will have a good understanding of their boundary
area and the risks involved. When identifying risks and controlling hazards it is necessary to
understand the importance of involving different parties during the process. Different
stakeholders have different roles within the development of UI system and are likely to differ
in the way they like to have information communicated to them.
To examine the significant risk events by way of ‘structuring and patterning’ the
relationship between actors (individual) and the events (risks), this research applied two-
mode SNA. This phase extends these areas and applies them in the field of UI system RA.
Moreover, study pertaining to the social network in the context of analyzing the dynamic of
UI risks interrelationship and impact affecting community is still an unexplored area. The
advantage and superiority of the two-mode SNA can be seen in [190, 198]. The model
develops in this phase is based on gathering and assembling the exchange of perception-
based information towards stakeholder-risk associated.
The model follows general steps of standard SNA, including: (1) Identifying the
boundary of the network; (2) Assessing meaningful and actionable relationships; (3)
Visualizing the network; (4) Analyzing the network data; and (5) Presenting the analysis
results. The two-mode SNA-based RA model flowchart is depicted in Figure 5-6. Similar to
the previous phase, any social network study requires to begin with defining who and what
is the actor and event respectively in th research scope, what should be considered as a tie
between nodes and sub-nodes, and what should be the boundary of the network in question
[185].
Following the flowchart in Figure 5-6, the preliminary step is to identify the risk
events in the specific UI sector discussed which could affect urban community negatively
[86]. The result of this step is the stable list of risk events. The next step is to identify and
determined the stakeholder groups towards determined UI sector as a problem boundary.
Similar like the previous phase, stakeholders in specific UI sector can be stated as either
individual or organization who has a role and affected by the achievement and of UI
serviceability system.

CHAPTER 5-CONCEPTUAL FRAMEWORK AND ANALYSIS MODELS
Page 131
Identify and determine
the stakeholder groups
Data collection
Identify and determine
the hazards events
Input data (0,1)
Targeted respondents
within the specific
stakeholder groups
Design-based
questionnaire
Network visualization
Convert to
Bipartite
matrix
Risk picture and evaluation
Data processing
Preliminary step
Result analysis- Global network topology analysis
- Risk event ranking based on each of the topology measurement
- Output comparison with conventional RA
1 2 3
1
2
3
(...) (...) (...) (...)
(...) (...) (...) (...)SRM
(...) (...) (...) (...)
(...) (...) (...) (...)
n
j
R R R R
S
S
S
S
=
0 0 (...) (...)
0 0 (...) (...)
(...) (...) 0 0
(...) (...) 0 0
S R
S
R
Bipartite matrix
Topology measurement- Degree (link)
- Degree centrality
- Closeness centrality
- Betweenness centrality
- Eigenvector centrality
Stakeholder-Risk affiliation matrix
Model Simulation
Concentric map
- Main input data set
Specific urban infrastructure
system boundary
Figure 5-6. Risk impact to community analysis model flowchart.
Nonetheless, the challenge is there’s no specific method in order to identify and
determine the stakeholder of specific UI sector [86]. The problem arises because social
networks do not have a natural frontier to define the boundaries of the set of actors in which
to be included in the network [129]. Methodologically, it is therefore important to decide
where to draw the boundaries [217]. Ideally more stakeholders should be evolved and
considered to increase the accuracy of risk impact to community analysis.
To overcome, this research applied a bold processes in order to scope the boundary
of stakeholders who involved and can be identified within the discussed UI system. The

CHAPTER 5-CONCEPTUAL FRAMEWORK AND ANALYSIS MODELS
Page 132
process is to explore the supply chain of respective UI in the context of how the system
delivering its service and product to the whole users. Once the initially step has been done,
the stakeholder can be identified and classified in a group formate.
5.6.1 Data Collection from The Community
The next step is data collection. This phase, adapts the participatory method to capture the
interrelationsihp dynamics between risk events with individual in datasets. Participatory
method describes as;
“……family of approaches, methods and behaviours to enable local people to chare, enhance
and analyse their knowledge of life and conditions, and to plan, act, monitor and evaluate”
[222].
Accordingly, participatory method also structured in a way that is particularly well-
attuned for engaging with complex problems. Bear in mind, as complexity increases it
becomes more difficult to explain the world with broad and centralised frameworks.
Participatory tools shift knowledge downward while, through the support of facilitators, still
maintaining a broader macro perspective, thai is; a knowledge combination that is vital for
understanding complex system [120].
Following the data collection method in previous phase, participants need to specify
what risk events are associated with them. This association refers to what risk events are
affecting or associating with each participant. This process intends to capture the actual
perceptions of the relevant stakeholders (participants) regarding; ‘who’ associated and
affected with ‘what’. There is no literature limiting the number of participant involved in the
data collection processes, however, the more people participating the better risk impact to
community analysis.
5.6.2 Developing Stakeholder-Risk Affiliation Matrix
The data obtained from survey processed and the stakeholder-risk associated (SRM) matrix
constructed to inform the identification of relations among stakeholders and risk events. The
SRM follows and extends the concept matrices in the network study applied in previous
studies [86, 92, 218, 219, 223, 224]. Proportionately, the SRM is represented by a two-mode
matrix which shown a non-tie directly between actors, nor would there be ties between
events, only ties connecting actors to risk events.

CHAPTER 5-CONCEPTUAL FRAMEWORK AND ANALYSIS MODELS
Page 133
Since both events and actors can be represented as nodes, and connections as edges,
the SRM offers the foundation to perform network analysis. The SRM can be expressed by a
rectangular matrix SRMni
in S Rsrm
=
which is the logic matrix (or relation/disjointK ) of
the network. In this research, a qualitative scale of entries from Boolean domain B 0,1=
issued for assessing the interactions of stakeholders and risk events interrelationship. Based
on Boolean domain, the value of 1 indicates that respective stakeholder ( )iS related/affected
with particular risk events ( )nR , and 0 is vice versa (see equation 5-15).
( )1 , K
0 otherwisein
i nsrm
=
(5-15)
Although an increasing emphasis is placed on stakeholder participation, many
communities especially the disadvantaged ones, are still on the margins in decision-making
processes [208]. In this research, instead of moderating the divergence perceptions, this
study exempts this issue by asking participant individually and independently regarding
their affectedness and relation against various UI system risk events. Therefore, the data
collected from different individuals does not need to be combined and, or averaged.
Following the developed SRM, reading vertically by column can helps to identify the
risk events that affect stakeholders, or what is often referred to as risk ‘impact-ability’; those
affected negatively the community. These risk events are analogous to impact vector, ripple
impact that can transmit negative consequences and disturbances to stakeholders.
Importantly, impact vector is a key strategy for community security intervention; likewise
addressing these overarching risks can be a mechanism for reducing UI risk impact on
community [120].
Importantly, the two-mode data can be analyzed in distinct way. The most commonly
used methods are either converting to one-mode data or analyzing it directly as a bipartite
graph [182, 198]. Nonetheless, one of the problem with converting the affiliation matrix to
one-mode is that some information can be loss [198]. This research, therefore applies the
bipartite analysis approach [190, 225, 226]. The SRM converts into a bipartite matrix
structure in which the rows consist of both stakeholders and risk events, and the columns
also consists of both risk events and stakeholders.
The bipartite matrix [SRM] is then applied to model and simulate the bipartite
network visualization which then further used to generate the network topology
representations [198]. Visualizing the relations between stakeholders and risk events as a
network provides a much more accurate representation of complexity. The SRM network
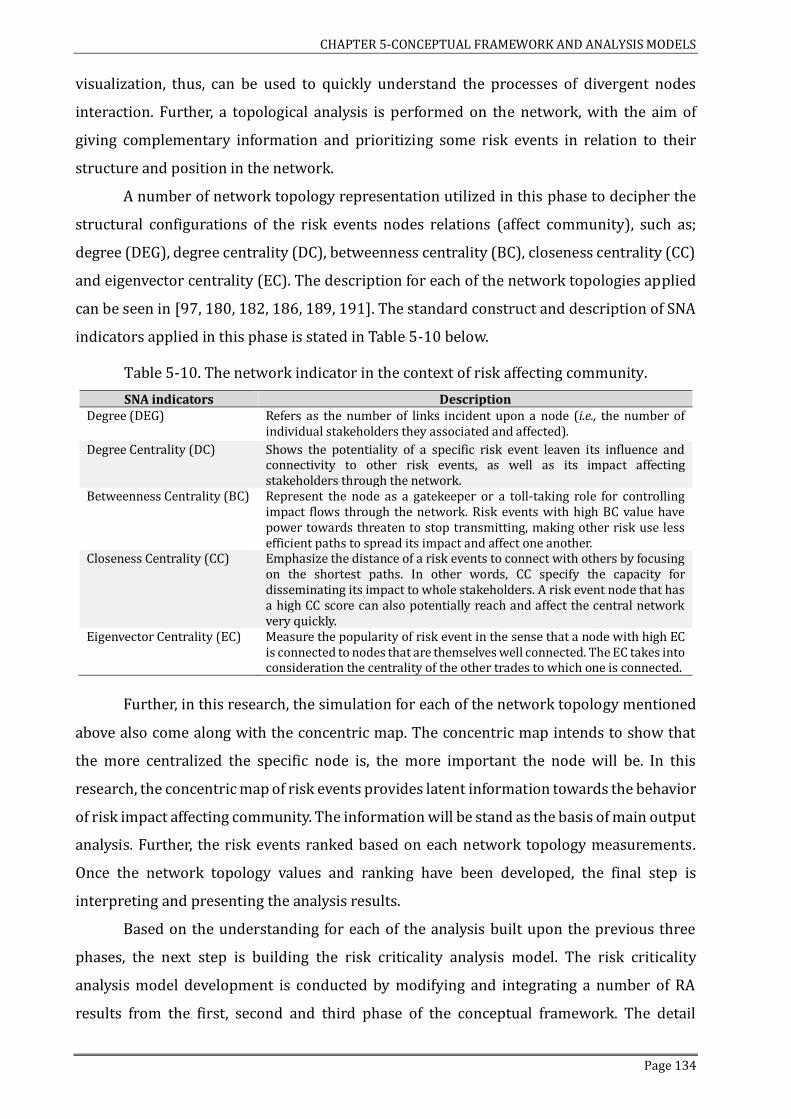
CHAPTER 5-CONCEPTUAL FRAMEWORK AND ANALYSIS MODELS
Page 134
visualization, thus, can be used to quickly understand the processes of divergent nodes
interaction. Further, a topological analysis is performed on the network, with the aim of
giving complementary information and prioritizing some risk events in relation to their
structure and position in the network.
A number of network topology representation utilized in this phase to decipher the
structural configurations of the risk events nodes relations (affect community), such as;
degree (DEG), degree centrality (DC), betweenness centrality (BC), closeness centrality (CC)
and eigenvector centrality (EC). The description for each of the network topologies applied
can be seen in [97, 180, 182, 186, 189, 191]. The standard construct and description of SNA
indicators applied in this phase is stated in Table 5-10 below.
Table 5-10. The network indicator in the context of risk affecting community.
SNA indicators Description Degree (DEG) Refers as the number of links incident upon a node (i.e., the number of
individual stakeholders they associated and affected).
Degree Centrality (DC) Shows the potentiality of a specific risk event leaven its influence and connectivity to other risk events, as well as its impact affecting stakeholders through the network.
Betweenness Centrality (BC) Represent the node as a gatekeeper or a toll-taking role for controlling impact flows through the network. Risk events with high BC value have power towards threaten to stop transmitting, making other risk use less efficient paths to spread its impact and affect one another.
Closeness Centrality (CC) Emphasize the distance of a risk events to connect with others by focusing on the shortest paths. In other words, CC specify the capacity for disseminating its impact to whole stakeholders. A risk event node that has a high CC score can also potentially reach and affect the central network very quickly.
Eigenvector Centrality (EC) Measure the popularity of risk event in the sense that a node with high EC is connected to nodes that are themselves well connected. The EC takes into consideration the centrality of the other trades to which one is connected.
Further, in this research, the simulation for each of the network topology mentioned
above also come along with the concentric map. The concentric map intends to show that
the more centralized the specific node is, the more important the node will be. In this
research, the concentric map of risk events provides latent information towards the behavior
of risk impact affecting community. The information will be stand as the basis of main output
analysis. Further, the risk events ranked based on each network topology measurements.
Once the network topology values and ranking have been developed, the final step is
interpreting and presenting the analysis results.
Based on the understanding for each of the analysis built upon the previous three
phases, the next step is building the risk criticality analysis model. The risk criticality
analysis model development is conducted by modifying and integrating a number of RA
results from the first, second and third phase of the conceptual framework. The detail

CHAPTER 5-CONCEPTUAL FRAMEWORK AND ANALYSIS MODELS
Page 135
explanation towards the development of the risk criticality analysis model development
(phase four) describes in the next section.
5.7 Phase 4: Risk Criticality Analysis
Prior to conduct the UI system robustness analysis, the ‘criticality of risk’ analysis model and
its equation must be defined and developed respectively. Although there is a strong
capability for the communities to assess UI system vulnerabilities, however without a better
understanding of the critical risk concept the robustness output will be less comprehensive.
This due to the fragmented RA which only represents part of total UI systems solution
towards the risk events. In this phase, the analysis model aims to assess quantitatively the
UI risks based on the three substantial elements (i.e., three RA mentioned in previous
phases).
Specifically, risk criticality refer to the level of risk impact by looking at its impact
characteristics, that is; (i) Risk magnitude, (ii) Risk causality and interaction pattern, and (iii)
Risk impact affecting the community [128]. The risk criticality model allows the
understanding of the integration between three risk impact characteristics. Therefore, a
broad structure of the risk and its impact can be respectively assessed and explored deeper.
Following the RPVs, (R-R) network and (S-R) network topology decipherment, the equation
to define the risk criticality is described in equation 5-16.
( )
R-R S-R
Top( ) Top( )
[R-R] [S-R]
Top Top, 0,1 , 0,1
( ) ( ), ,
( ) ( ) ( ) ( ) ( )
n nn n R R
n n n n nn N n Nn N n N
R f R
R R R R R
+
=
= (5-16)
, where
[R-R]
Top, 0,1
( ) ( )n nn N n N
R R
;
( ) ( ) ( ) ( ) ( )
[R-R]
DC OCC BC OSC EC
[R-
DC OCC BC OSC EC, 0,1 , [0,1] , [0,1] , [0,1] , [0,1]
RPV( ) ( ) ( ) ( ) ( ) ( )
( ) ( ) ( ) ( ) ( ) ( )
n n n n n nn N n N n N n N n N n N
n n n n n nn N n N n N n N n N n N
R R R R R R
R R R R R R
=
+ + + +
= + + + +
R]
, and
[S-R]
, 0,1
( ) ( )n Top nn N n N
R R
;

CHAPTER 5-CONCEPTUAL FRAMEWORK AND ANALYSIS MODELS
Page 136
( ) ( ) ( ) ( )
[S-R]
DC CC BC EC
[S-R]
DC CC BC EC, 0,1 , [0,1] , [0,1] , [0,1] , [0,1]
RPV( ) ( ) ( ) ( ) ( )
( ) ( ) ( ) ( ) ( )
n n n n nn N n N n N n N n N
n n n n nn N n N n N n N n N
R R R R R
R R R R R
=
+ + +
= + + +
where, ( )nR is the risk n magnitude resulted from the first phase analysis, ( )[R-R]
DC ( )nR
denotes the normalization of the R-R network DC, ( )[R-R]
OCC( )nR denotes the normalization
of the R-R network OCC, ( )[R-R]
BC ( )nR denotes the normalization of the R-R network BC,
( )[R-R]
OSC ( )nR denotes the normalization of the R-R network OSC, ( )[R-R]
EC ( )nR denotes the
normalization of the R-R network EC, ( )[S-R]
DC ( )nR denotes the normalization of the S-R
network DC, ( )[S-R]
CC ( )nR denotes the normalization of the S-R network CC, ( )[S-R]
BC ( )nR
denotes the normalization of the S-R network BC, ( )[S-R]
EC ( )nR denotes the normalization of
the S-R network EC, [ ]
Top ( )n
n N
R•
denotes the sum of the defined risk event n network
topology.
Accordingly, the risk criticality model analysis develops in this phase justified the
second research question (RQ2) as stated in Chapter 1. To remind the reader, the RQ2 is;
RQ2: How to conceptually model the variables and functions, and empirically quantify the
critical risk based on the risk characteristic and impact mechanism?
5.8 Phase 5: System Robustness Analysis
The UI systems are at risk from threats that urban community may not yet foresee. Prudent
risk management demands that community could anticipate the threats to whole aspects of
UI design systems that are inherently safer and more resilient and be prepared to restore
them when they fail. The resilient model develops in this research aim to assess
quantitatively the robustness capacity of the defined UI system facing specific risk event
(disturbance). The robustness capacity analysis model flowchart is depicted in Figure 5-7.

CHAPTER 5-CONCEPTUAL FRAMEWORK AND ANALYSIS MODELS
Page 137
Identify and determine the hazards events
Identify and determine the stakeholder groups
System identification
Risk criticality model development
Develop stress capacity and impact model
Develop shock capacity and impact model
Defining system-of-interest resilience over time model
Develop system robustness capacity
analysis model
Determine the scenario-based
recovery strategy
Model simulation
Model integration and adjustment
Conceptual model development
Analysis and discussion
Input data and assumption applied
Syst
em r
obu
stn
ess
anal
ysi
s
Data processing
Data collection
Design-based questionnaire
Targeted respondents
Shocked impact modelStress impact modelExpected recovery scenarioRecovery model sce.1Recovery model sce.2Recovery model sce…..Recovery model sce.n
Figure 5-7. Robustness analysis conceptual model flowchart.
5.8.1 System of Interest Definition
Let S be the system of interest for the resilience study (in this research refers to the defined
UI system). When considering resilience, the system experiences three distinct states; (i)
Original state, 0S , (ii) Disrupted state, dS , and, (iii) Recovered state, fS . Further, the system
also experiences three transitions; (i) System disruption (from original state to the disrupted
state), (ii) System withstand (from disrupted state to the pre-recovery state) and (iii) System
recovery (from the pre-recovery state to the recovered state). In addition, there are two
events that trigger and enable the last two transitions, that is; a disruptive (risk) event and
resilience action.
Figure 5-8 illustrates that initially the system exists in a stable original state 0S . A risk
event then occurs that triggers system disruption (due to internal and/or external factors).

CHAPTER 5-CONCEPTUAL FRAMEWORK AND ANALYSIS MODELS
Page 138
As a result, the system enters a disrupted state dS . In response, the resilience action is taken,
which triggers recovery processes, enabling the system bouncing back to a recovered state
fS . It must be noted that the recovered state fS could be the same, similar or different from
the original state of the system 0S .
Figure 5-8. Delivery function transition in resilience.
5.8.2 Figure-of-Merit or System Function
It is important to note that, to quantify system resiliency, the risk affecting the system is
synonymous with the unambiguous identification of a quantifiable and time-dependent
system level delivery function. In the system resilience study, this definition also can be
defined and symbolized as ‘Figure-of-merit’ (FOM) and ( )F • respectively [48, 51, 112, 227,
228]. Importantly, the ( )F • is the basis for the computation of system resilience. The
common use representations of this function can be network, connectivity, flow or delay as
applicable to the system under consideration.
Any state of S is characterized by a corresponding value of ( )F • , and it is assumed
that the two events (i.e., disruptive event and resilience action) directly affect its value. It is
important to mention that Figure 5-8 is the representative of a FOM for which increasing
values are considered better (e.g., reliability, flow, connectivity paths, etc). For the case where
the decreasing values are preferable1
( ) ( )G F−
• = • should be considered.

CHAPTER 5-CONCEPTUAL FRAMEWORK AND ANALYSIS MODELS
Page 139
As described in Figure 5-8, 0( )F t describes the delivery function value of the system
corresponding to state 0S . This state remains constant until the occurrence of the disruptive
event at time hzt . Then, it transits to the final disrupted state of the system dS at time het ,
where its value ( )he
F t is lower than its original value 0( )F t . Further, the system remains in dS
with disrupted delivery function value ( ) ( )he hd
F t F t= until it comes to the so called ‘Slack time’.
The ‘Slack time” refers to the maximum amount of time after disturbance occurred
for community to initially recover with remaining resources, that is acceptable before actual
recovery action ensues. In other words, during the period of hdt t t an initial set of
actions have been taken to stabilize the system at some intermediate state before substantive
recovery action started at time t . Finally, as a result of the recovery action, the system
recovers to a recovered state fS with delivery function ( )f
F t value at time ft .
It should be noted that; the two events viz; disrupted event and resilience action that
trigger the transitions system disruption and system recovery respectively, need not be a
one-time step events. Rather, both the events could vary as a function of a time, and the
resulting transitions could also have different variations with time and not necessarily a
linear one. Figure 5-8 is an illustration to describe the overall variation of the delivery
function or FOM of system facing disturbance over time during resilience analysis. Further,
it is also possible in some cases for the system disruption to continue until the recovery
action is initiated, that is; the time steps het and hdt could coincide with no steady disrupted
state dS .
Though this phase discusses only a single FOM, in real world, it is common for
multiple FOM to be considered for a single system under consideration. Hence, for a holistic
analysis of system resilience, the analysis should respect to all FOM that are relevant and
important. Finally, the final state, fS , does not necessarily have to coincide with the original
state of the system. That is, in terms of the FOM and based on the recovery actions, ( )f
F t can
be; (i) Equal to 0( )F t , (ii) Greater than 0
( )F t or, (iii) Smaller than 0( )F t .
5.8.3 Disruptive Event
In Figure 5-8, S enters a disruptive state due to a disruptive event that involves the reduction
of the delivery function value. While there are many events that could affect S , this alone is

CHAPTER 5-CONCEPTUAL FRAMEWORK AND ANALYSIS MODELS
Page 140
not sufficient for the event to be considered disruptive. An event considered disruptive if and
only if it affects the system S in such a way that the value of the FOM ( )F • is reduced.
Considering the illustrations in Figure 5-8 above, a disruptive event is one that affects S such
that the original value of the FOM is reduced to as 0( ) ( )
dF t F t . Moreover, only then can a
system in state 0S enter a disrupted state dS .
In system where multiple FOMs are considered, an event could be disruptive with
respect to one FOM but not disruptive with respect to one FOM. Let E represents the set of
all disruptive events, 1 2, ,..., nE e e e= . Then, the set of disruptive events R can be defined as
0( ) ( )j jdR e E F t e F t= . It should be noted that the system-of-interest resilience
over time explanation above does not cover all the detail mathematical instruments and
indicators. It is, rather, designed to facilitate general understanding for readers towards
developing the risk-based robustness analysis model for UI system in this research.
5.8.4 Recovery System Action as a Function of Time
A successful recovery action is one that restores the system to stable recovered states fS from
a disrupted state dS . Mathematically, the system stable recovered states can be obtained by
improving the system robustness capacity value of ( )F • from ( )d
F t to ( )f
F t , between time st
and ft , as illustrated in Figure 5-8 . The robustness function captures the effect of the
disaster, but also the result of responses and recovery, the effect of restoration and
preparedness. To increasing the value of ( )F • , it is pivotal to firstly understand the UI
system behavior and capacity encounter both the main shock and stress events which is
triggered by critical risk impact.
The UI system behavior and capacity level need to be analyzed before the recovery
strategy and actions plan developed towards enhancing the UI system robustness capacity.
The UI system robustness analysis metric proposes in this research incorporates two
disturbance capacities state models, that is; shock and stress events. The models are in
accordance to previous efforts to defined basic system-of-interest resilience over time [7, 51,
56, 68, 69, 229], in that it describes how the system delivery function collapse or changes
due to a disruptive event and how the system ‘bounce back’ from such distress state to
normalcy.
Unfortunately, most of the recovery models available in the literature, including the

CHAPTER 5-CONCEPTUAL FRAMEWORK AND ANALYSIS MODELS
Page 141
“PEER equation framework” developed at the Pacific Earthquake Engineering Research
Center (PEER) [187], are loss estimation models that focus on initial losses caused by
disaster, where losses are measured relative to pre-disaster conditions. The temporal
dimension of post-disaster loss recovery is not part of that formulation. As indicated in
Figure 5-8, the recovery time and the recovery path are essential for evaluating resilience, so
they should be estimated accurately.
Most of the common loss models, evaluate the recovery path and time in static
(undynamic) behavior and crude terms, and assume that within one year, everything returns
to normal. However, as shown in Figure 5-8 the system considered may not necessary return
to the pre-disaster baseline performance. It may exceed the initial performance, when the
recovery process ends, in particular when the UI’s system may use the opportunity to fix pre-
existing problems inside the system itself.
On the other hand, the system may suffer permanent losses and equilibrate below the
baseline performance. These considerations show that the recovery process is complex and
influenced by time dimensions, spatial dimensions and by interdependencies between
different economic sectors that are interested in the recovery process. Therefore, different
infrastructure types that belong to the same community, but are located in different
neighborhoods (location), have different recovery paths.
Concisely, the recovery process shows disparities among different geographic regions
in the same community, showing different rates and quality of recovery. Modeling recovery
of a single urban infrastructure type system or of an entire community is a complex subject.
These two processes are intercorrelated and cannot be assumed to be independent.
Information on comprehensive models that describe the recovery process is very limited.
5.8.5 Main Shock Function Transition Model Development
In this research, there are two aspects of resilience action that need be defined a priori: (1)
The component recovery mechanism and, (2) The resilience plan and strategy. These two
aspects are crucial within the development of system robustness analysis model proposes in
this phase. Computationally, when analyzing large complex system especially for UI system,
it may not be possible to consider every possible failures/ disruptive event. Therefore, a
worst-case scenario approach and average scenario approach may have to be considered in
order to develop a resilience strategy for the critical risk event.
To define the component of recovery mechanism, this research firstly develops a main
shock capacity model. The main shock refers to the highest disturbance impact made by

CHAPTER 5-CONCEPTUAL FRAMEWORK AND ANALYSIS MODELS
Page 142
specific risk event affected the system-of-interest until its capacity collapsed. In other words,
it also defines the maximum UI system capacity to withstand the disturbance impact to
maintain its serviceability in steady condition ( )0 to hzt t
. The shock graph model is depicted
in Figure 5-9.
Figure 5-9. Main shock function transition over time.
Following the figure 5-9, the main shock refers to the specific risk impact ( nR
occurred at time hzt ) totally affecting the system-of-interest reaching failure state at time het.
In other word, the UI system capacity and serviceability are collapse and dull respectively. In
the condition after disturbance occurred, the delivery function of the system ( )F t is null ( )het
.
This state remains constant since there is no recovery action ( ) to he ft t
. Further, the main
shock model, for each of the risk events SHOCK CAP.( )
nF R , can be calculated via equation 5-17
below.
( ) ( ) ( ) ( )
( )
0
SHOCK CAP. 0
[R-R] [S-R] [R-R] [S-R]
Top( ) Top( ) Top( ) Top( )
Top(
( ) ( ) ( )
( ), , ( ), ,
( ),
fhz
n n n nn n
he
nn
n he
tt
n R R n R RR R
t t
n RR
F R F t F t
f R dt f R dt
f R
= −
= −
=
( )[R-R] [S-R]
) Top( ), 0
( ), 1, 2,...,
nR
nR n N
−
= =
(5-17)

CHAPTER 5-CONCEPTUAL FRAMEWORK AND ANALYSIS MODELS
Page 143
where, ( )n
R is the risk event n magnitude, ( )[R-R]
Top( )nR denotes the network topology
indicators for the respective risk event within (R-R) network, ( )[S-R]
Top( )nR denotes the
network topology indicators for the respective risk event within (S-R) network. Further, the
main shock for respective risk event ( )n
R , SHOCK CAP.( )
nF R , need to find the objective below;
SHOCK CAP.max: ( )nF R
where, obtain the above objective need to satisfy the three conditions below;
C1. max , 1,....,nR n N =
C2.
[R-R]
DC
[R-R]
BC
x[R-R] [R-R]
Top( ) OCC ,
[R-R]
OSC
[R-R]
EC
max
max
max max , R-R R-R where; 0,
max
max
nnm
N N
R n m nmRR n m
= = =
C3.
( )
( )
( )
( )
[S-R]
DC
[S-R]
CC x[S-R]
Top( ) ( , )( , ) ,[S-R]
BC
[S-R]
EC
max
maxmax = , S-R S-R
max
max
ni n
I N
R i I n N S R
=
The objective above indicates three main conditions need to be maximized, that is; (i)
Risk magnitude, (ii) Risk causality and interaction pattern (R-R), and (iii) Risk impact to
community (S-R). To obtain the SHOCK CAP.maximum: ( )
nF R , the input parameters has to fulfil
requirement below.
x
( , )( , ) ,
x
( , )
( , , ), ( , , ) [1,10], 1,....,
max ( ) S-R S-R , ( , ) 1
R-R R-R
Rn
i n
I N
n i I n N S R
N N
n m
f O S D O S D n N
R i n
=
=
= , ( , ) 1, where; otherwise 0nmR
n m n m
5.8.6 Main Stress Function Transition Model Development
The stress model development considers the real value of risk criticality for respective risk
event ( )n
R . The UI system stress transition over time is illustrated in Figure 4-10 below. The
equation to compute the stress capacity of respective risk event described as below;

CHAPTER 5-CONCEPTUAL FRAMEWORK AND ANALYSIS MODELS
Page 144
STRESS CAP.( ) ( ), 1, 2,...,
n nF R R n N= = (5-18)
Figure 5-10. Main stress function transition over time.
Following both the shock and stress capacity analysis model defined previously, the
system robustness capacity analysis model can be subsequently developed. Meanwhile,
robustness referring to engineering systems is, “the ability of elements, systems or other
units of analyst to withstand a given level of stress, or demand without suffering degradation
or loss of function [8, 58, 69]. It is therefore the robustness also explaining the residual
functionality right after the extreme event. Following the general understanding of system
robustness mentioned above, thus the generic system robustness equation towards
particular nR at the time hdt can be calculated using equation below:
( ) ( ) ( ) ( )
( ) ( )
1 1
ROB.
1
( ) ( ) ( ) ( ) ( )
1 ( ) ( )
1 ( ), 1,2,...
n n n n n
n n
n
F R R R R R
R R
R n N
− −
−
= −
= −
= − =
(5-19)
where, ( )n
R , ( )n
R , ( )n
R denotes to the main shock, stress and the normalized stress
capacity based on main shock value determined previously. The normalized stress capacity
is the element of [0,1] and ROB.( ) [0,1]
nF R .
The phase 5 of the empirical framework develops in this research justified the third
research question (RQ3) questioned in the Chapter 1 previously. To re-mind the RQ3 is

CHAPTER 5-CONCEPTUAL FRAMEWORK AND ANALYSIS MODELS
Page 145
stated in the box below. The risk criticality developed is applied as the basis model to the
system-of-interest REA and transform it into both shock and stress capacity as a function of
time. The equations developed in conjunction towards RQ3 are described in the Eqs. 5-17 to
5-19.
RQ3: How to empirically derive the risk-criticality analysis model into system-of-interest
robustness analysis as a function of time?
Following the fifth phase discussed previously, this research further develops a
“system recovery analysis model” as explained in phase 6. The recovery analysis model
intends to assess various possibility recovery strategies and scenarios. The analysis model is
based on the simulation-based resilience actions towards obtaining the optimum strategy
maximizing the UI system robustness capacity. By increasing UI system robustness capacity,
the system losses and resilience thus can be minimized and maximized respectively in the
period and post-of disturbances.
5.9 Phase 6: System Recovery Analysis
While the system resilience can be characterized by many system’s features and attributes,
the system recovery and its role are a vital element of strategies to improve resilience. The
dynamic aspect of REA refers not only to the disruptive event timing, but also to the resilience
strategies selected and actions conducted timing. Concisely, the recovery process shows
disparities among different geographic regions in the same community, showing different
rates and quality of recovery. Modeling recovery of a single urban infrastructure type system
or of an entire community is a complex subject. These two processes are intercorrelated and
cannot be assumed to be independent.
On the other hand, information on comprehensive models that describe the UI system
recovery process from extreme events is very limited. A rigorous risk-based recovery
analysis model would then significantly act and dictate an appropriate recovery action to be
taken. These actions could be reinforcing a system’s resistance to shock and stress events,
reorganizing resources and making structural adjustments to accommodate likely changes
or enhance preparedness for recovery operations [8]. The recovery model of system-of-
interest over time depicts in Figure 5-11.

CHAPTER 5-CONCEPTUAL FRAMEWORK AND ANALYSIS MODELS
Page 146
Figure 5-11. Recovery function transition over time.
The conceptual graph in Figure 5-11 illustrates the restoration and recovery function
transition over time towards enhance and achieve highest respective system-of-interest
robustness level. It is importantly to note that, among the key challenges when responding
during and after an extreme event or catastrophic incident is the direction and coordination
of response efforts. This issue is requiring an up-to-date situational awareness and
operational picture, which, however, might not become available within the first 24-72 hours
of an extreme event in the making [53, 230, 231].
Therefore, this phase adopts the concept of ‘post-disruption condition’ faced by the
system which is named as ‘Slack time period’. This ‘Slack time period’ refers to the way of
system-of-interest attempted to reach its delivery function capacity back to (partially)
similar condition when the disruption has not taking place. Accordingly, in the event of
disruption, effort to enhance the UI system robustness level from its disrupted state mainly
affected by the recovery and restoration strategies and actions which planned and decided
respectively.
Nonetheless, in the real environment the nature of the UI system recovery dictated
primarily by various pre-determined policies, capacity and capability readiness, and
available facilities for restore and recover. Given the resilience metrics, however, only help
compute the resilience of the system, the time for resilience and the total cost of resilience.
Therefore, to make the analysis boundary clear in this phase, a number of assumptions and

CHAPTER 5-CONCEPTUAL FRAMEWORK AND ANALYSIS MODELS
Page 147
interpretations approach identified and determined in this research.
The purpose of the analysis model develops in this phase is to integrate the
information from different metrics into a unique system-of-interest robustness function. The
robustness function which is leading to results that are unbiased by uniformed intuition or
preconceived notions of risk. The UI system robustness capacity corresponding to a specific
FOM evaluated at a specific time under disruptive event can be calculated using equation 5-
20 below.
( ) ( )
( )
( )( ) (100% ) ( ) ( )
( )
1 ( ) ( ) , ( ) [0,1]
f
hd
f
tt
f n n
t t
t
n f
t
RF t R dt R dt
R
F t R dt F t
= − − +
= − +
(5-20)
where,𝛼 refers to the coefficient applied in this research towards increases capacity of
system-of-interest during the ‘Slack time’ period ( hdt tto ). In this research 𝛼 is determined
as 2.5%. Meaning that, the system-of-interest increasing its robustness capacity during Slack
time by 2.5% based on the robustness level at time hdt .
Following a disruption in the performance of UI system that is caused by either
natural or man-made hazards or accidents, recovery efforts begins to bring system
performance to an acceptable level. In this research, the recovery analysis model focuses on
the various recovery strategy scenarios built for the UI system to recover consider several
significant requirements. The requirements considered in this research is that; the optimum
recovery strategy towards achieving highest robustness capacity value of UI.
Moreover, a procedure for involving and controlling the various variables which
consider stakeholders point of view as an input, in defining the risk impact, UI system
robustness level, and recovery strategy was required. To obtain the most appropriate and
optimum recovery strategy towards obtaining highest UI robustness capacity, the scenario-
based robustness analysis is applied through the equation 5-20. The objective function
towards searching the highest UI system robustness capacity after disturbance occurred can
be seen below.
max : ( )fF t
( ) ( )( ). . (100% ) ( ) ( ) ( )
( )
f
hd
tt
n n f
t t
Rs t R dt R dt F t
R
− − +

CHAPTER 5-CONCEPTUAL FRAMEWORK AND ANALYSIS MODELS
Page 148
( )1 ( ) ( ) ( )
( ) 0, ( ) [0,1]
( ) [0,1] 0.025
for all
,
ft
n f
t
f f
n
F t R dt F t
F t F t
R
− +
=
where, the objective function constrains formulated as below:
C1. ( ) , , , ( , , ) [1,10], 1,....,nR f O S D O S D n N = =
C2.
[R-R]DC
[R-R]BC
x[R-R] [R-R],Top( ) CC
[R-R]EC
[R-R]SC
, R-R R-R ( , ) , where; 0, n nm
N N
n m nmR Rn m R n m
= = =
C3.
[S-R]DC
[S-R]xBC[S-R]
( , )( , )Top( ) [S-R] ,CC
[S-R]EC
, S-R S-R ( , )n
i n
I N
i I n NR S Ri n K
= =
It is important to note and clarify that max : ( )fF t is a non-linear objective function
which can be solved using multi-objective optimization. However, following the research
aims mentioned earlier, this phase is not intending to discuss and develop both the
optimization case and engaging metaheuristic methods respectively to find the optimum
objective function following its constrain. Furthermore, it should be kept in mind that the
resilience of UI system is always with respect to a specific time dependent FOM.
Proportionately, it is always possible for the system exhibit resilience for one FOM
and not for another FOM. It is, therefore, important to make this distinction because only
then can a comparison of system resilience be considered for different scenarios or
disrupted states. Moreover, to accommodate several analysis model limitations towards
resembling the real-world environment, the time dimension and metrics for REA is assumed.
As stated as the last phase of conceptual framework, this sub-section remarked the
fourth research question (RQ4). Importantly, by developing the UI system robustness
analysis function model, the UI system robustness capacity level over time in the further time
can be predicted. A quasi-experiment using computational simulation and optimization
approach can be applied towards predicting the UI system robustness capacity over time.
The quasi-experiment analysis produces several recovery scenarios which support
(empirically) crucial recovery action decision making, enhance the UI system robustness

CHAPTER 5-CONCEPTUAL FRAMEWORK AND ANALYSIS MODELS
Page 149
level post-disturbance.
RQ4: How the system-of-interest robustness capacity against particular risk can be
empirically assessed and enhanced over post-disturbance period?
5.10 Assumptions Applied
In RA, apart from technological failures, the threat is often an element of great uncertainty
requiring assumption and/or different scenarios to study [93]. Therefore, this research
applied several assumptions which is applied within analysis models. The assumptions
applied is;
- It is impractical to assess all risks relationship with community, thus the second phase
of conceptual framework assumed that the risk associated to specific stakeholder
group also affects and interrelates to all risks which associated to other respective
stakeholder group aimed.
- Participants (stand within stakeholder groups) presents sufficiently stable social
entities with a manageable number of actors, which is could be identified and
positioned at various scales. In this research, stakeholder groups assumed have NO
weight value. The various stakeholder groups assumed to have the same weight value
or have a same level of position (power, right and authority), in terms of giving their
perception/opinion, within the RA and REA processes.
- The determined risk decision factors have the same weight value applied within the
analysis processes.
- The characterization of risk event depends on the degree of difficulty towards
establishing the cause-effect relationship between a risk agent and its potential
consequences. The degree of causality and relationship pattern with regards to; what
risk actually mean for those affected, and the values to be applied when judging risk
impact amplification, is totally based on the participants perception.
- There’s no universal standard or rules to dichotomize a value in network matrix to
obtain a clear risks relationship value. Therefore, this research applied an ad-hoc
rules of dichotomize rules as mentioned in sub-section 5.5.4.
5.11 Chapter Summary
This Chapter has brought together the concept from various existing theories associated

CHAPTER 5-CONCEPTUAL FRAMEWORK AND ANALYSIS MODELS
Page 150
with theory building. The conceptual framework proposes in this research disembark from
various variables towards measuring and analyzing quantitative work. This research
conducts several literature reviews and builds a critical argument towards previous studies
knowledge shortcomings, including: ‘related theory’ (i.e., concepts and/or relationships that
are used to characterize the world), ‘related research’ (i.e., how other researchers have
tackled similar problems) and ‘other theory’ (i.e., lines of research and theory that not
directly relevant used).
Further, this Chapter also explores and discusses several UI system risk and resilience
assessment techniques and methods including its variables, mathematical formulas,
computational and simulation techniques. Both the methods and techniques applied in this
research intents to capture, model and simulate the impact characteristic of risk as well as
the resilience analysis in UI system that has explored and discussed in-depth within six main
phases of conceptual framework.
The conceptual framework develops is based on the main risk-criticality analysis.
While, risk-criticality is composed from the three preliminary RA phases, that is; (i) Risk
magnitude which observes its risk priority numbers and values (RPNs and RPVs); (ii) Risk
causality and interaction pattern investigates ‘how each risk propagating its impact and
affecting other risks (interaction)’, and (iii) Risk impact to community examines ‘how risk
impact affecting community’. Except the first preliminary RA, both the analyses apply the
network visualization and topology decipherment which is utilized to investigate the risk
impact characteristic and its behavior.
Further, several assumptions applied within the analysis models to imitate and
accommodate real-world environments and the model limitations respectively. The UI
system REA assembled by the critical risk capacity determined previously, compiled by both
shock and stress capacity analysis. The numerical solution to obtain optimum recovery level
is modelled as a non-linear objective function which could be solved using multi-objective
optimization.
Given the research aim, the discussion and development of the optimization case, and
engaging metaheuristic methods respectively towards searching the optimum recovery
strategy have not been included. Instead, this research develops the recovery analysis model
to assess and obtain highest robustness capacity level that particular UI system might
attained. It must be kept in mind that the resilience of the system is always with respect to a
specific time dependent FOM. To validate and exemplify the usefulness of the conceptual
framework, the next section discusses the application to a case study.

CHAPTER 6-FRAMEWORK VALIDATION: APPLICATION TO A CASE STUDY
Page 151
CHAPTER 6
FRAMEWORK VALIDATION: APPLICATION TO A CASE STUDY
CHAPTER HEADINGS Introduction Case Study Background Stakeholder Group Identification Risk Events Identification Data Collection Process and Respondent Profile Chapter Summary
6.1 Introduction
This Chapter starts with explaining the background of UWS infrastructure and its system in
Indonesian context, and then focusing on Surabaya city. Following the proposed research
design and methodology discussed in previous section, the stakeholder groups of Surabaya
water supply infrastructure system are identified and described. The determined risk events
which categorized in five categories are identified and explored rigorously.
Based on the determined stakeholder groups and risk events, further, the data
collected via design-based questionnaire are analyzed and disseminated. Prior to collecting
the data in the field, it is important to understand the background of the UWS infrastructure
system both in the context of Indonesia and Surabaya city. Accordingly, collected data need
to reflect the demographical information accurately. Data processing and analysis are
discussed in the next sub-section.
6.2 Case Study Background
The UWS infrastructure is one of the core CI sectors which provides significant services in
order to maintenance the vital societal functions, health, safety, security, economic and social
well-being [232]. Any interruption on this results in significant disruptions to the society.
Importantly, the risk issues on UWS infrastructure is the most complex and difficult to face
because of the high cost and the difficulty in providing the service in complex urban
environment [116, 233-235].
Complexity arise from the interconnected nature of the risks and potential influences
at multiple scales. Many scholars have published about the difficulties, relates to risk and
assessment methods in water sector [119, 204, 233, 236-240]. However, the discussion on
RA of UWS infrastructure sector affecting communities and the decision making considering
judgments from various types and levels of stakeholders perceptions have not been well

CHAPTER 6-FRAMEWORK VALIDATION: APPLICATION TO A CASE STUDY
Page 152
studied [96].
Moreover, UWS infrastructure system has been received little attention and tend to
be underestimated within the Large Technological System (LTS) debate even though they
bear most, if not all, of the principal characteristics of LTS. The UWS infrastructure is a
complex system consisting of physical artefacts (e.g., pipes, valve, processing plant),
organizations (utility companies, planning bodies) and, regulatory structures (legislative
framework, contractual obligations).
This system evolved in response to the increasing complexity and problems of control
relating to clean water needs in city. Typical of many LTS, UWS infrastructure networks are
engaged in regulating the input and output of resources on a large scale. The development
of UWS infrastructure networks is not determined purely by technological progress but also
by the interplay between technologies, institutions and-above all-actors.
Following the studies conducted by Moss, T., the progress of the three schemes of
water recycling in the Berlin region confirms that, besides the availability of a particular
technology, other financial, organizational, regulatory and political forces shape the
direction and speed of development [21]. The study further demonstrates the need to
consider the interaction of local factors, historical precedents, actors’ motives and natural
features that shape the fate of a scheme.
6.2.1 Indonesia UWS Infrastructure System and Regulation
Indonesia is not water scarce as it has enough water to satisfy the needs of its population
and economy. Uneven distribution, poor management and lack of infrastructure however,
have left parts of the country with insufficient access to water. Taking an example; increased
private investment in Jakarta water supply infrastructure system has failed to significantly
improve access to clean and affordable water supply [241]. Returning water resources and
infrastructure to public management will only lead to favourable outcomes if the necessary
funds are made available. Without considerable investment, water supply security in
Indonesia will remain tenuous and subject to rapid deterioration.
Water supply (and sanitation) in Indonesia is characterized by poor levels of access
and service quality. Over 40 million people lacks access to an improved water source and
more than 110 million of the country’s 240 million population has no access to improved
sanitation [1]. Furthermore, policy responsibilities are fragmented between different
ministries. Since decentralization was introduced in Indonesia in 2001, local governments
(province and districts) have gained responsibility for water supply (and sanitation).

CHAPTER 6-FRAMEWORK VALIDATION: APPLICATION TO A CASE STUDY
Page 153
Nonetheless, this has so far not translated into an improvement of access or service
quality, mainly because devolution of responsibilities has not followed by adequate fund
channeling mechanisms to carry out this responsibility. Local utilities remain weak. The
provision of clean water has, unfortunately, not yet been taken up as a development priority,
particularly at the provincial government level. Accordingly, the lack of access to clean water
and sanitation remains a serious challenge, especially in slums and rural areas.
This is a major concern because lack of clean water reduces the level of hygiene in the
communities and it also raises the probability of people contracting skin diseases or other
waterborne illnesses. A failure to aggressively promote behavioral change, particularly
among low-income families and slum dwellers, has further worsened the health impact of
Indonesia’s water and sanitation situation [4]. In Indonesia context, the UWS infrastructure
system (see Fig. 6-1) generally can be divided into two main system; first raw water from
source to water treatment plant (WTP), and clean water from WTP to consumer.
1. Source:- Surface water- Ground water
2. Water sources catchment
3. Raw water catchment
4. Water Treatment Plant
Ra
w w
ate
r
Raw water, from source to WTP
4. WTP
5. Clean water catchment
6. Transmission network
7. Distribution network
Cle
an w
ater
Clean water, from WTP to consumer
8. Consumer
Figure 6-1. General UWS infrastructure system in Indonesia.
The general water supply system in Indonesia explained as follows [242]. The
resource for water obtains from two main sources which is surface water and ground water.
The usual form of catchment for the surface water source is; river, swamp, lake, dam and
reservoir. The ground water sources are; groundwater basin (confined and unconfined
aquifer) and springs. Indonesia has a clear water resource law regarding the management of
water resource based on the boundaries of administrative regions.
Further, following various cross-border regulations, administration, agreements and
coordination between different level and type of governments in terms of water resources
zoning, management and preservation (e.g., state-owner enterprise in water source
management, province and regional level government, province level public work
department, national river basin agency and regional level government) the raw water

CHAPTER 6-FRAMEWORK VALIDATION: APPLICATION TO A CASE STUDY
Page 154
finally transmitted to WTP in specific urban administrative region.
The main operator who has an authority to transmit the raw water to WTP is the
state-owned water resource enterprise named Perusahaan Umum (Perum) Jasa Tirta. Then,
the roles and responsibility of treating raw water, producing good quality clean water and
distributing to costumers (includes giving both physical and non-physical service to the
infrastructure system and public) can be handled by private company, public company or
even applying public-private partnership system (under specific Indonesia concession
regulation, i.e., Built-Own-Operate-Transfer).
In the urban administrative region (city or district), the part of treating, producing
and distributing water mainly handled by the regional-owned enterprises (Badan Usaha
Milik Daerah-BUMD) named regional water company or Perusahaan Daerah Air Minum
(PDAM). Since PDAM is a level 2 BUMD, thus each PDAM in different administrative region
has their own governance and policy to serve people’s water demand. As a consumer, the
water users are responsible to pay the water bill based on how much they utilize the water,
the maintenance and services. In addition, the profit that PDAM gained and managed,
become one of the sources of income for regional government as PDAM is the regional owned
enterprise.
6.2.2 Surabaya Water Supply Infrastructure System
Surabaya is Indonesia’s second-largest metropolitan city as well as the capital of East Java
province. It is located on the northern shore of eastern Java at the mouth of the Mas River
and along the edge of the Madura Strait (Figure 6-2). Surabaya has become one of the largest
cities in Southeast Asia being the center of main seaport, industrial, commercial and
maritime center in the eastern region of Indonesia [243]. Further, the city occupies coastal
terrain and has a land area of 327 square kilometers with a population surrounding rural
area houses at least seven million and density about 8,458 inhabitants per km2 [244]. With
the population reaching 2.8 million inhabitants makes the development of UI and public
facilities inevitable important.
As the second largest city in Indonesia, Surabaya has achieved remarkable
development success over the past decade. The Surabaya water supply municipality is
considered among the top performers in nation [150]. This remarkable achievement is
echoed by its water utility, PDAM-Surya Sembada. Unlike most PDAMs, Surya Sembada has a
good reputation in the market and is in a strong financial position with no arrears on its debt.
In 2009, the utility annual operating and maintenance costs were 34 million US$ and

CHAPTER 6-FRAMEWORK VALIDATION: APPLICATION TO A CASE STUDY
Page 155
the total revenue was more than 55 million US$. Its current service coverage is 83 percent.
With approximately 450.000 domestic and commercial connections, PDAM Surya Sembada
is the biggest water supply enterprise in Indonesia. Meanwhile, the supply of raw water for
Surabaya city mainly comes from the ‘Surabaya river’ (surface water source) which is the
tributary part of the ‘Brantas river basin’.
Republic of Indonesia
East Java province
Surabaya city
Figure 6-2. Surabaya city position in Indonesia.
The Brantas basin is a national strategic basin in East Java, comprising two major
cities, Malang and Surabaya. Three consecutive plans that have been prepared for the
Brantas basin focused on irrigation development (1975), on flood management (1985), and
on environmental aspects and conservation (1995). These plans assisted in developing a
clear direction for the investments and in achieving a significant part of the goals
(construction of dams and reservoirs as well as flood-mitigating facilities). The Delta Brantas
river network system and the split streams of Brantas river can be seen in Figure 6-3.

CHAPTER 6-FRAMEWORK VALIDATION: APPLICATION TO A CASE STUDY
Page 156
Brantas river basin map
The split streams of Brantas river
Figure 6-3. Brantas river basin map and the split streams of Brantas river.
The Brantas basin is one of the developed river systems which have a pivotal and
crucial function in Indonesia [242]. The Brantas river basin functions as the most important
source of water specially in East Java province, for instance; electricity generation, irrigation,
brackish water fishponds, domestic water supply and industrial water supply. The Delta
Brantas river network splits into two major rivers (located in Mojokerto district). First,
Mlirip river weir as a regulatory structure for river flow entering Surabaya river and second,
Lekong barrage as a regulatory structure for river flow entering Porong river.
The Brantas river basin is the second largest river basin in Java Island, located in the
East Java Province at 110°30’ East Longitude to 112°55’ East Longitude and 7°01’ South
Latitude to 8°15’ South Latitude. The Brantas River extends to ± 320 km in length and it has
a catchment area extending to ± 14,103 km² which covers ± 25% of the total area of East Java
Province or ± 9% of the total area of Java Island. The average rainfall reaches 2,000 mm/year,
around 85% occurring during the rainy season.
CHAPTER 6-FRAMEWORK VALIDATION: APPLICATION TO A CASE STUDY
Page 157
The average surface water potential per year is 13,232 billion m³, with utilized
amount of around 5-6 billion m³/year. The Brantas river basin consists of the Brantas
watershed, which extends to 11,988 km², and more than 100 small watersheds that flow into
the south coast of Java island, including the Kali Tengah watershed, Ringin Bandulan
watershed, Kondang Merak watershed, and other small watersheds with a total area of
around 2,115 km². The Surabaya river is the major water source for Surabaya city fulfilling
society’s demand for the water supply, beside ‘Umbulan’ water source (Umbulan village,
Winongan sub-district, Pasuruan district).
Following governmental agreement between Surabaya government, Pasuruan
district government and East Java province government, the Umbulan water source
transmitted to the water storage plant in Surabaya using cross-district long-span water
piping network system. In the context of transmitting the Umbulan water resource to
Surabaya city, the agreement between different type and level of authorities is very
important considering the Umbulan water resources transmitted across different
administrative region boundaries.
The utilization of water in Surabaya river has been performed for more than 30 years
as a raw material of drinking water for citizens of Surabaya. Currently, Surabaya city has a
population of 3 million and own 6 drinking WTPs. The entire drinking WTPs are derived into
3 units in Karang Pilang and 3 others in Ngagel. The drinking WTPs are operated with
6 𝑚3𝑠−1 total debit taken from the Surabaya rivers.
6.3 Stakeholder Groups Identification
The problem of managing the transition to local percolation in Surabaya urban development
sites has also revealed the importance of closer interaction between the utility and the other
key stakeholder groups to reach agreement on the redistribution of responsibilities under
the new law. Therefore, it is important to explore the stakeholder (actor) group of Surabaya
water supply infrastructure system. To identify and determine the stakeholder groups, it is
an important path to first explore the Surabaya city water supply infrastructure system
supply chain.
Particularly, this research comprehensively explored the supply chain of Surabaya
water supply infrastructure system in the context of how water has been processed and
distributed, from the beginning (raw water being extracted, stored and transmitted) until it
reached end users. This research then initially identified and determined the stakeholder
groups who stood and classified based on supply chain explored previously. The
CHAPTER 6-FRAMEWORK VALIDATION: APPLICATION TO A CASE STUDY
Page 158
stakeholders of Surabaya water supply infrastructure cover all parties who are dependent
and are affected by the infrastructure system. However due to the time and regulation
constraints, the data collection processes cannot embrace all parties to be the participant.
To confirm the supply chain structure, the author has conducted a comprehensive
literature review and interviewed several experts from various level, scope, and institution.
Once the initial step has been done, the stakeholders were classified in a group format.
Ideally, more stakeholders should be evolved and considered to increase the accuracy of RA.
To overcome this issue, this study applied process to comprehensively scoping and
determining the boundary of stakeholders who can be identified and involved respectively.
To obtain richness picture and involvement of stakeholder groups, interviews were
conducted with a number of experts from different institutions. The second step was
conducted in order to complement the first step with respect to establishing the stakeholder
groups. Defining all the supply chain components of the respective infrastructure system is
a useful process to provide a way of analyzing the role of actors and agents. Furthermore, it
also supports the process of developing the urban environment and allows for an unravelling
interaction that forms a key characteristic of modern urban life.
The general structure of the supply chain of Surabaya water supply system and its
stakeholder groups is depicted in Figure 6-4. Notably, the detail of discussion of the supply
chain of Surabaya water supply is not shown in this research. Readers may refer to some
related literatures [150-152, 242, 244]. Based on the general water supply infrastructure
systemin Surabaya, it is worth to understand ‘who is authorized as what’, as the basis for
identifying and determining the stakeholder of Surabaya water supply infrastructure.
The stakeholder of Surabaya water supply infrastructure are the people, in different
levels and roles (including; organization and institution), and whosoever has an interest, was
affected by the presence of water supply infrastructure system. As an important city which
has taken various crucial roles in east part of Indonesia, various stakeholders of UWS
infrastructure from different sectors and levels are well situated in the Surabaya city. To
confirm the supply chain structure, the author also conducted a comprehensive literature
review and interviewed a number of experts applying snowball method from different
government institutions. The next sub-section describes the initial stakeholder group and
category.

CHAPTER 6-FRAMEWORK VALIDATION: APPLICATION TO A CASE STUDY
Page 159
Mojokerto district
Sidoarjo city
East Java (province) public work department
Industry
Surabaya river
Porong river
The split streams of Brantas river
Watershed management
Jagir damWonokromo floodgate
Gunungsari dam Gubeng rubber weir
Ngagel WTP 1, 2, 3Karang Pilang WTP 1, 2 , 3
Umbulan water source (pump house)
Water treatment, distribution and services
Water allocation agreement
Water allocation and supply
City/ district boundary
Malang, East Java.
Regional owned enterprise/ Badan Usaha Milik Daerah
Line of coordination
Line of coordination
Distribution system
Surabaya city governmental boundary
Technical and non-technical services
Line of coordination Line of coordination
Co
nsu
me
r/
Use
r
Line of coordination
Line of coordination
Commercial
Domestic user
Surabaya city governmentJasa Tirta-1 public corporation
National river basin management agency Regional water supply company
Brantas river
Figure 6-4. The supply chain of Surabaya water supply and its’ stakeholder groups.

CHAPTER 6-FRAMEWORK VALIDATION: APPLICATION TO A CASE STUDY
Page 160
Importantly, discussion with infrastructure decision makers (DMs) can have three
advantages, that is; (1) It may yield information; (2) Identify uncertainty about which criteria
have been and should be used, and (3) More awareness and thoughtfulness about gainer and
losers from infrastructure decisions in the community. Notably, the stakeholders identified
and discussed in next sub-sections do not cover all the stakeholders, but rather is designed
to facilitate initial and core stakeholder identification for this study. The description of eight
stakeholder groups determined based on the supply chain of Surabaya water supply
infrastructure are described in Table 6-1.
Table 6-1. Summarized stakeholder groups.
Stakeholder group Description Brantas river basin management agency (G1)
Technically, the national Brantas river basin management agency (Balai Besar Wilayah Sungai-BBWS) formed under the Directorate General of water resource responsibility. The BBWS is one of the governmental institution for water resource management in the context of managing ‘only’ the national strategic river (Brantas river stated as one of the national strategic river in Indonesia) which is based in the East Java province. The ‘national strategic river area’ means that the Brantas river has become the right and responsibility of the central government of Indonesia in terms of the management and supervision [242].
Further, BBWS has a duty to manage the water resource in terms of basin region which also cover; planning, construction, operation and maintenance, in the context of; conservation and utilization of water resources, controlling water damage to the rivers, lakes, reservoirs, dams and other types of water reservoirs, irrigation, ground water, raw water, marsh, ponds and beaches. The BBWS Brantas is categorized as a type-A large river basin organization which organizational structure consists of: (i) Administration department, (ii) Program and evaluation division, (iii) Water source network implementation division, (iv) Water utilization implementation division, (v) Water resources operation and maintenance division.
State public works department (G2)
The state public works service (Dinas Pekerjaan Umum-PU) has a duty of; management, assessment and makeing significant decisions regarding the development of; (i) Building infrastructure (Cipta Karya dan Tata Ruang), (ii) Roadway infrastructure (Bina Marga) and (iii) Irrigation and watering infrastructure respectively in the province (state) level (Pematusan). Furthermore, PU has a responsibility to coordinate, assess and work together with other PU department as well as with the Surabaya city government towards the development of water supply infrastructure system. The state PU has several missions, which is:
- Realize the layout as a reference spatial dimension of national and regional development and integration of public works infrastructure construction.
- Arrangement of space-based settlement in the framework of sustainable development.
- Organize effective management of natural resources and to improve the sustainability of natural resources function utilization.
- Reduce the risk of destructive force of water. - Improve accessibility and mobility within the region to support economic
growth and improve the welfare of the community by providing a reliable road network, integrated and sustainable.
- Improve the quality of neighborhoods livable and productive through fostering and facilitating the development of an integrated settlement infrastructure, reliable and sustainable.
- Conducting competitive construction industry by ensuring the integration of the management of the construction sector, the implementation of good construction and make the perpetrators of the construction sector to grow and thrive.
- Organizing research and development, and implementation: science and technology, norms, standards, guidelines, manuals and / or supporting criteria

CHAPTER 6-FRAMEWORK VALIDATION: APPLICATION TO A CASE STUDY
Page 161
PU and settlement infrastructure. - Carrying out functional management support and resources accountable and
competent, integrated and innovative by applying the principles of good governance.
- Minimize irregularities and corruption practices in the state PU department to improve the quality of inspection and professional supervision.
Jasa Tirta-I Public corporation (P1)
Jasa Tirta-1 Public Corporation (PJT-1) provides several important service, such as; (i) Bulk water for industry, agriculture, flushing, port, electric power generation and others, (ii) Water power to generate electricity for the state electricity company, (iii) Generate and distribute electric power and clean water, perform consulting in water resources fields, heavy equipment rental and water quality laboratory services, and (iv) Develop other water-related services including piped domestic supply at specified scales. Importantly, PJT-1 and BBWS has a tight relationship towards managing the water resources.
Based on the three consecutive plans of Brantas basin development that have been discussed in previous sub-section, the implementation clearly benefited from the fact that the plan was prepared by the ‘user’ to be implemented by a separate ‘provider’. The ‘user’ was the entity operating the major facilities in the river, which is PJT-1 [245]. They formulated the framework of activities (as a Terms of Reference) to be implemented and financed through the ‘provider’, the national Brantas Project Organization, whose role has now been taken over by BBWS Brantas.
These separate responsibilities highly contributed to a clear role distribution, avoiding overlapping interests and ensuring a transparent process regarding quality assurance, with PJT1 acting as user/client and Brantas project as provider. The design for Brantas was prepared in 2006 by BBWS and endorsed by the Minister of Public Works in 2010. Presently, BBWS is finalizing the procedures for endorsing the ‘plan’, as formulated in 2011/2012. The task of allocating roles to the user and the provider is now taken over by the Basin Council as the user, with PJT-1 as one of the most active members, and the BBWS Brantas as the provider.
Surabaya city government (G3)
According to city mayor regulation No.90/2008 towards the duties and functions of Surabaya city technical institution (government bodies), the main task of Surabaya government is to: (i) Implement the coordinated programs following the planned budgets and build the agency reports, (ii) Coach and manage the organizational stand under the umbrella of Surabaya government body, (iii) Personnel administration management. Furthermore, the Surabaya city government has a function to:
- Formulate a technical policy in the field of staffing training - Providing support for the implementation of regional government in the field of
personnel and training - To be a Guidance and execution of tasks in administration management context - Implement the other duties given by the head of the district in accordance with
the duties and functions The Surabaya city government is an important stakeholder for Surabaya water
supply infrastructure either as the owner of regional water supply enterprise (PDAM Surya Sembada), clean water user, public counseling, licensing services, public information providers, and the DM related to the Surabaya community interest. Importantly, Surabaya city government plays a crucial role for the Surabaya city development in building a good connection and coordination with BBWS, several state government of PU departments, PJT-1, and the regional water supply enterprises towards the development of UI.
Regional water supply enterprise (P2)
The Surabaya water supply handled by PDAM Surya Sembada, which is a regional-owned enterprise (owned by the Surabaya city government). To fulfill Surabaya’s demand on clean water, PDAM has a number of WTPs which is; ‘Ngagel’ WTP (1-3), ‘Kayon’ WTP, ‘Karang Pilang’ WTP (1-3, and 4 under construction) and, another water supply directly from Umbulan water source-Malang city. Substantially, the PDAM Surya Sembada has a responsibility to continuously supply a reliable a high-quality water for the society.
The responsibility includes, but not limited to; treating bulk raw water to be a high quality clean water, distribute the clean water to the society, plan and build a water distribution network system (including maintenance, e.g., checking the water meter for every user and another non-technical service). Accordingly, PDAM has the responsibility to maintain the level and ability for supplying clean water continuously to society with affordable quality and prices includes satisfying service provision.
As the main water supply enterprises in Surabaya, PDAM Surya Sembada has

CHAPTER 6-FRAMEWORK VALIDATION: APPLICATION TO A CASE STUDY
Page 162
two functions, that is; (i) Social oriented, which is providing a professional service in terms of both technical and non-technical matters in the context of produce, supply and distribute clean water to all regular customers as well as another stakeholder; and (ii) Profit oriented, which is aiming to gain profits used as an operational and technical fund and local income.
Industry and business entity (M1)
The stakeholder group who has a high dependency towards the big quantity supply of clean water in order to sustain their business. This industry group refers to the state-owned, joint venture, public-owned or even private business entity whose rely heavily on the continuity of inviolable domestic water services (massive quantity) to promote their business. For instances; manufacture industry, construction industry, service industry, food and drink industry, chemical industry, and et cetera. While, industrial and commercial sector.
Commercial and, or public space (M2)
A general, public space or commercial sector which managed by public or private institution and stand as both regular clean water customer and user. For instance; park, public toilet, worship place, public squares, public library, university, department store, school and office building, swimming pool, single management-based housing (apartment and condominium), hotel, restaurant, and exhibition hall.
Domestic end-user (M3)
The domestic end user group is either an individual or group in respective residence or dwelling area in Surabaya city as a regular customer towards clean water end user to support their daily activity. This stakeholder group is the society and, or group of laypeople who rely on the domestic UWS infrastructure service to support their daily life. In Surabaya city, water generally gets to community homes in one of two ways. Either it is distributed by PDAM, or people supply their own water, normally from a well. Water delivered to homes is called "public-supplied deliveries" and water that people supply themselves is called "self-supplied" and is almost always from groundwater.
The term 'domestic water use' as it applies to the area of water can be defined as 'water used for indoor and outdoor household purposes, such as drinking, food preparation, bathing, washing clothes, dishes, and dogs, flushing toilets, and watering lawns and gardens. A major actor group, which is largely absent from LTS studies, is the domestic end users, who are treated as passive recipients of system-builders’ products. The importance of user groups may still be marginal in some aspects of network management, but their degree of involvement is growing rapidly in selected parts of the networks.
6.4 Risk Events Identification
Assessing the risk of UWS infrastructure in relation to deliver of water in a safe, efficient,
economical and reliable manner is a difficult task. Some of the technical and non-technical
problems pertaining to UWS infrastructure that Surabaya faced has been described well in
several previous studies [151, 152, 243]. Nonetheless, the issue of assessing the risk in
Surabaya water supply infrastructure system based on various stakeholder perceptions has
not received sufficient attention in any other studies.
This research initially determined the risk events from selected research literatures
including the descriptions for each risk events. In previous works, data regarding the affected
infrastructure can be interpreted as impacts on industries and communities in terms of
technical, social and economic aspects [204, 239]. However, in UWS infrastructure sector,
another aspect as political, operational and environmental aspect is significant to be
included within the RA processes.
Conclusively, Surabaya water supply infrastructure risk events were determined
following by a number of important classification (i.e., social, natural/environmental,

CHAPTER 6-FRAMEWORK VALIDATION: APPLICATION TO A CASE STUDY
Page 163
political, technical and operational, financial and economic). To identify various risk events
in Surabaya water supply infrastructure, author conducted the literature review in both
global and local context. A number of libraries in Surabaya (i.e., city library, 10th November
Technology Institute library, Petra Christian University library and state library), and
desktop study (i.e., Indonesia research institute website) were conducted in order to reach
some archives and past research documents.
The conceptual model of risks scheme articulating the relationship between Surabaya
UWS infrastructure and the supported community is depicted in Figure 6-5. The literature
resulted in the identified risk events and stakeholder groups for Surabaya water supply
infrastructure system. In this research, as many as 30 risk events were identified based on
the literature review (see Figure 6-6). The risk events are considered as hazardous events
that can adversely affect the performance of the UWS infrastructure, which includes both
natural and human-related risks. Risk categorization can usually be performed in several
ways.
Technical & Operational
Economic & Financial
Community network
Political
Hazards and Threats
Natural Hazard
Human-made
Hazard
SocialEnvironmental
- Surabaya River (95%)- Pandaan Water Spring (±2.5%)- Umbulan Water Spring (±2.5%)
Water Resources
- Ngagel Water Treatment Plant I-III- Kayon Water Treatment Plant- Karang Pilang Water Treatment Plant I,II
Water Treatment
Water pumped to aerator system → Pre-sedimentation tank → Water treatment plant
Water Storage
Water Distribution
Purified water accommodated within the reservoir and ready to be distributed
Water distributed to the whole community
Hazard and threat affecting both the
infrastructure system and the community
Surabaya UWS processing system
UWSinfrastructure
aspects
Risk and hazard
Figure 6-5. The conceptual model of UWS system risks affecting community.

CHAPTER 6-FRAMEWORK VALIDATION: APPLICATION TO A CASE STUDY
Page 164
Nature
Social
R1. Climate change
R2. Natural disasters
R3. Water scarcity (shortage)
R4. Idle land exploitation
R5. Polution And contamination
R6. Uncertain water demand (and supply) trends
R7. Water misuse
R8. Limited access to clean water
R9. Payment problem
R10. Community rejection
R11. Population growth and urbanization problem
R12. Sabotage to physical infrastructure
Technical and
Operational
R17. Insufficient non-technical service provision
R18. Water quality defective
R19. Trouble in water transmission and distribution network
R20. Mechanical (physical) component failure
R21. Under rate maintenance
R22. Physical infrastructure decay (Aging)
R23. Lack of technical service provision
R24. Water loss (NRW)
R25. Disturbance from another supporting infrastructure
Risk event category Risk eventsInfrastructure system
Political
R13. Uncertain political behavior
R14. Limited public participation
R15. Changes in government policy
R16. Obscurity on government legal and regulatory
Economic
R26. Interest rates instability
R27. Foreign exchange rates instability
R28. Poor infrastructure investment
R29. Inflation hazard
R30. Uncertain water price
Surabaya water supply
infrastructure system
Figure 6-6. Identified risk events for Surabaya water supply infrastructure system.
One approach is to categorize the risk based on the technical and non-technical
threats [20]. Threats arising from malicious individuals (involving inherent risks to the
operation of the value chain) are different from the threats posed by natural phenomena.

CHAPTER 6-FRAMEWORK VALIDATION: APPLICATION TO A CASE STUDY
Page 165
Technical threats induce relate to financial and operational risks. Other technical threats are
caused by people, systems and procedures that negatively impact the infrastructure. Non-
technical threats included environmental risks, strategic risks and resource allocation risks.
While, other non-technical threats are posed by external factors such as; natural disasters,
socio-political situations, third- party actions, and policies and regulations.
Although there is no standard classification of risk events, this research categorizes
the risk into six categories which can be described as:
- 6 risk events of natural/environmental
- 9 risk events of social
- 5 risk events of political
- 10 risk events of technical and operational
- 6 risk events of financial and,
- 4 risk events of economic.
In Surabaya water supply infrastructure, natural risk refers to the non-manmade risk
affecting the system service ability. The risks in this category are usually beyond the ability
of human control. The social risk category relates mainly with the societal and ethical issue
contexts which affecting the serviceability level of the Surabaya water supply infrastructure
directly or indirectly. Further, the political risk associated with the uncertain and fluctuating
political behavior mainly triggered and affected by the uncertain policy making by the high-
level people (authority) in the infrastructure governance. This category is also related to
regulations and standard [92].
The technical and operational risks are related to the product quality, information and
technical barriers, and working quality (including both technical and non-technical issue).
Further, the economic risks are related to the global financial issue and, cost increase and
return which affect the Surabaya water supply infrastructure system. It should be noted that
this categorization does not cover all the risk groups, but rather designed to facilitate risk
identification for the practitioners and researchers. The description for each risk event,
based-on the literature review which supported by the expert point-of-view, can be seen in
Table 6-2 below.
Table 6-2. Determined risk events and the description.
Risk events Description R1. Climate change
The climate change refers to the change in regional climate patterns, in particular a change apparent from the mid to late 20th century onwards and attributed largely to the increased levels of atmospheric carbon dioxide produced by the use of fossil fuels. In Indonesia context potential regional impacts of climate change could include; increased frequency and magnitude of droughts and floods, and long-term changes in mean renewable water supplies through changes in precipitation, temperature,

CHAPTER 6-FRAMEWORK VALIDATION: APPLICATION TO A CASE STUDY
Page 166
humidity, wind intensity, duration of accumulated snowpack, nature and extent of vegetation, soil moisture, and runoff [246-256].
R2. Natural disasters
Natural disasters (act of god) can be describes as the non-man-made risk. The things that beyond human control which can be quantified such as; earthquake, flooding-river, flash, dam break, wind-hurricanes, waterborne disease, drought, other severe weather-cold, heat, high winds, lighting, prolonged dry and rainy season (which affecting the river water runoff from other upstream region) [106, 246, 251, 254, 257-259].
R3. Water scarcity (shortage)
Two dimensions of water scarcity; demand-driven water stress where there is a high usage compared to the availability of water and, population-driven water shortage: where there are many people dependent on the availability of water. In Surabaya city context, the water scarcity happened during the dry season which gives constraints to the water treatment processes and thus reducing the supply volume of clean water to the community [106, 246-248, 250, 254, 260].
R4. Idle land exploitation
The dynamic of modern society has been forced for urban water supply service to provide a vast and safe water supply services. The service includes expanding the water supply infrastructure within specific region and, thus allowing the risk of difficulty in controlling the land. The urban water supply infrastructure will mostly, utilize the region’s both underground and ground by which touch the environmental aspect [246, 251, 261].
R5. Pollution and contamination
As settlements quickly expanded, society grew into catchments and close to water sources, eventually polluting the supply and forcing a search for newer supplies of potable water beyond the town limits. In Surabaya city context, a pollution and contamination are a major environmental issue. In fact, pollution and contamination not just generated from industry waste but also community is self, such as; littering, treating river as communal space for washing and bathing which aggravates the condition and quality of Surabaya river [246, 251, 261].
R6. Demand uncertainty
Variations of supply and demand depends on many factors whose laws of variation are uncertain, for instance the increase in population (Supplies were in precarious balance with demand which affected by the water losses, leakage and wastage risks; The changing and increasing of domestic and non-domestic leads on consumption and demand behavior for public water). Fuzziness of water rights and unclear water accounting is linked to a tendency of over-allocating water to satisfy more water users, because of unclear pictures of supplies; Unrealistic planning with disaster requirements beyond the reach of local government [233-235, 246, 247, 250-252, 254, 262].
R7. Water misuse
Water misuse has been known for long time in some regions as a crime action. The example of water misuse in Surabaya city, such as; an illegal activity building water connection without proper license; manipulate water meter instrument; and, arbitrarily, improper and excessive use of water. Another effect and consequences of this risk is that, this risk not only affect the fire pressure (water loss) of the water and services within one network region of community, but also contribute to the deteriorating of the physical infrastructure and urban development deprivation [233, 251, 254, 263].
R8. Limited access to clean water
In Surabaya city context, access to the water may be uneven due to socio-economic inequalities. In keeping with its high levels of coverage, most areas of Surabaya are already served by the piped water system, and many households have individual connections. However, there are still some pockets of un-served areas that belong to the lowest income brackets. Many of these poor households are unable to afford the steep connection fee, which includes the cost of tertiary network expansion. In addition, some segments of the urban poor population are unable to furnish the legal documentation required by the utility for the provision of individual connections. In the absence of piped supply, these households relying on a combination of water from neighbors, purchased from vendors or small scale independent providers, and free well water. However, much of the water from these sources is expensive and contaminated [150, 243, 246, 251, 263, 264].
R9. Payment problem
Unpaid water service creates on the water market, financial and economic risk. Willingness to pay for water still low for some region (delay payment and further not paying). Some people are becoming more reluctant to pay the necessary changes. In some area, the ability to pay and the desire for good services are underestimated. In Surabaya city, the common case happened in terms of payment problem is more like; late payment made by the consumer/customer, and the water use bill problem [233, 235, 246, 251-253, 261, 265-267].

CHAPTER 6-FRAMEWORK VALIDATION: APPLICATION TO A CASE STUDY
Page 167
R10. Community rejection
In many countries, customer have experienced several attempted reforms in which tariffs were increased, but service did not improve. Complexities within UWS system (especially in Surabaya city case) involved with obtaining community acceptance of alternative water supply solutions. In some cases, community reluctant or event reject the solution of specific problems provided either by the regional water supply company or other government agencies [235, 261, 263, 267-272].
R11. Population growth & urbanization problem
As a metropolitan city, population growth and urbanization contribute to the uncertain of supply and demand trends in Surabaya, incriminating the water supply infrastructure system. The population growth (and the dynamic of urbanization pattern) leads on water consumption rose, both in total amount needed and in per capita demand. Further, this risk leads to the changes of society behavior on how to treat the water demand. This risk event is tightly related with uncertain water demand (and supply) trends risk event [234, 235, 237, 258, 261, 262, 265, 266, 273].
R12. Sabotage to physical infrastructure
In Indonesia, water supply infrastructure system protected by the constitution law. Physical attack or sabotage in Surabaya water supply infrastructure can be classified as criminal act. The example of sabotage to physical infrastructure of water supply in Surabaya; vandalism act towards water supply system, illegal act by adding chemical or biological agents into water treatment (including post-treatment facilities) and distribution systems, technical system destruction, unexplained cutting of utility fences and damage to storages and water contaminants on utility property. Further, a number cases such as water meter, other fittings and tools theft often occurred [106, 247, 251, 274, 275].
R13. Uncertain political behavior
This risk refers to the water supply service disturbances which occurred due to; the dynamic of both local and national political movement, obscurity happened on the cooperation agreement and tasks among various agencies, and bad decision making as well as low commitment among various agencies towards laws and regulations that applied. Further, this risk refers to the conflict which leads to the delay in the development of water supply infrastructure system, lack of requirements specification and low priority given to society interest [110, 234, 235, 246, 251-253, 260, 261, 269].
R14. Limited public participation
Since water supply infrastructure in Surabaya solely handled by the regional water supply company, the public participation in decision making are not taking place at all. Based on interview obtained from various stakeholder groups, the limited public participation caused by several factors, such as; there is a barrier between community with authorities/ high-level politician in terms of communication. The public interest is not prioritized by the authority, the public interest and authority point of view is disparate, the decision making decided by the politician (and the authority) are not clear and lack of transparency and accountability. Further, the decision making towards infrastructure development usually conducted without involving community consideration [234, 237, 246, 251, 260, 261, 265, 273, 276, 277].
R15. Changes in government policy
The water supply sector has a legal and regulation to run the appropriate work under the government policy and rules where the term of contract management stand as the basic and core value to the way of delivering safe and clean water to community. However, the existence of policy uncertainty leads to the water quality standards shifting, the obscurity towards the allocation of clean water quantity distribution, lack of authority accountability which results on the declining of public confidence towards the government policy changes (e.g., changes in customer tariffs, an administration and non-administration rules) [238, 250, 269, 278].
R16. Obscurity on government legal and regulatory
Typical risk event which are taken into consideration here refers to the mediocre governance of the existing legal and regulatory framework for the provision of water supply by the government, the incoherence of national and regional legal method of resolving disputes, such as those related to the enforceability of legal provisions. Another example for this risk, such as; the ambiguous towards the basic framework of laws, regulations and provisions which applied towards the water supply empowerment, treatment and distribution to the community. Importantly, this risk emerges because of the incoherence between methods and implementation of law and regulation by the authorities and agency bodies in terms of dispute resolution [238, 258, 263, 278].
R17. Insufficient non-technical service provision
The example of this risk event can be described as; the decreasing of non-technical service provision in terms of delivering solution towards public demand and complaints on the water supply service, the customer service division irreverent and lack of competency (unable) dealing with customer complaints, public problems and

CHAPTER 6-FRAMEWORK VALIDATION: APPLICATION TO A CASE STUDY
Page 168
complaints are handled very slow, long process and complicated (tricky) [106, 234, 246, 253, 261, 262, 265, 266, 268].
R18. Water quality defective
The problem with water quality can be described as; a poor quality of distributed clean water by the regional water supply company, the color of clean water is not clear (turbid), unearthly clean water taste and an odor within the water. It is also found that the water supplied to the community contained with residual disinfectant, microbial growth, sediment, substances and dirt [106, 110, 234, 252, 258, 261, 266, 275, 279].
R19. Trouble in water transmission and distribution network
This risk event refers to; the disorderly condition of elements of water distribution networks, limited transportation capacity of the system in relation to real needs (i.e., the needs which exceeding/overwhelm the planned distribution system capacity). Unless the distribution systems improve, the water may still have questionable taste, odor, color, sediment, and corrosivity [110, 254, 258, 262, 269, 273, 278, 279].
R20. Mechanical (physical) component failure
The failure of individual mechanical network components related to the water treatment processing, storage, and distribution to the community. For instances; pumps, pipes, connections and joints, meters, panels and valves, and another component accessories [106, 235, 247, 248, 251, 253, 254, 269, 273].
R21. Under rate maintenance
Under rate maintenance refers to the physical infrastructure not being maintained following the undue period. The problem of the maintenance including; the calibration and replacement of physical checking carried out under the standard regulation, maintenance does not get any priority and lack of attention (tend to be underestimated)[113, 262, 280].
R22. Physical infrastructure decay
This risk refers to an old and vulnerable physical infrastructure due to the aging factor (deterioration). In fact, Surabaya water supply physical infrastructure mainly has been built in the Dutch colonial era (some of the physical system approaching 100 years old). Surabaya water supply physical system (pumps, pipes, connections and joints, meters, panels and valves) have exceeded the anticipated “useful life-time” (the permitted limit time) [106, 246, 252, 253].
R23. Lack of technical service provision
The customer service and technical service department of authority or government agency takes very long to respond to customer’s problems and complaints. The origin and example of this risk event can be explained as; the technical service department of authority lack of technicians in the field, the technician lack the ability to understand the problem on site and thus cannot take the proper action, lack of investing on the modern technology to perform technical service and maintenance tasks, and technicians still prefer to do the task using traditional methods and technology rather than modern technology. Further, the authorities lack of finding solutions in terms of accessing the inaccessible areas for developing the water supply infrastructure system.
R24. Water loss (NRW)
Water loss or Non-Revenue Water (NRW) is one of the major issues in water supply management studies. The NRW problem cannot be easily assessed, however the NRW occurs because of several things, such as; a leakage within distribution pipe (premiere, secondary and tertiary), leakage within piping connection or joint system, water theft by the customer or non-customer.
R25. Disturbance from another supporting infrastructure
In terms of treating, processing and delivering water to the community, respective authority relies or depend on another ‘supporting’ infrastructure (e.g., transportation, banking and finance, gas and oil, information and technology and electric power). A single disturbance on supporting infrastructure to water supply infrastructure system resulting in service interruption. For instances; without gas and transportation infrastructure PDAM cannot transmit the water by using water tankers to several water-problem (or non-piped water) areas in Surabaya, a disruption on electricity infrastructure system PDAM hampered the processes (mainly rely on the electricity and information technology) of treating and distributing clean water to community [30, 94, 281].
R26. Interest rates instability
Interest is the cost of borrowing money. It is a function of the unrepaid principal and is expressed as a percentage per year. Interest rates instability affecting many aspects. For instance; based on regional water supply company (Perusahaan Daerah Air Minum-PDAM Surya Sembada) experts acknowledges the process of treating water is affected by the interest rate instability. The wide range of chemical materials required to treat the raw water into clean water which cannot be easily obtained has a sensitive price following the interest rate value. Thus, the price of various chemical materials is affected by the changes of interest rate. Unpredictable variation in interest rates results in an unstable and susceptible economy [234, 235, 238, 246, 253, 258, 267, 282, 283].

CHAPTER 6-FRAMEWORK VALIDATION: APPLICATION TO A CASE STUDY
Page 169
R27. Foreign exchange rates instability
Exchange rate risk comes from unpredictable variation in the exchange rate. Currency risk affects the value of the business through several mechanisms, which are; operational costs, maintenance and construction costs, and finance costs. Unpredictable variation in exchange rates results in an unstable and susceptible economy. One impact of this risk in Surabaya water supply infrastructure system is the increment of water supply fare which charged to the community [235, 238, 246, 253, 258, 267, 282, 283].
R28. Poor infrastructure investment
The shortage of investment towards Indonesian infrastructure system development in the case of urban water supply system has been acknowledged by a number of studies. This means that infrastructure system upgrades get deferred and the backlog of investment needs grows. The cause of poor infrastructure investment in Indonesia can be explained as follows, but not limited to; lack of adaptive and long-term planning towards constructing and developing the Surabaya water supply infrastructure system by the authorities, lack of coordination and complexity between various public institutions in terms of developing infrastructure system, distrust of both domestic and foreign investors toward making decision to invest in Indonesia infrastructure development program [233, 261, 265, 268, 269, 278, 279].
R29. Inflation hazard
Almost all of the water supply sectors in Indonesia have been funded under massive loan agreement. The inflation hazard gives entirety impact not just to economy and financial aspect but also to the service provided by the regional water supply company (Perusahaan Daerah Air Minum-PDAM Surya Sembada) delivering reliable, continuous, reasonable and affordable price, and high quality clean water to the customers. Further, the inflation hazard affects whole of the stakeholders in the form of different impact levels. The inflation hazard related to Indonesian urban water supply infrastructure system can be seen in [238, 269, 278].
R30. The failure of price stabilization
In Indonesia context, the regional water supply enterprises are owned by the local government (Badan Usaha Milik Daerah-BUMD Surabaya). This means, that every single region (mainly city/district) has their own regional water supply company which have the authority to form the policies and rules (including the water price adjustment) in terms of providing water supply service and management. Even though the water price in Surabaya city is relatively stable, nonetheless, this hazard issue is considered as big issue that should get an attention from various scholars [233, 235, 246, 250, 252, 253, 265, 270, 278, 284].
6.5 Data Collection Process and Respondent Profile
The collection and analysis of information is fundamental in defining needs and risks, and in
designing and measuring appropriate resilience building operations. In this research, the
data collection relies on large numbers of design-based questionnaires and non-structured
interviews, used to gather; contextual data about participants, a situation and the
experiences of participants towards Surabaya water supply risks and its impacts. The
questionnaires designed (attached in the Appendix B) can collect simple data, by asking
participants to check boxes, such as; to provide demographic data, as well as data of greater
complexity, by asking participants to code their responses to questions using Likert.
Importantly this allows the researcher to transform and process the computerized
data, which can then be subjected to numerical measures to provide insight into the
relationships among the variables, and data analysis. On the other hand, for the qualitative
approach, the data collection relying on instruments such as observation of participants,
interviews, focus groups of language-based approaches. To increase the validity of the results,
Yin, noted that this type of research should rely on multiple sources of evidence [146].

CHAPTER 6-FRAMEWORK VALIDATION: APPLICATION TO A CASE STUDY
Page 170
The research relied on three main sources to support the analysis result, that is:
archives, questionnaires and interviews. Specifically, regarding the interviews, this research
conducted a ‘face-to-face’ and non-structured interviews constitute the main data source.
Prior to the data collection, ethics approval was sought from the Faculty of Architecture,
Building and Planning Human Ethics Advisory group at The University of Melbourne,
Australia (Ethics ID 1443598.1., see Appendix A). All participants were given a PLS at the
start of the data collection using the design-based questionnaire. The PLS include an
invitation, research summary, what participants would be asked to do and for how long. It
also addressed confidential issues.
To obtain the perception of risk from the participants, a design-based questionnaire
needed to be developed in such way both experts and lay-people can understand and give
their perceptions and opinions. There’s no limitation towards how many participants within
data collection processes needed. However, as this study intends to obtain specific UI
stakeholder perception objectively towards identified risk events, it was important to obtain
many participants perceptions from different stakeholder groups determined. Following the
research ethics methodology of the University of Melbourne, around 250 sets questionnaire
were sent and distributed to various respondent candidates.
Because of some difficulties and barriers that author faced towards gathering the data
from various stakeholders, the whole data collection processes took about four and a half
months in Surabaya, Indonesia. Around 150 respondents from various stakeholder groups
expressed their willingness and agreed to fill up the 10 pages design-based questionnaire
provided. However, only about 126 questionnaires were successfully collected (see Figure 6-
16).
7 Resp.
Total=126 respondents
G1. Brantas river basin management agency
G2. State government of public works
P1. Jasa Tirta-1 public corporation
G3. Surabaya city government
P2. Regional water supply enterprise
M1. Industry
M2. Commercial and, or public space
M3. Domestic end user
13 Resp.
5 Resp.
8 Resp.
10 Resp.
24 Resp.
27 Resp.
32 Resp.
Figure 6-16. Total respondents from eight stakeholder groups.
The data collection intends to assemble the stakeholder perceptions regarding the

CHAPTER 6-FRAMEWORK VALIDATION: APPLICATION TO A CASE STUDY
Page 171
UWS infrastructure risk magnitude, dynamic impact and propagation mechanism. The
questionnaire was disseminated face-to-face meeting. The 126 respondents number is
considered sufficient for this research as the input data used in the conceptual framework.
The reason is that the RA and REA models within conceptual framework develops in this
research is applying various analysis methods. Specifically, the SNA method typically do not
have an unambiguous notion of sample size [285].
In this research the sample size was considered sufficient to represent Surabaya’s
stakeholder participation from various sectors and levels in the Surabaya water supply
infrastructure. This consideration, moreover, also supported by several number of former
studies applied the network analysis in which the sample size applied range between 14-389
respondents [86, 92, 184-186, 189, 208, 209, 286]. The 126 respondent demographical data
and details are explored in Table 6-3 to 6-6.
Table 6-3. Respondents number.
Stakeholder groups Sum Percentage (%) Brantas river basin management agency (G1) 7 5.6 State government of public works (G2) 13 10.32 Jasa Tirta-I public corporation (P1) 5 3.96 Surabaya city government (G3). 8 6.35 Regional water supply enterprise (P2) 10 7.9 Industry (M1) 24 19.05 Commercial and, or public space (M2) 27 21.43 Domestic end user (M3) 32 34.13
Total 126 100
Table 6-4. Respondents demographic data based on the age group.
Age group Sum Percentage (%) 23-30 Years old 52 41.26 31-38 Years old 27 21.42 39-46 Years old 21 16.67 47-53 Years old 22 17.46 54-60 Years old 4 3.17 > 61 Years old 0 0
Total 126 100
Table 6-5. Respondents demographic data based on the education level.
Education level Sum Percentage (%) Undergraduate 82 77.35 Master/Graduate 28 22.22 Doctorate 1 3.84 Other 15 11.71 N/A 0 0
Total 126 100
As mentioned in research design section (Chapter 4), this research applied the cluster
sampling but conducted in a non-probabilistic sample method. The proportion of eight
groups of stakeholders as a participant in this research can be seen in Table 6-2. Since the
author faced a number of challenges and difficulties towards inviting and reaching

CHAPTER 6-FRAMEWORK VALIDATION: APPLICATION TO A CASE STUDY
Page 172
government people and experts as well as lay people to participate into this research, the
percentage of stakeholder groups number was not same. To deal with this issue, the author
also applied the snowball sample techniques to open new horizon and reach latent
participant, especially government people, which in the preliminary period of data collection
was not known.
Table 6-6 Respondents demographic data based on working experience.
Working experience Sum Percentage (%) < 5 Years 34 26.98 5-10 Years 38 30.15 11-15 Years 19 15.08 15-20 Years 35 27.78
Total 126 100
The participants are the person who are in the range of 23-30 years old with
undergraduate level of education background compiled by their 5-10 years working
experience. The detail of their demographic data including their working background,
institution name, position and participant ID number can be seen in Appendix B in the last
section of this dissertation. The data processing, simulation and analysis are discussed in the
next Chapter.
6.6 Chapter Summary
This Chapter outlined detail of the case study and data collection procedure and respondent
demographics. The Surabaya water supply infrastructure system which has been chosen as
the main case study for this research. This case study appointed towards testing and
validating the conceptual framework proposes. Eight stakeholder groups and thirty risk
events in the Surabaya water supply infrastructure system are identified and discussed in-
depth. Following the university ethics and fieldwork permitting processes, around 250 sets
questionnaire were disseminated by face-to-face approach.
Out of 250 targeted participants, 126 participants agreed to participate into this
research by filling the questionnaire. Data were obtained through design-based
questionnaire and aided by face-to-face semi-structured interviews administrated in
Indonesia with expert in Surabaya water supply infrastructure and relevant stakeholders.
Furthermore, following the research strategy, face-to-face semi-structured interviews with
the aid of structured questionnaires also conducted by the author.
The data collection activities, instruments, respondents’ profile and research
objectives outcomes were also detailed. Purposeful and convenience sampling was selected
as the appropriate sampling strategy for the data collection phase. Moreover, respondents

CHAPTER 6-FRAMEWORK VALIDATION: APPLICATION TO A CASE STUDY
Page 173
were selected based on their job position, work experience and background knowledge in
the case of experts, or stakeholder category, age and level of education in the case of
stakeholders.
Although the sample size was small, but this does not invalidate the data processing
and analysis; it is adequate for this type of research. This is because the study uses the Fuzzy-
based FMECA and SNA, which are not traditional quantitative data analysis methods and the
statistical sampling is not the issue in all circumstances. Furthermore, this Chapter
presented the profiles of the respondents for the case study. Regarding the aggregation of
the stakeholder groups preferences, the analysis models which explored in Chapter 4 and 5
were deemed most suited for this research, as each participating individual can provide his
or her own perspective towards Surabaya water supply infrastructure system risks.

CHAPTER 6-FRAMEWORK VALIDATION: APPLICATION TO A CASE STUDY
Page 174
-This page intentionally left blank-

CHAPTER 7-DATA PROCESSING, SIMULATION AND ANALYSIS
Page 175
CHAPTER 7
DATA PROCESSING, SIMULATION AND ANALYSIS
CHAPTER HEADINGS Introduction Initial Data Processing Phase 1-Data Processing, Simulation, and Analysis Phase 2-Data Processing, Simulation, and Analysis Phase 3-Data Processing, Simulation, and Analysis Phase 4-Data Processing, Simulation, and Analysis Phase 5-Data Processing, Simulation, and Analysis Phase 6-Data Processing, Simulation, and Analysis Chapter Summary
7.1 Introduction
This Chapter consists of analysis model simulations and output discussions, including; risk
magnitude analysis, risk causality and interaction pattern analysis, risk impact to community
analysis, critical RA, system robustness analysis, and the system recovery analysis using
scenario-based metric data. After collecting the data, this research is ready to analyze the
results to determine the direction of the study. Following the data collection in the field and
the literature review conducted, the research resulted in a large amount of information,
which cannot be presented easily in its entirety.
The research summarizes the data which highlights the main trends and differences
in the most appropriate manner. Initially, this Chapter presents the initial data processing
which is then used as an input data towards the proposed analysis models. The step-by-step
method of processing the input data obtained from the fieldwork is discussed first in this
Chapter. The output of computation and simulation are discussed separately for different
phases of analysis.
Based on the output analysis discussions, findings and computations are discussed in
the last part of this Chapter. This Chapter will cover the following:
- Initial data processing and the variables
- Global risk magnitude analysis using Fuzzy-based FMECA method
- Significant risk event in terms of the impact on the community
- Significant risk event in terms of its’ causality capacity affecting other risk events
- The critical risk events based on its criticality variable
- Exploratory data analysis (archives and non-structured interview)
- The shock and stress effect analysis of risk events
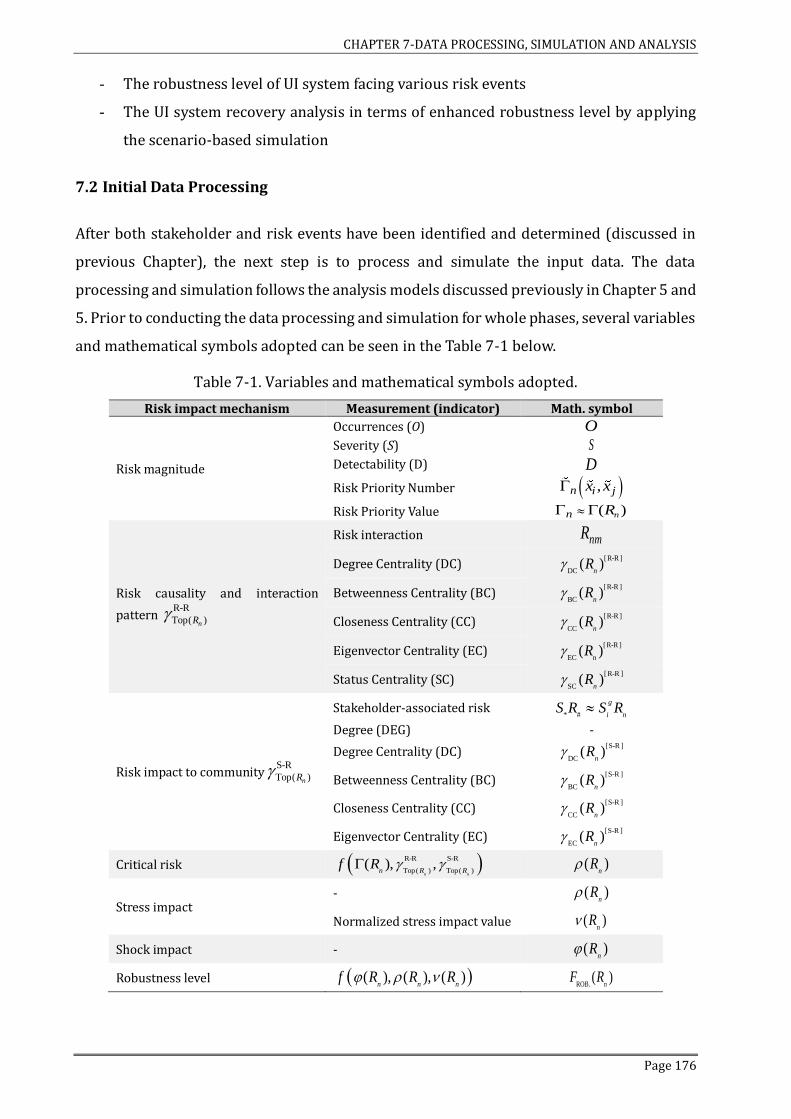
CHAPTER 7-DATA PROCESSING, SIMULATION AND ANALYSIS
Page 176
- The robustness level of UI system facing various risk events
- The UI system recovery analysis in terms of enhanced robustness level by applying
the scenario-based simulation
7.2 Initial Data Processing
After both stakeholder and risk events have been identified and determined (discussed in
previous Chapter), the next step is to process and simulate the input data. The data
processing and simulation follows the analysis models discussed previously in Chapter 5 and
5. Prior to conducting the data processing and simulation for whole phases, several variables
and mathematical symbols adopted can be seen in the Table 7-1 below.
Table 7-1. Variables and mathematical symbols adopted.
Risk impact mechanism Measurement (indicator) Math. symbol
Risk magnitude
Occurrences (O) O
Severity (S) S
Detectability (D) D
Risk Priority Number ( ),n i jx x
Risk Priority Value ( )nn R
Risk causality and interaction
pattern R-R
Top( )nR
Risk interaction nmR
Degree Centrality (DC) [R-R ]
DC( )
nR
Betweenness Centrality (BC) [R-R ]
BC( )
nR
Closeness Centrality (CC) [R-R ]
CC( )
nR
Eigenvector Centrality (EC) [R-R ]
EC( )
nR
Status Centrality (SC) [ R-R ]
SC( )
nR
Risk impact to communityS-R
Top( )nR
Stakeholder-associated risk * #
g
i nS R S R
Degree (DEG) -
Degree Centrality (DC) [S-R ]
DC( )
nR
Betweenness Centrality (BC) [S-R ]
BC( )
nR
Closeness Centrality (CC) [S-R ]
CC( )
nR
Eigenvector Centrality (EC) [S-R ]
EC( )
nR
Critical risk ( )R-R S-R
Top( ) Top( )( ), ,
n nn R R
f R ( )n
R
Stress impact - ( )
nR
Normalized stress impact value ( )n
R
Shock impact - ( )n
R
Robustness level ( )( ), ( ), ( )n n n
f R R R ROB.( )
nF R

CHAPTER 7-DATA PROCESSING, SIMULATION AND ANALYSIS
Page 177
7.3 Phase 1-Data Processing, Simulation and Analysis
After finishing the data processing, the analysis of risk magnitude can be conducted
following the model analysis flowchart in Figure 5-2. Applying the Fuzzy-based FMECA, the
global analysis of risk magnitude output is presented in Table 7-2 below. Global analysis
refers to the risk magnitude analysis, where the input data comes from all parties involved
within the data collection (unified input data). Local analysis refers to the output of risk
magnitude analysis which is generated based on different stakeholder groups.
Following the research objectives and questions, this research only discusses the
global analysis result. Local analysis output and discussion are considered insignificant for
this research. Following Table 7-2, ten significant risk events are explored and discussed. The
ten most significant risk events in the terms of their magnitude is R5 followed by R22, R1,
R24, R19, R11, R18, R20, R4, R21. These significant events are explained below.
Table 7-2. The risk magnitude output based on local and global analysis.
Risk ID
Risk magnitude Risk ID
Risk magnitude
Global score (RPN) Risk rank Global score (RPN) Risk rank
R1 1.720 3 R16 1.911 21 R2 1.830 14 R17 1.901 19 R3 1.920 23 R18 1.767 7 R4 1.785 9 R19 1.754 5 R5 1.598 1 R20 1.778 8 R6 1.916 22 R21 1.804 10 R7 1.807 11 R22 1.708 2 R8 1.950 27 R23 1.821 12 R9 1.930 25 R24 1.743 4
R10 2.058 29 R25 1.845 16 R11 1.765 6 R26 1.865 17 R12 2.087 30 R27 1.943 26 R13 1.925 24 R28 1.827 13 R14 1.904 20 R29 1.869 18 R15 1.843 15 R30 1.950 28
Note: The definition for identified risks (R1 to R30) refers to the section 6.4.
- Pollution and contamination (R5); The existence of a river crucially supports community
activities. Thus, washing, toilet necessities and even more as a source of drinking water.
Pollution and contamination is a major problem in Surabaya city. River pollution also
spoils the scenery of Surabaya city. The source of river pollution can be from both
industrial discharge and domestic waste. To mitigate this risk, it is important to
understand various sources of river pollution comprehensively. Surabaya river pollution
is marked by the absence of fish in Surabaya river.
- Physical infrastructure decay (R22); In fact, Surabaya city water supply’s physical
infrastructure system was mainly built a long time ago, with some reaching 100 years

CHAPTER 7-DATA PROCESSING, SIMULATION AND ANALYSIS
Page 178
old. This risk also leads to increased leakage level, water main breaks, and service
disruptions.
- Climate change (R1); The water sector is one of the most important sectors to be
influenced by climate change impacts. The projected climate change will likely impose
water shortage in several regions in Indonesia. Based on climate projections, most
regions in Indonesia will suffer from a gradual decrease of water supply due to
temperature increase and rainfall changes that will affect the water balance. This finding
is also supported by the national level of climate risk study [148, 287]. It is found that
areas which possess high risk of water shortage stretch in some parts of the Java-Bali
region, especially in a few locations in the northern and southern part of West Java,
middle and southern of Central Java and East Java.
- Water loss-NRW (R24); This analysis output is supported by expert opinions, mainly
from the PDAM stakeholder group. PDAM Surya Sembada has been seeking to suppress
the rate of water loss due to theft, through a meter replacement program for home
connections. To mitigate this risk, the PDAM has targeted community water meters for
replacement. However, another problem emerges as PDAM has failed to achieve its water
meter replacement target. This was due to several reasons, including the situation where
the customers’ water meters were buried under ceramic tiles or inside houses that had
been renovated (community rejection-R10). Based on the interview, this risk could affect
PDAM financial losses by around IDR. 2 billion (approx. AU$ 200.000-using current
currency).
- Trouble in water transmission and distribution network (R19); In the Surabaya water
supply infrastructure system, the problems normally faced in water
supply transmission and distribution system are; (i) Un-accounted for water (Leakage
and Wastage of water), (ii) Degradation of quality of water, (iii) Reduction in carrying
capacity, and (iv) Inadequate pressures at tail ends of the system. Moreover, R19 also
refers to the leakage which is common in the Surabaya water supply infrastructure
system. The causes for the leakage in the pipeline could be attributed to various factors,
such as; (i) The use of sub-standard pipes and fittings leading to imperfect jointing,
causing leakage in joints, (ii) Selection of pipe material without considering the
corrosives of the soil in which the pipes are to be laid and the quality of water the pipe
has to carry, which eventually may lead to corrosion of the pipes and fittings, (iii) Lack
of quality control in jointing of pipes during installation, which may result in leaks in
joints when there is settlement of the supporting soil, (iv) Non-conducting or improper

CHAPTER 7-DATA PROCESSING, SIMULATION AND ANALYSIS
Page 179
conducting of hydraulic pressure testing of pipeline and joints at the time of installation,
(v) Soil movement particularly when the pipes are laid in swelling soils like clay, due to
change of moisture content, which may cause disturbance to the pipes and joints
ultimately resulting in leakage, (vi) Water hammer pressure disturbing the joints,
resulting in leakage, (vii) Not detecting and rectifying the badly leaking joints regularly.
- Population growth and urbanization problem (R11); The increased demands for water
in Surabaya as a consequence of the population growth and economic development have
been accelerated from year to year. Combined with estimated population growth rates,
increased water demand will cause severe water shortages to occur, especially in Java
and Sumatra for the period of 2020-2030. The spatial and temporal variability of human
induced hydrological changes in a river basin could affect quality and quantity of water.
The challenge is that the water supply infrastructure system should cope with complex
issues of water in order to maximize the resultant economic and social welfare in an
equitable manner, without compromising the sustainability of vital ecosystems.
Population growth and an expanding manufacturing sector will increase demand for
water.
- Water quality defective (R18); The R18 refers to the decreasing of water quality being
distributed to community. This issue has been gaining high attention to experts,
industries and lay people. The water quality defect emerges due to various causes such
as, highly polluted raw water (Surabaya river), water supply transmission and
distribution problem and criminal acts (destruction and desecration of the pipeline).
- Mechanical component failure (R20); This risk usually occurrs due to infrastructure
aging and exceeding the load capacity due to uncertain conditions; leaks occur from
valves and distribution pipes. Further, mechanical component failure caused by the
intrusion of tree roots into the distribution pipeline is often a major cause of distribution
leakage.
- Idle land exploitation (R4); Following the study conducted by Nurhidayah, L., there is a
trend that development in big cities in Indonesia has neglected the principle of an
environmentally sustainable city [148]. The problems faced by big cities in Indonesia are:
air and water pollution, land degradation and lack of green space areas. This condition
is indeed not only jeopardizing the present but also the future generations. Surabaya, the
second largest city after Jakarta, has not implemented environmentally sustainable city
principles due to several reasons. These include: the local government favouring
economic benefit over environment protection, weakness of enforcement mechanisms

CHAPTER 7-DATA PROCESSING, SIMULATION AND ANALYSIS
Page 180
and. institutional deficiencies.
- Insufficient maintenance (R21); The insufficient maintenance disturbs the process of
delivering safe water to the community, and also shortens the life time service of the
physical component of urban water supply infrastructure. This risk causes a physical
loss where the water is actually lost through leakage and wastage. Leakage refers to the
water lost from storage reservoirs, transmission mains, service reservoirs, and
distribution system and house service connections through leaks from cracks, holes or
joints of pipe lines and due to corroded pipes and fittings in house service connections.
On the other hand, there are also another five risk events categorized as least
significant, such as; ‘limited access to clean water’ (R8), ’sabotage to physical infrastructure’
(R12),’ community rejection’ (R10), ‘foreign exchanges rates instability’ (R27), and ‘prize
stabilization failure’ (R30). Although R30 is considered as the least significant risk event,
with a lower magnitude level, the discussion towards R30 still needs to be considered.
Following expert narratives, the inefficiency of the water price setting could disrupt water
demand regulation.
In the Surabaya water supply infrastructure system, water use is heavily subsidized,
and prices are set without proper consideration of scarcity at an inefficiently low level.
Therefore, inefficient price level causes fluctuations in the balance between supply and
demand. This issue is further exacerbated by the overuse of water resources. Thus, failure to
find a balance between tariffs and service standards that consumers consider reasonable
contributed to the arrangement’s failure. Moreover, there is a lack of clarity regarding the
regulation and fixing of water tariffs which disrupt the supply of the water system.
7.4 Phase 2-Data Processing, Simulation and Analysis
A matrix of risk interconnections developed by following equation 5-11 to 5-14. Since both
local and global S.R matrix are complex and time consuming, this research exempts the
preliminary data processing explanation. The GRM,
.,,
n mnm
R RR R
and dichotomized GRM
.nm
R R can be seen in Figure B-1 and B-2 respectively (Appendix B). The dichotomized GRM
.nm
R R , which is a 30 x 30 size adjacent matrix, shows the weighted network value of risks
interaction using scale of 0 (no impact) to 5 (primary cause).
Cutter (2016), mentioned the importance of specificity when characterizing risks
[57]. In this instance, weights reflect the impact of the specific incidents on the outcome as
they affect another risk event. The final matrix of risk interconnections shows a weighted

CHAPTER 7-DATA PROCESSING, SIMULATION AND ANALYSIS
Page 181
number between risk events ( )nR , defined whenever the occurrence of one event (an event
as an ‘incident’) shapes another event (an event as an ‘outcome’ of another event).
Table B-2 (see Appendix B) makes it clear that many risk events serve dual temporal
roles in the context of the Surabaya water supply infrastructure system. Reading each row
can help identify risk events that cause (or influence) other risk events, or what is often
referred to as risk drivers; those caused by humans (which can be an example of negative
coping). While, reading vertically by column, shows the multiple ‘pathways’ that create a risk
event. Along with showing connection between risk events, Table B-2 makes it possible to
see how each risk event contributes to other risk events. Therefore, this helps to reveal the
breadth of impact a particular risk event.
Furthermore, reviewing these pathways helps understand some of the ways for
addressing various risks. Water shortage (R3), for example, can be addressed by improving
water transmission and distribution network, lifting and building the physical structures,
improving network system maintenance and technology applied. Such a dispersed number
of pathways can make water supply risk reduction challenging. The reason behind this is that
problems might be deeply embedded within the economic, technical and operational matter,
requiring a range of interventions and coordination across institutional structures.
On the other hand, there are numerous incidents that have only a small effect on other
risk events. These have been marked with a zero. Some have a more substantial outcome and
have been marked with a two (or one). A few are a primary cause and are marked with a five
(some marked with four). In regard to the levels of impact, the resulting weighted matrix
offers a more granular view of how events affect each other. The row totals have been tallied
from the matrix to show more clearly the vectors of how specific incidents contribute to
other incidents. The column total shows the pathways to address a problem.
From this matrix, it becomes clear that R5, R18, R3, R2 and R19, with row total of 83,
76, 68, 65 and 57 respectively, are some of the main contributing risk events to Surabaya
water supply infrastructure system problems. Efforts to address Surabaya water supply
infrastructure system problems should perhaps focus on these issues. Moreover, the
pathways section shows many of these events to be highly interlinked, meaning that they
require a broad number of interventions to address.
This provides clear demonstration of the importance of a multi-sectoral approach to
risk reduction, either through integrated programming within one institution (or
organization), or through a network of stakeholder specialized in different areas. Stepping
back and establishing the broader context of the risk shows that risks are not simply the

CHAPTER 7-DATA PROCESSING, SIMULATION AND ANALYSIS
Page 182
products. Accordingly, weighting lends greater precision to which interventions might
requires coordination within another risk events.
For instances; R2, R3, R5 and R18, have high pathways so are more likely to be
affected by other interventions. While risk events with fewer pathways are more ‘closed off’
so might need direct intervention within a specific mitigation program. Further, the matrix
shows how specific events directly connect with each other, but indirect connections are less
intuitive. For example, the matrix shows how R5 directly contributes to R18, but the reader
must (periodically) trace how R5 contributes to R18 since an increase in river pollution is an
outcome of both R18 and R19. Importantly, network visualization adds clarity to this matrix.
Visualizing the matrix as a network can be used to quickly understand processes of
interaction and see how each node fits in within a broader system. Networked visualization
also helps to understand the types of interventions necessary for risk reduction. To simulate
and obtain the network visualization, the adjacency matrix aforementioned is then used as
the basic matrix to run the risk interaction network simulation. To run the simulation and
computation, this research employs the Excel Spreadsheet and commercial software named
NetMiner 4.0. [288].
Once the adjacency matrix is converted into a useable format it can be uploaded to
develop a network map. Network visualization and topology decipherment offer important
clues that provide greater detail on what those coordination structures should look like.
Table 7-3 shows the risk network topology measurement output, and Figure 7-1 to 7-10
shows the risk interaction network as well as their concentric maps.
Risk network topology and visualization shows that there are a number of risk events
with considerable capacity and influence which contributes to several problems, such as; R1,
R2, R3, R5, R8, R15, R17, R18, R19, R20, R21, and R30. These risk events indicate a need for
coordinated or integrated interventions. The clues aforementioned would be much less
visible without the tools of network visualization. These maps together help assess UWS
problems in Surabaya as a network, visually showing how various risk events are
contextually embedded as a part of other interrelated challenges.
Coordination and governance by various actors (stakeholder groups) is thus a critical
component of addressing these risks which have high connection capacity. Moreover,
spatializing these risks as a network also provides a way of capturing the idea that risks, their
impact, and interrelationship are not unidirectional and linear, but rather highly
interconnected, with importance arising from degree of connection with other risks.
Assessing UWS infrastructure risk from an interconnected perspective reveals that

CHAPTER 7-DATA PROCESSING, SIMULATION AND ANALYSIS
Page 183
R5 is a central and main consideration to tackle as part of addressing other risks. For instance;
R5 exacerbates and is exacerbated by many other risks, from R1, R2, R3, and R17 to R18. The
R5 is therefore, not an issue to solve on its own but rather one that needs to be addressed
holistically through a variety of interventions falling under a diverse range of sectors and
scales. This finding that might not be captured with more linear representations of
conventional RA.
Table 7-3. R-R network topology decipherment simulation output
Risk ID
DEG DC CC BC EC
SC In Out In Out In Out In Out
R1 22 24 0.759 0.828 0.795 0.853 0.022 0.239 1.182 1.232 R2 23 27 0.793 0.931 0.819 0.935 0.045 0.246 1.224 1.319 R3 24 27 0.828 0.931 0.845 0.935 0.055 0.246 1.260 1.319 R4 6 3 0.207 0.103 0.541 0.527 0.000 0.077 0.373 0.190 R5 28 29 0.966 1.000 0.966 1.000 0.168 0.249 1.391 1.375 R6 9 6 0.310 0.207 0.575 0.558 0.000 0.113 0.546 0.373 R7 15 12 0.517 0.414 0.659 0.630 0.000 0.178 0.864 0.717 R8 20 22 0.690 0.759 0.751 0.806 0.010 0.230 1.102 1.165 R9 14 12 0.483 0.414 0.644 0.630 0.000 0.169 0.814 0.717
R10 4 1 0.138 0.034 0.520 0.509 0.000 0.052 0.253 0.064 R11 12 10 0.414 0.345 0.614 0.604 0.000 0.147 0.710 0.606 R12 14 12 0.483 0.414 0.644 0.630 0.000 0.169 0.814 0.717 R13 2 2 0.069 0.069 0.501 0.518 0.000 0.026 0.130 0.128 R14 4 2 0.138 0.069 0.520 0.518 0.000 0.052 0.253 0.128 R15 20 23 0.690 0.793 0.751 0.829 0.012 0.235 1.102 1.201 R16 13 12 0.448 0.414 0.629 0.630 0.000 0.159 0.765 0.717 R17 19 20 0.655 0.690 0.731 0.763 0.005 0.219 1.056 1.095 R18 27 29 0.931 1.000 0.932 1.000 0.133 0.249 1.357 1.375 R19 23 24 0.793 0.828 0.819 0.853 0.027 0.239 1.224 1.232 R20 20 23 0.690 0.793 0.751 0.829 0.012 0.235 1.102 1.201 R21 20 20 0.690 0.690 0.751 0.763 0.006 0.219 1.102 1.095 R22 14 15 0.483 0.517 0.644 0.674 0.000 0.178 0.814 0.874 R23 14 18 0.483 0.621 0.644 0.725 0.000 0.204 0.814 1.008 R24 18 19 0.621 0.655 0.711 0.744 0.003 0.211 1.008 1.053 R25 8 6 0.276 0.207 0.563 0.558 0.000 0.101 0.489 0.373 R26 4 2 0.138 0.069 0.520 0.518 0.000 0.052 0.253 0.128 R27 2 0 0.069 0.000 0.518 0.000 0.000 0.026 0.130 0.000 R28 9 5 0.310 0.172 0.575 0.547 0.000 0.113 0.546 0.313 R29 14 11 0.483 0.379 0.644 0.617 0.000 0.169 0.814 0.662 R30 14 20 0.483 0.690 0.644 0.763 0.001 0.219 0.814 1.095
Note: The DEG refers to how many stakeholder (out of 126) associated and affected by respective risk events. The bold and underline character refers to the top five highest rank and lowest rank respectively.
Furthermore, the risk maps created by this case are the result of a unique
combination of interdependent processes. Because of their interdependence, changes in that
combination-the removal of a node, strengthening or weakening of an edge-can reverberate
across these maps. In this case, for instance R5 and R18 were highly connected through a
direct and diverse combination of other nodes. In other contexts, this might not be the case.
This indicates the need for an empirical review of each risk situation rather than making
generic statements on the way events affect risk.

CHAPTER 7-DATA PROCESSING, SIMULATION AND ANALYSIS
Page 184
A variety of processes led to R5 for the Surabaya city, however, most of those causal
factors were the product of the slum residents and illegal waste activities by various
industries. Further, it also the product of an external agent within the city (e.g., the city
government, regional water supply enterprises and river basin bureau) or in the case of
climate change, across the world. This makes the root causes of UI risk creation an issue of
good governance, indicating the need to approach infrastructure resilience from an overtly
political manner focused on developing equitable governance structures supportive of all
urban elements.
However, a variety of pathways also provides several opportunities for addressing a
problem, meaning leaving fewer chances for a problem to become insurmountably stuck. For
problems with few interconnections targeted, specific interventions (e.g., R10, R13, R14, R27)
might actually be ‘quick fix’ that could solve problems in their entirety. Nonetheless, less
targeted generic interventions may not be effective for addressing problems, and roadblocks
may arise that could create intractable choke points.
The degree of centrality (DC) is a measure of influence of nodes on a network. Nodes
with high measures of centrality are well connected to other nodes in a map (Figure 7-1 and
7-2). A high level of DC indicates an event that plays a major role in a problem based on its
combined function as an incident and outcome. Such an event could be a root cause for the
risk in question. The DC consists of another two centralities, that is; in-degree centrality (In-
DC) and out-degree centrality (Out-DC). Out-DC is showing how risk events act as vectors
contributing to other outcomes. While, In-DC provides a visualization of which events are
affected by other events.
In terms of risk significant, this study only focuses on the Out-DC. The R3 and R18,
has a high Out-DC as indicated by its large size with R5 being the largest node overall
compared to the other nodes in the risk network map. This makes R5 a central problem to
the Surabaya water supply, meaning that addressing R5 could be a means of addressing a
main problem in Surabaya water supply infrastructure system, and vice versa. Since R5 has
the greatest impact on other events, it should be addressed to alleviate the risk system
creating water supply disturbance.
Unlike the Out-DC, the R3 and R18 as well as the R19 are also prominently impacted
by R5 and its related factors. Mitigating river pollution (in this case study is a multi-
dimensional problem) and its other causes will help address these events. This type of layout
is useful for assessing causality between components shaping UI risks. The R3 and R18
nodes are located near each other, indicating a close relationship. Indeed, respondents

CHAPTER 7-DATA PROCESSING, SIMULATION AND ANALYSIS
Page 185
described R3 as directly related to R18 on the water supplied in a specific range of period to
community-since people considered poor water quality cannot be used nor meet community
needs-as it meant supplied water and other matter which related to the UWS system
faltering and could not work properly.
Figure 7-1. Risk causality and interaction pattern network topology based on DC.
Figure 7-2. Risk causality and interaction concentric map based on DC.

CHAPTER 7-DATA PROCESSING, SIMULATION AND ANALYSIS
Page 186
Figure 7-3. Risk causality and interaction pattern network topology based on BC.
The betweenness centrality (BC) defines the risk event which has the role as a
gatekeeper for controlling impact flows through the risk network. The network graph and
concentric map based on BC can be seen in Figure 7-3 and 7-4 respectively. In BC context,
interestingly, R5 stands solely as the risk with highest BC score by showing the biggest node
size compare to other risk events. This finding provides an explicit guidance towards
building mitigation plan and strategy, such as; concretely building an intervention plan to
interfere R5. This would decrease the impact and influence capacity of other risks within risk
network.
Further, major risks (e.g., R2, R3, R4, R10, R13, R15, and R23) have a very small role
in the BC context (low characteristic towards bridging another risks impact flow). Surabaya
water supply infrastructure system risks are mainly independent and isolated which the
impact effect is emerged by its own capacity where without R5, their influence on other risks
is very small and builds a connection among other risk events.
The closeness centrality (CC), is a network measure of the risk capacity for
disseminating its impact (influence) to whole risks. Risk events with high CC potentially
reach and affect the central risk network very quickly. Differing from both DC and BC, in CC
there are several risk events which have a bigger node size compared to other risks. Based
on the CC network measure, theoretically, risk events that are tightly connected have a heavy
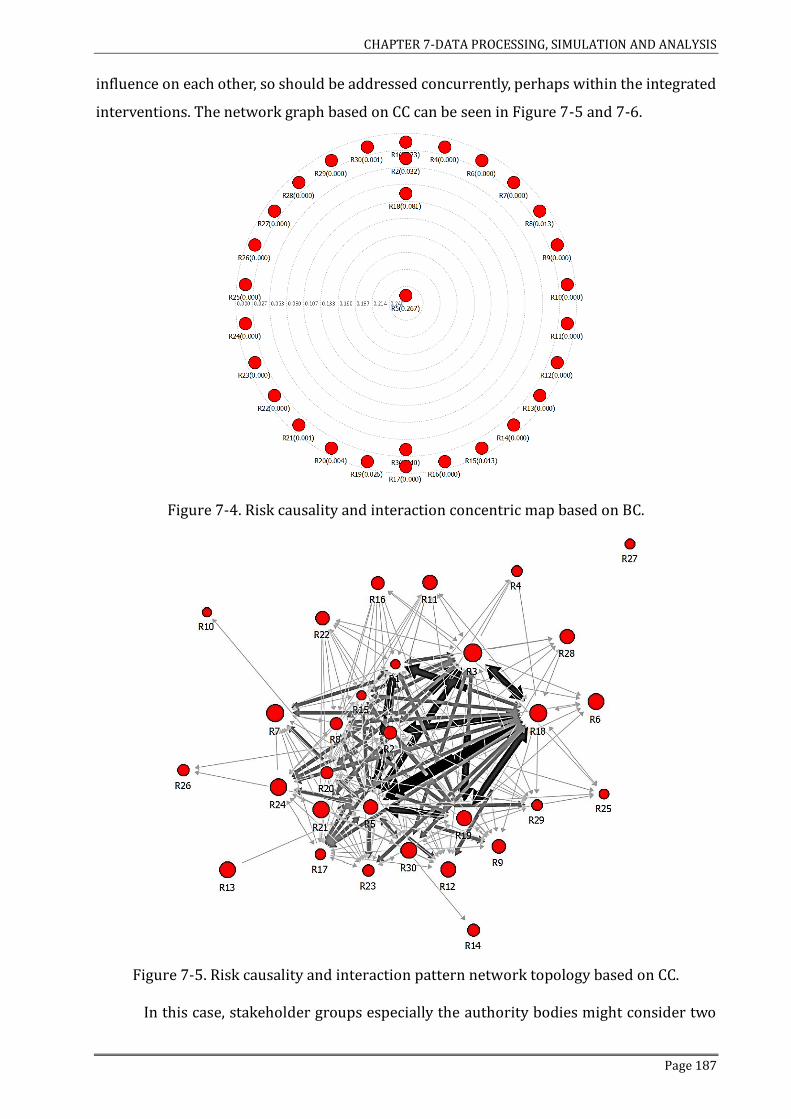
CHAPTER 7-DATA PROCESSING, SIMULATION AND ANALYSIS
Page 187
influence on each other, so should be addressed concurrently, perhaps within the integrated
interventions. The network graph based on CC can be seen in Figure 7-5 and 7-6.
Figure 7-4. Risk causality and interaction concentric map based on BC.
Figure 7-5. Risk causality and interaction pattern network topology based on CC.
In this case, stakeholder groups especially the authority bodies might consider two

CHAPTER 7-DATA PROCESSING, SIMULATION AND ANALYSIS
Page 188
types of interventions, for instances; a specific intervention directed at emphasizing the city
regulation towards the environment law specifically to river protection legislation and the
waste disposal policy, and an integrated program that focuses on providing campaign and
educational assistance for the community.
Figure 7-6. Risk causality and interaction concentric map based on CC.
Figure 7-7. Risk causality and interaction pattern network topology based on EC.
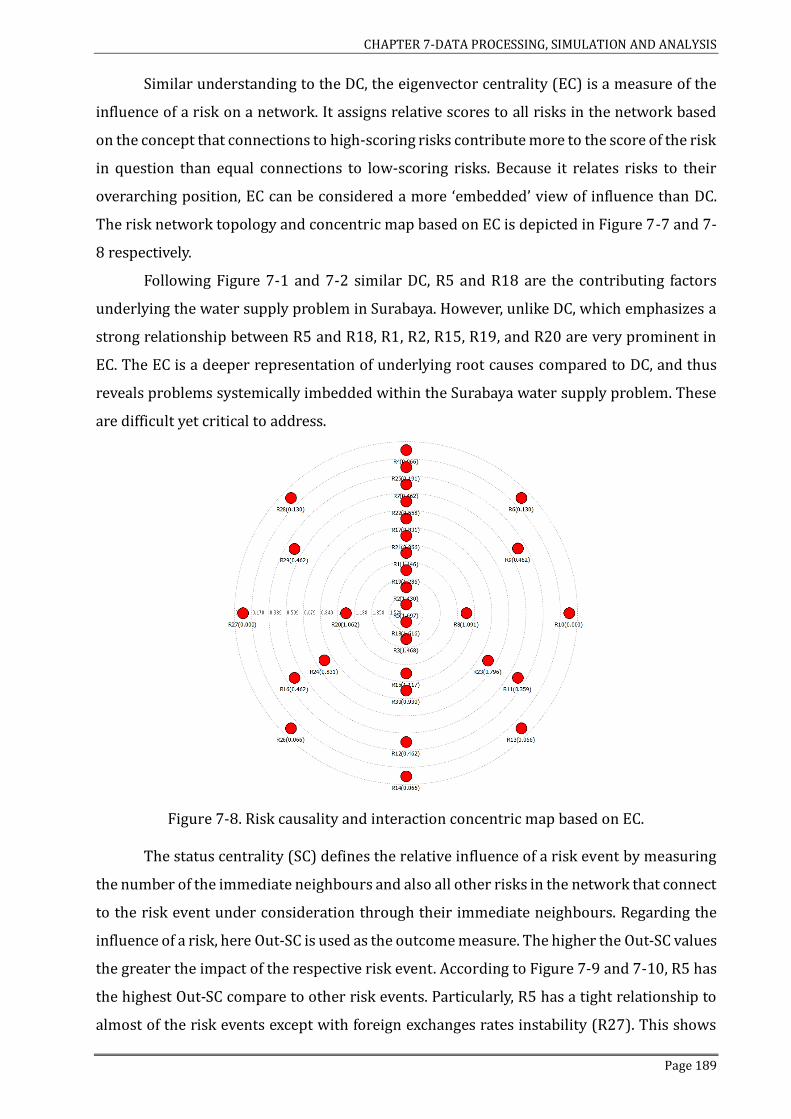
CHAPTER 7-DATA PROCESSING, SIMULATION AND ANALYSIS
Page 189
Similar understanding to the DC, the eigenvector centrality (EC) is a measure of the
influence of a risk on a network. It assigns relative scores to all risks in the network based
on the concept that connections to high-scoring risks contribute more to the score of the risk
in question than equal connections to low-scoring risks. Because it relates risks to their
overarching position, EC can be considered a more ‘embedded’ view of influence than DC.
The risk network topology and concentric map based on EC is depicted in Figure 7-7 and 7-
8 respectively.
Following Figure 7-1 and 7-2 similar DC, R5 and R18 are the contributing factors
underlying the water supply problem in Surabaya. However, unlike DC, which emphasizes a
strong relationship between R5 and R18, R1, R2, R15, R19, and R20 are very prominent in
EC. The EC is a deeper representation of underlying root causes compared to DC, and thus
reveals problems systemically imbedded within the Surabaya water supply problem. These
are difficult yet critical to address.
Figure 7-8. Risk causality and interaction concentric map based on EC.
The status centrality (SC) defines the relative influence of a risk event by measuring
the number of the immediate neighbours and also all other risks in the network that connect
to the risk event under consideration through their immediate neighbours. Regarding the
influence of a risk, here Out-SC is used as the outcome measure. The higher the Out-SC values
the greater the impact of the respective risk event. According to Figure 7-9 and 7-10, R5 has
the highest Out-SC compare to other risk events. Particularly, R5 has a tight relationship to
almost of the risk events except with foreign exchanges rates instability (R27). This shows

CHAPTER 7-DATA PROCESSING, SIMULATION AND ANALYSIS
Page 190
that there is no causality nor relationship between R5 and R27.
Figure 7-9. Risk causality and interaction pattern network topology based on SC.
Figure 7-10. Risk causality and interaction concentric map based on SC.
Again, R5 still plays an important role by disseminating its impact and influencing
almost the whole of the network. This is in line with previous discussion and another

CHAPTER 7-DATA PROCESSING, SIMULATION AND ANALYSIS
Page 191
network topology. In this case R5 can be stated as a significant risk by showing its causality
and highest interrelationship capacity towards whole network measurement. It can be seen
from all Figures above that each has some connection to R5 as the central risk which has
highest capacity within risk network, either as an incident exacerbating or as an outcome of
clean water supply to the community.
This finding is also supported by the expert opinions in the field. Based on the
interview, R5 is often linked to other risks, either as a source or an effect. For instance, high
pollution level in Surabaya river make it difficult for PDAM to process and produce clean
water. Thus, results in a quality decrease of the clean water produced (refer to R18).
Interestingly, it is also found that low quality water distributed to the community also relates
to both R19 and R3, which can be explained as follows.
The decreasing of the water quality leads to the disturbed distribution network. This
finding is also identical with the reality that the Surabaya water supply distribution network
has numerous blockages which consist of dirt and mud. This problem, further, resulted in
water scarcity faced by the community (both in quantity side and quality aspect). The
pollution, particularly garbage, that blocks some of the city water systems leads to flood,
natural disasters (R2) and spread of various diseases.
7.5 Phase 3-Data Processing, Simulation and Analysis
The building of Stakeholder-Risk Matrix (SRM)-[S-R] is based on the identification of both
risk events and individual stakeholders. Based on the identified risk events and stakeholders
(participants), and the data collected from the fieldwork, these risks events and their
associations with the stakeholders [S-R] form 126 rows ( )i and 30 columns ( )n in a matrix
which can be seen in Appendix B. The SRM is then converted into a bipartite matrix with
[126(+30) x 30(+126)] size. During the simulation, it is important to mention that the blue
square refers to the identified risk events and the red circle refers to the stakeholders.
Figure 7-11 shows the bipartite network visualization of stakeholder-associate risk
events based on the DEG. Furthermore, Figure 7-12 to 7-17 depicts the bipartite network
and concentric map visualization based on the DC, BC and CC respectively. While, Figure 7-
18 depicts the S-R network concentric maps based on EC. Furthermore, to analyze and
explore the simulation output comprehensively, this research presents the risk magnitude
assessment result computed in Phase-1 as a comparison to the Phase-3 simulation result.
Table 7-4 shows the simulation output of risk magnitude using the conventional method and
the four forms of network centrality.

CHAPTER 7-DATA PROCESSING, SIMULATION AND ANALYSIS
Page 192
Table 7-4. Risk magnitude and normalized S-R network topology decipherment.
Risk ID
F-FMECA Deg.
DC BC CC EC RPV Rank Value Rank Value Rank Value Rank Value Rank
R1 0.929 3 70 0.556 6 0.047 6 0.640 6 0.219 6 R2 0.873 14 73 0.579 5 0.061 4 0.654 5 0.230 5 R3 0.832 23 76 0.603 3 0.063 3 0.669 3 0.232 4 R4 0.895 9 33 0.262 25 0.007 24 0.506 25 0.125 25 R5 1.000 1 93 0.738 1 0.112 1 0.767 1 0.262 1 R6 0.833 22 36 0.286 24 0.006 25 0.514 24 0.147 23 R7 0.884 11 51 0.405 14 0.020 14 0.563 14 0.181 15 R8 0.819 27 63 0.500 8 0.036 8 0.610 8 0.204 8 R9 0.828 25 46 0.365 18 0.016 17 0.546 18 0.162 19
R10 0.776 29 28 0.222 27 0.003 30 0.492 27 0.123 27 R11 0.905 6 44 0.349 21 0.014 20 0.539 21 0.159 21 R12 0.765 30 48 0.381 16 0.014 19 0.553 16 0.179 16 R13 0.83 24 26 0.206 29 0.004 27 0.486 29 0.108 29 R14 0.839 20 28 0.222 27 0.005 26 0.492 27 0.113 28 R15 0.866 15 65 0.516 7 0.038 7 0.618 7 0.212 7 R16 0.836 21 45 0.357 19 0.013 21 0.543 19 0.168 18 R17 0.840 19 57 0.452 11 0.025 11 0.586 11 0.193 11 R18 0.904 7 85 0.675 2 0.085 2 0.718 2 0.254 2 R19 0.911 5 75 0.595 4 0.053 5 0.664 4 0.237 3 R20 0.898 8 60 0.476 9 0.033 9 0.597 9 0.203 9 R21 0.885 10 58 0.460 10 0.025 10 0.589 10 0.202 10 R22 0.935 2 47 0.373 17 0.017 16 0.549 17 0.173 17 R23 0.877 12 51 0.405 14 0.019 15 0.563 14 0.182 14 R24 0.916 4 55 0.437 12 0.023 12 0.578 12 0.193 12 R25 0.866 16 38 0.302 22 0.008 23 0.520 22 0.153 22 R26 0.856 17 29 0.230 26 0.004 28 0.494 26 0.125 26 R27 0.822 26 23 0.183 30 0.003 29 0.478 30 0.097 30 R28 0.874 13 37 0.294 23 0.009 22 0.517 23 0.138 24 R29 0.855 18 45 0.357 19 0.014 18 0.543 19 0.161 20 R30 0.819 28 54 0.429 13 0.021 13 0.574 13 0.188 13
Note: The DEG refers to how many stakeholder (out of 126) associated and affected by respective risk events. The bold and underline character refers to the top five highest (significant) rank and lowest (insignificant) rank respectively.
Based on both risk magnitude and S-R network simulation, this research found that
risk with high magnitude does not necessarily indicate that respective risk is significant
towards affecting the community. For instance; R22 ranked as 2nd and perceived highest
value for its magnitude. However, based on the S-R associated analysis context using
proposed method, R22 is considered as a non-significant risk event by showing a mediocre
network topology measurement score. Further, this finding also applies to other risk events
such as R24.
Contrary to the previous discussion, interestingly there are also a number of risk
events which possessed a low magnitude but have high network topology output. For
instance, R3 with risk magnitude ranked 23rd, has a high score and ranking for all of the
network topology measurement. This clarifies that even risk with low magnitude needs to
be considered as a significant risk considering its ripple impact deployment behavior within
the network affecting community.

CHAPTER 7-DATA PROCESSING, SIMULATION AND ANALYSIS
Page 193
Figure 7-11. Risk impact to community network visualization based on DEG.
Figure 7-12. Risk impact to community network visualization based on DC.

CHAPTER 7-DATA PROCESSING, SIMULATION AND ANALYSIS
Page 194
Figure 7-13. Risk impact to community concentric map based on DC.
Figure 7-14. Risk impact to community network visualization based on BC.
Following these findings, a face-to-face interview conducted by the author with the
experts also reveals that ‘water shortage’ (R3) does not arise because of highly correlated
(or impacted) by other risk events (e.g., natural disaster-R2 and, pollution and
contamination-R5). Instead, R3 emerges due to the existence of social inequality and uneven

CHAPTER 7-DATA PROCESSING, SIMULATION AND ANALYSIS
Page 195
services by authorities, which results in the lower quantity of supplied water. Even worse,
some precincts have difficulty obtaining water (no water supply in a certain number of
periods). Therefore, it is not surprising that R3 has profound influence on the community.
Figure 7-15. Risk impact to community concentric map based on BC.
Figure 7-16. Risk impact to community network visualization based on CC.

CHAPTER 7-DATA PROCESSING, SIMULATION AND ANALYSIS
Page 196
Although in fact Surabaya city rarely faces water shortage, however people assess R3
higher than the issue of ‘natural disasters’ (R2), and ‘trouble in water transmission and
distribution network’ (R19). Furthermore, participants perceived high inter-correlation
between R2 and R3 (i.e., unexpected both long rain season or drought, storm and sea water
intrusion to the city) as they generated an enormous impact and influence on the quantity,
quality and the whole processes of the clean water being processed, produced and supplied
to the community.
Phenomenally, there are a number of risk events with low magnitude score but high
BC score and ranked top five among the other one (Table 7-11). Specifically, both ‘natural
disaster’ (R2) and ‘water quality defective’ (R18) are the examples for low magnitude-high
BC risk events. This also clarifies that low magnitude risk has the capacity to control (change
the path) or even discharge a ripple impact flow through the network. In this case, BC output
might help policy and decision makers to identify the key risks which are prominent in the
network based on their virtual ties impact capacity affecting the community.
There is also a low magnitude-high CC risk. In this research, ‘limited access to clean
water’ (R8) is considered the only risk events which has low magnitude and high CC capacity.
This result defines that low magnitude risk events have a latent high impact capacity to affect
(connect) with others based on the shortest paths. In other words, R8 has high capacity for
disseminating its impact and influence very quickly to whole nodes (affecting community in
common). This finding is in line with the result of interview and expert justification in the
field.
Furthermore, (R8) perceived as less significant since this risk occurred very rarely
and is considered by the majority as a latent risk. Even though the Surabaya city water supply
system is considered well developed, there is still around 3%-5% population that face
difficulty in getting a supply of clean water. In a number of interviews with experts, R8 is
considered quite common in low-income communities. One of the reasons is that low-
income community in residential areas are hard to reach by the authority to develop the
water supply network. Moreover, high CC arises because its consequences emerge from
other risk resource (impact) and ultimately hinder the community’s ability to perform daily
activities significantly.
Although the risk magnitude and network measurements ranking in Table 7-4 are
slightly dissimilar, it can be clarified that ‘pollution and contamination’ (R5) is the most
significant and crucial risk for the community. In all of the network topology measurements,
R5 has been described as the most significant risk event. This indicates that R5 has a high

CHAPTER 7-DATA PROCESSING, SIMULATION AND ANALYSIS
Page 197
capacity to reach and affect the central network as well as the community. This finding is also
supported by a number of expert opinions since the Surabaya city clean water resource is
originally from the Surabaya river which is processed and managed by PDAM.
Figure 7-17. Risk impact to community concentric map based on CC.
Moreover, the issue of R5 in Surabaya is a multi-dimensional challenge to the
Surabaya city government where the sources of R5 are both natural (e.g., climate change-R1,
uncertain rainfall, river flow fluctuation, river sediment and submission dirt from upstream)
and man-made error (e.g., lack of awareness, littering and conducting illegal activity in the
river, illegal industry waste disposal). Consequently, it will burden PJT-1 and PDAM towards
processing the raw water which probably decreasing the quality of clean water produced.
From this discussion, R5 can be expressed as one risk source of ‘water quality defective’
(R18).
Specifically, not only do R5 and R18 (and R1 as mentioned above) have a high causal
relationship with each other, but also with other risk events which are highly ranked. The
high correlation between these risk events commonly affects the community. This can be
explained as follows; ‘water scarcity’ (R3) is one of the natural risk (e.g., persistent drought)
which affects and results in water transmission and distribution system problems (R19). In
fact, R19 occurs due to water pollution and contamination (R5) which encumber the system
that processes and delivers the water to the community. Based on both simulation and expert
opinion, this finding also confirmed the existence of highest EC score for R5.

CHAPTER 7-DATA PROCESSING, SIMULATION AND ANALYSIS
Page 198
Figure 7-18. Risk impact to community concentric map based on EC.
Although a number of risk events have already been identified as the most significant
risk according to magnitude and network topology measurements, in contrary there is also
a plethora of risk events which hold as less significant risk. For instance; community
rejection (R10), uncertain political behavior (R13), limited public participation (R14),
interest rates instability (R26) and foreign rates stability (R27) are the least significant risk
events, contributing to only a minor impact on the community.
Based on the most significant and less significant risks aforementioned, it can be
explained that significant risks mainly lie within natural, technical and operational
categories. This implies that significant risks affecting the community have high correlations
with the fundamental technical issues such as; extracting the raw water, processing the bulk
water, transmitting and distributing clean water to the user. On the other hand, a number of
less significant risks are arrayed within political, economic and social categories. Further,
both DC and EC in the concentric map (Fig. 7-13 and 7-18) shows that the less significant
risk events mentioned are located on the periphery of the risk concentration.
Uncovering the strength of node can suggest which risk events are more likely to
impact the community and influence one another, which ones are more likely to hold similar
views, which ones are marginalized, and which play a brokering role. In order to investigate
the attachment behavior of risk events in the context of UI system, disturbance and
interfering community flow, this research examined whether central positions, roles and
criticality in the connectedness network of community impact generate further effect and

CHAPTER 7-DATA PROCESSING, SIMULATION AND ANALYSIS
Page 199
influence other nodes.
7.6 Phase 4-Data Processing, Simulation and Analysis
Following the previous analyses in Phase 1-3, the application of equation 5-16 leads to the
risk criticality simulation output. To discuss deeper, this research compares the risk
criticality simulation result with conventional risk magnitude output calculated in Phase-1
previously. The comparison between them can only possibly be made once both risk
magnitude and risk criticality have been through a normalization process so that their value
lies in the range [0,1]. Therefore, the comparison between them is not based on the real
magnitude nor critical value but based on each of their normalized values and ranking order.
Table 7-5 shows both risk magnitude and risk criticality simulation results as well as
their risk events ranking. In this research, the simulation output comparison between
conventional method applying Fuzzy-based FMECA and risk criticality methods do not
search for the best or worst result, nor right or wrong simulation result. Instead, the analysis
explores the dissimilar output background which greatly affects further analysis, (Phase-5),
decision making processes and action-plans made by experts towards mitigating particular
Surabaya water supply infrastructure system risk events.
As seen in Table 7-5, risk criticality ranking order is highly dissimilar compared to the
conventional risk magnitude risk order. While almost all of the risk ranking order is
dissimilar, nonetheless, five out of thirty risk events have similar ranking order. The five risk
events are as follows; climate change (R1), pollution and contamination (R5), community
rejection (R10), under rate maintenance (R21) and inflation risk (R29). However, applying
the Fuzzy-based FMECA, the most significant risk event is pollution and contamination (R5),
followed by physical infrastructure decay (R22), climate change (R1), water loss-NRW (R24)
and trouble in water transmission and distribution network (R19).
The critical RA does not only consider the variables of the conventional RA model
offered, the analysis also considers two main important analysis, that is; risk causality and
interaction pattern, and risk impact to community by providing various variables from both
one-mode and two-mode network analyses. Interestingly, the application of risk criticality
analysis model considers and reveals latent variables mentioned previously.
For instance, applying the risk magnitude analysis, the physical infrastructure decay
(R22) ranked 2nd highest compared to other 30 risk events. On the other hand, by applying
the risk criticality model analysis, interestingly R22 ranked 14th among the 30 risk events.
This explains that R22 is not the significant risk event and thus the DM should be able to

CHAPTER 7-DATA PROCESSING, SIMULATION AND ANALYSIS
Page 200
arrange priority and strategy towards the R22 mitigation plan and strategy.
Table 7-5. Risk magnitude and risk criticality simulation outputs.
Risk ID Magnitude Criticality
Order Value Norm. Rank Value Norm. Rank
R1 1.720 0.929 3 1.979 0.747 3 ● R2 1.830 0.874 14 1.952 0.737 5 ↑ R3 1.920 0.832 23 1.819 0.687 6 ↑ R4 1.785 0.895 9 0.728 0.275 25 ↓ R5 1.598 1.000 1 2.650 1.000 1 ● R6 1.916 0.834 22 0.796 0.300 24 ↓ R7 1.807 0.884 11 1.236 0.467 16 ↓ R8 1.950 0.820 27 1.512 0.570 11 ↑ R9 1.930 0.828 25 1.078 0.407 20 ↑
R10 2.058 0.776 29 0.470 0.177 29 ● R11 1.765 0.905 6 1.138 0.429 17 ↓ R12 2.087 0.766 30 0.930 0.351 21 ↑ R13 1.925 0.830 24 0.554 0.209 28 ↓ R14 1.904 0.840 20 0.584 0.220 27 ↓ R15 1.843 0.867 15 1.717 0.648 8 ↑ R16 1.911 0.836 21 1.089 0.411 19 ↑ R17 1.901 0.841 19 1.475 0.557 12 ↑ R18 1.767 0.905 7 2.256 0.852 2 ↑ R19 1.754 0.911 5 1.964 0.741 4 ↑ R20 1.778 0.899 8 1.784 0.673 7 ↑ R21 1.804 0.886 10 1.614 0.609 10 ● R22 1.708 0.936 2 1.445 0.546 14 ↓ R23 1.821 0.878 12 1.465 0.553 13 ↓ R24 1.743 0.917 4 1.633 0.616 9 ↓ R25 1.845 0.866 16 0.855 0.323 22 ↓ R26 1.865 0.857 17 0.613 0.231 26 ↓ R27 1.943 0.822 26 0.647 0.114 30 ↓ R28 1.827 0.875 13 1.840 0.324 23 ↓ R29 1.869 0.855 18 2.482 0.438 18 ● R30 1.950 0.820 28 3.262 0.575 15 ↑
The sign of ↑ and ↓ refers to the risk ranking order change ascending and descending respectively. While, ● sign refers to the unchanged ranking order between two outputs.
Similarly, by applying the risk magnitude analysis the R24 ranked 4th is one of the
most significant risks. While applying the risk criticality model analysis, R24, which was
ranked 9th, is considered to be insignificant. Accordingly, experts and DMs can focus and
allocate more resources to mitigate the actual significant risk events by considering various
aspects and variables affecting the empirical analysis processes. Conversely, it is also found
that there are a number of conflicting results from the simulation mentioned previously.
For instance, using the risk magnitude analysis model, natural disaster (R2) is ranked
14th and categorized as a non-significant risk event. However, applying the risk criticality
model analysis, R2 is ranked 5th and considered as a significant risk. Similarly, water quality
defective (R18) is ranked 7th based on the risk magnitude analysis. However, upon applying
risk criticality analysis, R18 is ranked 2nd and considered as a significant risk event. This
occurs due to the nature of R18’s impact characteristics.

CHAPTER 7-DATA PROCESSING, SIMULATION AND ANALYSIS
Page 201
The different ranking between conventional RA and the risk criticality analysis is due
to the conventional RA being solely focused on the triplets of risk decision factors rather than
taking into consideration the risk impact to the community, and its causality capacity and
interaction pattern. Following both RAs simulation output, R5 is suggested to be the most
significant and critical risk by showing its highest normalized magnitude score (1.000). As
the most critical risk, R5 is considered not only because of its high magnitude capacity but
also the impact which severely harms the community (with its consequences) as well as its
dynamic causality impact and propagation affecting other risks.
The second most critical risk is R18 which was ranked 7th in the risk magnitude
analysis. In here, the R18 experienced a sharp increase in its ranking order from 7th to 2nd.
This finding shows that both the [S-R] network topology and [R-R] network topology
analysis plays a very significant role which affects the simulation and output interpretation.
From the expert point of view, R18 not only has a high magnitude but also impacts the
community and influences other risk events. R18 affects almost the whole of the Surabaya
water supply infrastructure system, especially to the supply chain processes. From this, the
community realized that they are under threat of not having a clean water supply.
The third ranked critical risk is R1, which also ranked third in risk magnitude analysis.
This result shows that participants assess R1 as significant since the first analysis (risk
magnitude) stands within the top five significant risks. Further, the fourth critical risk is R19
which is also stated within the top five significant risks (ranked 5th in risk magnitude
analysis). It is found that the R19 ranking order between the two analyses is slightly changed.
Accordingly, based on both analyses, R19 is considered crucial as it is ranked 4th in the risk
criticality analysis. Accordingly, following the experts point of view, R19 emerges from the
failure to maintain cross-connections control (distribution losses).
Furthermore, R19 also emerged from the decreasing of water flow and water
pressure because of distribution system disorder (e.g., temporarily shut by the authority due
to physical system maintenance, a leakage and, or uneven water flow pressure) within
distribution pipes. The fifth critical risk is R2 which, surprisingly, ranked 14th in risk
magnitude analysis. This shows that participants see this risk as less important and crucial
due to the low respective risk ranking order. Since R2 is stated as the fifth most critical risk
among other thirty risk events, experts (and lay people) need to put more attention to the
physical infrastructure maintenance issue. In the Surabaya water supply infrastructure
system case, communities give less attention towards urban utilities physical maintenance.
This issue leads to services disruption which occurred in several occasions.

CHAPTER 7-DATA PROCESSING, SIMULATION AND ANALYSIS
Page 202
7.7 Phase 5-Data Processing, Simulation and Analysis
Phase 5 focuses on the input data manipulation, simulation and analysis of the shock impact,
stress impact and system robustness capacity level. Following the equations 5-17 to 5-19,
the risk criticality analysis simulation output from Phase-4 is applied as a basis and
benchmark for the Surabaya water supply infrastructure system robustness analysis. Both
the shock and stress impact over time is assessed prior to assessing Surabaya water supply
infrastructure system robustness capacity level. The system shock and stress impact analysis
over time is discussed in the next sub-sections.
7.7.1 Shock Impact Analysis Model and Simulation
To develop and simulate shock impact for particular risk events SHOCK CAP.( )
nF R , the input
parameters have to fulfill requirements as follow; (i) Maximum capacity of risk magnitude,
(ii) Maximum capacity of particular risk causality impact affecting all risks, and (iii)
Maximum capacity of particular risk affecting whole community. Each risk decision factor in
the risk magnitude function f O S D( , , ) input is determined by point of 10 using Likert-scale.
This simulation will result in the highest risk magnitude analysis output (3.000) where the
normalized score is 1.000.
Further, to reach the maximum risk impact capacity affecting all risks, this research
applies the SNA method to simulate and calculate the [R-R] network topology following the
determined network topology indicators determined in Chapter 4. Accordingly, this research
inputs the [R-R] matrix sheet as 1 which form the matrix in equation 7-1 below. Then the [R-
R] matrix is a matrix of ones or all-ones matrix over the real numbers where every element
is equal to one. Notably, the diagonal of the [R-R] matrix is 0 since it is assumed that the risk
causality impact behavior and its influence is not a loop model.
1 2
1
2
0 1 1
[R-R]= 1 21
1 1
1 1 0
n
n
R R R
R
n NR
R
=
, , , ... (7-1)
Meanwhile, similar to [R-R] matrix input, the [S-R] will have the same structure as
stated in equation 7-2. Then the [S-R] matrix is a matrix of ones or all-ones matrix over
the real numbers where every element is equal to one. The next step is to account these
matrixes as an input for simulating and analyzing the network following all of the network
topologies. The network simulation was conducted in 1-mode and 2-mode for [R-R] and [S-

CHAPTER 7-DATA PROCESSING, SIMULATION AND ANALYSIS
Page 203
R] respectively.
1 2
1
2
1 1 1
[S-R]= 1 2 1 21
1 1
1 1 1
n
i
R R R
S
n N i IS
S
= =
, , , ... , , , ... (7-2)
The shock capacity analysis data input mentioned above intends to explain that each
of the risks has the highest likelihood to happen with high consequences as well as less
possibly to be detected. Risk also affecting whole community can be analyzed by developing
[S-R] as an all-ones matrix. Further, input data on [R-R] matrix also describes that a
particular risk has high impact and propagation affecting other risks within the risk network
boundary. As discussed previously, in [R-R] the diagonal is always 0 as in this research it is
assumed that risk does not recognize and have no impact loop, which is indicated by
0 nmR n m= =, .
Figure 7-19. Risk causality and interaction network based on DC, BC, CC, EC and SC.
Applying the SNA method, following the same way of simulation previously, the
simulation output for [S-R] and [R-R] networks topologies (both network graphs and
concentric maps) can be seen in Figure 7-19 to 7-24. After obtaining the
( )nF RSHOCK CAP.maximum: (see section 5.7.5), the simulation result for shock impact can be

CHAPTER 7-DATA PROCESSING, SIMULATION AND ANALYSIS
Page 204
seen in Table 7-8. By applying the equation 5-19, the robustness capacity level of Surabaya
water supply infrastructure system towards each of the risk events can be seen in Table 7-9.
Notably, the shock capacity value for all of risk events need to be normalized reaching value
of 1.000.
Figure 7-20. Risk causality and interaction concentric map based on DC, BC, CC and EC.
Figure 7-21. Risk causality and interaction concentric map based on SC.

CHAPTER 7-DATA PROCESSING, SIMULATION AND ANALYSIS
Page 205
Figure 7-22. Risk impact to community network based on DEG, DC, BC, CC and EC.
Figure 7-23. Risk impact to community concentric map based on DEG, DC, BC, and CC.

CHAPTER 7-DATA PROCESSING, SIMULATION AND ANALYSIS
Page 206
Figure 7-24. Risk impact to community concentric map based on EC.

CHAPTER 7-DATA PROCESSING, SIMULATION AND ANALYSIS
Page 207
Table 7-6. Shock impact and network topology simulation output.
Risk ID
Fuzzy-FMECA S-R network topology R-R network topology Risk criticality
RPN Norm. DC BC CC EC Out-DC Out-CC Node BC EC Out-SC Score Norm.
R1 3.000 1.000 1.000 0.022 1.000 0.183 1.000 1.000 0.000 0.183 1.000 5.387 1.000
R2 3.000 1.000 1.000 0.022 1.000 0.183 1.000 1.000 0.000 0.183 1.000 5.387 1.000
R3 3.000 1.000 1.000 0.022 1.000 0.183 1.000 1.000 0.000 0.183 1.000 5.387 1.000
R4 3.000 1.000 1.000 0.022 1.000 0.183 1.000 1.000 0.000 0.183 1.000 5.387 1.000
R5 3.000 1.000 1.000 0.022 1.000 0.183 1.000 1.000 0.000 0.183 1.000 5.387 1.000
R6 3.000 1.000 1.000 0.022 1.000 0.183 1.000 1.000 0.000 0.183 1.000 5.387 1.000
R7 3.000 1.000 1.000 0.022 1.000 0.183 1.000 1.000 0.000 0.183 1.000 5.387 1.000
R8 3.000 1.000 1.000 0.022 1.000 0.183 1.000 1.000 0.000 0.183 1.000 5.387 1.000
R9 3.000 1.000 1.000 0.022 1.000 0.183 1.000 1.000 0.000 0.183 1.000 5.387 1.000
R10 3.000 1.000 1.000 0.022 1.000 0.183 1.000 1.000 0.000 0.183 1.000 5.387 1.000
R11 3.000 1.000 1.000 0.022 1.000 0.183 1.000 1.000 0.000 0.183 1.000 5.387 1.000
R12 3.000 1.000 1.000 0.022 1.000 0.183 1.000 1.000 0.000 0.183 1.000 5.387 1.000
R13 3.000 1.000 1.000 0.022 1.000 0.183 1.000 1.000 0.000 0.183 1.000 5.387 1.000
R14 3.000 1.000 1.000 0.022 1.000 0.183 1.000 1.000 0.000 0.183 1.000 5.387 1.000
R15 3.000 1.000 1.000 0.022 1.000 0.183 1.000 1.000 0.000 0.183 1.000 5.387 1.000
R16 3.000 1.000 1.000 0.022 1.000 0.183 1.000 1.000 0.000 0.183 1.000 5.387 1.000
R17 3.000 1.000 1.000 0.022 1.000 0.183 1.000 1.000 0.000 0.183 1.000 5.387 1.000
R18 3.000 1.000 1.000 0.022 1.000 0.183 1.000 1.000 0.000 0.183 1.000 5.387 1.000
R19 3.000 1.000 1.000 0.022 1.000 0.183 1.000 1.000 0.000 0.183 1.000 5.387 1.000
R20 3.000 1.000 1.000 0.022 1.000 0.183 1.000 1.000 0.000 0.183 1.000 5.387 1.000
R21 3.000 1.000 1.000 0.022 1.000 0.183 1.000 1.000 0.000 0.183 1.000 5.387 1.000
R22 3.000 1.000 1.000 0.022 1.000 0.183 1.000 1.000 0.000 0.183 1.000 5.387 1.000
R23 3.000 1.000 1.000 0.022 1.000 0.183 1.000 1.000 0.000 0.183 1.000 5.387 1.000
R24 3.000 1.000 1.000 0.022 1.000 0.183 1.000 1.000 0.000 0.183 1.000 5.387 1.000
R25 3.000 1.000 1.000 0.022 1.000 0.183 1.000 1.000 0.000 0.183 1.000 5.387 1.000
R26 3.000 1.000 1.000 0.022 1.000 0.183 1.000 1.000 0.000 0.183 1.000 5.387 1.000
R27 3.000 1.000 1.000 0.022 1.000 0.183 1.000 1.000 0.000 0.183 1.000 5.387 1.000
R28 3.000 1.000 1.000 0.022 1.000 0.183 1.000 1.000 0.000 0.183 1.000 5.387 1.000
R29 3.000 1.000 1.000 0.022 1.000 0.183 1.000 1.000 0.000 0.183 1.000 5.387 1.000
R30 3.000 1.000 1.000 0.022 1.000 0.183 1.000 1.000 0.000 0.183 1.000 5.387 1.000

CHAPTER 7-DATA PROCESSING, SIMULATION AND ANALYSIS
Page 208
7.7.2 Shock and Stress Impact Analysis Model and Simulation
It is important to note that in equation 5-18, the stress effect value follows the risk criticality
output, while the normalized stress value ( )n
R is estimated based on the shock effect score
as the benchmark. Table 7-7 accounts for four main analysis attentions, which is; (i) The
shock effect value, (ii) Stress effect value, (iii) The impact effect value where is the percentage
of stress effect over shock effect score, and (iv) The system robustness level, which is UI
system resilient facing the various risk events in the context of its capacity to withstand the
respective risk impact.
Table 7-7. System robustness capacity level simulation output.
Risk ID
Shock effect Stress effect Impact effect (%)
System robustness (%) Score Norm. Score Norm. (*)
R1 5.387 1.000 1.979 0.367 36.7 63.3 R2 5.387 1.000 1.952 0.362 36.2 63.8 R3 5.387 1.000 1.819 0.338 33.8 66.2 R4 5.387 1.000 0.728 0.135 13.5 86.5 R5 5.387 1.000 2.650 0.492 49.2 50.8 R6 5.387 1.000 0.796 0.148 14.8 85.2 R7 5.387 1.000 1.236 0.229 22.9 77.1 R8 5.387 1.000 1.512 0.281 28.1 71.9 R9 5.387 1.000 1.078 0.200 20 80
R10 5.387 1.000 0.470 0.087 8.7 91.3 R11 5.387 1.000 1.138 0.211 21.1 78.9 R12 5.387 1.000 0.930 0.173 17.3 82.7 R13 5.387 1.000 0.554 0.103 10.3 89.7 R14 5.387 1.000 0.584 0.108 10.8 89.2 R15 5.387 1.000 1.717 0.319 31.9 68.1 R16 5.387 1.000 1.089 0.202 20.2 79.8 R17 5.387 1.000 1.475 0.274 27.4 72.6 R18 5.387 1.000 2.256 0.419 41.9 58.1 R19 5.387 1.000 1.964 0.365 36.5 63.5 R20 5.387 1.000 1.784 0.331 33.1 66.9 R21 5.387 1.000 1.614 0.300 30 70 R22 5.387 1.000 1.445 0.268 26.8 73.2 R23 5.387 1.000 1.465 0.272 27.2 72.8 R24 5.387 1.000 1.633 0.303 30.3 69.7 R25 5.387 1.000 0.855 0.159 15.9 84.1 R26 5.387 1.000 0.613 0.114 11.4 88.6 R27 5.387 1.000 0.647 0.051 5.1 94.9 R28 5.387 1.000 1.840 0.153 15.3 84.7 R29 5.387 1.000 2.482 0.203 20.3 79.7 R30 5.387 1.000 3.262 0.259 25.9 74.1
Meanwhile, Table 7-7 defines the maximum risk impact the Surabaya water supply
infrastructure can withstand by putting a shock effect score as 5.387 (normalized as
maximum score which is 1.000). By accounting the stress impact effect into the total capacity
of the respective UI system, both the impact effect and system robustness capacity can be
analyzed. In this case study, Surabaya UWS infrastructure system is very vulnerable towards

CHAPTER 7-DATA PROCESSING, SIMULATION AND ANALYSIS
Page 209
the pollution and contamination (R5) by showing its system vulnerability reaching 49.2%
and robustness score is only 50.8% (Figure 7-25).
Figure 7-25. The UI system robustness capacity towards R5 effect over period of time.
Further, following Table 7-7. Surabaya water supply infrastructure system is also
vulnerable to the water quality defective (R18) followed by climate change (R1), trouble in
water transmission and distribution network (R19), and natural disasters (R2) with their
robustness level percentages being 58.1%, 63.3%, 63.5% and 63.8% respectively. On the
other hand, Surabaya water supply infrastructure has a good resistance to withstand a
number of risk events, such as; foreign exchange rates instability (R27), community rejection
(R10), uncertain political behavior (R13), limited public participation (R14) and interest
rates instability (R26) by showing its robustness capacity as much as 94.9%, 91.3%, 89.7%,
89.2% and 88.6% respectively.
This outcome suggests that in the case of the Surabaya water supply infrastructure
system, monetary and fiscal matters, as well as political issues have not had a substantial
effect. Instead, Surabaya water supply infrastructure system is unquestionably vulnerable to
the risks related with technical and operational issues of how water is delivered to
community. Particularly, as discussed previously, these issues are related fairly towards the;
(i) Quality of the water (i.e., odor, taste and color) and, (ii) Aspects that support the continual
service of supplying the water to community.
Importantly, even R26 is considered as a less critical risk. However, it also leads to
monetary crisis. Further, unpredicted interest rates within the unstable economic
circumstances leads to vulnerable national economy affecting the respective UI system. For
instance; user tariff increases, obstacles to the development process of respective
infrastructure. At the same time, it is highly expected by the community that Surabaya water

CHAPTER 7-DATA PROCESSING, SIMULATION AND ANALYSIS
Page 210
supply infrastructure system reach 100% (or more) and defending its robustness level for
each of risk events the system encounter.
Nevertheless, based on the simulation (Table 7-7 and Figure 7-25), the Surabaya
water supply infrastructure has no any 100% robustness level achievement towards
withstanding various risk events. In this case the maximum robustness capacity level
achieved is 94.9% when the system in encountering R27. The discussion clarifies that,
among 30 risk events determined and analyzed, Surabaya water supply infrastructure
system need further resilience strategies to make the infrastructure system less vulnerable
and better when facing various risk events.
Furthermore, the infrastructure system robustness analysis is able to deliver a
thorough analysis and explanation while both conventional and critical RA are incapable of
exploring the latent phenomenon mainly because of the UI system resilience. Back to the RAs
discussed in previous Chapter, Table 7-7 tabulates the risk magnitude, risk criticality, impact
effect and system robustness. Interestingly, there is one risk event where the analysis shows
dissimilar outcome which is pivotal to be considered and analyzed.
The physical infrastructure decay (R22), is the significant risk which ranked 2nd
highest compare to other risk events. R22 is acknowledged by its high magnitude. However,
R22 only affects the Surabaya water supply infrastructure system by 26.8% over 100% of its
infrastructure system maximum capacity. This suggests that applying the conventional RA
with less measurement and variables considered within the UI system robustness
assessment leads to improper prejudiced results. This improper result ultimately leads to
imprudent management and resource allocation decision making made by both the
authorities and experts.
Another example for this phenomenon can be seen for the water loss-NRW (R24)
where this risk is considered as significant by ranking 4th in the risk magnitude analysis.
Notwithstanding, R24 only affects the Surabaya water supply infrastructure system by
30.3% and left the system robustness level on the point of 69.7% (out of 100%) based on its
stress effect. This analysis also implies that R24 is considered as less significant to the system
and differs from what the risk magnitude analysis output generated.
While all several analyses from phase 1-5 was conducted in various ways by applying
a number of analysis methods and models, R5 was generated consistently as the most critical
risks impacting the Surabaya community, Surabaya water supply infrastructure risk and its
system extensively. The explanation of this analysis output is described below.

CHAPTER 7-DATA PROCESSING, SIMULATION AND ANALYSIS
Page 211
7.7.3 Critical Risk-River Pollution and Contamination (R5)
In the case of Surabaya water supply infrastructure system, Surabaya river pollution not only
harms the community health but also other ecosystems, such as marine biota. Compared to
previous period, it is clear that the river condition is substantially changed. Industrialization
has become an important factor to the development of Surabaya’s economy, through the
establishment of plants and factories. However, the waste or by-products discharged from
them are severely disastrous to the environment consisting of various contaminants of the
surface water, ground water and soil.
There are a number of reasons the waste is not safely treated. One of the reasons is
mainly due to the lack of highly efficient and economic treatment technology. Unfortunately,
community awareness level towards urban environment is decreasing with the increasing of
Surabaya population, making the Surabaya rivers lose its important role in supporting
community activities. Therefore, there is inevitably a comprehensive, integrated and
sustainable solution towards pollution and contamination risk which need to be developed.
Furthermore, an active participation between both industry and lay people to control
their activities by putting a high priority to preserve Surabaya river is definitely needed. For
instance; applying the integrated waste management and processes, and significantly
reducing the source of pollution. The river pollution and contamination are multi-
dimensional problem in Surabaya city. The main reason is that, there are various
stakeholders which allegedly abuse the functions of rivers.
The discussion above also supported by the study conducted by Razif, M. and S.F.
Persada [149]. The study found that the load of contamination in Surabaya rivers caused by
industrial waste was BOD = 25336.54 kg/day, by domestic and farming waste were BOD =
65496.69 kg/day. These values indicate that the major contributors which dump the waste
into Surabaya rivers were from farming and domestic sectors. In accordance with the
development of Surabaya city, the farming activity has significantly reduced. Thus, the
biggest contributors of waste are from domestic and industrial waste and it has the majority
of organic and an organic material.
Surabaya rivers are the raw material for the WTP. Hence, the bad quality water river
will affect the process and quality of the resulting water. Furthermore, the entire WTP in
Surabaya city uses the conventional system. This situation results in bad water and harms
the citizens’ health. Particularly, R5 also affects the whole process of producing and
distributing clean water to the Surabaya community. Based on the experts point of views and
the literatures, the development of major cities where the Surabaya river flows through has

CHAPTER 7-DATA PROCESSING, SIMULATION AND ANALYSIS
Page 212
resulted in an increase in clean water and raw water requirements.
Figure 7-26. River pollution in Surabaya caused by the industry wastage.
On the other hand, the increasingly high concentrations of inhabitants and industries
in urban areas have given rise to several problems such as the emergence of slums along
riverbanks, decreasing water quality and floods due to disrupted water flow because of a
large number of garbage, siltation, or reduced river width. The dominant pollutants of
Surabaya river are as follows:
- Industrial waste. In Surabaya river, there are hundreds of industries that have the
potential to dispose their waste into the river basin (Figure 7-26).
- Domestic waste. Domestic waste (households, hotels, restaurants, and so forth) is the
biggest source of pollution.
Furthermore, the issues encountered in the efforts of controlling pollution in the
Surabaya river include the following:
- The controlling of sources of pollution has only been implemented on industrial
waste.
- Law enforcement against polluters is still weak since social, economic, work
opportunity and other aspects are still taken into consideration.
- There are many industries where waste WTP capacities are lower than the produced
waste and therefore the waste disposal does not meet the established quality
standards.
- Water pollution control is a complex issue that requires a large amount of funds and
time, as well as the commitment of all parties concerned.
- Many settlements are established in riparian areas, resulting in large amounts of
garbage and domestic waste that are directly disposed into the river.
- Lack of public awareness to participate in providing positive (active-constructive)

CHAPTER 7-DATA PROCESSING, SIMULATION AND ANALYSIS
Page 213
social control.
Following the previous discussion towards the most critical risk event in this case
study, this research highlights river pollution and contamination issue in Surabaya water
supply infrastructure system, which needs further understanding in the resilience context.
7.8 Phase 6-Data Processing, Simulation and Analysis
This section particularly gives attention to the recovery analysis aimed towards increasing
the level of Surabaya water supply infrastructure robustness capacity when bearing R5. In
this section, the shock and stress impact capacity (Table 7-7) used as a benchmark of
recovery analysis. To give more understanding, following the equation 5-20 in phase 6 of the
conceptual framework proposed in Chapter 5, six scenario-based resilience actions and
expected resilience action simulation and output are deliberated and can be seen in
Appendix C (Table C-1 to C13) in the last part of this dissertation.
Modeling the UI system with a specific risk event impact scenario and evaluating the
consequences of the vulnerability and resilience of the system have a central role in the
model developed. To exemplify the proposed robustness model, this research focuses on the
‘pollution and contamination’ risk (R5) which was found to be the most critical risk event
among another risk events.
7.8.1 What is Included within the Recovery Scenarios
The following were considered in the scenario-based robustness action strategy;
- Risk type, primary and secondary risk
- Occurrence-the likelihood of the risk events occurred
- Intensity-how strong is the event, and what could amplify it.
- Detectable-the possibility that respective risk events could be detected.
- Who and what is affected directly.
- Interdependencies and spill-overs-what and who could be affected indirectly.
- The dynamics of various UI aspects (e.g., restoration and recovery cost, political
behavior, environmental index, technical and operational matter and human-error
factor) within UI and community in a point-of-time basis is ignored.
7.8.2 Recovery Analysis towards Enhancing Robustness Capacity
Figure 7-26 depicts eights Surabaya water supply infrastructure system resilience analysis
simulations facing R5 over time (i.e., shock capacity, stress capacity, expected recovery, and

CHAPTER 7-DATA PROCESSING, SIMULATION AND ANALYSIS
Page 214
five different scenario-based recovery strategies). The five scenario-based recovery
strategies applied the semi-linear recovery function. The reason the semi-linear recovery
function was applied in this research is that; the semi-linear function model is generally
applied when there is no information regarding the preparedness, resources available and
societal response [9].
To compare the scenario-based recovery analysis developed with the expected
recovery action output, the expected recovery function applied the trigonometric recovery
function [9]. All values of resilience are normalized with respect to the Surabaya water
supply infrastructure system facing the shock impact of R5 and assumed equal to the largest
capacity value. All values of resilience are comparable because all recovery strategies (i.e.,
searching the most optimum objective value) are equally effective in improving the resilience
of the Surabaya water supply infrastructure facing the R5.
Table 7-8 shows the UI system robustness analysis simulation output in the context
of Surabaya water supply infrastructure system facing the R5 as the main disturbance. The
simulation output describes in detail the Surabaya water supply infrastructure system
condition within the various important main event, such as; shock and stress, expected
robustness level in the period of pre-and post-disruption event, and another robustness level
resulting from five different recovery strategies simulations.
The shock event scenario shows that the respective UI system reached its lowest
resilience state when R5 occurred with its devastating impact. The shock scenario is
intended to show that the R5 magnitude and impact is enormous, and affects both the
community and other infrastructure system inherent risks (refers to the most critical risks
[128]). This can be seen by respective infrastructure system FOM collapse in the time of
to hz he
t t from 1.000 into 0.000. Then, there is no resilience action (recovery strategy) applied,
which is shown by its’ null ( )F t value from to he f
t t .
The stress scenario shows the UI system reaching its actual robustness capacity when
R5 occurred. The stress scenario intends to show how the respective UI system is robust in
the period of disturbance. The respective UI system FOM deteriorates in the time period of
hzt to he
t from 1.000 into 0.509 resilience state. This justifies that Surabaya water supply
infrastructure system robustness is 0.491 which is less than 50% of the total its’ resilience
capacity. Then, since there is no recovery action applied, its’F t( ) is kept steady in the state of
0.509 within the time period of het to ft .

CHAPTER 7-DATA PROCESSING, SIMULATION AND ANALYSIS
Page 215
Figure 7-26. Resilience analysis for pollution and contamination risk (R5).

CHAPTER 7-DATA PROCESSING, SIMULATION AND ANALYSIS
Page 216
Table 7-8. System-of-interest F t( ) facing R5 simulation output.
1 2 3 4 5 6 7 8 9 10 11 12
t 1 t 2 t 3 t 4 t 5 t 6 t 7 t 8 t 9 t 10 t 11 t 12
1.000 0.000 0.000 0.000 0.000 0.000 0.000 0.000 0.000 0.000 0.000 0.000 0.000 0.000 0.000 0.000
1.000 0.509 0.509 0.509 0.509 0.509 0.509 0.509 0.509 0.509 0.509 0.509 0.509 0.509 0.509 0.509
Expec. 1.000 0.509 0.509 0.518 0.542 0.588 0.650 0.720 0.790 0.853 0.904 0.943 0.968 0.984 0.993 0.997
Sc.1 1.000 0.509 0.509 0.518 0.523 0.578 0.608 0.646 0.689 0.722 0.763 0.808 0.817 0.839 0.875 0.903
Sc.2 1.000 0.509 0.509 0.518 0.582 0.608 0.622 0.643 0.656 0.662 0.675 0.701 0.708 0.742 0.770 0.770
Sc.3 1.000 0.509 0.509 0.518 0.636 0.658 0.671 0.689 0.700 0.705 0.717 0.740 0.745 0.775 0.800 0.800
Sc.4 1.000 0.509 0.509 0.518 0.593 0.629 0.633 0.646 0.666 0.678 0.684 0.696 0.721 0.726 0.759 0.785
Sc.5 1.000 0.509 0.509 0.518 0.670 0.680 0.699 0.719 0.738 0.757 0.789 0.822 0.815 0.835 0.854 0.873
Shock
Stress
Re
cov
ery
mo
de
l
Condition
faced by UI
system
Discrete time (t f )
t hz t he t hd t

CHAPTER 7-DATA PROCESSING, SIMULATION AND ANALYSIS
Page 217
Simulating various scenarios for the recovery strategy model, five scenario-based
recovery strategies are considered (Scenario 1-5). The simulation input for five scenarios
can be seen in Appendix D. From both Figure 7-18 and Table 7-17, scenario 1 is considered
the most desirable, followed by scenario 5, scenario 3, scenario 4, and scenario 2 which is
less desirable, based on the F t( ) value reached in the time of 12t . Scenario 1 is considered
the optimum recovery strategy since the UI system robustness increase, reaching 0.903 out
of 1.000. Nonetheless, scenario 1 still leaves a loss to the UI system which refers to ‘residual
loss’ as much as 0.003.
In the simulation analysis, this loss can be expected to have no effect. In real world,
however, this number can be very harmful and inflict severe financial (and non-financial)
losses to both the urban community and respective UI system itself. Furthermore, even
though scenario 1 is the most optimum scenario towards reaching highest robustness
capacity in the time of 12t , this research also found that resilience actions from recovery
model scenario 1 are lower than the other recovery model scenarios between the time
period of t and 4t .
Scenario 1 showed significant escalation of the F t( ) value continuously during the
time period of 4t to 9
t until the highest F t( ) was reached in the time period of 12t compared to
other scenarios. During the post disturbance period, it is acknowledged that scenario 3 and
5 attained a higher F t( )compared with expected and other scenarios in the period of time
between 1 5and t t . Even so, both scenario 3 and 5 obtained a final F t( ) value lower than
scenario 1. Thus, it can be concluded that, recovery model scenarios 3 and 5 have better
robustness capacity improvement towards F t( ) in a short period of time specifically right
after the disturbance occurred.
On the other hand, recovery scenario 2 (also for scenario 4) is perhaps the least
prominent scenario which can be adopted. This finding is supported by the facts that; (i)
Similar to previous discussion both scenario 2 and 4 obtained a higher F t( ) value during the
time period of t and 2t compared to the expected recovery scenario and scenario 1, (ii) Both
scenario 2 and 4 obtained their F t( )value in the low state constantly during time period of 4t
to 12t . which explained that these scenarios deliver a slow pace of recovery processes.
From the simulation results, scenario 2 has its steady F t( ) value in the point of 0.770

CHAPTER 7-DATA PROCESSING, SIMULATION AND ANALYSIS
Page 218
between time 11 12to t t . This indicates that the resilience strategy for scenario 2 has not
contributed and improved much to the respective UI system during 11 12to t t . The reason that
the F t( )value is unchanged over time is that; during the recovery process there is might be
a circumstance that make the system recovery processes ineffective and inefficient. Similar
to the discussion above, the simulation output for scenario 3 also showed that itsF t( )value
kept steady in the point of 0.800 during 11 12to t t .
In addition, scenario 5 works very well, exceeding the expected recovery scenario by
reaching the highestF t( )value during 4 to t t . Notwithstanding, during the time period of
4t till 12
t , scenario 5 experienced obstacles and slowness towards obtaining the expected
F t( )value. One of the deterioration can be found during 8 9to t t when scenario 5 undergoes
a downgrade of its F t( )value from 0.822 to 0.815. This shows that the recovery process is
complex and is influenced by time dimensions, spatial dimensions (e.g., different
neighborhoods may have different recovery paths) and by interdependencies between
different economic sectors that are interested in the recovery process.
Therefore, different UI systems (e.g., electricity, oil and gas, transportation, water
supply) that belong to the same community, but are located in different neighborhoods have
different recovery paths, these essential facilities may experience long term or permanent
losses. In summary, the recovery process shows disparities among different resilience plans
and strategies in the same community, showing different rates and quality of recovery. These
findings are also supported by a previous study conducted by Cimellaro, G. P., A. M. Reinhorn,
and M. Bruneau (2010) [9].
Modeling recovery of a single UI system which is critically important to the entire
community is a complex subject. The REA model processes, in real world, cannot be assumed
to be independent. Some countermeasures are likely to be in place prior to the impact and
many different shocks and stresses may combine or occur close together. Further, different
risks impact the level of resilience at dissimilar scales and each require separate or
integrated measures to reduce the abruptness of downwards development trends.
The recovery analysis described in this section illustrates the use of the quantitative
approach to resilience proposed in this research. It is shown that one can consider multiple
Figure-of-merit (FOM) for the same system, and that resilience behavior can be different
among all these metrics. The example described illustrates the benefits of implementing the
right recovery action. This indicates that it is possible to arrive at an ‘optimal recovery

CHAPTER 7-DATA PROCESSING, SIMULATION AND ANALYSIS
Page 219
strategy’ that would enable the system to bounce back quickly and efficiently considering
the FOM of interest.
7.9 Chapter Summary
This Chapter intends to test, validate, and explore the applicability of a conceptual
framework develops in this research. The Surabaya water supply infrastructure system was
chosen as a case study. Following the data collection in Chapter 6 previously, this Chapter
mainly focuses on the data processing, simulation, and analysis for all phases of the
conceptual framework developed in Chapter 5. The analysis phase commenced by initially
processing the data collection, then transforming both the qualitative and quantitative data
collection from the fieldwork into numerical analysis.
The triplets of risk decision factor (i.e., occurrences, severity and detectability) are
applied towards analyzing the risk magnitude. Then, two main matrices ([R-R] and [S-R])
are formed as an input data towards conducting both 1-mode and 2-mode SNA. The 1-mode
SNA method is applied towards analyzing risk causality and interaction pattern, while 2-
mode SNA method is applied in order to analyze the risk impact to community. Each of the
network analysis consists of a number of network topology measurements. The topology
measurements applied in this research has important meaning in the context of Surabaya
water supply infrastructure system RA.
The simulation and analysis for the total six phases of empirical framework are
presented. Phase 1 focuses on the analysis of risk magnitude, while phase 2 focuses on the
risk causality and interaction pattern analysis, followed by phase 3, which analyzes the risk
impact to community. Then the fourth phase focuses on the integration simulation of the
previous three RAs leading to the risk criticality analysis. The simulation shifts onto the
processes of measuring and analyzing the robustness capacity level of the Surabaya water
supply infrastructure system towards facing various risk events.
A short discussion on the comparison between system robustness analysis and
conventional risk magnitude analysis is presented. This gives reader the further
understanding towards the superiority of risk criticality application as a crucial part within
Surabaya water supply infrastructure robustness analysis. Following a number of RAs, the
case study simulation output and analysis exhibits a consistent result by showing R1, R5 and
R19 as the critical risk events. The reasons behind this phenomenon have also been
discussed in this Chapter and have been strengthened by several archives and experts point
of view which make this simulation and analysis more meaningful.

CHAPTER 7-DATA PROCESSING, SIMULATION AND ANALYSIS
Page 220
This Chapter is ended by discussing the phase six of conceptual framework which
aims to deliberate and explore the scenario-based recovery action simulation and output
towards enhancing the UI system robustness capacity level. Five different recovery action
scenarios have been developed and compared to the ‘expected recovery’ scenario. The best
robustness capacity level output in the end of time frame can be appointed as the basis point
to determine the finest recovery action scenario. Nonetheless, the analysis also found that
considerable stagnant or even losses on the level of robustness happened during the
recovery processes within the discrete time period of analysis.

CHAPTER 8-FINDINGS AND DISCUSSION
Page 221
CHAPTER 8
FINDINGS AND DISCUSSION
CHAPTER HEADINGS Introduction Review of the Previous Sections Discussion and Findings towards Initial RA Joint RA-The Preliminary Step in REA Robustness Model Analysis Measuring UI System REA Chapter Summary
8.1 Introduction
This Chapter focuses on the dual discussion of the research, which is: (i) The discussion shifts
into the critical appraisal of the objectives of this research, (ii) Delivers the previous section
review and discussion towards six phases analysis models within UI system conceptual
framework. In order to purposefully carry out the analysis discussion and findings, this
section deliberates the research objectives within the scope of the research.
Having discussed the analysis of data on the previous Chapter, this Chapter discusses
the results of analysis and answers the key research questions set out in the dissertation.
The discussion is presented in accordance with every phase of the framework proposed in
each sub-section. The Chapter consists of several subsections which focus on the analysis
output discussions which was presented in previous Chapter. The discussion in this Chapter
highlights the significance of the findings of the several analysis models and application of
the framework discussed Chapter 5
8.2 Review of the Previous Chapters
The research objectives spans over a several key areas, that is; RO1-To determine the risk
characteristic and impact mechanism based on literatures; RO2-To explore risk analysis
methods and evaluate its shortages in UI context; RO3-To identify and develop risk function
and analysis model towards measuring the critical risks and impact mechanism; RO4-To
establish system-of-interest robustness analysis model as a function of time; RO5-To develop
system-of-interest recovery analysis model; RO6-To undertake a case study investigation to
test the applicability and validate the conceptual assessment framework.
This research responded the RO1 by conducting an in-depth, literature review
towards the role of the UI system to the community as a pivotal element to support their

CHAPTER 8-FINDINGS AND DISCUSSION
Page 222
activities and, various inherent risk natures and impact characteristics. These discussions
are deliberated in Chapters 2 and 3. Chapter 2 mainly discusses the basic and general
understanding towards UI system following by its crucial role and relationship with urban
community. Chapter 2 discusses the vulnerable UI system and its impact to urban community.
The Chapter ended the discussion by putting a deliberation towards UI system resiliency
facing disturbances.
It is acknowledged that the concept of resilience is attractive as it suggests the ability
of something or someone to cope in the face of adversity to recover and return to normally
after confronting an abnormal, alarming and often unexpected threat. While UI system is
threatened by various disturbances (risk events), society is becoming ever more complex
and organizational systems are becoming more interdependent, and thus more vulnerable
to disruption.
Chapter 3 discusses the risk in the UI system context followed by the resilience aspect.
The discussion initially explores the risk concept as well as its characteristics and impacts.
Based on the literature review, this research found and determined three main risk nature
and impact characteristics in the UI system context, that is: (i) The risk magnitude formed
by its three-dimensional decision factors (i.e., occurrences, severity and detectability), (ii)
Risk causality and interaction pattern, and (iii) Risk impact to community.
Accordingly, Chapter 3 also respond to the RO2 towards exploring and evaluating the
conventional RA methods in UI system resilience analysis issues. A number of RA methods,
both deterministic and probabilistic, have been discussed previously. Imperatively,
conventional RA method lacks its capability to: recognize and accommodate diverse view
points towards risk, analyzing the dynamic of risk behavior towards its causality nature and
interaction pattern with other risk events, and the risk impact to every individual as a part
of urban community.
The RO3 has been clarified in Chapter 4 during the discussion of risk criticality
analysis model. The joint RA between three risk impact characteristics (where each RA
model development was also discussed within the Chapter 5) was mentioned. Then, both the
shock and stress event analysis model were introduced subsequently based on the general
system-of-interest resilience and analysis. Based on the empirical model developed
previously, RO4 can be achieved following the direction of UI system robustness analysis
model.
In the single time period, the robustness level is built upon the result risk, and impact
analysis. Based on the understanding of the previous discussion, the RO5 was introduced in

CHAPTER 8-FINDINGS AND DISCUSSION
Page 223
the analysis of robustness capacity. The development and application of the RA within UI
system showed that UI system capacity is possible to be known, determined and further
predicted in the face of disturbances. Furthermore, in this research, the recovery analysis
which intends to increase the system-of-interest robustness level for every discrete point of
time is essentially affected by various assumptions made.
Regarding the recovery analysis, several assumptions are applied to mimic the real-
world circumstances. Finally, RO6 was accomplished by applying the conceptual framework
developed in Chapter 5 to the case study which was completely discussed in both Chapter 6
and 7. The validation of the proposed methods was elaborated using the Surabaya water
supply infrastructure system as a case study followed by the discussion of the simulation
output.
8.3 Discussion and Findings towards Preliminary Risk Analyses
To show the findings and advantages of the proposed conceptual framework, the three first
RA models are discussed further based on the simulation outputs and analysis discussed in
previous Chapter. In this section, the discussion of three different analysis models will be
deliberated, including the analysis discussion related to the main case study, following by a
number of key RAs findings. The RA of its magnitude has been explored in the first phase of
the conceptual framework.
During the data collection process, it is found that people responded to their
perceived risk, rather than the actual risk measurements applied. Following the flowchart
for analysis model depicted in Figure 5-2, the ranking of the Surabaya water supply
infrastructure risks has been determined based on its RPN and RPV (normalized RPN).
Furthermore, the magnitude of risk is built based on participants perspective towards
various risk decision factors. However, the challenges lied on the dissimilar perceptions
made by each of the participants.
In the process of group decision making problems, DMs sometimes may not provide
their preferences for alternatives to a certain degree and there is usually a degree of
uncertainty in providing their preferences over the alternatives considered. The Fuzzy-based
FMECA applied in the first phase of the conceptual framework developed in this research
has the capability of representing imprecise or not totally reliable judgments which exhibit
affirmation, negation and hesitation characteristics.
The consistency of Fuzzy-based FMECA output discussed from the case study play an
important role in the group decision making problems in order to reach an accurate analysis
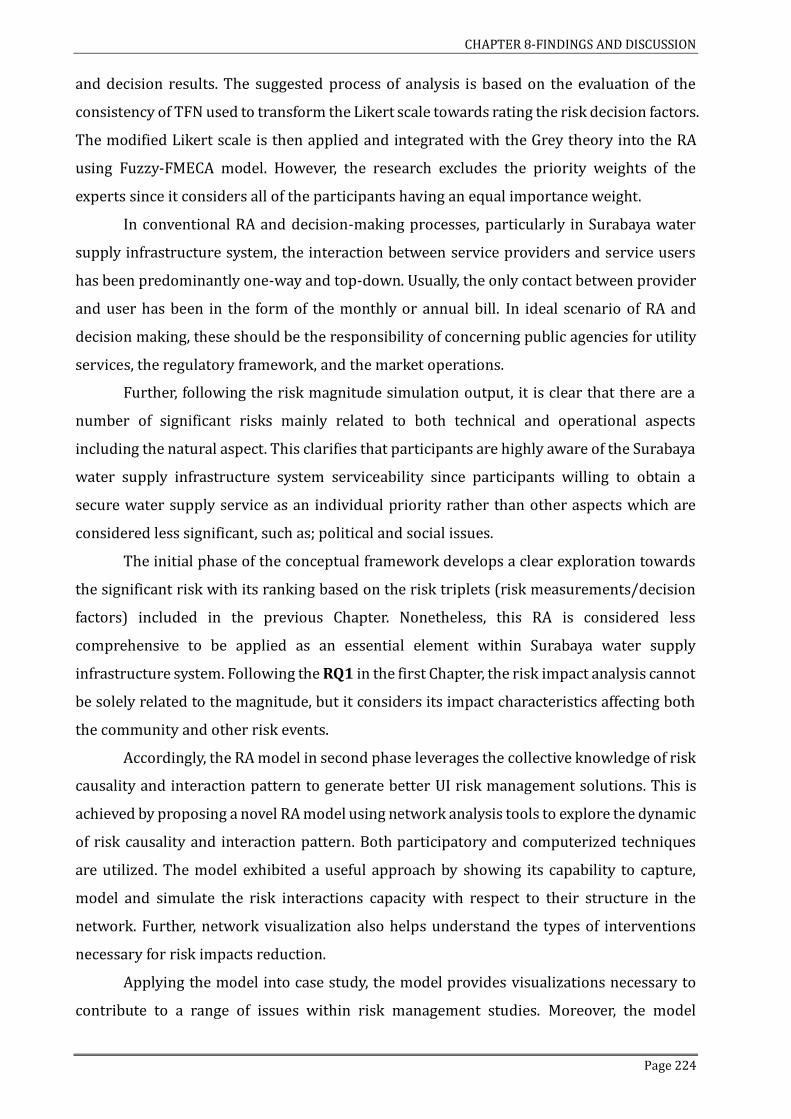
CHAPTER 8-FINDINGS AND DISCUSSION
Page 224
and decision results. The suggested process of analysis is based on the evaluation of the
consistency of TFN used to transform the Likert scale towards rating the risk decision factors.
The modified Likert scale is then applied and integrated with the Grey theory into the RA
using Fuzzy-FMECA model. However, the research excludes the priority weights of the
experts since it considers all of the participants having an equal importance weight.
In conventional RA and decision-making processes, particularly in Surabaya water
supply infrastructure system, the interaction between service providers and service users
has been predominantly one-way and top-down. Usually, the only contact between provider
and user has been in the form of the monthly or annual bill. In ideal scenario of RA and
decision making, these should be the responsibility of concerning public agencies for utility
services, the regulatory framework, and the market operations.
Further, following the risk magnitude simulation output, it is clear that there are a
number of significant risks mainly related to both technical and operational aspects
including the natural aspect. This clarifies that participants are highly aware of the Surabaya
water supply infrastructure system serviceability since participants willing to obtain a
secure water supply service as an individual priority rather than other aspects which are
considered less significant, such as; political and social issues.
The initial phase of the conceptual framework develops a clear exploration towards
the significant risk with its ranking based on the risk triplets (risk measurements/decision
factors) included in the previous Chapter. Nonetheless, this RA is considered less
comprehensive to be applied as an essential element within Surabaya water supply
infrastructure system. Following the RQ1 in the first Chapter, the risk impact analysis cannot
be solely related to the magnitude, but it considers its impact characteristics affecting both
the community and other risk events.
Accordingly, the RA model in second phase leverages the collective knowledge of risk
causality and interaction pattern to generate better UI risk management solutions. This is
achieved by proposing a novel RA model using network analysis tools to explore the dynamic
of risk causality and interaction pattern. Both participatory and computerized techniques
are utilized. The model exhibited a useful approach by showing its capability to capture,
model and simulate the risk interactions capacity with respect to their structure in the
network. Further, network visualization also helps understand the types of interventions
necessary for risk impacts reduction.
Applying the model into case study, the model provides visualizations necessary to
contribute to a range of issues within risk management studies. Moreover, the model

CHAPTER 8-FINDINGS AND DISCUSSION
Page 225
provides a new vantage point for understanding UI risk complexity and the structural
dynamics of intervention failures. To this opportunity, therefore, it improves both the
accuracy of RA and building risk decision making effectiveness towards mitigation plan and
strategy by overcoming the traditional RA method limitations.
The second phase of the conceptual framework developed demonstrated the
significance and value of the proposed model over the classical RA methods. It was proved
that effective societal decisions in the context of UI risk are supported in the unified analysis
of latent risk characteristic, which is; risk causality and interaction capacity. Therefore,
making a crucial UI governance decision towards risks that relies on the single and isolated
analysis viewpoint may lead to poor and obscured decisions.
Interconnected perspective provides a new understanding of UI risk complexity and
the structural dynamics of intervention failures. Applying the proposed model and
networked approach into UI case study, necessary visualizations were presented to
contribute to a range of issues within risk management studies. This research reaffirms
existing insights long held within infrastructure risk and its nature. It was asserted that
infrastructure risks are by no means natural, but instead are deeply embedded within a
broad number of social, technical, economical, governance and political arrays.
This phase suggests the need to take a wider view of UI risks and incorporate risk
reduction strategies within broader processes which focused on a variety of areas. Stepping
back and establishing the broader context of the risk (and its impact) characteristic shows
that risks are not simply the products of technological failures to be solved through
engineering or other technocratic measures, but rather human problems related to
governance. Following the aforementioned discussion, the analysis in the third phase
continues to analyze the risk impact towards individual as a part of community.
The third phase of empirical framework leverages the collective knowledge of risk
and stakeholder association to generate better risk management solutions. This phase
proposes and validates a novel RA model from a network perspective to fill the knowledge
gaps towards conventional RA method. The proposed model focuses on the analysis for
determining the significance risk in terms of impact on community. The model shows its’
capability to capture the complex relationship between UI risks and stakeholders as
individual.
Based on the simulation, analysis and discussion, the analysis model improves the
effectiveness and accuracy of RA by overcoming the limitation of the traditional RA methods.
The model provides a useful approach to map out the interactions complexity between risks

CHAPTER 8-FINDINGS AND DISCUSSION
Page 226
and community with respect to their structure in the network. Thus, it provides DMs with a
structured procedure and a series of indicators to analyze and demystify the risk impact
behavior.
Furthermore, the proposed model indicates the unique ability of network analysis to
delve into root impact pattern of risks, to help observe the various processes of coping, and
to understand which type of interventions might require coordination or integration.
Following the case study, the analysis model in this phase demonstrated network-based RA
approach for ensuring better value in comparison to the classical RA method. It is clear that
the SNA-based model presented in phase 2 and 3 is suitable for supporting the decision
making towards building risk mitigation plan and strategy in UI system.
The proposed approach proved that effective societal decisions in the context of UI
risk uncertainty and complexity are better supported by understanding the impacts affecting
community at an individual level. As a practical tool, the analysis model guides the optimal
allocation of scarce resources to build the resilience of at-risk people, communities and
states and their institutions. By identifying and assessing the impact of potential disruptions
to individual (as a part of community), RA model provides governments and local authorities
the basis for the prioritization of investments in building resilience, in a manner tailored to
local conditions, needs and preferences.
The most obvious finding to emerge from the analysis model considered in third
phase of conceptual framework is that; (i) The risk impact characterized by the degree of
association between actors and risks, and (ii) The correlation between risk magnitude and
impact capacity is not fully linear. Importantly, analyzing risk based on a single empirical
metric might not produce a comprehensive output, or be able to be used as consideration to
support the decision making towards building risk mitigation plan and strategy.
Another finding from the analysis output of the case study is that the vulnerability of
communities is born from inequalities which affect access to resources and information, the
ability to absorb the impacts of respective UI system risks without government interventions.
Moreover, the concept of RA model in the second phase can be used to understand how
community leaders can best address disruptive challenges in the UI system, such as; natural
disasters and malicious attacks. Notably, these findings are supported by the study
conducted by the McAslan, A. [85].
Even though the analysis has been done in the period when there was no disruption,
nonetheless the analysis output in phase 3 reveals that public perception towards specific
risk events is dissimilar. Some risk events perceived by the stakeholders are more crucial

CHAPTER 8-FINDINGS AND DISCUSSION
Page 227
than others. With the aid of 2-mode network analysis, this research revealed some
underlying patterns of how the stakeholder-risk associated network is structured, helping
DMs to make the formal arrangements of UI governance visible in terms of building risk
mitigation plans and strategies. Although the findings need to be verified with more UI case
studies, the outcomes of the analysis are meaningful and expected to be of interest and act
as guidelines to the DMs and practitioners from both public and private sectors working on
UI risk mitigation.
8.4 Joint Risk Analysis: The Analysis of Critical Risk
The fourth phase presents a risk criticality approach that integrates three RA models
discussed previously (i.e., phase 1, 2, and 3). The application of risk criticality is considered
to be highly relevant for investigating the unified analysis between risk magnitude, risk
causality and interaction pattern, and risk impact to dependent community in network-
based analysis based.
The three preliminary RA models in previous phases stand as the ‘joint analysis’ of
risk criticality analysis model. Together, three RA models with unified aim to assess the
critical risks. The benefits of integrating a number of RA prior to the UI system REA also
support by the OECD. [200], such as;
- Increasing the amount of information available (from numerous sources) and thus
the ability to triangulate.
- Reducing the cost of the RA.
- Reducing individual actor opinion bias.
- General agreement about which risks should be prioritized.
- Ownership by different communities and thus ability to use a range of instruments to
target the risk identified.
This fourth phase also presented comparative analysis output between risk
magnitude and risk criticality applied in Fuzzy-based model. The results of both analysis
towards risk magnitude, criticality value and ranking of the alternatives events change
significantly. The results of the numerical illustrations showed that risk criticality analysis
provides more accurate priority-based rankings of alternatives by taking into consideration
not just the participants affirmation towards three risk decision factors, but also both risk
causality and interaction pattern, and the risk impact to community.
Furthermore, this research observed significant differences between the rankings of
risk events in two analyses. On the first phase, the analysis output is capable for
CHAPTER 8-FINDINGS AND DISCUSSION
Page 228
categorization of risks for experts and DMs which is based on the differing knowledge about
each particular risk and in a subjective scale, for instance; ‘simple’, ‘complex’, ‘not-critical’
and ‘critical’ risk problems. Accordingly, following the simulation output in Chapter 7, the
change of risk ranking orders between risk magnitude and risk criticality uncovers two
insights.
Firstly, there is an absolute intrinsic uncertainty and individualized value systemin
accurate assessment of risks in decision making process. Secondly, considering both
magnitudes and cause-impact propagation in assessing the risk, the framework is found to
be a robust methodological advancement from risk prevention and building resilience
perspectives. Therefore, not paying attention to these aspects of the analysis leads to the loss
of some important information which eventually results in substantial vagueness in the
prioritization process leading to miss-guiding and miss-management of the risk.
Fuzzy-based FMECA methods have the potential for resulting in a reasonable risk
ranking within the traditional risk management framework. However, lack of integration of
risk causality and interaction pattern as well as its impact to community based on the degree
of community-risk associated made such methods grossly incomprehensive. This leads to
ineffective decision making towards UI risk prevention and resilience actions. The process
of assessment of the most critical risks in the Surabaya water supply infrastructure case
demonstrated an excellent performance of risk criticality model as compared to the results
in Fuzzy-based FMECA.
Specifically, the proposed model does not require criteria weighting or accurate
quantitative calculation as it simplifies decision making process by solving problems based
on both qualitative and quantitative information. The novelty of the risk criticality model is
realized due to its ability to improve the estimation accuracy and decision making. It is
important to note that the level of criticality of individual risks are not only related to the
results of the joint RAs, as applied in this research, they are also related the individual
capability, resources availability and other external factors and constraints.
Moreover, the phase 4 of the conceptual framework also contributes to the literature
in several ways. First, based on a comprehensive literature review, the analysis model
established a benchmark for development of a new RA method within the UI system and
community networks. Second, this phase validates the effectiveness of the model by
integrating a number of RA models. The approach is considered useful from a
methodological advancement when prioritizing similar or competing risk criticality values.
Further, the risk criticality analysis model could be the tool to ensure an early

CHAPTER 8-FINDINGS AND DISCUSSION
Page 229
response for detecting early warning mechanisms for different types of risks, which will in
most cases be cheaper and more effective. Accordingly, the proposed method can be repeated
and applied to any general UI case. The application of the model will potentially assist the
evaluation of decision making related to risk governance, managing the vulnerability of the
infrastructure and increasing both the infrastructure and community resilience.
Following the case study, the analysis output and findings, the risk criticality model
analysis developed in the phase 4 of the conceptual framework clarifies the existence of high-
impact, hard to predict and rare events; so-called ‘black swans’ (e.g., pollution and
contamination-R5, water transmission and distribution problem-R19, climate change-R1
and natural disaster-R2). On the other hand, while the author of the book ‘The Black Swan’
(2007) suggests that, for many governments, local authorities, organizations, it is needless
to prepare for such events as they are very unlikely [289].
However, recently UI system experienced a series of ‘unlikely’ events which the
Financial Times [85], concludes are not adequately addressed by existing risk and business
continuity thinking and practice [85]. Further, the analysis pointed out that threats and
impacts are no longer directed only at the urban utilities and its serviceability (mechanism),
but at the dimension of risk network and society at large. Therefore, the strategy emphasized
the importance of UI system and community resilience in facing up to such disruptions.
Following the discussion above, the risk criticality analysis leads to aiding an effective
risk communication strategy as part of the risk mitigation strategy which found to be useful
to communicate who, or which organization or ministry, is responsible for managing each of
the critical risks. Importantly, this analysis will also help provide incentives for paying proper
attention to addressing those risks and help support public accountability.
8.5 Robustness and Recovery Model Analysis Discussion and Findings
The robustness analysis model in fifth phase works well by showing the analysis output
which was discussed in previous Chapter. The UI system robustness analysis model
delineates the ability of the UI system to absorb and respond to the full impact which judged
in relation to the resilience scale of each risk event. The robustness analysis, further,
supports the fifth phase of the conceptual framework, which was applied and discussed in a
scenario-based system robustness metric for REA in the case of Surabaya water supply
infrastructure system.
The model provides valuable insights into the likely performance of Surabaya water
supply infrastructure systems as a whole, during and after specific disturbances scenario.

CHAPTER 8-FINDINGS AND DISCUSSION
Page 230
The fundamental concepts of UI system resilience discussed herein provide a common point
of reference and a unified terminology. While the proposed REA metrics only provides a
quantitative value for the system robustness, these metrics become useful and valuable only
when used to devise effective recovery strategies and actions for the system of interest.
Preventive strategies or improvement resources may simultaneously affect the resilience
under different risk types.
Nonetheless, the analysis model in this phase is not focused on maximizing the
interacting mechanisms between the improvement resources (or strategies) for a given risk
and their impacts on different risk types. Instead, the objective is to apply the emerging
model to issue strategies to increase UI system robustness capacity and illustrate their
outcomes at a different time associated with the simulation steps in the flowchart of Figure
5-7 depicts in Chapter 5. Theoretically, system resilience can be completely characterized
when considering the system’s associated Figure-of-merit (FOM).
Notably, based on the FOM of shock impact analysis simulation output, it illustrates
that prevention may also be physically impossible, especially if the risk is the result of a
global shock in contexts where levels of resilience are extremely low. Further, as illustrated,
the key parameters in resilience calculation are as follows; disruptive events, component
recovery and overall resilience strategy. In practice, obtaining these parameters may not be
trivial.
Nonetheless, the robustness metric allows for the comparison of recovery strategies
between alternatives. It must be noted that this resilience approach is applicable to any
system as long as FOM can be computed for different states under consideration. For a given
system of interest and an identified FOM, the REA model proposed contributes to the
application which support the computation of the system robustness as well as various
strategies implications considered for different robustness strategies. This would be of help
to systems engineers during overall system mitigation plan and design, or while devising
recovery strategies.
During the recovery analysis, an uncertainty mainly takes place where experts and
academia face new and unforeseen disruptions. This fourth phase also responds to the
knowledge gaps on the basic resilience preliminary strategies based on the UK’s 2010
National Security Strategy which is stated that [290];
“…we need to place more emphasis on spotting emerging risks, and dealing with them
before they become crises. We must do all we can, within the resource available, to predict,
prevent and mitigate the risks to our security and wellbeing. For those risks that we can

CHAPTER 8-FINDINGS AND DISCUSSION
Page 231
predict, we must act to reduce the likelihood of their occurring and develop the resilience
to reduce their impact”
Following the recovery analysis discussion above, this research enables control over
extraneous variables that could affect the value of the dependent variable. However, although
this research is able to better control variables towards enhancing UI system robustness
capacity, the results may lose some generality (the ability to apply this research results
beyond the specific computational simulation conditions). Since has the generalize ability
controlling extraneous variables towards obtaining optimum recovery action to enhance the
UI system robustness level, a scenario-based simulation design is adopted.
Importantly, to obtain the optimum strategy and result towards reaching high
robustness level for respective system-of-interest analysis, a well-established optimization
method and algorithm is needed. Nonetheless, the development of rigorous optimization
method and meta-heuristic techniques is beyond the research scope. In the sixth phase (i.e.,
recovery analysis) of conceptual framework, the scenario-based metric used within a
classical description of non-stochasticity does not provide information on the quality of the
assessment, that is; the quality and strength of knowledge which support the assumptions
made for the assessment itself and this could conceal important aspects which affect the
consequent predictive capability of the RA model.
By characterizing the strength of knowledge that supports the assumptions
underpinning the risk model and leading to the conditional risk results, the DM should be
made aware of the gap with the unconditional risk. The DMs need to consider the fact that
may occur relatively to what is captured in the model based on the analyst knowledge and
would thus be more or less cautious in the decisions. Evidently, the recovery analysis model
presented provides an opportunity to consider UI system multi-objective optimization as a
means to develop effective mitigation, recovery and restoration, or protective strategies.
8.6 Summary of Findings
Assessing UI risks can be a daunting task to various stakeholders as several consideration
aspects need to be taken into account within the whole processes of RA in order to obtain a
reliable and robust assessment result. In this research, two main challenges appear as
utmost important aspects that need to be considered when assessing UI system resilience,
which is; the people’s perceptions towards risk and the hidden characteristic of risk impact
mechanism. This research responds the knowledge gap by applying a number of RA

CHAPTER 8-FINDINGS AND DISCUSSION
Page 232
components and prioritizing the forms of stakeholders’ involvement that can enhance UI
system resilience.
Meanwhile, resilience is the ability of a system to react to and recover from
disturbances with minimal effects on dynamic stability. Resilience is needed as systems and
organizations become more complex and interrelated, and the consequences of accidents
and incidents increase. It is an integrating concept that allows multiple risks, shocks and
stresses and their impacts on UI system and vulnerable people to be considered together in
the context of development. Following the recovery analysis model proposed in this research,
the simulation and analysis output highlights probable slow driver of changes that influence
systems and the potential for non-linearity and system robustness transformation processes.
The drivers of transformation are affected by various aspects, which experts should
give focused attention, such as; set of institutional, community and individual capacities and
particularly on learning, innovation and adaptation. Strengthening UI system resilience by
enhancing its robustness capacity level post disturbances can be associated with windows
of opportunities for change, often opening after a disturbance. Nonetheless, resilience is a
difficult concept to measure and to apply to different operating contexts, meaning other
framings and linked concepts may be more fruitful avenues in which to work with ‘resilience’.
While UI system resilience clearly has attractions as a unifying concept and as a vision
in uncertain times, achieving positive outcomes will require a comprehensive analysis which
handled by policy makers and practitioners to fall back on more familiar concepts with which
they have practical experience. The majority of approaches, tools and methods currently
available to measure UI system resilience reflect strongly the diversity of disciplines and
sectors that have appropriated the term.
Recent attempts to develop ways to measure resilience that cross disciplinary
boundaries have focused on assessing such various elements. Such as; technological capacity,
skills and education levels, economic status and growth prospects, the quality of
environment and natural resource management institutions, livelihood assets, political
structures and processes, infrastructure, flows of knowledge and information and the speed
and breadth of innovation.
The specific combination of measures chosen in the framework developed within this
research are based on available data rather than a normative approach. Regardless of
disciplinary preference, measuring resilience of UI system requires bounded various
temporal and spatial scales. It is, therefore, the decisions on what aspects of a system to draw
a boundary around, and indeed how a system itself is conceptualized, that continue to shape

CHAPTER 8-FINDINGS AND DISCUSSION
Page 233
our knowledge of the interaction of processes that determine resilience in different contexts.
Caution also needs to be exercised in extrapolating findings or measures of resilience
at one scale (spatial and/or temporal) and making assumptions based on those findings for
other contexts or other parts of the same system. The context-specific nature of risk impact,
the dynamic nature of change and the complexity of capacities associated with resilience
make systemic measurement challenging, and lead to proxies or a simpler frame for
evaluation to be considered.
Regarding the knowledge gaps discussed in Chapter 2 and 3, this research takes risk
management as an entry point that proposes conceptual framework for operationalizing and
measuring UI system robustness level. Further, the framework considered various actors
(based on their experience and good practice) who can contribute within the RA. The
analysis models proposed in this research are a practical programming tool as they provide
initial attributes to protect UI system, lives and livelihoods from shocks and stresses.
Instead taking everything in mind of up-down analysis processes and decision
making, the experience-based derivation of ‘resilience’ measures in the context of risk man-
agement is a promising avenue, although measures of resilience more broadly have their
critics. Furthermore, the conceptual framework in this research raises three concerns about
popular measures: their deterministic approaches that focus on the inputs and outputs
processes; their capture of a static rather than a dynamic picture; and the narrow focus on
assessing processes of transformation.
From the conceptual REA framework proposes, risk criticality analysis provide and
allow a cross-disciplinary and cross-issue discussion that complement the REA. Furthermore,
according to the robustness and recovery analyses output, the ability for risk management
to provide a structure actions offers a useful basis for spotting linkages between strategies
and to consider the balance of efforts between reducing and managing risks, strengthen
resilience strategies and actions, and managing residual risks impacts. Understanding this
balance in the context of UI systems is a key challenge recognizing that the
shocks/stresses/risks impacting UI system and communities is constantly changing.
Moreover, the propose framework is also considered as a systematic approach
towards addressing the multiple risks to UI system development progress. This is considered
as one of the advantages where combining elements of risk management and REA in the UI
system context is decidedly the most pragmatic way. Finally, the analysis model based on
urban infrastructural disruptions provides important devices or learning opportunities
through which critical social science can excavate the politics of urban life, and financial

CHAPTER 8-FINDINGS AND DISCUSSION
Page 234
capacity as well as technology deployment in ways that are rarely possible when UI systems
are functioning normally.
8.7 Chapter Summary
The category of UI system REA includes risk magnitude, risk causality and interaction
(interdependent), the risk impact to community, shock and stress event impact, robustness
metric and the recovery empirical strategy. They enable the community to plan and prepare
particular UI systems to respond and recover from a major disruptive event. Physical and
non-physical assets provide the means to survive and recover, improved policies, plans,
procedures and information enable the assets to be applied effectively and efficiently.
The overall objective of the RA as the initial step of the conceptual REA framework is
to prioritize further strategies development (e.g., policy, programming and investments)
towards the particular ‘considerations’ of risk being assessed: the individual, the community,
or the government and its institutions. The RA model developed in the first three phases
could also be used to look at programmatic risk – the risk of causing harm through the
intervention-or institutional risk (i.e., risks to the aid UI provider: security, fiduciary failure,
reputational loss, domestic political damage, etc).
Importantly, following the importance roles of the RA within the body of UI system
REA, RA needs to be simple and appropriate for developing country contexts, where
complete information and credible data sources may be more difficult to obtain. It is the
important first step towards obtaining a shared vision of the wider risk landscape, to help
determine what risks are to be accepted, mitigated and/or transferred; and the reference
guide for prioritizing where the resilience of individuals, communities and governments and
their institutions need to be reinforced–by both governments and by the development,
humanitarian and climate change adaptation communities.
The RA needs to be comprehensive and requires a robust governance framework with
agreed definitions and rules, to ensure consistent and reliable outcomes. Moreover, effective
RA should provide the incentive for development partners to align their efforts towards
addressing high priority risks – those that are critical on the things that people and UI
systems value – whether they are caused by one off big events, or smaller, more regular
occurrences.
The results of the UI system robustness analysis should also inform every expert and
local authority, including showing how policy and strategy programming choices: (i) Have
been prioritized based on the need to address both the shock and stress event, and achieving

CHAPTER 8-FINDINGS AND DISCUSSION
Page 235
highest UI system robustness level, and (ii) How sector and other programs incorporate
measures to build resilience to particular UI system.
Based on the simulation output, it has been shown that the most effective way to
manage risks and shocks is to break them down into layers. This will allow these risks and
shocks to be managed at the most appropriate level. In addition, the discussion clarifies that
community should not expect individuals to deal with UI system risks. This findings has been
supported by the OECD report (2012) which is found that equally the analysis discourages
government policy that aims to remove all risk from individuals and communities [200].
In former period, UI experts and authorities mainly focus on the cost benefit analysis
which are considered be a useful tool in determining whether risks should be accepted,
prevented, mitigated or transferred. However, in the context of UI system REA, the discussion
above clarified that financial cost is not the only factor to take into consideration.
Policymakers, experts and other crucial actors will also need to look at other factors that are
valued in a particular context, especially the social, economic and environmental costs of the
identified risks. Together, all these factors will help determine whether the risks that have
been assessed can be accepted, or whether DMs must be addressed.
By proposing the conceptual risk-based REA framework, in the major and minor
disruptive event, this research are contributes to support the decision making to enhance UI
system resiliency, so that: (i) Are less likely to suffer major (or minor) serviceability
disruption, (ii) Have less damage and negative impact (consequences) to dependent
communities and its system, (iii) Have more secure UI system and utilities service, and finally
(iv) Recover in a manner that is acceptable to the community. These can be described as the
intended outcome of a resilient UI system. Finally, the conceptual framework can be applied
by communities in times of need to survive a disruptive event.

CHAPTER 8-FINDINGS AND DISCUSSION
Page 236
-This page intentionally left blank-

CHAPTER 9-SUMMARY AND CONCLUSION
Page 237
CHAPTER 9
SUMMARY AND CONCLUSION
CHAPTER HEADINGS Introduction Summary of Content Chronological Development of Research and Answering the Research Questions Limitation of the Current Research Recommendations for Further Work Implication of the Research Closure
9.1 Introduction
The final Chapter presents a summary of the content of this research which is discussed in
section 9.2. The discussion focuses on the link of both the research aim and objectives with
the data collected and the analysis in order to accomplish and confirm the research aim and
objectives. In this Chapter, the summary, recommendation, and conclusion are presented
based on the results and findings. Further, section 9.3 discusses the current research
limitation. The limitations of research clearly identified and finding appropriately
contextualized within boundaries.
Research occurs in a dynamic environment hence change is unavoidable. Thus, it is
important to note both the limitations and the consequences, and importantly, the research
limitations. Further, section 9.4 provides the recommended directions. The section 9.5
explains the two main sets of implications of the research; theoretical and practical. Finally,
section 9.6 gives a closure, which ends the dissertation.
9.2 Summary of Content
The UI systems operating environment in highly volatile, uncertain and ambiguous. A
reliable and functioning urban infrastructure (UI) system resilience analysis model is the
indispensable prerequisite for projecting a comprehensive mitigation plan. Strategic
decision making requires trustworthy, accurate, complete and timely information. Analysis
output has to be actionable and compiled in a way that it enables leaders to immediately
make informed decisions on priorities of response, deploy the resources and restore the
services in collective manner.
UI system research so far has mostly focused on the technical, organizational, social,
and socio-psychological effects of disturbances. This research adds the empirical risk
CHAPTER 9-SUMMARY AND CONCLUSION
Page 238
analysis (RA) perspective as a unique and distinctive contribution to UI system resilience
analysis (REA) research. This perspective connects the tangible elements of UI system with
intangible elements, captures their crucial role, and analyze their robustness capacity for
facing the disturbances. Therefore, the research elucidates that there is a need towards
building holistic risk-based UI system resilience management that focuses on both the
interactions between different types of risks, and the strategies designed to manage those
risks.
The term resilience has a number of common characteristics such as the ability to
absorb and then recover from an abnormal event; being ready and prepared to face threats
and events which are abnormal in terms of their scale, form or timing; an ability and
willingness to adapt to a changing and sometimes threatening environment; a tenacity and
commitment to survive; and a willingness of communities and organizations to rally round
a common cause and a shared set of values. Thus, resilience is the ability of something to
cope in the face of adversity-to recover and return to normality after confronting an
abnormal, alarming and often unexpected threat.
A resilient UI system require to ensure that its UI systems are sufficiently robust to
minimize the harm and consequence to its dependent community, property, the environment
and its serviceability. On the other hand, a resilient UI system recognizes that its dependent
community, other infrastructure and service may be affected by some disruptive events, but
it has the innate ability to cope during such extreme events and to recover afterwards. In real
world, few UI system can claim to be robust or enjoy absolute security.
By definition a robust UI system should be able to confront and overcome all risk
impact at all times with small or no socio-economic impact from disruptive events.
Accordingly, to commence the recovery processes, RA inevitably plays an important role as
the initial stage of the resilience analysis. As RA predominantly acts as gate to UI system REA,
however previous studies underestimated and gave less attention to the RA aspect within
REA bodies in the context of UI system case.
Following the gaps on previous UI system resilience studies, this research satisfied
the research aim (RAI) by proposing the conceptual UI system REA based on the RA as the
main entry point towards both the robustness and recovery analyses. Six phases of different
analysis models framed the conceptual UI system REA framework comprehensively. The six
phases of the analysis model, are: (i) Risk magnitude analysis, (i) Risk causality and
interaction pattern analysis, (iii) Risk impact to community analysis, (iv) Risk criticality
analysis, (v) Robustness capacity analysis, and (vi) Recovery analysis.

CHAPTER 9-SUMMARY AND CONCLUSION
Page 239
Ensuing the RAI mentioned below, the framework develops in this research considers
the RA as an integrated part and important component within system-of-interest REA
framework among the six phases. The first three phases are focusing on the RA in the case of
UI system. The phase four is the joint RA which contribute to generate the core equation of
risk criticality.
RAI: To develop a conceptual framework of risk-based resilience assessment for urban
infrastructure system which focus on robustness property.
The risk criticality equation leads to the UI system robustness analysis (fifth phase)
by establishing both shock and stress impact analysis model based on the concept and
understanding of general delivery function and the resilience graph (Figure 4-8). The risk
criticality forms the main analysis to support both the robustness and recovery analysis in
the fifth and sixth phase respectively. The goal of the analysis models developed is to achieve
highest robustness level of the respective UI system after being disrupted and by developing
the appropriate recovery strategy and action.
From the literature review and framework validation, it is clear that the concept of
resilience and robustness is different. It is, thus, important to note the difference between
the concept of resilience and robustness. Both from the theory and analysis output,
robustness is the ability of a system to maintain its functions and characteristics in the face
of disruptive events. A robust UI system should be able to withstand all external shocks with
little or no impact on its dependent community, other infrastructure, services and values.
The conceptual framework which is constituted by a number of novel RA models
provides us with an understanding of how broad RAs and processes resonate, and further
bring around the social interest and logic of the conventional UI system REA. These differing
viewpoints can facilitate greater understanding of the connections between disturbances
and UI system robustness capacity. In the context of managing risks, building and
strengthening resilience, UI involves establishing systems that incorporate the range of risk
management.
This research discussed UI system vulnerability, which pertains (although not
entirely) to the physical and tangible parts of the particular UI system, and its implications
for response and recover against the disturbances which so far have not been systematically
studied. Accordingly, this research also put an attention towards the interdependencies of
physical, tangible and social, relational and less tangible elements of risk impacts within UI

CHAPTER 9-SUMMARY AND CONCLUSION
Page 240
system resilience analysis which are little understood in the past. While, in the past resilience
research have mainly focused on the physical/tangible elements of UI system impact.
UI system is so complex that it would be almost impossible to develop a complete and
accurate model of a UI system resilience towards disruptive events by showing all the aspects,
variables and measurements. However, such an analysis model would be difficult to
understand or apply in a meaningful way to assist policy makers, local authorities,
emergency planners and community groups. Despite a comprehensive research method and
through analysis procedure, the findings reported in this study should be interpreted in light
of several limitations identified during the conduct of the research. A number of limitations
regarding this research are discussed in the next section.
9.3 Chronological Development of Research Objectives and its Achievements
To achieve the RAI, answering and responding both the research objectives (ROs) and
research questions (RQs) are compulsory. To answer all of the research questions, several
approaches and comprehensive actions have been appropriately taken. The chronological
development of ROs and its achievements as well as the findings (and contribution) are
described in Table 9-1 below.
Table 9-1. Chronological development of research objectives and its achievements.
Research objectivess Approach/action taken RO1. To determine the risk characteristics and impact mechanisms based on literatures.
The in-depth literature review from various area, (i.e., risk management, urban infrastructure management, risk analysis, complex and uncertain system, dynamic and stochastic system, network analysis, urban community and its’ behavior) has been considered and conducted comprehensively. The literature review was conducted mainly with desktop study method. In order to achieve RO1, numerous sources, such as; international journal, conference paper, text book as well as the internet sources in the area of risk analysis, are considered thoroughly towards the literature processes.
Findings and contribution Initially, based on the literature review processes, it is found that risk has very complex characteristic. Is complexity with its dynamic and uncertain. One of the most influential things towards risk characteristic complexity is its impact scale and mechanism. In the context of UI system case, there are three significant risk impact mechanism that plays significant role, that is: (i) Risk magnitude, (ii) Risk causality and interaction pattern, and (iii) Risk impact to community.
Firstly, risk magnitude is determined by its decision factor. In previous time, the most common risk decision factor applied is both occurrences and severity. While now, there are several risk decision factors that emerged and can be applied within the risk analysis processes.
Secondly, uncover and explain that the risk is not always a single event randomly occurred that give negative effects. It is also a part of series of events that have tight link, relationship and network pattern. A phenomenon named Domino effect could help to explain the risk impact mechanism.
Thirdly, risk is not only adjusted and assessed based on both its decision factor and causality capacity. Instead, its impact affecting the community. Accordingly, for each risk event, each individual is related and affected dissimilarly. Thus, the loss for each individual is diverse.

CHAPTER 9-SUMMARY AND CONCLUSION
Page 241
The aforementioned findings importantly contribute to open the new horizon for both academia and industry experts who pay attention to the risk management mainly in the urban infrastructure sector. and decision making. In addition, the findings on risk impact characteristic and impact mechanism useful for supporting the risk analysis processes and making decision. Therefore, lack to understand risk characteristic and impact mechanism leads to improper decision making.
RO2. To explore risk analysis methods literature and evaluate its shortages in UI resilience context
Approach/action taken This research explored risk analysis methods from several literatures
which focus on the infrastructure risk analysis context. Following the risk characteristic and impact mechanism that has discussed in RO1, this research explored the well-recognized risk analysis method called FMECA to assess the risk magnitude based on several defined risk decision factors, such as; occurrences and severity.
Further, a more advance analysis on the risk impact connection and interaction pattern is discussed with focus on several analysis methods named; risk maps and topology-based network theory, audit maps and enterprise maps. As risk impact known to have ripple impact and propagation pattern, a discussion on probability and domino effect analysis discussion also raised thoroughly.
The concept of social amplification of risk explored as risk affecting individual differently with its various (random) ways. To form a comprehensive literature review, both advantages and limitations for each of the risk analysis methods abovementioned discussed further as a part of literature review towards achieving RO2.
Findings and contribution Based on the literature review, it is found that previous risk analysis methods are narrowly focused on quantifying single characteristic of risk impact. Accordingly, conventional RA methods mainly applied in a static and deterministic environment which could not cope with real world problem (dynamic and stochastic) as risk has its dynamic characteristic and impact mechanism as mentioned in RO1.
Furthermore, it is affirmed that the conventional RA method is inadequate to analyze risk impact mechanisms in an integrated way. Such as a comprehensive model to assess dynamic risk characteristics and impact mechanisms as a unified model is absolutely needed. Therefore, an integrated RA model needed in order to assess risk in a dynamic environment.
Besides, the integrated RA model is needed as a pivotal element within UI resilience assessment, as far as researcher aware there is none study ever raised this issue. which has not touched by any of previous studies. Therefore, this knowledge gap has a position as a challenge to this research that need to be achieved.
Besides, risk and resilience approaches share four key characteristics which gained little attention recently. It is found that a few studies have investigated the important role of RA involvement in defining the UI system resiliency specifically, providing no insight into the role of risk management knowledge in defining the UI resilience.
RO3. To identify and develop risk function and analysis model respectively towards measuring the critical risk upon its’ impact mechanisms.
Approach/action taken Based on the risk characteristic and impact mechanisms explored and discussed from RQ1, the risk magnitude is analyzed based on the three dimension of risk decision factors, that is; occurrences (O), severity (S) and detectability (D). To analyze the risk magnitude, a Fuzzy-based FMECA is applied. The Fuzzy and Grey theory is used to accommodate divergent risk perception from participants as well as to cover the limited capability of conventional FMECA method.
Further, to model the impact mechanism of risk in terms of causality and interaction pattern, 1-mode social network analysis method is applied. In here, the risk events are modeled as a node that connect and interact with other nodes within specific risk network. To simulate the risk impact behavior and interaction, a risk-risk matrix [R-R] was formed as a base for simulation input.
Accordingly, to model the risk impact mechanism to community, 2-mode social network analysis is applied. In here, both risk and stakeholder are

CHAPTER 9-SUMMARY AND CONCLUSION
Page 242
modeled in different node types that connect each other. Note that, in 2-mode social network analysis, the node interaction only happened between different types of nodes. Therefore, there will be no any interaction between the same type of node.
To simulate the behavior risk impact to community, a stakeholder-risk matrix [S-R] is also developed as a base for simulation input. Both 1-mode and 2-mode social network analysis are applied in order to theoretically obtain risk impact behavior via network topology decipherment and visualization. Both network topology decipherment and visualization shown mathematically and graphically the dynamic of risk impact pattern.
The network topology decipherment applied, such as; degree, degree centrality, closeness centrality, betweenness centrality, eigenvector centrality and status centrality. Importantly, each of the network topology decipherments is shown in-depth understanding towards the risk impact network. The network topology decipherment applied, and its description can be seen in Table 4-2.
The risk criticality model is thus developed by integrating the three elements of risk analysis models discussed above. The risk criticality equation can be seen in the Eq. 5-16 (section 5-7). Equation 5-16 spell out; the risk magnitude element stands as the main coefficient that affect the sum of both 1-mode and 2-mode risk impact analysis output. To validate the risk analysis models, a real case study using urban water supply infrastructure system in Indonesian case study is applied.
Findings and contribution Applying the Fuzzy-based FMECA methods, the risk magnitude analysis result in a reasonable risk ranking. While, applying the risk criticality analysis model, the simulation output for risk ranking is changed dramatically. Comparing both the risk analyses output, the dissimilarity simulation result is found through the change of risk ranking. Out from 30 risk events identified, as many as 25 risk events ranking is changed (see Table 7-7).
The different risk ranking result is due to the Fuzzy-based FMECA being solely focused on the three dimensions of risk decision factors determined rather than taking into consideration two latent risk impact (i.e., risk causality and risk impact to the community).
The change of risk ranking orders between risk magnitude and risk criticality uncovers two insights. Firstly, there is an absolute intrinsic uncertainty and individualized value systemin accurate assessment of risks in decision making process. Secondly, considering both magnitudes and cause-impact propagation in assessing the risk, the framework is found to be a robust methodological advancement from risk prevention and building resilience perspectives.
Therefore, lack of integration of risk causality and interaction pattern as well as its impact to community based on the degree of community-risk associated made such methods grossly incomprehensive. Further, not paying attention to these aspects of the analysis leads to the loss of some important information which eventually results in substantial vagueness in the prioritization process leading to miss-guiding and miss-management of the risk. This leads to ineffective decision making towards UI risk prevention and resilience actions.
Clearly, the risk criticality analysis model does not require criteria weighting or accurate quantitative calculation as it simplifies complicated decision-making process by solving problems based on both qualitative and quantitative information. The novelty of the risk criticality model is evidenced by its ability to improve the simulation and analysis estimation accuracy.
From the simulation output, it is also found that the risk criticality level is not only pertinent to the joint RAs output, they are also related the individual capability, resources availability and other external factors and constraints. Moreover, the phase-4 of the conceptual framework also contributes to the literature in several ways. - The analysis models established a benchmark for development of a new RA methods in the UI system and community networks context.
- By validating the effectiveness of the risk criticality model, the approach is found to be considered useful from a methodological advancement when

CHAPTER 9-SUMMARY AND CONCLUSION
Page 243
prioritizing similar or competing risk criticality values. Further, the risk criticality analysis model could;
- Be a tool to ensure an early response for detecting early warning mechanisms for different types of risks, which will in most cases be cheaper and more effective.
- Potentially assist the evaluation of decision making related to risk governance. - Support the vulnerability management of the infrastructure and increasing both the infrastructure and community resilience.
- Leads to aiding an effective risk communication strategy as part of the risk mitigation strategy which found to be useful to communicate who, or which organization or ministry, is responsible for managing each of the critical risks.
- Help provide incentives for paying proper attention to addressing those risks and help support public accountability.
RO4. To establish system-of-interest robustness analysis model as a function of time.
Approach/action taken Literature review pertaining to the system resilience was conducted in order to obtain a basic theory and ground understanding towards the resilience analysis. Following the common system resilience study, an adjustment towards the figure-of-merit applied. Both main shock and stress function transition model were developed.
To model the shock function, the input for three risk analyses variables is set to be the maximum. From here, shock function showing the ‘high devastating risk impact capacity’, or maximum impact capacity of risk could produce. On the other hand, shock function also indicates to the maximum capacity of respective urban infrastructure system withstand to the particular risk impact. Meanwhile, the stress function specifies the actual risk impact capacity. In here, the actual risk impact capacity refers to the risk criticality.
Based on shock function, stress function and the risk criticality definition, the system-of-interest robustness analysis is developed. A system robustness defines the capacity of particular UI system to actually withstand the risk impact. System robustness estimation is based on the subtraction between shock value and stress value, in a specific time period.
Findings and contribution Although there are various methodologies towards system robustness analysis and computation, however this research proposed a novel model to assess the urban infrastructure system robustness. Based on the case study applied to validate the model, it is found that the robustness level of urban infrastructure system, right after the disturbance occurred, is mainly affected by; system’s capacity and capability to face the uncertain and unexpected disturbance with random impact effect.
The building of system’s capacity and capability to face the risk influenced by many things. Such as; community preparedness towards the disturbance and progressive infrastructure maintenance. Therefore, the system robustness cannot exclusively assess solely by the shock function, stress function and risk criticality elements.
The analysis model output it then rechecked following the desktop study and expert opinions from the interview. Following the case study of urban water supply infrastructure system in Surabaya, it is found that the simulation and analysis output was recognized close to reality. Although expert in the field not really consider and understand deeply this research, however the simulation result obtained, considered as proper analysis result. Experts express that the pollution and contamination (R5) is a multi-dimensional and very serious problem which generate enormous negative impact.
The answer to RQ3, contributes to the literature in several points; - The preliminary risk analyses and risk criticality analysis are stand as
the crucial gate towards the robustness analysis model. - This model brings a new perspective in system resilience analysis since
in past the role of risk analysis within resilience analysis still gained little attentions.
- The maximum risk impact and the actual capacity of urban infrastructure system withstanding particular risk impact can be assessed thoroughly. The analysis output will give deeper understanding to the expert and decision makers towards

CHAPTER 9-SUMMARY AND CONCLUSION
Page 244
preparedness and, or post-disturbance infrastructure system recovery management.
RO5. To develop system-of-interest recovery analysis model.
Approach/action taken As RQ3 has been answered thoroughly, the system recovery analysis model is then developed. The system recovery processes started after the system passed the ‘slack-time’ period. That is, the period that system initially try to do an initial recovery from the disturbance affected and could not functioning normally (as its robustness capacity level reduced). A one-point time period is determined to represent the ‘slack-time’ period. The goal of system recovery is to obtain robustness level as high as it can be in the end point of time analysis. The recovery analysis model is developed by applying the concept of optimization. It is the process to find the best solution towards obtain the optimum result. In here, the solution is to balance the risk variables input so that system can enhance its robustness capacity overtime. The recovery model formula can be seen in equation 5-20. To validate the model, the analysis is conducted in a deterministic-based time frame analysis. For this research, the recovery period is determined only 12-point of time. As many as five scenarios of recovery analysis was conducted to search the optimum robustness level in the end of the time period. For each of the single point of time, the recovery model input is assumed randomly to generate different robustness level over time.
Findings and contribution Although the recovery analysis model follows the concept of optimization, nonetheless none of the five scenarios of recovery analysis reached 100% robustness level. Theoretically, following the recovery model proposed, urban infrastructure system robustness level increase as time goes by. However, interestingly, it is found that there is a point when the system experienced obstacles and slowness towards obtaining the expected robustness level value.
One of the deterioration can be found during t8 to t9 when scenario 5 undergoes a downgrade of its’ robustness value from 0.822 to 0.815. This finding shows that the system recovery process is complex and is influenced by various dimensions, such as; time dimensions, spatial dimensions and by interdependencies between different economic sectors that are interested in the recovery process. Further, it also found that resilience behavior can be different among all recovery model metrics. The case study analysis illustrates the benefits of implementing the right recovery plan and action. This indicates that it is possible to arrive at an ‘optimal recovery strategy’ that would enable the system to bounce back quickly and efficiently considering the figure-of-merit of interest.
RO6. To undertake a case study investigation to test the applicability and validate the conceptual assessment model.
Approach/action taken Surabaya water supply infrastructure system has been chosen as the main
case study to test the applicability the conceptual assessment model. As many as 250 design-based questionnaires had been disseminated to various prospective participants which includes 6 stakeholder groups. Around 126 questionnaires had been successfully obtained within 5 months during data collection period. Further, instead participating to fill the questionnaire, a semi-formal interview had been also conducted to grab experts point-of-view regarding both the risk and resilience issue in Surabaya water supply infrastructure (see Chapter 6).
As a preliminary step, data processed following the initial phase of the framework. Then, following phase 1 till 6 of the proposed framework the input data processed thoroughly. At this quantitative data processing stage, phase 1 till 6 produces risk magnitude, risk impact to stakeholder, risk interaction, risk criticality, resilient analysis and recovery analysis respectively. It is important to note that there were several assumption and adjustment made in order to mimic the real-world problem. These processes are discussed thoroughly in Chapter 7.
By conducting manual checking the questionnaire obtained, a number of data missing had been processed as well. Then, applying high-level Microsoft Excel coding and calculation processes as well as Net Miner 4.0., the input data processed and computed. Several computational simulations employed to

CHAPTER 9-SUMMARY AND CONCLUSION
Page 245
comprehensively generate the computation results. The discussion and finding for each analysis model phases are then performed in Chapter 8.
Findings and contribution The result and findings for every model phases are discussed well in
separated sub-sections. Importantly, results from the interview section with the experts were applied to support the findings to strengthen the argument. The result from analysis model Phase 1, 2, and 3 are considered well as the discussion went comprehensively. In Phase 1, risk magnitude analysis shows clear risk ranking order based on three risk decision factors. A discussion supported by the actual proof from expert opinions is delivered in section 7.3.
While Phase 2 and 3 are discussed in section 7.4 and 7.5 respectively. Both analyses found that risk events are affecting and interacting each other as well as impacting community differently. This risk characteristic and behavior are uncertain and un-patterned. Interestingly, in Phase 4 presented comparative analysis output between risk magnitude and risk criticality applied in Fuzzy-based model.
This phase brings a new horizon as the result comparison between risk criticality model with conventional risk magnitude analysis method shown a very striking difference. It can be concluded that the results of the numerical illustrations showed that risk criticality analysis provides more accurate priority-based rankings of alternatives by taking into consideration; (i) The participants affirmations towards risk decision factors, (ii) Risk magnitude, (iii) Risk causality and interaction pattern, and (iv) Risk impact to community.
Moreover, the change of risk ranking orders between risk magnitude and risk criticality uncovers that; (i) There is an absolute intrinsic uncertainty and individualized value system in accurate assessment of risks in decision making process, (ii) The framework is robust from risk prevention and building resilience perspectives.
The robustness analysis model in fifth phase works well by showing that it delineates the ability of the UI system to absorb and respond to the full impact. The fundamental concepts of UI system resilience discussed herein provide a common point of reference and a unified terminology. It is worth to note that the proposed REA metrics only provides a quantitative value for the system robustness.
Accordingly, these metrics become useful and valuable only when used to devise effective recovery strategies and actions for the system of interest. Preventive strategies or improvement resources may simultaneously affect the resilience under different risk types. Furthermore, the resilience approach is applicable to any system as long as FOM can be computed for different states under consideration. This would be of help to systems engineers during overall system mitigation plan and design, or while devising recovery strategies.
On the other hand, during the recovery analysis, an uncertainty mainly takes place where experts and academia face new and unforeseen disruptions. Following this issue, this research adopted a scenario-based simulation design for the recovery model simulation. This adjustment enables control over extraneous variables that could affect the value of the dependent variable.
Nonetheless, although this research is able to better control variables towards enhancing UI system robustness capacity, the results may lose some generality. In the sixth phase of conceptual framework, the scenario-based metric used within a classical description of non-stochasticity does not provide information on the quality of the assessment.
9.4 Limitation of the Current Research
No single analysis model and computational simulation can offer definitive proof or support
for a theorized relationship by itself. This research does not come without its critics, or
limitations. It is worth to note that, this research was brought only one case study towards
testing and validating the applicability and reliability of the model. Hence, even quantitative

CHAPTER 9-SUMMARY AND CONCLUSION
Page 246
techniques were used in developing the model, generalizing to a population beyond the case
study would not be appropriate. As such the model is domain and case specific. Rather, both
the case study and findings in this research serve as a testing model and lesson learned.
In addition, the determination of both stakeholders and risk decision factor weight
value are missing. In order to obtain data from participant in the fieldwork, it is in
appropriate to assume that stakeholders have same weight value or have a same level of
position in terms of giving their perception/opinion within the RA processes. Contrarily, in
real world the weighted values for different stakeholders are crucial parts as it reflects the
different experiences, powers and legitimation, perception, opinion, influence and interest
that stakeholders hold. Further, during the data collection, the use of convenience sampling
as well as the snowball sample methods can create research analysis bias.
In addition, the risk decision factors also have divergent of weight values depending
on its’ characteristics and influence effect. Although a classical experience-based risk
identification and assessment method is more practical, as had been used in this research,
ideally more stakeholders may be evolved and considered through the snowball method,
when implementing phase 1, 2 and 3 of the analysis models, to increase the accuracy of RA.
While applying SNA method in the second phase of the conceptual framework, a social
network study requires to dichotomize the risk relationship matrix comprehensively me.
However, there is no single method to dichotomize the matrix value due to which an
improper simulation result and incomplete information may be resulted. Similarly, in phase
3 of the conceptual framework, a social network study requires one to list and enumerate all
actors related to the problem at hand, the option of using individuals as nodes were deemed
both impractical (too many individuals to visit) and infeasible (impossible to list all
individuals involved).
Moreover, when considering disturbances on UI system, Gaillard, J. C., suggested that
‘resilience’ tends to frame risk events as threats and appears to increase the prominence of
physical science in identifying solutions [5]. Framing risk in the context of resilience may
inadvertently downplay the focus on other aspects, such as; poverty, vulnerability and the
political economy of skewed development, which definitely draw attention away from the
role of agency, power and politics. As Cannon and Muller-Mahn (2010: 623) argue, resilience
[291];
‘.....is dangerous because it is removing the inherently power-related connotation of
vulnerability and is capable of doing the same to the process of adaptation’.

CHAPTER 9-SUMMARY AND CONCLUSION
Page 247
Conversely, the vulnerability dimension of the conceptual REA framework including
its analysis models seeks to place emphasis on the root causes of UI system disturbances.
Nonetheless, it should be noted that the conceptual framework proposed in this research
lacks in placing emphasis on individual, institutional and system wide capacities, which is
actually could have helped to expose concerns about an inability to address underlying
causes and where weaknesses (such as lack of power) have an impact on overall functioning
of the UI system.
This research puts attention on the main scientific and technocratic responses
divorced from a focus on RA and REA. This research also divorced from a focus on social
processes and systematic failures as well as the policy implication development for the UI
system. In addition, this may result in a skewed, incomplete and potentially ineffective
version of ‘resilience’ being pursued locally. Although the research proposes the conceptual
UI system REA framework from the entry point of RAs, however painting a picture of
resilience as undesirable raises quite different sets of questions.
On one level, UI resilience implies both physical and non-physical capacity to bounce
back from a significant obstacle, much like a rubber ball dropped on the pavement. But UI
systems are not rubber balls, nor is a disaster like an asphalt plane, from which a rebound
can be definitively predicted by a set of mathematical equations. This constrain should be a
trigger for scholars towards seeking systematic analyses of post-disaster recovery. By
developing the recovery model analysis, the time required for each activity period, in the
further time, is approximately predictable.
Accordingly, it is essential to propose and test a “model of recovery activity” that
classified the recovery process into four distinguishable stages; (i) Emergency responses; (ii)
Restoration of the restorable; (iii) Reconstruction of the destroyed for functional
replacement; (iv) Reconstruction for commemoration, betterment and development [292].
Besides, it acknowledged that the rate of recovery is “directly related to the extent of the
damage, the available recovery resources, the prevailing pre-disaster trends, and such
qualities as leadership, planning and organization for reconstruction”.
This sort of analytical framework is certainly a valuable contribution to the task of
explaining post-disaster UI system recovery, yet it masks as much as it reveals. Another
limitation that this research has is that this research is lack of external validity. Measurement
validity applies primarily to quantitative research and to the search for measures of social
scientific concepts [293]. Essentially, it is to do with the question of whether a measure that
is devised of a concept really does reflect the concept that is supposed to be denoting.

CHAPTER 9-SUMMARY AND CONCLUSION
Page 248
External validity is concerned with the question of whether the results of a study can be
generalized beyond the specific research context.
As the application of case study is to test the applicability of the proposed model, thus
the case study findings could not be generalized beyond the 126 respondents participated.
In other words, the result and findings from the case study could only apply to the 126
respondents alone. It is in this context that the issue of how people are selected to participate
in research becomes crucial. This is also one of the main reason why this research is so keen
to generate representative samples. Notwithstanding the above limitations, there is also a
need to provide a sound bases for future research explained in the next section.
9.5 Recommendations for Further Work
The exercise of measuring resilience may be considered highly tedious and clumsy,
depending on the understanding and weight given to concepts such as coping, capacity,
vulnerability and adaptive capacity. In addition, the relationship between risk and resilience
has received less attention and rarely developed in full and is by no means universally agreed
on. Much of the work on disaster resilience, for example; draws on understandings of the
relationship with vulnerability and seeks to measure levels of that vulnerability rather than
resilience itself [4, 16, 95, 294, 295]. This research recommends further work which can be
done in order to fill this research limitations.
Further research is needed to account for both stakeholder and weighted risk values
applied within the calculation method processes. More research will be needed to extend the
Fuzzy and probabilistic risk scenario considering disruptive events and components
recovery times in stochastic manner. Also, experimentation will be considered on a set of
case studies related to a more complex real-life UI system scenario facing disturbances and
considering various FOM as well as resources required for performing the resilience action
and/or mitigation strategies.
Scoring systems are being used in important real-world applications as well as risk
matrix systems. Yet these risk-scoring systems can perform extremely poorly compared to
optimization methods, allocating resources so that much less value-of-risk reduction is
achieved. Hence, further research is needed to build an optimization analysis model for
measuring optimum robustness strategy. The optimization result leads to a predictive
analysis to what (and in which scenario) various robustness variables and formation
strategies will take place in order to achieve the maximum UI system robustness capacity
level.

CHAPTER 9-SUMMARY AND CONCLUSION
Page 249
Nonetheless, this discussion is beyond the scope of this research to develop a
comprehensive optimization model of UI system robustness. Particularly, a multiple-
objectives analysis is important due to the temporal dimension of vulnerability analysis. A
certain set of resilience actions may be delegated on the basis of dimensions of the system
function prioritized for recovery. Indeed, such an optimization model could never be
universal due to many aspects within the UI system resilience analysis and the diverse range
of potential disruptive events.
Regardless, building a novel and comprehensive optimization method using various
metaheuristic models and compare the result for assessing and determining the recovery
strategy would be very influential. Since in this research most of the risk events identified
and considered are negative risks (i.e., consequences), further research need to consider the
positive risks (i.e., opportunities) into the analysis as well. It was assumed that the risk
causality and interaction pattern within the network is static. More research in the modeling
area is needed to analyze the risk network in dynamic circumstances.
Moreover, a REA scheme with time-series and data collected from a real world
extreme events will potentially add significant novelty and confidence in the system
functionalist and application. Analysis of such data will provide valuable insight regarding
policies and plans to reduce infrastructure service disruption and the impacts of that loss on
communities. It will also facilitate the development of new and better computational tools
for supporting resilience planning and management.
In addition, more research is essential to analyze the network in dynamic
circumstances. Notwithstanding the mentioned limitation, a contribution of the RA model
provided a sound basis for future research. First, future research should be undertaken to
develop a method for assessing stakeholder vulnerability in the face of UI system
disturbance. Therefore, the risk mitigation plan can be effectively unified for minimizing risk
impact and strengthen the vulnerable community. Second, the threshold value of
relationship intensity between risk and individual stakeholder should be defined properly
to produce rigorous network simulation result.
The further research needed, as mentioned also from OECD publication [200], to
examine how to build and construct a common REA of UI system that unites and makes sense
of the four key properties of resilience. The common REA which can embrace its four
properties following structured and comprehensive data collection in resilience-building
and analysis are;
- Merging different forms of data and analysis: merging surveillance, early warning,

CHAPTER 9-SUMMARY AND CONCLUSION
Page 250
assessments and impact analyses.
- Combining different thematics: incorporating risk and needs analyses according to
natural hazards, man-made threats, seasonal impacts and the effects of long-term
trends driving change in risk and needs.
- Using data and analysis with varying parameters: information that may vary by (i)
Scale: from local to inter-city, and regional to national; (ii) Timeframe: from weekly
to periodic multi-year exercises; and, (iii) Coordinating a multitude of actors
collecting data in isolation, from local to various actors, including humanitarian and
development agencies, thematic and sector-specific and special-interest actors, all
with different methodologies for collecting data.
- To develop a unified model which can accommodate four properties of resilience for
helping community to recover and restore their capacity disrupted by extreme events.
- Another limitation of this research is that, the RA applying SNA method in the case
study was a one-off. For a more longitudinal result, the dynamics of the risk network
should be monitored and reviewed periodically in a real situation.
- Furthermore, the analysis process does not consider stakeholders’ perspectives and
input towards risk and its impact. All stakeholders should have adequate
opportunities to have their voice heard in the process of defining and evaluating the
level of risk impact and UI system robustness respectively based on their point of view.
Accordingly, stakeholders’ input should be taken in accordance with their particular
concern on different project definition elements.
Further, it is important to mention the challenges that this research faced during the
analysis of the simulation output, that is; the information and analyses are lacked between
different forms of data systems (surveillance and early warning systems, assessments,
impact and cost benefit analyses), which importantly to be carried out at different
geographical scales, across different timeframes or cycles of time, involving a myriad of
uncoordinated actors.
During the stakeholder identification and data collection in this research, there were
numerous heterogeneous actors that are interconnected through strong social interactions.
They are embedded in multiple levels of institutional and cultural layers which act as a
normative guideline to individuals. In the case of infrastructure management, where a
growing number of actor groups are becoming involved and acquiring new responsibilities,
there would appear to be a real need to broaden the scope of actor analysis.
In addition, it is not enough to pose the general model of simplified UI system

CHAPTER 9-SUMMARY AND CONCLUSION
Page 251
recovery model using exponential recovery functions. It is mainly because of the extent, pace,
and direction of UI system recovery are chartable only in very general terms and present a
woefully incomplete picture of real world environment. Moreover, even if every extreme
event follows a predictable pattern of restoration -it is not this generality that is interesting;
what matters are the variations. Considering that this research is still in the early stage, the
complex recovery models are not available.
Thus, it is possible to describe relationships across different scales-socioeconomic
agents, neighborhood and community, and to study the effects of different policies and
management plans in an accurate way. Therefore, building different types of recovery
functions that can be cope with and selected depending on the system and society
preparedness response respectively (e.g., linear and trigonometric model [9, 72]), is also one
note for further work. To do this the recovery model could be continuously updated as soon
as more data are available using stochastic and dynamic approach.
Additionally, several adjustments need to be applied within the model analysis
framework to mimic the real-world problem. In this context, the adjustment has to reflects
and refers to the three main engineering application abilities, that is; (i) Application of
established engineering methods to complex engineering solving, (ii) Application of
systematic engineering synthesis and design process, (iii) Application of systematic
approaches to the conduct and management of engineering projects.
Following the research limitation mentioned in previous section, instead of focusing
only to the model validity, further research also need to give an attention towards evaluating
three most prominent criteria of social research, that is: (i) Reliability, (ii) Replication, and
(iii) Validity. This research suggests another further work to evaluate the risk-based UI
system resilience analysis model reliability by repeating the model application to other UI
case study. The idea of reliability is very close to another criterion of research-replication
and more especially replicability.
Accordingly, reliability is concerned with the question of whether the results of this
research are repeatable. Reliability, in other words, measuring the consistency of
measurement that are devised for this research concept. Importantly, the evaluation of risk-
based UI system resilience analysis model reliability might particularly unmasked latent
findings of current research original results that do not match other evidence. In this way, to
do replication, the risk-based UI resilience analysis model must be replicable.
Since this research described the methodology and procedures in great details,
replication is possible for other case study. Similarly, to assess the reliability of a risk-based

CHAPTER 9-SUMMARY AND CONCLUSION
Page 252
UI system resilience model concept, the procedures that constitute that measure must be
replicable by further research work. The application of more than once case study in order
to repeat the experiment is then essential. Therefore, further work towards evaluation this
model would be a great opportunity to test the model reliability and replicability.
As discussed earlier in the limitation of the current research section, each analysis
models and simulations are subject to a host of random factors that affect the outcomes.
Hence, there is always a chance that a single simulation in this research study, no matter how
well conducted, may produce misleading results. This is the reason why replication and
extension recognized such an important part of further research. Most importantly, the
process of replication, strengthens the results analytically, and to reveal a pattern of
replication from the findings.
As Eisenhardt points out, following the replication logic resulting from more than one
case study is central in shaping theory [296]. Regarding the external validity limitation that
this research owns, it is then acknowledged and expected to apply the model to more
generally UI case study with substantial populations of urban infrastructure broader
stakeholders at the time particular UI system disturbed by the extreme event.
Accordingly, further work is also needed towards mapping the social organization of
UI system management in selected urban regions, identifying the principal actor groups,
their spheres of influence and forms of interaction with one another. This approach needed
towards analytical generalization, which can be assumed to provide more compelling
evidence of the model framework superiority. Notwithstanding the above-mentioned
limitations, this research has contribution in the both theoretical and practical implications
which are discussed in the next section.
9.6 Implication of the Research
Recently, resilience has become a buzz word and being recognized as a major element to the
success of UI system surviving the aftermath of disturbances while returning its capacity to
the period when there was no disturbance. This has encouraged researchers to expend a
significant amount of effort in attempting to provide strategies to maintain UI serviceability.
Most of these attempts have focused on investigating REA method in technical context to
improve the UI system resilience, thereby enhancing the UI system capacity level.
Despite numerous research efforts, more studies are required to advance the existing
body of knowledge and generate practical research outcomes that benefit both the UI and
urban community as the dependent party. With this in mind, this research was conducted

CHAPTER 9-SUMMARY AND CONCLUSION
Page 253
with a view to provide conceptual progression in the area of RA and resilience research in
the context of UI system as well as practical contributions for the management of risk within
the UI system context. Based on the empirical results of the previous Chapter and the
discussions, this Chapter will highlight proportions and implications for theory as well as for
practice that has been hosting the research study.
9.6.1 Theoretical Implications
This research contributes to the body of knowledge in both risk management and UI
management by proposing and validating a novel risk-based REA conceptual framework. The
framework concept development is to investigate and measure the UI system robustness
level after being disturbed. The previous literature suggests that risk management and REA
theories are two separate domains, which are often investigated separately in the system
management field. However, this research show that REA particularly in the context of UI
system can benefit from RA theories, which can complement UI system REA.
In an attempt to fill the identified gap in the literature on developing well-defined UI
system robustness level that account for RA roles importance. This research uses three
different RA models, namely; risk magnitude, risk causality and interaction pattern, and risk
impact to community for developing risk criticality analysis which stand as the point of
departure towards the UI system REA processes. The combination was used to provide an
evaluation tool to measure the critical level, shock and stress impact of particular risk, and
UI system robustness capacity.
By applying participation theories to bring together risk and resilience analysis in
infrastructure management, this research contributed to the theory in both UI risk and
resilience management literature to quantify stakeholders’ input to measure the level of UI
system robustness capacity and recovery processes. The study provides empirical evidence
to support the notion that UI robustness capacity with resilience analysis scope is improved
when comprehensive recovery strategy developed, appropriate decision made, and action
conducted after the system has been disturbed.
Further, this research contributes to the UI resilience body of knowledge by
expanding previous resilience research by applying the RA as a main element of the analysis.
Previous research that developed the UI system REA for measuring one of the resilience
property can be improved by considering several RAs within the process. In addition, this
research complements the UI system robustness analysis by quantifying risk criticality,
shock and stress impact inputs in evaluating the completeness of the robustness elements.

CHAPTER 9-SUMMARY AND CONCLUSION
Page 254
Findings from the case studies revealed the result of risk magnitude analysis is not
comprehensive and cannot be used as a sole consideration towards making crucial decisions.
The risk magnitude, in fact, lacks consideration in both the risk causality capacity and
interaction pattern, and its impact to urban community. This offers empirical evidence for
the explanation of comprehensive risk management and decision-making as a regarding of
comprehensive RA solution. Adequate and effective RA can further support to build UI
system REA comprehensiveness and management capacity towards a better robustness
analysis and recovery strategy outcome and plan respectively.
Through this process, authorities and other experts will be able to highlight optimum
strategies for the recovery strategy towards enhancing UI system robustness capacity post-
disturbances period. This should help in achieving a good understanding of all stakeholders’
requirements and concerns from the particular UI system, reducing the constraints
challenges and conflicts which would be arose in recovery processes.
The innovation of developing the conceptual risk-based REA framework in this
research lies on the combination of three different risk impact characteristic elements. The
risk impact characteristics is built upon various mathematical variables from the three
dimensional of RAs, that is; risk magnitude, risk causality and interaction pattern, and risk
impact to community, which leads to the development of risk criticality analysis model. The
risk criticality then applied as the main gate towards the robustness analysis based on
general model of system REA. Previous studies analyzed the UI system risk and resilience
separately, to fill this knowledge gaps, this research linked the two domains by the
combination of several techniques abovementioned.
In addition, studying urban infrastructural disruptions allow various stakeholders
(both experts and lay people) to do much more than learn policy of planning lessons about
how to avoid repetitions of such risk events or how to ameliorate their effects. The analysis
model fills the risk management knowledge gaps by suggesting that networked approach to
RA are uniquely suited capturing the intricate processes that shape UI risks. Further, by
validating the proposed model into a real case study, this research shows the capability of
the model and application for supporting the UI risk governance and enhancing community
resilience.
Further, this research also contributed to the theoretical concept underlying the UI
system REA by considering the importance of both RA and stakeholders role, to identify their
relative contribution to the analysis elements. To the best of the researcher’s knowledge, this
is the first time that this combination has been incorporated into RA to measuring and
CHAPTER 9-SUMMARY AND CONCLUSION
Page 255
developing the level and recovery strategy of UI system robustness capacity respectively.
Thus, the proposed conceptual framework, including with its analysis models and
approaches, contributes to theoretical insight and technical originality.
9.6.2 Practical Implications
The quantitative model proposed in this research is novel in terms of UI system resilience
research and generic, so that it can be applied to different UI systems in various scenarios
and disciplines in a consistent manner. This research contributes as a practical tool for
experts and DMs to;
1. Determine the amount of investment that could be used for resilience strategies. It is
inevitably for the UI system to have proper maintenance to improve its’ serviceability.
The maintenance including various preparations towards bear the unexpected
extreme event that could affect UI’s serviceability. In fact, this arrangement needs
rigorous investment plan which in real world, the realization is challenging and
burdensome. In the face of this issue, this research contributes as a constructive and
functional tool for experts and decision makers in planning and deciding the
investment strategies enhancing UI system resilience.
2. Develop public awareness strategies. As examined by Frischmann, B. M., the UI can be
seen as common management which conjures up the notion of a shared community
resource and further brings to mind the related concept of open access or openness
[14]. Thereupon, the urban community relationship with UI system is inseparable.
Accordingly, the success of building UI system resiliency influenced by active public
participation. In the planning period, this research can be applied to guide arranging
the strategy related with community and human resource. The results of RA and REA
should be used to raise the awareness levels of key DMs. This can be achieved by
presenting the results to various authorities and experts locally and nationally. The
RA should also be shared with those who are charged with managing the response,
depending on the context. Greater knowledge of risk profiles should lead to the
prioritization of investments to strengthen resilience in UI systems and development
plans. Further, it also helps embed risk knowledge into governmental policies,
regulations and standards, including at regional and local levels. Accordingly, this
should also help governments ask the international to support UI system resilience
building efforts.
3. Achieve the level of robustness that they would now enable the UI system to exhibit

CHAPTER 9-SUMMARY AND CONCLUSION
Page 256
in case of a disruption in future. The recovery analysis model contributes as the main
formula underlying the guidance of recovery plan and strategy. Accordingly, the
recovery model also can be applied in a such way to forecast the recovery action
output by using designed-based or random input towards achieving highest
robustness level. In addition, this research also has an advantage to be efficient tool
to adjust the optimum resource needed in condition when resources limited
Meanwhile, based on the risk impact to community analysis model, the output could
be communicated to the public, targeting those who are likely to be affected. Messages
should be tailored to local condition and include preparedness measures and guidelines on
what to do in times of crisis–even if those crisis periods are regular and lower-impact.
Accordingly, the proposes analysis model can be a guideline on content that will help limit
confusion and conflicting messages.
Several trusted organizations, perhaps government-based organizations, such as;
local authorities and leaders on respective UI system, and Non-Governmental Organizations
are the most useful conduits of risk messages. Furthermore, the proposed RA framework
was carried out by experts in different way from those that have performed in the previous
time, to allow for different perspectives. Furthermore, the comprehensive of the risk
criticality model as a core element within REA suggests it is appropriate for planning
purposes. It capable facilitates the creation of a database schema for UI loss and recovery,
and its impact on indicators of community resilience.
The conceptual framework proposes in this research could be used to help educate
various stakeholders in particular UI system about empirical findings from UI management
studies (e.g., what types of extreme events have the most difficulty recovering from certain
UI disruption). Such a conceptual model is daunting for implementation but can provide
significant opportunities for advancing specifically, UI and community resilience research
and planning respectively, more broadly.
Not to mention, the recovery analysis model in this research will further push
understanding of UI resilience and facilitate the development of better tools for supporting
resilience planning. Importantly, the RA and REA output could be applied to inform various
stakeholder groups in consistent and persistent messages to internalize information, change
perceptions and move towards taking appropriate action.
For policymakers, both RA and REA outputs, can be a useful communication and
decision-making tool towards supporting the policy and program design, which aids to:
- Identify the most significant threats in UI system context.

CHAPTER 9-SUMMARY AND CONCLUSION
Page 257
- Identify the people, assets, environmental and economic resources that are most
exposed to (or particular) risk event.
- Weigh up the relative costs and benefits of different plans and strategies to mitigate
the impact of various risks.
- Establish priorities amongst these mitigation strategies, and
- Make the appropriate policy changes and programming decisions to implement the
resilience measurement and strategies to enhance resilient UI system.
On the other hand, several RA models proposed could illustrate and inform the DMs
if risks exceed acceptable levels and trade-offs. Ideally, policy and programming decisions
should aim to prevent all unacceptable risks; often, in fact, this will not be financially viable.
Thus, the models can support the development of both plan and strategy towards addressing
the risk swiftly and concisely.
Following the robustness and recovery analysis models that aim to enhance the UI
system robustness capacity post-disturbance, practically, it is found that optimal strategies
will need to focus on building the resilience of the people, communities and institutions at
risk by a mix of policy and programming work. This includes: (i) Empowering those at risk,
(ii) Mitigating risks and its impact, and, (iii) Where feasible, through risk transfer strategies.
In addition, the robustness analysis approach will provide a common framework
which should assist policy makers, community development workers, and emergency
managers share a common perspective, and thus develop complementary policies and
priorities for building both respective UI system and community resilience. The robustness
and recovery analysis model provide the information and ideas needed to plan and prepare
for, respond to, and recover from major (and minor) disruptive events.
Such information draws on stakeholder experiences, improvements to operational
practice (gained through lessons learned and experimentation) and a thorough analysis of
immediate and future risks. Finally, the conceptual risk-based REA framework provides
policy makers, emergency planners, community leaders and individuals with the ability to
understand the context in which recovery plans and strategies can be developed and serves
as the foundation upon which adaptability and innovation may be exercised.
Furthermore, the analysis model contributes to the risk management literature that
can support the governance of UI by developing scenarios and quantifying the value of
countermeasures and making fundamental policy. Finally, this phase also contributes to
delivering practical tools for the urban communities towards developing better UI risk
management system and enhancing community resilience.

CHAPTER 9-SUMMARY AND CONCLUSION
Page 258
The simulation output based on the conceptual framework would be significant
towards supporting the politics of investing in different options, on the economics of how to
balance investments. Specifically, the investment across the continuum in the context of
dynamic and interacting risks and on the extent to which implementation of measures across
the risk management helps develop the attributes of a resilient UI system.
9.7 Closure
This research was conducted in response to the need for a more comprehensive procedure
to assess UI system REA by putting RA as a high consideration of crucial element. More
specifically, the purpose of this research is to pave the way for empirical research on the
subject and to conceptually develop a REA framework which focus on robustness property.
To achieve RAI determined in Chapter 1, the proposed conceptual framework
proposes was divided into six main phases. The first phase was analysis of risk magnitude
followed by the second phase which focused on the risk causality and interaction pattern
analysis. The third phase analyzed the risk impact to community. Then the fourth phase,
focus on the integration of various variables from previous three RAs which leads to the risk
critical analysis. The simulation shifted onto the processes of measuring and analyzing the
robustness level of UI system towards facing various risk events.
The assessment processes ended by shifting to the phase six of conceptual framework
which aims to deliberate and explore the scenario-based recovery action simulation and
output towards enhancing particular UI system robustness level post-disturbance. Five
different resilience action scenarios have been developed and compared to the ‘expected
recovery’ scenario. The highest robustness level output in the end of time frame can be
appointed as the basis point to determine the finest recovery action scenario.
For study completeness (testing and validating the empirical framework),
exploratory case study was undertaken using Surabaya water supply infrastructure system
in Indonesian context. The simulation output and discussion found that using the risk
criticality analysis model made a significant difference in measuring the impact of each risk
event. Notably, the developed procedure can only be analytically generalized in the context
of Surabaya water supply infrastructure system case; it is not statistically generalizable.
However, the conceptual framework proposed in this research, not including the final
evaluation sheets, can be replicated globally, for any UI type and sector.
This dissertation recommends that REA in UI system context should put an attention
towards risk management in defining both the UI system robustness and recovery strategy.

CHAPTER 9-SUMMARY AND CONCLUSION
Page 259
Nonetheless, the inputs based on data collection in the field should be quantified with
respect to the input importance of each stakeholder on a particular UI sector. This research
proposed a conceptual framework that can help authorities and DMs to; (i) Measure the
initial level of UI system robustness post-disturbances in a manner that respects all
stakeholders’ sense of fairness in decision-making processes, and (ii) Advance the practice
of preparing the recovery strategy, which could in turn enhance the UI system robustness
level.
Insights gained by performing the resilience research are expected to be useful in
designing UI systems for resilience i.e., building particular UI systems that have the ability to
bounce back from a disruptive state. The proposed risk-based REA framework suitable for
the development of a UI security plans, in which will gather, assemble and apply the
exchanging experience-based information between various stakeholders towards the
inherent risk within the specific UI system considered.
Importantly, this dissertation makes recommendation for future research directions,
paving the way for other researchers willing to enhance and extend the current research
study’s findings. Finally, this research holds the promise to be a great potential utility for:
stakeholders (i.e., experts, DMs and recovery managers as well as affected communities) in
preparedness, response, recovery, and mitigation efforts as timely and actionable
information which is still the scarcest and most sought resource during extreme events.

CHAPTER 9-SUMMARY AND CONCLUSION
Page 260
-This page intentionally left blank-

BIBLIOGRAPHY
Page 261
BIBLIOGRAPHY
1. Cabanyes Truffino, J., Resilience: An approach to the concept. Revista de Psiquiatrí a y
Salud Mental (English Edition), 2010. 3(4): p. 145-151.
2. Rinaldi, S.M. Modeling and simulating critical infrastructures and their
interdependencies. in System Sciences, 2004. Proceedings of the 37th Annual Hawaii
International Conference on. 2004.
3. Rinaldi, S.M., J.P. Peerenboom, and T.K. Kelly, Identifying, understanding, and analyzing
critical infrastructure interdependencies. Control Systems, IEEE, 2001. 21(6): p. 11-25.
4. Zio, E., Challenges in the vulnerability and risk analysis of critical infrastructures.
Reliability Engineering & System Safety, 2016. 152: p. 137-150.
5. Gaillard, J.C., Vulnerability, capacity and resilience: Perspectives for climate and
development policy. Journal of International Development, 2010. 22(2): p. 218-232.
6. Miller, W., What does built environment research have to do with risk mitigation,
resilience and disaster recovery? Sustainable Cities and Society, 2015. 19: p. 91-97.
7. Shafieezadeh, A. and L. Ivey Burden, Scenario-based resilience assessment framework
for critical infrastructure systems: Case study for seismic resilience of seaports.
Reliability Engineering & System Safety, 2014. 132: p. 207-219.
8. Francis, R. and B. Bekera, A metric and frameworks for resilience analysis of engineered
and infrastructure systems. Reliability Engineering & System Safety, 2014. 121: p. 90-
103.
9. Cimellaro, G.P., A.M. Reinhorn, and M. Bruneau, Framework for analytical
quantification of disaster resilience. Engineering Structures, 2010. 32(11): p. 3639-
3649.
10. Aven, T., On some recent definitions and analysis frameworks for risk, vulnerability, and
resilience. Risk Analysis, 2011. 31(4): p. 515-522.
11. Mitchell, T. and K. Harris, Resilience: A risk management approach. ODI Background
Note. Overseas Development Institute: London, 2012.
12. Weathington, B.L., C.J. Cunningham, and D.J. Pittenger, Research methods for the
behavioral and social sciences. 2010: John Wiley & Sons.
13. Rydin, Y., et al., Shaping cities for health: complexity and the planning of urban
environments in the 21st century. Lancet, 2012. 379(9831): p. 2079-2108.
14. Frischmann, B.M., Defining Infrastructure and Commons Management, in
Infrastructure: The Social Value of Shared Resources, B. Frischmann, Editor. 2012. p. 3-
9.

BIBLIOGRAPHY
Page 262
15. Boone, C. and A. Modarres, Urban Infrastructure: Living with The Consequences of Past
Decisions and Opportunities for The Future, in City and Environment, C. Boone and A.
Modarres, Editors. 2009, Temple University Press: Philadelphia. p. 95-133.
16. Zio, E. Vulnerability and Risk Analysis of Critical Infrastructures. in Second
International Conference on Vulnerability and Risk Analysis and Management (ICVRAM)
and the Sixth International Symposium on Uncertainty, Modeling, and Analysis (ISUMA).
2014.
17. Graham, S., When infrastructures fail, in Disrupted Cities: When Infrastructure Fails.
2010. p. 1-26.
18. Ennis, F., Infrastructure provision and the urban environment. Infrastructure provision
and the Negotiating Process, 2003: p. 1-18.
19. Frischmann, B.M., Infrastructure resources, in Infrastructure: The social value of shared
resources, B.M. Frischmann, Editor. 2012, Oxford University Press. p. 61-90.
20. Graham, S. and C. McFarlane, Infrastructural Lives: Urban Infrastructure in Context.
2014: Routledge.
21. Moss, T., Battle of the Systems? Changing Styles of Water Recycling in Berlin, in Urban
infrastructure in transition: networks, buildings and plans, S. Guy, S. Marvin, and T.
Moss, Editors. 2001, Earthscan. p. 43-56.
22. Little, R.G., Managing the risk of cascading failure in complex urban infrastructures, in
Disrupted Cities-When Infrastructures Failes, S. Graham, Editor. 2009, London:
Routledge: New York. p. 27-39.
23. Guy, S., Splintering networks: cities and technical networks in 1990s Britain. Urban
Studies, 1997. 34(2): p. 191-216.
24. Bowker, G.C. and S.L. Star, Sorting things out: Classification and its consequences. 2000:
MIT press.
25. Hughes, T.P., The evolution of large technological systems. The social construction of
technological systems: New directions in the sociology and history of technology,
1987: p. 51-82.
26. Tonkiss, F., Infrastructure as 'Design Politics', in Cities by design: the social life of urban
form, F. Tonkiss, Editor. 2014, John Wiley & Sons. p. 138-158.
27. Eusgeld, I., et al., The role of network theory and object-oriented modeling within a
framework for the vulnerability analysis of critical infrastructures. Reliability
Engineering & System Safety, 2009. 94(5): p. 954-963.

BIBLIOGRAPHY
Page 263
28. Setola, R., S. De Porcellinis, and M. Sforna, Critical infrastructure dependency
assessment using the input–output inoperability model. International Journal of
Critical Infrastructure Protection, 2009. 2(4): p. 170-178.
29. Merabti, M., M. Kennedy, and W. Hurst. Critical infrastructure protection: A 21th
century challenge. in Communications and Information Technology (ICCIT), 2011
International Conference on. 2011.
30. Singh, A.N., M.P. Gupta, and A. Ojha, Identifying critical infrastructure sectors and their
dependencies: An Indian scenario. International Journal of Critical Infrastructure
Protection, 2014(0).
31. Chen, P., et al., Managing Critical Infrastructure Interdependence through Economic
Input-Output Methods. Journal of Infrastructure Systems, 2009. 15(3): p. 200-210.
32. Simone, A., Relational infrastructure in postcolonial urban worlds, in Infrastructural
lives: Urban infrastructure in context. 2014, Routledge. p. 17-38.
33. Mau, B. and J. Leonard, Massive change. 2004.
34. Guy, S., S. Marvin, and W. Medd, Shaping urban infrastructures: intermediaries and the
governance of socio-technical networks. 2011: Routledge.
35. Li, T.H.Y., S.T. Ng, and M. Skitmore, Conflict or consensus: An investigation of stakeholder
concerns during the participation process of major infrastructure and construction
projects in Hong Kong. Habitat International, 2012. 36(2): p. 333-342.
36. Graham, S., When infrastructures fail. Disrupted Cities: When Infrastructure Fails,
2010: p. 1-26.
37. McAllister, T., Research needs for developing a risk-informed methodology for
community resilience. Journal of Structural Engineering, 2015: p. C4015008.
38. Guy, S. and S. Marvin, Urban Environmental Flows: Towards a New Way of Seeing, in
Urban infrastructure in transition: networks, buildings and plans, S. Guy, S. Marvin, and
T. Moss, Editors. 2001, Earthscan.
39. Moss, T., Flow Management in Urbanb Regions: Introduction a Concept, in Urban
infrastructure in transition: networks, buildings and plans, S. Guy, S. Marvin, and T.
Moss, Editors. 2001, Earthscan. p. 3-21.
40. Oh, E., Identification of the impact of critical infrastructure on associated industries:
Analysis of a flood disaster event. Master's Thesis: Purdue University, Indiana, USA,
2008.

BIBLIOGRAPHY
Page 264
41. Oh, E., A. Deshmukh, and M. Hastak, Vulnerability Assessment of Critical Infrastructure,
Associated Industries, and Communities during Extreme Events, in Construction
Research Congress 2010. 2010. p. 449-469.
42. Ongkowijoyo, C.S. and H.K. Doloi. Analyzing the Risk Criticality of an Infrastructure
System on the Community. in Construction Research Congress 2016. 2016.
43. Oh, E. and M. Hastak. Impact analysis of natural calamities on infrastructure and
industries. in Proceedings of the 4th i-REC conference. 2008.
44. Mei, R., H. Chuanfeng, and L. Liang. Critical Infrastructure Failure Interdependencies in
the 2008 Chinese Winter Storms. in Management and Service Science (MASS), 2010
International Conference on. 2010.
45. Labaka, L., J. Hernantes, and J.M. Sarriegi, A holistic framework for building critical
infrastructure resilience. Technological Forecasting and Social Change, 2016. 103: p.
21-33.
46. Lauge , A., J. Hernantes, and J.M. Sarriegi, Critical infrastructure dependencies: A holistic,
dynamic and quantitative approach. International Journal of Critical Infrastructure
Protection, 2015. 8: p. 16-23.
47. Lewis, T.G., Critical infrastructure protection in homeland security: defending a
networked nation. 2014: John Wiley & Sons.
48. Rochas, C., T. Kuzn ecova, and F. Romagnoli, The concept of the system resilience within
the infrastructure dimension: application to a Latvian case. Journal of Cleaner
Production, 2014(0).
49. Milman, A. and A. Short, Incorporating resilience into sustainability indicators: An
example for the urban water sector. Global Environmental Change, 2008. 18(4): p.
758-767.
50. Jordan, E. and A. Javernick-Will, Measuring Community Resilience and Recovery: A
Content Analysis of Indicators, in Construction Research Congress 2012. p. 2190-2199.
51. Ouyang, M. and Z. Wang, Resilience assessment of interdependent infrastructure
systems: With a focus on joint restoration modeling and analysis. Reliability
Engineering & System Safety, 2015. 141: p. 74-82.
52. Dalziell, E.P. and S.T. McManus, Resilience, Vulnerability, and Adaptive Capacity:
Implications for System Performance, in 1st International Forum for Engineering
Decision Making (IFED). 2004, University of Canterbury. Civil and Natural Resources
Engineering: Stoos, Switzerland.

BIBLIOGRAPHY
Page 265
53. Scholl, H.J. and B.J. Patin, Resilient information infrastructures. Transforming
Government: People, Process and Policy, 2014. 8(1): p. 28-48.
54. Miles, S., The Role of Critical Infrastructure in Community Resilience to Disasters, in
Structures Congress 2011. 2011. p. 1985-1995.
55. Zio, E., Reliability engineering: Old problems and new challenges. Reliability
Engineering & System Safety, 2009. 94(2): p. 125-141.
56. Woods, D.D., N. Leveson, and E. Hollnagel, Resilience engineering: concepts and
precepts. 2012: Ashgate Publishing, Ltd.
57. Cutter, S.L., Resilience to What? Resilience for Whom? The Geographical Journal, 2016.
182(2): p. 110-113.
58. Henry, D. and J. Emmanuel Ramirez-Marquez, Generic metrics and quantitative
approaches for system resilience as a function of time. Reliability Engineering & System
Safety, 2012. 99: p. 114-122.
59. Boin, A. and A. McConnell, Preparing for Critical Infrastructure Breakdowns: The Limits
of Crisis Management and the Need for Resilience. Journal of Contingencies and Crisis
Management, 2007. 15(1): p. 50-59.
60. Dalziell, E.P. and S.T. McManus, Resilience, vulnerability, and adaptive capacity:
implications for system performance. 2004.
61. Hosseini, S. and K. Barker, Modeling infrastructure resilience using Bayesian networks:
A case study of inland waterway ports. Computers & Industrial Engineering, 2016. 93:
p. 252-266.
62. Johannessen, A ., et al., Strategies for building resilience to hazards in water, sanitation
and hygiene (WASH) systems: The role of public private partnerships. International
Journal of Disaster Risk Reduction, 2014. 10, Part A(0): p. 102-115.
63. Chang, S.E., et al., Toward Disaster-Resilient Cities: Characterizing Resilience of
Infrastructure Systems with Expert Judgments. Risk Analysis, 2014. 34(3): p. 416-434.
64. Manyena, S.B., The concept of resilience revisited. Disasters, 2006. 30(4): p. 434-450.
65. Chertoff, M., National infrastructure protection plan. Department of Homeland
Security (DHS), Washington, DC, 2009.
66. Haimes, Y.Y., On the definition of resilience in systems. Risk Analysis, 2009. 29(4): p.
498-501.
67. SRA. Society of risk analysis, glossary of the specialty group on foundations of risk
analysis. 2015; Available from: http://www.sra.org/news/sra-develops-glossary-
risk-related-terms.

BIBLIOGRAPHY
Page 266
68. Bocchini, P., et al., Resilience and sustainability of civil infrastructure: Toward a unified
approach. Journal of Infrastructure Systems, 2013. 20(2): p. 04014004.
69. Ouyang, M., L. Duen as-Osorio, and X. Min, A three-stage resilience analysis framework
for urban infrastructure systems. Structural Safety, 2012. 36–37(0): p. 23-31.
70. Rigaud, E. and F. Guarnieri. Proposition of a conceptual and a methodological modelling
framework for resilience engineering. in 2nd Symposium on Resilience Engineering.
2006.
71. Rochas, C., T. Kuzn ecova, and F. Romagnoli, The concept of the system resilience within
the infrastructure dimension: application to a Latvian case. Journal of Cleaner
Production, 2015. 88: p. 358-368.
72. Cimellaro, G.P. and D. Solari, Considerations about the optimal period range to evaluate
the weight coefficient of coupled resilience index. Engineering Structures, 2014. 69: p.
12-24.
73. Zhang, P. and S. Peeta, A generalized modeling framework to analyze interdependencies
among infrastructure systems. Transportation Research Part B: Methodological, 2011.
45(3): p. 553-579.
74. Sellke, P. and O. Renn, Risk, Society and Environmental Policy: Risk Governance in
Complex World, in Environmental sociology: European perspectives and
interdisciplinary challenges, M. Gross and H. Heinrichs, Editors. 2010, Springer
Science & Business Media. p. 295-321.
75. Little, R.G., Managing the risk of cascading failure in complex urban infrastructures.
2009: London: Routledge.
76. Cozzani, V., et al., The assessment of risk caused by domino effect in quantitative area
risk analysis. Journal of Hazardous Materials, 2005. 127(1–3): p. 14-30.
77. Antonioni, G., G. Spadoni, and V. Cozzani, Application of domino effect quantitative risk
assessment to an extended industrial area. Journal of Loss Prevention in the Process
Industries, 2009. 22(5): p. 614-624.
78. Reniers, G.L.L., et al., The use of current risk analysis tools evaluated towards preventing
external domino accidents. Journal of Loss Prevention in the Process Industries, 2005.
18(3): p. 119-126.
79. Cox Jr, L.A., Risk analysis of complex and uncertain systems. Vol. 129. 2009: Springer
Science & Business Media.

BIBLIOGRAPHY
Page 267
80. Correa-Henao, G.J., J.M. Yusta, and R. Lacal-Ara ntegui, Using interconnected risk maps
to assess the threats faced by electricity infrastructures. International Journal of
Critical Infrastructure Protection, 2013. 6(3–4): p. 197-216.
81. Kasperson, R.E., et al., The social amplification of risk: A conceptual framework. Risk
analysis, 1988. 8(2): p. 177-187.
82. Kasperson, J.X., et al., The social amplification of risk: assessing fifteen years of research
and theory. The social amplification of risk, 2003. 1: p. 13-46.
83. Matthews, J., K. Piratla, and E. Matthews, Disaster Resilience of Drinking Water
Infrastructure Systems to Multiple Hazards, in Structures Congress 2014. p. 2312-2317.
84. Komendantova, N., et al., Multi-hazard and multi-risk decision-support tools as a part
of participatory risk governance: Feedback from civil protection stakeholders.
International Journal of Disaster Risk Reduction, 2014. 8(0): p. 50-67.
85. McAslan, A., Community resilience: Understanding the concept and its application.
Torrens Resilience Institute, Adelaide, 2011.
86. Fang, C., et al., Network theory-based analysis of risk interactions in large engineering
projects. Reliability Engineering & System Safety, 2012. 106(0): p. 1-10.
87. Vidal, L.-A. and F. Marle, Understanding project complexity: implications on project
management. Kybernetes, 2008. 37(8): p. 1094-1110.
88. Khan, F.I. and S.A. Abbasi, An assessment of the likelihood of occurrence, and the
damage potential of domino effect (chain of accidents) in a typical cluster of industries.
Journal of Loss Prevention in the Process Industries, 2001. 14(4): p. 283-306.
89. Cozzani, V. and E. Salzano, The quantitative assessment of domino effect caused by
overpressure: Part II. Case studies. Journal of Hazardous Materials, 2004. 107(3): p.
81-94.
90. Cozzani, V. and E. Salzano, The quantitative assessment of domino effects caused by
overpressure: Part I. Probit models. Journal of Hazardous Materials, 2004. 107(3): p.
67-80.
91. Khakzad, N., et al., Domino effect analysis using Bayesian networks. Risk Analysis, 2013.
33(2): p. 292-306.
92. Yang, R.J. and P.X.W. Zou, Stakeholder-associated risks and their interactions in complex
green building projects: A social network model. Building and Environment, 2014.
73(0): p. 208-222.
93. Sapori, E., M. Sciutto, and G. Sciutto, A Quantitative Approach to Risk Management in
Critical Infrastructures. Transportation Research Procedia, 2014. 3(0): p. 740-749.

BIBLIOGRAPHY
Page 268
94. Huang, C.-N., J.J.H. Liou, and Y.-C. Chuang, A method for exploring the interdependencies
and importance of critical infrastructures. Knowledge-Based Systems, 2014. 55(0): p.
66-74.
95. Marrone, S., et al., Vulnerability modeling and analysis for critical infrastructure
protection applications. International Journal of Critical Infrastructure Protection,
2013. 6(3–4): p. 217-227.
96. Yusta, J.M., G.J. Correa, and R. Lacal-Ara ntegui, Methodologies and applications for
critical infrastructure protection: State-of-the-art. Energy Policy, 2011. 39(10): p.
6100-6119.
97. Zhang, W.-J., et al., Social network analysis of the vulnerabilities of interdependent
critical infrastructures. International journal of critical infrastructures, 2008. 4(3): p.
256-273.
98. Rausand, M., Risk assessment: theory, methods, and applications. Vol. 115. 2013: John
Wiley & Sons.
99. ISO/IEC, ISO/IEC FDIS 31010:2009, in Risk management - Risk assessment techniques.
2009, International Organization for Standardization.
100. Kro ger, W. and E. Zio, Vulnerable systems. 2011: Springer Science & Business Media.
101. Hopkin, P., Fundamentals of risk management: understanding, evaluating and
implementing effective risk management, ed. P. Hopkin. 2014: Kogan Page Publishers.
357.
102. Cox Jr, L.A., Limitations of Risk Assessment Using Risk Matrices, in Risk Analysis of
Complex and Uncertain Systems. 2009, Springer. p. 101-124.
103. Cox Jr, L.A., Limitations of Quantitative Risk Assessment Using Aggregate Exposure and
Risk Models, in Risk Analysis of Complex and Uncertain Systems. 2009, Springer. p. 125-
161.
104. Gardoni, P. and C. Murphy, A scale of risk. Risk Analysis, 2014. 34(7): p. 1208-1227.
105. Nirupama, N., Risk and vulnerability assessment: a comprehensive approach.
International Journal of Disaster Resilience in the Built Environment, 2012. 3(2): p.
103-114.
106. Roozbahani, A., B. Zahraie, and M. Tabesh, Integrated risk assessment of urban water
supply systems from source to tap. Stochastic Environmental Research and Risk
Assessment, 2013. 27(4): p. 923-944.
107. Zio, E., An introduction to the basics of reliability and risk analysis. Vol. 13. 2007: World
scientific.

BIBLIOGRAPHY
Page 269
108. Deshmukh, A., E.H. Oh, and M. Hastak, Impact of flood damaged critical infrastructure
on communities and industries. Built Environment Project and Asset Management,
2011. 1(2): p. 156-175.
109. Zhang, J., et al., A Case Study on Risk Assessment of Long Distance Water Supply System.
Procedia Engineering, 2014. 70(0): p. 1762-1771.
110. Gurzau, A.E., et al., Identification and Risk Assessment of Central Water Supply Systems-
Case Study. Aerul si Apa. Componente ale Mediului, 2011: p. 545-552.
111. Duenas-Osorio, L. and S.M. Vemuru. Risk Assessment of Complex Infrastructures. in
Special Workshop on Risk Acceptance and Risk Communication. 2007. Citeseer.
112. John, A., et al., A risk assessment approach to improve the resilience of a seaport system
using Bayesian networks. Ocean Engineering, 2016. 111: p. 136-147.
113. Dobbie, M.F. and R.R. Brown, A Framework for Understanding Risk Perception,
Explored from the Perspective of the Water Practitioner. Risk Analysis, 2014. 34(2): p.
294-308.
114. Lee, M., et al., Fuzzy-Logic Modeling of Risk Assessment for a Small Drinking-Water
Supply System. Journal of Water Resources Planning and Management, 2009. 135(6):
p. 547-552.
115. Oh, E., A. Deshmukh, and M. Hastak, Criticality Assessment of Lifeline Infrastructure for
Enhancing Disaster Response. Natural Hazards Review, 2013. 14(2): p. 98-107.
116. Grigg, N., Water Utility Security: Multiple Hazards and Multiple Barriers. Journal of
Infrastructure Systems, 2003. 9(2): p. 81-88.
117. Pollard, S.J.T., et al., Risk Analysis and Management in the Water Utility Sector: A Review
of Drivers, Tools and Techniques. Process Safety and Environmental Protection, 2004.
82(6): p. 453-462.
118. Selvakumar, A. and A. Tafuri, Rehabilitation of Aging Water Infrastructure Systems: Key
Challenges and Issues. Journal of Infrastructure Systems, 2012. 18(3): p. 202-209.
119. Boudet, H., D. Jayasundera, and J. Davis, Drivers of Conflict in Developing Country
Infrastructure Projects: Experience from the Water and Pipeline Sectors. Journal of
Construction Engineering and Management, 2011. 137(7): p. 498-511.
120. Clark-Ginsberg, A., Participatory risk network analysis: A tool for disaster reduction
practitioners. International Journal of Disaster Risk Reduction, 2017. 21: p. 430-437.
121. McAllister, T., Research Needs for Developing a Risk-Informed Methodology for
Community Resilience. Journal of Structural Engineering, 2016. 142(8).

BIBLIOGRAPHY
Page 270
122. Lindhe, A., et al., Fault tree analysis for integrated and probabilistic risk analysis of
drinking water systems. Water research, 2009. 43(6): p. 1641-1653.
123. Masys, A., Black swans to grey swans: revealing the uncertainty. Disaster Prevention
and Management: An International Journal, 2012. 21(3): p. 320-335.
124. Kaplan, S., et al., New Tools for Failure and Risk Analysis: Anticipatory Failure
Determination. Ideation International Inc, Detroit, 1999.
125. Khakzad, N., Application of dynamic Bayesian network to risk analysis of domino effects
in chemical infrastructures. Reliability Engineering & System Safety, 2015. 138: p.
263-272.
126. Yuan, Z., et al., Domino effect analysis of dust explosions using Bayesian networks.
Process Safety and Environmental Protection, 2016. 100: p. 108-116.
127. LaRocca, S. and S. Guikema. A survey of network theoretic approaches for risk analysis
of complex infrastructure systems. in Vulnerability, Uncertainty, and Risk: Analysis,
Modeling, and Management Proceedings of the International Conference on
Vulnerability and Risk Analysis and Management (ICVRAM) and International
Symposium on Uncertainty Modeling and Analysis (ISUMA), Hyattsville, MD, April. 2011.
128. Ongkowijoyo, C. and H. Doloi, Determining critical infrastructure risks using social
network analysis. International Journal of Disaster Resilience in the Built
Environment, 2017. 8(1): p. 5-26.
129. Marsden, P.V., Recent developments in network measurement. Models and methods in
social network analysis, 2005. 8: p. 30.
130. Thekdi, S. and J. Lambert, Quantification of Scenarios and Stakeholders Influencing
Priorities for Risk Mitigation in Infrastructure Systems. Journal of Management in
Engineering, 2014. 30(1): p. 32-40.
131. Aven, T. and B.S. Krohn, A new perspective on how to understand, assess and manage
risk and the unforeseen. Reliability Engineering & System Safety, 2014. 121: p. 1-10.
132. Fischhoff, B., P. Slovic, and S. Lichtenstein, Lay foibles and expert fables in judgments
about risk. The American Statistician, 1982. 36(3b): p. 240-255.
133. Kemp, R., Risk perception: The assessment of risks by experts and by lay people–a
rational comparison. Risk is a construct: Perceptions of risk perception, 1993: p. 103-
118.
134. Wildavsky, A., The comparative study of risk perception: A beginning. Risk is a
construct. Mu nchen: Knesebeck, 1993.

BIBLIOGRAPHY
Page 271
135. Bordens, K.S. and B.B. Abbott, Research design and methods: A process approach. 2002:
McGraw-Hill.
136. Johnson, R.B., A.J. Onwuegbuzie, and L.A. Turner, Toward a definition of mixed methods
research. Journal of mixed methods research, 2007. 1(2): p. 112-133.
137. Tan, W.C.K., Practical research methods. 2002: Prentice Hall.
138. Babbie, E.R., The practice of social research. 2015: Nelson Education.
139. Mertens, D.M., Research and evaluation in education and psychology: Integrating
diversity with quantitative, qualitative, and mixed methods. 2014: Sage publications.
140. Creswell, J.W., Research design: Qualitative, quantitative, and mixed methods
approaches. 2013: Sage publications.
141. Creswell, J.W. and V.L.P. Clark, Designing and conducting mixed methods research. 2007.
142. Creswell, J.W., et al., Advanced mixed methods research designs. Handbook of mixed
methods in social and behavioral research, 2003. 209: p. 240.
143. Mook, D.G., In defense of external invalidity. American psychologist, 1983. 38(4): p.
379.
144. Stake, R.E., The art of case study research. 1995: Sage.
145. Schramm, W., The nature of communication between humans. The process and effects
of mass communication, 1971: p. 3-53.
146. Yin, R.K., Case study research: Design and methods fourth edition. Los Angeles and
London: SAGE, 2009.
147. Alegre, H. and S.T. Coelho, Infrastructure asset management of urban water systems, in
Water Supply System Analysis-Selected Topics. 2012, InTech.
148. Nurhidayah, L., Toward Environmentally Sustainable City in Indonesia: Case Study on
Environment Protection in Surabaya. 2008.
149. Razif, M. and S.F. Persada, The Fluctuation Impacts of BOD, COD and TSS in Surabaya’s
Rivers to Environmental Impact Assessment (EIA) Sustainability on Drinking Water
Treatment Plant in Surabaya City. International Journal of ChemTech Research, 2015.
8(8): p. 143-151.
150. Setiono, I., Using output-based aid to expand piped water supply to Surabaya urban
poor, in Prakarsa Compendium, C.S. Walker and P. Punjabi, Editors. 2013, Indonesia
Infrastructure Initiative: Jakarta. p. 169-173.
151. Pranoto., A.H. and B. Suwarso. Community-Based Water Environmental Governance: A
Community Movement in Surabaya City 2007.

BIBLIOGRAPHY
Page 272
152. W.Dick, H., Surabaya City of Work. A Socioeconomic History, 1900-2000. 2002, Scott
Quadrangle, Athens, OH, USA: Ohio University Press. 224-226.
153. Frankfort-Nachmias, C. and D. Nachmias, Study guide for research methods in the social
sciences. 2007: Macmillan.
154. Bell, J., Doing Your Research Project: A guide for first-time researchers. 2014: McGraw-
Hill Education (UK).
155. Yin, R.K., Case study research: Design and methods. 2013: Sage publications.
156. Schwab, D.P., Research methods for organizational studies. 2013: Psychology Press.
157. Tashakkori, A. and C. Teddlie, Mixed methodology: Combining qualitative and
quantitative approaches. Vol. 46. 1998: Sage.
158. Marshall, M.N., Sampling for qualitative research. Family practice, 1996. 13(6): p. 522-
526.
159. Coyne, I.T., Sampling in qualitative research. Purposeful and theoretical sampling;
merging or clear boundaries? Journal of advanced nursing, 1997. 26(3): p. 623-630.
160. Neuman, L.W., Social research methods: Qualitative and quantitative approaches. 2002.
161. Silva, M.M., et al., A multidimensional approach to information security risk
management using FMEA and fuzzy theory. International Journal of Information
Management, 2014. 34(6): p. 733-740.
162. Puente, J., et al., A decision support system for applying failure mode and effects analysis.
International Journal of Quality & Reliability Management, 2002. 19(2): p. 137-150.
163. Beauregard, M.R. and R.J. Mikulak, The basics of FMEA. 2009: CRC Press.
164. Wall, M., et al., Failure Modes, Reliability and Integrity of Floating Storage Unit (FPSO,
FSU) Turret and Swivel Systems. 2002: Great Britain, Health and Safety Executive.
165. Vinnem, J.E., et al. Generalised methodology for operational risk analysis. in
Proceedings of ESREL. 2007.
166. Xia, J., et al., Failure Mode Criticality Analysis of Metro Door System, in Proceedings of
the 2013 International Conference on Electrical and Information Technologies for Rail
Transportation (EITRT2013)-Volume II, L. Jia, et al., Editors. 2014, Springer Berlin
Heidelberg. p. 251-257.
167. Pillay, A. and J. Wang, Modified failure mode and effects analysis using approximate
reasoning. Reliability Engineering & System Safety, 2003. 79(1): p. 69-85.
168. Zhang, Z. and X. Chu, Risk prioritization in failure mode and effects analysis under
uncertainty. Expert Systems with Applications, 2011. 38(1): p. 206-214.

BIBLIOGRAPHY
Page 273
169. Clark, K., Design for manufacturability at Midwest industries: teaching note, in Note No.
5-693-007. 1992, Harvard Business School Boston, MA.
170. Wang, Y.-M., et al., Risk evaluation in failure mode and effects analysis using fuzzy
weighted geometric mean. Expert Systems with Applications, 2009. 36(2, Part 1): p.
1195-1207.
171. Liu, H.-C., et al., Failure mode and effects analysis using fuzzy evidential reasoning
approach and grey theory. Expert Systems with Applications, 2011. 38(4): p. 4403-
4415.
172. Liu, H.-C., L. Liu, and N. Liu, Risk evaluation approaches in failure mode and effects
analysis: A literature review. Expert Systems with Applications, 2013. 40(2): p. 828-
838.
173. Li, Q., A novel Likert scale based on fuzzy sets theory. Expert Systems with Applications,
2013. 40(5): p. 1609-1618.
174. Pedrycz, W., P. Ekel, and R. Parreiras, Fuzzy multicriteria decision-making: models,
methods and applications. 2011: John Wiley & Sons.
175. Yager, R.R. and L.A. Zadeh, An introduction to fuzzy logic applications in intelligent
systems. Vol. 165. 2012: Springer Science & Business Media.
176. Be lohla vek, R. and G.J. Klir, Concepts and fuzzy logic. 2011: MIT Press.
177. Cintula, P., C. Fermu ller, and C. Noguera, Handbook of Mathematical Fuzzy Logic-
Volume 3. 2015.
178. Zadeh, L.A., Information and control. Fuzzy sets, 1965. 8(3): p. 338-353.
179. Zadeh, L.A., Fuzzy logic-computing with words. Fuzzy Systems, IEEE Transactions on,
1996. 4(2): p. 103-111.
180. Marin, A. and B. Wellman, Social network analysis: An introduction, in The SAGE
handbook of social network analysis. 2011. p. 370-388.
181. Wasserman, S. and K. Faust, Social network analysis: Methods and applications. Vol. 8.
1994: Cambridge university press.
182. Carrington, P.J., J. Scott, and S. Wasserman, Models and methods in social network
analysis. Vol. 28. 2005: Cambridge university press.
183. Wambeke, B., M. Liu, and S. Hsiang, Using Pajek and Centrality Analysis to Identify a
Social Network of Construction Trades. Journal of Construction Engineering and
Management, 2012. 138(10): p. 1192-1201.

BIBLIOGRAPHY
Page 274
184. Park, H., et al., Social Network Analysis of Collaborative Ventures for Overseas
Construction Projects. Journal of Construction Engineering and Management, 2011.
137(5): p. 344-355.
185. Stein, C., H. Ernstson, and J. Barron, A social network approach to analyzing water
governance: The case of the Mkindo catchment, Tanzania. Physics and Chemistry of the
Earth, Parts A/B/C, 2011. 36(14–15): p. 1085-1092.
186. Lienert, J., F. Schnetzer, and K. Ingold, Stakeholder analysis combined with social
network analysis provides fine-grained insights into water infrastructure planning
processes. Journal of Environmental Management, 2013. 125(0): p. 134-148.
187. Allin, C., Progress and challenges in seismic performance assessment. PEER newsletter,
2000.
188. Wambeke, B., M. Liu, and S. Hsiang, Task Variation and the Social Network of
Construction Trades. Journal of Management in Engineering, 2014. 30(4): p.
05014008.
189. Prell, C., K. Hubacek, and M. Reed, Stakeholder Analysis and Social Network Analysis in
Natural Resource Management. Society & Natural Resources, 2009. 22(6): p. 501-518.
190. Agneessens, F. and M.G. Everett, Introduction to the special issue on advances in two-
mode social networks. Social Networks, 2013. 35(2): p. 145-147.
191. Malisiovas, A. and X. Song. Social Network Analysis (SNA) for Construction Projects’
Team Communication Structure Optimization. in Construction Research Congress
2014@ sConstruction in a Global Network. 2014. ASCE.
192. Chinowsky, P.S., J. Diekmann, and J. O’Brien, Project organizations as social networks.
Journal of Construction Engineering and Management, 2009. 136(4): p. 452-458.
193. H., L.G., Mutual influence of corporate networks and industrial change. J. Korea Soc.
Social Sci., 2005. 39: p. 1.
194. K., W., et al., Global dimension of robust project network design. J. Constr. Eng. Manage.,
2010. 136: p. 442.
195. E., T.J., L. R., and V.J. A., Simulating learning dynamics in project networks. J. Constr. Eng.
Manage., 2009. 135: p. 1009.
196. E., T.J. and B.P. G., Paradigm trajectories of building information modeling practice in
project networks. J. Manage. Eng., 2009. 25: p. 69.
197. Chai, C.L., et al., Application of social network theory to prioritizing Oil & Gas
industries protection in a networked critical infrastructure system. Journal of Loss
Prevention in the Process Industries, 2011. 24(5): p. 688-694.

BIBLIOGRAPHY
Page 275
198. Borgatti, S.P., M.G. Everett, and J.C. Johnson, Analyzing social networks. 2013: SAGE
Publications Limited.
199. Rausand, M. and M. Rausand, Hazard Identification, in Risk Assessment. 2011, John
Wiley & Sons, Inc. p. 213-263.
200. OECD, Disaster Risk Assessment and Risk Financing, in A G20/OECD METHODOLOGICAL
FRAMEWORK. 2012, G20.
201. Xenidis, Y. and N. Gkoumas, Risk identification and fuzzy system-based risk analysis for
airport projects, in Safety, Reliability and Risk Analysis. 2013, CRC Press. p. 2095-2102.
202. Sadiq, R., Y. Kleiner, and B. Rajani, Water Quality Failures in Distribution Networks—
Risk Analysis Using Fuzzy Logic and Evidential Reasoning. Risk Analysis, 2007. 27(5):
p. 1381-1394.
203. Akgun, I., A. Kandakoglu, and A.F. Ozok, Fuzzy integrated vulnerability assessment
model for critical facilities in combating the terrorism. Expert Systems with
Applications, 2010. 37(5): p. 3561-3573.
204. Ezell, B., J. Farr, and I. Wiese, Infrastructure Risk Analysis Model. Journal of
Infrastructure Systems, 2000. 6(3): p. 114-117.
205. Aven, T., On how to define, understand and describe risk. Reliability Engineering &
System Safety, 2010. 95(6): p. 623-631.
206. Aven, T., On the new ISO guide on risk management terminology. Reliability
Engineering & System Safety, 2011. 96(7): p. 719-726.
207. Zhou, Q. and V.V. Thai, Fuzzy and grey theories in failure mode and effect analysis for
tanker equipment failure prediction. Safety Science, 2016. 83: p. 74-79.
208. Yang, R.J., An investigation of stakeholder analysis in urban development projects:
Empirical or rationalistic perspectives. International Journal of Project Management,
2014. 32(5): p. 838-849.
209. Doloi, H., Assessing stakeholders' influence on social performance of infrastructure
projects. Facilities, 2012. 30(11): p. 531-550.
210. Parise, S., Knowledge management and human resource development: An application
in social network analysis methods. Advances in Developing Human Resources, 2007.
9(3): p. 359-383.
211. Jung, H.P.S.H.H.E.M.R.J.S.W., Social Network Analysis of Collaborative Ventures for
Overseas Construction Projects. Journal of Construction Engineering and Management,
2011. 137(5).

BIBLIOGRAPHY
Page 276
212. Vechan, E. and E.-A. Islam. Dynamic Social Network Analysis for Infrastructure
Transportation Systems. in Construction Research Congress 2014: Construction in a
Global Network. 2014.
213. Lin, S.-C., An Analysis for Construction Engineering Networks. Journal of Construction
Engineering and Management, 2015. 141(5).
214. Vechan, I.H.E.-a.I.S.A.E., Social Network Analysis Approach for Improved
Transportation Planning. Journal of Infrastructure Systems, 2016. 0(0).
215. Sadri, A.M., S.V. Ukkusuri, and H. Gladwin, The Role of Social Networks and Information
Sources on Hurricane Evacuation Decision Making. Natural Hazards Review, 2017.
0(0).
216. Chambers, R., The origins and practice of participatory rural appraisal. World
development, 1994. 22(7): p. 953-969.
217. Degenne, A. and M. Forse , Introducing social networks. 1999: Sage.
218. Danilovic, M. and T.R. Browning, Managing complex product development projects with
design structure matrices and domain mapping matrices. International journal of
project management, 2007. 25(3): p. 300-314.
219. Lindemann, U., M. Maurer, and T. Braun, Structural complexity management: an
approach for the field of product design. 2008: Springer Science & Business Media.
220. Ravichandran, C. and G.M. Fitzmaurice, To dichotomize or not to dichotomize?
Nutrition, 2008. 24(6): p. 610-611.
221. Thomas, A.C. and J.K. Blitzstein, Valued Ties Tell Fewer Lies, II: Why Not To Dichotomize
Network Edges With Bounded Outdegrees. arXiv preprint arXiv:1101.2228, 2011.
222. Ansell, C., A. Boin, and A. Keller, Managing transboundary crises: Identifying the
building blocks of an effective response system. Journal of Contingencies and Crisis
Management, 2010. 18(4): p. 195-207.
223. Steward, D., The design structure matrix: A method for managing the deisgn of complex
systems. IEEE Transactions on Engineering Management, EM, 1981. 28(3).
224. Browning, T.R., Applying the design structure matrix to system decomposition and
integration problems: a review and new directions. Engineering Management, IEEE
Transactions on, 2001. 48(3): p. 292-306.
225. Everett, M.G. and S.P. Borgatti, The dual-projection approach for two-mode networks.
Social Networks, 2013. 35(2): p. 204-210.

BIBLIOGRAPHY
Page 277
226. Malinick, T.E., D.B. Tindall, and M. Diani, Network centrality and social movement
media coverage: A two-mode network analytic approach. Social Networks, 2013. 35(2):
p. 148-158.
227. Dessavre, D.G., J.E. Ramirez-Marquez, and K. Barker, Multidimensional approach to
complex system resilience analysis. Reliability Engineering & System Safety, 2016. 149:
p. 34-43.
228. Proag, V., Assessing and Measuring Resilience. Procedia Economics and Finance, 2014.
18: p. 222-229.
229. Ingirige, B., et al., Assessing vulnerability, resilience and adaptive capacity of a UK Social
Landlord. International Journal of Disaster Resilience in the Built Environment, 2013.
4(3): p. 287-296.
230. Chatfield, A.T., S.F. Wamba, and H. Tatano. E-government challenge in disaster
evacuation response: The role of RFID technology in building safe and secure local
communities. in System Sciences (HICSS), 2010 43rd Hawaii International Conference
on. 2010. IEEE.
231. Kapucu, N., T. Arslan, and M.L. Collins, Examining intergovernmental and
interorganizational response to catastrophic disasters: Toward a network-centered
approach. Administration & Society, 2010. 42(2): p. 222-247.
232. Theoharidou, M., P. Kotzanikolaou, and D. Gritzalis, A multi-layer Criticality Assessment
methodology based on interdependencies. Computers & Security, 2010. 29(6): p. 643-
658.
233. Ameyaw, E.E. and A.P.C. Chan, Identifying public-private partnership (PPP) risks in
managing water supply projects in Ghana. Journal of Facilities Management, 2013.
11(2): p. 152-182.
234. OECD, Infrastructure to 2030. Telecom, Land transport, Water and Electricity. 2006,
Paris, France: OECD Publishing. 355.
235. Sharma, S.K. and K. Vairavamoorthy, Urban water demand management: prospects and
challenges for the developing countries. Water and Environment Journal, 2009. 23(3):
p. 210-218.
236. Blackmore, J. and R. Plant, Risk and Resilience to Enhance Sustainability with
Application to Urban Water Systems. Journal of Water Resources Planning and
Management, 2008. 134(3): p. 224-233.
BIBLIOGRAPHY
Page 278
237. Karamouz, M., S. Saadati, and A. Ahmadi, Vulnerability Assessment and Risk Reduction
of Water Supply Systems, in World Environmental and Water Resources Congress 2010.
p. 4414-4426.
238. Platon, V., S. Frone, and A. Constantinescu, Financial and Economic Risks to Public
Projects. Procedia Economics and Finance, 2014. 8(0): p. 204-210.
239. Ezell, B., J. Farr, and I. Wiese, Infrastructure Risk Analysis of Municipal Water
Distribution System. Journal of Infrastructure Systems, 2000. 6(3): p. 118-122.
240. Khatri, K. and K. Vairavamoorthy, A New Approach of Risk Analysis for Complex
Infrastructure Systems under Future Uncertainties: A Case of Urban Water Systems, in
Vulnerability, Uncertainty, and Risk. p. 846-856.
241. Bakker, K., Trickle Down? Private sector participation and the pro-poor water supply
debate in Jakarta, Indonesia. Geoforum, 2007. 38(5): p. 855-868.
242. Kodoatie, R.J. and R. Sjarief, Pengelolaan Sumber Daya Air Terpadu. Edisi Revisi ed. Vol.
2. 2008, Yogyakarta: Penerbit ANDI. xii+420.
243. Prihandrijanti, M. and M. Firdayanti, Current Situation and Considerations of Dometic
Wastewater Treatment Systems for Big Cities in Indonesia (Case Study: Sutrabaya and
Bandung). Journal of Water Sustainability, 2011. Volume 1(Issue 2): p. 97-104.
244. Ostojic, D.R., et al., Surabaya, Indonesia, in Energizing Green Cities in Southeast Asia.
2013, The World Bank: Washington DC. p. 139-156.
245. ADB, Experience in River Basin Planning in Indonesia, in River Basing Management
Planing in Indonesia. 2016, Asian Development Bank: Mandaluyong City, Philippines.
p. 186-209.
246. Grafton, R.Q., et al., Water. First ed. Security, Economics and Governance. 2013,
Australia: Tilde Publishing and Distribution.
247. Mays, L.W., Urban water supply management tools. 2004: McGraw-Hill.
248. Mays, L.W., Water resources sustainability. 2007: McGraw-Hill; WEF Press.
249. Zimmerman, R. and J.G. Voeller, Understanding the Implications of Critical
Infrastructure Interdependencies for Water, in Wiley Handbook of Science and
Technology for Homeland Security. 2008, John Wiley & Sons, Inc.
250. Quiggin, J., Uncertainty, Risk, and Water Management in Australia, in Water policy in
Australia: the impact of change and uncertainty, L. Crase, Editor. 2008, Earthscan. p.
61-73.
251. Grafton, R.Q. and K. Hussey, Water Resource Planning and Management. 2011, United
States: Cambridge University Press.

BIBLIOGRAPHY
Page 279
252. Olmstead, S.M., Climate change adaptation and water resource management: A review
of the literature. Energy Economics, (0).
253. Stephenson, D., Water Service Management. 2005, United Kingdom: IWA Publishing.
254. Karamouz, M., A. Moridi, and S. Nazif, Urban Water Engineering and Management.
2010: CRC Press.
255. Means, E., Water 2050: Attributes of Sustainable Water Supply Development, in Toward
a Sustainable Water Future. p. 117-125.
256. Irias, X. and A. Coate, Managing Climate Change Uncertainty in Water Supply Planning,
in Vulnerability, Uncertainty, and Risk. p. 578-586.
257. Lu, J., C. Wang, and T. Huang, Analysis on Seismic Risk of Urban Water Supply System, in
ICPTT 2009. p. 1158-4466.
258. Grigg, N.S., Water, Wastewater, and Stormwater Infrastructure Management. Second
ed. 2012, United States: CRC Press and IWA Publishing. 343.
259. Shammas, N.K. and L.K. Wang, Water supply and wastewater removal. 2011: John
Wiley & Sons.
260. Hurlbert, M., et al., Climate change and water governance in Saskatchewan, Canada.
International Journal of Climate Change Strategies and Management, 2009. 1(2): p.
118-132.
261. Marlow, D.R., et al., Towards sustainable urban water management: A critical
reassessment. Water Research, 2013. 47(20): p. 7150-7161.
262. Ratnayaka, D.D., M.J. Brandt, and K.M. Johnson, Twort's Water Supply. Six ed. 2009,
United Kingdom: Elsevier Lt.
263. Akbar, H.M.D., et al., Community water supply for the urban poor in developing
countries: The case of Dhaka, Bangladesh. Habitat International, 2007. 31(1): p. 24-35.
264. Taylor, P., F.B.A. Hall, and J. Harlin, National Stakeholder Consultations on Water:
Supporting the Post-2015 Development Agenda. 2013, Global Water Partnership, Swiss
Agency for Development and Cooperation, The EUWI (Africa Working Group) and
United Nations Development Programme.: Stockholm, Sweden.
265. Nilsson, D. and E.N. Nyanchaga, Pipes and politics: a century of change and continuity
in Kenyan urban water supply. The Journal of Modern African Studies, 2008. 46(1): p.
133-158.
266. Sangodoyin, A.Y., Water Quality in Pipe Distribution Systems. Environmental
Management and Health, 1993. 4(4): p. 15-20.

BIBLIOGRAPHY
Page 280
267. Approaches to Private Participation in water Services: A Toolkit. 2006, Washington, DC.:
The International bank for Reconstruction and Development.
268. Decker, C.W., Managing water losses in Amman's renovated network: a case study.
Management of Environmental Quality: An International Journal, 2006. 17(1): p. 94-
108.
269. Chan, A.P.C. and E.E. Ameyaw, The private sector's involvement in the water industry of
Ghana. Journal of Engineering, Design and Technology, 2013. 11(3): p. 251-275.
270. Egan, M., Sydney water sector change and industrial water management. Journal of
Accounting & Organizational Change, 2009. 5(2): p. 277-293.
271. Madrigal-Ballestero, R., F. Alpí zar, and A. Schlu ter, Public perceptions of the
performance of community-based drinking water organizations in Costa Rica. Water
Resources and Rural Development, 2013. 1–2(0): p. 43-56.
272. Rao, S. and J. Rasmussen, Technology of Small Community Water Supply Systems in
Developing Countries. Journal of Water Resources Planning and Management, 1987.
113(4): p. 485-497.
273. Martinez, E.C.a.F., Water Supply Systems. State of The Art and Future Trends. 1993,
United Kingdom: Computational Mechanis Publications. 431.
274. Sullivant, J., Strategies for Protecting National Critical Infrastructure Assets. A Focus on
Problem-Solving. 2007, New Jersey: John Wiley & Sons, Inc.
275. Di Cristo, C., A. Leopardi, and G. de Marinis, Water infrastructure protection against
intentional attacks: An experience in Italy. Frontiers of Earth Science, 2011. 5(4): p.
390-399.
276. Grigg, N.S. and J.G. Voeller, Water Infrastructure Interdependencies, in Wiley Handbook
of Science and Technology for Homeland Security. 2008, John Wiley & Sons, Inc.
277. Dawson, G., Women, men and infrastructure development, in Prakarsa Compendium,
C.S. Walker and P. Punjabi, Editors. 2013, Indonesia Infrastructure Initiative: Jakarta.
p. 121-127.
278. Guerrini, A., G. Romano, and B. Campedelli, Factors affecting the performance of water
utility companies. International Journal of Public Sector Management, 2011. 24(6): p.
543-566.
279. Zimmerman, R. and C. Faris, Chapter 4: Infrastructure impacts and adaptation
challenges. Annals of the New York Academy of Sciences, 2010. 1196(1): p. 63-86.

BIBLIOGRAPHY
Page 281
280. Haider, H., R. Sadiq, and S. Tesfamariam, Performance indicators for small- and
medium-sized water supply systems: a review. Environmental Reviews, 2013. 22(1): p.
1-40.
281. Ouyang, M., Review on modeling and simulation of interdependent critical
infrastructure systems. Reliability engineering & System safety, 2014. 121: p. 43-60.
282. Shammas, N.K. and L.K. Wang, Fair, Geyer, and Okun's, Water and Wastewater
Engineering: Water Supply and Wastewater Removal: Water Supply and Wastewater
Removal. 2010: Wiley Global Education.
283. Qatar Water Report - Q2 2011. 2011, Business Monitor International: London. p. 1-53.
284. Biswas, A.K., et al., Water Pricing and Public-Private Partnership. 2005, New York:
Routledge.
285. Kolaczyk, E.D. and P.N. Krivitsky, On the question of effective sample size in network
modeling. arXiv preprint arXiv:1112.0840, 2011.
286. Chinowsky, P., J. Diekmann, and J. O’Brien, Project Organizations as Social Networks.
Journal of Construction Engineering and Management, 2010. 136(4): p. 452-458.
287. Suroso, D.S., O. Abdurahman, and B. Setiawan, Impacts of climate change on the
sustainability of water supply in Indonesia. 2010.
288. Huisman, M. and M.A. Van Duijn, Software for social network analysis. Models and
methods in social network analysis, 2005. 270: p. e316.
289. Sua rez-Lledo , J., The black swan: the impact of the highly improbable. The Academy of
Management Perspectives, 2011. 25(2): p. 87-90.
290. Cameron, P.M.D. and D.P.M.N. Clegg, A strong Britain in an age of uncertainty: the
National Security Strategy. Stationery Office, 2010.
291. Cannon, T. and D. Mu ller-Mahn, Vulnerability, resilience and development discourses in
context of climate change. Natural hazards, 2010. 55(3): p. 621-635.
292. Vale, L.J. and T.J. Campanella, Axiom of Resilience, in The resilient city: How modern
cities recover from disaster. 2005, Oxford University Press. p. 335-353.
293. Bryman, A., Social research methods. 2015: Oxford university press.
294. Srinivasan, V., et al., Climate vulnerability and adaptation of water provisioning in
developing countries: approaches to disciplinary and research-practice integration.
Current Opinion in Environmental Sustainability, 2013. 5(3–4): p. 378-383.
295. Srinivasan, V., et al., The impact of urbanization on water vulnerability: A coupled
human–environment system approach for Chennai, India. Global Environmental
Change, 2013. 23(1): p. 229-239.

BIBLIOGRAPHY
Page 282
296. Eisenhardt, K.M., Building Theories from Case Study Research. The Academy of
Management Review, 1989. 14(4): p. 532-550.

APPENDIX A
Page 283
APPENDIX A
Appendix Lists Fieldwork Funding Letter Plain Language Statement (in English) Plain Language Statement (in Bahasa) Application Letter (in Bahasa)

APPENDIX A
Page 284
-This page intentionally left blank-

APPENDIX A
Page 285
Figure A-1. Fieldwork fund grant letter.

APPENDIX A
Page 286
Figure A-2. Application letter (in Bahasa).
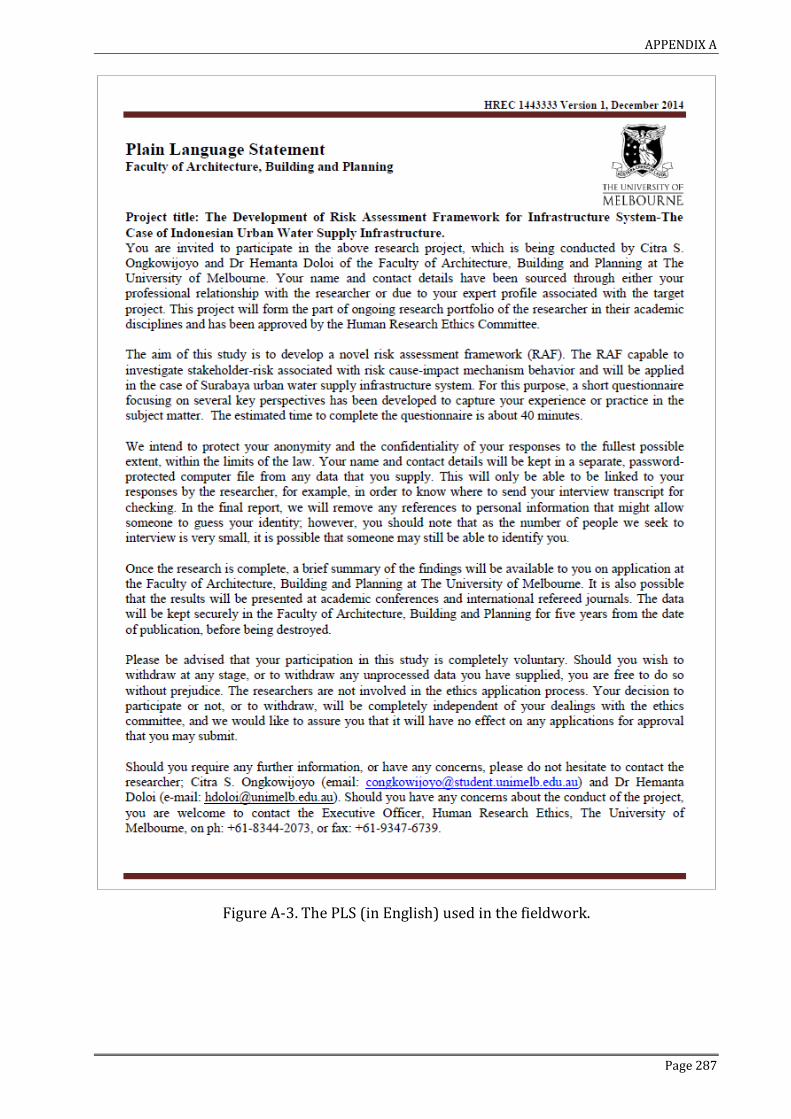
APPENDIX A
Page 287
Figure A-3. The PLS (in English) used in the fieldwork.

APPENDIX A
Page 288
Figure A-4. The PLS (in Bahasa) used in the fieldwork.

APPENDIX B
Page 289
APPENDIX B
Appendix Lists Questionnaire form (English ver.) Questionnaire form (Bahasa ver.) [R-R] Matrix [S-R] Matrix

APPENDIX B
Page 290
-This page intentionally left blank-

APPENDIX B
Page 291
FACULTY OF ARCHITECTURE, BUILDING AND PLANNING
THE UNIVERSITY OF MELBOURNE
QUESTIONAIRE FORM
Research title:
A Conceptual Model for Assessing Risks and Building Resilience for Urban
Infrastructure System: An Indonesian Case
1. Age Group : (1) □ 23~30 Years (2) □31~38 Years (3) □39~46
(4) □ 46~53 Years (5) □54~60 Years (6) □> 61 Years
2. Level of education : (1) □ Bachelor degree (2) □ Master degree
(3) □ Doctorate degree (4) □ Others, (please specify):__________
3. Occupation : (1) □Academia group (2) □Business or Service industry
(3) □ Manufacturing industry (4) □Government functionary
(5) □ Others, (please specify): ____________________________
4. Name of institution (where relevant) : _______________________________________
5. Position (where relevant) : _______________________________________
6. Personal Experience : (1) □ < 5 Years (2) □ 5-10 Years
(3) □11-15Years (4) □15-20 Years
7. Email/phone number : ________________________________________
Part A. Respondent background information
As the initial part of research questionnaire, you are asked to provide a background data about yourself.
Please select the most appropriate answer by giving tick (√) in the blank box. We will maintain the
confidentiality of information provided.
Participant number: (for surveyor only)
Note for participants
This survey intends to get the real data from various stakeholders in conjunction with risk inherent
within urban water supply infrastructure system. The data will then stand as the input in our proposed
framework which talked about the stakeholder-risk associated relationship. Therefore, in order to reach a valid data, minimize the mistake and misconception, please read carefully all of the instruction which
before you continue and answer in every part of this questionnaire.

APPENDIX B
Page 292
Risk event Risk decision variable
Nature risk R1. Climate change. The climate change refers to the change in regional climate patterns, in particular a change apparent from the mid to late 20th century onwards and attributed largely to the increased levels of atmospheric carbon dioxide produced by the use of fossil fuels. In Indonesia context potential regional impacts of climate change could include; increased frequency and magnitude of droughts and floods, and long-term changes in mean renewable water supplies through changes in precipitation, temperature, humidity, wind intensity, duration of accumulated snowpack, nature and extent of vegetation, soil moisture, and runoff.
O = 1 – 2 – 3 – 4 – 5 – 6 – 7 – 8 – 9 – 10
S = 1 – 2 – 3 – 4 – 5 – 6 – 7 – 8 – 9 – 10
D = 1 – 2 – 3 – 4 – 5 – 6 – 7 – 8 – 9 – 10
R2. Natural disasters. Natural disasters (act of god) can be describes as the non-man-made risk. The things that beyond human control which can be quantified such as; earthquake, flooding-river, flash, dam break, wind-hurricanes, waterborne disease, drought, other severe weather-cold, heat, high winds, lighting, prolonged dry and rainy season (which affecting the river water runoff from other upstream regions).
O = 1 – 2 – 3 – 4 – 5 – 6 – 7 – 8 – 9 – 10
S = 1 – 2 – 3 – 4 – 5 – 6 – 7 – 8 – 9 – 10
D = 1 – 2 – 3 – 4 – 5 – 6 – 7 – 8 – 9 – 10
R3. Water scarcity (shortage). Two dimensions of water scarcity; demand-driven water stress where there is a high usage compared to the availability of water and, population-driven water shortage: where there are many people dependent on the availability of water. In Surabaya city context, the water scarcity happened during the dry season which gives constraints to the water treatment processes and thus reducing the supply volume of clean water to the community.
O = 1 – 2 – 3 – 4 – 5 – 6 – 7 – 8 – 9 – 10
S = 1 – 2 – 3 – 4 – 5 – 6 – 7 – 8 – 9 – 10
D = 1 – 2 – 3 – 4 – 5 – 6 – 7 – 8 – 9 – 10
R4. Idle land exploitation. The dynamic of modern society has been forced for urban water supply service to provide a vast and safe water supply services. The service includes expanding the water supply infrastructure within specific region and, thus allowing the risk of difficulty in controlling the land. The urban water supply infrastructure will mostly, utilize the region’s both underground and ground by which touch the environmental aspect.
O = 1 – 2 – 3 – 4 – 5 – 6 – 7 – 8 – 9 – 10
S = 1 – 2 – 3 – 4 – 5 – 6 – 7 – 8 – 9 – 10
D = 1 – 2 – 3 – 4 – 5 – 6 – 7 – 8 – 9 – 10 R5. Pollution and contamination. As settlements quickly expanded, society grew into catchments and close to water sources, eventually polluting the supply and forcing a search for newer supplies of potable water beyond the town limits. In Surabaya city context, a pollution and contamination is a major environmental issue. In fact, pollution and contamination not just generated from industry waste but also community is self, such as; littering, treating river as communal space for washing and bathing which aggravates the condition and quality of Surabaya river.
O = 1 – 2 – 3 – 4 – 5 – 6 – 7 – 8 – 9 – 10
S = 1 – 2 – 3 – 4 – 5 – 6 – 7 – 8 – 9 – 10
D = 1 – 2 – 3 – 4 – 5 – 6 – 7 – 8 – 9 – 10
Part B. Risk magnitude analysis for urban water supply infrastructure risks.
Based on your perception, please fill the most appropriate answer by circling the 10-point of Likert scale for each of O, S and D. The definition for O, S and D, and the Likert scale definition (and its understanding) can be described below;
Occurrence (O) refers to the likelihood that the hazard will be occurred.
Almost never 1 2 3 4 5 6 7 8 9 10 Almost certain
Severity (S) indicates how high the hazard impact will affect.
None 1 2 3 4 5 6 7 8 9 10 Hazardous without warning
Detectability (D) refers to the probability not to detect the existence of hazard.
Almost certain 1 2 3 4 5 6 7 8 9 10 Absolutely uncertain

APPENDIX B
Page 293
Social risk R6. Demand uncertainty. Variations of supply and demand depends on many factors whose laws of variation are uncertain, for instance the increase in population (Supplies were in precarious balance with demand which affected by the water losses, leakage and wastage risks; The changing and increasing of domestic and non-domestic leads on consumption and demand behavior for public water). Fuzziness of water rights and unclear water accounting is linked to a tendency of over-allocating water to satisfy more water users, because of unclear pictures of supplies; Unrealistic planning with disaster requirements beyond the reach of local government.
O = 1 – 2 – 3 – 4 – 5 – 6 – 7 – 8 – 9 – 10
S = 1 – 2 – 3 – 4 – 5 – 6 – 7 – 8 – 9 – 10
D = 1 – 2 – 3 – 4 – 5 – 6 – 7 – 8 – 9 – 10
R7. Water misuse. Water misuse has been known for long time in some regions as a crime action. The example of water misuse in Surabaya city, such as; an illegal activity building water connection without proper license; manipulate water meter instrument; and, arbitrarily, improper and excessive use of water. Another effect and consequences of this risk is that, this risk not only affect the fire pressure (water loss) of the water and services within one network region of community, but also contribute to the deteriorating of the physical infrastructure and urban development deprivation.
O = 1 – 2 – 3 – 4 – 5 – 6 – 7 – 8 – 9 – 10
S = 1 – 2 – 3 – 4 – 5 – 6 – 7 – 8 – 9 – 10
D = 1 – 2 – 3 – 4 – 5 – 6 – 7 – 8 – 9 – 10
R8. Limited access to clean water. In Surabaya city context, access to the water may be uneven due to socio-economic inequalities. In keeping with its high levels of coverage, most areas of Surabaya are already served by the piped water system, and many households have individual connections. However, there are still some pockets of un-served areas that belong to the lowest income brackets. Many of these poor households are unable to afford the steep connection fee, which includes the cost of tertiary network expansion. In addition, some segments of the urban poor population are unable to furnish the legal documentation required by the utility for the provision of individual connections. In the absence of piped supply, these households relying on a combination of water from neighbors, purchased from vendors or small scale independent providers, and free well water. However, much of the water from these sources is expensive and contaminated.
O = 1 – 2 – 3 – 4 – 5 – 6 – 7 – 8 – 9 – 10
S = 1 – 2 – 3 – 4 – 5 – 6 – 7 – 8 – 9 – 10
D = 1 – 2 – 3 – 4 – 5 – 6 – 7 – 8 – 9 – 10
R9. Payment problem. Unpaid water service creates on the water market, financial and economic risk. Willingness to pay for water still low for some region (delay payment and further not paying). Some people are becoming more reluctant to pay the necessary changes. In some area, the ability to pay and the desire for good services are underestimated. In Surabaya city, the common case happened in terms of payment problem is more like; late payment made by the consumer/customer, and the water use bill problem.
O = 1 – 2 – 3 – 4 – 5 – 6 – 7 – 8 – 9 – 10
S = 1 – 2 – 3 – 4 – 5 – 6 – 7 – 8 – 9 – 10
D = 1 – 2 – 3 – 4 – 5 – 6 – 7 – 8 – 9 – 10
R10. Community rejection. In many countries, customer have experienced several attempted reforms in which tariffs were increased, but service did not improve. Complexities within UWS system (especially in Surabaya city case) involved with obtaining community acceptance of alternative water supply solutions. In some cases, community reluctant or event reject the solution of specific problems provided either by the regional water supply company or other government agencies
O = 1 – 2 – 3 – 4 – 5 – 6 – 7 – 8 – 9 – 10
S = 1 – 2 – 3 – 4 – 5 – 6 – 7 – 8 – 9 – 10
D = 1 – 2 – 3 – 4 – 5 – 6 – 7 – 8 – 9 – 10 R11. Population growth & urbanization problem. As a metropolitan city, population growth and urbanization contributes to the uncertain of supply and demand trends in Surabaya, incriminating the water supply infrastructure system. The population growth (and the dynamic of urbanization pattern) leads on water consumption rose, both in total amount needed and in per capita demand. Further, this risk leads to the changes of society behavior on how to treat the water demand. This risk event is tightly related with uncertain water demand (and supply) trends risk event.
O = 1 – 2 – 3 – 4 – 5 – 6 – 7 – 8 – 9 – 10
S = 1 – 2 – 3 – 4 – 5 – 6 – 7 – 8 – 9 – 10
D = 1 – 2 – 3 – 4 – 5 – 6 – 7 – 8 – 9 – 10
R12. Sabotage to physical infrastructure. In Indonesia, water supply infrastructure system protected by the constitution law. Physical attack or sabotage in Surabaya water supply infrastructure can be classified as criminal act. The example of sabotage to physical infrastructure of water supply in Surabaya; vandalism act towards water supply system, illegal act by
O = 1 – 2 – 3 – 4 – 5 – 6 – 7 – 8 – 9 – 10
S = 1 – 2 – 3 – 4 – 5 – 6 – 7 – 8 – 9 – 10

APPENDIX B
Page 294
adding chemical or biological agents into water treatment (including post-treatment facilities) and distribution systems, technical system destruction, unexplained cutting of utility fences and damage to storages and water contaminants on utility property. Further, a number cases such as water meter, other fittings and tools theft often occurred
D = 1 – 2 – 3 – 4 – 5 – 6 – 7 – 8 – 9 – 10
Political risk R13. Uncertain political behavior. This risk refers to the water supply service disturbances which occurred due to; the dynamic of both local and national political movement, obscurity happened on the cooperation agreement and tasks among various agencies, and bad decision making as well as low commitment among various agencies towards laws and regulations that applied. Further, this risk refers to the conflict which leads to the delay in the development of water supply infrastructure system, lack of requirements specification and low priority given to society interest.
O = 1 – 2 – 3 – 4 – 5 – 6 – 7 – 8 – 9 – 10
S = 1 – 2 – 3 – 4 – 5 – 6 – 7 – 8 – 9 – 10
D = 1 – 2 – 3 – 4 – 5 – 6 – 7 – 8 – 9 – 10
R14. Limited public participation. Since water supply infrastructure in Surabaya solely handled by the regional water supply company, the public participation in decision making are not taking place at all. Based on interview obtained from various stakeholder groups, the limited public participation caused by several factors, such as; there is a barrier between community with authorities/ high-level politician in terms of communication. The public interest is not prioritized by the authority, the public interest and authority point of view is disparate, the decision making decided by the politician (and the authority) are not clear and lack of transparency and accountability. Further, the decision making towards infrastructure development usually conducted without involving community consideration.
O = 1 – 2 – 3 – 4 – 5 – 6 – 7 – 8 – 9 – 10
S = 1 – 2 – 3 – 4 – 5 – 6 – 7 – 8 – 9 – 10
D = 1 – 2 – 3 – 4 – 5 – 6 – 7 – 8 – 9 – 10
R15. Changes in government policy. The water supply sector has a legal and regulation to run the appropriate work under the government policy and rules where the term of contract management stand as the basic and core value to the way of delivering safe and clean water to community. However, the existence of policy uncertainty leads to the water quality standards shifting, the obscurity towards the allocation of clean water quantity distribution, lack of authority accountability which results on the declining of public confidence towards the government policy changes (e.g., changes in customer tariffs, an administration and non-administration rules)
O = 1 – 2 – 3 – 4 – 5 – 6 – 7 – 8 – 9 – 10
S = 1 – 2 – 3 – 4 – 5 – 6 – 7 – 8 – 9 – 10
D = 1 – 2 – 3 – 4 – 5 – 6 – 7 – 8 – 9 – 10
R16. Obscurity on government. Typical risk event which are taken into consideration here refers to the mediocre governance of the existing legal and regulatory framework for the provision of water supply by the government, the incoherence of national and regional legal method of resolving disputes, such as those related to the enforceability of legal provisions. Another example for this risk, such as; the ambiguous towards the basic framework of laws, regulations and provisions which applied towards the water supply empowerment, treatment and distribution to the community. Importantly, this risk emerges because of the incoherence between methods and implementation of law and regulation by the authorities and agency bodies in terms of dispute resolution
O = 1 – 2 – 3 – 4 – 5 – 6 – 7 – 8 – 9 – 10
S = 1 – 2 – 3 – 4 – 5 – 6 – 7 – 8 – 9 – 10
D = 1 – 2 – 3 – 4 – 5 – 6 – 7 – 8 – 9 – 10
Technical and operational risk R17. Insufficient non-technical service provision. The example of this risk event can be described as; the decreasing of non-technical service provision in terms of delivering solution towards public demand and complaints on the water supply service, the customer service division irreverent and lack of competency (unable) dealing with customer complaints, public problems and complaints are handled very slow, long process and complicated (tricky)
O = 1 – 2 – 3 – 4 – 5 – 6 – 7 – 8 – 9 – 10
S = 1 – 2 – 3 – 4 – 5 – 6 – 7 – 8 – 9 – 10
D = 1 – 2 – 3 – 4 – 5 – 6 – 7 – 8 – 9 – 10 R18. Water quality defective. The problem with water quality can be described as; a poor quality of distributed clean water by the regional water supply company, the color of clean water is not clear (turbid), unearthly clean water taste and an odor within the water. It is also found that the water supplied to the community contained with residual disinfectant, microbial
O = 1 – 2 – 3 – 4 – 5 – 6 – 7 – 8 – 9 – 10
S = 1 – 2 – 3 – 4 – 5 – 6 – 7 – 8 – 9 – 10

APPENDIX B
Page 295
growth, sediment, substances and dirt D = 1 – 2 – 3 – 4 – 5 – 6 – 7 – 8 – 9 – 10 R19. Trouble in water transmission and distribution network. This risk event refers to; the disorderly condition of elements of water distribution networks, limited transportation capacity of the system in relation to real needs (i.e., the needs which exceeding/overwhelm the planned distribution system capacity). Unless the distribution systems improve, the water may still have questionable taste, odor, color, sediment, and corrosivity
O = 1 – 2 – 3 – 4 – 5 – 6 – 7 – 8 – 9 – 10
S = 1 – 2 – 3 – 4 – 5 – 6 – 7 – 8 – 9 – 10
D = 1 – 2 – 3 – 4 – 5 – 6 – 7 – 8 – 9 – 10 R20. Mechanical (physical) component failure. The failure of individual mechanical network components related to the water treatment processing, storage, and distribution to the community. For instances; pumps, pipes, connections and joints, meters, panels and valves, and another component accessories
O = 1 – 2 – 3 – 4 – 5 – 6 – 7 – 8 – 9 – 10
S = 1 – 2 – 3 – 4 – 5 – 6 – 7 – 8 – 9 – 10
D = 1 – 2 – 3 – 4 – 5 – 6 – 7 – 8 – 9 – 10 R21. Under rate maintenance. Under rate maintenance refers to the physical infrastructure not being maintained following the undue period. The problem of the maintenance including; the calibration and replacement of physical checking carried out under the standard regulation, maintenance does not get any priority and lack of attention (tend to be underestimated)
O = 1 – 2 – 3 – 4 – 5 – 6 – 7 – 8 – 9 – 10
S = 1 – 2 – 3 – 4 – 5 – 6 – 7 – 8 – 9 – 10
D = 1 – 2 – 3 – 4 – 5 – 6 – 7 – 8 – 9 – 10 R22. Physical infrastructure decay. This risk refers to an old and vulnerable physical infrastructure due to the aging factor (deterioration). In fact, Surabaya water supply physical infrastructure mainly has been built in the Dutch colonial era (some of the physical system approaching 100 years old). Surabaya water supply physical system (pumps, pipes, connections and joints, meters, panels and valves) have exceeded the anticipated “useful life-time” (the permitted limit time)
O = 1 – 2 – 3 – 4 – 5 – 6 – 7 – 8 – 9 – 10
S = 1 – 2 – 3 – 4 – 5 – 6 – 7 – 8 – 9 – 10
D = 1 – 2 – 3 – 4 – 5 – 6 – 7 – 8 – 9 – 10 R23. Lack of technical service provision. The customer service and technical service department of authority or government agency takes very long to respond to customer’s problems and complaints. The origin and example of this risk event can be explained as; the technical service department of authority lack of technicians in the field, the technician lack the ability to understand the problem on site and thus cannot take the proper action, lack of investing on the modern technology to perform technical service and maintenance tasks, and technicians still prefer to do the task using traditional methods and technology rather than modern technology. Further, the authorities lack of finding solutions in terms of accessing the inaccessible areas for developing the water supply infrastructure system.
O = 1 – 2 – 3 – 4 – 5 – 6 – 7 – 8 – 9 – 10
S = 1 – 2 – 3 – 4 – 5 – 6 – 7 – 8 – 9 – 10
D = 1 – 2 – 3 – 4 – 5 – 6 – 7 – 8 – 9 – 10
R24. Water loss (NRW). Water loss or Non-Revenue Water (NRW) is one of the major issues in water supply management studies. The NRW problem cannot be easily assessed, however the NRW occurs because of several things, such as; a leakage within distribution pipe (premiere, secondary and tertiary), leakage within piping connection or joint system, water theft by the customer or non-customer.
O = 1 – 2 – 3 – 4 – 5 – 6 – 7 – 8 – 9 – 10
S = 1 – 2 – 3 – 4 – 5 – 6 – 7 – 8 – 9 – 10
D = 1 – 2 – 3 – 4 – 5 – 6 – 7 – 8 – 9 – 10
R25. Disturbance from another supporting infrastructure. In terms of treating, processing and delivering water to the community, respective authority rely or depend on another ‘supporting’ infrastructure (e.g., transportation, banking and finance, gas and oil, information and technology and electric power). A single disturbance on supporting infrastructure to water supply infrastructure system resulting in service interruption. For instances; without gas and transportation infrastructure PDAM cannot transmit the water by using water tankers to several water-problem (or non-piped water) areas in Surabaya, a disruption on electricity infrastructure system PDAM hampered the processes (mainly rely on the electricity and information technology) of treating and distributing clean water to community
O = 1 – 2 – 3 – 4 – 5 – 6 – 7 – 8 – 9 – 10
S = 1 – 2 – 3 – 4 – 5 – 6 – 7 – 8 – 9 – 10
D = 1 – 2 – 3 – 4 – 5 – 6 – 7 – 8 – 9 – 10
Economic risk

APPENDIX B
Page 296
R26. Interest rates instability. Interest is the cost of borrowing money. It is a function of the unrepaid principal and is expressed as a percentage per year. Interest rates instability affecting many aspects. For instance; based on regional water supply company (Perusahaan Daerah Air Minum-PDAM Surya Sembada) experts acknowledges the process of treating water is affected by the interest rate instability. The wide range of chemical materials required to treat the raw water into clean water which cannot be easily obtained has a sensitive price following the interest rate value. Thus, the price of various chemical materials is affected by the changes of interest rate. Unpredictable variation in interest rates results in an unstable and susceptible economy
O = 1 – 2 – 3 – 4 – 5 – 6 – 7 – 8 – 9 – 10
S = 1 – 2 – 3 – 4 – 5 – 6 – 7 – 8 – 9 – 10
D = 1 – 2 – 3 – 4 – 5 – 6 – 7 – 8 – 9 – 10
R27. Foreign exchange rates instability. Exchange rate risk comes from unpredictable variation in the exchange rate. Currency risk affects the value of the business through several mechanisms, which are; operational costs, maintenance and construction costs, and finance costs. Unpredictable variation in exchange rates results in an unstable and susceptible economy. One impact of this risk in Surabaya water supply infrastructure system is the increment of water supply fare which charged to the community.
O = 1 – 2 – 3 – 4 – 5 – 6 – 7 – 8 – 9 – 10
S = 1 – 2 – 3 – 4 – 5 – 6 – 7 – 8 – 9 – 10
D = 1 – 2 – 3 – 4 – 5 – 6 – 7 – 8 – 9 – 10
R28. Poor infrastructure investment. The shortage of investment towards Indonesian infrastructure system development in the case of urban water supply system has been acknowledged by a number of studies. This means that infrastructure system upgrades get deferred and the backlog of investment needs grows. The cause of poor infrastructure investment in Indonesia can be explained as follows, but not limited to; lack of adaptive and long-term planning towards constructing and developing the Surabaya water supply infrastructure system by the authorities, lack of coordination and complexity between various public institutions in terms of developing infrastructure system, distrust of both domestic and foreign investors toward making decision to invest in Indonesia infrastructure development program
O = 1 – 2 – 3 – 4 – 5 – 6 – 7 – 8 – 9 – 10
S = 1 – 2 – 3 – 4 – 5 – 6 – 7 – 8 – 9 – 10
D = 1 – 2 – 3 – 4 – 5 – 6 – 7 – 8 – 9 – 10
R29. Inflation hazard. Almost all of the water supply sectors in Indonesia have been funded under massive loan agreement. The inflation hazard gives entirety impact not just to economy and financial aspect but also to the service provided by the regional water supply company (Perusahaan Daerah Air Minum-PDAM Surya Sembada) delivering reliable, continuous, reasonable and affordable price, and high quality clean water to the customers. Further, the inflation hazard affects whole of the stakeholders in the form of different impact levels. The inflation hazard related to Indonesian urban water supply infrastructure system can be seen in
O = 1 – 2 – 3 – 4 – 5 – 6 – 7 – 8 – 9 – 10
S = 1 – 2 – 3 – 4 – 5 – 6 – 7 – 8 – 9 – 10
D = 1 – 2 – 3 – 4 – 5 – 6 – 7 – 8 – 9 – 10
R30. The failure of price stabilization. In Indonesia context, the regional water supply enterprises are owned by the local government (Badan Usaha Milik Daerah-BUMD Surabaya). This means, that every single region (mainly city/district) has their own regional water supply company which have the authority to form the policies and rules (including the water price adjustment) in terms of providing water supply service and management. Even though the water price in Surabaya city is relatively stable, nonetheless, this hazard issue is considered as big issue that should get an attention from various scholars
O = 1 – 2 – 3 – 4 – 5 – 6 – 7 – 8 – 9 – 10
S = 1 – 2 – 3 – 4 – 5 – 6 – 7 – 8 – 9 – 10
D = 1 – 2 – 3 – 4 – 5 – 6 – 7 – 8 – 9 – 10

APPENDIX B
Page 297
Part C. Respondent position as stakeholder within urban water supply infrastructure
Please choose one stakeholder category which describes and represent you the best as the stakeholder group
within community. Tick (√, just one) in the left blank box towards your choice.
Stakeholder group Stakeholder description
G1. Brantas river basin
management
agency.
The national Brantas river basin management agency formed under the Directorate General
of water resource responsibility. It is one of the governmental institution for water resource
management in the context of managing ‘only’ the national strategic river. Further, it has a
duty to manage the water resource in terms of basin region which also cover; planning,
construction, operation and maintenance, in the context of; conservation and utilization of water resources, controlling water damage to the rivers, lakes, reservoirs, dams and other
types of water reservoirs, irrigation, ground water, raw water, marsh, ponds and beaches.
G2. State public works
department.
The state public works service (Dinas Pekerjaan Umum-PU) has a duty of; management,
assessment and makeing significant decisions regarding the development of; (i) Building
infrastructure (Cipta Karya dan Tata Ruang), (ii) Roadway infrastructure (Bina Marga) and
(iii) Irrigation and watering infrastructure respectively in the province (state) level
(Pematusan). Furthermore, PU has a responsibility to coordinate, assess and work together
with other PU department as well as with the Surabaya city government towards the
development of water supply infrastructure system.
P1. Jasa Tirta-I public
corportation.
Jasa Tirta-1 Public Corporation (PJT-1) provides bulk water for industry, agriculture,
flushing, port, electric power generation and others, (ii) provide water power to generate
electricity for the state electricity company, (iii) generate and distribute electric power and clean water, perform consulting in water resources fields, heavy equipment rental and water
quality laboratory services, and (iv) develop other water-related services including piped
domestic supply at specified scales.
G3. Surabaya city
government.
The Surabaya city government is an important stakeholder for Surabaya water supply
infrastructure either as the owner of regional water supply enterprise, clean water user, public
counseling, licensing services, public information providers, and the DM related to the
Surabaya community interest. Importantly, Surabaya city government plays a crucial role for
the Surabaya city development in building a good connection and coordination with BBWS,
several state government of PU departments, PJT-1, and the regional water supply enterprises
towards the development of UI.
P2. Regional water
supply enterprise.
Substantially, the PDAM Surya Sembada has a responsibility to continuously supply a reliable a high-quality water for the society. The responsibility includes, but not limited to; treating
bulk raw water to be a high quality clean water, distribute the clean water to the society, plan
and build a water distribution network system. Accordingly, PDAM has the responsibility to
maintain the level and ability for supplying clean water continuously to society with
affordable quality and prices includes satisfying service provision.
M1. Industry and
business.
The stakeholder group who has a high dependency towards the big quantity supply of clean
water in order to sustain their business. This industry group refers to the state-owned, joint
venture, public-owned or even private business entity whose rely heavily on the continuity of
inviolable domestic water services (massive quantity) to promote their business.
M2. Commercial and, or
public space.
A general, public space or commercial sector which managed by public or private institution
and stand as both regular clean water customer and user. For instance; park, public toilet,
worship place, public squares, public library, university, department store, school and office building, swimming pool, single management-based housing (apartment and condominium),
hotel, restaurant, and exhibition hall.
M3. Domestic end user.
The domestic end user group is either an individual or group in respective residence or
dwelling area in Surabaya city as a regular customer towards clean water end user to support
their daily activity. This stakeholder group is the society and, or group of laypeople who rely
on the domestic UWS infrastructure service to support their daily life.

APPENDIX B
Page 298
Part D. Information exchange between stakeholders related to the stakeholder-risk associated.
1. Please choose the risk event that you personally think threating/affecting you by ticking (√) in the
second (“Affected”) column as many risk events as you wish.
2. Based on the point 1 above, for each risk event you choose, determine other stakeholder groups
that you think also impacted/ affected by each of your risk. Note: Both risk events and the stakeholder groups are refers to part B and C respectively.
Risk ID
Affected by:
G1 G2 P1 G3 P2 M1 M2 M3
R1 R2 R3 R4 R5
Risk ID
Affected by:
G1 G2 P1 G3 P2 M1 M2 M3
R6 R7 R8 R9
R10 R11 R12
Risk ID
Affected by:
G1 G2 P1 G3 P2 M1 M2 M3
R13 R14 R15 R16
Risk ID
Affected by:
G1 G2 P1 G3 P2 M1 M2 M3
R17 R18 R19 R20 R21 R22 R23 R24 R25
Risk ID
Affected by:
G1 G2 P1 G3 P2 M1 M2 M3
R26 R27 R28 R29 R30

APPENDIX B
Page 299
Part E. Critics and suggestion
Thank you, your participation will give a huge contribute to the further path of this research processes.

APPENDIX B
Page 300
QUESTIONAIRE APPENDIX
Tabel 1. Probability of occurrences (O), failure rate description and rating scale.
Probability of occurrence Possible failure rate Rating Almost certain ≥1/2 10 Very High 1/3 9 High 1/8 8 Moderate high 1/20 7 Moderate 1/80 6 Moderately low 1/400 5 Low 1/2000 4 Slight 1/15.000 3 Remote 1/150.000 2 Almost never 1/1.500.000 1
Table 2. Severity (S), effect description and rating scale.
Effect Severity of Effect Rating Hazardous without warning
Hazardous effect and safety related when a potential failure mode effects safe system operation without warning
10
Hazardous with warning
Serious effect and product must stop when a potential failure mode affect safe system operation with warning
9
Very high Very high effect and product inoperable 8 High High effect on product performance with equipment damage 7 Moderate Moderate effect on product performance with minor damage 6 Low Low effect on product performance 5 Very low Very low effect on product performance 4 Minor Slight effect on product performance 3 Very minor Very slight effect on product performance 2 None No effect 1
Table 3. Detectability (D), criteria description and rating scale.
Detectability Criteria (Detection-%) Rating
Absolutely impossible Design control will not and/or cannot detect a potential cause/mechanism and subsequent failure mode; or there is no design control (0-5%)
10
Very remote Very remote chance the design control will detect a potential cause/mechanism and subsequent failure mode (6-15%)
9
Remote Remote chance the design control will detect a potential cause/mechanism and subsequent failure mode (16-25%)
8
Very low Very Low chance the design control will detect a potential cause/mechanism and subsequent failure mode (26-35%)
7
Low Low chance the design control will detect a potential cause/mechanism and subsequent failure mode (36-45)
6
Moderate Moderate chance the design control will detect a potential cause/mechanism and subsequent failure mode (46-55)
5
Moderately high Moderately high chance the design control will detect a potential cause/mechanism and subsequent failure mode (56-65)
4
High High chance the design control will detect a potential cause/mechanism and subsequent failure mode (66-75)
3
Very high Very High chance the design control will detect a potential cause/mechanism and subsequent failure mode (76-85)
2
Almost certain Design control will almost certainly detect a potential cause/mechanism and subsequent failure mode (86-100)
1

APPENDIX B
Page 301
FACULTY OF ARCHITECTURE, BUILDING AND PLANNING
THE UNIVERSITY OF MELBOURNE
FORM KUESIONER
Judul Penelitian:
Model Konseptual untuk Menilai Resiko dan Membangun Ketahanan Sistem
Infrastruktur Perkotaan: Studi Kasus Indonesia
1. Golongan umur : (1) □ 23~30 Tahun (2) □31~38 Tahun (3) □39~46 Tahun
(4) □ 46~53 Tahun (5) □54~60 Tahun (6) □> 61 Tahun
2. Tingkat pendidikan : (1) □ Sarjana (2) □ Magister
(3) □ Doktoral (4) □ Lain-lain, (sebutkan):____________________
3. Pekerjaan : (1) □ Akademisi/pendidikan (2) □ Bisnis atau industry jasa
(3) □ Industri manufaktur (4) □ Fungsionaris pemerintah
(5) □ Lain-lain, (sebutkan): ____________________________
4. Nama institusi (apabila relevan) : _______________________________________
5. Posisi (apabila relevan) : _______________________________________
6. Pengalaman kerja : (1) □ < 5 Tahun (2) □ 5-10 Tahun
(3) □11-15 Tahun (4) □15-20 Tahun
7. Email/nomor telepon : ________________________________________
Bagian A. latar belakang responden
Pada bagian awal kuesioner ini, anda diminta untuk memberikan informasi mengenai diri anda. Jawablah
pertanyaan dibawah ini dengan memberikan tanda cawang (√) pada kotak yang disediakan serta isilah
jawaban pada tempat yang telah disediakan. yang sesuai dengan diri anda Kami akan memastikan
kerahasiaan dari pada segala informasi anda berikan kepada kami.
Nomor partisipan: (for surveyor only)
Catatan untuk reponden
Survei ini ditujukan untuk mendapatkan data sebenar-benarnya dari stakeholder yang berbeda dalam
hal risiko dalam system infrastruktur air minum perkotaan. Hasil kuesioner akan menjadi input dalam
framework riset ini yang mana membahas soal hubungan stakeholder dengan risiko. Oleh karena itu, untuk mendapatkan data yang valid, meminimalisasi kesalahan dan ketidaksamaan pemahaman, bacalah
instruksi yang tertera pada bagian awal tiap-tiap bagian kuesioner ini.

APPENDIX B
Page 302
Daftar risiko Variabel risiko
Risiko alam
R1. Perubahan iklim (cuaca). Hujan berkepanjangan diluar waktu pada umumnya, musim panas dan kemarau berkepanjangan
menyebabkan; perubahan suhu, kelembaban, perubahan intensitas angin, tingkat vegetasi, kelembaban tanah dan limpasan serta
perubahan (penurunan) kualitas air baku.
O = 1 – 2 – 3 – 4 – 5 – 6 – 7 – 8 – 9 – 10
S = 1 – 2 – 3 – 4 – 5 – 6 – 7 – 8 – 9 – 10
D = 1 – 2 – 3 – 4 – 5 – 6 – 7 – 8 – 9 – 10
R2. Bencana alam. Kejadian yang mempengaruhi segala aktivitas sistem penyediaan air minum yang berada diluar
jangkauan manusia. Contoh: Gempa bumi, banjir, kerusakan sistem bendungan, serangan kilat, badai angin, tornado, penyakit
menular melalui air minum, kebakaran hutan, badai api, tanah longsor semburan lumpur, lahar, hujan abu dan peperangan.
O = 1 – 2 – 3 – 4 – 5 – 6 – 7 – 8 – 9 – 10
S = 1 – 2 – 3 – 4 – 5 – 6 – 7 – 8 – 9 – 10
D = 1 – 2 – 3 – 4 – 5 – 6 – 7 – 8 – 9 – 10
R3. Kelangkaan air minum. Debit menurun drastis, tidak tersedianya tekanan dalam sistem pendistribusian air minum,
tidak ada air yang keluar dari sistem distribusi, terjadinya kekeringan/kekurangan air baku sebagai bahan utama air minum perkotaan, adanya permintaan pengguna air minum jauh lebih tinggi dari pada kapasitas produksi, ketersediaan simpanan dan
cadangan air minum, kapasitas produksi air minum oleh pihak yang berwenang dibawah jumlah permintaan masyarakat.
O = 1 – 2 – 3 – 4 – 5 – 6 – 7 – 8 – 9 – 10
S = 1 – 2 – 3 – 4 – 5 – 6 – 7 – 8 – 9 – 10
D = 1 – 2 – 3 – 4 – 5 – 6 – 7 – 8 – 9 – 10
R4. Exploitasi lahan tidur berlebihan/ tak terkendali. Dalam proses pengembangan infrastruktur penyediaan air minum perkotaan,
risiko exploitasi, penggunaan dan pengalihgunaan lahan tidur semakin besar (dikarenakan juga oleh faktor pertumbuhan populasi
penduduk dan perubahan pola urbanisasi). Hal tersebut berdampak negatif terhadap lingkungan (polusi ke aquifer, gangguan
lingkungan dan kontaminasi sungai dan, atau daerah tangkapan air.
O = 1 – 2 – 3 – 4 – 5 – 6 – 7 – 8 – 9 – 10
S = 1 – 2 – 3 – 4 – 5 – 6 – 7 – 8 – 9 – 10
D = 1 – 2 – 3 – 4 – 5 – 6 – 7 – 8 – 9 – 10 R5. Polusi dan kontaminasi. Masyarakat dan industri bermukim didaerah tangkapan air (sumber air baku) yang menjadi bahan baku
olahan untuk air minum bagi masyarakat, pembuang sampah sembarangan di wilayah tangkapan air, pembuangan hajat, pembuangan limbah dari industri dan perumahan secara liar yang berdampak pada pencemaran wilayah tangkapan air.
O = 1 – 2 – 3 – 4 – 5 – 6 – 7 – 8 – 9 – 10
S = 1 – 2 – 3 – 4 – 5 – 6 – 7 – 8 – 9 – 10
D = 1 – 2 – 3 – 4 – 5 – 6 – 7 – 8 – 9 – 10 Risiko sosial
R6. Ketidakjelasan jumlah permintaan air bersih. Dinamika jumlah permintaan masyarakat akan air minum yang disebabkan oleh;
perubahan jumlah populasi penduduk, kapasitas instalasi pengolahan dan produksi air minum yang bersifat fluktuatif, risiko kebocoran
dan kehilangan air minum yang relatif susah untuk diketahui, berubahnya pola konsumsi air minum masyarakat domestik maupun non-
O = 1 – 2 – 3 – 4 – 5 – 6 – 7 – 8 – 9 – 10
S = 1 – 2 – 3 – 4 – 5 – 6 – 7 – 8 – 9 – 10
Bagian B. Analisa besaran resiko pada sistem infrastruktur pasokan air baku perkotaan.
Berdasarkan persepsi anda, berilah penilaian pada tiap variabel risiko (O, S dan D) dengan cara melingkari 10-point skala Likert. Pengertian akan tiap-tiap variable
risiko O, S dan D dijelaskan dibawah ini;
Occurrence (O) mengacu pada kemungkinan bahwa risiko tersebut akan terjadi.
Tidak pernah 1 2 3 4 5 6 7 8 9 10 Hampir pasti
Severity (S) mengindikasikan bagaimana dampak tiap risiko akan berpengaruh.
Tidak ada 1 2 3 4 5 6 7 8 9 10 Berbahaya tanpa peringatan
Detectability (D) mengacu pada probabilitas akan tidak terdeteksinya kehadiran risiko tersebut (ketidaktahuan akan eksistensi risiko tersebut).
Hampir pasti 1 2 3 4 5 6 7 8 9 10 Tidak mungkin

APPENDIX B
Page 303
domestik. D = 1 – 2 – 3 – 4 – 5 – 6 – 7 – 8 – 9 – 10 R7. Penyalahgunaan air minum. Perlakuan atas pemanfaatan air minum yang kurang benar dan, atau adanya penyalahgunaan
(penggunaan air secara berlebihan, penggunaan tidak pada kebutuhan yang semestinya, perlakuan penggunaan air minum dipandang
sebelah mata, menjual air tanpa ijin/ melanggar hukum).
O = 1 – 2 – 3 – 4 – 5 – 6 – 7 – 8 – 9 – 10
S = 1 – 2 – 3 – 4 – 5 – 6 – 7 – 8 – 9 – 10
D = 1 – 2 – 3 – 4 – 5 – 6 – 7 – 8 – 9 – 10 R8. Terbatasnya akses mendapatkan air minum. Ketidakterjangkauan masyarakat memperoleh (akses) air minum dikarenakan
adanya permasalahan ketidaksetaraan sosial-ekonomi, keterbatasan infrastruktur pendistribusian air perkotaan pada wilayah-wilayah
tertentu (khususnya wilayah terpencil dan rawan air), adanya diskriminasi gender dalam sistem infrastruktur penyediaan air minum
perkotaan.
O = 1 – 2 – 3 – 4 – 5 – 6 – 7 – 8 – 9 – 10
S = 1 – 2 – 3 – 4 – 5 – 6 – 7 – 8 – 9 – 10
D = 1 – 2 – 3 – 4 – 5 – 6 – 7 – 8 – 9 – 10 R9. Permasalahan pembayaran rekening air pelanggan. Tidak terbayarnya biaya tagihan konsumsi air minum oleh pelanggan,
adanya tidak pidana penipuan dengan mengganti meteran air yang bertujuan agar membayar biaya tagihan lebih rendah dari jumlah
semestinya, rendahnya kesadaran untuk membayar biaya tagihan tepat waktu, adanya rasa enggan membayar tagihan dikarenakan
perubahan sistem pelayanan dan harga air minum.
O = 1 – 2 – 3 – 4 – 5 – 6 – 7 – 8 – 9 – 10
S = 1 – 2 – 3 – 4 – 5 – 6 – 7 – 8 – 9 – 10
D = 1 – 2 – 3 – 4 – 5 – 6 – 7 – 8 – 9 – 10 R10. Penolakan masyarakat. Penolakan akan solusi yang diberikan terhadap permasalahan distribusi air minum, seperti; perubahan
kebijakan dan peraturan, kenaikan tarif air namun stagnansi dan penurunan kualitas pelayanan distribusi air minum masih terjadi,
mempersulit/menolak pemeriksaan meter air beserta perlengkapannya oleh petugas. Penolakan masyarakat berujung pada penolakan
untuk membayar tagihan, protes dan boikot masal, demo dan kemungkinan berujung pada tindakan anarkis.
O = 1 – 2 – 3 – 4 – 5 – 6 – 7 – 8 – 9 – 10
S = 1 – 2 – 3 – 4 – 5 – 6 – 7 – 8 – 9 – 10
D = 1 – 2 – 3 – 4 – 5 – 6 – 7 – 8 – 9 – 10 R11. Pertumbuhan penduduk dan perubahan pola urbanisasi. Pertumbuhan penduduk dan pola urbanisasi berubah sehingga
populasi menjadi sangat padat diwilayah perkotaan. Kapasitar produksi dan permintaan air minum berubah-ubah mengikuti pola
konsumsi masyarakat diwilayah perkotaan. Dampak lain adalah adanya perubahan pola penggunaan lahan tidur yang berdampak pada
polusi air tanah.
O = 1 – 2 – 3 – 4 – 5 – 6 – 7 – 8 – 9 – 10
S = 1 – 2 – 3 – 4 – 5 – 6 – 7 – 8 – 9 – 10
D = 1 – 2 – 3 – 4 – 5 – 6 – 7 – 8 – 9 – 10 R12. Ancaman pengrusakan sistem infrastructure (sabotase). Ancaman tindakan pengerusakan fisik fasilitas umum infrastruktur
penyediaan air minum perkotaan dengan mengunakan bahan peledak, tindakan kriminal dengan mencemari proses instalasi pengolahan
dan, atau jaringan distribusi air minum, pengerusakan meteran air dan pipa saluran primer distribusi air, merusak, melepas dan
menghilangkan segel serta kelengkapannya termasuk hidran/kran umum (termasuk aksesoris lainnya).
O = 1 – 2 – 3 – 4 – 5 – 6 – 7 – 8 – 9 – 10
S = 1 – 2 – 3 – 4 – 5 – 6 – 7 – 8 – 9 – 10
D = 1 – 2 – 3 – 4 – 5 – 6 – 7 – 8 – 9 – 10 Political risk
R13. Dinamika pergerakan politik. Gangguan pelayanan air minum perkotaan yang disebabkan oleh; pergerakan politik negara, ketidakjelasan kerjasama politik antar berbagai instansi, ketidakjelasan pengambilan keputusan dan rendahnya komitmen bersama dari berbagai instansi terkait dengan pengembangan dan penginplementasian kerangka dasar hukum (dan regulasi) yang berlaku, konflik yang berujung pada terhambatnya pengembangan sistem infrastruktur penyediaan air minum perkotaan.
O = 1 – 2 – 3 – 4 – 5 – 6 – 7 – 8 – 9 – 10
S = 1 – 2 – 3 – 4 – 5 – 6 – 7 – 8 – 9 – 10
D = 1 – 2 – 3 – 4 – 5 – 6 – 7 – 8 – 9 – 10
R14. Terbatasnya partisipasi publik. Adanya hambatan dalam hal komunikasi antar perwakilan masyarakat dengan elit politik, kurangnya prioritas yang diberikan kepada kepentingan masyarakat, munculnya bias, ketidakjelasan dan ketidak-transparansian dalam pengambilan keputusan yang dilakukan pihak berwenang (elit politik) tanpa melibatkan suara dan partisipasi masyarakat sekitar.
O = 1 – 2 – 3 – 4 – 5 – 6 – 7 – 8 – 9 – 10
S = 1 – 2 – 3 – 4 – 5 – 6 – 7 – 8 – 9 – 10
D = 1 – 2 – 3 – 4 – 5 – 6 – 7 – 8 – 9 – 10 R15. Perubahan kebijakan pemerintah. Ketidakjelasan mengenai alokasi kuantitas distribusi air minum (cenderung berlebihan), rendahnya transparansi dan akuntabilitas pihak pemerintah sehingga menurunkan kepercayaan publik atas perubahan kebijakan pemerintah yang disahkan (perubahan tarif pelanggan tak menentu yang merugikan masyarakat).
O = 1 – 2 – 3 – 4 – 5 – 6 – 7 – 8 – 9 – 10
S = 1 – 2 – 3 – 4 – 5 – 6 – 7 – 8 – 9 – 10
D = 1 – 2 – 3 – 4 – 5 – 6 – 7 – 8 – 9 – 10

APPENDIX B
Page 304
R16. Ketidakjelasan legalitas dan regulasi hokum. Tidak jelasnya (rancu) kerangka dasar hukum dan regulasi/ketentuan yang berlaku dalam hal pemberdayaan, pengolahan dan pendistribusian air minum kepada masyarakat. Risiko ini juga timbul dalam bentuk inkoherensi metode dan implementasi hukum nasional (tingkat provinsi, kabupaten dan regional/kota) dalam hal penyelesaian sengketa.
O = 1 – 2 – 3 – 4 – 5 – 6 – 7 – 8 – 9 – 10
S = 1 – 2 – 3 – 4 – 5 – 6 – 7 – 8 – 9 – 10
D = 1 – 2 – 3 – 4 – 5 – 6 – 7 – 8 – 9 – 10 Technical and operational risk
R17. Kurangnya tingkat pelayanan non-teknis. Penurunan kualitas pengelolah infrastruktur penyediaan air minum dalam memberikan pelayanan dan solusi atas permintaan maupun keluhan masyarakat, bagian pelayanan bersangkutan kurang sopan dalam menghadapi pelanggan, lambatnya penanganan atas keluhan masyarakat, bagian pelayanan kurang mampu menguasai permasalahan yang ada, pelayanan dan administrasi yang rumit.
O = 1 – 2 – 3 – 4 – 5 – 6 – 7 – 8 – 9 – 10
S = 1 – 2 – 3 – 4 – 5 – 6 – 7 – 8 – 9 – 10
D = 1 – 2 – 3 – 4 – 5 – 6 – 7 – 8 – 9 – 10 R18. Penurunan kualitas air bersih. Penurunan/rendahnya kualitas air minum dengan berbagai parameternya, yaitu; adanya perubahan warna (tidak jernih), tingkat kekeruhan tidak dapat diterima, rasa air yang aneh dan bau tak sedap.
O = 1 – 2 – 3 – 4 – 5 – 6 – 7 – 8 – 9 – 10
S = 1 – 2 – 3 – 4 – 5 – 6 – 7 – 8 – 9 – 10
D = 1 – 2 – 3 – 4 – 5 – 6 – 7 – 8 – 9 – 10 R19. Gangguan jaringan distribusi air bersih. Aliran air mengecil atau bahkan mati, penurunan tekanan air minum karena kapasitas perpipaan distribusi air minum melebihi beban permintaan masyarakat (tidak mencukupi/ kapasitas jaringan distribusi melebihi perencanaan awal dari kapasitas yang telah direncanakan), adanya kebocoran dalam pipa distribusi, aliran air yang ditutup/ dimatikan sementara oleh pihak berwenang (adanya perbaikan pipa), tekanan air dalam jaringan tidak merata.
O = 1 – 2 – 3 – 4 – 5 – 6 – 7 – 8 – 9 – 10
S = 1 – 2 – 3 – 4 – 5 – 6 – 7 – 8 – 9 – 10
D = 1 – 2 – 3 – 4 – 5 – 6 – 7 – 8 – 9 – 10
R20. Kerusakan komponen fisik infrastruktur. Risiko kerusakan komponen fisik infrastruktur meliputi (tak menutup kemungkinan lain); kerusakan pipa, pompa air, sambungan-sambungan, aksesoris, meteran air dan katup air, kebocoran karena katup air dan pipa distribusi air bermasalah, masuknya akar pohon ke dalam pipa distribusi.
O = 1 – 2 – 3 – 4 – 5 – 6 – 7 – 8 – 9 – 10
S = 1 – 2 – 3 – 4 – 5 – 6 – 7 – 8 – 9 – 10
D = 1 – 2 – 3 – 4 – 5 – 6 – 7 – 8 – 9 – 10 R21. Tingkat pemeliharaan fisik infrastruktur yang rendah. Perawatan dan pemeliharaan (penggantian, kalibrasi dan pengecekan fisik) fisik infrastruktur mengalami penurunan/ dilakukan dibawah standar peraturan, pemeliharaan tidak diprioritaskan dan tidak diperhatikan, cenderung diremehkan.
O = 1 – 2 – 3 – 4 – 5 – 6 – 7 – 8 – 9 – 10
S = 1 – 2 – 3 – 4 – 5 – 6 – 7 – 8 – 9 – 10
D = 1 – 2 – 3 – 4 – 5 – 6 – 7 – 8 – 9 – 10 R22. Penuaan umur fisik infrastruktur. Sistem infratruktur fisik penyediaan air minum perkotaan melebihi ambang batas waktu penggunaan yang dijinkan (pipa, pompa, panel, rumah pompa, sambungan dan aksesoris), infrastruktur fisik terlampau lama dibangun (sejak jaman belanda), sistem fisik infrastruktur melebihi kapasitas masa layan yang dianjurkan.
O = 1 – 2 – 3 – 4 – 5 – 6 – 7 – 8 – 9 – 10
S = 1 – 2 – 3 – 4 – 5 – 6 – 7 – 8 – 9 – 10
D = 1 – 2 – 3 – 4 – 5 – 6 – 7 – 8 – 9 – 10 R23. Kurangnya tingkat pelayanan teknis. Penurunan kualitas pelayanan teknis ke masyakarat rendah dan kurang terorganisir. Contoh: pemberitahuan berita penting ke para pelanggan terlambat, perbaikan kembali atas pekerjaan galian dan perbaikan sistem infrastruktur fisik kurang baik (asal-asalan), pengecekan meteran air dan input data yang kurang teliti, pekerja bersangkutan kurang sopan dalam menghadapi pelanggan, lambatnya penanganan atas keluhan masyarakat.
O = 1 – 2 – 3 – 4 – 5 – 6 – 7 – 8 – 9 – 10
S = 1 – 2 – 3 – 4 – 5 – 6 – 7 – 8 – 9 – 10
D = 1 – 2 – 3 – 4 – 5 – 6 – 7 – 8 – 9 – 10 R24. Kehilangan air (Non-Revenue Water). Adanya kebocoran pipa, kebocoran sambungan, kebocoran pada kran dan atau, aksesoris lainnya, pencurian air oleh pelanggan dan, atau oleh non-pelanggan.
O = 1 – 2 – 3 – 4 – 5 – 6 – 7 – 8 – 9 – 10
S = 1 – 2 – 3 – 4 – 5 – 6 – 7 – 8 – 9 – 10
D = 1 – 2 – 3 – 4 – 5 – 6 – 7 – 8 – 9 – 10

APPENDIX B
Page 305
R25. Gangguan dari infrastruktur pendukung lainnya. Gangguan dari sistem infrastruktur pendukung lain yang menyebabkan terganggunya proses pengolahan, dan pendistribusian air minum perkotaan. Contoh; Pemadaman listrik mengganggu proses pengelolaan dan pendistribusian air minum perkotaan, gangguan infrastruktur transportasi menghambat proses pendistribusian air ke daerah rawan air (mobil tangki), gangguan pada kapastias suplai energi (dan dukungan IT) untuk keberlanjutan kinerja sistem infratruktur penyediaan air perkotaan.
O = 1 – 2 – 3 – 4 – 5 – 6 – 7 – 8 – 9 – 10
S = 1 – 2 – 3 – 4 – 5 – 6 – 7 – 8 – 9 – 10
D = 1 – 2 – 3 – 4 – 5 – 6 – 7 – 8 – 9 – 10
Economic risk
R26. Fluktuasi tingkat bunga perbankan. Tingkat bunga yang terlalu tinggi menyebabkan krisis keuangan. Fluktiasi bunga perbankan yang tak dapat di prediksi berdampak pada ketidakseimbangan dan kerentanan ekonomi. Contoh; kenaikan tarif penggunaan air yang dibebankan kepada masyarakat (pelanggan), terhambatnya proses pengembangan pembangunan infrastruktur penyediaan air perkotaan. Proses pengolahan air baku menjadi air minum juga dipengaruhi oleh fluktuasi bunga perbankan.
O = 1 – 2 – 3 – 4 – 5 – 6 – 7 – 8 – 9 – 10
S = 1 – 2 – 3 – 4 – 5 – 6 – 7 – 8 – 9 – 10
D = 1 – 2 – 3 – 4 – 5 – 6 – 7 – 8 – 9 – 10
R27. Fluktuasi nilai pertukaran valuta asing. Terjadinya perubahan pertukaran valuta asing yang tidak dapat diprediksi. Variasi perubahan nilai pertukaran valuta asing berdampak pada kerentanan dan ketidakstabilan ekonomi. Salah satu dampak daripada risiko ini adalah adanya kenaikan tarif pengguna air yang dibebankan kepada masyarakat (pelanggan).
O = 1 – 2 – 3 – 4 – 5 – 6 – 7 – 8 – 9 – 10
S = 1 – 2 – 3 – 4 – 5 – 6 – 7 – 8 – 9 – 10
D = 1 – 2 – 3 – 4 – 5 – 6 – 7 – 8 – 9 – 10
R28. Kurangnya tingkat investasi pengembangan infrastruktur. Kurangnya perencanaan yang bersifat adaptif dan jangka panjang dalam hal perencanaan pembangunan dan pengembangan infrastruktur penyediaan air minum perkotaan, kerumitan yang disebabkan oleh lembaga-lembaga pemerintah/ swasta terkait, adanya faktor ketidakpercayaan investor domestik maupun luar negeri dalam hal menanamkan modalnya untuk pengembangan infrastruktur di Indonesia.
O = 1 – 2 – 3 – 4 – 5 – 6 – 7 – 8 – 9 – 10
S = 1 – 2 – 3 – 4 – 5 – 6 – 7 – 8 – 9 – 10
D = 1 – 2 – 3 – 4 – 5 – 6 – 7 – 8 – 9 – 10
R29. Risiko inflasi. Risiko inflasi (kenaikan dan ketidaksimbangan atas harga-harga barang ditengah masyarakat), dapat memberikan dampak tidak hanya kepada aspek ekonomi dan finansial namun juga berdampak pada tingkat sistem pelayanan penyediaanan air minum. Inflasi memberikan dampak yang tidak sama bagi berbagai stakeholder dalam konteks infrastruktur penyediaan air minum.
O = 1 – 2 – 3 – 4 – 5 – 6 – 7 – 8 – 9 – 10
S = 1 – 2 – 3 – 4 – 5 – 6 – 7 – 8 – 9 – 10
D = 1 – 2 – 3 – 4 – 5 – 6 – 7 – 8 – 9 – 10
R30. Kurang stabilnya harga air bersih. Ketidakjelasan pengaturan dan penetapan tarif air minum berimbas pada terganggunya sistem penyediaanan dan pemenuhan kebutuhan air minum. Tarif ditetapkan tanpa studi lanjut dan pertimbangan yang tepat, ketidakefisienan tingkat harga juga berujung pada ketidakseimbangan tingkat layanan pemenuhan kebutuhan air minum.
O = 1 – 2 – 3 – 4 – 5 – 6 – 7 – 8 – 9 – 10
S = 1 – 2 – 3 – 4 – 5 – 6 – 7 – 8 – 9 – 10
D = 1 – 2 – 3 – 4 – 5 – 6 – 7 – 8 – 9 – 10

APPENDIX B
Page 306
Bagian C. Posisi responden sebagai pemegang kepentingan dalam infrastruktur suplai air bersih Pilihlah salah satu (hanya satu) kategori dari pilihan stakeholder dibawah ini yang paling tepat untuk merepresentasikan
posisi anda sebagai stakeholder dalam konteks infrastruktur penyediaan air bersih kota Surabaya dengan mencentang
(√) pada kotak yang tersedia.
Stakeholder group Stakeholder description
G1. Balai Besar
Wilayah Sungai
Brantas (BBWS).
Balai Besar Wilayah Sungai mempunyai tugas melaksanakan pengelolaan sumber daya air di
wilayah sungai yang meliputi perencanaan, pelaksanaan konstruksi, operasi dan pemeliharaan
dalam rangka konservasi dan pendayagunaan sumber daya air dan pengendalian daya rusak
air pada sungai danau, waduk, bendungan dan tampungan air lainnya, irigasi, air tanah, air
baku, rawa, tambak dan pantai.
G2. Dinas Pekerjaan
Umum-provinsi
Dinas Pekerjaan Umum mempunyai fungsi: (i) Perumusan kebijakan teknis di bidang
pekerjaan umum, bina marga, cipta karya, pengairan dan tata ruang; (ii)Pelaksanaan
pengaturan, pembinaan, pengendalian, pembangunan, pemeliharaan dan pengawasan jalan
dan jembatan, drainase, irigasi, sungai, sumber daya air, bangunan dan gedung, permukiman
dan perumahan, sanitasi perkotaan serta tata ruang yang menjadi kewenangan daerah; (iii)
Pelaksanaan kegiatan pemungutan retribusi yang menjadi kewenangannya; (iv) Pelaksanaan Standar Pelayanan Minimal (SPM) dan Standart Pelayanan Publik (SPP) serta pelaksanaan
fasilitasi pengukuran Indeks Kepuasan Masyarakat (IKM) secara periodik untuk
memperbaiki kualitas layanan dan pengelolaan pengaduan masyarakat di bidang pekerjaan
umum; (v) dan lain-lain.
P1. Perusahaan Umum
Jasa Tirta-I.
Perusahaan Umum Jasa Tirta-1 adalah Badan Usaha Milik Negara (BUMN) yang ditugasi
untuk menyelenggarakan pemanfaatan umum atas air dan sumber-sumber air yang bermutu
dan memadai bagi pemenuhan hajat hidup orang banyak, serta melaksanakan tugas-tugas
tertentu yang diberikan Pemerintah dalam pengelolaan wilayah daerah aliran sungai (DAS).
G3. Pemerintahan kota
Surabaya.
Pemerintahan Kota Surabaya merupakan bagian dari sistem penyelenggaraan pemerintahan
daerah di Indonesia, yang menganut sistem desentralisasi, tugas pembantuan, dan
dekonsentrasi dalam mengatur dan mengurus sendiri urusan pemerintahan menurut asas
otonomi dan menjalankan otonomi seluas-luasnya serta tugas pembantuan di kota Surabaya.
P2. Perusahaan Daerah
Air Minum-Surya
Sembada.
Perusahaan Daerah Air Minum (PDAM) Surya Sembada mimiliki visi dan misi, diantaranya;
Visi: Tersedianya air minum yang cukup bagi pelanggan melalui perusahaan air minum yang
mandiri, berwawasan global, dan terbaik di Indonesia.
Misi: Memproduksi dan mendistribusikan air minum bagi pelanggan; Memberi pelayanan
prima bagi pelanggan dan berkelanjutan bagi pemangku kepentingan; Melakukan usaha lain
bagi kemajuan perusahaan dan berpartisipasi aktif dalam kegiatan sosial kemasyarakatan.
M1. Industri/bisnis.
Industri pengguna air minum sebagai bahan baku prioritas dalam usaha/ proses produksinya.
Perusahaan dengan komoditas produk yang diperdangangkan secara keseluruhan (atau
sebagian besar) merupakan hasil produksi dari bahan baku air minum perkotaan. Contoh:
industri air minum, industry minuman ringan, industri agrikultur.
M2. Komersial dan,
atau tempat publik.
Ruang publik, pusat perbelanjaan, rumah sakit (publik/ swasta), universitas, sekolah, pusat hiburan, taman rekreasi, tempat umum (kamar mandi umum), restaurant, hotel, gedung
pertemuan, gedung perkantoran, pasar tradisional, pasar modern, pelabuhan udara, pelabuhan
laut, apartemen, kondominium, gedung perkantoran, gedung pemerintah, gedung/tempat
ibadah, terminal, pergudangan, penjual air minum independen dan swasta.
M3. Pengguna akhir
domestik.
Pengguna/ pelanggan umum, pelanggan pemukiman perumahan, pengguna/ pelanggan air
minum ditingkat kawasan/ wilayah, pengguna potensial dan pengguna regular, pengguna
kelas atas-menengah-bawah, pengguna dengan tingkat koneksi layanan air minum perkotaan
kurang baik, pengguna dengan tingkat koneksi tingkat layanan air minum perkotaan sangat
buruk.

APPENDIX B
Page 307
Bagian D. Pertukaran informasi antar pemangku kepentingan terhadap kepemilikan risiko.
1. Pilihlah risiko-risiko yang berhubungan dan, atau berdampak pada anda dengan memberikan tanda
centang (√) dikolom kedua (“Terkena dampak”). Anda dapat memilih lebih dari satu risiko.
2. Berdasarkan poin 1 diatas, untuk tiap risiko yang telah nada pilih, tentukan pemangku kepentingan
lain yang mungkin memiliki hubungan dan, atau terkena dampak dari tiap-tiap risiko yang tela anda pilih.
Catatan: Penjelasan risiko dan pemangku kepentingan mengacu dan dapat dilihat pada bagian B dan
C kuesioner ini.
Risiko Terkena dampak
G1 G2 P1 G3 P2 M1 M2 M3
R1 R2 R3 R4 R5
Risiko Terkena dampak
G1 G2 P1 G3 P2 M1 M2 M3
R6 R7 R8 R9
R10 R11 R12
Risiko Terkena dampak
G1 G2 P1 G3 P2 M1 M2 M3
R13 R14 R15 R16
Risiko Terkena dampak
G1 G2 P1 G3 P2 M1 M2 M3
R17 R18 R19 R20 R21 R22 R23 R24 R25
Risiko Terkena dampak
G1 G2 P1 G3 P2 M1 M2 M3
R26 R27 R28 R29 R30

APPENDIX B
Page 308
Bagian E. Kritik dan saran.
Terima kasih, partisipasi anda memberikan kontribusi yang besar terhadap proses riset ini.

APPENDIX B
Page 309
APPENDIX KUESIONER
Tabel 1. Probabilita terjadinya risiko (O), deskripsi tingkat kegagalan dan tingkat penilaian.
Probabilitas terjadinya Tingkat kegagalan Penilaian
Hampir pasti ≥1/2 10
Sangat pasti 1/3 9
Tinggi 1/8 8
Sedang-Tinggi 1/20 7
Sedang 1/80 6
Cukup rendah 1/400 5
Rendah 1/2000 4 Sedikit 1/15.000 3
Hampir tidak pernah 1/150.000 2
Tidak pernah 1/1.500.000 1
Tabel 2. Dampak/efek (S), deskripsi dan tingkat penilaian.
Efek/Akibat Besarnya Dampak/Efek Penilaian
Berbahaya tanpa
peringatan
Efek berbahaya terkait dengan keamanan ketika kegagalan sistem
keamanan kinerja terjadi tanpa peringatan 10
Berbahaya
dengan peringatan
Dampak serius ketika potensial kegagalan mempengaruhi sistem
keamanan kinerja terjadi dengan peringatan 9
Sangat tinggi Tingkat dampak/efek yang sangat tinggi pada sistem kinerja 8
Tinggi Tingkat dampak/efek tinggi pada sistem kinerja 7
Sedang Tingkat dampak/efek sedang pada sistem kinerja 6
Rendah Tingkat dampak/efek rendah pada sistem kinerja 5
Sangat rendah Dampak yang sangat rendah pada sistem kinerja 4
Kecil Sedikit dampak/efek pada sistem kinerja 3
Sangat kecil Sangat sedikit berpengaruh pada sistem kinerja 2
Tidak ada Tidak ada efek 1
Tabel 3. Deteksi (D), deskripsi kriteria dan tingkat penilaian.
Pendeteksian Kriteria (Terdeteksi-%) Penilaian
Tidak mungkin
Tidak akan dan, atau tidak ada peluang untuk/dapat mendeteksi
penyebab/mekanisme potensial dan modus kegagalan; atau tidak ada kontrol
desain (0-5%)
10
Hampir tidak
mungkin
Peluang yang hampir tidak mungkin untuk mendeteksi dan mengontrol
penyebab potensial kegagalan mekanisme (6-15%) 9
Sangat rendah Peluang yang sangat rendah untuk mendeteksi dan mengontrol penyebab
potensial kegagalan mekanisme (16-25%) 8
Cukup rendah Peluang yang cukup rendah untuk mendeteksi dan mengontrol penyebab potensial kegagalan mekanisme (26-35%)
7
Rendah Peluang yang rendah untuk mendeteksi dan mengontrol penyebab potensial
kegagalan mekanisme (36-45%) 6
Sedang Peluang sedang untuk mendeteksi dan mengontrol penyebab potensial
kegagalan mekanisme (46-55%) 5
Cukup tinggi Peluang cukup tinggi untuk mendeteksi dan mengontrol penyebab potensial
kegagalan mekanisme (56-65%) 4
Tinggi Peluang cukup besar untuk mendeteksi dan mengontrol penyebab potensial
kegagalan mekanisme (66-75%) 3
Sangat tinggi Peluang sangat tinggi untuk mendeteksi dan mengontrol penyebab potensial
kegagalan mekanisme (76-85%) 2
Hampir pasti Hampir pasti terdeteksi dan kemampuan mengontrol akan penyebab
potensial kegagalan mekanisme (86-100%) 1
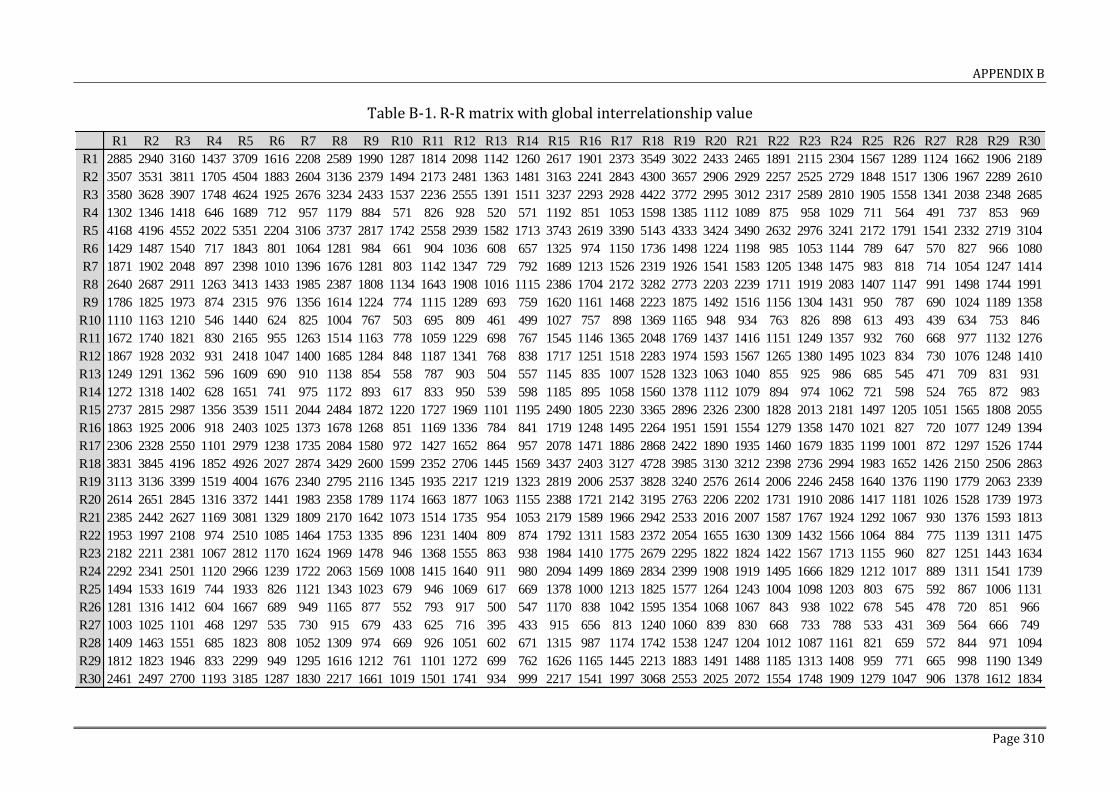
APPENDIX B
Page 310
Table B-1. R-R matrix with global interrelationship value
R1 R2 R3 R4 R5 R6 R7 R8 R9 R10 R11 R12 R13 R14 R15 R16 R17 R18 R19 R20 R21 R22 R23 R24 R25 R26 R27 R28 R29 R30
R1 2885 2940 3160 1437 3709 1616 2208 2589 1990 1287 1814 2098 1142 1260 2617 1901 2373 3549 3022 2433 2465 1891 2115 2304 1567 1289 1124 1662 1906 2189
R2 3507 3531 3811 1705 4504 1883 2604 3136 2379 1494 2173 2481 1363 1481 3163 2241 2843 4300 3657 2906 2929 2257 2525 2729 1848 1517 1306 1967 2289 2610
R3 3580 3628 3907 1748 4624 1925 2676 3234 2433 1537 2236 2555 1391 1511 3237 2293 2928 4422 3772 2995 3012 2317 2589 2810 1905 1558 1341 2038 2348 2685
R4 1302 1346 1418 646 1689 712 957 1179 884 571 826 928 520 571 1192 851 1053 1598 1385 1112 1089 875 958 1029 711 564 491 737 853 969
R5 4168 4196 4552 2022 5351 2204 3106 3737 2817 1742 2558 2939 1582 1713 3743 2619 3390 5143 4333 3424 3490 2632 2976 3241 2172 1791 1541 2332 2719 3104
R6 1429 1487 1540 717 1843 801 1064 1281 984 661 904 1036 608 657 1325 974 1150 1736 1498 1224 1198 985 1053 1144 789 647 570 827 966 1080
R7 1871 1902 2048 897 2398 1010 1396 1676 1281 803 1142 1347 729 792 1689 1213 1526 2319 1926 1541 1583 1205 1348 1475 983 818 714 1054 1247 1414
R8 2640 2687 2911 1263 3413 1433 1985 2387 1808 1134 1643 1908 1016 1115 2386 1704 2172 3282 2773 2203 2239 1711 1919 2083 1407 1147 991 1498 1744 1991
R9 1786 1825 1973 874 2315 976 1356 1614 1224 774 1115 1289 693 759 1620 1161 1468 2223 1875 1492 1516 1156 1304 1431 950 787 690 1024 1189 1358
R10 1110 1163 1210 546 1440 624 825 1004 767 503 695 809 461 499 1027 757 898 1369 1165 948 934 763 826 898 613 493 439 634 753 846
R11 1672 1740 1821 830 2165 955 1263 1514 1163 778 1059 1229 698 767 1545 1146 1365 2048 1769 1437 1416 1151 1249 1357 932 760 668 977 1132 1276
R12 1867 1928 2032 931 2418 1047 1400 1685 1284 848 1187 1341 768 838 1717 1251 1518 2283 1974 1593 1567 1265 1380 1495 1023 834 730 1076 1248 1410
R13 1249 1291 1362 596 1609 690 910 1138 854 558 787 903 504 557 1145 835 1007 1528 1323 1063 1040 855 925 986 685 545 471 709 831 931
R14 1272 1318 1402 628 1651 741 975 1172 893 617 833 950 539 598 1185 895 1058 1560 1378 1112 1079 894 974 1062 721 598 524 765 872 983
R15 2737 2815 2987 1356 3539 1511 2044 2484 1872 1220 1727 1969 1101 1195 2490 1805 2230 3365 2896 2326 2300 1828 2013 2181 1497 1205 1051 1565 1808 2055
R16 1863 1925 2006 918 2403 1025 1373 1678 1268 851 1169 1336 784 841 1719 1248 1495 2264 1951 1591 1554 1279 1358 1470 1021 827 720 1077 1249 1394
R17 2306 2328 2550 1101 2979 1238 1735 2084 1580 972 1427 1652 864 957 2078 1471 1886 2868 2422 1890 1935 1460 1679 1835 1199 1001 872 1297 1526 1744
R18 3831 3845 4196 1852 4926 2027 2874 3429 2600 1599 2352 2706 1445 1569 3437 2403 3127 4728 3985 3130 3212 2398 2736 2994 1983 1652 1426 2150 2506 2863
R19 3113 3136 3399 1519 4004 1676 2340 2795 2116 1345 1935 2217 1219 1323 2819 2006 2537 3828 3240 2576 2614 2006 2246 2458 1640 1376 1190 1779 2063 2339
R20 2614 2651 2845 1316 3372 1441 1983 2358 1789 1174 1663 1877 1063 1155 2388 1721 2142 3195 2763 2206 2202 1731 1910 2086 1417 1181 1026 1528 1739 1973
R21 2385 2442 2627 1169 3081 1329 1809 2170 1642 1073 1514 1735 954 1053 2179 1589 1966 2942 2533 2016 2007 1587 1767 1924 1292 1067 930 1376 1593 1813
R22 1953 1997 2108 974 2510 1085 1464 1753 1335 896 1231 1404 809 874 1792 1311 1583 2372 2054 1655 1630 1309 1432 1566 1064 884 775 1139 1311 1475
R23 2182 2211 2381 1067 2812 1170 1624 1969 1478 946 1368 1555 863 938 1984 1410 1775 2679 2295 1822 1824 1422 1567 1713 1155 960 827 1251 1443 1634
R24 2292 2341 2501 1120 2966 1239 1722 2063 1569 1008 1415 1640 911 980 2094 1499 1869 2834 2399 1908 1919 1495 1666 1829 1212 1017 889 1311 1541 1739
R25 1494 1533 1619 744 1933 826 1121 1343 1023 679 946 1069 617 669 1378 1000 1213 1825 1577 1264 1243 1004 1098 1203 803 675 592 867 1006 1131
R26 1281 1316 1412 604 1667 689 949 1165 877 552 793 917 500 547 1170 838 1042 1595 1354 1068 1067 843 938 1022 678 545 478 720 851 966
R27 1003 1025 1101 468 1297 535 730 915 679 433 625 716 395 433 915 656 813 1240 1060 839 830 668 733 788 533 431 369 564 666 749
R28 1409 1463 1551 685 1823 808 1052 1309 974 669 926 1051 602 671 1315 987 1174 1742 1538 1247 1204 1012 1087 1161 821 659 572 844 971 1094
R29 1812 1823 1946 833 2299 949 1295 1616 1212 761 1101 1272 699 762 1626 1165 1445 2213 1883 1491 1488 1185 1313 1408 959 771 665 998 1190 1349
R30 2461 2497 2700 1193 3185 1287 1830 2217 1661 1019 1501 1741 934 999 2217 1541 1997 3068 2553 2025 2072 1554 1748 1909 1279 1047 906 1378 1612 1834

APPENDIX B
Page 311
Table B-2. Dichotomized R-R matrix
R1 R2 R3 R4 R5 R6 R7 R8 R9 R10 R11 R12 R13 R14 R15 R16 R17 R18 R19 R20 R21 R22 R23 R24 R25 R26 R27 R28 R29 R30 Total
R1 0 3 3 0 4 2 2 3 2 0 2 2 0 0 3 2 2 3 3 2 2 2 2 2 2 0 0 2 2 2 54
R2 3 0 4 2 4 2 3 3 2 0 2 2 0 0 3 2 3 4 4 3 3 2 2 3 2 0 0 2 2 3 65
R3 3 4 0 2 4 2 3 3 2 0 2 2 0 0 3 2 3 4 4 3 3 2 3 3 2 2 0 2 2 3 68
R4 0 0 0 0 2 0 0 0 0 0 0 0 0 0 0 0 0 2 0 0 0 0 0 0 0 0 0 0 0 0 4
R5 4 4 4 2 0 2 3 4 3 2 2 3 2 2 4 3 3 5 4 3 3 3 3 3 2 2 0 2 3 3 83
R6 0 0 0 0 2 0 0 0 0 0 0 0 0 0 0 0 0 2 0 0 0 0 0 0 0 0 0 0 0 0 4
R7 2 2 2 0 2 0 0 2 0 0 0 0 0 0 2 0 0 2 2 0 2 0 0 0 0 0 0 0 0 0 18
R8 3 3 3 0 3 0 2 0 2 0 2 2 0 0 2 2 2 3 3 2 2 2 2 2 0 0 0 0 2 2 46
R9 2 2 2 0 2 0 0 2 0 0 0 0 0 0 2 0 0 2 2 0 0 0 0 0 0 0 0 0 0 0 16
R10 0 0 0 0 0 0 0 0 0 0 0 0 0 0 0 0 0 0 0 0 0 0 0 0 0 0 0 0 0 0 0
R11 2 2 2 0 2 0 0 0 0 0 0 0 0 0 2 0 0 2 2 0 0 0 0 0 0 0 0 0 0 0 14
R12 2 2 2 0 2 0 0 2 0 0 0 0 0 0 2 0 0 2 2 2 2 0 0 0 0 0 0 0 0 0 20
R13 0 0 0 0 2 0 0 0 0 0 0 0 0 0 0 0 0 0 0 0 0 0 0 0 0 0 0 0 0 0 2
R14 0 0 0 0 2 0 0 0 0 0 0 0 0 0 0 0 0 2 0 0 0 0 0 0 0 0 0 0 0 0 4
R15 3 3 3 0 3 0 2 2 2 0 2 2 0 0 0 2 2 3 3 2 2 2 2 2 0 0 0 2 2 2 48
R16 2 2 2 0 2 0 0 2 0 0 0 0 0 0 2 0 0 2 2 2 2 0 0 0 0 0 0 0 0 0 20
R17 2 2 2 0 3 0 2 2 2 0 0 2 0 0 2 0 0 3 2 2 2 0 2 2 0 0 0 0 0 2 34
R18 4 4 4 2 5 2 3 3 3 2 2 3 0 2 3 2 3 0 4 3 3 2 3 3 2 2 0 2 2 3 76
R19 3 3 3 0 4 2 2 3 2 0 2 2 0 0 3 2 2 4 0 3 3 2 2 2 2 0 0 2 2 2 57
R20 3 3 3 0 3 0 2 2 2 0 2 2 0 0 2 2 2 3 3 0 2 2 2 2 0 0 0 0 2 2 46
R21 2 2 3 0 3 0 2 2 2 0 0 2 0 0 2 2 2 3 2 2 0 2 2 2 0 0 0 0 2 2 41
R22 2 2 2 0 2 0 0 2 0 0 0 0 0 0 2 0 2 2 2 2 2 0 0 2 0 0 0 0 0 0 24
R23 2 2 2 0 3 0 2 2 0 0 0 2 0 0 2 0 2 3 2 2 2 0 0 2 0 0 0 0 0 2 32
R24 2 2 2 0 3 0 2 2 2 0 0 2 0 0 2 0 2 3 2 2 2 0 2 0 0 0 0 0 0 2 34
R25 0 0 2 0 2 0 0 0 0 0 0 0 0 0 0 0 0 2 2 0 0 0 0 0 0 0 0 0 0 0 8
R26 0 0 0 0 2 0 0 0 0 0 0 0 0 0 0 0 0 2 0 0 0 0 0 0 0 0 0 0 0 0 4
R27 0 0 0 0 0 0 0 0 0 0 0 0 0 0 0 0 0 0 0 0 0 0 0 0 0 0 0 0 0 0 0
R28 0 0 2 0 2 0 0 0 0 0 0 0 0 0 0 0 0 2 0 0 0 0 0 0 0 0 0 0 0 0 6
R29 2 2 2 0 2 0 0 2 0 0 0 0 0 0 2 0 0 2 2 0 0 0 0 0 0 0 0 0 0 0 16
R30 2 2 3 0 3 0 2 2 2 0 0 2 0 0 2 0 2 3 2 2 2 2 2 2 0 0 0 0 2 0 39
Total 50 51 57 8 73 12 32 45 28 4 18 30 2 4 47 21 32 70 54 37 39 23 29 32 12 6 0 14 23 30

APPENDIX B
Page 312
Table B-3. S-R matrix from input data (1).
R1 R2 R3 R4 R5 R6 R7 R8 R9 R10 R11 R12 R13 R14 R15 R16 R17 R18 R19 R20 R21 R22 R23 R24 R25 R26 R27 R28 R29 R30
S1 0 0 0 0 1 0 0 1 1 0 0 0 0 0 0 0 0 1 0 1 1 0 0 0 1 0 0 0 0 0
S2 1 1 1 1 1 0 0 1 0 0 0 0 0 0 1 0 1 1 1 1 1 1 0 0 0 0 0 0 1 1
S3 0 1 1 0 1 0 0 1 1 0 0 1 0 0 1 0 0 1 1 0 0 0 0 1 0 0 0 0 0 1
S4 0 0 0 0 1 0 0 0 0 0 0 0 0 0 0 0 1 1 0 0 0 1 1 0 0 0 0 0 0 0
S5 1 1 1 0 1 0 0 0 0 0 0 0 0 0 0 0 1 1 1 1 1 0 0 1 1 0 0 1 1 1
S6 1 1 0 0 1 0 0 0 1 0 0 0 0 0 0 0 1 1 1 1 0 0 1 1 1 0 0 0 0 0
S7 0 0 0 0 1 0 0 1 0 0 0 0 0 0 1 0 0 0 0 0 0 0 0 1 0 0 0 0 1 0
S8 1 0 1 0 0 1 1 0 0 0 1 1 0 0 0 1 1 0 1 0 0 1 1 0 0 0 0 0 1 1
S9 0 0 1 0 1 0 0 0 0 0 1 0 0 0 1 0 0 0 0 0 0 0 0 0 0 0 0 0 0 0
S10 1 1 1 0 0 0 1 0 0 0 0 0 0 0 1 1 1 1 1 1 1 1 1 1 1 1 0 0 0 1
S11 1 1 1 0 0 1 1 1 1 0 0 1 0 0 1 1 1 1 1 0 0 0 1 1 0 1 1 0 1 0
S12 0 1 0 0 0 0 0 0 0 0 0 0 0 0 0 0 0 0 0 0 0 0 0 0 0 0 0 0 0 0
S13 1 1 1 0 1 1 1 1 1 0 1 1 0 0 1 1 1 1 1 1 1 1 1 1 1 1 1 1 1 0
S14 0 0 0 1 1 0 0 0 1 0 0 1 0 0 0 0 0 1 1 1 1 0 0 0 0 0 0 0 0 0
S15 0 0 1 0 1 0 0 0 0 0 1 1 0 0 0 0 1 0 1 1 1 1 0 0 0 0 0 1 0 0
S16 0 1 1 0 1 0 0 1 0 1 0 0 0 0 1 0 0 1 1 0 0 1 0 0 0 0 0 1 1 0
S17 0 0 1 0 1 0 1 1 1 1 0 0 0 0 0 0 1 1 1 1 1 1 1 1 1 0 0 0 0 1
S18 0 1 1 0 1 1 0 1 0 1 0 1 1 1 1 1 1 1 1 1 1 1 1 1 1 1 0 0 1 1
S19 0 1 1 0 1 0 1 1 0 0 1 1 0 1 1 0 1 1 1 0 1 0 0 1 0 0 0 0 1 1
S20 1 0 0 0 0 0 0 0 1 0 0 0 0 0 0 0 1 0 1 0 0 0 0 0 0 0 0 0 0 1
S21 1 1 1 0 1 1 1 0 0 0 1 0 0 0 0 1 1 1 0 0 0 0 1 1 0 0 0 0 0 1
S22 1 1 0 0 1 0 0 0 1 0 0 1 0 1 0 0 1 1 1 1 1 1 1 1 1 0 0 0 0 0
S23 1 1 0 1 1 0 1 1 0 0 0 1 0 0 1 1 0 1 1 1 1 1 1 1 1 1 0 1 1 1
S24 1 0 0 0 1 0 0 0 0 0 0 0 0 0 0 0 0 1 1 1 0 0 0 0 0 0 0 0 0 0
S25 1 0 0 1 1 1 1 0 0 0 0 0 0 0 1 0 0 1 0 0 1 0 1 0 0 0 0 1 1 0
S26 0 0 0 0 0 0 0 0 0 0 0 0 0 0 0 0 0 0 1 1 0 0 0 0 0 0 0 0 0 0
S27 1 1 1 0 1 0 0 1 1 0 0 0 0 0 0 0 1 1 1 1 0 0 0 1 0 0 0 0 0 1
S28 1 1 1 1 1 0 0 1 0 0 0 0 0 0 1 1 1 1 1 1 1 1 1 1 1 0 0 0 0 1
S29 0 1 0 0 1 0 0 1 0 0 1 0 0 0 1 0 0 0 1 0 0 0 0 1 0 0 0 0 1 0
S30 1 1 1 1 1 0 0 1 0 0 1 0 0 0 1 1 0 0 1 0 0 0 1 1 0 0 0 0 1 0

APPENDIX B
Page 313
Table B-4. S-R matrix from input data (2).
R1 R2 R3 R4 R5 R6 R7 R8 R9 R10 R11 R12 R13 R14 R15 R16 R17 R18 R19 R20 R21 R22 R23 R24 R25 R26 R27 R28 R29 R30
S31 0 1 0 0 1 0 0 0 0 0 0 0 0 0 0 0 0 1 1 0 0 0 1 0 0 0 0 0 0 0
S32 1 0 1 0 1 0 1 0 0 0 0 0 0 0 1 0 1 1 1 0 0 0 0 0 0 0 0 0 0 1
S33 0 0 1 0 0 0 0 0 0 0 0 0 0 1 0 0 1 0 1 1 1 0 0 0 1 0 0 1 0 0
S34 0 0 1 0 0 0 0 0 0 0 0 0 0 1 0 0 1 0 1 1 0 1 1 0 1 0 0 0 0 0
S35 0 0 0 0 1 0 0 1 0 0 0 0 0 1 0 0 0 0 1 0 0 0 0 0 0 0 0 1 0 0
S36 0 0 0 0 1 0 0 1 0 0 0 0 0 1 0 0 0 0 1 0 0 0 0 0 0 0 0 1 0 0
S37 1 1 1 0 1 1 1 1 0 1 1 1 0 0 0 1 0 1 1 1 1 1 1 1 1 0 0 1 0 0
S38 1 0 1 0 1 0 0 1 0 0 1 0 0 0 0 0 1 1 1 0 1 0 0 0 0 0 0 1 0 0
S39 1 1 1 0 1 0 0 1 0 0 1 0 0 0 1 0 1 1 0 1 1 0 1 1 0 1 0 0 1 1
S40 1 1 1 0 1 1 1 1 1 1 1 1 0 1 1 1 1 1 1 1 1 1 1 1 1 1 0 1 1 1
S41 1 0 0 0 1 0 0 1 1 0 0 0 0 0 0 0 0 0 1 0 0 0 1 0 0 0 0 0 0 1
S42 1 0 0 0 0 0 0 0 0 0 1 1 0 0 1 1 0 1 0 1 0 0 0 0 0 0 0 0 0 1
S43 0 0 1 0 1 1 0 0 0 0 0 0 0 0 0 1 1 1 1 0 0 0 1 1 0 0 0 0 0 1
S44 1 1 1 1 1 1 1 1 1 1 1 1 1 1 1 1 1 1 1 1 1 1 1 1 1 1 1 1 1 1
S45 1 1 1 1 1 1 1 1 1 1 1 1 1 1 1 1 1 1 1 1 1 1 1 1 1 1 1 1 1 1
S46 1 1 1 1 1 1 1 1 1 1 1 1 1 1 1 1 1 1 1 1 1 1 1 1 1 1 1 1 1 1
S47 1 1 1 1 0 0 0 1 0 0 0 0 1 0 1 0 0 1 0 0 0 0 0 0 0 0 0 0 0 0
S48 0 0 0 0 0 0 1 0 0 0 0 0 0 0 0 0 0 0 0 1 0 1 0 1 0 0 0 0 0 0
S49 0 1 1 0 0 0 0 1 0 0 0 0 0 0 0 0 0 0 0 0 0 0 0 0 0 0 0 0 0 0
S50 1 1 1 1 1 1 1 1 1 1 1 1 1 1 1 1 1 1 1 1 1 1 1 1 1 1 1 1 1 1
S51 1 1 0 0 1 0 0 0 0 0 0 0 1 1 1 1 0 0 0 0 0 1 0 0 0 0 0 0 1 0
S52 0 0 1 0 1 0 1 1 1 0 0 1 0 0 1 1 0 1 1 0 0 0 1 0 0 0 0 0 0 0
S53 0 0 1 0 1 0 0 1 0 0 0 0 0 0 0 0 0 1 0 1 0 0 0 0 0 0 0 0 0 0
S54 0 0 1 0 1 0 1 0 1 0 0 0 0 0 1 0 1 1 1 1 1 0 1 1 1 0 0 0 0 0
S55 0 0 0 0 1 0 0 0 1 0 0 0 0 0 0 0 1 1 1 0 0 0 0 1 0 0 0 0 0 0
S56 0 0 0 0 1 0 0 0 1 0 0 0 0 0 1 0 0 1 1 1 0 1 0 1 0 0 0 0 0 0
S57 0 0 1 0 1 0 0 0 0 0 0 0 0 0 0 0 0 1 0 0 0 0 1 0 0 0 0 0 0 0
S58 0 1 1 0 0 0 1 1 0 0 0 1 0 0 0 0 0 0 1 0 0 0 0 1 0 0 0 0 0 0
S59 1 0 0 0 0 0 0 1 1 0 0 0 0 0 0 0 1 1 0 0 0 0 0 0 0 0 0 0 0 1
S60 1 1 1 1 1 1 1 1 1 1 1 1 1 1 1 1 1 1 1 1 1 1 1 1 1 1 1 1 1 1

APPENDIX B
Page 314
Table B-5. S-R matrix from input data (3).
R1 R2 R3 R4 R5 R6 R7 R8 R9 R10 R11 R12 R13 R14 R15 R16 R17 R18 R19 R20 R21 R22 R23 R24 R25 R26 R27 R28 R29 R30
S61 0 0 0 0 0 0 0 0 0 0 0 0 0 0 0 0 0 0 0 0 0 0 0 0 0 0 0 0 0 0
S62 0 0 0 0 0 0 0 0 0 0 0 0 0 0 0 0 0 0 0 0 0 0 0 0 0 0 0 0 0 0
S63 1 1 0 0 1 0 0 0 0 0 0 0 1 1 1 1 0 0 0 0 0 1 0 0 0 0 0 0 1 0
S64 1 1 1 0 1 0 0 1 0 1 0 1 1 0 1 1 0 1 0 1 1 1 0 0 0 1 0 1 1 0
S65 1 0 0 0 1 1 0 0 1 0 0 0 0 0 1 0 1 0 0 0 1 0 1 0 0 1 0 0 1 0
S66 1 1 1 1 1 1 1 1 1 1 1 1 1 1 1 1 1 1 1 1 1 1 0 0 1 1 0 1 1 1
S67 0 0 1 0 1 0 0 1 0 0 0 0 0 0 0 0 0 1 0 0 1 0 0 1 0 0 0 0 0 0
S68 0 1 1 0 0 0 0 0 0 0 0 0 0 0 1 0 0 0 0 0 0 0 0 0 0 0 0 0 1 0
S69 0 0 0 0 1 0 0 0 0 0 0 0 0 0 0 0 0 0 0 0 0 0 0 0 0 0 0 0 0 0
S70 1 1 1 1 1 1 1 1 1 1 1 1 1 1 1 1 1 1 1 1 1 1 1 1 1 1 1 1 1 1
S71 0 1 1 1 1 1 1 1 0 0 0 1 0 0 1 1 0 1 0 0 1 1 1 1 0 0 1 1 1 1
S72 1 1 1 0 1 0 0 1 0 0 1 1 1 1 1 1 0 1 1 1 0 1 0 1 0 0 0 0 0 0
S73 0 1 0 0 1 0 0 0 0 0 0 1 0 0 1 1 1 1 1 1 1 1 1 0 0 0 0 0 0 1
S74 0 0 1 0 0 0 0 0 0 0 0 0 0 0 0 0 0 1 0 0 0 0 0 0 0 0 0 0 0 1
S75 1 0 1 1 1 1 1 1 1 1 1 0 1 0 1 0 1 1 1 1 0 0 1 1 1 0 0 0 0 1
S76 1 1 1 0 1 0 1 0 1 1 0 1 0 0 1 0 1 1 1 1 1 0 0 1 0 1 1 1 1 1
S77 0 1 1 0 1 0 0 0 0 0 0 0 0 0 0 0 0 0 0 0 0 0 0 1 0 0 0 0 0 0
S78 1 1 1 1 1 1 1 1 1 1 1 1 1 1 1 1 1 1 1 1 1 1 1 1 1 1 1 1 1 1
S79 0 0 0 0 1 0 0 0 0 0 0 0 0 0 0 0 0 1 0 0 1 0 0 0 0 0 0 0 0 0
S80 1 0 1 0 0 0 1 0 0 0 0 1 0 0 1 0 1 0 0 0 0 0 0 0 0 0 0 0 0 0
S81 1 0 0 0 1 0 1 0 0 1 1 0 1 0 0 1 1 1 1 0 0 0 0 0 0 0 0 0 0 1
S82 0 0 0 0 0 0 0 0 0 0 0 0 0 0 0 0 0 0 0 0 0 0 0 0 0 0 0 0 0 0
S83 1 1 1 0 1 1 1 0 1 1 1 1 0 0 0 0 0 1 1 1 1 1 0 1 0 0 0 0 0 1
S84 0 0 1 0 0 0 0 1 0 0 1 0 0 0 0 1 1 1 0 0 0 0 0 0 0 1 0 0 0 0
S85 1 1 0 1 1 0 0 0 0 0 0 0 0 0 0 0 0 0 0 0 0 1 0 0 1 0 0 0 0 0
S86 1 1 1 1 1 0 0 0 0 0 0 0 0 0 0 0 0 0 0 0 0 0 0 0 0 0 0 0 0 0
S87 0 0 0 0 0 0 0 0 0 0 0 0 0 0 0 0 0 0 0 0 0 0 0 0 0 0 0 0 0 0
S88 1 0 1 0 1 0 0 0 0 0 1 0 0 0 1 0 0 0 0 0 1 0 0 0 0 0 0 1 1 0
S89 0 1 1 0 1 0 0 1 1 0 0 1 0 0 1 1 0 1 1 0 0 0 1 1 1 0 0 0 1 1
S90 1 1 1 1 1 1 1 1 1 1 1 1 1 1 1 1 1 1 1 1 1 1 1 1 1 1 1 1 1 1

APPENDIX B
Page 315
Table B-5. S-R matrix from input data (4).
R1 R2 R3 R4 R5 R6 R7 R8 R9 R10 R11 R12 R13 R14 R15 R16 R17 R18 R19 R20 R21 R22 R23 R24 R25 R26 R27 R28 R29 R30
S91 1 1 1 1 1 1 1 1 1 1 1 1 1 1 1 1 1 1 1 1 1 1 1 1 1 1 1 1 1 1
S92 1 1 1 1 1 1 1 1 1 1 1 1 1 1 1 1 1 1 1 1 1 1 1 1 1 1 1 1 1 1
S93 1 1 0 0 1 0 0 0 0 0 1 1 0 0 0 0 0 1 0 0 0 0 0 0 0 1 1 0 1 0
S94 0 1 0 1 0 0 0 0 0 0 1 0 1 0 1 1 0 0 0 0 0 0 0 0 0 1 1 0 1 0
S95 1 1 1 1 1 0 1 1 0 0 0 0 0 0 0 0 0 0 0 0 0 0 0 0 0 0 0 0 0 0
S96 1 1 1 1 1 1 1 1 1 1 1 1 0 0 0 0 0 0 0 0 0 0 0 0 0 0 0 0 0 0
S97 1 1 1 0 1 0 0 1 0 0 0 1 0 0 0 0 0 1 1 0 1 0 0 1 1 0 0 0 0 1
S98 0 0 0 0 0 0 0 0 0 0 0 0 0 0 0 0 0 0 0 0 0 0 0 0 0 0 0 0 0 0
S99 1 1 1 1 1 1 1 1 1 1 1 1 1 1 1 1 1 1 1 1 1 1 1 1 1 1 1 1 1 1
S100 1 1 0 0 1 1 1 0 1 0 1 0 0 1 1 0 1 1 1 1 1 1 1 0 0 0 0 0 0 1
S101 1 1 0 1 0 1 0 1 0 0 0 1 0 0 0 1 0 0 0 1 1 0 0 0 1 0 0 0 0 0
S102 1 1 1 0 1 1 0 1 1 0 1 1 0 0 1 1 1 1 1 1 1 1 1 1 1 1 0 0 1 1
S103 0 1 0 0 1 0 1 0 0 1 0 1 0 0 1 1 0 0 1 1 1 0 0 1 0 0 1 1 0 0
S104 0 1 1 0 1 0 1 1 1 0 0 0 0 0 0 0 0 1 1 1 1 0 1 1 0 0 0 0 0 0
S105 1 1 1 1 1 1 1 1 1 1 1 1 1 1 1 1 1 1 1 1 1 1 1 1 1 0 0 0 0 0
S106 1 1 0 1 1 0 1 1 0 0 1 1 1 0 1 0 1 1 1 1 1 1 1 0 1 0 0 1 0 0
S107 1 1 1 0 0 1 0 1 1 0 0 0 0 0 1 0 0 1 1 0 0 0 1 0 0 0 1 0 1 1
S108 0 1 0 0 1 0 0 0 0 0 0 1 0 0 1 1 1 1 1 1 1 0 0 0 0 0 0 1 0 0
S109 1 1 1 0 1 0 1 1 0 0 0 0 0 0 1 0 0 1 0 0 1 1 0 0 0 0 0 0 0 1
S110 1 1 1 0 0 0 0 1 0 0 0 0 0 0 0 0 1 1 1 1 1 1 1 0 0 0 0 0 0 1
S111 1 1 1 1 1 1 1 1 1 1 1 1 1 1 1 1 1 1 1 1 1 1 1 1 1 1 1 1 1 1
S112 1 1 1 1 1 1 1 0 1 0 1 1 0 0 1 1 0 1 1 1 1 1 1 1 1 0 0 0 0 1
S113 0 1 0 0 1 0 1 0 0 0 0 0 0 0 1 0 1 1 1 1 0 0 0 0 0 0 0 0 0 1
S114 1 0 0 0 0 0 1 0 0 0 0 0 1 0 0 0 0 0 0 0 1 0 0 0 0 0 1 0 0 0
S115 1 1 1 1 1 1 1 1 1 1 1 1 1 1 1 1 1 1 1 1 1 1 1 1 1 1 1 1 1 1
S116 0 0 0 0 0 0 0 0 0 0 0 0 0 0 0 0 0 0 0 0 0 0 0 0 0 0 0 0 0 0
S117 0 0 0 0 0 0 0 0 0 0 0 0 0 0 0 0 0 1 0 0 0 0 0 0 0 0 0 0 0 0
S118 0 0 0 0 0 0 0 0 0 0 0 0 0 0 0 0 0 1 0 1 0 1 1 0 0 0 0 0 0 0
S119 0 1 1 0 1 0 0 0 0 0 0 0 0 0 0 0 0 0 0 0 0 0 0 0 0 0 0 0 0 0
S120 1 0 0 0 0 0 0 0 1 0 0 0 0 0 1 0 0 1 0 0 0 0 0 0 0 0 0 0 0 1

APPENDIX B
Page 316
Table B-7. S-R matrix from input data (4).
R1 R2 R3 R4 R5 R6 R7 R8 R9 R10 R11 R12 R13 R14 R15 R16 R17 R18 R19 R20 R21 R22 R23 R24 R25 R26 R27 R28 R29 R30
S121 0 1 1 0 1 0 1 1 1 1 0 1 0 0 0 0 1 1 1 0 0 0 0 0 0 1 0 1 1 1
S122 1 0 1 0 0 1 1 0 0 0 1 0 0 1 0 1 0 1 0 0 0 0 0 1 0 0 1 1 1 0
S123 0 0 1 0 1 0 1 1 0 0 1 0 0 0 1 0 0 1 0 1 0 0 0 1 0 0 0 1 1 1
S124 0 0 0 0 1 0 0 0 1 0 0 0 0 0 1 0 0 1 0 0 0 0 0 0 0 0 0 0 0 0
S125 1 1 0 1 1 0 0 1 0 0 1 0 0 0 0 0 0 0 1 0 1 0 0 0 0 0 0 1 0 0
S126 1 0 1 0 1 1 1 0 0 0 0 0 0 0 1 0 1 1 1 1 1 0 0 0 0 0 0 0 0 1

APPENDIX C
Page 317
APPENDIX C
Appendix Lists Figures Detail Scenario for Recovery Analysis Shock impact simulation result Stress impact simulation result Expected recovery simulation result Actual recovery simulation result

APPENDIX C
Page 318
-This page intentionally left blank-

APPENDIX C
Page 319
Figure C-1. Gunung Sari Floodgate (front) managed by Jasa Tirta-I public corporation. (Source: http://kodim0832.blogdetik.com/2016/10/11/pantauan-babinsa-karah-pintu-
air-rolak-gunung-sari-status-aman).
Figure C-2. Gunung Sari Floodgate (back) managed by Jasa Tirta-I public corporation. (Source: http://travpacker.blogspot.com.au/2015/05/bangunan-sejarah-bendungan-rolak-
songo.html).
Figure C-3. Physical UWS infrastructure system managed by PDAM. (Source: Figure from: http://www2.jawapos.com/baca/artikel/17427/pdam-berhenti-berharap-pasokan-
umbulan).

APPENDIX C
Page 320
Figure C-4. Water treatment plant owned and operated by PDAM. (Source: http://kelanakota.suarasurabaya.net/news/2014/144689-250-Ribu-Pelanggan-PDAM-
Surabaya-Tak-Dapat-Pasokan-Air).
Figure C-5. Trans-logistic business in Surabaya, a business which need UWS service. (Source: https://thestoryofwardana.files.wordpress.com/2013/05/guariglia-cityscape-
urban-city-architectural-9.jpg).
Figure C-6. Activity of beverage plant which need a non-stop UWS service. (Source: https://coca-colaamatil.co.id/cctour).

APPENDIX C
Page 321
Figure C-7. Surabaya water supply is definitely required for bottled water industry. (Source:
http://www.harianterbit.com/hanterhumaniora/read/2017/05/08/81009/0/40/KPPU-Diminta-Netral-dalam-Menyikapi-Kasus-AMDK#).
Figure C-8. Plaza as both commercial and public space which need water supply. (Source: https://www.gotomalls.com/blog/2016/11/10-mall-terbaik-di-surabaya/).
Figure C-9. An open space in Surabaya equipped with ready-to-drink water facilities. (Source: https://www.flickr.com/photos/eastjava/4874286030).

APPENDIX C
Page 322
Table C-1. Scenario-1 for simulation-based recovery strategy
Step Time
(discrete)
Risk impact mechanism network topology
Magnitude Risk impact to community Risk causality and interaction pattern
DC BC CC EC ODC OCC BC EC OSC
1 9 2.5% magnitude reduction Original Original Original Original Original Original Original Original Original
2 10 5% magnitude reduction 5% random [S-R] nodes link reduction 5% random [R-R] nodes link reduction
3 11 10% magnitude reduction 10% random [S-R] nodes link reduction 10% random [R-R] nodes link reduction
4 12 15% magnitude reduction 15% random [S-R] nodes link reduction 15% random [R-R] nodes link reduction
5 13 20% magnitude reduction 20% random [S-R] nodes link reduction 20% random [R-R] nodes link reduction
6 14 25% magnitude reduction 25% random [S-R] nodes link reduction 25% random [R-R] nodes link reduction
7 15 30% magnitude reduction 30% random [S-R] nodes link reduction 30% random [R-R] nodes link reduction
8 16 35% magnitude reduction 35% random [S-R] nodes link reduction 35% random [R-R] nodes link reduction
9 17 40% magnitude reduction 40% random [S-R] nodes link reduction 40% random [R-R] nodes link reduction
10 18 45% magnitude reduction 45% random [S-R] nodes link reduction 45% random [R-R] nodes link reduction
11 19 50% magnitude reduction 50% random [S-R] nodes link reduction 50% random [R-R] nodes link reduction
12 20 55% magnitude reduction 55% random [S-R] nodes link reduction 55% random [R-R] nodes link reduction

APPENDIX C
Page 323
Table C-2. Scenario-2 for simulation-based recovery strategy
Step Time
(discrete)
Risk impact mechanism network topology
Magnitude Risk impact to community Risk causality and interaction pattern
DC BC CC EC ODC OCC BC EC OSC
1 9 10% magnitude reduction 5% random [S-R] nodes link reduction Original Original Original Original Original
2 10 10% magnitude reduction 10% random [S-R] nodes link reduction 10% random [R-R] nodes link reduction
3 11 10% magnitude reduction 15% random [S-R] nodes link reduction 15% random [R-R] nodes link reduction
4 12 10% magnitude reduction 20% random [S-R] nodes link reduction 20% random [R-R] nodes link reduction
5 13 10% magnitude reduction 25% random [S-R] nodes link reduction 25% random [R-R] nodes link reduction
6 14 10% magnitude reduction 30% random [S-R] nodes link reduction 30% random [R-R] nodes link reduction
7 15 10% magnitude reduction 35% random [S-R] nodes link reduction 35% random [R-R] nodes link reduction
8 16 10% magnitude reduction 40% random [S-R] nodes link reduction 40% random [R-R] nodes link reduction
9 17 10% magnitude reduction 45% random [S-R] nodes link reduction 45% random [R-R] nodes link reduction
10 18 10% magnitude reduction 50% random [S-R] nodes link reduction 50% random [R-R] nodes link reduction
11 19 10% magnitude reduction 55% random [S-R] nodes link reduction 55% random [R-R] nodes link reduction
12 20 10% magnitude reduction 55% random [S-R] nodes link reduction 55% random [R-R] nodes link reduction

APPENDIX C
Page 324
Table C-3. Scenario-3 for simulation-based recovery strategy
Step Time
(discrete)
Risk impact mechanism network topology
Magnitude Risk impact to community Risk causality and interaction pattern
DC BC CC EC ODC OCC BC EC OSC
1 9 20% magnitude reduction 5% random [S-R] nodes link reduction Original Original Original Original Original
2 10 20% magnitude reduction 10% random [S-R] nodes link reduction 10% random [R-R] nodes link reduction
3 11 20% magnitude reduction 15% random [S-R] nodes link reduction 15% random [R-R] nodes link reduction
4 12 20% magnitude reduction 20% random [S-R] nodes link reduction 20% random [R-R] nodes link reduction
5 13 20% magnitude reduction 25% random [S-R] nodes link reduction 25% random [R-R] nodes link reduction
6 14 20% magnitude reduction 30% random [S-R] nodes link reduction 30% random [R-R] nodes link reduction
7 15 20% magnitude reduction 35% random [S-R] nodes link reduction 35% random [R-R] nodes link reduction
8 16 20% magnitude reduction 40% random [S-R] nodes link reduction 40% random [R-R] nodes link reduction
9 17 20% magnitude reduction 45% random [S-R] nodes link reduction 45% random [R-R] nodes link reduction
10 18 20% magnitude reduction 50% random [S-R] nodes link reduction 50% random [R-R] nodes link reduction
11 19 20% magnitude reduction 55% random [S-R] nodes link reduction 55% random [R-R] nodes link reduction
12 20 20% magnitude reduction 55% random [S-R] nodes link reduction 55% random [R-R] nodes link reduction

APPENDIX C
Page 325
Table C-4. Scenario-4 for simulation-based recovery strategy
Step Time
(discrete)
Risk impact mechanism network topology
Magnitude Risk impact to community Risk causality and interaction pattern
DC BC CC EC ODC OCC BC EC OSC
1 9 15% magnitude reduction Original Original Original Original Original Original Original Original Original
2 10 15% magnitude reduction 5% random [S-R] nodes link reduction 5% random [S-R] nodes link reduction
3 11 15% magnitude reduction 10% random [S-R] nodes link reduction 10% random [S-R] nodes link reduction
4 12 15% magnitude reduction 15% random [S-R] nodes link reduction 15% random [S-R] nodes link reduction
5 13 15% magnitude reduction 20% random [S-R] nodes link reduction 20% random [S-R] nodes link reduction
6 14 15% magnitude reduction 25% random [S-R] nodes link reduction 25% random [S-R] nodes link reduction
7 15 15% magnitude reduction 30% random [S-R] nodes link reduction 30% random [S-R] nodes link reduction
8 16 15% magnitude reduction 35% random [S-R] nodes link reduction 35% random [S-R] nodes link reduction
9 17 15% magnitude reduction 40% random [S-R] nodes link reduction 40% random [S-R] nodes link reduction
10 18 15% magnitude reduction 45% random [S-R] nodes link reduction 45% random [S-R] nodes link reduction
11 19 15% magnitude reduction 50% random [S-R] nodes link reduction 50% random [S-R] nodes link reduction
12 20 15% magnitude reduction 55% random [S-R] nodes link reduction 55% random [S-R] nodes link reduction

APPENDIX C
Page 326
Table C-5. Scenario-5 for simulation-based recovery strategy
Step Time
(discrete)
Risk impact mechanism network topology
Magnitude Risk impact to community Risk causality and interaction pattern
DC BC CC EC ODC OCC BC EC OSC
1 9 2.5% magnitude reduction 50% random [S-R] nodes link reduction 50% random [R-R] nodes link reduction
2 10 5% magnitude reduction 50% random [S-R] nodes link reduction 50% random [R-R] nodes link reduction
3 11 10% magnitude reduction 50% random [S-R] nodes link reduction 50% random [R-R] nodes link reduction
4 12 15% magnitude reduction 50% random [S-R] nodes link reduction 50% random [R-R] nodes link reduction
5 13 20% magnitude reduction 50% random [S-R] nodes link reduction 50% random [R-R] nodes link reduction
6 14 25% magnitude reduction 50% random [S-R] nodes link reduction 50% random [R-R] nodes link reduction
7 15 30% magnitude reduction 50% random [S-R] nodes link reduction 50% random [R-R] nodes link reduction
8 16 35% magnitude reduction 50% random [S-R] nodes link reduction 50% random [R-R] nodes link reduction
9 17 40% magnitude reduction 50% random [S-R] nodes link reduction 50% random [R-R] nodes link reduction
10 18 45% magnitude reduction 50% random [S-R] nodes link reduction 50% random [R-R] nodes link reduction
11 19 50% magnitude reduction 50% random [S-R] nodes link reduction 50% random [R-R] nodes link reduction
12 20 55% magnitude reduction 50% random [S-R] nodes link reduction 50% random [R-R] nodes link reduction
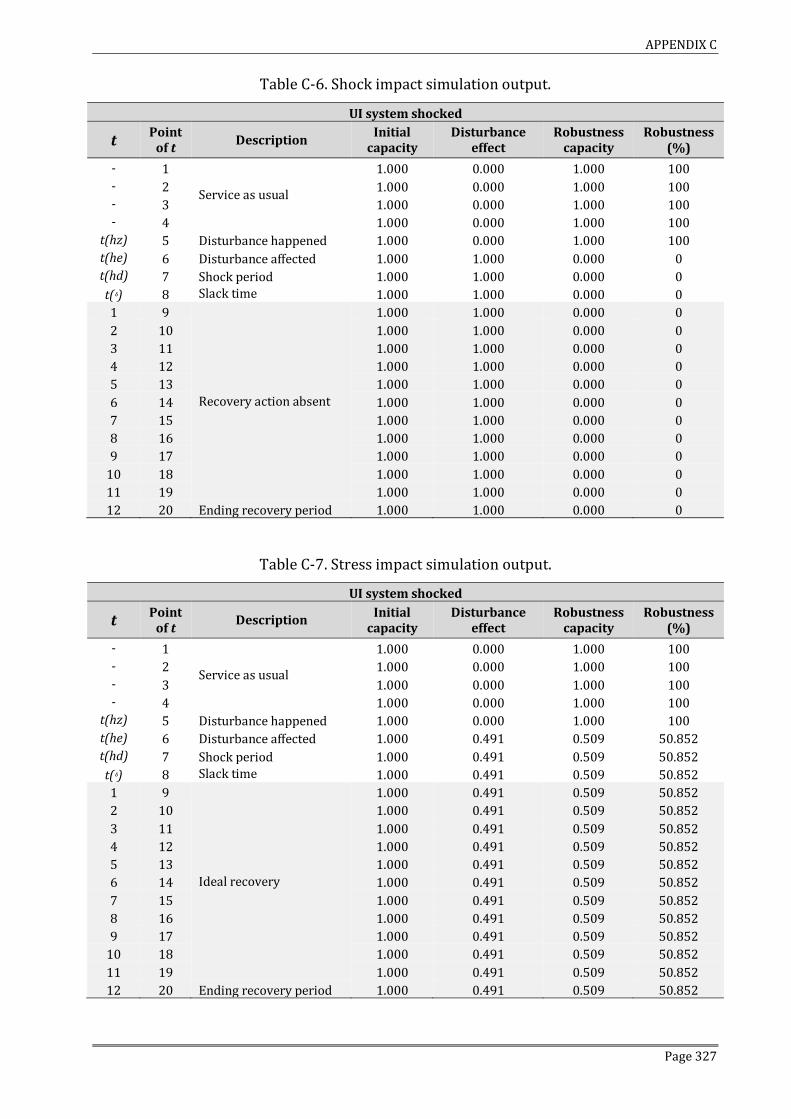
APPENDIX C
Page 327
Table C-6. Shock impact simulation output.
UI system shocked
t Point
of t Description
Initial capacity
Disturbance effect
Robustness capacity
Robustness (%)
- 1
Service as usual
1.000 0.000 1.000 100
- 2 1.000 0.000 1.000 100 - 3 1.000 0.000 1.000 100 - 4 1.000 0.000 1.000 100
t(hz) 5 Disturbance happened 1.000 0.000 1.000 100
t(he) 6 Disturbance affected 1.000 1.000 0.000 0 t(hd) 7 Shock period 1.000 1.000 0.000 0
t(ᵟ) 8 Slack time 1.000 1.000 0.000 0
1 9
Recovery action absent
1.000 1.000 0.000 0
2 10 1.000 1.000 0.000 0
3 11 1.000 1.000 0.000 0
4 12 1.000 1.000 0.000 0
5 13 1.000 1.000 0.000 0
6 14 1.000 1.000 0.000 0
7 15 1.000 1.000 0.000 0
8 16 1.000 1.000 0.000 0
9 17 1.000 1.000 0.000 0
10 18 1.000 1.000 0.000 0
11 19 1.000 1.000 0.000 0
12 20 Ending recovery period 1.000 1.000 0.000 0
Table C-7. Stress impact simulation output.
UI system shocked
t Point
of t Description
Initial capacity
Disturbance effect
Robustness capacity
Robustness (%)
- 1
Service as usual
1.000 0.000 1.000 100
- 2 1.000 0.000 1.000 100
- 3 1.000 0.000 1.000 100 - 4 1.000 0.000 1.000 100
t(hz) 5 Disturbance happened 1.000 0.000 1.000 100
t(he) 6 Disturbance affected 1.000 0.491 0.509 50.852
t(hd) 7 Shock period 1.000 0.491 0.509 50.852
t(ᵟ) 8 Slack time 1.000 0.491 0.509 50.852
1 9
Ideal recovery
1.000 0.491 0.509 50.852
2 10 1.000 0.491 0.509 50.852
3 11 1.000 0.491 0.509 50.852
4 12 1.000 0.491 0.509 50.852
5 13 1.000 0.491 0.509 50.852
6 14 1.000 0.491 0.509 50.852
7 15 1.000 0.491 0.509 50.852
8 16 1.000 0.491 0.509 50.852
9 17 1.000 0.491 0.509 50.852
10 18 1.000 0.491 0.509 50.852
11 19 1.000 0.491 0.509 50.852
12 20 Ending recovery period 1.000 0.491 0.509 50.852

APPENDIX C
Page 328
Table C-8. Expected recovery simulation output.
UI system shocked
t Point
of t Description
Initial capacity
Disturbance effect
Robustness capacity
Robustness (%)
- 1
Service as usual
1.000 0.000 1.000 100
- 2 1.000 0.000 1.000 100 - 3 1.000 0.000 1.000 100 - 4 1.000 0.000 1.000 100
t(hz) 5 Disturbance happened 1.000 0.000 1.000 100
t(he) 6 Disturbance affected 1.000 0.491 0.509 50.852 t(hd) 7 Shock period 1.000 0.491 0.509 50.852
t(ᵟ) 8 Slack time 1.000 0.482 0.518 51.835
1 9
Ideal recovery
1.000 0.458 0.542 54.243
2 10 1.000 0.412 0.588 58.819
3 11 1.000 0.350 0.650 64.996
4 12 1.000 0.280 0.720 71.997
5 13 1.000 0.210 0.790 78.998
6 14 1.000 0.147 0.853 85.298
7 15 1.000 0.096 0.904 90.444
8 16 1.000 0.057 0.943 94.266
9 17 1.000 0.032 0.968 96.846
10 18 1.000 0.016 0.984 98.423
11 19 1.000 0.007 0.993 99.290
12 20 Ending recovery period 1.000 0.003 0.997 99.716
Table C-9. Scenario-1 recovery simulation output.
UI system shocked
t Point
of t Description
Initial capacity
Disturbance effect
Robustness capacity
Robustness (%)
- 1
Service as usual
1.000 0.000 1.000 100
- 2 1.000 0.000 1.000 100
- 3 1.000 0.000 1.000 100 - 4 1.000 0.000 1.000 100
t(hz) 5 Disturbance happened 1.000 0.000 1.000 100
t(he) 6 Disturbance affected 1.000 0.491 0.509 50.852
t(hd) 7 Shock period 1.000 0.491 0.509 50.852
t(ᵟ) 8 Slack time 1.000 0.482 0.518 51.835
1 9
Ideal recovery
1.000 0.477 0.523 52.252
2 10 1.000 0.422 0.578 57.790
3 11 1.000 0.392 0.608 60.763
4 12 1.000 0.354 0.646 64.617
5 13 1.000 0.311 0.689 68.920
6 14 1.000 0.278 0.722 72.201
7 15 1.000 0.237 0.763 76.305
8 16 1.000 0.192 0.808 80.781
9 17 1.000 0.183 0.817 81.671
10 18 1.000 0.161 0.839 83.929
11 19 1.000 0.125 0.875 87.495
12 20 Ending recovery period 1.000 0.097 0.903 90.324

APPENDIX C
Page 329
Table C-10. Scenario-2 recovery simulation output.
UI system shocked
t Point
of t Description
Initial capacity
Disturbance effect
Robustness capacity
Robustness (%)
- 1
Service as usual
1.000 0.000 1.000 100
- 2 1.000 0.000 1.000 100 - 3 1.000 0.000 1.000 100 - 4 1.000 0.000 1.000 100
t(hz) 5 Disturbance happened 1.000 0.000 1.000 100
t(he) 6 Disturbance affected 1.000 0.491 0.509 50.852 t(hd) 7 Shock period 1.000 0.491 0.509 50.852
t(ᵟ) 8 Slack time 1.000 0.482 0.518 51.835
1 9
Ideal recovery
1.000 0.418 0.582 58.214
2 10 1.000 0.392 0.608 60.763
3 11 1.000 0.378 0.622 62.184
4 12 1.000 0.357 0.643 64.330
5 13 1.000 0.344 0.656 65.552
6 14 1.000 0.338 0.662 66.189
7 15 1.000 0.325 0.675 67.504
8 16 1.000 0.299 0.701 70.145
9 17 1.000 0.292 0.708 70.760
10 18 1.000 0.258 0.742 74.232
11 19 1.000 0.230 0.770 77.014
12 20 Ending recovery period 1.000 0.230 0.770 77.014
Table C-11. Scenario-3 recovery simulation output.
UI system shocked
t Point
of t Description
Initial capacity
Disturbance effect
Robustness capacity
Robustness (%)
- 1
Service as usual
1.000 0.000 1.000 100
- 2 1.000 0.000 1.000 100
- 3 1.000 0.000 1.000 100 - 4 1.000 0.000 1.000 100
t(hz) 5 Disturbance happened 1.000 0.000 1.000 100
t(he) 6 Disturbance affected 1.000 0.491 0.509 50.852
t(hd) 7 Shock period 1.000 0.491 0.509 50.852
t(ᵟ) 8 Slack time 1.000 0.482 0.518 51.835
1 9
Ideal recovery
1.000 0.364 0.636 63.591
2 10 1.000 0.342 0.658 65.812
3 11 1.000 0.329 0.671 67.050
4 12 1.000 0.311 0.689 68.920
5 13 1.000 0.300 0.700 69.985
6 14 1.000 0.295 0.705 70.540
7 15 1.000 0.283 0.717 71.686
8 16 1.000 0.260 0.740 73.987
9 17 1.000 0.255 0.745 74.522
10 18 1.000 0.225 0.775 77.548
11 19 1.000 0.200 0.800 79.972
12 20 Ending recovery period 1.000 0.200 0.800 79.972

APPENDIX C
Page 330
Table C-12. Scenario-4 recovery simulation output.
UI system shocked
t Point
of t Description
Initial capacity
Disturbance effect
Robustness capacity
Robustness (%)
- 1
Service as usual
1.000 0.000 1.000 100
- 2 1.000 0.000 1.000 100 - 3 1.000 0.000 1.000 100 - 4 1.000 0.000 1.000 100
t(hz) 5 Disturbance happened 1.000 0.000 1.000 100
t(he) 6 Disturbance affected 1.000 0.491 0.509 50.852 t(hd) 7 Shock period 1.000 0.491 0.509 50.852
t(ᵟ) 8 Slack time 1.000 0.482 0.518 51.835
1 9
Ideal recovery
1.000 0.407 0.593 59.257
2 10 1.000 0.371 0.629 62.894
3 11 1.000 0.367 0.633 63.288
4 12 1.000 0.354 0.646 64.617
5 13 1.000 0.334 0.666 66.625
6 14 1.000 0.322 0.678 67.769
7 15 1.000 0.316 0.684 68.365
8 16 1.000 0.304 0.696 69.595
9 17 1.000 0.279 0.721 72.066
10 18 1.000 0.274 0.726 72.641
11 19 1.000 0.241 0.759 75.890
12 20 Ending recovery period 1.000 0.215 0.785 78.493
Table C-13. Scenario-5 recovery simulation output.
UI system shocked
t Point
of t Description
Initial capacity
Disturbance effect
Robustness capacity
Robustness (%)
- 1
Service as usual
1.000 0.000 1.000 100
- 2 1.000 0.000 1.000 100
- 3 1.000 0.000 1.000 100 - 4 1.000 0.000 1.000 100
t(hz) 5 Disturbance happened 1.000 0.000 1.000 100
t(he) 6 Disturbance affected 1.000 0.491 0.509 50.852
t(hd) 7 Shock period 1.000 0.491 0.509 50.852
t(ᵟ) 8 Slack time 1.000 0.482 0.518 51.835
1 9
Ideal recovery
1.000 0.330 0.670 67.039
2 10 1.000 0.320 0.680 68.006
3 11 1.000 0.301 0.699 69.940
4 12 1.000 0.281 0.719 71.874
5 13 1.000 0.262 0.738 73.808
6 14 1.000 0.243 0.757 75.742
7 15 1.000 0.211 0.789 78.933
8 16 1.000 0.178 0.822 82.221
9 17 1.000 0.185 0.815 81.544
10 18 1.000 0.165 0.835 83.478
11 19 1.000 0.146 0.854 85.413
12 20 Ending recovery period 1.000 0.127 0.873 87.347

APPENDIX D
Page 331
APPENDIX D
Appendix Lists Abstract for Each of the Publication

APPENDIX D
Page 332
-This page intentionally left blank-

APPENDIX D
Page 333
201X Citra S. Ongkowijoyo and Hemanta K. Doloi, Risk Criticality-based Resilient Assessment Model for Urban Infrastructure System: With a Focus on Restoration Modeling and Analysis, International Journal of Reliability Engineering and System Safety.
Abstract
The concept of urban infrastructure (UI) resilience has been introduced and applied to minimize losses from disturbances through enhanced resistance and robustness to extreme events, as well as more effective recovery strategies. While it is acknowledged that resilience concept interrelated highly with risk management, however, conventional resilience analysis model lack to consider risk as crucial metric within analysis bodies. The challenge that experts faced is how best to develop and integrate the general metrics of resilience analysis with risk analysis model which capable to capture and mimic UI system in real life environment, to promote the UI resilience. This research aims to propose a novel conceptual resilience analysis model for measuring UI system focusing on the robustness dimensions. The model rooted in the well-established risk criticality model integrated with the modified resilience analysis which includes the disturbance shock and stress capacity as well as the scenario-based recovery strategies model. To validate and exemplify the model applicability, a numerical example and simulation in urban water supply infrastructure system case study is applied and analysed. The advantages of the model are shown by its capability to capture the uncertainty of risk impact, system capacity facing the disturbance, and recovery strategies complexities towards enhancing system robustness. This research contributes as a practical tool that can be applied to promote the concept of UI resilience in a way that assists local and authorities, and community leaders to develop more suitable decision making towards recovery and restoration policies, programs, strategies and plans. Keywords: Robustness; resilience, risk analysis, urban infrastructure system; recovery and restoration.

APPENDIX D
Page 334
201X Citra S. Ongkowijoyo and Hemanta K. Doloi, Participatory-based Urban Infrastructure System Risk Causality and Interaction Pattern Analysis using Social Network Analysis, International Journal of Reliability Engineering and System Safety.
Abstract
Abstract. The inherent risks within urban infrastructure (UI) system exert significant consequences on the dependent community. While risk is a product of a complex set of network processes, understanding its’ characteristics, such as; causality dynamic and interaction pattern, will give an advantage towards analysing risks. Nonetheless, conventional risk analysis (RA) methods are not designed and lack of capability to assess the causality dynamic and interaction patterns that shape risks based on community perceptions. This research aims to develops a novel RA model in which capable to capture and model the dynamic of risk causality and interaction pattern. The novelty of the model lies in the modified participatory method and risk interaction link weight to comprehensively capture the risks interaction pattern. To test and exemplify, the model is applied in the case of water supply infrastructure system. This study reveals that the model is better suited to capture the intricate processed that shape infrastructure risks. Based on the analysis output, it is found that; (i) the risk causality and interaction pattern characterized by the degree of connectedness between various risks, and (ii) the correlation between risk based on its impact capacity is non-linier. This research contributes in delivering practical tools which could potentially provide a way forward for developing mitigation strategy, intervention, policies and solutions that seek to address risk complex phenomena and thus enhance community resilience. Keywords: Participatory; network analysis; community resilience, infrastructure system, risk analysis

APPENDIX D
Page 335
201X Citra S. Ongkowijoyo and Hemanta K. Doloi, A Network-based Risk Analysis Model for Assessing Urban Infrastructure Risk Impact to Community, Built Environment Project and Asset Management.
Abstract
Abstract. The urban infrastructure (UI) system is crucial for supporting societal needs. Yet, the inherent risks exert significant consequences on the dependent community. As every risk event not necessarily affects everyone equally, the risk analysis (RA) in relation to the individuals and the specificity of impacts is pivotal. Conventional RA methods are lack the capability to analyze the impact of specific risk affecting multitude of people within the community. Utilizing the Social Network Analysis as the main method, this research puts forward a model for mapping and simulating the complex relationships of the risks and the community in relation to UI system. The applicability of the model has been demonstrated using a case research of urban water supply infrastructure. Based on the analysis output, it is found that; (i) the risk impact characterized by the degree of association between actors and risks, and (ii) it is found that the correlation between risk magnitude and its impact capacity is non-linier. Following the findings, analyzing risk towards making crucial decisions cannot lie solely on a single conventional metric. This research demonstrates how the tool of network analysis can be employed to develop network maps between risk and community and discusses the utility of such displays in designing interventions to reduce risk impact. This research contributes in delivering practical tools which can provide a path forwards for developing policies and solutions that seek to address risk complex phenomena and enhance community resilience. Keywords: Risk analysis; two-mode network analysis; community resilience, infrastructure system.

APPENDIX D
Page 336
2017 Citra S. Ongkowijoyo and Hemanta K. Doloi, Determining Critical Infrastructure Risks using Social Network Analysis, International Journal of Disaster Resilience in The Built Environment.
Abstract
Purpose-The purpose of this paper is to develop a novel risk analysis method named fuzzy critical risk analysis (FCRA) for assessing the infrastructure risks from a risk-community network perspective. The basis of this new FCRA method is the integration of existing risk magnitude analysis with the novel risk impact propagation analysis performed in specific infrastructure systems to assess the criticality of risk within specific social-infrastructure interrelated network boundary. Design/methodology/approach-The FCRA uses a number of scientific methods such as failure mode effect and criticality analysis (FMECA), social network analysis (SNA) and fuzzy-set theory to facilitate the building of risk evaluation associated with the infrastructure and the community. The proposed FCRA approach has been developed by integrating the fuzzy-based social network analysis (FSNA) method with conventional fuzzy FMECA method to analyse the most critical risk based on risk decision factors and risk impact propagation generated by various stakeholder perceptions. Findings-The application of FSNA is considered to be highly relevant for investigating the risk impact propagation mechanism based on various stakeholder perceptions within the infrastructure risk interrelation and community networks. Although conventional FMECA methods have the potential for resulting in a reasonable risk ranking based on its magnitude value within the traditional risk assessment method, the lack of considering the domino effect of the infrastructure risk impact, the various degrees of community dependencies and the uncertainty of various stakeholder perceptions made such methods grossly ineffective in the decision-making of risk prevention (and mitigation) and resilience context. Research limitations/implications-The validation of the model is currently based on a hypothetical case which in the future should be applied empirically based on a real case study. Practical implications-Effective functioning of the infrastructure systems for seamless operation of the society is highly crucial. Yet, extreme events resulted in failure scenarios often undermine the efficient operations and consequently affect the community at multiple levels. Current risk analysis methodologies lack to address issues related to diverse impacts on communities and propagation of risks impact within the infrastructure system based on multi-stakeholders’ perspectives. The FCRA developed in this research has been validated in a hypothetical case of infrastructure context. The proposed method will potentially assist the decision-making regarding risk governance, managing the vulnerability of the infrastructure and increasing both the infrastructure and community resilience. Social implications-The new approach developed in this research addresses several infrastructure risks assessment challenges by taking into consideration of not only the risk events associated with the infrastructure systems but also the dependencies of various type communities and cascading effect of risks within the specific risk-community networks. Such a risk-community network analysis provides a good basis for community-based risk management in the context of mitigation of disaster risks and building better community resilient. Originality/value-The novelty of proposed FCRA method is realized due to its ability for improving the estimation accuracy and decision-making based on multi-stakeholder perceptions. The process of assessment of the most critical risks in the hypothetical case project demonstrated an eminent performance of FCRA method as compared to the results in conventional risk analysis method. This research contributes to the literature in several ways. First, based on a comprehensive literature review, this work established a benchmark

APPENDIX D
Page 337
for development of a new risk analysis method within the infrastructure and community networks. Second, this study validates the effectiveness of the model by integrating fuzzy-based FMECA with FSNA. The approach is considered useful from a methodological advancement when prioritizing similar or competing risk criticality values. Keywords: Resilience; disaster response; risk analysis; disaster mitigation; infrastructure management; vulnerable groups.

APPENDIX D
Page 338
2017 Citra S. Ongkowijoyo and Hemanta K. Doloi, Risk-based Resilience Assessment Model Focusing on Urban Infrastructure System Restoration, Procedia Engineering for 7th International Conference on Building Resilience 2017 (ICBR-2017), 27-29 November, Bangkok-Thailand.
Abstract
A number of metrics in the past studies have been proposed and numerically implemented to assess particular system resilience during natural disaster and their recovery in the aftermath of the events. Among such performance measures, resilience is a reliable metric. The resilience assessment on the urban infrastructure system facing disturbances depends on comprehensive risk assessment. Nonetheless, it is found that previous studies lack of putting the risk assessment processes within the resilience assessment bodies. This study proposes a risk criticality-based resilient assessment model for scenario-based resilience assessment of infrastructure systems. The model accounts for uncertainties in the process including; the people expressions towards risks measures, risks magnitude and its impact to community estimation, and the dynamic of causality propagation pattern simulation. The proposed model is applied to water supply infrastructure case study with a hypothetical restoration scenario. The resilience level is assessed and determined based on the maximum resilience level the system can reach. Results of this analysis have shown that a holistic and integrated mitigation plans and strategies that seek to address complex phenomena towards system restoration is a critical requirement. The model will enable stakeholders to systemically assess the most-likely performance of the system during expected risk events. Keywords: Risk assessment; resilience analysis; infrastructure system; urban community.

APPENDIX D
Page 339
2017 Citra S. Ongkowijoyo and Hemanta K. Doloi, Understanding of Impact and Propagation of Risk based on Social Network Analysis, Procedia Engineering for 7th International Conference on Building Resilience 2017 (ICBR-2017), 27-29 November, Bangkok-Thailand.
Abstract
The inherent risks within urban infrastructure system exert significant consequences on the dependent community. As the risk is a product of a complex set of network processes. the complexity is better assessed by understanding the risk nature, interrelationship dynamic and impact propagation pattern. Experts and professionals often use various assessment models and tools to help understand risk nature. Nonetheless, such models are not designed to capture the interconnections that shape risks based on community participation. This study proposes a novel model to capture, draw and simulate the risk impact propagation pattern and interrelationships based on a single mode network analysis. Following the concept of social risk amplification, a process of developing risk network map based on community perspective is presented. The proposed model is applied on a water supply infrastructure system. A total of 30 risk events were used for collection of data from 126 individuals across eight different stakeholder categories. This study reveals that participatory networked approaches to risk interrelationship analysis are better suited to capturing the intricate processed that shape infrastructure risk. This approach could potentially provide a way forward for developing mitigation strategy, intervention and policy that seek to address risk complex phenomena and thus enhancing both infrastructure and community resilience. Keywords: Unimodial network; community resilience, infrastructure system; risk network.

APPENDIX D
Page 340
2016 Citra S. Ongkowijoyo and Hemanta K. Doloi, Setting The Priority of Risks To Community based on Social Network Analysis, 6th International Conference on Building Resilience (ICBR-2016) 2016, 7-9 September, Auckland-New Zealand.
Abstract
The ability to assess the risk and its impact in urban infrastructure context is of great importance supporting the preparedness, response and further fostering the recovery period of the infrastructure in the pre and post extreme event period, as well as significantly improves the building of both society well-being and community resilience. Nonetheless, current risk analysis methods are commonly worked in an isolate manner and focused solely on the technical matter. A missing point on the current risk analysis methodologies is the lack of assessing, determining and prioritizing the impact of risks to different community groups in the face of various specific risk events which is received very little portion of attention in the academia field. This study develops and validates a novel risk analysis method for assessing, setting and prioritizing the risks and its impact level on each of a number of community groups facing multi-hazard events in the context of urban infrastructure systems. The method developed in this study has been validated using a real case study in the Surabaya water supply infrastructure context. The data analysis and simulation result will be explained and discussed as well as the findings. The advantage of the proposed method is it capable to determine and screen both the associated the most endangers risks to several community groups. The proposed method will potentially assist the decision making in regards to the infrastructure risks governance and increasing both the infrastructure and community resilience. Keywords: Community resilience; social network; risk management; urban infrastructure; vulnerability; decision support systems.

APPENDIX D
Page 341
2016 Citra S. Ongkowijoyo and Hemanta K. Doloi, Analyzing Community Hazard in Urban Infrastructure System, 6th International Conference on Building Resilience 2016 (ICBR-2016), 7-9 September, Auckland-New Zealand.
Abstract
The reliable serviceability of urban infrastructure system is crucial for supporting modern society needs. Yet, the inherent hazard events within the respective urban infrastructure system exert significant risks on the dependent community. A number of conventional risk assessment methods are unable to assess the risks in the context of its ripple effect and impact within the community as various stakeholders associated and impacted dissimilar to the existing hazard events. This study intends to fill the risk assessment knowledge gap by applying a social network theory and analysis which can capture, model and simulate the relationship between the inherent urban infrastructure hazard events and the community. A bipartite network analysis, called Bi-NA, utilized to analyze the complex risk problem in a two-mode affiliated social network. The method is applied using the real case study of urban water supply infrastructure in Indonesia context. As many as 30 hazard events identified from both literature review and expert comments in the field, including the fulfilled design-based questionnaire by 126 individual which grouped within 8 stakeholder groups of Surabaya city water supply infrastructure system used as a main input data. The core capability and advantages of the Bi-NA includes; characterizing, portraying, modelling and expressing the association between each individual (stakeholder) with the hazard events. The result, discussion and findings of this study will contribute to the risk management field and as practical tools for the urban communities in order to develop better urban infrastructure system and community resilience. Keywords: Risk assessment; social network; bipartite analysis; infrastructure system.

APPENDIX D
Page 342
2016 Citra S. Ongkowijoyo and Hemanta K. Doloi, Analyzing The Risk Criticality of Infrastructure System on The Community, American Society in Civil Engineering (ASCE) for Construction Research Congress 2016 (CRC-2016), 31 May-2 June, San Juan-Puerto Rico.
Abstract
The importance of infrastructure poses significant complexity and challenges to the society under dynamic and uncertain conditions. Current risk assessment methodologies fail to address effectively the issue related to the criticality of risk in a specific infrastructure system. This issue has highlighted the need to understand both the magnitude and impact propagation mechanism of risk. This study develops a novel risk analysis method to analyze the risk criticality among various risks within specific infrastructure in the dynamic manner of stakeholder perceptions towards risk magnitude and impact propagation mechanism. The developed method is the combination of Failure Mode Effect and Criticality Analysis, Social Network Analysis and Fuzzy-set theory in a group decision-making environment to facilitate the building of risk evaluation. The developed method validated in a hypothetical case of urban water supply infrastructure context. The proposed method identifies and measures critical risk at different level of value when comparing a number of hazard events. The risk analysis model developed prioritizes hazard events by considering risk decision factors and impact network analysis to address the risk magnitude and impact propagation mechanism in the context of risk analysis and decision-making process. Compared to conventional risk assessment method, the proposed method provides more reliable estimation accuracy, increases decision quality and efficiency in risk management decision making. The empirical demonstration will add a significant insight and new perspective of risk analysis in order to prioritize the critical type of risk. Keywords: Infrastructure; Social network; Risk analysis; Fuzzy-theory.
Minerva Access is the Institutional Repository of The University of Melbourne
Author/s:Ongkowijoyo, Citra
Title:A conceptual model for assessing risks and building resilience for urban infrastructuresystem: an Indonesian case
Date:2017
Persistent Link:http://hdl.handle.net/11343/212141
Terms and Conditions:Terms and Conditions: Copyright in works deposited in Minerva Access is retained by thecopyright owner. The work may not be altered without permission from the copyright owner.Readers may only download, print and save electronic copies of whole works for their ownpersonal non-commercial use. Any use that exceeds these limits requires permission fromthe copyright owner. Attribution is essential when quoting or paraphrasing from these works.