TESIS DOCTORAL - Minerva - USC
271
Greenhouse gas fluxes derived from agricultural practices in forage crops in the Atlantic area ARÁNZAZU LOURO LÓPEZ DEPARTAMENTO DE PRODUCCIÓN VEGETAL ESCUELA POLITÉCNICA SUPERIOR LUGO 2015 TESIS DOCTORAL
-
Upload
khangminh22 -
Category
Documents
-
view
0 -
download
0
Transcript of TESIS DOCTORAL - Minerva - USC

Greenhouse gas fluxes derived from agricultural
practices in forage crops in the Atlantic area
ARÁNZAZU LOURO LÓPEZ
DEPARTAMENTO DE PRODUCCIÓN VEGETAL
ESCUELA POLITÉCNICA SUPERIOR
LUGO
2015
TESIS DOCTORAL

Greenhouse gas fluxes derived from agricultural practices
in forage crops in the Atlantic area
Fdo. Aránzazu Louro López
Departamento de Producción Vegetal
Escuela Politécnica Superior
LUGO
2015
TESIS DOCTORAL

AUTORIZACIÓN DE LOS DIRECTORES DE TESIS
Dña. Mª Dolores Báez Bernal, investigadora del "Instituto Galego de Calidade
Alimentaria (INGACAL)" en el Centro de Investigaciones Agrarias de
Mabegondo y Dña. Laura Maritza Nightingale, investigadora de Rothamsted
Research del Department of Sustainable Soil and Grassland Systems
Como directoras de la Tesis Doctoral titulada "Greenhouse gas fluxes derived
from agricultural practices in forage crops in the Atlantic area" presentada por
Dña. Aránzazu Louro López, alumna del programa de Doctoramiento en
Investigación Agraria y Forestal
Autorizan la presentación de la tesis indicada, teniendo en cuenta que cumple con
los requisitos del artículo 34 del Reglamento de Estudios de Doctorado y que no
incurre en las causas de abstención previstas en la Ley 30/1992.
Fdo. Dolores Báez Bernal Fdo. Laura Maritza Nightingale

AUTORIZACIÓN DEL TUTOR DE TESIS
Dña. María Jesús Sainz Osés, profesora titular del Departamento de Producción
Vegetal de la USC
Como tutora de la Tesis Doctoral titulada "Greenhouse gas fluxes derived from
agricultural practices in forage crops in the Atlantic area" presentada por Dña.
Aránzazu Louro López, alumna del programa de Doctoramiento en Investigación
Agraria y Forestal
Autoriza la presentación de la tesis indicada, teniendo en cuenta que cumple con
los requisitos del artículo 34 del Reglamento de Estudios de Doctorado y que no
incurre en las causas de abstención previstas en la Ley 30/1992.
Fdo. María Jesús Sainz Osés

Acknowledgements/ Agradecimientos
Al Instituto Nacional de Investigaciones Agrarias (INIA) por la beca concedida para la elaboración de
esta tesis. Al Centro de Investigaciones Agrarias de Mabegondo (CIAM-INGACAL) y Rothamsted
North Wyke Research por permitir el desarrollo de los experimentos incluidos en esta tesis.
A mis directoras de tesis, Dra. Dolores Báez Bernal y Dra. Laura M. Nightingale así como a la Dra.
María Isabel García Pomar : gracias por la dedicación y apoyo brindado, por aceptar mis sugerencias
e ideas así como la aportación de experiencia y conocimiento a este trabajo. Asimismo, quiero
agradecer a la Dra. M. Jesús Sainz Osés por la orientación, ayuda y atención prestada para la
presentación de esta tesis.
A mis compañeros del CIAM, María José Casal, Pablo, Enma, M. José Bermúdez, Paula, Ángeles,
Fernando, Lalo, Suso, María José, así como muchos otros. A todos, gracias por vuestra disposición
permanente, implicación y esfuerzo, especialmente en los momentos de mayor cantidad de trabajo.
También quisiera agradecer a María Bande, Sonia Pereira, Carmen, Delia y Victoria por lo buenos
momentos y risas que hemos compartido, dentro y fuera del trabajo.
To the 'Dream team': David Chadwick, Laura Cardenas, Takuji Sawamoto, Daniela Pezzolla, Rolan
Bol. I have very good memories of the period we worked together. I learnt that it is possible to do
science and have fun at the same time. It has been a real pleasure to work with all of you and I hope to
have the opportunity to collaborate with you on other experiments in the near future.
I also would like to thank to the staff at Rothamsted Research North Wyke, specially to Neil
Donovan, Liz Dixon, Denise Headon, Patricia Butler, Tim Preston, Nick Bulmer, Andy Retter, Tom
Misselbrook and Dan Dhanoa for their invaluable and essential field, technical, laboratory and
statistical assistance.
To Sabine Peukert, William Roberts, Very Green, Katy Orford, Katharina Wolf, Alixon Moxey,
Henry Oamen Patrick, Alexa Varah, Noémie Prochasson,.Jon Williams and Claire Horrocks for your
support and friendship and for the good moments at work and after work. All of you understand very
well how 'PhD stresses the body'.

To Professor Keith Goulding, from Rothamsted Research Harpenden for his valuable comments and
help on one of the chapters of this thesis includes and to Dr Bob Rees, from the Scothland's Rural
College, and Gary Lanigan, from Teagasc, for the time they have made in their schedules to read and
assess this thesis.
A mis incondicionales amigos, Ana Monteagudo, Nacho, Montse y Alfonso que me habéis apoyando
y animado en todo momento para terminar esta tesis. En especial, a Ana Monteagudo. Tengo que
agradecerte muchas cosas, pero sobre todo lo que me has cuidado y la paciencia que has tenido al
soportarme durante las largas tardes de trabajo en el CIAM. Gracias a ti, los días de trabajo se
hicieron mucho más cortos y agradables. También quiero agradecer el tiempo y la inestimable ayuda
de mi querido amigo Ginés Vidal durante la impresión de esta tesis.
I also would like to thank the families Nightingale (Laura, Elisa, Sofia and Phil) and Sawamoto
(Takuji, Masae and Arisa) for welcoming me and share your family activities with me. My stay away
from my family was not so hard because I felt like I was at home.
A mis queridos padres, Jose y Chus, mis abuelas Chicha y Nené, a mi hermana Olaia, a mi cuñado
Marcos, a mi sobrino Ahimar y a mis tíos Julio y Sara; vosotros deberías de encabezar la lista de
agradecimientos ya que vosotros me habéis enseñado que sin tesón y sacrificio no se alcanza ninguna
meta. Esto me ha servido para llegar a donde he llegado. El camino no ha sido nada fácil y vosotros lo
sabéis mejor que nadie. Me habéis ayudado, escuchado, llorado y reído conmigo, consolado y
levantado de los innumerables estados de derrota en los que me he encontrado y por ello os estaré
eternamente agradecida. Esta tesis os la dedico a todos vosotros.
I also want to thank and dedicate this thesis to the Roberts family (my English family), specially to
my partner, Will. If you did not have enough with the nerves and stress of your own PhD, you have
also joined mine. You have supported me and put up with my stressful moments with incredible
patience as well as sacrificing your holidays, weekends and free time to help me to finish this thesis.
Therefore, I believe that this thesis is also yours.
Greenhouse gas fluxes derived from agricultural practices in forage crops in the Atlantic area
I
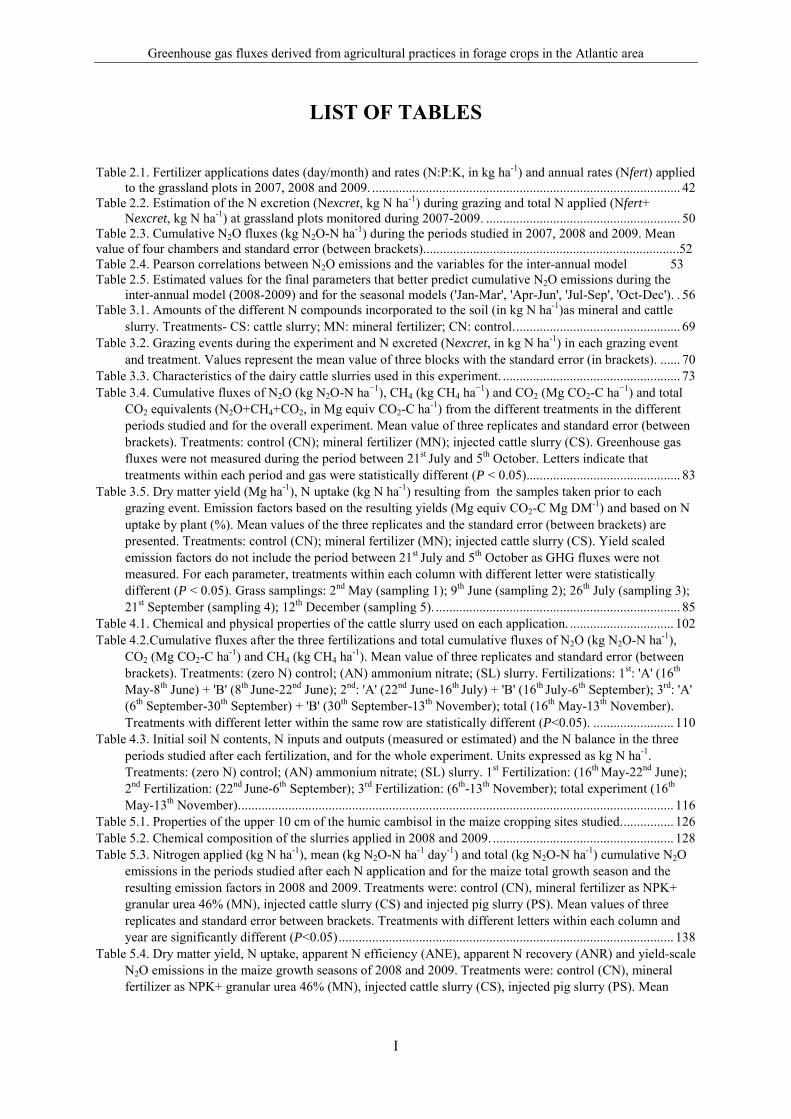
LIST OF TABLES
Table 2.1. Fertilizer applications dates (day/month) and rates (N:P:K, in kg ha-1) and annual rates (Nfert) applied to the grassland plots in 2007, 2008 and 2009. ............................................................................................ 42
Table 2.2. Estimation of the N excretion (Nexcret, kg N ha-1) during grazing and total N applied (Nfert+ Nexcret, kg N ha-1) at grassland plots monitored during 2007-2009. .......................................................... 50
Table 2.3. Cumulative N2O fluxes (kg N2O-N ha-1) during the periods studied in 2007, 2008 and 2009. Mean value of four chambers and standard error (between brackets).............................................................................52 Table 2.4. Pearson correlations between N2O emissions and the variables for the inter-annual model 53 Table 2.5. Estimated values for the final parameters that better predict cumulative N2O emissions during the
inter-annual model (2008-2009) and for the seasonal models ('Jan-Mar', 'Apr-Jun', 'Jul-Sep', 'Oct-Dec'). . 56 Table 3.1. Amounts of the different N compounds incorporated to the soil (in kg N ha-1)as mineral and cattle
slurry. Treatments- CS: cattle slurry; MN: mineral fertilizer; CN: control. ................................................. 69 Table 3.2. Grazing events during the experiment and N excreted (Nexcret, in kg N ha-1) in each grazing event
and treatment. Values represent the mean value of three blocks with the standard error (in brackets). ...... 70 Table 3.3. Characteristics of the dairy cattle slurries used in this experiment. ..................................................... 73 Table 3.4. Cumulative fluxes of N2O (kg N2O-N ha−1), CH4 (kg CH4 ha−1) and CO2 (Mg CO2-C ha−1) and total
CO2 equivalents (N2O+CH4+CO2, in Mg equiv CO2-C ha-1) from the different treatments in the different periods studied and for the overall experiment. Mean value of three replicates and standard error (between brackets). Treatments: control (CN); mineral fertilizer (MN); injected cattle slurry (CS). Greenhouse gas fluxes were not measured during the period between 21st July and 5th October. Letters indicate that treatments within each period and gas were statistically different (P < 0.05).............................................. 83
Table 3.5. Dry matter yield (Mg ha-1), N uptake (kg N ha-1) resulting from the samples taken prior to each grazing event. Emission factors based on the resulting yields (Mg equiv CO2-C Mg DM-1) and based on N uptake by plant (%). Mean values of the three replicates and the standard error (between brackets) are presented. Treatments: control (CN); mineral fertilizer (MN); injected cattle slurry (CS). Yield scaled emission factors do not include the period between 21st July and 5th October as GHG fluxes were not measured. For each parameter, treatments within each column with different letter were statistically different (P < 0.05). Grass samplings: 2nd May (sampling 1); 9th June (sampling 2); 26th July (sampling 3); 21st September (sampling 4); 12th December (sampling 5). ......................................................................... 85
Table 4.1. Chemical and physical properties of the cattle slurry used on each application. ............................... 102 Table 4.2.Cumulative fluxes after the three fertilizations and total cumulative fluxes of N2O (kg N2O-N ha-1),
CO2 (Mg CO2-C ha-1) and CH4 (kg CH4 ha-1). Mean value of three replicates and standard error (between brackets). Treatments: (zero N) control; (AN) ammonium nitrate; (SL) slurry. Fertilizations: 1st: 'A' (16th
May-8th June) + 'B' (8th June-22nd June); 2nd: 'A' (22nd June-16th July) + 'B' (16th July-6th September); 3rd: 'A' (6th September-30th September) + 'B' (30th September-13th November); total (16th May-13th November). Treatments with different letter within the same row are statistically different (P<0.05). ........................ 110
Table 4.3. Initial soil N contents, N inputs and outputs (measured or estimated) and the N balance in the three periods studied after each fertilization, and for the whole experiment. Units expressed as kg N ha-1. Treatments: (zero N) control; (AN) ammonium nitrate; (SL) slurry. 1st Fertilization: (16th May-22nd June); 2nd Fertilization: (22nd June-6th September); 3rd Fertilization: (6th-13th November); total experiment (16th
May-13th November). ................................................................................................................................. 116 Table 5.1. Properties of the upper 10 cm of the humic cambisol in the maize cropping sites studied. ............... 126 Table 5.2. Chemical composition of the slurries applied in 2008 and 2009. ...................................................... 128 Table 5.3. Nitrogen applied (kg N ha-1), mean (kg N2O-N ha-1 day-1) and total (kg N2O-N ha-1) cumulative N2O
emissions in the periods studied after each N application and for the maize total growth season and the resulting emission factors in 2008 and 2009. Treatments were: control (CN), mineral fertilizer as NPK+ granular urea 46% (MN), injected cattle slurry (CS) and injected pig slurry (PS). Mean values of three replicates and standard error between brackets. Treatments with different letters within each column and year are significantly different (P<0.05) .................................................................................................... 138
Table 5.4. Dry matter yield, N uptake, apparent N efficiency (ANE), apparent N recovery (ANR) and yield-scale N2O emissions in the maize growth seasons of 2008 and 2009. Treatments were: control (CN), mineral fertilizer as NPK+ granular urea 46% (MN), injected cattle slurry (CS), injected pig slurry (PS). Mean

Greenhouse gas fluxes derived from agricultural practices in forage crops in the Atlantic area
II
values of three replicates and standard error between brackets. Treatments with different letters within each column and year are significantly different (P<0.05) ........................................................................ 141
Table 5.5. Soil classification and properties (texture, soil OM, C contents), cumulative background and fertilizer induced N2O emissions, and EF from derived from maize cropping studies reviewed. ............................ 145
Table 6.1. Composition of the slurries applied in 2010. ..................................................................................... 153 Table 6.2. Cumulative CH4, N2O and CO2 fluxes in the first 8 days after the first N fertilization (short-term
period) and cumulative warming potential (GWP). Means (standard error) with different letters showing statistical differences (P<0.05). Treatments: injected cattle slurry (CS), injected pig slurry (PS), mineral fertilizer as NPK+ granular urea 46% (MN) and control (CN). Short-term period measured: 25th May-3rd June 2010. .................................................................................................................................................. 163
Table 6.3. Nitrogen applied (kg N ha-1), total (kg N2O N- ha-1) and mean (kg N-N2O m-2 day-1) cumulative N2O fluxes in each period and in the whole crop season with cumulative N2O fluxes transformed to global warming potencial (GWP) (Mg CO2-C equivalents ha-1). Mean values are presented with standard errors in parenthesis and different letters within each column showing significant differences (P<0.05). Treatments: injected cattle slurry (CS), injected pig slurry (PS), mineral fertilizer as NPK+ granular urea 46% (MN) and control (CN). ....................................................................................................................................... 164
Table 6.4. Dry matter yields, N uptake, N input, ANR and yield scaled N2O emissions resulting from the whole maize growing season (long-term period). Mean values of three replicates and standard error between brackets. Treatments with different letter within each column and year are significant different (P<0.05). Treatments: injected cattle slurry (CS), injected pig slurry (PS), mineral fertilizer as NPK+ granular urea 46% (MN) and control (CN). ..................................................................................................................... 165
Greenhouse gas fluxes derived from agricultural practices in forage crops in the Atlantic area
III
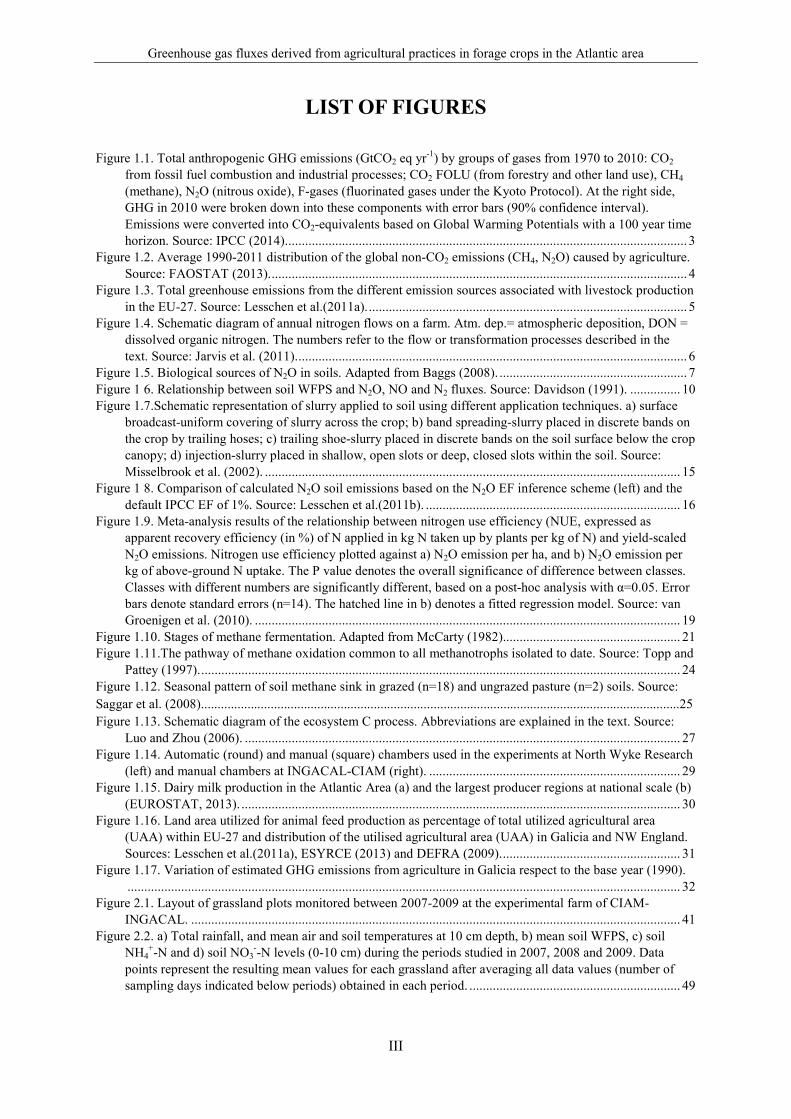
LIST OF FIGURES
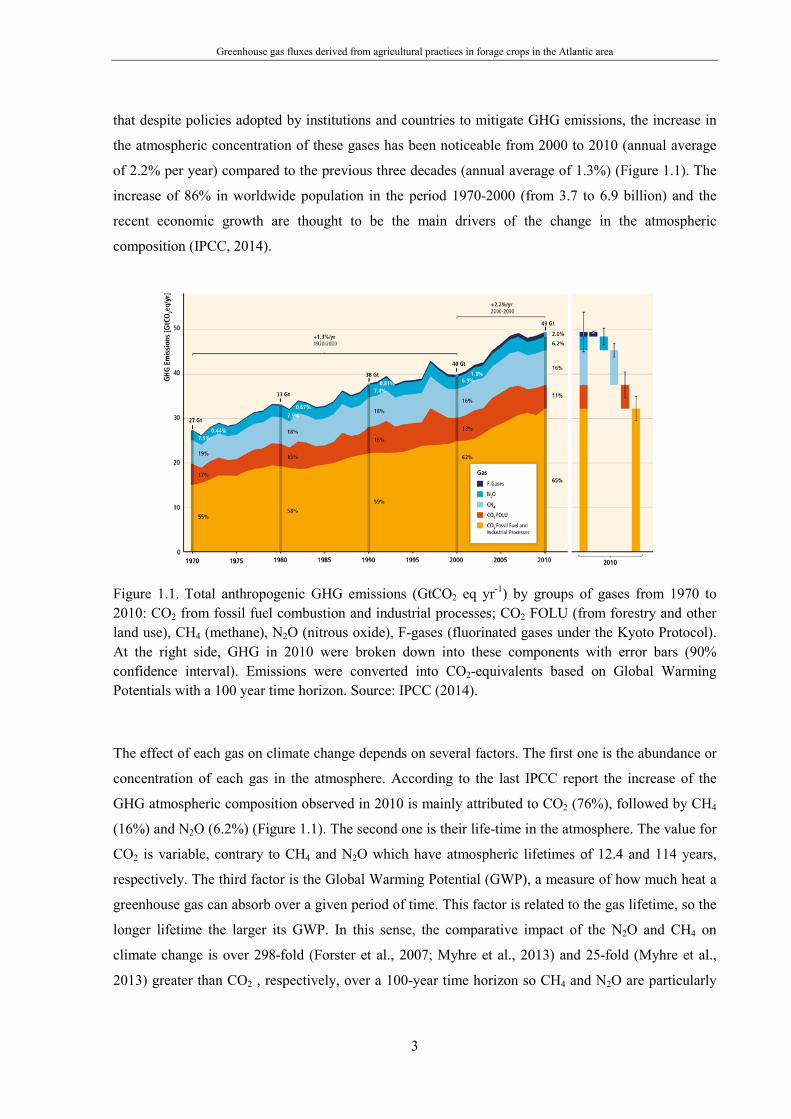
Figure 1.1. Total anthropogenic GHG emissions (GtCO2 eq yr-1) by groups of gases from 1970 to 2010: CO2 from fossil fuel combustion and industrial processes; CO2 FOLU (from forestry and other land use), CH4 (methane), N2O (nitrous oxide), F-gases (fluorinated gases under the Kyoto Protocol). At the right side, GHG in 2010 were broken down into these components with error bars (90% confidence interval). Emissions were converted into CO2-equivalents based on Global Warming Potentials with a 100 year time horizon. Source: IPCC (2014). ....................................................................................................................... 3
Figure 1.2. Average 1990-2011 distribution of the global non-CO2 emissions (CH4, N2O) caused by agriculture. Source: FAOSTAT (2013). ............................................................................................................................ 4
Figure 1.3. Total greenhouse emissions from the different emission sources associated with livestock production in the EU-27. Source: Lesschen et al.(2011a). ............................................................................................... 5
Figure 1.4. Schematic diagram of annual nitrogen flows on a farm. Atm. dep.= atmospheric deposition, DON = dissolved organic nitrogen. The numbers refer to the flow or transformation processes described in the text. Source: Jarvis et al. (2011). .................................................................................................................... 6
Figure 1.5. Biological sources of N2O in soils. Adapted from Baggs (2008). ........................................................ 7 Figure 1 6. Relationship between soil WFPS and N2O, NO and N2 fluxes. Source: Davidson (1991). ............... 10 Figure 1.7.Schematic representation of slurry applied to soil using different application techniques. a) surface
broadcast-uniform covering of slurry across the crop; b) band spreading-slurry placed in discrete bands on the crop by trailing hoses; c) trailing shoe-slurry placed in discrete bands on the soil surface below the crop canopy; d) injection-slurry placed in shallow, open slots or deep, closed slots within the soil. Source: Misselbrook et al. (2002). ............................................................................................................................ 15
Figure 1 8. Comparison of calculated N2O soil emissions based on the N2O EF inference scheme (left) and the default IPCC EF of 1%. Source: Lesschen et al.(2011b). ............................................................................ 16
Figure 1.9. Meta-analysis results of the relationship between nitrogen use efficiency (NUE, expressed as apparent recovery efficiency (in %) of N applied in kg N taken up by plants per kg of N) and yield-scaled N2O emissions. Nitrogen use efficiency plotted against a) N2O emission per ha, and b) N2O emission per kg of above-ground N uptake. The P value denotes the overall significance of difference between classes. Classes with different numbers are significantly different, based on a post-hoc analysis with α=0.05. Error bars denote standard errors (n=14). The hatched line in b) denotes a fitted regression model. Source: van Groenigen et al. (2010). ............................................................................................................................... 19
Figure 1.10. Stages of methane fermentation. Adapted from McCarty (1982)..................................................... 21 Figure 1.11.The pathway of methane oxidation common to all methanotrophs isolated to date. Source: Topp and
Pattey (1997). ............................................................................................................................................... 24 Figure 1.12. Seasonal pattern of soil methane sink in grazed (n=18) and ungrazed pasture (n=2) soils. Source: Saggar et al. (2008)................................................................................................................................................25 Figure 1.13. Schematic diagram of the ecosystem C process. Abbreviations are explained in the text. Source:
Luo and Zhou (2006). .................................................................................................................................. 27 Figure 1.14. Automatic (round) and manual (square) chambers used in the experiments at North Wyke Research
(left) and manual chambers at INGACAL-CIAM (right). ........................................................................... 29 Figure 1.15. Dairy milk production in the Atlantic Area (a) and the largest producer regions at national scale (b)
(EUROSTAT, 2013). ................................................................................................................................... 30 Figure 1.16. Land area utilized for animal feed production as percentage of total utilized agricultural area
(UAA) within EU-27 and distribution of the utilised agricultural area (UAA) in Galicia and NW England. Sources: Lesschen et al.(2011a), ESYRCE (2013) and DEFRA (2009). ..................................................... 31
Figure 1.17. Variation of estimated GHG emissions from agriculture in Galicia respect to the base year (1990). ..................................................................................................................................................................... 32
Figure 2.1. Layout of grassland plots monitored between 2007-2009 at the experimental farm of CIAM-INGACAL. .................................................................................................................................................. 41
Figure 2.2. a) Total rainfall, and mean air and soil temperatures at 10 cm depth, b) mean soil WFPS, c) soil NH4
+-N and d) soil NO3--N levels (0-10 cm) during the periods studied in 2007, 2008 and 2009. Data
points represent the resulting mean values for each grassland after averaging all data values (number of sampling days indicated below periods) obtained in each period. ............................................................... 49

Greenhouse gas fluxes derived from agricultural practices in forage crops in the Atlantic area
IV
Figure 2.3. Daily N2O fluxes observed from the grassland plots monitored in 2007, 2008 and 2009. Data points represent the mean value of four chambers ± standard error. Solid and dotted arrows denote grazing events and fertilization, respectively. Periods- 2007: (20th April-26th December); 2008: (8th January-30th December); 2009 (13th January-14th December). ......................................................................................... 52
Figure 2.4. Effect of changing each parameter on sensitivity analysis for the inter-annual empirical model. Percentage values represent the percentage of variation of the N2O emissions after changing each parameter respect to the baseline N2O emissions (6.0 kg N ha-1, denoted as *). Baseline values used for each parameter were: Nexcret: 22 kg N ha-1; rainfall: 348 mm; mean WFPS: 78.5%; Nfert: 14 kg N ha-1. 55
Figure 3.1. Monthly rainfall and mean air temperatures in 2011 and the 10 years average (2001-2010). ........... 75 Figure 3.2. Daily rainfall and daily mean air temperatures registered during the sampling periods in (a) spring,
summer and (b) autumn. Soil water filled pore space (WFPS) in the samples taken during (c) spring, summer and (d) autumn. In WFPS figures, data represent the mean value of the three replicates and error bars showing the standard error. Arrows represent fertilizations (13th April, 14th June, 8th November) and each grey box represents a grazing period. Treatments: CN: control; MN: mineral fertilizer; CS: injected cattle slurry. Period monitored in spring (13th April-6th June), summer (14th June-20th July) and autumn (6th October-21st December). .............................................................................................................................. 77
Figure 3.3. Soil NH4+-N contents in the samples taken during (a) spring, summer and (b) autumn. Soil NO3
--N contents in c) spring, summer and d) autumn. Data points represent mean value of the three replicates and error bars, the standard error. Arrows represent fertilizations (13th April, 14th June, 8th November) and each grey box represents a grazing period. Treatments: CN: control; MN: mineral fertilizer; CS: injected cattle slurry. Periods monitored in spring (13th April-6th June), summer (14th June-20th July) and autumn (6th October-21st December). .............................................................................................................................. 78
Figure 3.4. A schematic representation of the experiment and GHG fluxes measured during the periods monitored between 13th April and 21st December 2011. .............................................................................. 79
Figure 3.5. Temporal pattern of the a) N2O, b) CH4 and c) CO2 fluxes during the periods measured between 13th April and 21st December. Data represent mean value of three replicates and standard error. Arrows represent fertilizations (13th April, 14th June, 8th November) and each grey box represents a grazing period. Treatments: CN: control; MN: mineral fertilizer; CS: injected cattle slurry. Periods: 'A'- 13th April-13th May; 'B'- 14th May-6th June; 'C'- 14th June-20th July; 'D'- 6th October-7th November; 'E'- 8th November-8th December; 'F'- 9th December-21st December. .............................................................................................. 81
Figure 3.6. Results of a two way ANOVA repeated measures and pairwise multiple comparison test (Student-Newman-Keuls test) for mean cumulative fluxes of (a) N2O, (b) CH4 and (c) CO2. Bars and error bars show the mean and standard error (n = 3). Values below the x-axis show mean value of the periods ('A', 'B', 'C', 'D', 'E', 'F'). Means and bars with different letter show a significant difference using Student-Newman-Keuls test (P > 0.05). Treatments: CN: control; MN: mineral fertilizer; CS: injected cattle slurry. Periods: 'A'- 13th April-13th May; 'B'- 14th May-6th June; 'C'- 14th June-20th July; 'D'- 6th October-7th November; 'E'- 8th November-8th December; 'F'- 9th December-21st December. ......................................... 84
Figure 4.1. (a) Mean monthly rainfall and air temperature in 2011 and the 40-year averages (1961 – 2000). (b) Total daily rainfall and average daily air and soil temperatures recorded during the experiment.............. 104
Figure 4.2. Soil inorganic NH4+-N (a) and NO3
--N (b) contents in the fertilized and control treatments during the 6-month study. Treatments: (zero N) unfertilized or control; (AN) ammonium nitrate; (SL): slurry. Each point represents the mean value of three replicates ± standard error. ........................................................ 106
Figure 4.3. A schematic representation of the time periods studied between N applications. The two groups of periods are represented by the letters 'A' and 'B'. Arrows represent the time of fertilization. .................... 106
Figure 4.4. (a) % Water filled pore space (WFPS) and daily fluxes of N2O (b), CO2 (c) and CH4 (d). Letters 'A' and 'B' represent the different periods after fertilization and horizontal arrows, their length. Periods - 1st Fertilization: 'A' (16th May-8th June) and 'B' (8th-22nd June); 2nd Fertilization: 'A' (22nd June- 16th July) and 'B' (16th July-6th September); 3rd Fertilization: 'A' (6th-30th September) and 'B' (30th September-13th November). Treatments: (zero N) control; (AN) ammonium nitrate; (SL) slurry. Each point represents the mean value of three replicates ± standard error. ........................................................................................ 109
Figure 4.5. Results of a two way ANOVA repeated measures and pairwise multiple comparison test (Tukey test) for a) mean WFPS and mean cumulative fluxes of (b) N2O, (b) CH4 and (c) CO2. Bars and error bars show the mean and standard error (n=3). Values below the x-axis show mean value of the periods ('A', 'B'). Means and bars with the same letter show no significant difference using Tukey test (P>0.05). Treatments: (zero N) control; (AN) ammonium nitrate; (SL) slurry. Periods - 1st Fertilization: 'A' (16th May-8th June)

Greenhouse gas fluxes derived from agricultural practices in forage crops in the Atlantic area
V
and 'B' (8th-22nd June); 2nd Fertilization: 'A' (22nd June- 16th July) and 'B' (16th July-6th September); 3rd Fertilization: 'A' (6th-30th September) and 'B' (30th September-13th November)......................................... 112
Figure 5.1. Timeline and periods considered in a) 2008 and b) 2009. ................................................................ 131 Figure 5.2. Daily rainfall, soil temperatures and air temperatures in a) 2008 and b) 2009. Filled bars represent
daily rainfall and unfilled and filled circles represent daily air and soil temperatures, respectively. Soil water filled pore space (%WFPS) and gravimetric soil moisture contents (%water) following fertilizations in c) 2008 and d) 2009. Data points and error bars represent mean value (n=3) and standard error, respectively. Vertical lines mark periods between N applications. Treatments were: control (CN), mineral fertilizer as NPK+ granular urea 46% (MN), injected pig slurry (PS), injected cattle slurry (CS). Periods were: ˈ2008Iˈ (22nd May-22nd July), ˈ2008IIˈ (22nd July-16th October), ˈ2009Iˈ (22nd May-6th July) and ˈ2009IIˈ (6th July-25th September).............................................................................................................. 135
Figure 5.3. Soil mineral N contents following N applications in 2008 and 2009. Soil NH4+-N in 2008 (a) and
2009 (b). Soil NO3--N contents in 2008 (c) and 2009 (d). Data points and error bars represent mean value
(n=3) and standard error. Vertical lines mark periods between applications. Treatments were: control (CN), mineral fertilizer as NPK+ granular urea 46% (MN), injected cattle slurry (CS) and injected pig slurry (PS). Periods were: ˈ2008Iˈ (22nd May-22nd July), ˈ2008IIˈ (22nd July-16th October), ˈ2009Iˈ (22nd May-6th July) and ˈ2009IIˈ (6th July-25th September) .............................................................................................. 136
Figure 5.4. Nitrous oxide fluxes after N fertilization in a) 2008 and b) 2009. Cumulative N2O emissions in c) 2008 and d) 2009. Data points and error bars represent the mean value of three replicates and the standard error of the mean, respectively. Vertical lines mark periods between applications. Treatments were: control (CN), mineral fertilizer as NPK+ granular urea 46% (MN), injected cattle slurry (CS) and injected pig slurry (PS). Periods were: ˈ2008Iˈ (22nd May-22nd July), ˈ2008IIˈ (22nd July-16th October), ˈ2009Iˈ (22nd May-6th July) and ˈ2009IIˈ (6th July-25th September) ................................................................................ 139
Figure 6.1. Schematic representation of the experiment with the periods considered. ....................................... 155 Figure 6.2. a) Daily rainfall, air and soil temperatures, b) %Water filled pore space (WFPS), c) soil NH4
+-N content and d) NO3
--N contents during the maize crop season in 2010. Points and error bars represent mean value (n: 3) and standard error, respectively. Letters 'A' and 'B' represent the periods studied. Periods- 'A': 25th May-16th July, 'B': 16th July-27th September. Treatments: injected cattle slurry (CS), injected pig slurry (PS), mineral fertilizer as NPK+ granular urea 46% (MN) and control (CN)............................................ 157
Figure 6.3. Short-term CH4 (a), CO2 (b) and N2O fluxes (c) after the first N-fertilization (25th May) and in the following 8 days. Arrows represent fertilization. Data points represent the mean value of three replicates ± standard error. Treatments: control (CN), mineral fertilizer as NPK+ granular urea 46% (MN), injected cattle slurry (CS) and injected pig slurry (PS). Short-term period: 25th May-3rd June. .............................. 160
Figure 6.4. Time course of the N2O fluxes derived from the maize crop season in 2010. Data points represent the mean value of three replicates ± standard error. 'A' 'B' represent the periods studied. Vertical arrows represent fertilizations and horizontal arrows the length of the periods studied. Treatments: control (CN), mineral fertilizer as NPK+ granular urea 46% (MN), injected cattle slurry (CS) and injected pig slurry (PS). Periods- A: 25th May-16th July; B: 16th July-27th September. ............................................................ 161
Greenhouse gas fluxes derived from agricultural practices in forage crops in the Atlantic area
VI
RESUMEN
Según los datos del Grupo Intergubernamental de expertos sobre el cambio climático de las Naciones
Unidas (IPCC), el sector de la agricultura, silvicultura y uso del suelo (AFOLU) es responsable de
casi un cuarto (10-12 Gt CO2 equivalentes por año) de las emisiones de gases de efecto invernadero
(GEI) de carácter antropogénico: óxido nitroso (N2O), metano (CH4) y dióxido de carbono (CO2).
Este hecho es debido principalmente a la deforestación, a las pérdidas procedentes de los suelos
debidas al ciclo de nutrientes y al manejo del ganado. Las pérdidas de gases procedentes de las
prácticas agrícolas en explotaciones de leche están siendo objeto de estudio en todo el mundo. En
concreto, en Europa, el impacto ambiental derivado de la producción de leche está ampliamente
documentado y se están adoptando políticas para mitigar y reducir estas pérdidas. Sin embargo, hasta
la fecha, el impacto del sector lácteo sobre las pérdidas de GEI en el noroeste de España, donde la
producción de leche es una actividad relevante, es todavía bastante desconocido. Es importante
abordar esta laguna de conocimiento debido a la gran influencia que los factores edafoclimáticos
tienen en la magnitud y variabilidad espacial y temporal de los flujos de GEI, y que varían
enormemente de una región a otra.
El objetivo general de este trabajo fue evaluar el impacto de ciertas prácticas agrícolas utilizadas en la
producción lechera sobre las pérdidas de GEI procedentes de los suelos en las condiciones climáticas
atlánticas de Galicia (noroeste de España), para finalmente, obtener recomendaciones de prácticas que
reduzcan las emisiones y aumenten los rendimientos de los cultivos forrajeros. Para abordar este
objetivo principal, se establecieron una serie de objetivos específicos a través de cinco estudios de
experimentación en parcela. Estos objetivos fueron los siguientes:
Desarrollar modelos empíricos que expliquen las variaciones anuales y estacionales
procedentes de praderas aprovechadas por pastoreo con ganado vacuno y fertilizadas,
basándose en la medida de aquellos parámetros que mayor influencia puedan tener en las
emisiones de N2O.
Cuantificar los efectos de la aplicación de fertilizantes minerales y purín de vacuno en la
primavera, el verano y el otoño sobre los GEI procedentes de una pradera aprovechada por
pastoreo.
Conocer el efecto del manejo habitual del purín y del fertilizante mineral en las emisiones de
GEI en un suelo de pradera del suroeste de Inglaterra.

Greenhouse gas fluxes derived from agricultural practices in forage crops in the Atlantic area
VII
Entender la dinámica de los flujos de N2O durante el cultivo del maíz forrajero bajo las
condiciones climáticas gallegas, determinando la influencia del tipo de fertilizantes (purines
inyectados, fertilizante mineral) comúnmente aplicados por los productores gallegos en las
emisiones resultantes.
Investigar la contribución de los diferentes fertilizantes nitrogenados, tradicionalmente
utilizados en Galicia para el cultivo del maíz forrajero en los flujos de CH4, CO2 y N2O en un
período a corto plazo tras su aplicación, cuantificar los flujos totales de N2O durante el todo el
período de crecimiento del cultivo y aportar factores de emisión en función a los rendimientos
obtenidos ('yield scaled N2O emission factors').
Cuatro de estos estudios se llevaron a cabo entre 2007-2011 en el Centro de Investigaciones Agrarias
de Mabegondo (CIAM-INGACAL) en Galicia. El quinto fue desarrollado durante 2011 en
Rothamsted Research North Wyke, en Devon (suroeste de Inglaterra), si bien, en un tipo de suelo y
manejo de la pradera diferentes al de Galicia, bajo condiciones climáticas similares.
En el primer estudio (CIAM-INGACAL, Galicia) el objetivo fue desarrollar modelos empíricos para
explicar las variaciones interanuales y estacionales de las pérdidas de N2O procedentes de praderas
fertilizadas y pastadas mediante la medida de los parámetros de mayor influencia. Para ello se
monitorizaron los flujos de N2O en seis praderas con diferentes manejos de pastoreo y fertilización
mineral y los de una pradera control (CN) (sin aportes de N procedentes del pastoreo o fertilización),
entre los meses de abril del 2007 y diciembre del 2009 usando la técnica de la cámara cerrada. El
primer modelo se desarrolló para predecir las variaciones del N2O emitido a escala anual ('interanual')
y los otros cuatro a nivel estacional (invierno: 'Jan-Mar', primavera: 'Apr-Jun', verano: 'Jul-Sep' y
otoño: 'Oct-Dec'). Los cinco modelos empíricos obtenidos se basaron en las ecuaciones que mejor se
ajustaban (Adj R2) a los siguientes parámetros (predictores): precipitación, temperatura media del aire
y del suelo, media de porcentaje de poros del suelo llenos de agua (WFPS), media del contenido de
amonio (NH4+-N) y nitrato (NO3
--N) en la capa superficial (0-10 cm) del suelo, cantidad de
fertilizante nitrogenado (Nfert) y N excretado por el ganado (Nexcret). Para el modelo 'interanual', se
consideraron los datos correspondientes entre enero 2008 y diciembre 2009. La media anual de la
emisión de N2O (kg ha-1) procedente de las praderas con manejo de N (pastoreo y fertilización
mineral) se encontró en el rango 22,2-30,1 kg N ha-1 y en el rango 12,5-13,6 kg N ha-1 en la pradera
CN. El modelo 'interanual' mostró que el 24% de la variación en la cantidad de N2O emitido fue
causada por la media de WFPS en el suelo, la precipitación, el Nfert y el Nexcret (P<0,001). Otros
factores no incluidos en el modelo y probablemente relacionados con el pastoreo (p.ej. cambios en la
densidad aparente, pH, contenidos de carbono (C) disponible) pudieron haber sido los responsables de
la variación no explicada en el modelo. No se obtuvo un modelo significativo para el periodo 'Jan-

Greenhouse gas fluxes derived from agricultural practices in forage crops in the Atlantic area
VIII
Mar' (P=0,077), probablemente debido a la menor frecuencia de muestreo de gases en esta estación
durante el 2008. Sin embargo, si fueron significativos para el resto de las estaciones. Para los modelos
'Apr-Jun', 'Jul-Sep' y 'Oct-Dec', fueron incluidos los datos correspondientes a cada periodo en 2007,
2008 y 2009, obteniendo variaciones en la emisión acumulada de N2O de hasta 3,5, 2,7 y 2,0 en el
periodo 'Apr-Jun', 'Jul-Sep' y 'Oct-Dec', respectivamente. En 'Apr-Jun', el 77% de la variación fue
causada por el efecto combinado de la temperatura media del suelo y del Nfert (P<0,001). En el
periodo 'Jul-Sep', la combinación de la temperatura media del suelo y del contenido medio de NO3--N
en el suelo explicaron el 72% de la variación (P<0,001). Para el periodo 'Oct-Dec', el 78.4% de la
variación fue debida a las diferencias en la media de WFPS del suelo, en la precipitación, en el
contenido medio de NH4+-N en el suelo y en el Nexcret (P<0,001). Con el objetivo de reducir las
emisiones anuales de N2O procedentes de praderas destinadas a la producción lechera en el noroeste
de España, se sugiere una restricción del número de horas de pastoreo al día, así como evitar el
pastoreo cuando el suelo está muy húmedo, especialmente durante el otoño. Así mismo, se destaca la
necesidad de llevar a cabo más investigaciones de campo para la obtención de modelos que estén
basados en datos más detallados relacionados con el pastoreo y que permitan una mejor predicción de
las variaciones interanuales del N2O.
En el segundo estudio (CIAM-INGACAL, Galicia), el objetivo fue cuantificar los efectos de la
aplicación de fertilizantes minerales y purín de vacuno en las emisiones de GEI procedentes de
praderas pastadas por vacuno de leche así como identificar el tipo de fertilizante que sin elevar los
flujos de GEI incrementa la producción. Los flujos de GEI fueron monitorizados entre abril y
diciembre del 2011 tras las aplicaciones en primavera, verano y otoño de un fertilizante mineral (MN)
así como tras la inyección de purín de vacuno (CS). Además se añadió un tratamiento control sin
fertilización nitrogenada (CN). Las dosis aplicadas en el tratamiento MN fueron de 36, 45 y 40 kg N
ha-1 en primavera, verano y otoño, respectivamente. En el tratamiento CS, se trató de igualar en cada
fertilización la cantidad de N mineral contenido en el purín de vacuno al aplicado en el tratamiento
MN. Teniendo en cuenta esto, 26, 35 y 28 m3 ha-1 de purín de vacuno se inyectaron a 5 cm de
profundidad ('shallow injection') en la primavera, el verano y el otoño, respectivamente. Durante el
año 2011, se produjo una reducción de la precipitación media, especialmente importante durante los
periodos de primavera y verano, causando en el suelo una disminución del WFPS (<60%WFPS).
Estas condiciones de sequía contrastaron con los valores de WFPS (>60%WFPS) observados durante
el otoño debido a la mayor frecuencia en las precipitaciones. Las pérdidas totales acumuladas de N2O
fueron similares en los tratamientos CS y MN (P>0,05), produciéndose las más elevadas durante los
30 primeros días tras la aplicación de primavera, debido a la coincidencia de precipitaciones tras la
aplicación de los fertilizantes así como tras la aplicación de otoño. Se observaron flujos de CH4 de
elevada magnitud inmediatamente después de cada inyección de purín, los cuáles disminuyeron en los
días sucesivos hasta alcanzar valores similares a los tratamientos CN y MN. Los valores totales

Greenhouse gas fluxes derived from agricultural practices in forage crops in the Atlantic area
IX
acumulados de CH4 fueron más elevados en el tratamiento CS que en CN y MN (P<0,05). Los
mayores flujos de CH4 procedentes del tratamiento CS fueron observados tras la aplicación en otoño
(P<0,05). Este resultado pudo deberse al menor contenido en materia seca del purín usado en la
aplicación del otoño, en comparación con el usado en la aplicación de la primavera, lo cual habría
facilitado su infiltración en el suelo y la generación de condiciones más favorables para el proceso
metanogénico. Sin embargo, el contenido en materia seca del purín empleado en la aplicación del
verano fue similar al del otoño, lo cual denotaría que el consumo de CH4 en el suelo en el otoño pudo
estar condicionado por el estado anaeróbico del suelo, incrementando así la cantidad de CH4 liberado
tras la aplicación del purín. También se observaron elevados flujos de CO2 tras cada inyección de
purín y, al igual que el CH4, de corta duración, disminuyendo en los días posteriores a cada aplicación
hasta alcanzar valores similares a los obtenidos con los tratamientos CN y MN. Sin embargo, a pesar
de estos flujos elevados de CO2, no se encontraron diferencias significativas en las pérdidas totales
acumuladas de CO2 respecto a los tratamientos MN y CN (P>0,05). En general, no se encontraron
diferencias significativas entre tratamientos cuando el total de pérdidas de GEI (suma de N2O, CH4 y
CO2) se expresó en equivalentes de CO2 (CO2-C eq ) (P>0,05). Los valores obtenidos se encontraron
en el rango 3,87-4,52 Mg CO2-C eq ha-1. Los factores de emisión en función del rendimiento en
materia seca (DM) obtenido ('yield scaled emission factors') fueron de 3,87 Mg CO2-C eq Mg DM-1
para el tratamiento CN, valor similar a los 4,41 y 4,52 Mg CO2-C eq Mg DM-1 obtenidos con los
tratamientos MN y CS, respectivamente (P>0,05). Las condiciones de sequía del suelo durante la
primavera y el verano podrían haber estimulado la mineralización de la materia orgánica del suelo,
aportando cantidades de N suficientes para cubrir las demandas de la pradera. Como ambos
fertilizantes liberaron cantidades similares totales de equivalentes de CO2 para obtener los mismos
rendimientos, no hubo un beneficio ambiental por la utilización de uno u otro. Sin embargo, si se
considera el coste de la compra de fertilizantes minerales, la inyección de purines de vacuno podría
ser más beneficiosa para los productores de leche ya que las deyecciones ganaderas en las
explotaciones podrían ser reciclados así como se reducirían los costes derivados de la producción de
leche.
En el tercer estudio (Rothamsted Research North Wyke, Inglaterra), el objetivo fue evaluar como la
aplicación de purín de vacuno (SL) o fertilizante mineral (AN) en primavera, verano y otoño afectaba
a la emisión de GEI procedente de un suelo de pradera. El experimento se llevo a cabo entre mayo y
noviembre del 2011 en el sureste de Inglaterra, una región caracterizada por una elevada precipitación
anual (>1000 mm año-1) y por suaves temperaturas (temperatura media anual del aire de 9,6 °C). Los
tratamientos MN y SL fueron aplicados en mayo (primera aplicación), junio (segunda aplicación) y
septiembre (tercera aplicación) con dosis de 80 kg N ha-1 en cada aplicación. Las condiciones de
sequía observadas durante la primavera y el verano (inusuales de la zona de estudio) y las
precipitaciones recogidas en el otoño afectaron al WFPS del suelo resultando en bajos flujos de N2O

Greenhouse gas fluxes derived from agricultural practices in forage crops in the Atlantic area
X
durante el estudio. Tras las primeras dos aplicaciones (en primavera y verano), las condiciones
climáticas disminuyeron los valores de humedad del suelo por debajo del 60%WFPS, el valor umbral
para las pérdidas de N2O por nitrificación. Por el contrario, las precipitaciones frecuentes tras la
tercera aplicación (en otoño) ocasionaron un incremento de los valores de WFPS y estimularon las
pérdidas de N2O por desnitrificación. Respecto al tipo de fertilizante, AN causó mayores emisiones
acumuladas de N2O en comparación con el SL tras la tercera aplicación (P<0,05), probablemente
debidas a las mayores condiciones de anaerobiosis en el suelo en este tratamiento y a la volatilización
del amoniaco (NH3), la cual redujo la cantidad de N mineral en el suelo disponible para la producción
y emisión de N2O. El modelo de regresión múltiple 'Ammonia Loss from Field Applied Manure'
(ALFAM) estimó las pérdidas de N por volatilización de NH3 entre el 25 y el 38% del N aplicado
como consecuencia de la distribución del purín en superficie ('surface broadcast'). La extracción de N
por la planta representó cerca del total del N aplicado en el tratamiento AN tras las dos primeras
aplicaciones y el 59% tras la tercera aplicación, mientras que en el tratamiento SL la extracción de N
por la planta supuso una media del 64% del total de N aplicado. Los flujos de nitrógeno molecular
(N2) no fueron medidos. Sin embargo, las precipitaciones registradas tras la tercera fertilización
incrementaron gradualmente los contenidos de WFPS en el suelo hasta la saturación pudiendo haber
ocasionado pérdidas de N debidas a una completa desnitrificación, especialmente en el tratamiento
AN. Así, las aplicaciones de AN y SL resultaron en pérdidas totales de N2O durante los 6 meses
muestreados de 0,21 y 0,17 kg N ha-1, respectivamente (representando el 0,020 y 0,003% del N
aplicado). Se observó producción de CH4 en los primeros dos o tres días tras las aplicaciones del
tratamiento SL. En el resto de los periodos considerados, el suelo tratado con SL actuó como un
sumidero de CH4, igual que en el tratamiento AN. Se obtuvieron valores totales netos acumulados de -
0,09 y 0,92 kg CH4 ha-1 para los tratamientos AN y SL, respectivamente. Las tasas de producción y
consumo de CH4 estuvieron relacionadas con los cambios en el %WFPS. Así, bajo condiciones de
sequía (por debajo de 60%WFPS) el consumo de CH4 estuvo estimulado, tal y como se observó en
mayo y junio en el tratamiento AN, reduciéndose así mismo la tasa de producción en el tratamiento
SL. Los valores netos acumulados de CO2 obtenidos durante los seis meses muestreados fueron de
1,24 Mg CO2-C ha-1 en el tratamiento AN y 0,35 Mg CO2-C ha-1 en el tratamiento SL.
En el cuarto estudio (CIAM-INGACAL, Galicia), el objetivo fue cuantificar las emisiones de N2O
procedentes de las prácticas de fertilización llevadas a cabo por los productores gallegos de maíz
forrajero (Zea mays L.). El maíz forrajero se cultivó durante los años 2008 y 2009, en emplazamientos
diferentes dentro de la finca experimental. Los flujos de N2O fueron medidos durante todo el periodo
de crecimiento del cultivo tras la aplicación de los siguientes tratamientos: cultivo sin aplicación de N
(CN); con 200 kg N ha-1 de fertilizante mineral (MN); con 200 kg N ha-1 de purín de vacuno inyectado
(CS); con 200 kg N ha-1 de purín de porcino inyectado (PS). El fertilizante mineral se aplicó en dos
dosis: 125 kg N ha-1 en forma de fertilizante NPK en siembra y 75 kg N ha-1 de urea granulada en la

Greenhouse gas fluxes derived from agricultural practices in forage crops in the Atlantic area
XI
cobertera. Los purines de vacuno y porcino fueron aplicados en su totalidad en el momento previo a la
siembra. Se observó que a pesar de que la fertilización incrementó de manera significativa las
pérdidas de N en forma de N2O, el tipo de fertilizante no afectó de manera significativa las emisiones
totales acumuladas en ninguno de los años estudiados (P>0,05). Esto podría deberse al elevado
contenido de C existente en el suelo de ambos emplazamientos. Las emisiones totales acumuladas de
N2O procedentes de los tratamientos con aplicación de N (MN, CS y PS) se encontraron en los rangos
19,8-20,5 kg N ha-1 en 2008 y 10,8-11,7 kg N ha-1 en 2009, siendo el periodo entre la siembra y la
cobertera el de mayor contribución a las emisiones totales resultantes del cultivo de maíz forrajero. La
nitrificación probablemente causó los flujos de N2O observados durante los días siguientes a la
aplicación de N en el momento de la siembra (mayo), sin embargo, las mayores pérdidas de N2O
fueron observadas bajo óptimas condiciones para la desnitrificación. Las variaciones en los flujos de
N2O entre estaciones de cultivo podrían atribuirse, en primer lugar, a una mayor producción de N2
durante 2009 como consecuencia de los contenidos de WFPS más elevados (>80%WFPS) durante la
mayor parte del periodo muestreado en 2009. Las precipitaciones que humedecieron el suelo tras
periodos de sequía acontecidos durante el periodo de cultivo en 2008, ocasionaron los mayores flujos
de N2O observados, y contribuyeron a incrementar aproximadamente un 40% el total de las emisiones
de N2O durante este año. Con el uso de purines o fertilizantes minerales se obtuvieron similares
perdidas de N2O para la obtención de los mismos rendimientos ('yield scaled emission factors')
(P>0,05), con valores tras la aplicación de 200 kg N ha-1 en el rango 1,18-1,23 kg N2O-N Mg-1 DM en
2008 y 0,51-0,58 kg N2O-N Mg-1 DM en 2009. Estos resultados coinciden con los obtenidos en el
quinto estudio (CIAM-INGACAL, Galicia), durante el periodo de cultivo de maíz forrajero en 2010,
donde también se cuantificaron las emisiones totales de N2O durante el periodo de crecimiento del
cultivo y se obtuvieron factores de emisión en función de los rendimientos alcanzados tras la
aplicación de los mismos tipos de fertilizantes nitrogenados. En este estudio, al igual que en el
anterior, la aplicación de fertilizantes nitrogenados incrementó de forma significativa las pérdidas de
N2O, especialmente entre la siembra y la cobertera (P<0,05), con valores de potencial de
calentamiento global (GWP) para el N2O de 1,56 Mg CO2 eq ha-1 en el tratamiento CN (sin adición de
N) y entre 2,33-2,61 Mg CO2 eq ha-1 para los distintos tratamientos con fertilización nitrogenada. No
existieron diferencias significativas entre los valores de GWP para el N2O entre los tratamientos con
aportación de N (P>0,05), probablemente debido al elevado contenido inicial de N mineral del suelo y
las elevadas tasas de mineralización observadas. Como resultado, los fertilizantes no incrementaron la
producción de maíz forrajero, con recuperaciones medias aparentes de nitrógeno (ANR) del 4,29%
(rango entre -3,26 y 11,7%) y 'yield scaled emission factors', expresados como cantidad de N extraído,
de 36,8 g N2O kg N-1 en el tratamiento CN y entre 53,0 y 57,9 g N2O kg N-1 en los tratamientos con
fertilización nitrogenada.

Greenhouse gas fluxes derived from agricultural practices in forage crops in the Atlantic area
XII
En este estudio también se investigó el uso de los diferentes tipos de fertilizantes en los flujos de CH4,
CO2 y N2O en un periodo a corto plazo, que comprendió el día de la aplicación de los tratamientos y
los 8 días sucesivos. Durante este periodo, los mayores valores GWP (suma de N2O, CH4 y CO2)
fueron los obtenidos con los tratamiento PS (0,91 Mg CO2-C eq ha-1) y CS (0,71 Mg CO2-C eq ha-1)
(P>0,05). Esto fue debido a los flujos de CH4 y CO2 observados inmediatamente después de la
inyección en el suelo en estos tratamientos. Por otro lado, el tratamiento MN resulto en similares
valores de GWP (0,33 Mg CO2-C eq ha-1) que en el tratamiento sin aplicación nitrogenada (P>0,05).
Sin embargo, los valores de GWP obtenidos para los tratamientos PS y CS durante el periodo a corto
plazo deben considerarse con precaución ya que la longitud del periodo de muestreo pudo haber
sobrestimado el efecto real de estos tratamientos.
Los cinco estudios planteados en esta tesis permiten extraer las siguientes conclusiones generales:
1. Se observaron grandes variaciones interanuales y estacionales en las emisiones de N2O procedentes
de praderas fertilizadas con fertilizante mineral y aprovechadas por pastoreo con ganado vacuno de
leche. Estas pérdidas estuvieron condicionadas por las variables climáticas y de suelo, pero también
por las diferencias en el manejo del N. Bajo un escenario de futuro cambio climático en Galicia,
previsto por un modelo climático global, una mejora en la gestión del pastoreo podría ayudar a reducir
las pérdidas anuales de N2O derivadas de esta práctica. Los episodios de sequía seguidos de
precipitaciones que humedecen el suelo pueden contribuir de manera significativa a incrementar las
emisiones anuales de N2O de los suelos y, por lo tanto, este hecho justifica seguir investigando en la
identificación de los mecanismos que producen las emisiones del gas en los suelos gallegos.
2. En praderas, la aplicación de purín de vacuno como fertilizante no aumentó de forma significativa
las emisiones de N2O con respecto a la fertilización mineral. Conclusiones similares se obtuvieron
durante el cultivo de maíz forrajero cuando se compararon fertilizantes orgánicos (purín de vacuno y
porcino inyectados) con la fertilización mineral. Los suelos utilizados en los experimentos eran ricos
en carbono por lo que este factor no limitó las emisiones de N2O, y los elevados contenidos de N
mineral en suelo favorecieron las pérdidas de este gas.
3. La modelización del efecto de la técnica de aplicación de purines en praderas mostró que una gran
proporción del N mineral del purín se pierde por volatilización del amoníaco cuando el purín se
distribuye en superficie en comparación con la inyección. Cuando se aplican purines como
fertilizantes, la inyección superficial es recomendable en lugar de la distribución en superficie con el
fin de mitigar las pérdidas indirectas de N2O y aumentar la fracción de N mineral disponible para la
planta.
4. En cuanto a los factores de emisión, la fracción de N perdido en forma de N2O fue inferior al 1%
propuesto por el IPCC cuando la aplicación de fertilizantes se llevó a cabo en condiciones de sequía y
cuando el N mineral en suelo fue factor limitante. Sin embargo, en condiciones climáticas más típicas
Greenhouse gas fluxes derived from agricultural practices in forage crops in the Atlantic area
XIII
de la zona Atlántica, que propiciaron valores de WFPS óptimos para la desnitrificación, las pérdidas
de N2O alcanzaron valores superiores al 1%, viéndose especialmente favorecidas por las elevadas
cantidades de N mineral en suelo.
5. Los suelos de praderas en la zona Atlántica actuaron como sumideros de CH4 y las aplicaciones de
fertilizantes minerales no modificaron la capacidad del suelo para la captación de CH4. Conclusiones
similares se obtuvieron con la aplicación de purines si no se consideran las emisiones de CH4
producidas inmediatamente tras la aplicación y que fueron atribuidas a la liberación del CH4 disuelto
en el purín. Esto denota que las aplicaciones de N en suelos que recibieron N durante años no
modifican la actividad metanotrófica de los microorganismos presentes en dichos suelos.
6. La aplicación de purines no causó un efecto general en la respiración del ecosistema en
comparación con los suelos de pradera no fertilizados o con aplicación de fertilizante mineral, incluso
cuando se consideraron las elevadas emisiones de CO2 producidas inmediatamente después de la
aplicación del purín. En los suelos de praderas, fertilizantes minerales y purines generaron similares
emisiones equivalentes de CO2 para la obtención de rendimientos de cosechas semejantes, por lo que
ambos fertilizantes podrían ser recomendados. Sin embargo, si se considera el coste de la compra de
fertilizantes, el uso de purines inyectados como fertilizante sería más beneficioso para los productores
de leche ya que las deyecciones generadas en las granjas se reciclarían y los costes de producción de
leche se reducirían.
7. En suelos con maíz forrajero, fertilizantes orgánicos y minerales también propiciaron emisiones
similares de N2O para la obtención de los mismos rendimientos de cultivo (expresado por unidad de
materia seca o N extraído). Sin embargo, no lograron aumentar de manera eficiente los rendimientos
del cultivo y causaron grandes pérdidas de N2O. Por ello es necesario adaptar las dosis de N a las
demandas del cultivo, considerando el contenido inicial de N mineral en el suelo en el momento de la
aplicación del N así como la dinámica de la mineralización de la materia orgánica del suelo,
especialmente en el período entre la siembra y la aplicación de cobertera donde la demanda del N por
el cultivo es menor.

Greenhouse gas fluxes derived from agricultural practices in forage crops in the Atlantic area
XIV
ABSTRACT
Losses of nitrous oxide (N2O), methane (CH4) and carbon dioxide (CO2), referred to as ‘greenhouse
gases (GHGs), derived from agricultural practices in dairy farms have been largely documented in
Europe and policies have been adopted to mitigate and reduce those losses, especially in those regions
located in the Atlantic area where this sector has greater importance. However, to date, the impact of
dairy farming on losses of GHG in the NW Spain, where dairy farming is an important sector, is still
unknown. The overall aim of this thesis was to evaluate the impact of the agricultural practices for
dairy farming on losses of GHG from soils under the Atlantic climatic conditions in Galicia (NW
Spain), in order to make recommendations for practices that reduce emissions and increase crop
yields. Large inter-annual and seasonal variations in the N2O emissions from grasslands with dairy
cattle grazing management and mineral fertilization were observed. These losses were driven by
climatic and soil variables but also affected by differences in N management. Under a scenario of
future climate change in Galicia, predicted by a global climatic model, better grazing management
could help to reduce annual N2O losses derived from N-management. Dry-wetting episodes can
significantly contribute to increased annual N2O emissions from soils and therefore justifies further
research to indentify the exact mechanisms in Galician soils. In grasslands, the use of cattle slurry as
fertilizer did not significantly increase N2O emissions with respect to mineral fertilization. Similar
conclusions were obtained during forage maize cropping when organic fertilizers (injected cattle and
pig slurries) were compared with mineral fertilization. The soils used in these experiments were C-
rich so this factor did not limit N2O production, and the large soil mineral N contents stimulated the
losses of this gas. Modelling the effect of slurry application technique on emissions from grasslands
showed that large proportions of mineral N are lost from slurries by ammonia volatilization when
surface broadcast compared to when injected. When using slurries as fertilizers, shallow injection is
recommended rather than surface broadcast application in order to mitigate indirect losses of N2O and
increase the fraction of mineral N available for plant N uptake. In terms of emission factors, the
fraction of N lost as N2O was lower than 1% proposed by IPCC when fertilizer applications coincided
with dry weather conditions and mineral N was limited in soils. However, under the typical climatic
conditions of the Atlantic area, that led optimal WFPS values for denitrification, losses of N2O
derived from fertilization can reach values beyond 1%, especially when soil mineral N levels are
large. Grassland soils in the Atlantic area were sinks of CH4 and mineral fertilizer applications did not
modify soil capacity to CH4 uptake. Similar conclusions were obtained for slurry applications, if the
CH4 emissions observed immediately after slurry application that resulted from the release of the
dissolved CH4 in the slurry were not considered. That denoted that the N applications to soils that
received N for many years did not modify methanotrophy activity of the microorganisms present in
those soils. Slurry applications did not cause an overall effect in the ecosystem respiration compared

Greenhouse gas fluxes derived from agricultural practices in forage crops in the Atlantic area
XV
to non-treated or mineral fertilized grassland soils even when the resulting high CO2 emissions
observed immediately after slurry applications were considered. In grassland soils, mineral fertilizers
and cattle slurries caused similar total CO2 equivalents to produce the same yields, so both fertilizers
could be used. However, if the costs of purchasing mineral fertilizers is considered, using injected
slurries as fertilizer would be more beneficial for dairy farmers as animal wastes produced on farms
would be recycled and milk production costs would be reduced. In forage maize soils, organic and
mineral fertilizers resulted in similar yield-scaled N2O emissions (expressed as dry matter or N
uptake) . However, they failed to efficiently increase crop yields and caused high losses of N2O. Thus,
the initial soil N contents at the moment of the N application and the dynamics of soil organic matter
mineralization must be considered to adapt N rates to efficiently meet crop demands, especially in the
period between sowing and top dressing application when demands are small.

Greenhouse gas fluxes derived from agricultural practices in forage crops in the Atlantic area
XVI
INDEX
LIST OF TABLES I
ABSTRACT XIV
CHAPTER 1. GENERAL INTRODUCTION 1
1.1. The greenhouse effect and climate change 2
1.2. Nitrogen fluxes from agricultural soils 5 1.2.1. Nitrogen cycle in dairy farms 5 1.2.2. Nitrous oxide production processes from soils 6
1.2.2.1. Nitrifier denitrification 7 1.2.2.2. Nitrate ammonification 8 1.2.2.3. Nitrification 8 1.2.2.4. Denitrification 9
1.2.3. Factors influencing N2O production 9 1.2.3.1. Proximal factors 9
1.2.3.1.1. Soil moisture and aeration 9 1.2.3.1.2. Temperature 10 1.2.3.1.3. Available carbon and nitrogen 10 1.2.3.1.4. pH 11
1.2.3.2. Distal factors 11 1.2.3.2.1. Soil texture and composition 11 1.2.3.2.2. Weather conditions 12 1.2.3.2.3. Soil organic matter: mineralization-immobilization 12 1.2.3.2.4. Animal excreta 13 1.2.3.2.5. Fertilization 14 1.2.3.2.6. Nitrogen fixation 16 1.2.3.2.7. Plant N uptake 17
1.2.4. Indirect N2O emissions from soils 17 1.2.4.1. Ammonia volatilization 17 1.2.4.2. Nitrogen losses to groundwater 19
1.3. Methane fluxes from soils 20 1.3.1. Methane production or methanogenesis 20
1.3.1.1. Mechanisms 20 1.3.1.2. Factors influencing the rate of CH4 production 21
1.3.1.2.1. Soil aeration 21 1.3.1.2.2. Presence of inorganic redox substances 22 1.3.1.2.3. Available organic matter 22 1.3.1.2.4. Activity of methanogenic population 22 1.3.1.2.5. Temperature 22 1.3.1.2.6. pH 23
1.3.2. Methane consumption or methanotrophy 23 1.3.2.1. Mechanism 23 1.3.2.2. Factors influencing the rate of CH4 oxidation 24
1.3.2.2.1. Soil aeration, temperature and pH 24 1.3.2.2.2. Soil N levels 25
RESUMEN VI
LIST OF FIGURES III
gvidgim
Texto escrito a máquina
gvidgim
Texto escrito a máquina
Greenhouse gas fluxes derived from agricultural practices in forage crops in the Atlantic area
XVII
1.4. Carbon dioxide fluxes 26
1.5. Methodology for gas measurement 28
1.6. European dairy farming: the Galician case 29
1.7. Legislation to reduce GHG emissions 31
1.8. Aim and objectives 33
CHAPTER 2. INTER-ANNUAL AND INTER-SEASONAL VARIATIONS IN NITROUS OXIDE EMISSIONS FROM GRAZED AND FERTILIZED GRASSLANDS UNDER THE TEMPERATE HUMID CLIMATIC CONDITIONS IN NORTH-WEST SPAIN 37
Abstract 38
2.1. Introduction 39
2.2. Materials and methods 40 2.2.1. Location 40 2.2.2. Experimental design 40 2.2.3. Fertilization 41 2.2.4. Nitrogen excreted by livestock 43 2.2.5. Chamber design and operation 43 2.2.6. Nitrous oxide flux measurements 44 2.2.7. Soil sampling and analyses 44 2.2.8. Meteorological data 45 2.2.9. Statistical prediction. Model development 45
2.2.9.1. Models and data 45 2.2.9.2. Regression method and sensitivity analysis 46
2.3. Results 46 2.3.1. Weather conditions 46 2.3.2. Soil WFPS and mineral N contents. 47 2.3.3. Grazing data and N inputs 48 2.3.4. Nitrous oxide fluxes 48 2.3.5. Cumulative N2O emissions 51 2.3.6. Empirical models to predict N2O emissions 54
2.3.6.1. Correlations 54 2.3.6.2. Forward selection procedure for the inter-annual and seasonal models 54
2.3.7. Sensitivity analysis 55
2.4. Discussion 57 2.4.1. Empirical models 57 2.4.2. Inter-annual variations in N2O emissions. 57 2.4.3. Inter-seasonal variations on N2O emissions 58
2.4.3.1. Winter periods ('Jan-Mar') 58 2.4.3.2. Spring periods ('Apr-Jun') 59 2.4.3.3. Summer periods ('Jul-Sep') 60 2.4.4.4. Autumn periods ('Oct-Dec') 61
2.5. Conclusions 62

Greenhouse gas fluxes derived from agricultural practices in forage crops in the Atlantic area
XVIII
CHAPTER 3. GREENHOUSE GAS (GHG) FLUXES FROM A GRAZED GRASSLAND AFTER CATTLE SLURRY INJECTION AND MINERAL FERTILIZER APPLICATIONS 64
Abstract 65
3.1. Introduction 66
3.2. Material and methods 68 3.2.1. Experimental site and soil characteristics 68 3.2.2. Experimental design 68 3.2.3. Fertilization events and characteristics of mineral fertilizer and slurries applied 68 3.2.4. Grazing events and N excreted by livestock 69 3.2.5. Chamber design and operation 70 3.2.6. Greenhouse gas flux measurements and laboratory analysis 71 3.2.7. Soil sampling and analysis 72 3.2.8. Slurry analysis 72 3.2.9. Grass sampling and analysis 73 3.2.10. Meteorological data 73 3.2.11. Statistical analysis 73
3.3. Results 74 3.3.1. Weather conditions 74 3.3.2. Soil WFPS 75 3.3.3. Soil mineral N 75
3.3.3.1. Ammonium contents 75 3.3.3.2. Nitrate contents 76
3.3.4. Greenhouse gas (GHG) flux measurements 79 3.3.4.1. Nitrous oxide fluxes 79 3.3.4.2. Methane fluxes 80 3.3.4.3. Carbon dioxide fluxes 80
3.3.5. Cumulative GHG fluxes 82 3.3.6. Grass yields, N uptake and yield scaled emission factors 85
3.4. Discussion 86 3.4.1. Nitrous oxide fluxes 86 3.4.1.1. Nitrous oxide fluxes during spring and summer periods 86 3.4.1.2. Nitrous oxide fluxes during the autumn periods 87 3.4.2. Methane fluxes 88 3.4.3. Carbon dioxide fluxes 89 3.4.4. Nitrogen uptake and yield scale emission factors 91
3.5. Conclusion 91
CHAPTER 4. EFFECT OF SLURRY AND AMMONIUM NITRATE APPLICATION ON GREENHOUSE GAS FLUXES OF A GRASSLAND SOIL UNDER ATYPICAL SOUTH WEST ENGLAND WEATHER CONDITIONS 93
Abstract 94
4.1. Introduction 95
4.2. Material and methods 96 4.2.1. Location 96

Greenhouse gas fluxes derived from agricultural practices in forage crops in the Atlantic area
XIX
4.2.2. Experimental design 96 4.2.3. Application events and characteristics of mineral fertilizer and slurry used 97 4.2.4. Chamber design and operation 97 4.2.5. Greenhouse gas flux measurements and laboratory analysis 98 4.2.6. Ammonia (NH3) losses 99 4.2.7. Soil sampling and analysis 100 4.2.8. Slurry analysis 101 4.2.9. Grass yield and composition 102 4.2.10. Meteorological data 103 4.2.11. Statistical analysis 103
4.3. Results 103 4.3.1. Weather conditions 103 4.3.3. Soil WFPS 107 4.3.4. Greenhouse gas fluxes 107 4.3.5. Cumulative GHG fluxes 108 4.3.6. Correlations between GHG fluxes and soil and weather parameters 111
4.4. Discussion 117 4.4.1. Fluxes of N2O 117 4.4.2. Other N losses 118 4.4.3. Fluxes of CH4 119 4.4.4. Fluxes of CO2 120
4.5. Conclusions 121
CHAPTER 5. NITROUS OXIDE EMISSIONS FROM FORAGE MAIZE PRODUCTION ON A HUMIC CAMBISOL FERTILIZED WITH MINERAL FERTILIZER OR SLURRIES IN GALICIA, SPAIN 123
Abstract 124
5.1. Introduction 124
5.2. Material and methods 126 5.2.1. Location 126 5.2.2. Experimental design 126 5.2.3. Fertilization and slurry analysis 127 5.2.4. Sowing, harvesting and plant analysis 128 5.2.5. Nitrogen use efficiency 129 5.2.6. Measurements of N2O fluxes-chamber design and operation 129 5.2.7. Nitrous oxide fluxes 129 5.2.8. Soil sampling and analysis 131 5.2.9. Meteorological data 132 5.2.10. Statistical methods 132
5.3. Results 133 5.3.1. Weather conditions 133 5.3.2. Water filled pore space (WFPS) 133 5.3.3. Soil mineral N 134
5.3.3.1. Soil ammonium contents 134 5.3.3.2. Soil nitrate contents 134
5.3.4. Nitrous oxide fluxes 137 5.3.5. Cumulative N2O emissions 137 5.3.6. Forage maize production and N uptake 140

Greenhouse gas fluxes derived from agricultural practices in forage crops in the Atlantic area
XX
5.4. Discussion 142 5.4.1. Influence of soil mineral N and moisture contents on N2O fluxes 142 5.4.2. Impact of mineral or organic fertilizer on cumulative N2O emissions 143 5.4.3. Yield scale N2O emissions 144
5.5. Conclusions 147
CHAPTER 6. SHORT, LONG-TERM GREENHOUSE GAS (GHG) FLUXES AND YIELD SCALE EMISSION FACTORS DERIVED FROM A FORAGE MAIZE SEASON AFTER THE APPLICATION OF MINERAL AND ORGANIC FERTILIZERS IN NW SPAIN 148
Abstract 149
6.1. Introduction 150
6.2. Material and Methods 151 6.2.1. Study site and experimental design 151 6.2.2. Slurry collection and analyses 152 6.2.3. Plant sampling and analyses 152 6.2.4. Soil sampling and analyses 152 6.2.5. Greenhouse gas sampling and analyses 153 6.2.6. Meteorological data 155 6.2.7. Data and statistical analysis 155
6.3. Results 156 6.3.1. Weather conditions 156 6.3.2. Water filled pore space (WFPS) 156 6.3.3. Soil mineral N 158
6.3.3.1. Ammonium contents 158 6.3.3.2. Nitrate contents 158
6.3.4. Short-term effect of fertilization on GHG fluxes 159 6.3.5. Long-term N2O fluxes 161 6.3.6. Short-term total cumulative GHG fluxes and cumulative global warming potential (GWP) 162 6.3.7. Long-term total N2O emissions and cumulative global warming potential (GWP) 162 6.3.8. Crop yield and yield-scaled N2O emissions 165
6.4. Discussion 165 6.4.1. Fluxes of CH4 and CO2 in the short-term period 165 6.4.2. Nitrous oxide fluxes: short and long-term periods 167 6.4.3. Global warming potential in the short-term experiment and effect of N fertilizers on N2O emitted during the long-term experiment 167 6.4.4. Mineral fertilizer versus injected slurries on N2O fluxes 168 6.4.5. Yield scaled N2O emissions and ANR 169
6.5. Conclusion 170
CHAPTER 7. GENERAL DISCUSSION AND CONCLUSIONS 171
7.1. General discussion 172 7.1.1. Main findings 172 7.1.2. Inter-annual and seasonal variations in N2O emissions 174 7.1.3. Effect of the type of fertilizer on direct losses of N2O and CO2 from soils 177 7.1.4. Slurry application technique and losses of N by NH3 volatilization 179

Greenhouse gas fluxes derived from agricultural practices in forage crops in the Atlantic area
XXI
7.1.5. The effect of fertilizer type and applications on CH4 fluxes from soils 180 7.1.6. Emission factors 181
7.2. Future research 184
7.3. Conclusions 185
7.4. Conclusiones 186
REFERENCES 189
THESIS OUTPUTS 218
APPENDIX 1 222
APPENDIX 2 234

Greenhouse gas fluxes derived from agricultural practices in forage crops in the Atlantic area
1
CHAPTER 1. GENERAL INTRODUCTION

Greenhouse gas fluxes derived from agricultural practices in forage crops in the Atlantic area
2
1.1. The greenhouse effect and climate change
The greenhouse effect and climate change are pressing modern environmental issues. Regularly we
read or listen in the news that concentrations of greenhouse gases in the atmosphere are rising, the
Earth is rapidly warming and its climate is changing. According to the European Environment Agency
(EEA, 2012), the consequence of these effects may lead to an increase of 2.5-4° C in the European
land temperature in the later part of the 21st Century relative to the 1961-1990 average. There will be
more frequent heat waves, variations in precipitation (increase in the northern European countries and
decrease in the southern ones) causing river floods or droughts, and increased warming in the Arctic
and the melting of the Greenland ice sheet. Global sea levels in the 21st century would also rise more
than 1.7 mm a year observed over the 20th century. The report also indicates that climate change will
cause human health effects (i.e. transmission of certain diseases) and changes in plant and animal
characteristics or even the extinction of some species.
The greenhouse effect is a natural effect. Three primary gases make up 99.9% by volume of the
Earth's atmosphere: nitrogen (N2:77.6%), oxygen (O2: 20.9%) and argon (Ar: 0.93%). However, it is
the rare trace gases, carbon dioxide (CO2), methane (CH4), nitrous oxide (N2O), hydrofluorocarbons
(HFCs), perfluorocarbons (PFCs) and sulfur hexafluoride (SF6) that have the greatest effect on our
climate and they are referred to as ‘greenhouse gases (GHGs). They are important as they influence
the radiation balance or neat heat balance of the Earth. When incoming solar radiation passes through
the atmosphere, particles and gases absorb energy. Each particle or gas absorbs energy within a
specific wavelength region. A large percentage of the incoming solar radiation is in the visible region.
Greenhouse gases such as water vapour, CO2 and CH4 have low absorption in this region and allow
most of the visible light to reach the Earth's surface. After absorption at the Earth's surface, visible
energy is transformed and radiated back in the far-infrared (heat) region of the spectrum. The
transparency of the atmosphere to outgoing far-infrared radiation determines how much heat can
escape from the Earth and how much is trapped. The important feature of the greenhouse gases is that
they absorb strongly in the far-infrared and trap heat in the troposphere and stop it from escaping to
space. So without the greenhouse warming effect of the atmosphere, the Earth's average surface would
be about -20°C (-4 °F) instead of 15°C (-59°F) so the balance between the incoming solar radiation
and the amount of GHGs in the atmosphere is important to maintain the Earth's temperature (Hardy,
2003).
Human-induced changes in the atmospheric concentrations of these gases have occurred over recent
decades. In relation to the GHGs that this thesis focuses on (CO2, CH4 and N2O), the
Intergovernmental Panel on Climate Change (IPCC) communicated in the last report released in 2014
Greenhouse gas fluxes derived from agricultural practices in forage crops in the Atlantic area
3
that despite policies adopted by institutions and countries to mitigate GHG emissions, the increase in
the atmospheric concentration of these gases has been noticeable from 2000 to 2010 (annual average
of 2.2% per year) compared to the previous three decades (annual average of 1.3%) (Figure 1.1). The
increase of 86% in worldwide population in the period 1970-2000 (from 3.7 to 6.9 billion) and the
recent economic growth are thought to be the main drivers of the change in the atmospheric
composition (IPCC, 2014).
Figure 1.1. Total anthropogenic GHG emissions (GtCO2 eq yr-1) by groups of gases from 1970 to 2010: CO2 from fossil fuel combustion and industrial processes; CO2 FOLU (from forestry and other land use), CH4 (methane), N2O (nitrous oxide), F-gases (fluorinated gases under the Kyoto Protocol). At the right side, GHG in 2010 were broken down into these components with error bars (90% confidence interval). Emissions were converted into CO2-equivalents based on Global Warming Potentials with a 100 year time horizon. Source: IPCC (2014).
The effect of each gas on climate change depends on several factors. The first one is the abundance or
concentration of each gas in the atmosphere. According to the last IPCC report the increase of the
GHG atmospheric composition observed in 2010 is mainly attributed to CO2 (76%), followed by CH4
(16%) and N2O (6.2%) (Figure 1.1). The second one is their life-time in the atmosphere. The value for
CO2 is variable, contrary to CH4 and N2O which have atmospheric lifetimes of 12.4 and 114 years,
respectively. The third factor is the Global Warming Potential (GWP), a measure of how much heat a
greenhouse gas can absorb over a given period of time. This factor is related to the gas lifetime, so the
longer lifetime the larger its GWP. In this sense, the comparative impact of the N2O and CH4 on
climate change is over 298-fold (Forster et al., 2007; Myhre et al., 2013) and 25-fold (Myhre et al.,
2013) greater than CO2 , respectively, over a 100-year time horizon so CH4 and N2O are particularly
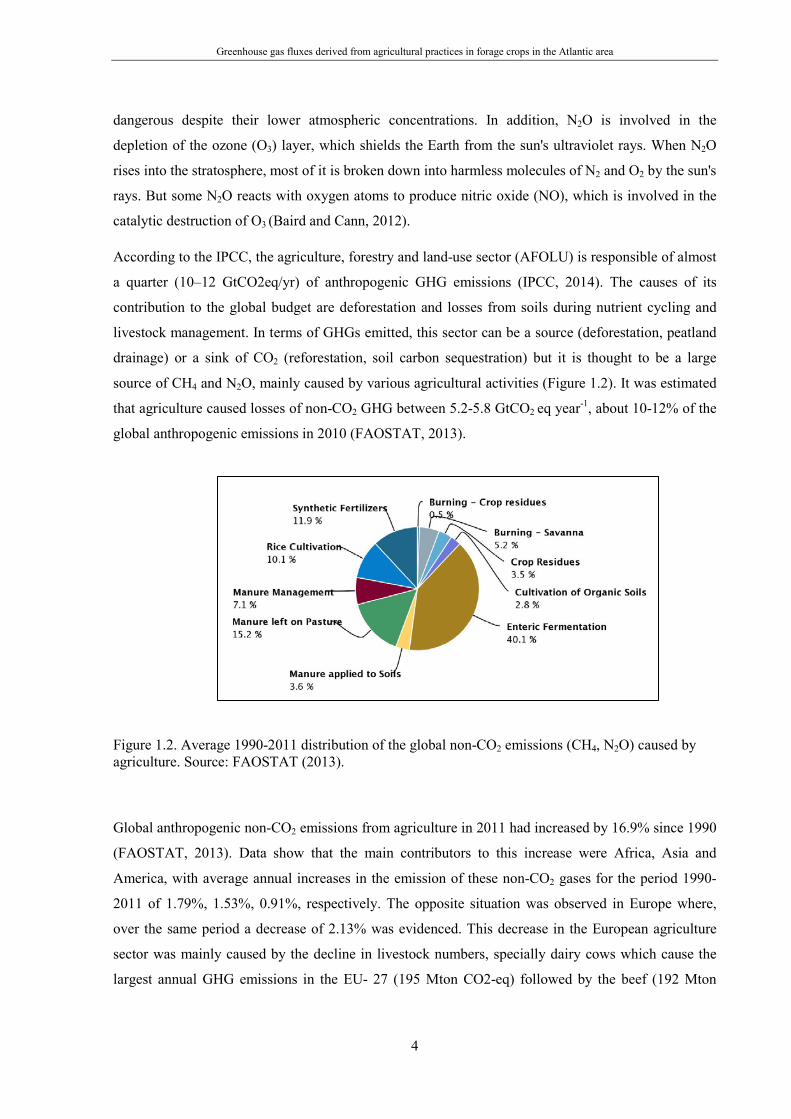
Greenhouse gas fluxes derived from agricultural practices in forage crops in the Atlantic area
4
dangerous despite their lower atmospheric concentrations. In addition, N2O is involved in the
depletion of the ozone (O3) layer, which shields the Earth from the sun's ultraviolet rays. When N2O
rises into the stratosphere, most of it is broken down into harmless molecules of N2 and O2 by the sun's
rays. But some N2O reacts with oxygen atoms to produce nitric oxide (NO), which is involved in the
catalytic destruction of O3 (Baird and Cann, 2012).
According to the IPCC, the agriculture, forestry and land-use sector (AFOLU) is responsible of almost
a quarter (10–12 GtCO2eq/yr) of anthropogenic GHG emissions (IPCC, 2014). The causes of its
contribution to the global budget are deforestation and losses from soils during nutrient cycling and
livestock management. In terms of GHGs emitted, this sector can be a source (deforestation, peatland
drainage) or a sink of CO2 (reforestation, soil carbon sequestration) but it is thought to be a large
source of CH4 and N2O, mainly caused by various agricultural activities (Figure 1.2). It was estimated
that agriculture caused losses of non-CO2 GHG between 5.2-5.8 GtCO2 eq year-1, about 10-12% of the
global anthropogenic emissions in 2010 (FAOSTAT, 2013).
Figure 1.2. Average 1990-2011 distribution of the global non-CO2 emissions (CH4, N2O) caused by agriculture. Source: FAOSTAT (2013).
Global anthropogenic non-CO2 emissions from agriculture in 2011 had increased by 16.9% since 1990
(FAOSTAT, 2013). Data show that the main contributors to this increase were Africa, Asia and
America, with average annual increases in the emission of these non-CO2 gases for the period 1990-
2011 of 1.79%, 1.53%, 0.91%, respectively. The opposite situation was observed in Europe where,
over the same period a decrease of 2.13% was evidenced. This decrease in the European agriculture
sector was mainly caused by the decline in livestock numbers, specially dairy cows which cause the
largest annual GHG emissions in the EU- 27 (195 Mton CO2-eq) followed by the beef (192 Mton
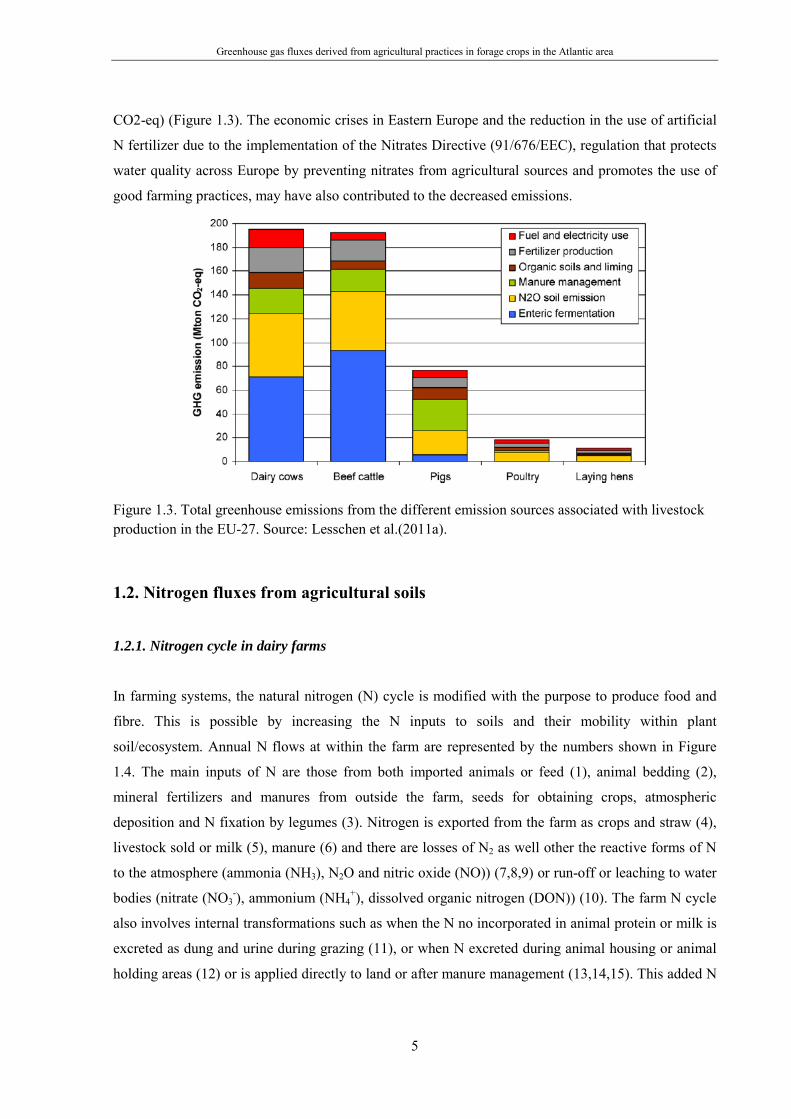
Greenhouse gas fluxes derived from agricultural practices in forage crops in the Atlantic area
5
CO2-eq) (Figure 1.3). The economic crises in Eastern Europe and the reduction in the use of artificial
N fertilizer due to the implementation of the Nitrates Directive (91/676/EEC), regulation that protects
water quality across Europe by preventing nitrates from agricultural sources and promotes the use of
good farming practices, may have also contributed to the decreased emissions.
Figure 1.3. Total greenhouse emissions from the different emission sources associated with livestock production in the EU-27. Source: Lesschen et al.(2011a).
1.2. Nitrogen fluxes from agricultural soils
1.2.1. Nitrogen cycle in dairy farms
In farming systems, the natural nitrogen (N) cycle is modified with the purpose to produce food and
fibre. This is possible by increasing the N inputs to soils and their mobility within plant
soil/ecosystem. Annual N flows at within the farm are represented by the numbers shown in Figure
1.4. The main inputs of N are those from both imported animals or feed (1), animal bedding (2),
mineral fertilizers and manures from outside the farm, seeds for obtaining crops, atmospheric
deposition and N fixation by legumes (3). Nitrogen is exported from the farm as crops and straw (4),
livestock sold or milk (5), manure (6) and there are losses of N2 as well other the reactive forms of N
to the atmosphere (ammonia (NH3), N2O and nitric oxide (NO)) (7,8,9) or run-off or leaching to water
bodies (nitrate (NO3-), ammonium (NH4
+), dissolved organic nitrogen (DON)) (10). The farm N cycle
also involves internal transformations such as when the N no incorporated in animal protein or milk is
excreted as dung and urine during grazing (11), or when N excreted during animal housing or animal
holding areas (12) or is applied directly to land or after manure management (13,14,15). This added N

Greenhouse gas fluxes derived from agricultural practices in forage crops in the Atlantic area
6
can be immobilized in organic N forms or even transformed by mineralization to forms available for
plant uptake and/or for gaseous losses by NH3 volatilization or N2O emissions (19). These loses of the
reactive N are increased compared to natural ecosystems, causing negative consequences for air and
water quality, human health, biodiversity loss and climate change (Erisman et al., 2013; Fowler et al.,
2013).
Figure 1.4. Schematic diagram of annual nitrogen flows on a farm. Atm. dep.= atmospheric deposition, DON = dissolved organic nitrogen. The numbers refer to the flow or transformation processes described in the text. Source: Jarvis et al. (2011).
1.2.2. Nitrous oxide production processes from soils
Agricultural soils are the main emitting sources of N2O and it is produced mainly by a wide range of
soil microorganisms (i.e. bacteria, fungi) which oxidize and reduce inorganic N forms existing in the
soil. The inorganic N forms are used by these organisms as part of their electronic transport systems,
for energy, as a source of electrons or as terminal electron acceptors. As a result of these reactions,
different N gases are released to the atmosphere, including N2O. Some of the reactions that cause N2O
production are represented in Figure 1.5.

Greenhouse gas fluxes derived from agricultural practices in forage crops in the Atlantic area
7
Figure 1.5. Biological sources of N2O in soils. Adapted from Baggs (2008).
1.2.2.1. Nitrifier denitrification
Nitrifier denitrification is the pathway where ammonia oxidising bacteria can reduce nitrite (NO2-) to
N2 via N2O during the ammonia oxidation process (Wrage et al., 2005). This transformation differs
from nitrification in the fact that it does not produce NO3- (Figure 1.5) and also the process occurs
under short-term O2 limitation (Wrage et al., 2005). Most of the N2O emitted from soils has been
attributed to denitrification and, to a lesser extent to autotrophic nitrification (Bateman and Baggs,
2005; Saggar et al., 2009; Trogler, 1999; Williams et al., 1992). However, there are some studies
which highlight the importance of nitrifier denitrification in the N2O produced from soils (Kool et al.,
2011; Venterea, 2007; Wrage et al., 2005). Wrage et al. (2005) studied the contribution of the different
pathways of N2O production in soils using a dual isotopic labelling method (single and double 15N
labelled ammonium nitrate, NH4NO3, with 18O labelled water) and the conventional inhibitor methods
with acetylene (C2H2) and O2. Both isotopic and inhibitor methods identified nitrifier denitrification as
the cause of 44 and 40% of the N2O produced over 24 hours. Kool et al. (2011) using the same double-
isotopic method obtained similar conclusions as Wrage at al. (2005) when moisture conditions are
suboptimal for denitrification.
NH3 NH2OH NO2- NO N2O N2
N2O
NO3-
NO2-
NH4+
N2O NO N2O N2
NitrificationDenitrification
Nitrate ammonification
Nitrifier denitrification
Ammonia monoxygenase
Hydroxylamine oxidoreductase
Nitrate reductase
Nitric oxide reductase
Nitrous oxide reductase
Nitrite oxidoreductase
Nitrate reductase
Nitrite reductase
Nitric oxidereductase
Nitrous oxide reductase
Nitrite reductase

Greenhouse gas fluxes derived from agricultural practices in forage crops in the Atlantic area
8
1.2.2.2. Nitrate ammonification
Another process that has recently been studied in soils is nitrate ammonification or dissimilatory NO3-
reduction to NH4+ (DNRA), which occurs under even more anaerobic conditions than denitrification.
The importance of DNRA is the fact that NO3- is transformed to NO2
- and then to NH4+, which is less
mobile and may conserve N in the ecosystem (Tiedje, 1988) (Figure 1.5). The main factor that
influence the importance of this pathway are, in addition to the reducing (anoxic) soil conditions, high
soil C/NO3- ratios. Large numbers of bacteria and fungi have the ability to perform DNRA. Bacteria
involved in this process are either obligate anaerobes (Clostridium), facultative anaerobes
(Citrobacter, Enterobacter, Erwinia, Escherichia, Klebsiella), aerobes (Bacillus, Pseudomonas)
(Tiedje, 1988) and fungi of the genus Ascomycota (e.g. Fusarium oxysporum) (Zhou et al., 2002).
Rütting et al.(2011) assessed the importance of DNRA in the terrestrial soil cycle based on published
work where 15N tracer techniques were used. They observed that the occurrence of DNRA is
widespread and gross DNRA is reported from temperate and tropical forest soils, temperate grassland
soils and even in an arable soil. According to a multiple linear regression developed in that study, the
largest gross DNRA could be observed in humid regions but the importance of this process (in terms
of % of NO3- consumed) can be larger in temperate climates.
1.2.2.3. Nitrification
Nitrification is an aerobic process performed by autotrophic and heterotrophic organisms. Autotrophic
nitrifiers oxidize NH4+ and NO2
- to obtain energy. In heterotrophic nitrification, bacteria use organic
substances for C as energy source. In general, autotrophic nitrification is the dominant nitrification
pathway in arable soils with heterotrophic nitrification being favoured in more acidic soils (Anderson
et al., 1993; Bremner, 1997; Robertson and Groffman, 2007). In autotrophic nitrification (Figure 1.5),
ammonium (NH4+) is oxidized to nitrate (NO3
-) under aerobic conditions by bacteria. Nitrous oxide is
formed during the first step of the nitrification process called ammonia oxidation where ammonia
(NH3) is oxidized to nitrite (NO2-) via hydroxilamine (NH2OH) (Baggs, 2008; Baggs, 2011; Bremner,
1997; Wrage et al., 2005) by ammonium oxidizing bacteria. Nitrosomonas is the most frequently
identified genus associated with this step, although other genera, including Nitrosococcus, and
Nitrosospira and some subgenera of Nitrosolobus and Nitrosovibrio are also associated (Watson et al.,
1981). In the second step of the process, the NO2- is oxidized to NO3
- by genus Nitrobacter,
Nitrosospira and Nitrococcus.

Greenhouse gas fluxes derived from agricultural practices in forage crops in the Atlantic area
9
1.2.2.4. Denitrification
Denitrification is a microbial process which sequentially reduces NO3- to di-nitrogen (N2) via NO2
-,
nitric oxide (NO) and N2O utilizing organic carbon (C) as the electron donor under conditions with
low soil O2 concentrations (anaerobic) (Morley et al., 2014) (Figure 1.5). More than 60 genera of
denitrifying microorganisms have been identified, which are within the bacteria, archaea, fungi and
eukaryote kingdoms (Baggs, 2011). In terms of denitrifying bacteria, the most important genus are the
heterotrophic facultative bacteria Pseudomonas, Bacillus, Propionibacterium and Tiobacillus (Wrage
et al., 2001). Within the fungi, Fusarium and other fungi such as Ascomycota (e.g. Cylindrocarpon
tonkinense, Gibberella fujikuroii), and Basidiomycota (e.g. Trichosporon cutaneum) are important
(Shoun et al., 1992; Shoun and Tanimoto, 1991).
1.2.3. Factors influencing N2O production
Although N2O can be produced by several pathways in soils, nitrification and denitrification processes
from managed and natural soils are responsible of approximately 56-70% of the global N2O emissions
(Braker and Conrad, 2011; Syakila and Kroeze, 2011). The factors that affect N2O production have
been described as proximal or distal (Robertson, 1989). Proximal factors are those that immediately
affect microbial communities resulting in instantaneous changes in N2O rates and distal factors are
those that control the composition and diversity of denitrifying communities over larger spatial and
temporal scales for a longer term and on a larger scale than proximal regulators.
1.2.3.1. Proximal factors 1.2.3.1.1. Soil moisture and aeration
Soil moisture is a major factor affecting N2O production as it regulates the oxygen availability in the
soil for microbial activity. In wet soils the proportion of air-filled pores is low so O2 diffuses much
slower (Renault and Stengel, 1994). In a large number of studies (e.g. Bateman and Baggs, (2005),
Davison, (1991), Dobbie and Smith (2003), Weier et al. (1993)) soil moisture is expressed as % water
filled pore space (WFPS) which denotes the proportion of the total porosity occupied by water and
therefore the aerobic and anaerobic conditions in a soil. Nitrification is observed in the WFPS range of
30-70% and denitrification becomes the dominant process at WFPS values above 60% (Figure 1.6).
However, when WFPS exceeds 80%, N2O production by denitrification decreases probably because of

Greenhouse gas fluxes derived from agricultural practices in forage crops in the Atlantic area
10
the rapid initialization of strictly anaerobic conditions, resulting in the formation of N2 rather than N2O
(Figure 1.6).
Figure 1.6. Relationship between soil WFPS and N2O, NO and N2 fluxes. Source: Davidson (1991).
1.2.3.1.2. Temperature
According to many studies (Singh et al., 1993; Stark, 1996; Stark and Firestone, 1996), the optimum
temperature for nitrification is environment specific. Most of ammonia oxidizing bacteria have an
optimum growth in the range of 25-30°C. However there is evidence that nitrifier activity can happen
under colder temperatures in winter (2-10°C) (Avrahami and Conrad, 2005; Cookson et al., 2002).
Denitrification is very sensitive to high temperatures as it enhances microbial respiration, resulting in
the depletion of the O2 existing in the soil (Smith et al., 2003). Normally the dependence of
temperature is expressed in terms of ‘Q10’, which is the rate of change of the microbial process when
temperature is increased by 10°C. Dobbie and Smith (2001) obtained Q10 values of 50 for the 5–12°C
and 8.9 for 12–18°C intervals in an arable soil meanwhile the corresponding Q10 values for the
grassland soil were 3.7 and 2.3.
1.2.3.1.3. Available carbon and nitrogen
Mineral N (NH4+, NO3
-) forms are required for the development of the nitrification and denitrification
processes so increasing the availability of these N forms in the soil by applying N fertilizers (mineral
fertilizers or manures) or even urine and dung during grazing may increase N2O emission rates from
Greenhouse gas fluxes derived from agricultural practices in forage crops in the Atlantic area
11
both pathways. Available C influences nitrification and denitrification reactions (Bremner 1997),
because it can stimulate microbial growth and activity, and is also the electron donor required for
denitrifiers (Cameron et al. 2013). Additionally, available C also influences in the oxygen status in
aerobic soils as it increases heterotrophic respiration in aerated soils and thus O2 consumption,
generating the anaerobic conditions necessary for denitrification (Groffman et al., 1988).
1.2.3.1.4. pH
Soil pH is also an important variable that affects the N2O produced by denitrification and nitrification
processes. When denitrification is the main pathway of N2O emission, higher pH values decrease the
soil N2O emissions, but if nitrification is the main process of N2O production, then an increase in the
soil pH stimulates N2O production. Van Den Heuvel et al. (2011), in a laboratory experiment, tested
the effects of a range of pH between 4 and 7 on soil NO3- reduction, N2O and N2 production rates.
They observed that the N2O:N2 emission ratio decreases with pH because the enzyme nitrous oxide
reductase is inhibited by low pH. Similar conclusions were obtained by Čuhel et al.(2010) after an in
situ experiment where they added 15N-labeled NO3− to acidic, neutral pH, and alkaline soils.
According to Šimek and Cooper,(2002), there is no optimum pH for denitrification as denitrifies can
adapt to soil pH but for nitrification Kyveryga et al.(2004) reported an optimum pH of almost 8 (>7.5).
1.2.3.2. Distal factors
1.2.3.2.1. Soil texture and composition
Nitrous oxide emitted is also influenced by soil texture, which influences water movement in the soil
and consequently, soil WFPS. In general, fine textured soils with poor drainage conditions are likely to
emit more N2O for longer periods than coarse soils with well-drained conditions (Barton et al., 1999;
Bouwman et al., 2002; Clayton et al., 1997; Saggar et al., 2004a). However, when these fine textured
soils have very poor-drainage, as in Burchill et al. (2014), high rainfall results in low N2O emissions
because of completely saturated conditions, which are favourable for complete denitrification (N2
production).

Greenhouse gas fluxes derived from agricultural practices in forage crops in the Atlantic area
12
1.2.3.2.2. Weather conditions
The pattern of precipitation and temperature has direct effects on soil functioning as they are key in
the temporal changes in soil moisture contents and temperature, and thus, N2O emissions. Both
parameters are highly specific and vary between soils and climates. In addition to their biochemical
effects on N2O emissions (Section 1.2.2), they also have physical effects such as freeze-thaw and dry-
wetting cycles and also biological effects that result in changes in microbial populations. Freezing and
thawing caused by low temperatures are of special interest as they lead to emissions with significant or
dominant contributions to the annual N2O budget according to observations by Burchill et al. (2014),
Lampe et al. (2006) and Syväsalo et al.(2004) in grassland soils and by Flessa et al. (1995) in arable
soils. These N2O emissions are caused by the release of C and N from soil aggregates that rupture or
microbial cells that lyse during the freezing periods. The released C and N are then available for
denitrifiers during thawing. Additionally, the low temperatures may suppress N2O reductase activity
and therefore alter the N2O/N2 emission ratio (Melin and Nômmik, 1983; Müller et al., 2002; van
Bochove et al., 2000). Likewise, drying-wetting cycles also cause large losses of N2O as it has been
reported in studies in temperate climates (Jørgensen et al., 1998; Kim et al., 2010; Louro et al., 2015),
semi-arid climates (Barton et al., 2008) and under laboratory incubations (Bergstermann et al., 2011).
Some reasons to explain those N2O emissions caused by these cycles are: 1) reduction in the microbial
population and therefore increased levels of microbially derived organic matter (OM) in the soil
during the dry period which the surviving microbial population mineralizes after soil rewetting (Van
Gestel et al., 1993) or 2) disruption of soil aggregates during drying period and exposition of soil OM
to a rapid mineralization (Goebel et al., 2005).
1.2.3.2.3. Soil organic matter: mineralization-immobilization
Nitrogen mineralization is the process by which microbes convert organic N to plant-available
inorganic forms, whereas immobilization is the process where microorganisms take-up inorganic N
forms and convert them into organic forms. The ratio C/N of the OM controls the balance of two soil
biological processes, immobilization-mineralization. Low C/N ratio (generally less than 30 parts of
C:1 part of N) means that the soil organic matter, or that incorporated with residues, supplies enough
N to meet the needs of decomposing organisms so mineral N is released through mineralization and is
available for plant uptake or N2O losses. Contrary, when OM has a high C/N, the supplied N is not
enough so microorganisms require more N (as NH4+ or NO3
-) to decompose the C from the organic
materials and N is immobilized until these microorganisms die and N is released. Crop residues

Greenhouse gas fluxes derived from agricultural practices in forage crops in the Atlantic area
13
incorporated in the soil are a potentially important source of N2O as: i) they provide a supply of easily
mineralizable N, which may be transformed into mineral N, ii) they provide a supply of easily
mineralizable C, which may enhance denitrifier activity and therefore N2O emissions from both soil
mineral N and crop residue N, and iii) they may cause a local increase of the oxygen consumption in
the soil leading to anaerobic soil conditions ideal for denitrification (Lesschen et al., 2011b). Baggs et
al. (2000) observed that the large N2O emissions after incorporation of lettuce residues (C:N ratio:
7.5:1) were probably caused by the stimulation of mineralization, contrary to winter wheat straw
incorporation (C:N: 38:1) which probably caused temporal immobilization.
1.2.3.2.4. Animal excreta
A large fraction of the anthropogenic N2O emissions come from grazed grasslands. The reason is that
little of the N ingested by livestock from feed is used efficiently with 75-95% being excreted as urine
and faeces (Eckard et al., 2010; Saggar et al., 2013). Dairy cows excrete between 197 to 534 g N per
day (Aguerre et al., 2011; Bossuet et al., 2006; Burke et al., 2008; Spek et al., 2013). In urine (68-75%
of excreted N), livestock excretes N mainly as urea (64-94% of urine N) but also other compounds as
allantoin, hippuric acid, creatinine, ammonia, creatine, free amino acids, uric acid, xanthine and
hypoxanthine (Bussink and Oenema, 1998). In dung, the majority of N is organic N. While grazing,
excreted N is deposited unevenly in localised areas where livestock deposit between 800-1300 kg N
ha-1 in a single cow urination patch (area of 0.16 to 0.49 m2) and 2000 kg N ha-1 in a single dung patch
(area 0.05 to 0.09 m2) (Eckard et al., 2010; Haynes and Williams, 1993; Lantinga et al., 1987). These
application rates are more than the soil-plant system can efficiently use so N2O production and
emission is very high especially when grazing and N fertilization are combined (up to 51.3 kg N2O-N
ha-1 year-1 , Rees et al. (2013)). Also, intense animal treading compacts soil, increasing soil WFPS and
thus, causing more anaerobic microsites in the soil that are optimal for denitrification (Drewry et al.,
2008; Simek et al., 2006). De Klein et al. (2006) observed that restricting grazing patterns to 3h per
day during the wettest period of year (autumn/winter) reduced N2O emissions by 40% and prevented
sward damage. Similar results were observed by Luo et al. (2008) who obtained reductions of 60% in
the total N2O emissions during autumn-winter when livestock grazed 6 h instead 24 h.

Greenhouse gas fluxes derived from agricultural practices in forage crops in the Atlantic area
14
1.2.3.2.5. Fertilization
Mineral fertilizers and manures are generally used in dairy farms to increase crop yields but they also
cause large N2O emissions. Manures are valuable fertilizers as they increase productivity of the land
and nutrient cycling as they provide nutrients (N, P, K) for plant nutrition, enhance crop growth and
improve soil structure which is important for air and water circulation, water retention and for greater
penetration of crop roots. They also improve biodiversity as they contain OM which provides nutrients
and energy for microorganisms. The literature reports different losses of N2O after organic and mineral
fertilizer applications as the different studies are influenced by soil and environmental conditions.
Velthof and Mosquera (2011) observed higher N2O emissions from soils fertilized with calcium
ammonium nitrate (CAN) than with slurries in grasslands and the opposite result in maize cropped
soil. Jones et al. (2007) reported losses of N2O of 1.4% of the N applied after application of
ammonium nitrate (NH4NO3) and 0.5% after cattle slurry spreading during the first year of
measurements but no significant difference in the second year. Similar results were also observed by
Bourdin et al. (2014) who reported losses of 1.6% and 0.8% of the N applied as CAN and slurry,
respectively. However, manure applications may affect N2O emissions as they contain large quantities
of labile C (contrary to mineral fertilizers) which may increase microbial respiration rates, thus
depleting oxygen and providing anaerobic conditions for denitrification. Pelster et al. (2012), in a
wheat cropped soil, and Chantigny et al. (2010), in a maize cropped soil, observed that the larger N2O
emissions from manure applications compared to mineral fertilizers were related to low soil C
contents, which is commonly observed in coarse-textured soils.
Slurry can be applied to soil by using techniques such as surface broadcast, band spreading, trailing
shoe or injection into soil (Figure 1.7). Slurry injection is commonly used to avoid losses of N by NH3
volatilization (see Section 1.2.4.1), however, some studies have reported larger denitrification rates
(N2O+N2) after slurry injection respect to other techniques. Dosch and Gutser (1996), using the
acetylene technique, observed denitrification losses of 7.5 kg N ha-1 from injected slurry compared to
4.5 kg N ha-1 after surface band slurry application 100 days after slurry applications. Wulf et al. (2002)
also observed larger N2O emissions after slurry injection to arable and grassland soils compared to
application by splash plate, trail hose and incorporation. Velthof and Mosquera (2011) also observed
that 0.9% and 0.4% of the N applied was lost when cattle slurries were injected and surface-applied,
respectively, to maize soils and losses of 0.4% and 0.1% of the N applied when similar techniques
were used in a grassland soil. They also observed similar results when pig slurry was used in the same
maize soil, causing even higher losses than cattle slurry (3.6 and 0.9% of the N applied by injection
and surface application, respectively). However, other studies as Velthof et al. (1997) and Vallejo et

Greenhouse gas fluxes derived from agricultural practices in forage crops in the Atlantic area
15
al. (2005) did not find a significant difference between manure application techniques in grassland on
total denitrification losses.
As it was observed from the experiments cited above, site specific conditions, weather, crop, type of
fertilizer and application technique influence losses of N2O and these losses are sometimes
overestimated when using the default value of 1% proposed by the Intergovernmental Panel on
Climate Change (IPCC) (IPCC, 2006). Lesschen et al. (2011b), using studies that compared N2O
emissions for different N inputs and environmental factors, developed a inference scheme to quantify
European N2O EFs based on the INTEGRATOR model. They compared the calculated N2O emissions
from agricultural soils with the emissions calculated using the default IPCC EF and observed that
there are clear regionally differences between the EF inference scheme and the IPCC EF (Figure 1.8).
They observed that on the Western part of UK and Ireland and the Northern of Spain, N2O emissions
from soils are higher due to the large annual precipitation. They also observed the effect of soil type in
the Netherlands. According to the EF inference scheme, the largest N2O emissions occur in Western
parts where soils are mainly clay and peat, while the Eastern and Southern parts have lower N2O
emissions because soils are mainly sandy.
Figure 1.7.Schematic representation of slurry applied to soil using different application techniques. a) surface broadcast-uniform covering of slurry across the crop; b) band spreading-slurry placed in discrete bands on the crop by trailing hoses; c) trailing shoe-slurry placed in discrete bands on the soil surface below the crop canopy; d) injection-slurry placed in shallow, open slots or deep, closed slots within the soil. Source: Misselbrook et al. (2002).

Greenhouse gas fluxes derived from agricultural practices in forage crops in the Atlantic area
16
Figure 1.8. Comparison of calculated N2O soil emissions based on the N2O EF inference scheme (left) and the default IPCC EF of 1%. Source: Lesschen et al.(2011b).
1.2.3.2.6. Nitrogen fixation
Nitrogen is an essential nutrient for plant growth as it is required for the synthesis of biomolecules (i.e.
amino acids, proteins, nucleic acids). Nitrogen is stored in soil as OM so this element is often limiting
for most plants and animals as, generally speaking, they can only take up N when it is as the inorganic
forms of ammonium (NH4+-N) and nitrate (NO3
--N). So, in ecosystems where N fertilizers are not
applied, soil N comes mainly from the atmosphere, which is the largest N pool and contains almost
78% of the total N (N gas) available on Earth. Most plants and animals cannot use N directly as gas as
it is in a stable form because of the triple bond that holds the two atoms of N (Galloway et al., 2004).
Instead they rely on N being fixed, that is pulled from the air and bonded to hydrogen and oxygen to
form inorganic compounds they can use. Nitrogen fixation is carried out by a number of fixing
organisms that live in soils but the most important ones are those that form symbiotic relationships
with higher plants, such as rhizobia, which can be found in nodules of the roots of legumes. Symbiotic
nitrogen fixation by rhizobia in legume root nodules injects approximately between 40 and 100 million
tonnes of N into agricultural systems each year (Udvardi and Poole, 2013; Vitousek et al., 2013).
These bacteria have enzymes that can convert N gas directly into N reactive forms which include
ammonia (NH3), ammonium (NH4+), nitrogen oxides (NOx), nitric acid (HNO3), nitrous acid (HONO),

Greenhouse gas fluxes derived from agricultural practices in forage crops in the Atlantic area
17
other organic N compounds (such as urea, nucleic acids, amino acids, proteins) and also nitrous oxide
(N2O) (Fowler et al., 2013).
1.2.3.2.7. Plant N uptake
The primary consideration for mitigating N2O emissions from agricultural lands is to match the supply
of mineral N (from fertiliser applications, legume-fixed N, organic matter, or manures) to the spatial
and temporal needs of crops/pastures/trees as N loaded in excess is susceptible to produce direct or
indirect losses of N2O. An increasing number of studies report greenhouse gas emissions as a function
of crop yield rather than as a function of land area, based on the work by Mosier et al. (2006) and van
Groenigen et al. (2010) . Mosier et al. (2006) proposed the concept of greenhouse gas intensity which
relates to GWP resulting from N2O, CH4 and CO2 emissions to crop yield (grain yield for maize). In
adittion, van Groenigen et al. (2010) introduced the concept of ‘yield-scaled N2O emissions’ which
relates the N2O emitted from cropping systems with the resulting yield. In the latter study, a meta-
analysis was performed based on a review of the literature on non-legume annual crops (maize, wheat,
potato, onion and flooded rice) to relate N application rates, N uptake (above-ground N uptake),
nitrogen use efficiency (NUE), and N2O emissions (Figure 1.9). They postulated that in a world with
increasing food demand and limited land area for expansion of agriculture, agronomic conditions
should be included when assessing N2O emissions and that requires the expression of N2O losses as
function of crop yield. They observed that yield-scaled N2O emissions were lowest where crops were
grown close to their yield potential with high N use efficiency and the increase in yield-scaled
emissions only occurred at high or excessive N rates. They observed a negative and significant
relationship between yield-scale N2O emissions and NUE. They observed decreases from 12.7 to 7.1 g
N2O-N kg-1 N uptake when NUE increased from 19 to 75% (Figure 1.9).
1.2.4. Indirect N2O emissions from soils
1.2.4.1. Ammonia volatilization
Ammonia volatilization is the gaseous loss of NH3 after conversion from NH4+. This process is
important as NH3 loss is a direct loss of plant available N and also causes acidification and
eutrophication of natural ecosystems as it returns to the Earth's surface through wet deposition
(dissolved in rainwater) or dry deposition (attached to particulate matter) (Cameron et al., 2013). In
addition, NH3 re-deposition represents an indirect source of N2O. Bussink and Oenema (1998)
reviewed NH3 losses on dairy farms, which mainly occur during manure applications but also during
Greenhouse gas fluxes derived from agricultural practices in forage crops in the Atlantic area
18
housing, manure storage, grazing, urea-based fertilizer applications and crops. In terms of manure
application, NH3 volatilization is especially important during the first 24h after land application and
the quantity of NH3 lost depends on factors such as characteristics of the material applied (% dry
matter (DM), total N, pH, NH4+), environmental factors (temperature, wind and rainfall) and
application technique (Bourdin et al., 2014; Cameron et al., 2013; Dell et al., 2011; Génermont and
Cellier, 1997; Huijsmans et al., 2003; Misselbrook et al., 2005; Misselbrook et al., 2004a; Smith et al.,
2000; Søgaard et al., 2002; Sommer and Olesen, 1991). Briefly, according to these studies, NH3
volatilization increases with increasing %DM content of the manure applied. This is due to the fact
that manures with large amount of solids tend to have lower fluidity and, therefore less infiltration into
the soil, leaving NH4+ exposed to volatilization. Ammonia volatilization increases when manure
temperature increases, especially within the first hours after manure application. This is also enhanced
with the absence of rainfall and under windy conditions during manure application. Absence of
rainfall reduces NH4+ infiltration into the soil therefore increasing its exposition to air and wind and in
turn enhances the mass transfer and gas exchange between the manure and atmosphere. In terms of
application technique, injection is the technique that causes less NH3 emissions from manure
applications as decreases the exposition of NH4+ to air, resulting in reductions in the NH3 volatilized
by between 40 to 90% with respect to surface applications.
Søgaard et al. (2002), based on empirical data of NH3 loss in experiments from seven European
countries after land applications of cattle and pig slurries, developed a multiple regression model
(ALFAM) that uses a Michaelis-Menten type equation to predict NH3 loss over time (t). This
regression model (R2=80) provides the estimated losses as response to variables that significantly
affect NH3 volatilization such as soil water content, air temperature, wind speed, slurry type, dry
matter content of slurry, total ammoniacal nitrogen content of slurry (TAN), application method and
rate, slurry incorporation and measurement technique. Bourdin et al.(2014) validated the NH3
emissions data obtained after application of cattle slurries by mimicking trailing shoe and splash plate
with ALFAM estimations and obtained a good correlation (R2 0.94).

Greenhouse gas fluxes derived from agricultural practices in forage crops in the Atlantic area
19
Figure 1.9. Meta-analysis results of the relationship between nitrogen use efficiency (NUE, expressed as apparent recovery efficiency (in %) of N applied in kg N taken up by plants per kg of N) and yield-scaled N2O emissions. Nitrogen use efficiency plotted against a) N2O emission per ha, and b) N2O emission per kg of above-ground N uptake. The P value denotes the overall significance of difference between classes. Classes with different numbers are significantly different, based on a post-hoc analysis with α=0.05. Error bars denote standard errors (n=14). The hatched line in b) denotes a fitted regression model. Source: van Groenigen et al. (2010).
1.2.4.2. Nitrogen losses to groundwater
Nitrogen lost into aquatic systems via leaching is also susceptible to be denitrified and result in N2O
emissions. The size of the N pool susceptible to be leached may be determined by the soil N balance
between N inputs from synthetic and organic fertilizers, urine, dung deposition, SOM, mineralization,
atmospheric deposition and N removal, and N soil cycling by immobilization into SOM,
denitrification, NH3 volatilization and plant uptake (Jarvis et al., 1995). Estimates of N leached from
managed grasslands vary widely, ranging from about 5 to 200 kg ha–1 year–1 and this is due to many
factors including differences in N input, N output in excreta, soil drainage and animal type (Monaghan
et al., 2007). Most of the leached N from grazed and fertilized grasslands come from the urine-N
deposited by livestock as this load is above plant N uptake and the excess of nitrate remains in the soil
until drainage and leaching occurs. Di and Cameron (2002) and Silva et al. (1999) reported losses of
up to 124 kg N ha-1 year-1 from urine patches, which contrasted with low losses (<8 kg N ha-1 year-1)
from the inter-urine patch areas. In grasslands for silage cutting, losses of N are lower. Estavillo et al.

Greenhouse gas fluxes derived from agricultural practices in forage crops in the Atlantic area
20
(1995) observed leaching losses in the range 1.6- 5.1% of the N applied (120- 290 kg N ha-1 year-1 as
slurry and CAN) from a poor drained clay grassland soil in the Basque Country. They also reported
that these losses were not as important as denitrification losses. In New Zealand, Di et al. (1998)
reported N leaching losses between 2.5 and 9.8% of the N applied (400 kg N ha-1 year-1) with a dairy
effluent or mineral fertilizer leaching to a sandy loam soil. This shows that nitrate leaching is generally
greater from sandy soils than clay soils because of the slower water movement and the greater
potential for denitrification to occur in clay soils, which itself poses a greater risk of gaseous
emissions. Temporally, the largest risk of N leaching is usually during late autumn, winter or early
spring months where plant N requirements are low and rainfall inputs are high. In arable soils, autumn
rainfall can also leach residual fertiliser nitrate left after the crop has been harvested and nitrate
released by OM mineralisation. A dry summer can result in an accumulation of nitrate in the surface
soil (because of low plant growth and low N uptake) and this nitrate can be leached over the
subsequent winter. Cameron et al. (2013) reported annual losses from maize cropped soils of between
11 and 107 kg N ha-1 with much of this loss being attributed to the period between November and May
before the crop is grown. They also argued that most of NO3- leached often comes from the
mineralization of the organic-N and re-mineralization of fertilized-N that was immobilized earlier
during previous cropping phase.
1.3. Methane fluxes from soils
In European agriculture dairy farms, animal enteric fermentation and manure management are direct
sources of CH4. In soils, CH4 fluxes are the net result of CH4 production by methanogenesis (+) and
CH4 oxidation (-) by methanotrophy processes (Baggs et al., 2006; Ball et al., 1999).
1.3.1. Methane production or methanogenesis
1.3.1.1. Mechanisms
Methanogenesis is a microbial process that may occur in soils when OM is degraded under anaerobic
conditions and produces CH4 and CO2, under low concentrations of sulphate and nitrate.
Methanogenesis can take place in anaerobic soils, such as rice paddies and wetlands, that are rich in
organic matter, which are significant methane sources. This process (Figure 1.10) requires successive
reactions which degrade molecules from complex to simpler compounds (Le Mer and Rogert, 2001;
McCarty, 1982):

Greenhouse gas fluxes derived from agricultural practices in forage crops in the Atlantic area
21
Hydrolysis of biological polymers into monomers such as glucides, fatty acids, amino acids.
This step is performed by hydrolytic microflora that are either aerobic, facultative or strictly
anaerobic.
Acidogenesis from the monomers and intermediary compounds formed during fermentation
to produce volatile fatty acids, organic acids, alcohols, hydrogen (H2) and CO2. This step is
performed by fermentative miroflora that can be either facultative or strictly anaerobic.
Acetogenesis from the previous metabolites to form H2, CO2 and acetate by syntrophic or
homoacetogenic microflora.
Methanogenesis where the metabolites obtained during the acetogenesis step are used by
methanogenic microflora to produce CH4. In most environments where OM decomposition is
important (digesters, freshwater, sediments and submerged soils), the main pathways are
acetoclastic (cleavage of acetate) and hydrogenotrophic methanogenesis (CO2 reduction by
H2) (Conrad, 2005). These bacteria are members of the domain Archaea, or archaebacteria
(Whitman et al., 2006) and although most of methanogenic species cannot use acetate as C
and energy source, acetotrophy methanogenesis is considered the cause of the bulk of CH4
produced.
Figure 1.10. Stages of methane fermentation. Adapted from McCarty (1982).
1.3.1.2. Factors influencing the rate of CH4 production
1.3.1.2.1. Soil aeration
COMPLEX ORGANICS
HIGHER ORGANIC ACIDS
H2
ACETIC ACID
CH4
HYDROLYSYS AND ACIDOGENESIS
ACETOGENESIS AND DEHYDROGENATION
METHANOGENESIS

Greenhouse gas fluxes derived from agricultural practices in forage crops in the Atlantic area
22
In soils, methanogenesis occurs in environments such as wetlands and rice fields where conditions are
highly reduced (Bachoon and Jones, 1992) (Eh<-200 mV, Le Mer and Rogert (2001)). The reason of
the low oxide-reduction conditions is due to fact that methanogens are strict anaerobes and the
presence of oxygen leads to the formation of reactive oxygen species, which damage cell membranes,
DNA and proteins and, in particular, promote the dissociation of the crucial electron transporter
(F420-hydrogenase enzyme complex) in methanogenesis (Schönheit et al., 1981; Storz et al., 1990).
1.3.1.2.2. Presence of inorganic redox substances
Methanogens are poor competitors for hydrogen and acetate in the presence of substances such as
NO3-, iron (Fe3+), sulphates (SO4
2-) and manganese (Mn4+) (Le Mer and Rogert, 2001; Whitman et al.,
2006). Thus, even in the absence of O2, hydrogenotrophic and acetolastic methanogenesis only takes
place when these substances are depleted (Kumaraswamy et al., 2001; Segers and Kengen, 1998;
Zehnder and Stumm, 1988). Kumaraswamy et al. (2001) tested the effects of the adittion of these
substances on CH4 production in anoxic rice soil samples. They observed that SO42- was the most
inhibitory compound for methane production followed by Fe3+, NO3-, and Mn4+.
1.3.1.2.3. Available organic matter
Once anaerobiosis is established, organic matter is considered as the major limiting factor for methane
production. Both the addition of direct methanogenic substrates like hydrogen or acetate, and the
addition of indirect substrates like glucose and leaf leachate, enhances methane production in
anaerobically incubated soil samples (Amaral and Knowles, 1994; Bachoon and Jones, 1992;
Valentine et al., 1994).
1.3.1.2.4. Activity of methanogenic population
Limitation of methane production by the microbial biomass occurs when microbial uptake capacity
does not meet by substrate supply. In principle, it can be a result of a periodical damage to
methanogenic population due to poisoning as result of aerobiosis or starvation, due to competition for
substrates with aerobic microorganisms (Segers and Kengen, 1998).
1.3.1.2.5. Temperature
Greenhouse gas fluxes derived from agricultural practices in forage crops in the Atlantic area
23
Methanogens are very responsive to temperature changes within their functional temperature range.
Most methanogens are able to function in a temperature range of about 20–40°C. Laboratory
incubations of peat soil showed Q10 values of 5.6-16 for temperatures between 0 and 35°C (Dunfield et
al., 1993).
1.3.1.2.6. pH
The pH range for methanotrophic activity in soils is wide. Most methanogens grow in the pH range of
6.0–8.0 but some can function under acidic conditions (pH< 3.5), as is the case for the genera
Methylocella and Methylocapsa and species of Methylocystis isolated from peatlands and acidic
forests (Dedysh et al., 2007; Dedysh et al., 2002).
1.3.2. Methane consumption or methanotrophy
1.3.2.1. Mechanism
Under aerobic conditions, soil methanotrophs communities can oxidize the CH4 produced in anaerobic
parts of the soil and atmospheric CH4 (Figure 1.11). There are two distinct populations which have
been found in most of soils: low capacity oxidizers (also 'high affinity oxidation') which are those that
receive CH4 only by diffusion from the atmosphere (e.g. forest soils) and those adapted to oxidize high
CH4 concentrations in the soil ('low affinity oxidation') (e.g. in wetlands, landfill and peat soils) (Le
Mer and Rogert, 2001; Reay and Nedwell, 2004). Methane is oxidized to carbon dioxide by sequential
reactions catalyzed by the enzymes methane monooxygenase (Methane MO), methanol
dehydrogenase (Methanol DH), formaldehyde dehydrogenase (Formaldehyde DH), and formate
dehydrogenase (Formate DH). Methane monooxygenase also catalyzes the oxidation of ammonia to
hydroxylamine, which is then further oxidized to nitrite with the accompanying production of nitrous
oxide. The cofactors nicotinamide adenine dinucleotide (NADH) and pyrrolo-quinoline quinone
(PQQ) participate as electron carriers (Topp and Pattey, 1997).
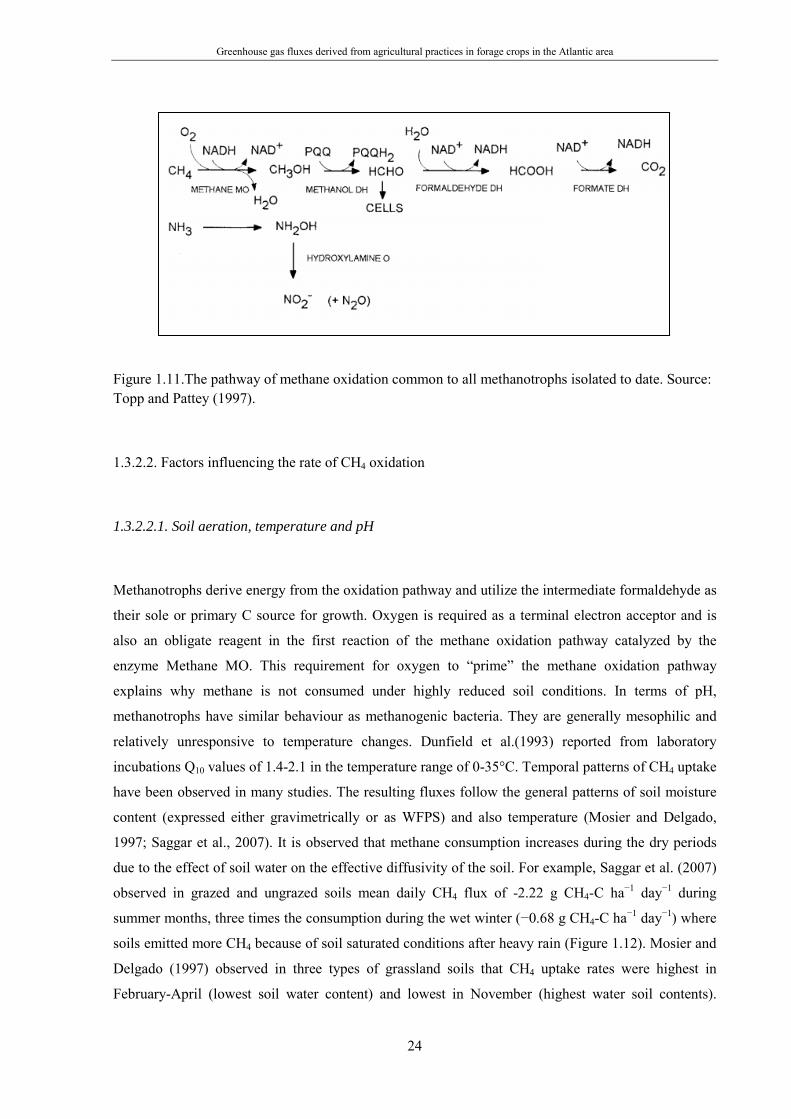
Greenhouse gas fluxes derived from agricultural practices in forage crops in the Atlantic area
24
Figure 1.11.The pathway of methane oxidation common to all methanotrophs isolated to date. Source: Topp and Pattey (1997).
1.3.2.2. Factors influencing the rate of CH4 oxidation
1.3.2.2.1. Soil aeration, temperature and pH
Methanotrophs derive energy from the oxidation pathway and utilize the intermediate formaldehyde as
their sole or primary C source for growth. Oxygen is required as a terminal electron acceptor and is
also an obligate reagent in the first reaction of the methane oxidation pathway catalyzed by the
enzyme Methane MO. This requirement for oxygen to “prime” the methane oxidation pathway
explains why methane is not consumed under highly reduced soil conditions. In terms of pH,
methanotrophs have similar behaviour as methanogenic bacteria. They are generally mesophilic and
relatively unresponsive to temperature changes. Dunfield et al.(1993) reported from laboratory
incubations Q10 values of 1.4-2.1 in the temperature range of 0-35°C. Temporal patterns of CH4 uptake
have been observed in many studies. The resulting fluxes follow the general patterns of soil moisture
content (expressed either gravimetrically or as WFPS) and also temperature (Mosier and Delgado,
1997; Saggar et al., 2007). It is observed that methane consumption increases during the dry periods
due to the effect of soil water on the effective diffusivity of the soil. For example, Saggar et al. (2007)
observed in grazed and ungrazed soils mean daily CH4 flux of -2.22 g CH4-C ha−1 day−1 during
summer months, three times the consumption during the wet winter (−0.68 g CH4-C ha−1 day−1) where
soils emitted more CH4 because of soil saturated conditions after heavy rain (Figure 1.12). Mosier and
Delgado (1997) observed in three types of grassland soils that CH4 uptake rates were highest in
February-April (lowest soil water content) and lowest in November (highest water soil contents).

Greenhouse gas fluxes derived from agricultural practices in forage crops in the Atlantic area
25
Dobbie and Smith (1996), in a soil planted with wheat, observed a relationship between CH4 oxidation
rate and soil moisture content during the dry conditions observed in summer and in a woodland soil
with soil moisture and temperature.
Figure 1.12. Seasonal pattern of soil methane sink in grazed (n=18) and ungrazed pasture (n=2) soils. Source: Saggar et al. (2008).
1.3.2.2.2. Soil N levels
Methane oxidation is lower in agricultural soils than in natural systems. Numerous studies have shown
that the application of nitrogenous fertilizer to soils frequently inhibits methane oxidation (Bedard and
Knowles, 1989; Bodelier and Laanbroek, 2004; Jollie and Lipscomb, 1991; King and Schnell, 1994).
Two mechanisms to explain the inhibitory effect of nitrogen have been proposed: firstly, studies with
pure cultures of methanotrophs show that ammonia is a competitive inhibitor of Methane MO. This
enzyme oxidizes ammonia to hydroxylamine, which is then oxidized to NO2-, and ammonia will
therefore reduce the amount of CH4 consumed by methanotriphic bacteria in a concentration-
dependent way. (Bedard and Knowles, 1989; Bodelier and Laanbroek, 2004). Secondly, it has been
proposed that NO2- produced by methanotrophic nitrification is toxic to the organisms, possibly
because it inhibits the last enzyme in the methane oxidation pathway, formate DH (Jollie and
Lipscomb, 1991; King and Schnell, 1994). Inhibition of formate DH could starve Methane MO of the
reductant required to metabolize methane. However, other studies have reported that N is essential.
They support that NH4+ or NO3
- relieves N limitation of cell growth and subsequently increases the
activity of methanotrophic community in the long term. Also N addition interferes more directly with
the synthesis of involved enzymes in the CH4 oxidation pathway of nitrogen-starved cells and

Greenhouse gas fluxes derived from agricultural practices in forage crops in the Atlantic area
26
increases the size and activity of the nitrifying population, which also oxidises methane (Bodelier and
Laanbroek, 2004).
Published data from field experiments show a large variety of results. Mosier and Delgado (1997)
observed different responses to fertilizer applications amongst types of soil with grassland: a small
negative effect on CH4 uptake in Vertisol, enhanced CH4 uptake in the Ultisol and significantly
decreased uptake in the Oxisol. Dobbie and Smith (1996), in Scotland, observed that the addition of N
fertilizer to wheat soil did not have an immediate effect in the resulting oxidation rates (0.82 mg CH4
m-2 d-1) because the soil was already fertile but it affected the corresponding rates in a woodland soil
(2.19-2.97 mg CH4 m-2 d-1). In a soil planted with maize, Collins et al. (2011), after excluding the time
of slurry application, observed that the application of manure slurries lowered the seasonal uptake
between 55-85% (12 and 37 g CH4–C ha−1) with respect to no fertilization. Jarecki et al. (2008)
observed a decrease in CH4 oxidation after swine manure slurry application to clay and sandy loam
soils. They observed that the response of methane oxidation to N additions was moderated by soil
type, with the effect being larger in the clay soil.
1.4. Carbon dioxide fluxes
The carbon cycle in an ecosystem initiates when plants fix CO2 and water from the air to convert it
into C organic compounds through photosynthesis with the help of photosynthetically active radiation.
Environmental factors such as photosynthetically active radiation (PAR), soil moisture availability, air
temperature, leaf area index and concentrations of CO2 in the atmosphere influence the rate of
photosynthesis (Gilmanov et al., 2003; Ruimy et al., 1995). Some of those organic compounds are
used by plants to grow tissues (leaves, stems and roots) and other compounds are broken down to
supply energy to plants, releasing CO2 back to the atmosphere through respiration. Microorganisms
decompose dead plant material (litter) to obtain energy for microbial growth and other activities and
CO2 is also released through microbial respiration. The live microbial biomass is mixed with organic
residues of dead plants and dead microbes to form soil OM. This OM can be stored in the soil for
hundred or thousand years before is broken down into CO2 through respiration by microbes. Through
the carbon cycle (Figure 1.13), CO2 is produced by both plant respiration (Rp) and microbial
respiration (Rm) that occurs during decomposition of litter and soil OM. Plant respiration is often
called autotrophic respiration and can be separated into above-ground plant respiration (Ra) and
below-ground plant respiration (Rb) (often equivalent to root respiration) and the rate of autotrophic
respiration is associated with three major energy-requiring processes: growth, maintenance and

Greenhouse gas fluxes derived from agricultural practices in forage crops in the Atlantic area
27
transport (Buchmann, 2000; Lambers et al., 1998). Microbial respiration (Rm) during the
decomposition of litter and soil OM is called heterotrophic respiration. The heterotrophic respiration is
controlled by soil temperature, soil moisture and substrate quality and reflects the microbial activity
rate. The CO2 rate measured at soil surface (Rs) is the sum of root respiration (Rb) and microbial
respiration (Rm). Thus, the ecosystem respiration (Re) can be estimated by sum Ra and Rs. Gross
primary production (GPP) is the annual C assimilation by photosynthesis. Net ecosystem production
(NEP) can be obtained by subtracting the gross primary production to ecosystem respiration, and also
related to soil respiration by:
NEP = GPP-Ra-Rs (Eq. 1)
Soil respiration is also related to net ecosystem respiration through net primary production (NPP),
which is GPP minus autotrophic plant respiration, by the following equation:
NEP = NPP-Rm = NPP + Rb -Rs (Eq. 2)
Figure 1.13. Schematic diagram of the ecosystem C process. Abbreviations are explained in the text. Source: Luo and Zhou (2006).
According to Houghton (2007), soil respiration in terrestrial ecosystems has been estimated to emit 58
Pg C yr-1 on a global scale but these emissions are balanced by plant photosynthesis which transfers
approximately 59 Pg C yr-1. Contrary, burning fossil fuels contributes to increased CO2 emissions to
the atmosphere (~6.3 Pg C yr-1). Thus, soil respiration is one of the major flux pathways in the global

Greenhouse gas fluxes derived from agricultural practices in forage crops in the Atlantic area
28
carbon cycle that could either mitigate atmospheric CO2 emissions via increased C sequestration, or
exacerbate global warming by accelerated release of CO2 from soil.
Agricultural soils present an important reservoir of organic C. In agro-ecosystems, unlike forest
ecosystems, the major C pool is located in the soil and not in the biomass. In soils the turnover is
relatively slow, allowing the possibility of enhancement through management (Fischer et al., 1994).
The amount of C stored in agricultural soils depends on climatic and site-specific conditions as well as
on management decisions. Several studies have shown that it is not only theoretically possible, but
practically feasible to regulate soil C stocks through improved management within upper and lower
limits, which are determined by natural constraints (Ash et al., 1995; Batjes, 1999). Batjes et al.(1999)
reviewed a series of land management options for enhanced soil C sequestration which included
combinations of tillage methods and residue management (e.g. conservation tillage, cover crops,
mulch farming), soil fertility and nutrient management (judicious use of fertilizers and organic
amendments, improving NUE, nutrient cycling through cover crops and planted fallows, enhance
biological N-fixation), water management (supplemental irrigation, surface and subsoil drainage, soil
water management), erosion control (runoff management with vegetative barriers, soil surface
amendment and mulch farming) and crop selection and rotation.
1.5. Methodology for gas measurement
Chamber is the most popular approach for measuring gas fluxes from the soil surface as they are easy
to deploy and the technology is easy to adopt. Usually a sealable chamber or base is placed over the
soil surface and closed for a period of time. Within that period of time gases build up and samples are
collected to determine changes in their concentration over time. Chambers can cover an area up to 2
m2 but the most common models have an area smaller than 0.5 m2 so multiple chambers are required
to account for the spatial variability of the gases emitted. Figure 1.14 shows some examples of
equipment used to measure GHG emissions, which can be manually closed or opened or automated
when they contain a pneumatic system. In the case of manual chambers, the number of readings that
can be collected is limited but as they are cheap, more spatial locations can be sampled (Pattey et al.,
2007). On the contrary, the use of automatic chambers allows many more readings over a longer
period of study but because of their operating requirements and cost, this method is suitable for small
areas. Chamber methodology guidelines and recommendations can be found in De Klein and Harvey
(2012), Parkin and Venterea (2010) and Rochette (2011).

Greenhouse gas fluxes derived from agricultural practices in forage crops in the Atlantic area
29
Figure 1.14. Automatic (round) and manual (square) chambers used in the experiments at North Wyke Research (left) and manual chambers at INGACAL-CIAM (right).
1.6. European dairy farming: the Galician case
The European dairy sector (EU-28) produces an estimated total of 151.1 million of tonnes of milk per
year, 48% of which are produced in the countries as Ireland, UK, France, Belgium, Netherlands,
Denmark, Spain and Portugal, all within areas located facing the Atlantic Ocean (Figure 1.15a)
(FAOSTAT, 2013). This fact is reflected in the large percentage of utilised agricultural area (UAA)
intended for feed production, which is in all cases larger than 70% (Figure 1.16). Within each of those
countries, there is a region that leads the national production (Figure 15b). In Spain, the largest dairy
producer region is Galicia, which contributes 39.2% to the national production (Figure 1.15b) and 1.7
% of the total milk produced in the EU-28 (FAOSTAT, 2013). Galicia is the Spanish region with the
largest number of dairy cows (326,000 heads), 40.5% of the Spanish dairy census. The largest number
of dairy cows and holdings intended to dairy production is mainly concentrated in the provinces of
Lugo and La Coruña. According to Barbeyto Nistal and López Garrido (2013), the average Galician
farm has 34.4 ha of UAA, 62.4 dairy cows, a stocking rate of 2.75 livestock units per hectare (LSU ha-
1) and annual production of 17,123 litres of milk per ha.

Greenhouse gas fluxes derived from agricultural practices in forage crops in the Atlantic area
30
Figure 1.15. Dairy milk production in the Atlantic Area (a) and the largest producer regions at national scale (b) (EUROSTAT, 2013).
In terms of farming area, the land extent covered by permanent grasslands in Galicia is as large as in
other important European milk producer regions, representing more than 50% of the UAA (Figure
1.16). The reason is attributed to its Atlantic climate (Fernández et al., 2011), characterized by high
annual rainfall (>1000 mm) and cool temperatures. However, despite the large extension of grasslands
in Galicia, fields are often very small and separated so grazing is difficult. This is in contrast with, for
example, the full grazing and extensive system with limited supplemental feeding (up to 8 kg grass
silage per cow and day when there is grass deficit in the paddocks) practice in Ireland. Also, with the
English case where farms mainly practice restricted grazing (restricted number of cows graze during
the whole day) (Reijs et al., 2013). To compensate for the absence of large land areas for grazing in
Galicia, farmers feed livestock with concentrates (3.03 Tonnes per dairy cow and year, Barbeyto
Nistal and López Garrido (2013)) and also forages (grass silage and maize). In Galicia, grasslands for
grass silage represent 19.3% of the UAA (816,871 ha) much larger percentage than the percentage of
11.7% in the SW England (Figure 1.16). Also, forage maize is significant in Galicia, which occupies
8.4% of the UAA and 23% of the arable land (304,576 ha).
0 5,000 10,000 15,000 20,000 25,000 30,000
France
UK
Netherlands
Spain
Ireland
Denmark
Belgium
Portugal
Dairy milk production (thousand tonnes)
Dairy milk producers in the Atlantic area
0 1,000 2,000 3,000 4,000 5,000 6,000
Bretagne
South West England
Friesland
Galicia
Southern and Eastern
Syddanmark
Prov. West-Vlaanderen
North
Dairy milk production (thousand tonnes)
Region with the largest dairy milk production ratea b

Greenhouse gas fluxes derived from agricultural practices in forage crops in the Atlantic area
31
Figure 1.16. Land area utilized for animal feed production as percentage of total utilized agricultural area (UAA) within EU-27 and distribution of the utilised agricultural area (UAA) in Galicia and NW England. Sources: Lesschen et al.(2011a), ESYRCE (2013) and DEFRA (2009).
1.7. Legislation to reduce GHG emissions
On 11st December 1997, the United Nations Framework Convention on Climate Change, based on the
reports produced by the IPCC about the impact of the anthropogenic activities on climate change,
adopted an international agreement called The Kyoto Protocol which established legally binding limits
for industrialized countries on emissions of CO2 and other greenhouse gases derived from activities.
The protocol, which entered into force on 16th February 2005, had concrete measurements, targets and
timetables to achieve the reduction desired. The Kyoto Protocol has had two commitment periods:
2008-2012 and 2012-2020. To meet the targets established for 2020, the European Union follows the
binding legislation included in the 2020 Climate and Energy Package, which aims to reduce GHG
emissions by 20% relative to 1990, raise the percentage of energy consumption produced from
renewable resources to 20% and improve energy efficiency by 20% in the EU. This legislation has
complementary legislation, which will allow a reduction of 21% GHG emissions relative to the 2005
level for the more energy intensive and, under the EU Emission trading system (EU ETS), reductions
of 10% less with respect to the same base year from the sectors not covered by the EU ETS, such as
housing, agriculture, waste and transport (excluding aviation).
Permanent grasslands
53.8%
Sole right rough
grazing4.8%
Permanent crops0.0%
Kitchen gardens0.0%
Cereal crops 18.6%
Bare fallow1.1%
Grassland11.7%
Potatoes0.4%
Horticulture0.7%
Other arable crops8.9%
Arable land41.4%
SW England (UK)
Permanent grasslands
54.1%
Permanent crops5.5%
Kitchen gardens3.1%
Cereal crops 4.8%
Bare fallow2.3%
Grassland19.3%
Potatoes1.6%
Horticulture0.3%
Other arable crops0.2%
Other forage crops0.3%
Forage maize8.4%
Arable land37%
Galicia (NW Spain)

Greenhouse gas fluxes derived from agricultural practices in forage crops in the Atlantic area
32
To ensure the compliance by Spain with its obligations with the Kyoto Protocol, the Spanish
government activated two initiatives named "Spanish climate change and clean energies 2007-2012-
2020" and "The National Plan for Climate Change Adaptation". The elaboration and development of
both initiatives require the active participation of all Spanish Autonomous Communities, as well as the
cooperation of the business sector and social organizations to achieve an efficient use of the energy.
The collaboration of the Autonomous Communities is required as large part of the competences in the
sectors or activities affected are transferred, enabling synergies between national and regional policies.
To help Spain to achieve the commitments agreed with the Kyoto protocol, the Autonomous
Community of Galicia prepared its strategy against climate change. The first step was to elaborate an
inventory of the GHG emissions to better understand the contribution of the main sectors in this
region. This inventory was published in 2004 and contained the six main sectors contained in the
Kyoto Protocol which were also broke down into more specific sub-sectors. The contribution of each
sub-sector was estimated used the IPCC guidelines for greenhouse gas inventories.
The elaboration of the Galician inventory gave the first estimates of the environmental contribution of
the agricultural sector in this region since 1990. According to the inventory, the estimation for 2012
reports a contribution of 11.1% (3,343.0 Gg eq CO2) to the total GHG emissions in this region. The
main causes are enteric fermentation, manure management and agricultural soils. In terms of type of
gas, the main cause of the CH4 emissions are enteric fermentation (61%) and manure management
(39%). The largest sources of N2O are agricultural soils (84%) and manure management (16%).
Observing the estimations reported by the inventory, GHG emissions from agriculture clearly
increased with respect to the base year (1990) (Figure 1.17). However, the contribution of the
agriculture to the GHG is following a trend to decrease. The reason of this decline is largely due to the
decrease in N2O emissions from agricultural soils, which could be stimulated by the fluctuation in the
price of mineral fertilizers and the economic crisis.
Figure 1.17. Variation of estimated GHG emissions from agriculture in Galicia respect to the base year (1990).
0.0%
7.1%
11.9%11.6%12.6%
13.4%
22.2%
15.3%
21.1%
26.1%26.3%
24.6%25.4%
29.5%
23.3%25.5%
15.3%
20.4%22.2%
18.4%17.7%
16.8%15.5%
0.0%
5.0%
10.0%
15.0%
20.0%
25.0%
30.0%
35.0%
1990
1991
1992
1993
1994
1995
1996
1997
1998
1999
2000
2001
2002
2003
2004
2005
2006
2007
2008
2009
2010
2011
2012

Greenhouse gas fluxes derived from agricultural practices in forage crops in the Atlantic area
33
On 18th March 2005, the Government of Galicia (Xunta de Galicia) approved the Galician strategy
against climate change, a document which proposes, measurements, actions and monitoring indicators
that are intended to meet the effects of each sector on climate change, determine its consequences and
identify solutions. The Galician strategy establishes specific course of actions for the agricultural
sector as:
Policies to promote compliance with the EU and national standards on sensitive areas,
action plans, code of good agricultural practices, etc
Conduct an inventory of sensitive areas and implement protection programs in these
sensitive areas.
Measures to support manure management and other livestock waste.
Increase research on GHG emissions in the main agricultural activities.
1.8. Aim and objectives
Losses of N2O, CH4 and CO2 derived from agricultural practices in dairy farms have been largely
studied worldwide. In Europe, the environmental impact of dairy farming has been also largely
documented and policies have been adopted to mitigate and reduce those losses, especially in those
regions located in the Atlantic area where this sector has greater importance. In Spain, numerous
studies about the impact of dairy farming in Northern areas have been developed and even from
agricultural ecosystems influenced by Mediterranean climatic conditions. However, to date, the impact
of dairy farming on losses of GHG in the NW Spain, where dairy farming is an important sector, is
still unknown. It is important to address this knowledge gap because of the strong influence of soil and
climate factors; factors that vary greatly from one region to another and have great influence on the
magnitude and spatial and temporal variability of GHG fluxes.
The overall aim of this study was to evaluate the impact of the agricultural practices for dairy farming
on losses of GHG from soils under the Atlantic climatic conditions in Galicia (NW Spain), in order to
make recommendations for practices that reduce emissions and increase crop yields.
To address this main aim, a number of objectives were completed through five plot scale experimental
studies. These were carried out between 2007-2011 at Mabegondo Agricultural Research Centre
(CIAM-INGACAL) in Galicia (NW Spain) on grassland and forage maize soils. To complement these
studies, an experiment was conducted in 2011 on a grassland site at Rothamsted Research, North
Wyke, in Devon (SW England), in a contrasting soil type and management, under similar Atlantic
climatic conditions as Galicia. The objectives were the following:

Greenhouse gas fluxes derived from agricultural practices in forage crops in the Atlantic area
34
To develop empirical models to explain inter-annual and seasonal variations from grazed and
fertilized grasslands based on the measurement of the most influential parameters on N2O
emissions (Chapter 2).
To quantify the effects of the application of mineral fertilizers and cattle slurry during spring,
summer and autumn on GHGs from a grassland with grazing dairy cattle (Chapter 3).
To investigate how typical management of slurry or mineral fertilizer affect GHG emissions in
a grassland soil in the South West of England (Chapter 4).
To understand the dynamics of the N2O fluxes during the maize growing season under the
Galician climatic conditions and determine the influence of the type of fertilizer (injected
slurries and mineral fertilizers) typically applied by local Galician farmers on the resulting
emissions (Chapter 5).
To investigate the contribution of the different N fertilizers, commonly used in Galicia for
forage maize cropping, on CH4, CO2 and N2O fluxes in a short-term period after their
application, quantify total N2O fluxes derived from the whole maize grown season and
provide yield scaled N2O emission factors. (Chapter 6).
These experiments combined will also address three key hypotheses that are based on the following
arguments:
I. Inter-annual and seasonal variations in N2O emissions.
Losses of N2O from soils are mainly caused by nitrification and denitrification processes,
which are controlled by factors as soil moisture content, temperature, soil pH, organic carbon
C and the availability of mineral N in the soil (Bouwman, 1996; Firestone and Davidson,
1989; Smith et al., 2003). Changes in these factors over time create considerable temporal
variations in emissions of N2O, making difficult to acquire representative estimates of annual
N2O emissions (Burchill et al., 2014). Large inter-annual N2O variations from agricultural
soils have been reported in other regions of the Atlantic area (Burchill et al., 2014; Cardenas et
al., 2010; Dobbie et al., 1999; Flechard et al., 2007; Hyde et al., 2006; Rafique et al., 2011;
Velthof et al., 1996). To investigate those variations, previous studies longer than 1 year were
developed, and found that the cause of the large variation is generally attributed to climatic
conditions in combination with N management (fertilization, grazing). As it was mentioned

Greenhouse gas fluxes derived from agricultural practices in forage crops in the Atlantic area
35
above, there is a knowledge gap on how agricultural practices in this Spanish region affect
losses of GHG from soils. Specifically, to date, there are not studies about inter-annual and
seasonal variations of N2O emissions from agricultural soils in this region. Based on the latter
studies, it is expected that the combination of grazing and mineral fertilization can result in
significant losses of N2O from soils. In addition, grazing patterns, depending on the weather
and soil conditions, can lead to large seasonal variability in N2O emissions so it is necessary to
increase the knowledge about the main factors that drive and affect N2O emissions in each
season to mitigate those losses.
We therefore hypothesise that combining grazing with fertilization under the climatic
conditions of the NW Spain can lead in large inter-annual and inter-seasonal N2O
variations from soils, as in other regions of the Atlantic area.
II. Effect of fertilizer type on direct losses of N2O and CO2 from soils.
The use of organic fertilizers at farm scale can be a solution to reduce the cost of purchasing
mineral fertilizers, minimizing the cost of milk production, and also an option to recycled
animal wastes produced on farms. However, as discussed earlier, different types of fertilizer
can have different effects on GHG emissions, so encourage the use of the fertilizer types that
minimize emissions is a mitigation option. Slurries contain concentrations of NH4+-N and
easily decomposable organic C that can, in concert, stimulate microbial activity and
production of N2O in soils (Rochette et al., 2000b; Velthof et al., 2003), which can be in some
occasions larger than the resulting emissions after mineral fertilizer application. However,
according to some studies N2O emissions rates depend of the type of soil. In low C soils, N2O
emissions are related to easily decomposable organic C whereas in those with high C
concentrations, N2O rates are related to N availability (Chantigny et al., 2010; Pelster et al.,
2012). As Galician soils are generally rich in organic matter content, this thesis
hypothesises that the addition of slurry-C to the soil would not significantly stimulate
microbial activity and thus, would not increase CO2 and N2O production with respect to
increases caused by mineral fertilizer applications as N2O losses from soils rich in C are
more dependent of the availability of N .
III. The effect of fertiliser type and applications on CH4 fluxes from soils.
Soil can be also a source or a sink of CH4 and CH4 fluxes from soils are the net result of
methanogenesis, where CH4 is produced in anaerobic environments with a source of C, and
methanotrophy processes, where the CH4 (produced in anaerobic parts of the soil and
atmospheric CH4) is consumed under aerobic conditions. Field experiments have previously

Greenhouse gas fluxes derived from agricultural practices in forage crops in the Atlantic area
36
been carried out to test the effect of N fertilizer applications in soil CH4 oxidation rates and
diverse responses have been reported in the literature (Collins et al., 2011; Dobbie and Smith,
1996; Jarecki et al., 2008; Mosier and Delgado, 1997) from grasslands and arable soils. An
interesting result was reported by Dobbie and Smith (1996), in Scotland, which reported no
immediate effect in the observed oxidation rates to the addition to N fertilizer to wheat soil.
They argued that it is the initial application of fertilizer to a soil that decreases CH4 oxidation
rates in that soil but there is not inhibitory effect from further N fertilizer applications Based
on this, we hypothesise that additions of N with organic and mineral fertilizers would not
reduce soil CH4 uptake capacity with respect to no fertilization in soils in Galicia that
have received N fertilizer applications for many years.

Greenhouse gas fluxes derived from agricultural practices in forage crops in the Atlantic area
37
CHAPTER 2. INTER-ANNUAL AND INTER-SEASONAL VARIATIONS IN NITROUS OXIDE EMISSIONS FROM GRAZED AND FERTILIZED GRASSLANDS UNDER THE TEMPERATE HUMID CLIMATIC CONDITIONS IN NORTH-WEST SPAIN

Greenhouse gas fluxes derived from agricultural practices in forage crops in the Atlantic area
38
Abstract
Data from a field study conducted in grasslands used for dairy production in NW Spain was used to
develop five empirical models to predict temporal variations in the N2O emitted. Nitrous oxide
emissions from six grassland plots under different grazing and fertilization management and one with
no nitrogen (N) inputs (control plot, CN) were frequently monitored between April 2007 and
December 2009 using the closed chamber technique. The first model was developed to predict
variations in the N2O emitted at the annual scale ('inter-annual') and the other four at seasonal scale
(winter: 'Jan-Mar', spring: Apr-Jun', summer: Jul-Sep' and autumn: 'Oct-Dec'). The five empirical
models obtained were based on equations that better fit (Adj R2) the following parameters (predictors):
rainfall, mean air and soil temperatures, mean water-filled pore space (WFPS), soil ammonium (NH4+-
N) and nitrate (NO3--N) contents, N fertilization rates and N excreted. For the 'inter-annual' model,
data from January 2008 to December 2009 was considered. The mean annual N2O-N emissions (kg ha-
1) were in the range 22.2-30.1 kg N ha-1 from managed grasslands and 12.5-13.6 kg N ha-1 from CN
plot. The inter-annual model (2008-2009) showed that 24% of the variation in the N2O emitted was
caused by mean soil WFPS, rainfall, N fertilizer applied (Nfert) and N excreted by livestock (Nexcret)
(P<0.001). Other factors not included in the model and probably related to grazing (i.e. changes in soil
bulk density, pH, available C contents) could have been responsible for the remaining variation. We
did not obtain a significant model for the 'Jan-Mar' period, probably because of the lower frequency of
the gas sampling during this season in 2008. However, significant models were obtained for the rest of
the seasons. For 'Apr-Jun', 'Jul-Sep' and 'Oct-Dec' models, data from each period in 2007, 2008 and
2009 was used. Inter-seasonal variations in the cumulative N2O emissions of 3.5, 2.7 and 2.0-fold
were observed in 'Apr-Jun', 'Jul-Sep' and 'Oct-Dec', respectively. In 'Apr-Jun', 77% of the variation
was explained by the combination of mean soil temperatures and Nfert (P<0.001). In 'Jul-Sep', the
combination of mean soil temperatures and mean soil NO3--N contents explained 72% of the variation
(P<0.001). For 'Oct-Dec', 78.4% of the variation was attributed to differences in mean WFPS, rainfall,
mean soil NH4+-N contents and Nexcret (P<0.001). We suggest that restricting the number of grazing
hours per day and avoiding grazing when soil is very wet, especially during autumn, could help to
reduce annual N2O losses from dairy grasslands in the NW Spain. Future research is required to build
models that are based on more detailed data related to grazing to allow for better prediction of inter-
annual variation in N2O.

Greenhouse gas fluxes derived from agricultural practices in forage crops in the Atlantic area
39
2.1. Introduction
Nitrous oxide (N2O) is an important greenhouse gas (GHG) which contributes to global warming and
stratospheric ozone (O3) destruction (Wuebbles, 2009). Nitrous oxide stays in the atmosphere for an
average of 114 years and the potential for one molecule of N2O to cause warming of the atmosphere is
approximately 298 times greater than that of one molecule of CO2 (IPCC, 2007). According to Smith
et al. (2007), agriculture caused worldwide losses of 5.1-6.1 Gt CO2 equivalents year-1 in 2005 (10-
12% of the total anthropogenic GHG emissions), 60% of which were caused by N2O. Most of the N2O
is produced from agricultural soils and mainly due to two microbial processes: nitrification, which is
the oxidation of ammonium (NH4+) to nitrite (NO2
-) and nitrate (NO3-) under aerobic conditions and
denitrification, which is the reduction of NO3- to nitrite (NO2
-), nitric oxide (NO), N2O and nitrogen
gas (N2) under anaerobic conditions. These two processes are responsible for approximately 56-70% of
the global N2O emissions (Braker and Conrad, 2011; Syakila and Kroeze, 2011). The timing and
magnitude of N2O emissions by these processes is mainly controlled by soil moisture content,
temperature, soil pH, organic carbon C and the availability of mineral N in the soil (Bouwman, 1996;
Firestone and Davidson, 1989; Smith et al., 2003). Changes in these factors over time create
considerable temporal variation in emissions of N2O on a seasonal and annual basis, making it difficult
to acquire representative estimates of annual N2O emissions (Burchill et al., 2014). Changes in these
factors can be triggered by changes in rainfall patterns, temperatures, freezing and thawing, dry-
wetting periods, management practices such as manure and fertilizer applications, grazing,
incorporation of crop residues and tillage. Understanding these factors and how they influence N2O
emissions in a particular area is therefore a key step in developing mitigation options that reduce
emissions.
In terms of grasslands, large inter-annual and seasonal changes have been reported from field studies
in European temperate locations and predicted in empirical models (Burchill et al., 2014; Cardenas et
al., 2010; Dobbie et al., 1999; Flechard et al., 2007; Hyde et al., 2006; Rafique et al., 2011; Velthof et
al., 1996), but have yet to be investigated in Galicia, NW Spain, an important area of forage grassland.
In this paper, a field study was conducted in Galicia, a region located at NW Spain where the dairy
sector has large importance. This region produces 39.2% (2,55 millions of litres) of the annual volume
of milk produced in Spain (EUROSTAT, 2013). Due to its climatic conditions (i.e., rainfall >1000 mm
year-1), grasslands represent 19% of Galician utilised agricultural area (810,871 ha) and 42 per cent of
the Galician croppable land (374,916 ha) (ESYRCE, 2013). Nitrous oxide was monitored over 2 years
and 9 months from N-fertilized and grazed grasslands. The data obtained was used to develop
empirical models to explain inter-annual and seasonal variations from grazed and fertilized grasslands
based on the most influential parameters for N2O emissions.

Greenhouse gas fluxes derived from agricultural practices in forage crops in the Atlantic area
40
2.2. Materials and methods
2.2.1. Location
The study was carried out at Mabegondo Agricultural Research Centre (CIAM-INGACAL),
Abegondo, Galicia, Spain (43.2425°N, 8.2608°W). The climate is European Atlantic (Fernández et al.,
2011) and Mediterranean humid according to agrologic classification provided by Papadakis (1966).
The mean annual rainfall (1997-2006) is 1131 mm with autumn (October-December) being the wettest
season (506 mm) and summer (July-September) being the driest (130 mm). The mean air temperature
(1997-2006) is 13.3 ºC, with the lowest mean air temperatures of 9.4ºC occurring during winter
(January-March) and the highest of 18.3 ºC occurring in summer. The soil is a free draining, acid
brown earth with a silt-loam texture (27% sand, 56% silt and 17% clay, USDA classification system)
and acid pH (5.5). At 0-30 cm depth, the soil was composed by 54.0 g kg-1 organic matter (OM), 2.5 g
kg nitrogen (N), 18.2 g kg-1 phosphorus (P) and 195.9 g kg-1 potassium (K). Soil bulk density was 1.25
g cm-3 and pH of 5.6.
2.2.2. Experimental design
Six grassland plots (denoted as 1A, 1B, 2A, 2B, 3A and 3B, Figure 2.1), typical for dairy grazing in
Galicia, were selected and monitored during 20th April 2007 to 14th December 2009 to identify
temporal variability in N2O fluxes. Plots were 0.5 ha and they were predominantly composed of
perennial ryegrass (Lolium perenne L. cv. Brigantia) and less than 10% of white clover (Trifolium
repens L.cv. Huia) which, after five years of grazing management, showed a low proportion of other
species (less than 20%).
The grazing management used was the rotation system, allowing dairy cow livestock access to only
one area of grassland at time and therefore providing resting periods for the rest of grassland. This
system allows plant recovery and thus, maximizes production. To accomplish this system, before each
grazing event, each grassland site was subdivided into 4 small areas and the livestock were moved
from one small area to another.
In addition to the six grassland plots mentioned, an additional grassland plot was used as a control
(CN), with similar size and composition, was also monitored during the same periods in 2007-2009.
The CN grassland plot did not receive N inputs from fertilizers or grazing during the experiment and

Greenhouse gas fluxes derived from agricultural practices in forage crops in the Atlantic area
41
also during the previous two years (2005-2006) to this experiment. However, CN plot received several
grass cuts between 2007-2009: on 2nd March 2007, 14th May 2007, 28th June 2007, 10th August 2007,
26th September 2007, 26th December 2007, 10th March 2008, 14th May 2008, 1st July 2009, 23rd
September 2009 and 24th November 2009.
Figure 2.1. Layout of grassland plots monitored between 2007-2009 at the experimental farm of CIAM-INGACAL.
2.2.3. Fertilization
Mineral N fertilizers were applied to each grassland plot (except in CN plot) by using a fertilizer drill,
and the applied rate was according to individual requirements of each plot at the moment of
fertilization. Several N applications occurred throughout the 2007-2009 period, registering annual
rates of N in the ranges 130-169 kg N ha-1 in 2007, 77-115 kg N ha-1 in 2008 and 32-43 kg N ha-1 in
2009 (Table 2.1). Grasslands plots (including CN) also received annual quantities phosphorus (P) and
potassium (K) to maintain the optimal soil fertility level (Table 2.1).
2A
2B
CN 3A
1A
1B
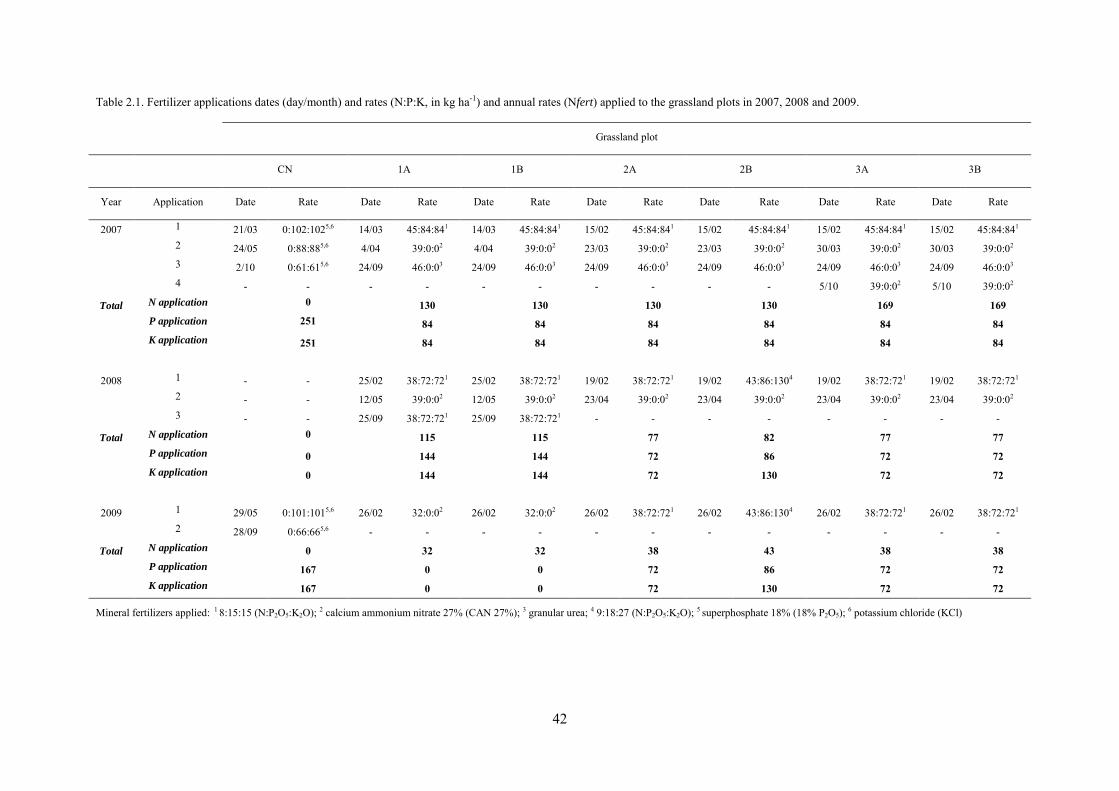
42
Table 2.1. Fertilizer applications dates (day/month) and rates (N:P:K, in kg ha-1) and annual rates (Nfert) applied to the grassland plots in 2007, 2008 and 2009.
Grassland plot
CN 1A 1B 2A 2B 3A 3B
Year Application Date Rate Date Rate Date Rate Date Rate Date Rate Date Rate Date Rate
2007 1 21/03 0:102:1025,6 14/03 45:84:841 14/03 45:84:841 15/02 45:84:841 15/02 45:84:841 15/02 45:84:841 15/02 45:84:841
2 24/05 0:88:885,6 4/04 39:0:02 4/04 39:0:02 23/03 39:0:02 23/03 39:0:02 30/03 39:0:02 30/03 39:0:02
3 2/10 0:61:615,6 24/09 46:0:03 24/09 46:0:03 24/09 46:0:03 24/09 46:0:03 24/09 46:0:03 24/09 46:0:03
4 - - - - - - - - - - 5/10 39:0:02 5/10 39:0:02
Total N application 0 130 130 130 130 169 169
P application 251 84 84 84 84 84 84
K application 251 84 84 84 84 84 84
2008 1 - - 25/02 38:72:721 25/02 38:72:721 19/02 38:72:721 19/02 43:86:1304 19/02 38:72:721 19/02 38:72:721
2 - - 12/05 39:0:02 12/05 39:0:02 23/04 39:0:02 23/04 39:0:02 23/04 39:0:02 23/04 39:0:02
3 - - 25/09 38:72:721 25/09 38:72:721 - - - - - - - -
Total N application 0 115 115 77 82 77 77
P application 0 144 144 72 86 72 72
K application 0 144 144 72 130 72 72
2009 1 29/05 0:101:1015,6 26/02 32:0:02 26/02 32:0:02 26/02 38:72:721 26/02 43:86:1304 26/02 38:72:721 26/02 38:72:721
2 28/09 0:66:665,6 - - - - - - - - - - - -
Total N application 0 32 32 38 43 38 38
P application 167 0 0 72 86 72 72
K application 167 0 0 72 130 72 72
Mineral fertilizers applied: 1 8:15:15 (N:P2O5:K2O); 2 calcium ammonium nitrate 27% (CAN 27%); 3 granular urea; 4 9:18:27 (N:P2O5:K2O); 5 superphosphate 18% (18% P2O5); 6 potassium chloride (KCl)

Greenhouse gas fluxes derived from agricultural practices in forage crops in the Atlantic area
43
2.2.4. Nitrogen excreted by livestock
Nitrogen excreted by dairy cow livestock in the grassland plots was estimated by using the indicator of
the presence of the livestock grazing used by Bossuet et al. (2006). The calculation requires
information about each single grazing event that happened in each grassland plot: livestock units
(LSU), number of grazing days and number of hours per day grazing. Also, it was considered that, the
daily N excretion was 0.2002 kg N cow-1 day-1. This value, in agreement with the values reported in
the literature for dairy cows (Aguerre et al., 2011; Burke et al., 2008; Spek et al., 2013) and a similar
value was also obtained in a previous study carried out by Báez Bernal et al. (2008) at CIAM-
INGACAL with dairy cows. In the later study, a mean annual N excretion per cow of 73 kg, was
calculated from the balance between the N inputs during the livestock feeding (grass, silage and
concentrates), N outputs (milk and meat) and also discounting the losses of N by ammonia (NH3)
volatilization.
Total N excretion (Nexcret) in each grassland plot during a single grazing event was estimated as
follows (Eq.1):
Nexcret (kg N ha-1) = 0.2002 × N × LSU × number of grazing hours × 24h-1 × A-1
where Nexcret is the N excretion by livestock during a grazing event in kg N ha-1, 0.2002 is the daily
N excretion per cow (in kg N cow-1 day-1) (Báez Bernal et al., 2008; Bossuet et al., 2006), N is the
number of animals grazing, LSU is a constant that represents the type of livestock unit (dairy cattle:
1.00), number of grazing hours normalized to 24 hours and A is the area of the grassland plot (in ha).
2.2.5. Chamber design and operation
Nitrous oxide fluxes were monitored using the closed chamber technique (Louro et al., 2015).
Chambers comprised cylinders of polyvinyl chloride (PVC) with a volume of 0.02 m3 (height: 36 cm;
diameter: 25 cm) and a PVC lid fitted to a septum rubber as a sampling port. To allow greater ground
coverage of the spatial variability in N2O fluxes resulting from the deposition of the urine and dung on
the grassland plots studied, chambers were placed in different locations within each grassland plot
(Hyde et al., 2006). The re-insertion into the soil (3 cm depth) was carried out after each sampling day.
A total of four chambers per plot were used (i.e., 28 chambers per measurement day). On each
sampling day, chambers were closed for 60 min (T60). After 60 min, the chamber headspace was
sampled through the rubber septum on the chamber lid. A sample of 12 ml from each chamber was

Greenhouse gas fluxes derived from agricultural practices in forage crops in the Atlantic area
44
transferred to a 10 ml pre-evacuated glass vial using a syringe fitted with a hypodermic needle to over-
pressurize the vials. Two ambient samples were also taken to provide N2O background values and the
mean value was used as the time zero sample (T0).
2.2.6. Nitrous oxide flux measurements
Soil N2O fluxes were measured 59 times between 20th April and 26th December 2007, 106 times
between 8th January and 30th December 2008 and 97 times between 13th January and 14th December
2009. Except during the winter of 2008 and the autumn of 2009 where sampling frequency was lower,
chambers were sampled up to three times a week, usually between 10:00 and 12:00 h. The N2O
concentration in each sample was analysed in the laboratory using a Thermo Finnigan Trace gas
chromatograph (GC 2000) equipped with a HP-Plot Q column (30 mm × 0.3 mm) and an electron
capture detector at 330ºC. Gas samples were injected into the GC in a split mode at a flow rate of 11ml
min-1 and using helium (He) as a carrier gas at a flow rate of 1.5 ml min-1. Calibration was performed
using a 9.9 ppm standard of N2O and the concentration of the gas in each sample was calculated by
comparing the peak area of the samples and that obtained with the standard. On each sampling day,
daily N2O fluxes were calculated as follows (Eq.2):
F= ρ x V/A x (C60-C0)/t x (273.15/T) x 24 x 104 (Eq.2)
where F is the flux of N2O (kg N2O-N ha-1 day-1), ρ the gas density (1.26 kg m-3 N2O-N) under STP
conditions (273 K and 101,325 Pa); V and A are the volume (0.02 m3) and area (0.0491 m2) of the
chamber; C60-C0 (m3 m-3) are the N2O concentration at T60 minus the concentration of the ambient
sample (T0); t is the time of chamber placement (60 min); and T is the air temperature (K) at the time
of sampling. Cumulative N2O emissions (expressed as kg N2O-N ha-1) were calculated using the
trapezoidal method (Cardenas et al., 2010; Louro et al., 2013). Periods considered were selected based
on the different seasons and they will be denoted as 'Jan-Mar', 'Apr-Jun', 'July-Sep' and 'Oct-Dec'.
2.2.7. Soil sampling and analyses
At each sampling day, four soil cores were taken to 10 cm depth within the area covered by each
chamber, giving sixteen soil cores per grassland plot which were then bulked into one sample. After
soil collection the chambers were randomly repositioned within the grassland plot. Soil samples were
analyzed for ammonium (NH4+-N ) and nitrate (NO3
--N) contents and soil moisture to be transformed

Greenhouse gas fluxes derived from agricultural practices in forage crops in the Atlantic area
45
to %WFPS. The methodology used for these analysis and the transformation of the gravimetric soil
moisture into %WFPS is described in Louro et al. (2015).
2.2.8. Meteorological data
Total daily rainfall, daily mean soil and air temperatures were collected from 1st January 2007 to 14th
December 2009 by the meteorological station located at CIAM. Average rainfall, air and soil
temperature data for the previous 10 years (1997-2006) were used as a comparison for the weather
conditions observed during the experiment.
2.2.9. Statistical prediction. Model development
2.2.9.1. Models and data
Measured and estimated data obtained during the experiment were used to develop five separate
statistical models -that predicted N2O emissions (Genstat version 15). The first model, denoted as
‘inter-annual’, was built to predict inter-annual N2O emissions based on data from 2008-2009. Data
from 2007 was not used for the inter-annual model as the period 'Jan-Mar 2007' was not measured.
The other four models were built to predict inter-seasonal variations in the N2O emissions. These
empirical models were denoted as 'Jan-Mar', 'Apr-Jun', 'Jul-Sept' and 'Oct-Dec'. Except for the 'Jan-
Mar' model where only data from 2008 and 2009 was used, the rest of empirical models contained data
collected in 2007, 2008 and 2009. The data for each model were arranged in indexed format with
independent variables total rainfall, total Nfert, total Nexcret, and mean values for the soil mineral N
(0-10 cm), soil temperature at 10 cm depth and air temperature. For the inter-annual empirical model,
data from the seven individual plots within each separate year (2008, 2009) and period ('Jan-Mar',
'Apr-Jun', 'Jul-Sept' and 'Oct-Dec') were used, totalling 56 data points. For the four seasonal models,
data from the seven individual plots across all three years were modelled separately for each period
('Jan-Mar', 'Apr-Jun', 'Jul-Sept' and 'Oct-Dec'). The data points for the each seasonal empirical models
totalled 21, except for 'Jan-Mar' model which only had 14 points (absence of data for 2007). Prior to
building the models, data was analysed for normality to assess if log-transformation was required. The
result showed that most data fell within 95% limits of a normal distribution. Using Spearman rank
correlation data was also plotted versus simple correlation and the test showed that all bivariate
Greenhouse gas fluxes derived from agricultural practices in forage crops in the Atlantic area
46
relationships were linear and fell in 1:1 line. Based on this, data was not log-transformed prior to
building the models.
2.2.9.2. Regression method and sensitivity analysis
A forward selection multiple regression procedure was used for the estimation of above prediction
equations that maximised R2 (Dhanoa et al., 1999). Further, the annual data was also used to
investigate individual correlations(Pearson correlations) between cumulative N2O emissions and the
individual parameters described above.
A sensitivity analysis was performed with the parameters involved in the generation of the best-fitted
inter-annual empirical model. To determine the sensitivity, the mean value of each parameter was
calculated in order to obtain the mean N2O emission. The mean of each parameter ±25% and ±50%
was estimated and the resulting mean N2O emission calculated while the remaining parameters were
left unchanged. The percentage of change of each parameter was calculated by subtracting the mean
N2O emission to the resulting N2O emission after increasing or decreasing 50% that parameter and
dividing the resulting values by the mean N2O emission.
2.3. Results
2.3.1. Weather conditions
Of the three years studied, 2007 was dry compared to 2008 and 2009. Total annual rainfall was 718,
1408, 1373 mm in 2007, 2008 and 2009, respectively. In 2007, the wettest period was 'Jan-Mar'
(winter) and the driest 'Jul-Sep' (summer). The distribution of the rainfall during 2007 (expressed as %
of annual rainfall) was 46% in 'Jan-Mar', 21% in 'Apr-Jun', 17% in 'Oct-Dec' and 16% in 'Jul-Sep'
(Figure 2.2a). In both 2008 and 2009, the wettest period was 'Oct-Dec' (autumn) and the warmest 'Jul-
Sep'. The rainfall distribution figures for each year were as follows: 34% in 'Oct-Dec', 27% in 'Apr-
Jun', 25% in 'Jan-Mar' and 14% in 'Jul-Sep' in 2008 and 44% in 'Oct-Dec', 24% in 'Jan-Mar', 20% in
'Apr-Jun' and 13% in 'Jul-Sep' in 2009. In terms of air temperatures, 2007 was the coldest of the three
years studied. Annual average temperatures were 12.7°C, 13.5 and 13.41°C in 2007, 2008 and 2009,
respectively. The warmest period in all three years studied was 'Jul-Sep' with mean air temperatures of
16.9, 18.0 and 17.6 °C in 2007, 2008 and 2009, respectively (Figure 2.2a). In 2007 and 2008, 'Oct-

Greenhouse gas fluxes derived from agricultural practices in forage crops in the Atlantic area
47
Dec' and 'Jan-Mar' were the coldest periods with mean temperatures of 9.8°C and 9.6°C in 2007 and
10.7°C and 10.1°C in 2008, respectively. In 2009, the differences between 'Jan-Mar' and 'Oct-Dec'
were larger than in the previous years. The coldest period was 'Jan-Mar' (9.1°C), followed by 'Oct-
Dec' (12.7°C). Mean soil temperatures in the periods studied were in the ranges of 8.4-18.7°C in 2007,
8.4-18.4°C in 2008 and 7.2-18.0°C in 2009, with 'Jan-Mar' and 'Jul-Sep' the coldest and the warmest
periods, respectively (Figure 2.2a).
2.3.2. Soil WFPS and mineral N contents.
Mean soil WFPS (Figure 2.2b), NH4+-N (Figure 2.2c) and NO3
--N (Figure 2.2d) contents from the
seven grasslands monitored are presented in Figures 2.2b, c and d, respectively. In terms of WFPS, the
mean values from grassland plots 2A and 2B (Figure 2.1) were in general larger than from the other
five plots since the period Apr-Jun 08. We observed that in large number of sampling days these two
plots had standing water at the soil surface (>100%WFPS) after rainfall episodes. Mean values
obtained for the 'Apr-Jun' periods were 71% WFPS (range: 54-85% WFPS ) in 2007, 90% WFPS
(range: 74-115%WFPS) in 2008 and 82% WFPS (range: 69-104% WFPS) in 2009. In all years, the
lowest soil WFPS contents were observed during 'Jul-Sep' as the mean values were 40% WFPS
(range: 31-48% WFPS) in 2007, 55% (43-71% WFPS) in 2008 and 61% WFPS (range: 50-81%) in
2009. In ’Oct-Dec' periods, the mean soil WFPS levels were 56% WFPS (range: 50-64% WFPS),
77%WFPS (range: 69-90% WFPS) and 95% (range: 85-111%WFPS) in 2007, 2008 and 2009,
respectively. In 'Jan-Mar', the corresponding means for 2008 and 2009 were 81%WFPS (range: 70-
91%WFPS) and 90% (range: 75-103%), respectively.
Large and short -lived soil NH4+-N and NO3
+-N peaks, compared to those from CN plots (no N
inputs), were observed in this study when grazing and fertilization events were followed by soil
sampling. Soil NH4+-N peaks were more frequent than NO3
+-N peaks and also larger. In some
occasions, soil NH4+-N peaks reached values of up to 200 kg N ha-1 while NO3
+-N peaks were not
larger than 100 kg N ha-1 (data not shown). Mean mineral N values used to input the models are shown
in Figure 2.2c and 2.2d. In the six grazed grassland plots with N-inputs, mean soil NH4+-N contents
were in the ranges 10-27 kg N ha-1 in 'Apr-Jun', 10-26 kg N ha-1 in 'Jul-Sep', 8-26 kg N ha-1 in 'Oct-
Dec' and 3-18 kg N ha-1 in 'Jan-Mar' (Figure 2.2c). In the CN plot these ranges were 5-12, 9-11, 7-12
and 3-11 kg N ha-1 in 'Apr-Jun', 'Jul-Sep', 'Oct-Dec' and 'Jan-Mar', respectively (Figure 2.2c). Mean
soil NO3+-N contents (Figure2.2d) were in the ranges 1-5 and 17-47 kg N ha-1 in 'Apr-Jun', 2-4 and 4-

Greenhouse gas fluxes derived from agricultural practices in forage crops in the Atlantic area
48
18 kg N ha-1 in 'Jul-Sep', 3-4 and 4-21 kg N ha-1 in 'Oct-Dec', and 2-7 and 2-14 kg N ha-1 in 'Jan-Mar',
for the CN plot and the six grassland plots under N-inputs, respectively.
2.3.3. Grazing data and N inputs
In 2007, the largest N-input source for the six grassland plots was through fertilization. Nitrogen
excretion represented 43% (mean value) of the total N-inputs (Table 2.2). Although, in 2008,
fertilization and grazing decreased by 31% and 23%, respectively, with respect to 2007, Nexcret still
represented 48% (mean value) of the total N-inputs. In 2009, grassland plots received N mainly
through livestock excretion (77% of the total N-inputs) and grazing was practiced throughout the year.
The largest Nexcret in all years occurred during ’Apr-Jun'.
2.3.4. Nitrous oxide fluxes
Large and frequent N2O peaks were observed immediately after grazing and fertilization events in all
grasslands plots during the three years studied (Figure 2.3) and contrasted with those observed from
the CN plot, with no grazing or fertilization events. In 2007, the daily mean N2O fluxes from CN plot
were 0.022, 0.010 and 0.016 kg N2O-N ha-1 day-1 in 'Apr-Jun', 'Jul-Sep' and 'Oct-Dec', respectively.
From grazed and fertilized grasslands, the corresponding fluxes (mean of the six grassland plots) for
the same periods were 0.044, 0.035 and 0.034 kg N2O-N ha-1 day-1, respectively. In 2008, daily mean
N2O fluxes from the CN plot were 0.028, 0.035, 0.039 and 0.031 kg N2O-N ha-1 day-1 in 'Jan-Mar',
'Apr-Jun', 'Jul-Sep' and 'Oct-Dec', respectively, lower than those of 0.075, 0.056, 0.048 and 0.053
N2O-N ha-1 day-1 registered during the same periods from the remaining six grassland plots. In 2009,
the lowest mean daily fluxes from CN plots during 'Jan-Mar', 'Apr-Jun', 'Jul-Sep' and 'Oct-Dec' were
0.020, 0.051, 0.044 and 0.037 kg N2O-N ha-1 day-1, respectively and 0.067, 0.123, 0.105, 0.066 kg
N2O-N ha-1 day-1 from the six grassland plots with N-inputs.

49
Figure 2.2. a) Total rainfall, and mean air and soil temperatures at 10 cm depth, b) mean soil WFPS, c) soil NH4+-N and d) soil NO3
--N levels (0-10 cm) during the periods studied in 2007, 2008 and 2009. Data points represent the resulting mean values for each grassland after averaging all data values (number of sampling days indicated below periods) obtained in each period.
0
5
10
15
20
25
30
35
40
Jan-Mar 07
Apr-Jun 07
Jul-Sep 07
Oct-Dec 07
Jan-Mar 08
Apr-Jun 08
Jul-Sep 08
Oct-Dec 08
Jan-Mar 09
Apr-Jun 09
Jul-Sep 09
Oct-Dec 09
- 15 25 15 4 25 35 36 26 35 20 13
NO
3- -N (k
g N
ha-1
)
CN 1A 1B 2A 2B 3A 3B
0
2
4
6
8
10
12
14
16
18
20
0
100
200
300
400
500
600
700
Jan-Mar 07
Apr-Jun 07
Jul-Sep 07
Oct-Dec 07
Jan-Mar 08
Apr-Jun 08
Jul-Sep 08
Oct-Dec 08
Jan-Mar 09
Apr-Jun 09
Jul-Sep 09
Oct-Dec 09
Temperature (°C
)
Rai
nfal
l (m
m)
Rainfall Air temp Soil temp 10 cm
a
c
b
d
0
20
40
60
80
100
120
140
Jan-Mar 07
Apr-Jun 07
Jul-Sep 07
Oct-Dec 07
Jan-Mar 08
Apr-Jun 08
Jul-Sep 08
Oct-Dec 08
Jan-Mar 09
Apr-Jun 09
Jul-Sep 09
Oct-Dec 09
- 15 25 15 4 25 35 36 26 35 20 13
%W
FPS
CN 1A 1B 2A 2B 3A 3B
0
5
10
15
20
25
30
35
40
Jan-Mar 07
Apr-Jun 07
Jul-Sep 07
Oct-Dec 07
Jan-Mar 08
Apr-Jun 08
Jul-Sep 08
Oct-Dec 08
Jan-Mar 09
Apr-Jun 09
Jul-Sep 09
Oct-Dec 09
- 15 25 15 4 25 35 36 26 35 20 13
NH
4+ -N
(kg
N h
a-1)
CN 1A 1B 2A 2B 3A 3B
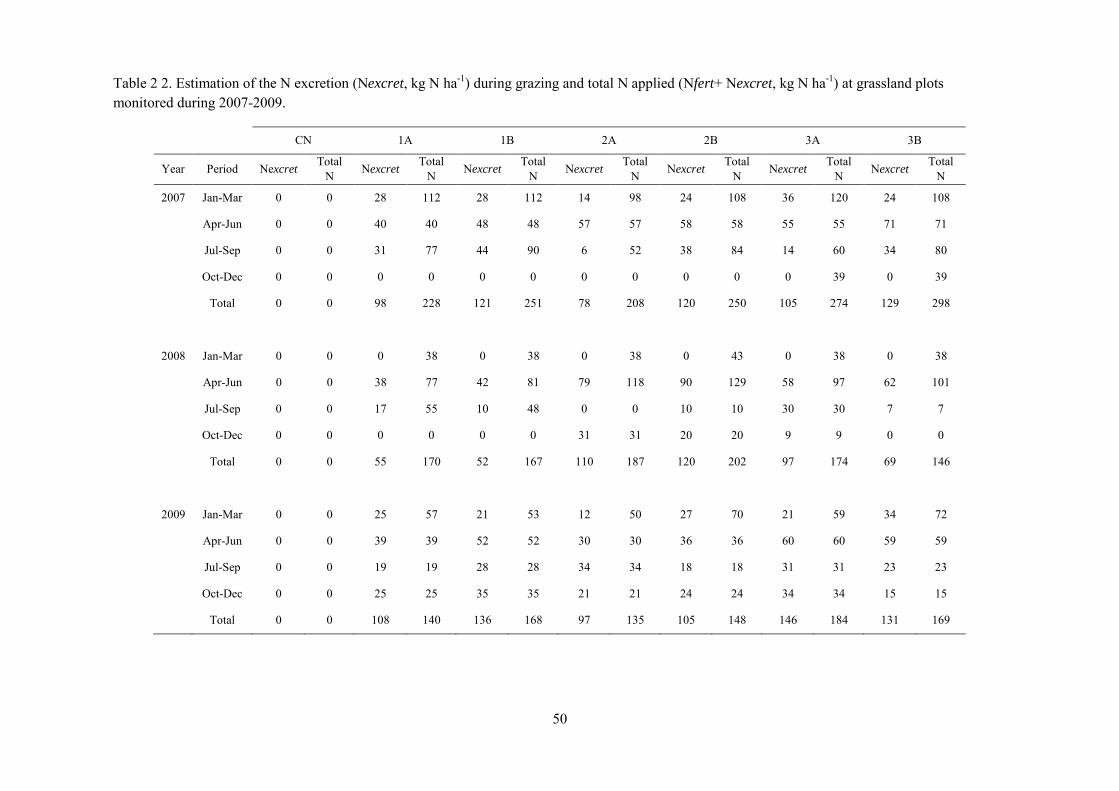
50
Table 2 2. Estimation of the N excretion (Nexcret, kg N ha-1) during grazing and total N applied (Nfert+ Nexcret, kg N ha-1) at grassland plots monitored during 2007-2009.
CN 1A 1B 2A 2B 3A 3B
Year Period Nexcret Total N Nexcret Total
N Nexcret Total N Nexcret Total
N Nexcret Total N Nexcret Total
N Nexcret Total N
2007 Jan-Mar 0 0 28 112 28 112 14 98 24 108 36 120 24 108
Apr-Jun 0 0 40 40 48 48 57 57 58 58 55 55 71 71
Jul-Sep 0 0 31 77 44 90 6 52 38 84 14 60 34 80
Oct-Dec 0 0 0 0 0 0 0 0 0 0 0 39 0 39
Total 0 0 98 228 121 251 78 208 120 250 105 274 129 298
2008 Jan-Mar 0 0 0 38 0 38 0 38 0 43 0 38 0 38
Apr-Jun 0 0 38 77 42 81 79 118 90 129 58 97 62 101
Jul-Sep 0 0 17 55 10 48 0 0 10 10 30 30 7 7
Oct-Dec 0 0 0 0 0 0 31 31 20 20 9 9 0 0
Total 0 0 55 170 52 167 110 187 120 202 97 174 69 146
2009 Jan-Mar 0 0 25 57 21 53 12 50 27 70 21 59 34 72
Apr-Jun 0 0 39 39 52 52 30 30 36 36 60 60 59 59
Jul-Sep 0 0 19 19 28 28 34 34 18 18 31 31 23 23
Oct-Dec 0 0 25 25 35 35 21 21 24 24 34 34 15 15
Total 0 0 108 140 136 168 97 135 105 148 146 184 131 169

Greenhouse gas fluxes derived from agricultural practices in forage crops in the Atlantic area
51
2.3.5. Cumulative N2O emissions
During all of the periods studied between 2007-2009, the lowest cumulative N2O emissions were
observed from the CN plot (Table 2.3). In 2007, the largest losses were during 'Apr-Jun' (60% of the
total N2O losses). In 2008, during the periods 'Jan-Mar', 'Apr-Jun', 'Jul-Sep' plots emitted an average of
3.61 kg N2O-N ha-1. In 2009, a large proportion (39%) of the annual loss was also observed during
'Apr-Jun'. Grazed and fertilized grassland plots emitted an average of 8.78 kg N2O-N ha-1 during the
sampling period in 2007, 22.15 kg N2O-N ha-1 in 2008 and 30.13 kg N2O-N ha-1 in 2009 (Table 2.3).
The largest cumulative N2O emissions were in 'Apr-Jun' and 'Jul-Sep' during 2007 (average of 3.06
and 3.14 kg N2O-N ha-1, respectively), ’Jan-Mar' in 2008 (average of 6.90 kg N2O-N ha-1) and 'Apr-
Jun' in 2009 (average of 10.64 kg N2O-N ha-1).
Table 2 3. Cumulative N2O fluxes (kg N2O-N ha-1) during the periods studied in 2007, 2008 and 2009. Mean value of four chambers and standard error (between brackets).
Plots
Period CN 1A 1B 2A 2B 3A 3B
Jan-Mar 07 - - - - - - -
Apr-Jun 07 2.57 (0.11) 3.36 (0.10) 3.22 (0.11) 2.70 (0.12) 2.57 (0.07) 3.05 (0.07) 3.46 (0.24)
Jul-Sep 07 0.80 (0.06) 3.38 (0.07) 3.70 (0.09) 2.76 (0.05) 2.89 (0.09) 2.78 (0.09 3.33 (0.19)
Oct-Dec 07 0.93 (0.01) 2.37 (0.10) 3.39 (0.05) 1.94 (0.05) 2.51 (0.40) 2.56 (0.11) 2.73 (0.08)
Total 2007 4.30 (0.06) 9.11 (0.26) 10.31 (0.18) 7.40 (0.14) 7.97 (0.50) 8.39 (0.12) 9.52 (0.41)
Jan-Mar 08 3.72 (0.04) 11.41 (0.79) 8.39 (0.16) 6.64 (0.10) 5.24 (0.17) 5.28 (0.21) 4.44 (0.14)
Apr-Jun 08 3.49 (0.01) 7.46 (0.12) 6.25 (0.15) 5.08 (0.07) 4.92 (0.04) 5.48 (0.15) 5.78 (0.06)
Jul-Sep 08 3.62 (0.01) 5.22 (0.05) 5.10 (0.08) 4.09 (0.06) 4.86 (0.06) 4.25 (0.07) 3.81 (0.06)
Oct-Dec 08 2.74 (0.02) 5.08 (0.04) 4.11 (0.04) 4.80 (0.05) 4.78 (0.10) 5.57 (0.18) 4.87 (0.02)
Total 2008 13.57 (0.06) 29.17 (0.88) 23.85 (0.40) 20.61 (0.17) 19.80 (0.17) 20.58 (0.21) 18.90 (0.20)
Jan-Mar 09 1.62 (0.00) 6.91 (0.03) 7.29 (0.14) 5.12 (0.05) 5.04 (0.03) 4.27 (0.06) 5.67 (0.16)
Apr-Jun 09 4.84 (0.00) 11.83 (0.07) 12.17 (0.04) 9.33 (0.04) 10.63 (0.13) 10.69 (0.12) 9.16 (0.01)
Jul-Sep 09 3.64 (0.01) 6.80 (0.06) 7.33 (0.15) 6.52 (0.15) 9.87 (0.05) 11.36 (0.02) 9.39 (0.07)
Oct-Dec 09 2.42 (0.07) 3.31 (0.19) 5.80 (0.17) 4.29 (0.24) 6.57 (0.07) 6.24 (0.11) 5.18 (0.21)
Total 2009 12.51 (0.07) 28.85 (0.30) 32.59 (0.12) 25.26 (0.32) 32.11 (0.15) 32.56 (0.05) 29.40 (0.39)

Greenhouse gas fluxes derived from agricultural practices in forage crops in the Atlantic area
52
Figure 2.3. Daily N2O fluxes observed from the grassland plots monitored in 2007, 2008 and 2009. Data points represent the mean value of four chambers ± standard error. Solid and dotted arrows denote grazing events and fertilization, respectively. Periods- 2007: (20th April-26th December); 2008: (8th January-30th December); 2009 (13th January-14th December).
0.00000.10000.20000.30000.40000.50000.60000.7000
1/1/
0731
/1/0
72/
3/07
1/4/
071/
5/07
31/5
/07
30/6
/07
30/7
/07
29/8
/07
28/9
/07
28/1
0/07
27/1
1/07
20073B
0.00000.10000.20000.30000.40000.50000.60000.7000
20073A 20083A
0.00000.10000.20000.30000.40000.50000.60000.7000
20072B 20082B
0.00000.10000.20000.30000.40000.50000.60000.7000
20072A 20082A
0.00000.10000.20000.30000.40000.50000.60000.7000
20071B 20081B
0.00000.10000.20000.30000.40000.50000.60000.7000
1A 2007 20081A
0.00000.10000.20000.30000.40000.50000.60000.7000
2007CN 2008CN
00000000
2009CN
0000000
kg N
2O-N
ha-1
day-1
20091A
20091B
20092A
20092B
20093A
13/1
/09
7/2/
094/
3/09
29/3
/09
23/4
/09
18/5
/09
12/6
/09
7/7/
091/
8/09
26/8
/09
20/9
/09
15/1
0/09
9/11
/09
4/12
/09
20093B
8/1/
087/
2/08
8/3/
087/
4/08
7/5/
086/
6/08
6/7/
085/
8/08
4/9/
084/
10/0
83/
11/0
83/
12/0
8
20083B

53
Table 2.4. Pearson correlations between N2O emissions and the variables for the inter-annual model
N2O Nexcret N fertilizer Rainfall Mean soil temp
Mean soil NO3
--N Mean soil NH4
--N Mean air
temp Mean WFPS
N2O -
Nexcret 0.3753 ** -
Nfert -0.0143 0.1742 -
Rainfall -0.3241 * -0.0186 -0.0606 -
Mean soil temp 0.1642 0.2426 -0.3044 *
-0.596 *** -
Mean soil NO3
--N 0.182 0.1366 -0.3071 * -0.0523 0.2046 -
Mean soil NH4
--N 0.244 0.3459 **
-0.277 * -0.2929 0.4029
** 0.6047
*** -
Mean air temp 0.1514 0.2413 -0.306
* -0.5611
*** 0.9964
*** 0.1918 0.3641 ** -
Mean WFPS 0.0786 0.387
** 0.2685
* 0.5734
*** -0.5446
*** -0.0601 -0.2417 0.5224 *** -
* P<0.05; **P<0.01;***P<0.001
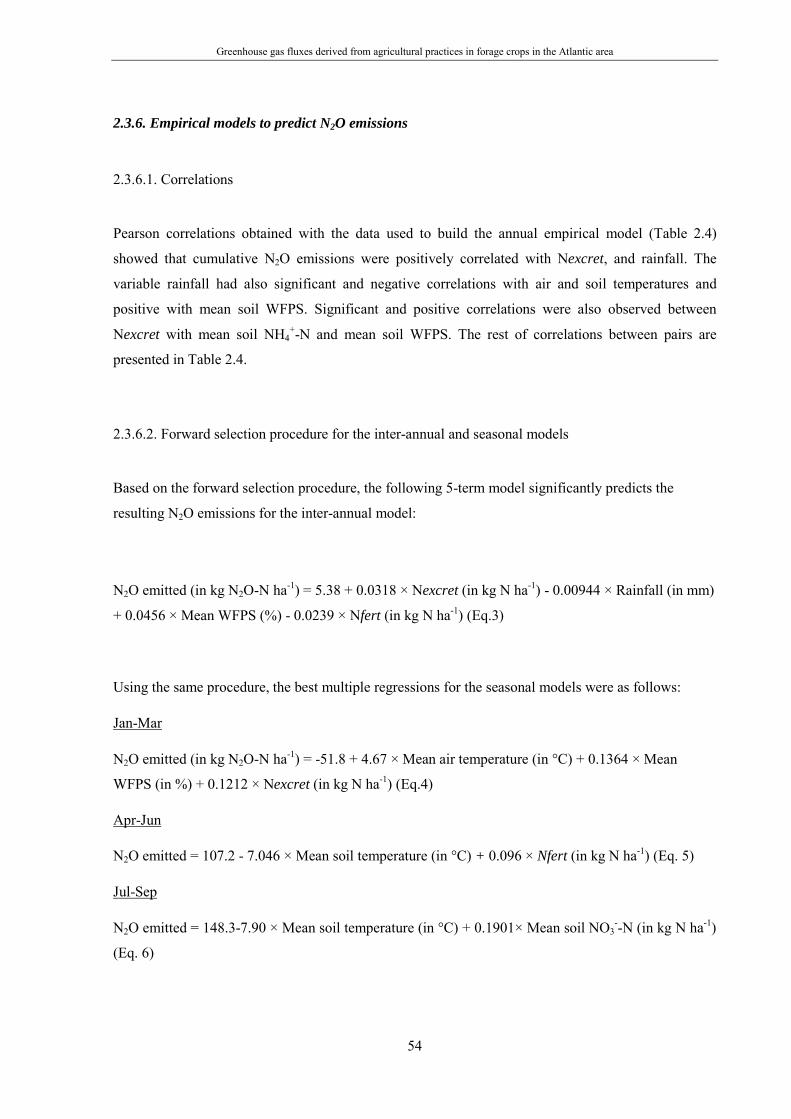
Greenhouse gas fluxes derived from agricultural practices in forage crops in the Atlantic area
54
2.3.6. Empirical models to predict N2O emissions
2.3.6.1. Correlations
Pearson correlations obtained with the data used to build the annual empirical model (Table 2.4)
showed that cumulative N2O emissions were positively correlated with Nexcret, and rainfall. The
variable rainfall had also significant and negative correlations with air and soil temperatures and
positive with mean soil WFPS. Significant and positive correlations were also observed between
Nexcret with mean soil NH4+-N and mean soil WFPS. The rest of correlations between pairs are
presented in Table 2.4.
2.3.6.2. Forward selection procedure for the inter-annual and seasonal models
Based on the forward selection procedure, the following 5-term model significantly predicts the
resulting N2O emissions for the inter-annual model:
N2O emitted (in kg N2O-N ha-1) = 5.38 + 0.0318 × Nexcret (in kg N ha-1) - 0.00944 × Rainfall (in mm)
+ 0.0456 × Mean WFPS (%) - 0.0239 × Nfert (in kg N ha-1) (Eq.3)
Using the same procedure, the best multiple regressions for the seasonal models were as follows:
Jan-Mar
N2O emitted (in kg N2O-N ha-1) = -51.8 + 4.67 × Mean air temperature (in °C) + 0.1364 × Mean
WFPS (in %) + 0.1212 × Nexcret (in kg N ha-1) (Eq.4)
Apr-Jun
N2O emitted = 107.2 - 7.046 × Mean soil temperature (in °C) + 0.096 × Nfert (in kg N ha-1) (Eq. 5)
Jul-Sep
N2O emitted = 148.3-7.90 × Mean soil temperature (in °C) + 0.1901× Mean soil NO3--N (in kg N ha-1)
(Eq. 6)

Greenhouse gas fluxes derived from agricultural practices in forage crops in the Atlantic area
55
Oct-Dec
N2O emitted = 2.99 + 0.00734 × Rainfall (in mm) + 0.1003 × Mean soil NH4+-N (in kg N ha-1) +
0.0798 × Nexcret (in kg N ha-1) - 0.0574 × Mean WFPS (in %) (Eq. 7)
The estimated coefficient values for the parameters included in the models and the corresponding
standard errors and significance were summarized in Table 2.5. The variance explained by combining
the parameters showed in each equation was 24.0% for the inter-annual model, 34.2% for the 'Jan-Mar
' model, 77.0% for the 'Apr-Jun' model, 72.0% for the 'Jul-Sep' model and 78.4% for the 'Oct-Dec'
model. Except for the 'Jan-Mar' model, all models were significant at P<0.001.
2.3.7. Sensitivity analysis
Figure 2.4 shows the result of the sensitivity analysis for the inter-annual model. The inter-annual
empirical model responded to changes in all the individual parameters included. However, cumulative
N2O emissions were more susceptible to environmental changes (specifically, rainfall and mean WFPS
are both positively related, Table 2.4) than changes in N management (Nexcret and Nfert).
Figure 2.4. Effect of changing each parameter on sensitivity analysis for the inter-annual empirical model. Percentage values represent the percentage of variation of the N2O emissions after changing each parameter respect to the baseline N2O emissions (6.0 kg N ha-1, denoted as *). Baseline values used for each parameter were: Nexcret: 22 kg N ha-1; rainfall: 348 mm; mean WFPS: 78.5%; Nfert: 14 kg N ha-1.
+5.8 %+2.9%
-2.9%-5.8 %
-27.1%-13.6%
+13.6%+27.1%
+29.6%+14.8%
-14.8%-29.6%
-2.7%-1.3%+1.3%
+2.7%
0.0 1.0 2.0 3.0 4.0 5.0 6.0 7.0 8.0 9.0
-50%-25%+25%+50%-50%-25%+25%+50%-50%-25%+25%+50%-50%-25%+25%+50%
*N
excr
etR
ainf
all
Mea
n W
FPS
N fe
rt
kg N2O-N ha-1
Inter-annual

56
Table 2.5. Estimated values for the final parameters that better predict cumulative N2O emissions during the inter-annual model (2008-2009) and for the seasonal models ('Jan-Mar', 'Apr-Jun', 'Jul-Sep', 'Oct-Dec').
Inter-annual
(2008,2009)
Parameter included in the
model Constant Nexcret Rainfall Mean WFPS Nfert P regression Adj R2
Estimate value for parameters (se) 5.38 (1.44) 0.0318 (0.0154) -0.00944 (0.00292) 0.0456 (0.0256) -0.0239 (0.0172) <0.001 0.240 (0.022)
P <0.001 0.045 0.002 0.041 0.170
Jan-Mar
(2008, 2009)
Parameter included in the
model Constant Mean air temperature Mean WFPS Nexcret - 0.077 0.325 (0.019)
Estimate value for
parameters (se) -51.8 (19.4) 4.67 (1.73) 0.1364 (0.0629) 0.1212 (0.0707) -
P 0.024 0.022 0.055 0.117 -
Apr-Jun
(2007, 2008, 2009)
Parameter included in the
model Constant Mean soil temp Nfert - - <0.001 0.770 (0.016)
Estimate value for
parameters 107.2 (12.2) -7.046 (0.849) 0.096 (0.0232) - -
P <0.001 <0.001 <0.001 - -
Jul-Sep
(2007, 2008, 2009)
Parameter included in the
model Constant Mean soil temp Mean soil NO3
--N - - <0.001 0.720 (0.014)
Estimate value for
parameters 148.3 (26.9) -7.90 (1.47) 0.1901 (0.0779) - -
P <0.001 <0.001 0.026 - -
Oct-Dec
(2007, 2008, 2009)
Parameter included in the
model Constant Rainfall Mean soil NH4
--N Nexcret Mean WFPS <0.001 0.784 (0.007)
Estimate value for
parameters 2.99 (1.38) 0.00734 (0.00164) 0.1003 (0.0320) 0.0798 (0.0188) -0.0574 (0.0225)
P 0.045 <0.001 0.006 <0.001 0.021
Greenhouse gas fluxes derived from agricultural practices in forage crops in the Atlantic area
57
2.4. Discussion
2.4.1. Empirical models
We aimed to obtain inter-annual and seasonal empirical models for grassland soils in the NW
Spain to predict the N2O emissions based on the most influential variables in the emission of
this gas. Six grazed and fertilizer grassland plots and one plot (designed as CN) with no N
inputs were monitored between April 2007 and December 2009. Sampling frequency was high
to provide more representative estimates of the losses of N2O caused by the combination of
grazing and fertilization under the climatic conditions in the NW Spain. As chambers were re-
located after each sampling, the spatial variability of the N2O emissions (caused by the
heterogeneous distribution of the urine and dung patches) within each plot was also included in
the measurements. We selected the equations based on the parameters that best predict N2O
(large Adj R2). The parameters included in each equation were generally significant at P<0.05
and P<0.001. Only in a couple of cases these parameters were not significant (P>0.05) within a
particular model, as it was observed during the inclusion of Nfert in the inter-annual model or
Nexcret in the 'Jan-Mar' empirical model (Table 2.5). However, they were included in the final
models as their inclusion improved the significance of the rest of parameters and, in the case of
the inter-annual model, improved the final Adj R2 (Dhanoa et al., 1999).
2.4.2. Inter-annual variations in N2O emissions.
Large inter-annual variations were observed in this study: there was up to a 1.4-fold difference
in the cumulative N2O emissions over two years (e.g. 2008 and 2009) from N managed
grasslands. This difference would have been larger if data from the whole 2007 was used
(excluded because there were no measurements in period 'Jan-Mar 2007'). Large inter-annual
variations were also observed in other temperate European grasslands under grazing and
fertilization, for example, 1.1-3.4- fold differences over two years in grasslands in England and
Wales (Cardenas et al., 2010), a 20-fold difference over 3 years in Scotland (Dobbie et al.,
1999), 1.1-3 fold differences over two years (Hyde et al., 2006; Rafique et al., 2011), up to a
7.8-fold over 4-years in Irish grasslands (Burchill et al., 2014) and up to a 5.8-fold over two
years in Dutch grasslands (Velthof et al., 1996). Some of the factors that caused the inter-annual
variation reported in the studies cited above were related to fertilizer N applications, grazing and
weather conditions and their effect on soil conditions. In agreement with those studies, inter-
annual N2O emissions were driven by changes in the rainfall patterns, mean soil WFPS and N
Greenhouse gas fluxes derived from agricultural practices in forage crops in the Atlantic area
58
management practices and explained 24% of the variation. In this sense, the inter-annual
empirical model was obtained from wet years, although both had similar annual rainfall
(differences of 2.6% in annual rainfall), there were differences in the seasonal distribution of the
rainfall and thus, differences in the soil WFPS. When comparing all seasons among years we
observed that the largest differences in cumulative N2O emissions between these two years were
during 'Apr-Jun' and 'Jul-Sep', with variations of 1.8 and 1.9-fold, respectively. In 2009, the year
with the largest N2O losses, the reduction in the annual Nfert with respect to 2008 was supplied
because of the increase in the grazing intensity and thus, Nexcret. That was reflected in the
inter-annual model obtained by sign (positive/negative) of variables for those parameters (Table
2.5). In 2008, the bulk of grazing events were in 'Apr-Jun' and in 2009, although larger in 'Apr-
Jun', grazing was practiced throughout all seasons in the managed grassland plots. The
parameter Nexcret is related to the effect of the animals grazing on the soil as it was calculated
based on number of animals, days, and hours per day grazing. In this sense, grazing occurred
during large number of hours per day (18h), with no restrictions when the soil was very wet.
Thus, the intense livestock treading when managed grassland plots were under those soil
conditions could have caused more anaerobic microsites in the soil as consequence of soil
compaction, which is in agreement with other studies (Drewry et al., 2008; Simek et al., 2006;
Van Groenigen et al., 2005). The increasingly anaerobic conditions would have stimulated
denitrification and thus, N2O production. In addition, during grazing, large quantities of readily
organic C contents were deposited on the soil from animal excreta, which would have also
stimulated the denitrification process (Cameron et al., 1997; Chadwick, 1997; de Klein et al.,
2001; Di and Cameron, 2003) and, therefore N2O losses. The hydrolysis of urea in urine patches
would have caused a decrease of soil pH, increasing the solubility of soil organic matter,
availability of C and consumption by microorganisms which could also result in larger number
of anaerobic microsites (Luo et al., 2013; Monaghan and Barraclough, 1993) available for N2O
production. The changes cited above caused by grazing and not included in the model (i.e.
changes in soil bulk density, pH, available C contents) could explain inter-annual variation not
explained for by rainfall, mean WFPS, Nfert and Nexcret. Thus, we believe that restrictions in
the number of grazing hours per day when soil is very wet (de Klein et al., 2006; Luo et al.,
2008; Rafique et al., 2011) or even avoiding grazing (Van Groenigen et al., 2005) could
minimize losses of N2O.
2.4.3. Inter-seasonal variations on N2O emissions
2.4.3.1. Winter periods ('Jan-Mar')

Greenhouse gas fluxes derived from agricultural practices in forage crops in the Atlantic area
59
Some studies report large N2O emissions during the winter. The reason of the losses observed
during this season could be caused by periods of freezing and thawing because of the low
temperatures. Burchill et al. (2014) observed in a white/clover grassland in Ireland that these
episodes produced 39-fold more N2O emissions in comparison with other winters where these
cycles are missing. Syväsalo et al.(2004) in a two year study in boreal grassland also observed
that these cycles contribute to increases of between 45-59% and 33-36% in N2O emissions
during winter periods, on a clay and a loamy sand soil, respectively. Lampe et al. (2006) and
Kammann et al. (1998), both in Germany, reported that these episodes contributed 26% to the
total cumulative 11-month emissions from a permanent grassland with a mixed managed system
(cut and grazing) and 43-52% to the total annual N2O emissions from grasslands with the
highest amount of N fertilizer applied. These N2O emissions are caused by the release of C and
N from soil aggregates that rupture or microbial cells that lyse during the freezing periods and
are then available for denitrifiers during thawing. It can also be because of the effect of the low
temperatures on the N2O/N2 ratio due to the suppress of the N2O reductase enzyme activity
(Melin and Nômmik, 1983; Müller et al., 2002; van Bochove et al., 2000). In this study, we
observed variations of 1.3-fold in the cumulative N2O emissions during the winter but, contrary
to the studies reported above, they were not related to those freezing and thawing cycles as daily
temperatures did not reach temperatures below zero in any year monitored during winter. The
model obtained for this season attributed changes in N2O emissions to variations in soil WFPS,
air temperature and Nexcret. During winters, optimal conditions for denitrification are caused
by high rainfall and low evapotranspiration (Luo et al., 2000) and low growth state of the
grassland (Saggar et al., 2004a). In this study, both winters had similar rainfall records (349 and
328 mm), which resulted in very wet soil moisture conditions. However, as air temperatures
during winter 2008 were 0.6°C warmer than 2009, evapotranspiration was larger, resulting in
less saturated soil conditions than in 2009. The inclusion of the Nexcret in the model would
mean that if soil conditions were not that anaerobic during 2009, larger N2O emissions would
have been observed during 'Jan-Mar' 2009. In this sense, differences in evapotranspiration,
which was not included in the model, would probably have played an important role during this
period. However, the results of this model should be considered carefully as the resulting
combination did not report significance, probably because of a possible overestimation in
cumulative N2O emissions caused by the lower sampling frequency during 'Jan-Mar' 2008.
2.4.3.2. Spring periods ('Apr-Jun')
Inter-seasonal differences in the cumulative N2O emissions of up to 3.5-fold were observed
during spring. from N managed grassland plots. During this season, air temperatures, and

Greenhouse gas fluxes derived from agricultural practices in forage crops in the Atlantic area
60
consequently soil temperatures, rose up after the winter which, together with the frequent rain,
early in the season, stimulates the growth of the pasture. This fact explains the required fertilizer
applications and the large opportunity for grazing during this season. However, soil
temperatures also stimulate and govern microbial processes in the soil and thus, N2O production
(Firestone and Davidson, 1989; Smith et al., 2003). This makes the spring one of the largest, if
not the largest, contributing seasons to annual N2O emissions. Soil temperatures were very
similar in 2007 and 2008 but almost 1°C lower in 2009. However, the pattern of N2O
production was the opposite with greater emission in 2009. In 2007, soil WFPS conditions were
optimal for both losses by nitrification and denitrification but the magnitude of the N2O
emissions would have been limited by the timing of fertilizer applications. The fact that most of
the managed grasslands received N fertilizers late in the winter or early in spring (Table 2.1)
before starting sampling measurements meant that N2O losses related to fertilizer applications in
spring 2007 could have been missed. In the springs of 2008 and 2009, denitrification would
have been the main N2O producing process and it would have been highly stimulated because of
the increase of soil temperatures during the season. Dobbie and Smith (2001), for example,
reported that at temperatures in the range of 12-18°C, denitrification showed Q10 values of 2.3
in a grassland soil. However, despite this stimulation, the process would have differed in the
N2O/N2 rate of production amongst seasons. In 2008, although the soil conditions for losses of
N2O by denitrification were optimal, the larger N inputs from livestock and fertilizers than in
2009 would have decreased the N2O/N2 production ratio (de Klein and van Logtestijn, 1996),
especially in those days where soil was saturated (in 58% of the days sampled WFPS>90%, data
not shown) because of the high rainfall during the season in 2008 (39% larger than 2009). On
the contrary, the rate of production would have increased in 2009 as soil WFPS presented levels
between 60-80% in most of the days sampled (70% of the days, data not shown). The model
revealed an effect of soil temperature and N fertilizer on N2O emissions but not of soil WFPS,
probably because of the decrease of N2O emissions at low (as in 2007) and very high soil WFPS
levels (as in 2008), which also explains the negative effect of the soil temperature in the model
(largest N2O emissions were in 2009 where soil temperature was almost 1°C lower compared to
the other two years).
2.4.3.3. Summer periods ('Jul-Sep')
Large N2O emissions are frequently observed during the summer months, in temperate (Hyde et
al., 2006; Kim et al., 2010; Rafique et al., 2012; Rafique et al., 2011) and sub-tropical
grasslands (Rowlings et al., 2015). Although this was the driest period of the year (113-196 mm
of rainfall), large N2O losses were observed when warm temperatures (18.0-18.7 °C) were

Greenhouse gas fluxes derived from agricultural practices in forage crops in the Atlantic area
61
combined with wet conditions and available mineral N, causing inter-annual differences up to
2.7-fold in N2O emissions. Hyde et al. (2006) associated large N2O emissions during summer
with fertilizer N applications that coincide with rainfall events. In this study, although no
fertilization was made during this period in 2009, contrary to 2007 and 2008 (N applied late in
the season), managed plots received N inputs through grazing. These grazing events coincided
with times were rainfall was large and frequent, whereas in 2007 grazing occurred under drier
conditions. The larger soil NO3--N contents was probably the cause, in addition to the wetter
conditions, of the high magnitude of the resulting N2O losses in this period in 2009. After
grazing, peaks of NH4+-N were episodic and significant increases in soil NO3
--N contents were
not observed (data not shown), which probably denoted a rapid denitrification of the NO3--N
formed. This was also supported by the levels of soil WFPS at the moment of the largest N2O
emissions, which were in the range 64-88%, optimal conditions for losses by denitrification.
Some studies also attribute these losses to the combined effect of elevated soil temperatures,
large N inputs and rewetting periods after a long period of soil dryness as in Kim et al.(2010). In
this type of soil and region, dry-wetting periods have been observed by Louro et al. (2015)
during the summer period in forage maize and elevated the resulting losses of N2O from soil. In
the latter study, the resulting fluxes were caused by an increase in a certain fraction of the soil
OM (resulting from the death of the microbial population and from the disruption of soil
aggregates) during the dry period which would be mineralized and N2O emitted after soil
rewetting. That could explain the losses of N2O observed in all summers and also springs from
the CN grassland plot (no N applications). This fact together with the more optimal conditions
for N2O production by denitrification during 2009 would have caused differences in the
background values with respect to 2007 and 2008. However, the magnitude of the episodes of
soil drying and rewetting were not as significant as those related to grazing.
2.4.4.4. Autumn periods ('Oct-Dec')
Under the contrasting weather conditions and the different N management, differences of up to
2.0-fold in cumulative N2O emissions were observed during the autumn seasons. In 2007, only
two grassland plots received N fertilizers in early autumn, in addition to those carried out late in
summer. In this year, climatic conditions were drier than in the other two years and most of the
rain occurred in this season from mid-November onwards (data not shown) and it was reflected
in the low WFPS levels (<60%WFPS) early in the season. However, when soil WFPS
conditions increased beyond this limit because of the frequency of the rain, only one significant
peak of N2O was observed from one of the N managed plots. This would have denoted larger
plant N uptake in the managed plots early in the season, leaving less quantities of available

Greenhouse gas fluxes derived from agricultural practices in forage crops in the Atlantic area
62
mineral N for possible losses by denitrification later on. In 2008 and 2009, N additions were
through grazing. In 2008 only half of the N managed plots had livestock grazing while in 2009
all plots were grazed. Those events coincided with periods with frequent rainfall, which was
more intense in 2009. This was also reflected in the soil. We observed that in both years WFPS
levels were suitable for denitrification, however as Nexcret during 2009 was larger, losses of
N2O emission were 7.5% larger than 2008. This figure is considerably lower than the increase
of 40-60% reported by de Klein et al.(2006) and Luo et al.(2008) when grazing with no
restrictions is carried out under wet conditions in autumn. The reason of these differences would
have been in the larger number of days with optimal conditions for complete denitrification
during 2009 (in 2009, WFPS>80% in 77% of days versus 36% of days in 2008, data not
shown), which together with the enhancement of anaerobic conditions caused by livestock
grazing, resulted in the decrease in the N2O/N2 ratio of denitrification.
2.5. Conclusions
Understanding what factors and how those factors influence N2O emissions in a particular area
is a key step in developing mitigation options that reduce emissions. In Galicia (NW Spain),
where dairy farming is an important sector, there were a knowledge gap about how N
management practices under the influence of the Atlantic climatic conditions of this region
affected N2O emissions from grasslands. In this study, N2O emissions were monitored over 2
years and 9 months from N-fertilized and grazed grasslands. The data obtained was used to
develop five empirical models to explain inter-annual and seasonal variations from grazed and
fertilized grasslands based on the most influential parameters for N2O emissions. We observed
large inter-annual variations in the N2O emissions from grasslands used for dairy production,
which were caused by variations in N management in combination with variations in weather
conditions. Twenty-four percent of those inter-annual variations were explained by differences
in rainfall, mean WFPS and N inputs (fertilization and excretion). As the largest annual N2O
emissions were observed when wet conditions were combined with unrestricted grazing daily
grazing hours. we believe that other factors not included in the model and, probably, related to
grazing (i.e. changes in soil bulk density, pH, available C contents) would have been
responsible for the remaining variation. Variations in the N2O emitted were observed in all
seasons. High soil temperatures and N fertilizer application or available soil nitrate contents
caused most of the variations observed in spring and summer. In autumn, the variations were
caused by differences in rainfall records and the effect on soil WFPS as well as grazing and
available ammonium contents in the soil. We suggest that restriction in the number of grazing

Greenhouse gas fluxes derived from agricultural practices in forage crops in the Atlantic area
63
hours per day or even avoiding grazing when soil is very wet could reduce annual N2O losses
from dairy grasslands in the NW Spain. Future research is required to build models that are
based on more detailed data related to grazing to allow for better prediction of inter-annual
variation in N2O.

Greenhouse gas fluxes derived from agricultural practices in forage crops in the Atlantic area
64
CHAPTER 3. GREENHOUSE GAS (GHG) FLUXES FROM A GRAZED GRASSLAND AFTER CATTLE SLURRY INJECTION AND MINERAL FERTILIZER APPLICATIONS

Greenhouse gas fluxes derived from agricultural practices in forage crops in the Atlantic area
65
Abstract
The dairy sector causes the largest annual greenhouse gas (GHG) emissions in Europe with the
largest number of dairy farms located in the European Atlantic areas. The objective of this
experiment was to quantify the effects of the application of mineral fertilizers and cattle slurry
on GHGs from a grassland with grazing dairy cattle and identify the type of fertilizer associated
with high grass production and low GHG fluxes. The experiment was located in Galicia, a
region located in the Atlantic zone in North West Spain with humid climatic conditions (mean
annual rainfall >1000 mm) and tempered temperatures (mean annual temperature of 13.2 ºC).
Greenhouse gas fluxes were monitored during a seven-month experiment in 2011 after the
spring, summer and autumn applications of mineral fertilizer (MN) and injected cattle slurry
(CS) and they were compared with no fertilization (CN). In 2011, all seasons monitored
suffered a reduction in the mean rainfall but it was especially important during spring and
summer seasons where rainfall was very little. Dry soil conditions (<60%WFPS) were observed
during the spring and summer, which was contrary to the higher soil WFPS (>60%WFPS) in
autumn because of the more frequent rainfall. Total cumulative N2O fluxes were similar in CS
and MN (P>0.05). The largest cumulative N2O fluxes were observed in the first 30 days after
the spring application (as fertilization was followed by some rainfall) and autumn application.
Short-lived CH4 fluxes were observed immediately after each slurry injection and decreased in
the following days to similar values as in CN and MN. Total cumulative CH4 fluxes were
significantly (P<0.05) larger from CS than MN and CN. The largest CH4 fluxes from CS were
observed after the application in autumn (P<0.05), probably because of the low dry matter
content in the slurry in combination with wet soil conditions on the application day. Carbon
dioxide fluxes were also short-lived after the three CS applications followed by a decrease to
similar values as in CN and MN. However, these short-lived losses did not cause an overall
difference in the total cumulative CO2 fluxes respect to MN and CN (P>0.05). Overall, no
significant differences between treatments were found when expressing total GHG (sum of
N2O, CH4 and CO2) losses in CO2 equivalents (P>0.05), which were in the range 3.87-4.52 Mg
equiv CO2-C ha-1. Yields scaled emission factors of 3.87 Mg equiv CO2-C Mg DM-1 were
obtained from CN, similar to 4.41 and 4.52 Mg equiv CO2-C Mg DM-1 resulting from MN and
CS treatments, respectively (P>0.05). Dry soil conditions during spring and summer would
have stimulated organic matter mineralization, providing quantities of N that met crop demands.
As both fertilizers caused similar total CO2 equivalents to produce the same yields, both
fertilizers could be used. However, if the costs of purchasing mineral fertilizers are considered,
using injected slurries as fertilizer would be more beneficial for dairy farmers as animal wastes
produced on farms would be recycled and milk production costs would be reduced.

Greenhouse gas fluxes derived from agricultural practices in forage crops in the Atlantic area
66
3.1. Introduction
Grasslands are important in Europe as they cover approximately one third of the European
agricultural area (Smit et al., 2008). They are used for animal feeding as they provide the
nutrients required for domestic livestock to meet current demands of milk and meat quality.
According to Smit et al. (2008), grasslands located in Atlantic areas are more productive than
those in Mediterranean areas due to the frequent rainfall and cool temperatures. Thus, the largest
number of dairy farms are located in these Atlantic Areas. According to Lesschen et al. (2011a),
in comparison with other sectors (beef, pork, poultry and egg ) the dairy sector causes the
largest annual greenhouse gas (GHG) emissions (195 Tg CO2 eq) in Europe. As the atmospheric
concentration of these gases, (nitrous oxide (N2O), methane (CH4) and carbon dioxide (CO2)),
have increased between 1970-2010 (from 27 to 49 Gt CO2 eq) and intensified in the decade
2000-2010 (2.2%) (Victor et al., 2014) policies should be adopted by institutions and countries
to mitigate GHG emissions. Nitrous oxide is formed in soil by nitrification, where nitrifying
microorganisms transform the ammonium (NH4+) contained in the soil in nitrate (NO3
-) under
aerobic conditions and by denitrification where NO3- is reduced to N2O and, finally to N2 gas
under anaerobic conditions (Barton et al., 2008). Both processes are controlled by several
factors as oxygen availability, soil water filled pore space (WFPS), mineral N content,
temperature, available soil organic C and pH (Dobbie et al., 1999; Smith et al., 2003). Smith et
al. (2003) reported that rainfall is the main controlling factor during the growing season in
grasslands due to the influence of soil water status on N2O production, especially if these events
happen around the time of fertilization when large soil mineral N levels are available for losses
of N2O. In this sense, fertilization plans have to be adapted to crop demands as an excess of N in
the soil can lead to large losses of N2O. Grazing also results in large N2O losses as the urine and
dung deposited by grazing animals causes a high nutrient loading with respect to the small area
intended for grazing and this high loading often exceeds plant N demand (Haynes and Williams,
1993; Zaman et al., 2013). In addition, the damage of the grass during intensive treading also
causes the decrease of plant N uptake and therefore, accumulation in the soil of large amounts
of N available for N2O production. Livestock treading generates soil anaerobic environment by
physical disturbance and compaction during grazing in combination with large inputs of N and
C, which also stimulates denitrification (Luo et al., 1999; Menneer et al., 2005; Oenema et al.,
1997; Saggar et al., 2004b; Saggar et al., 2011). When fertilizers and grazing are combined N2O
can reach annual losses up to 51.3 kg N ha-1 (Rees et al., 2013). Slurry application to grasslands
is a frequent practice to increase grass yields in dairy systems as they are very valuable
fertilizers and it is a solution to the large volume of animal waste generated in farms. Slurry
application techniques such injection have been reported as an option to reduce losses of N by
ammonia (NH3) (Huijsmans et al., 2003; Misselbrook et al., 1996; Smith et al., 2000). However,

Greenhouse gas fluxes derived from agricultural practices in forage crops in the Atlantic area
67
in some studies, the injection of the slurries seem to increased losses of N2O respect other
techniques (Ellis et al., 1998; Flessa and Beese, 2000; Wulf et al., 2002).
Grassland soils generally act as a sink of CH4 via oxidation by methanotropic bacteria so short-
lived CH4 emissions are only observed immediately after manure applications to soil (Chadwick
and Pain, 1997; Chadwick et al., 2000; Louro et al., 2013). Methane is the product of the
organic matter decomposition carried out by methanogenic microorganisms under anaerobic
conditions so once organic fertilizer is applied to the soil the diffusion of oxygen into the
amendment on the soil surface inhibits CH4 production (Chadwick et al., 2011).
Soils can also act as both source and sink of atmospheric CO2. The CO2 is fixed in plant
biomass through photosynthesis and can be stored in the soil as organic C when plant residues
are converted into soil organic matter. Respiration by plant roots and soil microflora and fauna
also contribute a major portion of CO2 emission from the soil (Curtin et al., 2000). Mineral and
organic fertilizers can result in different responses in soil CO2 fluxes as Rochette and Gregorich
(1998) reported after mineral or slurry applications. They observed that the application of
slurries can increase 2.2-2.6-fold CO2 fluxes with respect to no fertilizer due to the increased in
soil respiration and levels of soluble organic C and microbial biomass C, whereas mineral
fertilizers had little effect on these parameters. It is therefore important to identify the type of
fertilizers that minimize GHG emissions in the specific soils and climates of Europe.
In Spain, agriculture causes 84.1% and 53.9% of the anthropogenic N2O and CH4
(MAGRAMA, 2015). The dairy sector is concentrated in the northern areas where the largest
extension of grasslands are located. In Galicia, a region located in the Atlantic zone, grasslands
represent 19% of the utilised agricultural area (816, 871 ha) and 42% of the croppable land
(374,916 ha) (ESYRCE, 2013), which means that this region is one of the main dairy milk
producers in Spain. Despite this, there is currently little research into the natural or human
factors that influence GHG emissions in Galician grasslands. Based on this, the objective of this
study was to quantify the effects of the application of mineral fertilizers and cattle slurry during
spring, summer and autumn on GHG fluxes from a grassland with grazing dairy cattle. Based on
the yield-scaled emission factors (expressed as total CO2 equivalents per unit of dry matter
yield), we aim to find the type of fertilizer (mineral fertilizer/ injected cattle slurry) that
increases grass production without increasing GHG fluxes.

Greenhouse gas fluxes derived from agricultural practices in forage crops in the Atlantic area
68
3.2. Material and methods
3.2.1. Experimental site and soil characteristics
A field experiment was carried out between 13th April and 8th December 2011 in a grassland
located at Mabegondo Agricultural Research Centre (CIAM-INGACAL), in Abegondo, Galicia,
Spain (43.2425°N, 8.2608°W). The pasture consisted of a mixture of perennial ryegrass (Lolium
perenne L.) and white clover (Trifolium repens L.). The soil is a Humic Cambisol with a silt
loam texture (USDA classification). The bulk density (BD) at 0-10 cm soil depth was 1.07 g cm-
3 and the pH (H2O) value was 5.7. Total C, total N and organic matter were 4.8%, 0.42% and
10.4%, respectively. The climate is European Atlantic (Fernández et al., 2011) with annual
mean rainfall and air temperatures (2001-2010) of 1173 mm year-1 and 13.2ºC, respectively.
The agroclimatic classification of the area where the experiment was located is Mediterranean
Maritime according to Papadakis (1966).
3.2.2. Experimental design
A randomized block design was set up with three replicate plots of the following treatments:
control with no N fertilizer (CN), mineral N fertilizer as CAN 27% (MN) and cattle slurry
injected into the soil at 5 cm depth (CS). Each replicate plot was 0.15 ha in area (42.5 m x 35.0
m).
3.2.3. Fertilization events and characteristics of mineral fertilizer and slurries applied
Treatments were applied three times during the study: 13th April (spring application), 14th June
(summer application) and 8th November (autumn application). Mineral fertilizer was applied as
calcium ammonium nitrate 27% (CAN 27%) at rates of 36, 45 and 40 kg N ha-1 in the spring,
summer and autumn applications, respectively using a fertilizer spreader. Phosphorus (P) and
potassium (K) fertilizers were applied in CN and MN treatments to ensure that these nutrients
would not limit herbage production and also to equal the amounts of P and K applied with the
slurry. Phosphorus and potassium fertilizers were applied on the 13th April and 8th November
using granular simple super phosphate 18% and potassium chloride 60%. Rates of 28 and 30 kg
ha-1 of P (as P2O5) and 121 and 67 kg ha-1 of K (as K2O) were applied in the spring and autumn
applications, respectively.

Greenhouse gas fluxes derived from agricultural practices in forage crops in the Atlantic area
69
Cattle slurry was collected from the pit located at CIAM-INGACAL. The pit was sampled in
the previous months to this study for the analysis of N contents in the slurry and calculation of
N to be applied in the experiment. The slurry samples taken showed that 56% of the total N was
as mineral N and entirely as ammonium (NH4+-N) (no nitrate, NO3
--N, was detected). Based on
this and with the aim to equal N rates in the MN treatment, slurries were injected at 5cm depth
with target rates of 26, 35 and 28 m3 ha-1 in the spring, summer and autumn applications,
respectively. On each application day, slurry samples were collected from the slurry injector
tank and analysed to determine the chemical composition of the slurries applied (see section
2.8). These analyses showed that the NH4+-N contained in the slurries used in spring and
summer slightly varied respect to previous analysis. The final N rates applied were those
reported in Table 3.1.
Table 3.1. Amounts of the different N compounds incorporated to the soil (in kg N ha-1)as mineral and cattle slurry. Treatments- CS: cattle slurry; MN: mineral fertilizer; CN: control.
Fertilization Date Treatment Total N NH4+-N NO3
--N N org
Spring 13th April CS 83 46 0 37
MN 36 18 18 -
CN - - - -
Summer 14th June CS 108 61 0 47
MN 45 22.5 22.5
CN - - - -
Autumn 8th November CS 67 38 0 29
MN 40 20 20 -
CN - - - -
3.2.4. Grazing events and N excreted by livestock
A rotational grazing system was used during the experiment. This practice can control the
paddocks where forage growth is at peak production (high forage quality and easy digestion).
Also, it allows resting periods between grazing events which help to maintain healthy forages
since rotational grazing controls the production of weeds and undesirable plants which often
invade overgrazing areas. Blocks were rotationally grazed one by one and livestock was not
allowed to access to the next block until the previous block was completed grazed. Within each

Greenhouse gas fluxes derived from agricultural practices in forage crops in the Atlantic area
70
block, treatment plots were simultaneously grazed. The herd size was divided into three groups
of a mean of 11 animals per group. Each treatment plot was divided into three small areas to
allow the rotational grazing. Different groups of animals (dairy cattle, pregnant cows and
heifers) were used to graze the experiment a total of five times during the experiment, which are
shown in Table 3.2.
Total nitrogen excreted by livestock (Nexcret) in each grazing event was estimated as follows
((Eq.1)):
Nexcret (kg N ha-1) = 0.2002 × N × LSU × number of grazing hours × 24h-1 × A-1
where Nexcret is the N excretion by livestock during a grazing event in kg N ha-1, 0.2002 is the
daily N excretion per cow (in kg N cow-1 day-1) (Báez Bernal et al., 2008; Bossuet et al., 2006),
N is the number of animals grazing, LSU is a constant that represents the type of livestock unit
(dairy cattle: 1.00; pregnant cows and heifers: 0.85), number of grazing hours normalized to 24
hours and A is the area of the grassland plot (in ha).
Table 3.2. Grazing events during the experiment and N excreted (Nexcret, in kg N ha-1) in each grazing event and treatment. Values represent the mean value of three blocks with the standard error (in brackets).
Grazing event Period grazing N Number of grazing
hours LSUa Nexcret
1 2nd to 10th May 13 47 (6) 1.00 34 (4) 2 7th to 11th June 13 38 (7) 0.85 24 (5) 3 27th July to 5th August 13 48 (0) 1.00 35 (0) 4 26th September to 3rd October 10 55 (7) 0.85 26 (3) 5 12th to18th December 7 48 (0) 0.85 16 (0) a LSU: livestock unit
3.2.5. Chamber design and operation
Greenhouse gas (N2O, CH4 and CO2) fluxes were measured using a closed chamber technique
(Louro et al., 2015). Chambers were comprised by a cylinder of polyvinyl chloride (PVC) with
24.02 l volume (diameter 25 cm, height 36 cm) and a PVC lid fitted with a sampling port with a
three-way valve. Chambers were inserted in the soil 24 h before starting gas measurements . Six
chambers per replicate plot were used (i.e., 18 chambers per treatment). Chambers were
returned to the same position after each grazing event and fertilizer application. The effective
height of each chamber above the ground (H) was measured internally in the centre of the

Greenhouse gas fluxes derived from agricultural practices in forage crops in the Atlantic area
71
chamber. The resulting effective chamber height ranged between 23-27.5 cm. Values of
chamber height recorded were used to calculate GHG fluxes from each chamber after insertion
in the soil. Gas measurements were usually carried out between 10:00 and 13:00 h. On each
sampling day, chambers were closed for 50 min. After 50 min (T50), the chamber headspace
was sampled via the three-way valve on the chamber lid. A sample of 60 ml of the chamber
headspace was taken and transferred to a 20 ml pre-evacuated glass vial using a syringe and two
hypodermic needles: one to inject the sample into the vial and the second one to release the
sample to ambient pressure. Two ambient air samples were taken and the average was used to
provide a background value (T0). Two digital thermometers were used to record soil and air
temperatures in each chamber.
3.2.6. Greenhouse gas flux measurements and laboratory analysis
Fluxes of N2O, CH4 and CO2 were measured immediately after first fertilization carried out in
spring (from 13th April to 6th June), immediately after the second fertilization in summer (14th
June to 20th July 2011), and before and after the third fertilization in autumn (from 6th October
to 21st December 2011). Gas samples were analysed with an Agilent Technologies gas
chromatograph (Agilent 7890A) equipped with a capilar column (IA KRCIAES 6017: 240 ºC,
30 m x 0.32 mm) and two detectors: 63Ni electron capture detector (ECD) at 300ºC for
measuring N2O and a flame ionization detector (FID) at 300ºC for CH4. For CO2 determination,
the GC was equipped with a methanizer to reduce CO2 to CH4. The injection was carried out
with a six pot valve. Gas standards (0.22, 0.33, 0.88, 1.10, 8.9 ppm for N2O; 1.67, 8.4, 16.7 ppm
for CH4; 399, 1995, 3990 ppm for CO2) were used for calibration and to calculate the
concentrations of gases in the samples by comparing peak areas integrated with those obtained
with the standards of each gas.
Daily greenhouse gas fluxes were calculated from the accumulation of each gas in the chamber
as follows ((Eq. 2)):
F= ρ x H x (C50-C0)/ t x 273.15/ T x 104 x 24 (Eq.2)
where F is the gas flux (kg N2O-N ha-1 day-1, g CH4 ha-1 day-1, kg CO2-C ha-1 day-1), ρ is the gas
density (N2O-N: 1.26 kg m-3; CH4: 717 g m-3; CO2-C: 0.536 kg m-3) under STP conditions
(273.15 K, 101,325 Pa), H is the effective height of the chamber (m), C50-C0 is the gas
concentration at 50 minutes (T50) after chamber closure minus gas concentration of ambient
sample (T0) (µm3 m-3), t is the time of chamber closure (50 min) and T the temperature (K)
inside the chamber. Total cumulative fluxes of N2O, CH4 and CO2 fluxes (expressed as kg N2O-
N ha-1, kg CH4 ha-1 and Mg CO2-C ha-1) were calculated for each period considered and during

Greenhouse gas fluxes derived from agricultural practices in forage crops in the Atlantic area
72
the whole experiment by using the trapezoidal method (Cardenas et al., 2010; Louro et al.,
2013). In the period between 21th July and 5th October no measurements were taken. Mean
cumulative GHG fluxes were also calculated in different periods after fertilizations. Factors of
298, 25 and 1 were used to convert total N2O, CH4 and CO2 fluxes in total CO2 equivalents
(IPCC, 2007). The value obtained was used for the calculation of total CO2 equivalents emitted
per unit of DM yield produced in each treatment. For N2O, emission factors (expressed as %)
based on the loss per kg of N applied with fertilizers (EFNapplied) and per kg of N uptake by plant
in each treatment (EFNuptake, Schils et al. (2008)) were calculated.
3.2.7. Soil sampling and analysis
Once a week, six soil cores from the 0-10 cm soil profile were collected from each single plot
for analysis of gravimetric soil moisture and mineral N (ammonium, NH4+-N and nitrate, NO3
--
N) as it was described in Louro et al. (2015). Soil bulk density (BD) was determined at the start
of the experiment. Three metal rings (3.8 cm diameter, 8cm height) were used for the sampling.
The soil sample contained in the ring was dried at 105ºC to constant weight. Bulk density was
finally calculated from the dry soil weight and the volume it occupied and expressed as Mg m-3.
Total soil porosity was calculated by the following equation (3):
Porosity =1- (BD/2.65) (Eq.3)
where BD is the soil bulk density (Mg m-3) and 2.65 is the assumed particle density value (Mg
m-3). Water filled pore space (WFPS), expressed as percentage, was calculated by multiplying
the gravimetric soil moisture by BD and dividing by total soil porosity (Louro et al., 2015).
3.2.8. Slurry analysis
Density, pH, dry matter (DM), total N, total P, total K and total C were determined by using the
methodology described in Louro et al. (2015). Organic matter (OM) was analysed in dry and
ground (<0.01mm) samples using a thermogravimetric analyzer TGA-601 (LECO Co.,
Michigan, USA). Chemical and physical properties of the cattle slurry applied to the soil are
summarized in Table 3.3.

Greenhouse gas fluxes derived from agricultural practices in forage crops in the Atlantic area
73
Table 3.3. Characteristics of the dairy cattle slurries used in this experiment.
Dairy cattle slurry applications Spring application Summer application Autumn application Properties Units 13th April 14th June 8th November Density g cm-3 1.09 1.07 1.05 pH - 8.45 8.45 8.39 DM % 7.5 6.9 6.9 OM % DM 80.7 79.1 76.2 Total P % DM 0.56 0.61 0.67 Total K % DM 5.44 5.48 6.79 Total N % DM 3.91 4.20 3.31 Total C % DM 39.93 39.21 38.48
3.2.9. Grass sampling and analysis
Grass samples were taken prior to grazing events on 2nd May, 9th June, 26th July, 21st September
and 12th December 2011. For every single grass sampling, three samples per plot were taken
using a square of 0.25 m2 (0.5m x 0.5 m) and a knife. Grass samples were analysed for DM and
total N. Dry matter was determined by oven-drying the samples for 24-36 h at a temperature of
70ºC. Total N was determined in dry and ground samples by Kjeldhal (AOAC, 2000). Both
parameters were used to calculate DM yields and N plant uptake. With the total N harvested
during the experiment from each N treatment, apparent nitrogen recoveries (ANR) were
calculated as in Louro et al. (2015).
3.2.10. Meteorological data
Daily rainfall and daily mean air temperatures were recorded from 13th April to 20th July 2011
and from 6th October to 21th December 2011 by the weather station located at CIAM. Monthly
mean rainfall and air temperatures of the last 10 years (2001-2010) and the corresponding
means for these parameters in 2011 were also used.
3.2.11. Statistical analysis
Statistical analyses were performed using Sigmaplot (11.0). Two way repeated measures
analysis of variance (ANOVA) was used to determine significant differences between
treatments within each period and between periods for the parameters cumulative and mean

Greenhouse gas fluxes derived from agricultural practices in forage crops in the Atlantic area
74
cumulative N2O, CH4 and CO2 fluxes and CO2 equivalents. For soil (WFPS and mineral N
contents) and plant (DM yield and N uptake) parameters, the same test was used to investigate
significant differences between treatments within sampling days. For yield scaled emission
factors (expressed as CO2 equivalents per DM yield), EFNapplied and EFNuptake and apparent
nitrogen recoveries, one way ANOVA was used to determine significant differences between
treatments. Student-Newman-Keuls' test was used to determine which treatment groups were
different at the P≤0.05 significance level.
3.3. Results
3.3.1. Weather conditions
Rainfall in 2011 was 30% lower than the 10 year mean value (2001-2010) (Figure 3.1). Except
in April, where the rain was 20% larger compared to the last 10 year mean, rainfall in the rest of
months was significantly lower with respect to the same mean. Thus, rainfall records were 23,
37, 29 and 44% lower than average in winter (January-March), spring (April-June), summer
(July-September) and autumn (October-December), respectively. Total rainfall was 129 mm
during the spring experimental period (13th April-6th June), 19 mm during the period sampled in
summer (14th June-20th July) (Figure 3.2a) and 352 mm during the sampling in autumn (6th
October-21st December) (Figure 3.2b).
The annual mean air temperature in 2011 was 13.7ºC, 0.5ºC warmer than the last 10-years
(2001-2010). Spring and autumn in 2011 were warmer compared to the same mean (Figure 3.1).
Mean air temperatures during the spring (13th April-6th June) and summer (14th June-20th July)
sampling periods were 14.9 (daily mean temperatures ranged from 11.3 ºC to 18.3) and 17.4 ºC
(daily mean temperatures from 14.4 to 23.5 ºC), respectively (Figure 3.2a). During the autumn
sampling period (6th October and 21st December), the mean air temperature was 12.1ºC with
daily mean air temperatures between 5.9 and 17.7ºC (Figure 3.2b) .
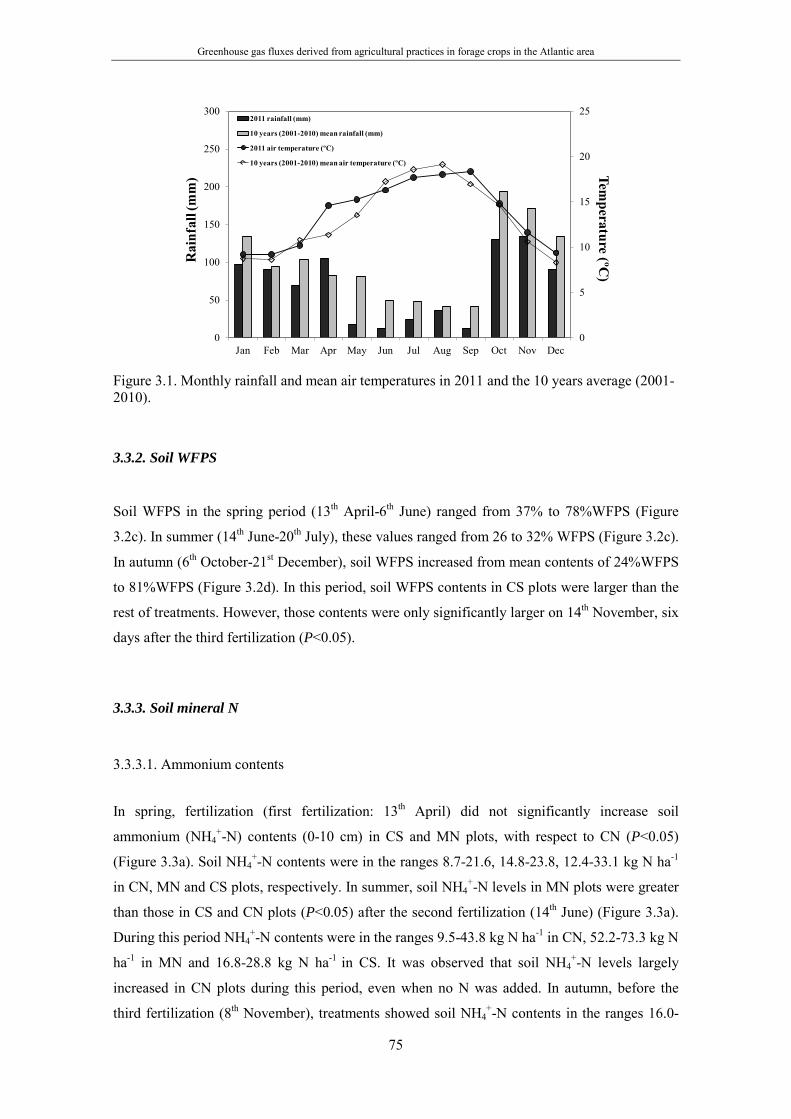
Greenhouse gas fluxes derived from agricultural practices in forage crops in the Atlantic area
75
Figure 3.1. Monthly rainfall and mean air temperatures in 2011 and the 10 years average (2001-2010).
3.3.2. Soil WFPS
Soil WFPS in the spring period (13th April-6th June) ranged from 37% to 78%WFPS (Figure
3.2c). In summer (14th June-20th July), these values ranged from 26 to 32% WFPS (Figure 3.2c).
In autumn (6th October-21st December), soil WFPS increased from mean contents of 24%WFPS
to 81%WFPS (Figure 3.2d). In this period, soil WFPS contents in CS plots were larger than the
rest of treatments. However, those contents were only significantly larger on 14th November, six
days after the third fertilization (P<0.05).
3.3.3. Soil mineral N
3.3.3.1. Ammonium contents
In spring, fertilization (first fertilization: 13th April) did not significantly increase soil
ammonium (NH4+-N) contents (0-10 cm) in CS and MN plots, with respect to CN (P<0.05)
(Figure 3.3a). Soil NH4+-N contents were in the ranges 8.7-21.6, 14.8-23.8, 12.4-33.1 kg N ha-1
in CN, MN and CS plots, respectively. In summer, soil NH4+-N levels in MN plots were greater
than those in CS and CN plots (P<0.05) after the second fertilization (14th June) (Figure 3.3a).
During this period NH4+-N contents were in the ranges 9.5-43.8 kg N ha-1 in CN, 52.2-73.3 kg N
ha-1 in MN and 16.8-28.8 kg N ha-1 in CS. It was observed that soil NH4+-N levels largely
increased in CN plots during this period, even when no N was added. In autumn, before the
third fertilization (8th November), treatments showed soil NH4+-N contents in the ranges 16.0-
0
5
10
15
20
25
0
50
100
150
200
250
300
Jan Feb Mar Apr May Jun Jul Aug Sep Oct Nov Dec
Temperature (ºC
)R
ainf
all (
mm
)
2011 rainfall (mm)
10 years (2001-2010) mean rainfall (mm)
2011 air temperature (ºC)
10 years (2001-2010) mean air temperature (ºC)

Greenhouse gas fluxes derived from agricultural practices in forage crops in the Atlantic area
76
33.5, 18.3-40.1 and 19.1-60.1 kg N ha-1 in CN, CS and MN, respectively (Figure 3.3b). After
the third fertilization, these values were in the ranges 8.2-34.5 kg N ha-1 in CN, 8.5-48.7 kg N
ha-1 in MN and 9.3-23.6 kg N ha-1 in CS plots. Significant differences were observed between
MN and the rest of the treatments on 6th October and on 21st November (P<0.05).
3.3.3.2. Nitrate contents
In spring, soil nitrate (NO3--N) contents were in the ranges 5.1-21.6, 14.8-37.1 and 12.8-43.6 kg
N ha-1 for CN, MN and CS plots, respectively after the first fertilization (Figure 3.3c). In
summer, MN plots showed soil NO3--N contents in the range 34.3-73.3 kg N ha-1 after the
second fertilization, which were significantly larger than those in CN (4.9-28.8 kg N ha-1) and
CS (3.3-9.5 kg N ha-1) plots (P<0.05) (Figure 3.3c). In autumn, before the third fertilization, soil
NO3--N levels in MN plots were also significantly higher than the rest of treatments (P<0.05)
(Figure 3.3d). The largest soil NO3--N levels of the experiment were observed in all treatments
on 24th October, fifteen days before the third fertilization. On that day, soil NO3--N values in
MN plots reached levels of 154.5 kg N ha-1, significantly higher than those of 98.3 and 101.6 kg
N ha-1 in CS and CN plots, respectively. Immediately after the peak observed on 24th October,
soil NO3--N contents decreased in the following days prior the third fertilization (Figure 3.3d).
After the third fertilization (8th November), soil NO3--N contents in MN plots were in the range
18.2-71.2 kg N ha-1, which were significantly larger than the ranges 9.6-17.4 and 12.6-28.4 kg N
ha-1 in CN and CS plots, respectively (P<0.05).

77
Figure 3.2. Daily rainfall and daily mean air temperatures registered during the sampling periods in (a) spring, summer and (b) autumn. Soil water filled pore space (WFPS) in the samples taken during (c) spring, summer and (d) autumn. In WFPS figures, data represent the mean value of the three replicates and error bars showing the standard error. Arrows represent fertilizations (13th April, 14th June, 8th November) and each grey box represents a grazing period. Treatments: CN: control; MN: mineral fertilizer; CS: injected cattle slurry. Period monitored in spring (13th April-6th June), summer (14th June-20th July) and autumn (6th October-21st December).
a
c
b
d0
5
10
15
20
25
30
Temperature (ºC
)
Rainfall (mm) Air temperature (ºC)
0
10
20
30
40
50
60
70
80
90
100
13-A
pr
20-A
pr
27-A
pr
04-M
ay
11-M
ay
18-M
ay
25-M
ay
01-J
un
08-J
un
15-J
un
22-J
un
29-J
un
06-J
ul
13-J
ul
20-J
ul
WFP
S (%
)
CN MN CS
06-O
ct
11-O
ct
16-O
ct
21-O
ct
26-O
ct
31-O
ct
05-N
ov
10-N
ov
15-N
ov
20-N
ov
25-N
ov
30-N
ov
05-D
ec
10-D
ec
15-D
ec
20-D
ec
CN MN CS
SPRING SUMMER AUTUMN
0
5
10
15
20
25
30
35
40
45
50
Rai
nfal
l (m
m)
Rainfall (mm) Air temperature (ºC)

78
Figure 3.3. Soil NH4+-N contents in the samples taken during (a) spring, summer and (b) autumn. Soil NO3
--N contents in c) spring, summer and d) autumn. Data points represent mean value of the three replicates and error bars, the standard error. Arrows represent fertilizations (13th April, 14th June, 8th November) and each grey box represents a grazing period. Treatments: CN: control; MN: mineral fertilizer; CS: injected cattle slurry. Periods monitored in spring (13th April-6th June), summer (14th June-20th July) and autumn (6th October-21st December).
a
c
b
d
0
20
40
60
80
100
120
140
160
180
200
n n n n n
NH
4+ -N
(kg
N h
a-1)
CN MN CS
0
20
40
60
80
100
120
140
160
180
200
13-A
pr
20-A
pr
27-A
pr
04-M
ay
11-M
ay
18-M
ay
25-M
ay
01-J
un
08-J
un
15-J
un
22-J
un
29-J
un
06-J
ul
13-J
ul
20-J
ul
NO
3- -N (k
g N
ha-1
)
CN MN CS
CN MN CS
06-O
ct
11-O
ct
16-O
ct
21-O
ct
26-O
ct
31-O
ct
05-N
ov
10-N
ov
15-N
ov
20-N
ov
25-N
ov
30-N
ov
05-D
ec
10-D
ec
15-D
ec
20-D
ec
CN MN CS
SPRING SUMMER AUTUMN

Greenhouse gas fluxes derived from agricultural practices in forage crops in the Atlantic area
79
3.3.4. Greenhouse gas (GHG) flux measurements
Greenhouse gas fluxes were measured at least five times during the first week after fertilization,
decreasing the frequency in the following weeks and before the next fertilization (1-3 times a
week). A total of 44 gas samplings were carried out during the experiment: 15 during spring
(13th April to 6th June), 9 after in summer (14th June-20th July), 20 samplings in autumn (6th
October-21st December).
In order to investigate significant differences between treatments caused by fertilization and
differences between fertilization themselves, the first 30-36 days after each fertilization were
separated from the rest of sampling days and designated as 'A' (first fertilization), 'C' (second
fertilization), 'E' (third fertilization). the remaining days after next fertilization or end of the
experiment were designated as 'B', 'D' and 'F' (Figure 3.4).
Figure 3.4. A schematic representation of the experiment and GHG fluxes measured during the periods monitored between 13th April and 21st December 2011.
3.3.4.1. Nitrous oxide fluxes
In spring, the first fertilization resulted in N2O peaks of 0.112 and 0.092 kg N2O-N ha-1 day-1
seven days after MN and CS applications, respectively, with their magnitude decreasing to
values below 0.02 kg N2O-N ha day-1in the following days (Figure 3.5a). In summer, the second
fertilization did not result in distinct N2O peaks. Nitrous oxide fluxes ranged from -0.001 to
0.006 kg N2O-N ha-1 day-1 from CN, from -0.002 to 0.006 kg N2O-N ha-1 day-1 from MN and
from 0.000 to 0.008 kg N2O-N ha-1 day-1 from CS plots (Figure 3.5a). In autumn, large N2O
fluxes of 0.075, 0.056 and 0.033 kg N2O-N ha-1 day-1 from MN, CN and CS plots were observed
fifteen days before the third fertilization (Figure 3.5a). After the third fertilization, CS showed a
small increase in the N2O emitted from fluxes lower than 0.010 kg N2O-N ha-1 day-1 to 0.026 kg
1° Fertilization13th April
2°Fertilization 14th June
Grazing 1 2nd -10th May
Grazing 27th-11th Jun
Grazing 327th Jul-5th Aug
Grazing 426th Sep-3rd Oct
Grazing 512th -18rd Dec
14th Jun-20th Jul 6th Oct-7th Nov 8th Nov-8th Dec
3° Fertilization8th November
Periods
30 days
13th Apr-13th May
A B C D E F
14th May-6th Jun 9th -21st Dec
23 days 36 days 32 days 30days 12 days
SPRING SUMMER AUTUMN

Greenhouse gas fluxes derived from agricultural practices in forage crops in the Atlantic area
80
N2O-N ha-1 day-1. However, the largest N2O fluxes resulting from fertilization were observed
seventeen days after the third application of the treatments, with fluxes of 0.067, 0.053 and
0.046 kg N2O-N ha-1 day-1 from CS, MN and CN plots, respectively (Figure 3.5a).
3.3.4.2. Methane fluxes
Methane fluxes from CN and MN plots were negative or low during the experiment (Figure
3.5b). Values ranged from -56 to 39 and from -56 to 38 g CH4 ha-1 day-1 from CN and MN plots,
respectively. Slurry injection resulted in short-lived and high CH4 fluxes immediately after
applications and on the following day (only after the first and second fertilization), and
decreased in the next days to values as from CN and MN plots (Figure 3.5b). Maximum CH4
fluxes of 462, 365 and 548 g CH4 ha-1 day-1 appeared immediately after the first (in spring),
second (in summer) and third (in autumn) slurry fertilizations, respectively.
3.3.4.3. Carbon dioxide fluxes
Carbon dioxide fluxes from CN and MN plots were in the ranges 0.9-56.9 and 1.6-58.2 kg CO2-
C ha-1 day-1, respectively (Figure 3.5c). Large CO2 fluxes of 61.1, 67.7 and 58.7 kg CO2-C ha-1
day-1 were observed from CS plots immediately after the first, second and third fertilization,
respectively. In the rest of the days, CS plots showed similar trend as that observed in MN and
CN plots.
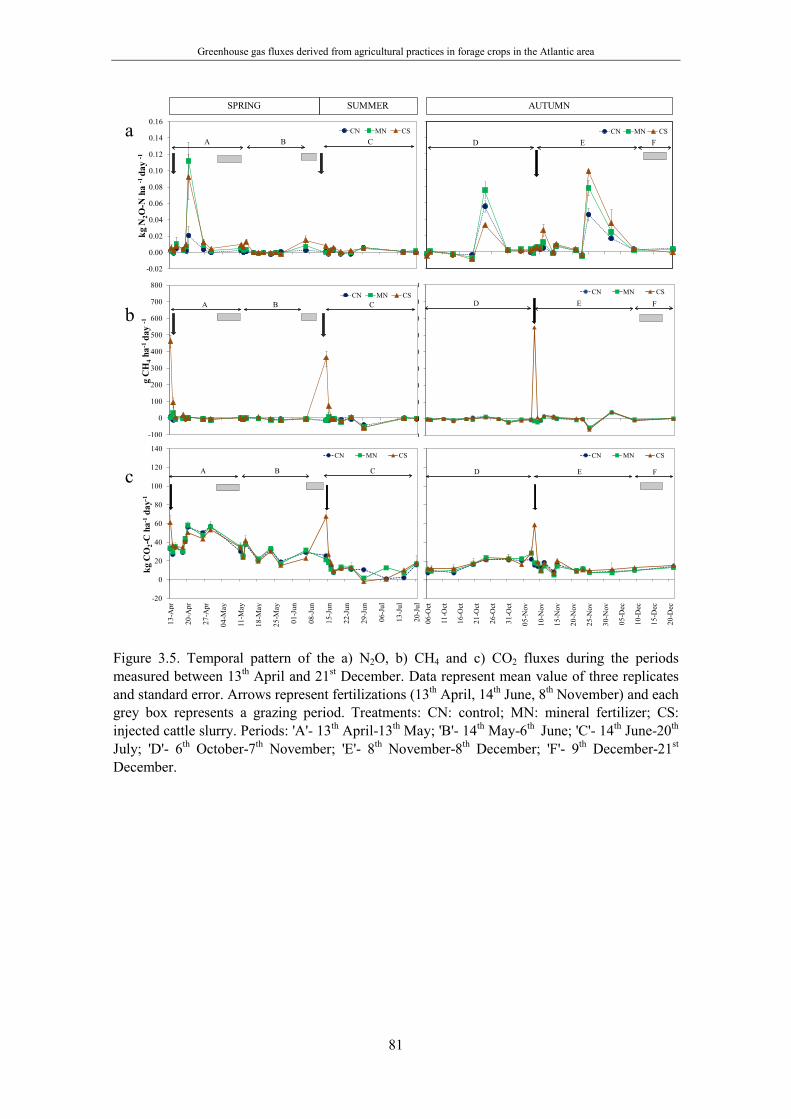
Greenhouse gas fluxes derived from agricultural practices in forage crops in the Atlantic area
81
Figure 3.5. Temporal pattern of the a) N2O, b) CH4 and c) CO2 fluxes during the periods measured between 13th April and 21st December. Data represent mean value of three replicates and standard error. Arrows represent fertilizations (13th April, 14th June, 8th November) and each grey box represents a grazing period. Treatments: CN: control; MN: mineral fertilizer; CS: injected cattle slurry. Periods: 'A'- 13th April-13th May; 'B'- 14th May-6th June; 'C'- 14th June-20th July; 'D'- 6th October-7th November; 'E'- 8th November-8th December; 'F'- 9th December-21st December.
-0.02
0.00
0.02
0.04
0.06
0.08
0.10
0.12
0.14
0.16
kg N
2O-N
ha
-1 d
ay-1
CN MN CSA B C
-100
0
100
200
300
400
500
600
700
800
g C
H4
ha-1
day
-1
CN MN CSA B C
-20
0
20
40
60
80
100
120
140
13-A
pr
20-A
pr
27-A
pr
04-M
ay
11-M
ay
18-M
ay
25-M
ay
01-J
un
08-J
un
15-J
un
22-J
un
29-J
un
06-J
ul
13-J
ul
20-J
ul
kg C
O2-
C h
a-1da
y-1
CN MN CS
A B C
06-O
ct
11-O
ct
16-O
ct
21-O
ct
26-O
ct
31-O
ct
05-N
ov
10-N
ov
15-N
ov
20-N
ov
25-N
ov
30-N
ov
05-D
ec
10-D
ec
15-D
ec
20-D
ec
CN MN CS
D E F
0
0
0
0
0
0
0
0
0
0
CN MN CS
D E F
CN MN CSD E F
SPRING SUMMER AUTUMN
a
b
c

Greenhouse gas fluxes derived from agricultural practices in forage crops in the Atlantic area
82
3.3.5. Cumulative GHG fluxes
Total cumulative fluxes of N2O, CO2 and CH4 for the whole experimental period (13th April–
21st December) and in the periods studied (see Figure 3.4) are shown in Table 3.4. Significant
differences between N-treatments (MN and CS) were observed during the periods 'D' and 'E'
(P<0.05) but overall, total cumulative N2O fluxes between MN and CS were similar (P>0.05)
(Table 3.4). In period 'D' mean cumulative N2O fluxes from MN plots were 2.8-fold larger than
from CS (P<0.05) (Figure 3.6). The opposite situation was observed in period 'E' where CS
increased 1.4-fold mean cumulative N2O fluxes with respect MN (P<0.05). During periods 'A'
and 'E', mean cumulative N2O fluxes from CS and MN plots were the largest (P<0.05). Overall,
EFNapplied were 0.60% (±0.2) after an annual application of 121 kg N ha-1 as mineral fertilizer and
0.28% (±0.6) after the injection of 258 kg N ha-1 as cattle slurry (0.50% ±0.11 when only the
mineral fraction applied with the slurry is considered) and these differences were not significant
(P>0.05).
Total cumulative CH4 fluxes from the CS treatment were significantly greater than the rest of
the treatments at the end of the experiment. Cattle slurry injection caused larger cumulative CH4
fluxes than MN and CN in the periods following fertilizations (i.e. periods 'A', 'C' and 'E')
(P<0.05) (Table 3.4). Comparing those periods, the largest mean cumulative CH4 fluxes from
CS plots were in period 'E' and the lowest in period 'C' (Figure 3.6). In the periods ('B', 'D' and
'F'), cumulative CH4 fluxes from CS were similar than MN and CN (P>0.05) treatment. In MN
and CN plots, the lowest mean cumulative CH4 fluxes (average -15.7 g CH4 ha-1 day-1) were
observed in period 'C' and the largest in period 'E' (0.1 g CH4 ha-1 day-1).
Total cumulative CO2 fluxes from CS plots were slightly larger than the rest of treatments at the
end of the experiment but not significantly different (P>0.05). Although, large CO2 fluxes were
observed immediately after CS injection, the resulting cumulative CO2 fluxes from CS plots
were not significantly larger than MN and CN plots neither in the periods immediately after
fertilizations (i.e. 'A', 'C', 'E') nor in the rest of periods (P>0.05) (Table 3.4). Comparing periods,
the largest mean cumulative CO2 fluxes from all treatments were observed in period 'A' and the
lowest in period 'C' (P<0.05) (Figure 3.6).
In terms of total CO2 equivalents, CS plots resulted in larger CO2 equivalents than MN and CN
plots only during the period 'E' (P<0.05) but, overall, there were no significant differences in
total CO2 equivalents caused by the use of N-fertilizers (CS or MN) compared to no fertilization
(CN) (P>0.05) (Table 3.4). In all treatments, the largest CO2 equivalents occurred during period
'A' which caused 35-37% of the total CO2 equivalents of the experiment (P<0.05) (Table 3.4).

83
Table 3.4. Cumulative fluxes of N2O (kg N2O-N ha−1), CH4 (kg CH4 ha−1) and CO2 (Mg CO2-C ha−1) and total CO2 equivalents (N2O+CH4+CO2, in Mg equiv CO2-C ha-1) from the different treatments in the different periods studied and for the overall experiment. Mean value of three replicates and standard error (between brackets). Treatments: control (CN); mineral fertilizer (MN); injected cattle slurry (CS). Greenhouse gas fluxes were not measured during the period between 21st July and 5th October. Letters indicate that treatments within each period and gas were statistically different (P < 0.05).
Cumulative GHG emissions Spring Summer Autumn
Gas Treatment 'A'
13 April-13 May
'B'
14 May-6 June
'C'
14 June-20 July
'D'
06 October-7 November
'E'
8 November-8 December 'F'
9-21 December
Total experiment
13 April- 21 December
N2O CN 0.13 (0.06)b 0.03 (0.01)a 0.07 (0.01)a 0.28 (0.05)ab 0.37 (0.06)b 0.04 (0.01)a 0.92 (0.04)b
MN 0.52 (0.12)a 0.06 (0.05)a 0.08 (0.02)a 0.39 (0.15)a 0.47 (0.06)b 0.03 (0.01)a 1.55 (0.12)a
CS 0.54 (0.11)a 0.17 (0.06)a 0.11 (0.02)a 0.14 (0.01)b 0.66 (0.04)a 0.02 (0.01)a 1.65 (0.13)a
CH4 CN -0.12 (0.09)b -0.15 (0.01)b -0.56 (0.10)b -0.14 (0.06)a 0.00 (0.06)b -0.04 (0.01)a -1.01 (0.12)b
MN -0.10 (0.10)b -0.19 (0.06)b -0.57 (0.13)b -0.15 (0.02)a 0.01 (0.07)b 0.00 (0.02)a -1.00 (0.05)b
CS 0.52 (0.09)a -0.11 (0.04)b -0.04 (0.03)a -0.18 (0.00)a 0.61 (0.25)a -0.04 (0.03)a 0.78 (0.17)a
CO2 CN 1.34 (0.08)a 0.80 (0.03)a 0.30 (0.05)a 0.52 (0.01)a 0.35 (0.03)a 0.16 (0.01)a 3.46 (0.14)a
MN 1.40 (0.07)a 0.83 (0.05)a 0.31 (0.06)a 0.70 (0.13)a 0.31 (0.03)a 0.15 (0.01)a 3.70 (0.19)a
CS 1.32 (0.10)a 0.90 (0.01)a 0.35 (0.03)a 0.58 (0.03)a 0.39 (0.04)a 0.18 (0.01)a 3.73 (0.11)a
Total CO2 equivalents CN 1.40 (0.10)a 0.81 (0.04)a 0.32 (0.05)a 0.65 (0.01)a 0.52 (0.04)b 0.18 (0.01)a 3.87 (0.15)a
MN 1.65 (0.12)a 0.86 (0.06)a 0.33 (0.06)a 0.88 (0.19)a 0.53 (0.03)b 0.17 (0.01)a 4.41 (0.24)a
CS 1.59 (0.08)a 0.98 (0.02)a 0.40 (0.04)a 0.64 (0.02)a 0.72 (0.01)a 0.19 (0.01)a 4.52 (0.10)a

Greenhouse gas fluxes derived from agricultural practices in forage crops in the Atlantic area
84
Figure 3.6. Results of a two way ANOVA repeated measures and pairwise multiple comparison test (Student-Newman-Keuls test) for mean cumulative fluxes of (a) N2O, (b) CH4 and (c) CO2. Bars and error bars show the mean and standard error (n = 3). Values below the x-axis show mean value of the periods ('A', 'B', 'C', 'D', 'E', 'F'). Means and bars with different letter show a significant difference using Student-Newman-Keuls test (P > 0.05). Treatments: CN: control; MN: mineral fertilizer; CS: injected cattle slurry. Periods: 'A'- 13th April-13th May; 'B'- 14th May-6th June; 'C'- 14th June-20th July; 'D'- 6th October-7th November; 'E'- 8th November-8th December; 'F'- 9th December-21st December.
b b
b
a b ab bb
a b
a
a
a
a
a
a
a
-30
-20
-10
0
10
20
30
40
50
60
A B C D E F
g C
H4
ha-1
day-1
CN MN CS
3.30a -6.45bc -10.78c -4.86b 6.91a -2.12 b
a
b
c
ba a
abb
a
a
a a
a b
a
a
a
a b
a
a
0.000
0.005
0.010
0.015
0.020
0.025
0.030
0.035
0.040
A B C D E Fkg
N2O
ha-1
day-1
CN MN CSTreatment : 0.009Period <0.001Treatment*period <0.005
0.0133a 0.0038c 0.0024c 0.0084b 0.0166a 0.0028c
aa
aa a a
aa
a
a
a a
a a
aa a a
0
10
20
30
40
50
60
70
80
A B C D E F
kg C
O2-
C h
a-1da
y-1 CN MN CSTreatment: 0.345Period <0.001Treatment*period: 0.459
45.18a 36.75b 8.84e 18.78c 11.68d 13.56dPeriods
Periods
Periods
Treatment <0.001Period <0.001Treatment*period <0.001

Greenhouse gas fluxes derived from agricultural practices in forage crops in the Atlantic area
85
3.3.6. Grass yields, N uptake and yield scaled emission factors
No significant differences between treatments were observed in the resulting DM yields and
plant N uptake in any grazing event (P>0.05) (Table 3.5). The largest DM values and plant N
uptake were obtained in the grass sampling 1 (prior to grazing event 1) and the lowest in the
grass sampling 4 (prior to the fourth grazing event) (P<0.05). In terms of emission factors
(EFNuptake), N-fertilizer treatments were almost 1.5-fold larger than CN (P<0.05). Overall, total
CO2 equivalents per crop yield (Table 3.5), from MN and CS plots were slightly higher but not
significant different than CN (P>0.05). Apparent nitrogen recovery (ANR) from MN plots were
slightly higher than CS but not significant different (P>0.05) than CS, either when ANR from
MN is compared with the mineral N fraction or total N contained applied with CS. These ANR
were 41%±11% in MN and 10%±10 and 17%±17 from CS when total N and mineral N
fractions are considered, respectively.
Table 3.5. Dry matter yield (Mg ha-1), N uptake (kg N ha-1) resulting from the samples taken prior to each grazing event. Emission factors based on the resulting yields (Mg equiv CO2-C Mg DM-1) and based on N uptake by plant (%). Mean values of the three replicates and the standard error (between brackets) are presented. Treatments: control (CN); mineral fertilizer (MN); injected cattle slurry (CS). Yield scaled emission factors do not include the period between 21st
July and 5th October as GHG fluxes were not measured. For each parameter, treatments within each column with different letter were statistically different (P < 0.05). Grass samplings: 2nd May (sampling 1); 9th June (sampling 2); 26th July (sampling 3); 21st September (sampling 4); 12th December (sampling 5).
Grass sampling 1
Grass sampling 2
Grass sampling 3
Grass sampling 4
Grass sampling 5 Total
Yield scaled
emission factor
Parameter
Mg DM ha-1 Mg equiv CO2-C Mg
DM-1
DM
CN 4.53 (0.38)a 1.67 (0.03)a 1.55 (0.07)a 0.49 (0.04)a 1.51 (0.10)a 9.75 (0.45)a 0.40 (0.02)a
MN 4.75 (0.06)a 1.87 (0.21)a 1.64 (0.18)a 0.47 (0.04)a 1.77 (0.29)a 10.50 (0.38)a 0.42 (0.04)a
CS 4.67 (0.38)a 1.43 (0.18)a 1.32 (0.04)a 0.57 (0.13)a 1.74 (0.28)a 9.74 (0.73)a 0.47 (0.03)a
N
uptake Kg N ha-1 EFNuptake
(%)
CN 96 (16)a 37 (2)a 20 (5)a 10 (1)a 51 (3)a 220 (14)a 0.42 (0.01)b
MN 122 (4)a 40 (3)a 33 (2)a 10 (0)a 63 (9)a 270 (9)a 0.58 (0.05)a
CS 113 (3)a 30 (4)a 25 (2)a 13 (3)a 60 (9)a 245 (11)a 0.67 (0.03)a
Greenhouse gas fluxes derived from agricultural practices in forage crops in the Atlantic area
86
3.4. Discussion
3.4.1. Nitrous oxide fluxes
Large ranges in annual N2O losses have been reported from other European grasslands under
grazing and fertilization management and similar climatic conditions as in NW Spain (Burchill
et al., 2014; Cardenas et al., 2010; Hyde et al., 2006; Rafique et al., 2012; Rafique et al., 2011;
Rees et al., 2013). The resulting N2O losses, between 0.5 and 51.3 kg N ha-1, are caused by the
large difference in the N management (annual N inputs of fertilizer between 100 and
approximately 525 kg N ha-1 plus N inputs from livestock grazing) in combination with the
large variability in the soil sites characteristics and climatic conditions (836 to 1183 mm). The
resulting N2O losses from this 7-month experiment was within the range of values observed
from those European grasslands. However, according to a previous study carried out between
2007-2009 in grazed grasslands with mineral N fertilizer applications at CIAM-INGACAL
(Chapter 2), the losses obtained in this study were significantly lower. According to the earlier
study annual N2O losses vary from 8.8 to 30.1 kg N2O ha-1, with the largest losses observed in
wet years in combination larger annual grazing intensities. In this experiment, gas samplings
were carried out under atypical climatic conditions, which was reflected in EFNapplied values from
both types of fertilizer, which were below the IPCC default value of 1% (IPCC, 2006). As it
was mentioned, in comparison with the last 10-years mean for this region, 2011 was a dry and
warm year. All seasons where gas sampling were carried out had a considerable reduction in the
rainfall patterns in comparison with the last 10-years mean. However, the reduction seriously
affected spring and summer seasons as rainfall was very low.
3.4.1.1. Nitrous oxide fluxes during spring and summer periods
According to the earlier study (reported in Chapter 2), spring and summers periods are large
contributors to the annual N2O emissions, as the high frequency of rainfall is combined with
large N inputs from fertilizers and livestock excretion, resulting in large losses. In this
experiment, as rainfall was low and air temperatures were very warm during spring and
summer, low soil WFPS levels (<60%WFPS) were frequently observed, causing a general trend
of low N2O fluxes throughout most of the sampling days in these periods. In the period after
first application (period 'A'), the only N2O peaks from N-fertilized treatments were observed
when fertilization was followed by a short period of days with high rainfall (Dobbie and Smith,
2003; Smith et al., 2012), significantly increasing (although for a short-term) soil WFPS (up to

Greenhouse gas fluxes derived from agricultural practices in forage crops in the Atlantic area
87
78%WFPS). Under these soil conditions, denitrification could cause these short-lived losses of
N2O seven days after the first fertilization, changing the general pattern of low soil N2O fluxes,
which were probably caused by nitrification (Bateman and Baggs, 2005).
These short-term soil WFPS increases were not observed after the second fertilization (period
'C'). Because of the little rain and the increase of air temperatures in this period, the soil reached
extremely low WFPS levels (30%WFPS, mean value, Figure 3.2c), which resulted in even
lower N2O fluxes compared to the previous period. With the soil aerobic conditions in this
period only nitrification could have been responsible for the N2O fluxes observed. However, no
nitrification of the N applied with fertilizers was observed during this period. That was very
clear in CS plots where mineral N was applied entirely as NH4+-N (Table 3.1) and no increase in
the soil NO3--N was observed in the following days after fertilization (Figure 3.3c). We also
observed that OM mineralization would have been stimulated during the previous periods (as an
increase in mineral N was observed in CN plots), providing additional NH4+-N to the soil
(Figure 3.3a). However, as in CS plots, soil NO3--N contents did not increase (Figure 3.3c). In
this sense, microbial population could be affected by the low soil moisture levels in combination
with warm temperatures, reducing the activity and causing the low N2O fluxes observed. That
could explain the large fraction of mineral N accumulated in the soil at the end of the period 'C'.
3.4.1.2. Nitrous oxide fluxes during the autumn periods
The mineral N accumulation in the soil from previous fertilizations and the N depositions
during the summer grazing events could be the N pool for the large N2O losses observed in the
period prior to third fertilization (period 'D'). In this period, the frequent rain increased
significantly soil WFPS (up to 60%WFPS) compared to in summer. That would have activated
the microbial population, resulting in the high N2O fluxes observed from the N- fertilizer
treatments and also from CN plots. A similar situation has been reported by Cardenas et al.
(2010), Kim et al. (2010) and Rafique et al. (2012) from grasslands in UK and Ireland. Kim et
al. (2010) and Rafique et al. (2012), in Ireland, attributed the large N2O pulses, when rainfall
preceded by long dry periods, to nitrification. They observed that N2O fluxes at soil WFPS
below 60% were better correlated to soil NH4+-N contents rather than NO3
--N. In this study,
N2O production would have been caused by denitrification even when the fluxes were observed
at 54% WFPS (mean value, Figure 3.2d). This was based on the fact that those peaks coincided
with large peak of soil NO3--N in all treatments (Figure 3.3d) which decreased immediately
after the N2O peaks. After the period of soil rewetting, the frequency of rain was larger and soil
remained in a constant anaerobic soil status (WFPS>60%), optimal conditions for large losses

Greenhouse gas fluxes derived from agricultural practices in forage crops in the Atlantic area
88
by denitrification. That explains the two episodes of N2O fluxes observed from CS and MN
after the third fertilization (period 'E'). In this period, denitrification would have been more
stimulated in CS plots than in MN. The reason could have been in the more anaerobic
conditions in CS, probably because of the slightly larger soil WFPS contents in CS plots (Figure
3.2d) caused by the water contained in the slurry. This could explain the differences observed
after the third fertilization (period 'E') between N-treatments.
3.4.2. Methane fluxes
In soils, CH4 fluxes are the net result of CH4 production by methanogenesis (positive fluxes)
and CH4 oxidation (negative fluxes) by methanotrophy processes (Baggs et al., 2006; Ball et al.,
1999). In this experiment, the net result from CS plots was CH4 production whereas in MN and
CN plot the net result was CH4 oxidation of approximately 1 kg CH4 ha-1. The reason of the
result obtained from CS plots is attributed to large fluxes observed immediately after each cattle
slurry application, which are frequently observed where manures are applied to soil and as it
was observed in this experiment, the origin of those fluxes would come from the release of the
dissolved CH4, generated in the slurry, but not from the soil (Chadwick and Pain, 1997; Flessa
and Beese, 2000; Rodhe et al., 2006; Sherlock et al., 2002). One proof of the non-soil origin of
those large fluxes immediately after CS applications is that they were observed within the first
day after application and they rapidly decreased s in the following days to reach similar
magnitudes as in MN and CN plots. This is because methanogenesis is sensitive to O2 and
diffusion of O2 into the cattle slurry from the soil inhibits CH4 formation (Chadwick et al.,
2011). If the fluxes at the time of CS applications in 'A', 'C' and 'E' were excluded in all
treatments (data not shown), CS plots showed similar cumulative CH4 fluxes as for CN and MN
treatments, denoting that methanotrophy was the dominate process during the experiment.
Comparing the resulting CH4 fluxes following CS applications, it was observed that the
injection in autumn produced greater CH4 fluxes than in spring and summer. A possible
explanation could be the lower DM contents of the material applied during the third
fertilization, which could aid infiltration into the soil (Chadwick and Pain, 1997), promoting
more anaerobic conditions in the soil for methanogenic processes. However, the slurry applied
in summer contained similar DM contents as that used in autumn. In agreement with Chadwick
et al. (2000) and Louro et al. (2013), the largest CH4 fluxes observed in this experiment appear
to be also greater under wetter and cooler climatic conditions and the reason could be attributed
to the fact CH4 oxidizers would have delay CH4 consumption due to the more anaerobic
conditions in autumn, thus increasing the rate of CH4 released (Rodhe et al., 2006). This is also

Greenhouse gas fluxes derived from agricultural practices in forage crops in the Atlantic area
89
supported by the seasonal trend in CH4 consumption observed in CN and MN plots.
Atmospheric CH4 consumption followed an increasing trend with decreasing soil WFPS and
increasing air temperatures (affecting finally soil temperatures) which is in agreement with the
observations reported by Louro et al. (2013) and Meijide et al. (2010). When mean cumulative
CH4 fluxes from MN and CN plots in the different periods are compared, the largest mean CH4
oxidation rates of this experiment coincided with the lowest soil WFPS levels and the largest air
temperatures of the experiment observed during period 'C' (Figure 3.6b), contrasting with the
lowest mean CH4 oxidation rates during autumn where climatic conditions were the opposite.
Some studies have shown that the N fertilizers can inhibit CH4 oxidation due to the competition
between the NH4+-N and CH4 for the methane monooxigenase, the enzyme responsible for the
oxidation of CH4 and others highlight the importance of additions of N for nitrifying population,
which also oxidises methane (Bodelier and Laanbroek, 2004). In addition, other studies report
that the inhibitory effects in the CH4 oxidation capacity of the soil is caused by the to the toxic
effect of high concentrations of NO3--N, which is likely give rise to osmotic potential (Hütsch et
al., 1996; Nesbit and Breitenbeck, 1992). In this experiment, no inhibition of caused by N
fertilizer additions was observed. The largest mean CH4 oxidation rates in soils treated with
slurry and mineral fertilizer occurred under significant levels of NH4+-N (in CS and MN plots)
and NO3--N (in MN plots) and no differences were observed with the corresponding CH4
oxidation rates from CN plots. A possible explanation of this result could be in the large fertility
of the soil (Dobbie and Smith, 1996), reason why the addition of N fertilizers did not have an
immediate effect in the resulting oxidation rates.
3.4.3. Carbon dioxide fluxes
Many studies have reported that grasslands switched from a net carbon sink in a wet and normal
year to a net source in drought conditions (Aires et al., 2008; Du et al., 2012; Meyers, 2001;
Nakano and Shinoda, 2014). As it was mentioned, the year 2011 does not correspond to a
normal year (according to the 10-year average) as reductions in rainfall were observed in all
seasons. As result, the grassland resulted in a source of CO2, which is consistent with the
findings in the studies cited above, under drought conditions.
Carbon dioxide fluxes obtained with the chamber methodology represent ecosystem respiration.
Ecosystem respiration is influence by disparate factors, those that affect heterotrophic and
autotrophic respiration. Heterotrophic respiration has been reported to be strongly regulated by
soil moisture and temperature (Davidson et al., 2000; Xu and Qi, 2001) and autotrophic
respiration varies seasonally as the relative roles of growth and maintenance respiration change

Greenhouse gas fluxes derived from agricultural practices in forage crops in the Atlantic area
90
(Falge et al., 2002). In this sense, according to Davidson et al. (2000), heterotrophic respiration
has a linear increase with temperature but also requires moisture conditions near field capacity
where macropore spaces are mostly air-filled, which facilites O2 diffusion, and micropore
spaces are mostly water-filled, to facilitate diffusion of soluble substrates. Based on this, the
largest ecosystem respiration observed during the spring period in this grassland soil would be
explained by the coincidence of high plant growth peak, in addition to warm temperatures and
optimal moisture soil conditions for high heterotrophic respiration. Meijide et al. (2010)
observed that ecosystem respiration increased in autumn when soil was fallow and it was
rewetted after the lack of rainfall during summer, resulting in pulses of CO2. In this experiment,
the soil rewetting episode in autumn (period 'D') resulted in large N2O fluxes from all treatments
but clear CO2 pulses were not observed. Instead, we observed that cumulative CO2 fluxes in
period 'D' were twice as large as in period 'C'. The only large fluxes observed in this experiment
were those related to cattle slurry applications, which is consistent with other studies after
organic fertilizer applications to the soil (Fangueiro et al., 2008b; Flessa and Beese, 2000;
Meijide et al., 2010; Rochette et al., 2004). According to some studies the cause of the CO2 flux
observed after slurry applications may be attributed to the release of the CO2 dissolved in the
slurry which is released after the application to the soil or even CO2 production from the
dissociation of slurry carbonates (Fangueiro et al., 2008b; Flessa and Beese, 2000; Rochette et
al., 2004). Rochette et al. (2004) reported an absence of CO2 fluxes immediately after slurry
injection in autumn and large fluxes after the spring application. They hypothesised that some
CO2 could be solubilised into the soil solution under high soil water contents and low
temperatures in autumn. In this experiment, although the differences in the resulting CO2 fluxes
following each slurry injection were not very large (range 58.7-67.7 kg CO2-C ha-1 day-1), the
lowest CO2 flux was in autumn, coinciding with the highest soil WFPS values and the lowest
temperatures, and the largest flux, in summer, when conditions were the opposite. In this sense,
similarity in CO2 fluxes would have been the result of the net effect of the different slurry
carbonate contents between the slurries and the different soil conditions at the moment of each
fertilization. Despite these fluxes, ecosystem respiration from CS were not different than MN or
CN plots. As CS resulted in similar yields as those obtained in CN and MN plots after each
application, the fraction of autotrophic respiration would have been similar among treatments,
denoting that slurry applications to this soil would not change microbial activity. The reason of
this result would have been caused by the large amount of organic C present in this soil (48 g
kg-1) as consequence of the grazing history in this site. Under these conditions, slurry-C
additions could not have caused a larger CO2 response because microbial population would
have obtained enough substrate from the soil.

Greenhouse gas fluxes derived from agricultural practices in forage crops in the Atlantic area
91
3.4.4. Nitrogen uptake and yield scale emission factors
As it was mentioned, the dry soil conditions during spring and summer could have stimulated
mineralization of the organic matter and that was reflected in the large N uptake obtained from
CN plots. The large supply of N from organic matter mineralization caused the low efficiency of
the fertilizers applied, suggesting that large proportion of the N applied with fertilizers was not
taken up by grass, leaving part of the N in the soil, in agreement with Schils et al. (2008). The
resulting ANR from both types of fertilization were not significant different. However, the
corresponding the fraction recovered from AN were slightly higher than the recovery obtained
with CS. This difference could be attributed to some losses of the ammoniacal fraction of the
slurry by ammonia volatilization caused by the shallow injection technique (1-25% of the total
ammoniacal N, Huijsmans et al. (2001)). As consequence of possible large contribution of the
OM mineralization and due to the low N2O losses observed during the experiment, the EFNuptake
in this experiment derived from N-fertilizers were much higher than range of 0.2-0.3% reported
in other European grasslands soils with only N inputs from fertilizer applications (Hansen et al.,
2014; Schils et al., 2008) but much lower than the resulting values of up to 8% from grasslands
soils with annual N inputs from grazing (up to 203 kg N ha-1) and fertilization (up to 156 kg N
ha-1) (resulting from data provided in Burchill et al. (2014)), under more wetter soil conditions.
The aim of this study was to select the type of fertilizer type related to low GHG emissions and
large grass yields. We observed that both fertilizers caused similar losses of total CO2
equivalents to produce same yields. Based on this, both fertilizers could be used. However, if
the costs of purchasing mineral fertilizers are considered, using injected slurries as fertilizer
would be more beneficial for dairy farmers as animal wastes produced on farms would be
recycled and milk production costs would be reduced.
3.5. Conclusion
Dry weather conditions during the spring and summer limited N2O production after
fertilizations and caused a general trend of low and similar N2O losses after the application or
mineral fertilizer or cattle slurry. Only, in spring ,when fertilization was followed by a period of
rain, short-lived N2O losses were observed when fertilization was followed by a period of rain.
Simultaneously, the dry weather conditions during these periods would have stimulated organic
matter mineralization, providing quantities of N that met crop demands. That resulted in large
part of the added N left in the soil, which was lost in early autumn by denitrification when soil
was rewetted. Under the wetter conditions in autumn, application of cattle slurries caused larger
losses of N2O than MN probably because of the larger soil WFPS levels. Large losses of CH4

Greenhouse gas fluxes derived from agricultural practices in forage crops in the Atlantic area
92
and CO2 were related to slurry injection but overall only total cumulative CH4 fluxes were
significant respect to the mineral fertilizer. The reason of the differences in total CH4 were
caused by the large release of the CH4 contained in the slurry after each application but not from
the soil. The aim of this study was to find the type of fertilizer associated with low GHG fluxes
and large yields in a grazed grassland. We observed that both fertilizers caused similar total CO2
equivalents to produce same yields. Based on this, both fertilizers could be used. However, if
the costs of purchasing mineral fertilizers is considered, using injected slurries as fertilizer
would be more beneficial for dairy farmers as animal wastes produced on farms would be
recycled and milk production costs would be reduced.

Greenhouse gas fluxes derived from agricultural practices in forage crops in the Atlantic area
93
CHAPTER 4. EFFECT OF SLURRY AND AMMONIUM NITRATE APPLICATION ON GREENHOUSE GAS FLUXES OF A GRASSLAND SOIL UNDER ATYPICAL SOUTH WEST ENGLAND WEATHER CONDITIONS
Louro, A., Sawamoto, T., Chadwick, D., Pezzolla, D., Bol, R., Baez, D., Cardenas, L., 2013. Effect of slurry and ammonium nitrate application on greenhouse gas fluxes of a grassland soil under atypical South West England weather conditions. Agric. Ecosyst. Environ. 181, 1-11. DOI:10.1016/j.agee.2013.09.005

Greenhouse gas fluxes derived from agricultural practices in forage crops in the Atlantic area
94
Abstract
In this study we evaluated how typical split applications of cattle slurry (SL) or mineral
fertilizer (AN) (in spring, summer and autumn) affected greenhouse gas (GHG) emissions from
a grassland soil. Field measurements were carried out between May and November in 2011
using the closed chamber technique. The experiment was located in the South West of England,
an area which is typically characterized by high annual precipitation (>1000 mm yr-1) and cool
temperatures (average annual air temperature of 9.6oC). The unusual dry climatic conditions
observed during the late spring and summer, and the rainfall events identified in autumn
affected soil water filled pore space (WFPS) resulting in low nitrous oxide (N2O) fluxes during
the experiment. After the first two applications, climatic conditions dried the soil to values
below 60%WFPS, the threshold level for losses of N2O by nitrification. In contrast, the frequent
rainfall events observed after the third application (in autumn) increased the WFPS and
promoted losses of N2O by denitrification. In terms of fertilizer type, AN resulted in higher
cumulative N2O emissions compared with SL after the third application, probably because the
SL treatment resulted in more anaerobic soil conditions and ammonia (NH3) volatilisation
resulted in a smaller mineral N pool in the soil available for N2O production and emission.
Ammonia (NH3) emission modelling estimated losses of N by volatilization of NH3 between 25-
38% of N applied after slurry surface broadcast application. Plant N offtake represented nearly
all of the total N applied in AN plots following the first two applications and 59% of that
applied in the third, whereas in SL plots an average of 64% of the total N applied in the three
applications was harvested in the grass. Nitrogen gas (N2) fluxes were not measured but the
large rainfall events observed after the third application gradually increased the soil WFPS to
saturation and could also have resulted in losses of N by complete denitrification, especially
from the AN treatment. Thus, applications of AN and SL resulted in total N2O-N losses during
the 6-month measurement period of 0.21 and 0.17 kg N ha-1, respectively (representing only
0.02 and 0.003% of the N applied). Methane (CH4) production was observed in the first two or
three days after SL spreading. For the remaining days, and also in plots treated with AN, the soil
acted as a sink of CH4 (consumption). Total net CH4 cumulative values of -0.09 and 0.92 kg CH4
ha-1 were observed in AN and SL, respectively. CH4 consumption and production rates were
related to changes in the %WFPS. Thus, dry soil conditions (below 60%WFPS) enhanced the
CH4 consumption, observed in May and June in AN, and reduced the rate of CH4 production in
SL plots. Total net cumulative carbon dioxide (CO2) fluxes of 1.24 and 0.35 Mg CO2-C ha-1
were observed in AN and SL plots during the 6-months measurements.

Greenhouse gas fluxes derived from agricultural practices in forage crops in the Atlantic area
95
4.1. Introduction
Agriculture and agricultural production practices play an important role in the global fluxes of
the greenhouse gases (GHG) methane (CH4), nitrous oxide (N2O) and carbon dioxide (CO2),
each contributing 6.5%, 5.5% and 0.1% to the total anthropogenic greenhouse gas emissions,
respectively (Sänger et al., 2011). The production or consumption of these gases are mainly due
to biological processes which are strongly affected by natural conditions and agricultural
management (Snyder et al., 2009). Weather conditions and the addition of slurries or mineral
fertilizers (such as ammonium nitrate (NH4NO3)) can significantly affect the interchange of
greenhouse gases between the soil and the atmosphere. This is due to an increase in the supply
of substrates and a change in soil conditions that alters the processes responsible of the
production and/or consumption of each gas. Nitrification and/or denitrification can produce N2O
emissions. Both processes occur if nitrogen (N) is applied in the ammonium (NH4+-N) form, but
only by denitrification if it is applied solely in the nitrate (NO3--N) form (Clayton et al., 1997)
or after NH4+-N has been converted to NO3
--N. Nitrification is responsible for the release of
N2O in dry or well-aerated soils (as it is an aerobic process), while denitrification is,
dominantly, the main pathway at medium-high soil water contents (being an anaerobic
processes). The production of CH4 is primarily by microbial degradation of organic matter
under anaerobic conditions, e.g. in wetlands or from rice paddies. However, the application of
animal manures can provide an immediately available carbon source and moisture leading to
CH4 production (Chadwick and Pain, 1997). Well-aerated upland soils (e.g. grasslands, forest
and arable) are commonly regarded as a biological sink of atmospheric CH4 and are responsible
for 6% of the global methane consumption (Le Mer and Rogert, 2001). Carbon dioxide (CO2)
emissions resulting from respiration in soil and vegetation are the principal sources of CO2
entering the atmosphere (Smith et al., 2003). Applications of livestock slurries and mineral
fertilizers provide nutrients for plant and soil microbial growth, and enhance CO2 emissions,
although N fertilizer effects on soil CO2 emissions are dependent on weather conditions during
the growing season (Morell et al., 2011). Soil moisture influences gas exchange by altering
oxygen availability and gas diffusivity. Soil respiration has been shown to increase with
increasing temperature due to the enhanced microbial activity. Because of varying weather and
soil conditions, the GHG fluxes are likely to be temporally dynamic and also dependent on the
nature of fertilizer inputs.
The main aim of this study was to investigate how typical management of slurry or mineral
fertilizer affect GHG emissions in a grassland soil in the South West of England. We applied
cattle slurry and NH4NO3 to grassland plots on three occasions over a period of six months. The
fluxes of N2O, CH4 and CO2 were measured at high frequency using the static chamber

Greenhouse gas fluxes derived from agricultural practices in forage crops in the Atlantic area
96
methodology. Although unplanned, the experiment was carried out under atypical, i.e. unusually
dry, climatic conditions for the region.
4.2. Material and methods
4.2.1. Location
The field trial was carried out in permanent grassland in May 2011 at Rothamsted Research,
North Wyke, Devon, UK (50:46:10N, 3:54:05W), which has a temperate maritime climate
(Koppen, 1931), typical of the South-West England. The 40-year mean annual temperature
(1961-2000) is 9.6ºC, and the minimum and maximum monthly mean temperatures are 4.5ºC in
February and 15.5ºC in August. The mean annual precipitation (40-years average) is 1056 mm,
46% of which falls between October and January. British soil classification (Avery, 1980)
defines the soil as clayey typical non-calcareous pelosol of the Halstow series and as a stagni-
vertic cambisol, and as aeric haplaquept using FAO and USDA taxonomy, respectively. The
soil texture was a silty clay loam (Harrod and Hogan, 1981). Initial analysis of the properties of
the upper 10 cm of the soil profile indicated a total N content of 0.44%, total carbon (C) content
of 3.94%, C:N ratio of 8.9, pH of 5.9 and bulk density (BD) of 0.88 Mg m-3.
4.2.2. Experimental design
The experiment was set up in a randomised block design, with three replicate plots of the
following treatments: (1) control with no N application (zero N), (2) mineral fertilizer as
NH4NO3 (AN) and (3) cattle slurry (SL). Replicate plots were 15.0 m2 in area (3.0 m x 5.0 m),
and within each main replicate plot three zones were marked out separating chamber, soil
sampling and grass yield measurement areas. Within each plot, three chambers were fixed
within an area of 3.0 m2 (3.0 m x 1.0 m), whilst two zones each of 6.0 m2 in area (3.0 m x 2.0
m) were left for the soil sampling and grass yield measurements. A distance of 1 m was kept
between blocks and treatments.

Greenhouse gas fluxes derived from agricultural practices in forage crops in the Atlantic area
97
4.2.3. Application events and characteristics of mineral fertilizer and slurry used
The applied NH4NO3 comprised 34.5% N. Cattle slurry was collected from a dairy farm located
near North Wyke. Treatments were applied by hand three times during the experiment (1st
application: 16th May, 2nd application: 24th June and 3rd application: 8th September) at a target
rate of 80 kg N ha-1 (8 g N m-2) on each application. Slurry was analyzed for total N prior to
each application (Table 4.1). Slurry was spread at rates of 2.26 l m-2 in May and June and 2.48 l
m-2 in September, and the NH4NO3 at the rates of 23.2 g m-2, equivalent to 80 kg total N ha-1 at
each of the three applications.
4.2.4. Chamber design and operation
The closed chamber technique was used to quantify the GHG flux measurements in the field
(Rochette and Erisksen-Hamel, 2008). Chambers comprised white polyvinyl chloride (PVC)
open ended boxes with a volume of 0.032 m3 (length 40 cm, width 40 cm, height 30 cm,
Cardenas et al. (2010)). The upper edge of the chamber had a ‘U’ shaped channel, which was
filled with water to ensure an airtight seal with the PVC lid. The lid was fitted with a sampling
port with a three-way valve. Three chambers were used per replicate plot (i.e., 27 chambers in
total). To ensure a good seal between the chamber and soil, the chambers were inserted into the
soil to a depth of 10 cm > 24 h before the flux measurements began (Parkin and Venterea,
2010), and left in the same place until the first plot harvest to avoid soil disturbances, which
could affect the soil-atmosphere gas transfer. Chambers were returned to the same position after
each plot harvest. The effective height of each chamber above the ground (H) was measured
three times: at the beginning of experiment (5th May) and after the first and second grass
harvests (22nd June and 24th August). Height measurements were taken internally at the centre of
each wall and in the centre of the chamber. The resultant chamber effective height was the mean
of the 5 points taken, and ranged between 20.6-25.4 cm. Values recorded were used to calculate
GHG fluxes from each chamber after the insertion in the soil. On each sampling occasion, the
chamber was closed for 40 min. Ten ambient air samples were taken (5 at the start of the
chamber closure, and 5 at the end of the 40 minute period) to provide background values for
N2O, and stored in pre-evacuated 20 ml glass vials. The average of N2O, CH4 and CO2
concentrations in these ambient air samples was used as the time zero sample (T0). After 40
minutes (T40) the chamber headspace was sampled via the three-way valve on the chamber lid.
60 ml gas samples were taken from each chamber headspace (and from ambient air) and
transferred to 20 ml pre-evacuated glass vials, using a syringe and hypodermic needle to inject

Greenhouse gas fluxes derived from agricultural practices in forage crops in the Atlantic area
98
the sample into the vial. A second needle was used to release the sample to ambient pressure.
Soil surface temperature inside chambers was also recorded every sampling date and the data
used to calculate the gas fluxes.
We assumed a linear accumulation of headspace GHG concentrations in our flux calculations;
an observation we have verified for N2O using the same chambers on the same soil type
following AN applications (Cardenas et al., 2010), thus using our resources to ensure we
accounted for spatial variability of fluxes within each plot (using three chambers per plot), and
opting to sample at high frequency (see next section), improving the ability to account for
temporal variability of fluxes. In addition, data collected from a nearby experiment carried out
at the same time as the current experiment, showed that CO2 accumulation in the headspace was
linear at 40 minutes in 88% of the chambers tested (Cardenas, L.; Chadwick, D., personal
communication).
4.2.5. Greenhouse gas flux measurements and laboratory analysis
Measurements of N2O, CO2 and CH4 were conducted frequently over a 6-month period, from
the 16th May to 13th November 2011. Gas sampling was usually carried out between 10:00 and
12:00 h. Chambers were sampled every day during the first fifteen days after AN and SL
applications, and every two days until the next application. Gas samples were usually analyzed
within 24 h of collection with a Perkin Elmer Auto-system gas chromatograph (GC500)
equipped with two Elite Plot Q columns (30 m x 0.53 mm) and two detectors: 63Ni electron
capture detector (ECD) at 300ºC for measuring N2O and a flame ionization detector (FID) at
350ºC for CO2 equipped with a methanizer to analyze CH4. This system was attached to an
auto-sampler (Perkin Elmer headspace sampler Turbo matrix 110), which extracted a sample of
0.03µl/min from the sampling vial and injected it into the GC. Calibrations were performed
using standards of N2O, CO2 and CH4 (0.33, 1.59, 5.23 ppm for N2O; 2.97, 1198, 2467 ppm for
CO2; 2.05, 5.18, 10.18 ppm for CH4). Concentrations of gases were calculated by comparing
peak areas integrated with those obtained with the standards of each gas.
Fluxes were calculated from the accumulation of gas in the chamber as follows (Eq.1):
F= ρ x H x (C40-C0)/ t x 273.15/ T x 24 x 104 (Eq.1)
where F is the gas flux (kg N2O-N ha-1 day-1, g CH4 ha-1 day-1, kg CO2-C ha-1 day-1), ρ is the gas
density (N2O-N: 1.26 kg m-3; CH4: 717 g m-3; CO2-C: 0.536 kg m-3) under STP conditions

Greenhouse gas fluxes derived from agricultural practices in forage crops in the Atlantic area
99
(273.15 K, 101,325 Pa), H is the effective height of the chamber (m), C40-C0 is the gas
concentration at 40 minutes (T40) after chamber closure minus gas concentration of ambient
sample (T0) (µm3 m-3), t is the time of chamber closure (40 min) and T the temperature (K)
inside the chamber. Cumulative emissions were calculated by the trapezoidal method (Cardenas
et al., 2010; van den Pol-van Dasselaar and Oenema, 1997; Velthof et al., 1996).
For N2O and CH4, emissions from the zero N treatment were subtracted from the corresponding
values in fertilized plots for the whole period of measurements, giving net emissions attributable
to the N applied (for N2O) or to the amount of slurry (for CH4). Seasonal N2O emission factors
(EFs), for each amendment studied during the experiment, were calculated by dividing the net
N2O cumulative fluxes by the total N applied and expressing as percentage. Methane emission
factors, expressed as %C applied, were calculated for each application of slurry by dividing the
net cumulative CH4 fluxes by the total amount of slurry applied.
4.2.6. Ammonia (NH3) losses
Although NH3 losses were not measured in the field, an estimation of the percentage of NH3
loss from each application was calculated using the empirical model, ALFAM (Ammonia losses
from Field-Applied Animal Manure), provided by Søgaard et al. (2002). The ALFAM model is
a multiple regression model based on empirical data of NH3 loss from experiments conducted in
seven European countries (UK, Denmark, the Netherlands, Norway, Sweden, Switzerland, and
Italy) and it uses the Michaelis-Mentel type equation to predict NH3 loss over time (t) after
slurry application as:
N(t)= Nmax x (t/(t+Km)) (Eq.2)
where N(t) is the cumulative loss fraction of total amoniacal nitrogen (TAN), Nmax (as % NH4+-
N applied) the total time integrated loss and Km the time (h) in which 50% of NH3 loss
occurred. The instantaneous emission rate corresponds to the derivated dN/dt of Eq. (2) as
follows:
dN/dt: Nmax x (Km x (t+Km)-2 (Eq.3)
For the estimation, variables related to slurry, (type of slurry (pig/cattle), application technique,
DM and NH4+-N contents), weather (air temperature, wind speed) and soil conditions (dry/wet)
are required model inputs because these significantly affect Nmax and Km.

Greenhouse gas fluxes derived from agricultural practices in forage crops in the Atlantic area
100
In this experiment, NH3 losses were estimated to provide an understanding of a major loss
pathway of available N, which could be used to help explain the patterns of N2O emissions
observed. The value of Nmax provided after each of the three slurry applications was considered
as the cumulative NH3 loss and expressed as percentage of NH4+-N applied with the slurry.
Losses of NH3 from AN applications were estimated using the emission factor of 1.4%
(percentage of loss of NH4+-N applied) reported by Misselbrook et al. (2004b), in grasslands
fertilized with NH4NO3 and without grazing management.
4.2.7. Soil sampling and analysis
During the experiment, flux measurements were accompanied by measurements of soil moisture
at a depth of 0-10 cm. Every sampling day, one soil core per replicate of each treatment was
taken and then unified into one sample per treatment for analysis of gravimetric soil moisture.
This parameter was measured by oven-drying the samples at 105ºC for 24 h. Soil BD of the 0-
10cm layer was determined at the start of the experiment from five undisturbed blocks of soil
with a mean height of 8.6 cm. Measures of the width and length of each side of block were
recorded. The volume of soil was calculated and the soil was dried at 105ºC to constant weight
to determine the dry weight. Bulk density was finally calculated from the weight of the dry soil
and the volume it occupied and expressed as Mg m-3. Particle density (PD) was assumed to be
2.65 Mg m-3. Porosity was calculated according to Eq. (4):
Porosity =1- (BD/PD) (Eq.4)
Gravimetric soil water content was then converted to % soil water filled pore space (WFPS)
using the following equation (Eq.5):
WFPS = ((Water content x BD)/ Porosity) x 100 (Eq.5)
Soil ammonium (NH4+-N) and nitrate (NO3
--N) contents were analyzed once a week. Five cores
(0-10cm) per plot were taken from the soil sampling zone in each plot, extracted with 2M KCl
(Searle, 1984) for 1 h at 200 rpm in a horizontal shaker (1:2 fresh soil:extractant ratio) and then
filtered through Whatman No 5 paper. Extracts were analyzed for NO3--N and NH4
+-N soil
contents using a SKALAR SAN Plus analyser (provided with a SKALAR 5000-02 analyser unit,

Greenhouse gas fluxes derived from agricultural practices in forage crops in the Atlantic area
101
a SKALAR 28503902_0 photometric detector, a SKALAR 1050d auto-sampler and a
circulating water bath).
4.2.8. Slurry analysis
Slurry samples were analyzed for total N by Kjeldahl (AOAC, 1990). Slurry density was
calculated on the basis of the volume occupied by a mass of sample. The pH of the slurry was
measured directly with a pH meter (HANNA HI 9025). Total C was also analyzed using a TOC
analyzer (Skalar FormacsHT, Breda, The Netherlands). Dry matter (DM) was determined after
24 h of drying at 105ºC. Organic matter (OM) was estimated by loss on ignition (LOI); oven-
dried samples (105 ºC) were weighed and then ashed for 24h at 550ºC in a muffle furnace. LOI
was calculated as follows (Eq.6):
LOI (%) = ((oven-dried sample weight – ashed sample weight) / oven-dried sample weight) x
100 (Eq.6)
Mineral nitrogen (NO3--N and NH4
+-N) was extracted using 2M KCl. Slurry extracts were
analyzed using a SKALAR SAN Plus analyser (described in soil sampling and analysis section).
Analysis of other macronutrients (P, K, Ca, Mg, S) were carried out by a commercial laboratory
using the aqua-regia method (ISO, 1995) followed by determination by inductively coupled
plasma optical emissions spectrometry (ICP-OES). Chemical and physical properties of the
cattle slurry applied to the soil are summarized in Table 4.1.

Greenhouse gas fluxes derived from agricultural practices in forage crops in the Atlantic area
102
Table 4.1. Chemical and physical properties of the cattle slurry used on each application.
Applications
Properties Units 1st (16th May) 2nd (24th June) 3rd (8th September)
Density kg l-1 0.995 1.021 1.006
pH - 6.9 6.8 7.3
Dry matter % 8.8 6.4 6.5
Total C % DMa 37.6 39.4 38.4
Total N % FWtb 0.36 0.35 0.32
Total N % DM 2.58 2.67 2.67
NH4-N % FWt 0.16 0.12 0.12
NO3-N % FWt 0.00 0.00 0.00
LOI % DM 74.8 77.7 77.1
Ash % DM 25.2 22.3 22.9
P as P2O5 g l-1 FWt 1.11 1.05 1.03
K as K2O g l-1 FWt 2.99 2.82 2.89
Ca as CaO g l-1 FWt 5.45 3.10 2.37
Mg as MgO g l-1 FWt 0.72 0.74 0.74
S as SO3 g l-1 FWt 0.86 0.79 0.79
aDM: dry matter; bFWt: fresh weight
4.2.9. Grass yield and composition
All plots were harvested three times, 21th June, 24th August and 31st October, using a
reciprocating mower to cut an area of 2 x 1 m2, at a cutting height of 5 cm. Fresh grass samples
were taken from the harvesting zone for analysis for DM. This parameter was determined after
16 h drying at a temperature of 80ºC. Dried and ground grass samples were also analyzed for
total N. Both parameters were used to determine N plant offtake after each cut.

Greenhouse gas fluxes derived from agricultural practices in forage crops in the Atlantic area
103
4.2.10. Meteorological data
Total daily rainfall, daily average air and soil (10 cm depth) temperatures were recorded
between 22nd June and 13th November by a weather station within 500 m of the experimental
area. Also, the average wind speed (at 10 m height) for the day of the slurry addition and the
following day was used as a model input to estimate NH3 losses by the ALFAM model, after
each application. Average monthly rainfall, air and soil temperature data for the last 40 years
(1961-2000) were used to compare the weather conditions observed during the experiment.
4.2.11. Statistical analysis
Statistical analyses were performed using Sigmaplot (11.0). One way ANOVA was used to
study the effect of fertilization with NH4NO3 or cattle slurry on cumulative GHG emissions
following each fertilization event, and for the total experiment. Two way repeated measures
ANOVA was used to compare the same effect on mean N2O, CH4 and CO2 fluxes under the
different weather conditions and to determine significance of changes in soil (mineral N and
WFPS) and grass yields (DM, %N contents, N offtake) during the experiment. Daily fluxes of
N2O, CH4 and CO2 were related to corresponding soil and weather parameters using Pearson
correlation analysis. The “r” value provided by Sigmaplot was used to prove the influence of
these environmental conditions on the pattern of GHGs.
4.3. Results
4.3.1. Weather conditions
The annual mean air temperature in 2011 was on average 0.9 ºC higher than the 40-year mean
value (Figure 4.1a). Compared to the 40-year average (1961-2000), 2011 was characterized by
warm temperatures in spring (March-May) and autumn (September-November), and relatively
cool conditions during summer (June-August). The mean daily air temperature ranged during
the sampling period (from 16th May to 13th November 2011) ranged from 6.4 ºC (6th November)
to 18.2 ºC (2nd October) (Figure 4.1b). November was the coldest month of the experimental
period with a mean monthly temperature of 10.3 ºC, whereas maximum mean monthly
temperature was recorded in July (14.5 ºC).

Greenhouse gas fluxes derived from agricultural practices in forage crops in the Atlantic area
104
Soil temperature ranged from 9.1 ºC (7th November) to 19.3 ºC (28th July). Daily soil
temperature was around 14 ºC in the period after the first N-fertilization and increased to mean
values of 16.5 ºC in the period after the second application, coinciding with the summer
growing season. Mean soil temperature decreased to 13.3ºC, after the third N application, which
coincided with the arrival of the autumn.
Rainfall in 2011 was low compared with the 40-year mean (21% less rainfall) (see Figure 4.1a),
particularly in the months of March, April and May (before the first N application) when the
precipitation was only 73, 71 and 52% of the 40-year average. Total precipitation during the
sampling period was 427 mm, (76, 166 and 186 mm fell during the period after the first, second
and third N-fertilization event, respectively) with October as the wettest month and May as the
driest. Two substantial precipitation events (more than 20 mm day-1) were recorded on 28th
August and on 24th October (Figure 4.1b).
Figure 4.1. (a) Mean monthly rainfall and air temperature in 2011 and the 40-year averages (1961 – 2000). (b) Total daily rainfall and average daily air and soil temperatures recorded during the experiment.
0
5
10
15
20
25
30
0
20
40
60
80
100
120
140
160
180
200
JAN FEB MAR APR MAY JUN JUL AUG SEP OCT NOV DEC
Temperature (ºC
)R
ainf
all (
mm
)
Rainfall 40 years-mean Rainfall 2011
Air Temperature (ºC) 40 years-mean Air Temperature (ºC) 2011
0
5
10
15
20
25
0
5
10
15
20
25
30
35
40
1st A
ppl 7 14 21 28
2nd
App
l 7 14 21 28 35 42 49 56 63 703r
d A
ppl 7 14 21 28 35 42 49 56 63
Temperature (ºC
)R
ainf
all (
mm
)
Days after fertilization
Rainfall (mm) Soil temperature (ºC) Air temperature (ºC)
a
b
Greenhouse gas fluxes derived from agricultural practices in forage crops in the Atlantic area
105
4.3.2. Soil mineral N
After each of the three fertilizer applications in the experiment, only high soil NH4+-N values
were found in the AN plots (Figure 4.2a), with maximum values of 20.6, 11.0 and 14.8 kg N ha-
1 in the first, second and third application, respectively. Values of between 0.2 and 2.5 kg N ha-1
were found in the zero N plots, and between 0.1 and 3.6 kg N ha-1 in the SL plots. Also the
highest soil NO3--N contents were found in AN plots (Figure 4.2b), with maximum values of
22.4, 15.4 and 17.0 kg N ha-1 after the first, second and third N-fertilization, respectively. Zero
or very low values of NO3--N were recorded in the zero N and SL plots, with values in the range
of 0.0-1.4 kg N ha-1 from zero N plots and 0.0-1.3 kg N ha-1 in SL plots. Two way repeated
measures ANOVA showed statistical differences between treatments in NH4+-N and NO3
--N
contents with date of sampling (P<0.001) and these contents were significantly higher in AN
plots within the first three weeks after each application event. No statistical differences were
found between treatments in the soil mineral N contents after this time (for each N-fertilization)
(P>0.05).
Based on the significant statistical increases in soil NH4+-N and NO3
--N concentrations during
the first three weeks after each fertilization event, GHG emissions data recorded in this
experiment were collated into two periods within each fertilization event (Figure 4.3). The
period corresponding to the first three weeks of measurements (24 days) after each N
application was designated as period 'A', and the remaining days until the next fertilization or
end of the experiment, designated as period 'B'.

106
Figure 4.2. Soil inorganic NH4+-N (a) and NO3
--N (b) contents in the fertilized and control treatments during the 6-month study. Treatments: (zero N) unfertilized or control; (AN) ammonium nitrate; (SL): slurry. Each point represents the mean value of three replicates ± standard error.
Figure 4.3. A schematic representation of the time periods studied between N applications. The two groups of periods are represented by the letters 'A' and 'B'. Arrows represent the time of fertilization.
a b
05
101520253035404550
-71s
t App
l 7 14 21 28
2nd
App
l 7 14 21 28 35 42 49 56 63
3rd
App
l 7 14 21 28 35 42 49 56 63
NO
3- -N (k
g ha
-1)
Days after fertilization
zero N AN SL
05
101520253035404550
-71s
t App
l 7 14 21 28
2nd
App
l 7 14 21 28 35 42 49 56 63
3rd
App
l 7 14 21 28 35 42 49 56 63
NH
4+ -N
(kg
ha-1
)
Days after fertilization
zero N AN SL
16th May- 8th June 22nd June - 16th July 8th – 22nd June 16th July - 6th September 6th - 30th September 30th September-13th November
1st Fertilization 2nd Fertilization 3rd Fertilization24th June 8th September16th May
A A AB B BPeriods
24 days 16 days 24 days 52 days 24 days 44 days

Greenhouse gas fluxes derived from agricultural practices in forage crops in the Atlantic area
107
4.3.3. Soil WFPS
Low %WFPS values were recorded in the period after the first two fertilization dates (Figure
4.4a). The dry conditions during the spring and summer resulted in WFPS values ranging from
35 to 65%, and 37 to 67% after the first and second application, respectively. These values were
below the threshold range, 60-70% WFPS, where denitrification becomes dominant and high
N2O fluxes are often observed (Bateman and Baggs, 2005; Davidson, 1993; Dobbie et al., 1999;
Linn and Doran, 1984). After the third application, there was an increased frequency of rainfall
events so %WFPS increased to values ranging from 54 to 93% WFPS, which were significantly
greater than the WFPS following the first two fertilisation occasions (P<0.001). Statistical
analysis showed that the mean soil WFPS value during the latter phase after the autumn
application (period 'B') was the highest of the experiment (P<0.001) (Figure 4.5a). However,
there was no significant difference in the values of %WFPS of soil samples from zero N, AN
and SL plots within each sampling date (P >0.05) and within each period (P>0.05).
4.3.4. Greenhouse gas fluxes
A total of 112 GHG flux samplings were carried out over the 6-month period (16th May to 13th
November 2011); 25 after the first N-fertilizer application and 43 and 44 after the second and
third applications, respectively. Fluxes of N2O were low throughout the whole experiment in all
treatments studied (Figure 4.4b). Zero N plots resulted in values from -0.004 to 0.006 kg N2O-N
ha-1 day-1. Fluxes from AN and SL plots ranged from -0.005 to 0.008 kg N2O-N ha-1 day-1 and
from -0.004 to 0.004 kg N2O-N ha-1 day-1, respectively. The applications of AN and SL were not
followed by a distinct peak of emission following the first application in May. The highest value
was observed 15 days after the application of AN and SL and after a period of some rainfall
events <5 mm. After the second application, increases in N2O fluxes were observed on the
fourth (higher in AN plots) and twenty fourth days (after amendment applications). After the
third application, only AN plots showed an increase in N2O fluxes from the 10th day to the 14th
day, during which time maximum N2O fluxes were recorded. Forty six days after the third
application of the treatments small peaks of N2O in zero N and SL plots were observed. This
continued for 2 further days from the AN plots only.
Fluxes of CH4 (Figure 4.4c) were generally negative or close to zero from the zero N plots and
those fertilized with AN. Values ranged between -11.5 to 6.4 g CH4 ha-1 day-1 and between -10.8
to 4.1 g CH4 ha-1 day-1 from the zero N and AN treatments, respectively. Only plots fertilized
with SL showed distinct peaks of CH4 fluxes between days 1 and 3 following each slurry

Greenhouse gas fluxes derived from agricultural practices in forage crops in the Atlantic area
108
application. Values ranged from -9.8 to 304.5 g CH4 ha-1 day-1. Maximum CH4 fluxes appeared
immediately after each SL application, with values of 65.4 g CH4 ha-1 day-1, 129.6 g CH4 ha-1
day-1 and 304.5 g CH4 ha-1 day-1 in May, June and September, respectively.
Fluxes of CO2 (Figure 4.4d) ranged from 5.7 to 91.8, from 8.3 to 115.6 and from 9.9 to 97.4 kg
CO2-C ha-1 day-1 from the zero N, AN and SL treatments, respectively. Immediately after grass
was harvested, CO2 fluxes were low. Maximum CO2 peaks in the whole experiment were
observed after the first N application.
4.3.5. Cumulative GHG fluxes
Total cumulative fluxes of N2O, CO2 and CH4 for the whole experimental period (16th May-13th
November) and in the periods between each fertilizer application and the next fertilization or
end of the experiment (1st fertilization: 'A' (16th May-8th June) + 'B' (8th June-22nd June); 2nd
fertilization: 'A' (22nd June-16th July) + 'B' (16th July-6th September); 3rd fertilization: 'A' (6th
September-30th September) + 'B' (30th September-13th November) are shown in Table 4.2. Also,
mean cumulative N2O, CH4, and CO2 fluxes (Figures 4.5b, c and d, respectively) were explored
statistically for the periods 'A' and 'B' after each fertilization (see previous definition of these
periods).
Total N2O cumulative fluxes from the AN plots resulted in slightly higher fluxes than those
recorded from the zero N and SL treatments, but these differences were not statistically different
(P>0.05). Plots fertilized with AN showed significant differences in mean cumulative N2O
fluxes (P<0.05) in the period 'A' after the 3rd N-fertilization compared with those fluxes from
the zero N and SL plots (Figure 4.5b). Mean N2O fluxes from AN plots were 44% and 53%
higher than those from SL and zero N, respectively. In terms of N2O EFs, the total application
of 240 kg N ha-1 with AN and SL caused a total N2O-N loss during 6-months measurements of
0.21 and 0.17 kg N ha-1, respectively, accounting for 0.02 and 0.003% of the N applied.

109
Figure 4.4. (a) % Water filled pore space (WFPS) and daily fluxes of N2O (b), CO2 (c) and CH4 (d). Letters 'A' and 'B' represent the different periods after fertilization and horizontal arrows, their length. Periods - 1st Fertilization: 'A' (16th May-8th June) and 'B' (8th-22nd June); 2nd Fertilization: 'A' (22nd June- 16th July) and 'B' (16th July-6th September); 3rd Fertilization: 'A' (6th-30th September) and 'B' (30th September-13th November). Treatments: (zero N) control; (AN) ammonium nitrate; (SL) slurry. Each point represents the mean value of three replicates ± standard error.
020406080
100120140160180200
1st A
ppl 7 14 21 28
2nd
App
l 7 14 21 28 35 42 49 56 63 703r
d A
ppl 7 14 21 28 35 42 49 56 63
kg C
O2-
C h
a-1da
y -1
Days after fertilization
A BA BA B
0102030405060708090
100
1st A
ppl 7 14 21 28
2nd
App
l 7 14 21 28 35 42 49 56 63 703r
d A
ppl 7 14 21 28 35 42 49 56 63
%W
FPS
Days after fertilization
b
d
A BA BA B A BA BA B
A BA BA B
a
c
-0.008
-0.004
0.000
0.004
0.008
0.012
0.016
1st A
ppl 7 14 21 28
2nd
App
l 7 14 21 28 35 42 49 56 63 703r
d A
ppl 7 14 21 28 35 42 49 56 63
kg N
2O-N
ha-1
day
-1
Days after fertilization

Greenhouse gas fluxes derived from agricultural practices in forage crops in the Atlantic area
110
Table 4. 2.Cumulative fluxes after the three fertilizations and total cumulative fluxes of N2O (kg N2O-N ha-1), CO2 (Mg CO2-C ha-1) and CH4 (kg CH4 ha-1). Mean value of three replicates and standard error (between brackets). Treatments: (zero N) control; (AN) ammonium nitrate; (SL) slurry. Fertilizations: 1st: 'A' (16th May-8th June) + 'B' (8th June-22nd June); 2nd: 'A' (22nd June-16th
July) + 'B' (16th July-6th September); 3rd: 'A' (6th September-30th September) + 'B' (30th September-13th November); total (16th May-13th November). Treatments with different letter within the same row are statistically different (P<0.05).
Treatment
Gas Fertilizations zero N AN SL
N2O 1st 0.007 (0.009) a 0.006 (0.003) a 0.007 (0.007) a
2nd 0.105 (0.026) a 0.089 (0.008) a 0.102 (0.020) a
3rd 0.048 (0.010) b 0.115 (0.022) a 0.058 (0.006) b
Total 0.160 (0.045) a 0.205 (0.031) a 0.166 (0.019) a
CO2 1st 1.59 (0.09) a 2.04 (0.02) a 1.56 (0.14) a
2nd 3.42 (0.09) a 3.91 (0.16) a 3.60 (0.34) a
3rd 2.61 (0.04) a 2.90 (0.16) a 2.79 (0.12) a
Total 7.61 (0.02) a 8.85 (0.22) a 7.96 (0.59) a
CH4 1st -0.13 (0.01) a -0.12 (0.01) a -0.02 (0.02) a
2nd -0.31 (0.03) b -0.32 (0.02) b 0.01 (0.08) a
3rd -0.08 (0.02) b -0.17 (0.04) b 0.42 (0.01) a
Total -0.52 (0.02) b -0.60 (0.03) b 0.41 (0.10) a
Statistically significant differences were found in total CH4 cumulative fluxes (Table 4.2)
between treatments (P<0.001). Plots fertilized with slurry resulted in fluxes of 0.41 kg CH4 ha-1,
with negative fluxes from the other treatments (-0.52 and -0.60 kg CH4 ha-1, from zero N and
AN plots, respectively). Mean cumulative CH4 emissions from SL were significantly greater
(P<0.001) compared with zero N and AN treatments in the periods 'A' (Figure 4.5c). The
quantity of CH4 emitted in period 'A' increased with successive SL applications, with the third
application resulting in the greatest flux. In the periods 'B', no differences were found (P>0.05)
between treatments. Indeed during these periods ('B'), the SL plots resulted in negative
cumulative CH4 fluxes, similar to those from the zero N and AN plots. Comparing the mean
CH4 cumulative fluxes from periods 'B' after fertilization, we found that CH4 uptake by the soil
was significantly lower after the third application compared with the first and second
fertilization (P<0.001). The application of cattle slurry resulted in CH4 emission factors

Greenhouse gas fluxes derived from agricultural practices in forage crops in the Atlantic area
111
representing 0.01, 0.04 and 0.06% of the C applied following each application, and a total for
the whole experiment of 0.04% C applied (kg CH4-C/kg slurry-C).
Total cumulative CO2 fluxes (Table 4.2) from the amendments were not statistically different to
those from the zero N plots (P>0.05). The AN treatment resulted in significantly different mean
CO2 fluxes compared with the other treatments (Figure 4.5d) in the period 'B' after the first
application (6th -22nd June) (P<0.05), with mean cumulative values of 80.8 kg CO2-C ha-1 day-1,
20% and 22% higher than zero N and SL, respectively.
4.3.6. Correlations between GHG fluxes and soil and weather parameters
The daily N2O fluxes observed in all treatments showed significant positive correlation with
daily %WFPS (r: 0.17; P<0.01), soil (r: 0.06; P<0.05) and air temperature (r: 0.08; P<0.05).
Also, negative correlations were observed between the soil mineral N values and the
corresponding N2O fluxes observed from the treatments at each soil sampling day (NH4+-N: r:-
0.17; P<0.01 and NO3--N: r:-0.13, P<0.05).
Daily CH4 fluxes from zero N (r: 0.39; P<0.01) and AN plots (r: 0.21; P<0.01) were related to
daily WFPS. Soil temperature was negatively correlated with the daily CH4 fluxes from zero N
and AN plots after the first (r: -0.25; P<0.01) and second fertilization (r: -0.22; P<0.01). Also,
soil N-NH4+ contents were related to the corresponding CH4 fluxes at the day of the soil
sampling from zero N (0.40; P<0.01) and AN (0.23; P<0.01).
Daily CO2 fluxes from all treatments showed significant correlations with daily soil
temperatures after each fertilization (r values in each fertilization of 0.43, 0.34, 0.57; P<0.01)
and also with soil WFPS (r values in each fertilization of 0.43, 0.34, 0.57; P<0.01).

112
Figure 4.5. Results of a two way ANOVA repeated measures and pairwise multiple comparison test (Tukey test) for a) mean WFPS and mean cumulative fluxes of (b) N2O, (b) CH4 and (c) CO2. Bars and error bars show the mean and standard error (n=3). Values below the x-axis show mean value of the periods ('A', 'B'). Means and bars with the same letter show no significant difference using Tukey test (P>0.05). Treatments: (zero N) control; (AN) ammonium nitrate; (SL) slurry. Periods - 1st Fertilization: 'A' (16th May-8th June) and 'B' (8th-22nd June); 2nd Fertilization: 'A' (22nd June- 16th July) and 'B' (16th July-6th September); 3rd Fertilization: 'A' (6th-30th September) and 'B' (30th September-13th November).
-0.0005
0.0000
0.0005
0.0010
0.0015
0.0020
0.0025
0.0030
0.0035
0.0040
A B A B A B
kg N
2O-N
ha-1
day-1
Periods after fertilization-0.0001d 0.0005cd 0.0010bc 0.0014ab 0.0018a 0.0007c
P treatment = 0.606P period < 0.001P treatment x period = 0.012
1st fertilization 2nd fertilization 3rd fertilization
a a a
a
a
a aa
a
a
a
a
ab
b a
a
a
b
d
0
30
60
90
120
150
180
210
240
A B A B A B
kg C
O2-
C h
a-1da
y-1
Periods after fertilization
1st fertilization 2nd fertilization 3rd fertilization
aa a
ba
b
aa a
a a aa aa a a a
P treatment =0.079P period < 0.001P treatment x period < 0.001
31.45e 74.99a 36.43de 53.27b 42.41c 39.76cd
-10
0
10
20
30
40
50
60
70
80
A B A B A B
g C
H4 ha
-1da
y-1
Periods after fertilization
1st fertilization 2nd fertilization 3rd fertilization
b b a a a a b b
a
a a a aabb
a
a
P treatment < 0.001P period < 0.001P treatment x period < 0.001
-1.30c -4.50d 0.74b -4.31d 5.53a -1.70c
0
10
20
30
40
50
60
70
80
90
100
A B A B A B
%W
FPS
Periods after fertilization
1st fertilization 2nd fertilization3rd fertilization
a a a
a a aa a a
aa a
aaa a a
a
P treatment = 0.212P period < 0.001P treatment x period < 0.047
44.47e 54.87c 44.08e 47.81d 65.93b 73.22a
a
c

Greenhouse gas fluxes derived from agricultural practices in forage crops in the Atlantic area
113
4.3.7. Losses of NH3
On the basis of the output from the ammonia emission model (ALFAM), the slurry application
under the warm and dry weather conditions of the experiment may have led to significant
volatilization of NH3. As some studies report (e.g. Pfluke et al. (2011); Thompson et al. (1990))
volatilization tends to occur within the first 24 hours after application to soil. Wind speed values
used as the model input data were 5 m s-1 for the first application and 4 m s-1 in the other two
fertilization events. With respect to air temperature, the surface broadcasting of slurry was
carried out when mean air temperatures were 11, 14, 17 ºC, at the time of the first, second and
third slurry applications. Values for DM and the NH4+-N content of the slurry applied in each
fertilization (Table 4.1) were input into the ALFAM model. According to the model, the
interaction of these input parameters may have caused losses of NH3 of 86, 69 and 82% (%
NH4+-N applied) after each slurry application, thus leaving little NH4
+-N in the soil at risk of
loss as N2O or for plant offtake.
In the AN plots, the application of 80 kg N ha-1 of NH4NO3 (40 kg ha-1 as NH4+-N) may have
resulted in a loss of 0.6 kg N ha-1 via NH3 volatilisation after each fertilization.
4.3.8. Dry matter yield and N plant offtake
Dry matter yields were statistically greater (P<0.001) for the first two herbage cuts (22nd June
and 24th August) than the third cut, for all treatments (Figure 4.6a). The application of AN and
SL significantly increased DM in the first and second harvests (P<0.001) compared with the
zero N plots. Dry matter yields in SL were 56% greater than yields from the zero N plots in
August (P<0.001). No differences between treatments (P<0.001) were found for the DM yields
after the third harvest (31st October). For each cut, the herbage N contents were similar between
the zero N, AN and SL treatments. Highest total N herbage concentrations (mean value of
3.59% DM) were found in grass from the October harvest (Figure 4.6b), compared with the
June and August harvests (P<0.001). So, N offtake (Figure 4.6c) in the first two applications
were statistically greater (P<0.05) compared with the third application, for all treatments.
Similar to DM yield, the AN plots significantly increased N offtakes in the first and second cut
(p<0.05) compared with the zero N and SL plots. The SL treatment resulted in significantly
greater N offtake (58% more) compared with N offtake on the zero N plots after the second
harvest (P<0.05). At the October grass harvest, no differences in N offtake were found between
N fertilization treatments (P>0.05).

114
Figure 4.6. Results of a two way ANOVA repeated measures and pairwise multiple comparison test (Tukey test) for grass (a) dry matter (DM) yield expressed as kg ha-1, (b) total plant N concentration expressed as %DM, and (c) N offtake (kg N ha-1) in the three cuts carried out in the experiment. Values below the x-axis show the mean value of the treatments (zero N, AN, SL) within each grass cut (1st, 2nd, 3rd). Means and bars with the same letter show no significant difference using Tukey test (P>0.05). Treatments: (zero N) control; (AN) ammonium nitrate; (SL) slurry. Grass harvests: 1st (21st June), 2nd (24th August), 3rd (31st October).
a b c
zero N AN SL
010002000300040005000600070008000
1st 2nd 3rd
DM
(kg
ha-1
)
Grass cut
a
bb
a
c
baa
a
2301a 2500a 1083b
P treatment: 0.001P cut < 0.001P treatment x cut < 0.001
0
1
2
3
4
5
1st 2nd 3rd
Tota
l N (%
DM
)
Grass cut2.03b 2.35b 3.59a
P treatment: 0.449P cut < 0.001P treatment x cut: 0.015
a
aa
aaa
aa
a
0
20
40
60
80
100
120
140
160
1st 2nd 3rd
N o
fftak
e (k
g N
ha-1
)
Grass cut
a
b
ab
a
c
b aa
b
49.6a 56.1a 39.6b
P treatment: 0.007P cut: 0.013P treatment x cut: 0.007

Greenhouse gas fluxes derived from agricultural practices in forage crops in the Atlantic area
115
4.3.9. Nitrogen budget
Nitrogen inputs and outputs, measured or estimated (NH3 volatilisation), for each period after
fertilization and also for the whole experiment are summarized in the Table 4.3. The initial soil
mineral N content for each period was taken into account to provide an indication of the
available mineral N pool for plant uptake. The soil sample taken on 13th May prior to the first
fertilization was considered as the initial soil N content for the first fertilization and for the
entire experiment. For the second and third fertilization events, the soil mineral N values were
from the last soil sample taken prior to the next fertilization.
Zero N plots showed a negative N balance after each of the three fertilization periods. The AN
treatment resulted in a N deficit of 14.3 kg N ha-1 in the period studied after the second
fertilization. In the first and third periods, surpluses of N were observed, with the highest
surplus (33.5 kg N ha-1) occurred after the third application. For the SL treatment, surpluses
ranged from 3.7 to 9.8 kg N ha-1. Across the entire measurement period (taking all three periods
into account), only the zero N plots resulted in N deficit (negative values), unlike the AN and
SL plots where soil remained with N surpluses of 21.6 and 15.5 kg N ha-1, respectively.

116
Table 4.3. Initial soil N contents, N inputs and outputs (measured or estimated) and the N balance in the three periods studied after each fertilization, and for the whole experiment. Units expressed as kg N ha-1. Treatments: (zero N) control; (AN) ammonium nitrate; (SL) slurry. 1st Fertilization: (16th May-22nd June); 2nd Fertilization: (22nd June-6th September); 3rd Fertilization: (6th-13th November); total experiment (16th May-13th November).
1st fertilization 2nd fertilization 3rd fertilization Total experiment zero N AN SL zero N AN SL zero N AN SL zero N AN SL NH4
+-N 1.8 2.0 1.5 1.2 1.5 1.3 1.2 1.4 1.3 1.8 2.0 1.5 NO3
--N 1.5 1.9 1.5 0.0 0.0 0.0 0.0 0.1 0.2 1.5 1.9 1.5 Total initial soil mineral N content 3.3 3.9 3.0 1.2 1.5 1.3 1.2 1.5 1.5 3.3 3.9 3.0 Inputs
NH4+-N 0.0 40.0 35.1 0.0 40.0 28.4 0.0 40.0 28.9 0.0 120.0 92.4
NO3--N 0.0 40.0 0.4 0.0 40.0 0.0 0.0 40.0 0.0 0.0 120.0 0.4
Organic-N 0.0 0.0 44.5 0.0 0.0 51.5 0.0 0.0 51.1 0.0 0.0 147.1
Total N inputs 0.0 80.0 80.1 0.0 80.0 79.8 0.0 80.0 80.1 0.0 240.0 240.0
Outputs
N2O-N 0.007 0.006 0.007 0.105 0.089 0.102 0.048 0.115 0.058 0.160 0.205 0.166
NH3-N volatilizationa 0.0 0.6 30.1 0.0 0.6 19.7 0.0 0.6 23.6 0.0 1.8 73.4
N plant offtake 21.7 77.9 49.3 21.6 95.2 51.5 18.3 47.3 53.1 83.3 220.4 153.9
Total N outputs 21.7 78.5 79.4 21.7 95.8 71.3 18.3 48.0 76.8 61.7 222.3 227.5
N balance -18.4 5.4 3.7 -20.5 -14.3 9.8 -17.1 33.5 4.8 -58.4 21.6 15.5 a Estimated using the ALFAM model (Søgaard et al., 2002).

Greenhouse gas fluxes derived from agricultural practices in forage crops in the Atlantic area
117
4.4. Discussion
4.4.1. Fluxes of N2O
The low N2O emissions observed in our experiment in 2011 were most likely the consequence of low
%WFPS, high soil and air temperatures, and low available soil N contents. As already mentioned,
2011 was considered a very dry year compared with the 40-year mean for rainfall (Figure 4.1a),
especially before and immediately after the first fertilizer application. The low rainfall after the first
fertilization (20% less than the 40-year mean for May and June in the SW England) meant that the
WFPS did not increase above 60%, resulting in frequent negative N2O fluxes (as low as -0.005 kg
N2O-N ha-1 day-1). Rain fell just before the second and third fertilizer applications, resulting in an
immediate increase of the WFPS above 60% (the threshold value above which anaerobic activity
becomes significant, Linn and Doran (1984)), and subsequent increases in N2O fluxes (Davidson,
1993; Dobbie et al., 1999). Between the second and third applications, the WFPS varied between 35-
60% producing low N2O fluxes, probably as result of nitrification (Bateman and Baggs, 2005). The
low N2O emissions during period 'B' after the third fertilization were due to high %WFPS values (near
saturation), which would have promoted complete denitrification to N2 (Rudaz et al., 1999). In period
'A' after the third fertilization, where soil %WFPS was optimal for N2O production (mean of 66%
WFPS), there was only a small increase of up to 0.008 kg N2O-N ha-1 day-1 from the AN treatment.
But there was no increase in N2O flux from the SL treatment, probably because of the lower NO3--N
content in the SL treatment, and/or possibly because the addition of available C in the SL treatment
enhanced full denitrification to N2 (Weier et al., 1993).
The low N2O fluxes observed during the 2011 experiment contrasted with previous experiments
carried out in the South West of England. The North Wyke meteorological records show that during
the past fifteen years (1995-2010), 2003 was a similar dry year, especially in the spring and summer.
Smith et al. (2012) reported low N2O emissions (0.15-0.22 kg N ha-1) from cut grassland from an
experiment on the same soil type in the same region in 2003, following applications of 80-100 kg N
ha-1 as AN in spring and summer. They attributed these low N2O emissions to the low % WFPS.
However, their emissions in 2003 were still 25 and 2.5-fold greater than those measured in our
experiment in 2011 after the applications in May and June, respectively. Smith et al. (2012) also
reported an increase in N2O emissions during the same months following NH4NO3 applications in
2004, which was considered a wet year, more typical of SW England. The amount of N2O emitted in
2004 respect to 2003 was approximately 9 and 4- fold higher in the applications of May and June,
respectively. Cardenas et al. (2010), also, reported frequent and high N2O fluxes in 2006 (up to 200 g
N2O-N ha-1 day-1 in June) after the application of 75 kg N ha-1 as NH4NO3 in a grazed grassland on the

Greenhouse gas fluxes derived from agricultural practices in forage crops in the Atlantic area
118
same soil type, close to our experimental site. They ascribed these high N2O fluxes to intense
denitrification due to the anaerobic soil conditions generated by the large amount of rainfall recorded.
Chadwick et al. (2000) observed large differences in N2O emissions following slurry application
under different weather conditions at a site close to ours. They also observed that the amount of N2O
emitted was 10 times lower in July, under warmer conditions (WFPS values below 60%), than in
April, probably due to the relatively dry (aerobic) nature of the soil. Unlike our experiment, the N2O
fluxes from the experiments cited above (on the same soil and conducted at the same time as our
experiment) were not limited by soil mineral N, only by the WFPS. In this sense, the loss of NH4+-N
through plant offtake and NH3 volatilisation contributed to the low soil NH4+-N observed during our
experiment and, therefore, low level of soil NO3-- N. In our study, N2O emissions under the limited
conditions of anaerobicity and soil NO3--N content resulted in emission factors lower than the IPCC
default value of 1% (IPCC, 2006), and 8- and 40-fold lower than the lowest emission factors reported
in the experiments carried out in North Wyke and cited above for NH4NO3 and cattle slurry,
respectively.
4.4.2. Other N losses
Converting the emissions to proportion of total N, the ALFAM model estimated that 25-38% of the
total N in the slurry was lost by NH3 volatilization. These results contrasted with the estimated 1%
following NH4NO3 application (Misselbrook et al., 2004b). The climatic conditions (warm and
windy), and the application method (surface broadcasting) coupled with the high DM content of the
slurry would have enhanced NH3 volatilization from SL plots. Surface broadcasting of slurry results
in greater NH3 losses compared to other application methods such as band spreading, use of trailing
hose or shallow injection (e.g. Huijsmans et al. (2003); Misselbrook et al. (1996); Pfluke et al. (2011);
Smith et al. (2000)) due to the increased surface area of the slurry in contact with the air. Also, the
absence of rainfall immediately after the slurry spreading reduced the infiltration of the slurry
ammonium into the soil (Misselbrook et al., 2005). For the same reason, the high slurry DM content
could have an important effect on NH3 loss (Misselbrook et al., 2005; Pain et al., 1989); the DM
content of the slurry used in our experiment was at the value suggested by Sommer and Olesen
(1991), which promotes NH3 emissions. The application under windy conditions would have
enhanced the mass transfer and gas exchange between the slurry and the atmosphere (Misselbrook et
al., 2005).
The warm and dry climatic conditions during the experiment stimulated plant growth on all treatments
and thus generated a high plant N demand. For the zero N plots, the soil N deficits observed meant

Greenhouse gas fluxes derived from agricultural practices in forage crops in the Atlantic area
119
that plant N requirement was probably met via the mineralisation of soil OM. For the SL fertilized
plots, plant offtake represented 64% (mean value) of the total N applied in each fertilization.
Moreover, plant N offtake seems to have been influenced by losses of N via NH3 volatilization on the
SL treatment, where the lowest plant offtake observed (after the first application) coincided with the
highest NH3 volatilization predicted, resulting in a much reduced soil NH4+-N content available for
plant requirements. Misselbrook et al. (1996) reported data about NH3 volatilization and N offtake
from an experiment carried out at a sward located in SW England after surface application of cattle
slurry. Their data showed that the lowest N offtake (23.4 kg N ha-1) was in June coinciding with the
highest NH3 losses (30.6 kg N ha-1). Also, Carran et al. (1982) observed that the soil conditions
directly influence the proportion of N lost as NH3 and N offtake by the plant. In the AN treatment,
most of the N applied was taken up by the grass, especially after the first two harvests, when the plant
N requirements are highest. In addition, after the second application the grass required more N than
the N applied, suggesting mineralization of the OM supplied some the N required by the plant. The
decrease in N offtake observed in the final harvest can be explained by the increase in soil %WFPS
after the third fertilization. Losses of N could have limited the amount of N available for the plant.
This effect was observed by Abassi et al. (2005) in a permanent grassland in Wales on soil in
saturated conditions.
The N budget in the AN treatment showed a surplus (33.5 kg N ha-1) at the end of the experiment.
From this surplus, only 2.8 kg N ha-1 remained in the soil as mineral N. We assumed no losses of N
via nitrate leaching during our measurement period, as there was little opportunity for leaching to
occur. So, the surplus observed in AN could be attributed to losses as N2 due to the anaerobic
conditions caused by the high % WFPS after the third application. The resulting fraction of N applied
attributed to N2 (42% of the N applied) is higher than the range observed (8-25.5%) by Estavillo et al.
(1994), Rudaz et al. (1999) and Velthof et al. (1996) after application of mineral fertilizers in
grasslands. Compared to AN, the SL treatment did not result the same surplus due to the high plant N
offtake and the estimated losses of N by NH3 volatilization.
4.4.3. Fluxes of CH4
Methane emissions were observed immediately after the application of slurry. Fluxes were short-
lived, occurring within the first two (fertilization of June and September) to three days (in May) after
application of the material. The larger mean CH4 cumulative fluxes in the later applications could be
related to the different DM content of the slurries applied, and the environmental conditions. The DM
content of the slurry applied in September (6.5%) was lower than the DM of the slurry applied in

Greenhouse gas fluxes derived from agricultural practices in forage crops in the Atlantic area
120
May. Lower DM contents could enhance slurry infiltration in the soil promoting methanogenesis due
to greater anaerobicity. This was not the case for the June application compared to September because
DM contents were similar. We suggest that soil moisture was the controlling factor in the CH4
production due to lower % WFPS observed in the June application.
In the periods between application (periods “B”) the soil acted as a net sink, resulting in negative
fluxes as low as -9.8 g CH4 ha-1 day-1. Similar conclusions concerning the CH4 fluxes from the soil
after cattle slurry applications were reported by Chadwick et al. (2000), Jones et al. (2005) and Rodhe
et al. (2006). Emissions of CH4 from the AN plots were not observed, with negative fluxes often
measured, indicating consumption of atmospheric CH4. Soil moisture had an influence in gas
diffusivity in the soil and, therefore, controlled the amount of CH4 available for the oxidation by
metanotrophic bacteria (Dunfield, 2007). In the periods following the first and second application,
methanogenesis would have been suppressed in favour of methanotrophy due to the aerobic
conditions generated by the low % WFPS in the zero N and AN plots. Pearson correlations between
WFPS and CH4 consumption rates observed in these treatments seem to confirm this assumption.
Methane uptake rates generally increase with decreasing soil moisture because molecular diffusion in
water is a factor of 104 times slower than in air (Borken et al., 2006). Higher soil temperature in May
and June compared to September may have increased CH4 oxidation rates. Methane consumption
increases when soil is dry and warm (Price et al., 2003). The Pearson correlations between soil
temperature and CH4 oxidation rates confirmed this effect. Negative values showed CH4 consumption
was enhanced (became more negative) with the increase in soil temperature that occurred during the
late spring and summer months. Some studies have shown that mineral N fertilizer application may
decrease CH4 consumption by an immediate inhibition of methanotrophs or change in the microbial
community due to repeated applications (Bodelier and Laanbroek, 2004). In this sense, despite the
positive correlations found between N-NH4+ and CH4 comsumption values in the zero N and AN
plots, there was no evidence of inhibition in this study.
4.4.4. Fluxes of CO2
The CO2 fluxes resulting from the grassland and measured by using static and opaque chambers
represent ecosystem respiration. The application of slurries to the soil provides available C for soil
microorganism activity, increasing of the microbial activity and resulting in large CO2 fluxes after
slurry application (Fangueiro et al., 2007; Meijide et al., 2010; Rochette et al., 2000a). However, in
this experiment total CO2 fluxes from soils fertilized with SL resulted in similar CO2 fluxes from soils
with zero N or amended with AN. These results suggest that soil CO2 fluxes may have been induced

Greenhouse gas fluxes derived from agricultural practices in forage crops in the Atlantic area
121
by the native soil C contents (Kuzyakov and Bol, 2006), rather than by the C contained in the slurry,
and/or that another factor could have limited microbial respiration, not C.
The unusual warm and dry conditions observed during the experiment affected the pattern of soil CO2
fluxes as the Pearson correlations confirmed, when relating soil temperature and moisture to soil CO2
fluxes. The highest soil CO2 fluxes following the first and second N applications coincided with high
soil temperatures and dry soil conditions and contrasted with the low CO2 rates observed after the
third application, in autumn. The relationship between respiration and temperature has been reported
in other studies. Meijide et al. (2010) observed in a barley field that the lowest CO2 emissions
occurred in late autumn and winter, when soil temperatures were below 10˚C. Hynšt et al. (2007), in a
grassland affected by cattle impact in Czech Republic, and Jones et al. (2006), in a temperate
grassland in Scotland, observed the opposite. They observed the highest CO2 fluxes with warm
temperatures. Soil moisture contents was also related to the CO2 fluxes observed. Dry soil conditions
observed after the first two applications resulted in greater CO2 fluxes than those observed after the
third fertilization, when high frequency of rainfall events was registered. In this sense, high WFPS
may have suppressed soil respiration after the third fertilization by reducing soil CO2 diffusivity rates
(Rochette et al., 1991) and also by enhancing anaerobiosis and, in consequence, reducing aerobic
respiration (Ball et al., 1999).
4.5. Conclusions
The unusual climatic conditions observed in 2011 in the SW England affected the pattern of fluxes of
N2O, CO2, CH4 during the experiment. Nitrification was probably the main pathway for N2O
production under the dry soil conditions (WFPS below 60%) observed during the first two
applications. Large rainfall inputs identified after the third fertilization increased gradually soil
%WFPS to saturation and could have enhanced conditions for complete denitrification. This situation
also resulted in low N2O fluxes from the SL and AN treatments. However, AN showed higher
cumulative N2O emissions compared with SL after the third application, probably due to greater
anaerobicity and the lower N availability in the SL plots. High losses of N via NH3 volatilization
could have contributed to the low N2O losses from the SL treatment, although these were modelled
and not measured directly. Plant offtake of the applied N with both types of fertilizer also reduced the
soil N pool available for potential N2O production, especially during the first two applications.
Methane emissions were recorded only from the slurry applications, and the increase of soil moisture
enhanced methanogenic processes which occurred within 48 hours after the application. Carbon
dioxide fluxes were influenced by soil temperatures and soil moisture contents, with the highest fluxes
in the driest period of this study (May-June). The atypical weather during this experiment in some

Greenhouse gas fluxes derived from agricultural practices in forage crops in the Atlantic area
122
sense offers an indication of the effect of future climate change, with decreases in the annual pattern
of rainfall and increased temperatures in SW England, especially in late winter and early spring; all of
which could result in a decrease of N2O emissions.

Greenhouse gas fluxes derived from agricultural practices in forage crops in the Atlantic area
123
CHAPTER 5. NITROUS OXIDE EMISSIONS FROM FORAGE MAIZE PRODUCTION ON A HUMIC CAMBISOL FERTILIZED WITH MINERAL FERTILIZER OR SLURRIES IN GALICIA, SPAIN
Louro, A., Báez, D., García, M.I., Cárdenas, L., 2015. Nitrous oxide emissions from forage maize production on a Humic Cambisol fertilized with mineral fertilizer or slurries in Galicia, Spain. Geoderma Regional 5, 54-63.
DOI: 10.1016/j.geodrs.2015.03.004

Greenhouse gas fluxes derived from agricultural practices in forage crops in the Atlantic area
124
Abstract
We conducted a field experiment in Galicia (NW Spain) to quantify N2O emissions derived from
fertilization practices carried out by local farmers growing forage maize (Zea mays L.). Forage maize
was cultivated in a silt loam soil during 2008 and 2009, in different locations each year. Nitrous oxide
fluxes were monitored during the whole growing season after the application of the following
treatments: no N application (CN); 125 kg N ha-1 NPK at sowing and 75 kg granulated urea at top
dressing (MN); 200 kg N ha-1 injected cattle slurry (CS) and 200 kg N ha-1 injected pig slurry (PS),
with both slurry treatments applied at sowing. We observed that although fertilization significantly
increased losses of N as N2O, the type of fertilizer did not significantly affect the total cumulative
N2O emissions in either year. This could have been due to the high native soil C content in both
experimental sites. Total cumulative N2O emissions from N fertilized treatments ranged from 19.8 to
20.5 kg N ha-1 in 2008 and 10.8 to 11.7 kg N ha-1 in 2009, with the period between sowing and top
dressing being the largest contributor. Nitrification probably caused the N2O fluxes observed in the
days following the application of N fertilizers in May, however the largest losses of N2O were
observed at optimal soil conditions for denitrification. Variations in N2O fluxes between crop seasons
could be attributed, in the first instance, to more N2 rather than N2O production during 2009, a
consequence of the larger soil water filled pore space (>80%WFPS) during most of the sampling
period. Another cause was probably the periods of soil rewetting observed in 2008, which triggered
the largest N2O fluxes observed and contributed to approximately 40% of the total cumulative N2O
emissions. The use of slurries or mineral fertilizer resulted in similar yield scaled N2O emissions in
both years. At a target N rate of 200 kg N ha-1 these were in the range 1.18-1.23 kg N2O-N Mg-1 DM
in 2008 and 0.51-0.58 kg N2O-N Mg-1 DM in 2009. This study highlights the need to increase the
knowledge of initial soil N contents at the moment of the N application and the dynamics of soil
organic matter mineralization to adapt N rates to efficiently meet crop demands, especially in the
period between sowing and top dressing application when demands are small.
5.1. Introduction
Nitrous oxide (N2O) is a potent greenhouse gas that also plays an important role in the depletion of
stratospheric ozone (O3). The global warming potential of N2O is 298 times that of the CO2 in a 100-
year time horizon (IPCC, 2007). Agriculture is the source of 10-12% of global anthropogenic
greenhouse gases (GHGs), of which 60% is N2O (Smith et al., 2007). Consistent with this trend,
Spanish agriculture contributed approximately 76-78% to the total national N2O produced in 2009 and
2010, 67% of which is from soil (MAGRAMA, 2012).

Greenhouse gas fluxes derived from agricultural practices in forage crops in the Atlantic area
125
The application of organic and mineral fertilizers plays an important role in determining N2O fluxes
from soils (Mosier et al., 1998) via production from nitrification, the biological oxidation of
ammonium (NH4+-N) to nitrate (NO3
--N), and denitrification, the reduction of NO3--N to N2. The
contribution of these processes to N2O production is controlled by soil oxygen (O2) availability,
mainly driven by soil water content. Generally any production at water filled pore space (WFPS)
values below 60% is attributed to nitrification (Bateman and Baggs, 2005) whereas denitrification is
the dominant process when WFPS exceeds 60% (Davidson, 1991). Large numbers of studies have
considered denitrification to be the main N2O producing process under high soil moisture, (Abbasi
and Adams, 2000; Skiba and Ball, 2002) but N2O fluxes can decrease when extremely anoxic
conditions are generated in the soil (WFPS exceeds 80%) and N2O is reduced to N2 (Davidson, 1991).
As Galicia is one of the wettest areas of Spain (>1000 mm year-1), agricultural practices in this region
may contribute greatly to anthropogenic N2O emissions. Agriculture has great importance in Galicia,
in the North West of Spain, especially forage maize production. It accounts for 76% (68,909 ha) of
the total area of Spain dedicated to this crop (ESYRCE, 2013). This is because Galician agriculture is
associated with the production and use of forage crops at the farm scale to maintain dairy cattle
production systems. Maize irrigation is not required in Galicia due to the cool summers and high
rainfall (39% annual rainfall is registered between May and October). However, the application of N
based fertilizers is necessary to enhance crop yields. Slurries generated on Galician farms are
commonly applied to avoid the cost of mineral fertilizers. Also, crops can take up N more efficiently
from slurries due to the slow release of nutrients they contain. This characteristic of the slurry can also
help to reduce environmental problems such as leaching and, if slurry is injected into the soil, the risk
of losses of N from ammonia (NH3) volatilization (Smith et al., 2000). However, the injection of the
slurries could stimulate N2O fluxes (Sistani et al., 2010; Wulf et al., 2002) as slurries contain easily
decomposable organic carbon (C) which can trigger denitrification and also generate anaerobiosis in
the soil by increasing biological O2 demand (Rochette et al., 2000b).
The aims of this study were to understand the dynamics of the N2O fluxes during the maize growing
season under Galician climatic conditions and determine the influence of the type of fertilizer
(injected slurries and mineral fertilizers) typically applied by local Galician farmers on the resulting
emissions. We also aimed to identify what form of fertilization is associated with low N2O production
and high yields. This study will report N2O emissions and crop yields from the maize growing seasons
of 2008 and 2009, and present emission factors scaled by crop yields.

Greenhouse gas fluxes derived from agricultural practices in forage crops in the Atlantic area
126
5.2. Material and methods
5.2.1. Location
Measurements were carried out for two consecutive growing seasons (2008 and 2009) on forage
maize fields (Zea mays L.), which were established in different locations at Mabegondo Agricultural
Research Centre (CIAM-INGACAL), Abegondo, Galicia, Spain (43.2425°N, 8.2608°W). The climate
is European Atlantic (Fernández et al., 2011) and Mediterranean humid according to the agrologic
classification provided by Papadakis (1966). The mean annual temperature for the period 1998-2007
was 13.1 ºC, and the mean minimum and maximum temperatures were recorded in February (2.9ºC)
and August (25.4ºC), respectively. The mean rainfall for the same period was 1101 mm. The wettest
month was October (177 mm) and the driest July (35 mm). The average rainfall registered during the
forage maize growing season (average of the period May-September over the last 10 years) is 237 mm
and the average temperature is 16.1ºC. The soil in both maize crop seasons was a Humic Cambisol
with a silt loam texture in the top 10 cm. The soil properties measured in each location are shown in
the Table 5.1.
Table 5.1. Properties of the upper 10 cm of the humic cambisol in the maize cropping sites studied.
Sand Silt Claya Total C Total N C/N pH BDb
Year/Site % % DMc Mg m-3
2008 25 55 20 3.27 0.22 10.38 5.35 1.28
2009 19 56 25 3.60 0.35 10.22 5.30 1.25 a USDA classification b BD: bulk density was calculated by using the empirical formula provided by Battilani et al. (1999) c DM: dry matter
5.2.2. Experimental design
The experimental plots were established in May in both years as a randomized plot design with three
replicates of four treatments: control without N fertilizer (CN), mineral fertilizer as NPK (15:15:15)
and urea 46% (MN), cattle slurry (CS) and pig slurry (PS). Plots were 42 m2 in area (4.2 m x 10 m)
for control and mineral fertilizer plots. The area in those plots fertilized with cattle and pig slurries

Greenhouse gas fluxes derived from agricultural practices in forage crops in the Atlantic area
127
was 88 m2 (8.8 m x 10 m) to accommodate the 4.4 m application width of the slurry tanker used for
the slurry injection.
5.2.3. Fertilization and slurry analysis
Mineral fertilizer was applied by hand in two doses at a final rate of 200 kg N ha-1: 125 kg N ha-1 as
NPK 15:15:15 fertilizer (7% nitrate N content, NO3--N; 7% ammonium N content, NH4
+-N) before
sowing (1st application, on 22nd May 2008 and on 22nd May 2009) and 75 kg N ha-1 as urea 46% for
the top dressing when the plant was 40 cm high (2nd application, on 22nd July 2008 and 6th July 2009).
Cattle slurry was from a storage pit located at CIAM and the pig slurry from a storage pit located on a
private farm. Slurries were injected 20-25 cm into the soil at a target rate of 200 kg N ha-1 using a
Joskin EMB tank with 8400 l of capacity and 40 cm band spacing injection. A sample of each slurry
was analysed for total N prior to application to calculate an application rate equivalent to 200 kg N ha-
1. Cattle slurry was finally spread at rates of 66 and 69 m3 ha-1and pig slurry at rates of 62.5 and 76 m3
ha-1 in 2008 and 2009, respectively (see slurries characteristics in Table 5.2). Before sowing, all plots
were amended with P and K mineral fertilizers at a final rate of 100 kg P2O5 ha-1 and 250 kg K2O ha-1.
Slurry density was determined in fresh samples using a hydrometer (Nahita, Navarra, Spain). The pH
of the slurry was measured with a pH meter (Crison GLP 22, Barcelona, Spain) after adding to 25 g of
slurry to 25 ml of distilled water and stirring for 30 min. Slurry dry matter (DM) was determined after
24 h oven-drying at 105ºC. Organic matter (OM) was analysed in dry and ground (<0.01mm) samples
using a thermogravimetric analyzer TGA-601 (LECO Corp., Michigan, USA). Analysis of N, P and K
was determined in fresh samples using Kjeldahl digestion (AOAC, 2000). Total N was analysed by a
colorimetric method (indophenol blue reaction) using a continuous flow analyzer AA III
(Bran+Luebbe, Norderstedt, Germany). Total P was determined by the colorimetric reaction between
orthophosphate and ammonium molydate to form phosphomolybdate blue and analysed by a UV-vis
spectrophotometer (Thermo Scientific Evolution 201). Dry samples of slurry were analysed on a Leco
TruSpec CN (Leco Corp., Michigan, USA) to determine total C contents. Slurry K, Ca, Mg, Na
contents were determined by atomic absorption spectroscopy. Ammonium (NH4+-N) and nitrate (NO3
-
-N) contents were extracted from fresh samples using 2M KCl. The extracts obtained were analysed
using a segmented flow analyser AA III (Bran+Luebbe, Norderstedt, Germany).

Greenhouse gas fluxes derived from agricultural practices in forage crops in the Atlantic area
128
Table 5.2. Chemical composition of the slurries applied in 2008 and 2009.
2008 2009
Property Units Cattle Pig Cattle Pig
Density g cm-3 1.01 1.01 1.04 1.01
DM % 7.30 2.13 6.57 2.22
pH - 8.2 8.3 8.4 8.4
NH4+-N %FMa 0.087 0.168 0.115 0.162
NO3--N %FM 0.000 0.000 0.000 0.000
OM g kg-1DM 814 633 769 623
N g kg-1DM 42.0 119.5 43.3 110.3
P g kg-1DM 8.6 30.4 9.2 27.8
K g kg-1DM 44.1 84.9 47.3 83.2
Ca g kg-1DM 23.1 35.2 19.8 28.2
Mg g kg-1DM 6.1 18.2 6.9 14.7
Na g kg-1DM 6.1 13.2 3.9 11.3
FM; fresh weight
5.2.4. Sowing, harvesting and plant analysis
Maize (Zea mays L., variety DKC3745) was planted on 22nd May 2008 and 22nd May 2009, with a 75
cm and 14 cm row and plant spacing, respectively. Planting rate was approximately 90,000 seeds ha-1.
Plots were harvested on 16th October 2008 and 29th September 2009. At the optimal maturity stage
(the milk line is half to two thirds down the kernel), two central lines per plot were selected. In each
line, 10 plants in a stretch of 7 m were cut with a sickle to 10-15 cm from the root and weighed.
Samples of 300 g were selected for analysis of the percentage dry matter (%DM), measured by oven-
drying at 80ºC for 18 h until constant weight. Dry samples were ground to pass a sieve of 1 mm and
scanned on a near infrared reflectance spectrophotometer, NIRS Systems 6500 (FOSS NIRS Systems,
Inc., Silver Spring, Washington, USA) for analysis of crude protein (CP) at 2 nm intervals between
1100 and 2500 nm. Spectral data were processed using WINISI software (ISI, Port Matilda, PA).

Greenhouse gas fluxes derived from agricultural practices in forage crops in the Atlantic area
129
5.2.5. Nitrogen use efficiency
Dry matter yield and crude protein contents were used to calculate N uptake in plant tissue by the
following equation ((Eq.1)):
N uptake: DM x CP/ 100/ 6.25 (Eq.1)
where DM is the dry matter (kg ha-1), CP is the crude protein content (in %DM) and 6.25 is the
conversion factor of protein to N content (MacDonald et al., 2002).
Apparent nitrogen recoveries (ANR) and apparent nitrogen efficiency (ANE) were calculated for each
N treatment by the following equations (Eqs. (2) and (3)):
ANR (%): 100 x (N uptake fert – N uptake unfert)/N fertilizer (Eq.2)
ANE (kg DM kg-1 N): (DM fert – DM unfert)/N fertilizer (Eq.3)
where N uptake fert and N uptake unfert denote the above-ground plant N uptakes in the fertilized and
control plots (kg N ha-1), respectively and DM fert and DM unfert are the yields in fertilized and
control plots (Mg ha-1), respectively.
5.2.6. Measurements of N2O fluxes-chamber design and operation
Nitrous oxide fluxes were measured using the closed chamber technique (Ryden and Rolston, 1983).
Chambers were cylinders of polyvinyl chloride (PVC) with a volume of 0.018 m3 (height: 36 cm;
diameter: 25 cm) with a lid fitted with a rubber septum as a sampling port. Two chambers per plot
(i.e., six chambers per treatment) were placed between rows and left in the same position during the
experiment. On 30th May 2008 and 5th June 2009, before the application of the herbicide (4 l ha-1 as
Acetochlor 45%+Terbuthylazine 21.4% (Harness GTZ)) and the insecticide (1 l ha-1 as Clorpyrifos
46%), chambers were removed to facilitate spreading and to avoid chamber contamination. After
these applications they were re-inserted into the soil in the same position and sampling restarted 24 h
later to avoid the effect of disturbance on the soil-atmosphere-gas transfer (Parkin and Venterea,
2010).
5.2.7. Nitrous oxide fluxes
Soil N2O fluxes were measured a total of 70 times between 22nd May and 16th October 2008 and 45
times between 22nd May and 25th September 2009, and always between 09:00 and 10:00 h, which is

Greenhouse gas fluxes derived from agricultural practices in forage crops in the Atlantic area
130
the period of time considered to be representative of the daily mean (Alves et al., 2012). During the
growing seasons of 2008 and 2009 and after the N applications, gas samples were taken three or five
times a week. Chambers were closed for 60 min (T60), the period of time where the headspace N2O
accumulation is linear (Chadwick et al., 2014). After this, a sample of the chamber headspace was
withdrawn through the rubber septum using a 10 ml polypropylene syringe fitted with a hypodermic
needle. An ambient sample was also taken to provide background values for N2O (Cardenas et al.,
2010; Chadwick et al., 2014) and the time zero sample (T0). Each sample was transferred into a pre-
evacuated 10 ml vial for storage and analysis. A sample of 12 ml was injected to over-pressurize the
vials, preventing a back-diffusion of air (Hyde et al., 2006). The N2O concentration of the samples
was analysed in the laboratory using a gas chromatograph Thermo Finnigan Trace gas chromatograph
(GC 2000) fitted with an electron capture detector (ECD) at 330ºC and HP-Plot Q column (30 mm ×
0.3 mm). Nitrous oxide fluxes were calculated using the following equation (Eq. (4)):
F= ρ x V/A x (Ct-C0)/t x (273.15/T) (Eq. 4)
where F is the N2O flux (µg N2O-N m-2 h-1); ρ the gas density (1.26 x 10⁹ µg m-3 N2O-N) under STP
conditions (273 K and 101,325 Pa); V and A are the volume (0.02 m3) and area (0.0491 m2) of the
chamber; C60 and Co (µm3 m-3) are the N2O concentrations 60 min after chamber closure (T60) and the
ambient sample (T0), respectively; t is the time of chamber closure in hours (T60); and T is the air
temperature (K) at the time of sampling. Nitrous oxide fluxes were transformed to daily fluxes (kg
N2O ha-1 day-1) for the calculation of the cumulative N2O emissions. Nitrous oxide fluxes for dates
between samplings were interpolated and the cumulative emissions calculated using the trapezoidal
method (Cardenas et al., 2010; Louro et al., 2013). In order to obtain the cumulative N2O emissions
and the standard error for each treatment, cumulative N2O emissions per plot (2 chambers) were
calculated and the values obtained from the tree plots averaged.
Based on the N-applications and because of the split application of mineral fertilizer, cumulative N2O
emissions were calculated in two periods within each cropping season. In 2008 periods were: ˈ2008Iˈ
(22nd May-22nd July) and ˈ2008IIˈ (22nd July-16th October). In 2009: ˈ2009Iˈ (22nd May-6th July) and
ˈ2009IIˈ (6th July-25th September) (see Figure 5.1).

Greenhouse gas fluxes derived from agricultural practices in forage crops in the Atlantic area
131
Figure 5.1. Timeline and periods considered in a) 2008 and b) 2009.
Total cumulative N2O emissions from the control treatment were subtracted from the corresponding
values in N fertilized treatments during the whole period of measurements, giving net total N2O
emissions as a response to the N applied for each N fertilizer in each cropping season. Emission
factors (EFs) for each N fertilizer were calculated by dividing the net N2O cumulative emissions by
the total N fertilizer applied and expressing it as a percentage. The assessment of the impact of
cropping practices on greenhouse gas (GHG) production per unit yield is important for maintaining
high yields with minimal GHG emissions (Van Groenigen et al., 2010). Yield scaled N2O emissions
were calculated by dividing the total N2O cumulative emissions in each treatment by their resulted
crop yields and expressing them in kg N2O-N Mg-1 DM.
5.2.8. Soil sampling and analysis
Soil samples at 10 cm depth were collected throughout both cropping seasons for the analysis of
mineral N contents (ammonium (NH4+-N) and nitrate (NO3
--N)) and soil moisture. Soil NH4+-N and
NO3--N were determined by extracting 100 g of fresh soil with 200 ml 1M KCl. Extracts were
analysed colorimetrically for NH4+-N and NO3
--N soil contents using a segmented flow auto-analyser
AA III (Bran+Luebbe, Norderstedt, Germany). Soil moisture content was determined gravimetrically
after oven- drying at 105ºC for 24 h. Porosity was calculated from the bulk density (BD) at each site
1st Application/Sowing22nd May 2009
2nd Application6th July 2009
2009I 2009II45 days 82 days
Harvest29th September 2009
2008I 2008II61 days 87 days
1st Application/Sowing 2nd Application Harvest22nd July 200822nd May 2008 16th October 2008
a)
b)
MN:125 kg N ha-1; PS: 200 kg N ha-1; CS:203 kg N ha-1 MN:75 kg N ha-1
MN:125 kg N ha-1; PS: 186 kg N ha-1; CS:214 kg N ha-1 MN:75 kg N ha-1

Greenhouse gas fluxes derived from agricultural practices in forage crops in the Atlantic area
132
by assuming a particle density of 2.65 Mg m-3. Water filled pore space (WFPS) was calculated by
dividing the soil moisture content and BD by the porosity and expressing it as a percentage.
5.2.9. Meteorological data
Daily rainfall (mm) and daily mean air and soil (10 cm depth) temperatures (ºC) were obtained from
the weather station located at CIAM which includes a pluviometer (Thies Clima, Germany, model
5.4032.35.007) and air (Geonica, Spain, model STH-5031) and soil (Campbel Scientific Spain, model
T-107) temperature probes. Monthly mean rainfall and air temperatures for the last 10 years (1998-
2007) and the corresponding means for 2008 and 2009 were also used.
5.2.10. Statistical methods
The statistical analyses were performed using Sigmaplot 11. Total cumulative N2O emissions were
transformed into mean cumulative emissions by dividing the total cumulative emissions by the
number of days. This allowed comparisons to be made between periods and years that differed in
numbers of days. Two way repeated measures analysis of variance (ANOVA) was used to determine
significant differences between the periods within each year (i.e. periods ˈ2008Iˈ versus ˈ2008IIˈ and
ˈ2009Iˈ versus ˈ2009Iˈ) and between the years themselves (i.e. 2008 versus 2009). In each of these
three analyses the treatment factor (CN, MN, CS and PS) was also included to determine a significant
effect on the mean cumulative N2O emissions. The same test was also performed to determine
differences in EF within each year and between years. For total cumulative N2O emissions, one way
ANOVA was used to test for differences between treatments (CN, MN, CS and PS) within each
period and also within each year. For WFPS and mineral N contents, two way repeated measures
ANOVA was used to test for significant differences between treatments (CN, MN, CS and PS) and
between soil sampling days within each period and year. For plant yield, N uptake, ANR, ANE and
yield-scale N2O emissions, one way ANOVA was used to investigate differences caused by the
treatments (CN, MN, CS and PS). Tukey's test was used to determine which treatment groups were
different at the P≤0.05 significance level.

Greenhouse gas fluxes derived from agricultural practices in forage crops in the Atlantic area
133
5.3. Results
5.3.1. Weather conditions
Daily mean air temperature from the day of seeding to harvest was similar in both years, ranging from
12 to 25ºC in 2008 (Figure 5.2a) and from 11 to 24 ºC in 2009 (Figure 5.2b). Daily mean soil
temperatures were also similar with ranges of 13-22 ºC in 2008 and 13-21 ºC in 2009. Total rainfall
during the sampling periods in 2008 and 2009 (Figure 5.2a) was 360 mm (167 mm in ˈ2008Iˈ and 193
mm in ˈ2008IIˈ) and 296 mm (145 in ˈ2009Iˈ and 151 mm in ˈ2009IIˈ), respectively. The first
fertilization in both years was followed by high rainfall for the first 12 days in '2008I' and for the first
19 days in '2009I'. In '2008I', 11 days before the second fertilization, 28 mm of rain fell after a long
period with no significant rainfall. The second N fertilization in both cropping seasons (periods
ˈ2008IIˈ and ˈ2009IIˈ) was not followed by large rainfall. In '2008II', large rainfall was observed
between days 25 and 46; in '2009II' most of the rain fell in one single event on day 15.
5.3.2. Water filled pore space (WFPS)
The WFPS values reported in this study are approximate as they were derived using an estimated BD
which was based on the sand and clay contents of the soil at each site (Battilani et al., 1999). We have
carried out the statistical analysis of the treatments using this parameter but also provide the
equivalent measured gravimetric soil moisture content (expressed as % water) as it is a more accurate
descriptor of moisture for our study (Figures 5.2c, 2d). No significant differences in soil WFPS
between treatments were observed on any sampling day within either year (P>0.05). Mean soil WFPS
during '2008I' was 73% with the largest WFPS values in the following 25 days after the first
fertilization (Figure 5.2c). Also, in '2008I', the rain observed 11 days before the second fertilization
increased soil moisture levels from approximately 50% to almost 60%WFPS. The beginning of the
ˈ2008IIˈ period was characterized by dry conditions (as low as 30% WFPS) until the rainfall between
days 25 and 46 increased WFPS to a mean value of 80%. In '2009I', the soil remained saturated
(100% WFPS) or with standing water at the soil surface (WFPS>100%) (Figure 5.2d). In ˈ2009IIˈ,
throughout the period mean soil WFPS was 77% except for a couple of sampling days after day 15
where levels reached values >100%WFPS.

Greenhouse gas fluxes derived from agricultural practices in forage crops in the Atlantic area
134
5.3.3. Soil mineral N
5.3.3.1. Soil ammonium contents
In '2008I', soil NH4+-N levels (0-10 cm) in N-fertilized plots were not significantly higher as those in
CN plots (Figure 5.3a) (P>0.05). In '2008II', NH4+-N values from MN plots were larger than the other
treatments during the first 36 days (P<0.05). In '2009I', significant differences between the N-
treatments and the CN treatment were observed in the first 26 days (P<0.05) (Figure 5.3b). The
largest soil NH4+-N contents were observed immediately after the first fertilization. In ˈ2009IIˈ, soil
NH4+-N contents in MN plots were significantly larger than the other treatments during the first 23
days (P<0.05).
5.3.3.2. Soil nitrate contents
In both years, soil NO3--N contents (0-10 cm) in the CN plots were in general lower than the other
treatments (P<0.05). However, short-lived increases in NO3--N levels from CN were observed in both
years even when no N fertilizer was applied. During 2008, CN plots reached levels up to 61 kg N ha-1
on day 33 in '2008I' and 74 kg N ha-1 on day 6 in '2008II' (Figure 5.3c). Maximum soil NO3--N
contents of 97 and 118 kg N ha-1 were reached on day 21 in period '2008II' from CS and PS plots,
respectively. In MN plots, fertilizations resulted in maximum soil NO3--N contents of 121.5 kg N ha-1
(on day 18 in ˈ2008Iˈ) and 93.1 kg N ha-1 (on day 13 in ˈ2008IIˈ). In 2009, the largest soil NO3--N
contents observed in CS and PS plots (114 and 204 kg N ha-1, respectively) were reached on days 31
and 38 in ˈ2009Iˈ, respectively. In the MN plots, although a similar pattern to the CS and PS plots was
observed, the maximum soil NO3--N content (205.2 kg N ha-1) was observed on day 11 in period
ˈ2009IIˈ.

135
Figure 5.2. Daily rainfall, soil temperatures and air temperatures in a) 2008 and b) 2009. Filled bars represent daily rainfall and unfilled and filled circles represent daily air and soil temperatures, respectively. Soil water filled pore space (%WFPS) and gravimetric soil moisture contents (%water) following fertilizations in c) 2008 and d) 2009. Data points and error bars represent mean value (n=3) and standard error, respectively. Vertical lines mark periods between N applications. Treatments were: control (CN), mineral fertilizer as NPK+ granular urea 46% (MN), injected pig slurry (PS), injected cattle slurry (CS). Periods were: ˈ2008Iˈ (22nd May-22nd July), ˈ2008IIˈ (22nd July-16th October), ˈ2009Iˈ (22nd May-6th July) and ˈ2009IIˈ (6th July-25th September).
a
c
b
d

136
Figure 5.3. Soil mineral N contents following N applications in 2008 and 2009. Soil NH4+-N in 2008 (a) and 2009 (b). Soil NO3
--N contents in 2008 (c) and 2009 (d). Data points and error bars represent mean value (n=3) and standard error. Vertical lines mark periods between applications. Treatments were: control (CN), mineral fertilizer as NPK+ granular urea 46% (MN), injected cattle slurry (CS) and injected pig slurry (PS). Periods were: ˈ2008Iˈ (22nd May-22nd July), ˈ2008IIˈ (22nd July-16th October), ˈ2009Iˈ (22nd May-6th July) and ˈ2009IIˈ (6th July-25th September)
a b
c d

Greenhouse gas fluxes derived from agricultural practices in forage crops in the Atlantic area
137
5.3.4. Nitrous oxide fluxes
In 2008, N2O fluxes were large and frequent, even from CN plots (Figure 5.4a). In ˈ2008Iˈ, the largest
N2O fluxes were observed between days 51 and 55 from N-fertilizer treatments (1933, 2035, 1647 µg
N2O-N m-2 h-1 in MN, CS and PS, respectively) and on day 41 from CN plots (1137 µg N2O-N m-2 h-
1). The largest N2O peaks of the experiment from all treatments (range of 1772-2313 µg N2O-N m-2 h-
1) were observed between days 27 and 41 in period ˈ2008IIˈ. In 2009, N2O fluxes were less frequent
and lower than in 2008. The largest N2O fluxes in all treatments (range of 939-1642 μg N2O-N m-2 h-1)
were reached on day 19 in ˈ2009Iˈ. In ˈ2009IIˈ, the largest N2O fluxes from the treatments (range of
751-992 μg N2O-N m-2 h-1) were between days 28 and 32.
5.3.5. Cumulative N2O emissions
As Table 5.3 shows, N-based fertilizers significantly increased total cumulative N2O emissions
compared to the CN plots (P<0.001) in both years and in the periods studied within each year
(P<0.001) but no differences between the forms of N applied were observed (P>0.05). The patterns of
the cumulative N2O emissions from the treatments were similar to those from CN until day 55 in
ˈ2008Iˈ (Figure 5.4c) and day 21 in ˈ2009Iˈ(Figure 5.4d), when N applications progressively
increased losses compared to CN. Comparing losses in the two periods studied within each year,
treatments resulted in mean cumulative N2O emissions 1.4-fold larger inˈ2008Iˈ than in ˈ2008IIˈ and
2-fold greater in ˈ2009Iˈ than in ˈ2009IIˈ (P<0.001). Comparing years, in 2009 all treatments showed
significantly lower mean total cumulative N2O emissions than the corresponding values in 2008
(P<0.001). In terms of EF, no significant differences between treatments were observed within each
year and between years (P>0.05). Losses of N2O in relation to the N applied to the forage maize were
1.81% (MN), 1.63% (PS) and 1.74% (CS) (mean of both years).

138
Table 5.3. Nitrogen applied (kg N ha-1), mean (kg N2O-N ha-1 day-1) and total (kg N2O-N ha-1) cumulative N2O emissions in the periods studied after each N application and for the maize total growth season and the resulting emission factors in 2008 and 2009. Treatments were: control (CN), mineral fertilizer as NPK+ granular urea 46% (MN), injected cattle slurry (CS) and injected pig slurry (PS). Mean values of three replicates and standard error between brackets. Treatments with different letters within each column and year are significantly different (P<0.05)
ˈIˈ ˈIIˈ Total ('I'+'II')
Year/Site Treatment
N applied
Mean N2O cumulative
fluxes
Total N2O cumulative
fluxes N
applied
Mean N2O cumulative
fluxes
Total N2O cumulative
fluxes Total N
applied
Mean N2O cumulative
fluxes
Total N2O cumulative
fluxes EF
2008 22nd May-22nd July 2008 22ndJuly-16th October 2008 22nd May-16th October 2008
CS 203 0.17 (0.01)a 10.5 (0.6)a - 0.12 (0.01)a 10.0 (0.7)a 203 0.14 (0.00)a 20.5 (0.8)a 2.15 (0.53)a
PS 200 0.16 (0.01)a 9.8 (0.4)a - 0.12 (0.01)a 10.0 (0.8)a 200 0.13 (0.00)a 19.8 (0.4)a 1.82 (0.28)a
MN 125 0.16 (0.01)a 9.9 (0.6)a 75 0.11 (0.00)a 9.9 (0.2)a 200 0.13 (0.00)a 19.8 (0.8)a 1.80 (0.07)a
CN - 0.13 (0.00)b 8.1 (0.3)b - 0.09 (0.00)b 8.1 (0.3)b - 0.11 (0.00)b 16.2 (0.8)b -
2009 22nd May-6th July 2009 6th July-25th September 2009 22nd May-25th September
CS 214 0.13 (0.01)a 5.8 (0.2)a - 0.06 (0.01)a 5.2 (0.4)a 214 0.09 (0.00)a 10.9 (0.4)a 1.33 (0.35)a
PS 186 0.12 (0.00)a 5.5 (0.2)a - 0.06 (0.00)a 5.3 (0.1)a 186 0.08 (0.00)a 10.8 (0.2)a 1.44 (0.35)a
MN 125 0.14 (0.01)a 6.5 (0.4)a 75 0.06 (0.00)a 5.2 (0.3)a 200 0.09 (0.01)a 11.7 (0.7)a 1.82 (0.45)a
CN - 0.09 (0.01)b 4.2 (0.5)b - 0.04 (0.00)b 3.8 (0.2)b - 0.06 (0.00)b 8.1 (0.5)b -

139
Figure 5.4. Nitrous oxide fluxes after N fertilization in a) 2008 and b) 2009. Cumulative N2O emissions in c) 2008 and d) 2009. Data points and error bars represent the mean value of three replicates and the standard error of the mean, respectively. Vertical lines mark periods between applications. Treatments were: control (CN), mineral fertilizer as NPK+ granular urea 46% (MN), injected cattle slurry (CS) and injected pig slurry (PS). Periods were: ˈ2008Iˈ (22nd May-22nd July), ˈ2008IIˈ (22nd July-16th October), ˈ2009Iˈ (22nd May-6th July) and ˈ2009IIˈ (6th July-25th September)
a b
c d

Greenhouse gas fluxes derived from agricultural practices in forage crops in the Atlantic area
140
5.3.6. Forage maize production and N uptake
In 2008, the application of N fertilizers resulted in similar DM yields and crop N uptake compared to
maize plots with no N fertilizer application (P>0.05) (Table 5.4), with overall mean values of 16.4 Mg
DM ha-1 and 163.5 kg N ha-1 for DM yield and N uptake, respectively. In 2009, DM yields and N
uptake from N fertilized treatments were 1.5 and 2-fold larger than for the CN treatment (P<0.05) but
no significant differences in these parameters between N-fertilizers were observed. In terms of ANE
and ANR (Table 5.4), no significant differences between N-fertilized treatments were observed in any
year (P>0.05). However, ANE and ANR values in 2009 were 2.6 fold and 2.0-fold larger than the
corresponding averages in 2008, respectively. The yield-scaled N2O emissions (Table 5.4) showed no
differences between N fertilized and CN plots in any year (P>0.05) but values in 2009 were
approximately 2-fold lower than those obtained in 2008 (P<0.05).

141
Table 5.4. Dry matter yield, N uptake, apparent N efficiency (ANE), apparent N recovery (ANR) and yield-scale N2O emissions in the maize growth seasons of 2008 and 2009. Treatments were: control (CN), mineral fertilizer as NPK+ granular urea 46% (MN), injected cattle slurry (CS), injected pig slurry (PS). Mean values of three replicates and standard error between brackets. Treatments with different letters within each column and year are significantly different (P<0.05)
Year/Site Treatment N applied Yield N uptake ANE ANR yield-scaled N2O fluxes
kg N ha-1 Mg DM ha-1 kg N ha-1 kg DM kg-1 N % kg N2O-N Mg-1 DM
2008 CS 203 18.3 (2.7)a 175.2 (17.7)a 19.65 (10.61)a 23.01 (4.70)a 1.18 (0.19)a
PS 200 16.5 (1.2)a 177.0 (11.8)a 10.82 (3.98)a 22.12 (6.53)a 1.22 (0.09)a
MN 200 16.4 (1.4)a 169.2 (9.8)a 10.27 (4.79)a 18.25 (3.16)a 1.23 (0.14)a
CN - 14.3 (0.5)a 132.7 (12.6)a - - 1.13 (0.07)a
2009 CS 214 20.6 (1.0)a 161.5 (10.8)a 32.58 (8.41)a 34.45 (8.86)a 0.53 (0.05)a
PS 186 21.0 (0.4)a 176.1 (8.7)a 39.44 (5.79)a 47.48 (8.06)a 0.51 (0.01)a
MN 200 20.2 (0.6)a 189.7 (10.3)a 32.93(3.73)a 50.93 (3.61)a 0.58 (0.05)a
CN - 13.7 (1.2)b 87.8 (13.2)b - - 0.59 (0.02)a

Greenhouse gas fluxes derived from agricultural practices in forage crops in the Atlantic area
142
5.4. Discussion
5.4.1. Influence of soil mineral N and moisture contents on N2O fluxes
We assessed different N-fertilizers typically applied by local farmers during forage maize cultivation
in order to identify the N fertilizer type that related to low N2O emissions while maximizing
production. However, the experimental sites had large initial mineral N contents in the soil profile
(106 kg N ha-1 in 2008 and 123 kg N ha-1, in 2009, data not shown). Low C/N residues from previous
crops (pea/pea-triticale) were incorporated in both sites one year prior the maize season, followed by a
fallow period during winter. So, the application of the different fertilizers at sowing further increased
the mineral-N pool in the soil. This explains the high N2O background values and those induced by
the application of fertilizers observed throughout both cropping seasons. The losses of N2O were
especially high during the first period of each year e.g.'2008I' and '2009I' as the N plant requirements
were low at this growth stage and soil WFPS and soil mineral N contents were high (Drury et al.,
2014; Sehy et al., 2003; Tan et al., 2009). However, the total losses varied between years, probably
due to the different soil WFPS (Figures 5.2c, 2d). These differences could have also been related to
the different positions on the slope of the experimental sites; at the bottom of a slope close to a river
in 2009, and on the top in 2008. This would have resulted in large water contribution from the upslope
land after rainfall episodes, causing saturated conditions and even standing water at the soil surface in
2009. Nitrification could have been the cause of the N2O fluxes during the first days after the first
fertilization in both years ('2008I', '2009I'). This is supported by the increase of soil NO3--N in all N
treatments, especially in PS and CS where the N was applied entirely as NH4+-N (Figure 5.3).
However, this transformation was slower in '2009I’ as soil mineral N was present both as NH4+-N and
NO3--N ten days after fertilization where, at the same stage, mineral N was practically all as NO3
--N in
'2008I'. This was probably caused by the high soil WFPS contents in ˈ2009I’. In addition, most of the
existing NO3--N in MN plots and that already produced in CS and PS and also in MN plots during
'2009I' could have been further reduced to N2 (Smith et al., 2003) at such high soil WFPS levels,
explaining the lower N2O fluxes observed compared to '2008I' (Figure 5.3). The CN plots also had an
increase in soil NO3--N contents suggesting that mineralization of the soil OM and nitrification had
occurred. The increase was larger in 2008 possibly due to the drying and wetting cycles observed
during this year. During long periods of dry soil, a large fraction of the microbial population can die,
increasing the levels of OM in the soil and, after soil rewetting, the surviving microbial biomass
mineralizes that fresh OM (Van Gestel et al., 1993). Also these cycles could disrupt soil aggregates,
exposing the large soil OM contents of this soil to a rapid mineralization (Goebel et al., 2005) and
consequently emitting large pulses of N2O, which would be in agreement with other studies carried
out in temperate climates (Jørgensen et al., 1998; Kim et al., 2010), semi-arid climates (Barton et al.,

Greenhouse gas fluxes derived from agricultural practices in forage crops in the Atlantic area
143
2008; Dick et al., 2001) or even under laboratory incubations (Bergstermann et al., 2011). In our
study, the resulting fluxes contributed approximately 40% to the total cumulative N2O emissions from
each treatment and denitrification would have been the largest contributor after both episodes of soil
rewetting as soil NO3--N contents and WFPS contents were not limiting for losses of N2O by this
pathway (Davidson, 1991).
5.4.2. Impact of mineral or organic fertilizer on cumulative N2O emissions
Literature reviews including soils planted with maize have reported contradicting emission responses
to the application of mineral and organic fertilizers (Table 5.5): greater N2O emissions from mineral
fertilizers in López-Fernández et al. (2007) and Chantigny et al. (2010) in clay soil, lower in
Chantigny et al. (2010) in loam soil and van Groenigen et al. (2004). In agreement with our study,
similar losses of N2O from mineral and organic fertilizers are reported in Collins et al. (2011), Cai et
al. (2012), Damdreville et al. (2008) and Meijide et al. (2007). The latter experiments, with the
exception of those by Cai et al. (2012) and Meijide et al. (2007), corresponded to experimental sites
with lower native soil C content but similar soil texture as in our experiment. The application of
organic C contained in the slurries to soils with low C contents enhances microbial growth which
promotes oxygen consumption and creates temporary anaerobic microsites (Cannavo et al., 2004),
enhancing N2O production by denitrification. Thus, the similar large N2O emissions observed from
mineral and slurry-treated plots in our experiment suggest that sufficient native soil C contents (Table
5.1) were available to support denitrification and that any differences between N2O emissions were
ultimately related to mineral N availability. This is also in agreement with the observations of
Chantigny et al. (2010) and Pelster et al. (2012) in soils planted with maize and wheat, respectively,
and both had high C contents.
The results reviewed in Table 5.5 confirm that the resulting EFs derived from maize cropping are not
always similar the IPCC default value of 1% (IPCC, 2006). Under Mediterranean climatic conditions,
even under lower soil C contents, urea or pig slurries under irrigation (López-Fernández et al., 2007;
Meijide et al., 2007) resulted in EFs larger than this threshold value. In Canada (Chantigny et al.,
2010; Gagnon et al., 2011), when optimal soil moisture conditions for N2O losses by denitrification
are combined with higher soil C contents than those in this study, the resulting EF are even higher.
However, in silt loam soils (Collins et al., 2011; Damdreville et al., 2008, Table 5.5) fertilization
caused similar or lower losses than 1%, contrary to our study, probably because of the lower soil C
availability and greater soil aeration (WFPS 36.1-42.1% in Collins et al. 2011; 45-46%WFPS in
Damdreville et al., 2008). This indicates that the IPCC default value understimates N2O emissions
from maize cropping in this region and in this type of soil.

Greenhouse gas fluxes derived from agricultural practices in forage crops in the Atlantic area
144
5.4.3. Yield scale N2O emissions
Expressing N2O fluxes in terms of crop productivity did not reveal an association between fertilizer
type, low N2O production and high yields, possibly due to the large initial soil N contents in both soil
sites. However, the results showed that even when similar types of fertilizers are applied at similar
rates in the same soil type, yield scale factors vary largely from one year to other. In this sense, as it
was mentioned, N mineralization could probably be more stimulated during 2008 because of the
environmental conditions (e.g. soil moisture and temperature, Ma et al., 1999), increasing the amounts
of mineral N available in the soil profile compared to in 2009. This resulted in the low efficiency of N
fertilizers to increase yields during 2008, leaving larger quantities of N after harvest compared to
2009 (66-425 kg N ha-1 in 2008 versus 24-47 kg N ha-1 in 2009, data not shown). This indicates that
the N inputs from mineralization varied seasonally, in agreement with Zhang et al. (2015) and Loecke
et al. (2012) and thus, so do the optimal N rates for maize cropping as N demand changes (Olfs et al.,
2005; Raun et al., 2009). So, the N2O emissions observed during 2008 were related to the N rate that
exceeded crop N uptake capacity (Snyder et al., 2009). Nitrogen fertilization strategies to maize
cropping in this region must consider possible large N inputs from soil mineralization and adapt N
fertilizer rates to match crop demands. Similarly, Hartmann et al. (2014) reported that N applications
during maize growing season must be reduced as mineralization meets crop demands and N losses are
very likely to occur. Also, they confirm that reductions in N application rates relative to conventional
farming practices (excess of N inputs) do not affect maize yields and cause less N surpluses at
harvest. Similar conclusions were also reported by Zhang et al. (2015). So, our study highlights the
need to increase the knowledge of initial soil N contents at the moment of the N application and the
dynamics of soil organic matter mineralization to adapt N rates to efficiently meet crop demands,
especially in the period between sowing and top dressing application when demands are small.

Greenhouse gas fluxes derived from agricultural practices in forage crops in the Atlantic area
145
Table 5.5. Soil classification and properties (texture, soil OM, C contents), cumulative background and fertilizer induced N2O emissions, and EF from derived from maize cropping studies reviewed.
Cumulative N2O emissions (kg N2O–N ha−1)
Emission factor (%)
Location N applied (kg N ha-1)
(Control/Treat 1/Treat 2)
Treatments1
(Control/Treat 1/Treat 2) Soil
classification Soil
texture
C content (g C kg−1)
OM (%) Control Treat
1 Treat
2 Treat
1 Treat
2 Ref.2
Madrid, Spain 0/170/170 control/incorporated pig
slurry/ urea Typic
Xerofluvent Sandy loam 8.2 1.4 2.91 5.08 5.89 1.27 1.80 1
Henan province,
China 0/150/150 control/organic
manure/NPK Aquic
Inceptisol Sandy loam 6.46 - 0.06 0.30 0.47 0.15 0.27 2
Quebec, Canada 0/100/100 control/liquid swine
manure/mineral fertilizer
clayey, mixed, frigid, Typic Humaquept
Clay 46.8 - 2.63 7.10 11.61 3.1 6.6 3
Quebec, Canada 0/100/100 Control/liquid swine
manure/mineral fertilizer
loamy, mixed, frigid, Typic Dystrocryept
Loam 29.9 - 1.44 4.59 2.01 2.4 0.4 3
Wageningen, Netherlands 0/209/188 control/cattle slurry/CAN Typic
Endoaquoll Sandy - 4 0.14 1.70 0.25 0.75 0.06 4
Wageningen, Netherlands 0/196/188 control/cattle slurry/CAN Typic
Endoaquept Heavy clay - 6.4 1.52 3.37 2.75 0.88 0.66 4
Prosser, USA 0/336/336 control/liquid
manure/NPK
coarse-silty, mixed,
superactive, mesic Xeric
Haplocambid
Silt loam 10 - 0.155 0.411 0.361 0.10 0.08 5
Rennes, France 0/110/180 control/pig slurry/AN Luvisol
Redoxisol Silt
loam 9.5 - 1.00 1.028 2.167 1.07 0.02 6 Ϯ
Rennes, France 0/180/132 control/ matured pig
manure/AN Luvisol
Redoxisol Silt
loam 10.1 - 0.344 0.851 0.872 0.38 0.29 6Ϯ
Madrid, Spain 0/175/175 control/ pig slurry
without DCD/ urea Typic
Xerofluvent Sandy loam 0.0089 ϮϮ 1.4 5.98 8.27 8.57 1.30 1.49 7
Quebec, Canada 0/200/200 control/UAN/CAN
fine, mixed, frigid Typic Humaquept
Clay 46 - 6.5 14.2 13.3 3.8 3.4 8

Greenhouse gas fluxes derived from agricultural practices in forage crops in the Atlantic area
146
Note: in those experiments where different N rates of the same fertilizer were tested, the resulting N2O emissions and EF after the application of similar N rates as in this experiment were selected. Also, in those works with more than one year of study testing the same N rate/s of the same fertilizer/s, the mean value of the N2O emissions and EF obtained was considered.
1 Treatments::CAN: calcium- ammonium nitrate; AN: ammonium nitrate; UAN: urea-ammonium nitrate; DCD: dicyandiamide
2 Ref.: 1, López-Fernández et al. (2007); 2, Cai et al. (2012); 3, Chantigny et al. (2010); 4, van Groenigen et al. (2004); 5, Collins et al. (2011); 6, Damdreville et al. (2008); 7, Meijide et al. (2007); 8, Gagnon et al. (2011)
Ϯ calculated by lineal interpolation of periodic fluxes on the field
ϮϮ expressed in g kg-1 of water soluble organic C

Greenhouse gas fluxes derived from agricultural practices in forage crops in the Atlantic area
147
5.5. Conclusions
We observed large differences in N2O losses between the two maize cropping seasons studied even
though they were performed in the same soil type. The different location of the sites could have
influenced the contrasting soil moisture contents observed during both seasons and the extension of
these events, which affected nitrification and denitrification processes. The objective of this study was
to identify the N source that produced low N2O production and high yields. However, we were not
able to select one, as the forms of N applied caused similar N2O losses to produce the same yields,
probably due to the high C contents characteristic of the type of soil studied. It was also observed that
the large initial soil mineral N contents at both sites, together with the application of the N treatments
resulted in an accumulation in the soil after harvesting, especially in 2008. This study highlights the
need to increase the knowledge of initial soil N contents at the moment of the N application and the
dynamics of soil organic matter mineralization to adapt N rates to efficiently meet crop demands,
especially in the period between sowing and top dressing application when demands are small.

Greenhouse gas fluxes derived from agricultural practices in forage crops in the Atlantic area
148
CHAPTER 6. SHORT, LONG-TERM GREENHOUSE GAS (GHG) FLUXES AND YIELD SCALE EMISSION FACTORS DERIVED FROM A FORAGE MAIZE SEASON AFTER THE APPLICATION OF MINERAL AND ORGANIC FERTILIZERS IN NW SPAIN

Greenhouse gas fluxes derived from agricultural practices in forage crops in the Atlantic area
149
Abstract
The objective of this study was to investigate the contribution of from the different N fertilizers,
commonly used in Galicia (NW Spain) for forage maize cropping (Zea mays L.), on methane (CH4),
carbon dioxide (CO2) and nitrous oxide (N2O) fluxes in a short-term period after their application, to
quantify total N2O fluxes derived from the whole maize grown season and provide yield scaled N2O
emission factors. The treatments applied to a maize field were: (i) control (CN, no added N), (ii) NPK
fertilizer + granulated urea (MN),(iii) injected cattle slurry (CS) and (iv) injected pig slurry (PS).
Closed chambers were used to monitor CO2, CH4 and N2O fluxes in a period of 9 days (short-term
period) after N fertilizers were applied but N2O fluxes were also measured throughout the whole
forage maize season (long-term period). During the short-term period, the largest cumulative Global
Warming Potential (GWP) (sum of N2O, CH4 and CO2) values were from PS (0.91 Mg CO2-C eq ha-1)
and CS (0.71 Mg CO2-C eq ha-1) due to the CH4 and CO2 fluxes observed after their injection into the
soil. Whereas, MN caused similar cumulative GWP values (0.33 Mg CO2-C eq ha-1) to a soil with no
N fertilizer. However, the cumulative GWP values obtained for PS and CS during the short-term
period must be considered carefully as the length of the sampling campaign could have overestimated
the real effect of these treatments. In the long-term period, the application of N fertilizers significantly
increased cumulative GWP values for N2O, especially in the period between sowing and top dressing.
Global warming potential values for N2O were 1.56 Mg CO2-C eq ha-1 from CN and between 2.33-
2.61 Mg CO2-C eq ha-1 from N-treatments but no differences were observed between N-fertilizer
treatments, probably due to the high initial soil mineral N contents at this site and the high
mineralization rates observed. As a result, fertilizers did not increase yields, resulting in mean
apparent nitrogen recoveries (ANR) of 4.29% (-3.26 to 11.7%) and yield-scaled emission factors of
36.8 g N2O kg N-1 in CN plot and between 53.0-57.9 g N2O kg N-1 in N-fertilized plots.
This study highlights the inefficiency of N fertilizers to increase yields when mineralization is
stimulated during maize growing seasons which also resulted in large yield scaled N2O emissions.
Reducing nitrogen application rates in this soil is recommended and total N rates must be adapted to
the initial soil mineral N contents. In addition, the large contribution of the soil organic matter
mineralization must be considered as a potential pool of N for the crop. Adjusting N fertilizer rates is
necessary to avoid excess of N in the soil as it does not significantly increase forage maize yields and
it can provide the substrate for large losses of N as N2O when soil conditions are optimal for both
nitrification and denitrification.

Greenhouse gas fluxes derived from agricultural practices in forage crops in the Atlantic area
150
6.1. Introduction
Anthropogenic greenhouse gas (GHG) emissions derived from human activities are largely
responsible of global climate change. Agriculture contributes to 10-12% of the total global
anthropogenic GHG emissions with 60% and 50% of the total global anthropogenic N2O and CH4
being generated during agricultural practices (Smith et al., 2007). Following this trend, Spanish
agriculture causes 14.1% (40, 218.84 kt CO2 equivalents) of the country's total GHG emissions,
contributing 84.1% and 53.9% to the total anthropogenic emissions of N2O and CH4, respectively
(MAGRAMA, 2015).
Methane is produced by methanogenic microorganisms under anaerobic conditions (Chan and Parkin,
2001) which takes place during manure storage and when they are applied to water-logged fields
(Fangueiro et al., 2008a; Smith et al., 2008). Methane is also consumed by methanotrophes, which are
present in many soils (McLain and Martens, 2006). Agricultural soils are considered as sinks of CH4
as microbial uptake is generally larger than production (Del Grosso et al., 2000). However, some
studies have shown that application of N- based fertilizers can reduce the oxidation capacity of soils
due to the inhibition of the enzyme responsible of methane oxidation (methane monooxygenase)
(Bedard and Knowles, 1989; Knowles and Topp, 1988).
Carbon dioxide emissions can increase after application of organic fertilizers to unamended soils due
to the rapid depletion of easily mineralizable carbon by respiring microorganisms as well as to the
release of CO2 dissolved in the organic amendments (Chadwick et al., 2000; Chantigny et al., 2001;
Collins et al., 2011; Fangueiro et al., 2008b; Phillips et al., 2009; Rochette et al., 2006; Wulf et al.,
2002).
Agricultural N2O emissions derive from the processes of nitrification (requiring aerobic conditions
and N as ammonium (NH4+-N)) and denitrification (requiring anaerobic conditions and nitrate (NO3
--
N)). Also, the application of manures provides additional C to soil, which may decrease soil oxygen
due to the increase of microbial respiration and generation of anaerobic conditions for denitrification.
Thus, N2O production is usually enhanced after application of N fertilizers especially when N
fertilizers are applied beyond crop demand because N forms are available for N2O production and
emission.
The Intergovernmental Panel on Climate Change (IPCC) assumes that 1% of the N applied to soil is
lost as N2O, regardless of type of fertilizer, soil or climatic conditions. However, a large quantity of
studies report losses of N2O larger than 1%. Van Groenigen et al. (2010) argued that agronomic
conditions should be included when assessing N2O emissions. They suggested that expressing N2O
losses as yield-scale N2O emissions may provide a better understanding of the real impact of the
agricultural practices for crop productivity. As Galicia produces 56% of the forage maize in Spain

Greenhouse gas fluxes derived from agricultural practices in forage crops in the Atlantic area
151
(2,069,017 Mg, MAGRAMA, (2013)), investigating the environmental impact caused during forage
maize production in this region is required. Thus, this paper will be present the data derived from the
maize crop season in Galicia during 2010 after mineral and organic fertilization. The objectives of this
study were to investigate the contribution of from the different N fertilizers, commonly used in
Galicia (NW Spain) for forage maize cropping (Zea mays L.), on CH4, CO2 and N2O fluxes in a short-
term period after their application, to quantify total N2O fluxes derived from the whole maize grown
season and provide yield scaled N2O emission factors.
6.2. Material and Methods
6.2.1. Study site and experimental design
The experimental site was located at Mabegondo Agricultural Research Centre (CIAM-INGACAL)
(43.2425°N, 8.2608°W) in Galicia, Spain. The climate is European Atlantic (Fernández et al., 2011)
and Mediterranean humid according to agrologic classification provided by Papadakis (1966). The
annual mean air temperature and total precipitation of the last 10 years (2000-2009) was 13.2 ºC and
1167 mm, respectively. The soil of the experimental site was a Humic Cambisol with a silt loam
texture. Soil properties of the upper 10 cm were 21.8% sand content, 57.3% silt content, 14.5% clay
content (USDA classification), organic matter (OM) 77.2 g kg-1, total carbon (C) content 31.8 g kg-1,
total nitrogen content 2.96 g kg-1 and pH 5.3. The soil had a bulk density (BD) of 1.28 Mg m-3. The
experimental site was a grassland soil used for grazing during the previous 5 years before this
experiment.
The experimental plots were established in May 2010 as a randomized plot design with three
replicates of the following treatments: no N fertilization or control (CN), mineral fertilizer as NPK
15:15:15 fertilizer and granular urea 46% (MN), cattle slurry (CS) and pig slurry (PS). The size of the
plots were 42 m2 in area (4.2 m × 10 m) for control and mineral fertilizer plots. To accommodate the
4.4 m application width of the slurry tanker used for the slurry injection, CS and PS plots were 88 m2
(8.8 m × 10 m). Excluding the CN, all treatments received a target rate of 200 kg N ha-1. Slurry
treatments were injected at 20-25 cm depth on 25th May 2010. Mineral fertilizer was applied by hand
and split in two doses: 125 kg N ha-1 as NPK 15:15:15 fertilizer on 25th May (first application) and 75
kg N ha-1 as granular urea 46% on 16th July (second application). After fertilization, plots were seeded
to forage maize (Zea mays L.) on 28th May at a density of 90,000 seeds ha-1. Row and plant spacing
were 75 and 14 cm, respectively. Harvesting occurred on days 28th, 29th and 30th September 2010.

Greenhouse gas fluxes derived from agricultural practices in forage crops in the Atlantic area
152
6.2.2. Slurry collection and analyses
Cattle slurry was collected from the pit located at CIAM and the pig slurry was brought from a pit
located on a private farm. A sample of each slurry was analysed prior to the fertilization for total N.
Based on this analysis, cattle and pig slurries were applied at rates of 90 and 60 m3 ha-1, respectively,
equivalent to 200 kg N ha-1. The methodology to determine the chemical and physical composition of
the slurries used (Table 6.1) has been described in Louro et al. (2015).
6.2.3. Plant sampling and analyses
At the optimal forage maize maturity stage, two central lines per plot were selected. In each line, 10
plants in a stretch of 7 m length were cut with a sickle to 20 cm from root formation and weighed and
ground. Samples of 300 g were selected for analysis of dry matter (DM) content and crude (CP) and
these parameters were used to calculate N uptake in plant and apparent nitrogen recoveries (ANR) as
in Louro et al. (2015). Yield scaled N2O emissions were calculated in each treatment by dividing the
total cumulative N2O fluxes during maize season by the N yields and expressed as and g N2O-N kg N-
1.
6.2.4. Soil sampling and analyses
Soil samples at 10 cm depth were taken once a week for analysis of soil moisture and mineral N
contents (NH4+-N and NO3
--N) (methodology described in Louro et al. (2015)). Water-filled pore
space (WFPS) was also calculated as in Louro et al. (2015).

Greenhouse gas fluxes derived from agricultural practices in forage crops in the Atlantic area
153
Table 6.1. Composition of the slurries applied in 2010.
Properties Unit Cattle slurry Pig slurry
pH 8.3 8.3
Density g ml-1 1.06 1.01
DMa % 7.66 1.49
NH4+-N %FMb 0.099 0.148
NO3--N %FMb 0.000 0.000
C g kg DM-1 229.8 185.4
N g kg DM-1 37.7 154.3
C/N - 6.1 1.2
OMc g kg DM-1 780 545
P g kg DM-1 6.5 21.4
K g kg DM-1 37.5 131.7
Ca g kg DM-1 22.7 31.6
Mg g kg DM-1 6.1 12.6
Na g kg DM-1 4.6 24
a DM: dry matter; bFM: fresh matter; cOM: organic matter
6.2.5. Greenhouse gas sampling and analyses
Soil CH4, CO2 and N2O fluxes were measured between 9:00 and 10:30 h using the closed chamber
technique (Louro et al., 2015). Two polyvinyl chloride (PVC) cylindrical chambers (height: 36 cm;
diameter: 25 cm) per plot were inserted between crop rows to a depth of 3cm. On every sampling
date, air samples were collected from chamber headspace 60 min after chamber closure. Samples
were withdrawn through a rubber septum, located on the chamber lid, by using a polypropylene
syringe fitted with a needle and transferred to 10 ml pre-evacuated glass vials. Ambient samples were
also taken to provide background values (T0) for CH4, CO2 and N2O. Air temperature of each chamber
was also recorded in each sampling date and the data was used to calculate gas fluxes.
Concentrations of CH4 and CO2 were analyzed using a gas chromatograph (GC, Agilent 7890A,
Agilent Technologies Inc., USA) fitted with a flame ionization detector (FID) and equipped with a
methanizer. Nitrous oxide concentration of the samples was determined by using a Thermo Finnigan

Greenhouse gas fluxes derived from agricultural practices in forage crops in the Atlantic area
154
GC 2000 Trace gas chromatograph (Thermo Finnigan, Rodano, Italy) equipped with an electron
capture detector.
Fluxes of CO2, CH4 and N2O were calculated using the following equation (Eq.1):
F= ρ × V/A × (C60-C0)/t × (273.15/T) (Eq.1)
where F is the gas flux (expressed as mg CH4 m-2 h-1,mg CO2-C m-2 h-1 and µg N2O-N m-2 h-1); ρ the
gas density (CH4: 717 × 103 mg m-3; CO2-C: 0.536 × 10⁶ mg m-3; N2O-N: 1.26 ×10⁹ µg m-3) under
STP conditions (273 K and 101,325 Pa); V and A are the volume (0.02 m3) and area (0.0491 m2) of
the chamber, respectively, C60 and C0 (µm3 m-3) are gas concentrations at chamber closure (T60) minus
gas concentration of the ambient samples (T0), respectively, t is the time of chamber placement (T60)
in hours and T is the air temperature, in ºK, at the time of the sampling.
Daily CO2, CH4 and N2O fluxes for each plot (2 chambers) were calculated and the values from the
three replicates averaged to obtain the daily fluxes per treatment and the standard error. Fluxes of
CH4, CO2 and N2O fluxes were measured during a short-term period, which covered the time
immediately after the fertilization (25th May 2010) and the following eight days (until 3rd June 2010).
On days 25th and 26th May, chambers were sampled in four occasions, corresponding to the GHG
fluxes on 0.06 day (90 min), 0.25 day (6h), 1.04 day (25h) and 1.25 day (29h 30 min) after the
application of the fertilizer treatments. On days 2, 3, 6 and 8 in the short-term period, chambers were
sampled once a day. Nitrous oxide fluxes observed during the whole maize crop season (25th May-27th
September) were considered for the long-term period. Cumulative CH4, CO2 and N2O emissions
derived from the short and long-term periods were calculated using the trapezoidal method (Cardenas
et al., 2010; Louro et al., 2015). Based on the split of the mineral fertilizer in two doses, cumulative
N2O emissions from the long-term period were studied in two periods: period 'A' (between 25th May
and 16th July) and period 'B' (between 16th July and 27th September) (Figure 6.1).
Cumulative CH4, N2O emissions resulting from short-period were transformed to CO2 equivalents
based on the Global Warming Potential (GWP) of greenhouse gases relative to CO2. Radioactive
forcing values considered for CH4 and N2O were 25 and 298, respectively (IPCC, 2007).

Greenhouse gas fluxes derived from agricultural practices in forage crops in the Atlantic area
155
Figure 6.1. Schematic representation of the experiment with the periods considered.
6.2.6. Meteorological data
Total daily rainfall and daily mean soil and air temperatures were recorded between 25th May and 27th
September by a weather station located at CIAM. Total annual rainfall in 2010 and mean annual
rainfall and air temperature for the last 10 years (2000-2009) were used to compare with the weather
conditions observed during the experiment.
6.2.7. Data and statistical analysis
The statistical analyses were performed using Sigmaplot 11. For the hourly N2O, CO2 and CH4 fluxes
obtained in the short-term period, two way repeated measures ANOVA was used to test for significant
differences between treatments (CN, MN, CS and PS) and between gas sampling events. For the total
cumulative CH4,CO2 and N2O fluxes and total GWP resulted from the short-term period monitored,
one way ANOVA was used to evaluate the differences between treatments (CN, MN, CS and PS).
For the long-term period, total cumulative N2O flux data were transformed into mean cumulative
fluxes by dividing the total cumulative emissions by the number of days. This allowed comparisons to
be made between periods that differed in numbers of days. Two way repeated measures analysis of
variance ANOVA was used to determine significant differences between the periods (i.e. period 'A'
versus 'B'), including the treatment factor (CN, MN, CS and PS) to determine a significant effect on
the mean cumulative N2O fluxes. For total cumulative N2O fluxes, one way ANOVA was used to
1st N Appl25th May
Sowing 28th May
May Jun Jul Aug Sep
3rd June
2nd N Appl16th July
27th September
Harvest 28-30th September
Short-term CH4, CO2, N2O fluxes
Long-term N2O fluxes period 'A' Long-term N2O fluxes period ‘B'
9 days
52 days 73 days

Greenhouse gas fluxes derived from agricultural practices in forage crops in the Atlantic area
156
evaluate the differences between treatments (CN, MN, CS and PS) within each period separately, and
also in the overall crop season. For WFPS and mineral N contents, two way repeated measures
ANOVA was used to test for significant differences between treatments (CN, MN, CS and PS) and
between soil sampling days within each period separately. For DM yield, N uptake, ANR and yield-
scale N2O emissions, one way ANOVA was used to test differences caused by the treatments (CN,
MN, CS and PS). In all tests performed Tukey's test was used to determine which treatment groups
were different at the P≤0.05 significance level.
6.3. Results
6.3.1. Weather conditions
During the gas sampling period (25th May-27th September), daily air mean temperatures ranged from
12 to 23 ºC and the soil daily mean temperatures were from 16 to 22 ºC (Figure 6.2a). During the
sampling period, a total of 220 mm of rainfall was registered, which was mainly distributed during
period 'A' (173 mm) (Figure 6.2a). The important rainfall episodes during period 'A' happened on day
1 (16.7 mm), between days 14 and 17 (115 mm) and on day 45 (19 mm). In the period 'B' the largest
rainfall event was observed on day 52 (13 mm).
6.3.2. Water filled pore space (WFPS)
Soil WFPS varied during the experiment (Figure 6.2b). Period 'A' was significantly wetter than the
period 'B' due to the largest rainfall events registered in this period. In period 'A' soil WFPS showed
values between 54-100% WFPS, whereas in period 'B' values were in the range of 27-60%. No
statistical differences between treatments were found within each sampling date (P>0.05).

157
Figure 6.2. a) Daily rainfall, air and soil temperatures, b) %Water filled pore space (WFPS), c) soil NH4+-N content and d) NO3
--N contents during the maize crop season in 2010. Points and error bars represent mean value (n: 3) and standard error, respectively. Letters 'A' and 'B' represent the periods studied. Periods- 'A': 25th May-16th July, 'B': 16th July-27th September. Treatments: injected cattle slurry (CS), injected pig slurry (PS), mineral fertilizer as NPK+ granular urea 46% (MN) and control (CN).
0
20
40
60
80
100
120
1st N
App
l 7 14 21 28 35 42 492n
d N
App
l 7 14 21 28 35 42 49 56 63 70
%W
FPS
Days after fertilization
CN MNCS PS
A B
0
50
100
150
200
250
300
1st N
App
l 7 14 21 28 35 42 492n
d N
App
l 7 14 21 28 35 42 49 56 63 70
NH
4+ -N
(kg
N h
a-1)
Days after fertilization
CN MNCS PS
A B
a
c
b
d
0
5
10
15
20
25
30
35
0
10
20
30
40
50
60
70
1st N
App
l 7 14 21 28 35 42 492n
d N
App
l 7 14 21 28 35 42 49 56 63 70Tem
perature (ºC)
Rai
nfal
l (m
m)
Days after fertilization
RainfallAir temperatureSoil temperature
A B
0
50
100
150
200
250
300
1st N
App
l 7 14 21 28 35 42 492n
d N
App
l 7 14 21 28 35 42 49 56 63 70
NO
3- -N (k
g N
ha-1
)
Days after fertilization
CN MNCS PS
A B

Greenhouse gas fluxes derived from agricultural practices in forage crops in the Atlantic area
158
6.3.3. Soil mineral N
6.3.3.1. Ammonium contents
Soil ammonium (NH4+-N) contents to 10 cm depth (Figure 6.2c) from CN plots remained below
10 kg N ha-1 during the experiment with values in the range 1.9-6.8 kg N ha-1. In the period 'A',
maximum soil NH4+ maximum contents (10 cm depth) of 130.1, 77.3 and 114.2 kg N ha-1 were
observed three days after the first N fertilization (1st N Appl) in MN, CS and PS, respectively.
After this day, a decrease was observed in all treatments to values of 12.2, 2.2 and 2.9 kg N ha-1
in MN, CS and PS, respectively. The statistical analysis showed differences between treatments
(P<0.05) and between sampling days (P<0.05). In period 'A' soil NH4+-N contents in MN were
significantly higher with respect to CS and PS from day 3 to the end of the period 'A' (P<0.05).
In period 'B', the application of the granular urea in MN plots (2nd N Appl) significantly
increased soil NH4+-N contents in MN plots with respect to the rest of treatments (P<0.05) and
these differences were observed until de end of the experiment (P<0.05). Mineral plots
produced values from 61.4 to 220.5 kg N ha-1 and the maximum value was observed on day 25
after the second fertilization. Plots amended with CS and PS recorded similar values than CN
during the period 'B', with ranges from 3.3 to 6.0 and from 4.4 to 9.0 kg N ha-1 in CS and PS,
respectively.
6.3.3.2. Nitrate contents
Soil nitrate (NO3- -N) contents (0-10 cm depth) (Figure 6.2d) were in the ranges 9.4-86.0, 10.9-
88.4, 15.5-131.0 and 37.4-243.5 kg N ha-1 in CN, CS, PS and MN treatments, respectively. The
statistical analysis showed differences between treatments and between sampling days (P<0.05).
In period 'A', soil NO3--N in CS plots showed similar NO3
- -N levels than in CN plots (P>0.05),
contrary to those in PS plots, which were significantly higher (P<0.05). No differences between
contents in PS and CS were observed during the first 34 days after the first fertilization
(P>0.05). After that NO3- -N contents in PS plots were similar than MN plots (P<0.05), which
was the treatment, in general, with the largest NO3- -N values. Plots fertilized with MN produced
values during period 'A' in the range 37.4 to 138.0 kg N ha-1, larger than those of 9.4-50.2, 10.9-
80.4 and 15.5-131.0 in CN, CS and PS, respectively. In period 'B', similar NO3- -N contents
were observed in CN and CS plots, with values in the ranges 33.7-86.0 and 47.8-88.4 kg N ha-
and they were significantly lower (P<0.05) than those observed in MN plots (134.5 -243.5 kg N

Greenhouse gas fluxes derived from agricultural practices in forage crops in the Atlantic area
159
ha-1) for all samples taken in this period. Plots fertilized with PS contained NO3- -N levels
between 86.2 and 129.0 kg N ha-1, which were similar than those in MN during the first 32 days
after the second fertilization and similar than in CS plots during the remaining soil samplings.
6.3.4. Short-term effect of fertilization on GHG fluxes
Methane fluxes from CN and MN plots remained negative or close to zero during the short-term
period measured after the first N fertilization, with values between -0.06 and 0.05 mg CH4 m-2 h-
1 in MN and between -0.06 and 0.13 mg CH4 m-2 h-1 in CN plots (Figure 6.3a). Fluxes of CH4
from CS and PS were in the ranges -0.09-5.98 and -0.06-17.70 mg CH4 m-2 h-1 from CS and PS,
respectively. Plots treated with CS and PS showed significant differences with respect to MN
and CN plots at day 0.06 (90 min) (P<0.05), where the largest peaks were observed.
Afterwards, peaks of CH4 from CS and PS rapidly decreased in the next hours to values less
than 1 mg CH4 m-2 h-1.
The lowest CO2 fluxes (Figure 6.3b) were observed in CN and MN plots. Daily CO2 fluxes were
in the ranges -16.3-97.2 and 5.5-63.9 mg CO2-C m2 h-1 from CN and MN plots, respectively.
Plots treated with PS and CS showed significant differences with respect to the rest of
treatments within the first 6 hours (on 0.06 and 0.25 days) (P<0.001) with the largest fluxes of
862.3 and 403.0 mg CO2-C m2 h-1 at day 0.06 (90 min) after the application of PS and CS,
respectively. Afterwards CO2 fluxes from PS and CS decrease to values below 100 mg CO2-C
m2 h-1, similar than those in CN and MN plots (P>0.05).
The N2O fluxes from CN and MN plots ranged from 20.6 to 305.1 and from 45.3 to 399.6 μg
N2O-N m-2 h-1, respectively (Figure 6.3c). Plots amended with CS and PS produced N2O fluxes
in the ranges 41.2- 492.5 and 46.9-534.7 μg N2O-N m-2 h-1, respectively. Nitrous oxide fluxes
from PS showed statistically different N2O fluxes compared to the rest of the treatments at day
0.25 (6h) and on day 8 after the first fertilization (P<0.05), with the largest flux observed from
PS at day 0.25. In the rest of the short-term period measured daily N2O fluxes were similar
between treatments (P>0.05).

Greenhouse gas fluxes derived from agricultural practices in forage crops in the Atlantic area
160
Figure 6.3. Short-term CH4 (a), CO2 (b) and N2O fluxes (c) after the first N-fertilization (25th May) and in the following 8 days. Arrows represent fertilization. Data points represent the mean value of three replicates ± standard error. Treatments: control (CN), mineral fertilizer as NPK+ granular urea 46% (MN), injected cattle slurry (CS) and injected pig slurry (PS). Short-term period: 25th May-3rd June.
-1000
100200300400500600700800900
1000
1st N App
0.06 0.25 1.04 1.23 2 3 4 5 6 7 8
mg
CO
2-C
m-2
h-1
Days after fertilization
CN MN CS PS
-3
0
3
6
9
12
15
18
21
24
1st N App
0.06 0.25 1.04 1.23 2 3 4 5 6 7 8
mg
CH
4m
-2h-1
Days after fertilization
CN MN CS PSa
b
c
0
200
400
600
800
1000
1200
1400
1600
1st N App
0.06 0.25 1.04 1.23 2 3 4 5 6 7 8
µg N
2O-N
m-2
h-1
Days after fertilization
CN MN CS PS

Greenhouse gas fluxes derived from agricultural practices in forage crops in the Atlantic area
161
6.3.5. Long-term N2O fluxes
Figure 6.4 presents the field N2O measurements carried out during 2010 in the whole maize
crop season. In period 'A', N2O fluxes from CN and MN plots showed values from -86.6 to
586.3 and from -124.5 to 502.2 μg N-N2O m-2 h-1, respectively. In CS and PS plots these values
were in the ranges -59.0-673.4 and -5.6-645.9 μg N-N2O m-2 h-1, respectively.
In period 'B', N2O fluxes were in the ranges 26.3-372.5, 24.4 -1052.9, 11.3-988.0 and 35.1-
1032.1 μg N-N2O m-2 h-1 in CN, MN, CS and PS, respectively. The application of urea in MN
plots (period 'B') did not induce an immediate peak of N2O. The highest peaks observed in this
period from N-fertilizer treatments happened on days 53 (in MN) and 54 (in CS and PS). On
these days N2O fluxes of 1052.9, 988.0 and 1032.1 μg N-N2O m-2 h-1 were released from MN,
CS and PS plots, respectively.
Figure 6.4. Time course of the N2O fluxes derived from the maize crop season in 2010. Data points represent the mean value of three replicates ± standard error. 'A' 'B' represent the periods studied. Vertical arrows represent fertilizations and horizontal arrows the length of the periods studied. Treatments: control (CN), mineral fertilizer as NPK+ granular urea 46% (MN), injected cattle slurry (CS) and injected pig slurry (PS). Periods- A: 25th May-16th July; B: 16th July-27th September.
-2000
200400600800
100012001400160018002000
1st N
App
l 7 14 21 28 35 42 492n
d N
App
l 7 14 21 28 35 42 49 56 63 70
µg N
2O-N
m-2
h-1
Days after fertilization
CN MN CS PS
A B

Greenhouse gas fluxes derived from agricultural practices in forage crops in the Atlantic area
162
6.3.6. Short-term total cumulative GHG fluxes and cumulative global warming potential (GWP)
In the short-term period (Table 6.2), CS and PS showed statistical differences in the total
cumulative CH4 and CO2 fluxes compared to the CN and MN fertilizer (P<0.05) but no
differences in N2O cumulative fluxes were observed during the same period (P>0.05).
Cumulative CH4 and CO2 fluxes from PS were 89% and 24% greater than CS during the short-
term period measured. In terms of cumulative GWP potential derived from the first 8 days of
measurements (short-tem period), forage maize amended with slurries showed greater values
than CN and MN plots (P<0.05). Comparing slurry treatments, PS significantly elevated
cumulative GWP values with respect to CS (P<0.05).
6.3.7. Long-term total N2O emissions and cumulative global warming potential (GWP)
In the long-term period measured (Table 6.3), total cumulative N2O fluxes from N-fertilizers
(MN, CS, PS) showed statistically differences compared to CN plots (P<0.05) but no
differences between N-treatments were observed (P>0.05) in either period or for the whole crop
season. Although, there were differences in the duration of period 'A' and period 'B', cumulative
N2O fluxes were similar in both periods. However, comparing the mean cumulative N2O fluxes
between periods, all treatments in period 'A' resulted in values 1.4-1.7 fold larger compared to
those in period 'B'. In terms of cumulative GWP potential for N2O, N fertilization elevates 1.6-
fold compared to no fertilization. (Table 6.3).

163
Table 6.2. Cumulative CH4, N2O and CO2 fluxes in the first 8 days after the first N fertilization (short-term period) and cumulative warming potential (GWP). Means (standard error) with different letters showing statistical differences (P<0.05). Treatments: injected cattle slurry (CS), injected pig slurry (PS), mineral fertilizer as NPK+ granular urea 46% (MN) and control (CN). Short-term period measured: 25th May-3rd June 2010.
CH4 (Kg CH4 ha-1) N2O (Kg N2O-N ha-1) CO2 (Mg CO2-C ha-1) GWP
Treat. Total Net Total Net Total Net Mg CO2-C eq ha-1
CS 2.250 (0.541)b 2.274 (0.544)b 0.717 (0.030)a 0.192 (0.028)a 0.436 (0.024)b 0.258 (0.050)b 0.71 (0.05)b
PS 4.260 (0.603)a 4.284 (0.613)a 0.887 (0.218)a 0.361 (0.239)a 0.539 (0.024)a 0.361 (0.050)a 0.91 (0.05)a
MN 0.002 (0.015)c 0.026 (0.022)c 0.618 (0.110)a 0.093 (0.124)a 0.149 (0.003)c -0.029 (0.025)c 0.33 (0.03)c
CN -0.023 (0.010)c - 0.525 (0.022)a - 0.178 (0.027)c - 0.33 (0.03)c

164
Table 6.3. Nitrogen applied (kg N ha-1), total (kg N2O N- ha-1) and mean (kg N-N2O m-2 day-1) cumulative N2O fluxes in each period and in the whole crop season with cumulative N2O fluxes transformed to global warming potencial (GWP) (Mg CO2-C equivalents ha-1). Mean values are presented with standard errors in parenthesis and different letters within each column showing significant differences (P<0.05). Treatments: injected cattle slurry (CS), injected pig slurry (PS), mineral fertilizer as NPK+ granular urea 46% (MN) and control (CN).
Periods
Period A
25th May-16th July
Period B
16th July-27th September
Crop season
25th May-27th September
Treatment N applied Total Mean N applied Total Mean N applied Total GWP
CS 183 4.46 (0.16)a 0.086 (0.003)a 0 4.31 (0.28)a 0.059 (0.004)a 183 8.76 (0.17)a 2.61a
PS 209 4.31 (0.25)a 0.083 (0.005)a 0 4.34 (0.25)a 0.060 (0.003)a 209 8.66 (0.44)a 2.58a
MN 125 4.29 (0.27)a 0.082 (0.005)a 75 3.55 (0.09)a 0.049 (0.001)a 200 7.83 (0.19)a 2.33a
CN 0 2.73 (0.12)b 0.053 (0.002)b 0 2.51 (0.08)b 0.034 (0.001)b 0 5.24 (0.07)b 1.56b

Greenhouse gas fluxes derived from agricultural practices in forage crops in the Atlantic area
165
6.3.8. Crop yield and yield-scaled N2O emissions
No significant differences between treatments were observed for the parameters DM and N uptake
(P>0.05) (Table 6.4). In terms of apparent nitrogen recoveries (ANR), the highest value was observed
in CS and the lowest in MN (negative value). However, no significant differences were observed
between treatments (P>0.05). Yield scaled emission factors from N-treatments were significantly
larger compared to CN (P>0.05) (Table 6.4).
Table 6.4. Dry matter yields, N uptake, N input, ANR and yield scaled N2O emissions resulting from the whole maize growing season (long-term period). Mean values of three replicates and standard error between brackets. Treatments with different letter within each column and year are significant different (P<0.05). Treatments: injected cattle slurry (CS), injected pig slurry (PS), mineral fertilizer as NPK+ granular urea 46% (MN) and control (CN).
Treatment Yield N uptake N input ANR
Yield-scale N2O
emissions
Mg DM ha-1 kg N ha-1 kg ha-1 (%) g N2O-N kg -1 N
CS 17.4 (1.0)a 166 (8)a 183 10.71 (2.03)a 53.0 (2.6)a
PS 15.6 (1.2)a 151 (13)a 209 3.41 (5.28)a 57.9 (5.1)a
MN 15.0 (0.4)a 140 (4)a 200 -2.10 (4.76)a 56.0 (2.9)a
CN 16.8 (1.0)a 145 (11)a 0 - 36.8 (3.4)b
6.4. Discussion
6.4.1. Fluxes of CH4 and CO2 in the short-term period
Methane fluxes were related to slurry applications and were short-lived, with the largest values
occurring 90 min after the slurry application. This result is in agreement with other studies, which
reported elevated CH4 emissions within 6 hours (Sherlock et al., 2002), two days (Collins et al., 2011)
or even 5 and 7 days after the application of slurries (Jarecki et al., 2008; Sistani et al., 2010),
followed by a rapid decline. Contrary to non-slurry treated plots (e.g. MN and CN plots), the low CH4
fluxes in MN and CN plots indicated consumption also in agreement with Jarecki et al. (2008), Sistani
et al. (2010) and Collins et al. (2011), from unfertilized and mineral fertilized maize plots. Based on

Greenhouse gas fluxes derived from agricultural practices in forage crops in the Atlantic area
166
the observations reported in many studies (Collins et al., 2011; Sherlock et al., 2002; Wulf et al.,
2002), the short-lived CH4 fluxes after PS and CS application correspond to quantities of CH4
dissolved in the slurries prior application, probably from the easily decomposable organic fraction
through reduction of CO2 and decarboxylation of acetic acid (Chadwick and Pain, 1997). Based on
this, the different magnitude of the CH4 peaks observed between PS and CS application would be
related to the larger fraction of mineralizable C contained in pig slurries (Velthof et al., 2003).
Some studies in forage maize have found that application of N-based fertilizers decreased the CH4
oxidation capacity of soils. For example, Collins et al. (2011), after excluding the CH4 fluxes at the
time of slurry application, observed that the slurry application lowered the seasonal CH4 uptake
between 55-85% (12 and 37 g CH4–C ha−1) compared to no fertilization. In this study, we observed
that application of MN did not affect soil CH4 uptake as it resulted in similar cumulative CH4
emissions than no fertilization. However, in the case of CS and PS, cumulative CH4 losses were
influenced by the fluxes observed immediately their application. If the same procedure as in Collins et
al. (2011) was taken into account (i.e. excluding the time of slurry application, 0.06 day), the resulting
cumulative CH4 fluxes did not differ than no fertilization, at least in this short-term period of
measurements.
The application of slurries also induced large CO2 fluxes with respect to soils with no fertilizer as
many other studies have reported (Chantigny et al., 2001; Fangueiro et al., 2008b; Rochette et al.,
2004). In agreement with these studies the response of the soil to these amendments was short-lived,
decreasing after application. In this experiment, this pattern was observed in the first 6h after
application, when CO2 fluxes from PS and CS declined by 71 and 65%, respectively. Reductions of
about 50% or larger were observed in Chantigny et al. (2001) in the following 4 h after pig slurry and
pig slurry/barley straw applications, in Rochette et al. (2004) and Collins et al. (2011) within 6 h after
cattle slurry application to soils planted with maize, and also within a few hours in Fangueiro et al.
(2008b) after cattle slurry application to a grassland. Based on the previous works, the large CO2
fluxes observed immediately after slurry injection would have been caused by the release of the CO2
dissolved in the slurry itself or from dissociation of the carbonates contained in the slurries when
slurries are mixed with the soil. Fangueiro et al. (2008b) did not observe large CO2 fluxes after
application of slurry solid fractions (high DM contents 24.8-26%) as those fractions do not have
dissolved CO2 and water soluble C contents are very low (1.7-2.2g/kg fresh material). In this sense,
the differences in the lower DM (Table 6.1) and the larger water soluble C contents (Maag and
Vinther, 1999) in the pig slurry could have caused the differences in the resulting CO2 fluxes
immediately after application respect to cattle slurry.
Greenhouse gas fluxes derived from agricultural practices in forage crops in the Atlantic area
167
6.4.2. Nitrous oxide fluxes: short and long-term periods
Forage maize in Galicia is commonly grown under weather conditions that ensure even distribution of
rain with time once the crop is planted. Nevertheless, the usual rainfall distribution (Louro et al.,
2015) was not observed in this study as most of the rainfall fell in a short period of time during the
period 'A' instead of more frequent events. This affected the soil WFPS contents during the short and
long-term periods studied and, consequently, the resulting N2O fluxes. A peak of N2O was observed
in PS immediately after its application, probably caused by the release of some N2O dissolved in the
slurry itself. However, the general trend during the growing season was characterized by lower N2O
fluxes during the short-term and long-term periods compared to previous studies in this soil (Louro et
al., 2015) even though large soil mineral contents were available (Figure 6.2d). During the short-term
period and in the following 13 days, soil WFPS was high, which probably hindered nitrification of the
added NH4+-N with the N-fertilizer. Also, denitrification could have produced N2 instead of N2O
(Smith et al., 2003) with the NO3--N available in the soil. Once most of NH4+-N was completely
transformed in the period 'A' (Figure 6.2c), rainfall decreased and temperatures increased generating
more aerobic conditions in the soil which were extended throughout most of period 'B'. (Figure 6.2b).
Under these aerobic soil conditions (WFPS<60%, Figure 6.2b), denitrification is limited but not
nitrification (Bateman and Baggs, 2005; Davidson, 1991) so the N2O fluxes observed during most of
the dry period would have been caused by nitrification. During the dry conditions in period 'A' the
added NH4+-N with fertilizers was probably lost as N2O by nitrification. This would not have been the
case during period 'B' as NO3-N was the only available mineral N form in PS and CS and the added
NH4+-N to MN plots during the second application would have not been dissolved due to the lack of
rain so organic matter would have been the main source of NH4+-N for the losses observed from all
treatments during period 'B'. We support this by the fact that CN plots increased the levels of NO3--N,
which could denote the rapid nitrification of the NH4+-N released during organic matter mineralization
(Figure 6.2d). We also observed that when rainfall took place at the end of the growing season (days
47 and 53 of the period 'B') soil WFPS increased to optimal values for losses of denitrification
(60%WFPS) so that NO3--N accumulated in the soil caused the largest N2O losses observed during the
growing season (approx. 1000 mg N2O-N m-2 h-1).
6.4.3. Global warming potential in the short-term experiment and effect of N fertilizers on N2O emitted during the long-term experiment

Greenhouse gas fluxes derived from agricultural practices in forage crops in the Atlantic area
168
Slurry treatments did significantly influence the resulting cumulative global warming potential (GWP)
during the first 8 days after application (short-term period) mainly due to the contributions of CH4 and
CO2 fluxes resulting immediately after application. Sistani et al. (2010) reported the effect of these
three gases in short-term (31-33 days) and long-term (141-158 days) periods after application of
mineral fertilizer and after injection, surface application and application with soil aeration of a swine
effluent during two maize growing seasons. They found in the first year that all N-treatments largely
increased GWP during the short period compared to no fertilization but they were similar than no
fertilization during the long-term period. In the second year, they observed that injected swine effluent
elevated N2O and CH4 fluxes during the short-term period, which caused the elevation of the
cumulative GWP in the long-term period compared to the rest of treatments. In this experiment, the
differences in the GWP from CS and PS in the short-term period with respect to CN and MN were
therefore caused by the losses of CH4 and CO2 derived from the application of these treatments and
not from the soil. Also, as CH4 and CO2 were not measured in the long-term period, we cannot know
if the influence of these two gases in the GWP during the long term period followed the same trend as
in the short-term period. In sight of these, the resulting cumulative GWP in the first 8 days must be
considered carefully as the short period of measurements could be overestimating the real effect of the
pig and cattle slurry injection on the GWP for the whole maize season, which is also consistent with
the findings of Sistani et al. (2010).
6.4.4. Mineral fertilizer versus injected slurries on N2O fluxes
In agreement with other studies (Chantigny et al., 2010; Pelster et al., 2012) and following a
consistent trend observed in previous maize growing seasons soil (Louro et al., 2015), the absence of
differences between organic and mineral fertilization was related to the high soil C content of the
experimental site. High N2O fluxes from slurry injection are observed after their application in soils
with low C contents because slurries provide C contents that enhance microbial growth. We also
observed, based on this study and in the previous maize seasons that the different distribution and
quantity of rainfall during maize seasons, and its influence on soil WFPS, can cause differences
between 1.5-2.5-fold in the resulting cumulative N2O losses under the same type of soil, which also
concurs with Dobbie and Smith (2003). In terms of the periods studied during the long-term
experiment, period 'A' contributed 50% to the resulting GWP despite its shorter length (compared to
period 'B') because of the larger proportion of rain that fell in it in combination with the largest
quantities of N in the soil, which is consistent with that observed in previous maize seasons in this
soil.
Greenhouse gas fluxes derived from agricultural practices in forage crops in the Atlantic area
169
6.4.5. Yield scaled N2O emissions and ANR
The low ANR obtained during this maize growing season denoted the inefficiency of the N fertilizers
to increase maize yields. In agreement with Muñoz et al. (2004) and Motavalli et al. (1989), who also
obtained low ANR during maize cropping seasons after the application of slurries, the reason of such
values is related to the high productivity of the soil. As it was mentioned the soil site was previously a
grassland which received large inputs of N during grazing which was reflected in the large mineral N
background values once the crop was established (108 kg N ha-1 in the 90 cm soil profile, mainly as
NO3--N, data not shown). In addition, in agreement with Goebel et al. (2005) and with previous maize
studies in this soil (Louro et al., 2015), the long period with soil dryness could stimulate
mineralization by disrupting soil aggregates, exposing the large quantities of soil OM to be
mineralized and further nitrified. That explains the gradual increase of the soil NO3- throughout the
maize growing season. As the soil OM could have supplied far in excess N crop demands, N
fertilizers were inefficient as it was observed in the low ANR values, (Table 6.4), resulting in the
accumulation in the 90 cm soil profile of practically all the added N (mainly as NO3--N, data not
shown). In addition, the fraction of NH4+-N in the 90 cm soil profile of MN plots was larger than in
CS and PS (127 kg NH4+-N ha-1 in MN versus 9.24 kg NH4
+-N observed in both CS and PS plots, data
not shown), denoting that the second fertilization in MN plots was not necessary.
The resulting high yield scaled N2O emissions were reflected in the low ANR, which concurs with the
results of the meta-analysis reported by van Groeningen et al. (2010) on published crop studies
(maize, wheat potato and rice). However, in their study they reported yield scaled N2O emissions in
the range 8-15 g N2O-N kg N-1, with the smallest yield scaled emission factors of 8.9 g N2O-N kg N-1
at application rates between 180-190 kg N ha-1, which are far lower than the values obtained in this
study or those obtained in previous maize seasons in this type of soil (61.3-122.1 g N2O-N kg N-1)
(Louro et al., 2015). Even in other maize studies, not included in the latter meta-analysis, the resulting
values were much lower. In Halvorson et al. (2010), the resulting yield scaled emission factors were
in the range of 1.7-3.7 g N2O-N kg N-1 (above-ground N biomass calculated as in van Groeningen et
al. (2010) ) or between 2.8 and 6.8 g N2O-N kg N-1 in Venterea et al. (2011), both after fertilizer
inputs between 0 and 224 kg N ha-1. The differences with our study would be related to the site
characteristics (high C, low pH, larger mineralization rates, texture for optimal water retention) and
weather-specific conditions, which created optimal soil environment for losses of N2O. Under these
conditions when N additions exceed crop N needs larger losses of N2O are likely to occur, which is in
agreement with McSwiney and Robertson (2005), Snyder et al. (2009) and Snyder et al., (2014).
This study highlights the infectiveness of N fertilizers for increasing yields when mineralization is
stimulated during maize growing season. Reducing nitrogen applications rates in this soil is
recommended and total N rates must be adapted to the initial soil mineral N contents. In addition, the

Greenhouse gas fluxes derived from agricultural practices in forage crops in the Atlantic area
170
large contribution of the soil organic matter mineralization must be considered as a potential pool of
N for the crop. Adjusting N fertilizer rates is necessary to avoid excess of N in the soil as it does not
significantly increase forage maize yields and it can provide the substrate for large losses of N as N2O
when soil conditions are optimal for both nitrification and denitrification.
6.5. Conclusion
The injection of pig and cattle slurry to a silt loam soil planted to forage maize significantly
contributed to global warming potential in a short-term period due to the large CH4 and CO2 fluxes
released immediately after their application. However, they must be investigated in long-term periods
to asses if the contribution of these gases to GWP maintain the same pattern or are overestimated.
Nevertheless, short and long-term studies showed that the contribution of the N2O to GWP was
similar between N fertilizers in this soil, with the largest contribution during the period between
sowing and top dressing. This study highlights the inefficiency of N fertilizers to increase yields when
mineralization is stimulated during maize growing seasons which resulted in large yield scaled N2O
emissions. Reducing nitrogen applications rates in this soil is recommended and total N rates must be
adapted to the initial soil mineral N contents. In addition, the large contribution of the soil organic
matter mineralization must be considered as a potential pool of N for the crop. Adjusting N fertilizer
rates is necessary to avoid excess of N in the soil as it does not significantly increase forage maize
yields and it can provides the substrate for large losses of N as N2O when soil conditions are optimal
for both nitrification and denitrification.

Greenhouse gas fluxes derived from agricultural practices in forage crops in the Atlantic area
171
CHAPTER 7. GENERAL DISCUSSION AND CONCLUSIONS

Greenhouse gas fluxes derived from agricultural practices in forage crops in the Atlantic area
172
7.1. General discussion
The overall aim of this study was to evaluate the impact of the agricultural practices for dairy farming
on losses of GHG from soils under the Atlantic climatic conditions in Galicia (NW Spain), in order to
make recommendations for practices that reduce emissions and increase crop yields. A series of
experiments that address the specific objectives outlined in chapter 1 provide the evidence that
agricultural practices in dairy farms in NW Spain significantly increase the risk of losses of N2O from
soils meanwhile largest CH4 and CO2 fluxes from soils were short-lived and related to slurry
applications. This chapter returns to those objectives and outlines the main findings, limitations and
implications. Also, the series of experiments will be used to address the hypotheses raised in this
thesis by bringing all the main findings together bringing all the findings together to improve the
understanding of losses of GHG from dairy farming in Galicia (NW Spain).
7.1.1. Main findings
The specific objective in Chapter 2 was to develop empirical models to explain inter-annual and
seasonal variations of N2O losses from grazed and fertilized grasslands based on the measurement of
the most influential parameters. The experiment in chapter 2 showed that grazing and mineral
fertilization significantly increase annual N2O losses from grassland soils with respect to no N inputs,
which was the background N2O reference of this study. The N2O data, in addition to soil, weather and
N management data, were used to build five empirical models: the first at annual scale and the other
four at the seasonal scale (winter, spring, summer and autumn). Four of the five empirical models
were significant and explained the variation in N2O losses. According to the annual empirical model,
rainfall distribution, soil WFPS and N management explained the inter-annual variations in
cumulative N2O emissions among 2008 and 2009. However, the variables measured only explained
24% of the inter-annual variations. Inter-seasonal variations in N2O emitted were also observed but
only the empirical models for spring, summer and autumn were significant. In spring, mean soil
temperature and fertilizer applications were significant factors whereas in summer the combination of
mean soil temperatures and mean soil NO3--N contents and in autumn rainfall, mean soil NH4
+-N, N
inputs from grazing and mean WFPS were significant factors.
The second specific objective was to quantify the effects of the application of mineral fertilizers and
cattle slurry injection during spring, summer and autumn on GHGs from a grassland with grazing
dairy cattle in Galicia (NW Spain) during 2011. In the experiment in chapter 3, Both fertilizers were
tested under drier weather conditions with respect to the average, especially after spring and summer
applications. The application of mineral and injected slurries under these conditions did not

Greenhouse gas fluxes derived from agricultural practices in forage crops in the Atlantic area
173
significantly increase total losses of GHG with respect to a soil with no N-fertilizer applications. A
general trend of low N2O fluxes was observed during the experiment. Soil mineral N was not a
limiting factor as, in addition to the added N during fertilizations, organic matter mineralization was
also stimulated, increasing the fraction of mineral N in the soil. Thus, N2O production was only
limited when soil WFPS was low. Slurry- treated plots showed positive total cumulative CH4 fluxes
because of the CH4 release caused during the slurry applications. However, overall, when those fluxes
from slurry applications are not considered, negative cumulative CH4 fluxes were obtained, denoting
that, as in mineral fertilized and non-fertilized plots, methanotrophy was the predominate pattern and
N additions did not affect the capacity of soil for CH4 uptake. Carbon dioxide fluxes measured with
static chamber represent ecosystem respiration. Short-lived losses of CO2 resulted from slurry
applications, but overall, these large fluxes did not significantly increase cumulative CO2 fluxes with
respect to mineral and non-fertilized plots.
The third specific objective was to investigate how typical management of slurry or mineral fertilizer
affect GHG emissions in a grassland soil in the South West of England. As in the previous chapter, in
the experiment in chapter 4, mineral fertilizer and cattle slurry were also tested during spring, summer
and autumn 2011 to a permanent grassland soil (although with heavier texture than Galician soils).
Dry weather conditions were also observed at this site after spring and summer applications, which
did result in similar low losses of N2O from non-fertilized soils. Low soil WFPS during the spring and
summer did not favour N2O production from N fertilizer applications. This fact was attributed to the
low mineral N contents of the soil, caused by the large plant N uptake in both N treatments and also
due the large fraction of N lost by ammonia (NH3) volatilization immediately after surface broadcast
application of the slurry. After autumn application, losses of N2O were also low even under wetter
soil conditions than in spring and summer. Mineral N levels were also low after the application of the
treatments as a consequence of the losses of NH3 derived from the slurry application and plant N
uptake which removed large fraction of the mineral N for N2O production. However, the N budget
from the mineral fertilizer in this period shows a important N surplus, which was not found in the soil
and was not lost as N2O, which could denote the existence of environmental conditions for complete
denitrification in autumn. Slurry-treated plots showed positive total cumulative CH4 fluxes because of
the CH4 release caused by the slurry applications but in the following days the magnitude of the fluxes
were similar as in the mineral fertilizer and non-fertilized treatments and losses of CO2 from both N-
treatments were similar than the soil with no N additions, all resulting in a source of CO2.
As investigated in chapter 5, the forth specific objective was to understand the dynamics of the N2O
fluxes during the maize growing season under the Galician climatic conditions and determine the
influence of the type of fertilizer (injected slurries and mineral fertilizers) typically applied by local
Galician farmers on the resulting emissions. Investigated chapter 6, the fifth specific objective to
investigate the contribution of the different N fertilizers, commonly used in Galicia for forage maize

Greenhouse gas fluxes derived from agricultural practices in forage crops in the Atlantic area
174
cropping, to CH4, CO2 and N2O fluxes in a short-term period after their application and quantify total
N2O fluxes derived from the whole maize grown season (long-term period). Consistent results relating
to N2O losses were obtained from both experiments and from the all forage maize cropping seasons:
a) using injected slurries (pig or cattle) in a soil with high C contents results in similar cumulative
N2O emissions as mineral fertilizers; b) the largest losses are observed between sowing and top
dressing, a period where the wettest conditions are combined with high mineral N levels and low crop
demand; c) high initial soil contents of the sites in combination with the dynamic of the organic matter
mineralization during the cropping seasons significant contribute to increase mineral N contents in the
soil; d) differences in the total cumulative N2O emissions among cropping seasons were caused by
differences in soil WFPS patterns during the cropping seasons and also the existence of dry-wetting
episodes, which largely contributed to increase cumulative N2O emissions; and e) Slurries (pig and
cattle) resulted in similar high yield-scaled N2O emissions as mineral fertilizer, although cattle and pig
slurry injection significantly elevated cumulative CH4 and CO2 fluxes due to the release of these gases
immediately upon their application into the soil but in the rest of days of the short-term period, CH4
and CO2 fluxes from soils treated with either pig or cattle slurry did not differ from those treated with
mineral fertilizer or no fertilized.
7.1.2. Inter-annual and seasonal variations in N2O emissions
The first hypothesis was that combining grazing with fertilization under the climatic conditions of the
NW Spain can lead in large inter-annual and inter-seasonal N2O variations from soils, as in other
regions of the Atlantic area.
Quantifying annual N2O losses from different agricultural management scenarios has a important
interest for scientists in order to develop strategies to reduce these emissions. However, the task is a
real challenge as losses are highly episodic, varying from year to year. One of the important aspects in
order to adequately quantify N2O emissions is the sampling frequency. Closed chamber technique is
the most popular option for data acquisition but a frequent sampling campaign is required to reduce
errors in the final estimation of the resulting losses (Parkin, 2008; Smith and Dobbie, 2001). In
chapter 2, gas samplings were carried out with the highest frequency possible. Only during winter
2008 and autumn 2009, sampling frequency decreased with respect to the general trend and this could
explain the absence of significance in the model obtained for winter. Despite this, and considering the
general high frequency during the study, the results obtained with this plot scale experiment and
consequently, with the resulting models, provide the evidence to accept the tested hypothesis. The
inter-annual model was obtained with data from two years, with different seasonal distribution of
rainfall among years. That resulted in differences in the soil anaerobic conditions, from very wet

Greenhouse gas fluxes derived from agricultural practices in forage crops in the Atlantic area
175
periods to saturation or even with standing water. As denitrification is considered the process that
causes the largest losses of N2O from temperate grassland soils (Saggar et al., 2009), differences in
the N2O/N2 production ratio caused by the different anaerobic status, could result, in part, in the
differences between years. The models also allow some discussion on how emissions may be altered
under future climate and farming scenarios.
Martínez de la Torre and Miguez-Macho (2009) modelled a scenario with the future climate changes
in Galicia for the period 2034-2051. In this study, a climate change scenario generated by the
Atmosphere Ocean Global Circulation model HadCM3 was regionalized by nesting a regional climate
model (RAMS) within HadCM3. The regional model grid, centred in Galicia, has a resolution of 25
km which allowed a finer spatial detail of Galicia. According to this study, increases of 1.5°C in the
mean annual temperatures and 25% increase in the annual rainfall are predicted for the period 2034-
2051 in Galicia. In order to evaluate how the predicted changes in climatic conditions in Galicia for
2034-2051 would affect future N2O emissions from soils with similar management, the predicted
increase in annual rainfall was input in the inter-annual empirical model, considering that soil WFPS
would change in the same way. According to this, annual N2O emissions from soils under similar
management would increase by 1.2% during the period 2034-2051.
The inter-annual model also showed that both N fertilization and N excreted also contributed to
increase inter-annual N2O variations. However, in comparison with N fertilizer applications, annual
N2O emissions were more responsive to continuous urine and dung depositions (Saggar et al., 2013),
which, according to the inter-seasonal models, contributed to the N2O emissions during the wettest
periods, autumn and winter (although winter model was not significant). In 2009, annual fertilizer rate
was reduced by 59% and grazing was practiced throughout the year, increasing annual N excretions
by 44% with respect 2008. In this sense, reducing losses of N2O from animal excreta seems to be an
important factor to consider. One option to reduce N2O emissions could be the use of nitrificator
inhibitors as 3,4-dimethyl pyrazole phosphate (DMPP), dicyandiamide (DCD) or and nitrapyrin.
These compounds delay the oxidation of the ammonium to nitrate. They act specifically on the
enzyme ammonium monooxygenase by blocking the site where ammonium is converted to nitrate,
reducing the NO3- build up and thus, processes associated with N2O production. Thus, the application
of those compounds to urine patches could significantly reduce these emissions as has been reported
elsewhere (de Klein et al., 2011; Di and Cameron, 2012). However, this option could decrease the
profitability of the farmers due to their high cost (25-30% of the cost of N fertilizers, Subbarao et al.
(2006)). Another way to reduce N2O production could be the application of restricted grazing plans,
which was not applied during the study as livestock remained in the grassland plots until milking
time. Restricted grazing plans can be based on the reduction of the number of animals grazing or
reducing grazing time in periods where the risk of denitrification is high. After comparing these two
options, reduction in grazing time seems to be a more viable option to apply compared to plans aimed

Greenhouse gas fluxes derived from agricultural practices in forage crops in the Atlantic area
176
at reducing the number of animals as the latter would decrease farm profitability and make the sector
fail to fulfil the high demands of animal protein from the growing human population (Li et al., 2013).
By adopting grazing strategies based on reduction in grazing times, significant reductions in N2O
production from soils have been reported in de Klein et al. (2006), Luo et al. (2008) and Schils et al.
(2006). Based on observed/modelled data and the ensuing discussion, the development of a grazing
plan which restricts access time to grasslands is recommended as first step to reduce N2O emissions
from grazing in this area.
In addition to annual changes in climatic conditions, the models also highlight important changes in
the way that temperatures and rainfall and the consequent emissions are distributed throughout the
seasons for the period 2034-2051in Galicia (Martínez de la Torre and Miguez-Macho, 2009). The
climate predictions show increases in mean temperatures of 1.7°C for spring and 2.5°C for summer
compared to the current ones. As the models for these periods have shown, mean soil temperature was
the factor that caused the large inter-seasonal variations during spring and summer due to its
important effect of stimulating the soil biological processes responsible of N2O production. In spring,
these soil conditions coincide with the period of the peak grassland production so grazing is mainly
located during this season. To maintain the grazing intensity, N fertilizers are applied to increase
grassland production and provide an available source of N for a very active soil microbial population.
In addition, soil OM mineralization was highly dynamic during these periods increasing the fraction
of mineral N available in the soil. Under these soil conditions where the microbial population is very
active and mineral N was not a limiting factor losses of N2O were very frequent. This was observed
from the grassland plots monitored to obtain the empirical models (chapter 2) but also could explain
the losses of N2O observed from the three forage maize cropping seasons (chapters 5 and 6).
Although, differences in soil WFPS between forage maize cropping seasons caused differences in the
rate of N2O produced and thus, the inter-seasonal variation of the N2O in forage maize, the increase in
mean soil temperature during forage maize cropping could also stimulate biological processes for
N2O, which concurs with the observations of Doltra et al. (2015) when modelling data from 2009 and
2010 forage maize seasons (chapters 5 and 6) and data from Danish spring barley cropping system.
The predicted seasonal changes in temperature and rainfall could also have an impact on dry-wetting
cycles which this thesis shows to be an important mechanism that increases N2O emissions from
Galician soils. Despite that in chapter 2, the magnitude of these episodes in summer were not as large
as those from grazing and fertilization, the effect of dry-wetting cycles were clearly observed during
forage maize cropping season in 2008 (chapter 5), causing an increase of 40% in the total N2O
emissions during this cropping season. But also in early autumn 2011 from the grasslands in chapter
3, both following significant rain after long periods of soil dryness. Important changes in rainfall are
predicted, in addition to changes in temperatures, for spring and summer seasons in the period 2030-
2060 in Galicia (Martínez de la Torre and Miguez-Macho, 2009). Reductions in the rainfall of 25%
Greenhouse gas fluxes derived from agricultural practices in forage crops in the Atlantic area
177
are expected in spring and increases of the same magnitude in summer. These extreme changes would
lead to more frequent episodes of soil rewetting, which would significantly contribute to increased
annual losses of N2O from soils so more research is required to understand the mechanisms that cause
losses of N2O when these episodes occur in soils in order to obtain potential mitigation options.
7.1.3. Effect of the type of fertilizer on direct losses of N2O and CO2 from soils
The second hypothesis was that because Galician soils are generally rich in organic matter content,
the addition of slurry-C to soil would not significantly stimulate microbial activity and thus, would
not increase CO2 and N2O production with respect to increases caused by mineral fertilizer
applications as N2O losses from soils rich in C are more dependent of the availability of N.
Livestock slurries have been used in farms as they are a valuable source of nutrients (N, P, K) for
growing crops when used properly. Slurry composition depends on several factors as type of animal,
diet and animal age, etc, but in general, when considering the cost of purchasing mineral fertilizers
(19% of the total cost for forage production, CAP (2010)), using slurries is a good money saving
strategy as well as option to recycle the high volumes of animal wastes generated as consequence of
farm intensification. However, there are some environmental concerns about their use as fertilizers. In
addition to the odours that emerge after their application (when slurries are not injected) there is the
problem related to the increase of direct losses of N2O from soils compared to mineral fertilizers.
Contrary to mineral fertilizers, slurries contain a source of easy mineralizable C which can be used by
nitrifiers and denitrifiers to obtain energy. When slurries are applied to soil, microbial respiration
increases due to the increase of easily mineralizable C and mineral N contents in the soil. This causes
the formation of anoxic microsites within soil, optimal for denitrification and, thus, N2O production.
This causes larger N2O losses from slurry-treated soils than those with mineral fertilizers (Chantigny
et al., 2010; López-Fernández et al., 2007; Rochette et al., 2000b; Velthof et al., 2003). However,
according to some studies N2O emissions differ in rates depending on the type of soil. In low C soils,
N2O emissions are related to easily decomposable organic C whereas in those with high C
concentrations where the microbial biomass is limited by other macronutrients, N2O rates are more
often related to N availability (Chantigny et al., 2010; Pelster et al., 2012).
In the experiments described in chapter 3 and 4, cattle slurries were applied to soils with high C
contents (48.0 g/kg and 39.4 g/kg, respectively). From the experiment described in chapter 4, it was
speculated that the ecosystem respiration resulting from slurry applications was similar to that from
non-fertilized and mineral-fertilized soils due to the high C contents of this soil. In the experiment,
CO2 fluxes were measured with static chambers, which accounts for both heterotrophic and
autotrophic respiration often referred to as 'ecosystem respiration'. A proxy evaluation of the effect of

Greenhouse gas fluxes derived from agricultural practices in forage crops in the Atlantic area
178
slurry C-additions on heterotrophic respiration alone was not possible especially as there were
treatment differences in the plant yield which would have affected the proportion of autotrophic
relative to ecosystem respiration. In chapter 3, elevated CO2 fluxes from slurry amended plots
immediately after application were attributed to dissolved CO2 released from the slurry as in other
studies (Fangueiro et al., 2008b; Flessa and Beese, 2000; Rochette et al., 2004). Regardless of this
short lived increase, the resulting overall ecosystem respiration from soils fertilized with cattle slurry
was not significantly different than that from all other treatments. Contrary the results of chapter 4,
neither cattle slurry nor mineral fertilizer increased plant biomass relative to no N applications, which
would denote that the fraction of CO2 corresponding to autotrophic respiration was similar among
treatments and thus, so was heterotrophic respiration. This means that in soils with high C contents,
slurry-C additions do not result in a larger CO2 response because microbial population obtained
enough C substrate from the soil. These results show an absence of a clear overall stimulating effect
of slurry- C applications on microbial activity. The lack of microbial stimulation upon organic C
addition as slurry would also mean that microbial N2O producing processes were also not increased
by slurry application relative to mineral N application. This result was consistently observed in the
overall data for both grasslands (chapters 3 and 4) and forage maize soils (chapters 5 and 6). Even
using pig slurry as fertilizer (chapters 5 and 6), which contains a larger fraction of mineralizable C
content with respect to cattle slurry (Velthof et al., 2003), similar N2O responses as cattle slurry or
mineral fertilizer were observed. This suggests that the occasional differences in N2O fluxes caused
by organic and inorganic fertilizer types in these soils were more to be due to the existence of
available N in the soil rather than C availability (Chantigny et al., 2010; Pelster et al., 2012).
The importance of N availability for losses of N2O was observed in the English grassland soil in
September 2011 (chapter 4), where ammonium nitrate (NH4NO3) and slurry (surface broadcast) were
applied. In the three weeks following each application, mineral N contents in slurry-treated soils were
limited in comparison with those in the soil fertilized with NH4NO3. The reason of the limitation was
that slurry application rates considered total N contained in the material applied instead total mineral
N fraction. In addition, the slurry application technique caused the loss of large fraction of the
ammoniacal slurry content by ammonia volatilization (section 7.4), leaving less available N in the
soil. However, no larger N2O loses from NH4NO3 were observed after the spring and summer
applications as soil WFPS conditions were not optimal for denitrification and plant significantly
uptake the mineral N applied. However, under optimal conditions for denitrification observed in
autumn, the larger mineral N availability in NH4NO3 caused a larger N2O response in comparison with
the slurry treated slurry.
The opposite situation was observed in chapter 3, where slurries were injected into a grassland soil to
reduce losses of the available N by NH3 volatilization (section 7.4). Slurry application target rates
aimed to match slurry mineral N contents with those applied with calcium ammonium nitrate (CAN).

Greenhouse gas fluxes derived from agricultural practices in forage crops in the Atlantic area
179
Under similar soil mineral N levels, both treatments caused similar N2O responses in spring and
summer. In autumn, where conditions were optimal for denitrification, large N2O fluxes were
observed from both types of fertilizers, although they were significantly larger from soils treated with
injected slurry as WFPS levels in soil treated with the organic fertilizer were larger in comparison
with those in CAN.
During forage maize, N2O production was not limited by the availability of mineral N. Prior to
fertilization, the soil sites selected for these experiments contained large mineral N contents caused by
the previous management of each site. In addition, as it was mentioned in section 7.2, the increase of
soil temperatures during the period where forage maize was cropped stimulated microbial activity and
thus, OM mineralization, which contributed to increase the mineral N pool in the soil. Under these
soil conditions, even when cattle and pig slurries were applied based on the total N contents of the
amendments rather than on their mineral N levels, the large fraction of mineral N from the soil
compensated differences in mineral N composition between both types of slurry and mineral N
fertilizer, resulting in similar N2O production from all fertilizers tested.
Thus, the results provided with these four experiments provide the evidence to accept the hypothesis
that the addition of slurry-C to soils with high C contents does not significantly stimulate microbial
activity and thus, increase N2O production respect to those caused by mineral fertilizer applications as
N2O losses from soils rich in C are more dependent of the availability of N in the soil rather than C.
This makes it difficult to choose a specific fertilizer that reduces N2O and CO2 emissions so it would
be recommended that farmers use organic fertilizers to promote within farm recycling of N.
7.1.4. Slurry application technique and losses of N by NH3 volatilization
In addition to the hypothesis tested, this data has also contributed to the understanding of how
application technique affects emissions. The lower availability of the mineral N when slurries are
applied can be caused by the volatilization of the ammonium fraction into the air as ammonia.
According to measurements obtained by using a ammonium selective-ion electrode, between 40-48%
of the N contained in slurries is as ammonium (D. Baez, personal communication), which is available
for crop uptake, and the rest is in an organic form which requires prior mineralization to be available
for the crops. This means that maintaining the mineral N form in the soil when slurries are used as
fertilizers is crucial for crops. But it is also crucial in order to reduce indirect losses of N2O associated
with NH3 volatilization, which sometimes can be larger than direct N2O emissions (Chadwick et al.,
2011). To minimize these losses, weather conditions need to be consider. Slurry application is
preferred under cool, overcast, calm and misty conditions rather than hot dry weather and windy
conditions. In the studies in grassland soils in SW England and Galicia (chapters 3 and 4), slurries

Greenhouse gas fluxes derived from agricultural practices in forage crops in the Atlantic area
180
were applied in spring, summer and winter. Except for the autumn application in the Galician soil, the
rest of slurry applications were carried out under dry weather conditions, favourable for losses of
NH3. However, irrespective of the weather conditions, the application technique was an influencing
factor that determined the degree of exposition of the material to the air and thus, the magnitude of
NH3 losses and the fraction of mineral N available in the soil. In the Galician soil, slurries were
applied by shallow injection, which causes less losses of NH3 than the surface broadcast technique
used in the English soil. The ALFAM model (Søgaard et al., 2002), which provides NH3 estimations
and is well correlated to field measurements (Bourdin et al., 2014), was used in the English site to
obtained the losses caused by the application technique under those weather conditions. This multiple
regression model revealed that 69-86% of the ammoniacal N was lost as NH3 in the first 24h. No
estimations of the resulting NH3 losses from the slurry shallow injection in the Galician soil were
reported in chapter 3. The reason is attributed to the fact that data from Spanish studies were not used
to build the ALFAM regression. However, if ALFAM model was used to evaluate these losses under
the weather conditions under which slurries where applied in the Galician soil, shallow injection
would have caused NH3 losses between 11-17% of the total ammoniacal N, which is in agreement
with the range 1-25% reported by Huijsmans et al. (2001) from field studies. Based on these results it
is clear that shallow injection is highly recommended to maintain more fraction of N available plant
uptake in the soil and reduce indirect N2O emissions with respect surface broadcast application
technique.
7.1.5. The effect of fertilizer type and applications on CH4 fluxes from soils
The third hypothesis posed by this thesis was that because of the high fertility of soils in Galicia,
additions of N with organic and mineral fertilizers would not reduce soil CH4 uptake capacity with
respect to no fertilization.
Methane fluxes measured were net result of CH4 production by methanogenesis (positive fluxes) and
CH4 oxidation by methanotrophy (negative fluxes) processes (Baggs et al., 2006; Ball et al., 1999).
From the experiments described in chapters 3 and 4, grassland soils result in net CH4 production when
slurries are used as fertilizers. The reason of the net CH4 production is caused by the large CH4 fluxes
released after their applications which, due to their short-lived nature, were probably caused by the
easily decomposable organic fraction through reduction of CO2 and decarboxylation of acetic acid in
the slurry, but not from the soil (Chadwick and Pain, 1997; Collins et al., 2011; Fangueiro et al.,
2008b). From the experiments in grasslands, the short-lived CH4 production attributed to slurry was
observed within 2-3 days after its application and in forage maize (chapter 6) over an even a shorter
period of time (less than 2h) (chapter 6). Due to the large magnitude of those fluxes, a total positive
flux was observed for the whole experiment in both grassland soils, which denoted that

Greenhouse gas fluxes derived from agricultural practices in forage crops in the Atlantic area
181
methanogenesis was the most important process in the soils treated with slurries. However, after
excluding the time of slurry applications, a total negative flux comparable to that in a non-fertilized
soil was obtained for the whole period in both experiments in grasslands, denoting that in temperate
grassland soils treated with slurries, methanotrophy is the main process.
Some studies have shown that the N fertilizers can inhibit CH4 oxidation due to the competition
between the NH4+-N and CH4 for methane monooxigenase, the enzyme responsible for the oxidation
of CH4 and others highlight the importance of additions of N for nitrifying population, which also
oxidises methane (Bodelier and Laanbroek, 2004). In addition, other studies report inhibitory effects
in the CH4 oxidation capacity of the soil due to the toxic effect of high concentrations of NO3--N.
From the experiments in chapters 3 and 4 in grasslands, no clear inhibition or stimulation of CH4
oxidation by the added NH4+-N with the slurries or mineral fertilizers was observed nor was inhibition
due to NO3-N concentrations observed. In the experiment in chapter 4, the reason could be caused by
the mineral N levels in the N-fertilized treatments, caused by high plant N uptake and also by
volatilization of large fraction of NH4+-N contained in the slurry. However, in chapter 3, no
limitations in soil NH4+-N levels from N fertilized soils were observed throughout the experiment.
Even in summer, the largest mean CH4 oxidation rates in soils treated with slurry and mineral
fertilizer occurred under significant levels of NH4+-N (in CS and MN plots) and NO3
--N (in MN plots)
and no differences were observed with the corresponding CH4 oxidation rates from CN plots. A
possible explanation of this result could be in the fact that the soil received N fertilizer applications
for many years (Dobbie and Smith, 1996), so the addition of N fertilizers in this study did not have an
immediate effect in the resulting oxidation rates. Based on this arguments, farmers would use organic
fertilizers to promote within farm recycling of N.
7.1.6. Emission factors
According to the results obtained by Lesschen et al. (2011b) when using the INTEGRATOR model to
calculate European N2O EFs, agricultural soils in the Western part of UK and North West of Spain
have medium and high risk of large losses of N2O, respectively, much larger than those obtained
using IPCC default value, due to the large annual rainfall as well as the fine texture of the soils in
these regions. The results obtained in this study provide the evidence that EF derived from fertilizer
applications to forage crops in the Atlantic area may be lower than 1% proposed by IPCC in the
guidelines (IPCC, 2006) under atypical dry conditions, as it was observed in both NW Spain and SW
England during 2011. In addition, the magnitude of these EF can be significantly low if dry soil
conditions are combined with limited mineral N levels, as it was observed from the English site. On
the contrary, when soil moisture and soil mineral N are not limiting factors for N2O production
(Dobbie and Smith, 2003), EFs derived from fertilizer applications can be much higher than 1%, as it

Greenhouse gas fluxes derived from agricultural practices in forage crops in the Atlantic area
182
was observed during the three forage maize seasons, where mean EF of 1.64% for mineral fertilizer,
1.63% for injected pig slurry and 1.80% for injected cattle slurry were obtained (chapters 5 and 6).
However, as it will be discussed later in this section, the EFs from forage maize were result of an
inadequate N fertilizer application rates to soil so optimizing EF derived from forage maize
production is required.
Using emission factors based on the rate of N applied does not allow to evaluate the agronomic
management as GHG losses depend more than just the amount of fertilized applied. For this reason,
the number of studies presented in this thesis aimed to link the agronomic productivity to
environmental sustainability. This link is possible by using emission factors based on crop production
or as they are also known 'yield-scaled emission factors' introduced by Mosier et al. (2006) and van
Groenigen et al. (2010). By using these factors, the most suitable type of fertilization linked with
productivity and sustainability would be selected.
In chapter 3, the use of mineral fertilizer was evaluated against using injected cattle slurry as fertilizer
in a grassland soil used for dairy grazing. Even though, EF were below the default value of 1%
proposed by IPCC, fertilizers did not achieved the main aim of fertilization: increase yields. The
dynamic of the OM in the Galician site contributed to an increase in the pool of mineral N in the soil,
causing an deficient use of both fertilizers. When expressing GHG losses in DM basis (Mg equiv
CO2-C Mg DM-1) both fertilizers caused similar losses of GHG per unit of crop produced but the
resulting factors were only 11% higher than the corresponding value when no fertilizer is applied.
In chapter 4, mineral fertilizer and surface broadcast cattle slurry were also tested in a permanent
grassland. Although yield-scaled emission factors were not directly reported, using mineral fertilizers
reported slightly larger losses of GHG per unit of yield produced than surface broadcast slurry
(P=0.486) due to the larger N availability in the mineral fertilized soil compared to the slurry-treated
soil. When the resulting ANR values obtained for the total N applied with each treatment were
evaluated, ANR from mineral fertilizers were much higher than the corresponding for slurry
application. However, it has to be considered that losses by NH3 volatilization were very important,
reducing the quantity of N in the slurry-treated soil. Thus, if those losses caused by the slurry
application technique were considered and discounted to the total N applied, 42.4% of the N finally
applied to the soil (70 kg N ha-1) was harvested, which is not very different than the 57.1% obtained
after application of 240 kg N ha-1 with mineral fertilizer. This means that, in proportion, cattle slurry
was able to produce significant yields with less quantities of N.
Based on these results, the author, in principle, recommends the use of slurries as fertilizers in
grasslands in the Atlantic area but using the shallow injection technique to reduce losses of NH3 and
increase the fraction of mineral N available for plant uptake. This fertilizer option will reduce the cost

Greenhouse gas fluxes derived from agricultural practices in forage crops in the Atlantic area
183
of milk production by reducing the cost of purchasing mineral fertilizers as well as recycle animal
wastes produced in farms.
In relation to maize cropping (chapters 5 and 6), the agronomic management only could be evaluated
based on losses of N2O, as CH4 and CO2 were only measured in 2010 and in a short-period of time, so
future studies in forage maize must include measurements of CH4 and CO2 during the whole cropping
season. Despite all types of fertilizer resulting in similar N2O emission per yield, no recommendation
can be make in terms of type of fertilizer as the N application rate selected (200 kg N ha-1) was very
high and did not only not increase N uptake but also provided the source of N to increase losses of
N2O when soil conditions were optimal. These results concur with the meta-analysis reported by Van
Groenigen et al. (2010) on published crop studies (maize, wheat potato and rice) who found that
yield-scaled N2O emissions are negatively related with the N use efficiency so the strategy to reduce
N2O should be focus on optimizing the efficiency of the N fertilizers. The reason of the inefficiency of
the fertilizers applied was in the fact that the initial soil N contents and the high source of N from the
mineralization of the residues of previous crops (i.e. pea/triticale in 2008 and 2009 and grassland in
2010) were dismissed at the time of fertilizer applications. As García-Pomar et al. (2012) stated based
on the results obtained from the agronomic N balance for forage maize cropping in seven Galician
dairy farms in 2008 and 2010, both factors are crucial in order to carry out an optimal fertilization. In
terms of the initial soil N contents, the latter study pointed that in some sites N fertilization were not
required as the initial soil mineral N contents were very high. They also reported that reductions of up
to 125 kg N ha-1 in the quantity of N fertilizer applied are possible when the previous crops to forage
maize are legumes or grasslands because the organic matter provided by previous crops can be
mineralized and available for the forage maize. Based on this, N application rates need to be adapted
to the initial soil contents and the dynamics of the soil organic matter mineralization need to be
studied to finally match N crop demands. Determining the initial soil mineral N contents prior any N
fertilizer addition by taking soil samples provides initial information of how much N is available in
the soil. However, the estimation of the fraction of mineralizable N that can be available for forage
maize uptake during the growing season is difficult due to the variations in the N cycle caused by
variations in moisture and temperature, as it was observed in the mineral N pattern in the plots used as
control with forage maize. In this sense, scientists in this region need to develop a soil test to predict
N supply from organic matter mineralization. For sites like in this study with high dynamic of the
mineralization and low crop response to N fertilizer applications, the Illinois soil nitrogen test (ISNT),
developed by Khan et al. (2001) would be an appropriate test to consider. This test estimates the
amino sugar-N fraction in the soil and quantitatively measures NH4+-N levels and it has aided the
provision of N recommendations in maize cropping in USA as Williams et al. (2007), Mulvaney et al.
(2001), Klapwyk and Ketterings (2006) and Lawrence et al. (2009) have reported.

Greenhouse gas fluxes derived from agricultural practices in forage crops in the Atlantic area
184
7.2. Future research
The discussion highlighted a number of areas where future research should focus and an improved
understanding in those areas is required if mitigation measures for dairy agriculture in the NW Spain
are to be identified and effectively implemented. Those areas are:
• Development of long-term studies based on frequent N2O measurements as well as the
measurement of a larger number of soil and field management variables in order to obtain
empirical models that fully explain the inter-annual variations in the N2O emissions from
Galician grassland soils.
• Evaluate if development of a grazing plan based on restricted access time to grasslands would
decrease N2O production from grassland soils in this region with respect to grazing with
unlimited access.
• Investigate the processes that trigger N2O production from Galician soils after dry-wetting
periods and develop measure to address this.
• Develop a soil test for Galician soils to predict N supply from organic matter mineralization
in order to adapt fertilization rates for forage maize cropping.
• Monitor, in addition to N2O, CH4 and CO2 fluxes from the entire forage maize growing
season and in soils with different initial mineral N contents, in order to aid identification of
the fertilizer type that gives high yields and low GHG emissions.
• Development of long-term studies that include measurements of soil C sequestration.
• Laboratory studies to evaluate in more detail the effect of slurry-C additions on heterotrophic
respiration in Galician agricultural soils with high C contents.
• Laboratory experiments in order to investigate the contribution of nitrification and
denitrification processes to N2O production in Galician soils under different regimes of soil
WFPS, specially N2O/N2 production ratios by denitrification under those regimes.

Greenhouse gas fluxes derived from agricultural practices in forage crops in the Atlantic area
185
7.3. Conclusions
1. Large inter-annual and seasonal variations in the N2O emissions from grasslands with dairy cattle
grazing management and mineral fertilization were observed. These losses were driven by climatic
and soil variables but also affected by differences in N management. Under a scenario of future
climate change in Galicia, predicted by a global climatic model, better grazing management could
help to reduce annual N2O losses derived from N-management. Dry-wetting episodes can
significantly contribute to increased annual N2O emissions from soils and therefore justifies further
research to indentify the exact mechanisms in Galician soils.
2. In grasslands, the use of cattle slurry as fertilizer did not significantly increase N2O emissions with
respect to mineral fertilization. Similar conclusions were obtained during forage maize cropping when
organic fertilizers (injected cattle and pig slurries) were compared with mineral fertilization. The soils
used in these experiments were C-rich so this factor did not limit N2O production, and the large soil
mineral N contents stimulated the losses of this gas.
3. Modelling the effect of slurry application technique on emissions from grasslands showed that large
proportions of mineral N are lost from slurries by ammonia volatilization when surface broadcast
compared to when injected. When using slurries as fertilizers, shallow injection is recommended
rather than surface broadcast application in order to mitigate indirect losses of N2O and increase the
fraction of mineral N available for plant N uptake.
4. In terms of emission factors, the fraction of N lost as N2O was lower than 1% proposed by IPCC
when fertilizer applications coincided with dry weather conditions and mineral N was limited in soils.
However, under the typical climatic conditions of the Atlantic area, that led optimal WFPS values for
denitrification, losses of N2O derived from fertilization can reach values beyond 1%, especially when
soil mineral N levels are large.
5. Grassland soils in the Atlantic area were sinks of CH4 and mineral fertilizer applications did not
modify soil capacity to CH4 uptake. Similar conclusions were obtained for slurry applications, if the
CH4 emissions observed immediately after slurry application that resulted from the release of the
dissolved CH4 in the slurry were not considered. That denoted that the N applications to soils that

Greenhouse gas fluxes derived from agricultural practices in forage crops in the Atlantic area
186
received N for many years did not modify methanotrophy activity of the microorganisms present in
those soils.
6. Slurry applications did not cause an overall effect in the ecosystem respiration compared to non-
treated or mineral fertilized grassland soils even when the resulting high CO2 emissions observed
immediately after slurry applications were considered. In grassland soils, mineral fertilizers and cattle
slurries caused similar total CO2 equivalents to produce the same yields, so both fertilizers could be
used. However, if the costs of purchasing mineral fertilizers is considered, using injected slurries as
fertilizer would be more beneficial for dairy farmers as animal wastes produced on farms would be
recycled and milk production costs would be reduced.
7. In forage maize soils, organic and mineral fertilizers resulted in similar yield-scaled N2O emissions
(expressed as dry matter or N uptake) . However, they failed to efficiently increase crop yields and
caused high losses of N2O. Thus, the initial soil N contents at the moment of the N application and the
dynamics of soil organic matter mineralization must be considered to adapt N rates to efficiently meet
crop demands, especially in the period between sowing and top dressing application when demands
are small.
7.4. Conclusiones
1. Se observaron grandes variaciones interanuales y estacionales en las emisiones de N2O procedentes
de praderas fertilizadas con fertilizante mineral y aprovechadas por pastoreo con ganado vacuno de
leche. Estas pérdidas estuvieron condicionadas por las variables climáticas y de suelo, pero también
por las diferencias en el manejo del N. Bajo un escenario de futuro cambio climático en Galicia,
previsto por un modelo climático global, una mejora en la gestión del pastoreo podría ayudar a reducir
las pérdidas anuales de N2O derivadas de esta práctica. Los episodios de sequía seguidos de
precipitaciones que humedecen el suelo pueden contribuir de manera significativa a incrementar las
emisiones anuales de N2O de los suelos y, por lo tanto, este hecho justifica seguir investigando en la
identificación de los mecanismos que producen las emisiones del gas en los suelos gallegos.
2. En praderas, la aplicación de purín de vacuno como fertilizante no aumentó de forma significativa
las emisiones de N2O con respecto a la fertilización mineral. Conclusiones similares se obtuvieron
durante el cultivo de maíz forrajero cuando se compararon fertilizantes orgánicos (purín de vacuno y
porcino inyectados) con la fertilización mineral. Los suelos utilizados en los experimentos eran ricos

Greenhouse gas fluxes derived from agricultural practices in forage crops in the Atlantic area
187
en carbono por lo que este factor no limitó las emisiones de N2O, y los elevados contenidos de N
mineral en suelo favorecieron las pérdidas de este gas.
3. La modelización del efecto de la técnica de aplicación de purines en praderas mostró que una gran
proporción del N mineral del purín se pierde por volatilización del amoníaco cuando el purín se
distribuye en superficie en comparación con la inyección. Cuando se aplican purines como
fertilizantes, la inyección superficial es recomendable en lugar de la distribución en superficie con el
fin de mitigar las pérdidas indirectas de N2O y aumentar la fracción de N mineral disponible para la
planta.
4. En cuanto a los factores de emisión, la fracción de N perdido en forma de N2O fue inferior al 1%
propuesto por el IPCC cuando la aplicación de fertilizantes se llevó a cabo en condiciones de sequía y
cuando el N mineral en suelo fue factor limitante. Sin embargo, en condiciones climáticas más típicas
de la zona Atlántica, que propiciaron valores de WFPS óptimos para la desnitrificación, las pérdidas
de N2O alcanzaron valores superiores al 1%, viéndose especialmente favorecidas por las elevadas
cantidades de N mineral en suelo.
5. Los suelos de praderas en la zona Atlántica actuaron como sumideros de CH4 y las aplicaciones de
fertilizantes minerales no modificaron la capacidad del suelo para la captación de CH4. Conclusiones
similares se obtuvieron con la aplicación de purines si no se consideran las emisiones de CH4
producidas inmediatamente tras la aplicación y que fueron atribuidas a la liberación del CH4 disuelto
en el purín. Esto denota que las aplicaciones de N en suelos que recibieron N durante años no
modifican la actividad metanotrófica de los microorganismos presentes en dichos suelos.
6. La aplicación de purines no causó un efecto general en la respiración del ecosistema en
comparación con los suelos de pradera no fertilizados o con aplicación de fertilizante mineral, incluso
cuando se consideraron las elevadas emisiones de CO2 producidas inmediatamente después de la
aplicación del purín. En los suelos de praderas, fertilizantes minerales y purines generaron similares
emisiones equivalentes de CO2 para la obtención de rendimientos de cosechas semejantes, por lo que
ambos fertilizantes podrían ser recomendados. Sin embargo, si se considera el coste de la compra de
fertilizantes, el uso de purines inyectados como fertilizante sería más beneficioso para los productores
de leche ya que las deyecciones generadas en las granjas se reciclarían y los costes de producción de
leche se reducirían.
7. En suelos con maíz forrajero, fertilizantes orgánicos y minerales también propiciaron emisiones
similares de N2O para la obtención de los mismos rendimientos de cultivo (expresado por unidad de
materia seca o N extraído). Sin embargo, no lograron aumentar de manera eficiente los rendimientos
del cultivo y causaron grandes pérdidas de N2O. Por ello es necesario adaptar las dosis de N a las
demandas del cultivo, considerando el contenido inicial de N mineral en el suelo en el momento de la

Greenhouse gas fluxes derived from agricultural practices in forage crops in the Atlantic area
188
aplicación del N así como la dinámica de la mineralización de la materia orgánica del suelo,
especialmente en el período entre la siembra y la aplicación de cobertera donde la demanda del N por
el cultivo es menor.

Greenhouse gas fluxes derived from agricultural practices in forage crops in the Atlantic area
189
REFERENCES

Greenhouse gas fluxes derived from agricultural practices in forage crops in the Atlantic area
190
Abassi, M.K., Kazmi, M., Hussan, F.U., 2005. Nitrogen use efficiency and herbage production of an
established grass sward in relation to moisture and nitrogen fertilization. J. Plant Nutr. 28, 1693-1708.
Abbasi, M.K., Adams, W.A., 2000. Gaseous N emission during simultaneous nirification-
denitrification asociated with mineral N fertilization to a grassland soil under field conditions. Soil
Biol. Biochem., 1251-1259.
Aguerre, M.J., Wattiaux, M.A., Powell, J.M., Broderick, G.A., Arndt, C., 2011. Effect of forage-to-
concentrate ratio in dairy cow diets on emission of methane, carbon dioxide, and ammonia, lactation
performance, and manure excretion. J. Dairy Sci. 94, 3081-3093.
Aires, L.M.I., Pio, C.A., Pereira, J.S., 2008. Carbon dioxide exchange above a Mediterranean C3/C4
grassland during two climatologically contrasting years. Glob. Change Biol. 14, 539-555.
Alves, B.J.R., Smith, K.A., Flores, R.A., Cardoso, A.S., Oliveira, W.R.D., Jantalia, C.P., Urquiaga,
S., Boddey, R.M., 2012. Selection of the most suitable sampling time for static chambers for the
estimation of daily mean N2O flux from soils. Soil Biol. Biochem. 46, 129–135.
Amaral, J.A., Knowles, R., 1994. Methane Metabolism in a Temperate Swamp. Appl. Environ.
Microbiol. 60, 3945-3951.
Anderson, I.C., Poth, M., Homstead, J., Burdige, D., 1993. A comparison of NO and N2O production
by the autotrophic nitrifier Nitrosomonas europaea and the heterotrophic nitrifier Alcaligenes faecalis.
Applied and environmental microbiology 59, 3525-3533.
AOAC, 1990. Association of Official Analytical Chemist, Official Methods of Analysis, 15th ed.
Association of Official Analytical Chemist, Washington, DC.
AOAC, 2000. Official methods of analysis of AOAC. Association of Official Analytical Chemists, 17
ed. Gaithersburg, Maryland, USA.
Ash, A.J., Howden, S.M., McIvor, J.G., 1995. Improved rangeland management and its implications
for carbon sequestration. In: West, N. (Ed.), Rangelands in a sustainable biosphere. Proceedings of the
Fifth International Rangeland Congress, Denver, pp. 19-20.
Avery, B.W., 1980. Soil Classification for England and Wales (Higher Categories). Soil Survey of
England and Wales. Soil Survey Technical Monograph No. 14, Harpenden, UK.
Avrahami, S., Conrad, R., 2005. Cold-temperate climate: a factor for selection of ammonia oxidizers
in upland soil? Can. J. Microbiol. 51, 709-714.

Greenhouse gas fluxes derived from agricultural practices in forage crops in the Atlantic area
191
Bachoon, D., Jones, R.D., 1992. Potential rates of methanogenesis in sawgrass marshes with peat and
marl soils in the Everglades. Soil Biol. Biochem. 24, 21-27.
Báez Bernal, D., Castro Insua, J., López Díaz, J.E., González Arráez, A., García Pomar, M.I., 2008.
Cuantificación de pérdidas y transformaciones de nitrógeno asociadas al vacuno de leche en pastoreo.
In: Pastos, S.E.p.e.E.d.l. (Ed.), Patos, pp. 21-44.
Baggs, E., Rees, R., Smith, K., Vinten, A., 2000. Nitrous oxide emission from soils after
incorporating crop residues. Soil Use Manage. 16, 82-87.
Baggs, E.M., 2008. A review of stable isotope techniques for N2O source partitioning in soils: Recent
progress, remaining challenges and future considerations. Rapid communications in mass
spectrometry 22, 1664-1672.
Baggs, E.M., 2011. Soil microbial sources of nitrous oxide: recent advances in knowledge, emerging
challenges and future direction. Curr. Opin. Environ. Sustain. 3, 321-327.
Baggs, E.M., Chebii, J., Ndufa, J.K., 2006. A short-term investigation of trace gas emissions
following tillage and no-tillage of agroforestry residues in western Kenya. Soil Till. Res. 90, 69–76.
Baird, C., Cann, M., 2012. Environmental Chemistry. Basingstoke, England.
Ball, B.C., Scott, A., Parker, J.P., 1999. Field N2O, CO2 and CH4 fluxes in relation to tillage,
compaction and soil quality in Scotland. Soil Till. Res. 53, 29-39.
Barbeyto Nistal, F., López Garrido, C., 2013. Resultados técnico-económicos das explotacións de
vacún de leite en Galicia 2011. Conselleria do Medio Rural e do Mar-Xunta de Galicia, Santiago de
Compostela, Spain.
Barton, L., Kiese, R., Gatter, D., Butterbach-Bahl, K., Buck, R., Hinz, C., Murphy, D.V., 2008.
Nitrous oxide emissions from a cropped soil in a semi-arid climate. Glob. Change Biol. 14, 177-192.
Barton, L., McLay, C.D.A., Schipper, L.A., Smith, C.T., 1999. Annual denitrification rates in
agricultural and forest soils: a review. Aust. J. Soil Res. 37, 1073-1094.
Bateman, E.J., Baggs, E.M., 2005. Contributions of nitrification and denitrification to N2O emissions
from soils at different water-filled pore space. Biol. Fert. Soils 41, 379-388.
Batjes, N.H., 1999. Management options for reducing CO2-concentrations in the atmosphere by
increasing carbon sequestration in the soil. International Soil Reference and Information Centre,
Wageningen, The Netherlands.

Greenhouse gas fluxes derived from agricultural practices in forage crops in the Atlantic area
192
Battilani, A., Piva, A., Dadomo, M., 1999. Evaluation of the decision support system for irrigation
scheduling of processing tomato adopted in the Emilia-Romagna region. Acta Hort.(ISHS) 487, 507-
511.
Bedard, C., Knowles, R., 1989. Physiology, biochemistry, and specific inhibitors of CH4, NH4+, and
CO oxidation by methanotrophs and nitrifiers. Microbiol. Rev. 53, 68-84.
Bergstermann, A., Cárdenas, L., Bol, R., Gilliam, L., Goulding, K., Meijide, A., Scholefield, D.,
Vallejo, A., Well, R., 2011. Effect of antecedent soil moisture conditions on emissions and
isotopologue distribution of N2O during denitrification. Soil Biol. Biochem. 43, 240-250.
Bodelier, P.L.E., Laanbroek, H.J., 2004. Nitrogen as a regulatory factor of methane oxidation in soils
and sediments. 47, 265–277.
Borken, W., Davidson, E.A., Savage, K., Sundquist, E.T., Steudler, P., 2006. Effect of summer
through fall exclusion, summer drought, and winter snow cover on methane fluxes in a temperate
forest soil. Soil Biol. and Biochem. 38, 1388-1395.
Bossuet, I., Chambaut, H., Le Gall, A., Raison, C., 2006. Study of the distribution of nitrogen surplus
in experimental dairy farms of the Atlantic area. Dairy systems and environment in the Atlantic area.
Proceedings of the final seminar of the Green dairy Proyect. Institute L'Evage, Rennes, France, pp.
67-95.
Bourdin, F., Sakrabani, R., Kibblewhite, M.G., Lanigan, G.J., 2014. Effect of slurry dry matter
content, application technique and timing on emissions of ammonia and greenhouse gas from cattle
slurry applied to grassland soils in Ireland. Agric. Ecosyst. Environ. 188, 122-133.
Bouwman, A.F., 1996. Direct emission of nitrous oxide from agricultural soils. Nutr. Cycl.
Agroecosyst. 46, 53-70.
Bouwman, A.F., Boumans, L.J.M., Batjes, N.H., 2002. Emissions of N2O and NO from fertilized
fields: Summary of available measurement data. Global Biogeochem. Cy. 16, 6-1-6-13.
Braker, G., Conrad, R., 2011. Diversity, structure, and size of N2O-producing microbial communities
in soils—what matters for their functioning? Adv. Appl. Microbiol. 75, 33-70.
Bremner, J., 1997. Sources of nitrous oxide in soils. Nutr. Cycl. Agroecosyst. 49, 7-16.
Buchmann, N., 2000. Biotic and abiotic factors controlling soil respiration rates in Picea abies stands.
Soil Biol.Biochem. 32, 1625-1635.

Greenhouse gas fluxes derived from agricultural practices in forage crops in the Atlantic area
193
Burchill, W., Li, D., Lanigan, G.J., Williams, M., Humphreys, J., 2014. Interannual variation in
nitrous oxide emissions from perennial ryegrass/white clover grassland used for dairy production.
Glob. Change Biol. 20, 3137-3146.
Burke, F., O'Donovan, M.A., Murphy, J.J., O'Mara, F.P., Mulligan, F.J., 2008. Effect of pasture
allowance and supplementation with maize silage and concentrates differing in crude protein
concentration on milk production and nitrogen excretion by dairy cows. Livest. Sci. 114, 325-335.
Bussink, D.W., Oenema, O., 1998. Ammonia volatilization from dairy farming systems in temperate
areas: a review. Nutr. Cycl. Agroecosys. 51, 19-33.
Cai, Y., Ding, W., Luo, J., 2012. Spatial variation of nitrous oxide emission between interrow soil and
interrow plus row soil in a long-term maize cultivated sandy loam soil. Geoderma 181–182, 2–10.
Cameron, K.C., Di, H.J., McLaren, R.G., 1997. In soil an appropriate dumping ground for our wastes?
Australian journal of soil research 35, 995-1035.
Cameron, K.C., Di, H.J., Moir, J.L., 2013. Nitrogen losses from the soil/plant system: a review. Ann.
Appl. Biol. 162, 145-173.
Cannavo, P., Richaume, A., Lafolie, F., 2004. Fate of nitrogen and carbon in the vadose zone: in situ
and laboratory measurements of seasonal variations in aerobic respiratory and denitrifying activities.
Soil Biol. Biochem. 36, 463–478.
CAP, 2010. Asesoramento técnico-económico en explotacións de vacún de leite. IV Xornadas
Técnicas. Cooperativa Agraria Provincial de A Coruña INGACAL, Abegondo. .
Cardenas, L.M., Thorman, R., Ashlee, N., Buttler, M., Chadwick, D., Chambers, B., Cuttle, S.,
Donovan, N., Kingston, H., Lane, S., Dhanoa, M.S., Scholefield, D., 2010. Quantifying annual N2O
emissions fluxes from grazed grasslands under a range of inorganic fertilizer nitrogen inputs. Agric.
Ecosyst. Environ. 136, 218-226.
Carran, R.A., Ball, P.R., Theobald, P.W., Collins, M.E.G., 1982. Soil nitrogen balances in urine-
affected areas under two moisture regimes in Southland. New Zeal. J. Exp. Agr. 10, 377-381.
Chadwick, D., 1997. Nitrous oxide and ammonia emissions from grasslands following applications of
slurry: potential abatement practices. In: Jarvis, S.C., Pain, B.F. (Eds.), Gaseous nitrogen emissions
from grasslands, Wallingford, UK.

Greenhouse gas fluxes derived from agricultural practices in forage crops in the Atlantic area
194
Chadwick, D., Sommer, S., Thorman, R., Fangueiro, D., Cardenas, L., Amon, B., Misselbrook, T.,
2011. Manure management: Implications for greenhouse gas emissions. Anim. Feed Sci. Tech. 166-
167, 514-531.
Chadwick, D.R., Cardenas, L., Misselbrook, T.H., Smith, K.A., Rees, R.M., Watson, C.J.,
McGeough, K.L., Williams, J.R., Cloy, J.M., Thorman, R.E., Dhanoa, M.S., 2014. Optimizing
chamber methods for measuring nitrous oxide emissions from plot-based agricultural experiments.
Eur. J. Soil Sci. 65, 295-307.
Chadwick, D.R., Pain, B.F., 1997. Methane fluxes following slurry applications to grassland soils:
laboratory experiments. Agric. Ecosyst.Environ. Qual. 63, 51-60.
Chadwick, D.R., Pain, B.F., Brookman, S.K.E., 2000. Nitrous oxide and methane emissions following
application of animal manures to grassland. J. Environ. Qual. 29, 277-287.
Chan, A., Parkin, T., 2001. Effect of land use on methane flux from soil. J. Environ. Qual. 30, 786-
797.
Chantigny, M.H., Rochette, P., Angers, D.A., 2001. Short-term C and N dynamics in a soil amended
with pig slurry and barley straw: a field experiment. Can. J. Soil Sci. 81, 131-137.
Chantigny, M.H., Rochette, P., Angers, D.A., Bittman, S., Buckley, K., Masse, D., Belanger, G.,
Erisksen-Hamel, N., Gasser, M.O., 2010. Soil nitrous oxide emissions following band-incorporation
of fertilizer nitrogen and swine manure. J. Environ. Qual. 39, 1545-1553.
Clayton, H., McTaggart, I.P., Parker, J., Swan, L., Smith, K.A., 1997. Nitrous oxide emissions from
fertilised grassland: A 2-year study of the effects of N fertiliser form and environmental conditions.
Biol. Fert. Soils 25, 252-260.
Collins, H.P., Alva, A.K., Streubel, J.D., Fransen, S.F., Frear, C., Chen, S., Kruger, C., Granatstein,
D., 2011. Greenhouse gas emissions from an irrigated silt loam soil amended with anaerobically
digested dairy manure. Soil Sci. Soc. Am. J. 75, 2206-2216.
Conrad, R., 2005. Quantification of methanogenic pathways using stable carbon isotopic signatures: a
review and a proposal. Org. Geochem. 36, 739-752.
Cookson, W.R., Cornforth, I.S., Rowarth, J.S., 2002. Winter soil temperature (2–15 C) effects on
nitrogen transformations in clover green manure amended or unamended soils; a laboratory and field
study. Soil Biol. Biochem. 34, 1401-1415.

Greenhouse gas fluxes derived from agricultural practices in forage crops in the Atlantic area
195
Čuhel, J., Šimek, M., Laughlin, R.J., Bru, D., Chèneby, D., Watson, C.J., Philippot, L., 2010. Insights
into the effect of soil pH on N2O and N2 emissions and denitrifier community size and activity. Appl.
Environ. Microbiol. 76, 1870-1878.
Curtin, D., Wang, H., Selles, F., McConkey, B.G., Campbell, C.A., 2000. Tillage effects on carbon
fluxes in continuous wheat and fallow-wheat rotations. Soil Sci. Soc. Am. J. 64, 2080-2086.
Damdreville, C., Morvan, T., Germon, J.C., 2008. N2O emission in maize-crops fertilized with pig
slurry, matured pig manure or ammonium nitrate in Brittany. Agric. Ecosyst. Environ. 123, 201–210.
Davidson, E.A., 1991. Fluxes of nitrous oxide and nitric oxide from terrestrial ecosystems. In: Rogers,
J.E., Whitman, W.B. (Eds.), Microbial production and consumption of greenhouse gases: methane,
nitrogen oxides, and halomethanes. American Society of Microbiology, Washington DC, USA, pp.
219-235.
Davidson, E.A., 1993. Soil water content and the ratio of nitrous oxide to nitric oxide emitted from
soil. In: Oremland, R.S. (Ed.), Biogeochemistry of Global Change. Chapman and Hall, Inc, London,
pp. 369-386.
Davidson, E.A., Verchot, L.V., Cattânio, J.H., Ackerman, I.L., Carvalho, J.E.M., 2000. Effects of soil
water content on soil respiration in forests and cattle pastures of eastern Amazonia. Biogeochemistry
48, 53-69.
de Klein, C., Harvey, M., 2012. Nitrous oxide chamber methodology guidelines. Ministry for Primary
Industries, Wellington
de Klein, C.A.M., Cameron, K.C., Di, H.J., Rys, G., Monaghan, R.M., Sherlock, R.R., 2011.
Repeated annual use of the nitrification inhibitor dicyandiamide (DCD) does not alter its effectiveness
in reducing N2O emissions from cow urine. Anim. Feed Sci. Tech. 166–167, 480-491.
de Klein, C.A.M., Sherlock, R.R., Cameron, K.C.v.d.W., T.J., 2001. Nitrous oxide emissions from
agricultural soils in New Zealand-a review of current knowledge and directions of future research.
Journal of the Royal Society of New Zealand 31, 543-574.
de Klein, C.A.M., Smith, L.C., Monaghan, R.M., 2006. Restricted autumn grazing to reduce nitrous
oxide emissions from dairy pastures in Southland, New Zealand. Agric. Ecosyst. Environ. 112, 192-
199.

Greenhouse gas fluxes derived from agricultural practices in forage crops in the Atlantic area
196
de Klein, C.A.M., van Logtestijn, R.S.P., 1996. Denitrification in grassland soils in the Netherlands in
relation to irrigation, N-application rate, soil water content and soil temperature. Soil Biol. Biochem.
28, 231–237.
Dedysh, S.N., Belova, S.E., Bodelier, P.L., Smirnova, K.V., Khmelenina, V.N., Chidthaisong, A.,
Trotsenko, Y.A., Liesack, W., Dunfield, P.F., 2007. Methylocystis heyeri sp. nov., a novel type II
methanotrophic bacterium possessing 'signature' fatty acids of type I methanotrophs. Int. J. Syst. Evol.
Microbiol. 57, 472-479.
Dedysh, S.N., Khmelenina, V.N., Suzina, N.E., Trotsenko, Y.A., Semrau, J.D., Liesack, W., Tiedje,
J.M., 2002. Methylocapsa acidiphila gen. nov., sp. nov., a novel methane-oxidizing and dinitrogen-
fixing acidophilic bacterium from Sphagnum bog. Int. J. Syst. Evol. Microbiol. 52, 251-261.
DEFRA, 2009. https://www.gov.uk/government/collections/agri-environment-analysis (Access on
7/03/2015).
Del Grosso, S.J., Parton, W.I., Mosier, A.R., Ojima, D.S., Potter, C.S., Borken, W., Brumme, R.,
Butterbach-Bahl, K., Crill, P.M., Dobbie, K., Smith, K.A., 2000. General CH4 oxidation model and
comparisons of CH4 oxidation in natural and managed systems. Global Biochem. Cy. 14, 999-1019.
Dell, C.J., Meisinger, J.J., Beegle, D.B., 2011. Subsurface application of manures slurries for
conservation tillage and pasture soils and their impact on the nitrogen balance. J. Environ. Qual. 40,
352-361.
Dhanoa, M., Lister, S., France, J., Barnes, R., 1999. Use of mean square prediction error analysis and
reproducibility measures to study near infrared calibration equation performance. J. Near Infrared.
Spectrosc. 7, 133-143.
Di, H.J., Cameron, K.C., 2002. The use of a nitrification inhibitor, dicyandiamide (DCD), to decrease
nitrate leaching and nitrous oxide emissions in a simulated grazed and irrigated grassland. Soil Use
Manage. 18, 395-403.
Di, H.J., Cameron, K.C., 2003. Mitigation of nitrous emissions in spray-irrigated grazed grasslands by
treating the soil with dicyandiamide, a nitrification inhibitor. Soil use and management 19, 284-290.
Di, H.J., Cameron, K.C., 2012. How does the application of different nitrification inhibitors affect
nitrous oxide emissions and nitrate leaching from cow urine in grazed pastures? Soil Use Manage. 28,
54-61.

Greenhouse gas fluxes derived from agricultural practices in forage crops in the Atlantic area
197
Di, H.J., Cameron, K.C., Moore, S., Smith, N.P., 1998. Nitrate leaching and pasture yields following
the application of dairy shed effluent or ammonium fertilizer under spray or flood irrigation: results of
a lysimeter study. Soil Use Manage. 14, 209-214.
Dick, J., Skiba, U.M., Wilson, J., 2001. The effect of rainfall on NO and N2O emissions from
Ugandan agroforest soils. Phyton-Annales Rei Botanicae 41, 73-80.
Dobbie, K.E., McTaggart, I.P., Smith K, A., 1999. Nitrous oxide emissions from intensive agricultural
systems: variations between crops and seasons, key driving variables and mean emission factors. J.
Geophys. Res. 104, 26891- 26899.
Dobbie, K.E., Smith, K.A., 1996. Comparison of CH4 oxidation rates in woodland, arable and set
aside soils. Soil Biol. Biochem. 28, 1357-1365.
Dobbie, K.E., Smith, K.A., 2001. The effects of temperature, water-filled pore space and land use on
N2O emissions from an imperfectly drained gleysol. Eur. J. Soil Sci. 52, 667-673.
Dobbie, K.E., Smith, K.A., 2003. Nitrous oxide emission factors for agricultural soils in Great Britain:
the impact of soil water‐filled pore space and other controlling variables. Glob. Change Biol. 9, 204-
218.
Doltra, J., Olesen, J.E., Báez, D., Louro, A., Chirinda, N., 2015. Modeling nitrous oxide emissions
from organic and conventional cereal-based cropping systems under different management, soil and
climate factors. Eur. J. Agron. 66, 8-20.
Dosch, P., Gutser, R., 1996. Reducing N losses (NH3, N2O, N2) and immobilization from slurry
through optimized application techniques. In: Rodriguez-Barrueco, C. (Ed.), Fertilizers and
Environment. Springer Netherlands, pp. 283-289.
Drewry, J.J., Cameron, K.C., Bucham, G.D., 2008. Pasture yield and soil physical property responses
to soil compaction from treading and grazing: a review. Australian Journal of Soil Research, 237-256.
Drury, C.F., Reynolds, W.D., Tan, C.S., McLaughlin, N.B., Yang, X.M., Calder, W., Oloya, T.O.,
Yang, J.Y., 2014. Impacts of 49–51 years of fertilization and crop rotation on growing season nitrous
oxide emissions, nitrogen uptake and corn yields. Can. J. Soil Sci. 94, 421-433.
Du, Q., Liu, H., Feng, J., Wang, L., Huang, J., Zhang, W., Bernhofer, C., 2012. Carbon dioxide
exchange processes over the grassland ecosystems in semiarid areas of China. Sci. China Earth Sci.
55, 644-655.

Greenhouse gas fluxes derived from agricultural practices in forage crops in the Atlantic area
198
Dunfield, P., Knowles, R., Dumont, R., Moore, T.R., 1993. Methane production and consumption in
temperate and subarctic peat soils: response to temperature and pH. Soil Biol. Biochem. 25, 321-326.
Dunfield, P.F., 2007. The soil methane sink. In: Reay, D., Hewitt, C.N., Smith, K., Grace, J. (Eds.),
Grenouse gas sinks. CAB International, Wallinford, pp. 152-170.
Eckard, R.J., Grainger, C., de Klein, C.A.M., 2010. Options for the abatement of methane and nitrous
oxide from ruminant production: A review. Livest. Sci. 130, 47-56.
EEA, 2012. Climate change, impacts and vulnerability in Europe 2012. An indicator-based report.
European Environment Agency, Copenhagen.
Ellis, S., Yamulki, S., Dixon, E., Harrison, R., Jarvis, S.C., 1998. Denitrification and N2O emissions
from a UK pasture following the early spring application of cattle slurry and mineral fertilizer. Plant
Soil, 15-25.
Erisman, J.W., Galloway, J.N., Seitzinger, S., Bleeker, A., Dise, N.B., Petrescu, A.M.R., Leach,
A.M., de Vries, W., 2013. Consequences of human modification of the global nitrogen cycle. Phil
Trans R Soc B 368.
Estavillo, J.M., Rodriguez, M., Domingo, M., Muñoz-Rueda, A., Gonzalez-Murua, C., 1994.
Denitrification losses from a natural grassland in the Basque Country under organic and inorganic
fertilization. Plant Soil 162, 19-29.
Estavillo, J.M., Rodriguez, M., Gonzalez-Murua, C., 1995. Nitrogen losses by denitrification and
leaching in grassland. Fert. Res. 43, 197-201.
ESYRCE, 2013. Encuestas sobre superficies y rendimientos de cultivos. Resultados nacionales y
autonómicos. Ministerio de Agricultura, Alimentación y Medioambiente (MAGRAMA), Madrid,
Spain.
EUROSTAT, 2013. Agriculture, forestry and fishery statistics. In: Covette, C., Herta Schenk, H.
(Eds.). European Union, Luxembourg, p. 249.
Falge, E., Baldocchi, D., Tenhunen, J., Aubinet, M., Bakwin, P., Berbigier, P., Bernhofer, C., Burba,
G., Clement, R., Davis, K.J., 2002. Seasonality of ecosystem respiration and gross primary production
as derived from FLUXNET measurements. Ag. Forest Meteoro. 113, 53-74.
Fangueiro, D., Chadwick, D., Dixon, L., Bol, R., 2007. Quantification of the priming and CO2
emissions sources following the application of different slurry particle size to a grassland soil. Soil
Biol. Biochem. 39, 2608-2620.

Greenhouse gas fluxes derived from agricultural practices in forage crops in the Atlantic area
199
Fangueiro, D., Coutinho, J., Chadwick, D., Moreira, N., Trindade, H., 2008a. Effect of cattle slurry
separation on greenhouse gas and ammonia emissions during storage. J. Environ. Qual. 37, 2322–
2331.
Fangueiro, D., Senbayran, M., Trinidade, H., Chadwick, D., 2008b. Cattle slurry treatment by screw
press separation and chemically enhanced settling: effect on greenhouse gas emissions after land
spreading and grass yield. Bioresource Technol. 99, 7132-7142.
FAOSTAT, 2013. FAOSTAT database, Food and Agriculture Organization of the United Nations.
http://faostat.fao.org/.
Fernández, J., Curt, D., Aguado, P.L., Esteban, B., Sánchez, J., Checa, M., Mosquera, F., Romero, L.,
2011. Caracterización de las comarcas agrarias de España. Tomo 2. Provincia de A Coruña.
Ministerio de Medio Ambiente Medio Rural y Marino, Madrid, Spain.
Firestone, M.K., Davidson, E.A., 1989. Microbiological basis of NO and N2O production and
consumption in soil. In: Andrae, M.O., Schimel, D.S. (Eds.), Exchange of trace gases between
terrestrial ecosystems and the atmosphere, Wiley, New York, pp. 7–21.
Flechard, C.R., Ambus, P., Skiba, U., Rees, R.M., Hensen, A., van Amstel, A., Dasselaar, A.v.d.P.-v.,
Soussana, J.F., Jones, M., Clifton-Brown, J., Raschi, A., Horvath, L., Neftel, A., Jocher, M.,
Ammann, C., Leifeld, J., Fuhrer, J., Calanca, P., Thalman, E., Pilegaard, K., Di Marco, C., Campbell,
C., Nemitz, E., Hargreaves, K.J., Levy, P.E., Ball, B.C., Jones, S.K., van de Bulk, W.C.M., Groot, T.,
Blom, M., Domingues, R., Kasper, G., Allard, V., Ceschia, E., Cellier, P., Laville, P., Henault, C.,
Bizouard, F., Abdalla, M., Williams, M., Baronti, S., Berretti, F., Grosz, B., 2007. Effects of climate
and management intensity on nitrous oxide emissions in grassland systems across Europe. Agric.
Ecosyst. Environ. 121, 135-152.
Flessa, H., Beese, F., 2000. Laboratory estimates of trace gas emissions following surface application
and injection of cattle slurry. J. Environ. Qual. 29, 262-268.
Flessa, H., Dörsch, P., Beese, F., 1995. Seasonal variation of N2O and CH4 fluxes in differently
managed arable soils in southern Germany. J. Geophys. Res. Atmos. 100, 23115-23124.
Forster, P., Ramaswamy, V., Artaxo, P., Berntsen, T., Betts, R., Fahey, D.W., Haywood, J., Lean, J.,
Lowe, D.C., Myhre, G., Nganga, J., Prinn, R., Raga, G., Schulz, M., Van Dorland, R., 2007. Changes
in Atmospheric Constituents and in Radiative Forcing. In: Solomon, S., Qin, D., Manning, M., Chen,
Z., Marquis, M., Averyt, K.B., Tignor, M., Miller, H.L. (Eds.), Climate Change 2007: The Physical
Science Basis. Contribution of Working Group I to the Fourth Assessment Report of the

Greenhouse gas fluxes derived from agricultural practices in forage crops in the Atlantic area
200
Intergovernmental Panel on Climate Change. Cambridge University Press, Cambridge, United
Kingdom and New York, NY, USA.
Fowler, D., Coyle, M., Skiba, U., Sutton, M.A., Cape, J.N., Reis, S., Sheppard, L.J., Jenkins, A.,
Grizzetti, B., Galloway, J.N., Vitousek, P., Leach, A., Bouwman, A.F., Butterbach-Bahl, K.,
Dentener, F., Stevenson, D., Amann, M., Voss, M., 2013. The global nitrogen cycle in the twenty-first
century. Phil Trans R Soc B 368.
Gagnon, B., Ziadi, N., Rochette, P., Chantigny, M.H., Angers, D.A., 2011. Fertilizer source
influenced nitrous oxide emissions from a clay soil under corn. Soil Science Society of American
Journal 75, 595-604.
Galloway, J.N., Dentener, F.J., Capone, D.G., Boyer, E.W., Howarth, R.W., Seitzinger, S.P., Asner,
G.P., Cleveland, C.C., Green, P.A., Holland, E.A., Karl, D.M., Michaels, A.F., Porter, J.H.,
Townsend, A.R., Vöosmarty, C.J., 2004. Nitrogen cycles: past, present, and future. Biogeochemistry
70, 153-226.
García-Pomar, M.I., Báez-Bernal, D., Castro Insua, J., Louro-López, A., 2012. Axuste das
recomendacions de fertilizacion no millo forraxeiro para as condicións galegas. AFRIGA, pp. 130-
136.
Génermont, S., Cellier, P., 1997. A mechanistic model for estimating ammonia volatilization from
slurry applied to bare soil. Agric. For. Meteorol. 88, 145-167.
Gilmanov, T.G., Johnson, D.A., Saliendra, N.Z., 2003. Growing season CO2 fluxes in a sagebrush-
steppe ecosystem in Idaho: Bowen ratio/energy balance measurements and modeling. Basic Appl.
Ecol. 4, 167-183.
Goebel, M.-O., Bachmann, J., Woche, S.K., Fischer, W.R., 2005. Soil wettability, aggregate stability,
and the decomposition of soil organic matter. Geoderma 128, 80-93.
Groffman, P.M., Tiedje, J.M., Robertson, G.P., Christensen, S., 1988. Denitrification at different
temporal and geographical scales:proximal and distal controls. In: Wilson, J.R. (Ed.), Advances in
Nitrogen Cycling in Agricultural Systems. CAB International, Wallingford, UK, pp. 174-192.
Halvorson, A.D., Del Grosso, S.J., Alluvione, F., 2010. Nitrogen source effects on nitrous oxide
emissions from irrigated no-till corn. J. Environ. Qual. 39, 1554-1562.

Greenhouse gas fluxes derived from agricultural practices in forage crops in the Atlantic area
201
Hansen, S., Bernard, M.-E., Rochette, P., Whalen, J., Dörsch, P., 2014. Nitrous oxide emissions from
a fertile grassland in Western Norway following the application of inorganic and organic fertilizers.
Nutr.Cycl. Agroecosys. 98, 71-85.
Hardy, J.T., 2003. Climate change: causes, effects, and solutions. John Wiley & Sons.
Harrod, T.R., Hogan, D.V., 1981. The Soils of North Wyke and Rowden. Unpublished Report to
North Wyke Research, Revised Edition of Original Report by TR Harrod, Soil Survey of England and
Wales.
Hartmann, T.E., Yue, S., Schulz, R., Chen, X., Zhang, F., Müller, T., 2014. Nitrogen dynamics,
apparent mineralization and balance calculations in a maize – wheat double cropping system of the
North China Plain. Field Crops Res. 160, 22-30.
Haynes, R.J., Williams, P.H., 1993. Nutrient cycling and soil fertility in the grazed pasture ecosystem.
Adv. Agron. 49, 119-199.
Houghton, R.A., 2007. Balancing the global carbon budget. Annu. Rev. Earth Planet. Sci. 35, 313-
347.
Huijsmans, J.F.M., Hol, J.M.G., Hendriks, M.M.W.B., 2001. Effect of application technique, manure
characteristics, weather and field conditions on ammonia volatilization from manure applied to
grassland. NJAS-Wagen. J. Life Sc. 49, 323-342.
Huijsmans, J.F.M., Hol, J.M.G., Vermeulen, G.D., 2003. Effect of application method, manure,
characterisitcs, weather and field conditions on ammonia volatilization from manure applied to arable
land. Atmos. Environm. 37, 3669-3680.
Hütsch, B.W., Mengel, K., Russell, P., 1996. CH4 oxidation in two temperate arable soils as affected
by nitrate and ammonium application. Biol. Fert. Soils 23, 86-92.
Hyde, B.P., Hawkins, M.J., Fanning, A.F., Noonan, D., Ryan, M., O'Toole, P.O., Carton, O.T., 2006.
Nitrous oxide emissions from a fertilized and grazed grassland in the South East of Ireland. Nutr.
Cycl. Agroecosyst. 75, 187–200.
Hynšt, J., Šimek, M., Brůček, P., Petersen, S.O., 2007. High fluxes but different patterns of nitrous
oxide and carbon dioxide emissions from soil in a cattle overwintering area. Agric. Ecosyst. Environ.
120, 269-279.

Greenhouse gas fluxes derived from agricultural practices in forage crops in the Atlantic area
202
IPCC, 2006. 2006 IPCC Guidelines for National Greenhouse Gas Inventories, Prepared by the
National Greenhouse Gas Inventories Programme. Agriculture, Forestry and Other Land Use, volume
4. In: Eggleston H.S., B.L., Miwa K., Ngara T.,Tanabe K. (Ed.). IGES, Japan.
IPCC, 2007. Climate change 2007: The physical science basis. Contribution of working group I to the
fourth assessment report of the intergovernmental panel on ckimate change. In: Solomon, S., Qin, D.,
Manning, M., Chen, Z., Marquis, M., Averyt, M., Tignor, M., Miller, H.L. (Eds.), Cambrigde (United
Kingdom) and New York (USA).
IPCC, 2014. Climate Change 2014: Mitigation of Climate Change. Contribution of Working Group
III to the Fifth Assessment Report of the Intergovernmental Panel on Climate Change. Cambridge
University Press, Cambridge, United Kingdom and New York, NY, USA.
Jarecki, M.K., Parkin, T.B., Chan, A.S., Hatfield, J.L., Jones, R., 2008. Greenhouse gas emissions
from two soils receiving nitrogen fertilizer and swine manure slurry. J. Environ. Qual. 37, 1432-1438.
Jarvis, S., Hutchings, N., Brentrup, F., Olesen, J.E., van de Hoek, K.W., 2011. Nitrogen flows in
farming systems across Europe. In: Sutton, M.A., Howard, C.M., Erisman, J.W., Billen, G., Bleeker,
A., Grennfelt, P., van Grinsven, H., Grizzetti, B. (Eds.), The European Nitrogen Assessment.
Cambridge University Press, pp. 228-211.
Jarvis, S.C., Scholefield, D., Pain, B.F., 1995. Nitrogen cycling in grazing systems. In: Bacon, P.E.
(Ed.), Nitrogen fertilization in the environment. Marcel Dekker, New York, USA, pp. 381-419.
Jollie, D.R., Lipscomb, J.D., 1991. Formate dehydrogenase from Methylosinus trichosporium OB3b.
Purification and spectroscopic characterization of the cofactors. J. Biol. Chem. 266, 21853-21863.
Jones, S.K., Rees, R.M., Kosmas, D., Ball, B.C., Skiba, U.M., 2006. Carbon sequestration in a
temperate grassland; management and climatic controls. Soil Use Manage. 22, 132-142.
Jones, S.K., Rees, R.M., Skiba, U.M., Ball, B.C., 2005. Greenhouse gas emissions from a managed
grassland. Global Planet. Change 47, 201-211.
Jones, S.K., Rees, R.M., Skiba, U.M., Ball, B.C., 2007. Influence of organic and mineral N fertiliser
on N2O fluxes from a temperate grassland. Agric. Ecosyst. Environ. 121, 74-83.
Jørgensen, R.N., Jørgensen, B.J., Nielsen, N.E., 1998. N2O emission immediately after rainfall in a
dry stubble field. Soil Biol. Biochem. 30, 545-546.

Greenhouse gas fluxes derived from agricultural practices in forage crops in the Atlantic area
203
Kammann, C., Grünhage, L., Müller, C., Jacobi, S., Jäger, H.-J., 1998. Seasonal variability and
mitigation options for N2O emissions from differently managed grasslands. Environ. Pollut. 102, 179-
186.
Khan, S.A., Mulvaney, R.L., Hoeft, R.G., 2001. A simple soil test for detecting sites that are
nonresponsive to nitrogen fertilization. Soil Sci. Soc. Am. J. 65, 1751-1760.
Kim, D.-G., Mishurov, M., Kiely, G., 2010. Effect of increased N use and dry periods on N2O
emission from a fertilized grassland. Nutr. Cycl. Agroecosyst. 88, 397-410.
King, G.M., Schnell, S., 1994. Effect of increasing atmospheric methane concentration on ammonium
inhibition of soil methane consumption. Nature 370, 282-284.
Klapwyk, J.H., Ketterings, Q.M., 2006. Soil tests for predicting corn response to nitrogen fertilizer in
New York. Agron. J. 98, 675-681.
Knowles, R., Topp, E., 1988. Some factors affecting nitrification and the production of nitrous oxide
by the methanotrophic bacterium Methylosinus trichosporium OB3b. . In: Giovannozzi-Sermanni, G.,
Nannipieri, P. (Eds.), Current perspectives in environmental biogeochemistry. Consiglio Nazionale
delle Ricerche-I.P.R.A., Rome, Italy, pp. 383-393.
Kool, D.M., Dolfing, J., Wrage, N., Van Groenigen, J.W., 2011. Nitrifier denitrification as a distinct
and significant source of nitrous oxide from soil. Soil Biol. Biochem. 43, 174-178.
Koppen, W., 1931. Grundriss der Klimakunder. Walter der Gruyter, Berlin.
Kumaraswamy, S., Ramakrishnan, B., Sethunathan, N., 2001. Methane production and oxidation in an
anoxic rice soil as influenced by inorganic redox species. J. Environ. Qual. 30, 2195-2201.
Kuzyakov, Y., Bol, R., 2006. Sources and mechanisms of priming effect induced in two grassland
soils amended with slurry and sugar. Soil Biol. Biochem. 38, 747-758.
Kyveryga, P.M., Blackmer, A.M., Ellsworth, J.W., Isla, R., 2004. Soil pH effects on nitrification of
fall-applied anhydrous ammonia. Soil Sci. Soc. Am. J. 68, 545-551.
Lambers, H., Chapin, F.S., Pons, T.L., 1998. Plant physiological ecology. Springer-Verlag New York.
Lampe, C., Dittert, K., Sattelmacher, B., Wachendorf, M., Loges, R., Taube, F., 2006. Sources and
rates of nitrous oxide emissions from grazed grassland after application of 15N-labelled mineral
fertilizer and slurry. Soil Biol. Biochem. 38, 2602-2613.

Greenhouse gas fluxes derived from agricultural practices in forage crops in the Atlantic area
204
Lantinga, E.A., Keuning, J.A., Groenwold, J., Deenen, P.J.A.G., 1987. Distribution of excreted
nitrogen by grazing cattle and its effects on sward quality, herbage production and utilization. In: Van
Der Meer, H.G., Unwin, R.J., Van Dijk, T.A., Ennik, G.C. (Eds.), Animal Manure on Grassland and
Fodder Crops. Fertilizer or Waste? Springer Netherlands, pp. 103-117.
Lawrence, J.R., Ketterings, Q.M., Goler, M.G., Cherney, J.H., Cox, W.J., Czymmek, K.J., 2009.
Illinois soil nitrogen test with organic matter correction for predicting nitrogen responsiveness of corn
in rotation. Soil Sci. Soc. Am. J. 73, 303-311.
Le Mer, J., Rogert, P., 2001. Production, oxidation, emission and consumption of methane by soils: a
review. J. Soil Biol. 37, 25-50.
Lesschen, J.P., van den Berg, M., Westhoek, H.J., Witzke, H.P., Oenema, O., 2011a. Greenhouse gas
emission profiles of European livestock sectors. Anim. Feed Sci. Technol. 166–167, 16-28.
Lesschen, J.P., Velthof, G.L., de Vries, W., Kros, J., 2011b. Differentiation of nitrous oxide emission
factors for agricultural soils. Environ. Pollut. 159, 3215-3222.
Li, D., Watson, C.J., Yan, M.J., Lalor, S., Rafique, R., Hyde, B.L., G., Richards, K.G., Holden, N.M.,
Humphreys, J., 2013. A review of nitrous oxide mitigation by farm nitrogen management in temperate
grassland-based agriculture. Journal of Environmental Management 128, 893-903.
Linn, D.M., Doran, J.W., 1984. Effect of water-filled pore space on carbon dioxide and nitrous oxide
in filled and non-filled soils. Soil Sci. Soc. Am. J. 48, 1267-1272.
Loecke, T.D., Cambardella, C.A., Liebman, M., 2012. Synchrony of net nitrogen mineralization and
maize nitrogen uptake following applications of composted and fresh swine manure in the Midwest
U.S. Nutr. Cycl. Agroecosyst 93, 65-74.
López-Fernández, S., Díez, J.A., Hernáiz, P., Arce, A., García-Torres, L., Vallejo, A., 2007. Effects of
fertiliser type and the presence or absence of plants on nitrous oxide emissions from irrigated soils.
Nutr. Cycl. Agroecosyst. 78, 279-289.
Louro, A., Báez, D., García, M.I., Cárdenas, L., 2015. Nitrous oxide emissions from forage maize
production on a Humic Cambisol fertilized with mineral fertilizer or slurries in Galicia, Spain.
Geoderma Regional 5, 54-63.
Louro, A., Sawamoto, T., Chadwick, D., Pezzolla, D., Bol, R., Baez, D., Cardenas, L., 2013. Effect of
slurry and ammonium nitrate application on greenhouse gas fluxes of a grassland soil under atypical
South West England weather conditions. Agric. Ecosyst. Environ. 181, 1-11.

Greenhouse gas fluxes derived from agricultural practices in forage crops in the Atlantic area
205
Luo, J., Ledgard, S.F., Lindsey, S.B., 2008. A test of a winter farm management option for mitigating
nitrous oxide emissions from a dairy farm. Soil use manage. 24, 121-130.
Luo, J., Ledgard, S.F., Lindsey, S.B., 2013. Nitrous oxide and greenhouse gas emissions from grazed
pastures as affected by use of nitrification inhibitor and restricted grazing regime. Science of the Total
Environment 465, 107-114.
Luo, J., Tillman, R.W., Ball, P.R., 1999. Grazing effects on denitrification in a soil under pasture
during two contrasting seasons. Soil Biol. Biochem. 31, 903-912.
Luo, J., Tillman, R.W., Ball, P.R., 2000. Nitrogen loss through denitrification in a soil under pasture
in New Zealand. Soil Biol. Biochem. 32, 497-509.
Luo, Y., Zhou, X., 2006. Soil respiration and the environment. Academic press, Burlington, USA.
Ma, B.L., Dwyer, L.M., Gregorich, E.G., 1999. Soil nitrogen amendment effects on seasonal nitrogen
mineralization and nitrogen cycling in maize production. Agron. J. 91, 1003-1009.
Maag, M., Vinther, F.P., 1999. Effect of temperature and water on gaseous emissions from soils
treated with animal slurry. Soil Sci. Soc. Am. J. 63, 858-865.
MacDonald, P., Edwards, R., Greenhalgh, J., Morgan, C., 2002. Animal Nutrition. Prentice Hall,
Upper Saddle River, NJ, USA.
MAGRAMA, 2012. Inventario de gases de efecto invernadero de España 1999-2010. Sumario de
resultados. Ministerio de Agricultura, Alimentación y Medioambiente, Madrid, Spain.
MAGRAMA, 2013. Anuario de estadística agraria 2012. Ministerio de Agricultura, Alimentación y
Medio Ambiente, Madrid, Spain.
MAGRAMA, 2015. Inventario de gases de efecto invernadero de España. Serie 1990-2013. Sumario
de resultados. Ministerio de Agricultura, Alimentacion y Medio Ambiente. Secretaria de Estado de
Medio Ambiente. DG. de Calidad y Evaluacion Ambiental y Medio Rural. S.G. de Calidad del Aire y
Medio Ambiente Industrial, Madrid, Spain.
Martínez de la Torre, A., Miguez-Macho, G., 2009. Modelización dun escenario de fururo de cambio
climático en Galicia In: Consellería de Medio Ambiente e Desenvolvemento Sostible (Ed.),
Evidencias e Impactos do Cambio Climático en Galicia. Xunta de Galicia pp. Chapter 26, 543-560.
McCarty, P.L., 1982. Anaerobic Digestion 1981. Elsevier Biomedical Press, Amsterdam, New York,
Oxford.

Greenhouse gas fluxes derived from agricultural practices in forage crops in the Atlantic area
206
McLain, J., Martens, D., 2006. Moisture controls on trace gas fluxes in semiarid riparian soil. Soil Sci.
Soc. Am. J. 70, 367-377.
McSwiney, C.P., Robertson, G.P., 2005. Nonlinear response of N2O flux to incremental fertilizer
addition in a continuous maize (Zea mays L.) cropping system. Glob. Change Biol. 11, 1712-1719.
Meijide, A., Cardenas , L.M., Sanchez-Martin, L., Vallejo, A., 2010. Carbon dioxide and methane
fluxes from a barley field amended with organic fertilizers under Mediterranean climatic conditions.
Plant Soil 328, 353-3678.
Meijide, A., Díez, J.A., Sánchez-Martín, L., López-Fernández, S., Vallejo, A., 2007. Nitrogen oxide
emissions from an irrigated maize crop amended with treated pig slurries and composts in a
Mediterranean climate. Agric. Ecosyst. Environ. 121, 383–394.
Melin, J., Nômmik, H., 1983. Denitrification measurements in intact soil cores. Acta Agric. Scand.
33, 145-151.
Menneer, J.C., Ledgard, S., McLay, C., Silvester, W., 2005. Animal treading stimulates denitrification
in soil under pasture. Soil Biol. Biochem., 1625-1629.
Meyers, T.P., 2001. A comparison of summertime water and CO2 fluxes over rangeland for well
watered and drought conditions. Agricult. Forest Meteorol. 106, 205-214.
Misselbrook, T.H., Law, J.A., Pain, B.F., 1996. Surface application and shallow injection of cattle
slurry on grasslands: nitrogen losses, herbage yields and nitrogen recoveries. Grass Forage Sci. 51,
270-277.
Misselbrook, T.H., Nicholson, F.A., Chambers, B.J., 2005. Predicting ammonia losses following the
application of livestock manure to land. Bioresource Technol. 96, 159-168.
Misselbrook, T.H., Smith, K.A., Jackson, D.R., Gilhespy, S.L., 2004a. Ammonia emissions from
irrigation of dilute pig slurries. Biosyst. Eng. 89, 473-484.
Misselbrook, T.H., Smith, K.A., Johnson, R.A., Pain, B.F., 2002. SE—structures and environment:
slurry application techniques to reduce ammonia emissions: results of some UK field-scale
experiments. Biosyst. Eng. 81, 313-321.
Misselbrook, T.H., Sutton, M.A., Scholefield, D., 2004b. A simple process-based model for
estimating ammonia emissions from agricultural land after fertilizer applications. Soil Use Manage.
20, 365-372.

Greenhouse gas fluxes derived from agricultural practices in forage crops in the Atlantic area
207
Monaghan, R.M., Barraclough, D., 1993. Nitrous oxide and dinitrogen emissions from urine-affected
soil under controlled conditions. Plant and soil, 127-138.
Monaghan, R.M., Hedley, M.J., Di, H.J., McDowell, R.W., Cameron, K.C., Ledgard, S.F., 2007.
Nutrient management in New Zealand pastures— recent developments and future issues. New Zeal. J.
Agr. Res. 50, 181-201.
Morell, F.J., Cantero-Martínez, C., Lampurlanés, J., Plaza-Bonilla, D., Álvaro-Fuentes, J., 2011. Soil
carbon dioxide flux and organic carbon content: effects of tillage and nitrogen fertilization. Soil Sci.
Soc. Am. J. 75, 1874-1884.
Morley, N.J., Richardson, D.J., Baggs, E.M., 2014. Substrate induced denitrification over or under
estimates shifts in soil N2/N2O ratios. PLoS ONE 9, e108144.
Mosier, A., Kroeze, C., Nevison, C., Oenema, O., Seitzinger, S., van Cleemput, O., 1998. Closing the
global N2O budget: nitrous oxide emissions through the agricultural nitrogen cycle. Nutr. Cycl.
Agroecosyst. 52, 225-248.
Mosier, A.R., Delgado, J.A., 1997. Methane and nitrous oxide fluxes in grasslands in western Puerto
Rico. Chemosphere 35, 2059-2082.
Mosier, A.R., Halvorson, A.D., Reule, C.A., Liu, X.J., 2006. Net global warming potential and
greenhouse gas intensity in irrigated cropping systems in northeastern Colorado. J. Environ. Qual. 35,
1584-1598.
Motavalli, P.P., Kelling, K.A., Converse, J.C., 1989. First-year nutrient availability from injected
dairy manure. J. Environ. Qual. 18, 180-185.
Müller, C., Martin, M., Stevens, R., Laughlin, R., Kammann, C., Ottow, J., Jäger, H.-J., 2002.
Processes leading to N2O emissions in grassland soil during freezing and thawing. Soil Biol.
Biochem. 34, 1325-1331.
Mulvaney, R.L., Khan, S.A., Hoeft, R.G., Brown, H.M., 2001. A soil organic nitrogen fraction that
reduces the need for nitrogen fertilization. Soil Sci. Soc. .Am. J. 65, 1164-1172.
Muñoz, G.R., Kelling, K.A., Powell, J.M., Speth, P.E., 2004. Comparison of estimates of first year
dairy manure nitrogen availability of recovery using nitrogen-15 and other techniques. J. Environ.
Qual. 33, 719-727.
Myhre, G., Shindell, D., Bréon, F.M., Collins, W., Fuglestvedt, J., Huang, J., Koch, D., Lamarque,
J.F., Lee, D., Mendoza, B., Nakajima, T., Robock, A., Stephens, G., Takemura, T., Zhang, H., 2013.

Greenhouse gas fluxes derived from agricultural practices in forage crops in the Atlantic area
208
Anthropogenic and Natural Radiative Forcing. In: Stocker, T.F., Qin, D., Plattner, G.K., Tignor, M.,
Allen, S.K., Boschung, J., Nauels, A., Xia, Y., Bex, V., Midgley, P.M. (Eds.), Climate Change 2013:
The Physical Science Basis. Contribution of Working Group I to the Fifth Assessment Report of the
Intergovernmental Panel on Climate Change. Cambridge University Press, Cambridge, United
Kingdom and New York, USA.
Nakano, T., Shinoda, M., 2014. Modeling gross primary production and ecosystem respiration in a
semiarid grassland of Mongolia. Soil Sci. Plant Nutr. 61, 106-115.
Nesbit, S.P., Breitenbeck, G.A., 1992. A laboratory study of factors influencing methane uptake by
soils. Agric. Ecosyst. Environ. 41, 39-54.
Oenema, O., Velthof, G.L., Yamulki, S., Jarvis, S.C., 1997. Nitrous oxide emissions from grazed
grasslands. Soil Use Manage. 13, 288-295.
Olfs, H.W., Blankenau, K., Brentrup, F., Jasper, J., Link, A., Lammel, J., 2005. Soil- and plant-based
nitrogen-fertilizer recommendations in arable farming. J. Plant Nutr. Soil Sci. 168, 414-431.
Pain, B.F., Phillips, V.R., Clarkson, C.R., Klarenbeek, J.V., 1989. Loss of nitrogen through ammonia
volatilisation during and following the application of pig or cattle slurry to grassland. J. Sci. Food
Agric. 47, 1-12.
Papadakis, J., 1966. Climates of the world and their agricultural potentialities. DAPCO, Rome, Italy.
Parkin, T., Venterea, R., 2010. Sampling protocols.Chapter 3. Chamber-based trace gas flux
measurements. In: Follett, R.F. (Ed.), Sampling Protocols, pp. 1-39.
Parkin, T.B., 2008. Effect of sampling frequency on estimates of cumulative nitrous oxide emissions.
J. Environ. Qual. 37, 1390-1395.
Pattey, E., Edwards, G., Desjardins, R., Pennock, D., Smith, W., Grant, B., MacPherson, J., 2007.
Tools for quantifying N2O emissions from agroecosystems. Agr. Forest Meteorol. 142, 103-119.
Pelster, D.E., Chantigny, M.H., Rochette, P., Angers, D.A., Rieux, C., Vanasse, A., 2012. Nitrous
oxide emissions respond differently to mineral and organic nitrogen sources in contrasting soil types.
J. Environ. Qual. 41, 427-435.
Pfluke, P.D., Jokela, W.E., Bosworth, S.C., 2011. Ammonia volatilization from surface-banded and
broadcast application of liquid dairy manure on grass forage. J. Environ. Qual. 40, 374-382.
Greenhouse gas fluxes derived from agricultural practices in forage crops in the Atlantic area
209
Phillips, R.L., Tanaka, D.L., Archer, D.W., Hanson, J.D., 2009. Fertilizer application timing
influences greenhouse gas fluxes over a growing season. J. Environ. Qual. 38, 1569-1579.
Price, S.J., Sherlock, R.R., Kelliher, F.M., McSeveny, T.M., Tate, K.R., Condron, L.M.,
2003. Pristine New Zealand forest soil is a strong methane sink. Glob. Change Biol. 10, 16-26.
Rafique, R., Anex, R., Hennessy, D., Kiely, G., 2012. What are the impacts of grazing and cutting
events on the N2O dynamics in humid temperate grassland? Geoderma, 36-44.
Rafique, R., Hennessy, D., Kiely, G., 2011. Nitrous oxide emissions from grazed grasslands under
different management systems. Ecosystems 14, 563-582.
Raun, W.R., Ortiz-Monasterio, I., Solie, J.B., 2009. Temporally and spatially dependent nitrogen
management for diverse environments. In: Carver, B.F. (Ed.), Wheat Science and Trade. Wiley-
Blackwell, Ames, Iowa, pp. 203-214.
Reay, D.S., Nedwell, D.B., 2004. Methane oxidation in temperate soils: effects of inorganic N. Soil
Biol. Biochem. 36, 2059-2065.
Rees, R.M., Augustin, J., Alberti, G., Ball, B.C., Boeckx, P., Cantarel, A., Castaldi, S., Chirinda, N.,
Chojnicki, B., Giebels, M., Gordon, H., Grosz, B., Horvath, L., Juszczak, R., Kasimir Klemedtsson,
Å., Klemedtsson, L., Medinets, S., Machon, A., Mapanda, F., Nyamangara, J., Olesen, J.E., Reay,
D.S., Sanchez, L., Sanz Cobena, A., Smith, K.A., Sowerby, A., Sommer, M., Soussana, J.F.,
Stenberg, M., Topp, C.F.E., van Cleemput, O., Vallejo, A., Watson, C.A., Wuta, M., 2013. Nitrous
oxide emissions from European agriculture-an analysis of variability and drivers of emissions from
field experiments. Biogeosciences 10, 2671-2682.
Reijs, J.W., Daatselaar, C.H.G., Helming, J.F.M., Jager, J., Beldman, A.C.G., 2013. Grazing dairy
cows in North-West Europe. Economic farm performance and future developments with emphasis on
the Dutch situation. LEI Report 2013-001. Wageningen.
Renault, P., Stengel, P., 1994. Modeling Oxygen Diffusion in Aggregated Soils: I. Anaerobiosis
inside the Aggregates. Soil Sci. Soc. Am. J. 58, 1017-1023.
Robertson, G.P., 1989. Nitrification and denitrification in humid tropical ecosystems: potential
controls on nitrogen retention. In: Procter, J. (Ed.), Mineral nutrients in tropical forest and savanna
ecosystems. Blackwell Scientific, Cambrigde, Massachusetts, USA, pp. 55-69.
Robertson, G.P., Groffman, P.M., 2007. Nitrogen transformations. In: Paul, E.A. (Ed.), Soil
microbiology, biochemistry and ecology, Springer, New York.

Greenhouse gas fluxes derived from agricultural practices in forage crops in the Atlantic area
210
Rochette, P., 2011. Towards a standard non-steady-state chamber methodology for measuring soil
N2O emissions. Anim. Feed Sci. .Tech. 166, 141-146.
Rochette, P., Angers, D.A., Chantigny, M.H., Bertrand, N., Côté, D., 2004. Carbon Dioxide and
Nitrous Oxide Emissions following Fall and Spring Applications of Pig Slurry to an Agricultural Soil.
Soil Sci. Soc. Am. J. 68, 1410-1420.
Rochette, P., Angers, D.A., Chantigny, M.H., Gagnon, B., Bertrand, N., 2006. In situ mineralization
of dairy cattle manures as determined using soil-surface carbon dioxide fluxes. Soil Sci. Soc. Am. J.
70, 744-752.
Rochette, P., Angers, D.A., Coté, D., 2000a. Soil carbon and nitrogen dynamics following application
of pig slurry for the 19th consecutive year I. Carbon dioxide fluxes and microbial biomass carbon.
Soil Sci. Soc. Am. J. 64, 1389-1395.
Rochette, P., Bochove, E.v., Prévost, D., Angers, D.A., Côté, D., Bertrand, N., 2000b. Soil carbon and
nitrogen dynamics following application of pig slurry for the 19th consecutive year II. Nitrous oxide
fluxes and mineral nitrogen. Soil Science Society of Amercan Journal 64, 1396-1403.
Rochette, P., Desjardins, R.L., Pattey, E., 1991. Spatial and temporal variability of soil respiration in
agricultural fields. Can. J. Soil Sci. 71, 189-196.
Rochette, P., Erisksen-Hamel, N.S., 2008. Chamber measurements of soil nitrous oxide flux: are
absolute values reliable? Soil Science Society of American Journal 72, 331–342.
Rochette, P., Gregorich, E.G., 1998. Dynamics of soil microbial biomass C, soluble organic C, and
CO2 evolution after three years of manure application. Can. J. Soil Sci. 78, 283-290.
Rodhe, L., Pell, M., Yamulki, S., 2006. Nitrous oxide, methane and ammonia emissions following
slurry spreading on grassland. Soil Use Mange. 22, 229-237.
Rowlings, D.W., Grace, P.R., Scheer, C., Liu, S., 2015. Rainfall variability drives interannual
variation in N2O emissions from a humid, subtropical pasture. Sci. Total Environ. 512–513, 8-18.
Rudaz, A.O., Wälti, E., Kyburz, G., Lehmann, P., Fuhrer, J., 1999. Temporal variation in N2O and N2
fluxes from a permanent pasture in Switzerland in relation to management, soil water content and soil
temperature. Agric. Ecosyst. Environ. 73, 83-91.
Ruimy, A., Jarvis, P.G., Baldocchi, D.D., Saugier, B., 1995. CO2 fluxes over plant canopies and solar
radiation: a review. Adv. Ecol. Res. 26, 1-81.

Greenhouse gas fluxes derived from agricultural practices in forage crops in the Atlantic area
211
Rütting, T., Boeckx, P., Müller, C., Klemedtsson, L., 2011. Assessment of the importance of
dissimilatory nitrate reduction to ammonium for the terrestrial nitrogen cycle. Biogeosciences 8,
1779-1791.
Ryden, J.C., Rolston, D.E., 1983. The measurement of denitrification. In: Freney, J.R., Simpson, J.R.
(Eds.), Gaseous loss of nitrogen from plant-soil systems. Springer Netherlands, Netherlands, pp. 91-
132.
Saggar, S., Andrew, R.M., Tate, K.R., Hedley, C.B., Rodda, N.J., Townsend, J.A., 2004a. Modelling
nitrous oxide emissions from dairy-grazed pastures. Nutr. Cycl. Agroecosyst., 243–255.
Saggar, S., Bolan, N.S., Bhandral, R., Hedley, C.B., 2004b. A review of emissions of methane,
ammonia, and nitrous oxide from animal excreta deposition and farm effluent application in grazed
pastures. New Zeal. J. Agr. Res. 47, 513–544.
Saggar, S., Hedley, C.B., Giltrap, D.L., Lambie, S.M., 2007. Measured and modelled estimates of
nitrous oxide emission and methane consumption from a sheep-grazed pasture. Agr. Ecosyst. Environ.
122, 357-365.
Saggar, S., Jha, N., Deslippe, J., Bolan, N.S., Luo, J., Giltrap, D.L., Kim, D.G., Zaman, M., Tillman,
R.W., 2013. Denitrification and N2O:N2 production in temperate grasslands: processes,
measurements, modelling and mitigating negative impacts. Sci. Total Environ. 465, 173-195.
Saggar, S., Luo, J., Giltrap, D.L., Maddena, M., 2009. Nitrous oxide emission from temperate
grasslands: process, measurements, modelling and mitigation. In: Sheldon, A.I., Barnhart, E.P. (Eds.),
Nitrous oxide emissions research progress, New York: Nova Science Publishers, pp. 1-66.
Saggar, S., Luo, J., Kim, D.G., Jha, N., 2011. Intensification in pastoral farming: impacts on soil
attributes and gaseous emissions. In: Singh, B.P., Cowie, A., Chan, Y. (Eds.), Soil Health and Climate
Change Springer-Verlag, Berlin, Heidelberg, pp. 207-236.
Saggar, S., Tate, K.R., Giltrap, D.L., Singh, J., 2008. Soil-atmosphere exchange of nitrous oxide and
methane in New Zealand terrestrial ecosystems and their mitigation options: a review. Plant Soil 309,
25-42.
Sänger, A., Geisseler, D., Ludwig, B., 2011. Effects of moisture and temperature on greenhouse gas
emissions and C and N leaching losses in soil treated with biogas slurry. Biol. Fertil. Soils 47, 249-
259.
Greenhouse gas fluxes derived from agricultural practices in forage crops in the Atlantic area
212
Schils, R.L.M., van Groenigen, J.W., Velthof, G.L., Kuikman, P.J., 2008. Nitrous oxide emissions
from multiple combined applications of fertiliser and cattle slurry to grassland. Plant Soil 310, 89-101.
Schils, R.L.M., Verhagen, A., Aarts, H.F.M., Kuikman, P.J., ŠEbek, L.B.J., 2006. Effect of improved
nitrogen management on greenhouse gas emissions from intensive dairy systems in the Netherlands.
Glob. Change Biol. 12, 382-391.
Schönheit, P., Keweloh, H., Thauer, R.K., 1981. Factor F420 degradation in Methanobacterium
thermoautotrophicum during exposure to oxygen. FEMS Microbiol. Lett. 12, 347-349.
Segers, R., Kengen, S.W.M., 1998. Methane production as a function of anaerobic carbon
mineralization: a process model. Soil Biol. Biochem. 30, 1107-1117.
Sehy, U., Ruser, R., Munch, J.C., 2003. Nitrous oxide fluxes from maize fields: relationship to yield,
site-specific fertilization, and soil conditions. Agric. Ecosyst. Environ. 99, 97–111.
Sherlock, R.R., Sommer, S.G., Khan, R.Z., Wood, C.W., Guertal, E.A., Freney, J.R., Dawson, C.O.,
Cameron, K.C., 2002. Ammonia, methane, and nitrous oxide emission from pig slurry applied to a
pasture in New Zealand. J. Environ. Qual. 31, 1491-1501.
Shoun, H., Kim, D.H., Uchiyama, H., Sugiyama, J., 1992. Denitrification by fungi. FEMS Microbiol.
Lett. 94, 277-281.
Shoun, H., Tanimoto, T., 1991. Denitrification by the fungus Fusarium oxysporum and involvement
of cytochrome P-450 in the respiratory nitrite reduction. J. Biol. Chem. 266, 11078-11082.
Silva, R.G., Cameron, K.C., Di, H.J., Hendry, T., 1999. A lysimeter study of the impact of cow urine,
dairy shed effluent, and nitrogen. Aust. J. Soil Res. 37, 357-370.
Simek, M., Brucek, P., Hynst, J., Uhlirova, E., Petersen, S.O., 2006. Effects of exceta returns and soil
compaction on nitrous oxide emissions from a cattle overwintering area. Agriculture Ecosystems and
Environment 112, 186-191.
Šimek, M., Cooper, J.E., 2002. The influence of soil pH on denitrification: progress towards the
understanding of this interaction over the last 50 years. Eur. J. Soil Sci. 53, 345-354.
Singh, B., Singh, B., Singh, Y., 1993. Potential and kinetics of nitrification in soils from semiarid
regions of northwestern India. Arid Soil Res. Rehab. 7, 39-50.
Sistani, K.R., Warren, J.G., Lovanh, N., Higgins, S., Shearer, S., 2010. Greenhouse gas emissions
from swine effluent applied to soil by different methods. Soil Sci. Soc. Am. J. 74, 429-435.
Greenhouse gas fluxes derived from agricultural practices in forage crops in the Atlantic area
213
Skiba, U., Ball, B., 2002. The effect of soil texture and soil drainage on emissions of nitric oxide and
nitrous oxide. Soil use manage. 18, 56-60.
Smit, H.J., Metzger, M.J., Ewert, F., 2008. Spatial distribution of grassland productivity and land use
in Europe. Agr. Syst. 98, 208-219.
Smith, K.A., Ball, T., Conen, F., Dobbie, K.E., Massheder, J., Rey, A., 2003. Exchange of greenhouse
gases between soil and atmosphere: interactions of soil physical factors and biological processes. Eur.
J. Soil Sci. 54, 779-791.
Smith, K.A., Dobbie, K.E., 2001. The impact of sampling frequency and sampling times on chamber-
based measurements of N2O emissions from fertilized soils. Glob. Change Biol. 7, 933-945.
Smith, K.A., Dobbie, K.E., Thorman, R.E., Watson, C.J., Chadwick, D.R., Yamulki, S., Ball, B.C.,
2012. The effect of N fertilizer forms on nitrous oxide emissions from UK arable land and grassland.
Nutr. Cycl. Agroecosys. 93, 127-149.
Smith, K.A., Jackson, D.R., Misselbrook, T.H., Pain, B.F., Johnson, R.A., 2000. PA-Precision
Agriculture: reduction of ammonia emissions by slurry application techniques. Journal of Agricultural
Engineering Research 77, 277-287.
Smith, P., Martino, D., Cai, Z., Gwary, D., Janzen, H., Kumar, P., McCarl, B., Ogle, S., O'Mara, F.,
Rice, C., Scholes, B., Sirotenko, O., Howden, M., McAllister, T., Pan, G., Romanenkov, V.,
Schneider, U., Towprayoon, S., Wattenbach, M., Smith, J., 2008. Greenhouse gas mitigation in
agriculture. Philos. Trans. R. Soc. B 363, 789-813.
Smith, P., Martino, D., Cai, Z., Gwary, D., Janzen, H., Kumar, P., McCarl, B., Ogle, S., O´Mara, F.,
Rice, C., Scholes, B., Sirotenko, O., 2007. Agriculture. In: Metz, B., Davidson, O.R., Bosch, P.R.,
Dave, R., Meyer, L.A. (Eds.), Climate change 2007: mitigation, contribution of working group III to
the fourth assessment report of the intergovernmental panel on climate change. Cambrigde University
Cambrigde, UK and New York, USA.
Snyder, C.S., Bruulsema, T.W., Jensen, T.L., Fixen, P.E., 2009. Review of greenhouse gas emissions
from crop production systems and fertilizer management effects. Agri. Ecosyst. Environ. 133, 247-
266.
Snyder, C.S., Davidson, E.A., Smith, P., Venterea, R.T., 2014. Agriculture: sustainable crop and
animal production to help mitigate nitrous oxide emissions. Curr. Opin. Env. Sust. 9–10, 46-54.

Greenhouse gas fluxes derived from agricultural practices in forage crops in the Atlantic area
214
Søgaard, H.T., Sommer, S.G., Hutchings, N.J., Huijsmans, J.F.M., Bussink, D.W., Nicholson, F.A.,
2002. Ammonia volatilization from field-applied animal slurry—the ALFAM model. Atmos. Environ.
36, 3309-3319.
Sommer, S.G., Olesen, J.E., 1991. Effects of dry matter content and temperature on ammonia loss
from surface-applied cattle slurry. J. Environ. Qual. 20, 679-683.
Spek, J.W., Bannink, A., Gort, G., Hendriks, W.H., Dijkstra, J., 2013. Interaction between dietary
content of protein and sodium chloride on milk urea concentration, urinary urea excretion, renal
recycling of urea, and urea transfer to the gastrointestinal tract in dairy cows. J. Dairy Sci. 96, 5734-
5745.
Stark, J.M., 1996. Modeling the temperature response of nitrification. Biogeochemistry 35, 433-445.
Stark, J.M., Firestone, M.K., 1996. Kinetic characteristics of ammonium-oxidizer communities in a
California oak woodland-annual grassland. Soil Biol. Biochem. 28, 1307-1317.
Storz, G., Tartaglia, L.A., Farr, S.B., Ames, B.N., 1990. Bacterial defenses against oxidative stress.
Trends Genet. 6, 363-368.
Subbarao, G.V., Ito, O., Sahrawat, K.L., Berry, W.L., Nakahara, K., Ishikawa, T., Watanabe, T.,
Suenaga, K., Rondon, M., Rao, I.M., 2006. Scope and strategies for regulation of nitrification in
agricultural systems—challenges and opportunities. Cr. Rev. Plant Sci. 25, 303-335.
Syakila, A., Kroeze, C., 2011. The global nitrous oxide budget revisited. Greenhouse Gas Meas.
Manage. 1, 17-26.
Syväsalo, E., Regina, K., Pihlatie, M., Esala, M., 2004. Emissions of nitrous oxide from boreal
agricultural clay and loamy sand soils. Nutr. Cycl. Agroecosys. 69, 155-165.
Tan, I.Y.S., van Es, H.M., Duxbury, J.M., Melkonian, J.J., Schindelbeck, R.R., Geohring, L.D.,
Hively, W.D., Moebius, B.N., 2009. Single-event nitrous oxide losses under maize production as
affected by soil type, tillage, rotation, and fertilization. Soil and Tillage Research 102, 19–26.
Thompson, R.B., Pain, B.F., Rees, Y.J., 1990. Ammonia volatilization from cattle slurry following
surface application to grassland. Plant Soil 125, 119-128.
Tiedje, J.M., 1988. Ecology of denitrification and dissimilatory nitrate reduction to ammonium. In:
Zehnder, A.J.B. (Ed.), Biology of Anaerobic Microorganisms. John Wiley & Sons, New York, USA,
pp. 179–244.

Greenhouse gas fluxes derived from agricultural practices in forage crops in the Atlantic area
215
Topp, E., Pattey, E., 1997. Soils as sources and sinks for atmospheric methane. Can. J. Soil Sci. 77,
167-177.
Trogler, W.C., 1999. Physical properties and mechanisms of formation of nitrous oxide. Coord.
Chem. Rev. 187, 303-327.
Udvardi, M., Poole, P.S., 2013. Transport and metabolism in llegume-Rhizobia symbioses. Annu.
Rev. Plant Biol. 64, 781-805.
Valentine, D.W., Holland, E.A., Schimel, D.S., 1994. Ecosystem and physiological controls over
methane production in northern wetlands. J. Geophys. Res. 99, 1563-1571.
Vallejo, A., García-Torres, L., Díez, J.A., Arce, A., López-Fernández, S., 2005. Comparison of N
losses (NO3−, N2O, NO) from surface applied, injected or amended (DCD) pig slurry of an irrigated
soil in a Mediterranean climate. Plant Soil 272, 313-325.
van Bochove, E., Prévost, D., Pelletier, F., 2000. Effects of freeze–thaw and soil structure on nitrous
oxide produced in a clay soil. Soil Sci. Soc. Am. J. 64, 1638-1643.
Van Den Heuvel, R.N., Bakker, S.E., Jetten, M.S.M., Hefting, M.M., 2011. Decreased N2O reduction
by low soil pH causes high N2O emissions in a riparian ecosystem. Geobiology 9, 294-300.
van den Pol-van Dasselaar, A., Oenema, O., 1997. Effects of grassland mangement on the emission of
methane from intensively managed grasslands on peat soil. Plant Soil, 1-9.
Van Gestel, M., Merckx, R., Vlassak, K., 1993. Microbial biomass responses to soil drying and
rewetting: the fate of fast- and slow-growing microorganisms in soils from different climates. Soil
Biol. Biochem. 25, 109–123.
van Groenigen, J.W., Kasper, G.J., Velthof, G.L., van den Pol-van Dasselaar, A., Kuikman, P.J.,
2004. Nitrous oxide emissions from silage maize fields under different mineral nitrogen fertilizer and
slurry applications. Plant Soil 263, 101-111.
Van Groenigen, J.W., Velthof, G.L., Oenema, O., Van Groenigen, K.J., Van Kessel, C., 2010.
Towards an agronomic assessment of N2O emissions: a case study for arable crops. Eur. J. Soil Sci.
61, 903-913.
Van Groenigen, J.W., Velthof, G.L., Van der Bolt, F.J.E., Vos, A., Kuikman, P.J., 2005. Seasonal
variation in N2O emissions from urine patches: effects of urine concentration, soil compaction and
dung. Plant Soil 273, 15-27.

Greenhouse gas fluxes derived from agricultural practices in forage crops in the Atlantic area
216
Velthof, G.L., Brader, A.B., Oenema, O., 1996. Seasonal variations in nitrous oxide losses from
managed grasslands in the Netherlands. Plant Soil, 263-274.
Velthof, G.L., Kuikman, P.J., Oenema, O., 2003. Nitrous oxide emissions from animal manures
applied to soil under controled conditions. Biol. Fertil. Soils, 221-230.
Velthof, G.L., Mosquera, J., 2011. The impact of slurry application technique on nitrous oxide
emissions from agricultural soils. Agric. Ecosyst. Environ., 298-308.
Velthof, G.L., Oenema, O., Postma, R., Van Beusichem, M.L., 1997. Effects of type and amount of
applied nitrogen fertilizer on nitrous oxide fluxes from intensively managed grassland. Nutr. Cycling
Agroecosyst. 46, 257-267.
Venterea, R.T., 2007. Nitrite-driven nitrous oxide production under aerobic soil conditions: kinetics
and biochemical controls. Glob. Chang. Biol. 13, 1798-1809.
Venterea, R.T., Bijesh, M., Dolan, M.S., 2011. Fertilizer source and tillage effects on yield-scaled
nitrous oxide emissions in a corn cropping system. J. Environ. Qual. 40, 1521-1531.
Victor, D.G., Zhou, D., Ahmed, E.H.M., Dadhich, P.K., Olivier, J.G.J., Rogner, H.-H., Sheikho, K.,
Yamaguchi, M., 2014. Introductory chapter. In: Edenhofer, O., Pichs-Madruga, R., Sokona, Y.,
Farahani, E., Kadner, S., Seyboth, K., Adler, A., Baum, I., Brunner, S., Eickemeier, P., Kriemann, B.,
Savolainen, J., Schlömer, S., von Stechow, C., Zwickel, T., Minx, J.C. (Eds.), Climate Change 2014:
Mitigation of Climate Change. Contribution of Working Group III to the Fifth Assessment Report of
the Intergovernmental Panel on Climate Change, Cambridge, United Kingdom and New York, NY,
USA.
Vitousek, P.M., Menge, D.N.L., Reed, S.C., Cleveland, C.C., 2013. Biological nitrogen fixation:
rates, patterns and ecological controls in terrestrial ecosystems. Trans. R. Soc. B 368: 20130119.
Watson, S.W., Valos, F.W., Waterbury, J.B., 1981. The Family Nitrobacteraceae. The Prokaryotes,
Springer-Verlag, Berlin.
Weier, K.L., Doran, J.W., Power, J.F., Walters, D.T., 1993. Denitrification and the dinitrogen/nitrous
oxide ratio as affected by soil water, available carbon, and nitrate. Soil Sci. Soc. Am. J. 57, 66-72.
Whitman, W.B., Bowen, T.L., Boone, D.R., 2006. The methanogenic bacteria. In: Dworkin, M.,
Falkow, S., Rosenberg, E., Schleifer, K.-H., Stackebrandt, E. (Eds.), The Prokaryotes. Springer New
York, pp. 165-207.

Greenhouse gas fluxes derived from agricultural practices in forage crops in the Atlantic area
217
Williams, E.J., Hutchinson, G.L., Fehsenfeld, F.C., 1992. NOx and N2O emissions from soil. Global
Biogeochem. Cy. 6, 351-388.
Williams, J.D., Crozier, C.R., White, J.G., Heiniger, R.W., Sripada, R.P., Crouse, D.A., 2007. Illinois
soil nitrogen test predicts Southeastern U.S. corn economic optimum nitrogen rates. Soil Sci. Soc.
Am. J. 71, 735-744.
Wrage, N., Groenigen, J.W.v., Oenema, O., Baggs, E.M., 2005. A novel dual-isotope labelling
method for distinguishing between soil sources of N2O. Rapid Commun. Mass Spectrom. 19, 3298-
3306.
Wrage, N., Velthof, G.L., van Beusichem, M.L., Oenema, O., 2001. Role of nitrifier denitrification in
the production of nitrous oxide. Soil Biol. Biochem. 33, 1723-1732.
Wuebbles, D.J., 2009. Nitrous oxide: no laughing matter. Science 326, 56-57.
Wulf, S., Maeting, M., Clemens, J., 2002. Application technique and slurry co-fermentation effects on
ammonia, nitrous oxide, and methane emissions after spreading: II. Greenhouse gas emissions. J.
Environ. Qual. 31, 1795-1801.
Xu, M., Qi, Y., 2001. Soil‐surface CO2 efflux and its spatial and temporal variations in a young
ponderosa pine plantation in northern California. Glob. Change Biol. 7, 667-677.
Zaman, M., Zaman, S., Nguyen, M.L., Smith, T.J., Nawaz, S., 2013. The effect of urease and
nitrification inhibitors on ammonia and nitrous oxide emissions from simulated urine patches in
pastoral system: A two-year study. Sci. Total Environ. 465, 97-106.
Zehnder, A.J.B., Stumm, W., 1988. Geochemistry and biogeochemistry of anaerobic habitats. In:
Zehnder, A.J.B. (Ed.), Biology of anaerobic microorganisms. Wiley, New York.
Zhang, X., Wang, Q., Xu, J., Gilliam, F.S., Tremblay, N., Li, C., 2015. In situ nitrogen mineralization,
nitrification, and ammonia volatilization in maize field fertilized with urea in Huanghuaihai Region of
Northern China. PLoS ONE 10, e0115649.
Zhou, Z., Takaya, N., Nakamura, A., Yamaguchi, M., Takeo, K., Shoun, H., 2002. Ammonia
fermentation, a novel anoxic metabolism of nitrate by fungi. J. Biol. Chem. 277, 1892-1896.

Greenhouse gas fluxes derived from agricultural practices in forage crops in the Atlantic area
218
THESIS OUTPUTS
Peer reviewed journal papers
Louro, A., Báez, D., García, M.I., Cárdenas, L. 2015. Nitrous oxide emissions from forage maize
production on a Humic Cambisol fertilized with mineral fertilizer or slurries in Galicia, Spain.
Geoderma Regional, 5, 54–63.
Doltra, J., Olesen, J.E., Báez, D., Louro, A., Chirinda, N. 2015. Modeling nitrous oxide emissions
from organic and conventional cereal-based cropping systems under different management, soil and
climate factors. European Journal of Agronomy; 66, 8-20.
Louro, A., Sawamoto, T., Chadwick, D., Pezzolla, D., Bol, R., Báez, D., Cardenas, L. 2013. Effect of
fertilization with slurry and ammonium nitrate on greenhouse gas (GHG) emissions under atypical
South West England weather conditions. Agriculture, Ecosystems and Environment, 181, 1-11.
Pezzolla, D.; Bol, R.; Gigliotti, G.; Sawamoto, T.; Louro López, A.; Cardenas, L.; Chadwick, D.
2012. Greenhouse gas (GHG) emissions from soils amended with digestate derived from anaerobic
treatment of food waste. Rapid Communications in Mass Spectrometry, 26 (20), 2422-2430.
Peer reviewed conference papers
Doltra, J., Báez, D., Louro, A., García, M.I. 2014. Simulación de la emisión de N2O en maíz forrajero
influenciada por la fertilización nitrogenada y el cultivo precedente. Proceedings of the III Workshop
sobre Mitigación de emisión de gases de efecto invernadero provenientes del sector agroforestal, pp.
15, Valencia (Spain).
Louro, A., Báez, M.D., García, M.I. 2013. Greenhouse gas emissions after organic and mineral
fertilization from maize in Galicia. Proceedings of the II Workshop sobre mitigación de emisión de
gases de efecto invernadero provenientes del sector agroforestal, 70-72, Zaragoza (Spain).
Louro, A. , Báez, D. , García, M.I. , Castro, J. 2012. Nitrous oxide emissions from two maize crop
seasons in Northwesthern Spain. In: Richards, K.G., Fenton, O., Watson, C. J. (Eds). Innovations for
sustainable use of nitrogen resources. Proceedings of the 17th Nitrogen Workshop, 190-191, Wexford,
(Ireland). ISBN-10: 1-84170-588-8.

Greenhouse gas fluxes derived from agricultural practices in forage crops in the Atlantic area
219
Louro, A., Báez, D. M., García, M.I., Castro, J. 2012. Seasonal variation of nitrous oxide emissions
from grazed grasslands in Galicia (Spain). In: Richards, K.G., Fenton, O., Watson, C. J. (Eds).
Innovations for sustainable use of nitrogen resources. Proceedings of the 17th Nitrogen Workshop,
208-209, Wexford, (Ireland). ISBN-10: 1-84170-588-8.
García, M.I., Báez, D., Louro, A., Castro, J. 2012. Influence of different nitrogen fertilizers on forage
maize yield and quality. In: Richards, K.G., Fenton, O., Watson, C. J. (Eds). Innovations for
sustainable use of nitrogen resources. Proceedings of the 17th Nitrogen Workshop, 418-419, Wexford,
(Ireland). ISBN-10: 1-84170-588-8.
Pezzolla D., Bol R., Gigliotti G., Sawamoto T., Louro Lopez A., Cardenas L., Chadwick D.
Greenhouse gas (GHG) emissions from soil amended with digestate derived from anaerobic digestion
of food waste. La chimica agraria tra energia e ambiente. Proceedings of the XXX Convegno
Nazionale Società Italiana di Chimica Agraria, p.62, Milano (Italy).
Pezzolla, D., Bol R., Sawamoto T., Louro A., Cardenas, L., Gigliotti, G.; Chadwick, D. 2011. Short-
term greenhouse gas (GHG) emissions from soils amended with digestate derived from anaerobic
treatment of food waste. Relazione suolo-pianta e qualità delle produzioni. Proceedings of the XIX
Convegno Nazionale della Società Italiana di Chimica Agraria, Foggia (Italy), p.70.
Báez, D.; Louro, A.; García, M. I; Castro, J.; Valladares, J. 2010. Efecto del tipo de fertilización en las
emisiones de óxido nitroso en praderas bajo manejo de pastoreo. In: Grupo de Investigación en
Economía Ecolóxica e Agroecoloxía (Eds), Soberanía alimentaria e agricultura ecolóxica. Propostas
de acción. Proceedings of the III Congreso de Agroecoloxía e Agricultura Ecolóxica de Galicia, 905-
912, Vigo (Spain). ISBN: 978-84-614-3560-9.
Louro, A.; Báez, D.; García, M. I; Castro, J. 2011. Variaciones estacionales de óxido nitroso en
praderas de pastoreo en Galicia. In: Sociedad Española para el Estudio de los Pastos (Eds), Pastos,
paisajes culturales entre tradición y nuevos paradigmas del siglo XXI. Proceedings of the 50 Reunión
científica de la Sociedad Española para el Estudio de los Pastos, 679-685, Toledo (Spain). ISBN:978-
84-614-8713-4.
Louro, A.; Báez, D.; García, M. I.; Castro, J., 2010. Emisiones de óxido nitroso en un suelo cultivado
con maíz tras el aporte de distintos tipos de fertilizantes. In: Sociedad Española para el Estudio de los
Pastos (Eds), Pastos: fuente natural de energía. Proceedings of the IV Reunión Ibérica de Pastos y
Forrajes, 291-297, León (Spain). ISBN: 978-84-612-9773-502-5.

Greenhouse gas fluxes derived from agricultural practices in forage crops in the Atlantic area
220
Báez, D.; Louro, A.; Roca, A.; Castro, J.; García, M. I., 2009. Emisiones de óxido nitroso en pastoreo
rotacional. In: Sociedad Española para el Estudio de los Pastos (Eds), La multifuncionalidad de los
pastos: producción ganadera sostenible y gestión de los ecosistemas. Proceedings of the XLVIII
Reunión científica de la Sociedad Española para el Estudio de los Pastos, 163-170, Huesca (Spain).
ISBN: 978-84-612-9337-7.
Oral presentations
Louro, A. Emisiones de GEI en maiz forrajero. Oral presentation in the research meeting RUENA
(Red del Uso eficiente del Nitrógeno) celebrated at Mabegondo Agricultural Research Centre, Galicia
(Spain), 23-24 April 2013.
Sawamoto, T.; Louro, A. NW553: Assessment of the spatial and temporal variation of N2O, CH4, and
CO2 flux from grassland. Internal seminar at Rothamsted North Wyke, 2 March 2012.
Louro, A.; Báez, D.; García, M. I.; Castro, J., 2010. Emisiones de óxido nitroso en un suelo cultivado
con maíz tras el aporte de distintos tipos de fertilizantes. IV Reunión Ibérica de Pastos y Forrajes,
Zamora (Spain) and Miranda do Douro (Portugal), 3-6 May 2010.
Báez, D.; Louro, A.; Roca, A.; Castro, J.; García, M. I., 2009. Emisiones de óxido nitroso en pastoreo
rotacional. XLVIII Reunión científica de la Sociedad Española para el Estudio de los Pastos, Huesca
(Spain), 15-18 June 2009.
Magazines
Báez Bernal, M.D., García Pomar, M.I., Louro López, A., Gilsanz Rey, C., Castro Ínsua, J.F. 2014.
Fertilización de praderas con purines. Afriga, 114, 119-128.
Báez Bernal, M.D., García Pomar, M.I., Gilsanz Rey, C., Louro López, A., Castro Ínsua, J.F. 2014.
Fertilización nitroxenada no millo forraxeiro en rotación con varios cultivos de invierno. Afriga, 109,
146-155.
García Pomar, M.I., Báez Bernal, D., Louro López, A., Castro Ínsua, J. 2013. La fertilización
nitrogenada del maíz forrajero. Fertilizantes tradicionales frente a los nuevos fertilizantes
nitrogenados. Afriga, 103, pp. 150-160.

Greenhouse gas fluxes derived from agricultural practices in forage crops in the Atlantic area
221
García, M.I., Báez, D., Castro, J., Louro, A. 2012. Axuste das recomendacións de fertilización no
millo forraxeiro para as condicións galegas. Afriga, 97, 130-136.

Greenhouse gas fluxes derived from agricultural practices in forage crops in the Atlantic area
222
APPENDIX 1

Agriculture, Ecosystems and Environment 181 (2013) 1– 11
Contents lists available at ScienceDirect
Agriculture, Ecosystems and Environment
jo ur nal ho me page: www.elsev ier .com/ locate /agee
Effect of slurry and ammonium nitrate application on greenhouse gasfluxes of a grassland soil under atypical South West England weatherconditions
A. Louroa,∗, T. Sawamotob, D. Chadwickc,1, D. Pezzollad, R. Bolc,2, D. Báeza, L. Cardenasc
a Centro de Investigaciones Agrarias de Mabegondo, Apdo. 10, 15080 A Coruna, Galicia, Spainb Department of Dairy Science, Faculty of Dairy Science, Rakuno Gakuen University, Hokkaido 069-8501, Japanc Department of Sustainable Soil and Grassland Systems, Rothamsted Research, North Wyke, Okehampton, Devon EX20 2SB, UKd Department of Agricultural and Environmental Science, University of Perugia, Borgo XX Giugno, 72-06121 Perugia, Italy
a r t i c l e i n f o
Article history:Received 19 November 2012Received in revised form 29 August 2013Accepted 7 September 2013
Keywords:Greenhouse gasesCattle slurryAmmonium nitrateDry soil conditionsAmmonia emission modellingPlant N offtake
a b s t r a c t
In this study we evaluated how typical split applications of cattle slurry (SL) or mineral fertilizer (AN)(in spring, summer and autumn) affected greenhouse gas (GHG) emissions from a grassland soil. Fieldmeasurements were carried out between May and November 2011 using the closed chamber technique.The experiment was located in the South West of England, an area which is typically characterized by highannual precipitation (>1000 mm year−1) and cool temperatures (average annual air temperature of 9.6 ◦C).The unusual dry climatic conditions observed during the late spring and summer, and the rainfall eventsidentified in autumn affected soil water filled pore space (WFPS) resulting in low nitrous oxide (N2O)fluxes during the experiment. After the first two applications, climatic conditions dried the soil to valuesbelow 60%WFPS, the threshold level for losses of N2O by nitrification. In contrast, the frequent rainfallevents observed after the third application (in autumn) increased the WFPS and promoted losses of N2Oby denitrification. In terms of fertilizer type, AN resulted in higher cumulative N2O emissions comparedwith SL after the third application, probably because the SL treatment resulted in more anaerobic soilconditions and ammonia (NH3) volatilization resulted in a smaller mineral N pool in the soil available forN2O production and emission. Ammonia (NH3) emission modelling estimated losses of N by volatilizationof NH3 between 25% and 38% of N applied after slurry surface broadcast application. Plant N offtakerepresented nearly all of the total N applied in AN plots following the first two applications and 59%of that applied in the third, whereas in SL plots an average of 64% of the total N applied in the threeapplications was harvested in the grass. Nitrogen gas (N2) fluxes were not measured but the large rainfallevents observed after the third application gradually increased the soil WFPS to saturation and couldalso have resulted in losses of N by complete denitrification, especially from the AN treatment. Thus,applications of AN and SL resulted in total N2O-N losses during the 6-month measurement period of 0.21and 0.17 kg N ha−1, respectively (representing only 0.02% and 0.003% of the N applied). Methane (CH4)production was observed in the first two or three days after SL spreading. For the remaining days, and alsoin plots treated with AN, the soil acted as a sink of CH4 (consumption). Total net CH4 cumulative values of−0.09 and 0.92 kg CH4 ha−1 were observed in AN and SL, respectively. CH4 consumption and productionrates were related to changes in the %WFPS. Thus, dry soil conditions (below 60%WFPS) enhanced theCH4 consumption in AN plots and reduced the rate of CH4 production in SL plots during May and June.Total net cumulative carbon dioxide (CO2) fluxes of 1.24 and 0.35 Mg CO2-C ha−1 were observed in ANand SL plots during the 6-months measurements.
© 2013 Elsevier B.V. All rights reserved.
∗ Corresponding author. Tel.: +34 881881857; fax: +34 881881800.E-mail addresses: [email protected], [email protected] (A. Louro).
1 Present address: School of Environment, Natural Resources & Geography (SENGRY), Environment Centre Wales, Bangor University, Bangor LL57 2UW, UK.2 Present address: Terrestrial Biogeochemistry Group, Institute of Bio- and Geosciences, IBG-3: Agrosphere, Forschungszentrum Jülich GmbH, 52425 Jülich, Germany.
0167-8809/$ – see front matter © 2013 Elsevier B.V. All rights reserved.http://dx.doi.org/10.1016/j.agee.2013.09.005

2 A. Louro et al. / Agriculture, Ecosystems and Environment 181 (2013) 1– 11
1. Introduction
Agriculture and agricultural production practices play an impor-tant role in the global fluxes of the greenhouse gases (GHG)methane (CH4), nitrous oxide (N2O) and carbon dioxide (CO2),each contributing 6.5%, 5.5% and 0.1% to the total anthropogenicgreenhouse gas emissions, respectively (Sanger et al., 2011). Theproduction or consumption of these gases is mainly due to biologi-cal processes which are strongly affected by natural conditions andagricultural management (Snyder et al., 2009). Weather conditionsand the addition of slurries or mineral fertilizers (such as ammo-nium nitrate (NH4NO3)) can significantly affect the interchange ofgreenhouse gases between the soil and the atmosphere. This isdue to an increase in the supply of substrates and a change in soilconditions that alters the processes responsible of the productionand/or consumption of each gas. Nitrification and/or denitrificationcan produce N2O emissions. Both processes occur if nitrogen (N) isapplied in the ammonium (NH4
+-N) form, but only by denitrifica-tion if it is applied solely in the nitrate (NO3
−-N) form (Clayton et al.,1997) or after NH4
+-N has been converted to NO3−-N. Nitrification
is responsible for the release of N2O in dry or well-aerated soils (as itis an aerobic process), while denitrification is, dominantly, the mainpathway at medium–high soil water contents (being an anaero-bic processes). The production of CH4 is primarily by microbialdegradation of organic matter under anaerobic conditions, e.g., inwetlands or from rice paddies. However, the application of animalmanures can provide an immediately available carbon and mois-ture source leading to CH4 production (Chadwick and Pain, 1997).Well-aerated upland soils (e.g., grasslands, forest and arable) arecommonly regarded as a biological sink of atmospheric CH4 andare responsible for 6% of the global methane consumption (Le Merand Roger, 2001). Carbon dioxide (CO2) emissions resulting fromrespiration in soil and by vegetation are the principal sources ofCO2 entering the atmosphere (Smith et al., 2003). Applications oflivestock slurries and mineral fertilizers provide nutrients for plantand soil microbial growth, and enhance CO2 emissions, although Nfertilizer effects on soil CO2 emissions are dependent on weatherconditions during the growing season (Morell et al., 2011). Soilmoisture influences gas exchange by altering oxygen availabilityand gas diffusivity. Soil respiration has been shown to increasewith increasing temperature due to the enhanced microbial activ-ity. Because of varying weather and soil conditions, the GHG fluxesare likely to be temporally dynamic and also dependent on thenature of fertilizer inputs.
The main aim of this study was to investigate how typical man-agement of slurry or mineral fertilizer affect GHG emissions in agrassland soil in the South West of England. We applied cattle slurryand NH4NO3 to grassland plots on three occasions over a periodof six months. The fluxes of N2O, CH4 and CO2 were measured athigh frequency using the static chamber methodology. Althoughunplanned, the experiment was carried out under atypical, i.e.,unusually dry, climatic conditions for the region.
2. Materials and methods
2.1. Location
The field trial was carried out in permanent grassland in May2011 at Rothamsted Research, North Wyke, Devon, UK (50:46:10N,3:54:05W), which has a temperate maritime climate (Koppen,1931), typical of the South-West England. The 40-year mean annualtemperature (1961–2000) is 9.6 ◦C, and the minimum and max-imum monthly mean temperatures are 4.5 ◦C in February and15.5 ◦C in August. The mean annual precipitation (40-years aver-age) is 1056 mm, 46% of which falls between October and January.
Table 1Chemical and physical properties of the cattle slurry used on each application.
Applications
Properties Units 1st(16th May)
2nd(24th June)
3rd(8th September)
Density kg l−1 0.995 1.021 1.006pH – 6.9 6.8 7.3Dry matter % 8.8 6.4 6.5Total C % DMa 37.6 39.4 38.4Total N % FWtb 0.36 0.35 0.32Total N % DM 2.58 2.67 2.67NH4-N % FWt 0.16 0.12 0.12NO3-N % FWt 0.00 0.00 0.00LOI % DM 74.8 77.7 77.1Ash % DM 25.2 22.3 22.9P as P2O5 g l−1 FWt 1.11 1.05 1.03K as K2O g l−1 FWt 2.99 2.82 2.89Ca as CaO g l−1 FWt 5.45 3.10 2.37Mg as MgO g l−1 FWt 0.72 0.74 0.74S as SO3 g l−1 FWt 0.86 0.79 0.79
a DM: dry matter.b FWt: fresh weight.
British soil classification (Avery, 1980) defines the soil as clayeytypical non-calcareous pelosol of the Halstow series and as a stagni-vertic cambisol, and as aeric haplaquept using FAO and USDAtaxonomy, respectively. The soil texture was a silty clay loam(Harrod and Hogan, 1981). Initial analysis of the properties of theupper 10 cm of the soil profile indicated a total N content of 0.44%,total carbon (C) content of 3.94%, C:N ratio of 8.9, pH of 5.9 and bulkdensity (BD) of 0.88 Mg m−3.
2.2. Experimental design
The experiment was set up in a randomized block design, withthree replicate plots of the following treatments: (1) control withno N application (zero N), (2) mineral fertilizer as NH4NO3 (AN)and (3) cattle slurry (SL). Replicate plots were 15.0 m2 in area(3.0 m × 5.0 m), and within each main replicate plot three zoneswere marked out separating chamber, soil sampling and grass yieldmeasurement areas. Within each plot, three chambers were fixedwithin an area of 3.0 m2 (3.0 m × 1.0 m), whilst two zones each of6.0 m2 in area (3.0 m × 2.0 m) were left for the soil sampling andgrass yield measurements. A distance of 1 m was kept betweenplots.
2.3. Application events and characteristics of mineral fertilizerand slurry used
The applied NH4NO3 comprised 34.5% N. Cattle slurry was col-lected from a dairy farm located near North Wyke. Treatments wereapplied by hand three times during the experiment (1st applica-tion: 16th May, 2nd application: 24th June and 3rd application:8th September) at a target rate of 80 kg N ha−1 (8 g N m−2) on eachapplication. Slurry was analyzed for total N prior to each appli-cation (Table 1). Slurry was spread at rates of 2.26 l m−2 in Mayand June and 2.48 l m−2 in September, and the NH4NO3 at the ratesof 23.2 g m−2, equivalent to 80 kg total N ha−1 at each of the threeapplications.
2.4. Chamber design and operation
The closed chamber technique was used to quantify the GHGflux measurements in the field (Rochette and Erisksen-Hamel,2008). Chambers comprised white polyvinyl chloride (PVC) openended boxes with a volume of 0.032 m3 (length 40 cm, width 40 cm,height 30 cm, Cardenas et al., 2010). The upper edge of the chamber

A. Louro et al. / Agriculture, Ecosystems and Environment 181 (2013) 1– 11 3
had a ‘U’ shaped channel, which was filled with water to ensurean airtight seal with the PVC lid. The lid was fitted with a samp-ling port with a three-way valve. Three chambers were used perreplicate plot (i.e., 27 chambers in total). To ensure a good sealbetween the chamber and soil, the chambers were inserted intothe soil to a depth of 10 cm > 24 h before the flux measurementsbegan (Parkin and Venterea, 2010) and left in the same place untilthe first plot harvest to avoid soil disturbances, which could affectthe soil-atmosphere gas transfer. Chambers were returned to thesame position after each plot harvest. The effective height of eachchamber above the ground (H) was measured three times: at thebeginning of experiment (5th May) and after the first and secondgrass harvests (22nd June and 24th August). Height measurementswere taken internally at the center of each wall and in the center ofthe chamber. The resultant chamber effective height was the meanof the 5 points taken, and ranged between 20.6 and 25.4 cm. Val-ues recorded were used to calculate GHG fluxes from each chamberafter the insertion in the soil.
On each sampling occasion, the chamber was closed for 40 min.Ten ambient air samples were taken (5 at the start of the chamberclosure, and 5 at the end of the 40 min period) to provide back-ground values for N2O, and stored in pre-evacuated 20 ml glassvials. The average of N2O, CH4 and CO2 concentrations in theseambient air samples was used as the time zero sample (T0). After40 min (T40) the chamber headspace was sampled via the three-way valve on the chamber lid. 60 ml gas samples were taken fromeach chamber headspace (and from ambient air) and transferredto 20 ml pre-evacuated glass vials, using a syringe and hypodermicneedle to inject the sample into the vial. A second needle was usedto release the sample to ambient pressure. Soil surface tempera-ture inside chambers was also recorded every sampling date andthe data used to calculate the gas fluxes.
We assumed a linear accumulation of headspace GHG concen-trations in our flux calculations; an observation we have verifiedfor N2O using the same chambers on the same soil type followingAN applications (Cardenas et al., 2010), thus using our resourcesto ensure we accounted for spatial variability of fluxes within eachplot (using three chambers per plot), and opting to sample at highfrequency (see next section), improving the ability to account fortemporal variability of fluxes. In addition, data collected from anearby experiment carried out at the same time as the currentexperiment, showed that CO2 accumulation in the headspace waslinear at 40 min in 88% of the chambers tested (L. Cardenas and D.Chadwick, personal communication).
2.5. Greenhouse gas flux measurements and laboratory analysis
Measurements of N2O, CO2 and CH4 were conducted frequentlyover a 6-month period, from 16th May to 13th November 2011.Gas sampling was usually carried out between 10:00 and 12:00 h.Chambers were sampled every day during the first 15 days afterAN and SL applications, and every two days until the next applica-tion. Gas samples were usually analyzed within 24 h of collectionwith a Perkin Elmer Auto-system gas chromatograph (GC500)equipped with two Elite Plot Q columns (30 m × 0.53 mm) andtwo detectors: 63Ni electron capture detector (ECD) at 300 ◦C formeasuring N2O and a flame ionization detector (FID) at 350 ◦Cfor CO2 equipped with a methanizer to analyze CH4. This systemwas attached to an auto-sampler (Perkin Elmer headspace samplerTurbo matrix 110), which extracted a sample of 0.03 �l min−1 fromthe sampling vial and injected it into the GC. Calibrations were per-formed using standards of N2O, CO2 and CH4 (0.33, 1.59, 5.23 ppmfor N2O; 2.97, 1198, 2467 ppm for CO2; 2.05, 5.18, 10.18 ppmfor CH4). Concentrations of gases were calculated by comparingpeak areas integrated with those obtained with the standards ofeach gas.
Fluxes were calculated from the accumulation of gas in thechamber as follows:
F = � × H × (C40 − C0)/t × 273.15/T × 24 × 104 (1)
where F is the gas flux (kg N2O-N ha−1 day−1, g CH4 ha−1 day−1,kg CO2-C ha−1 day−1), � is the gas density (N2O-N: 1.26 kg m−3;CH4: 717 g m−3; CO2-C: 0.536 kg m−3) under STP conditions(273.15 K, 101,325 Pa), H is the effective height of the chamber (m),C40 − C0 is the gas concentration at 40 min (T40) after chamber clo-sure minus gas concentration of ambient sample (T0) (�m3 m−3),t is the time of chamber closure (40 min) and T is the temperature(K) inside the chamber. Cumulative emissions were calculated bythe trapezoidal method (Cardenas et al., 2010; Van den Pol-vanDasselaar and Oenema, 1997; Velthof et al., 1996). For N2O andCH4, emissions from the zero N treatment were subtracted from thecorresponding values in fertilized plots for the whole period of mea-surements, giving net emissions attributable to the N applied (forN2O) or to the amount of slurry (for CH4). Seasonal N2O emissionfactors (EFs), expressed as % N applied to the soil, were calculatedfor each amendment studied during the experiment by dividing thenet N2O cumulative fluxes by the total N applied. Methane emis-sion factors, expressed as % C applied in the soil, were calculatedfor each application of slurry by dividing the net cumulative CH4fluxes by the total amount of slurry applied.
2.6. Ammonia (NH3) losses
Although NH3 losses were not measured in the field, an esti-mation of the percentage of NH3 loss from each application wascalculated using the empirical model ALFAM (Ammonia Lossesfrom Field-Applied Animal Manure) provided by Sogaard et al.(2002). The ALFAM model is a multiple regression model basedon empirical data of NH3 loss from experiments conducted inseven European countries (UK, Denmark, The Netherlands, Norway,Sweden, Switzerland and Italy) and it uses the Michaelis–Menteltype equation to predict NH3 loss over time (t) after slurry applica-tion as:
N(t) = Nmax × (t/(t + Km)) (2)
where N(t) is the cumulative loss fraction of total amoniacal nitro-gen (TAN), Nmax (as % NH4
+-N applied) the total time integratedloss and Km the time (h) in which 50% of NH3 loss occurred. Theinstantaneous emission rate corresponds to the derivated dN/dt ofEq. (2) as follows:
dN/dt : Nmax × (Km × (t + Km)−2 (3)
For the estimation, variables related to slurry, (type of slurry(pig/cattle), application technique, DM and NH4
+-N contents),weather (air temperature, wind speed) and soil conditions(dry/wet) are required model inputs because these significantlyaffect Nmax and Km.
In this experiment, NH3 losses were estimated to provide anunderstanding of a major loss pathway of available N, which couldbe used to help explain the patterns of N2O emissions observed. Thevalue of Nmax provided after each of the three slurry applicationswas considered as the cumulative NH3 loss and expressed as per-centage of NH4
+-N applied with the slurry. Losses of NH3 from ANapplications were estimated using the emission factor of 1.4% (per-centage of loss of NH4
+-N applied) reported by Misselbrook et al.(2004), in grasslands fertilized with NH4NO3 and without grazingmanagement.
2.7. Soil sampling and analysis
During the experiment, flux measurements were accompaniedby measurements of soil moisture at a depth of 0–10 cm. Every

4 A. Louro et al. / Agriculture, Ecosystems and Environment 181 (2013) 1– 11
sampling day, one soil core per replicate of each treatment wastaken and then unified into one sample per treatment for analy-sis of gravimetric soil moisture. This parameter was measured byoven-drying the samples at 105 ◦C for 24 h. Soil BD of the 0–10 cmlayer was determined at the start of the experiment from five undis-turbed blocks of soil with a mean height of 8.6 cm. Measures of thewidth and length of each side of block were recorded. The volumeof soil was calculated and the soil was dried at 105 ◦C to constantweight to determine the dry weight. Bulk density was then calcu-lated from the weight of the dry soil and the volume it occupiedand expressed as Mg m−3. Particle density (PD) was assumed to be2.65 Mg m−3. Porosity was calculated according to Eq. (4):
Porosity = 1 − (BD/PD) (4)
Gravimetric soil water content was then converted to % soilwater filled pore space (WFPS) using the following equation (5):
WFPS = ((Water content × BD)/Porosity) × 100 (5)
Soil ammonium (NH4+-N) and nitrate (NO3
−-N) contents wereanalyzed once a week. Five cores (0–10 cm) per plot were takenfrom the soil sampling zone in each plot, extracted with 2 M KCl(Searle, 1984) for 1 h at 200 rpm in a horizontal shaker (1:2 freshsoil:extractant ratio) and then filtered through Whatman No. 5paper. Extracts were analyzed for NO3
−-N and NH4+-N soil contents
using a SKALAR SANPlus analyser (provided with a SKALAR 5000-02 analyser unit, a SKALAR 28503902 0 photometric detector, aSKALAR 1050d auto-sampler and a circulating water bath).
2.8. Slurry analysis
Slurry samples were analyzed for total N by Kjeldahl (AOAC,1990). Slurry density was calculated on the basis of the volumeoccupied by a mass of sample. The pH of the slurry was mea-sured directly with a pH meter (HANNA HI 9025). Total C wasalso analyzed using a TOC analyzer (Skalar FormacsHT, Breda, TheNetherlands). Dry matter (DM) was determined after 24 h of dryingat 105 ◦C. Organic matter (OM) was estimated by loss on ignition(LOI); oven-dried samples (105 ◦C) were weighed and then ashedfor 24 h at 550 ◦C in a muffle furnace. LOI was calculated as follows:
LOI (%) = ((oven-dried sample weight − ashed sample weight)/oven-dried sample weight) × 100 (6)
Mineral nitrogen (NO3−-N and NH4
+-N) was extracted using 2 MKCl. Slurry extracts were analyzed using a SKALAR SANPlus analyser(described in soil sampling and analysis section). Analysis of othermacronutrients (P, K, Ca, Mg, S) were carried out by a commer-cial laboratory using the aqua-regia method (ISO, 1995) followedby determination by inductively coupled plasma optical emissionsspectrometry (ICP-OES). Chemical and physical properties of thecattle slurry applied to the soil are summarized in Table 1.
2.9. Grass yield and composition
All plots were harvested three times, 21st June, 24th August and31st October, using a reciprocating mower to cut an area of 2 × 1 m2,at a cutting height of 5 cm. Fresh grass samples were taken fromthe harvesting zone for analysis for DM. This parameter was deter-mined after 16 h drying at a temperature of 80 ◦C. Dried and groundgrass samples were also analyzed for total N. Both parameters wereused to determine N plant offtake after each cut.
2.10. Meteorological data
Total daily rainfall, daily average air and soil (10 cm depth) tem-peratures were recorded between 22nd June and 13th November by
0
5
10
15
20
25
30
0
20
40
60
80
100
120
140
160
180
200
JAN FEB MAR APR MAY JUN JUL AUG SEP OCT NOV DEC
Tem
pera
ture (ºC
)
Ra
infa
ll (
mm
)
Rainfall 40 years-mean Rainfall 2011
Air Temperature (ºC) 40 years-mean Air Temperature (ºC) 2011
0
5
10
15
20
25
0
5
10
15
20
25
30
35
40
1st
Appl 7
14
21
28
2nd A
ppl 7
14
21
28
35
42
49
56
63
70
3rd
Appl 7
14
21
28
35
42
49
56
63
Tem
pera
ture (ºC
)
Ra
infa
ll (
mm
)
Days after fertilization
Rainfall (mm) Soil temperature (ºC) Air temperature (ºC)
a
b
Fig. 1. (a) Mean monthly rainfall and air temperature in 2011 and the 40-year aver-ages (1961–2000). (b) Total daily rainfall and average daily air and soil temperaturesrecorded during the experiment.
a weather station within 500 m of the experimental area. Also, theaverage wind speed (at 10 m height) for the day of the slurry addi-tion and the following day was used as a model input to estimateNH3 losses by the ALFAM model, after each application. Aver-age monthly rainfall, air and soil temperature data for the last 40years (1961–2000) were used to compare the weather conditionsobserved during the experiment.
2.11. Statistical analysis
Statistical analyses were performed using Sigmaplot (11.0). Oneway ANOVA was used to study the effect of fertilization withNH4NO3 or cattle slurry on cumulative GHG emissions followingeach fertilization event, and for the total experiment. Two wayrepeated measures ANOVA was used to compare the same effecton mean N2O, CH4 and CO2 fluxes under the different weather con-ditions and to determine significance of changes in soil (mineral Nand WFPS) and grass yields (DM, % N contents, N offtake) during theexperiment. Daily fluxes of N2O, CH4 and CO2 were related to cor-responding soil and weather parameters using Pearson correlationanalysis. The “r” value provided by Sigmaplot was used to provethe influence of these environmental conditions on the pattern ofGHGs.
3. Results
3.1. Weather conditions
The annual mean air temperature in 2011 was on average 0.9 ◦C higher thanthe 40-year mean value (Fig. 1a), Compared to the 40-year average (1961–2000),

A. Louro et al. / Agriculture, Ecosystems and Environment 181 (2013) 1– 11 5
a
0
5
10
15
20
25
30
35
40
45
50
-7
1st
Appl 7
14
21
28
2nd A
ppl 7
14
21
28
35
42
49
56
63
3rd
Appl 7
14
21
28
35
42
49
56
63
NO
3- -
N (
kg
ha
-1)
Days after fertilization
zero N AN SL
0
5
10
15
20
25
30
35
40
45
50-7
1st
Ap
pl 7
14
21
28
2n
d A
pp
l 7
14
21
28
35
42
49
56
63
3rd
Ap
pl 7
14
21
28
35
42
49
56
63
NH
4+-N
(k
g h
a-1
)
Days after fertilization
zero N AN SL
b
Fig. 2. Soil inorganic NH4+-N (a) and NO3
−-N (b) contents in the fertilized and control treatments during the 6-month study. Treatments: (zero N) unfertilized or control;(AN) ammonium nitrate; (SL): slurry. Each point represents the mean value of three replicates ± standard error.
Fig. 3. A schematic representation of the time periods studied between N applications. The two groups of periods are represented by the letters ‘A’ and ‘B’. Arrows representthe time of fertilization.
2011 was characterized by warm temperatures in spring (March–May) andautumn (September–November), and relatively cool conditions during summer(June–August). The mean daily air temperature during the sampling period (from16th May to 13th November 2011) ranged from 6.4 ◦C (6th November) to 18.2 ◦C(2nd October) (Fig. 1b). November was the coldest month of the experimental periodwith a mean monthly temperature of 10.3 ◦C, whereas maximum mean monthlytemperature was recorded in July (14.5 ◦C).
Soil temperature ranged from 9.1 ◦C (7th November) to 19.3 ◦C (28th July). Dailysoil temperature was around 14 ◦C in the period after the first N-fertilization andincreased to mean values of 16.5 ◦C in the period after the second application,coinciding with the summer growing season. Mean soil temperature decreased to13.3 ◦C, after the third N application, which coincided with the arrival of the autumn.
Rainfall in 2011 was low compared with the 40-year mean (21% less rainfall)(see Fig. 1a), particularly in the months of March, April and May (before the firstN application) when the precipitation was only 73%, 71% and 52% of the 40-yearaverage. Total precipitation during the sampling period was 427 mm, (76, 166 and186 mm fell during the period after the first, second and third N-fertilization event,respectively) with October as the wettest month and May as the driest. Two substan-tial precipitation events (more than 20 mm day−1) were recorded on 28th Augustand on 24th October (Fig. 1b).
3.2. Soil mineral N
After each of the three fertilizer applications in the experiment, only high soilNH4
+-N values were found in the AN plots (Fig. 2a), with maximum values of 20.6,11.0 and 14.8 kg N ha−1 in the first, second and third application, respectively. Valuesof between 0.2 and 2.5 kg N ha−1 were found in the zero N plots and between 0.1 and3.6 kg N ha−1 in the SL plots. Also, the highest soil NO3
−-N contents were found in ANplots (Fig. 2b), with maximum values of 22.4, 15.4 and 17.0 kg N ha−1 after the first,second and third N-fertilization, respectively. Zero or very low values of NO3
−-Nwere recorded in the zero N and SL plots, with values in the range of 0.0–1.4 kg N ha−1
in zero N plots and 0.0–1.3 kg N ha−1 in SL plots. Two way repeated measures ANOVAshowed statistical differences between treatments in NH4
+-N and NO3−-N contents
with date of sampling (P < 0.001) and these contents were significantly higher inAN plots within the first three weeks after each application event. No statisticaldifferences were found between treatments in the soil mineral N contents after thistime (for each N-fertilization) (P > 0.05).
Based on the significant statistical increases in soil NH4+-N and NO3
−-N concen-trations during the first three weeks after each fertilization event, GHG emissionsdata recorded in this experiment were collated into two periods within eachfertilization event (Fig. 3). The period corresponding to the first three weeks of mea-surements (24 days) after each N application was designated as period ‘A’, and theremaining days until the next fertilization or end of the experiment, designated asperiod ‘B’.
3.3. Soil WFPS
Low %WFPS values were recorded in the period after the first two fertilizationdates (Fig. 4a). The dry conditions during the spring and summer resulted in WFPSvalues ranging from 35% to 65% and from 37% to 67% after the first and second appli-cation, respectively. These values were below the threshold range of 60–70% WFPS,where denitrification becomes dominant and high N2O fluxes are often observed(Bateman and Baggs, 2005; Davidson, 1993; Dobbie et al., 1999; Linn and Doran,1984). After the third application, there was an increased frequency of rainfallevents so %WFPS increased to values ranging from 54% to 93% WFPS, which weresignificantly greater than the WFPS following the first two fertilization occasions(P < 0.001). Statistical analysis showed that the mean soil WFPS value during thelatter phase after the autumn application (period ‘B’) was the highest of the exper-iment (P < 0.001) (Fig. 5a). However, there were no significant differences in thevalues of %WFPS of soil samples from zero N, AN and SL plots within each samplingdate (P > 0.05) and within each period (P > 0.05).
3.4. Greenhouse gas fluxes
A total of 112 GHG flux samplings were carried out over the 6-month period(16th May–13th November 2011); 25 after the first N-fertilizer application and 43and 44 after the second and third applications, respectively. Fluxes of N2O werelow throughout the whole experiment in all treatments studied (Fig. 4b). Zero Nplots resulted in values from −0.004 to 0.006 kg N2O-N ha−1 day−1. Fluxes from ANand SL plots ranged from −0.005 to 0.008 kg N2O-N ha−1 day−1 and from −0.004 to0.004 kg N2O-N ha−1 day−1, respectively. The applications of AN and SL were notfollowed by a distinct peak of emission following the first application in May. Thehighest values were observed 15 days after the application of AN and SL and aftera period of some rainfall events <5 mm. After the second application, increases inN2O fluxes were observed on the fourth (higher in AN plots) and twenty fourth days(after amendment applications). After the third application, only AN plots showedan increase in N2O fluxes from the 10th day to the 14th day, during which timemaximum N2O fluxes were recorded. Forty-six days after the third application of thetreatments small peaks of N2O in zero N and SL plots were observed. This continuedfor 2 further days from the AN plots only.
Fluxes of CH4 (Fig. 4c) were generally negative or close to zero from thezero N plots and those fertilized with AN. Values ranged between −11.5 and6.4 g CH4 ha−1 day−1 and between −10.8 and 4.1 g CH4 ha−1 day−1 from the zero Nand AN treatments, respectively. Only plots fertilized with SL showed distinct peaksof CH4 fluxes between days 1 and 3 following each slurry application. Values rangedfrom −9.8 to 304.5 g CH4 ha−1 day−1. Maximum CH4 fluxes appeared immediatelyafter each SL application, with values of 65.4, 129.6 and 304.5 g CH4 ha−1 day−1 inMay, June and September, respectively.

6 A. Louro et al. / Agriculture, Ecosystems and Environment 181 (2013) 1– 11
0
20
40
60
80
100
120
140
160
180
200
1st
Ap
pl 7
14
21
28
2n
d A
pp
l 7
14
21
28
35
42
49
56
63
70
3rd
Ap
pl 7
14
21
28
35
42
49
56
63
kg
CO
2-C
ha
-1d
ay
-1
Days after fertilization
A BA BA B
0
10
20
30
40
50
60
70
80
901
st A
pp
l 7
14
21
28
2n
d A
pp
l 7
14
21
28
35
42
49
56
63
70
3rd
Ap
pl 7
14
21
28
35
42
49
56
63
%W
FP
S
Days after fertilization
b
d
zero N AN SL
A BA BA B A BA BA B
8
58
108
158
208
258
308
358
- 20
- 16
- 12
-8
-4
0
4
8
1st
Ap
pl 7
14
21
28
2n
d A
pp
l 7
14
21
28
35
42
49
56
63
70
3rd
Ap
pl 7
14
21
28
35
42
49
56
63
Days after fertilization
g C
H4
ha
-1d
ay
-1
A BA BA B
a
c
-0.008
-0.004
0.000
0.004
0.008
0.012
0.016
1st
Ap
pl 7
14
21
28
2n
d A
pp
l 7
14
21
28
35
42
49
56
63
70
3rd
Ap
pl 7
14
21
28
35
42
49
56
63
kg
N2O
-N h
a-1d
ay
-1
Days after fertilization
Fig. 4. (a) % Water filled pore space (WFPS) and daily fluxes of N2O (b), CH4 (c) and CO2 (d). Letters ‘A’ and ‘B’ represent the different periods after fertilization and horizontalarrows, their length. Periods – 1st fertilization: ‘A’ (16th May–8th June) and ‘B’ (8th–22nd June); 2nd fertilization: ‘A’ (22nd June–16th July) and ‘B’ (16th July–6th September);3rd fertilization: ‘A’ (6th–30th September) and ‘B’ (30th September–13th November). Treatments: (zero N) control; (AN) ammonium nitrate; (SL) slurry. Each point representsthe mean value of three replicates ± standard error.
Fluxes of CO2 (Fig. 4d) ranged from 5.7 to 91.8, from 8.3 to 115.6 and from 9.9to 97.4 kg CO2-C ha−1 day−1 from the zero N, AN and SL treatments, respectively.Immediately after grass was harvested, CO2 fluxes were low. Maximum CO2 peaksin the whole experiment were observed after the first N application.
3.5. Cumulative GHG fluxes
Total cumulative fluxes of N2O, CO2 and CH4 for the whole experimental period(16th May–13th November) and in the periods between each fertilizer applica-tion and the next fertilization or end of the experiment (1st fertilization: ‘A’ (16thMay–8th June) + ‘B’ (8th June–22nd June); 2nd fertilization: ‘A’ (22nd June–16thJuly) + ‘B’ (16th July–6th September); 3rd fertilization: ‘A’ (6th September–30thSeptember) + ‘B’ (30th September–13th November)) are shown in Table 2. Also,mean cumulative N2O, CH4, and CO2 fluxes (Fig. 5b, c and d, respectively) wereexplored statistically for the periods ‘A’ and ‘B’ after each fertilization (see previousdefinition of these periods).
Total N2O cumulative fluxes from the AN plots resulted in slightly higher fluxesthan those recorded from the zero N and SL treatments, but these differences werenot statistically different (P > 0.05). Plots fertilized with AN showed significant dif-ferences in mean cumulative N2O fluxes (P < 0.05) in the period ‘A’ after the 3rdN-fertilization compared with those fluxes from the zero N and SL plots (Fig. 5b).Mean N2O fluxes from AN plots were 44% and 53% higher than those from SL andzero N, respectively. In terms of N2O EFs, the total application of 240 kg N ha−1 withAN and SL caused a total N2O-N loss during 6-months measurements of 0.21 and0.17 kg N ha−1, respectively, accounting for 0.02% and 0.003% of the N applied.
Statistically significant differences were found in total CH4 cumulative fluxes(Table 2) between treatments (P < 0.001). Plots fertilized with slurry resulted influxes of 0.41 kg CH4 ha−1, with negative fluxes from the other treatments (−0.52and −0.60 kg CH4 ha−1, from zero N and AN plots, respectively). Mean cumulativeCH4 emissions from SL were significantly greater (P < 0.001) compared with zero Nand AN treatments in the periods ‘A’ (Fig. 5c). The quantity of CH4 emitted in period‘A’ increased with successive SL applications, with the third application resultingin the greatest flux. In the periods ‘B’, no differences were found (P > 0.05) betweentreatments. Indeed during these periods (‘B’), the SL plots resulted in negative cumu-lative CH4 fluxes, similar to those from the zero N and AN plots. Comparing the
mean CH4 cumulative fluxes from periods ‘B’ after fertilization, we found that CH4
uptake by the soil was significantly lower after the third application compared withthe first and second fertilization (P < 0.001). The application of cattle slurry resultedin CH4 emission factors representing 0.01, 0.04% and 0.06% of the C applied fol-lowing each application, and a total for the whole experiment of 0.04% C applied(kg CH4-C/kg slurry-C).
Table 2Cumulative fluxes after the three fertilizations and total cumulative fluxes of N2O(kg N2O-N ha−1), CH4 (kg CH4 ha−1) and CO2 (Mg CO2-C ha−1). Mean value of threereplicates and standard error (between brackets). Treatments: (zero N) control; (AN)ammonium nitrate; (SL) slurry. Fertilizations: 1st: ‘A’ (16th May–8th June) + ‘B’ (8thJune–22nd June); 2nd: ‘A’ (22nd June–16th July) + ‘B’ (16th July–6th September);3rd: ‘A’ (6th September–30th September) + ‘B’ (30th September–13th November);total (16th May–13th November). Treatments with different letter within the samerow are statistically different (P < 0.05).
Treatment
Gas Fertilizations Zero N AN SL
N2O 1st 0.007 (0.009) a 0.006 (0.003) a 0.007 (0.007) a2nd 0.105 (0.026) a 0.089 (0.008) a 0.102 (0.020) a3rd 0.048 (0.010) b 0.115 (0.022) a 0.058 (0.006) bTotal 0.160 (0.045) a 0.205 (0.031) a 0.166 (0.019) a
CH4 1st −0.13 (0.01) a −0.12 (0.01) a −0.02 (0.02) a2nd −0.31 (0.03) b −0.32 (0.02) b 0.01 (0.08) a3rd −0.08 (0.02) b −0.17 (0.04) b 0.42 (0.01) aTotal −0.52 (0.02) b −0.60 (0.03) b 0.41 (0.10) a
CO2 1st 1.59 (0.09) a 2.04 (0.02) a 1.56 (0.14) a2nd 3.42 (0.09) a 3.91 (0.16) a 3.60 (0.34) a3rd 2.61 (0.04) a 2.90 (0.16) a 2.79 (0.12) aTotal 7.61 (0.02) a 8.85 (0.22) a 7.96 (0.59) a
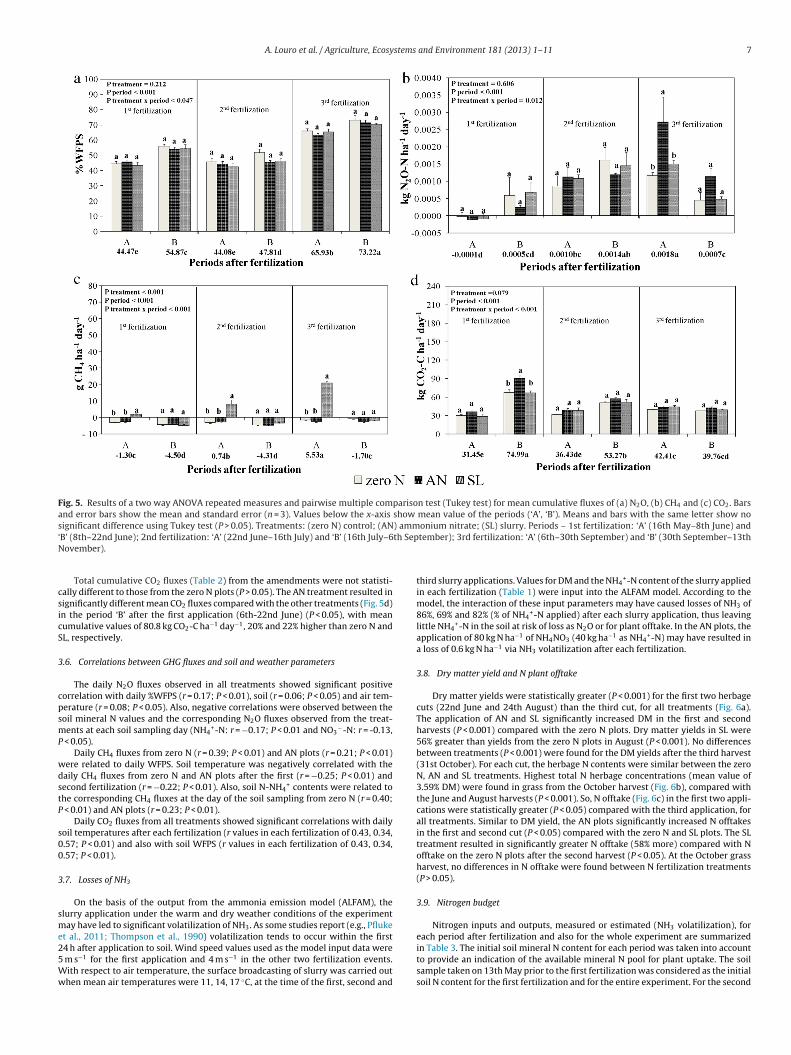
A. Louro et al. / Agriculture, Ecosystems and Environment 181 (2013) 1– 11 7
Fig. 5. Results of a two way ANOVA repeated measures and pairwise multiple comparison test (Tukey test) for mean cumulative fluxes of (a) N2O, (b) CH4 and (c) CO2. Barsand error bars show the mean and standard error (n = 3). Values below the x-axis show mean value of the periods (‘A’, ‘B’). Means and bars with the same letter show nosignificant difference using Tukey test (P > 0.05). Treatments: (zero N) control; (AN) ammonium nitrate; (SL) slurry. Periods – 1st fertilization: ‘A’ (16th May–8th June) and‘B’ (8th–22nd June); 2nd fertilization: ‘A’ (22nd June–16th July) and ‘B’ (16th July–6th September); 3rd fertilization: ‘A’ (6th–30th September) and ‘B’ (30th September–13thNovember).
Total cumulative CO2 fluxes (Table 2) from the amendments were not statisti-cally different to those from the zero N plots (P > 0.05). The AN treatment resulted insignificantly different mean CO2 fluxes compared with the other treatments (Fig. 5d)in the period ‘B’ after the first application (6th-22nd June) (P < 0.05), with meancumulative values of 80.8 kg CO2-C ha−1 day−1, 20% and 22% higher than zero N andSL, respectively.
3.6. Correlations between GHG fluxes and soil and weather parameters
The daily N2O fluxes observed in all treatments showed significant positivecorrelation with daily %WFPS (r = 0.17; P < 0.01), soil (r = 0.06; P < 0.05) and air tem-perature (r = 0.08; P < 0.05). Also, negative correlations were observed between thesoil mineral N values and the corresponding N2O fluxes observed from the treat-ments at each soil sampling day (NH4
+-N: r = −0.17; P < 0.01 and NO3−-N: r = -0.13,
P < 0.05).Daily CH4 fluxes from zero N (r = 0.39; P < 0.01) and AN plots (r = 0.21; P < 0.01)
were related to daily WFPS. Soil temperature was negatively correlated with thedaily CH4 fluxes from zero N and AN plots after the first (r = −0.25; P < 0.01) andsecond fertilization (r = −0.22; P < 0.01). Also, soil N-NH4
+ contents were related tothe corresponding CH4 fluxes at the day of the soil sampling from zero N (r = 0.40;P < 0.01) and AN plots (r = 0.23; P < 0.01).
Daily CO2 fluxes from all treatments showed significant correlations with dailysoil temperatures after each fertilization (r values in each fertilization of 0.43, 0.34,0.57; P < 0.01) and also with soil WFPS (r values in each fertilization of 0.43, 0.34,0.57; P < 0.01).
3.7. Losses of NH3
On the basis of the output from the ammonia emission model (ALFAM), theslurry application under the warm and dry weather conditions of the experimentmay have led to significant volatilization of NH3. As some studies report (e.g., Pflukeet al., 2011; Thompson et al., 1990) volatilization tends to occur within the first24 h after application to soil. Wind speed values used as the model input data were5 m s−1 for the first application and 4 m s−1 in the other two fertilization events.With respect to air temperature, the surface broadcasting of slurry was carried outwhen mean air temperatures were 11, 14, 17 ◦C, at the time of the first, second and
third slurry applications. Values for DM and the NH4+-N content of the slurry applied
in each fertilization (Table 1) were input into the ALFAM model. According to themodel, the interaction of these input parameters may have caused losses of NH3 of86%, 69% and 82% (% of NH4
+-N applied) after each slurry application, thus leavinglittle NH4
+-N in the soil at risk of loss as N2O or for plant offtake. In the AN plots, theapplication of 80 kg N ha−1 of NH4NO3 (40 kg ha−1 as NH4
+-N) may have resulted ina loss of 0.6 kg N ha−1 via NH3 volatilization after each fertilization.
3.8. Dry matter yield and N plant offtake
Dry matter yields were statistically greater (P < 0.001) for the first two herbagecuts (22nd June and 24th August) than the third cut, for all treatments (Fig. 6a).The application of AN and SL significantly increased DM in the first and secondharvests (P < 0.001) compared with the zero N plots. Dry matter yields in SL were56% greater than yields from the zero N plots in August (P < 0.001). No differencesbetween treatments (P < 0.001) were found for the DM yields after the third harvest(31st October). For each cut, the herbage N contents were similar between the zeroN, AN and SL treatments. Highest total N herbage concentrations (mean value of3.59% DM) were found in grass from the October harvest (Fig. 6b), compared withthe June and August harvests (P < 0.001). So, N offtake (Fig. 6c) in the first two appli-cations were statistically greater (P < 0.05) compared with the third application, forall treatments. Similar to DM yield, the AN plots significantly increased N offtakesin the first and second cut (P < 0.05) compared with the zero N and SL plots. The SLtreatment resulted in significantly greater N offtake (58% more) compared with Nofftake on the zero N plots after the second harvest (P < 0.05). At the October grassharvest, no differences in N offtake were found between N fertilization treatments(P > 0.05).
3.9. Nitrogen budget
Nitrogen inputs and outputs, measured or estimated (NH3 volatilization), foreach period after fertilization and also for the whole experiment are summarizedin Table 3. The initial soil mineral N content for each period was taken into accountto provide an indication of the available mineral N pool for plant uptake. The soilsample taken on 13th May prior to the first fertilization was considered as the initialsoil N content for the first fertilization and for the entire experiment. For the second
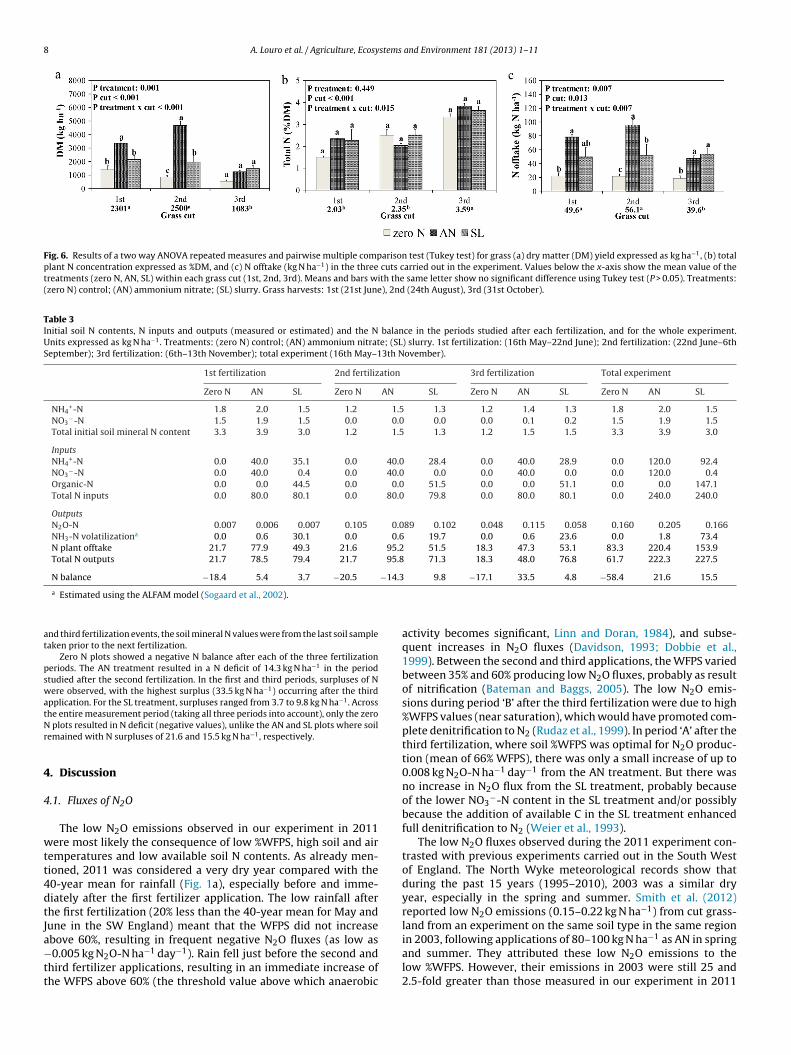
8 A. Louro et al. / Agriculture, Ecosystems and Environment 181 (2013) 1– 11
Fig. 6. Results of a two way ANOVA repeated measures and pairwise multiple comparison test (Tukey test) for grass (a) dry matter (DM) yield expressed as kg ha−1, (b) totalplant N concentration expressed as %DM, and (c) N offtake (kg N ha−1) in the three cuts carried out in the experiment. Values below the x-axis show the mean value of thetreatments (zero N, AN, SL) within each grass cut (1st, 2nd, 3rd). Means and bars with the same letter show no significant difference using Tukey test (P > 0.05). Treatments:(zero N) control; (AN) ammonium nitrate; (SL) slurry. Grass harvests: 1st (21st June), 2nd (24th August), 3rd (31st October).
Table 3Initial soil N contents, N inputs and outputs (measured or estimated) and the N balance in the periods studied after each fertilization, and for the whole experiment.Units expressed as kg N ha−1. Treatments: (zero N) control; (AN) ammonium nitrate; (SL) slurry. 1st fertilization: (16th May–22nd June); 2nd fertilization: (22nd June–6thSeptember); 3rd fertilization: (6th–13th November); total experiment (16th May–13th November).
1st fertilization 2nd fertilization 3rd fertilization Total experiment
Zero N AN SL Zero N AN SL Zero N AN SL Zero N AN SL
NH4+-N 1.8 2.0 1.5 1.2 1.5 1.3 1.2 1.4 1.3 1.8 2.0 1.5
NO3−-N 1.5 1.9 1.5 0.0 0.0 0.0 0.0 0.1 0.2 1.5 1.9 1.5
Total initial soil mineral N content 3.3 3.9 3.0 1.2 1.5 1.3 1.2 1.5 1.5 3.3 3.9 3.0
InputsNH4
+-N 0.0 40.0 35.1 0.0 40.0 28.4 0.0 40.0 28.9 0.0 120.0 92.4NO3
−-N 0.0 40.0 0.4 0.0 40.0 0.0 0.0 40.0 0.0 0.0 120.0 0.4Organic-N 0.0 0.0 44.5 0.0 0.0 51.5 0.0 0.0 51.1 0.0 0.0 147.1Total N inputs 0.0 80.0 80.1 0.0 80.0 79.8 0.0 80.0 80.1 0.0 240.0 240.0
OutputsN2O-N 0.007 0.006 0.007 0.105 0.089 0.102 0.048 0.115 0.058 0.160 0.205 0.166NH3-N volatilizationa 0.0 0.6 30.1 0.0 0.6 19.7 0.0 0.6 23.6 0.0 1.8 73.4N plant offtake 21.7 77.9 49.3 21.6 95.2 51.5 18.3 47.3 53.1 83.3 220.4 153.9Total N outputs 21.7 78.5 79.4 21.7 95.8 71.3 18.3 48.0 76.8 61.7 222.3 227.5
N balance −18.4 5.4 3.7 −20.5 −14.3 9.8 −17.1 33.5 4.8 −58.4 21.6 15.5
a Estimated using the ALFAM model (Sogaard et al., 2002).
and third fertilization events, the soil mineral N values were from the last soil sampletaken prior to the next fertilization.
Zero N plots showed a negative N balance after each of the three fertilizationperiods. The AN treatment resulted in a N deficit of 14.3 kg N ha−1 in the periodstudied after the second fertilization. In the first and third periods, surpluses of Nwere observed, with the highest surplus (33.5 kg N ha−1) occurring after the thirdapplication. For the SL treatment, surpluses ranged from 3.7 to 9.8 kg N ha−1. Acrossthe entire measurement period (taking all three periods into account), only the zeroN plots resulted in N deficit (negative values), unlike the AN and SL plots where soilremained with N surpluses of 21.6 and 15.5 kg N ha−1, respectively.
4. Discussion
4.1. Fluxes of N2O
The low N2O emissions observed in our experiment in 2011were most likely the consequence of low %WFPS, high soil and airtemperatures and low available soil N contents. As already men-tioned, 2011 was considered a very dry year compared with the40-year mean for rainfall (Fig. 1a), especially before and imme-diately after the first fertilizer application. The low rainfall afterthe first fertilization (20% less than the 40-year mean for May andJune in the SW England) meant that the WFPS did not increaseabove 60%, resulting in frequent negative N2O fluxes (as low as−0.005 kg N2O-N ha−1 day−1). Rain fell just before the second andthird fertilizer applications, resulting in an immediate increase ofthe WFPS above 60% (the threshold value above which anaerobic
activity becomes significant, Linn and Doran, 1984), and subse-quent increases in N2O fluxes (Davidson, 1993; Dobbie et al.,1999). Between the second and third applications, the WFPS variedbetween 35% and 60% producing low N2O fluxes, probably as resultof nitrification (Bateman and Baggs, 2005). The low N2O emis-sions during period ‘B’ after the third fertilization were due to high%WFPS values (near saturation), which would have promoted com-plete denitrification to N2 (Rudaz et al., 1999). In period ‘A’ after thethird fertilization, where soil %WFPS was optimal for N2O produc-tion (mean of 66% WFPS), there was only a small increase of up to0.008 kg N2O-N ha−1 day−1 from the AN treatment. But there wasno increase in N2O flux from the SL treatment, probably becauseof the lower NO3
−-N content in the SL treatment and/or possiblybecause the addition of available C in the SL treatment enhancedfull denitrification to N2 (Weier et al., 1993).
The low N2O fluxes observed during the 2011 experiment con-trasted with previous experiments carried out in the South Westof England. The North Wyke meteorological records show thatduring the past 15 years (1995–2010), 2003 was a similar dryyear, especially in the spring and summer. Smith et al. (2012)reported low N2O emissions (0.15–0.22 kg N ha−1) from cut grass-land from an experiment on the same soil type in the same regionin 2003, following applications of 80–100 kg N ha−1 as AN in springand summer. They attributed these low N2O emissions to thelow %WFPS. However, their emissions in 2003 were still 25 and2.5-fold greater than those measured in our experiment in 2011

A. Louro et al. / Agriculture, Ecosystems and Environment 181 (2013) 1– 11 9
after the applications in May and June, respectively. Smith et al.(2012) also reported an increase in N2O emissions during the samemonths following NH4NO3 applications in 2004, which was con-sidered a wet year, more typical of SW England. The amount ofN2O emitted in 2004 respect to 2003 was approximately 9 and4-fold higher in the applications of May and June, respectively.Cardenas et al. (2010), also, reported frequent and high N2O fluxesin 2006 (up to 200 g N2O-N ha−1 day−1 in June) after the applicationof 75 kg N ha−1 as NH4NO3 in a grazed grassland on the same soiltype, close to our experimental site. They ascribed these high N2Ofluxes to intense denitrification due to the anaerobic soil condi-tions generated by the large amount of rainfall recorded. Chadwicket al. (2000) observed large differences in N2O emissions follow-ing slurry application under different weather conditions at a siteclose to ours. They also observed that the amount of N2O emittedwas 10 times lower in July, under warmer conditions (WFPS val-ues below 60%), than in April, probably due to the relatively dry(aerobic) nature of the soil.
Unlike our experiment, the N2O fluxes from the experimentscited above (on the same soil and conducted at the same time asour experiment) were not limited by soil mineral N, only by theWFPS. In this sense, the loss of NH4
+-N through plant offtake andNH3 volatilization contributed to the low soil NH4
+-N observed dur-ing our experiment and, therefore, low level of soil NO3
−-N. In ourstudy, N2O emissions under the limited conditions of anaerobicityand soil NO3
−-N content resulted in emission factors lower than theIPCC default value of 1% (IPCC, 2006), and 8- and 40-fold lower thanthe lowest emission factors reported in the experiments carriedout in North Wyke and cited above for NH4NO3 and cattle slurry,respectively.
4.2. Other N losses
Converting the emissions to proportion of total N, the ALFAMmodel estimated that 25–38% of the total N in the slurry was lost byNH3 volatilization. These results contrasted with the estimated 1%following NH4NO3 application (Misselbrook et al., 2004). The cli-matic conditions (warm and windy), and the application method(surface broadcasting) coupled with the high DM content of theslurry would have enhanced NH3 volatilization from SL plots. Sur-face broadcasting of slurry results in greater NH3 losses comparedto other application methods such as band spreading, use of trailinghose or shallow injection (e.g., Huijsmans et al., 2003; Misselbrooket al., 1996; Pfluke et al., 2011; Smith et al., 2000) due to theincreased surface area of the slurry in contact with the air. Also, theabsence of rainfall immediately after the slurry spreading reducedthe infiltration of the slurry ammonium into the soil (Misselbrooket al., 2005). For the same reason, the high slurry DM content couldhave an important effect on NH3 loss (Misselbrook et al., 2005; Painet al., 1989); the DM content of the slurry used in our experimentwas at the value suggested by Sommer and Olesen (1991), whichpromotes NH3 emissions. The application under windy conditionswould have enhanced the mass transfer and gas exchange betweenthe slurry and the atmosphere (Misselbrook et al., 2005).
The warm and dry climatic conditions during the experimentstimulated plant growth on all treatments and thus generated ahigh plant N demand. For the zero N plots, the soil N deficitsobserved meant that plant N requirement was probably met viathe mineralization of soil OM. For the SL fertilized plots, plant off-take represented 64% (mean value) of the total N applied in eachfertilization. Moreover, plant N offtake seems to have been influ-enced by losses of N via NH3 volatilization on the SL treatment,where the lowest plant offtake observed (after the first application)coincided with the highest NH3 volatilization predicted, result-ing in a much reduced soil NH4
+-N content available for plantrequirements. Misselbrook et al. (1996) reported data about NH3
volatilization and N offtake from an experiment carried out at asward located in SW England after surface application of cattleslurry. Their data showed that the lowest N offtake (23.4 kg N ha−1)was in June coinciding with the highest NH3 losses (30.6 kg N ha−1).Also, Carran et al. (1982) observed that the soil conditions directlyinfluence the proportion of N lost as NH3 and N offtake by theplant. In the AN treatment, most of the N applied was taken up bythe grass, especially after the first two harvests, when the plant Nrequirements are highest. In addition, after the second applicationthe grass required more N than the N applied, suggesting mineral-ization of the OM supplied some the N required by the plant. Thedecrease in N offtake observed in the final harvest can be explainedby the increase in soil %WFPS after the third fertilization. Losses ofN could have limited the amount of N available for the plant. Thiseffect was observed by Abassi et al. (2005) in a permanent grasslandin Wales on soil in saturated conditions.
The N budget in the AN treatment showed a surplus(33.5 kg N ha−1) at the end of the experiment. From this surplus,only 2.8 kg N ha−1 remained in the soil as mineral N. We assumednegligible losses of N via nitrate leaching during our measurementperiod, as there was little opportunity for leaching to occur. So, thesurplus observed in AN could be attributed to losses as N2 due tothe anaerobic conditions caused by the high %WFPS after the thirdapplication. The resulting fraction of N applied attributed to N2 (42%of the N applied) is higher than the range observed (8–25.5%) byEstavillo et al. (1994), Rudaz et al. (1999) and Velthof et al. (1996)after application of mineral fertilizers in grasslands. Compared toAN, the SL treatment did not result the same surplus due to the highplant N offtake and the estimated losses of N by NH3 volatilization.
4.3. Fluxes of CH4
Methane emissions were observed immediately after the appli-cation of slurry. Fluxes were short-lived, occurring within the firsttwo (fertilization of June and September) to three days (in May)after application of the material. The larger mean CH4 cumulativefluxes in the later applications could be related to the different DMcontent of the slurries applied, and the environmental conditions.The DM content of the slurry applied in September (6.5%) was lowerthan the DM of the slurry applied in May. Lower DM contents couldenhance slurry infiltration in the soil promoting methanogenesisdue to greater anaerobicity. This was not the case for the June appli-cation compared to September because DM contents were similar.We suggest that soil moisture was the controlling factor in the CH4production due to lower %WFPS observed in the June application.
In the periods between application (periods ‘B’) the soilacted as a net sink, resulting in negative fluxes as low as−9.8 g CH4 ha−1 day−1. Similar conclusions concerning the CH4fluxes from the soil after cattle slurry applications were reported byChadwick et al. (2000), Jones et al. (2005) and Rodhe et al. (2006).Emissions of CH4 from the AN plots were not observed, with nega-tive fluxes often measured, indicating consumption of atmosphericCH4. Soil moisture had an influence in gas diffusivity in the soil and,therefore, controlled the amount of CH4 available for the oxidationby metanotrophic bacteria (Dunfield, 2007). In the periods follow-ing the first and second application, methanogenesis would havebeen suppressed in favor of methanotrophy due to the aerobic con-ditions generated by the low %WFPS in the zero N and AN plots.Pearson correlations between WFPS and CH4 consumption ratesobserved in these treatments seem to confirm this assumption.Methane uptake rates generally increase with decreasing soil mois-ture because molecular diffusion in water is a factor of 104 timesslower than in air (Borken et al., 2006). Higher soil temperaturein May and June compared to September may have increased CH4oxidation rates. Methane consumption increases when soil is dryand warm (Price et al., 2003). The Pearson correlations between soil

10 A. Louro et al. / Agriculture, Ecosystems and Environment 181 (2013) 1– 11
temperature and CH4 oxidation rates confirmed this effect. Nega-tive values showed CH4 consumption was enhanced (became morenegative) with the increase in soil temperature that occurred dur-ing the late spring and summer months. Some studies have shownthat mineral N fertilizer application may decrease CH4 consump-tion by an immediate inhibition of methanotrophs or change in themicrobial community due to repeated applications (Bodelier andLananbroek, 2004). In this sense, despite the positive correlationsfound between N-NH4
+ and CH4 comsumption values in the zeroN and AN plots, there was no evidence of inhibition in this study.
4.4. Fluxes of CO2
The CO2 fluxes resulting from the grassland and measured byusing static and opaque chambers represent ecosystem respira-tion. The application of slurries to the soil provides available Cfor soil microorganism activity, increasing of the microbial activityand resulting in large CO2 fluxes after slurry application (Fangueiroet al., 2007; Mejide et al., 2009; Rochette et al., 2000). However,in this experiment total CO2 fluxes from soils fertilized with SLresulted in similar CO2 fluxes from soils with zero N or amendedwith AN. These results suggest that soil CO2 fluxes may have beeninduced by the native soil C contents (Kuzyakov and Bol, 2006),rather than by the C contained in the slurry, and/or that anotherfactor could have limited microbial respiration, not C.
The unusual warm and dry conditions observed during theexperiment affected the pattern of soil CO2 fluxes as the Pearsoncorrelations confirmed when relating soil temperature and mois-ture to soil CO2 fluxes. The highest soil CO2 fluxes following thefirst and second N applications coincided with high soil temper-atures and dry soil conditions and contrasted with the low CO2rates observed after the third application, in autumn. The relation-ship between respiration and temperature has been reported inother studies. Mejide et al. (2009) observed in a barley field thatthe lowest CO2 emissions occurred in late autumn and winter,when soil temperatures were below 10 ◦C. Hynst et al. (2007), ina grassland affected by cattle impact in Czech Republic, and Joneset al. (2006), in a temperate grassland in Scotland, observed theopposite. They observed the highest CO2 fluxes with warm temper-atures. Soil moisture contents were also related to the CO2 fluxesobserved. Dry soil conditions observed after the first two appli-cations resulted in greater CO2 fluxes than those observed afterthe third fertilization when high frequency of rainfall events wasregistered. In this sense, high WFPS may have suppressed soil res-piration after the third fertilization by reducing soil CO2 diffusivityrates (Rochette et al., 1991) and also by enhancing anaerobiosis and,in consequence, reducing aerobic respiration (Ball et al., 1999).
5. Conclusions
The unusual climatic conditions observed in 2011 in the SWEngland affected the pattern of fluxes of N2O, CO2, CH4 dur-ing the experiment. Nitrification was probably the main pathwayfor N2O production under the dry soil conditions (WFPS below60%) observed during the first two applications. Large rainfallinputs identified after the third fertilization gradually increased soil%WFPS to saturation and could have enhanced conditions for com-plete denitrification. This situation also resulted in low N2O fluxesfrom the SL and AN treatments. However, AN showed higher cumu-lative N2O emissions compared with SL after the third application,probably due to greater anaerobicity and the lower N availabil-ity in the SL plots. High losses of N via NH3 volatilization couldhave contributed to the low N2O losses from the SL treatment,although these were modelled and not measured directly. Plant off-take of the applied N with both types of fertilizer also reduced the
soil N pool available for potential N2O production, especially dur-ing the first two applications. Methane emissions were recordedonly from the slurry applications and the increase of soil mois-ture enhanced methanogenic processes which occurred within 48 hafter the application. Carbon dioxide fluxes were influenced by soiltemperatures and soil moisture contents, with the highest fluxesin the driest period of this study (May–June). The atypical weatherduring this experiment in some sense offers an indication of theeffect of future climate change, with decreases in the annual patternof rainfall and increased temperatures in SW England, especially inlate winter and early spring; all of which could result in a decreaseof N2O emissions.
Acknowledgments
Rothamsted Research is supported by the Biotechnology andBiological Sciences Research Council (BBSRC). The authors wouldlike to thank Instituto Nacional de Investigaciones Agrarias (INIA)for the grant awarded to Aránzazu Louro López; Neil Donovan forGC analysis; Tom Misselbrook for the help with ALFAM modelling;Andrew Bristow, Patricia Butler, Liz Dixon and Denise Headon forlaboratory analysis; Tim Preston and Nick Bulmer for the assistancein the field and collection of slurry and Dan Dhanoa for advice onthe statistical methods for data analysis.
References
Abassi, M.K., Kazmi, M., Hussan, F.U., 2005. Nitrogen use efficiency and herbageproduction of an established grass sward in relation to moisture and nitrogenfertilization. J. Plant Nutr. 28, 1693–1708.
AOAC, 1990. Association of Official Analytical Chemist, Official Methods of Analysis,15th ed. Association of Official Analytical Chemist, Washington, DC.
Avery, B.W., 1980. Soil Classification for England and Wales (Higher Categories).Soil Survey of England and Wales. Soil Survey Technical Monograph No. 14,Harpenden, UK.
Ball, B.C., Scott, A., Parker, J.P., 1999. Field N2O, CO2 and CH4 fluxes in relation totillage, compaction and soil quality in Scotland. Soil Till. Res. 53, 287–301.
Bateman, E.J., Baggs, E.M., 2005. Contributions of nitrification and denitrification toN2O emissions from soils at different water-filled pore space. Biol. Fertil. Soils41, 379–388.
Bodelier, P.L.E., Lananbroek, H.J., 2004. Nitrogen as a regulatory factor of methaneoxidation in soils and sediments. FEMS Microbiol. Ecol. 47, 265–277.
Borken, W., Davidson, E.A., Savage, K., Sundquist, E.T., Steudler, P., 2006. Effect ofsummer through fall exclusion, summer drought, and winter snow cover onmethane fluxes in a temperate forest soil. Soil Biol. Biochem. 38, 1388–1395.
Cardenas, L.M., Thorman, R., Ashlee, N., Buttler, M., Chadwick, D., Chambers, B., Cut-tle, S., Donovan, N., Kingston, H., Lane, S., Dhanoa, M.S., Scholefield, D., 2010.Quantifying annual N2O emissions fluxes from grazed grasslands under a rangeof inorganic fertilizer nitrogen inputs. Agric. Ecosyst. Environ. 136, 218–226.
Carran, R.A., Roger Ball, P., Theobald, P.W., Collins, M.E.G., 1982. Soil nitrogen bal-ances in urine-affected areas under two moisture regimes in Southland. NewZeal. J. Exp. Agr. 10, 377–381.
Chadwick, D., Pain, B.F., 1997. Methane fluxes following slurry applications to grass-land soils: laboratory experiments. Agric. Ecosyst. Environ. 63, 51–60.
Chadwick, D.R., Pain, B.F., Brookman, S.K.E., 2000. Nitrous oxide and methane emis-sions following application of animal manures to grassland. J. Environ. Qual. 29,277–287.
Clayton, H., McTaggart, I.P., Parker, J., Swan, L., 1997. Nitrous oxide emissions fromfertilized grassland: a 2-year study of the effects of N fertilizer from environ-mental conditions. Biol. Fertil. Soils 25, 252–260.
Davidson, E.A., 1993. Soil water content and the ratio of nitrous oxide to nitric oxideemitted from soil. In: Oremland, R.S. (Ed.), Biogeochemistry of Global Change.Chapman and Hall, Inc., London, pp. 369–386.
Dobbie, K.E., McTaggart, I.P., Smith, K.A., 1999. Nitrous oxide emissions from inten-sive agricultural systems: variations between crops and seasons, key drivingvariables, and mean emission factors. J. Geophys. Res. 104, 26891–26899.
Dunfield, P.F., 2007. The soil methane sink. In: Reay, D., Hewitt, C.N., Smith, K., Grace,J. (Eds.), Greenhouse Gas Sinks. CAB International, Wallingford, pp. 152–170.
Estavillo, J.M., Rodriguez, M., Domingo, M., Munoz-Rueda, A., Gonzalez-Murua, C.,1994. Denitrification losses from a natural grassland in the Basque Countryunder organic and inorganic fertilization. Plant Soil 162, 19–29.
Fangueiro, D., Chadwick, D., Dixon, L., Bol, R., 2007. Quantification of the primingand CO2 emission sources following the application of different slurry particlesize fractions to a grassland soil. Soil Biol. Biochem. 39, 2608–2620.
FAO-UNESCO, 1997. Soil Map of the World, Revised Legend. ISRIC, Wageningen, NL.Harrod, T.R., Hogan, D.V., 1981. The Soils of North Wyke and Rowden. Unpublished
Report to North Wyke Research, Revised Edition of Original Report by TR Harrod,Soil Survey of England and Wales.

A. Louro et al. / Agriculture, Ecosystems and Environment 181 (2013) 1– 11 11
Huijsmans, J.F.M., Hol, J.M.G., Vermeulen, G.D., 2003. Effect of application method,manure characteristics, weather and field conditions on ammonia volatilizationfrom manure applied to arable land. Atmos. Environ. 37, 3669–3680.
Hynst, J., Simek, M., Brucek, P., Petersen, S.O., 2007. High fluxes but different patternsof nitrous oxide and carbon dioxide emissions from soils in a cattle overwinte-ring area. Agric. Ecosyst. Environ. 120, 269–279.
IPCC, 2006. Agriculture, forestry and other land use. In: Eggleston, H.S., Buendia, L.,Mika, K., Ngara, T., Tanabe, K. (Eds.), Guidelines for National Greenhouse GasInventories, vol. 4. IGES, Japan, pp. 5–54 (Chap. 11).
ISO 11466, 1995. Soil Quality – Extraction of Trace Elements Soluble in Aqua Regia.International Organization for Standardization, Geneva, Switzerland.
Jones, S.K., Rees, R.M., Kosmas, D., Ball, B.C., Skiba, U.M., 2006. Carbon sequestrationin a temperate grassland management and climatic controls. Soil Use Manage.22, 132–142.
Jones, S.K., Rees, R.M., Skiba, U.M., Ball, B.C., 2005. Greenhouse gas emissions from amanaged grasslands. Global Planet. Change 47, 201–211.
Koppen, W., 1931. Grundriss der Klimakunder. Walter der Gruyter, Berlin.Kuzyakov, Y., Bol, R., 2006. Sources and mechanisms of priming effect induced in two
grassland soils amended with slurry and sugar. Soil Biol. Biochem. 38, 747–758.Le Mer, J., Roger, P., 2001. Production, oxidation, emission and compsumption of
methane by soils: a review. Eur. J. Soil Biol. 37, 25–50.Linn, D.M., Doran, J.W., 1984. Effect of water-filled pore space on carbon dioxide and
nitrous oxide in filled and non-filled soils. Soil Sci. Soc. Am. J. 48, 1267–1272.Mejide, A., Cardenas, L.M., Sanchez-Martin, L., Vallejo, A., 2009. Carbon dioxide
and methane fluxes from a barley field amended with organic fertilizers underMediterranean climatic conditions. Plant Soil 328, 353–367.
Misselbrook, T.H., Laws, J.A., Pain, B.F., 1996. Surface application and shallow injec-tion of cattle slurry on grassland: nitrogen losses, herbage yields and nitrogenrecoveries. Grass Forage Sci. 51, 270–277.
Misselbrook, T.H., Nicholson, F.A., Chambers, B.J., 2005. Predicting ammonia lossesfollowing the application of livestock manure to land. Bioresour. Technol. 96,159–168.
Misselbrook, T., Sutton, M.A., Scholefield, D., 2004. A simple process-based modelfor estimating ammonia emissions from agricultural land after fertilizer appli-cations. Soil Use Manage. 20, 365–372.
Morell, F.J., Cantero-Martinez, C., Lampurlanes, J., Plaza-Bonilla, D., Alvaro-Fuentes,J., 2011. Soil carbon dioxide flux and organic carbon content: effects of tillageand nitrogen fertilization. Soil Sci. Soc. Am. J. 75, 1874–1884.
Pain, B.F., Phillips, V.R., Clarkson, C.R., Klarenbeek, J.V., 1989. Loss of nitrogen throughammonia volatilisation during and following the application of pig or cattleslurry to grassland. J. Sci. Food Agric. 47, 1–12.
Parkin, T.B., Venterea, R.T., 2010. USDA-ARS GRACEnet Proyect Protocols. In: Follet,R.F (Eds), Chapter 3. Chamber-Based Traze Gas Flux Measurements. SamplingProtocols, Beltsville, MD, pp. 1–39.
Pfluke, P.D., Jokela, W.E., Bosworth, S.C., 2011. Ammonia volatilization from surfacebanded and broadcast application of liquid manure on grass forage. J. Environ.Qual. 40, 374–382.
Price, S.J., Sherlock, R.R., Kelliher, F.M., McSeveny, T.M., Tate, K.R., Condron, L.M.,2003. Pristine New Zealand forest soil is a strong methane sink. Glob. ChangeBiol. 10, 16–26.
Rochette, P., Angers, D.A., Côté, D., 2000. Soil carbon and nitrogen dynamicsfollowing applications of pig slurry for the 19th consecutive year I. Car-bon dioxide fluxes and microbial biomass carbon. Soil Sci. Soc. Am. J. 64,1389–1395.
Rochette, P., Desjardins, R.L., Patty, E., 1991. Spatial and temporal variability of soilrespiration in agricultural fields. Can. J. Soil Sci. 71, 189–196.
Rochette, P., Erisksen-Hamel, N.S., 2008. Chamber measurements of soilnitrous oxide flux: are absolute values reliable? Soil Sci. Soc. Am. J. 72,331–342.
Rodhe, L., Pell, M., Yamulki, S., 2006. Nitrous oxide, methane and ammonia emissionsfollowing slurry spreading on grassland. Soil Use Manage. 22, 229–237.
Rudaz, A.O., Wälti, E., Kyburz, G., Lehmann, P., Fuhrer, J., 1999. Temporal variationin N2O and N2 fluxes from a permanent pasture in Switzerland in relation tomanagement, soil water content and soil temperature. Agric. Ecosyst. Environ.73, 83–91.
Sanger, A., Geisseler, D., Ludwig, B., 2011. Effects of moisture and temperature ongreenhouse gas emissions and C and N leaching losses in soil treated with biogasslurry. Biol. Fertil. Soils 47, 249–259.
Searle, P.L., 1984. The berthelot or indophenol reaction and its use in the analyticalchemistry of nitrogen. Analyst 109, 549–568.
Smith, K.A., Ball, T., Conen, T., Dobbie, K.E., Massheder, J., Rey, A., 2003. Exchangeof greenhouse gases between soil and atmosphere: interactions of soil physicalfactor and biological processes. Eur. J. Soil Sci. 54, 779–791.
Smith, K.A., Dobbie, K.E., Thorman, R., Watson, C.J., Chadwick, D.R., Yamulki, S., Ball,B.C., 2012. The effect of N fertilizer forms on nitrous oxide emissions from UKarable land and grassland. Nutr. Cycl. Agroecosys. 93, 127–149.
Smith, K.A., Jackson, D.R., Misselbrook, T.H., Pain, B.F., Johnson, R.A., 2000.PA—Precision agriculture: reduction of ammonia emission by slurry applicationtechniques. J. Agr. Eng. Res. 77, 277–287.
Snyder, C.S., Bruulsema, T.W., Jensen, T.L., Fixen, P.E., 2009. Review of greenhousegas emissions from crop production systems and fertilized management effects.Agric. Ecosyst. Environ. 133, 247–266.
Sogaard, H.T., Sommer, S.G., Hutchings, N.J., Huijsmans, J.F.M., Bussink, D.W., Nichol-son, F., 2002. Ammonia volatilization from field applied animal slurry – theALFAM model. Atmos. Environ. 36, 3309–3319.
Sommer, S.G., Olesen, J.E., 1991. Effects of dry matter content and tempera-ture on ammonia loss from surface-applied cattle slurry. J. Environ. Qual. 20,679–683.
Thompson, R.B., Pain, B.F., Rees, Y.J., 1990. Ammonia volatilization from cattle slurryfollowing surface application to grassland II. Influence of application rate, windspeed and applying slurry in narrow bands. Plant Soil 125, 119–128.
Van den Pol-van Dasselaar, A., Oenema, O., 1997. Effects of grassland managementon the emission of methane from intensively managed grasslands on peat soil.Plant Soil 189, 1–9.
Velthof, G.L., Brader, A.B., Oenema, O., 1996. Seasonal variations in nitrousoxide losses from managed grasslands in the Netherlands. Plant Soil 181,263–274.
Weier, K.L., Doran, J.W., Power, J.F., Walters, D.T., 1993. Denitrification and the dini-trogen nitrous oxide ratio as affected by soil water, available carbon and nitrate.Soil Sci. Soc. Am. J. 64, 66–72.

APPENDIX 2

Nitrous oxide emissions from forage maize production on a HumicCambisol fertilized with mineral fertilizer or slurries in Galicia, Spain
Aránzazu Louro a,⁎, Dolores Báez a, María Isabel García a, Laura Cárdenas b
a Mabegondo Agricultural Research Centre (CIAM-INGACAL), Xunta de Galicia, Carretera AC-542 de Betanzos a Mesón do Vento, km 7, 15318 Abegondo, A Coruña, Spainb Department of Sustainable Soil and Grassland Systems, Rothamsted Research, North Wyke, Okehampton, Devon, EX20 2SB, UK
a b s t r a c ta r t i c l e i n f o
Article history:Received 10 January 2015Received in revised form 18 March 2015Accepted 19 March 2015Available online 21 March 2015
Keywords:Closed chamberHumic CambisolMineral fertilizerNitrous oxideSlurry injectionYield scaled N2O emissionsZea mays L
We conducted a field experiment in Galicia (NW Spain) to quantify N2O emissions derived from fertilizationpractices carried out by local farmers growing forage maize (Zea mays L.). Forage maize was cultivated in a siltloam soil during 2008 and 2009, in different locations each year. Nitrous oxide fluxes were monitored duringthe whole growing season after the application of the following treatments: no N application (CN);125 kgN ha−1 NPK at sowing and 75 kg granulated urea at top dressing (MN); 200 kgN ha−1 injected cattle slur-ry (CS) and 200 kg N ha−1 injected pig slurry (PS), with both slurry treatments applied at sowing. We observedthat although fertilization significantly increased losses of N as N2O, the type of fertilizer did not significantly af-fect the total cumulative N2O emissions in either year. This could have been due to the high native soil C contentin both experimental sites. Total cumulative N2O emissions from N fertilized treatments ranged from 19.8 to20.5 kg N ha−1 in 2008 and 10.8 to 11.7 kg N ha−1 in 2009, with the period between sowing and top dressingbeing the largest contributor. Nitrification probably caused the N2O fluxes observed in the days following the ap-plication of N fertilizers in May, however the largest losses of N2O were observed at optimal soil conditions fordenitrification. Variations in N2O fluxes between crop seasons could be attributed, in the first instance, to moreN2 rather than N2O production during 2009, a consequence of the larger soil water filled pore space(N80%WFPS) during most of the sampling period. Another cause was probably the periods of soil rewetting ob-served in 2008, which triggered the largest N2O fluxes observed and contributed to approximately 40% of thetotal cumulative N2O emissions. The use of slurries ormineral fertilizer resulted in similar yield scaled N2O emis-sions in both years. At a target N rate of 200 kg N ha−1 these were in the range 1.18–1.23 kg N2O-NMg−1 DM in2008 and 0.51–0.58 kgN2O-NMg−1 DM in 2009. This study highlights the need to increase the knowledge of ini-tial soil N contents at the moment of the N application and the dynamics of soil organic matter mineralization toadapt N rates to efficiently meet crop demands, especially in the period between sowing and top dressing appli-cation when demands are small.
© 2015 Elsevier B.V. All rights reserved.
1. Introduction
Nitrous oxide (N2O) is a potent greenhouse gas that also plays an im-portant role in the depletion of stratospheric ozone (O3). The globalwarming potential of N2O is 298 times that of the CO2 in a 100-yeartime horizon (IPCC, 2007). Agriculture is the source of 10–12% of globalanthropogenic greenhouse gases (GHGs), of which 60% is N2O (Smithet al., 2007). Consistent with this trend, Spanish agriculture contributedapproximately 76–78% to the total national N2O produced in 2009 and2010, 67% of which is from soil (MAGRAMA, 2012).
The application of organic andmineral fertilizers plays an importantrole in determining N2O fluxes from soils (Mosier et al., 1998) via pro-duction from nitrification, the biological oxidation of ammonium(NH4
+-N) to nitrate (NO3−-N), and denitrification, the reduction of
NO3−-N to N2. The contribution of these processes to N2O production is
controlled by soil oxygen (O2) availability, mainly driven by soil watercontent. Generally any production at water filled pore space (WFPS)values below 60% is attributed to nitrification (Bateman and Baggs,2005) whereas denitrification is the dominant process when WFPS ex-ceeds 60% (Davidson, 1991). Large numbers of studies have considereddenitrification to be the main N2O producing process under high soilmoisture (Abbasi and Adams, 2000; Skiba and Ball, 2002), but N2Ofluxes can decrease when extremely anoxic conditions are generatedin the soil (WFPS exceeds 80%) and N2O is reduced to N2 (Davidson,1991).AsGalicia is oneof thewettest areasof Spain (N1000mmyear−1),agricultural practices in this region may contribute greatly to anthropo-genic N2O emissions. Agriculture has great importance in Galicia, in theNorthWest of Spain, especially foragemaize production. It accounts for76% (68,909 ha) of the total area of Spain dedicated to this crop(ESYRCE, 2013). This is because Galician agriculture is associated withthe production and use of forage crops at the farm scale to maintain
Geoderma Regional 5 (2015) 54–63
⁎ Corresponding author.E-mail address: [email protected] (A. Louro).
http://dx.doi.org/10.1016/j.geodrs.2015.03.0042352-0094/© 2015 Elsevier B.V. All rights reserved.
Contents lists available at ScienceDirect
Geoderma Regional
j ourna l homepage: www.e lsev ie r .com/ locate /geodrs

dairy cattle production systems. Maize irrigation is not required in Gali-cia due to the cool summers and high rainfall (39% annual rainfall is reg-istered betweenMay andOctober). However, the application of N basedfertilizers is necessary to enhance crop yields. Slurries generated on Ga-lician farms are commonly applied to avoid the cost of mineral fertil-izers. Also, crops can take up N more efficiently from slurries due tothe slow release of nutrients they contain. This characteristic of the slur-ry can also help to reduce environmental problems such as leachingand, if slurry is injected into the soil, the risk of losses of N fromammonia (NH3) volatilization (Smith et al., 2000). However, the injec-tion of the slurries could stimulate N2O fluxes (Sistani et al., 2010;Wulf et al., 2002) as slurries contain easily decomposable organic car-bon (C) which can trigger denitrification and also generate anaerobiosisin the soil by increasing biological O2 demand (Rochette et al., 2000).
The aims of this study were to understand the dynamics of the N2Ofluxes during the maize growing season under Galician climatic condi-tions and determine the influence of the type of fertilizer (injected slur-ries and mineral fertilizers) typically applied by local Galician farmerson the resulting emissions. We also aimed to identify what form of fer-tilization is associated with low N2O production and high yields. Thisstudywill report N2O emissions and crop yields from themaize growingseasons of 2008 and 2009, and present emission factors scaled by cropyields.
2. Material and methods
2.1. Location
Measurements were carried out for two consecutive growing sea-sons (2008 and 2009) on forage maize fields (Zea mays L.), whichwere established in different locations at Mabegondo Agricultural Re-search Centre (CIAM-INGACAL), Abegondo, Galicia, Spain (43.2425°N,8.2608°W). The climate is European Atlantic (Fernández et al., 2011)and Mediterranean humid according to the agrologic classification pro-vided by Papadakis (1966). The mean annual temperature for the peri-od 1998–2007 was 13.1 °C, and the mean minimum and maximumtemperatures were recorded in February (2.9 °C) and August(25.4 °C), respectively. The mean rainfall for the same period was1101 mm. The wettest month was October (177 mm) and the driestJuly (35 mm). The average rainfall registered during the forage maizegrowing season (average of the period May–September over the last10 years) is 237 mm and the average temperature is 16.1 °C. The soilin both maize crop seasons was a Humic Cambisol with a silt loam tex-ture in the top 10 cm. The soil properties measured in each location areshown in the Table 1.
2.2. Experimental design
The experimental plots were established in May in both years as arandomized plot designwith three replicates of four treatments: controlwithout N fertilizer (CN), mineral fertilizer as NPK (15:15:15) and urea46% (MN), cattle slurry (CS) and pig slurry (PS). Plotswere 42m2 in area(4.2 m × 10m) for control andmineral fertilizer plots. The area in thoseplots fertilized with cattle and pig slurries was 88 m2 (8.8 m × 10 m) to
accommodate the 4.4 m application width of the slurry tanker used forthe slurry injection.
2.3. Fertilization and slurry analysis
Mineral fertilizer was applied by hand in two doses at a final rate of200 kg N ha−1: 125 kg N ha−1 as NPK 15:15:15 fertilizer (7% nitrate Ncontent, NO3
−-N; 7% ammonium N content, NH4+-N) before sowing
(1st application, on 22nd May 2008 and on 22nd May 2009) and75 kg N ha−1 as urea 46% for the top dressing when the plant was40 cmhigh (2nd application, on 22nd July 2008 and 6th July 2009). Cat-tle slurry was from a storage pit located at CIAM and the pig slurry froma storage pit located on a private farm. Slurries were injected 20–25 cminto the soil at a target rate of 200 kg N ha−1 using a Joskin EMB tankwith 8400 l of capacity and 40 cm band spacing injection. A sample ofeach slurry was analysed for total N prior to application to calculate anapplication rate equivalent to 200 kg N ha−1. Cattle slurry was finallyspread at rates of 66 and 69 m3 ha−1 and pig slurry at rates of 62.5and 76 m3 ha−1 in 2008 and 2009, respectively (see slurries character-istics in Table 2). Before sowing, all plots were amended with P and Kmineral fertilizers at a final rate of 100 kg P2O5 ha−1 and 250 kgK2O ha−1.
Slurry density was determined in fresh samples using a hydrometer(Nahita, Navarra, Spain). The pH of the slurry was measured with a pHmeter (Crison GLP 22, Barcelona, Spain) after adding to 25 g of slurry to25 ml of distilled water and stirring for 30 min. Slurry dry matter (DM)was determined after 24 h oven-drying at 105 °C. Organic matter (OM)was analysed in dry and ground (b0.01 mm) samples using a thermo-gravimetric analyzer TGA-601 (LECO Corp., MI, USA). Analysis of N, Pand K was determined in fresh samples using Kjeldahl digestion(AOAC, 2000). Total N was analysed by a colorimetric method (indo-phenol blue reaction) using a continuous flow analyzer AA III(Bran + Luebbe, Norderstedt, Germany). Total P was determined bythe colorimetric reaction between orthophosphate and ammoniummolydate to form phosphomolybdate blue and analysed by a UV–visspectrophotometer (Thermo Scientific Evolution 201). Dry samples ofslurry were analysed on a Leco TruSpec CN (Leco Corp., MI, USA) to de-termine total C contents. Slurry K, Ca, Mg, Na contents were determinedby atomic absorption spectroscopy. Ammonium (NH4
+-N) and nitrate(NO3
−-N) contents were extracted from fresh samples using 2 M KCl.The extracts obtained were analysed using a segmented flow analyserAA III (Bran + Luebbe, Norderstedt, Germany).
2.4. Sowing, harvesting and plant analysis
Maize (Zea mays L., variety DKC3745) was planted on 22nd May2008 and 22nd May 2009, with a 75 cm and 14 cm row and plant spac-ing, respectively. Planting rate was approximately 90,000 seeds ha−1.Plots were harvested on 16th October 2008 and 29th September 2009.
Table 1Properties of the upper 10 cm of the Humic Cambisol in the maize cropping sites studied.
Year/site Sand Silt Claya Total C Total N C/N pH BDb
% % DMc Mg m−3
2008 25 55 20 3.27 0.22 10.38 5.35 1.282009 19 56 25 3.60 0.35 10.22 5.30 1.25
a USDA classification.b BD: bulk density was calculated by using the empirical formula provided by Battilani
et al. (1999).c DM: dry matter
Table 2Chemical composition of the slurries applied in 2008 and 2009.
Property 2008 2009
Units Cattle Pig Cattle Pig
Density g cm−3 1.01 1.01 1.04 1.01DM % 7.30 2.13 6.57 2.22pH – 8.2 8.3 8.4 8.4NH4
+-N %FMa 0.087 0.168 0.115 0.162NO3
−-N %FM 0.000 0.000 0.000 0.000OM g kg−1DM 814 633 769 623N g kg−1DM 42.0 119.5 43.3 110.3P g kg−1DM 8.6 30.4 9.2 27.8K g kg−1DM 44.1 84.9 47.3 83.2Ca g kg−1DM 23.1 35.2 19.8 28.2Mg g kg−1DM 6.1 18.2 6.9 14.7Na g kg−1DM 6.1 13.2 3.9 11.3
a FM; fresh weight.
55A. Louro et al. / Geoderma Regional 5 (2015) 54–63

At the optimal maturity stage (the milk line is half to two thirds downthe kernel), two central lines per plot were selected. In each line, 10plants in a stretch of 7 m were cut with a sickle to 10–15 cm from theroot and weighed. Samples of 300 g were selected for analysis of thepercentage dry matter (%DM), measured by oven-drying at 80 °C for18 h until constant weight. Dry samples were ground to pass a sieveof 1mm and scanned on a near infrared reflectance spectrophotometer,NIRS Systems 6500 (FOSS NIRS Systems, Inc., Silver Spring,Washington,USA) for analysis of crude protein (CP) at 2 nm intervals between 1100and 2500 nm. Spectral data were processed using WINISI software (ISI,Port Matilda, PA).
2.5. Nitrogen use efficiency
Drymatter yield and crude protein contentswere used to calculateNuptake in plant tissue by the following equation (Eq. (1)):
N uptake : DM � CP=100=6:25 ð1Þ
where DM is the dry matter (kg ha−1), CP is the crude protein content(in %DM) and 6.25 is the conversion factor of protein to N content(MacDonald et al., 2002).
Apparent nitrogen recoveries (ANR) and apparent nitrogen efficien-cy (ANE) were calculated for each N treatment by the following equa-tions (Eqs. (2) and (3)):
ANR %ð Þ : 100� N uptake fert–N uptake unfertð Þ=N fertilizer ð2Þ
ANE kg DM kg−1N� �
: DM fert– DM unfertð Þ=N fertilizer ð3Þ
where N uptake fert and N uptake unfert denote the above-ground plantN uptakes in the fertilized and control plots (kg N ha−1), respectivelyand DM fert and DM unfert are the yields in fertilized and control plots(Mg ha−1), respectively.
2.6. Measurements of N2O fluxes-chamber design and operation
Nitrous oxide fluxes were measured using the closed chamber tech-nique (Ryden and Rolston, 1983). Chambers were cylinders of polyvinylchloride (PVC) with a volume of 0.018 m3 (height: 36 cm; diameter:25 cm) with a lid fitted with a rubber septum as a sampling port. Twochambers per plot (i.e., six chambers per treatment) were placed be-tween rows and left in the same position during the experiment. On30th May 2008 and 5th June 2009, before the application of the herbi-cide (4 l ha−1 as Acetochlor 45% + Terbuthylazine 21.4% (HarnessGTZ)) and the insecticide (1 l ha−1 as Clorpyrifos 46%), chamberswere removed to facilitate spreading and to avoid chamber contamina-tion. After these applications they were re-inserted into the soil in thesame position and sampling restarted 24 h later to avoid the effect ofdisturbance on the soil-atmosphere-gas transfer (Parkin and Venterea,2010).
2.7. Nitrous oxide fluxes
Soil N2O fluxes were measured a total of 70 times between 22ndMay and 16th October 2008 and 45 times between 22nd May and25th September 2009, and always between 09:00 and 10:00 h, whichis the period of time considered to be representative of the daily mean(Alves et al., 2012). During the growing seasons of 2008 and 2009 andafter the N applications, gas samples were taken three or five times aweek. Chambers were closed for 60 min (T60), the period of timewhere the headspace N2O accumulation is linear (Chadwick et al.,2014). After this, a sample of the chamber headspace was withdrawnthrough the rubber septum using a 10 ml polypropylene syringe fittedwith a hypodermic needle. An ambient sample was also taken to pro-vide background values for N2O (Cardenas et al., 2010; Chadwick
et al., 2014) and the time zero sample (T0). Each samplewas transferredinto a pre-evacuated 10 ml vial for storage and analysis. A sampleof 12 ml was injected to over-pressurize the vials, preventing a back-diffusion of air (Hyde et al., 2006). The N2O concentration of thesamples was analysed in the laboratory using a gas chromatographThermo Finnigan Trace gas chromatograph (GC 2000) fitted with anelectron capture detector (ECD) at 330 °C and HP-Plot Q column(30 mm × 0.3 mm). Nitrous oxide fluxes were calculated using the fol-lowing equation (Eq. (4)):
F ¼ ρ� V=A� Ct−C0ð Þ=t � 273:15=Tð Þ ð4Þ
where F is the N2O flux (μg N2O-N m−2 h−1); ρ the gas density(1.26 × 10⁹ μg m−3 N2O-N) under STP conditions (273 K and101,325 Pa); V and A are the volume (0.02 m3) and area (0.0491 m2) ofthe chamber; C60 and Co (μm3 m−3) are the N2O concentrations 60 minafter chamber closure (T60) and the ambient sample (T0), respectively; tis the time of chamber closure in hours (T60); and T is the air temperature(K) at the time of sampling. Nitrous oxide fluxes were transformed todaily fluxes (kg N2O ha−1 day−1) for the calculation of the cumulativeN2O emissions. Nitrous oxide fluxes for dates between samplings wereinterpolated and the cumulative emissions calculated using the trapezoi-dal method (Cardenas et al., 2010; Louro et al., 2013). In order to obtainthe cumulative N2O emissions and the standard error for each treatment,cumulative N2O emissions per plot (2 chambers)were calculated and thevalues obtained from the tree plots averaged.
Based on the N-applications and because of the split application ofmineral fertilizer, cumulative N2O emissions were calculated in two pe-riods within each cropping season. In 2008 periods were: ‘2008I’ (22ndMay–22nd July) and ‘2008II’ (22nd July–16th October). In 2009: ‘2009I’(22nd May–6th July) and ‘2009II’ (6th July–25th September) (see Fig. 1).
Total cumulative N2O emissions from the control treatment weresubtracted from the corresponding values in N fertilized treatmentsduring the whole period of measurements, giving net total N2O emis-sions as a response to theN applied for eachN fertilizer in each croppingseason. Emission factors (EFs) for eachN fertilizerwere calculated bydi-viding the net N2O cumulative emissions by the total N fertilizer appliedand expressing it as a percentage. The assessment of the impact ofcropping practices on greenhouse gas (GHG) production per unit yieldis important for maintaining high yields with minimal GHG emissions(vanGroenigen et al., 2010). Yield scaledN2O emissionswere calculatedby dividing the total N2O cumulative emissions in each treatment bytheir resulted crop yields and expressing them in kg N2O-N Mg−1 DM.
2.8. Soil sampling and analysis
Soil samples at 10 cm depth were collected throughout bothcropping seasons for the analysis of mineral N contents (ammonium(NH4
+-N) and nitrate (NO3−-N)) and soil moisture. Soil NH4
+-Nand NO3
−-N were determined by extracting 100 g of fresh soil with200 ml 1 M KCl. Extracts were analysed colorimetrically for NH4
+-Nand NO3
−-N soil contents using a segmented flow auto-analyser AA III(Bran+ Luebbe, Norderstedt, Germany). Soil moisture content was de-termined gravimetrically after oven-drying at 105 °C for 24 h. Porositywas calculated from the bulk density (BD) at each site by assuming aparticle density of 2.65 Mg m−3. Water filled pore space (WFPS) wascalculated by dividing the soil moisture content and BD by the porosityand expressing it as a percentage.
2.9. Meteorological data
Daily rainfall (mm) and daily mean air and soil (10 cm depth)temperatures (°C) were obtained from the weather station located atCIAM which includes a pluviometer (Thies Clima, Germany, model5.4032.35.007) and air (Geonica, Spain, model STH-5031) and soil(Campbel Scientific Spain, model T-107) temperature probes. Monthly
56 A. Louro et al. / Geoderma Regional 5 (2015) 54–63

mean rainfall and air temperatures for the last 10 years (1998–2007)and the corresponding means for 2008 and 2009 were also used.
2.10. Statistical methods
The statistical analyses were performed using Sigmaplot 11. Totalcumulative N2O emissions were transformed into mean cumulativeemissions by dividing the total cumulative emissions by the numberof days. This allowed comparisons to be made between periods andyears that differed in numbers of days. Two way repeated measuresanalysis of variance (ANOVA) was used to determine significant differ-ences between the periods within each year (i.e. periods ‘2008I’ versus‘2008II’ and ‘2009I’ versus ‘2009I’) and between the years themselves(i.e. 2008 versus 2009). In each of these three analyses the treatmentfactor (CN, MN, CS and PS) was also included to determine a significanteffect on the mean cumulative N2O emissions. The same test was alsoperformed to determine differences in EFwithin each year and betweenyears. For total cumulative N2O emissions, oneway ANOVAwas used totest for differences between treatments (CN, MN, CS and PS) withineach period and also within each year. For WFPS and mineral N con-tents, two way repeated measures ANOVA was used to test for signifi-cant differences between treatments (CN, MN, CS and PS) andbetween soil sampling days within each period and year. For plantyield, N uptake, ANR, ANE and yield-scale N2O emissions, one wayANOVA was used to investigate differences caused by the treatments(CN, MN, CS and PS). Tukey's test was used to determine which treat-ment groups were different at the P ≤ 0.05 significance level.
3. Results
3.1. Weather conditions
Daily mean air temperature from the day of seeding to harvest wassimilar in both years, ranging from 12 to 25 °C in 2008 (Fig. 2a) andfrom 11 to 24 °C in 2009 (Fig. 2b). Daily mean soil temperatures were
also similar with ranges of 13–22 °C in 2008 and 13—21 °C in 2009.Total rainfall during the sampling periods in 2008 and 2009 (Fig. 2a)was 360 mm (167 mm in ‘2008I’ and 193 mm in ‘2008II’) and296 mm (145 in ‘2009I’ and 151 mm in ‘2009II’), respectively. Thefirst fertilization in both years was followed by high rainfall for thefirst 12 days in ‘2008I’ and for the first 19 days in ‘2009I’. In ‘2008I’,11 days before the second fertilization, 28 mm of rain fell after along period with no significant rainfall. The second N fertilizationin both cropping seasons (periods ‘2008II’ and ‘2009II’) was notfollowed by large rainfall. In ‘2008II’, large rainfall was observed be-tween days 25 and 46; in ‘2009II’ most of the rain fell in one singleevent on day 15.
3.2. Water filled pore space (WFPS)
The WFPS values reported in this study are approximate as theywere derived using an estimated BD which was based on the sand andclay contents of the soil at each site (Battilani et al., 1999).We have car-ried out the statistical analysis of the treatments using this parameterbut alsoprovide the equivalentmeasured gravimetric soilmoisture con-tent (expressed as % water) as it is a more accurate descriptor of mois-ture for our study (Fig. 2c, d). No significant differences in soil WFPSbetween treatments were observed on any sampling day within eitheryear (P N 0.05). Mean soil WFPS during ‘2008I’was 73% with the largestWFPS values in the following 25 days after the first fertilization (Fig. 2c).Also, in ‘2008I’, the rain observed 11 days before the second fertilizationincreased soil moisture levels from approximately 50% to almost60%WFPS. The beginning of the ‘2008II’ period was characterized bydry conditions (as low as 30% WFPS) until the rainfall between days25 and 46 increased WFPS to a mean value of 80%. In ‘2009I’, the soilremained saturated (100%WFPS) or with standingwater at the soil sur-face (WFPS N 100%) (Fig. 2d). In ‘2009II’, throughout the period meansoil WFPS was 77% except for a couple of sampling days after day 15where levels reached values N100%WFPS.
1st Application/Sowing22nd May 2009
2nd Application6th July 2009
Harvest29th September 2009
2009I 2009II45 days 82 days
2008I 2008II61 days 87 days
1st Application/Sowing 2nd Application Harvest22nd July 200822nd May 2008 16th October 2008
a)
b)
MN:125 kg N ha-1; PS: 200 kg N ha-1; CS:203 kg N ha-1 MN:75 kg N ha-1
MN:125 kg N ha-1; PS: 186 kg N ha-1; CS:214 kg N ha-1 MN:75 kg N ha-1
Fig. 1. Timeline and periods considered in a) 2008 and b) 2009.
57A. Louro et al. / Geoderma Regional 5 (2015) 54–63

3.3. Soil mineral N
3.3.1. Soil ammonium contentsIn ‘2008I’, soil NH4
+-N levels (0–10 cm) in N-fertilized plots were notsignificantly higher as those in CN plots (Fig. 3a) (P N 0.05). In ‘2008II’,
NH4+-N values from MN plots were larger than the other treatments
during the first 36 days (P b 0.05). In ‘2009I’, significant differences be-tween the N-treatments and the CN treatment were observed in thefirst 26 days (P b 0.05) (Fig. 3b). The largest soil NH4
+-N contentswere observed immediately after the first fertilization. In ‘2009II’, soil
0
25
50
75
100
125
150
1st A
ppl 7 14 21 28 34 41 48 55
2nd
App
l 7 14 21 28 35 42 49 56 63 70 77 84
%W
FP
S
Days after fertilization
CN
MN
PS
CS
2008I 2008II
0
5
10
15
20
25
30
0
10
20
30
40
50
60
70
80
90
100
Temperature (ºC
)Rai
nfal
l (m
m)
Rainfall (mm)
Air temperature (ºC)
Soil temperature (ºC)
2008I 2008IIa
c
b
d
0
5
10
15
20
25
30
0
10
20
30
40
50
60
70
80
90
100
Temperature (ºC
)
Rai
nfal
l (m
m)
Rainfall (mm)
Air temperature (ºC)
Soil temperature (ºC)
2009I 2009II
0
10
20
30
40
50
60
Gravim
etricsoilm
oisture%
water
Gravim
etricsoilm
oisture%
water
0
11
22
32
35
42
63
1st A
ppl 7 14 21 28 34 41
2nd
App
l 7 14 21 28 35 42 49 56 63 70 77 84
Days after fertilization
0
25
50
75
100
125
150
%W
FP
S
CN
MN
PS
CS
2009I 2009II
Fig. 2. Daily rainfall, soil temperatures and air temperatures in a) 2008 and b) 2009. Filled bars represent daily rainfall and unfilled and filled circles represent daily air and soil temperatures,respectively. Soil water filled pore space (%WFPS) and gravimetric soil moisture contents (%water) following fertilizations in c) 2008 and d) 2009. Data points and error bars represent meanvalue (n=3) and standard error, respectively. Vertical linesmarkperiods betweenNapplications. Treatmentswere: control (CN),mineral fertilizer asNPK+granular urea 46% (MN), injectedpig slurry (PS), injected cattle slurry (CS). Periodswere: ‘2008I’ (22ndMay–22nd July), ‘2008II’ (22nd July–16th October), ‘2009I’ (22ndMay–6th July) and ‘2009II’ (6th July–25th September).
0
50
100
150
200
250
300
1st A
ppl 7 14 21 28 34 41 48 55
2nd
App
l 7 14 21 28 35 42 49 56 63 70 77 84
NO
3- -N (k
g N
ha-1
)
Days after fertilization
CN
MN
PS
CS
2008I 2008II
0
50
100
150
200
250
300
NH
4+ -N
(kg
N h
a-1)
CN
MN
PS
CS
2008I 2008II CNMNPSCS
2009I 2009II
1st A
ppl 7 14 21 28 34 41
2nd
App
l 7 14 21 28 35 42 49 56 63 70 77 84
Days after fertilization
CN
MN
PS
CS
2009I 2009II
a b
c d
Fig. 3. Soil mineral N contents following N applications in 2008 and 2009. Soil NH4+-N in 2008 (a) and 2009 (b). Soil NO3
−-N contents in 2008 (c) and 2009 (d). Data points and error barsrepresent mean value (n= 3) and standard error. Vertical lines mark periods between applications. Treatments were: control (CN), mineral fertilizer as NPK+ granular urea 46% (MN),injected cattle slurry (CS) and injected pig slurry (PS). Periodswere: ‘2008I’ (22ndMay–22nd July), ‘2008II’ (22nd July–16th October), ‘2009I’ (22ndMay–6th July) and ‘2009II’ (6th July–25th September).
58 A. Louro et al. / Geoderma Regional 5 (2015) 54–63

NH4+-N contents in MN plots were significantly larger than the other
treatments during the first 23 days (P b 0.05).
3.3.2. Soil nitrate contentsIn both years, soil NO3
−-N contents (0–10 cm) in the CNplotswere ingeneral lower than the other treatments (P b 0.05). However, short-lived increases in NO3
−-N levels from CN were observed in both yearseven when no N fertilizer was applied. During 2008, CN plots reachedlevels up to 61 kg N ha−1 on day 33 in ‘2008I’ and 74 kg N ha−1 onday 6 in ‘2008II’ (Fig. 3c). Maximum soil NO3
−-N contents of 97 and118 kg N ha−1 were reached on day 21 in period ‘2008II’ from CS andPS plots, respectively. In MN plots, fertilizations resulted in maximumsoil NO3
−-N contents of 121.5 kg N ha−1 (on day 18 in ‘2008I’) and93.1 kg N ha−1 (on day 13 in ‘2008II’). In 2009, the largest soil NO3
−-Ncontents observed in CS and PS plots (114 and 204 kg N ha−1, respec-tively) were reached on days 31 and 38 in ‘2009I’, respectively. In theMN plots, although a similar pattern to the CS and PS plots was ob-served, the maximum soil NO3
−-N content (205.2 kg N ha−1) was ob-served on day 11 in period ‘2009II’.
3.4. Nitrous oxide fluxes
In 2008, N2O fluxes were large and frequent, even from CN plots(Fig. 4a). In ‘2008I’, the largest N2O fluxes were observed betweendays 51 and 55 from N-fertilizer treatments (1933, 2035, 1647 μgN2O-N m−2 h−1 in MN, CS and PS, respectively) and on day 41 fromCN plots (1137 μg N2O-Nm−2 h−1). The largest N2O peaks of the exper-iment from all treatments (range of 1772–2313 μg N2O-N m−2 h−1)were observed between days 27 and 41 in period ‘2008II’. In 2009,N2O fluxes were less frequent and lower than in 2008. The largest N2Ofluxes in all treatments (range of 939–1642 μg N2O-N m−2 h−1) werereached on day 19 in ‘2009I’. In ‘2009II’, the largest N2O fluxes from
the treatments (range of 751–992 μg N2O-N m−2 h−1) were betweendays 28 and 32.
3.5. Cumulative N2O emissions
As Table 3 shows, N-based fertilizers significantly increased total cu-mulative N2O emissions compared to the CN plots (P b 0.001) in bothyears and in the periods studiedwithin each year (P b 0.001) but no dif-ferences between the forms of N applied were observed (P N 0.05). Thepatterns of the cumulative N2O emissions from the treatments weresimilar to those from CN until day 55 in ‘2008I’ (Fig. 4c) and day 21 in‘2009I’(Fig. 4d), when N applications progressively increased lossescompared to CN. Comparing losses in the two periods studied withineach year, treatments resulted in mean cumulative N2O emissions 1.4-fold larger in ‘2008I’ than in ‘2008II’ and 2-fold greater in ‘2009I’ thanin ‘2009II’ (P b 0.001). Comparing years, in 2009 all treatments showedsignificantly lower mean total cumulative N2O emissions than the cor-responding values in 2008 (P b 0.001). In terms of EF, no significant dif-ferences between treatments were observed within each year andbetween years (P N 0.05). Losses of N2O in relation to the N applied tothe forage maize were 1.81% (MN), 1.63% (PS) and 1.74% (CS) (meanof both years).
3.6. Forage maize production and N uptake
In 2008, the application of N fertilizers resulted in similar DM yieldsand crop N uptake compared tomaize plots with noN fertilizer applica-tion (P N 0.05) (Table 4), with overall mean values of 16.4 Mg DM ha−1
and 163.5 kg N ha−1 for DM yield and N uptake, respectively. In 2009,DM yields and N uptake from N fertilized treatments were 1.5 and 2-fold larger than for the CN treatment (P b 0.05) but no significant differ-ences in these parameters between N-fertilizers were observed. In
0
5
10
15
20
25
1st A
ppl 7 14 21 28 34 41 48 55
2nd
App
l 7 14 21 28 35 42 49 56 63 70 77 84
Cum
ulat
ive
N2O
-N e
mis
sion
s (k
g ha
-1)
Days after fertilization Days after fertilization
CN
MN
PS
CS
2008I 2008II
1st A
ppl 7 14 21 28 34 41
2nd
App
l 7 14 21 28 35 42 49 56 63 70 77 842009I 2009IICN
MN
PS
CS
a b
c d
CNMNPSCS
2009I 2009II
0
500
1000
1500
2000
2500
3000
µg N
2O-N
m-2
h-1
CN
MN
PS
CS
2008I 2008II
Fig. 4. Nitrous oxide fluxes after N fertilization in a) 2008 and b) 2009. Cumulative N2O emissions in c) 2008 and d) 2009. Data points and error bars represent the mean value of threereplicates and the standard error of the mean, respectively. Vertical lines mark periods between applications. Treatments were: control (CN), mineral fertilizer as NPK+ granular urea46% (MN), injected cattle slurry (CS) and injected pig slurry (PS). Periods were: ‘2008I’ (22nd May–22nd July), ‘2008II’ (22nd July–16th October), ‘2009I’ (22nd May–6th July) and‘2009II’ (6th July–25th September).
59A. Louro et al. / Geoderma Regional 5 (2015) 54–63

terms of ANE and ANR (Table 4), no significant differences between N-fertilized treatments were observed in any year (P N 0.05). However,ANE and ANR values in 2009 were 2.6 fold and 2.0-fold larger than thecorresponding averages in 2008, respectively. The yield-scaled N2Oemissions (Table 4) showed no differences between N fertilized andCN plots in any year (P N 0.05) but values in 2009 were approximately2-fold lower than those obtained in 2008 (P b 0.05).
4. Discussion
4.1. Influence of soil mineral N and moisture contents on N2O fluxes
We assessed different N-fertilizers typically applied by local farmersduring forage maize cultivation in order to identify the N fertilizer typethat related to low N2O emissions while maximizing production. How-ever, the experimental sites had large initial mineral N contents in thesoil profile (106 kg N ha−1 in 2008 and 123 kg N ha−1, in 2009, datanot shown). Low C/N residues from previous crops (pea/pea-triticale)were incorporated in both sites one year prior themaize season, follow-ed by a fallow period during winter. So, the application of the differentfertilizers at sowing further increased the mineral-N pool in the soil.This explains the high N2O background values and those induced bythe application of fertilizers observed throughout both cropping sea-sons. The losses of N2O were especially high during the first period ofeach year e.g.‘2008I’ and ‘2009I’ as the N plant requirements were lowat this growth stage and soil WFPS and soil mineral N contents werehigh (Sehy et al., 2003; Tan et al., 2009; Drury et al., 2014). However,the total losses varied between years, probably due to the differentsoil WFPS (Fig. 2c, d). These differences could have also been relatedto the different positions on the slope of the experimental sites; at thebottom of a slope close to a river in 2009, and on the top in 2008. This
would have resulted in large water contribution from the upslope landafter rainfall episodes, causing saturated conditions and even standingwater at the soil surface in 2009. Nitrification could have been thecause of the N2O fluxes during the first days after the first fertilizationin both years (‘2008I’, ‘2009I’). This is supported by the increase of soilNO3
−-N in all N treatments, especially in PS and CS where the Nwas ap-plied entirely as NH4
+-N (Fig. 3). However, this transformation wasslower in ‘2009I’ as soil mineral N was present both as NH4
+-N andNO3
−-N ten days after fertilization where, at the same stage, mineral Nwas practically all as NO3
−-N in ‘2008I’. This was probably caused bythe high soil WFPS contents in ‘2009I’. In addition, most of the existingNO3
−-N in MN plots and that already produced in CS and PS and alsoin MN plots during ‘2009I’ could have been further reduced to N2
(Smith et al., 2003) at such high soil WFPS levels, explaining the lowerN2O fluxes observed compared to ‘2008I’ (Fig. 3). The CN plots alsohad an increase in soil NO3
−-N contents suggesting that mineralizationof the soil OM and nitrification had occurred. The increase was largerin 2008 possibly due to the drying and wetting cycles observed duringthis year. During long periods of dry soil, a large fraction of themicrobialpopulation can die, increasing the levels of OM in the soil and, after soilrewetting, the surviving microbial biomass mineralizes that fresh OM(Van Gestel et al., 1993). Also these cycles could disrupt soil aggregates,exposing the large soil OM contents of this soil to a rapidmineralization(Goebel et al., 2005) and consequently emitting large pulses of N2O,whichwould be in agreement with other studies carried out in temper-ate climates (Jørgensen et al., 1998; Kim et al., 2010), semi-arid climates(Barton et al., 2008; Dick et al., 2001) or even under laboratory incuba-tions (Bergstermann et al., 2011). In our study, the resulting fluxes con-tributed approximately 40% to the total cumulative N2O emissions fromeach treatment and denitrificationwould have been the largest contrib-utor after both episodes of soil rewetting as soil NO3
−-N contents and
Table 3Nitrogen applied (kg N ha−1), mean (kg N2O-N ha−1 day−1) and total (kg N2O-N ha−1) cumulative N2O emissions in the periods studied after each N application and for the maize totalgrowth season and the resulting emission factors in 2008 and 2009. Treatments were: control (CN), mineral fertilizer as NPK+ granular urea 46% (MN), injected cattle slurry (CS) andinjected pig slurry (PS). Mean values of three replicates and standard error between brackets. Treatments with different letters within each column and year are significantly different(P b 0.05).
Year/site Treatment ‘I’ ‘II’ Total (‘I’ + ‘II’)
Napplied
Mean N2Ocumulativefluxes
Total N2Ocumulativefluxes
Napplied
Mean N2Ocumulativefluxes
Total N2Ocumulativefluxes
Total Napplied
Mean N2Ocumulativefluxes
Total N2Ocumulativefluxes
EF
2008 22nd May–22nd July 2008 22nd July–16th October 2008 22nd May–16th October 2008CS 203 0.17 (0.01)a 10.5 (0.6)a – 0.12 (0.01)a 10.0 (0.7)a 203 0.14 (0.00)a 20.5 (0.8)a 2.15 (0.53)a
PS 200 0.16 (0.01)a 9.8 (0.4)a – 0.12 (0.01)a 10.0 (0.8)a 200 0.13 (0.00)a 19.8 (0.4)a 1.82 (0.28)a
MN 125 0.16 (0.01)a 9.9 (0.6)a 75 0.11 (0.00)a 9.9 (0.2)a 200 0.13 (0.00)a 19.8 (0.8)a 1.80 (0.07)a
CN – 0.13 (0.00)b 8.1 (0.3)b – 0.09 (0.00)b 8.1 (0.3)b – 0.11 (0.00)b 16.2 (0.8)b –
2009 22nd May–6th July 2009 6th July–25th September 2009 22nd May–25th SeptemberCS 214 0.13 (0.01)a 5.8 (0.2)a – 0.06 (0.01)a 5.2 (0.4)a 214 0.09 (0.00)a 10.9 (0.4)a 1.33 (0.35)a
PS 186 0.12 (0.00)a 5.5 (0.2)a – 0.06 (0.00)a 5.3 (0.1)a 186 0.08 (0.00)a 10.8 (0.2)a 1.44 (0.35)a
MN 125 0.14 (0.01)a 6.5 (0.4)a 75 0.06 (0.00)a 5.2 (0.3)a 200 0.09 (0.01)a 11.7 (0.7)a 1.82 (0.45)a
CN – 0.09 (0.01)b 4.2 (0.5)b – 0.04 (0.00)b 3.8 (0.2)b – 0.06 (0.00)b 8.1 (0.5)b –
Table 4Dry matter yield, N uptake, apparent N efficiency (ANE), apparent N recovery (ANR) and yield-scale N2O emissions in the maize growth seasons of 2008 and 2009. Treatments were:control (CN), mineral fertilizer as NPK+ granular urea 46% (MN), injected cattle slurry (CS), injected pig slurry (PS). Mean values of three replicates and standard error between brackets.Treatments with different letters within each column and year are significantly different (P b 0.05).
Year/site Treatment N applied Yield N uptake ANE ANR Yield-scaled N2O fluxes
kg N ha−1 Mg DM ha−1 kg N ha−1 kg DM kg−1 N % kg N2O−N Mg−1 DM
2008 CS 203 18.3 (2.7)a 175.2 (17.7)a 19.65 (10.61)a 23.01 (4.70)a 1.18 (0.19)a
PS 200 16.5 (1.2)a 177.0 (11.8)a 10.82 (3.98)a 22.12 (6.53)a 1.22 (0.09)a
MN 200 16.4 (1.4)a 169.2 (9.8)a 10.27 (4.79)a 18.25 (3.16)a 1.23 (0.14)a
CN – 14.3 (0.5)a 132.7 (12.6)a – – 1.13 (0.07)a
2009 CS 214 20.6 (1.0)a 161.5 (10.8)a 32.58 (8.41)a 34.45 (8.86)a 0.53 (0.05)a
PS 186 21.0 (0.4)a 176.1 (8.7)a 39.44 (5.79)a 47.48 (8.06)a 0.51 (0.01)a
MN 200 20.2 (0.6)a 189.7 (10.3)a 32.93(3.73)a 50.93 (3.61)a 0.58 (0.05)a
CN – 13.7 (1.2)b 87.8 (13.2)b – – 0.59 (0.02)a
60 A. Louro et al. / Geoderma Regional 5 (2015) 54–63

WFPS contents were not limiting for losses of N2O by this pathway(Davidson et al. 1991).
4.2. Impact of mineral or organic fertilizer on cumulative N2O emissions
Literature reviews including soils planted with maize have reportedcontradicting emission responses to the application of mineral and or-ganic fertilizers (Table 5): greater N2O emissions from mineral fertil-izers in López-Fernández et al. (2007) and Chantigny et al. (2010) inclay soil, lower in Chantigny et al. (2010) in loam soil and vanGroenigen et al. (2004). In agreement with our study, similar losses ofN2O from mineral and organic fertilizers are reported in Collins et al.(2011), Cai et al. (2012), Damdreville et al. (2008) and Meijide et al.(2007). The latter experiments, with the exception of those by Caiet al. (2012) and Meijide et al. (2007), corresponded to experimentalsites with lower native soil C content but similar soil texture as in ourexperiment. The application of organic C contained in the slurries tosoils with low C contents enhances microbial growth which promotesoxygen consumption and creates temporary anaerobic microsites(Cannavo et al., 2004), enhancing N2O production by denitrification.Thus, the similar large N2O emissions observed from mineral andslurry-treated plots in our experiment suggest that sufficient nativesoil C contents (Table 1) were available to support denitrification andthat any differences between N2O emissions were ultimately relatedtomineral N availability. This is also in agreementwith the observationsof Chantigny et al. (2010) and Pelster et al. (2012) in soils planted withmaize and wheat, respectively, and both had high C contents.
The results reviewed in Table 5 confirm that the resulting EFs de-rived from maize cropping are not always similar the IPCC defaultvalue of 1% (IPCC, 2006). Under Mediterranean climatic conditions,even under lower soil C contents, urea or pig slurries under irrigation
(López-Fernández et al., 2007;Meijide et al., 2007) resulted in EFs largerthan this threshold value. In Canada (Chantigny et al., 2010; Gagnonet al., 2011), when optimal soil moisture conditions for N2O losses bydenitrification are combined with higher soil C contents than those inthis study, the resulting EF are even higher. However, in silt loam soils(Collins et al., 2011; Damdreville et al., 2008, Table 5) fertilizationcaused similar or lower losses than 1%, contrary to our study, probablybecause of the lower soil C availability and greater soil aeration (WFPS36.1–42.1% in Collins et al., 2011; 45–46%WFPS in Damdreville et al.,2008). This indicates that the IPCC default value understimates N2Oemissions from maize cropping in this region and in this type of soil.
4.3. Yield scale N2O emissions
ExpressingN2O fluxes in terms of crop productivity did not reveal anassociation between fertilizer type, lowN2O production and high yields,possibly due to the large initial soil N contents in both soil sites. Howev-er, the results showed that evenwhen similar types of fertilizers are ap-plied at similar rates in the same soil type, yield scale factors vary largelyfrom one year to other. In this sense, as it wasmentioned, Nmineraliza-tion could probably be more stimulated during 2008 because of the en-vironmental conditions (e.g. soil moisture and temperature, Ma et al.,1999), increasing the amounts of mineral N available in the soil profilecompared to in 2009. This resulted in the low efficiency of N fertilizersto increase yields during 2008, leaving larger quantities of N after har-vest compared to 2009 (66–425 kg N ha−1 in 2008 versus 24–47 kg N ha−1 in 2009, data not shown). This indicates that the N inputsfrom mineralization varied seasonally, in agreement with Zhang et al.(2015) and Loecke et al. (2012) and thus, so do the optimal N rates formaize cropping as N demand changes (Olfs et al., 2005; Raun et al.,2009). So, the N2O emissions observed during 2008 were related to
Table 5Soil classification and properties (texture, soil OM, C contents), cumulative background and fertilizer induced N2O emissions, and EF from derived frommaize cropping studies reviewed.
Location N applied(kg N ha−1)(control/treat1/treat 2)
Treatmentsa
(control/treat1/treat 2)
Soil classification Soiltexture
C content(g C kg−1)
OM(%)
CumulativeN2O emissions(kg N2O-N ha−1)
Emissionfactor (%)
Ref.b
Control Treat 1 Treat 2 Treat 1 Treat 2
Madrid, Spain 0/170/170 Control/incorporatedpig slurry/urea
Typic Xerofluvent Sandy loam 8.2 1.4 2.91 5.08 5.89 1.27 1.80 1
Henan province, China 0/150/150 Control/organicmanure/NPK
Aquic Inceptisol Sandy loam 6.46 – 0.06 0.30 0.47 0.15 0.27 2
Quebec, Canada 0/100/100 Control/liquid swinemanure/mineralfertilizer
Clayey, mixed, frigid,Typic Humaquept
Clay 46.8 – 2.63 7.10 11.61 3.1 6.6 3
Quebec, Canada 0/100/100 Control/liquid swinemanure/mineralfertilizer
Loamy, mixed, frigid,Typic Dystrocryept
Loam 29.9 – 1.44 4.59 2.01 2.4 0.4 3
Wageningen,Netherlands
0/209/188 Control/cattleslurry/CAN
Typic Endoaquoll Sandy – 4 0.14 1.70 0.25 0.75 0.06 4
Wageningen,Netherlands
0/196/188 Control/cattleslurry/CAN
Typic Endoaquept Heavy clay – 6.4 1.52 3.37 2.75 0.88 0.66 4
Prosser, USA 0/336/336 Control/liquidmanure/NPK
Coarse-silty, mixed,superactive, mesicXeric Haplocambid
Silt loam 10 – 0.155 0.411 0.361 0.10 0.08 5
Rennes, France 0/110/180 Control/pigslurry/AN
Luvisol Redoxisol Silt loam 9.5 – 1.00 1.028 2.167 1.07 0.02 6c
Rennes, France 0/180/132 Control/maturedpig manure/AN
Luvisol Redoxisol Silt loam 10.1 – 0.344 0.851 0.872 0.38 0.29 6c
Madrid, Spain 0/175/175 Control/pig slurrywithout DCD/urea
Typic Xerofluvent Sandy loam 0.0089d 1.4 5.98 8.27 8.57 1.30 1.49 7
Quebec, Canada 0/200/200 Control/UAN/CAN Fine, mixed, frigidTypic Humaquept
Clay 46 – 6.5 14.2 13.3 3.8 3.4 8
Note: in those experiments where different N rates of the same fertilizer were tested, the resulting N2O emissions and EF after the application of similar N rates as in this experimentwereselected. Also, in those works with more than one year of study testing the same N rate/s of the same fertilizer/s, the mean value of the N2O emissions and EF obtained was considered.
a Treatments: CAN: calcium-ammonium nitrate; AN: ammonium nitrate; UAN: urea-ammonium nitrate; DCD: dicyandiamide.b Ref.: 1, López-Fernández et al. (2007); 2, Cai et al. (2012); 3, Chantigny et al. (2010); 4, van Groenigen et al. (2004); 5, Collins et al. (2011); 6, Damdreville et al. (2008); 7,Meijide et al.
(2007); 8, Gagnon et al. (2011).c Calculated by lineal interpolation of periodic fluxes on the field.d Expressed in g kg−1 of water soluble organic C.
61A. Louro et al. / Geoderma Regional 5 (2015) 54–63
the N rate that exceeded crop N uptake capacity (Snyder et al., 2009).Nitrogen fertilization strategies to maize cropping in this region mustconsider possible large N inputs from soil mineralization and adapt Nfertilizer rates to match crop demands. Similarly, Hartmann et al.(2014) reported that N applications during maize growing seasonmust be reduced as mineralization meets crop demands and N lossesare very likely to occur. Also, they confirm that reductions in N applica-tion rates relative to conventional farming practices (excess of N inputs)do not affect maize yields and cause less N surpluses at harvest. Similarconclusions were also reported by Zhang et al. (2015). So, our studyhighlights the need to increase the knowledge of initial soil N contentsat the moment of the N application and the dynamics of soil organicmattermineralization to adaptN rates to efficientlymeet crop demands,especially in the period between sowing and top dressing applicationwhen demands are small.
5. Conclusions
We observed large differences in N2O losses between the twomaizecropping seasons studied even though theywere performed in the samesoil type. The different location of the sites could have influenced thecontrasting soil moisture contents observed during both seasons andthe extension of these events, which affected nitrification and denitrifi-cation processes. The objective of this studywas to identify theN sourcethat produced low N2O production and high yields. However, we werenot able to select one, as the forms of N applied caused similar N2Olosses to produce the same yields, probably due to the high C contentscharacteristic of the type of soil studied. It was also observed that thelarge initial soil mineral N contents at both sites, together with the ap-plication of the N treatments resulted in an accumulation in the soilafter harvesting, especially in 2008. This study highlights the need to in-crease the knowledge of initial soil N contents at the moment of the Napplication and the dynamics of soil organic matter mineralization toadapt N rates to efficiently meet crop demands, especially in the periodbetween sowing and top dressing application when demands are small.
Acknowledgments
This work was supported by the National Institute for Agriculturaland Food Research and Technology (INIA) under the projectSUM2006-00017-C03-03 and by Regional Funds (Conselleria deMedio Rural, Xunta de Galicia) under the project 07MRU040503PR.The authorswould like to thank INIA for the grant awarded to AránzazuLouro López, and Dr. WilliamMark Roberts and Prof. Keith Goulding fortheir comments and help on the preparation and editing of the manu-script. Rothamsted Research receives strategic funding by the Biotech-nology and Biological Sciences Research Council (BBSRC).
Appendix A. Supplementary data
Supplementary data associated with this article can be found in theonline version, at http://dx.doi.org/10.1016/j.geodrs.2015.03.004.These data include Google map of the most important areas describedin this article.
References
Abbasi, M.K., Adams, W.A., 2000. Gaseous N emission during simultaneous nitrification–denitrification associated with mineral N fertilization to a grassland soil under fieldconditions. Soil Biol. Biochem. 32, 1251–1259.
Alves, B.J.R., Smith, K.A., Flores, R.A., Cardoso, A.S., Oliveira, W.R.D., Jantalia, C.P., Urquiaga, S.,Boddey, R.M., 2012. Selection of the most suitable sampling time for static chambersfor the estimation of daily mean N2O flux from soils. Soil Biol. Biochem. 46, 129–135.
AOAC, 2000. Official Methods of Analysis of AOAC. 17 ed. Association of Official AnalyticalChemists, Gaithersburg.
Barton, L., Kiese, R., Gatter, D., Butterbach-Bahl, K., Buck, R., Hinz, C., Murphy, D.V., 2008.Nitrous oxide emissions from a cropped soil in a semi-arid climate. Glob. ChangeBiol. 14, 177–192.
Bateman, E.J., Baggs, E.M., 2005. Contributions of nitrification and denitrification to N2Oemissions from soils at different water-filled pore space. Biol. Fertil. Soils 41,379–388.
Battilani, A., Piva, A., Dadomo, M., 1999. Evaluation of the decision support system for ir-rigation scheduling of processing tomato adopted in the Emilia-Romagna region. ActaHorticult. 487, 507–511.
Bergstermann, A., Cárdenas, L., Bol, R., Gilliam, L., Goulding, K., Meijide, A., Scholefield, D.,Vallejo, A., Well, R., 2011. Effect of antecedent soil moisture conditions on emissionsand isotopologue distribution of N2O during denitrification. Soil Biol. Biochem. 43,240–250.
Cai, Y., Ding, W., Luo, J., 2012. Spatial variation of nitrous oxide emission between inter-row soil and interrow plus row soil in a long-term maize cultivated sandy loamsoil. Geoderma 181–182, 2–10.
Cannavo, P., Richaume, A., Lafolie, F., 2004. Fate of nitrogen and carbon in the vadosezone: in situ and laboratory measurements of seasonal variations in aerobic respira-tory and denitrifying activities. Soil Biol. Biochem. 36, 463–478.
Cardenas, L.M., Thorman, R., Ashlee, N., Buttler, M., Chadwick, D., Chambers, B., Cuttle, S.,Donovan, N., Kingston, H., Lane, S., Dhanoa,M.S., Scholefield, D., 2010. Quantifying an-nual N2O emissions fluxes from grazed grasslands under a range of inorganic fertiliz-er nitrogen inputs. Agric. Ecosyst. Environ. 136, 218–226.
Chadwick, D.R., Cardenas, L., Misselbrook, T.H., Smith, K.A., Rees, R.M., Watson, C.J.,McGeough, K.L., Williams, J.R., Cloy, J.M., Thorman, R.E., Dhanoa, M.S., 2014. Optimiz-ing chamber methods for measuring nitrous oxide emissions from plot-based agri-cultural experiments. Eur. J. Soil Sci. 65, 295–307.
Chantigny, M.H., Rochette, P., Angers, D.A., Bittman, S., Buckley, K., Masse, D., Belanger, G.,Erisksen-Hamel, N., Gasser, M.O., 2010. Soil nitrous oxide emissions following band-incorporation of fertilizer nitrogen and swine manure. J. Environ. Qual. 39,1545–1553.
Collins, H.P., Alva, A.K., Streubel, J.D., Fransen, S.F., Frear, C., Chen, S., Kruger, C.,Granatstein, D., 2011. Greenhouse gas emissions from an irrigated silt loam soilamended with anaerobically digested dairy manure. Soil Sci. Soc. Am. J. 75,2206–2216.
Damdreville, C., Morvan, T., Germon, J.C., 2008. N2O emission in maize-crops fertilizedwith pig slurry, matured pig manure or ammonium nitrate in Brittany. Agric. Ecosyst.Environ. 123, 201–210.
Davidson, E.A., 1991. Fluxes of nitrous oxide and nitric oxide from terrestrial ecosystems.In: Rogers, J.E., Whitman, W.B. (Eds.), Microbial Production and Consumption ofGreenhouse Gases: Methane, Nitrogen Oxides, and Halomethanes. American Societyfor Microbiology, Washington DC, pp. 219–235.
Dick, J., Skiba, U.M., Wilson, J., 2001. The effect of rainfall on NO and N2O emissions fromUgandan agroforest soils. Phyton-Ann. Rei Bot. A 41, 73–80.
Drury, C.F., Reynolds, W.D., Tan, C.S., McLaughlin, N.B., Yang, X.M., Calder, W., Oloya, T.O.,Yang, J.Y., 2014. Impacts of 49–51 years of fertilization and crop rotation on growingseason nitrous oxide emissions, nitrogen uptake and corn yields. Can. J. Soil Sci. 94,421–433.
ESYRCE, 2013. Encuestas sobre superficies y rendimientos de cultivos. Resultadosnacionales y autonómicos. Ministerio de Agricultura, Alimentación y Medioambiente(MAGRAMA), Madrid.
Fernández, J., Curt, D., Aguado, P.L., Esteban, B., Sánchez, J., Checa, M., Mosquera, F.,Romero, L., 2011. Caracterización de las comarcas agrarias de España. Tomo 2.Provincia de A Coruña. first ed. Ministerio de Medio Ambiente Medio Rural y Marino,Madrid.
Gagnon, B., Ziadi, N., Rochette, P., Chantigny, M.H., Angers, D.A., 2011. Fertilizer source in-fluenced nitrous oxide emissions from a clay soil under corn. Soil Sci. Soc. Am. J. 75,595–604.
Goebel, M.O., Bachmann, J., Woche, S.K., Fischer, W.R., 2005. Soil wettability, aggregatestability, and the decomposition of soil organic matter. Geoderma 128, 80–93.
Hartmann, T.E., Yue, S.C., Schulz, R., Chen, X.P., Zhang, F.S., Müller, T., 2014. Nitrogendynamics, apparent mineralization and balance calculations in a maize—wheat dou-ble cropping system of the North China Plain. Field Crop Res. 160, 22–30.
Hyde, B.P., Hawkins, M.J., Fanning, A.F., Noonan, D., Ryan, M., O'Toole, P.O., Carton, O.T.,2006. Nitrous oxide emissions from a fertilized and grazed grassland in the SouthEast of Ireland. Nutr. Cycl. Agroecosyst. 75, 187–200.
IPCC, 2006. 2006 IPCC Guidelines for national greenhouse gas inventories, prepared bythe National Greenhouse Gas Inventories Programme. Agriculture, Forestry andOther Land Use vol. 4. IGES, Japan.
IPCC, 2007. Climate Change 2007: The Physical Science Basis. Contribution of WorkingGroup I to the Fourth Assessment Report of the Intergovernmental Panel on ClimateChange. Cambrigde University Press, Cambrigde and New York.
Jørgensen, R.N., Jørgensen, B.J., Nielsen, N.E., 1998. N2O emission immediately after rain-fall in a dry stubble field. Soil Biol. Biochem. 30, 545–546.
Kim, D.-G., Mishurov, M., Kiely, G., 2010. Effect of increased N use and dry periods on N2Oemission from a fertilized grassland. Nutr. Cycl. Agroecosyst. 88, 397–410.
Loecke, T.D., Cambardella, C.A., Liebman, M., 2012. Synchrony of net nitrogen mineraliza-tion and maize nitrogen uptake following applications of composted and fresh swinemanure in the Midwest U.S. Nutr. Cycl. Agroecosyst. 93, 65–74.
López-Fernández, S., Díez, J.A., Hernáiz, P., Arce, A., García-Torres, L., Vallejo, A., 2007. Ef-fects of fertiliser type and the presence or absence of plants on nitrous oxide emis-sions from irrigated soils. Nutr. Cycl. Agroecosyst. 78, 279–289.
Louro, A., Sawamoto, T., Chadwick, D., Pezzolla, D., Bol, R., Baez, D., Cardenas, L., 2013.Effect of slurry and ammonium nitrate application on greenhouse gas fluxes of agrassland soil under atypical South West England weather conditions. Agric. Ecosyst.Environ. 181, 1–11.
Ma, B.L., Dwyer, L.M., Gregorich, E.G., 1999. Soil nitrogen amendment effects on seasonalnitrogen mineralization and nitrogen cycling in maize production. Agron. J. 91,1003–1009.
62 A. Louro et al. / Geoderma Regional 5 (2015) 54–63

MacDonald, P., Edwards, R., Greenhalgh, J., Morgan, C., 2002. Animal Nutrition. sixth ed.Prentice Hall, Harlow and Upper Saddle River.
MAGRAMA, 2012. Inventario de gases de efecto invernadero de España 1999–2010.Sumario de resultados. Ministerio de Agricultura, Alimentación y Medioambiente,Madrid.
Meijide, A., Díez, J.A., Sánchez-Martín, L., López-Fernández, S., Vallejo, A., 2007. Nitrogenoxide emissions from an irrigated maize crop amended with treated pig slurriesand composts in a Mediterranean climate. Agric. Ecosyst. Environ. 121, 383–394.
Mosier, A., Kroeze, C., Nevison, C., Oenema, O., Seitzinger, S., van Cleemput, O., 1998. Clos-ing the global N2O budget: nitrous oxide emissions through the agricultural nitrogencycle. Nutr. Cycl. Agroecosyst. 52, 225–248.
Olfs, H.W., Blankenau, K., Brentrup, F., Jasper, J., Link, A., Lammel, J., 2005. Soil- and plant-based nitrogen-fertilizer recommendations in arable farming. J. Plant Nutr. Soil Sci.168, 414–431.
Papadakis, J., 1966. Climates of the World and Their Agricultural Potentialities. DAPCO,Rome, Italy.
Parkin, T., Venterea, R., 2010. Chapter 3. Chamber-based trace gas flux measurements. In:Follett, R.F. (Ed.), USDA-ARS GRACEnet Project Protocols. USDA-ARS, Fort Collins,pp. 1–39.
Pelster, D.E., Chantigny, M.H., Rochette, P., Angers, D.A., Rieux, C., Vanasse, A., 2012. Ni-trous oxide emissions respond differently to mineral and organic nitrogen.J. Environ. Qual. 41, 427–435.
Raun, W.R., Ortiz-Monasterio, I., Solie, J.B., 2009. Temporally and spatially dependent ni-trogen management in diverse environments. In: Carver, B.F. (Ed.), Wheat Scienceand Trade. Willey-Blackwell, Ames, Iowa, pp. 203–214.
Rochette, P., Bochove, E.v., Prévost, D., Angers, D.A., Côté, D., Bertrand, N., 2000. Soil carbonand nitrogen dynamics following application of pig slurry for the 19th consecutiveyear II. Nitrous oxide fluxes and mineral nitrogen. Soil Sci. Soc. Am. J. 64, 1396–1403.
Ryden, J.C., Rolston, D.E., 1983. The measurement of denitrification. In: Freney, J.R.,Simpson, J.R. (Eds.), Gaseous Loss of Nitrogen from Plant–Soil Systems. Springer,Netherlands, pp. 91–132.
Sehy, U., Ruser, R., Munch, J.C., 2003. Nitrous oxide fluxes from maize fields: relationshipto yield, site-specific fertilization, and soil conditions. Agric. Ecosyst. Environ. 99,97–111.
Sistani, K.R., Warren, J.G., Lovanh, N., Higgins, S., Shearer, S., 2010. Greenhouse gas emis-sions from swine effluent applied to soil by different methods. Soil Sci. Soc. Am. J. 74,429–435.
Skiba, U., Ball, B., 2002. The effect of soil texture and soil drainage on emissions of nitricoxide and nitrous oxide. Soil Use Manag. 18, 56–60.
Smith, K.A., Jackson, D.R., Misselbrook, T.H., Pain, B.F., Johnson, R.A., 2000. PA-PrecisionAgriculture: reduction of ammonia emissions by slurry application techniques.J. Agric. Eng. Res. 77, 277–287.
Smith, K.A., Ball, T., Conen, F., Dobbie, K.E., Massheder, J., Rey, A., 2003. Exchange of green-house gases between soil and atmosphere: interactions of soil physical factors and bi-ological processes. Eur. J. Soil Sci. 54, 779–791.
Smith, P., Martino, D., Cai, Z., Gwary, D., Janzen, H., Kumar, P., McCarl, B., Ogle, S., O'Mara,F., Rice, C., Scholes, B., Sirotenko, O., Smith, P., Martino, D., Cai, Z., Gwary, D., Janzen, H.,Kumar, P., McCarl, B., Ogle, S., O'Mara, F., Rice, C., Scholes, B., Sirotenko, O., 2007. Ag-riculture. In: Metz, B., Davidson, O.R., Bosch, P.R., Dave, R., Meyer, L.A. (Eds.), Climatechange 2007: mitigation, contribution of working group III to the fourth assessmentreport of the intergovernmental panel on climate change. Cambrigde University,Cambrigde and New York.
Snyder, C.S., Bruulsema, T.W., Jensen, T.L., Fixen, P.E., 2009. Review of greenhouse gasemissions from crop production systems and fertilizer management effects. Agric.Ecosyst. Environ. 133, 247–266.
Tan, I.Y.S., van Es, H.M., Duxbury, J.M., Melkonian, J.J., Schindelbeck, R.R., Geohring, L.D.,Hively, W.D., Moebius, B.N., 2009. Single-event nitrous oxide losses under maize pro-duction as affected by soil type, tillage, rotation, and fertilization. Soil Tillage Res. 102,19–26.
Van Gestel, M., Merckx, R., Vlassak, K., 1993. Microbial biomass responses to soil dryingand rewetting: the fate of fast- and slow-growing microorganisms in soils from dif-ferent climates. Soil Biol. Biochem. 25, 109–123.
van Groenigen, J.W., Kasper, G.J., Velthof, G.L., van den Pol-van Dasselaar, A., Kuikman, P.J.,2004. Nitrous oxide emissions from silage maize fields under different mineral nitro-gen fertilizer and slurry applications. Plant Soil 263, 101–111.
van Groenigen, J.W., Velthof, G.L., Oenema, O., Van Groenigen, K.J., Van Kessel, C., 2010.Towards and agronomic assessment of N2O emissions: a case study for arablecrops. Eur. J. Soil Sci. 61, 903–913.
Wulf, S., Maeting, M., Clemens, J., 2002. Application technique and slurry co-fermentationeffects on ammonia, nitrous oxide, andmethane emissions after spreading: II. Green-house gas emissions. J. Environ. Qual. 31, 1795–1801.
Zhang, X., Wang, Q., Xu, J., Gilliam, F.S., Tremblay, N., Li, C., 2015. In situ nitrogen miner-alization, nitrification, and ammonia volatilization in maize field fertilized with ureain Huanghuaihai Region of Northern China. PLoS One 10 (1), e0115649.
63A. Louro et al. / Geoderma Regional 5 (2015) 54–63