USC / School Performance Dashboard - ERIC
62
USC / School Performance Dashboard 2011 A Report from the Center on Educational Governance / University of Southern California 6 6 6 4 8 7 7 9 8 10 8 9 10 10 7 10 10 10 1 1 2 1
-
Upload
khangminh22 -
Category
Documents
-
view
0 -
download
0
Transcript of USC / School Performance Dashboard - ERIC

USC / School Performance Dashboard
2011
A Report from the Center on Educational Governance /University of Southern California
6 6 6 4 8 7
7 9 8 10 8 9
10 10 7 10 10 10
1 1 2 1
10 9 10 10 10
1 1 4 1 1 1
8 7 3 6 7 8

USC / School Performance Dashboard / 1
ForewordIntroduction . . . . . . . . . . . . . . . . . . . . . . . . . . . . . . . . . . . . . . . . . . . . . . . . . . . . . . . . . . . . . . . . . . . . 2 Introduction / Top 10 Performers . . . . . . . . . . . . . . . . . . . . . . . . . . . . . . . . . . . . . . . . . . . . . . . . . 4Figure: Transforming Data into Knowledge . . . . . . . . . . . . . . . . . . . . . . . . . . . . . . . . . . . . . . . . 5 Snapshot: California Charter Schools, 2009 to 2010 . . . . . . . . . . . . . . . . . . . . . . . . . . . . . . . . 6
The Report / Across California
Understanding the Charts . . . . . . . . . . . . . . . . . . . . . . . . . . . . . . . . . . . . . . . . . . . . . . . . . . . . . . . 9
Financial Resources and InvestmentReserves Ratios . . . . . . . . . . . . . . . . . . . . . . . . . . . . . . . . . . . . . . . . . . . . . . . . . . . . . . . . . . . . . . . 10Liquidity Ratios . . . . . . . . . . . . . . . . . . . . . . . . . . . . . . . . . . . . . . . . . . . . . . . . . . . . . . . . . . . . . . . . 11Direct Classroom Investment . . . . . . . . . . . . . . . . . . . . . . . . . . . . . . . . . . . . . . . . . . . . . . . . . . . 12
School QualityTeaching Resources . . . . . . . . . . . . . . . . . . . . . . . . . . . . . . . . . . . . . . . . . . . . . . . . . . . . . . . . . . . 13Teacher Qualification . . . . . . . . . . . . . . . . . . . . . . . . . . . . . . . . . . . . . . . . . . . . . . . . . . . . . . . . . . 14English Learner Reclassification . . . . . . . . . . . . . . . . . . . . . . . . . . . . . . . . . . . . . . . . . . . . . . . . 15
School PerformanceAPI Composite . . . . . . . . . . . . . . . . . . . . . . . . . . . . . . . . . . . . . . . . . . . . . . . . . . . . . . . . . . . . . . . . . 16Adequate Yearly Progress . . . . . . . . . . . . . . . . . . . . . . . . . . . . . . . . . . . . . . . . . . . . . . . . . . . . . . 17Academic Momentum . . . . . . . . . . . . . . . . . . . . . . . . . . . . . . . . . . . . . . . . . . . . . . . . . . . . . . . . . . 18
Academic ProductivityEnglish/Language Arts Productivity . . . . . . . . . . . . . . . . . . . . . . . . . . . . . . . . . . . . . . . . . . . . . 19Math Productivity . . . . . . . . . . . . . . . . . . . . . . . . . . . . . . . . . . . . . . . . . . . . . . . . . . . . . . . . . . . . . . 20School Productivity . . . . . . . . . . . . . . . . . . . . . . . . . . . . . . . . . . . . . . . . . . . . . . . . . . . . . . . . . . . . 21
The Report / Individual SchoolsUnderstanding the Tables . . . . . . . . . . . . . . . . . . . . . . . . . . . . . . . . . . . . . . . . . . . . . . . . . . . . . . 23Map of California Counties . . . . . . . . . . . . . . . . . . . . . . . . . . . . . . . . . . . . . . . . . . . . . . . . . . . . . 24Charter School Scores, Grouped by County . . . . . . . . . . . . . . . . . . . . . . . . . . . . . . . . . . . . . . 25
AppendicesAppendix A / Data Sources and Terms . . . . . . . . . . . . . . . . . . . . . . . . . . . . . . . . . . . . . . . . . . . 50Appendix B / Creating the Dashboard . . . . . . . . . . . . . . . . . . . . . . . . . . . . . . . . . . . . . . . . . . . 52Appendix C / Index and Data Sources . . . . . . . . . . . . . . . . . . . . . . . . . . . . . . . . . . . . . . . . . . . 54
Credits . . . . . . . . . . . . . . . . . . . . . . . . . . . . . . . . . . . . . . . . . . . . . . . . . . . . . . . . . . . . . . . . . . . . . . 58
Table of Contents

USC / School Performance Dashboard / 2
In his 2011 State of the Union address, President Barack Obama declared that charter schools are a way to out-innovate and out-educate our competitors worldwide. The Presi-dent believes that investment in education must be accompanied by reform, including the expansion of high-quality charter schools. President Obama has challenged states to lift limits that stifle growth among successful charter schools and has encouraged rigorous accountability for all charter schools.
This report, in its fifth year, has a similar goal of accountability in reporting school data. Now titled USC School Performance Dashboard, it draws on California school data from 2003 to 2010. For the second year, we provide an accompanying interactive report at school-performance.usc.edu.
What’s New
The big news is that the nation’s financial crisis has hit California public schools. Schools have less to work with, so their financial health is not as strong as it has been in past years. EdSource reports that the state education budget has been cut by five percent since the recession hit, and legislators are contemplating an additional 10 percent cut. This amounts to a loss of almost $1,200 in funding per pupil, or the equivalent of 15 teachers (salaries and benefits) in a school of 1,000 students. The bottom line: Charter schools – like all public schools in the state – have less money to save and less to carry over from year to year.
So how have charter schools responded? For one thing, they have tightened their belts. Schools have dramatically reallocated larger proportions of their operating budget into direct classroom instruction. Cuts in charters appear to be outside the classroom, such as counselors, school staff, and outreach personnel; those positions added when budgets were less lean are the first to go.
Another trend across many of the Dashboard indicators is that charters, when compared to non-charter public schools, are overrepresented at the very top and the very bottom of the performance distribution. This applies to the School Performance indicators, the Academic Momentum indicators and the School Productivity indicators. This may be due to the large increase in the number of charter schools reporting since our last Dashboard (more than 300 additional schools on some measures). Or perhaps the results relate to the aging of California’s charter population: Some charter schools become high-performing as they age and learn from experience, while others flounder when faced with leadership changes and financial instability.
Regardless of the precise explanation, what’s needed is an investigation into the schools at the top. What are the promising practices that lead to their high performance? Equally important, we need to pay attention to the charters at the very bottom: Who are their au-thorizers? What kinds of quality controls have been put in place to monitor performance? What level of performance is poor enough to revoke the charter?
A Report from the University of Southern California
Introduction / School Performance Dashboard

USC / School Performance Dashboard / 3
Spotlight on Charter Schools – Nationally and Locally
Across the U.S. and in California specifically, the number of charter schools has continued to grow. In fall 2010, California – home to 807 charters, more than any other state – opened 90 new charter schools: an eight percent growth. The U.S. Department of Education’s School Improvement Grants program calls charter schools an important strategy for turning around failing schools. Charters are also an option for restructuring failing schools under No Child Left Behind. We have observed significant increases of charters in a few urban California school districts, such as Oakland and Los Angeles, similar to the jump in numbers seen in Chicago, New York and Philadelphia. In those cities, districts are moving away from the common-school model. Instead, they’re moving toward a portfolio of schools that includes a variety of education providers, from traditional public schools to nonprofit organizations and charter groups.
Simultaneously, authorizers are raising their standards; they closed 160 charter schools nationally due to problems in the areas of finance, management, or poor student performance. This phenomenon has hit home with the bankruptcy of the Inner City Education Foundation (ICEF Public Schools), one of California’s largest charter management organization; its 15 charter schools targeted the African American community in South Los Angeles. Our Dashboard measures of financial health, especially the reserves and liquidity ratios, provide warnings to help authorizers put out fires before they become blazes.
Data Challenges
Financial data has always been spotty in the USC Dashboard because of the way counties report district data to the state of California. For this year’s report, USC researchers reached out to several large urban California school districts – such as Los Angeles Unified – which had missing financial data. This generated more financial data for Dashboard users to see. We hope that this greater transparency becomes the norm: that all California counties deliver data to Sacramento in a usable form.
And due to the economic downturn, the state has cut back and slowed down calculating some measures. The state announced they will only report class size in charters every other year, not every year as in the past. Also, this year’s data are not available yet for the Teacher Qualifications Index. The state has promised the data will be released; once available, we will add the information to our Interactive Dashboard.
Louisiana is in the process of adopting a Dashboard of its own, built on California’s example. With five years of the School Performance Dashboard under its belt, California is in a position – hinging on greater transparency and cooperation from Sacramento – to lead the nation in charter school analysis.
The USC School Performance Dashboard Research Team

USC / School Performance Dashboard / 4
This year, we are highlighting 10 high flyers among California’s charter schools. These 10 charter schools had the highest combined ratings on the academic mea-sures and school productivity indicators.
We included charter schools with enrollments of over 100 students and also limited our rankings to charter schools that reported data for each of the measures included – we hope this encourages others to step up their reporting!
1. Heritage K-8 Charter School (Escondido)
2. Rocklin Academy (Rocklin)
3. Temecula Valley Charter School (Winchester)
4. Aspire Vincent Shalvey Academy (Stockton)
5. Aspire River Oaks Charter School (Stockton)
6. Willow Creek Academy (Sausalito)
7. Orange County High School of the Arts (Santa Ana)
8. St. HOPE Public School 7 (Sacramento)
9. Aspire East Palo Alto Charter School (East Palo Alto)
10. Wilder’s Preparatory Academy Charter (Inglewood)
A few notes:
> Grades served varied, with four K-8 schools, five with elementary grades only, and one serving grades 7-12.
> The schools varied in size. Rocklin Academy is the smallest, with an enrollment of 156, while the largest, Orange County High School of the Arts, serves 1417 students.
> Four of the 10 schools are stand-alone charter schools; six are part of a network (CMO, EMO or other type of network).
> The percentage of Free and Reduced Price Lunch students served varies from two percent to 92 percent. Five schools serve more than 50 percent FRL.
> Nine of the 10 schools serve fewer than 10 percent English Language Learners.
> The schools vary in age but tend to be more “mature” schools. Seven of the 10 were established 10 or more years ago.
> Our top 10 list meshes with recognition given by others. For example, St. HOPE Public School 7 and Orange County High School of the Arts were named California Distinguished Schools in 2010 and 2009, respectively.
Introduction / Top 10 Performers

USC / School Performance Dashboard / 5
USC Center on Educational Governance
KEY INDICATORS
Charter School Indicators / Transforming Data into Knowledge
USC / School Performance Dashboard
2011
A Report from the Center on Educational Governance /University of Southern California
6 6 6 4 8 7
7 9 8 10 8 9
10 10 7 10 10 10
1 1 2 1
10 9 10 10 10
1 1 4 1 1 1
8 7 3 6 7 8
USC School Performance Dashboard 2011
State of California Database
California Public Schools
Financial Resources and Investment
School Quality
School Performance
Academic Productivity
ACADEmIC DATA
DATA FROm mANDATORY YEARLY REPORTS
FINANCIAL DATA

USC / School Performance Dashboard / 6
Snapshot / California Charter Schools, 2009 to 2010
Ethnicity African American 5.4%American Indian 0.5%Asian 4.9%Filipino 1.5%Hispanic 15.6%Pacific Islander 0.3%White 65.7%Multi-Racial 1.5%Did not report 2.6%
Staff
Averages: Students/Teacher: 21.6 / 1 Students/Admin: 274.8 / 1 Students/Staff: 739.9 / 1
Ethnicity African American 13.1%American Indian 1.3%Asian 3.4%Filipino 1.1%Hispanic 41.7%Pacific Islander 0.5%White 32.9%Multi-Racial 1.8%Did not report 4.1%
Graduate School 12.5%College Grad 20.0%Some College 25.6%High School Grad 22.9%Did Not Graduate 17.7%High School
Percentages: Male: 49.3% Female: 50.7% Free/Reduced Lunch: 50.4% English Learner: 15.2%
Parent Education
Students
K-12 17.9%High 29.6%Middle 11.2%Elementary 40.5%Non-traditional 0.7%
School
Averages: School Size: 397.4 Students/Computer: 9.33 / 1
Charter Type
School Type
New Start 83.3%Conversion 16.7%
Year Chartered
94 95 96 97 98 99 00 01 02 03 04 05 06 07 08 090
50
100
0 50 100%
Number of Schools

USC / School Performance Dashboard / 7
School Size Charter schools’ average enrollment (398 students) is smaller than that of non-charter public schools (610 students). Charter school enrollment has increased from last year’s average of 382 students.
Student/Computer RatioNon-charter public schools have a higher student/computer ratio – 11.4 students per computer – than do charter schools (9.3). Last year, charter schools had about seven students per computer.
Staff AveragesThe student-teacher ratio is slightly higher for charter schools (21.6 students per teacher) than for non-charter public schools (20.6). However, non-charter public schools have higher ratios of students to administrators: 411 students per administrator versus 274.8 students per administrator in charter schools. These comparisons have not changed much from last year.
Staff Ethnicity Compared to non-charter public schools, charter schools have higher percentages of staff members who identify as African-American (5.4% of charter school staff, 3.7% at non-charters). At non-charter public schools, 69.5% of staff report their ethnicity as white, compared to 65.7% at charter schools. These differences in staff ethnicity have changed little from since year.
Free/Reduced Lunch Charter schools enroll fewer students from low-income families. The percentage of students who are eligible for free or reduced lunch at non-charter public schools is 57.1% compared to 50.4% at charter schools. The percentages of low-income students in both types of public schools has increased since last year.
English Learners On average, charter schools have lower percentages of English Learners (15.2) than non-charter public schools (24.4). This was also true last year; however, the percentages have decreased for both charter and non-charter public schools.
Student Ethnicity The overall ethnic composition of charter schools is similar to that of non-charter public schools, but there are some key differences. Charter schools have nearly twice as many African-American students (13.1%) than non-charter public schools (6.8%). The percentage of white students at charter schools (32.9) is slightly higher than that of public non-charters (31.1). Non-charter public schools have higher proportions of Asian students (7.1% compared to 3.4% for charter schools) and Hispanic students (47%, compared to 41.7% in charter schools). These numbers have not changed much from last year.
Parent Education Parents of charter school students have received more formal education than parents of non-charter public school students. While 58.1% of students at charter schools have parents who have received some post-secondary education (attended college, graduated from college, or received graduate education), 52.2% of students at non-charter public schools have parents who have attended school beyond high school. At the same time, parents of students at non-charter schools are more likely not to have finished high school (20.8% compared to 17.7% for parents of charter school students). These numbers are similar to previous years.
Snapshot Highlights / California Charter and Non-Charter Public Schools Compared, 2009 to 2010

USC / School Performance Dashboard / 8
The Report / Across California

USC / School Performance Dashboard / 9
100
80
60
40
20
02004/05
n=2112005/06
n=2642006/07
n=3052007/08
n=3482008/09
n=3582009/10
n=6382009/10n=77255
Non-Charter Public Schools
School Quality / School Performance / Academic ProductivityAll California public schools with available data are included in the calculation of these indicators.
Each column represents one year of data.
Rankings for all schools were broken into quintiles* (equal intervals of 20 percent). If a category is greater than 20 percent, there are more charter schools in that category than non-charters. Less than 20 percent indicates fewer charters in that category than non-charters.
n = the number of charter schools with the data necessary to be included in this ranking.
The vast majority of California public schoolsare non-charter schools, so their data willfall close to the 20 percent intervals.
*except for the Teacher Qualification Index
Understanding the Charts
Financial Resources and InvestmentThe Financial Indicators are calculated for charter schools only. To be included in CSI-USC, charter schools must report their financial data separately from the financial data of their district.
n=182 n=213 n=259 n=286 n=327 n=364 n=545
100
80
60
40
20
02003/04 2004/05 2005/06 2006/07 2007/08 2008/09 2009/10
% in
eac
h sc
ore
rang
e
Each column represents one year of data.
Each color represents a range of valuesused in calculating the scores for the financial indicators.
n = the number of charter schools with the data necessary to be included in this ranking.

USC / School Performance Dashboard / 10
Reserves RatiosCharter Schools, 2003 to 2010
Highlights
DEFINITION: The Reserves Ratios Index is the ratio of reserve fund balances to total expenditures. This measures the portion of total expenditures that a school has saved in reserves, and therefore reflects the ability to weather future costs even if revenue is deficient. The Reserves Ratios Index is reported as a ratio instead of a ranking, and is not compared to non-charter schools.
TRENDS: According to this year’s data, the six-year trend of gradual improvement in charter school financial health has reversed, as reflected in the ratio of reserve fund balances to total expenditures. Proportionately fewer reserves are being carried forward, which could very well reflect reduced revenues appropriated to charter schools that are associated with California’s school spending cutbacks.
Financial Resources and Investment
100
80
60
40
20
0
.75 or more.50 to .75.25 to .50
below .25
2.203.85
20.8873.08
2.352.82
21.6073.24
2.705.79
19.6971.81
4.206.99
24.4864.34
4.897.65
23.8563.61
6.599.89
25.5557.97
6.976.42
26.2460.37
ScoreRanges
2003/04n=182
2004/05n=213
2005/06n=259
2006/07n=286
2007/08n=327
2008/09n=364
2009/10n=545
% in
eac
h sc
ore
rang
e

USC / School Performance Dashboard / 11
Financial Resources and Investment
Liquidity RatiosCharter Schools, 2003 to 2010
Highlights
DEFINITION: The Liquidity Ratios Index is the ratio of a school’s assets to its liabilities. This reflects the school’sability to pay off its short-term debts, as well as the ability to raise additional capital, either through selling off or borrowing against its assets. A school with a high liquidity ratio is more financially stable. The Liquidity Ratios Index is reported as a ratio instead of a ranking, and is not compared to non-charter schools.
TRENDS: Charter schools seem to be reversing the trend of increased financial stability as reflected in the ratio of a school’s assets to its liabilities. After steady increases in this ratio from 2003-04 to 2008-09, the average liquidity ratio declined during 2009-10, reflecting some combination of relative asset loss or increase in liabilities from increased debt levels.
100
80
60
40
20
0
ScoreRanges
2003/04n=173
2004/05n=205
2005/06n=252
2006/07n=276
2007/08n=318
2008/09n=350
2009/10n=403
% in
eac
h sc
ore
rang
e
3.0 or more2.0 to 3.01.0 to 2.0
below 1.0
28.3215.6144.5111.56
30.2420.0033.1716.59
34.1315.4835.3215.08
38.7713.7736.2311.23
39.9416.0435.85
8.18
43.9114.4533.71
7.93
41.1215.2232.2511.41

USC / School Performance Dashboard / 12
Financial Resources and Investment
Direct Classroom InvestmentCharter Schools, 2003 to 2010
Highlights
DEFINITION: The Direct Classroom Investment Index is the ratio of classroom investment to total revenues.Classroom investments include such expenditures as teacher salaries and benefits, textbooks, and curriculum. The Direct Classroom Investment Index is reported as a ratio instead of a ranking, and is not compared to non-charter schools.
TRENDS: After years of proportionate growth in indirect classroom support (investment not directly associated with instruction in classrooms), charters dramatically reallocated much larger proportions of their resources directly into classrooms. This trend reversal is most likely the result of severe belt-tightening due to revenue fall-offs. As schools reduced expenditures in response to the state funding reductions, they appeared to place a high priority on protecting classroom investments, seeking instead to cut resources outside the classroom.
100
80
60
40
20
0
ScoreRanges
2003/04n=183
2004/05n=213
2005/06n=259
2006/07n=285
2007/08n=327
2008/09n=364
2009/10n=545
% in
eac
h sc
ore
rang
e
.70 or more.60 to .70.50 to .60
below .50
12.0225.6831.6930.60
15.4929.5831.4623.47
11.9726.2535.5226.25
11.9320.7035.7931.58
9.4820.4941.9028.13
5.4920.3336.5437.64
49.1724.7715.4115.41

USC / School Performance Dashboard / 13
School Quality
Teaching ResourcesCharter Schools, 2005 to 2010
Highlights
DEFINITION: The Teaching Resources Index reflects the ratio of certified, full-time-equivalent teachers to the number of students at a school.
TRENDS: The data indicate a growing differentiation among charter schools and also between charter schools and non-charter public schools. First, compared to the previous year, there are greater proportions of charter schools in the highest two categories (high ratios of teachers to students), but also greater proportions of charter schools in the lowest category (with low ratios of teachers to students). Second, despite this separation trend among charter schools, charter schools as a group report overall higher ratios of teachers to students than do non-charter public schools. One possible contributing factor to this difference may be charter schools’ apparent priority of protecting classroom teaching positions from budget cuts.
100
80
60
40
20
0
ScoreRanges
% in
eac
h sc
ore
rang
e
9-107-85-63-41-2
22.2421.8519.6917.3218.90
24.5919.9419.1914.6921.59
25.4021.9116.9416.4019.35
23.7425.7516.0814.5719.85
22.0419.8421.0414.2322.85
2007/08n=667
2008/09n=744
2009/10n=796
2005/06n=499
2009/10n=8933
Non-Charter Public Schools
19.6719.4920.3520.4920.00
2006/07n=508
USC / School Performance Dashboard / 14
School Quality
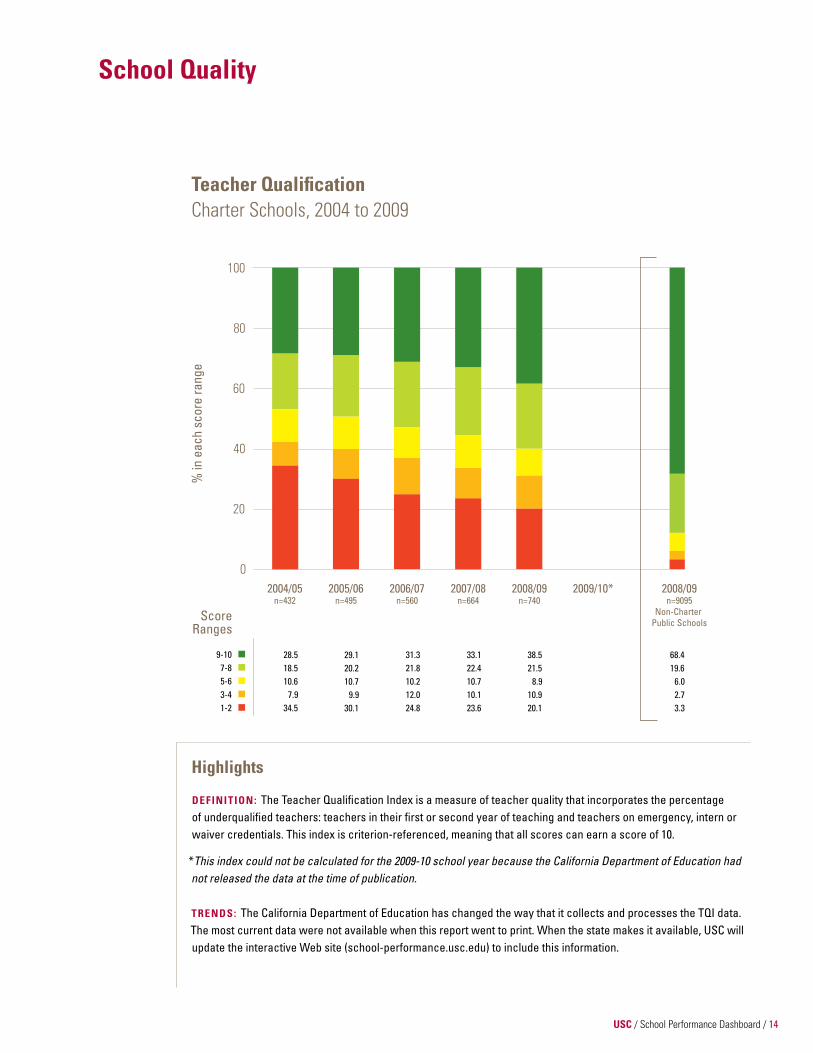
Teacher QualificationCharter Schools, 2004 to 2009
Highlights
DEFINITION: The Teacher Qualification Index is a measure of teacher quality that incorporates the percentage of underqualified teachers: teachers in their first or second year of teaching and teachers on emergency, intern or waiver credentials. This index is criterion-referenced, meaning that all scores can earn a score of 10.
*This index could not be calculated for the 2009-10 school year because the California Department of Education had not released the data at the time of publication.
TRENDS: The California Department of Education has changed the way that it collects and processes the TQI data. The most current data were not available when this report went to print. When the state makes it available, USC will update the interactive Web site (school-performance.usc.edu) to include this information.
100
80
60
40
20
0
ScoreRanges
% in
eac
h sc
ore
rang
e
9-107-85-63-41-2
2004/05n=432
2005/06n=495
2006/07n=560
2007/08n=664
2008/09n=740
28.518.510.6
7.934.5
31.321.810.212.024.8
33.122.410.710.123.6
38.521.5
8.910.920.1
29.120.210.7
9.930.1
2008/09n=9095
Non-Charter Public Schools
68.419.6
6.02.73.3
2009/10*
USC / School Performance Dashboard / 15
School Quality
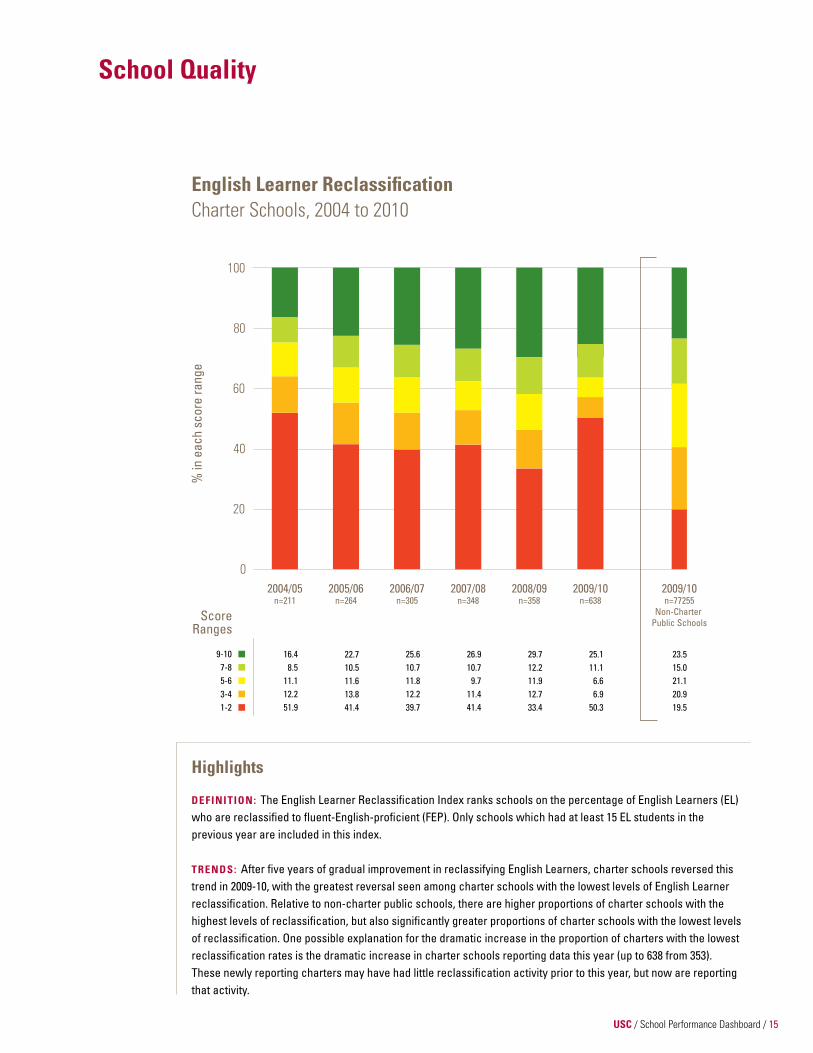
English Learner ReclassificationCharter Schools, 2004 to 2010
Highlights
DEFINITION: The English Learner Reclassification Index ranks schools on the percentage of English Learners (EL)who are reclassified to fluent-English-proficient (FEP). Only schools which had at least 15 EL students in the previous year are included in this index.
TRENDS: After five years of gradual improvement in reclassifying English Learners, charter schools reversed this trend in 2009-10, with the greatest reversal seen among charter schools with the lowest levels of English Learner reclassification. Relative to non-charter public schools, there are higher proportions of charter schools with the highest levels of reclassification, but also significantly greater proportions of charter schools with the lowest levels of reclassification. One possible explanation for the dramatic increase in the proportion of charters with the lowest reclassification rates is the dramatic increase in charter schools reporting data this year (up to 638 from 353). These newly reporting charters may have had little reclassification activity prior to this year, but now are reporting that activity.
ScoreRanges
% in
eac
h sc
ore
rang
e
9-107-85-63-41-2
16.48.5
11.112.251.9
25.610.711.812.239.7
26.910.7
9.711.441.4
29.712.211.912.733.4
25.111.1
6.66.9
50.3
22.710.511.613.841.4
100
80
60
40
20
02004/05
n=2112005/06
n=2642006/07
n=3052007/08
n=3482008/09
n=3582009/10
n=6382009/10n=77255
Non-Charter Public Schools
23.515.021.120.919.5

USC / School Performance Dashboard / 16
School Performance
API CompositeCharter Schools, 2004 to 2010
Highlights
DEFINITION: The Academic Performance Index (API) measures a school’s average student performance on statewide assessments across multiple content areas. The API Composite Index is a combination ofseveral variables: API school rank, API similar-schools rank and API base score from the previous year.
TRENDS: Charter schools’ API scores continue to fluctuate. This year shows an increase in the number of schools performing in the highest ranking and a decrease in the proportion of charter schools performing in the lowest ranking. In comparison to non-charter public schools, higher proportions of charters are performing in the highest category. At the same time, however, higher proportions of charters are performing in the bottom two API composite categories relative to non-charter public schools.
100
80
60
40
20
0
ScoreRanges
2004/05n=241
2005/06n=281
2006/07n=339
2007/08n=381
2008/09n=447
2009/10n=503
% in
eac
h sc
ore
rang
e
9-107-85-63-41-2
19.517.817.817.027.8
23.317.115.919.823.9
22.115.521.317.124.2
19.016.817.920.426.0
22.217.716.721.621.8
19.919.619.217.823.5
2009/10n=7307
Non-Charter Public Schools
19.820.220.219.919.8

USC / School Performance Dashboard / 17
School Performance
Adequate Yearly ProgressCharter Schools, 2004 to 2010
Highlights
DEFINITION: The Adequate Yearly Progress (AYP) Index ranks schools on several components of AYP: whether they met AYP goals in math and English/language arts and the percentage of their students who were rated proficient or above in these areas.
TRENDS: There continues to be improvement at the top among charter schools, but the problems at the bottom persist. Higher proportions of charter schools are finding their way into the top two AYP performance categories, and smaller proportions are showing up in the bottom two categories combined. However, the proportion of charter schools in the very bottom category continues to grow. In comparison to non-charter public schools, greater proportions of charter schools occupy the top two AYP performance categories, but they are also overrepresented in the bottom two AYP performance categories.
100
80
60
40
20
0
ScoreRanges
2004/05n=444
2005/06n=490
2006/07n=565
2007/08n=619
2008/09n=700
2009/10n=768
% in
eac
h sc
ore
rang
e
9-107-85-63-41-2
23.1822.5317.8414.3222.14
100
80
60
40
20
0
15.118.724.120.321.8
17.617.718.223.323.2
19.418.923.318.220.2
19.021.717.320.921.1
16.518.917.624.322.6
19.820.520.219.819.7
2009/10n=8173
Non-Charter Public Schools

USC / School Performance Dashboard / 18
School Performance
Academic momentumCharter Schools, 2004 to 2010
Highlights
DEFINITION: The Academic Momentum Index measures changes in a school’s student achievement over time,reflecting whether a school is improving, declining or consistent. It combines three measures of academic progress: annual change in the percentage of students proficient in math; annual change in the percentage of students proficient in English/language arts; and annual API growth.
TRENDS: Among charters, there is steady improvement in academic momentum over the past three years. This is the case across all five categories of academic momentum. Generally, charter schools outperform non-charter public schools in all categories except in the lowest category, where higher proportions of charter schools have the lowest academic momentum.
100
80
60
40
20
0
ScoreRanges
2004/05n=444
2005/06n=490
2006/07n=565
2007/08n=619
2008/09n=700
2009/10n=768
% in
eac
h sc
ore
rang
e
9-107-85-63-41-2
23.1822.5317.8414.3222.14
100
80
60
40
20
0
15.118.724.120.321.8
17.617.718.223.323.2
19.418.923.318.220.2
19.021.717.320.921.1
16.518.917.624.322.6
19.820.520.219.819.7
2009/10n=8173
Non-Charter Public Schools

USC / School Performance Dashboard / 19
Academic Productivity
English/Language Arts ProductivityCharter Schools, 2004 to 2010
Highlights
DEFINITION: The English/Language Arts Productivity Index ranks schools on their student performance on standardized tests of English/language arts compared to schools within the same district and districts withsimilar per-pupil spending.
TRENDS: Among charters, a growing trend of separation between the top and bottom performers persists. Greater proportions of charter schools are showing up in the top two categories of ELA productivity and in the bottom two categories of ELA productivity. When compared to non-charter public schools in 2009-10, charter schools have lower proportions in the bottom four categories and higher proportions in the top category of ELA productivity.
100
80
60
40
20
0
ScoreRanges
2004/05n=363
2005/06n=417
2006/07n=482
2007/08n=555
2008/09n=630
2009/10n=655
% in
eac
h sc
ore
rang
e
9-107-85-63-41-2
23.923.120.712.919.3
24.422.219.813.619.9
24.322.316.914.621.8
24.120.221.614.919.2
25.819.819.815.419.1
25.621.117.114.921.4
2009/10n=7970
Non-Charter Public Schools
19.520.020.120.320.0

USC / School Performance Dashboard / 20
Academic Productivity
math ProductivityCharter Schools, 2004 to 2010
Highlights
DEFINITION: The Math Productivity Index ranks schools based upon math standardized test performance,comparing charter schools to non-charter schools within the same district and districts with similar per-pupil spending.
TRENDS: Charter schools have made gains in math productivity, decreasing the proportion of schools in the bottom two productivity categories and increasing the proportion of schools in the top two categories. Nonetheless, charter schools still lag behind non-charter public schools with disproportionately fewer charters schools in each of the highest four productivity categories and significantly greater proportions in the lowest productivity category.
100
80
60
40
20
0
ScoreRanges
% in
eac
h sc
ore
rang
e
9-107-85-63-41-2
12.716.016.919.335.1
15.815.215.220.833.0
15.815.514.217.836.6
16.915.414.920.232.6
18.517.215.016.932.5
15.616.111.524.732.1
2004/05n=362
2005/06n=417
2006/07n=481
2007/08n=555
2008/09n=629
2009/10n=681
20.020.320.420.319.0
2009/10n=8962
Non-Charter Public Schools

USC / School Performance Dashboard / 21
Academic Productivity
School ProductivityCharter Schools, 2004 to 2010
Highlights
DEFINITION: The School Productivity Index ranks schools based upon their API scores, comparing schools tonon-charter public schools within the same district and districts with similar per-pupil spending. The API uses standardized tests to assess schools on various subject areas.
TRENDS: Charter school productivity has improved overall, with decreasing proportions of schools in the bottom two productivity categories and increasing proportions in the top two categories. When compared to non-charter public schools, charter schools are disproportionately represented at the extremes of high and low productivity, again reflecting the greater separation between “best” and “worst” found in several other performance indicators. General productivity gains in all schools may result from recent budget reductions, thereby reducing the denominator of the productivity ratio without immediately influencing the numerator.
100
80
60
40
20
0
ScoreRanges
% in
eac
h sc
ore
rang
e
9-107-85-63-41-2
2004/05n=297
2005/06n=362
2006/07n=427
2007/08n=486
2008/09n=562
2009/10n=614
20.217.918.918.924.3
21.316.420.815.725.8
20.518.315.820.225.1
19.017.615.720.826.9
22.516.118.719.723.0
18.817.121.618.524.0
19.820.220.220.119.7
2009/10n=9180
Non-Charter Public Schools

USC / School Performance Dashboard / 22
The Report / Individual Schools

USC / School Performance Dashboard / 23
Alameda County
Achieve Academy 0.25 1.62 0.79 4 9 6 6 6 4 8 7
Alameda Community Learning Center 2 10 7 9 8 10 8 9
American Indian Public Charter 0.84 6.05 0.74 7 2 10 10 7 10 10 10
American Indian Public Charter School II 0.44 2.44 0.52 10 10 1 1 1 1
American Indian Public High 0.91 3.89 0.47 6 10 9 10 10 10
ARISE High -0.19 0.65 0.75 6 2 1 1 4 1 1 1
Aspire Berkley Maynard Academy 0.1 1.47 0.83 7 2 8 7 3 6 7 8
Understanding the Tables / Individual Charter School Scores
3.0 or more2.0 to 3.01.0 to 2.0below 1.0
.75 or more
.50 to .75
.25 to .50below .25
Direct Classroom Investment
Liquidity Ratios
Reserves Ratios
.70 or more
.60 to .70
.50 to .60below .50
9-107-85-63-41-2
All Others
Scho
ol P
rodu
ctiv
ity In
dex
Mat
h Pr
oduc
tivity
Inde
x
Engl
ish/
LA
Prod
uctiv
ity In
dex
Acad
emic
Mom
entu
m In
dex
Adeq
uate
Yea
rly
Prog
ress
Inde
x
API C
ompo
site
Inde
x
EL R
ecla
ssifi
catio
n In
dex
Teac
her Q
ualifi
catio
n In
dex
Teac
hing
Res
ourc
es In
dex
Dire
ct C
lass
room
In
vest
men
t Ind
ex
Liqu
idity
Rat
ios
Inde
x
Rese
rves
Rat
ios
Inde
x
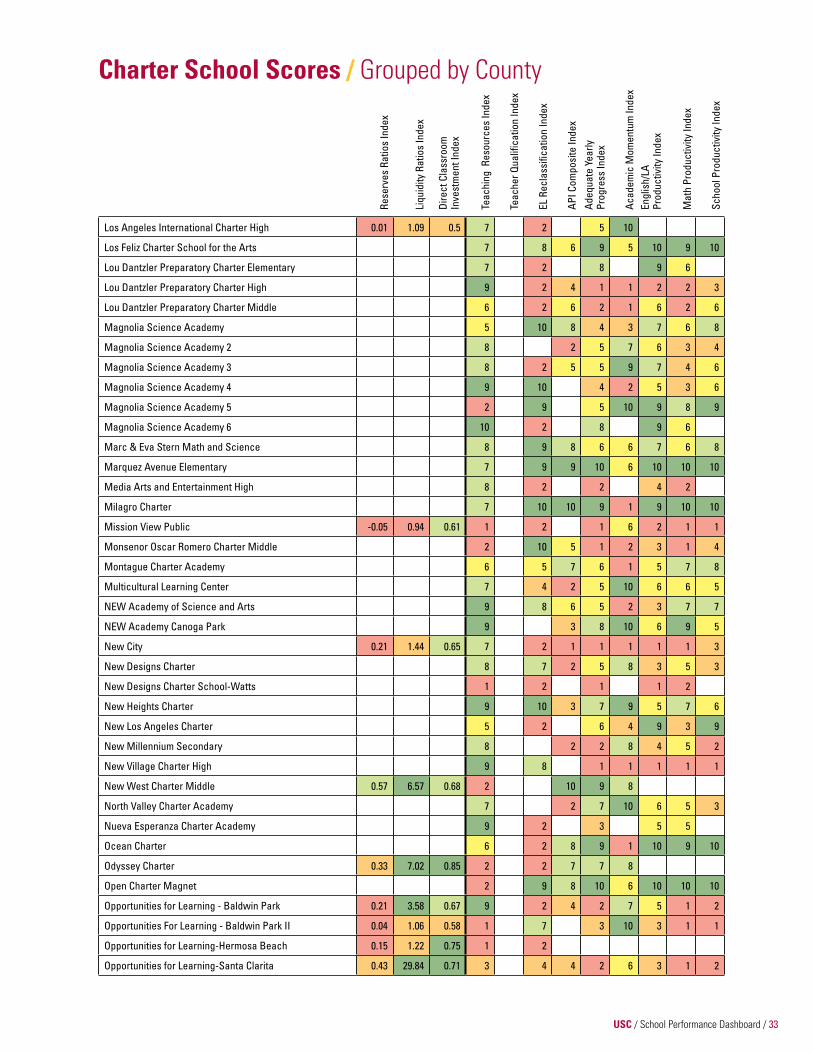
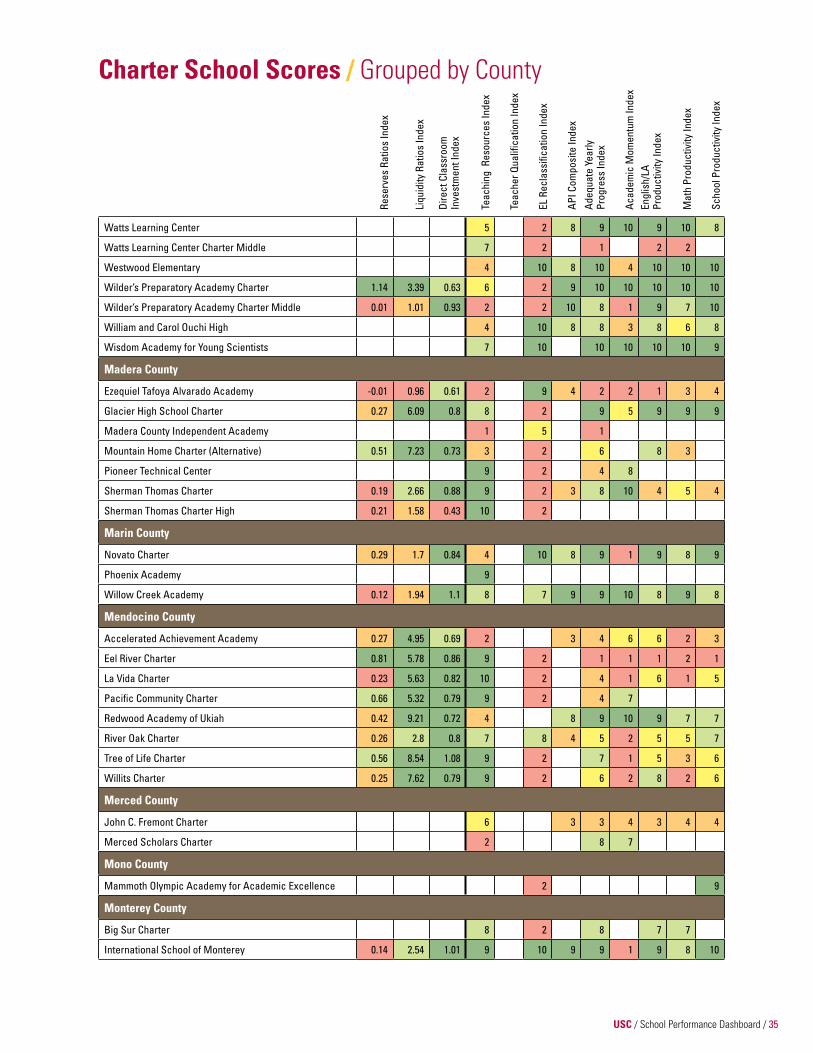
The tables on pages 25 to 48 show scores for individual charter schools, organized alphabetically within each county.
Charter schools included in this report were identified as ‘Active’ for the 2009-2010 school year by the CDECharter School Division. Of those, only charter schools with data are included in this section.
Both district and CDE data were used in these calculations. For additional information on rankings and sources used, see Appendices B and C.
The colors represent the categories found in the charts on pages 10 to 21.
A blank cell denotes insufficient data.

USC / School Performance Dashboard / 24
California Counties

USC / School Performance Dashboard / 25
Alameda County
Achieve Academy 0.25 1.62 0.79 4 9 6 6 6 4 8 7
Alameda Community Learning Center 2 10 7 9 8 10 8 9
American Indian Public Charter 0.84 6.05 0.74 7 2 10 10 7 10 10 10
American Indian Public Charter School II 0.44 2.44 0.52 10 10 1 1 1 1
American Indian Public High 0.91 3.89 0.47 6 10 9 10 10 10
ARISE High -0.19 0.65 0.75 6 2 1 1 4 1 1 1
Aspire Berkley Maynard Academy 0.1 1.47 0.83 7 2 8 7 3 6 7 8
Aspire California College Preparatory Academy 0.08 1.36 0.98 7 2 9 9 9
Aspire ERES Academy -0.07 0.76 0.68 5 2 2 2 4
Aspire Lionel Wilson College Preparatory Academy 0.03 1.15 0.76 2 8 7 9 5 8 7
Aspire Millsmont Academy -0.05 0.78 0.88 3 7 6 6 1 4 6 6
Aspire Millsmont Secondary Academy -0.02 0.93 0.7 6 7 2 2 3 2 3 2
Aspire Monarch Academy 0.21 2.55 0.94 8 7 8 10 6 8 6
Bay Area School of Enterprise 0.18 6.37 0.88 1 2 6 9 3 1 1
Bay Area Technology 0.15 2.41 0.78 9 9 1 4 5 3 3 2
Circle of Independent Learning 4 5 4 8 5 6 3 3
Civicorps Corpsmember Academy 0.23 32.38 0.75 1 2 3 4 5
Civicorps Elementary 0.36 2.34 0.88 7 2 4 5 6 3 4 5
Civicorps Middle 0.05 1.23 0.97 5 4 4 2
Conservatory of Vocal/Instrumental Arts 0.11 1.24 0.62 5 2 8 10 7 7 7
Cox Academy
East Oakland Leadership Academy 0.43 0.61 1 10 7 10 3 4 4
East Oakland Leadership Academy High 0.66 5.95 0.27 2 10 4 1 5 1 2
Envision Academy for Arts & Technology 0.11 1.17 0.69 9 9 1 3 7
FAME Public Charter 0.09 1.28 0.7 2 10 3 4 5
Golden Oak Montessori of Hayward 0.45 2.42 0.46 7 2 8 8 5
Impact Academy of Arts & Technology 0.19 1.35 0.65 8 2 5 6 6 8 4 5
KIPP Bridge Charter 0.02 1.06 0.9 1 8 9 10 8 8 7
KIPP King Collegiate High 0.2 1.92 0.98 8 9 10 9 9 7 9
KIPP Summit Academy 0.5 11.31 0.86 8 9 8 8 8 8 6 8
Leadership Public Schools - Hayward 0.34 1.93 0.65 7 10 8 7 9 8 9 7
Lighthouse Community Charter 0.41 3.7 0.81 6 9 6 6 7 5 6 6
Lighthouse Community Charter High 0.05 1.16 0.69 7 6 7 10 4 4 4
Livermore Valley Charter 0.39 3.49 2.11 9 7 9 9
LPS College Park 0.06 1.45 0.74 9 10 1 3 8 1 2 1
Nea Community Learning Center 0.14 1.62 0.68 5 2 7 9 6
Scho
ol P
rodu
ctiv
ity In
dex
Mat
h Pr
oduc
tivity
Inde
x
Engl
ish/
LA
Prod
uctiv
ity In
dex
Acad
emic
Mom
entu
m In
dex
Adeq
uate
Yea
rly
Prog
ress
Inde
x
API C
ompo
site
Inde
x
EL R
ecla
ssifi
catio
n In
dex
Teac
her Q
ualifi
catio
n In
dex
Teac
hing
Res
ourc
es In
dex
Dire
ct C
lass
room
In
vest
men
t Ind
ex
Liqu
idity
Rat
ios
Inde
x
Rese
rves
Rat
ios
Inde
x
Charter School Scores / Grouped by County

USC / School Performance Dashboard / 26
North Oakland Community Charter 0.1 1.66 1.09 9 10 10 8 9 9 9
Oakland Aviation High 0.14 2.07 0.41 3 1 1 1 1 1
Oakland Charter Academy 1.57 13.75 0.71 4 2 10 10 7 9 10 10
Oakland Charter High 0.04 1.06 0.62 9 2 10 3 10 10 10
Oakland Military Institute, College Preparatory Ac 0.2 1.82 0.73 8 10 3 4 8 4 3 4
Oakland School for the Arts 2.11 3.47 0.98 3 2 3 4 9 8 4 4
Oakland Unity High 0.2 2.63 0.6 4 2 2 4 8 3 4 3
Reems (Ernestine C.) Academy of Technology and Art 0.06 1.45 0.88 9 3 2 3 3 2 4
World Academy 0.47 2.61 1 8 7 5 6 6 3 7 5
Butte County
Achieve Charter School of Paradise Inc. 0.46 6.1 0.67 3 6 4 1 7 4 9
Blue Oak Charter 0.76 6.43 0.68 9 2 4 9
Chico Country Day 0.45 2.69 0.83 1 2 7 9 2 10 7 9
Children’s Community Charter 4 9 9 1 9 8 10
CORE Butte Charter 0.36 17.71 0.69 6 2 7 6 4
Forest Ranch Charter 0.83 19.46 0.46 7 2 9 10 9 8 8
Hometech Charter 8 6 10 5 1 1
Learning Community Charter 9 2 5 2 2
Nord Country 0.66 12.65 0.87 8 2 8 10 4 7 4
Paradise Charter Middle 5 10 9 7 10 9 10
Calaveras County
Mountain Oaks 4 1 4 4
Contra Costa County
Antioch Charter Academy 0.66 34.29 0.84 8 10 5 8 7 9 4 8
Antioch Charter Academy II 0.43 38.85 0.84 2 10 6 10 3 1 1
Eagle Peak Montessori 8 2 7 9 7 10 10 10
Leadership Public Schools: Richmond 0.3 3.93 0.69 7 10 3 1 5 1 2 3
Making Waves Academy 0.13 3.98 1.52 10 3 5 10
Manzanita Middle 0.37 8.99 0.72 8 3 4 8 5 2 5
R.A.A.M.P. Charter Academy -0.11 0.58 0.52 1 5 1 2
Richmond College Prep K-5 Charter 0.09 1.36 0.73 5 2 4 9 1 4 3
West County Community High 0.31 19.21 0.63 4 2 2 6 3 1 1
Del Norte County
Castle Rock 4 1 9
Klamath River Early College of the Redwoods -0.14 0.58 1.07 9 2
Uncharted Shores Academy 0.16 1.48 0.54 1 2 6
Charter School Scores / Grouped by County
Scho
ol P
rodu
ctiv
ity In
dex
Mat
h Pr
oduc
tivity
Inde
x
Engl
ish/
LA
Prod
uctiv
ity In
dex
Acad
emic
Mom
entu
m In
dex
Adeq
uate
Yea
rly
Prog
ress
Inde
x
API C
ompo
site
Inde
x
EL R
ecla
ssifi
catio
n In
dex
Teac
her Q
ualifi
catio
n In
dex
Teac
hing
Res
ourc
es In
dex
Dire
ct C
lass
room
In
vest
men
t Ind
ex
Liqu
idity
Rat
ios
Inde
x
Rese
rves
Rat
ios
Inde
x

USC / School Performance Dashboard / 27
El Dorado County
Aspire Alexander Twilight College Preparatory Academy -0.14 -0.34 0.71 3 2 3
Aspire Junior Collegiate Academy 0.08 1.74 0.68 9 8 7 9 10
Aspire Port City Academy 0.09 1.6 0.8 4 2 9 9 9
Aspire Titan Academy 0 0.97 0.67 9 6
California Montessori Project-Shingle Springs Camp 0.39 4.35 0.82 9 9 10 8 10 9 9
Charter Comm. School, Home Study Academy & Ext. Day 7 2 4 5
Charter Montessori Blue Oak Campus 4 2 8 1 3 8 8
El Dorado County Office of Education Community Day 10 2
Gold Oak Arts Charter 4 2 10 10 10 7 9
Pacific Technology School Orangevale -0.07 0.74 0.45 10 2 8
Pacific Technology School Santa Ana 0.04 1.35 0.62 10 2 8
Rite of Passage 10 2 1 1
Shenandoah High 6 2 6 1 5 1 4
Fresno County
Alvina Elementary Charter 6 5 3 7 7 4 5 4
Big Picture High School - Fresno 0.13 2.1 0.45 9 1
Carter G. Woodson Public Charter 0.24 12.3 0.68 1 4 1 8 1 1 1
Clovis Online Charter 1 2 6 4 2
Crescent View Charter High 0.5 1.88 3.13 2 2
Crescent View South Charter 0.12 1.15 0.6 1 3 4 1
Crescent View West Charter 2
Dunlap Leadership Academy 1 2 10 1
Edison-Bethune Charter Academy 0.08 0.79 9 3 7 9
Fresno Academy for Civic and Entrepreneurial Leadership 0.16 5.3 0.28 10 2 2 3 1
Hallmark Charter 10 2 7 8 10 9 7 6
Hume Lake Charter 0.07 1.27 1.03 10 2 8 1
Island Community Day 10
Kingsburg Community Charter Extension 3 2 1 7 10 4 1 1
Lincoln Elementary 7 2 7 5 2 4 6 5
New Millennium Institute of Education Charter 0.05 1.1 0.55 5 2 1 7 1 1 1
Quail Lake Environmental Charter 3 10 10 2 10 10 10
Rafer Johnson Junior High 6 8 6 6 4 5 2 4
Ronald W. Reagan Elementary 1 2 6 9 10 5 7 4
Roosevelt Elementary 8 2 9 6 7
San Joaquin Valley High Charter 6 2 1
Sanger Academy Charter 5 10 9 7 10 9 10
Charter School Scores / Grouped by County
Scho
ol P
rodu
ctiv
ity In
dex
Mat
h Pr
oduc
tivity
Inde
x
Engl
ish/
LA
Prod
uctiv
ity In
dex
Acad
emic
Mom
entu
m In
dex
Adeq
uate
Yea
rly
Prog
ress
Inde
x
API C
ompo
site
Inde
x
EL R
ecla
ssifi
catio
n In
dex
Teac
her Q
ualifi
catio
n In
dex
Teac
hing
Res
ourc
es In
dex
Dire
ct C
lass
room
In
vest
men
t Ind
ex
Liqu
idity
Rat
ios
Inde
x
Rese
rves
Rat
ios
Inde
x
Charter Comm. School, Home Study Academy & Ext. Day

USC / School Performance Dashboard / 28
School of Unlimited Learning 0 1 1.05 9 1 6 1 1 1
Sierra Charter 0.29 5.84 0.79 9 2 2 1 5 3 1 2
Sunset Elementary 5 4 2 5 5 2 6 4
University High 0.8 5.05 0.92 4 2 10 10 5 10 10 10
Valley Arts and Science Academy (VASA) 0.16 1.29 0.74 8 1 3 8 2 2 2
Valley Preparatory Academy Charter 0.01 1.03 0.6 6 4 3 2 7 3 3 4
W. E. B. DuBois Public Charter 0.23 3.79 0.64 4 4 1 8 1 1 1
Washington Elementary 3 9 6 7
West Park Charter Academy 7 1 1 9 2 1 1
Glenn County
William Finch 9 2 8 8
Humboldt County
Alder Grove Charter 0.38 4.81 0.88 9 2 1 2 4 6 1 3
Coastal Grove Charter 7 2 3 5 8 7 3 6
Freshwater Charter Middle 6 2 9 7 10 5 8
Fuente Nueva Charter 8 2 8 1 7 7 9
Jacoby Creek Charter 4 10 10 10 2 10 9 10
Mattole Valley Charter (#159) 9 2 3 3 7 5 4 4
Northcoast Preparatory and Performing Arts Academy 0.16 4.18 0.72 9 2 10 10
Pacific View Charter 0.17 12.61 0.73 9 2 5 10 3 1 1
Six Rivers Charter High 9 2 9 7 9 7 7
Trillium Charter 9 2 7 1 2 1 6
Union Street Charter 9 10 10 10 10 9
Imperial County
Ballington Academy for the Arts and Sciences 0.14 1.22 0.44 9 2 6 1 4
Inyo County
YouthBuild Charter School of California 0.12 1.31 0.62 3 2 1 10
Kern County
California Virtual Academy @ Kern 0 1 1.01 3 2 2 2 1 4 1 4
Cecil Avenue Math and Science Academy 3 7 5 2 6 2 2 3
Kern Workforce 2000 Academy 4 8 6 5 1
Nueva Vista Language Academy 9 2 2 2 3
Paramount Bard Academy 0.25 2.42 0.8 10 2 1
Pine Mountain Learning Center 6 2 10 7 10 10 9
Ridgecrest Charter 0.71 2.66 0.72 7 10 9 6 1
Valley Oaks Charter 3 9 2 3 6
Charter School Scores / Grouped by County
Scho
ol P
rodu
ctiv
ity In
dex
Mat
h Pr
oduc
tivity
Inde
x
Engl
ish/
LA
Prod
uctiv
ity In
dex
Acad
emic
Mom
entu
m In
dex
Adeq
uate
Yea
rly
Prog
ress
Inde
x
API C
ompo
site
Inde
x
EL R
ecla
ssifi
catio
n In
dex
Teac
her Q
ualifi
catio
n In
dex
Dire
ct C
lass
room
In
vest
men
t Ind
ex
Liqu
idity
Rat
ios
Inde
x
Rese
rves
Rat
ios
Inde
x
Teac
hing
Res
ourc
es In
dex

USC / School Performance Dashboard / 29
Kings County
California Virtual Academy @ Kings 0 1 0.99 1 2 3 3 4 5 1 3
Crossroads Charter 6 8 1 1 1 1 1
Crossroads Trade Tech Charter 10 2
Frontier Elementary 5 10 8 9 6 7 6 7
Island Elementary 2 3 8 8 9 6 5 5
Kaplan Academy of California-Central -0.02 0.96 0.47 9 2 7 7 1
Kings River-Hardwick Elementary 3 2 4 6 7 4 3 4
Lemoore Middle College High 8 2 8 4 9 8 8
Lemoore University Elementary Charter 3 6 5 2 1 3 1 4
Mid Valley Alternative Charter 10
Pioneer Elementary 4 8 9 9 4 7 8 8
Pioneer Middle 2 10 7 5 4 5 3 5
Lake County
Lake County International Charter 0.19 1.12 0.7 8 7 1 5 2 8
Lassen County
Diamond Mountain Charter High 1 2 1 1 1 1 2
New Day Academy 0.14 1.57 0.54 1 2 4 4 2
Ravendale-Termo Charter 1 2 4 5 2
Soldier Bridge Charter 2
Westwood Charter 0.17 1.6 0.66 6 2 1 1 4 2 1 2
Los Angeles County
Academia Avance Charter 2
Academia Moderna 5 2 1 1 1
Academia Semillas del Pueblo 3 10 1 5 9 2 5 3
Academy for Recording Arts -0.25 0.33 0.69 2 10 10 10 10 10 10 10
Accelerated 1 10 1 5 10 6 4 4
Accelerated Elementary Charter 5 10 7 9 4 5 5
Alain Leroy Locke High 10 3 1 1 5 1 1 1
Anahuacalmecac University Preparatory High 10 10 7 1 4 7 5
Animo Film and Theater Arts Charter High 7 2 5 7 7 3 4
Animo Inglewood Charter High 0.05 2.86 0.58 7 9 4 4
Animo Jackie Robinson High 8 10 2 6 10 2 5 2
Animo Justice Charter High 8 4 1 2 1 2 1
Animo Leadership High 0.4 15.92 0.48 8 10 3 8 10 7 6 3
Animo Locke ACE Academy 10 2 3 5 4
Animo Locke Charter High School #1 9 4 1 1 10 1 1 1
Charter School Scores / Grouped by County
Scho
ol P
rodu
ctiv
ity In
dex
Mat
h Pr
oduc
tivity
Inde
x
Engl
ish/
LA
Prod
uctiv
ity In
dex
Acad
emic
Mom
entu
m In
dex
Adeq
uate
Yea
rly
Prog
ress
Inde
x
API C
ompo
site
Inde
x
EL R
ecla
ssifi
catio
n In
dex
Teac
her Q
ualifi
catio
n In
dex
Teac
hing
Res
ourc
es In
dex
Dire
ct C
lass
room
In
vest
men
t Ind
ex
Liqu
idity
Rat
ios
Inde
x
Rese
rves
Rat
ios
Inde
x

USC / School Performance Dashboard / 30
Animo Locke Charter High School #2 9 4 1 1 10 2 2 1
Animo Locke Charter High School #3 10 8 1 1 3 1 1 1
Animo Locke Technology High 4 7 1 2 4 1 2 1
Animo Oscar De La Hoya Charter High 6 10 5 7 5 5 7 4
Animo Pat Brown 8 7 7 8 10 7 6 6
Animo Ralph Bunche High 7 8 2 5 7 2 1 2
Animo South Los Angeles Charter 8 10 5 4 6 4 3 4
Animo Venice Charter High 9 9 6 7 6 7 6 5
Animo Watts Charter High 7 8 1 1 6 1 1 1
Antelope Valley Desert Montessori Schools, Inc. 2
Antelope Valley Learning Academy 0.1 1.21 0.71 1 1 1 9 2 1 1
Aspire Antonio Maria Lugo Academy 7 7 8 9 8 8 10 9
Aspire Centennial College Preparatory Academy 2 10 8 8 6 8 9 8
Aspire Huntington Park Charter 8 8 8 8 9 8 9 9
Aveson Global Leadership Academy 0.06 1.35 0.12 2 2 4 5 1 6 2 6
Aveson School of Leaders 0.06 1.3 0.13 5 2 6 6 1 7 6 8
Barack Obama Charter 0.16 1.1 0.48 3 2 1
Bert Corona Charter 3 1 1 3 2 2
Birmingham Community Charter High 1 7 3 2 2 6 3 3
Bright Star Secondary Charter Academy 1 10 9 9 9 10 10 9
CA Academy for Liberal Studies Early College High 10 10 5 8 8 8 8 5
California Academy for Liberal Studies 1 10 8 8 9 8 7 8
California Virtual Academy @ Los Angeles 0 1 0.96 1 3 3 5 6 2 4
Camino Nuevo Charter Academy 5 8 8 9 10 9 10 9
Camino Nuevo High School Charter 6 10 8 8 3 7 8 7
Canyon Elementary 2 10 10 10 4 10 10 10
Carpenter Community Charter 2 9 9 10 4 10 10 10
Celerity Dyad Charter 4 8 7 8 10 7 9 8
Celerity Nascent Charter 6 9 5 5 8 5 6 6
Celerity Troika Charter 8 10 10 10 10 10 10
Center for Advanced Learning 5 4 4 7 10 6 6 6
Central City Value 4 4 2 2 8 2 1 2
Century Academy for Excellence 0.2 2.68 0.9 8 2 1 1 6 1 1 1
Century Community Charter -0.36 0.51 0.65 1 10 3 4 9 6 1 4
CHAMPS - Charter H.S. of Arts-Multimedia & Performing 5 10 9 9 3 10 9 8
CHIME Charter 9 10 4 8 4 9 8 8
CHIME Middle Charter 9 9 4 5 2 8 2 7
City Honors College Preparatory Charter 1 8 9 5 10 9 8
Charter School Scores / Grouped by County
Scho
ol P
rodu
ctiv
ity In
dex
Mat
h Pr
oduc
tivity
Inde
x
Engl
ish/
LA
Prod
uctiv
ity In
dex
Acad
emic
Mom
entu
m In
dex
Adeq
uate
Yea
rly
Prog
ress
Inde
x
API C
ompo
site
Inde
x
EL R
ecla
ssifi
catio
n In
dex
Teac
her Q
ualifi
catio
n In
dex
Teac
hing
Res
ourc
es In
dex
Dire
ct C
lass
room
In
vest
men
t Ind
ex
Liqu
idity
Rat
ios
Inde
x
Rese
rves
Rat
ios
Inde
x

USC / School Performance Dashboard / 31
CLAS Affirmation 8 2 5 8 10 8 5 7
Colegio New City 0.11 1.17 0.75 9 2 4 8 5 2 1
Colfax Charter Elementary 4 8 10 9 1 10 10 10
College Ready Academy High #4 8 10 10 10 10 9 10 9
College Ready Academy High #5 8 7 3 1 10 2 2 2
College Ready Academy High #7 9 3 2 2 5 1 2 2
College Ready Middle Academy #3 3 8 2 3 3 3 5
College Ready Middle Academy #4 2 2 3 5 5
College Ready Middle Academy #5 7 2 1 2 2
Community Charter Early College High 1 10 7 8 8
Community Charter Middle 3 10 2 4 10 4 4 4
Community Harvest Charter 1 10 4 1 1 4 2 4
Community Magnet Charter Elementary 3 9 10 10 2 10 10 10
Constellation Community Charter Middle 0.1 4.8 0.77 5 5 2 1 1 1 1 2
Cornerstone Prep Charter 8 1 1 2 1 1 2
Crenshaw Arts/Tech Charter High 2 1 7 10 6 4 2
Crescendo Charter 4 10 7 2 3 5 7
Crescendo Charter Academy 7 2 9 9 10 8
Crescendo Charter Conservatory 7 10 7 6 4 9
Crescendo Charter Preparatory Central 5 2 6 6 9 8
Crescendo Charter Preparatory South 7 2 7
Crescendo Charter Preparatory West 5 2 8 5 5 4 9
Da Vinci Design 0.35 4.55 0.48 2 2 5 6 1
Da Vinci Science 0.48 6.83 0.5 2 2 9 9 4
Desert Sands Charter 0.19 1.29 0.67 1 10 1 4 1 1 1
Design High 2 4
Discovery Charter Preparatory #2 4 7 1 5 10 3 2 2
Downtown Value 6 10 3 5 10 5 7 4
Dr. Theodore T. Alexander Science Center 4 9 5 3 1 6 6 7
Emerson Parkside Academy Charter 8 9 9 6 1 9 9 10
Endeavor College Preparatory Charter 10 2 6 6 8
Environmental Charter High 0.48 11.89 0.66 8 10 7 8 5 7 5 6
Environmental Science and Technology High 7 2 9 10 10
Equitas Academy Charter 9 2 4 7 6
Excel Charter Academy 7 10 7 2 2 6 3 7
Fenton Avenue Charter 9 9 4 3 6 4 5 6
Fenton Primary Center 9 6 2 4 2
Fernando Pullum Performing Arts High 9 2 1 1 1
Charter School Scores / Grouped by County
Scho
ol P
rodu
ctiv
ity In
dex
Mat
h Pr
oduc
tivity
Inde
x
Engl
ish/
LA
Prod
uctiv
ity In
dex
Acad
emic
Mom
entu
m In
dex
Adeq
uate
Yea
rly
Prog
ress
Inde
x
API C
ompo
site
Inde
x
EL R
ecla
ssifi
catio
n In
dex
Teac
her Q
ualifi
catio
n In
dex
Teac
hing
Res
ourc
es In
dex
Dire
ct C
lass
room
In
vest
men
t Ind
ex
Liqu
idity
Rat
ios
Inde
x
Rese
rves
Rat
ios
Inde
x

USC / School Performance Dashboard / 32
Frederick Douglass Academy Elementary 6 2 9 8 9
Frederick Douglass Academy High 7 2 2 3 9 5 1 2
Frederick Douglass Academy Middle 4 2 5 2 1 4 2 5
Full Circle Learning Academy 8 2 1 1 3 2 5
Gabriella Charter 3 7 9 8 4 9 10 10
Garr Academy of Math and Entrepreneurial Studies 8 2 1 8 10 6 8 3
Gertz-Ressler Academy High 6 10 9 9 6 9 9 9
Global Education Academy 7 5 6 1 7 8 10
Goethe International Charter 7 2 10 10 10
Gorman Learning Center 1.24 2.62 0.57 9 10 4 2 6 5 2 3
Granada Hills Charter High 1 5 9 10 9 10 10 9
Guidance Charter 0.98 22.74 0.97 2 2 4 5 8 3 5 4
Hawthorne Math and Science Academy 2 10 10 10 5 10 10 9
Health Services Academy High 7 2 1 2 1
Heritage College-Ready High 3 5 3 7 10 5 7 2
High Tech LA 5 9 10 7 10 10 9
Huntington Park College-Ready Academy 8 6 8 5 6 4 7 7
ICEF Inglewood Elementary Charter Academy -0.06 0.97 0.64 9 2 5 5 5
ICEF Inglewood Middle Charter Academy -0.11 0.94 0.48 6 2 3 6 3
ICEF Vista Elementary Academy 3 2 4 8 4 8 7 7
ICEF Vista Middle Academy 4 2 3 7 10 8 3 5
Ivy Academia 7 10 8 8 6 10 9 9
Ivy Bound Academy of Math, Science, and Technology 4 10 10 10 7 10 9 10
Jack H. Skirball Middle 6 9 6 2 2 2 3 6
James Jordan Middle 2 10 4 1 2 3 2 5
Jardin de la Infancia 9 10 4 7 6
Kaplan Academy of Southern California -0.04 0.94 0.41 1 2 2 7 5 1 2
Kenter Canyon Elementary 3 9 10 3 10 10 10
KIPP Academy of Opportunity 4 7 6 8 8 5 7
KIPP Los Angeles College Preparatory 7 4 9 9 10 9 9 9
KIPP Raices Academy 9 2 4 7 6
Lakeview Charter Academy 7 10 9 7 9 8 9 9
Larchmont Charter 6 9 10 7 10 10 10
Larchmont Charter School-West Hollywood 10 10 10 9 10
Learning Works! 0.08 1.32 0.75 1 2 1 1 1 1 1
Legacy Charter High 9 2 1 1 1
Lennox Mathematics, Science and Technology Academy 5 4 7 7 7 7 8 6
Los Angeles County Online High 0.09 1.19 1.09 1 2 1 7 9 8 2 1
Charter School Scores / Grouped by County
Scho
ol P
rodu
ctiv
ity In
dex
Mat
h Pr
oduc
tivity
Inde
x
Engl
ish/
LA
Prod
uctiv
ity In
dex
Acad
emic
Mom
entu
m In
dex
Adeq
uate
Yea
rly
Prog
ress
Inde
x
API C
ompo
site
Inde
x
EL R
ecla
ssifi
catio
n In
dex
Teac
her Q
ualifi
catio
n In
dex
Teac
hing
Res
ourc
es In
dex
Dire
ct C
lass
room
In
vest
men
t Ind
ex
Liqu
idity
Rat
ios
Inde
x
Rese
rves
Rat
ios
Inde
x
USC / School Performance Dashboard / 33
Los Angeles International Charter High 0.01 1.09 0.5 7 2 5 10
Los Feliz Charter School for the Arts 7 8 6 9 5 10 9 10
Lou Dantzler Preparatory Charter Elementary 7 2 8 9 6
Lou Dantzler Preparatory Charter High 9 2 4 1 1 2 2 3
Lou Dantzler Preparatory Charter Middle 6 2 6 2 1 6 2 6
Magnolia Science Academy 5 10 8 4 3 7 6 8
Magnolia Science Academy 2 8 2 5 7 6 3 4
Magnolia Science Academy 3 8 2 5 5 9 7 4 6
Magnolia Science Academy 4 9 10 4 2 5 3 6
Magnolia Science Academy 5 2 9 5 10 9 8 9
Magnolia Science Academy 6 10 2 8 9 6
Marc & Eva Stern Math and Science 8 9 8 6 6 7 6 8
Marquez Avenue Elementary 7 9 9 10 6 10 10 10
Media Arts and Entertainment High 8 2 2 4 2
Milagro Charter 7 10 10 9 1 9 10 10
Mission View Public -0.05 0.94 0.61 1 2 1 6 2 1 1
Monsenor Oscar Romero Charter Middle 2 10 5 1 2 3 1 4
Montague Charter Academy 6 5 7 6 1 5 7 8
Multicultural Learning Center 7 4 2 5 10 6 6 5
NEW Academy of Science and Arts 9 8 6 5 2 3 7 7
NEW Academy Canoga Park 9 3 8 10 6 9 5
New City 0.21 1.44 0.65 7 2 1 1 1 1 1 3
New Designs Charter 8 7 2 5 8 3 5 3
New Designs Charter School-Watts 1 2 1 1 2
New Heights Charter 9 10 3 7 9 5 7 6
New Los Angeles Charter 5 2 6 4 9 3 9
New Millennium Secondary 8 2 2 8 4 5 2
New Village Charter High 9 8 1 1 1 1 1
New West Charter Middle 0.57 6.57 0.68 2 10 9 8
North Valley Charter Academy 7 2 7 10 6 5 3
Nueva Esperanza Charter Academy 9 2 3 5 5
Ocean Charter 6 2 8 9 1 10 9 10
Odyssey Charter 0.33 7.02 0.85 2 2 7 7 8
Open Charter Magnet 2 9 8 10 6 10 10 10
Opportunities for Learning - Baldwin Park 0.21 3.58 0.67 9 2 4 2 7 5 1 2
Opportunities For Learning - Baldwin Park II 0.04 1.06 0.58 1 7 3 10 3 1 1
Opportunities for Learning-Hermosa Beach 0.15 1.22 0.75 1 2
Opportunities for Learning-Santa Clarita 0.43 29.84 0.71 3 4 4 2 6 3 1 2
Charter School Scores / Grouped by County
Scho
ol P
rodu
ctiv
ity In
dex
Mat
h Pr
oduc
tivity
Inde
x
Engl
ish/
LA
Prod
uctiv
ity In
dex
Acad
emic
Mom
entu
m In
dex
Adeq
uate
Yea
rly
Prog
ress
Inde
x
API C
ompo
site
Inde
x
EL R
ecla
ssifi
catio
n In
dex
Teac
her Q
ualifi
catio
n In
dex
Teac
hing
Res
ourc
es In
dex
Dire
ct C
lass
room
In
vest
men
t Ind
ex
Liqu
idity
Rat
ios
Inde
x
Rese
rves
Rat
ios
Inde
x

USC / School Performance Dashboard / 34
Opportunities Unlimited Charter High 0.07 1.95 0.61 10 2 1
Options for Youth San Gabriel 0.34 2.55 0.56 8 2 3 1 8 2 1 1
Options for Youth-Burbank Charter 9 2 4 2 5 3 1 1
Options for Youth-Hermosa Beach, Inc. 0.34 4.35 0.57 9 2 1 1 1
Our Community Charter 4 4 8 7 2 9 9 9
Pacoima Charter Elementary 8 8 3 7 9 5 7 5
Palisades Charter Elementary 7 9 10 10 4 10 10 10
Palisades Charter High 1 9 9 6 2 10 9 9
Para Los Ninos Charter 4 6 2 4 3 1 4 4
Para Los Ninos Middle 6 4 6 10 2 3 3
Pasadena Rosebud Academy 0.29 1.45 0.61 10 2 8 6 5
Paul Revere Middle 1 8 6 5 10 8 9
Port of Los Angeles High 8 10 5 8 9 9 6 5
Puente Charter 9 2 4 7 6
Renaissance Arts Academy 1 10 10 9 5 10 8 10
Richard Merkin Middle Academy 4 10 6 2 8 5 3 6
San Jose-Edison Academy 4 10 10 4 9 9 10
Santa Clarita Valley International 0.28 2.71 0.56 5 10 6 1 6 3 7
Santa Monica Boulevard Community Charter 8 8 3 3 4 4 5 5
Santa Rosa Charter Academy 3 2 2 5 3
School of Arts and Enterprise 0.37 1.64 0.72 1 1 3 7
School of Extended Educational Options 2 2 1 8 5 1 2
Sequoia Charter 10 2 5 1 1 1 1
Stella Middle Charter Academy 7 4 8 6
Synergy Charter Academy 4 6 10 10 7 10 10 10
Synergy Kinetic Academy 3 2 6 7 7 4 8
Thurgood Marshall Charter High 2 2
Thurgood Marshall Charter Middle 2 3 3 7 5 2 4
Today’s Fresh Start Charter 2
Today’s Fresh Start Charter School Inglewood 0.05 1.23 0.99 9 2 8 5 9
Topanga Learn-Charter Elementary 6 5 10 10 4 10 10 10
Triumph Academy 6 1 7 10 4 7 3
Valor Academy Charter 4 2 9 8 9
Vaughn Next Century Learning Center 6 8 6 5 8 5 6 6
View Park Preparatory Accelerated Charter 4 2 9 9 10 10 9 10
View Park Preparatory Accelerated Charter Middle 2 9 3 1 7 4 9
View Park Preparatory Accelerated High 1 2 6 7 2 7 4 4
Wallis Annenberg High 10 10 5 7 8 7 9 5
Charter School Scores / Grouped by County
Scho
ol P
rodu
ctiv
ity In
dex
Mat
h Pr
oduc
tivity
Inde
x
Engl
ish/
LA
Prod
uctiv
ity In
dex
Acad
emic
Mom
entu
m In
dex
Adeq
uate
Yea
rly
Prog
ress
Inde
x
API C
ompo
site
Inde
x
EL R
ecla
ssifi
catio
n In
dex
Teac
her Q
ualifi
catio
n In
dex
Teac
hing
Res
ourc
es In
dex
Dire
ct C
lass
room
In
vest
men
t Ind
ex
Liqu
idity
Rat
ios
Inde
x
Rese
rves
Rat
ios
Inde
x
USC / School Performance Dashboard / 35
Watts Learning Center 5 2 8 9 10 9 10 8
Watts Learning Center Charter Middle 7 2 1 2 2
Westwood Elementary 4 10 8 10 4 10 10 10
Wilder’s Preparatory Academy Charter 1.14 3.39 0.63 6 2 9 10 10 10 10 10
Wilder’s Preparatory Academy Charter Middle 0.01 1.01 0.93 2 2 10 8 1 9 7 10
William and Carol Ouchi High 4 10 8 8 3 8 6 8
Wisdom Academy for Young Scientists 7 10 10 10 10 10 9
madera County
Ezequiel Tafoya Alvarado Academy -0.01 0.96 0.61 2 9 4 2 2 1 3 4
Glacier High School Charter 0.27 6.09 0.8 8 2 9 5 9 9 9
Madera County Independent Academy 1 5 1
Mountain Home Charter (Alternative) 0.51 7.23 0.73 3 2 6 8 3
Pioneer Technical Center 9 2 4 8
Sherman Thomas Charter 0.19 2.66 0.88 9 2 3 8 10 4 5 4
Sherman Thomas Charter High 0.21 1.58 0.43 10 2
marin County
Novato Charter 0.29 1.7 0.84 4 10 8 9 1 9 8 9
Phoenix Academy 9
Willow Creek Academy 0.12 1.94 1.1 8 7 9 9 10 8 9 8
mendocino County
Accelerated Achievement Academy 0.27 4.95 0.69 2 3 4 6 6 2 3
Eel River Charter 0.81 5.78 0.86 9 2 1 1 1 2 1
La Vida Charter 0.23 5.63 0.82 10 2 4 1 6 1 5
Pacific Community Charter 0.66 5.32 0.79 9 2 4 7
Redwood Academy of Ukiah 0.42 9.21 0.72 4 8 9 10 9 7 7
River Oak Charter 0.26 2.8 0.8 7 8 4 5 2 5 5 7
Tree of Life Charter 0.56 8.54 1.08 9 2 7 1 5 3 6
Willits Charter 0.25 7.62 0.79 9 2 6 2 8 2 6
merced County
John C. Fremont Charter 6 3 3 4 3 4 4
Merced Scholars Charter 2 8 7
mono County
Mammoth Olympic Academy for Academic Excellence 2 9
monterey County
Big Sur Charter 8 2 8 7 7
International School of Monterey 0.14 2.54 1.01 9 10 9 9 1 9 8 10
Charter School Scores / Grouped by County
Scho
ol P
rodu
ctiv
ity In
dex
Mat
h Pr
oduc
tivity
Inde
x
Engl
ish/
LA
Prod
uctiv
ity In
dex
Acad
emic
Mom
entu
m In
dex
Adeq
uate
Yea
rly
Prog
ress
Inde
x
API C
ompo
site
Inde
x
EL R
ecla
ssifi
catio
n In
dex
Teac
her Q
ualifi
catio
n In
dex
Teac
hing
Res
ourc
es In
dex
Dire
ct C
lass
room
In
vest
men
t Ind
ex
Liqu
idity
Rat
ios
Inde
x
Rese
rves
Rat
ios
Inde
x
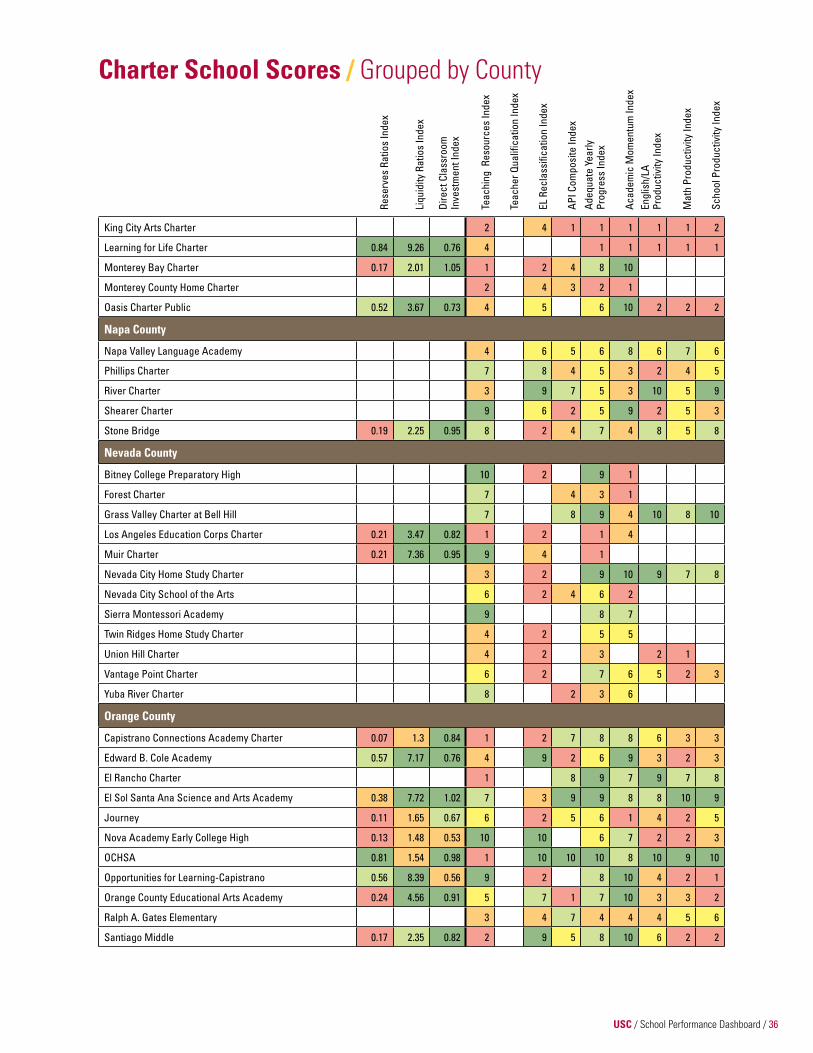
USC / School Performance Dashboard / 36
King City Arts Charter 2 4 1 1 1 1 1 2
Learning for Life Charter 0.84 9.26 0.76 4 1 1 1 1 1
Monterey Bay Charter 0.17 2.01 1.05 1 2 4 8 10
Monterey County Home Charter 2 4 3 2 1
Oasis Charter Public 0.52 3.67 0.73 4 5 6 10 2 2 2
Napa County
Napa Valley Language Academy 4 6 5 6 8 6 7 6
Phillips Charter 7 8 4 5 3 2 4 5
River Charter 3 9 7 5 3 10 5 9
Shearer Charter 9 6 2 5 9 2 5 3
Stone Bridge 0.19 2.25 0.95 8 2 4 7 4 8 5 8
Nevada County
Bitney College Preparatory High 10 2 9 1
Forest Charter 7 4 3 1
Grass Valley Charter at Bell Hill 7 8 9 4 10 8 10
Los Angeles Education Corps Charter 0.21 3.47 0.82 1 2 1 4
Muir Charter 0.21 7.36 0.95 9 4 1
Nevada City Home Study Charter 3 2 9 10 9 7 8
Nevada City School of the Arts 6 2 4 6 2
Sierra Montessori Academy 9 8 7
Twin Ridges Home Study Charter 4 2 5 5
Union Hill Charter 4 2 3 2 1
Vantage Point Charter 6 2 7 6 5 2 3
Yuba River Charter 8 2 3 6
Orange County
Capistrano Connections Academy Charter 0.07 1.3 0.84 1 2 7 8 8 6 3 3
Edward B. Cole Academy 0.57 7.17 0.76 4 9 2 6 9 3 2 3
El Rancho Charter 1 8 9 7 9 7 8
El Sol Santa Ana Science and Arts Academy 0.38 7.72 1.02 7 3 9 9 8 8 10 9
Journey 0.11 1.65 0.67 6 2 5 6 1 4 2 5
Nova Academy Early College High 0.13 1.48 0.53 10 10 6 7 2 2 3
OCHSA 0.81 1.54 0.98 1 10 10 10 8 10 9 10
Opportunities for Learning-Capistrano 0.56 8.39 0.56 9 2 8 10 4 2 1
Orange County Educational Arts Academy 0.24 4.56 0.91 5 7 1 7 10 3 3 2
Ralph A. Gates Elementary 3 4 7 4 4 4 5 6
Santiago Middle 0.17 2.35 0.82 2 9 5 8 10 6 2 2
Charter School Scores / Grouped by County
Scho
ol P
rodu
ctiv
ity In
dex
Mat
h Pr
oduc
tivity
Inde
x
Engl
ish/
LA
Prod
uctiv
ity In
dex
Acad
emic
Mom
entu
m In
dex
Adeq
uate
Yea
rly
Prog
ress
Inde
x
API C
ompo
site
Inde
x
EL R
ecla
ssifi
catio
n In
dex
Teac
her Q
ualifi
catio
n In
dex
Teac
hing
Res
ourc
es In
dex
Dire
ct C
lass
room
In
vest
men
t Ind
ex
Liqu
idity
Rat
ios
Inde
x
Rese
rves
Rat
ios
Inde
x
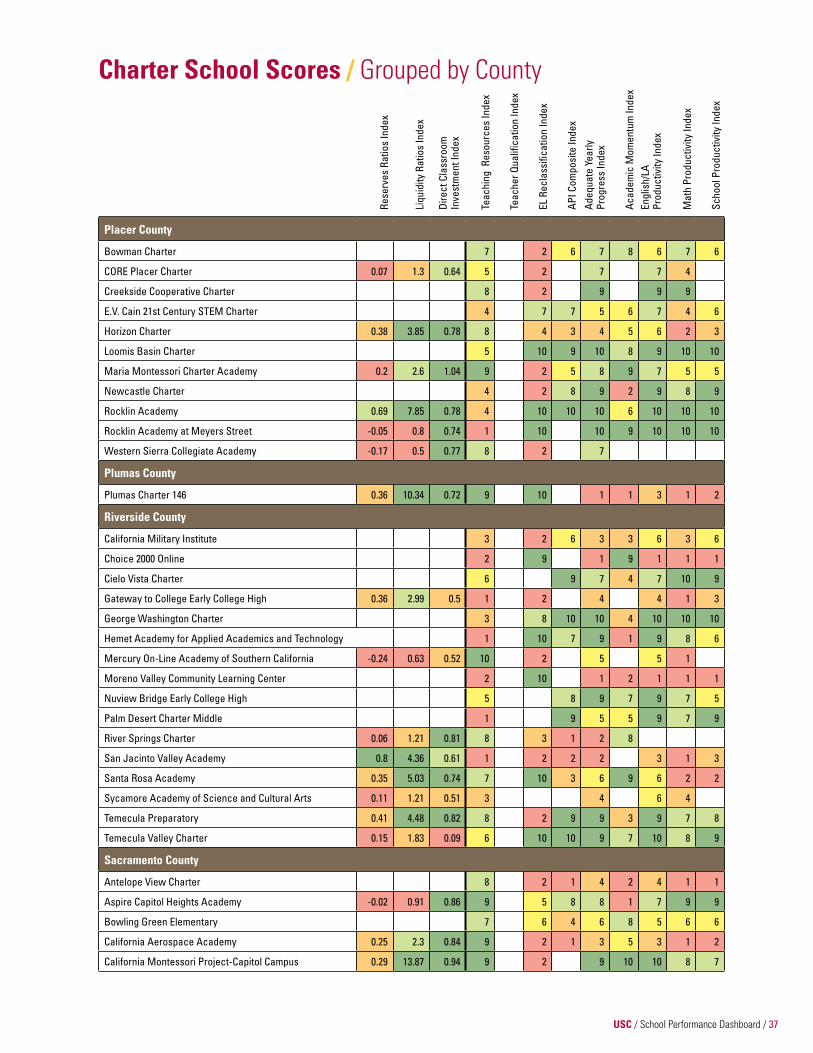
USC / School Performance Dashboard / 37
Placer County
Bowman Charter 7 2 6 7 8 6 7 6
CORE Placer Charter 0.07 1.3 0.64 5 2 7 7 4
Creekside Cooperative Charter 8 2 9 9 9
E.V. Cain 21st Century STEM Charter 4 7 7 5 6 7 4 6
Horizon Charter 0.38 3.85 0.78 8 4 3 4 5 6 2 3
Loomis Basin Charter 5 10 9 10 8 9 10 10
Maria Montessori Charter Academy 0.2 2.6 1.04 9 2 5 8 9 7 5 5
Newcastle Charter 4 2 8 9 2 9 8 9
Rocklin Academy 0.69 7.85 0.78 4 10 10 10 6 10 10 10
Rocklin Academy at Meyers Street -0.05 0.8 0.74 1 10 10 9 10 10 10
Western Sierra Collegiate Academy -0.17 0.5 0.77 8 2 7
Plumas County
Plumas Charter 146 0.36 10.34 0.72 9 10 1 1 3 1 2
Riverside County
California Military Institute 3 2 6 3 3 6 3 6
Choice 2000 Online 2 9 1 9 1 1 1
Cielo Vista Charter 6 9 7 4 7 10 9
Gateway to College Early College High 0.36 2.99 0.5 1 2 4 4 1 3
George Washington Charter 3 8 10 10 4 10 10 10
Hemet Academy for Applied Academics and Technology 1 10 7 9 1 9 8 6
Mercury On-Line Academy of Southern California -0.24 0.63 0.52 10 2 5 5 1
Moreno Valley Community Learning Center 2 10 1 2 1 1 1
Nuview Bridge Early College High 5 8 9 7 9 7 5
Palm Desert Charter Middle 1 9 5 5 9 7 9
River Springs Charter 0.06 1.21 0.81 8 3 1 2 8
San Jacinto Valley Academy 0.8 4.36 0.61 1 2 2 2 3 1 3
Santa Rosa Academy 0.35 5.03 0.74 7 10 3 6 9 6 2 2
Sycamore Academy of Science and Cultural Arts 0.11 1.21 0.51 3 4 6 4
Temecula Preparatory 0.41 4.48 0.82 8 2 9 9 3 9 7 8
Temecula Valley Charter 0.15 1.83 0.09 6 10 10 9 7 10 8 9
Sacramento County
Antelope View Charter 8 2 1 4 2 4 1 1
Aspire Capitol Heights Academy -0.02 0.91 0.86 9 5 8 8 1 7 9 9
Bowling Green Elementary 7 6 4 6 8 5 6 6
California Aerospace Academy 0.25 2.3 0.84 9 2 1 3 5 3 1 2
California Montessori Project-Capitol Campus 0.29 13.87 0.94 9 2 9 10 10 8 7
Charter School Scores / Grouped by County
Scho
ol P
rodu
ctiv
ity In
dex
Mat
h Pr
oduc
tivity
Inde
x
Engl
ish/
LA
Prod
uctiv
ity In
dex
Acad
emic
Mom
entu
m In
dex
Adeq
uate
Yea
rly
Prog
ress
Inde
x
API C
ompo
site
Inde
x
EL R
ecla
ssifi
catio
n In
dex
Teac
her Q
ualifi
catio
n In
dex
Teac
hing
Res
ourc
es In
dex
Dire
ct C
lass
room
In
vest
men
t Ind
ex
Liqu
idity
Rat
ios
Inde
x
Rese
rves
Rat
ios
Inde
x
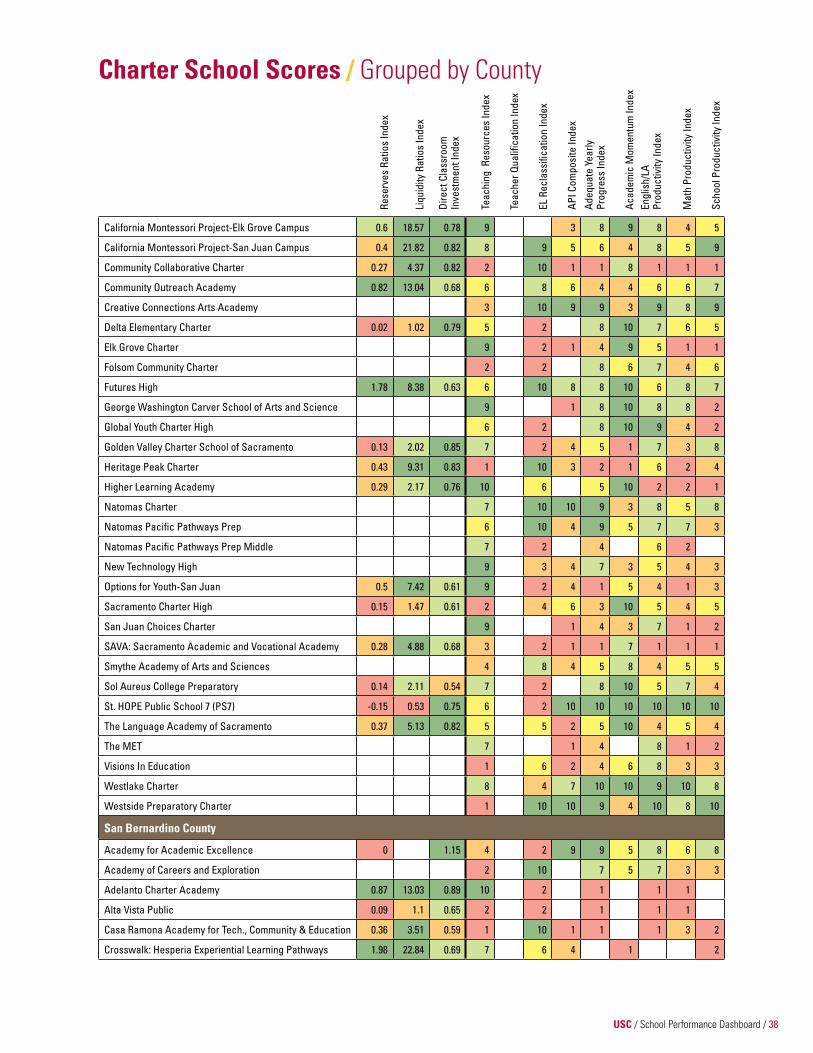
USC / School Performance Dashboard / 38
California Montessori Project-Elk Grove Campus 0.6 18.57 0.78 9 3 8 9 8 4 5
California Montessori Project-San Juan Campus 0.4 21.82 0.82 8 9 5 6 4 8 5 9
Community Collaborative Charter 0.27 4.37 0.82 2 10 1 1 8 1 1 1
Community Outreach Academy 0.82 13.04 0.68 6 8 6 4 4 6 6 7
Creative Connections Arts Academy 3 10 9 9 3 9 8 9
Delta Elementary Charter 0.02 1.02 0.79 5 2 8 10 7 6 5
Elk Grove Charter 9 2 1 4 9 5 1 1
Folsom Community Charter 2 2 8 6 7 4 6
Futures High 1.78 8.38 0.63 6 10 8 8 10 6 8 7
George Washington Carver School of Arts and Science 9 1 8 10 8 8 2
Global Youth Charter High 6 2 8 10 9 4 2
Golden Valley Charter School of Sacramento 0.13 2.02 0.85 7 2 4 5 1 7 3 8
Heritage Peak Charter 0.43 9.31 0.83 1 10 3 2 1 6 2 4
Higher Learning Academy 0.29 2.17 0.76 10 6 5 10 2 2 1
Natomas Charter 7 10 10 9 3 8 5 8
Natomas Pacific Pathways Prep 6 10 4 9 5 7 7 3
Natomas Pacific Pathways Prep Middle 7 2 4 6 2
New Technology High 9 3 4 7 3 5 4 3
Options for Youth-San Juan 0.5 7.42 0.61 9 2 4 1 5 4 1 3
Sacramento Charter High 0.15 1.47 0.61 2 4 6 3 10 5 4 5
San Juan Choices Charter 9 1 4 3 7 1 2
SAVA: Sacramento Academic and Vocational Academy 0.28 4.88 0.68 3 2 1 1 7 1 1 1
Smythe Academy of Arts and Sciences 4 8 4 5 8 4 5 5
Sol Aureus College Preparatory 0.14 2.11 0.54 7 2 8 10 5 7 4
St. HOPE Public School 7 (PS7) -0.15 0.53 0.75 6 2 10 10 10 10 10 10
The Language Academy of Sacramento 0.37 5.13 0.82 5 5 2 5 10 4 5 4
The MET 7 1 4 8 1 2
Visions In Education 1 6 2 4 6 8 3 3
Westlake Charter 8 4 7 10 10 9 10 8
Westside Preparatory Charter 1 10 10 9 4 10 8 10
San Bernardino County
Academy for Academic Excellence 0 1.15 4 2 9 9 5 8 6 8
Academy of Careers and Exploration 2 10 7 5 7 3 3
Adelanto Charter Academy 0.87 13.03 0.89 10 2 1 1 1
Alta Vista Public 0.09 1.1 0.65 2 2 1 1 1
Casa Ramona Academy for Tech., Community & Education 0.36 3.51 0.59 1 10 1 1 1 3 2
Crosswalk: Hesperia Experiential Learning Pathways 1.98 22.84 0.69 7 6 4 1 2
Charter School Scores / Grouped by County
Scho
ol P
rodu
ctiv
ity In
dex
Mat
h Pr
oduc
tivity
Inde
x
Engl
ish/
LA
Prod
uctiv
ity In
dex
Acad
emic
Mom
entu
m In
dex
Adeq
uate
Yea
rly
Prog
ress
Inde
x
API C
ompo
site
Inde
x
EL R
ecla
ssifi
catio
n In
dex
Teac
her Q
ualifi
catio
n In
dex
Teac
hing
Res
ourc
es In
dex
Dire
ct C
lass
room
In
vest
men
t Ind
ex
Liqu
idity
Rat
ios
Inde
x
Rese
rves
Rat
ios
Inde
x

USC / School Performance Dashboard / 39
Encore High for the Performing and Visual Arts -0.02 0.97 0.63 1 2 4 2 3 5 1 3
Excelsior Education Center 0.59 18.07 0.59 1 2 7 6 4 9 3 6
Grove 0.22 12.45 0.73 9 2 7 8 9 8 4 5
High Desert Academy of Applied Arts and Sciences 0.11 1.36 0.65 9 2 3 10 1 1 1
Inland Leaders Charter 0.48 7.36 0.72 7 2 6 9 8 8 8 8
LaVerne Elementary Preparatory Academy 0.48 3.25 0.54 7 2 8 10 6 7 4
Mirus Secondary 0.71 20.14 0.69 1 2 4 10 1 1 1
Mojave River Academy 0.19 1.6 0.62 4 10 1 5 1 1 1
Mountain View Montessori Charter 4 2 7 9 2 2 1
New Vision Middle -0.13 0.56 0.51 10 2 5 3 4
Norton Space and Aeronautics Academy 0.15 0.84 4 2 1 1
Options for Youth - Upland 0.85 11.97 0.59 9 2 1 4 1 1 1
Options for Youth-San Bernardino 0.07 1.14 1.01 9 1 1 1
Options for Youth-Victorville Charter 0.41 2.54 0.59 9 2 2 1 2 4 1 2
Pathways to College 0.14 2.04 0.9 9 4 6 2 2 1
Provisional Accelerated Learning Academy 0.11 0.66 1 2 1 3 1 1 1
Public Safety Academy 0.02 3.14 0.67 9 10 4 6 6 7 3 5
Riverside Preparatory 0.21 1.84 0.62 6 10 8 8 6 8 5 7
Sedona Charter Academy -0.06 0.82 5.76 2 1 1 1
Sixth Street Prep 4 7 10 10 9 10 10 10
Sky Mountain Charter 0.24 2.27 0.61 3 10 2 3 6 7 2 5
SOAR Charter Academy 0.28 2.79 0.69 7 2 7 9 3 4 4
Summit Leadership Academy-High Desert 1.48 0.61 3 2 3 10 2 1 2
San Diego County
Albert Einstein Academy Middle 0.28 3.71 0.82 4 5 5 8 10 9 6 7
All Tribes Charter 0.05 1.15 0.63 9 2 6 6 6 1 2
Arroyo Paseo Charter High 0.1 1.44 0.86 9 2 1 1 4 1 1 1
Arroyo Vista Charter 3 7 8 10 9 10 10 10
Audeo Charter 0.82 16.73 0.94 1 5 4 2 2 5 2 2
Barona Indian Charter 9 2 1 1 1 1 3
Bayshore Prep Charter 0.06 1.21 0.52 1 2 3 2 2 1 2
California Virtual Academy @ San Diego 0 1 0.98 1 10 5 4 3 7 3 5
Charter School of San Diego 1.5 32.77 0.96 1 6 2 3 5 6 3 2
Chula Vista Learning Community Charter 7 6 10 9 5 9 10 10
Classical Academy 0.27 1.69 0.64 1 10 7 9 2 8 6 8
Classical Academy High 0.04 1.11 0.79 9 2 6 9 9 10 9 8
Coastal Academy 0.34 4.02 0.61 2 2 8 7 1 9 8 10
Charter School Scores / Grouped by County
Scho
ol P
rodu
ctiv
ity In
dex
Mat
h Pr
oduc
tivity
Inde
x
Engl
ish/
LA
Prod
uctiv
ity In
dex
Acad
emic
Mom
entu
m In
dex
Adeq
uate
Yea
rly
Prog
ress
Inde
x
API C
ompo
site
Inde
x
EL R
ecla
ssifi
catio
n In
dex
Teac
her Q
ualifi
catio
n In
dex
Teac
hing
Res
ourc
es In
dex
Dire
ct C
lass
room
In
vest
men
t Ind
ex
Liqu
idity
Rat
ios
Inde
x
Rese
rves
Rat
ios
Inde
x

USC / School Performance Dashboard / 40
Darnall E-Charter 0.36 5.38 1.11 8 4 6 6 6 4 7 7
Dehesa Charter 0.3 5.66 0.71 6 10 1 7 10 6 3 3
Diego Hills Charter 0.01 1.02 0.49 4 2
Discovery Charter 9 6 6 5 5 8 8 9
Eagles Peak Charter 2 7 5
Ecademy California 1 2
Einstein Academy 0.26 4.2 0.98 7 5 8 9 6 9 9 9
EJE Elementary Academy Charter 0.39 5.87 0.88 7 10 4 7 10 5 9 4
EJE Middle Academy 0.56 5.99 0.36 6 2 5 4 2
Escondido Charter High 0.52 5.05 0.79 7 9 9 3 10 9 9
Explorer Elementary 0.42 4.54 1.06 8 8 10 10 1 9 10 10
Feaster (Mae L.) Charter 8 4 6 8 10 7 8 6
Gompers Charter Middle 0.13 2.64 1.18 10 7 1 1 1 1 2
Gompers Preparatory Academy 0.12 2.08 0.77 8 2 1 1 1
Greater San Diego Academy 7 8 4 4 6 8 2 4
Guajome Park Academy Charter 0.56 11.24 0.78 4 9 4 4 10 8 3 4
Harriet Tubman Village Charter 0.08 1.65 0.9 2 2 4 6 9 6 5 6
Health Sciences High 0.13 1.49 0.66 4 10 8 8 1 8 7 7
Helix High 0.37 5.16 0.81 3 9 7 9 7 8 8 6
Heritage K-8 Charter 0.51 5.99 0.74 6 10 10 10 7 10 9 10
High Tech High 0.11 2.37 0.79 8 6 7 10 5 10 9 7
High Tech High Chula Vista 0.08 1.54 0.71 8 4 7 1
High Tech High International 0.1 2.13 0.78 9 5 9 9 9 8 6
High Tech High Media Arts 0.14 3.46 0.71 7 2 6 9 10 9 8 6
High Tech High North County 0.06 1.25 0.79 9 6 9 4
High Tech Middle 0.08 1.81 0.65 8 9 6 8 5 8 7 8
High Tech Middle Media Arts 0.13 3.9 0.72 5 10 4 8 8 9 5 7
High Tech Middle North County 0.07 1.35 0.57 5 2 5
Holly Drive Leadership Academy 0.01 1.12 0.93 2 3 1 1 2 2 4
Iftin Charter 0.74 25.22 0.92 9 2 1 7 10 3 5 2
Innovations Academy 0.05 1.18 0.8 9 2 6 10 5 2 2
Integrity Charter 6 5 5 7 6 4 6
Juan Bautista de Anza 0 0.99 0.51 10 2
Julian Charter 0.02 1.09 0.69 8 10 5 5 7 8 5 6
Kaplan Academy of California - San Diego -0.03 0.95 0.39 1 2 2 6 2
Keiller Leadership Academy 0.15 2.45 0.9 8 7 4 2 5 4 3 4
King/Chavez Academy Excellence 0.05 1.31 0.9 5 2 2 4 9 2 4 3
King/Chavez Arts Academy 0.09 1.81 0.86 7 5 1 7 10 2 5 2
Charter School Scores / Grouped by County
Scho
ol P
rodu
ctiv
ity In
dex
Mat
h Pr
oduc
tivity
Inde
x
Engl
ish/
LA
Prod
uctiv
ity In
dex
Acad
emic
Mom
entu
m In
dex
Adeq
uate
Yea
rly
Prog
ress
Inde
x
API C
ompo
site
Inde
x
EL R
ecla
ssifi
catio
n In
dex
Teac
her Q
ualifi
catio
n In
dex
Teac
hing
Res
ourc
es In
dex
Dire
ct C
lass
room
In
vest
men
t Ind
ex
Liqu
idity
Rat
ios
Inde
x
Rese
rves
Rat
ios
Inde
x

USC / School Performance Dashboard / 41
King/Chavez Athletics Academy 0.09 1.75 0.68 7 5 5 8 10 4 9 6
King/Chavez Community High 0.05 1.38 0.64 9 2 1 3 1
King/Chavez Preparatory Academy 0.06 1.39 0.74 3 8 1 5 10 2 1 1
King/Chavez Primary Academy 0.35 4.08 0.84 8 2 8 6 6 9 8
KIPP Adelante 0.87 20.36 0.83 5 2 9 4 1 6 5 8
Learning Choice Academy 0.09 1.63 0.75 1 9 4 4 5 7 3 5
Leonardo da Vinci Health Sciences Charter 0.12 1.51 0.45 7 2 4 5 1
Liberty Charter 0.1 1.65 0.82 9 9 9 10 3 9 9 9
Literacy First Charter 0.99 28.4 0.84 6 6 9 7 4
MAAC Community Charter 1 2 1 10 1 1 1
Magnolia Science Academy San Diego 0 1.01 0.83 5 7 5 6 7 8 3 7
McGill School of Success 0.36 4.22 1.04 8 2 8 10 4 8 3
Mountain Peak Charter 9 2 2 5 2
Mueller Charter (Robert L.) 5 8 7 8 10 8 8 7
Museum 0.04 1.34 1.18 4 2 9 10 9 9 8
National University Academy 0.16 1.15 0.6 8 2 1 1 1 1 2
Nestor Language Academy Charter 5 2 8 10 6 8 5
North County Trade Tech High 0.07 1.22 0.63 10 1 5 1 1 1
Nubia Leadership Academy 0.21 3.02 0.99 8 2 2 2 1 3 3 4
O’Farrell Community Center for Advanced Academy 0.29 3.02 0.9 5 5 4 2 7 5 3 5
Pacific View Charter 0.39 45.82 0.58 5 2 4 7 8 9 2 3
Preuss School UCSD 0.84 5.04 0.99 6 10 10 9 2 9 8 10
Promise Charter 0.34 3.9 0.86 5 8 6 8 10 5 8 6
RAI Online Charter 6 2 3 2 8 1 6
River Valley Charter 2 2 10 9 4 10 8 10
San Diego Cooperative Charter 0.29 3.05 1.11 8 10 5 8 8 9 4 8
San Diego Neighborhood Homeschools 1 2
SIATech 0.24 13.26 0.88 1 8 6 7 6 10
Steele Canyon High 1 8 5 5 3 7 7 6
Urban Discovery Academy Charter 0.26 2.22 0.83 8 2 9 9 9 8 8
Vivian Banks Charter 9 2 8 10 3 7 3
Xara Garden 9 2
San Francisco County
City Arts and Tech High 0.24 1.33 0.64 9 1 5 9 6 2 2
Creative Arts Charter 0.29 3.44 0.98 9 2 3 3 4 7 4 6
Edison Charter Academy 0.12 2.64 7 9 7 6 7
Five Keys Adult School (SF Sheriff’s) 0.35 2.51 0.5 10 2
Charter School Scores / Grouped by County
Scho
ol P
rodu
ctiv
ity In
dex
Mat
h Pr
oduc
tivity
Inde
x
Engl
ish/
LA
Prod
uctiv
ity In
dex
Acad
emic
Mom
entu
m In
dex
Adeq
uate
Yea
rly
Prog
ress
Inde
x
API C
ompo
site
Inde
x
EL R
ecla
ssifi
catio
n In
dex
Teac
her Q
ualifi
catio
n In
dex
Teac
hing
Res
ourc
es In
dex
Dire
ct C
lass
room
In
vest
men
t Ind
ex
Liqu
idity
Rat
ios
Inde
x
Rese
rves
Rat
ios
Inde
x

USC / School Performance Dashboard / 42
Five Keys Charter (SF Sheriff’s) 0.7 6.01 0.58 10 2 1 1 1
Gateway High 1.39 17.45 1.15 10 10 6 7 2 8 5 5
KIPP Bayview Academy 0.45 20.73 1.23 10 10 6 8 10 6 7 6
KIPP San Francisco Bay Academy 0.29 6.31 0.92 9 9 8 7 8 8 8
Leadership High 0.39 3.95 1.02 9 1 1 5 2 1 2
Life Learning Academy Charter 0.56 90.03 2.74 10 1 2 1 1 1
Metropolitan Arts & Technology High 0.14 1.3 0.82 9 2 3 7 7 6 2 2
San Joaquin County
Aspire Benjamin Holt College Preparatory Academy 0.48 1.21 0.68 2 10 9 8 10 9 9
Aspire Langston Hughes Academy 0 1.01 0.92 9 10 6 8 10 5 8 5
Aspire River Oaks Charter -0.05 0.98 0.78 7 7 9 9 9 9 10 9
Aspire Rosa Parks Academy 1.51 1.89 0.9 7 6 8 10 7 8 6
Aspire Vincent Shalvey Academy 0.6 7.36 0.92 7 10 10 10 2 10 10 10
California Virtual Academy @ San Joaquin 0 1 1.05 1 2 2 1 1 4 1 4
Career & Technical High 6 2 5 8
Delta Charter 0.11 1.64 1.07 10 10 1 2 5 4 2 3
Discovery Charter 0.42 3.56 0.83 5 10 5 8 9 7 2 4
Dr. Lewis Dolphin Stallworth Sr. Charter -0.12 0.7 0.56 9 2 1 2 1 1 1
Institute of Business, Management, and Law Charter 5 7 4 8 9 8 6 4
Joe Serna Jr. Charter 7 5 1 2 6 1 3 3
Kaplan Academy of California - North Central Calif -0.04 0.93 0.5 10 2 2 1 1
Millennium Charter 0.14 2.18 0.9 7 7 4 7 2 3 2 2
New Jerusalem 0.25 1.95 0.09 1 10 4 3 5 4 5 6
Pittman Charter 8 5 1 1 8 1 2 2
Primary Charter 0.36 7.18 1.03 7 10 9 9 1 8 9 10
Stockton Alternative High 1 1 1 1
Stockton Unified Early College Academy 3 2 8 10 5
Venture Academy 5 10 2 4 8
San Luis Obispo County
Bellevue-Santa Fe Charter 0.34 14.14 0.95 9 2 10 10 1 10 10 10
Grizzly Challenge Charter 0.28 3.28 0.82 8
San mateo County
Arundel Elementary 9 2 10 10 4 10 10 10
Aspire East Palo Alto Charter -0.01 0.92 0.88 7 8 9 9 10 8 9 8
Aspire East Palo Alto Phoenix Academy 3.71 18.79 1.31 10 9 8 10 4 8 3
Brittan Acres Elementary 7 8 9 9 1 10 9 10
California Virtual Academy @ San Mateo 0 1 1.01 1 10 6 3 2 5 2 4
Charter School Scores / Grouped by County
Scho
ol P
rodu
ctiv
ity In
dex
Mat
h Pr
oduc
tivity
Inde
x
Engl
ish/
LA
Prod
uctiv
ity In
dex
Acad
emic
Mom
entu
m In
dex
Adeq
uate
Yea
rly
Prog
ress
Inde
x
API C
ompo
site
Inde
x
EL R
ecla
ssifi
catio
n In
dex
Teac
her Q
ualifi
catio
n In
dex
Teac
hing
Res
ourc
es In
dex
Dire
ct C
lass
room
In
vest
men
t Ind
ex
Liqu
idity
Rat
ios
Inde
x
Rese
rves
Rat
ios
Inde
x

USC / School Performance Dashboard / 43
Edison-Brentwood Elementary 0 1.01 0.88 9 4 6 5 10 3 5 5
Everest Public High 0.04 1.16 1.07 9 2 5
Heather Elementary 9 4 7 10 10 10 10 9
Kaplan Academy of California-San Francisco Bay -0.06 0.9 0.54 10 2 8 9 4
San Carlos Charter Learning Center 7 3 9 10 6 10 10 10
Stanford New School 0.17 1.67 1.01 9 8 1 1 9 1 3 1
Summit Preparatory Charter High 0.14 2.38 12.76 8 8 9 9 4 8 8 8
Tierra Linda Middle 4 2 10 10 4 10 10 10
White Oaks Elementary 7 2 9 10 7 10 10 10
Santa Barbara County
Adelante Charter 0.07 1.38 1.23 9 4 1 3 8
Camino Real Community Partnership Academy 7 2 1
Family Partnership Home Study Charter 0.23 3.42 0.78 9 2 5 6 4 8 4 5
Manzanita Public Charter 0.21 2.15 0.94 8 4 3 2 4 3 5
Olive Grove 8 3 2 1 2 1 1
Orcutt Academy Charter 1 9 9 2 8 5 5
Peabody Charter 0.27 2.89 1.07 6 5 9 6 3
Santa Barbara Charter 9 5 4 5 4
Santa Barbara Charter Middle 2 3 10
Santa Ynez Valley Charter 8 2 9 9 3 9 8 9
Santa Clara County
ACE Charter 0.19 2.21 0.62 1 9 4 10
Blackford Elementary 5 2 7 9 3 5 3
Bridges Academy 5 8 3 2 5 3 2 3
Bullis Charter 0.07 1.65 1.46 10 10 10 6
Capri Elementary 7 6 9 9 8 9 8
Castlemont Elementary 5 5 4 4 5 7 6
Charter School of Morgan Hill 0.16 2.3 12.36 8 10 8 9 5 9 7 9
Discovery Charter 0.28 3.51 0.81 8 10 9 10 9
Downtown College Prep Alviso 0.05 1.29 0.54 2 1 10 2 1 1
Downtown College Preparatory 0.36 2.51 0.67 5 8 3 1 4 2 2 3
Escuela Popular Accelerated Family Learning 0.02 1.13 1.12 6 7 1 1 2 1 2 2
Escuela Popular/Training & Careers, Family Learning 0.32 5.96 0.57 10 1 8 1 1 2
Fammatre Elementary 8 10 10 3 10 10 10
Farnham Charter 7 8 6 2 9 9 9
Forest Hill Elementary 7 9 10 6 9 10 10
Ida Jew Academies 5 2 5 10 2 7 3
Charter School Scores / Grouped by County
Scho
ol P
rodu
ctiv
ity In
dex
Mat
h Pr
oduc
tivity
Inde
x
Engl
ish/
LA
Prod
uctiv
ity In
dex
Acad
emic
Mom
entu
m In
dex
Adeq
uate
Yea
rly
Prog
ress
Inde
x
API C
ompo
site
Inde
x
EL R
ecla
ssifi
catio
n In
dex
Teac
her Q
ualifi
catio
n In
dex
Teac
hing
Res
ourc
es In
dex
Dire
ct C
lass
room
In
vest
men
t Ind
ex
Liqu
idity
Rat
ios
Inde
x
Rese
rves
Rat
ios
Inde
x

USC / School Performance Dashboard / 44
KIPP Heartwood Academy 0.85 6.26 0.68 1 10 10 7 9 10 10
KIPP San Jose Collegiate 0.44 5.81 0.86 7 10 1 10 10 10
Latino College Preparatory Academy 0.19 2 0.68 9 10 1 1 9 2 2 2
Leadership Public Schools - San Jose 0.06 1.21 0.62 6 1 4 10
Lynhaven Elementary 5 4 4 2 4 6 6
Marshall Lane Elementary 6 9 10 8 10 10 10
Monroe Middle 6 4 6 9 5 3 4
Price Charter Middle 4 9 8 5 8 10 6 9
Rocketship Mateo Sheedy Elementary 0.16 2.36 0.51 1 6 10 10 3
Rocketship Si Se Puede Academy 0.14 2.1 0.41 1 2 9
Rolling Hills Middle 6 10 9 7 9 9 10
Rosemary Elementary 7 3 5 8 3 4 3
San Jose Conservation Corps Charter 0.81 5.38 0.59 1 10 8 8 6
Sartorette Charter 6 9 8 6 10 10 10
Sherman Oaks Elementary 6 4 3 8 10 6 8 4
South Bay Preparatory -0.11 0.71 0.42 1 2
University Preparatory Academy Charter 0.07 1.51 0.85 6 2 9
Village 6 9 10 7 10 10 10
Voices College-Bound Language Academy 0.26 2.59 1.15 2 2 5 1 3 6 6
Walter L. Bachrodt Elementary 9 7 1 7 10 4 4 3
Santa Cruz County
Academic/Vocational Charter Institute 10 2 1 10 1 1 1
Alianza Charter 1 3 1 1 5 1 2 1
Ceiba College Preparatory Academy 0.22 3.23 0.47 1 3 7 8 10 8 8 7
Cypress Charter High 7 8 8 9 6 4
Delta Charter 0.51 2.74 1.11 4 5 9
Linscott Charter 1 4 7 7 3 9 7 9
Ocean Grove Charter 0.29 6.54 0.63 6 10 4 6 6 9 4 7
Pacific Coast Charter 3 4 4 2 2 5 2 4
Pacific Collegiate Charter 0.65 9.82 0.84 9 10 10 10 8
SLVUSD Charter 8 2 5 5 1 7 3 6
Tierra Pacifica Charter 0.92 2.25 0.87 7 2 9 1 9 7 10
Watsonville Charter School of the Arts 1 7 3 6 9 5 5 6
Shasta County
Academy of Personalized Learning 0.14 1.93 0.71 9 2 2 6 1
Anderson New Technology High 8 2 7 9 6 9 9 8
Chrysalis Charter 0.58 7.44 0.92 9 2 9 2
Charter School Scores / Grouped by County
Scho
ol P
rodu
ctiv
ity In
dex
Mat
h Pr
oduc
tivity
Inde
x
Engl
ish/
LA
Prod
uctiv
ity In
dex
Acad
emic
Mom
entu
m In
dex
Adeq
uate
Yea
rly
Prog
ress
Inde
x
API C
ompo
site
Inde
x
EL R
ecla
ssifi
catio
n In
dex
Teac
her Q
ualifi
catio
n In
dex
Teac
hing
Res
ourc
es In
dex
Dire
ct C
lass
room
In
vest
men
t Ind
ex
Liqu
idity
Rat
ios
Inde
x
Rese
rves
Rat
ios
Inde
x

USC / School Performance Dashboard / 45
Monarch Learning Center 5 7 2 5 3 5
North Woods Discovery 9 2 3 6 9 8 3 6
Redding School of the Arts II 0.19 2.5 1.04 9 8 10 9 6 4
Rocky Point Charter 7 2 7 3 4 4 7
Shasta Secondary Home 2 2 6 8 3 9 3 6
Stellar Charter 4 6 1 8 2 8
Stellar Secondary Charter High 1 2 8 10 10 1 4
University Preparatory 2 9 9 6 10 8 10
Siskiyou County
Golden Eagle Charter 0.1 1.43 0.73 9 2 2 5 8
Solano County
Elise P. Buckingham Charter Magnet High 2 2 10 10 7 10 8 7
Fairmont Charter Elementary 6 4 2 1 1 1 3
Mare Island Technology Academy 1.02 13.98 0.56 1 10 2 2 7 6 1 3
MIT Academy 0.87 11.68 0.56 3 2 5 3 8 2 4
Vallejo Charter 2 9 6 7 7 7 8 9
Sonoma County
Abraxis Charter 0.42 3.78 0.45 8 6
Arts & Ethics Academy WASC Accredited Charter High -0.08 0.79 0.86 2
Binkley Elementary Charter 3 7 9 9 3 8 8 9
Cali Calmecac Language Academy 6 7 5 4 7 5 6 5
California Virtual Academy @ Sonoma 0 1 1.02 2 2 3 3 5 6 1 3
Forestville Academy 1 7 5 3 7 6 8
Insight School of California - North Bay 0.03 1.07 1.05 7 2 4 1 4 1 1
Kid Street Learning Center Charter 0.86 22.57 0.81 9 2
Liberty Elementary 7 5 10 10 6 10 10 10
Live Oak Charter 0.15 2.61 1.04 8
Mark West Charter 0.42 2.47 0.05 2 10 9 7 4 8 4 8
Mary Collins School at Cherry Valley 7 4
Northwest Prep at Piner-Olivet 7 8 2 5 1 1 1
Oak Grove Elementary/Willowside Middle 6 7 7 7 7 6 7
Orchard View 8 2 9 9 1 10 4 7
Pathways Charter -0.02 0.93 0.78 8 2 3 5 3 6 2 4
Piner-Olivet Charter 0.23 5.54 0.84 2 2 8 5 2 6 4 6
Pivot Online Charter - North Bay 0.04 1.06 0.28 10
REACH 9 2 9 10 6
Rincon Valley Charter 0.34 7.13 0.75 9 2 7 9 10 9 6 7
Charter School Scores / Grouped by County
Scho
ol P
rodu
ctiv
ity In
dex
Mat
h Pr
oduc
tivity
Inde
x
Engl
ish/
LA
Prod
uctiv
ity In
dex
Acad
emic
Mom
entu
m In
dex
Adeq
uate
Yea
rly
Prog
ress
Inde
x
API C
ompo
site
Inde
x
EL R
ecla
ssifi
catio
n In
dex
Teac
her Q
ualifi
catio
n In
dex
Teac
hing
Res
ourc
es In
dex
Dire
ct C
lass
room
In
vest
men
t Ind
ex
Liqu
idity
Rat
ios
Inde
x
Rese
rves
Rat
ios
Inde
x

USC / School Performance Dashboard / 46
River Montessori Elementary Charter 0.08 1.22 0.44 9 2 8
Roseland Charter 0.32 2.9 0.06 3 7 7 4 5 6 7 6
Russian River Charter 0 1 0.52 5 2 2 2 1 3
Salmon Creek 9 2 8 9 9 9 8 8
Santa Rosa Accelerated Charter 1 2
Santa Rosa Charter 0.78 14.38 0.86 8 8
Santa Rosa Charter School for the Arts 7 8
Sebastopol Independent Charter 0.45 11.75 1.02 7 2 7 8 2 9 7 9
Sonoma Charter 0.29 7.56 1.03 8 4 5 8 5 9 6 8
Spring Creek Matanzas Charter 8 8 9 5 1 8 8 9
Sunridge Charter 0.19 2.8 1.22 9 2 4 6 5 6 4 5
Twin Hills Charter Middle 7 2 8 9 9 9 8 7
Village Charter 0.38 6.65 0.88 7 2 7 1 3 4 4
Village Elementary Charter 7 7 8 7 4 8 8 8
Whited Elementary Charter 7 7 10 8 2 9 10 10
Woodland Star Charter 0.1 1.52 1.11 7 2 2 1 4 2 4
Wright Charter 8 6 3 4 3 5 5
Stanislaus County
Aspire Summit Charter Academy 0.21 3.57 0.84 8 4 9 7 1 6 8 8
Aspire University Charter 0.35 2.2 0.75 8 2 10 10 4 10 10 10
Aspire Vanguard College Preparatory Academy -0.09 0.37 0.78 8 8
Connecting Waters Charter 0.29 3.13 0.68 3 9 3 3 5 7 3 4
Denair Charter Academy 1 2 1 1 1 1 1 1
Gratton Charter 2 10 10 9
Grayson Charter 9 5 6 6 9 2 7 4
Great Valley Academy 0.36 1.32 0.72 3 2 2 2 8
Hart-Ransom Academic Charter 6 2 4 6 3 6 2 5
Hickman Charter 6 2 6 7 5 7 3 6
Hickman Elementary 5 2 8 9 9 7 9 7
Hickman Middle 3 2 10 5 1 6 4 8
Keyes to Learning Charter 1 2 5 6 7 8 2 6
Oakdale Charter High 3 2 6 10 4 1 1
Paradise Charter 1 2 8 10 7 7 4
Riverbank Language Academy 6 3 2 3 2 6 5
Valley Charter High 8 7 5
Whitmore Charter High 10 5 7 10 7 6 5
Whitmore Charter School of Art & Technology 8 8 5 1 7 1 7
Whitmore Charter School of Personalized Learning 5 2 1
Charter School Scores / Grouped by County
Scho
ol P
rodu
ctiv
ity In
dex
Mat
h Pr
oduc
tivity
Inde
x
Engl
ish/
LA
Prod
uctiv
ity In
dex
Acad
emic
Mom
entu
m In
dex
Adeq
uate
Yea
rly
Prog
ress
Inde
x
API C
ompo
site
Inde
x
EL R
ecla
ssifi
catio
n In
dex
Teac
her Q
ualifi
catio
n In
dex
Teac
hing
Res
ourc
es In
dex
Dire
ct C
lass
room
In
vest
men
t Ind
ex
Liqu
idity
Rat
ios
Inde
x
Rese
rves
Rat
ios
Inde
x

USC / School Performance Dashboard / 47
Sutter County
California Virtual Academy @ Sutter 0 1 1.05 1 3 2 3 6 1 3
South Sutter Charter 0.3 3.24 0.7 6 1 2 8 8 2 3
Twin Rivers Charter 0.41 6.28 0.78 8 6 9 10 7 6 4
Yuba City Charter 0.2 2.59 0.75 6 1 6 8 1 1 1
Tehama County
Educational Outreach Academy 3
eScholar Academy 9 1 10 1 1 1
Sacramento River Discovery Charter 0.52 10.53 0.83 8 6
Tulare County
Alpaugh Achievement Academy Charter
Butterfield Charter High 1 1 9 1 1 1
Central California Connections Academy 0.01 1.02 0.84 1 8 5 7 4 6
Charter Alternatives Academy 6 1 3 1 1 1
Charter Home School Academy 1 5 2 4 1 2
Eleanor Roosevelt Community Learning Center 0.7 16.69 0.75 3 2 3 6
Harmony Magnet Academy 6 10 10 1 10 10 9
La Sierra High 6 1 1 10
Summit Charter Academy 7 4 3 3 4 3 5
University Preparatory High 1 9
Visalia Charter Independent Study 1 1 7 1 1 1
Tuolumne County
California Virtual Academy @ Jamestown 0 1 1.01 2 2 7 9 7 2 4
Connections Visual and Performing Arts Academy 1 9 9 7 10 7 9
Gold Rush Charter 0.18 4.45 0.72 10 2 3 7 6 3 3
Ventura County
Camarillo Academy of Progressive Education 0.48 12.71 0.78 3 10 9 3 10 10 10
Golden Valley Charter 0.27 4.04 0.68 3 5 5 7 8 5 6
Golden Valley Virtual Charter 0.07 1.09 0.32 10
Meadows Arts and Technology Elementary 0.12 2.45 0.73 7 10 10
Somis Academy 7 4 2 5 1 2
University Charter Middle School at CSU Channel Islands 0.11 1.32 0.57 2 4 2 2 2 1 2
University Preparation School at CSU Channel Islands 0.26 2.54 0.73 7 4 4 1 3 3 4
Valley Oak Charter 0.71 4.53 0.66 6 8 2 8 3 5
Ventura Charter School of Arts and Global Education 0.43 6.09 0.8 4 5 8 6
Vista Real Charter High 0.21 1.34 0.69 1 1 1
Charter School Scores / Grouped by County
Scho
ol P
rodu
ctiv
ity In
dex
Mat
h Pr
oduc
tivity
Inde
x
Engl
ish/
LA
Prod
uctiv
ity In
dex
Acad
emic
Mom
entu
m In
dex
Adeq
uate
Yea
rly
Prog
ress
Inde
x
API C
ompo
site
Inde
x
EL R
ecla
ssifi
catio
n In
dex
Teac
her Q
ualifi
catio
n In
dex
Teac
hing
Res
ourc
es In
dex
Dire
ct C
lass
room
In
vest
men
t Ind
ex
Liqu
idity
Rat
ios
Inde
x
Rese
rves
Rat
ios
Inde
x
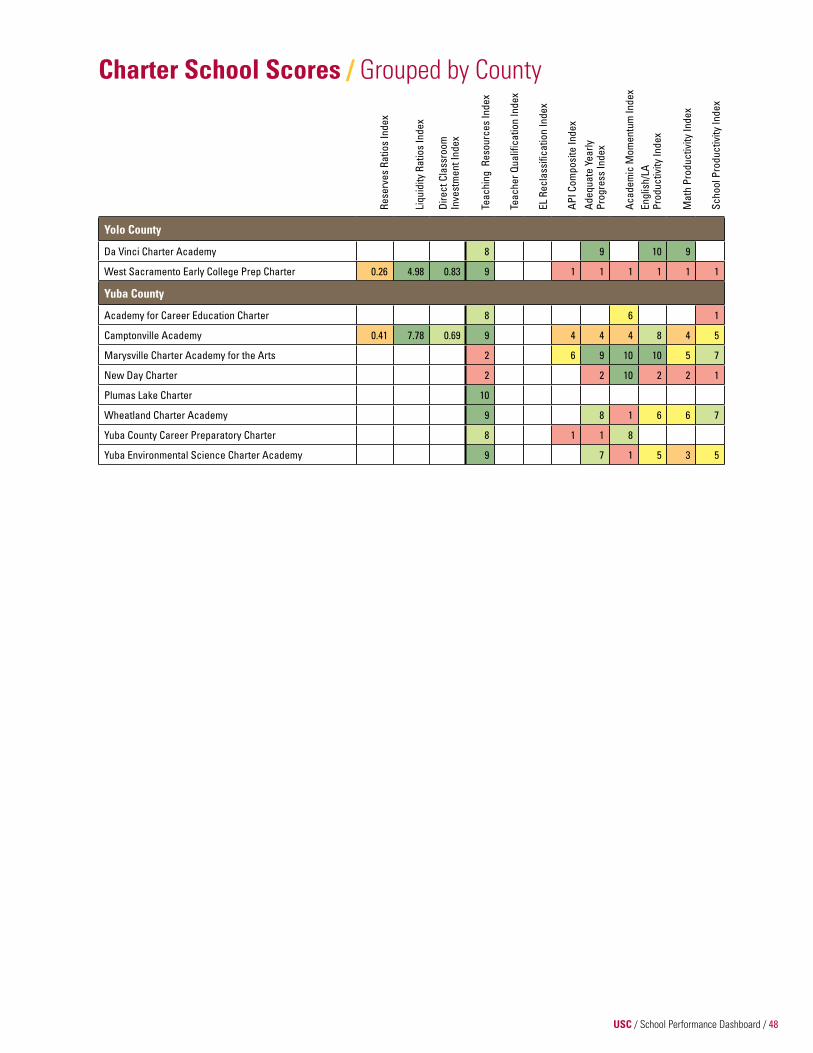
USC / School Performance Dashboard / 48
Yolo County
Da Vinci Charter Academy 8 9 10 9
West Sacramento Early College Prep Charter 0.26 4.98 0.83 9 1 1 1 1 1 1
Yuba County
Academy for Career Education Charter 8 6 1
Camptonville Academy 0.41 7.78 0.69 9 4 4 4 8 4 5
Marysville Charter Academy for the Arts 2 6 9 10 10 5 7
New Day Charter 2 2 10 2 2 1
Plumas Lake Charter 10
Wheatland Charter Academy 9 8 1 6 6 7
Yuba County Career Preparatory Charter 8 1 1 8
Yuba Environmental Science Charter Academy 9 7 1 5 3 5
Charter School Scores / Grouped by County
Scho
ol P
rodu
ctiv
ity In
dex
Mat
h Pr
oduc
tivity
Inde
x
Engl
ish/
LA
Prod
uctiv
ity In
dex
Acad
emic
Mom
entu
m In
dex
Adeq
uate
Yea
rly
Prog
ress
Inde
x
API C
ompo
site
Inde
x
EL R
ecla
ssifi
catio
n In
dex
Teac
her Q
ualifi
catio
n In
dex
Teac
hing
Res
ourc
es In
dex
Dire
ct C
lass
room
In
vest
men
t Ind
ex
Liqu
idity
Rat
ios
Inde
x
Rese
rves
Rat
ios
Inde
x

USC / School Performance Dashboard / 49
Appendices / Final Credits

USC / School Performance Dashboard / 50
Academic Performance Index (API)The API measures the academic performance and growth of public schools in California based on a variety of tests and establishes a statewide ranking of schools according to those scores. Most schools have an API, an overall state ranking, a ranking in comparison to 100 similar schools, and growth targets for the following year.
Further information can be found at http://www.cde.ca.gov/ta/ac/ap/
Accountability Progress Report (APR)The APR provides information on state API results, federal AYP results and federal program improvement information.
Further information can be found at http://www.cde.ca.gov/ta/ac/ar/index.asp
Adequate Yearly Progress (AYP)A goal of the 2001 federal No Child Left Behind Act (NCLB) is to require schools and districts to measure and report students’ annual progress toward proficiency in English/language arts and math-ematics. Progress is based on whether the school or district has met its Annual Measurable Objectives, demonstrated 95 percent participation on standardized tests, achieved its target on the API and, for high schools, met target graduation rates.
Further information can be found at http://www.cde.ca.gov/ta/ac/ay/
Charter School Alternative Form DataCalifornia Education Code began requiring charter school financial reporting during fiscal year 2003-2004. Charter schools can choose to use the Charter School Alternative Form. Charter schools that do not report in the Standardized Account Code Structure format must use the Alternative Form.
Further information can be found at http://www.cde.ca.gov/fg/sf/fr/csalternative.asp
California Basic Educational Data System (CBEDS)CBEDS contains information that the California Department of Education collects each October from school districts, schools and certificated staff. The CBEDS data include staffing information and student characteristics collected on three forms: the School Information Form, the Professional Assignment Information Form and the County/District Information Form.
Further information can be found at http://www.cde.ca.gov/ds/sd/cb/
DataQuestDataQuest is a database developed and maintained by the Department of Education that provides reports about California’s schools and school districts. It contains a variety of information, including school performance indicators; student and staff demographics; expulsion, suspension, and truancy data; and a variety of test results.
Further information can be found at http://www.cde.ca.gov/ds/sd/cb/dataquest.asp
Appendix A / Data Sources and Terms

USC / School Performance Dashboard / 51
Language Census (R30-LC)This census collects data on students with non-English-language backgrounds and includes information regarding English learner (EL) and fluent-English-proficient (FEP) students.
Further information can be found at http://www.cde.ca.gov/ds/dc/lc/
Professional Assignment Information Form (PAIF)PAIF data are collected annually from California teachers and concern the qualifications, demographics and teaching assignments for teachers in California’s public schools.
Further information can be found at http://www.cde.ca.gov/ds/sd/df/filespaif.asp
School Accountability Report Card (SARC)California state law requires all public schools receiving state funding to prepare a SARC. The SARC is intended to provide the public with important information about individual public schools, including school mission and progress towards goals; academic and demographic data; school safety and climate for learning; teacher and staff information; and fiscal and expenditure data. Although charter schools are required to prepare a SARC as a condition of receiving state funds, they are not required to comply with various SARC content and distribution requirements contained in the California Education Code.
Further information can be found at http://www.cde.ca.gov/ta/ac/sa/
School Information Form (SIF)The SIF is used to collect data specific to schools on the number of classified staff, school enrollment,high school graduates, enrollment in selected high school courses, career-technical educationenrollment, dropouts, alternative education, technology, education calendars and No ChildLeft Behind reporting requirements.
Further information can be found at http://www.cde.ca.gov/ds/sd/cb/studentdatafiles.asp
Standardized Account Code Structure (SACS)The SACS is a uniform and comprehensive chart of accounts for classifying the financial activitiesof California local school districts and county offices of education. Phase-in began in 1997-1998;by 2003-2004, all local educational agencies (LEAs) reported in SACS.
Further information can be found at http://www.cde.ca.gov/ds/fd/fd/
Teacher Qualification Index (TQI)The TQI is a standardized rating system that shows the credential status and experience level ofteachers at public K-12 schools in California. Schools receive a rating from 1 to 10 based on thepercentage of teachers at the school who are formally qualified. Schools with higher percentagesof underqualified teachers have lower TQI ratings. Ken Futernick, a former professor at CaliforniaState University, Sacramento, developed this measure.
Further information can be found at http://www.edfordemocracy.org/
Appendix A / Data Sources and Terms

USC / School Performance Dashboard / 52
The following section describes the measures we used to assess the performance of charter schoolsin California. It explains what data we used and how we calculated values for each of the 12 indices.
Financial Resources and Investment
Reserves Ratios IndexThe Reserves Ratios Index is the ratio of reserve fund balances to total expenditures. This measureof charter school financial stability counts available funds to cover unexpected costs or to compensate if future revenues are less than expected.
Liquidity Ratios IndexThe Liquidity Ratios Index, which measures assets to liabilities, is a measure of a charter school’sfinancial health. It indicates a school’s ability to meet its liabilities as covered by its assets. A school with a high liquidity ratio is better able to raise additional capital, either through selling off or borrowing against its assets.
Direct Classroom Investment IndexThe Direct Classroom Investment Index is the ratio of classroom investment to total revenues.Classroom investments include such expenditures as teacher salaries and benefits, textbooks, and curriculum.
School Quality
Teaching Resources IndexThe Teaching Resources Index provides a ratio of full-time equivalent teachers to students. A teacher is an individual who holds a position requiring certification, and who provides direct instruction to students.
Teacher Qualification IndexThe Teacher Qualification Index measures teacher quality based on credentials and experience.Each school begins with a score of 10; this is lowered if any of its teachers possess an emergency,intern or waiver credential or if 20 percent or greater of its teaching staff is first- or second-yearteachers. As this indicator is criterion-referenced, it is possible for all schools to receive a rankingof 10.
English Learner Reclassification IndexThe English Learner Reclassification Index represents the frequency with which a school transitionsstudents from English Learner (EL) to fluent-English-proficient (FEP).
Appendix B / Creating the Dashboard

USC / School Performance Dashboard / 53
School Performance
API Composite IndexThe API Composite Index summarizes school performance on various statewide standardizedtests that cover a variety of academic subjects. This index combines API school rank, API similarschools rank and API base score from the previous year.
Adequate Yearly Progress IndexAdequate Yearly Progress (AYP) Index rankings include whether schools met AYP goals in mathand English/language arts and the percentage of students rated as proficient or above in thesesubject areas.
Academic momentum IndexThe Academic Momentum Index combines three measures of academic progress: annual changein the percentage of students proficient in math; annual change in the percentage of studentsproficient in English/language arts; and annual API growth. It measures changes in a school’sstudent achievement over time.
Academic Productivity
English/Language Arts Productivity IndexThe English/Language Arts Productivity Index measures academic achievement on standardizedtests of English/language arts as compared to non-charter schools within the same district anddistricts with similar per-pupil spending.
math Productivity IndexThe Math Productivity Index measures how well a charter school performs on math standardizedtests compared to non-charter schools within the same district and districts with similar per-pupilspending.
School Productivity IndexSchool Productivity Index rankings compare a school’s API scores to those of schools withintheir district and similarly funded districts. The API rates school performance in a variety ofsubject areas.
Appendix B / Creating the Dashboard

USC / School Performance Dashboard / 54
Reserves Ratios Index
SITE: http://www.cde.ca.gov/ds/fd/fd/
DATA ELEmENTS:
> Reserves ratio (Fund Balance/Revenues)
DATA SOURCES:
> Charter School Alternative Form Unaudited Actual Data Sets: 2004-05, 2005-06, 2006-07, 2007-08, 2008-09, 2009-10
> SACS Unaudited Actual Data: 2004-05, 2005-06, 2006-07, 2007-08, 2008-09, 2009-10
Appendix C / Index and Data Sources
Liquidity Ratios Index
SITE: http://www.cde.ca.gov/ds/fd/fd/
DATA ELEmENTS:
> Liquidity ratio (Assets/liabilities)
DATA SOURCES:
> Charter School Alternative Form Unaudited Actual Data Sets: 2004-05, 2005-06, 2006-07, 2007-08, 2008-09, 2009-10
> SACS Unaudited Actual Data: 2004-05, 2005-06, 2006-07, 2007-08, 2008-09, 2009-10
Direct Classroom Investment
SITE: http://www.cde.ca.gov/ds/fd/fd/
DATA ELEmENTS:
> Teachers’ salaries> Certified pupil support salaries> Instructional aides’ salaries> Non-certified support salaries> Approved textbooks and core curriculum materials> Books and other reference materials> Materials and supplies> Tuition to other schools> State teachers’ retirement system> Public employees’ retirement system> OASDI/Medicare/Alternative> Health and welfare benefits> Unemployment insurance> Workers’ compensation insurance> Retiree benefits> PERS reduction (for revenue limit funded schools)
> Other employee benefits
DATA SOURCES:
> Charter School Alternative Form Unaudited Actual Data Sets: 2004-05, 2005-06, 2006-07, 2007-08, 2008-09, 2009-10
> SACS Unaudited Actual Data: 2004-05, 2005-06, 2006-07, 2007-08, 2008-09, 2009-10

USC / School Performance Dashboard / 55
Teaching Resources Index
SITE: http://www.cde.ca.gov/ds/sd/df/filescertstaff.asp
DATA ELEmENTS
> FTE teacher/student ratiosDATA SOURCES:
> CBEDS Professional Assignment Information Form (PAIF): assign04.exe, assign05.dbf, assign06.dbf, as sign07.dbf, paif09.txt
> CBEDS Certificated Staff Profile: prcert08.txt, prcert07.txt, prcert06.txt, prcert05.dbf, prcert04.exe
Teacher Qualification Index
SITES:
http://www.cde.ca.gov/ds/ss/cb/filestchcrd.asp http://www.cde.ca.gov/ds/ss/cb/filespaif.asp
DATA ELEmENTS:
Number of:> Teachers> Beginning teachers> Pre-interns> Emergency permits> Waivers
DATA SOURCES:
> CBEDS Professional Assignment Information Form (PAIF): paif04.exe, paif05. exe, paif06.dbf, paif.07.dbf, tchcrd08.txt
Appendix C / Index and Data Sources
English Learner Reclassification
SITES:
http://www.cde.ca.gov/ds/sd/sd/fileslcp234.asp http://dq.cde.ca.gov/dataquest/AltPage2.asp?cSubject=LC
DATA ELEmENTS
> Number of EL in previous years> Number of EL reclassified> Percent reclassified
DATA SOURCES
> Language Census (R30-LC): lc05p2_4, lc06p2_4, lc07p2_4, lc08p2_4, lc09p2_4, and lc10p2_4
> DataQuest search: 2009-2010

USC / School Performance Dashboard / 56
API Composite Index
SITE: http://www.cde.ca.gov/ta/ac/ap/apidatafiles.asp
DATA ELEmENTS
> API school rank> API similar schools rank> API base score
DATA SOURCES:
> API - Data File (DBF): 2005, 2006, 2007, 2008, 2009
Adequate Yearly Progress Index
SITE: http://www.cde.ca.gov/ta/ac/ay/aypdatafiles.asp
DATA ELEmENTS:
> Met overall AYP for English/Language Arts (yes or no)> AYP English/Language Arts Achievement (percent proficient or above)> Met overall AYP for math (yes or no)> AYP Math Achievement (percent proficient or above)
DATA SOURCES:
> AYP - Data File (DBF): 2006, 2007, 2008, 2009, 2010
Academic momentum Index
SITES:
http://www.cde.ca.gov/ta/ac/sa/ http://www.cde.ca.gov/ta/ac/ap/apidatafiles.asp
DATA ELEmENTS:
> English/Language Arts Performance> Math Performance> API Growth (percent proficient or above)
DATA SOURCES:
> SARC: 2005-06, 2006-07, 2007-08, 2008-09, 2009-10
> Growth API - Data File (DBF): 2006, 2007, 2008, 2009, 2010
English/Language Arts Productivity Index
SITES:
http://www.cde.ca.gov/ta/ac/ay/aypdatafiles.asp http://www.cde.ca.gov/ds/fd/ec/
DATA ELEmENTS:
> Percent proficient in English/language arts> Expenditures per ADA
DATA SOURCES:
> AYP - Data File (DBF): 2006, 2007, 2008, 2009, 2010
> Current Cost of Education: 2005-06, 2006-07, 2007-08, 2008-09, 2009-10
Appendix C / Index and Data Sources
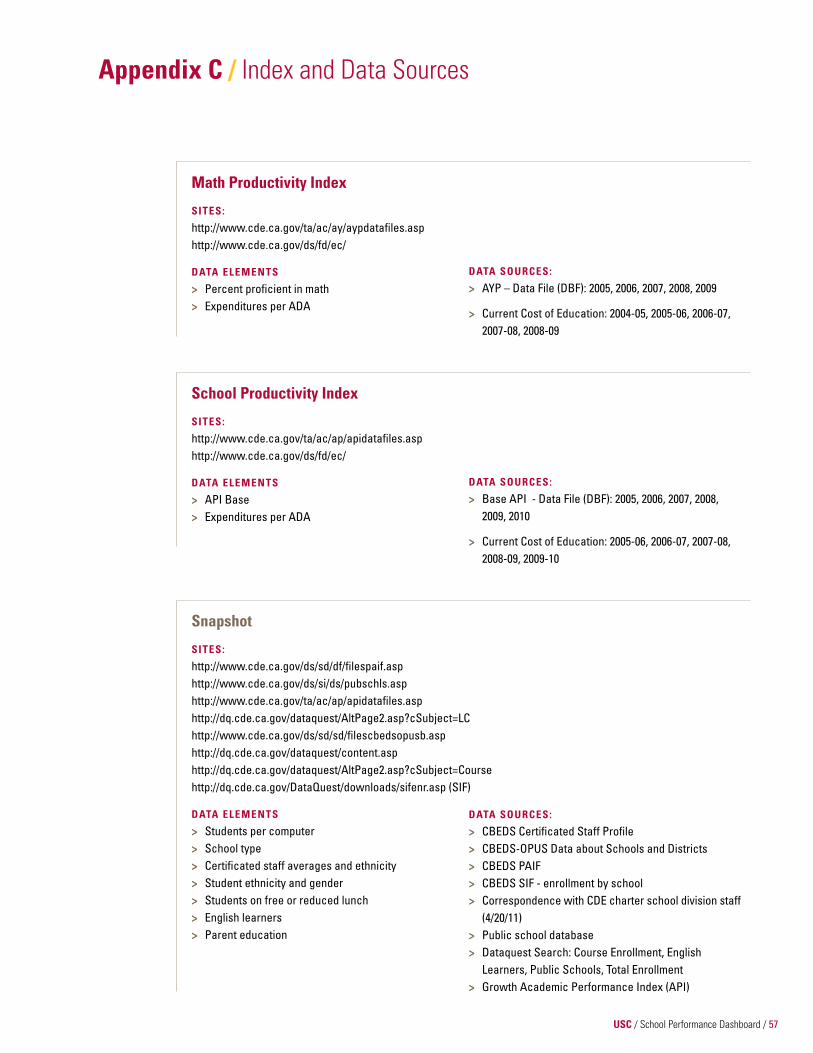
USC / School Performance Dashboard / 57
math Productivity Index
SITES:
http://www.cde.ca.gov/ta/ac/ay/aypdatafiles.asp http://www.cde.ca.gov/ds/fd/ec/
DATA ELEmENTS
> Percent proficient in math> Expenditures per ADA
School Productivity Index
SITES:
http://www.cde.ca.gov/ta/ac/ap/apidatafiles.asp http://www.cde.ca.gov/ds/fd/ec/
DATA ELEmENTS
> API Base> Expenditures per ADA
DATA SOURCES:
> AYP – Data File (DBF): 2005, 2006, 2007, 2008, 2009
> Current Cost of Education: 2004-05, 2005-06, 2006-07, 2007-08, 2008-09
DATA SOURCES:
> Base API - Data File (DBF): 2005, 2006, 2007, 2008, 2009, 2010
> Current Cost of Education: 2005-06, 2006-07, 2007-08, 2008-09, 2009-10
Snapshot
SITES:
http://www.cde.ca.gov/ds/sd/df/filespaif.asp http://www.cde.ca.gov/ds/si/ds/pubschls.asp http://www.cde.ca.gov/ta/ac/ap/apidatafiles.asp http://dq.cde.ca.gov/dataquest/AltPage2.asp?cSubject=LC http://www.cde.ca.gov/ds/sd/sd/filescbedsopusb.asp http://dq.cde.ca.gov/dataquest/content.asp http://dq.cde.ca.gov/dataquest/AltPage2.asp?cSubject=Course http://dq.cde.ca.gov/DataQuest/downloads/sifenr.asp (SIF)
DATA ELEmENTS
> Students per computer> School type> Certificated staff averages and ethnicity> Student ethnicity and gender> Students on free or reduced lunch> English learners> Parent education
DATA SOURCES:
> CBEDS Certificated Staff Profile > CBEDS-OPUS Data about Schools and Districts > CBEDS PAIF> CBEDS SIF - enrollment by school> Correspondence with CDE charter school division staff (4/20/11)> Public school database > Dataquest Search: Course Enrollment, English Learners, Public Schools, Total Enrollment> Growth Academic Performance Index (API)
Appendix C / Index and Data Sources

USC / School Performance Dashboard / 58
We are deeply grateful to the foundations, charter school partners and individuals who have supported the development of USC School Performance Dashboard 2011 and Dashboard Interactive:
The Ahmanson Foundation, Los Angeles
The John Randolph Haynes and Dora Haynes Foundation, Los AngelesLeon Lowenstein Foundation Inc., New York • Ralph M. Parsons Foundation, Los Angeles
Skirball Foundation, New York • Weingart Foundation, Los Angeles • William E. B. Siart, Los Angeles
CEG Advisory Board
Fred Ali President and Chief Administrative Officer Weingart Foundation
Steve BarrFounder and CEO Future Is Now Schools
magdalena Carrillo mejia Co-DirectorStanford ELL Leadership NetworkStanford University
Jackie Duvivier Castillo Director of Business and Development Services PUC Schools
Carl Cohn Co-DirectorUrban Leadership ProgramClinical Professor School of Educational Studies Claremont Graduate University
David Dwyer, Ph.D.President and CEOEdnovate Inc.Katzman-Ernst Chair for Entrepreneurship, Technology and InnovationUSC Rossier School of Education
José Cole-Gutiérrez Director, Charter SchoolsInnovation and Charter Schools DivisionLos Angeles Unified School District
David Plank Research ProfessorStanford UniversityExecutive DirectorPolicy Analysis for California Education
Darline P. RoblesProfessor of Clinical EducationUniversity of Southern CaliforniaFormer SuperintendentLos Angeles County Office of Education
William E.B. Siart Founder and ChairmanExcellent Education Development
Aisha ToneyDirector of ResearchCalifornia Charter Schools Association
Lee Walcott Managing Director EmeritusThe Ahmanson Foundation
Jed WallacePresident and CEOCalifornia Charter Schools Association
Johnathan Williams Founder The Accelerated School
Caprice YoungFormer CEOICEF Public Schools
Credits / Support
The content of this report is the sole responsibility of the Center on Educational Governance research team and may not reflect the views of the individuals or organizations named here.

USC / School Performance Dashboard / 59
Credits / About the USC School Performance Dashboard
In its fifth annual report, the Center on Educational Governance has built upon a foundation of national research and data analysis to produce the USC School Performance Dashboard (formerly known as “CSI–USC”). This year’s report, like last year’s, includes performance ratings for individual charter schools.
Since last year’s report was released, the CEG research team conducted a series of focus groups to gauge the value and utility of multiple measures of school performance. We also closely monitored who used the information, and we talked with users about what is needed to make the site more accessible and useful. Based on user feedback, this year’s report highlights the top 10 charter schools in California, based on academic and school productivity measures. We also added a filter so that users can search schools by the size of their English language learner populations. In the future, we will expand the filters to allow for searches based on the size and age of the school, its demographics, and whether it is affiliated with a charter management organization.
As a result of our meetings with USC Dashboard consumers, we discovered that in addition to charter school leaders, parents shopping for schools for their children were active visitors to the Web site, along with foundations that have invested in charter schools. Users pointed out the difficulty of accessing the Web site through the USC Web site and so we decided to launch an independent site devoted exclusively to the USC Dashboard: school-performance.usc.edu.
The USC School Performance Dashboard is just one project among the Center on Educational Governance’s commitment to research examining the quality, accountability and sustainability of public schools.
CEG’s Director, Priscilla Wohlstetter, Ph.D., the Diane and MacDonald Becket Professor of Educational Policy, serves as Co-Principal Investigator on the U.S. Department of Education’s national evaluation of charter schools. CEG has also developed and produced stakeholder satisfaction surveys for parent, students and staff, as well as guidebooks on charter school partnerships, parent involvement, and the scale-up of charter management organizations.
For more information about CEG research, products and services, and staff, consult the Cen-ter on Educational Governance Web site: http://www.usc.edu/cegov/
The USC School Performance Dashboard Research Team
Jeimee Estrada, MPP; Guilbert C, Hentschke, Ph.D.; Brynne Keith-Jennings, MPP; Archana Patel, MPP; Joanna Smith, Ph.D.; Priscilla Wohlstetter, Ph.D.
Editor: Elaine Beebe
Founding researchers: Richard S. Brown, Ph.D.; Sunny Liu, Ph.D.

USC / School Performance Dashboard / 60
The Center on Educational Governance (CEG), located at the University of Southern California, focuses on the linkages between policy, governance, and the improvement of urban schools and the systems within which they operate. CEG researchers use an interdisciplinary approach to study current policy solutions to the educational issues posed by diverse urban communi-ties– locally, nationally and globally. The main activities of the center are: (1) engaging in rigorous quantitative and qualitative research studies of policy problems; (2) building a knowledge base to provide researchers, educators, parents and policymakers with new tools and strategies for improvement; and (3) working in partnership with educators and policymakers to use research to improve policy and practice. Project highlights include studies of school networks, publicprivate partnerships, urban school district reform, and accountability, governance and leadership in charter schools.
Center on Educat ional GovernanceRossier School of Education
University of Southern California3470 Trousdale Parkway
Suite WPH 901Los Angeles, CA 90089-4039
(213) 740-0697www.usc.edu/cegov
Copyright ©2011 Center on Educational Governance, Rossier School of Education,
University of Southern California.All rights reserved.
Credits / About the Center on Educational Governance

Copyright ©2011 Center on Educational Governance, Rossier School of Education,
University of Southern California.All rights reserved.