Local Instruction Theory on Decimals - Minerva Access
308
Local Instruction Theory on Decimals: The Case of Indonesian Pre-service Teachers WANTY WIDJAJA Submitted in total fulfilment of the requirements of the degree of Doctor of Philosophy January 2008 Science and Mathematics Education Cluster Melbourne Graduate School of Education The University of Melbourne
-
Upload
khangminh22 -
Category
Documents
-
view
2 -
download
0
Transcript of Local Instruction Theory on Decimals - Minerva Access

Local Instruction Theory on Decimals:
The Case of Indonesian Pre-service Teachers
WANTY WIDJAJA
Submitted in total fulfilment of the requirements of the degree of
Doctor of Philosophy
January 2008
Science and Mathematics Education Cluster
Melbourne Graduate School of Education
The University of Melbourne

i
ABSTRACT
This thesis reports on an empirical study in developing an instructional sequence on
decimals to promote Indonesian pre-service teachers’ content and pedagogical
content knowledge on decimals. The study was situated in the context of the current
reform effort in adapting Realistic Mathematics Education (RME) theory and looked
into the role and issues of incorporating RME tenets into the design of activities for
teacher education in Indonesia.
The study was carried out in two cycles of teaching experiments involving 258 pre-
service primary and secondary teachers in one particular teacher training institute in
Indonesia using Design Research methodology. After the first cycle of 4 lessons,
activities and test items were refined for trialling with a new cohort in the following
year.
Findings from the two cycles signified the importance of revisiting and improving
pre-service teachers’ content and pedagogical content knowledge of decimals. This
study found that pre-service teachers’ knowledge on decimals were characterised as
fragmented, with strong reliance on rules without understanding, and strong
association with fractions. Pre-service teachers in both cycles made substantial
improvement in both content and pedagogical content knowledge and they gained
their first experiences of working with physical models and working in groups with
class discussion. The nature of pre-service teachers’ knowledge of decimals
highlighted a challenge in attending to the guided reinvention tenet of RME.

ii
DECLARATION
This thesis contains no material that has been accepted for any degree in any
university. To best of my knowledge and belief, this thesis contains no material
previously published or written by another person, except where reference is given in
the text. This thesis is less than 100 000 words in length, exclusive of tables, maps,
bibliographies, and appendices.
Signature:
Date:

iii
ACKNOWLEDGEMENTS
I would like to thank Professor Kaye Stacey, my principal supervisor, for her
generous support, patience, and encouragement from the start until the completion of
this thesis. My appreciation also goes to Dr. Vicki Steinle, my co-supervisor, for her
inspiring research on decimals and her valuable support on this thesis.
I also would like to acknowledge the great support by all the staffs and fellow
postgraduate students from the Science and Mathematics Education Cluster at the
University of Melbourne for their insightful feedback and support over the years. It
has been a great honour to meet and to learn from many hard working and caring
people. Special thanks for Lynda Ball, Dr. Christine Redman, Dr. Robyn Pierce,
Irene Sheffield, and Maryrose Dennehy for their friendship and encouragement in
some challenging times on my PhD journey.
I would like to extend my gratitude to my colleagues at Sanata Dharma University,
Yogyakarta, particularly Dr. Yansen Marpaung, Mr. Hongki Julie, and Dr. Susento
who provided great support during data collection period.
This PhD journey is not possible without the generous support of AusAID
scholarship and I would like to express my gratitude to Ms Lucia Wong, for her
support.
My final thanks go to my parents, my siblings, and my four nephews, Chris, Nico,
Jojo, and Clement for their support and love.

iv
LIST OF PUBLICATIONS
Publications by candidate on matters relevant to thesis:
Pierce, R., Steinle, V., Stacey, K., & Widjaja, W. (2008). Understanding decimal numbers: a foundation for correct calculations. International Journal of Nursing Education Scholarship, 5(1), 1-15.
Widjaja, W., Stacey, K., & Steinle, V. (2007). Misconceptions in locating negative
decimals on the number line In J. Watson & K. Beswick (Eds.), Mathematics: Essential Research, Essential Practice (Vol. 2, pp. 923). Hobart: MERGA.
Widjaja, W., & Stacey, K. (2006). Promoting pre-service teachers' understanding of
decimal notation and its teaching. In J. Novotna & M. Kratka (Eds.), The Proceedings of 30th Annual Conference of Psychology of Mathematics Education (pp. 385-392). Prague: PME.
Widjaja, W. (2005). Didactical analysis of learning activities on decimals for
Indonesian pre-service teachers. In H. L. Chick & J. L. Vincent (Eds.), Proceedings of the 29th Annual Conference of Psychology of Mathematics Education (pp. 332). Melbourne: PME.

v
TABLE OF CONTENTS
ABSTRACT.................................................................................................................. i
DECLARATION......................................................................................................... ii
ACKNOWLEDGEMENTS........................................................................................ iii
LIST OF PUBLICATIONS........................................................................................ iv
TABLE OF CONTENTS............................................................................................. v
LIST OF TABLES..................................................................................................... vii
LIST OF FIGURES .................................................................................................... ix
LIST OF FIGURES .................................................................................................... ix
CHAPTER 1 INTRODUCTION ............................................................................. 1
1.1. Introduction to the study ........................................................................... 1
1.2. Definitions and Scope of Key Constructs ................................................. 4
1.3. Aims of the study in relation to Research Questions ................................ 6
1.4. Relevance and Significance of the study .................................................. 8
1.5. Outline of thesis ........................................................................................ 8
CHAPTER 2 LITERATURE REVIEW .................................................................. 9
2.1. Introduction ............................................................................................... 9
2.2. General overview of content areas and difficulties with decimals............ 9
2.3 Teaching Ideas about Decimals .............................................................. 22
2.4 RME basic tenets and teaching ideas on decimals.................................. 31
2.5 Concluding Remark ................................................................................ 38
CHAPTER 3 METHODOLOGY .......................................................................... 39
3.1 Introduction ............................................................................................. 39
3.2 Overview of Design Research................................................................. 39
3.3 Design Research in this study ................................................................. 40
3.4 Instruments .............................................................................................. 50
3.5 Discussion of the methodology............................................................... 54
3.6 Overview of data sources ........................................................................ 57
CHAPTER 4 GOING THROUGH PHASES IN CYCLE 1.................................. 60
4.1 Introduction ............................................................................................. 60
4.2 Design phase 1 ........................................................................................ 61

vi
4.3 Research instruments .............................................................................. 68
4.4 Reorganising activities after the trial phase ............................................ 69
4.5 Teaching experiment phase..................................................................... 77
4.6 Retrospective analysis phase................................................................. 105
CHAPTER 5 GOING THROUGH PHASES IN CYCLE 2................................ 109
5.1 Introduction ........................................................................................... 109
5.2 Design Phase 2 ...................................................................................... 110
5.3 Teaching Experiment 2 ......................................................................... 115
5.4 Findings from written test and interviews............................................. 127
5.5 Retrospective analysis ........................................................................... 142
CHAPTER 6 OVERVIEW OF FINDINGS FROM THE TWO CYCLES....... 145
6.1 Introduction ........................................................................................... 145
6.2 Overview of Improvements on Content knowledge ............................. 145
6.3 Overview of Improvements in Pedagogical Content knowledge.......... 152
6.4 Samples of development on CK and PCK ............................................ 157
6.5 Answering Research Question 1 and sub-questions ............................. 164
6.6 Answering Research Question 2 and sub-questions. ............................ 168
6.7 Concluding Remark .............................................................................. 171
CHAPTER 7 CONCLUSION............................................................................ 173
7.1 Introduction ........................................................................................... 173
7.2 Proposed LIT for decimals.................................................................... 173
7.3 Reflections on the role of teacher education in Indonesia in adapting
RME (Answering Research Question 3)............................................... 180
7.4 Strengths and Limitations of the study.................................................. 188
7.5 Directions and Recommendations for further study ............................. 190
REFERENCES ........................................................................................................ 192
APPENDICES .. ................................................................................................... 203
Appendix A: Set of activities
Appendix B: Written test and interviews items
Appendix C: Samples of recording activities or interview excerpts

vii
LIST OF TABLES
Table 2.1: Ways of thinking and corresponding behaviours adopted from Steinle
(2004, p.47-59) .......................................................................................................... 15
Table 3.1: Links among areas in learning goals, measure of achievement and
corresponding items................................................................................................... 44
Table 3.2: Types of decimal comparison items and number of items in DCT3a ...... 51
Table 3.3: Item types and classification of ways of thinking (fine codes) in DCT3a
and DCT3b................................................................................................................. 51
Table 3.4: Distribution of items in various areas of content knowledge assessed in
Part B ......................................................................................................................... 52
Table 3.5: Scoring criteria for various areas of pedagogical ideas assessed in Part C
................................................................................................................................... 53
Table 3.6: Illustrative samples of scoring criteria in Part C ...................................... 53
Table 3.7: Outline of data in relation to the research questions and goals of the study
for both cycles............................................................................................................ 58
Table 3.8: Links between research questions and various data sources .................... 59
Table 4.1: Overview of data sources in relation to research questions and goals in
cycle 1 ........................................................................................................................ 61
Table 4.2: Number and percentage of pre-service teachers with no errors in two
cohorts........................................................................................................................ 87
Table 4.3: Number and percentage of pre-service teachers in various thinking
classification .............................................................................................................. 87
Table 4.4: Paired t-test on the total score of Part B (out of the total score of 27) ..... 91
Table 4.5: Mean pre- and post-test Part B scores of the primary cohort (N=67, paired
t-tests)......................................................................................................................... 92
Table 4.6: Mean pre- and post-test Part B scores of the secondary cohort (N=51,
paired t-tests).............................................................................................................. 92
Table 4.7: Distributions of pre-service teachers in various categories in Part C of
cycle 1 (N=118) ......................................................................................................... 99
Table 4.8: Mean pre- and post-test Part C score (total score out of 9) .................... 100
Table 4.9: Paired t-test results of various items in Part C items of cycle 1 ............. 101

viii
Table 5.1: Overview of data sources in relation to research questions and goals ... 110
Table 5.2: Representative comments on patterns observed in Set 1- Activity 7 ..... 121
Table 5.3: Number and percentage of pre-service teachers with no errors in two
cohorts...................................................................................................................... 128
Table 5.4: Number and percentage of pre-service teachers in various thinking
classification ............................................................................................................ 129
Table 5.5: Mean pre- and post-tests from Part B in cycle 2 (out of the total score of
28) ............................................................................................................................ 131
Table 5.6: Mean pre- and post-test Part B of the primary cohort in cycle 2 (N=94,
paired t-tests)............................................................................................................ 133
Table 5.7: Mean pre- and post-test Part B of the secondary cohort in cycle 2 (N=46,
paired t-tests)............................................................................................................ 133
Table 5.8: Distribution of responses in locating negative decimals in the pre- and
post-test (N=140) ..................................................................................................... 136
Table 5.9: Distributions of pre-service teachers in various categories in Part C of
cycle 1 (N=140) ....................................................................................................... 137
Table 5.10: Mean pre- and post-test of Part C scores (total score ranges from 0 to 9)
................................................................................................................................. 138
Table 5.11: Paired t-test results of various items in Part C items of cycle 2 ........... 139
Table 6.1: Outcome of teaching experiments on various content areas from two
cycles ....................................................................................................................... 147
Table 6.2: Outcome of teaching experiments on various pedagogical content
knowledge areas between cycles ............................................................................. 153
Table 7.1: Proposed LIT on decimals in teacher education..................................... 174

ix
LIST OF FIGURES
Figure 2.1: Endless base ten chain (from Steinle, Stacey, & Chambers, 2006) ........ 10
Figure 2.2: Key notions for learning decimals covered in activities ......................... 11
Figure 2.3: Levels of models in RME (derived from Gravemeijer, 1998, p. 286) .... 35
Figure 3.1: Cycles and Phases of Design Research .................................................. 42
Figure 3.2: Timeline of the research in cycle 1 and cycle 2 ..................................... 57
Figure 4.1: LAB pieces.............................................................................................. 65
Figure 4.2: Various expansions of 3.145 using the number expander model (from
Steinle et al., 2006) .................................................................................................... 66
Figure 4.3: Set 1- Activity 1 worksheet of cycle 1 ................................................... 70
Figure 4.4: Set 1- Activity 3: Measuring length and width of a table using LAB
pieces ......................................................................................................................... 71
Figure 4.5: Set 1- Activity 5, 6: Sketching out representations of 2.06, 0.26, 0.206 . 72
Figure 4.6: Set 1- Activity 7, 8, and 9........................................................................ 73
Figure 4.7: Set 2-Activity 11: Decomposing decimals into various extended notations
................................................................................................................................... 74
Figure 4.8: Various expansions of 1.027 using the number expander...................... 74
Figure 4.9: Set 3 activities: Density of decimal numbers .......................................... 76
Figure 4.10: Sketches of representations for 2.06, 0.26, and 0.206 in worksheet of Set
1- Activity 5 ............................................................................................................... 79
Figure 4.11: Sketches showing no particular grouping ............................................. 83
Figure 4.12: Sketches showing five-grouping ........................................................... 83
Figure 4.13: Sketch showing ten-grouping............................................................... 83
Figure 4.14: Classifications of responses to DCT3a and DCT3b from two cohorts in
cycle 1 ........................................................................................................................ 88
Figure 4.15: Percentage of pre-service teachers’ error on DCT3a and DCT3b by
matched item types .................................................................................................... 89
Figure 4.16: Ismi’s misconception about decimals ................................................... 90
Figure 4.17: Box plot representing Part B total scores in pre-post of two cohorts.... 91
Figure 4.18: Performance in decomposing decimals (Item 2a,b in Part B) from both
cohorts........................................................................................................................ 94

x
Figure 4.19: Andin’s explanation for her erroneous interpretation of 555.555......... 95
Figure 4.20: Novo’s explanation in respond to pre-test Item 5 in Part B about density
of decimals................................................................................................................. 96
Figure 4.21: Box plot representing PCK scores in pre-post of two cohorts ............ 100
Figure 5.1: Comparison of Activity 1 in cycle 1 and in cycle 2 (from Appendix A4)
................................................................................................................................. 112
Figure 5.2: Refinement of Item 1 Part B from cycle 1 to cycle 2............................ 113
Figure 5.3: Refinement of Pre-test from Part C, Item 17 & 20 of cycle 1.............. 113
Figure 5.4: Changes in interview items and their justification ................................ 114
Figure 5.5: Pivoting the LAB pieces to divide into 2 halves................................... 117
Figure 5.6: Illustrations of intuitive approaches in partitioning one........................ 118
Figure 5.7: Illustration of partitioning one into 10 parts from Secondary cohort
responses.................................................................................................................. 119
Figure 5.8: Set 2, Activity 5-7 Cycle 2 investigating place value of decimals........ 120
Figure 5.9: Sample of worksheet response to Set 1 - Activity 5 in cycle 2............. 121
Figure 5.10: Set 2 - Activity 12 of Cycle 2.............................................................. 123
Figure 5.11: Responses to Set 2 Activity 12 of Cycle 2 from one primary cohort
group ........................................................................................................................ 124
Figure 5.12: Evidence of difficulties in locating negative decimals on the number line
................................................................................................................................. 125
Figure 5.13: Teaching idea incorporating place value column chart/matrix ........... 127
Figure 5.14: Classifications of thinking from two cohorts comparing pre- and post-
tests .......................................................................................................................... 129
Figure 5.15: Box plots of pre-test and post-test score of Part B.............................. 132
Figure 6.1: Vivi’s notes made during the interview ............................................... 162
Figure 6.2: Deficient knowledge of invert and multiply algorithm and the division
algorithm.................................................................................................................. 167
Figure 7.1: History of decimal notation (Steinle et al., 2006) ................................. 176
Figure 7.2: Main uses of models for learning decimals........................................... 184

1
CHAPTER 1 INTRODUCTION
1.1. Introduction to the study
Some people might perceive decimals as a simple school mathematics topic. This
misleading perception can be attributed to how decimals are approached in textbooks as
a simple extension of whole numbers. In many countries, the textbook approach of
introducing decimals tends to focus on symbolic manipulation of decimals and less
attention is paid to building a sound understanding of decimals based on place value
notions. One of the common approaches of teaching decimal operations is by extending
syntactic whole number rules to decimals. The extensive practice of applying whole
number rules might lead students to think that decimals are just a pair of whole
numbers separated by a decimal point (Brekke, 1996). In a similar vein, Brousseau
(1997) commented on the inadequacy of the teaching of decimals in France around
1960 which attended more to the discrete nature of decimals by employing smaller units
and using measurement contexts as expressed in the following quotation:
But in fact, these school decimal numbers are really just whole natural numbers. In every measure there exists an indivisible sub-multiple, an atom, below which no further distinctions are made. Even if the definition claims that all units of size can be divided by ten, these divisions are never- in elementary teaching- pursued with impunity beyond what is useful or reasonable, even through the convenient fiction of the calculation of a division. (p. 125)
Contrary to the assumption of the simplicity of decimals, extensive studies from
around the world on decimals have documented students’ difficulties and weak
conceptual understanding of decimals from primary to college levels (e.g., Glasgow,
Ragan, Fields, Reys, & Wasman, 2000; K. Irwin, 1995; Padberg, 2002; Steinle &
Stacey, 1998b, 2001, 2002). A weak understanding of place value, coupled by weak
notions of the magnitude of decimals and poor performance on estimation tasks, are
amongst the indicators of problems in decimals (Sowder, 1997; Steinle, 2004; Steinle &
Stacey, 2002, 2003b; Swan, 2001).
Studies investigating pre-service teachers’ understanding of decimals have
revealed that misconceptions also persisted in this group (Putt, 1995; Stacey, Helme,

2
Steinle et al., 2001; Thipkong & Davis, 1991). The fact that some mathematics teachers
themselves have limited understanding of decimals might explain the practice of relying
on the memorized procedures. This underscores the need to prepare mathematics
teachers with conceptual understanding of decimals in order to enable them to uncover
and resolve students’ misconceptions. Unfortunately, research involving overcoming
pre-service teachers’ difficulties in decimals seems to be more limited. The fact that pre-
service teachers in their future employment may share their misconceptions with
children underscores the need to improve pre-service teachers’ understanding of
decimals. This provides an impetus for research into designing instruction to improve
pre-service teachers’ content and pedagogical content knowledge of decimals.
Studies in the design of instruction in decimals (Brousseau, 1997; Hiebert, 1992;
Hunter & Anthony, 2003; K. C. Irwin, 2001; Lachance & Confrey, 2002; Sowder, 1997;
Stacey, Helme, Archer, & Condon, 2001) articulated the importance of building
meaningful interpretation of decimals. Hiebert (1992) contends that “A greater
investment of time would be required to develop meaning for the symbols at the outset
and less emphasis would be placed on immediate computational proficiency” (p. 318).
Furthermore he argued that having meaningful interpretation of decimals would
enhance performance in computation skills.
Despite extensive studies of decimals in other countries (e.g., K. Irwin, 1995;
Owens & Super, 1993; Padberg, 2002; Peled & Shabari, 2003; Steinle & Stacey,
1998b), a comprehensive study of teaching and learning decimals in the Indonesian
context has not been carried out. An analysis of some Indonesian commercial textbooks
(e.g., Listyastuti & Aji, 2002a, 2002b) indicates strong reliance on syntactic rules based
on whole numbers to teach decimals. The approach to teaching and learning decimals is
very symbolic and no attention is given to creating meaningful referents such as
concrete models to help students make sense of the place value structure of decimals.
The models for learning decimals presented in the textbooks are the more symbolic
models such as number lines, emphasising positions of points rather than lengths of
lines. Considering that these approaches used in Indonesia are similar to those that have
been found inadequate in international research studies, it is posited that Indonesian pre-
service teachers’ knowledge in decimals will be limited and not well-connected. Hence,
this study intends to develop a set of appropriate activities on decimals to promote a

3
conceptual understanding of the topic for pre-service teachers in Indonesia and to
strengthen their ideas about how to teach the topic. This study is expected to contribute
to the international discussion regarding the development of adequate mathematical
knowledge in pre-service teacher education.
Current thinking in Indonesia, influenced by the Freudenthal realistic mathematics
education (RME) theory, which will be reviewed in Chapter 2, accepts that
improvement in mathematics education will come by increasing emphasis on
developing meaning and moving away from teaching based only on rules, and through
adopting new teaching methodologies, such as group work, which encourage students to
construct mathematical ideas together. The project to adapt RME to the Indonesian
context called “PMRI” (Pendidikan Matematika Realistik Indonesia) began in 2000. To
date 11 teacher education institutions involving 30 Indonesian primary schools have
been participating in this reform effort (Sembiring, 2007; Zulkardi & Ilma, 2007).
Sanata Dharma University, where the main data collection for the current study took
place, is one of the four teacher education institutions that have been involved since the
start of the project. The research PMRI is still in infancy but early studies (Fauzan,
Slettenhaar, & Plomp, 2002; Hadi, Plomp, & Suryanto, 2002) adapting this approach
indicate promising results. The promising impact of PMRI is particularly evident in
creating an active and engaging learning atmosphere in mathematics classrooms.
However, Armanto (2002) found that teachers’ limited knowledge of RME and
resistance to the new teaching ideas often resulted in conducting RME lessons with little
variation from the conventional Indonesian approach. This underscores the need to
introduce and incorporate RME tenets in activities in teacher training institutes in order
to prepare and familiarize the pre-service teachers with this new approach. This concern
has been voiced by Hadi (2002) as one of the recommendations from his study.
Designing activities to be used in teacher education programs would have different
requirements from the ones for schools since the pre-service teachers have acquired
some knowledge of decimals. Moreover, the activities will need to address not only an
understanding of decimal concepts but also prepare pre-service teachers with ideas for
teaching decimals in more meaningful ways. Chapter 2 will incorporate further
discussion on findings from early studies on the implementation of the RME approach
in an Indonesian context.

4
1.2. Definitions and Scope of Key Constructs
1.2.1. Local Instruction Theory (LIT)
A local instruction theory (LIT), as used in this study, is defined in accordance with
Gravemeijer’s (2004) definition. It is “the description of, and the rationale for, the
envisioned learning route as it relates to a set of instructional activities for a specific
topic” (p. 107). The concept of the LIT defined by Gravemeijer performed a similar
function to the Hypothetical Learning Trajectory (HLT) defined by Simon (1995).
However, in Gravemeijer’s LIT, the rationale for the envisioned learning route should
explain “how the instructional activities comply with the intention to give the students
the opportunity to reinvent mathematics” (Gravemeijer, 1998, p. 280). This is because
Gravemeijer is a leading proponent of RME and guided reinvention is one of the RME
principles. An LIT is developed through the iterative process of conducting a thought
experiment, implementing experiments in the classroom and reflecting upon the
considerations, deliberations, and experiences. The term ‘local’ is used here to describe
“how that specific topic should be taught to fit the basic principles” (p. 280). It is ‘local’
in the sense of applying to one topic, not to all mathematics teaching. The starting point
of developing a LIT is the existing knowledge of students and by “imagining students
elaborating, refining, and adjusting their current ways of knowing” (Gravemeijer, 2004,
p. 106).
1.2.2. Indonesian Pre-service Teachers
The Indonesian Pre-service teachers in this study are pre-service teachers enrolled in the
Primary School Teacher Education (Two-Year Diploma Program) and in the
Mathematics Education Study Program (Bachelor of Education Program) for secondary
teaching at Sanata Dharma University in Yogyakarta. Therefore findings related to the
performance of pre-service teachers reported in this thesis will be confined to this scope.
It is anticipated that the implementation of the result to other teacher education
institutions might require some adjustments. However, the researcher does not know of
any features that make Sanata Dharma University pre-service teachers different from
other pre-service teachers.

5
1.2.3. Decimals
The word ‘decimal’ is used to refer to a base ten number that is written with a decimal
point. In this thesis, decimal refers to the notation of the numbers not the value. Note
that in an Indonesian context, a decimal comma is used instead of a decimal point, as
will be observed in samples of work presented along the thesis. Examples of decimals
are 1.8, 0.5, and −0.5 but not 1/2. Although nearly all decimals discussed are finite, we
also use the term decimals for decimals with infinite lengths.
1.2.4. Content Knowledge of Decimals
Content knowledge refers to a subset of knowledge about decimals. It includes
understanding of decimal place value, understanding of the multiplication and division
by 10, special properties of decimals such as density, and the relationships among
decimals, fractions and whole numbers. However, knowledge that underpins the
execution of algorithms involving decimals, such as lining up the decimal point is not
the focal interest of this study. The exact subset of content knowledge areas in the
activities in this study will be discussed in detail in Chapter 2, and Chapter 3.
1.2.5. Pedagogical Content Knowledge
Pedagogical Content Knowledge (PCK) refers to one category of Shulman’s (1987)
PCK definition, which focussed on knowledge of representations, i.e. “knowledge that
goes beyond knowledge of subject matter per se to the dimension of knowledge about
ways of representing and formulating the subject matter that make it comprehensible to
others”. Other categories of Shulman’s PCK, i.e. “understanding of what makes the
learning of a specific topic easy or difficult: the conceptions and preconceptions that
students of different ages and backgrounds bring with them to the learning” (p. 9), were
not the focal point of this study. In this study, the activities will focus on the issue of
finding ways to represent concepts and properties in decimals that are meaningful and
comprehensible for students. This notion will be discussed and defined further in
Chapter 2 and in Chapter 4.

6
1.3. Aims of the study in relation to Research Questions
This study aims to develop a Local Instruction Theory (LIT) on decimal notation for
Indonesian pre-service teachers. Primarily, developing LIT shall be based on empirical
studies of elaborating, deliberating and reflecting on a set of activities that are designed
to promote and improve Indonesian pre-service teachers’ content knowledge (CK) and
pedagogical content knowledge (PCK) on decimals.
The first research question is concerned with content knowledge. The learning activities
will focus on the key notions and properties that are often not addressed properly in
Indonesian education. These have been identified by an analysis of primary school
textbooks (e.g., Listyastuti & Aji, 2002a, 2002b). The most important are:
decimal place value system and interpretation of decimals
additive and multiplicative structures in decimals including unitising and
reunitising of decimals
density of decimals
connections and links between decimals, positive and negative whole numbers
and fractions
Further explanations about the above concepts and properties will be presented in
Section 2.2. The learning activities will incorporate principles of RME in order to fit
with new Indonesian initiatives.
The success of the learning activities to improve pre-service teachers’ content
knowledge (CK) on decimals is investigated in research question 1 as follows:
Research question 1: To what extent do the activities improve pre-service teachers’
content knowledge (CK) on decimals?
In answering this question, the following sub-questions are to be investigated:
a) What is the current state of Indonesian pre-service teachers’ CK of decimals?
b) What is the interplay between pre-service teachers’ participation in the set of
activities on decimals and their CK of decimals?

7
As is appropropriate in a teacher education course, the activities will also address
pedagogical issues and it is to be expected that pre-service teachers’ knowledge of how
to teach decimals will be improved by their participation. The study will therefore also
examine pre-service teachers’ knowledge of decimals in the context of teaching it to
their future students. This aspect relates to one of Shulman’s (1986) categories of PCK,
i.e. the knowledge of how to help students to learn concepts or properties in decimal
numeration. Shulman’s other aspect of PCK, i.e. “understanding of what makes the
learning of specific topics easy or difficult: the conceptions and preconceptions that
students of different ages and backgrounds bring with them” will not be examined in
this study. The impact of learning activities on pre-service teachers’ pedagogical
content knowledge (PCK) will be investigated in research question 2 as follows:
Research question 2: To what extent do the activities improve pre-service teachers’
pedagogical content knowledge (PCK) on decimals?
In answering this question, the following two sub-questions are to be investigated:
a) What is the current state of Indonesian pre-service teachers’ PCK of teaching
decimals?
b) What is the interplay between pre-service teachers’ participation in the set of
activities on decimals and their PCK of decimals?
Lying behind these two main questions is the author’s concern to prepare future
Indonesian teachers who are well trained to implement principles of RME. It is the
researcher’s intention that participation in these learning activities will give pre-service
teachers first-hand experience of how the principles of RME can be implemented into
their own mathematics teaching. However, there is to date little Indonesian experience
of using RME principles in teacher education. This concern is reflected in the following
question:
Research question 3: How can teacher education assist Indonesian schools to adapt
RME principles?

8
Research question 3 will be answered by the researchers’ reflections on empirical work
undertaken in answering Research Question 1 and Research Question 2. Responses to
question 3 are taken up in the final chapter.
1.4. Relevance and Significance of the study
This thesis will develop a framework of teaching and learning decimal notation for
Indonesian university lecturers to use with pre-service teachers. It is expected that this
framework could be adapted for use with in-service teachers in Indonesia, thereby
contributing to the improvement of both pre-service and in-service teacher education in
Indonesia. Future students of these pre-service teachers should benefit from this
improved conceptual understanding of decimals and teaching ideas. Moreover, this
study will also contribute to the international discussion regarding the issue of teaching
and learning decimals in teacher education. LIT will also give insights to the
development and dissemination of PMRI in teacher education in Indonesia, and of the
application of RME to teacher education.
1.5. Outline of thesis
Chapter 2 will review literature on prior research in learning and teaching of decimals
pertinent to this study. The discussion of basic tenets of RME and RME instructional
principles will also be addressed in this chapter. Chapter 3 contains discussions about
the Design Research methodology which is employed in this study. Analysis of findings
from different phases in cycle 1 and cycle 2 of the Design Research cycle will be
presented in Chapter 4 and Chapter 5 consecutively. In Chapter 6, a review of how the
activities evolve in the two cycles, common findings and differences between the two
cycles of teaching experiment will be explicated. Chapter 7 concludes with presenting
the activities depicting the LIT on decimals. Moreover, recommendations for the role of
teacher education institutions in assisting Indonesian schools to adapt the RME
principles will be articulated in this chapter.

9
CHAPTER 2 LITERATURE REVIEW
2.1. Introduction
This chapter starts with a general review of the main areas of conceptions in
decimals that need to be addressed in teaching decimals, as documented in past and
recent studies. A brief overview of diagnostic items used to detect misconceptions of
decimals is included. The main focus in reviewing the literature on difficulties will be
placed on identifying common difficulties related to conceptual understanding of
decimals rather than computational operations. Discussion on common difficulties about
decimals will be taken up at the end of Section 2.2. Section 2.3 will elaborate various
teaching ideas to improve understanding of decimals. In Section 2.4, the Realistic
Mathematics Education (RME) basic tenets, and teaching ideas about decimals based on
RME theory, will be discussed. Designing instruction based on RME principles is of
interest in this study because it is consistent with the current reform initiative in
Indonesian mathematics education. Finally, Section 2.5 ends with a concluding remark
about the main areas on teaching and learning about decimals that will be addressed in
this study with respect to the Indonesian context and consistent with the current reform
effort to adapt the RME theory.
2.2. General overview of content areas and difficulties with decimals
This section will start with a review of key notions in content areas for learning
decimals. Following that, literature on studies of misconceptions and problems in the
content areas of decimals at various levels of education will be discussed.
2.2.1 Overview of the key notions in learning decimals
Various studies have examined basic notions in learning and teaching decimals
and the inter-relations among those notions. Understanding place value has been widely
cited as one of the basic notions in decimal numeration. The term “endless base ten
chain” is used by Steinle, Stacey, and Chambers (2002) to refer to the chain of
relationships between the values of place value columns. As depicted in Figure 2.1, the

10
value of each place value column is ten times the value of the column to the right
(including across the decimal point) and that the value of each column is one tenth of
the value of the column to the left. Similar relationships imply that the value of each
place value column is one hundred times the value of the column two places to the right.
Conversely, the value of each column is one hundredth of the value of the column
located two places to the left, and so on. These structural relationships among different
place value columns are known as the multiplicative structure of decimals.
Figure 2.1: Endless base ten chain (from Steinle, Stacey, & Chambers, 2006)
Baturo (2000) proposed a model representing three levels of knowledge involved
in processing decimal numbers. The first level consists of knowledge of position
(involving place value names), the base ten system, and order of the places (hundredths
are larger than tenths, etc). This knowledge of ‘position’ seems to refer to the “place” of
place value, rather than the position of decimal numbers on a number line. The second
level of knowledge encompasses knowledge of unitising and equivalence of decimals
(e.g., 1 ten = 10 ones). Unitising is defined by Baas “identifying singleton of units, e.g.,
10 of hundredths = 1 tenth”. In the third level of her model are multiplicative structures
along with additive structures (e.g., 0.25 = 2 tenths + 5 hundredths) and reunitising.
These are considered as the highest level of knowledge because they integrate other
knowledge with place value knowledge. Reunitising is defined as “the ability to change
one’s perception of the unit (i.e., to also see that one whole partitioned into 10 equal
parts as five lots of 2 parts and two lots of 5 parts)” (Baturo, 2004, p.96). Baturo (2000)
contends that reunitising consists of three processes: partitioning (e.g., 6 tenths = 60
hundredths), grouping (e.g., 60 hundredths = 6 tenths), and re-grouping (e.g., 0.6 = 5
tenths + 10 hundredths) and hence it involves a more complex processes than unitising.
This is in line with Behr, Khoury, Harel, Post, and Lesh (1997)’s comment about
reunitising. They contend that reunitising “requires flexibility of thinking” and involves
11
more complex process than unitising (p.96). It is established that different level of
complexities are involved in unitising and reunitising. this thesis will not attempt to look
in detail into various levels of cognitions involved in unitising and reunitising. In this
thesis, the two notions are viewed more generally as part of the multiplicative structure
of decimals in Figure 2.2. Unitising is defined as grouping of smaller units into a larger
unit of decimal fractions. For example, 5 tenths + 10 hundredths = 6 tenths. Reunitising
is defined as the process involved in structuring a unit from smaller unit parts of
decimal fractions.
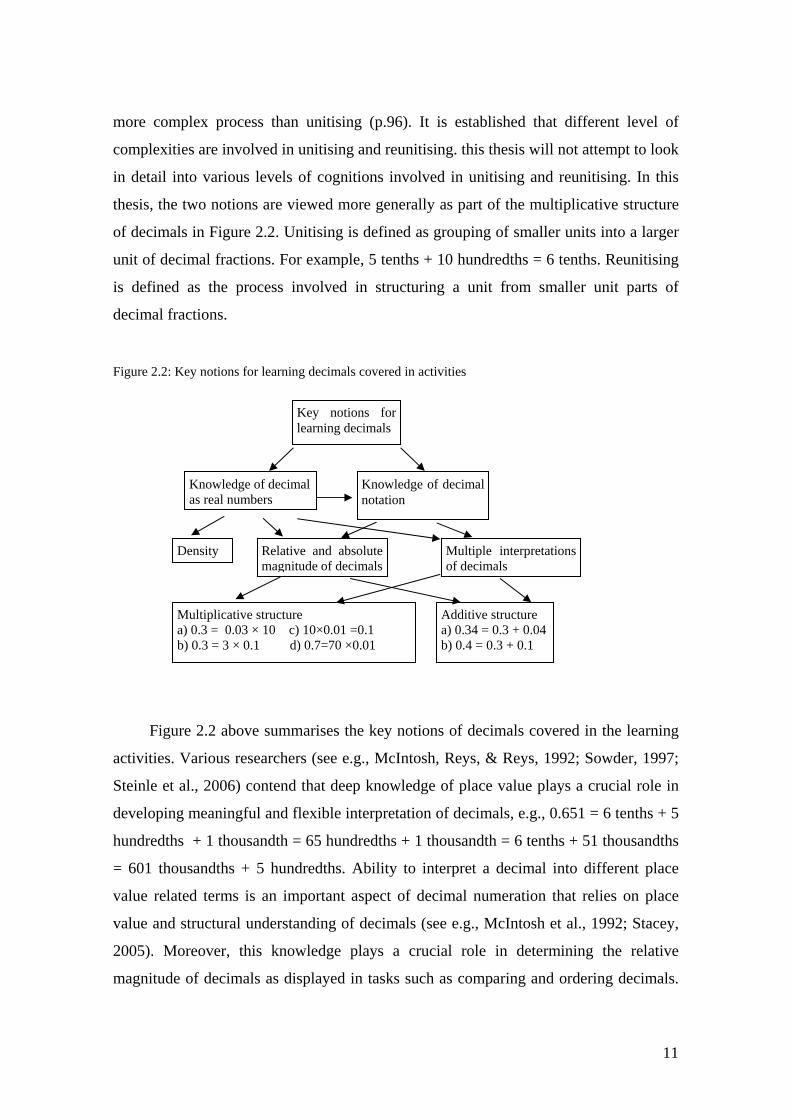
Figure 2.2: Key notions for learning decimals covered in activities
Figure 2.2 above summarises the key notions of decimals covered in the learning
activities. Various researchers (see e.g., McIntosh, Reys, & Reys, 1992; Sowder, 1997;
Steinle et al., 2006) contend that deep knowledge of place value plays a crucial role in
developing meaningful and flexible interpretation of decimals, e.g., 0.651 = 6 tenths + 5
hundredths + 1 thousandth = 65 hundredths + 1 thousandth = 6 tenths + 51 thousandths
= 601 thousandths + 5 hundredths. Ability to interpret a decimal into different place
value related terms is an important aspect of decimal numeration that relies on place
value and structural understanding of decimals (see e.g., McIntosh et al., 1992; Stacey,
2005). Moreover, this knowledge plays a crucial role in determining the relative
magnitude of decimals as displayed in tasks such as comparing and ordering decimals.
Key notions for learning decimals
Knowledge of decimal as real numbers
Multiple interpretations of decimals
Knowledge of decimal notation
Density
Additive structure a) 0.34 = 0.3 + 0.04 b) 0.4 = 0.3 + 0.1
Multiplicative structure a) 0.3 = 0.03 × 10 c) 10×0.01 =0.1 b) 0.3 = 3 × 0.1 d) 0.7=70 ×0.01
Relative and absolute magnitude of decimals

12
As will be discussed later in Section 2.2.3, researchers have documented the fact that
many students have trouble in judging the relative magnitude of decimals.
Another key notion in learning decimal is knowledge of decimal as real numbers.
These features would still hold if decimal numbers were represented not in a base ten
place value system but, for example, as continued fractions or in a base 2 system
without place value. For the purpose of this thesis, these features encompasses
knowledge about density of decimals (see e.g., Reys et al., 1999; Steinle et al., 2002;
Swan, 1990) and knowledge about relative and absolute magnitude of decimals. The
density property signifies that in between any two decimals, there are infinitely many
more decimals. This feature of decimals is independent of the notation that is used to
represent them as it is a property of real numbers. Figure 2.2 illustrates various key
notions for learning decimals derived from prior studies. It should be noted that Figure
2.2 does not contain exhaustive list of key notions for learning decimals. It mainly
serves as a framework to guide the goals of activities in this study.
2.2.2 Overview of decimal misconceptions identified using decimal
comparison tasks
Misconceptions of decimals and the underlying thinking behind these
misconceptions have been well documented in many studies. One of the tools that has
been widely used by researchers to reveal understanding and to detect misconceptions
of decimals is the task of comparing decimals (see e.g., Nesher & Peled, 1986; Sackur-
Grisvard & Leonard, 1985; Steinle & Stacey, 1998b, 2001, 2002). In general, decimal
comparison tasks ask students to determine the larger decimal among two or more
decimals, or to order two or more decimals from the smallest to the largest. This section
will present a brief overview of decimal misconceptions detected through the use of
these comparisons and ordering tasks.
There was a long history of use of comparison of decimal tasks, which resulted in
various classifications of decimal misconceptions. Early studies to diagnose decimal
misconceptions by Sackur-Grisvard and Leonard (1985) and Resnick, Nesher, Leonard,
Magone, Omanson, and Peled (1989) discriminated three incorrect rules which students
appeared to use based on association with common fractions or whole numbers. The

13
three incorrect rules are referred to as the Whole Number Rule, Fraction Rule, and Zero
Rule. Each of these rules arises from a misconception of decimals. In fact, later work
has shown a cluster of misconceptions behind each rule. In the Whole Number Rule,
decimal digits are interpreted according to overgeneralisation of whole number
knowledge, which implied that decimals with longer decimal digits are perceived as
larger numbers. In contrast, knowledge of common fractions and place value are
incorrectly extended to interpret decimal digits using knowledge of common fractions in
the Fraction Rule. Following this rule, decimals with shorter decimal digits are
perceived as the larger number. Meanwhile, the Zero Rule is based on awareness of the
role of zero as place holder but this knowledge is not well connected with the decimal
place value structure. Those who follow the Zero Rule perceive decimals with an
immediate zero after the decimal point such as 3.06 as smaller decimals compared to
3.7, but otherwise follow the whole number rule. Resnick et al. (1989) noted that
students who applied an Expert Rule might do this with real understanding or they may
be applying a correct rule without understanding.
Later studies confirmed the existence of students following those four incorrect
rules identified in the earlier studies (see e.g., Brekke, 1996; Fuglestad, 1996; Markovitz
& Sowder, 1994; Moloney & Stacey, 1997; Rouche & Clarke, 2004). Yet, careful
analysis of large data over several years (Stacey & Steinle, 1998, 1999; Steinle &
Stacey, 1998a, 2002, 2003b) reveals that there are more variations of students’
erroneous responses and underlying thinking, which can again be revealed using a
decimal comparison test, with refined items.
A systematic way of classifying incorrect responses and a refined classification of
ways of thinking was then offered. In Steinle’s (2004) classification, the term
behaviours were used to refer to patterns of incorrect responses on DCT on different
types of items. Four groups of behaviours and twelve ways of thinking were established
which corresponded to a two stage classification process. The terms ‘ways of thinking’
was used by Steinle to distinguish behaviour from underlying (conceptual)
misconception, because earlier studies used misconception in both ways. First,
behaviours are classified into one of the four coarse-grained behaviours as follows:

14
• Longer-is-Larger (L behaviour), choosing the decimal with the most digits after the decimal point as the largest
• Shorter-is-Larger (S behaviour), choosing the decimal with the fewest digits after the decimal point as the largest
• Apparent Expert (A behaviour), comparing “straightforward” pairs of decimals correctly with or without full understanding
• Unclassified (U behaviour), indicating behaviours that does not fit in either L, S, or A behaviour
Second, based on more detailed analysis of patterns of responses, twelve
categories as presented in Table 2.1 can be identified. This refined analysis of ways of
thinking is presented here because it will be employed as an initial framework for
analysing data gathered in this study. The decimal comparison test called DCT3a (pre-
test) and DCT3b (post-test) includes items problematic for adults in order to better
capture their thinking, as well as items representative of those used in earlier studies.
These tests have very closely matched but different items (see Appendix B1 and B2). Its
usage has been reported in some studies involving pre-service teachers and nursing
students to diagnose their conceptual understanding on decimals (see e.g., Steinle &
Pierce, 2006; Widjaja & Stacey, 2006). The DCT3a and DCT3b will be used in this
study to diagnose and follow pre-service teachers’ misconceptions about decimals.
DCT has been shown as an insightful and reliable diagnostic tool in revealing the
nature of some incorrect thinking. However, one limitation lies in the fact that DCT is
unable to discriminate whether students have a meaningful understanding of decimals or
are just following expert rules (annexing zeros and then comparing as whole numbers or
comparing decimal digits from left to right). Hence Steinle and Stacey (2002; 2003a)
use the label ‘task expert’, rather than just simply expert. The next section will review
literature on the main areas of difficulties with decimals informed by prior research in
this area.

15
Table 2.1: Ways of thinking and corresponding behaviours adopted from Steinle (2004, p.47-59)
Way of thinking Brief description Fine code
Coarse code
Task expert Indicating either solid understanding of decimals or following of annexe zero algorithm or left-to-right comparison algorithm
A1 A
Money Drawing analogy to money (dollar and cents) or equivalent systems for comparing decimals.
A2
Unclassified A A3 Decimal point ignored
Choosing the longest sequence of digits as the larger number, ignoring the decimal point
Numerator focussed
Concentrating on the number of parts and disregarding the size of the parts, thinking 6.03 and 6.3 are the same because they both contain 6 wholes and 3 more parts.
String length Choosing decimals with longer decimal digits as the larger number
L1
Zero makes small Thinking that decimals with a zero or zeros in the first column(s) after the decimal point is “small”
L2
Column overflow Squashing the place value columns to the left, e.g., noting that 0.70>0.7 because 70 tenths is larger than 7 tenths
Reverse thinking Confusing the decimal place value names with whole number place value names, e.g., identifying 0.35 as 3 tens and 5 hundreds instead of 3 tenths.
L3
Unclassified L L4
L
Denominator focussed
Considering the size of the parts in isolation and ignoring the number of parts, e.g., 0.6>0.75 because tenths is larger than hundredths
Place value number line
Considering place value columns as a pseudo number line
S1
Reciprocal Confusing decimal digits as whole numbers and drawing analogy with reciprocals, e.g., 0.3>0.4 like 1/3>1/4
Negative Associating decimals with negative numbers 0>0.6 like 0>-6
S3
Unclassified S S4
S
Unclassified Not fitting anywhere due to mixed or unknown ideas U1 Misread Misreading the instruction Misrule Applying opposite thinking after following expert rules
such as annexe zero or the left-to-right digit comparison algorithms
U2 U
* whole number thinking = numerator focussed + string length thinking

16
2.2.3 Other main areas of difficulties about decimals
Various areas of difficulties about decimals have been identified, including weak
knowledge of decimal place value, fragmented links between decimals and fractions,
lack of knowledge on density of decimals and confusion about relative position of
decimals on the number line. The following paragraphs will expand on evidence of
difficulties in each of those areas. Moreover, reviews of studies investigating pre-
service teachers’ knowledge and difficulties on decimal numeration will be discussed.
Whereas the misconceptions in Table 2.1 describe the underlying interpretation of
decimals, the studies in this section generally show the consequences of these erroneous
interpretations.
Place value
Weak knowledge of place value interpretation of decimals (A. R. Baturo, 1997;
Carpenter, Corbitt, Kepner, Linquist, & Reys, 1981; Kouba et al., 1988; Lampert, 1989;
Sowder, 1997) is one of the main conceptual problems in decimal numeration. This is
evident in nearly all of the ways of thinking in Table 2.1. Carpenter et al. (1981)
recorded that only 21% of 9 year olds in a USA national study and 79% of 13 year olds
could correctly identify the place value names of a decimal number, 7.94. Their facility
with the reverse task, to match up thirty-seven thousandths with its decimal notation
was much lower with only 3% of 9 year olds and 54% of 13 year olds providing correct
answers.
Both Hiebert (1992) and Kouba et al. (1988) linked lack of sound knowledge on
place value in decimals to difficulties in understanding and operating with decimals.
Similarly, Grossman (1983) observed that performance on calculations involving
decimals was higher than the ability to interpret the meaning of decimals. She noted that
more than 50% in a USA college could perform decimal computation (addition,
subtraction, multiplication) but only less than 30% could select the smallest decimal
from five possibilities which indicated scant knowledge of place value.
In the same vein, Tsao (2005) found from her interview data that performance on
computation algorithms did not imply good number sense. She suggested that over-
reliance on written algorithms might inhibit the development of important aspects of
number sense including flexible interpretation and use of numbers.

17
Baturo (1997) investigated a more specific aspect of place value, focussing on
multiplicative structures in place value of decimals involving 175 Grade 6 students in
Australia. She found that a majority of students showed lack of knowledge of
multiplicativity in decimal place value with only high performance students showing
full knowledge of multiplicative structure.
Similarly, Stacey, Helme, & Steinle (2001) reported evidence of place value
column name confusions wherein “whole number” part of the place value system (tens,
hundreds, etc) placed to the right of “number line” were mirrored to the “decimal” part
of the place value system (tenths, hundredths, etc.). Merging this place value confusion
with the knowledge of the placement of positive and negative numbers on the number
line resulted in students thinking of decimals as negative numbers. The ‘negative
thinking’ of Table 2.1 is an instance of this.
Density of decimals
One of the features distinguishing decimals from whole numbers is the density of
decimals. Hiebert et al., (1991) found improving the continuity aspects of decimals’
density was particularly difficult. Working with problems involving continuous models
in the written tests and the interviews, such as marking a representation of a decimal
number on a number line, or finding a number in between two given decimals such as
0.3 and 0.4 were found to be more challenging than working with discrete-
representation task utilizing MAB models. Analysis for this finding suggested that an
extra step in finding the unit of the continuous models explained the lower performance
on continuous-representation tasks. In Table 2.1, A2 (money thinking) describes
students thinking like this.
Likewise, Merenlouto (2003) found that only a small portion of Finnish students
aged 16-17 years old in her study changed their concept of density. She attributed
difficulties with grasping density to students’ reference to natural numbers and
difficulties in extending their frame of reference to rational or real numbers. Some
students relied on the possibility to add decimals in their explanations for recognizing
density of decimals. Furthermore, she contended that this kind of explanation was based
on an abstraction from natural numbers properties rather than a radical conceptual
change from natural to real numbers.

18
Difficulties with density were also evident in studies involving pre-service
teachers. Menon (2004) found only 59% of 142 pre-service teachers recognized the
density of decimals. A similar trend was noted by Tsao (2005) who found that of 12
pre-service teachers involved in her study, only the six high ability students
demonstrated an understanding of density.
The nature of incorrect responses with regard to the density of decimals is
reflected in common misconceptions drawing on analogies between decimals and whole
numbers. Clearly density will not make sense to students holding misconceptions
identified in Table 2.1 such as money thinking, denominator focussed thinking,
reciprocal thinking, and place value number line thinking.
In general incorrect answers in recognizing the density of decimals could be
classified in two categories. The first category of incorrect answers is identifying no
decimal existing in between pairs of decimals. Fuglestad (1996) found that most
students in her study of Norwegian students claimed there were no decimals in between
two given decimals such as between 3.9 and 4 or between 0.63 and 0.64. Similarly,
Bana, Farrell, and McIntosh (1997) reported that the majority of 12 year olds and 14
year olds from Australia, US, Taiwan and Sweden displayed the same problem. Only
62% of 14 year olds from Australia and 78% of 14 year olds from Taiwan showed
understanding of decimal density. This evidence reflected incorrect extension of whole
number knowledge that there is no whole number in between two consecutive whole
numbers such as 63 and 64. Note that students holding money thinking (allocated to A2
code in Table 2.1) also will have difficulty in grasping the density notion of decimals
and identify no decimals in between decimals such as 0.63 and 0.64. However, these
students might identify 9 decimals in between 0.6 and 0.7 for instance, if they interpret
decimals only as a number system for dollar and cents.
The second category of incorrect answer translates knowledge of multiplicative
relations between subsequent decimal fractions. For instance, Hart (1981) reported that
22 to 39% students age 12 to 15 year-old thought there were 8, 9, or 10 decimals in
between 0.41 and 0.42. Similarly, Tsao (2005) observed the same phenomenon in her
study with pre-service teachers. She found that three pre-service teachers from a low
ability group believed there were nine decimals in between 1.42 and 1.43 by sequencing
only the thousandths: 1.421, 1.422,…, and 1.429. Along with most of the students in L

19
and S groups (see Table 2.1), some students holding A thinking, such as A2 thinking
with reference to metric measures (m, cm, mm) might possibly respond in this way.
Relative and absolute magnitude of decimals
Various studies have underlined the importance of having a sense of relative and
absolute magnitude of decimals, including as shown on the number line (see e.g.,
McIntosh et al., 1992; Thompson & Walker, 1996; Watson, Collis, & Campbell, 1995).
The importance of this knowledge is articulated by Thompson & Walker (1996) as
follows:
For students to understand decimals thoroughly, they need to have an understanding of the relative magnitudes of these numbers. That is, they should have a good idea of where decimal values lies on a number line in relation to other decimals. Furthermore, they need to know how the values of decimals compare to common fractions and whole numbers. They need to know for example, that 0.48 is about ½ and is about halfway between 0 and 1. (p.501)
However, a number of studies (Bana et al., 1997; Kloosterman et al., 2004;
Michaelidou, Gagatsis, & Pitta-Pantazi, 2004; Rittle-Johnson, Siegler, & Alibali, 2001;
Thipkong & Davis, 1991) have documented persistent problems in locating decimal
number on a number line. Kloosterman et al. (2004) reported only 39% of fourth
graders correctly placed a decimal number on the number line (with divisions not 0.1
apart) in consecutive NAEP studies in 1992 and 1996. The result was statistically
improved in year 2000, yet it still indicated weak knowledge as reflected in 48% facility
of correct answers.
Likewise, Bana, Farrell, and McIntosh (1997) found that the task of identifying
decimals on the number line was particularly challenging for 10 year olds. All
performance of students in this age group from Australia, Sweden, and the USA were
below 50%, with the USA students performing particularly poorly at only 20% facility.
In the study by Michaelidou, Gagatsis, & Pitta-Pantazi (2004) involving 120 12
year olds students’ understanding of the concept of decimals in Cyprus, many students
attended to the discrete instead of the continuous aspect of number line as they worked
with decimals on the number line. It was found that “they treated number lines not as a
continuous model…, but as line segments from which they had to select a part” (p.310).
The problem reported in Michaelidou, Gagatsis, & Pitta-Pantazi’s (2004) study

20
confirmed Hiebert et al.’s (1991) finding that working with a continuous representation
model for decimals such as the number line was more difficult, as discussed earlier.
Evidence from these studies has underscored the complexity of decimals in
understanding relative and absolute magnitude of decimals experienced by both children
and adults.
Studies of decimals understanding in teacher education
Fewer studies have been carried out to investigate pre-service teachers’
understanding of decimals compared to similar studies involving children. As pointed
out before, studies have revealed that some of misconceptions observed in children were
also apparent in adults, including pre-service teachers (Menon, 2004; Putt, 1995;
Stacey, Helme, Steinle et al., 2001; Thipkong & Davis, 1991; Tsao, 2005). However,
Steinle’s longitudinal study (2004) showed a different prevalence of misconceptions in
children of different ages and hence it is likely that there will be a different prevalence
for secondary school students and pre-service teachers. This finding implies that the
teaching of decimals in teacher education needs to take into account the different nature
of pre-service teachers’ knowledge and misconceptions on decimals. The misleading
common perception of topics in elementary schools including decimals as “simple”
mathematics and the constraints on formal teachers’ education, such as limited time,
were noted by as Ball (1990) as factors contributing to a decision not to revisit this topic
in many of the U.S. teacher education institutions. It is the author’s view that this
practice is also shared in many teacher education programs in Indonesia and is possibly
relevant in some other countries as well.
Investigating pre-service teachers’ understanding and misconception of decimals
entails assessment of an aspect of knowledge, called “pedagogical content knowledge”
or PCK (Shulman, 1986). In Shulman’s (1986) seminal work, PCK is defined as
composing two aspects, the knowledge of students’ knowledge and understanding, and
knowledge of representations, which are useful for teaching. Knowledge of students’
knowledge, including common difficulties and misconceptions in the topic, allows
teachers to explain the confusions that occur and to assist students to overcome these
problems (Graeber, 1999; Leinhardt, Putnam, Stein, & Baxter, 1991). For instance, in a
decimal topic, Ball and Bass (2000) noticed that students often get confused about the

21
‘oneths’ place. In this case, teachers need to be able to explain that this ‘expectation’
comes from applying the ‘symmetry’ principle around the decimal point, which was also
noted by Stacey, Helme, and Steinle (2001). They contend that “helping a fifth grader to
understand the “missing oneths” requires an intertwining of content and pedagogy, or
pedagogical content knowledge” (p.87). Knowledge of students’ prior conceptions and
misconceptions assist teachers in tailoring their lessons so that the lessons will be more
meaningful for students.
Having a wide repertoire of representations enables teachers to flexibly expand on
mathematical notions and properties in order to make them more comprehensible for
students. Ball and Bass (2000; 2003) relate this knowledge to the importance of the
teacher’s role in “unpacking” mathematical content knowledge to fit a learner’s
perspective and in identifying central ideas in teaching mathematics.
Studies by Thipkong and Davis (1991) and Putt (1995) confirmed the trend
predicted by Steinle and Stacey’s (1998a) study of the changes in prevalence of
misconceptions from years 3 to 10; that shorter-is-larger (S) behaviours would be likely
to continue throughout adulthood. Steinle (2004) found the increasing trends with grade
of students who made very few errors in DCT such as in the A categories of Table 2.1.
Stacey et al.’s (2001) observation of 553 pre-service primary teachers’ content and
pedagogical content knowledge of decimal numeration from Australia and New Zealand
revealed a high incidence of difficulties of comparing decimals with zero (13%).
Similar to Putt’s (1995) finding, this study also found evidence of ‘shorter-is-larger’
(S) misconception (about 3%) among pre-service teachers. However, many pre-service
teachers had little awareness of this misconception even when they held this
misconception. Pre-service teachers were able to identify four surface features that
make the comparison of pairs of decimals difficult for students: ragged or unequal
lengths (long decimals and decimals with unequal lengths), comparison with zero,
presence of zero digits, and similar decimal digits (decimals that differ only in the third
or fourth decimal digits). However, despite having good ability of identifying these
features, pre-service teachers’ explanations for the thinking underlying these difficulties
were less satisfactory. An understanding of why these errors occur is an important part
of PCK.

22
Pre-service teachers’ fragmented knowledge of decimals and fractions was
apparent in Tsao’s (2005) study, when “students considered fractions and decimals as
different entities and they did not necessarily make any connections between them”
(p.661). Yet many of the S thinkers believe that decimals and fractions are similar as
evident in overgeneralising of fractions knowledge to decimals. Resnick et al. (1989)
found that different curriculum sequences in different countries generated different
pattern of misconceptions. In countries where the teaching of fractions precedes the
teaching of decimals such as the U.S.A and Israel, misconceptions resulting from
overgeneralising fraction knowledge to decimals (S thinkers) were dominant. However,
Steinle and Stacey’s Australia data shows that the proportion of S thinkers increased
with age. It will be discussed later whether this study indicate the same trend as in
Indonesia curriculum, where decimals are taught after fractions. This will be discussed
in Chapter 4 and Chapter 5.
This signifies the importance of attending to and resolving the main problematic
areas both in content and pedagogical content knowledge in decimal numeration as
recommended by prior studies (see e.g., Putt, 1995; Stacey, Helme, Steinle et al., 2001).
This study will capitalize on findings on key conceptions in learning decimal notation
and likely areas of weaknesses in decimal numeration informed by prior studies in
designing the activities and written test items. It will also use items derived from these
studies to monitor change. The next section will review different teaching ideas
proposed to improve understanding of decimals.
2.3 Teaching Ideas about Decimals
A number of teaching ideas have been proposed and tested to improve conceptual
understanding of decimal numeration (see e.g., Boufi & Skaftourou, 2002; Brousseau,
1997; Hiebert, 1992; Hunter & Anthony, 2003; K. C. Irwin, 2001; Lachance & Confrey,
2002; Sowder, 1997; Wearne & Hiebert, 1988a, 1988b). Hiebert (1992) expressed the
importance of attending to conceptual understanding by noting “A greater investment of
time would be required to develop meaning for the symbols at the outset and less
emphasis would be placed on immediate computational proficiency” (p. 318). In
making this recommendation, he argued that meaningful interpretation of decimal
notation would enhance performance in computation skills.

23
Whilst researchers agree on the importance of designing instruction to instil a
deeper meaningful understanding of decimals, there have been a variety of approaches
in teaching ideas on decimals in a meaningful way. These studies vary with respect to
prior teaching exposure to decimals of the participants, the place of decimals in the
curriculum sequence, and scope and length of the studies. This review, however, does
not attempt to compare the various teaching ideas about decimals on the basis of the
effectiveness or success rate. Considering the differences in students’ background
knowledge, different lengths and nature of the teaching interventions, it is not sensible
to compare various teaching interventions’ success.
In this discussion, teaching ideas on decimals will be classified into two
categories based on their main emphasis as indicated in their choice of the initial
activities. The first category places heavy emphasis on integrating decimals with other
related concepts such as ratio or rational numbers or percentage (K. C. Irwin, 2001;
Lachance & Confrey, 2002; Moss, 2005; Moss & Case, 1999). The second category
focuses on building meaningful understanding of decimal numeration based on place
value (Bell, Swan, & Taylor, 1981; Helme & Stacey, 2000; Hiebert et al., 1991;
Lampert, 1989). It should be noted that the two camps are not viewed as opposing
camps. Both camps underscore the importance of constructing a meaningful link
between related ideas such as fractions, and decimals, for instance. The following
paragraphs will expand on these ideas and associated findings.
The first camp is characterized by its integration of teaching ideas of decimals
with other related concepts such as ratio and proportion or percent and linear
measurement contexts or to present it in contextual problems. Examples are Hunter and
Anthony (2003), Irwin (2001), Lachance and Confrey (2002), Moss (2005) and Moss
and Case (1999).
The basic argument of this position is grounded on the idea that conceptual
understanding of decimals presupposes strong connections among related constructs.
Furthermore, proponents of this approach observe and criticize the fact that different
models (called referents) are used in teaching decimals, fractions, and percentages
without explicit links among them. Lachance & Confrey (2002) articulated this concern
as follows:

24
The “one referent per mathematical construct” set of activities may be too narrow to allow for “real” conceptual knowledge to emerge. Hence, unless work with concrete referents allows students to develop an understanding of the meaning of mathematical symbols and at the same time, explore the connections between various types of mathematical symbols, such experiences may only lead to rather weak, superficial, and narrow understanding of mathematical constructs. (p.508)
However, within the same camp, there is no unique path in sequencing different
constructs to arrive at conceptual understanding. Moss and Case (1999) devised a
curriculum to introduce rational numbers comprising percentages, fractions, and
decimals to a group of 29 fourth graders (aged 10 to 11) in a Canadian school in 20-25
lessons over 5 months. This program was based on intuitive estimation of ratios and
representation of length (number-ribbon diagrams) to introduce percentages in linear
measurement contexts. One reason for starting the sequence with percentage is to
postpone problems of comparing and manipulating fractions with different
denominators and complex conversion among percents, fractions, and decimals. The
successive halving strategy (used in the context of estimating the fullness of water in
glass beakers) was emphasized to link computations involving percents, fractions and
decimals. The link to decimals was developed by contextual problems of calculating tax
or tips where that could be solved by calculating with multiple of 10% relying on the
knowledge of money (dollar and cents).
In this program, two-place decimals were introduced as notation to represent the
distance between two adjacent whole numbers as percentage, e.g., 5.25 represented a
distance that is 25% of the distance between 5 and 6. The transitional notation called
“double decimal notation” such as 5.25.25 was employed intuitively by children to
represent a number that is located 25% of the distance in between 5.25 and 5.26.
Students were grouped into the experimental curriculum based on intuitive notion of
ratio (16 students) and the control curriculum (based on widely-used Canadian
textbooks) (13 students). In the control curriculum, the sequence started with fractions
followed by one-place decimals and two-place decimals using models such as pie
graphs, number line, and place value charts. The experimental group outperformed the
control group overall and in most areas including decimal notation, density of decimals,
comparing and ordering decimals as well as decimal operations (including conversion
among fractions, decimals and percentages). However, no detail was given on

25
comparison of performance from both groups on decimal components. Furthermore, no
explanation was given on how this teaching approach addressed other properties of
decimals such as density in relation to the transitional notation or “double decimal
notation” for instance. The fact that this program avoids complex fractions and decimals
raises a concern about how to build students’ understanding of more complex decimals.
Hunter and Anthony (2003) adopted Moss and Case’s teaching ideas in New
Zealand over a six-month period and evaluated it using interviews (4 case studies), and
lesson observations with qualitative analysis of the classroom episodes. In line with
Moss and Case’s (1999) study, the initial activities were designed to capitalize on
students’ informal understanding of ratio based on a numerical halving strategy.
Decimal notation was established as a way to record the whole number of metric units
such as metre with part of the unit as percentage (e.g., 3 metres and 47% of a metre was
linked with 3.47).
Misconception in decimals was observed when a student recorded 761 metres and
4 cm as 761.4 instead of 761.04 and noting the extra 4 cm as 40%. In addressing this
problem, the teacher used percentage as a scaffold by comparing 40% and 4% in
relation to 100%. This “dropping back” (p.457) action of going back to the initial
context allowed students to correctly link 0.40 with 40%, and 0.04 with 4%. Yet, in my
opinion, it is not clear whether this approach indeed resolves students’ misconception of
place value in decimals and the interpretation of its magnitude in metric contexts
because the explanations seem to rely on comparison of the corresponding percentages.
Another study within the same camp by Lachance & Confrey (2002) involving a
6-week instruction sequence on decimals was built around three open-ended, contextual
problems grounded on the multiplicative notion called “splitting”. This splitting notion,
evident in actions such as sharing, folding, and magnifying, was introduced by Confrey
in 1994. The first contextual problem explored different notational systems (including
base 2, 4, and 6) before investigating base 10. The second contextual problem, called
the ‘Decimal Olympics’, involved computations (addition and subtraction) using
decimal notation in measurement context (metric rulers) and included discussion on
ways of noting quantities in metric system. The last problem, called the ‘Domino
Problem’, explored issues in computing with decimals using rate and ratio reasoning. In
this study, 20 Grade 5 students (working in 5 small groups during instruction) were

26
assessed on the following areas: (1) meaning of decimal notation, (2) the ordering of
decimals, (3) the conversion from fraction to decimal and vice versa, and (4)
computations with decimals. Interestingly, despite significant improvement on the
written tests (overall facility increased from 35.6% to 80.3%), a majority of students
struggled in working with contextual problems, particularly in making sense of decimal
notation such as 0.7625 in the context of the problem. In my opinion, while contextual
problems allowed rich exploration of decimal notation and computation, the complexity
of the contexts seemed to inhibit the development of meaningful understanding of
decimal notation.
Irwin (1996; 2001) designed an intervention study on decimals for 16 students
(ages 11 and 12) working in pairs on problems in everyday contexts such as decimals in
metric measurement systems and money contexts. Another group of students worked on
similar decimal-fraction problems without context. In each contextual problem, two
hypothetical answers were presented, one answer derived from a misconception and the
other, the correct answer. Concrete models, as illustrated in the contextual problems,
and a calculator were provided during this intervention study. Both groups of students
participated in pre- and post-testing, involving non-contextual problems so as not to
favour students in the intervention group. The main findings of this study suggested that
students who worked on the contextualized problems improved on their knowledge of
decimal fractions more than those on non-contextualized problems. Note that in this
case, decimal fractions are limited to rational decimal numbers with finite lengths.
Furthermore, Irwin justified her choice of using everyday settings as follows:
Problems presented in everyday settings provided the context that students needed for reflection on the scientific concept of decimal fractions… Such problems may have provided the reflection required for expanding their knowledge of decimal fractions. (p. 416)
However, limitations and problematic aspects of using everyday contexts such as
money in interpreting decimals notation were observed and reported. This problem
emerged in conversation between pairs of students on how to solve a conversion rate
problem between New Zealand and Australian dollars (1 NZ$ = 0.9309 AU$). At the
end of the discussion, both students were uncertain whether 0.9309 represented 93.09
cents or 93.09 dollars. The fact that the explanation drew on analogy of another
conversion rate (New Zealand dollar to Indonesian rupiah) instead of on the

27
multiplicative relations on decimals highlighted the problematic aspect of working with
the money context where the understanding of parts of a unit was not necessarily due to
the availability of smaller units.
Whilst other researchers (Thompson & Walker, 1996) take a similar position as
Irwin and Lampert with regard to the relevance of everyday contexts, many researchers
(Brekke, 1996; Brousseau, 1997) have pointed out the problematic aspects of metric
measures and money in teaching decimals. They claimed that the use of metric
measurement or money context in teaching decimals could lead to interpretation of
decimals as pairs of whole numbers as expressed in Brekke’s comment:
When children first experience decimal numbers, usually in connection with money and measurement, they may lead to believe that the decimal point is introduced to separate two units of measurement. From the teaching of fractions they know that the fraction bar is used to split for example a part from a whole. They are also told that there is a relationship between fractions and decimal numbers. It is therefore not a great step further for them to conceive that the decimal point as a separator also. (p.142)
Common practice, such as introducing decimal notation as composed of whole
number parts and decimal parts, might also lead students to think of the decimal point as
a separator of two different units: for example, separating the dollars from the cents or
the metres from the centimetres. Another concerning note from Brekke (1996) is his
observation that this kind of teaching approach has a lasting impact on children and
impedes their proper understanding of decimal place value. He commented, “It seems
that the teaching of decimals as one number which can contain tenths, hundredths,
thousandths, etc of a unit, does not replace this first decimal experience with money and
measurement” (p.2-138). Therefore it would be better to build understanding of decimal
notation based on place value understanding rather than rely on these metric contexts.
Similarly, Stacey & Steinle (1998) found evidence that students who showed over-
reliance on the money context had difficulties in comparing pairs of decimals such as
4.4502 and 4.45:
When the numbers are the same in the same spot I get very confused … Does the number get bigger or smaller with more numbers on the end?...When the number after the decimal point is different the question is easier but when they are the same, I don’t know what rule to apply. (p.60)

28
Reliance on the money context indeed could provide a hindrance to the development of
a robust decimal concept as evident in a case above, because money is a discrete
system, not a continuous one. Students can deduce 4.4502 = 4.45 because they are the
same amount of money.
In the same vein, Basso, Bonotto, and Sorzio (1998) reported a problem of
utilizing the metric system in teaching decimals. Their study showed that in comparing
8.1 and 8.15, one child responded that 8.1 was larger because it was composed of 8 dm
and 1 cm and cm was a larger unit compared to mm. Apparently, the student interpreted
a decimal number as composed of pairs of whole metric units and associated metric
units based on the length of decimal digits, 1-place decimal with cm and 2-place
decimals with mm. Focussing on the size of the parts, in this case comparing cm and
mm in general, led students to conclude that 8.1 was larger than 8.15. This is like the
denominator focussed thinking (S1) of Table 2.1.
Moreover, Brousseau (1997) pointed out that the use of decimals to express
measures of cardinality of finite sets such as population or in the metric measures where
all units of size can be divided by ten, emphasized the discrete nature and hence might
mask the continuous nature of decimals including density.
Under these conditions, decimal numbers retain a discrete order, that of the natural numbers; many students using this definition will have difficulty in imagining a number between 10.849 and 10.850. (p.125)
In summary, teaching ideas which integrate decimals with other constructs often
face problems originating from either the complexity of the contexts or weak knowledge
of other constructs which interfere with the effort to build understanding of decimals
through these constructs. These studies also highlight the limitations and problematic
issues of using contexts such as money and metric systems in teaching decimals.
Therefore taking into account the problematic sides of such contexts informed by prior
studies, my study opted for contexts which explored basic notions of decimals without
links to metric measures. These links must be made at some point, but not necessarily in
these lessons.
Teaching ideas from the other camp (Hiebert, 1992; Hiebert et al., 1991; Stacey,
Helme, Archer et al., 2001; Steinle et al., 2006; Wearne & Hiebert, 1988a) focused on

29
developing meaningful understanding of decimal notation. These teaching ideas shared
the same stand in creating meaningful interpretation of decimal notation as the initial
step in activities in which models played a crucial role as referents. This was based on
the fact that many misconceptions and difficulties reflected scant meaningful
understanding of decimal notation.
The emphasis in creating meaningful understanding of decimal notation is
reflected in Wearne and Hiebert (1988a)’s four stages of developing understanding of
decimal notation, particularly in the first two stages. The last two stages link the first
knowledge of the meaning of decimals with the procedures and rules for operations with
decimals:
(1) creating meaning for notation by connecting them to familiar or meaningful referents; (2) developing symbol manipulation procedures in which “procedures are developed as actions
on referents are extended and reflected unto the symbols”; (3) elaborating (means extending syntactic procedures to other appropriate contexts) and
routinizing procedures (memorizing and practicing rules until they become automatic and can be executed with little cognitive conflict;
(4) using symbols and rules (in a familiar system) as referents (in constructing more abstract system). (p. 372-3)
Wearne and Hiebert (1988a) argued that building on the first two stages, called
“semantic processes”, will lead to a better transfer and understanding of links between
fractions and decimals, and decimal magnitude including ordering decimals. In the first
stage of creating the meaning for decimal notation, Dienes base 10 blocks (referred to as
MAB later in this thesis) were employed as a referent (see e.g., Hiebert et al., 1991;
Wearne & Hiebert, 1988a). However, Hiebert et al. (1991) were aware of the fact that
MAB models attended more to the discrete nature of decimals. Hence, a number line
was utilized to address the continuous nature of decimals such as density.
The MAB model has been widely used for teaching whole number place value and
operations as well as decimals. English and Halford (1995) pointed out that prior use of
MAB for teaching whole numbers added an extra cognitive load when MAB model was
utilized for teaching decimals. The Stacey, Helme, Archer, and Condon (2001) study
confirmed this prediction and an alternative model called Linear Arithmetic Blocks
(LAB) was proposed for teaching decimals.
In contrast to MAB, which is a volume-based model, LAB represents decimals by
the quantity of length (not metric length such as metres and centimetres). It consists of

30
long pipes that represent a unit and shorter pieces that represent tenths, hundredths, and
thousandths in proportion. Pieces can be placed together to create a length modelling a
decimal number and can be grouped or decomposed (for example to show 0.36 as 3
tenths + 6 hundredths or as 36 hundredths).
In line with Hiebert et al.’s (1991) and Wearne and Hiebert’s (1988b) stance on
the importance of building a meaningful interpretation of decimal notation, some
educators proposed teaching ideas which started with explorations of base ten structures
of decimals using the LAB model (see e.g., Helme & Stacey, 2000; Steinle et al., 2006).
Similar to Hiebert et al. (1991), they also recommended a number line for teaching
decimals, particularly in incorporating discussion of various sets of numbers such as
whole numbers, common fractions, negative numbers and decimals. The role of a game
such as the ‘Number Between’ game in addressing density notion of decimals has been
pointed out by Tromp (1999). The LAB model leads easily to the number line.
Stacey, Helme, Archer, and Condon’s (2001) study demonstrated that LAB was a
more effective model than MAB for teaching decimals because the model relied on
length, a cognitively simpler quantity than volume. It also highlighted the superiority of
LAB to model density of decimals and to demonstrate the principle of rounding (due to
its linear nature). Neither LAB nor MAB model positional place value due to the fixed
value of the pieces. However, MAB demonstrates multiplication by a power of ten
better than LAB. In this study, students found the LAB model more acceptable and
accessible for three reasons:
(1) the newness of LAB in contrast to the prior use of MAB for whole numbers; (2) the simplicity of LAB as a length-based model in contrast to MAB as a
volume-based model (3) the complexity caused from switching various MAB components such as
mini, long, flat, block/cube with their associated apparent dimensions of 0, 1, 2, and 3 respectively.
Based on these observations, Helme and Stacey (2000) and Steinle (2004b)
recommended LAB as a starting model in teaching decimals instead of MAB.
Review of the literature in Section 2.2 has established the need to address decimal
misconceptions in teacher education. Yet most of the proposed teaching ideas were
targeted at the primary school level. Studies on teaching ideas to improve pre-service

31
teachers’ knowledge and teaching ideas on decimals are needed particularly concerning
pedagogical knowledge pertinent to pre-service teachers. Moreover, the fact that pre-
service teachers already have knowledge on decimals, which might be fragmented or
incomplete in their training requires a different approach than teaching decimals to
primary students who are learning decimals in school for the first time.
This study will try to fill in this gap by capitalizing on ideas from different sources
to fit with the target audience in teacher education. This is in line with the process of
devising local instruction theory using design research methodology (Gravemeijer,
1998, 2004), which will be discussed in Chapter 3. This study will follow this line of
thought by employing LAB in the initial activities. The linear nature of LAB fits with
the didactical analysis of the context problems presented in the starting activity which
will be explicated in Chapter 3. More symbolic models such as number line and number
expander (a symbolic model which show various expansion of a decimal number in
different place value terms) will also be employed.
2.4 RME basic tenets and teaching ideas on decimals
Considering the current reform effort to improve mathematics education in
Indonesia by adapting Realistic Mathematics Education (RME) theory, this section will
discuss in more detail the RME basic tenets and teaching ideas grounded on RME
theory.
The basic tenets of RME refer to guided reinvention, didactic phenomenology, and
mediating model principles. All these tenets are inspired by Freudenthal’s (1973; 1983;
1991) foundational principle of ‘mathematics as a human activity’. This notion places a
heavy emphasis on students constructing their own knowledge with the guidance of
teachers in the learning experience of mathematics.
In addition to the three basic tenets of RME, five basic principles of instructional
design (Treffers, 1987) will be reviewed briefly. Treffers (1987) articulated these five
basic principles which guide both how learning is constructed and principles for
teaching that support learning process in RME lessons.

32
2.4.1 The basic tenets of RME
Each of the RME basic tenets will be reviewed and teaching ideas on decimals
consonant with the RME basic tenets will be discussed.
Guided reinvention
The guided reinvention principle is advocated by Freudenthal in response to
teaching ‘mathematics as a ready-made system’, where the end results of the work of
mathematicians are taken as the starting points of mathematics education (Gravemeijer
& Doorman, 1999). Freudenthal (1973; 1991) contends that mathematics should be
undertaken as an activity for students to experience mathematics as a meaningful
subject and to better understand mathematics. In his opinion, mathematics should not be
presented as ready made.
The guided reinvention principle places importance on mathematics as a process
in which students experience learning mathematics in activities guided by the teachers
or their peers. The idea is “to allow the learner to come to regard the knowledge they
acquire as their own private knowledge, knowledge for which they themselves are
responsible” (Gravemeijer & Doorman, 1999, p. 116). The inspiration for the
reinvention route could be grounded on the history of mathematics or students’
spontaneous solution strategies. For instance, Freudenthal (1983) observed that in the
approach to decimal notation by Simon Stevin (1585), decimals was closely connected
to a decimal system of measure. This may provide a starting point for teaching about
decimals. However, as Gravemeijer (1998) pointed out it might not be sensible to
expect the reinvention of decimal notation since this would involve a lengthy and
complex process.
In teaching ideas on decimals developed based on RME tenets (see e.g.,
Gravemeijer, 1998; Keijzer, van Galen, & Oosterwall, 2004), the guided reinvention
tenet was translated into reinventing the salient base-ten positional system in decimal
notation. Both Gravemeijer (1998) and Keijzer et. al (2004) followed this idea by
choosing the context of refining measurement units to measure quantities more
precisely as the initial point of departure of reinvention route. For instance, Keijzer et
al. (2004) employed a problem of measuring with a rope of a certain unit where
repeated partitioning was explored in the context of refining the measurement.

33
However, it was found that repeated halving (repeated partitioning into 2 equal parts)
was more natural to students than repeated refinement into ten equal parts (called
‘decimating’).
The present author has observed the same phenomenon with teacher education
students and trainee nurses, which will be discussed in Chapter 4 and 5. The novel issue
of how guided reinvention tenet could be interpreted in teacher education level will be
explored in Chapter 6 and 7.
Didactical phenomenology
The didactical phenomenology principle concerns finding problem situations that
allows generalizations and provides a basis for linking solutions to concepts or
properties in mathematics. The choice for the initial contexts is not restricted to real-
world situations; even the world of mathematics and fairy tales, can serve as a ‘real
context’ when these are understandable by students (see e.g.,Treffers, 1987; van den
Heuvel-Panhuizen, 2001). Gravemeijer (1994a) expounded on this tenet as follows:
Didactical phenomenology points to applications as a possible source. Following on the idea that mathematics developed as increasing mathematization of what were originally solutions to practical problems, it may be concluded that the starting points for the re-invention process can be found in current applications. The developer should therefore analyse application situations with an eye to their didactic use in the reinvention process. (p. 179)
Freudenthal (1983) observed that a possible source of applications for common
and decimal fractions involves problems of measuring an object where there exists a
remainder but a greater precision and a more systematic procedure is required. Based on
this analysis he contends that “length is one of the concepts by which common and
decimal fractions can operationally be introduced” (p.26). This idea is followed by both
Treffers (1987) and Streefland (1991) who suggested measuring with remainders, which
elicit refinement of a given measuring unit as one way of introducing decimals in
relation to common fractions. In similar vein, Streefland (1991) and Gravemeijer (1998)
proposed the use of metric measurement as potential contexts of the repeated
decimating strategy. Moreover, Gravemeijer (1998) included money as another

34
potential context for decimals although you do not want to get smaller and smaller
amounts.
Teaching decimals from the money context will not find relevant applications in
the Indonesian context because the currency system in Indonesia reflects only the whole
number system and does not recognize units smaller than one, such as cents which
represent one hundredth of a dollar. As discussed in Section 2.2, prior studies (Brekke,
1996; Brousseau, 1997) have voiced concerns about the use of money for teaching
decimals. Brekke (1996) found that use of money context in teaching decimals,
particularly in primary school, might inhibit students from developing a deep
understanding of the decimal concept:
Teachers regularly claim that their pupils manage to solve arithmetic problems involving decimals correctly if money is introduced as a context to such problems. Thus they fail to see that the children do not understand decimal number in such cases, but rather that such understanding is not needed; it is possible to continue to work as if the numbers are whole … It is doubtful whether a continued reference to money will be helpful, when it comes to developing understanding of decimal numbers; on the contrary, this can be a hindrance to the development of a robust decimal concept. (p. 138)
Hence, the idea of repeated refinement into 10 smaller units might be best pursued
outside linear metric measure contexts. The didactical phenomenology is of great
significance in generating problem structures for instruction, but evaluation remains
essential at this stage. This will be discussed further in the design of activities in Section
3.3.
Mediating model
According to RME theory, models are not limited to concrete models but also
include situational models (such as fairy tales stories that serve the purpose of
illustrating mathematical principles) or mathematical relations (see e.g., Gravemeijer,
1994a, 1998; van den Heuvel-Panhuizen, 2001; 2003). Models are first linked with the
contextual problems and then, by gradually by solving similar problems, students will
be led to more formal mathematics. Ideally, models in RME emerge from students’ own
activities and then gradually serve as a catalyst for a growth process to more formal
knowledge (Gravemeijer, 1998). Gravemeijer noted that it is not always possible to
have students re-invent models on their own. Sometimes, models are given to students

35
but in that case, these models should support the transition of students’ thinking of more
formal mathematics.
Gravemeijer (1997; 1998) linked the transitions of models with the four levels of
how reinvention process was structured:
i. a situation level, where domain-specific, situational knowledge and strategies are used within the context of situation;
ii. a referential level, where models and strategies refer to the situation described in the problem;
iii. a general level, where a mathematical focus on strategies dominates over the reference to the context;
iv. a formal mathematics level, where one works with conventional procedures and notations. (p. 286-287)
The following figure depicts how the concept of models relates to different levels
of activities in RME:
Figure 2.3: Levels of models in RME (derived from Gravemeijer, 1998, p. 286)
In RME approach, the starting point should be connected to the knowledge of
students, through what is called the situational activity. As discussed above, the context
of measurement, which relates to how decimals are used in daily life, served as a
situation level in RME teaching ideas.
Gravemeijer (1998) points out that the number line is an important model in RME
for teaching decimals because it allows the shifts from informal to more formal
mathematical activity. At the situational level, he argued that the use of a ‘simple ruler’
(without refined units of tenths markings) offered alternatives of refinement such as
halving or refinement by ten. A more precise ruler with fixed refined units was used on
the next level.
This study will try to accommodate the basic tenets of RME in the design of the
activities, as will be discussed further in Section 3.3. The following few paragraphs will
review some teaching ideas on rational numbers which included discussion of teaching
ideas on decimals. The purpose of this review is to gain more ideas about the
General
Formal
model of
model for
Referential
Situational

36
interpretation of teaching ideas consonant with RME, which will be helpful in design
and refection of activities in this study.
Boufi and Skaftourou (2002) adopted teaching ideas from a unit “Measure for
Measure” of the Mathematics in Context (Encyclopaedia Britannica Educational Corp.,
1998) for teaching decimals to a fifth-grade classroom in Athens. Decimals in this study
were introduced in the context of measuring the turn of the wheel. Interestingly it was
reported that repeated halving was easily invented by students but not repeated division
by ten. This trend was also similar to findings reported in other studies discussed above
(see e.g., Keijzer et al., 2004). The teacher in this study announced the wheel was
repeatedly divided by ten and students accepted this as an efficient way to measure
more accurately the result of the measurement. The exploration of decimal relations in
the problem of measuring the turn of the wheel was extended to a problem of exploring
subunits’ relationships on the metre stick.
Following Gravemeijer (1998), this study capitalized on the use of the double
number line, integrating two units of metric measures such as metre and centimetre on
the number line in the next sequence. In this study, Boufi and Skaftourou observed a
phenomena indicating reliance on numerical patterns instead of reasoning with repeated
decimating on the number line. They pointed out the need for children “to reflect on
their decimating activity in connection with decimals numbers” to advance their
understanding of place value, otherwise students’ understandings of place value “remain
instrumental” (p.157).
Hadi (2007) devised learning materials focussing on fractions which integrated
lessons on decimals and percentage, grounded on RME theory for Indonesian primary
school children. In these learning materials, a fair sharing context of dividing cakes
serves as an initial activity to develop a sense of magnitude of fractions. The context
problem of measuring length was utilized to explore repeated halving and then was
followed by exploring repeated division into 10 in the context of measuring a turn of a
wheel. One-place decimals was introduced in relation to the corresponding decimal
fraction, such as 1 0.110
= , 2 0.210
= , etc and two-place decimals were linked to percentage.
This study reported positive reactions to the lessons in the two trials of the activities as
documented on students’ questionnaires. The use of real contexts in a fair-sharing
problem, models and interactivity depicted some characteristics of RME lessons.

37
However, no explicit report was given on the impact of the activities on students’
knowledge on the constructs addressed in the activities including decimals.
The review of teaching ideas on decimals consonant with RME tenets signified the
importance of attending to repeated base ten partitioning in decimal notation. This idea
will be adapted in the design of the starting contextual problem in this study. In addition
to attending to basic tenets of RME discussed in Section 2.4.1, implementing activities
in the classroom context is guided by RME learning and teaching principles which will
be addressed in the following section.
2.4.2 RME Learning and Teaching principles
In addition to the three basic tenets of RME, Treffers (1987) articulated five
principles for teaching and learning as follows:
1. Phenomenological exploration in which the concrete context and real phenomena
are explored as starting points and applications. 2. Bridging by vertical instruments using models or concrete situations to bridge the
gap between the informal and formal levels 3. Student contribution, emphasizing active role of students in constructing their own
knowledge; 4. Interactivity, placing importance on explicit negotiation, intervention, discussion,
cooperation, and evaluation as means of progressing from informal to more formal knowledge
5. Intertwining, incorporating applications and dealing with learning strands in a problem solving.
The first principle relates to the Didactical Phenomenology tenet and the Guided
Reinvention tenet, whereas the second and the fifth principles relate to the Mediating
Model tenet. The third and the fourth principles reflect the pedagogy characteristics of
RME lessons.
Treffers (1987) particularly emphasizes the importance of the third principle, i.e.,
the pupil’s own contribution to the learning process with the interactive instruction
principle serves as a catalyst for the learning process to occur in the classroom
situations. He noted that “in realistic programs and textbooks, instruction is didactically
organised in such a way that interaction and cooperation between the pupils and with
the teacher are coexistent with individual work” (p.261). The two pedagogical
principles (principle 3 and 4) are in line with the widely growing vision of classroom in
reform movements around the world. The vision underlying many of the reform

38
movements in Western countries view learning mathematics as a process of
constructing and negotiating meaning where students actively engage in the learning
process as a community (see e.g., Kilpatrick, Swafford, & Findell, 2001; Victorian
Department of Education and Early Childhood Development, 2007).
In line with the current reform effort in mathematics education in Indonesia, this
study tries to establish this classroom culture by encouraging students to engage and
contribute in discussion and negotiation throughout the activities.
2.5 Concluding Remark
It is well established, based on the reviews of past and current studies, that
teaching and learning decimals is a complex topic for both children and adults.
Improving pre-service teachers’ content and pedagogical content knowledge on decimal
numeration in their training is expected to assist in breaking the cycle of misconceptions
on decimals. The main areas of concern as reviewed in Section 2.2 need to be
addressed.
However, to date, insufficient studies have attended to design instruction to
improve understanding of decimals and PCK for teaching decimals in teacher education
context. Hence there is a gap in studies that are aimed to improve decimal
understanding in primary or secondary schools and in teacher education. This study will
try to fill in the gap, as will be explicated in Chapter 3, 4, and 5.
Consistent with the current reform in Indonesian to adapt RME principles in
mathematics pedagogy, teaching ideas consistent with RME tenets are of particular
interest in this study. The challenges that arise in designing curriculum and teaching
materials that are consistent with RME tenets and that fits Indonesian contexts is an
issue that needs work (Hadi, 2007; Zulkardi & Ilma, 2007; Zulkardi, Nieveen, van den
Akker, & de Lange, 2002).
Moreover, the key role of teacher education in dissemination of PMRI (see
Section 1.1) in Indonesia has been articulated (Hadi, 2002; Sembiring, 2007; Zulkardi &
Ilma, 2007). This again underscores the importance of preparing the set of activities for
pre-service teachers to revisit and to improve their content and pedagogical ideas on
decimals. The elaboration of this idea will be discussed in Chapter 3.

39
CHAPTER 3 METHODOLOGY
3.1 Introduction
This chapter contains a description of the methods to address the research questions and
provides details of the procedures for analysing and interpreting data in this study.
Section 3.2 contains a general overview of design research methodology and its iterative
cyclic phases of design, teaching experiment and retrospective analysis. Section 3.3
presents a summary of main activities involved in cycles and phases of the design
research in this study. In Section 3.4, the instruments utilized in this study including the
framework for analysing the data obtained from the instruments will be explicated.
Section 3.5 will discuss the methodological concern about the validity and reliability in
design research. Finally Section 3.6 concludes with an overview of data sources and
their relations to the research questions and the goals of this study.
3.2 Overview of Design Research
Design research (Cobb, Stephan, McClain, & Gravemeijer, 2001; Edelson, 2002;
Gravemeijer, 2004; Kelly, 2003; Research Advisory Committee, 1996) is considered as
an emerging paradigm which aims to develop sequences of activities and to grasp an
empirically grounded understanding of how learning works. Other terms such as
“design experiments” (Cobb, Confrey, diSessa, Lehrer, & Schauble, 2003; Wood &
Berry, 2003) or “developmental research” (Gravemeijer, 1994b, 1998; van den Akker,
1999) have been used to refer to design research methodology. Despite different terms
and interpretations in describing design research, the iterative cyclic character of design
research and its role in developing domain specific theories are the shared key
characteristics of the design research.
In design research, the process starts with an anticipatory thought experiment by
the researcher to formulate a hypothesis about how activities will be employed to
promote the identified goals. In constructing a provisional design, the researcher adopts
ideas from different sources available from previous studies, in this case in teaching and

40
learning decimals, and makes them fit the purpose of the study. Identifying the central
idea of the study in design research is accomplished by drawing on and synthesizing
prior literature (Cobb et al., 2003; Gravemeijer, 1998). Gravemeijer (1994b; 1998;
2004) referred to this approach as ‘theory-guided bricolage’.
Moreover, Edelson (2002) points out that the process of adopting ideas is
informed by knowledge of gaps in current understanding of the area. The hypothesis is
then tested, elaborated and refined during and after a series of deliberations on, and
trials of, the activities in the classrooms. The knowledge formed is then used to
construct a recommended sequence of activities. Edelson (2002) articulated the cyclic
processes involved in design research as follows:
In this theory development approach, the design researchers begin with a set of hypotheses and principles that they use to guide the design process…. design researchers proceed through iterative cycles of design and implementation, using each implementation as an opportunity to collect data to inform subsequent design. Through a parallel and retrospective process of reflection upon the design and its outcomes, the design researchers elaborate upon their initial hypotheses and principles, refining, adding, and discarding-gradually knitting together a coherent theory that reflects their understanding of the design experience. (p.106)
Gravemeijer (1994b; 2004) contends that the process of cyclic alternation between
thought and practical experiments can be considered as the concrete sediments of a local
instruction theory. Cyclic alternation between thought experiment and teaching
experiment in design research contribute to the strength of design research, i.e. “the
explanatory power” and “their grounding in specific experiences” (Edelson, 2002, p.
118).
The next section will expand on design research in this study by articulating the
process involved in various cycles and phases of the design research in this study.
3.3 Design Research in this study
The design research in this study adheres to Gravemeijer’s account (2004)
whereby a set of instructional activities for decimals is devised through a cycle of
design, teaching experiment, and retrospective analyses. The starting point for devising
the instructional activities is taken from the likely existing knowledge of the students

41
and by hypothesizing their learning trajectories at the design phase. At this phase, the
learning goals are determined and the set of planned activities are devised to achieve the
learning goals. Following that, a conjectured learning path of how students’
understanding will evolve from their prior knowledge in working with the activities is
developed. This process constitutes a conjectured Local Instruction Theory or LIT
(Gravemeijer, 1998, 2004).
There are two main reasons for choosing design research methodology in this
study. Firstly, there is, as yet, no existing elaborated theory of teaching and learning
decimals available for pre-service teachers in the Indonesian context. Hence, design
research suits the purpose of developing a prototype for local instruction theory on
decimal topic in teacher education level grounded in Indonesian context. Secondly,
design research enables the researcher to study the learning process of participants and
to find the extent to which activities impact on pre-service teachers’ understanding of
decimal notation, which was consistent with the aim of this study.
The justification of design research involves not only in selecting methods of data
collection but also in the structure of reporting the findings from both cycles as will be
explicated in Chapter 4 and Chapter 5. The rationale for determining goals of the
activities, choosing the test items and selecting parts of empirical data to focus on the
analysis will be made available along the way.
3.3.1 Cycles of design research
The main study was carried out in two cycles with each cycle consisting of three
phases. One cycle here refers to a complete process of the design, implementation of the
design in the teaching experiment, and reflection of the design and its implementation in
the retrospective analysis phase as illustrated in Figure 3.1.
There are two reasons for having only two cycles in this study. Firstly, the
researcher’s restricted time (i.e., approximately three years) and resources limited the
number of cycles. Secondly, the courses that embedded activities of decimal topic were
only offered once a year. Whilst more cycles may be desirable, testing and refining the
activities and its sequence with pre-service teachers from two different programs across

42
two cycles with multiple classes provided a considerable insight into the learning of
decimals. The adequacy of two cycles will be assessed in Chapter 6.
The first cycle was carried out in 2005 involving three participating classes
(N=118), with the second cycle in 2006 involving four classes (N=140) of the next
cohorts of Sanata Dharma University pre-service teachers. The first cycle implemented
activities and subsequent retrospective analysis provided a recommendation for the
improvement of the activities in the second cycle. The second cycle implemented and
tested the refined activities developed in the first cycle. Findings from the analysis of
data from the second cycle provided the final recommendation of this study.
An overview of the phases involved in the design research of this study is
presented in Figure 3.1. Note that the 1 and 2 referred to the cycle. The letters a and b
refer to the two separate cohorts of pre-service teachers involved in each cycle: a for the
primary cohort and b for the secondary cohort.
Figure 3.1: Cycles and Phases of Design Research
In cycle 1, teaching experiment with the pre-service primary was carried out
earlier than the secondary cohort due to the time arrangement with volunteer lecturers.
The dotted arrow from Teaching Experiment 1a to Teaching Experiment 1b signified
feedback from Teaching Experiment 1a that was accommodated in Teaching
LIT for Decimals
CYCLE 2
Design Phase 1
Teaching Experiment 1a
Teaching Experiment 1b
Retrospective Analysis 1a
RetrospectiveAnalysis 1b
Design Phase 2
Teaching Experiment 2b
Teaching Experiment 2a
Retrospective Analysis 2b
RetrospectiveAnalysis 2a
CYCLE 1

43
Experiment 1b. Similarly, data from retrospective analysis 1a pertinent to the pre-
service secondary cohort were fed into retrospective analysis 1b.
In contrast, time arrangement with the lecturer in charge of the three primary
cohort classes in cycle 2 did not allow for the same arrangement to take place. Teaching
experiments in the secondary cohort started first and consequently adjustments coming
from teaching experiments from the secondary cohort were fed immediately to the
primary cohort. This will be discussed further in Chapter 5.
3.3.2 Phases of design research
This section presents summary of key things involved in each phase of design research
in this study.
Design phase:
The main purposes of design phase are to develop a sequence of activities on
decimals and to design tools for evaluating the learning processes of pre-service
teachers. The first stage in devising the activities comprised determining the goals of the
activities, selecting the activities and conjecturing pre-service teachers’ learning
pathways in achieving those goals.
The goals for the activities, as mentioned in Chapter 1, were determined based on
analysis of the teaching approach on decimals addressed in commercial Indonesian
primary mathematics textbooks. Details of the analysis carried out in cycle 1 will be
presented in Section 4.2. Key areas on teaching and learning of decimals which have
been identified in prior studies (see Chapter 2) served to identify the likely gaps in
knowledge that need to be addressed in the activities. The activities in this study also
aimed to improve pre-service teachers’ pedagogical ideas on decimals. Accommodating
the basic tenets of RME in the design of the activities was another important feature of
this phase and was principally carried out by review of literature and published RME
materials. The details of the process involved in the design phase in each cycle will be
elaborated later in Section 4.2 and Section 5.2.
Table 3.1 presents the links among general learning goals, ways of evaluating the
achievement of these goals and corresponding items in the written tests, which will be
discussed in Section 3.4.

44
Table 3.1: Links among areas in learning goals, measure of achievement and corresponding items
Areas in learning goals Measure Part of written test
Item no or group of items*
Comparing pairs of decimals A DCT3a Meaningful interpretation of decimals Decomposing and unitising decimals into
place value terms B 2a,b,c,d,
3a, b
Explicit knowledge of place value
Identifying place value names of a decimal digit
B 1a,b,c,d
Knowledge on density of decimals
Identifying number of decimals in between two given decimals
B 5, 6
Ordering and sequencing decimals B 3, 4
Placing decimals on the number line B 7, 8, 9
Knowledge on relative magnitude of decimals and links among decimals, common fractions, and whole numbers
Finding closest decimals to a given decimal number
B 10, 11
Interpretation of decimals and operation involving decimals in various contexts
Solving word problems involving decimals B 12, 13, 14, 15, 16
Knowledge of teaching ideas and representations for teaching decimals
Exploring teaching ideas to compare decimals, to diagnose decimal misconceptions, to divide decimals by 100, and to link common fractions and decimals
C 17, 18, 19, 20
*based on cycle 1 list of written test items
Teaching ideas from various studies (see e.g., Condon & Archer, 1999;
Gravemeijer, 1998; Steinle et al., 2002) were adapted to fit the Indonesian context and
the basic tenets of RME comprising guided reinvention, didactical phenomenology, and
mediating model tenets. Connections to Indonesian contexts and incorporation of
concrete models in learning decimal notation were evaluated in relation to their
potential to assist pre-service teachers in revisiting and reconstructing both their
understanding in various content areas of decimals as well as their pedagogical ideas.
The design phase is also concerned with the choice or development of instruments
such as written tests and interview items to measure the impact of the activities. These
instruments were designed to enable the identification of changes related to the goals of
the program. Details on adoption or development of these instruments will be addressed
in Section 3.4.
As part of the design phase, prior to each cycle in the main study, volunteer pre-
service teachers at the University of Melbourne and Sanata Dharma University trialled

45
the written tests and the activities. The volunteer pre-service teachers were approached
by their lecturers. Group discussions during the trial of the activities were audio-
recorded or video-recorded and the completed learning worksheets were collected.
Outcomes from the trial of activities were used to refine the activities prior to their use
in the main classrooms where the data collection took place.
Teaching experiment phase:
The term ‘teaching experiment’ does not refer to a formal experiment and control
group design. In this study, the teaching experiment phase encompasses all activities
involving direct interactions with the participants as can be observed in Figure 3.1. In
this phase, the designed activities were implemented and the extent to which these
activities improve pre-service teachers’ content and pedagogical content knowledge was
observed and reported. Moreover, factors contributing to the success or lack of success
of the activities were investigated. Details of the activities devised in each cycle and
report of the enactment, analysis, and interpretation of the outcomes will be elaborated
in Section 4.5 and 5.3.
The teaching experiment phase in both cycles involved two cohorts of pre-service
teachers, i.e., the primary and the secondary cohort. Different traits of these two groups
were seen to provide opportunities for the researcher to test and see how the activities
work with different target audiences. Furthermore, this added to the depths of the data in
the study and reduced the effect of limited sampling as will be discussed further in
Section 3.3.
Observations prior to the enactment of the activities were conducted in 2 to 3
meetings in every participating class to allow pre-service teachers to get familiar with
modes of learning and with the observation protocols (video-recording of group works).
These observations focused on the interactions and the exchange of ideas during group
works and served the purpose of selecting video-recorded groups (1 group in each
class). The criteria in selecting video-recorded groups was based on practical
considerations such as consent to be video-recorded, adequate communication skills of
group members, and high engagement level in group activities and discussion.
Group work was chosen as the dominant mode of delivering the activities during
the teaching experiment phase. Pre-service teachers worked together in groups of 4 to 6

46
of their own choice in discussing and solving problems presented in the activities. The
choice of group work was consistent with RME instructional principle of students’
contribution and interactivity discussed in Section 2.4.2. This mode of learning was a
new experience for many of Indonesian pre-service teachers. Lecturers assigned for the
course carried out the activities during their regular classes. The lecturers’ role in this
study is more as a facilitator for delivering activities and leading group presentations
and discussions. This mode of delivering activities is consistent with Freudenthal’s
notion of guided reinvention, which encourages active participation of pre-service
teachers in constructing meanings for themselves. This way, pre-service teachers were
expected to explore more ideas and get firsthand experience of new methodologies for
their future career. The role of lecturer and researcher will be explained in Section 3.3.2.
Information about pre-service teachers’ current state content knowledge (CK) and
pedagogical representation knowledge (PCK) was obtained by administering one-hour
pre-test (see Appendix B1 for cycle 1 or Appendix B5 for cycle 2) and by conducting
interviews (see Appendix B3 for cycle 1 or Appendix B7 for cycle 2) with
approximately 5 pre-service teachers from each class and Post-tests (see Appendix B2
for cycle 1 or Appendix B4 for cycle 2) intended to be carefully matched but non-
identical items to pre-test were administered following the completion of the activities
to observe the impact of designed activities on pre-service teachers’ CK and PCK on
decimals. A post-course interview (see Appendix B4 for cycle 1 or Appendix B8 for
cycle 2) was conducted with after the post-test to gain in depth insights about the impact
of activities towards their CK and PCK and to elicit information about the thinking
involved in incorrect responses in the written test responses. In this respect, the
interview items were guided mainly by explanations for certain pattern of incorrect
responses. All interviews were audio-recorded or video-recorded and were transcribed.
Selected parts of the interviews were analysed based on their relevance in answering the
research questions, and in improving subsequent activities. Discussions about the
components in the written tests and interview items will be addressed in Section 3.4.
Retrospective analysis phase
The retrospective analysis phase was carried out once the teaching experiment was
completed. The retrospective analysis phase (see Figure 3.1) comprised data analysis,

47
reflections, interpretation of findings, and formulation of recommendations for the next
cycle as illustrated in Figure 3.1. The aims of the retrospective analysis phase are to
evaluate the success of the enacted activities, to observe the learning progress of pre-
service teachers and to inform the improvement of the activities for the next cycle.
The retrospective analysis phase involved elaborating data from various sources
and looking for trends from various data. Observation of video-recorded group and
whole class discussions, which provide insights into learning process in working with
the activities, complemented the analysis of group worksheets. These observations and
group worksheets were analysed against the initial goals and expectations set in the
design phase. Success and lack of success in the enactment of the activities were
reported. Factors contributing to success or lack of success were gathered by analysing
the discourse during group work, or derived from researcher’s observation notes in
observing discourse among various groups. Analysis of activities also aimed at
identifying problems and gaps found in the design of activities and its enactment during
the teaching experiment and accounting for these problems and gaps.
Likewise, responses to the written tests guide the interview questions as interviews
also aim to gain in depth insights on pre-service teachers’ thinking in solving the written
tests. Comparing results of pre- and post-tests as well as pre- and post- interviews (when
applicable) provided information about evolutions of pre-service teachers’ content and
pedagogical representation knowledge and aspects of the learning that were successful
or less successful. Selected segments from audio/video recording of observations and
interviews were transcribed and analysed based on their relevance to the research
questions and contributions to the improvement of activities and written tests or
interview items. Space and time limitations preclude the presentation of all this data in
this thesis: some representative and some particularly insightful comments are given
throughout.
Findings pertinent to research questions were triangulated using the whole data set
to check for any inconsistency or deviant cases using constant comparative method
(Strauss, 1987; Strauss & Corbin, 1990). When differences existed between
expectations and findings, then explanations or interpretations of the causes were
sought. The findings were then summarized and illustrated by prototypical examples in
Section 4.5 and Section 5.3. Based on analysis and reflections on the findings, ideas to

48
improve activities and instruments used in the next design phase were devised. In this
study, the improvement of content knowledge and pedagogical content knowledge was
the criterion for optimization from retrospective analysis of cycle 1 to design phase of
cycle 2.
Refinement on research instruments were carried out based on analysis of the
findings in cycle 1. As this study involved only two cycles, the result of the
retrospective analysis of the second cycle served to give a final recommendation from
this study. A detailed explanation of the analysis and discussions of findings from each
cycle will be addressed in Chapter 4 and 5. An overview of findings from the two cycles
will be addressed in Chapter 6.
3.3.3 Conduct of the teaching experiments
The main data collections for this study were carried out in Sanata Dharma
University, Yogyakarta, Indonesia, the normal employment place of the researcher. This
convenient purposive sampling was chosen based on two considerations. First, Sanata
Dharma University is one of the higher education institutions that have been involved in
developing PMRI in Indonesia since the early stage. The lecturers volunteered in this
study were affiliated to PMRI development team which implied they had certain degree
of familiarity with the basic tenets of RME. This was an important aspect as the
activities designed in this study tried to accommodate the RME basic tenets. Second, the
lecturers in this institution were willing to fit the activities designed by the researcher
into their lessons with their pre-service teachers. The willingness of lecturers to carry
out these activities was a critical factor in determining the selection of the institution.
Ethics approval was obtained from the institution and consent from both pre-service
teachers and lecturers were sought prior to the teaching experiment.
The pre-service teachers participated in this study were the ones attending
‘Teaching and Learning Mathematics for Primary School’ from two different programs,
the Primary School Teacher Education Program (PSTEP) and the Secondary
Mathematics Education Program (SMEP) study program in semester 1, year 2005 and
semester 1, year 2006. The pre-service primary teachers were undertaking a two-year
diploma program run by elementary teacher training department, whereas the pre-
service secondary teachers were enrolled in a 4-year Bachelor of Education program run

49
by the mathematics and science education department. For pre-service primary teachers,
‘Teaching and Learning Mathematics for Primary School’ was a required course as part
of their training. Meanwhile, ‘Teaching Mathematics in Primary School’ course was an
elective course for pre-service secondary teachers. The decision to choose this course to
embed the instruction was based on the relevance of decimal topics in this course. It
should be noted that the nature of their participation and the teaching intervention for
both the primary and secondary were the same. However, in general the mathematical
ability of pre-service teachers from PSTEP was lower than that of the pre-service
teachers from SMEP, as expected from the lower mathematical entrance score to the
programs. In analysing the data, the researcher took into account the different levels of
knowledge of the subjects when evaluating the impact of the activities designed in this
study. How these different traits relate to the outcomes of the activities in this study will
be illuminated in Chapter 4, 5, and 6.
This study operated within the time constraints of PSTEP and SMEP. The
lecturers permitted only 4 classroom meetings for the complete program. Discussions on
the arrangement and delivery of the activities were held between lecturers and the
researcher prior to the enactment of the activities. However, it should be noted that the
lecturers were fully responsible of classroom management and all decisions during the
classroom activities including presentations Feedback about the activities from the
lecturers was obtained through informal interviews prior to and after the enactment of
activities. Any interesting phenomena observed during the enactment of activities and
group or whole class discussions were also discussed with the lecturers to accommodate
them during classroom discussion when applicable. Having the lecturers conduct the
activities provides a realistic test of their effectiveness in practice. However, as will be
described in Chapter 4 and 5, on a few occasions the intention of the activities was not
fully appreciated.
The researcher was present in the classroom as an observer and directed the video
recordings of group and whole-class discussions accompanied by two technical
assistants. Two video-cameras were used during the observations, one was directed to a
group (in each class) that was followed during the whole set of activities. The other
video camera moved around the class to capture the variety of responses around the
class and to get a general impression of how the activities worked in the classroom

50
situations. During the whole-class discussions led by the lecturers, both cameras were
used to capture the public classroom discussions and presentations of ideas by the
lecturer and pre-service teachers. The group worksheets accompanying the activities
were collected after each meeting for subsequent analysis. Researchers’ notes during the
observation supplemented the group and whole class discussion for the purpose of
ongoing analysis. These data allowed the researcher to note phenomena and trends of
difficulties which guided the retrospective analysis phase.
Consent to participate in this study was sought from pre-service teachers, with
options to contribute to the data by taking parts in written tests, interviews, and video-
recorded activities. The participants were made aware at the beginning that their
participation in this study would not affect their grade in the subject they were taken.
Moreover, they were allowed to withdraw their participation at any stage of data the
research.
3.4 Instruments
This section will explicate the design of the written tests and interview items utilized in
this study and ways of analysing the findings in relation to the research questions and to
the improvement of the activities.
3.4.1 Written tests
The first part of the written test (labelled as Part A) comprised the 30 item decimal
comparison tests, DCT3a and DCT3b (see Appendix B1 for detail of DCT3a and
Appendix B2 for detail of DCT3b). This test was adopted to identify ways of thinking in
interpreting decimal notation. Research has shown that DCT is an insightful instrument
to diagnose misconceptions on decimals reliably. Similar to the earlier versions, DCT3a
and DCT3b classify ways of thinking based on the performance on different item types
and not based on the total score.
The items in DCT3a and DCT3b belong to ten different item types, listed in Table
3.2. Responses to item type 1 and type 2 in DCT3a and DCT3b served as a core criteria
in identifying coarse codes (L, S, A, or U) and pattern of responses to item types 1, 2, 3,
4, 4R, and 5 determined the fine code (see Table 3.2 for item types). The remaining 9
items of DCT3a and DCT3b (from type 8, 9, 10, and 11) provided information on pre-

51
service teachers’ knowledge on the role of zero in decimal numbers and relations
between zero and decimals. Change in ways of thinking was observed by comparing the
thinking classification from the pre-test to the post-test. The DCT3a and DCT3b were
analysed following the classification criteria spelled out by Steinle and Stacey (2004b)
as illustrated in Table 3.3. Explanations about various ways of thinking adopted from
Steinle (2004) have been given in Section 2.2.
Table 3.2: Types of decimal comparison items and number of items in DCT3a
Type Number of items
Example Brief description of item type
1 6 3.92/3.4813 Unequal length. The larger decimal is the shorter 2 6 0.6/0.73 Unequal length. The larger decimal is the longer 3 2 4.08/4.7 A zero in the tenths column of one number, which would
otherwise be the larger 4 4R
2 2
4.4502/4.45 3.7/3.77777
One decimal is a truncation of the other One decimal is a truncation of the other
5 3 0.3/0.4 Equal length decimals 8 2 0/0.6 A comparison of a positive decimals with zero 9 2 0.0004/0.4 Unequal length decimals. 10 3 0.8/0.80000 Decimals with the same value but different lengths 11 2 3.72/3.07 Equal length decimals with a zero in the tenth column of
one number
Table 3.3: Item types and classification of ways of thinking (fine codes) in DCT3a and DCT3b
Item type Fine Codes (number)
Examples L1 L2 L3 L4 S1 S3 S4 A1 A2 A3 U1 U2
1 (6) 0.41/0.362 Lo Lo Lo Lo Hi Hi Hi Hi Hi Hi
Cor
e
2 (6) 5.73/5.847 Hi Hi Hi Hi Lo Lo Lo Hi Hi Hi
3 (2) 3.72/3.073 Lo Hi Lo Hi Hi Hi Hi
4 (2) 1.1503/1.15 Hi Hi Hi Lo Lo Hi Lo
4R (2) 3.7/3.77777 Hi Hi Hi Lo Lo Hi Lo
Non
-Cor
e
5 (3) 0.7/0.6 Hi Hi Hi
Else
Hi Lo
Else
Hi Hi Else
Else
Else
, few
cor
rect
*
Hi=High (at most one error in the set of items for that type) Lo=Low (at most one item correct in the set) * up to 6 correct answers
The researcher constructed Part B and Part C of the written tests (see e.g.,
Appendix B1 and Appendix B2 for the complete test items in cycle 1). The construction
of items in Part B was guided by main difficulties in content areas of decimals identified
in prior studies as discussed in Section 2.2. The items were commonly used in studies
such as NAEP studies to examine knowledge in content areas of decimals. Part B was

52
analysed according to areas of content knowledge. Similar weights were assigned to
different areas of content knowledge to reflect the importance of these content areas of
decimals (see Table 3.4). For each item, the incorrect responses were marked as 0 and
the correct responses were marked as 1. Paired t-tests were carried out to observe any
changes and to identify areas of improvement. Note that problems involving decimals in
word problems context were excluded from the analysis of this part due to the
confounding factors such as knowledge of the contexts. Responses on these word
problems revealed that pre-service teachers made a number of errors and alternative
interpretations that were related to the contexts instead of their understanding of
decimals. Therefore these items were not useful in tracking pre-service teachers’
understanding that was pertinent to this study.
Patterns and common trends of difficulties and misconceptions in various content
areas were surveyed and reported. Variations in the number of items involved in the two
cycles reflected the refinement of the instruments after retrospective analysis in cycle 1.
This information was then utilized in refining the activities as well as the written test
items. Note that the different number of items reflected the refinement between cycles.
Table 3.4: Distribution of items in various areas of content knowledge assessed in Part B
Item number on the written test Part B (total score) Areas of content knowledge Cycle 1 Appendix B1
Total marks
Cycle 2 Appendix B2
Total marks
Identifying place value names 1a, b, c (3) 1a, b, c, d (4) Decomposing of decimals 2a, b
(8 alternatives) (4) 2
(4 alternatives) (4)
Unitising decimals n/a n/a 3a, b (4) Ordering and sequencing decimals 3a, b, 4a, b (4) 4a, b (4) Density of decimals 5, 6 (4) 5, 6 (4) Relative magnitude of decimals on a number line 7a, b, 8a, b,
9a, b, c, d (4) 7a, b, 8a, b,
9a, b, c, d (4)
Closeness of decimals to a decimal 10, 11 (4) 10, 11 (4) n/a: not applicable (not included in the written tests of cycle 1)
Part C of the written tests was designed to assess pedagogical ideas on decimals
(see Appendix B1, B2, B5, and B6 for the copy of the written tests). Scoring rubrics
were devised to classify and to quantify responses in Part C as presented in Table 3.5. A
second researcher who was not involved in data collection of this study repeated the
scoring for some of data from Part C in order to test the consistency of the scoring

53
criteria and to establish the reliability of this scoring. After quantifying the data, a paired
2-tailed t-test was carried out to identify areas of improvement in teaching ideas.
Various representations posed in teaching ideas were classified and shifts in trends of
dominant representations utilized in teaching ideas were surveyed and reported.
Table 3.5: Scoring criteria for various areas of pedagogical ideas assessed in Part C
Low (0 out of 2 or 1 out of 3)
Medium (1 out of 2 or 2 out of 3)
High (2 out of 2 or 3 out of 3)
Blank or
Give correct answer based on reliance on rules without meaningful explanations or
Indicate understanding of basic notion in decimals such as place value and incorporate proper model in teaching ideas or
Indicate misconception on CK or
Make links to appropriate concept but give no proper models or
Justify teaching approach that go beyond reliance on “expert rules” and incorporate proper model in teaching ideas
General teaching ideas, e.g., teaching it slowly, repeat explanations, etc
Include teaching ideas with models but not much explanation
To illustrate the scoring criteria, an example of various responses to teaching ideas
to Item 15 in the pre-test of cycle 2, i.e., “Explain your ideas for teaching primary
school students to find the larger number between 0.8 and 0.8888. Include any models
that you can think of in your teaching ideas!” is given in Table 3.6:
Table 3.6: Illustrative samples of scoring criteria in Part C
Response Score Rationale Teaching 8/10 > 8888/10000 without explanation
0 Indicate a misconception, i.e., overgeneralising that tenths are larger than ten thousandths.
Annexing zeros to 0.8, and telling students that 0.8888 > 0.8000. No model is proposed
1 Give correct answer based on reliance on rules without meaningful explanations.
Suggest both 0.8 and 0.8888 by 100 to conclude that 88.88 > 80. Suggest abacus as a model
1 Make links to appropriate concept but suggests no proper model.
Decomposing 0.8 = 0 ones + 8 tenths, 0.8888 = 0 ones + 8 tenths + 8 hundredths + 8 thousandths. Suggest ruler as a model
2 Indicate understanding of basic notion in decimals such as place value and incorporate proper model for teaching.
Finally, out of the total score of 9 in Part C, the score are classified into low
(score 0 to 3), medium (score 4 to 6), and high (score 7 to 9).

54
3.4.2 Interview items
The interview was designed to examine the current state and the progress of pre-
service teachers’ content and pedagogical content knowledge on decimals and to elicit
pre-service teachers’ thinking behind some of the incorrect or unexplained answers on
the written tests. List of interview questions along with the rationale for each question
for pre- and post-course interviews for cycle 1 and cycle 2 could be found in Appendix
B3, B4, B7, and B8. A “Think aloud” procedure (audio- or video-recorded) was
employed during the interviews as students worked through the problems in the
presence of the researcher, who observed and asked further probing questions. Pre-
service teachers were asked to write some part of their explanations, which were kept by
the researcher. In cycle 1, investigations of prior schooling experiences were included as
part of the interviews prior to the enactment of the activities, but this was excluded in
cycle 2.
The interview responses were grouped based on the main content areas or
pedagogical ideas and their relevance to the research questions. Segments of interviews
that provided clear insights into pre-service teachers’ thinking processes or indicated
evolutions of their understanding would be reported. Common trends of difficulties or
misconceptions observed during the interviews in two cycles were reported in Chapter 4
and 5. Detail discussion on findings from the interviews from samples of pre-service
teachers will also be reported in Chapter 6.
3.5 Discussion of the methodology
In this section, discussions about methodological and practical issues concerning the
research design will be addressed. Moreover, some constraints beyond the control of the
researcher that may affect the result of this study will be highlighted.
3.5.1 Methodological Issues
The large data corpus gathered from this study consisting video-recording of
group discussions, worksheets of group activities, written tests and interviews imposed

55
a challenge to integrate the data across the two cycles. This raises the fundamental
issues in design research concerning data reduction and analysis.
Collins, Joseph, & Bielaczys (2004) pointed out that one of the challenges in
design research was large amounts of data collected over the number of cycles that
require a lot of resources to analysed. In addressing this challenge, the analysis was
conducted only on data that would directly contribute to answering the research
questions and that provided ideas for the improvement of the activities. For instance, a
decision was made not to analyse in detail all data gathered during the teaching
experiment. The dimensionality of the qualitative data in this study such as the
interview data and video observation data were reduced via exploratory thematic
analysis whereas descriptive statistics were employed to reduce the dimensionality of
the quantitative data such as Part B of the written tests.
The situated aspect of implementing design research in “real” classrooms created
another issue of uncontrolled variables that affect the success or failure of the design.
The nature of this study depended largely on voluntary participation of lecturers and
pre-service teachers. Thus, establishing and maintaining a respectful and collaborative
partnership with lecturers in the research process played a critical role in the success of
carrying out the design.
Another characteristic related to the nature of the teacher education program was
the limited number of meetings that could be devoted to this study, i.e., 4 to 5 meetings
in each class. There are many promising situations which pre-service teachers could
explore to deepen knowledge of decimals. However, implementing the design in the real
context of teacher education with its limited time allocation forced the researcher to
focus the lessons on the most important issues to be addressed. In this sense, the limited
time could be considered as strength of the program because there was little benefit in
developing a set of activities that could not be implemented because they required too
much time particularly in the teacher training context.
3.5.2 Justification and Trustworthiness
Following the proponents of design research (Cobb et al., 2003; Cobb et al., 2001;
Edelson, 2002; Gravemeijer, 1994b; Research Advisory Committee, 1996; The Design-
Based Research Collective, 2003), justification in this study relied on an argumentative

56
character of the thoughts in designing the provisional activities in addition to the
interpretation of the empirical findings. Unlike the experimental research, justification
in design research methodology is not merely confined to empirical testing but also is in
thought experiments (Gravemeijer, 1994b). Thus, documentation of the enactment of
the activities provided critical evidence to establish warrants for claims about why
outcomes occurred which related to the nature of justification in design research.
The justification in the design research comprised of “an analysis on the area of
subject matter, an intrinsically substantiated characterization of the structure and content
of the course, paradigmatic examples (of student works and interaction) and a reflection
on the realistic calibre of the whole” (Gravemeijer, 1994, p.291). Freudenthal (1991)
commented on the importance of reflection and reporting the researcher’s thoughts and
experience as way of justifying design research or what he referred to as developmental
research as follows: Developmental research means: ‘experiencing the cyclic process of development and research so consciously, and reporting it so candidly that it justifies itself, and that this experience can be transmitted to others to become like their own experience. (Freudenthal, 1991, p. 161)
Graveimeijer contends that justification in design research relates to the learning
process of the research team in a notion called ‘trackability’ by reporting both failures
and successes, on the procedures followed, on the conceptual framework, and on the
reasons for the choices made. Rationale for choices and interpretation of the empirical
data forms part of justification in design research. By so doing, other researchers can
retrace the learning process of the researcher and enter into a discussion. This thesis
followed this line of justification in reporting the findings and interpretation of the
findings in this study as will be discussed in Chapter 4 and Chapter 5.
Following Drijvers (2004), this study perceived internal validity of the data as the
measure of “quality of data collection and the soundness of the reasoning that lead to
the conclusions” (p. 23). Internal validity of the instruments and content validity of
instruments was obtained by reviewing the instruments used in this study by experts in
teaching and learning decimals and by having the instrument trialled prior to the
implementation stage. The internal validity of the data was also ensured by sharing

57
crucial findings with colleagues for peer examination in departmental seminars to gain
different perspectives.
External validity concerns “the bearing of the results on other situations”, which is
led by a question “how certain elements of the results will apply to other situations”
(Gravemeijer, 1994, p.455). In this study, reporting and sharing the findings of the study
in publications and conference contributions to gain feedback about the quality of the
reasoning promoted external validity (Widjaja, 2005; Widjaja & Stacey, 2006).
Moreover, complementary triangulation of data and repeated analysis across the two
cycles account for reliability of the findings (The Design-Based Research Collective,
2003).
Trustworthiness in design research is concerned with the reasonableness and
justifiability of the inferences and assertions. To ensure this, the analysis of the data
generated during the teaching experiment was carried out in systematic and thorough
ways. Following Cobb et al (2001), inferences in this study were treated as provisional
conjectures that were continually open to refutations. Analysis was documented and
reported in such a way that is open to criticism from other researchers to ensure
trustworthiness in design research.
3.6 Overview of data sources
This section outlines the data sources involved in different phases of the design research
cycle and their relevance to the research questions and goals of this study as presented
in Table 3.7. Timeline of the research in cycle 1 and cycle 2 are presented in Figure 3.2.
Links between various data sources and the research questions are given in Table 3.8.
Figure 3.2: Timeline of the research in cycle 1 and cycle 2
May-June 2005 August 2005 October 2005 July 2006 August 2006 October 2006
Trial 1 Trial 1 Teaching Exp Cycle 1 Trial 2 Teaching Exp Cycle 2 Melbourne Indonesia Indonesia Indonesia
Cycle 1 Cycle 2

58
Table 3.7: Outline of data in relation to the research questions and goals of the study for both cycles
Phase Data collection technique Goals or Relevance to Research Questions
Design Phase
Design instruments and activities
To develop and adapt activities to promote knowledge (CK and PCK) of PSTs* on decimals. To develop instruments that can provide indications of any progress in understanding.
Trial activities To observe how the activities work and to identify any problem in carrying out the activities.
Trial of instruments with volunteer PSTs
To gain feedback to improve the instruments
1
Informal Classroom Observation
To familiarise researcher to PSTs involved in the study
Teaching Experiment Phase
Pre-tests To gain understanding of existing knowledge (CK and PCK) of PSTs (RQ 1a & 2a)
Pre-course interview (audio/video-taped and transcribed)
To gain knowledge of the PSTs previous learning experiences on decimals (RQ1a, cycle 1 only) To gain knowledge on PSTs’ ideas in teaching decimals (PCK) (RQ2a)
Classroom observation (Video-recording groups discussion and transcribed)
To observe the conduct of the activities, e.g., whether they have been carried out as intended To observe PSTs’ reaction to the activities To capture any impact of the activities to PSTs’ CK and PCK (RQ 1b & 2b) To identify PSTs’ difficulties on content areas and pedagogical ideas (RQ 1b & 2b)
Post-course Interviews (audio/video-taped and transcribed)
To learn about the impact of activities for PSTs’ CK and PCK on decimals (RQ 1b & 2b).
Group worksheets of activities
To find any indication of progress of PSTs’ CK and PCK and their changes (RQ1b & 2b)
2
Post-tests To assess the impact of the activities on PSTs’ CK and PCK (RQ1b &2b) To identify areas of improvement in CK and PCK (RQ1b & 2b)
Retrospective Analysis Phase
3 Triangulate the data gathered from teaching experiment phase
To elaborate on the data gathered from teaching experiment phase to find a general pattern in various data. To gain insights on how to refine and reorganize the activities for the next cycle. New ideas from previous activities will also be put forward into the design phase of the next cycle.
*PSTs: pre-service teachers

59
Table 3.8: Links between research questions and various data sources
Data Sources Research Question Pre-test
Pre-course intervi
ew
Observation
Group worksheets
Post-test
Post-course intervi
ew 1a. What is the current state of Indonesian pre-service teachers’ CK of decimals?
Part A, B
- - - -
1b. What is the interplay between pre-service teachers’ participation in the activities and their CK of decimals?
- - Part A, B
2a. What is the current state of Indonesian pre-service teachers’ PCK of decimals?
Part C
- - -
2b. What is the interplay between pre-service teachers’ participation in the set of activities and their PCK of decimals?
- - Part C

60
CHAPTER 4 GOING THROUGH PHASES IN CYCLE 1
4.1 Introduction
This chapter contains a description of different phases leading up to and involved
in cycle 1 and findings gathered in each phase. The description will explicate the
research instruments comprising written tests, interview questions and activities
involved in different phases. Section 4.2 addresses the design phase focusing on the
initial development of the Local Instruction Theory (LIT) and findings from the trial
phase of the instruments used prior to cycle 1 along with lessons learned from the trial
phase. Refinements and adaptations made as a result of the trial phase will be explicated
in Section 4.2. Section 4.3 presents the research instruments comprising written tests
and interview items. In section 4.4, the design and the enactment of the activities and
the findings during the teaching experiment phase are discussed. Section 4.5 discusses
the findings from pre-test and post-test as well as from pre-course interviews and post-
course interviews that indicate any evolution of pre-service teachers’ content knowledge
and pedagogical content knowledge. Finally, this chapter ends with retrospective
analysis phase of cycle 1 and feed-forward recommendations for the second cycle in
Section 4.6.
Before discussing the first design phase in Section 4.2, I will present the details of
the data collection methods in relation to the research questions and goals, which are
summarised in Table 4.1. A total of 31 pre-service teachers were involved in the trial
phase. A total of 136 pre-service teachers sat for the pre-test. After the teaching
intervention, a total of 129 pre-service teachers sat for the post-test. From these two
tests, longitudinal data on 118 pre-service teachers, 67 from the primary cohort and 51
from the secondary cohort were obtained. There were 16 pre-service teachers who
participated in the pre-course interviews; but 2 of them gave very little information and
refused to be audio-recorded, even though they had noted otherwise on the consent form
so 14 useful interviews were obtained. Selection of the interviewees in the first cycle
was based only on the responses on the pre-test and on consent to be interviewed. The
same pre-service teachers who participated in the pre-course interviews were invited to
participate in the post-course interviews. However, 5 pre-service primary teachers and 1

61
pre-service secondary teacher did not attend the post-course interviews so that there
were 10 pre-service teachers properly interviewed before and after the enactment of the
activities. During the enactment of the activities, the pre-service teachers worked in
small groups of 4-6 people. The total number of groups varied from meeting to meeting,
as some pre-service teachers were occasionally absent. All activities were carried out in
the span of 4-5 meetings lasting approximately 2 hours each during the teaching
experiment phase.
Table 4.1: Overview of data sources in relation to research questions and goals in cycle 1
Methods Cohort Number of participants
Research questions*
Goals
Trial phase
Volunteers 5 (Melb) 9 (Indo)
- Trial test items and identify problems on test items
Observation of trial of activities (Appendix A1, A2)
Volunteers
2 groups (Melb-9) 2 groups (Indo-8)
- Test and identify problems in the activities
Pre-test Primary 72 1a Identify current state of CK (Appendix B1) Secondary 64 2a Identify current state of PCK Post-test Primary 73 1b Identify the evolved CK (Appendix B2) Secondary 56 2b Identify the evolved PCK Pre-course interviews
Primary 11 1a
(Appendix B3) Secondary 5 2a
Clarification of pre-test responses Identify prior learning experience Identify initial ideas for future teaching
Post-course interview (Appendix B4)
Primary 6 1b Clarification of post-test responses Gain feedback on activities
Secondary 4 2b Identify evolved ideas for future teaching
Observation of activities (video and audio-recordings)
Primary Secondary
3 groups 2 groups
1b 2b
Identify aspects in the activities that contribute to improvement of CK and PCK
* see Section 1.4
4.2 Design phase 1
In this section, I first explain about the initial development of the LIT, which is based on
the analysis of decimal notation, and analysis of the potential use of the models. The
decision to incorporate models is based on the aim to introduce pre-service teachers to a
less symbolic teaching and learning approach on decimals. The starting point for

62
devising the instructional activities is taken from the likely existing knowledge of pre-
service teachers and by hypothesizing their learning trajectories. The existing
knowledge of pre-service teachers was posited through analysis of how the decimal
topics were commonly approached in primary mathematics textbooks, which will be
described in the following section.
4.2.1 Textbook Approach on Decimal Notation
Analysis of some Indonesian commercial school textbooks (e.g., Khafid & Suyati,
2004a, 2004b; Listyastuti & Aji, 2002a, 2002b) indicates a very symbolic approach in
teaching decimals. Common fractions starting with one tenth are utilized to introduce
decimal notation ( 110
= 0.1) followed by exercises to convert fractions such as 53,
21 into
decimal notation. No attention is given to creating meaningful referents such as concrete
models to help students make sense of the place value in decimal notation. Moreover,
strong reliance on syntactic rules based on whole numbers dominates the approach in
comparing two decimals and in carrying out operations with whole number algorithms.
Two and three digit decimals are introduced through finding conversion of fractions
with denominator 4 and 8 to denominators 100 or 1000. This approach clearly
overemphasizes operations of fractions as the basis and overlooks place value
understanding in building understanding of decimal notation. Rules such as moving a
decimal comma when dividing or multiplying by 10 are stated as shortcuts without any
justification or illustration.
Moreover, decimals with repeating digits are “given” without explicating the
division process, for instance 23
=0.6666…; 26
=0.3333… ; 56
=0.8333… ; 79
=0.777….
Textbooks also emphasise rounding to two digit decimal numbers, e.g., 23
= 0.67
without providing much justification for the use of rounding. Steinle (2004) found that
this teaching approach contributes to lack of understanding of decimals with longer
digits and infinite repeated digits. Moreover, this practice in learning decimals does not
develop meaningful understanding of decimal notation based on important ideas such as
place value.

63
Therefore, utilizing this analysis and insights from prior research in teaching and
learning decimals (Hiebert, 1992; Hiebert & Wearne, 1986, 1987; Stacey, Helme, &
Steinle, 2001; Steinle & Stacey, 2001, 2002), the focus of the activities in this study was
determined. Prior studies in teaching and learning of decimals suggested the importance
of building understanding of decimal notation based on place value understanding and a
focus on structural characteristics of decimal system. Hence this study focuses on
building understanding of decimals and basic notions in decimals such as an
understanding of density of decimals, and structural relations including additive and
multiplicative structures which are crucial in building meaningful interpretation of
decimals.
4.2.2 Determining Goals for the Activities
Activities were selected with the purpose of improving understanding of the key
notions of decimals that were not appropriately addressed in the Indonesian primary
school mathematics textbooks. Below are the lists of goals that guide the development
of activities in the trial phase of cycle 1:
o Develop an understanding of decimals based on place value concepts; that is to
recognise decimal digits in terms of place value.
o Develop an understanding of additive and multiplicative structures of
decimals; that is to recognize that decimals can be represented as a linear
combination of powers of 10 and to recognize the base ten multiplicative
structures of decimals.
o Develop an understanding of equivalent decimals and multiple ways of
interpreting decimals, e.g., 2.35 as composed of 2 ones, 3 tenths, and 5
hundredths but also 23 tenths and 5 hundredths, and 235 hundredths.
o Develop an understanding of density of decimals; that is to recognize that
there are infinitely many decimals in between any two decimals.
o Building links among decimals, fractions and whole numbers and a sense of
relative magnitude of those numbers, including knowing relative magnitude of
decimals on the number line.

64
4.2.3 Designing activities and conjecturing learning paths
Based on the above goals, sets of activities were devised and conjectures about
pre-service teachers’ learning paths in working with these activities were developed.
Guided by the didactical phenomenology tenet of RME, the context of measuring length
was chosen in order to explore the basic notion of repeated refinement into ten. This
idea was inspired by activities on decimals consonant with RME basic tenets devised
earlier (see e.g., Gravemeijer, 1998; Keijzer et al., 2004). Gravemeijer (1998) proposed
the use of ruler with metric measures (such as m and cm) and number line as mediating
models for teaching decimals. In contrast, Keijzer et al.(2004) utilised a less standard
measurement tool such as a rope and small strips of paper in their initial teaching
activities. As discussed in Chapter 2, reference to metric measures in teaching decimals
allowed a decimal number to be interpreted using two separate units. Hence, an
understanding of decimals as part of a whole is missing.
In this study, a linear concrete model based on length, called Linear Arithmetic
Blocks (LAB) (see Figure 4.1) was employed as a learning tool for decimals. The linear
nature of LAB fits with the chosen context of measurement in this study. LAB consists
of long pipes that represent a unit and shorter pieces that represent tenths, hundredths,
and thousandths in proportion. Pieces can be placed together to create a length
modelling a decimal number and can be grouped or decomposed (for example to show
0.23 as 2 tenths + 3 hundredths or as 23 hundredths). The LAB model has been explored
in prior studies on teaching and learning decimals (Stacey, Helme, Archer et al., 2001;
Steinle et al., 2006) and suggested as a powerful model in learning decimals. LAB
represents decimal numbers by the quantity of length (not measured length such as
metres and centimetres) and not volume such as Multi Arithmetic Blocks (MAB).
Moreover, the simplicity of LAB and its linear nature allowed the extension to a more
abstract model of the number line.
The researcher hypothesized that exploring the relationships between different
pieces of LAB in the context of measuring a length of a table and different ways of
naming the pieces would be a useful initial task to create a meaningful interpretation of
base ten relations. The longest piece is called “one rod” and by observing the
relationships of the shorter pieces to the longest one, it is expected that pre-service
teachers establish the name that reflect the relationships such as “one tenth of a rod”,

65
“one hundredth of a rod”, also “one tenth of one tenth of a rod”, etc (see Appendix A1
for the complete set of trial version activities).
Figure 4.1: LAB pieces*
Trial Stage of Activities
Results from the trial of Activity 1 in Set 1 showed that establishing the names for
each of the pieces involved a more complicated process unforeseen by the researcher.
Establishing the names for shorter LAB pieces involved a long discussion and yet the
chosen names did not necessarily express the relationships to one rod as the longest
piece. One of the trial groups established the names based on the physical appearance of
the models to objects familiar with them like “a stick” for a tenth of a rod, “a cheezle”
for a hundredth of a rod, and “a splinter” for a thousandth of a rod. This finding
suggested that different interpretations of the activity to label the pieces shifted the
focus on this activity away from the more important exploration of the relations
between the pieces of LAB. Thus, the researcher determined to introduce the longest
piece as “one” and ask pre-service teachers to explore and find the relationship between
shorter pieces to “one” for the initial task in the main study in cycle 1. This more
straightforward approach was expected to set the focus on the relations between the
pieces, more than asking for names of the pieces.
* LAB pictures are taken from Steinle, Stacey & Chambers (2006) Teaching and Learning Decimals CD
version 3.1. Melbourne: The University of Melbourne

66
In the trial phase, promoting the understanding of additive structures of decimals
were addressed in Activity 1, 2, and 3 in Set 2 (see Appendix A1). Pre-service teachers
were asked to find various ways of constructing a decimal using LAB model, e.g.,
making 0.213 by 2 tenths and 13 thousandths or 21 hundredths and 3 thousandths.
Following this activity, a number expander model was introduced to observe various
ways of expanding decimals. A number expander works on the symbolic representation
of decimals. It displays the extended notation of a number in different ways as can be
seen in Figure 4.2 below. The outcome of the trial indicated the majority of volunteer
pre-service teachers, except one pre-service teacher, were able to give more than one of
way constructing a decimal 0.213 after the intervention. The number expander was
perceived by the researcher as a model to help them in seeing that the same decimal
number can be expressed in different ways.
Figure 4.2: Various expansions of 3.145 using the number expander model (from Steinle et al., 2006)
The multiplicative structure of decimals was explored in Set 3 activities of
exploring the endless base ten chain pattern (see Section 2.2) by looking at different
conversions from ones to tenths, tenths to hundredths, etc. and vice versa using the
number expander model. The iterative process of finding the base-ten multiplicative
structure pattern was expected to afford pre-service teachers to arrive at more abstract
understanding of the endless base ten chains of decimals. Results indicated that these
tasks did not assist pre-service teachers to observe the multiplicative structures in a
more meaningful way. This was evident as one pre-service teacher applied a memorized
strategy of moving a decimal point in expressing the relations among 3.07 in tenths,
hundredths and thousandths. Consequently, these tasks were omitted in cycle 1.
Set 4 in this trial stage (see Appendix A1) aimed to explore density of decimals
(by finding decimals in between pair of decimals) and links among decimals, fractions
and whole numbers using a number line model. The task asked pre-service teachers to

67
locate different numbers on the same number line, e.g., locating –2.65, ½. 0.6, –0.9999,
0.9999, and 0.501. It was expected by discussing and working together in locating those
numbers on the number line, they learn from each other about the relative magnitude
and positions of those numbers on the number line.
An important amendment made after the trial was the more explicit inclusion of
pedagogical aspect of teaching decimals as a focus of the study. Whilst working on
problems with models during the trial of the activities, one pre-service teacher pointed
out the importance of finding ways to help her students to solve the problems. Attending
to the need of finding ways to make a topic more comprehensible for students relates to
one aspect of pedagogical content knowledge defined by Shulman (1987), i.e.
knowledge of “ways of representing and formulating the subject matter that make it
comprehensible to others” (p. 9). This particular knowledge is referred to as
Pedagogical Content Knowledge (PCK) in this thesis. Section 1.2.5 lists various other
components of Shulman’s PCK, but only one aspect is being considered here. The
development of PCK during the teaching experiment will be tracked.
Exposing pre-service teachers to new concrete models in this study is expected to
encourage them to revisit their knowledge about decimals and to enhance their
knowledge about different ways of teaching decimals more meaningfully. By
investigating and exploring the principle of partitioning into ten smaller units in
establishing the names of the models, pre-service teachers are expected to revisit and
reinvent their understanding of decimals and to promote meaningful teaching ideas.
However, the fact that pre-service teachers bring with them prior strong syntactic
knowledge of decimal notation might challenge their openness to developing new
knowledge.
In this trial stage, the researcher observed that pre-service teachers with a strong
reliance on syntactic knowledge showed higher level of resistance in working with new
concrete models to revisit their understanding of decimals than others who have less
reliance on syntactic knowledge. This was in line with Wearne & Hiebert’s (1988a)
prediction of this tendency in the following comment:
Theoretically, students who have already routinized syntactic rules without establishing connections between symbols and referents will be less likely to engage in the semantic process than students who are encountering decimal symbols for the first time” (p. 374)

68
It is significant that none of the subjects in this thesis fall into the class of encountering
decimals symbols for the first time.
Moreover, Hiebert, Morris, Berk, and Jansen (2007) contend that prior learning
experiences heavily influence pre-service teachers’ perceptions and interpretations of
what they learn at the teacher education level. As the prior teaching experience of
Indonesian pre-service teachers is predominated by syntactic rules, a challenge in
revisiting the decimal notation and its basic properties is recognized. This understanding
of the possible impact of prior learning experience is accommodated in the design of the
activities and instruments.
4.3 Research instruments
The section will report on findings from the trial phase of research instruments
both written tests and interviews prior to the main study in cycle 1. The description
below includes the rationale for the selection of the instruments and surveys the
concepts evaluated by the instruments.
Instruments
1. Written tests
The written tests (see Appendix B1 and Appendix B2) were trialled with 5 pre-
service teachers in Melbourne and 9 pre-service teachers in Indonesia. The trial of
written test items with pre-service teachers in Melbourne was conducted in face to face
basis and pre-service teachers were asked to think aloud when solving the questions.
The main aims of trialling the research instruments were to gain feedback on the test
and to observe any ambiguity in the written test questions. Seven out of the nine pre-
service teachers involved in the trial of instruments in Indonesia pointed out confusions
in understanding item 2 in Part B of the pre-test. Hence, adjustments were made to
improve the instruction on Item 2 in Part B in the Indonesian translation for in both the
pre-test and the post-test items.
2. Interviews
The pre-course interview in cycle 1 (Appendix B3) examined the current state of
pre-service teachers’ content and pedagogical content knowledge of decimals as well as
their prior schooling experiences. Moreover, the pre-course interview aimed to elicit

69
pre-service teachers thinking behind some of the incorrect or unexplained answers on
the pre-test. The pre-course interviews were carried out after the pre-test. “Think aloud”
procedure (audio-recorded) was employed during the interviews and pre-service
teachers were asked to write some of their explanations, which were kept by the
researcher.
Post-course interviews in cycle 1 (see Appendix B4) were carried out after the
post-test and focussed mainly to gain feedback for improving the activities. Moreover,
the post-course interviews also aimed at eliciting pre-service teachers’ underlying
thinking behind some incorrect answers on the post-test that were indicative of certain
misconceptions. During these post-course interviews, pre-service teachers were asked to
identify three different models for teaching decimals and to rank the models according
to their levels of accessibility.
4.4 Reorganising activities after the trial phase
In contrast to the common approach of teaching and learning decimals in
Indonesia which puts a heavy emphasis on symbolic manipulation, activities in this
study were designed to utilize concrete models in assisting pre-service teachers to revisit
their understanding of decimal notation. The enactment of activities during the teaching
experiment involved a limited amount of lecturing, which is in line with a goal to
develop meaningful understanding and interpretation of decimals. The main role of the
lecturer in this study is to facilitate the discussions in small groups and in the whole
class by emphasising the main points of the activities. This approach emphasizes active
engagement in group work, which is consistent with the RME instructional approach
(see discussion in Section 2.4). It is expected that this approach will encourage more
engagement in exploration of ideas, and pre-service teachers will get firsthand
experience of new methodologies for their future teaching.
Set 1
Utilizing the didactical phenomenology tenet of RME, the measurement context
was chosen to explore base ten relationships, i.e., that parts of units hold a specified size
relationship to the unit: tenth of a unit, hundredth of a unit, as a basis for understanding
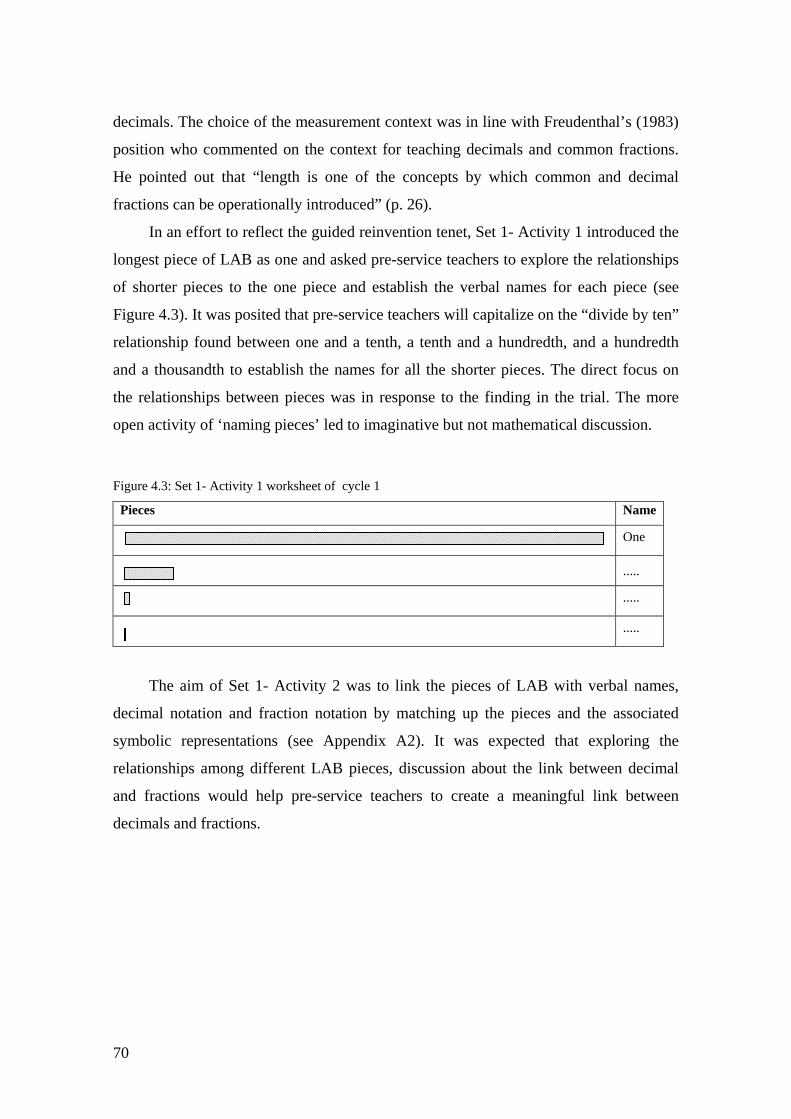
70
decimals. The choice of the measurement context was in line with Freudenthal’s (1983)
position who commented on the context for teaching decimals and common fractions.
He pointed out that “length is one of the concepts by which common and decimal
fractions can be operationally introduced” (p. 26).
In an effort to reflect the guided reinvention tenet, Set 1- Activity 1 introduced the
longest piece of LAB as one and asked pre-service teachers to explore the relationships
of shorter pieces to the one piece and establish the verbal names for each piece (see
Figure 4.3). It was posited that pre-service teachers will capitalize on the “divide by ten”
relationship found between one and a tenth, a tenth and a hundredth, and a hundredth
and a thousandth to establish the names for all the shorter pieces. The direct focus on
the relationships between pieces was in response to the finding in the trial. The more
open activity of ‘naming pieces’ led to imaginative but not mathematical discussion.
Figure 4.3: Set 1- Activity 1 worksheet of cycle 1
Pieces Name
One
.....
.....
.....
The aim of Set 1- Activity 2 was to link the pieces of LAB with verbal names,
decimal notation and fraction notation by matching up the pieces and the associated
symbolic representations (see Appendix A2). It was expected that exploring the
relationships among different LAB pieces, discussion about the link between decimal
and fractions would help pre-service teachers to create a meaningful link between
decimals and fractions.

71
Figure 4.4: Set 1- Activity 3: Measuring length and width of a table using LAB pieces
In Set 1- Activity 3 (see Appendix A2), ideas to measure the length and width of a
table using various LAB pieces to get an accurate result were explored. Furthermore, in
Set 1- Activity 4, explanations about the reasoning and justification as well as the result
of the measurement were called for. Note that for this activity, some steel pipes were
available to conveniently join different LAB pieces together (see Figure 4.4). In set 1-
Activity 5 (see Figure 4.5), various ways of sketching out representations for three
decimals to emphasize that the value of a decimal digit depends on its place. The notion
of rounding in decimal notation was addressed in Set 1, activity 6 (see Figure 4.6), in
which pre-service teachers were asked to find the number of hundredth pieces closest to
the length that represent 0.666 and 1.55569 by using only hundredth pieces.
Set 1- Activity 7 (see Figure 4.6 and Appendix A2 for more detail) was designed
to expand the use of LAB as a thinking tool to compare two decimals based on length. It
was expected that erroneous thinking such as 0>0.6 and 1.666 = 1.66, which might have
been uncovered by DCT would be challenged and resolved.

72
Figure 4.5: Set 1- Activity 5, 6: Sketching out representations of 2.06, 0.26, 0.206
5. Sketch the construction of LAB representations of the following decimals.
Numbers Sketch
2.06
0.26
0.206
• What could you conclude from the construction process above?
• What is the value of 6 in 0.26 ? ……………………………………………………………
Is it the same as the value of 6 in 2.06? Is it the same as the value of 6 in 0.206? Yes/No. Why? Yes/No. Why?
6. If you measure a length of something using only hundredth pieces of LAB, answer the
following questions: • How many of hundredth pieces of LAB are needed to represent a length closest to 0.666? • How many of hundredth pieces of LAB are needed to represent a length closest to 1.55569?
Observing the reflections of pre-service teachers of new learning experiences was
expected to bring out insights about the new learning ideas of decimals that the pre-
service teachers perceived as meaningful. Set 1- Activity 8 (see Appendix A2) asked
pre-service teachers to articulate their new learning experiences about decimals.
Moreover, insights about prior or initial knowledge of decimals might be gathered in
these reflections. Meanwhile, Set 1- Activity 9 was expected to disclose information
about translation of ideas gathered from pre-service teachers’ own learning experience
to ideas for future teaching of decimals. This activity is an example of activities to elicit
PCK of pre-service teachers.

73
Figure 4.6: Set 1- Activity 7, 8, and 9
7. Explain your idea on how to decide the larger decimals between the given pairs of decimals below using the LAB model.
8. Based on your learning experience last week, explain your new learning experience of decimals. 9. Explain your ideas to teach decimals in primary school based on your learning experience.
Set 2
Set 2 activities (see Appendix A2) started with Activity 10 to explore different
ways of decomposing two decimals 0.123 and 1.230. For each decimal number, pre-
service teachers were asked to draw sketches of how to decompose the decimal numbers
using various pieces of LAB models. Columns to decompose the number in up to 8
ways into ones, tenths, hundredths, and thousandths were provided for each decimal
(see Appendix A2). It was expected that this activity would encourage pre-service
teachers to explore various ways of interpreting decimals using LAB as a thinking tool.
In the process of finding different ways of decomposing decimals, the researcher
posited that pre-service teachers would “re-invent” structural relations (additive and
multiplicative) amongst ones, tenths, hundredths and thousandths in the process of
finding different alternatives. It was also expected that different ways of decomposing
0.123 would be capitalized in finding multiple ways of decomposing 1.230.
Having pre-service teachers’ reflecting on Set 2- Activity 10, Set 2- Activity 11
explored various ways of decomposing a decimal number in symbolic way as shown in
Figure 4.7. Following this activity, each group was given a number expander to work
with and pictures of how the number expander displayed the extended notation of a
decimal 1.027.
0.9 0.90 0 0.6 1.666 1.66 1.9912999 1.9912

74
Figure 4.7: Set 2-Activity 11: Decomposing decimals into various extended notations
Figure 4.8: Various expansions of 1.027 using the number expander
A number expander was first introduced to explore various ways of decompose
decimals in Set 2 - Activity 12 and to check the answers for solving problem in Figure
4.8 above. Moreover, discussion about similarities and differences between a number
expander and LAB was sought in Set 2- Activity 13. In Set 2- Activity 14 written
reflections of the learning experiences on activities in Set 2 were called for. Finally in
Set 2- Activity 15, teaching ideas about decimals in primary school based on pre-service
teachers’ own learning experiences was probed (see Appendix A2). It was expected that
in the reflections of the pre-service teachers’ own learning experience, remarks
indicating the evolved CK or PCK could be observed.
Set 3
Set 3 activities were designed to address density of decimals and links between
decimals including negative decimals, whole numbers, and fractions on the number line
as shown in Figure 4.9. This set started with the use of concrete model LAB which then
followed by the use of number line as a more symbolic model in locating decimals and
addressing density of decimals. Note that LAB represents decimals by length, whereas
number line represents decimals by length and also position. These activities were
expected to elicit knowledge and misconceptions on the links among decimals, whole
numbers and fractions, such as knowledge of equivalence relation between 2¼ and 2.25,
0.213 = …. ones + 2 tenths + …. hundredths +..……thousandths 0.213 = …. ones + 2 tenths + 0 hundredths +..……thousandths 0.213 = …. ones + 0 tenths + ….. hundredths +..……thousandths 0.213 = …. ones + 1 tenths + ….. hundredths +..……thousandths 0.213 = …… tenths + …… thousandths 0.213 = ……. hundredths + ..…. thousandths 0.213 = ..…… hundredths 0.213 = .…….. thousandths

75
and that 0.6 was not equal to 16
, which might be taught by some pre-service teachers
identified by DCT3a and DCT3b as having S3 (reciprocal) thinking (see Table 2.1).
Unfortunately, the significant amount of time devoted to group presentations of
their responses to activities and sharing of ideas following group discussion elongated
the enactment of activities in cycle 1. Hence Set 3 activities were not carried out in the
first cycle. However, performance on these areas was observed in both pre-test and
post-test so information about pre-service teachers’ understanding on this aspect could
still be inspected. It is at least possible that an improved understanding of an advanced
topic such as density may occur as result of attention to “the basics” knowledge of
decimals.

76
Figure 4.9: Set 3 activities: Density of decimal numbers
Set 3
16. Use the LAB to construct pairs of the given decimals in Set A (see below). For each pair, please check whether you could find decimals in between the pair of numbers. If yes, please
name the number, and explain how you find the number of decimals.
17. Use the number line to locate the pair of decimals given in the Set B, and discuss whether it is possible to find any number in between a given pair.
18. What can you conclude from working with the problems above? 19. Can you find any decimal that is bigger than 0.36666601? 20. Can you find any decimal that is bigger than 99.999999? 21. Locate the following numbers in the number line below:
a) 2, 2 ¼, -1, 31 , 0.3333333, 0.3334, 2.25
b) 1.5, 51 , 0.21, 1/10, 0.1, 0.010, 0.100
c) –1.5 61 , 0.6, –0.9999, 0.9999, 0.501
0.9 1 0.66 0.666 1.21 1.23 1.5 1.51 1 1.001
Set A
0.1 0.11 0.7501 0.7501 0.600 0.60001 2.2452 2.245201 0.366666 0.3666601
Set B
0 1
0 1
0 1

77
4.5 Teaching experiment phase
The aim of the first teaching experiment is to investigate how the LIT plays out in
the participating classes and whether the implementation of activities improve pre-
service teachers’ CK and PCK of decimals. Section 4.5.1 will discuss findings from
classroom observations and responses in worksheets of the activities. Note that not all
the activities designed to be implemented in cycle 1 were carried out. Activities in Set 3
which were designed to address density of decimals and relative magnitude of decimals
had to be left out due to time constraints. Section 4.5.2 will present findings from
pre/post-written tests along with insights gathered from pre/post course interviews that
deepen our understandings about the results on the content knowledge. In Section 4.5.3,
findings related to PCK from both written tests and interviews will be discussed.
4.5.1 During the teaching experiment
This section describes the findings during the teaching experiment gathered
mainly from observation of the groups during the whole class discussions and repeated
viewing of the videotapes of 5 groups and written responses to the activities. Most of
pre-service secondary groups consisted of 5-6 people due to the large size of the class
(64 people at the start of teaching experiment). In contrast, pre-service primary teachers
work in groups of 3-5 people as the size their classes allowed for smaller groupings
(range from 36-38 per class). In line with the Guided reinvention tenet, the activities in
cycle 1 were carried out with limited formal teaching. Pre-service teachers were
expected to construct new knowledge through their engagement in carrying out and
discussing various activities. Opportunities to address and resolve misconceptions were
taken up during the whole class discussions led by the lecturers.
4.5.1.1 Outcomes from Set 1
As predicted in the LIT, in Set 1- Activity 1 and 2 explored relationships between
different pieces of LAB and connections of LAB pieces with decimal and fractional
notation, could be completed without much difficulty. Note that unlike in the trial phase
when the longest piece was called “one rod”, in the main study of cycle 1, the longest
piece was just called “one”. This is to avoid the complicated problem of naming the

78
pieces based on their physical appearance as found in the trial stage. Interestingly, most
groups utilized one tenth relations between LAB pieces of subsequent length to
establish the names for the other pieces. For example, the observation of group
discussions revealed that most groups started with finding the relationship between the
longest piece (one) and the one-tenth pieces. By noting that ten of the one tenth pieces
made one, most groups were able to establish the name one tenth. Successively, because
ten of the shorter pieces made one-tenth pieces and utilizing previous relation that ten of
one-tenth pieces made one, the name for that piece as a hundredth was established.
During their group discussion of this approach, a possibility of children associating one-
tenth with different pieces was raised by one member of the video-recorded group. This
remark emphasized the importance of a referent unit (one) in partitioning and
establishing the names of the other pieces.
Despite familiarity with symbolic notation of decimals and fractions, the activity
of establishing the names assisted pre-service teachers in understanding the meaning of
“one tenth”, “one hundredth”, and “one thousandth”. Written test and interview data in
Section 4.5.2 documented evidence on this phenomenon. In this respect, this activity
enabled pre-service teachers to revisit their understanding on the meaning of notation
0.1, 0.01, and 0.001.
The context of measuring a table or a chair (Set 1, Activity 3 and 4 in Appendix
A2) capitalized on the linear nature of LAB. Adding and subtracting strategies to get the
total length were observed. Interestingly, the majority of groups employed written
fraction operations to find the total length and converted the answers into decimals at
the end, e.g., 10005
1003
106 ++ = 1000
51000
301000600 ++ = 1000
635 = 0.635. It was posited that
strong focus on computational fluency and lack of emphasis in understanding of
decimal notation system in their prior schooling led to this preference to fraction
operations. Three groups (2 primary and 1 secondary) linked LAB with a ruler, a
reference to the metric system, to find the total length in cm and mm after measuring the
length of a tenth piece LAB in mm (approximately 1.1 mm). Apparently, a ruler is a
standard tool in solving measurement problems and these groups focus on finding the
length in metric measures. Whilst the use of ruler in the measurement context seemed
natural, the design of LAB was not intended to directly link to the metric measures. The
ruler has multiple units such as cm and mm, whereas LAB has only one reference unit.

79
Consequently all measurement result should be expressed in relation to the one.
However, both LAB and a ruler share a similarity in representing base ten relations.
In Set 1- Activity 5 (see Figure 4.10, Appendix A2) of constructing three decimals
that have same digits in different places using LAB, most groups note different value of
decimal digits in different places by observing different length of LAB model. Some
groups linked their sketches with the corresponding “expanded notation” as shown in
Figure 4.10. The first sketch illustrates a preference of fraction notation and operations
whereas the second sketch illustrates the link between pieces of LAB model with the
decimal place value system and its notation. Interestingly, more groups employed
fraction notation and operations (8 groups) than decimal notation (5 groups). The rest of
the groups only provided sketches of representations. This finding depicted a strong
association of decimal notation with fraction notation and operations as commonly
reflected in many Indonesian primary school textbooks.
Figure 4.10: Sketches of representations for 2.06, 0.26, and 0.206 in worksheet of Set 1- Activity 5
The following excerpt of discussion from one video-recorded primary group in
working with Set 1- Activity 5 showed evidence of pre-service teachers’ evolving
understanding of decimal notation and place value. An understanding of the additive
structure of decimals and the realization that place value for decimals could go beyond
ones and thousandths were particularly evident. Stacey, Helme, Archer et al. (2001)
articulated this as one of the strengths of LAB for teaching decimals. Moreover, the
notion of place value was articulated as the determining factor distinguishing three

80
decimals given in this task as documented in group discussion excerpts of one of the
video-recorded groups:
Susilo: A decimal number is a number that is composed by addition of ones, tenths, and
hundredths. Maya: But if you said that a decimal number is a number composed of ones, tenths and
hundredths, how about this example (i.e., 0.206), this decimal number is also composed of thousandths?
Susilo Yes, it can be composed by thousandths, ten thousandths, and so on. Nia: That’s right, because if we have twenty comma something, that is also decimals,
right? I think we can say that most primary school children might think that the value of 2, 0, and 6 are the same in these numbers, but in fact their values are not the same because their place value are different.
Responses to a task of rounding to hundredths in the context of length in Set 1 -
Activity 6 (see Figure 4.5) indicated some confusion in the interpretation of the
problem. Two groups interpreted this question as finding how many hundredths are in
the numbers and use rounding in their answers so finding 7 hundredths in 0.666 and 6
hundredths in 1.55569 instead. One group answered with division by 100 instead and
found 66.6 hundredths and 155.569 hundredths. Another group revealed a
misconception, by noting that using only hundredths, the closest length to 1.55569 is
100155 +
1000569 . This indicated that this group thought of the number 1.55569 could be
obtained by adding or joining two decimals 1.55 and 0.569, ignoring the place value
concept and associating decimals with fractions based on the length of decimal digits.
Despite the fact that this activity was able to uncover a decimal misconception,
misinterpretations to this activity suggested that this activity was ambiguous. Hence Set
1- Activity 6 was omitted in cycle 2.
Responses to Set 1- Activity 7 (see Appendix A2) about ideas to use LAB for
comparing two decimals revealed that most groups capitalized on decomposing
decimals in place value related terms of the decimal pairs before comparing the length
of LAB pieces needed to make the two decimals. For instance, noting that the value of
each digit in 0.9 and 0.90 in order to notice that both numbers have 0 ones, 9 tenths.
Hence both numbers could be represented with 9 tenths pieces of LAB. Eight groups
compared the length of 9 tenth LAB pieces and 90 hundredths LAB pieces and

81
capitalized on the relationship that 1 tenth LAB = 10 hundredth LAB pieces to
concluded that 0.9 = 0.90. Meanwhile seven groups utilized the multiplicative relations
between tenths and hundredths, i.e., 9 tenths = 90 hundredths in comparing decimals.
Three other groups showed reliance on syntactic procedures such as cancelling out zero
in 0.90 knowing that 109
10090
= so 0.90 = 0.9 or by writing zero at on the right end of 0.9,
which resulted in both decimals have the same number of decimal digits in their
solutions. This procedure is often referred to as the annexe zero algorithm or simply
annexing zeros. One group revealed a misconception of thinking 0.90 as 90 tenths. This
misconception has been labelled as ‘column overflow’ because of an analogy of
overflow to the left columns in whole numbers to decimals (see e.g., Stacey, Helme, &
Steinle, 2001; Steinle & Stacey, 1998a) and is one of the ways of thinking associated
with code L in DCT3a and DCT3b (see Table 2.1).
Similarly, most groups chose to decompose decimals in expanded notation using
LAB for comparing decimals with repeating digits such as 1.666 and 1.66. For instance,
explaining that 1.666 = 10001666 is smaller than 1.66 =
100166 because
10001666 =
10006
1006
1061 +++ could be represented by one piece, 6 of tenth pieces, 6 of hundredth
pieces and 6 of thousandth pieces of LAB, whereas 100166 =
1006
1061 ++ was represented
by one piece, 6 of tenth pieces, and 6 of hundredth pieces. Hence 1.66 is smaller than
1.666 because the LAB representation of the number is shorter. Only three groups
indicated reliance on the ‘whole number strategy’ of multiplying both 1.666 and 1.66
with 1000 and comparing 1666 and 1660 to determine the larger decimals, i.e., 1.666.
These explanations indicated positive impacts of the activities since most answers in the
pre-test in comparing decimals relied on either the annexe zeros algorithm or by
comparing the equivalent common fractions.
Another common strategy in determining the larger of pairs of decimals with
common initial decimal digits and decimals with repeating digits such as in comparing
1.1503 with 1.15 or in comparing 1.777 with 1.77, were the use of rounding or
truncating rule. Findings from interview and written tests, which will be discussed in
Section 4.5.2, confirm these strategies.

82
The outcomes of Set 1- Activity 8 on reflections of learning experiences in Set 1
and Set 1- Activity 9 on the articulation of future teaching ideas will be discussed
together with reflections and teaching ideas from Set 2 activities in Section 4.5.1.3.
4.5.1.2 Outcomes from Set 2
Set 2- Activity 10 (see Figure 4.11, 4.12, and 4.13 for illustrative responses)
requires pre-service teachers to explore various ways of interpreting a decimal number
by sketching out representations of the given decimal. The sketches and ways of
decomposing a decimal number reflect whether base ten structures are observed in
different representations for the same number. Worksheets of Set 2- Activity 10
documented that most groups could find 5 or more ways to express 1.230 or 0.123.
However, their sketches depicted different mathematical understandings, which can be
categorized as showing 10-grouping, 5-grouping and no-grouping (see Figure 4.11,
4.12, and 4.13). Note that in Indonesia, a decimal comma is used instead of a decimal
point to mark the ones column.
Of 29 groups that handed in their written work, only 6 groups reflected the 10-
grouping in their sketches. Four groups showed a combination of 5- and 10-grouping in
their sketches with dominant 5-grouping, and 19 groups showed no particular grouping.
This suggested that even though most groups could complete many possible alternatives
for decomposing decimals, they did not emphasize base ten structures in their solutions,
which was very important for teaching. The researcher also observed that most groups
did not work with the LAB model when sketching decimal representations. Instead, they
found solutions arithmetically by using addition, subtraction, multiplication, and
division. Prior learning experiences in decimals with heavy emphasis on symbolic
manipulations might cause them to be more comfortable working on the problems
arithmetically.

83
Figure 4.11: Sketches showing no particular grouping
Figure 4.12: Sketches showing five-grouping
Figure 4.13: Sketch showing ten-grouping
84
Capitalizing on experience in working with Set 2- Activity 10, pre-service
teachers were asked to decompose a decimal number into various extended notations
symbolically in Set 2- Activity 11 (see Figure 4.7). One common difficulty recorded in
responses of 11 groups (out of 29 groups), noting that 0.213 = 21 hundredths instead of
21.3 hundredths. As revealed in observation during group discussions, these groups
thought the answers should be in whole numbers which suggested that this activity was
ambiguous.
Findings in Set 2- Activity 12 with number expander to observe various ways of
expanding decimals were not satisfactory. The majority of groups (12 out of the 29
groups) attended to the technical aspects of working with the number expander instead
of focussing on the mathematical ideas. For instance, one group explained that with the
number expander finding the value of ones can be done by unfolding the ones, finding
the value of tenths by unfolding the tenth column etc. Seven groups linked the number
expander with multiple ways of decomposing decimals in related place value terms.
Refining this activity so that pre-service teachers could focus more on the mathematical
ideas in using the number expander and its connection with LAB was one of
recommendations for cycle 2.
4.5.1.3 Reflections on new learning experiences and ideas for future teaching
The novelty of using concrete models such as LAB and number expander for
learning decimals and their role in creating more active and engaging learning process
were two most common features noted as new learning points both in Set 1- Activity 8
and Set 2 -Activity 14. For instance, one of the primary cohort groups commented that
experience with the concrete materials helped them to move away from reliance on
rounding rule in comparing pairs of decimals as recorded in the following reflection
note in Set 2- Activity 14.
We learnt that decimal numbers which are used to be taught only using numbers can be represented using concrete materials so that students can actively engage in the learning process. In comparing decimals such as 0.123 and 0.1231, I used to think that 0.123=0.1231 using the rounding rule but after the learning experience, I know that 0.123<0.1231 because if I use LAB then 0.1231 is longer than 0.123.
(Hery’s group- Primary cohort)
85
Similarly, the following comments from the reflection notes of Set 2- Activity 14
worksheets illustrated different aspects of the activities that were perceived as most
valuable by pre-service teachers. The first and the third quotes confirmed that the
concrete models such as LAB and number expander were perceived as valuable learning
tools. It was clearly expressed in the first comment that experience with concrete
models and modes of learning during the teaching experiments had expanded pre-
service teachers’ ideas about new ways of teaching decimals. The second and third
comments below showed that various ways of decomposing decimals were new to
them. Moreover, this learning experience led to knowledge of different ways of
interpreting decimals. This is the first time for us to use concrete models in learning decimals. This helped us to become more creative in finding other models to learn decimals like a piece of paper, plasticine, which will be a concrete way to learn place value in decimals. We also experienced a new approach in learning decimals, namely by finding it for ourselves, sharing amongst groups and gaining feedback from the lecturer.
[Veni’s group- Secondary cohort]
We learnt how to differentiate different place value, ones, tenths, hundredths, thousandths, etc. Also we learnt finding different ways of decomposing the same decimals, for instance: 1.025 = 1 one, 0 tenth, 2 hundredths, and 5 thousandths but it also can be composed of 0 ones, 10 tenths, 0 hundredths, and 25 thousandths.
[Anik’s group- Secondary cohort]
We were pleased to learn new experience that we could not imagine before that there are different ways of presenting a decimal number… Learning decimal numbers was much easier when we use media or concrete models. We will use concrete models in teaching decimals in the primary school.
[Diana’s group – Primary cohort]
Some groups perceived the mode of learning, which encouraged active
engagement with the content, (e.g., Hery’s group and Veni’s group) as an insightful
approach. They also commented that this approach implied the shift of role for teachers
to act more as a facilitator in the learning process, which was in line with the intention
of the study on the method of delivering the activities.
In teaching ideas articulated in Set 1- Activity 9 and Set 2- Activity 15,
incorporating the use of concrete models to help students in creating meaningful
understanding of decimals was dominant. However, many groups voiced concerns about

86
the affordability of providing LAB in teaching decimals on the reflections in Set 1-
Activity 7. They suggested the use of models similar to LAB but made from materials
such as straws, bamboo sticks, or wood. For the teaching experiment in this study, LAB
was made from aluminium steel. Concern about logistics in arranging pieces of LAB
with primary school children in the classroom was another point highlighted by pre-
service teachers. Whilst these issues on practical and technical aspects of the use of
models in classroom situations were important, reflections on the mathematical
principles observed in the models are preferable but fewer were found in teaching ideas
of cycle 1.
Interestingly one group from the primary cohort proposed the use of money (ten
thousands rupiahs, one thousand rupiahs, and one hundred rupiahs) to show a tenth, a
hundredth and a thousandth relations as teaching ideas in Set 1- Activity 9 (see
Appendix A2). Despite the fact that Indonesian money system works on the basis of
whole numbers, this idea indicated an understanding of the act of combining and
partitioning into ten as the basis of decimal system. It should be noted that this response
was an exception as this group was able to link the decimal relations in whole numbers
and not only in decimal numbers.
Note that there Set 3 was not carried out in cycle 1 due to the time constraints.
Hence Set 3 will be trialled for the first time in cycle 2.
4.5.2 Findings from tests and interviews on Content Knowledge
As noted earlier, both tests and interviews were administered on two occasions
during the teaching experiment phase, prior to and after participation in the set of
activities. Discussion of findings from pre and post-tests as well as pre and post-
interviews will focus on data gathered from 118 pre-service teachers who sat both tests
in order to gain a better indication of the impact of the activities (see Section 4.1). Pre-
service teachers’ content knowledge on various areas of decimals was evaluated by
examining performance in DCT3a and DCT3b and Part B of the tests as well as
responses in the pre- and post course interviews. Analysis of responses to DCT3a and
DCT3b identified the most problematic item types for pre-service teachers and

87
predicted pre-service teachers’ underlying thinking behind the observed patterns of
errors on various item types.
4.5.2.1 Decimal Comparison Test
Both cohorts showed improvement in their performance of DCT3a as shown by
the increased percentage of pre-service teachers who made no errors in DCT3a from
45.7% to 61% in DCT3b. Pre-service teachers from both the primary and the secondary
cohort recorded improvement with the secondary cohort outperformed the primary
cohort as shown in Table 4.2.
Table 4.2: Number and percentage of pre-service teachers with no errors in two cohorts
Pre-test Post-test Cohorts
Total number of
PSTs Number of PSTs with no errors
% no errors Number of PSTs with no errors
% of no error
Primary 67 15 22.4% 27 40.3%
Secondary 51 41 80.4% 45 88.2%
TOTAL 118 56 45.7% 72 61.0%
Table 4.3 presents the distribution of pre-service teachers’ ways of thinking
diagnosed according to Steinle & Stacey (2004a) and given in this thesis in Figure 4.3.
The proportion of A1 pre-service teachers (‘Apparent experts’) increased to
approximately three quarters of the combined cohorts. There was only one pre-service
primary teacher who was identified as holding any form of ‘Longer-is-Larger’ thinking
(L1, L2, L3, L4). He moved to unclassified category (U1) in the post-test.
Table 4.3: Number and percentage of pre-service teachers in various thinking classification
Pre-test Post-test Thinking Classification Number of
PSTs Percentage of PSTs
Number of PSTs
Percentage of PSTs
A1 66 55.9% 89 75.4% A2 12 10.2% 4 3.4% A3 18 15.3% 6 5.1% L3 1 0.8% 0 0.0% S1 4 3.4% 2 1.7% S3 1 0.8% 2 1.7% S4 1 0.8% 0 0.0% U1 14 11.9% 15 12.7% U2 1 0.8% 0 0.0%
Total 118 100% 118 100%

88
There were a total of 6 pre-service teachers from the primary cohort identified as
holding various ways of ‘Shorter-is-Larger’ thinking (S1, S3, S4). Of those 6 pre-
service teachers holding ‘Shorter-is-Larger’ thinking, one third of them persisted as
holding ‘Shorter-is-Larger’ thinking, one third moved to A1 thinking and one third
moved to Unclassified (U1) category. This trend is in line with Steinle’s (2004)
prediction that ‘Shorter-is-Larger’ thinking is more prevalent in post-school students
than in ‘Longer-is-Larger’ thinking and also Steinle & Pierce’s study (2006) in
involving student nurses.
Figure 4.14 shows that both cohorts improved as the percentage of pre-service
teachers holding A1 thinking rose and the percentage of pre-service teachers holding
one of the error patterns of thinking decreased except for U categories in the primary
cohort which remained the same. The primary cohort showed a wider range of
variability in difficulties in interpreting decimal notation.
Figure 4.14: Classifications of responses to DCT3a and DCT3b from two cohorts in cycle 1
Both cohorts demonstrated misconceptions associated with inappropriate use of
rounding/truncating rules, apparent in type 4 and 4R items (see Figure 4.15) which
consists of decimals with the same digits in the first two decimal digits or finite repeated
digits such as comparing 4.45 with 4.4502 or 3.7 with 3.77777. Those who are not
holding L or S thinking but showing consistent error patterns in these items were
identified as holding A2 thinking (see Table 2.1). As noted in the previous section, lack
Classification of Thinking PrimaryLongitudinal
0%
10%
20%
30%
40%
50%
60%
70%
80%
90%
A1 A2 A3 S L U
PRE POST
Classification of Thinking Secondary Longitudinal
0%
10%
20%
30%
40%
50%
60%
70%
80%
90%
A1 A2 A3 S L U
PRE POST

89
of exposure to decimals with more than three decimal digits coupled with strong
reliance on rounding and truncating in schools contributed to the dominance of
rounding/truncating strategy. These misconceptions relate to pre-service teachers’
understanding of only the first few decimal places. Figure 4.15 presents the percentage
of pre-service teachers’ errors in matched item types of DCT3a and DCT3b from both
cohorts. Note that T1 refers to type 1 items, T2 refers to type 2 items of DCT3a and
DCT3b (see Table 3.2 for detail of item types).
Figure 4.15: Percentage of pre-service teachers’ error on DCT3a and DCT3b by matched item types
Percentage of Errors by Matched Types for Pre and Post test Primary
Longitudinal
0%
10%
20%
30%
40%
50%
60%
T1 T2 T3 T4T4R T5 T8 T9
T10 T11
pre-testpost-test
Percentage of Errors by Matched Types for Pre and Post Tests
Secondary Longitudinal
0%
10%
20%
30%
40%
50%
60%
T1 T2 T3 T4T4R T5 T8 T9
T10 T11
pre-test post-test
Findings from the pre-course interviews also confirmed reliance on rounding and
truncating strategy in solving type 4 and type 4R items as articulated by five of the
fourteen interviewees. The following interview transcripts showed this tendency of one
primary pre-service teacher, Hery, who utilized rounding and noted that 4.4502 and 4.45
were equal. However, he also showed a misconception associated with thinking of
decimal digits as reciprocals. This suggested that Hery applied a mixed of strategies
related to A2 and S3 thinking which explained his being diagnosed in Unclassified
category (U1) in the pre-test:
Researcher: So could you explain your thinking in solving this problem? [Referring to a problem to choose the larger decimal between 4.4502 and 4.45] Hery: Well, I round the numbers to two decimal places 4.45 so they are the same.
Researcher: But if you don’t round the numbers, are they the same? Hery Different, of course 4.45 is larger Researcher: Why is that?
Hery: Because 4.4502 is 4 and 4502
1 , whereas 4.45 is 4 and 451 so when we
divide, this one (4.4502) is smaller.
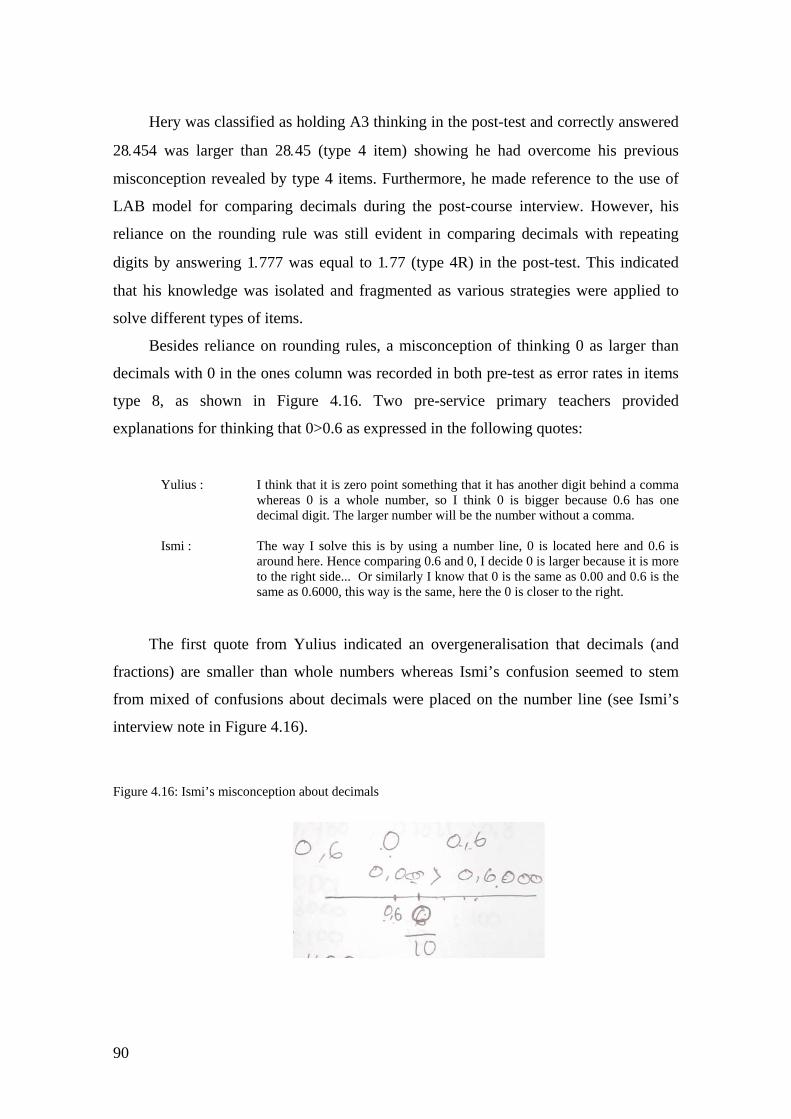
90
Hery was classified as holding A3 thinking in the post-test and correctly answered
28.454 was larger than 28.45 (type 4 item) showing he had overcome his previous
misconception revealed by type 4 items. Furthermore, he made reference to the use of
LAB model for comparing decimals during the post-course interview. However, his
reliance on the rounding rule was still evident in comparing decimals with repeating
digits by answering 1.777 was equal to 1.77 (type 4R) in the post-test. This indicated
that his knowledge was isolated and fragmented as various strategies were applied to
solve different types of items.
Besides reliance on rounding rules, a misconception of thinking 0 as larger than
decimals with 0 in the ones column was recorded in both pre-test as error rates in items
type 8, as shown in Figure 4.16. Two pre-service primary teachers provided
explanations for thinking that 0>0.6 as expressed in the following quotes: Yulius : I think that it is zero point something that it has another digit behind a comma
whereas 0 is a whole number, so I think 0 is bigger because 0.6 has one decimal digit. The larger number will be the number without a comma.
Ismi : The way I solve this is by using a number line, 0 is located here and 0.6 is
around here. Hence comparing 0.6 and 0, I decide 0 is larger because it is more to the right side... Or similarly I know that 0 is the same as 0.00 and 0.6 is the same as 0.6000, this way is the same, here the 0 is closer to the right.
The first quote from Yulius indicated an overgeneralisation that decimals (and
fractions) are smaller than whole numbers whereas Ismi’s confusion seemed to stem
from mixed of confusions about decimals were placed on the number line (see Ismi’s
interview note in Figure 4.16).
Figure 4.16: Ismi’s misconception about decimals

91
It was interesting the way she noted the relationships between 0 and 0.00 and
between 0.6 and 0.6000. Her conclusion of 0.00 > 0.6000 indicated denominator
focussed thinking (S1), based on overgeneralisation that any ten thousandths is smaller
than any hundredths. Note that pre-service teachers who made mistakes in type 8 only
showed a serious problem in their understanding of decimals. However, they might be
still classified as A1, on their responses to basic items.
4.5.2.2 Results of Part B of the written tests
Overall, pre-service teachers from both cohorts showed improvement in their
content knowledge of decimals in cycle 1 as shown in Table 4.4, as measured by Part B
of the written test (see Appendix B1 and Appendix B2). These significant
improvements suggested positive impact of the activities. However, the mean of total
scores in Part B, particularly of the primary cohort signified inadequate knowledge of
content areas of decimals assessed in this study. Even at the post-test, the mean score
for the primary cohort was only around 50% (14.34 out of 27).
Table 4.4: Paired t-test on the total score of Part B (out of the total score of 27)
Pre-test Pos-test Cohort N Df
Mean Standard dev (SD) Mean Standard dev
(SD) t value p value
Primary 67 66 11.98 6.5 14.34 6.39 8.844 p=0.000
Secondary 51 50 21.03 3.53 22.25 3.94 8.313 p=0.010
Figure 4.17: Box plot representing Part B total scores in pre-post of two cohorts
CohortSecpri
30
25
20
15
10
5
0
73
118
Post-test Part B scorePre-test Part B score

92
Examining performance in various content areas, the results of paired t-tests in
Table 4.5 and Table 4.6 showed similarities and differences in trends of improvements
in content areas. The secondary cohort consistently outperformed the primary
counterparts in all content areas. This superior performance of the secondary cohort was
not surprising as in general they had higher initial entrance score of mathematics. The
high initial mean score of the secondary cohort in some content areas also implied there
were not much room for improvement to be observed. However, as discussed later, the
high mean scores could also be due to the lack of sensitivity of the written tests in
picking up the incorrect thinking. This will be expanded in the discussion of findings in
each of the content area and changed for cycle 2.
Both cohorts recorded significant improvement on decomposition of decimals and
showed significant decline on sequencing of decimals. Moreover, both cohorts showed
no significant improvement on relative magnitude of decimals, measured in content
areas of placing decimals on the number line and finding the closest decimal to a given
decimal. The difference between the two cohorts was recorded on identifying place
value names of a decimal digit, where the primary cohort showed significant
improvement whilst the secondary cohort had little room for improvement.
Table 4.5: Mean pre- and post-test Part B scores of the primary cohort (N=67, paired t-tests)
Table 4.6: Mean pre- and post-test Part B scores of the secondary cohort (N=51, paired t-tests)
Pre-test Pos-test Content Areas df
Mean SD Mean SD t value p value Identifying place value names 66 1.60 1.060 2.43 0.908 6.022 0.000 Decomposition of decimals 66 0.73 0.931 2.85 1.340 13.027 0.000 Density of decimals 66 1.28 1.799 1.52 1.778 1.158 0.251 Sequencing of decimals 66 2.06 1.516 1.13 1.445 1.952 0.000 Ordering of decimals 66 2.24 1.859 2.72 1.695 4.504 0.055 Decimals on the number line 66 2.47 1.269 2.51 1.138 1.280 0.205 Closeness to a decimal 66 1.81 1.203 1.97 1.058 2.157 0.035
Pre-test Pos-test Area df
Mean SD Mean SD t value p value Identifying place value names 50 2.61 0.493 2.71 0.701 0.927 0.358 Decomposition of decimals 50 1.69 1.334 3.45 1.083 9.040 0.000 Density of decimals 50 3.14 1.456 3.25 1.495 0.622 0.537 Sequencing of decimals 50 3.69 0.735 2.90 1.404 0.704 0.001 Ordering of decimals 50 3.84 0.543 3.76 0.651 3.606 0.485 Decimals on the number line 50 3.33 0.712 3.22 0.808 0.979 0.332 Closeness to a decimal 50 2.82 1.396 3.10 1.285 1.188 0.240

93
Pre-service teachers from the primary cohort improved significantly in explicit
names of place value (see row 1 of Table 4.5). The initial mean score of this cohort
(1.60 out of 3) indicated pre-service primary teachers’ weak knowledge of place value.
Moreover, a common error pattern to identify the place value of a decimal digit based
only on the length of decimal digits signified lack of place value understanding in the
pre-test (Item 1a, b, c in Part B, see Appendix B1). The value of digit 1 in 9.31 was
identified as a hundredth (apparently correctly), and the value of digit 1 in 5.1064 was
identified as a ten thousandth. There were 45 pre-service teachers showed this error
pattern in the pre-test of cycle 1 and a majority of them were from the primary cohort.
Fortunately this error pattern was not persistent, with only 8 pre-service teachers
indicated this problem in the post-test. Observation of an error pattern in identifying
place value names also suggested lack of sensitivity of the written test items to pick up
this error pattern in cycle 1. The high initial mean score of 2.61 out of 3 of the
secondary cohort which gave little room for improvement might be due to this lack of
sensitive items. Hence, confirmation about this error pattern will be tested with an
additional test item in cycle 2.
Both cohorts recorded the weakest performance in Item 2a and 2b (see Appendix
B1) on decomposing decimals (see row 2 of Table 4.5 and 4.6) in the pre-test but made
the most significant improvements on this area in the post-test. Lack of place value
understanding, higher proportion of blank answers, and unfamiliarity with various ways
of interpreting decimals were amongst the factors contributing to this weak performance
in this area. Scant knowledge of place value was indicated by re-ordering decimal
digits, e.g., decomposing 0.375 = 5 one + 7 tenths + 3 hundredths + 0 thousandths, or
0.375 = 0 one + 5 tenths + 7 hundredths + 3 thousandths, or 0.375 = 0 one + 7 tenths + 3
hundredths + 5 thousandths. This is evidence of a classic misconception that is referred
to as ‘reverse thinking’ by Stacey and Steinle (1998). However, the DCT is known not
to identify this misconception very well.
Furthermore, responses in the pre-test showed that most pre-service teachers from
both cohorts were not aware of multiple ways of decomposing a decimal number. Pre-
service teachers’ unfamiliarity of different ways of decomposing decimals was
confirmed in the interview transcripts. Some interviewees noted that they were only
familiar with one standard way of interpreting a decimal number in their schooling

94
experience. Consequently, it was not surprising that both cohorts started with half of the
cohorts giving only one correct alternative, i.e., 0.375 = 0 one + 3 tenths + 7 hundredths
+ 5 thousandths. Both cohorts gained advantage from the teaching as majority of pre-
service teachers could provide more than 4 correct alternatives for each decomposition
item as can be seen in Figure 4.18.
Figure 4.18: Performance in decomposing decimals (Item 2a,b in Part B) from both cohorts
Pre-service Primary: Decomposing 0.375 and 0.753
01020304050607080
0 1 2 3 4
number of correct alternatives
perc
enta
ge
pre-testpost-test
Pre-service secondary: Decomposing 0.375 and 0.753
01020304050607080
0 1 2 3 4number o f co rrect a lternat ives
perc
enta
ge
pre-testpost-test
Pre-service Primary: Decomposing 1.025 and 2.051
01020304050607080
0 1 2 3 4
number o f co rrect a lternat ives
perc
enta
ge
pre-testpost-test
Pre-service secondary: Decomposing 1.025 and 2.051
01020304050607080
0 1 2 3 4
number of correct alternatives
perc
enta
ge
pre-testpost-test
Similarly, the pre-course interview data with Andin, a pre-service primary teacher,
provided a confirmation of her identifying the right most digit as the tenth (reverse
thinking) (see Figure 4.19 below). This thinking was evident in her decomposing
decimals in Part B item 2a and b. An improvement was observed in the post-test as she
could give one correct alternative in decomposing decimals (Item 2a and 2b, Appendix
B2).

95
Figure 4.19: Andin’s explanation for her erroneous interpretation of 555.555
Density of decimals was another content area that both cohorts showed no
significant improvement (see row 3 of Table 4.5 and Table 4.6). However the mean
scores in both tests for the two cohorts showed wide gap between their performances.
The performance of the primary cohort in both tests was particularly alarming on this
area. In contrast, the mean score of the secondary cohort of 3.14 (out of 4) indicated that
pre-service secondary teachers might have a good knowledge about density of decimals.
However, explanations on the written tests and interview data, items to assess density of
decimals in cycle 1 (item 5 and 6 of Part B) revealed the limitation of the items to
discriminate clearly those who thought there were finitely or infinitely many decimals in
between the pair of given decimals.
A majority of incorrect answers from the primary cohort to density items reflected
incorrect association of decimal digits with whole numbers. Interestingly, some pre-
service teachers employed subtraction to find the number of decimals in between two
decimals in the pre-test of Part B Item 5 and 6 (see Appendix B1), particularly in the
primary cohort responses. This response might be triggered by the question format of
asking how many numbers in between two decimals. Some pre-service teachers
suggested no decimal number in between 0.899 and 0.90 and noted that 0.899 was the
same as 0.90 suggesting inappropriate use of rounding. The textbook approach, which
overemphasized rounding to two or three decimal digits, seemed to delimit pre-service
teachers’ understanding of density of decimals as well as giving the impression that
digits beyond the second or the third have no meaning. This lies behind A2 thinking
(see Table 2.2). Another incorrect answer to Item 5 and 6 was related to a common
practice of working with decimals numbers of the same lengths as showed by Novo’s

96
written explanations (see Figure 4.19) recorded during the pre-course interview excerpt
below:
Figure 4.20: Novo’s explanation in respond to pre-test Item 5 in Part B about density of decimals
Novo: First I thought that since 3.14 equals to 3.140 equals to 3.140000 and so on. Similarly 3.15 is the same as 3.150 and 3.15000 and so on. Then the interval between them can be 10 and between this one (3.1400) and this one (3.1500), the interval is in thousandths (sync) so there should be more than 200 because thousandths implies that there will be more than 200. I personally think that there are 998 but because the option is only more than 200 then I choose the one with more than 200 as an option.
Apparently Novo’s thinking showed reliance on strategy of working only with
decimals with the same length, which consequently led to the answer there were finitely
many decimals in between two decimals. A similar way of thinking was also evident in
Maya’s and Nara’s pre-course interview responses below:
Maya: I think that between 3.14, and 3.15 there is a difference like between 2 and 3 so I think starting from 3.14 there must be 3.141, 3.142, 3.143, and so on until 3.15. How many are there? Well, last time I counted … perhaps there were about nine?
Nara: 3.142, 3.143, 3.144 and so on until it get close to 3.15. I think there are finite numbers in between because 3.15 is a fixed number.
Pre-service teachers who answered there were infinitely many decimals in
between two decimals also failed to provide satisfactory justifications both in the pre-
test responses to Part B item 5 and 6 and also in the pre-course interviews. The language
employed such as “adding more digits” or “infinite zeros behind the last decimal digit”
in the following pre-course interview excerpts which reflected reliance on a procedural
approach.

97
Ayi: I remember that behind 3.14 there are infinitely many zeros, it can go very long so I imagine that from 0 we can make infinite digits. It can start from unit to tenths so clearly there are infinitely numbers in between.
Tinton : Because the number of digits behind the decimal comma are infinite. Sasti: Because in between 3.14 and 3.15 there are tenths, hundredths, and thousandths and the
decimal digit that is larger than 5 will be rounded up. Only a small number of pre-service teachers provided sound explanations about
the density of decimals as illustrated below. Apparently some explanations concerning
the density property marked different traits of the two cohorts in terms of mathematics
subjects they took up during their training. The fact that the pre-service secondary
cohort had more exposure to properties of different number systems including the real
numbers allowed them to provide explanations using knowledge obtained from other
courses.
Susilo: Because after 3.14, there are 3.1401, 3.1402, 3.140021 and if we continue up to 3.15,
there will be so many of them. It is infinite because this 3.14 is in hundredths, if we add one more digit; it will be thousandths, 3.141 and if we add more digits until perhaps hundred thousandths or millions then there will be so many. There will be infinitely many of them.
Retno: In between 3.14 and 3.15 there are more than 5 numbers, one of them is 3.142. In
between 3.14 and 3.142 there are also more than five decimal numbers so following this thinking there are infinitely many numbers in between 3.14 and 3.15.
Ayi: Because decimals are a subset of real numbers so they satisfy the dense property of real
numbers.
Besides positive improvement observed, both cohorts recorded decline on
sequencing of decimals (row 4 of Table 4.5 and Table 4.6). High cognitive load of
problems of finding the sequence of the next three decimals (Item 4a, 4b of Part B) and
lack of comparability between pre-test and post-test items were the identified factors to
explain the decline on this content area items assessing knowledge in sequencing
decimals. Moreover, the common incorrect answers in cycle 1, such as sequencing
decimals 0, 0.05, 0.10 after 1.5, 1, 0.5, indicated weak knowledge of place value and
negative decimals. The common incorrect answer in the post-test item of finding the
next three decimals in the sequence 1.4, 1, and 0.6, i.e., 0.2, 0.08 and 0.04 confirmed

98
pre-service teachers’ difficulties in working with negative decimals. Hence, a decision
to refine the written test items in cycle 2 on sequencing of decimals was made.
Similarly both cohorts showed no significant improvement in ordering decimals
(row 5 of Table 4.5 and Table 4.6). The majority of pre-service teachers showed no
difficulty with ordering five decimals in Item 3a and 3b of Part B (see Appendix B2). In
contrast, the primary cohort showed a variety of incorrect responses as also observed in
DCT responses. Based on this, it was decided to omit ordering of decimals from written
test of cycle 2.
Weak knowledge on relative magnitude of decimals was evident particularly in the
primary cohort as reflected in low initial mean scores in both identifying or locating
decimals on the number line (row 6 of Table 4.5 and Table 4.6, item 7, 8, 9 from Part B
Appendix B2) and finding the closest decimal to a given decimal (row 7 of Table 4.5
and Table 4.6, item 10, 11 from Part B Appendix B2). Moreover, difficulties in locating
negative decimals on the number line were found in the primary cohort and were
reflected in the low mean scores on this content area in both pre- and post-tests.
Note that word problems (item 12, 13, 14, 15, 16 from Part B Appendix B1 and
Appendix B2) were excluded from the paired t-test analysis of cycle 1. The decision
was made based on the fact that most responses focused on finding the exact answers
and ignored the context set in these problems. For instance, when asked how many
package of 100 grams need to be bought for 1.25 kg of flour, many answered 12.5
instead of 13. Prior learning experiences which lack exposure to contextual items and
have strong emphasis on computational skills played a role in low rate of success with
contextual items as suggested in the following interview excerpt: Susilo: In the past, we were directly taught to find the decimal 0.6. My teacher did not focus on
the understanding of decimal notation. We were given a lot of exercises to do that but no real life examples given, just sample problems and explanations how to solve the problems.
In summary, the activities in cycle 1 improved pre-service teachers’ knowledge
of place value and various ways of interpreting decimal numbers. These areas were the
main focus of the activities in this cycle. Content areas that indicated no improvement
such as density, relative magnitude of decimals, ordering of decimals were not covered
in the activities in this cycle due to lack of time. Hence lack of improvement in these

99
areas did not reflect the effectiveness of activities. Meanwhile the decline in sequencing
decimals could be explained by higher level of difficulties in the post-test items.
Similarly, difficulties with word problems suggested a tendency to focus on
computational fluency and ignoring the context of the problem. These findings will be
taken into account in the design of the activities in the second cycle. Section 4.6 will
address these issues.
4.5.3 Findings from tests and interviews on Pedagogical Content
Knowledge
In examining the pedagogical ideas on the teaching and learning decimals, the
responses to Part C of the written tests (see Appendix B1 and Appendix B2) were
scored and classified into low, medium and high based on the scoring rubric (see Table
3.5). Common themes recorded in teaching ideas will be reported and illustrative
examples will be presented to get a complete picture of pre-service teachers’ evolutions
in teaching ideas for decimals.
Improvement in pedagogical ideas was indicated by the progress of the 118 pre-
service teachers in various classifications based on their scores in Part C of the written
tests. The total score of Part C was classified into low, medium, and high based on the
following criteria. Total score 0 to 3 out of 9 are classified as low, total score of 4 to 6
out of 9 are classified as medium, and total score 7 to 9 out of 9 are classified as high
PCK. The proportion of pre-service teachers who were identified as having low PCK
dropped from 55.9% in the pre-test to 32.2% in the post-test, and the percentages of
those identified as having high PCK increased from 2.5% to 13.6% in the post-test (see
Table 4.7). Table 4.7: Distributions of pre-service teachers in various categories in Part C of cycle 1 (N=118)
Post-test (%) Pre-test (%) Low Medium High Total
Low 27.1 25.4 3.4 55.9
Medium 5.1 27.1 9.3 41.5
High 0 1.7 0.8 2.5
Total 32.2 54.2 13.6 100

100
Both cohorts improved significantly from the pre-test to the post-test. Significant
improvement of pre-service teachers’ pedagogical ideas was confirmed by the result of
paired t-tests on the overall score of Part C as presented in Table 4.8. However, despite
significant improvement in the post-test, both cohorts still documented a lack of
satisfactory explanations in teaching ideas as reflected in the low mean scores of both
cohorts.
Table 4.8: Mean pre- and post-test Part C score (total score out of 9) Pre-test Pos-test
Cohort N df Mean Standard dev (SD)
Mean Standard dev (SD)
t-test p value
Primary 67 66 2.00 1.303 3.61 2.181 7.228 0.000
Secondary 51 50 4.69 1.378 5.39 1.484 2.944 0.005
Figure 4.21: Box plot representing PCK scores in pre-post of two cohorts
CohortSecpri
10
8
6
4
2
0
90
8194106
7985
111114
73
Post-test PartC scorePre-test PartCscore
One of the common problems in both cohorts was lack of attention to teaching
ideas. The performance of the primary cohort was particularly alarming. A high
proportion of blank answers as well as fragmented content knowledge contributed to
this low performance in this area. For instance, 21 pre-service primary teachers did not
provide any teaching ideas in the pre-test of Part C Item 19 (see Appendix B1) to
diagnose and to resolve students’ misconception in ordering 0.3<0.34<0.33333. The
fact that no blank responses were recorded in the secondary cohort ruled out the
possibility of lack of time in completing the test to explain this trend in the primary
cohort.

101
Table 4.9: Paired t-test results of various items in Part C items of cycle 1
a: Pre-test items are given in Appendix B1 b: Post-test items are given in Appendix B2
As revealed in Table 4.9, of four PCK items covered in Part C items 17, 18, 19,
and 20 (see Appendix B1 for details of the items), the highest improvements were
observed in teaching ideas to compare decimals and to diagnose students’ errors in
ordering decimals (examined in item 17 and 19). Rounding to two or three decimals
digits was the most common strategy shared by both cohorts in teaching ideas to rectify
errors in ordering decimals in the pre-test item 19. The striking difference in the post-
test was reference to LAB model and extended notation of decimals for comparing and
ordering decimals.
Clearly both cohorts gained advantage from the models introduced during the
teaching experiment as indicated by the fact that many of them could provide three
different models for teaching decimals. Interestingly, the majority of pre-service
teachers proposed the use of linear models similar in principle to LAB such as bamboo
sticks, straws along with other models such as paper strips, plastic rope, and number
line. All pre-service teachers who participated in the post-course interviewees listed
LAB as one of the models for their future teaching ideas in decimals.
Pre-testa Pos-testb C
ohor
t No Area df
Mean SD Mean SD t value
p value
17 Teaching ideas for comparing pairs of decimals
66 0.76 0.676 1.18 0.716 4.378 0.000
18 Teaching ideas on division of decimals by 100
66 0.39 0.491 0.52 0.587 1.584 0.118
19 Diagnosis of students’ error in ordering decimals and teaching ideas to resolve it.
66 0.40 0.698 1.25 0.990 6.305 0.000
Prim
ary
20 Teaching ideas on the links between fractions and decimals
66 0.45 0.634 0.66 0.617 2.117 0.038
17 Teaching ideas for comparing pairs of decimals
50 1.31 0.583 1.51 0.505 1.697 0.096
18 Teaching ideas on division of decimals by 100
50 0.86 0.401 0.96 0.631 0.868 0.389
19 Diagnosis of students’ error in ordering decimals and teaching ideas to resolve it.
50 1.24 0.551 1.55 0.856 2.177 0.034
Seco
ndar
y
20 Teaching ideas on the links between fractions and decimals
50 1.27 0.777 1.41 0.669 1.155 0.254

102
Despite significant improvement observed in the post-test, extending the link
between pieces of LAB model with finding a decimal notation of a given fraction was
particularly challenging for a majority of pre-service teachers. Some pre-service
teachers made a remark that decimal notation for a fraction 31 should be limited to only
two or three decimal places to avoid confusion and complexity for primary school
students in the pre-test. This comment reflected the common practice in the primary
school textbooks, where discussions of decimals were often limited to thousandths. In
response to Part C post-test item 20, only two pre-service teachers could extend their
learning experience with models and incorporate it in their ideas for future teaching
such as explaining with LAB the link between the division algorithm and extended
notation for 61 . Nonetheless these findings indicated a promising impact of activities in
developing ideas for teaching decimals.
Teaching ideas in Part C Item 18 about explaining how to divide a decimal
number by a power of 10 (e.g., 100) indicated no significant improvement. Fragmented
memorized knowledge of the standard algorithm was evident in errors involving invert
and multiply algorithm to solve division of 0.5 by 100. Incorrect answers such as;
0.5 ÷100 = 105 ÷
1100 =
105 ×100 =
510 ×100 = 50 or 0.5 ÷100 =
105 ÷ 100 =
510 ×100 =
200 documented in the pre-tests showed evidence of the reliance on algorithms without
referencing to underlying meaning.
Only a few pre-service teachers were able to translate their extended notation of
decimals for ideas to teach division of decimals by 100 in the post-test. These pre-
service teachers expanded 0.3 as 0 + 3 tenths = 0 ones + 0 tenth + 30 hundredths = 0
ones + 0 tenths + 0 hundredths + 300 thousandths and then divided 300 thousandths by
100 to obtain 3 thousandths or 0.003 in the post-test. Obviously this explanation
signified an understanding of place value including additive and multiplicative
structures of decimals. Two pre-service teachers proposed similar teaching ideas by
utilizing LAB model and straws to represent 0.3 and then divided it into 100 smaller
pieces to get to 3 thousandths or 0.003. One pre-service teacher opted to explain this to
children by representing 0.3 not using tenths pieces but thousandths pieces, which

103
depicted her understanding of multiplicative structure between tenths and thousandths,
i.e., there are 100 thousandths in 1 tenth.
In response to cycle 1 post-course interview question on value judgement of the
models for teaching decimals (see Appendix B4), a majority of pre-service teachers
ranked LAB as the most accessible model for students as it reflected base ten
relationships among ones, tenths, hundredths and thousandths clearly and commented
on simplicity of the model due to its linear nature as expressed in the following
representative comments. Note that Ayi’s comment reflected the influence of an
additional task given by the lecturer in the secondary cohort to think about other models
for teaching decimals. This lecturer presented pre-service secondary teachers with a task
to compare LAB model with an area model or a volume model. Note however, that the
other lecturer did not present the task with pre-service teachers from the primary cohort. Hery: LAB is the easiest one because the relationships such as tenths, hundredths, etc are
reflected in the models. Meanwhile with a concrete model (from daily life) such as rock melon you need to (imagine) cut it into pieces and with number expander students need to fill in the numbers first. (Primary cohort)
Ayi: It is easier to use LAB because even though it looks like a three-dimensional model, the
prominent feature is length whereas with cube we have to consider the volume. With a paper [area based model] there is a problem of consistency in dividing into shorter/smaller pieces. Dealing with the spatial model is even more complex. (Secondary cohort)
Ismi: LAB is easier…. with LAB, I came to understand why we call these pieces tenths,
because there are ten tenths in a one. Similarly a hundredth consists of ten tenths, and a thousandth consists of ten hundredths. (Primary cohort)
Most of the models proposed in the post-course interviews were models
introduced in the activities. Whilst some comments tended to focus on the logistic and
physical characteristics of concrete models instead of the mathematical principles, it
was encouraging that many responses noted that the linearity of LAB as helpful in
noticing the decimal relations.
Examinations of common teaching ideas for decimals highlighted some interesting
similarities and differences between the two cohorts. The difference was that the
primary pre-service teachers incorporated more use of concrete models in their teaching
ideas than the secondary pre-service teachers in both pre- and post-tests. However, pre-

104
service teachers’ own confusions were depicted in some of these teaching ideas using
concrete or pictorial models. The use of models often signalled weak knowledge of
links between fractions and decimals as captured in the following pre-course interview
excerpts. This explained the lower scores of the primary cohort despite the fact that they
showed more awareness of teaching pedagogy as they took into account the
developmental stages of children’s thinking in their teaching ideas. The following
excerpts illustrated incomplete knowledge of two pre-service primary teachers observed
during their individual pre-course interviews. Dian: Using concrete materials, for instance using a cake as an example… Ehm, but a cake is
more like to help children learn fractions and not decimals. For decimals, we can multiply the numbers by tenths. (With the cake) well, 0.6 means that we have to find,… like if we need to find percents… how much is 0.6 of 1 so we divide the cake into equal pieces from one. Multiply it by six tenths of it, so … [we need to find] how many parts, right?… Probably six parts… I don’t know… I am weak in mathematics.
Ismi: Perhaps we can use daily experience, for primary school children, using word problem
such as sharing a cake. One cake is divided for several students; for instance there is one cake and there are ten students then we just need to divide one cake into 10 parts. [Interviewer: How will you represent 0.6 then?] One part is a tenth so if we are asked… if each child gets a tenth of one, then how many are … for instance there are four children. Four children means, ehm… it means that there are ten cakes, then if each child gets 2 cakes, then the total is 8 and we have 2 left over. Then we divide 2 into 4 children, so each child gets two and a half.
Dian, a primary pre-service teacher, apparently had incomplete ideas about the
relation between fractions and decimals. Her fragmented knowledge was indicated in
her first comment to suggest cake as a model for teaching fractions but not for teaching
decimals. Similarly, Ismi, a fellow pre-service primary teacher, also proposed sharing a
cake as a context to represent decimals. She was able to explain a model for one tenth
correctly but she showed difficulties in utilizing the same context to represent 0.6. Even
when she proceeded with an attempt to explain the model for ¼, she was unable to link
this with the corresponding decimal notation. She explained (see excerpt above) that a
quarter of 10 objects in 2 ½ objects but did not link to the question about decimals.
In fact, both cohorts showed lack of awareness about the use of models in teaching
and learning decimals could be attributed to limited exposure to models in learning
decimals as captured and expressed below by Ayi, a secondary pre-service teacher:

105
Ayi: From our learning experiences in primary school, we never learnt decimals using concrete models. Teacher used to explain in the black board without manipulative that could help us to understand decimal concept. We were not encouraged to participate actively in the learning process and to express our thinking.
Teaching ideas from the secondary cohort were dominated by the computational
approach and the proposed models were more abstract such as the number line. The fact
that the secondary cohort possessed better skills with some standard algorithms such as
the division algorithm might explain their stronger reliance on syntactic procedures in
their teaching ideas. However, interview transcripts revealed cases of pre-service
teachers from both cohorts who memorized the relations 31 = 0.333… and could not
explain this equivalence relation.
In summary, despite some improvements observed in teaching ideas for decimals
such as reference to basic notion of place value and structural properties of decimals,
the pedagogical content knowledge of most pre-service teachers was far from
satisfactory.
4.6 Retrospective analysis phase
This section starts with an overview of findings from various data sources in
answering the research questions. Reflections on the achievement of goals for the
activities and the contributing factors that afford or inhibit the attainment of those goals
will also be discussed in Section 4.6.1. Feed-forward recommendations for the next
research cycle will be articulated in Section 4.6.2.
4.6.1 Overview of Research Findings
There was an overall trend of improvement in both CK and PCK from both
cohorts after the teaching experiment. Performance on content areas of decimals
covered in the activities such as decomposition of decimals in expanded notation, and
ideas for comparing decimal numbers indicated clear improvements. However, findings
from pre-test and pre-course interviews identified some major difficulties, i.e.,
overgeneralization of rounding, and evidence of ‘Shorter-is-Larger’ misconceptions in
the primary cohort. Performance in some areas of decimal numeration that were not

106
addressed in the teaching such as sequencing of decimals declined in the post-test.
Besides lack of teaching, lack of comparability between pre- and post-test items might
explain the decline. A better match between pre- and post-test items as well as attention
to these areas of decimals is expected in the design of the next cycle. Meanwhile low
scores and lack of significant improvement in content areas such as density and
knowledge of relative magnitude of decimals on the number line signified the
importance of attending to these areas in the activities for the next cycle.
The initial state of pre-service teachers’ PCK for both cohorts was characterized
by the strong reliance of syntactic computational procedures and lack of ideas for
incorporating models in teaching decimals. Pre-service teachers’ knowledge of decimal
representation was limited to only the standard form of representation. This
characteristic of pre-service teachers’ PCK reflected influence of common teaching
approach in Indonesian classroom practice. Areas identified in the goals of the
activities such as decimal place value, interpretation of decimals, and continuous nature
of decimals were found to be problematic for most pre-service teachers. Hence the
importance of addressing those topics in the activities was confirmed.
Post-course interview data also revealed clear improvements in the ideas for the
use of models for teaching decimals. The use of concrete models in particular LAB was
observed by the researcher to mediate between the abstract notion of decimal notation
and its interpretations through hands on explorations and group discussions. However,
we found that the use of models might have not been well integrated in the activities as
many pre-service teachers still relied on syntactic rules in solving the problems.
Moreover, extending and linking the models with the standard algorithm proved to be
challenging for most pre-service teachers. This suggested that linking concrete models
with the standard algorithm was a mathematically challenging task. The fact that no
activity in cycle 1 was devoted in particular to assist pre-service teachers in linking their
experience with models and the standard algorithm explained pre-service teachers’
difficulty. In contrast, activities providing a clear direction in integrating models with a
mathematical task for comparing decimals (see Set 1 Activity 7) resulted in better
teaching ideas in corresponding topic. Hence more careful planned activities with a
clear direction to explore concrete models in making sense of standard algorithms
followed by classroom discussion might improve learning on this aspect.

107
Interactive modes of learning that focused on active participation in finding own
solutions and group discussions, and the use of concrete models, were noted as
contributing factors to the improvement. These factors were articulated by pre-service
teachers as documented in the reflections comments in Set 1 Activity 8 and Set 2
Activity 15 were consistent with some of the RME instructional principles (Treffers,
1987). However, interpretations of basic tenets of RME such as guided reinvention,
mediating model and didactical phenomenology were not yet clearly observed in this
cycle. This raised a concern about the integration of RME tenets in the design of the
activities in the first cycle. Hence integrating RME basic tenets in the design of the
activities needs to be improved in the next design. These aspects will be addressed in
more detail in Chapter 5.
Concerning the interpretation of didactical phenomenology, I hypothesised that
the measurement context used in Set 1 Activity 1 was a good context for introducing
decimals. However, building the connections between the context situation and the
formal decimal notation required some improvement. The preference of pre-service
teachers to rely on a computational approach suggested that the strong interference of
pre-service teachers’ existing knowledge of decimals. The mediating models tenet was
not well reflected in the design of the first cycle. For instance the link between the LAB
model and with the more abstract models such as number expanders and the number
line was not addressed well in cycle 1.
4.6.2 Feed forward for cycle 2
Findings from the first cycle signified the need to adjust the sequence of the
activities. In the introductory activities to explore LAB and establish the names for each
piece, focus should be placed on linking the materials with the symbolic representation
of decimals. Observation of group discussions revealed that some groups utilized a
standard measurement tool such as a ruler in solving the problem. Hence discussion
about the idea of partitioning into ten smaller parts in both models (LAB and rulers)
might be helpful in understanding the idea of decimals. An issue regarding the
integration of models in the activities was one of the concerns in the design of activities
for cycle 1. This challenge was in part caused by the fact that pre-service teachers had
already acquired symbolic knowledge. Encouraging pre-service teachers to use models

108
as a thinking tool in solving the problems will be made clearer in cycle 2. As different
models are involved, attention to the links among models such as LAB, number line,
and number expander become crucial. A challenge to refine activities so that pre-
service teachers can focus more on the mathematical ideas in using the models is one of
the feed-forward ideas for cycle 2.
Many pre-service teachers also showed difficulties in identifying decimal numbers
on the number line and have little idea about density of decimals. Hence extending the
LAB model and linking it with the number line model in the early stage of teaching
experiment will be a feature of cycle 2. Moreover, an activity to find a decimal number
in between two given decimals will challenge some misconceptions with decimals
including rounding/truncating thinking and the associated lack of meaning of the
decimal places beyond the first two or third. Attending to pre-service teachers’
misconceptions and problems was one of the aspects that should be improved in cycle 2.
The fact that some pre-service teachers left answers for PCK items blank in pre-
test and post-test indicates difficulties in finding ideas for teaching decimals.
Incorporating diagnostic questions based on hypothetical situations as part of the
teaching activities might encourage deeper engagement with the issues. Posing
diagnostic questions in the interview questions is another idea to gain more insights into
the thinking and misconceptions held by pre-service teachers. The post-course interview
in cycle 1 also missed out on addressing pre-service teachers’ self-evaluation about their
own evolution in understanding of decimals.
The importance of guiding group and classroom discussions to focus on key
concepts addressed in each goal was particularly important. Findings from cycle 1
indicate the activities made a positive impact on both cohorts despite some different
traits of the primary and secondary cohort. Further investigation in cycle 2 will either
confirm or not the different traits of the two cohorts and the impact of the activities on
these cohorts. Note that even though data collection will take place in the same
university and involve both primary and secondary pre-service teachers, the individual
pre-service teachers participating in the next cycle will be different. Where activities
remain unchanged, their effects will be trialled again with a new set of pre-service
teachers. Conjectures made based on the findings from cycle 1 regarding the nature of
the activities and the cohorts involved in the study will be tested and refined in cycle 2.

109
CHAPTER 5 GOING THROUGH PHASES IN CYCLE 2
5.1 Introduction
This chapter describes the phases leading up to and involved in cycle 2 and
findings gathered in each phase. The description will follow similar structure in
reporting phases and findings of cycle 1 in Chapter 4. First, Section 5.2 gives a
summary of the refined research instruments comprising written tests, interview
questions, activities and reasons leading to the changes. Moreover, I will explicate
findings from the trial phase of the refined instruments prior to cycle 2 along with
lessons learned from the trial in this cycle. Section 5.3 discusses the enactment of the
activities and describes the findings during the teaching experiment phase. In section
5.4, results of the pre-test and the post-test, pre-course interviews and post-course
interviews will be discussed, with an indication of any evolution of pre-service teachers’
content and pedagogical content knowledge. Finally, Section 5.5 concludes with the
retrospective analysis of cycle 2 and presents reflections on the overall findings
gathered in cycle 2.
Details of the data collection methods in relation to the research questions and
goals are summarised in Table 5.1. A total of 172 pre-service teachers sat for the pre-
test. After participating in the sets of activities, a total of 155 pre-service teachers sat for
the post-test which then formed a total of 140 longitudinal cases, 94 from primary
cohort and 46 from secondary cohort. Of 20 pre-service teachers who participated in the
pre-course interviews, 3 did not attend the post-course interview. One pre-service
teacher, who did not participate in the pre-course interview, demonstrated an interesting
way of thinking during group discussions and expressed her interest to participate in an
interview so she was involved in post-course interview. Her thinking and strategies in
the pre-test and changes she experienced after the teaching experiments were extracted
during the post-course interview. Following the same design structure as in cycle 1, pre-
service teachers worked in small groups of 4-6 people during the enactment of
activities. All the activities were carried out in the span of 4-5 meetings each lasting
approximately 2 hours. Similar to the conduct of teaching experiment in cycle 1, the

110
main strategies in delivering activities rely on pre-service teachers’ engagement in
activities on group works. There were 3 classes of the primary pre-service teachers and
one class of the secondary pre-service teachers.
Table 5.1: Overview of data sources in relation to research questions and goals
Methods Cohort Number of participants
Research questions*
Goals
Trial phase Pre-test
Volunteers 2 (Indo) - Trial test items and identify problems on test items
Observation of trial of activities
Volunteers
1 group (Indo)
- Test and identify problems in the activities
Pre-test Primary 119 1a Identify current state of CK (Appendix B5) Secondary 53 2a Identify current state of PCK Post-test Primary 108 1b Identify the evolved CK (Appendix B6) Secondary 47 2b Identify the evolved PCK Pre-course interviews
Primary 14 1a
(Appendix B7) Secondary 6 2a
Confirmation of the pre-test Identify initial ideas for future teaching
Post-course interview
Primary 13 1b Confirmation of the post-test Feedback for activities
(Appendix B8) Secondary 5 2b Identify evolved ideas for future teaching
Observation of activities (video and audio-recordings)
Primary Secondary
5 groups 1 group
1b 2b
Identify aspects in the activities that contribute to improvement of CK and PCK
* see Section 1.4
5.2 Design Phase 2
In this section, I will explicate the fine-tuning of instruments based on analysis of
findings and recommendations from cycle 1. The main refinements of different research
instruments will be explicated starting with refinements of activities, followed by
refinements of some of the written tests and interview questions. See Appendix A4 for
complete record of changes and refinement of LIT and Appendix B9 for record of
changes in written test items.
5.2.1 Refinement of the activities
A complete set of activities in cycle 2 can be found in Appendix A5 (Indonesian
version). As pointed out in the retrospective analysis of cycle 1, the activities in cycle 2

111
aims to better reflect the basic tenets of RME. In Set 1 Activity 1 of cycle 1, the process
of partitioning the longest LAB pipe into ten, hundred, and thousand shorter pieces of
equal length was given. Based on exploration of the relationships among various pieces,
pre-service teachers were expected to establish verbal names, fraction and decimal
notation of those pieces. Yet in the light of RME guided reinvention tenet, this activity
did not allow much opportunity for pre-service teachers to reinvent the decimal
structure by themselves and to connect this decimal structure with the formal decimal
notation. Experiencing the process of partitioning one successively by ten was expected
to guide pre-service teachers to understand the connection between this act of
partitioning and the decimal notation. Therefore, Activity 1 in cycle 2 started with
finding ways of partitioning the longest LAB piece into equal parts and asking for
justification of choosing certain ways of partitioning. Moreover, ideas about further
refinement into shorter pieces were probed in the context of making the measurement
more accurate (see Figure 5.1).
Following the above activities, Set 1- Activity 2 to link LAB pieces, verbal
names, decimal notation, and fraction notation and to record the result of measuring a
table was explored as in the first cycle. Articulation of new ideas for future teaching
based on reflection of their engagement in the activities was more emphasised in cycle
2. This is in line with the aim of the study to engage pre-service teachers in constructing
meaningful understanding of decimal notation and pedagogical ideas of various
representations in this area. Moreover, the sequence of the activities was modified to
ensure that density of decimals was attended in this cycle, after being omitted from
cycle 1 because of time constraints. Hence in cycle 2, this activity was trialled for the
first time.

112
Figure 5.1: Comparison of Activity 1 in cycle 1 and in cycle 2 (from Appendix A4)
Set 1 Activity 1 and Activity 2 in Cycle 1
1. We assign the longest LAB piece as a one and agree to name the length of the longest piece as one. Explore the relationships between different pieces of LAB and establish the names of the pieces (verbally).
Pieces Verbal name
2. Match up the following cards with the LAB pieces and fill out the following table with corresponding verbal names, fraction and decimal notation. From now on we will focus on the use of the decimal notation.
Set 1 Activity 1, 2, and 3 in Cycle 2
1. You are given this piece and we agree to call it one. If you were to measure the length and width of your table with the piece, how many parts would you divide the piece into? Explain why do you choose this? What is the advantage and limitation of your choice?
2. If you want to get a more accurate result compared to the one before, what do you need to do?
3. Now if you need to measure the length of an eraser, how would you divide the piece?
5.2.2 Refinement of the test and the interview items
Basically refinement of the test and interview items aimed at getting better data.
For instance, analysis of responses to Part B Item 1 in cycle 1 (see Figure 5.2)
highlighted one common error pattern, i.e., the fact that place value of a decimal digit
was determined based on the number of decimal digits. An additional item was included
in cycle 2 as shown in Figure 5.2 to test the conjecture of the error pattern observed in
a tenth 0.1
101
a hundredthone
a thousandth
1001
10001 0.01 0.001
1

113
cycle 1. As will be discussed in section 5.4, these new items worked well in revealing
and confirming our conjectured pattern of thinking.
Figure 5.2: Refinement of Item 1 Part B from cycle 1 to cycle 2 Pre-test B1cycle1 Post-test B1cycle1 1. Tick the boxes that indicate the value of digit
1 in the following decimal numbers: a) 9.31 a tenth a hundredth a thousandth a ten thousandth b) 23.001 a tenth a hundredth a thousandth a ten thousandth c) 5.1064 a tenth a hundredth a thousandth a ten thousandth
1. Tick the boxes that indicate the value of digit 3 in the following decimal numbers: a) 9.31
a tenth a hundredth a thousandth a ten thousandth b) 23.001
a tenth a hundredth a thousandth a ten thousandth c) 5.1064
a tenth a hundredth a thousandth a ten thousandth
Pre-test B1cycle2 Post-test B1cycle2 1. Tick the boxes that indicate the value of digit 1 in the following decimal numbers: a) 9.31
a tenth a hundredth a thousandth a ten thousandth b) 23.001
a tenth a hundredth a thousandth a ten thousandth c) 5.1064
a tenth a hundredth a thousandth a ten thousandth d) 2.318
a tenth a hundredth a thousandth a ten thousandth
1. Tick the boxes that indicate the value of digit 3 in the following decimal numbers: a) 9.31
a tenth a hundredth a thousandth a ten thousandth b) 23.001
a tenth a hundredth a thousandth a ten thousandth c) 5.1063
a tenth a hundredth a thousandth a ten thousandth d) 2.183
a tenth a hundredth a thousandth a ten thousandth
Similarly, analysis of cycle 1 Part C data (pre-service teachers’ PCK) revealed that
pre-service teachers tended to focus on explaining what they do rather than the reasons
behind it (e.g. find the larger number by comparing digit by digit) rather than on the
teaching ideas. Hence in cycle 2, explicit teaching ideas were probed to overcome those
problems, as illustrated by two examples in Figure 5.3.
Figure 5.3: Refinement of Pre-test from Part C, Item 17 & 20 of cycle 1
Pre-test Item C17 cycle1 Pre-test Item C15cycle2
What is your idea of teaching your students to find the larger number between 0 and 0.6.
Explain your ideas for teaching primary school students to find the larger number of 0.8 and 0.8888. Include any models that you can think of in your teaching ideas.

114
Pre-test Item C20cycle1 Pre-test item C18cycle2
How will you assist your students in converting 1/3 into a decimal number?
When asked to solve 1/3 x 100 000, a student answered 1/3 x 100 000 = 33 000. Do you agree with this student? How would you, as a teacher, help this student?
Concerning the interview questions, questions that failed to reveal much about
conceptual understanding were omitted from cycle 2. On the other hand, items that
revealed a progress of understanding or challenged certain misconceptions were
retained. Some changes in interview items are illustrated in Figure 5.4 below but a
complete list of changes can be found in Appendix B9.
Figure 5.4: Changes in interview items and their justification
Pre-course Interview Action Justification for changes
How was your experience in learning addition of two decimals? For example how did your teacher teach you to add 1.8 and 1.31?
Was the reason for lining up the decimal comma explained to you?
What are your ideas for teaching addition of decimals in the future? (Pre-course interview)
Omit questions
Findings confirm the prediction about the reliance of rules of lining up the decimal point. Don’t reveal much about the conceptual understanding of decimal notation. Not required in cycle 2 to establish memories of primary school learning.
What is your idea to help children find the decimal expansion of 1/6?
Adjust question
Reveal ability to translate and link understanding to algorithm.
In answering a question to compare two decimals 1.66666 and 1.66, a student said that 1.66666 = 1.66. Do you agree with this answer? Why do you think she answer that way? What is your idea to resolve this problem? Can you think of any model that will be helpful in addressing/resolving this problem?
New Question
Reveal and challenge rounding/ truncating thinking (money thinking according to Steinle and Stacey, 1998). Also address the pedagogical aspect of resolving misconceptions involving decimals with repeated digits
Incorporating all changes above, instruments and the initial activity were trialled
out with 2 volunteer pre-service teachers in Sanata Dharma University, Yogyakarta. It
should be noted that these two volunteers were not involved in the teaching experiment
of cycle 1. The fact that the previous cohort year participated in cycle 1 and most of the
fourth year pre-service teachers were undertaken teaching practice in schools as well as

115
semester break (mid August) contributed to low participation of the trial in cycle 2. It
was realized that this trial would not be representative of the research participants.
However, responses and feedback from this trial were valuable particularly in ensuring
that the problems were comprehensible and time provided for the test was enough.
Minor refinements in the Indonesian translations were made in the wording of Part C
Item 15 (see Appendix B5, B6), as volunteers suggested a possible misinterpretation of
the problem in the Indonesian version.
Trial of the interview items revealed that the new items were easily understood so
no further change was made. However, trial of the activities could only cover the first
few activities due to limited time that could be afforded by volunteers. The outcome of
the trial of Set 1 Activity 1 confirmed a conjecture about preference of halving over
decimating in partitioning the longest LAB piece in the initial refined activity (see
Section 4.2.3). However, this preference over intuitive halving strategy was not
perceived as a hindrance to the exploration of decimating.
5.3 Teaching Experiment 2
This section will explicate findings during the cycle 2 teaching experiment from
observation of group discussions, written responses to the activities, and the whole class
discussions. Section 5.3.1 starts with the administration of the teaching experiments and
discusses some changes that occurred in the teaching experiment of cycle 2. Section
5.3.2 presents findings from the classroom observations and the worksheets of the
activities during the teaching experiment. Meanwhile Section 5.3.3 discusses the
findings from the written tests along and the interviews on various areas of content
knowledge. In Section 5.3.4, findings from the written tests and interviews on
pedagogical content knowledge will be elaborated.
5.3.1 Administration of Teaching Experiment 2
Two lecturers were initially involved in the teaching experiment of cycle 2. It
should be noted that there was a change of lecturers from cycle 1 to cycle 2. This was
not an ideal situation but it was beyond the researcher’s control to decide. One lecturer,

116
who participated in cycle 1, was again in charge of the class of the secondary cohort
participated in this project. Yet, due to his busy schedule, he was unable to allocate
extra time to prepare and discuss the teaching experiment. Consequently, the researcher
took over his class for 5 meetings to conduct the activities. The former lecturer provided
his insights before the teaching experiment in this cycle started based on cycle 1
experience. The inability of the normal lecturer to take the secondary class presented the
researcher with a dilemma. The researcher appreciated that her role would shift from
mainly lesson observation to include ensuring pre-service teachers’ engagement in
activities, and leading class discussion. Consequently, the researcher’s role in observing
group discussions during was limited by this shift of role. On the other hand, the
researcher was able to ensure that the activities and discussion had the intended focus.
Despite the fact that the class had been quite supportive during the research process on a
voluntary basis, the researcher’s lack of authority over the class impacted on the level of
commitment level of students to this project.
In the primary cohort, one lecturer, who was not involved last year, was in charge
of all three parallel classes this year and wished them all to be involved in the project.
Similar to other lecturers who participated in cycle 1, this lecturer has been involved in
the PMRI project. In all three classes, the researcher maintained the observer role and
directed the video-recording during the whole teaching experiment.
5.3.2 During the teaching experiment
This section reports on findings from the trialled of cycle 2 teaching experiments.
As discussed in Section 5.2, a change was made in the initial activity of cycle 2.
5.3.2.1 Outcomes from Set 1
Following the introduction of the longest piece of LAB as one in Set 1 –
Activity 1 (see Appendix A4), pre-service teachers were asked to explore ways of
partitioning the one piece in the context of measuring dimension of a table so that it
allowed them to compare and record the measurement result accurately. It was expected
that this exploration would guide pre-service teachers to observe that partitioning into
ten subsequently relates to decimal notation and reasons for favouring this approach.

117
Preference for halving was predicted as this approach offered a more intuitive and
practical approach. However, as pre-service teachers held prior knowledge of decimals,
an idea about partitioning into ten parts was expected to emerge during the discussion
besides the other approaches.
Confirming the prediction in the conjectured LIT, worksheets documenting
response to Set 1 Activity 1 (see Appendix C4) recorded that most primary cohort
groups (11 out of 23 groups) opted for some sort of halving strategies, varying from
partitioning the one into 2 equal parts, 4 parts, 8 parts, 16 parts, or 32 parts by
successive halving. Most groups articulated the practical ease of finding a half of the
length as the strength of this approach, for instance, by utilizing a pivot point as
illustrated in Figure 5.5. Meanwhile lack of accuracy or higher error rate, and having to
divide many times in halving were noted as weaknesses of this approach. These in fact
the disadvantages of halving compared to decimating strategies.
Figure 5.5: Pivoting the LAB pieces to divide into 2 halves
In exploring ways of partitioning the one, a majority of groups in the secondary
cohort tended to engage more on ‘how to’ partition using non-standardized
measurement tools such as chalks, hand span, and length of a pen as illustrated in Figure
5.6. Only 2 out of the 10 secondary groups opted for the halving strategy in partitioning
the longest LAB piece or the ‘one’, half of the groups in the secondary groups
partitioned one using hand span (see Appendix C4 for distribution of ways of
partitioning one in Set 1- Activity 1 in cycle 2). Meanwhile 70% of the secondary pre-
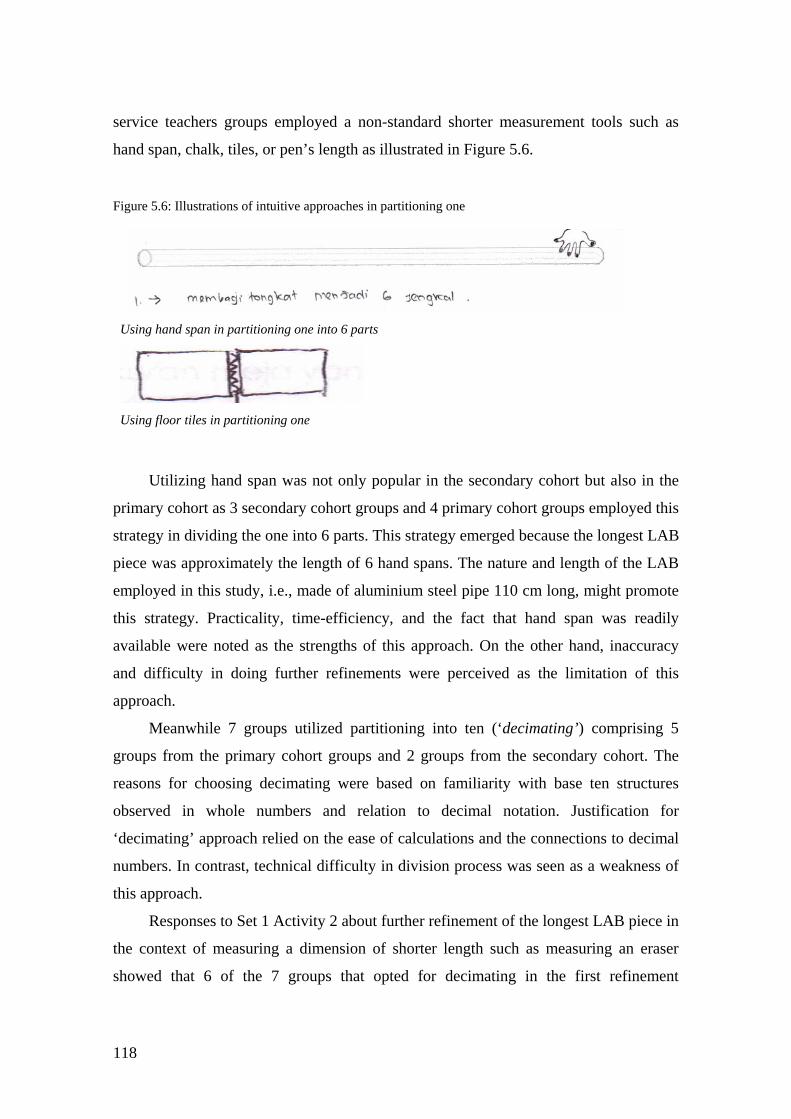
118
service teachers groups employed a non-standard shorter measurement tools such as
hand span, chalk, tiles, or pen’s length as illustrated in Figure 5.6.
Figure 5.6: Illustrations of intuitive approaches in partitioning one
Using hand span in partitioning one into 6 parts
Using floor tiles in partitioning one
Utilizing hand span was not only popular in the secondary cohort but also in the
primary cohort as 3 secondary cohort groups and 4 primary cohort groups employed this
strategy in dividing the one into 6 parts. This strategy emerged because the longest LAB
piece was approximately the length of 6 hand spans. The nature and length of the LAB
employed in this study, i.e., made of aluminium steel pipe 110 cm long, might promote
this strategy. Practicality, time-efficiency, and the fact that hand span was readily
available were noted as the strengths of this approach. On the other hand, inaccuracy
and difficulty in doing further refinements were perceived as the limitation of this
approach.
Meanwhile 7 groups utilized partitioning into ten (‘decimating’) comprising 5
groups from the primary cohort groups and 2 groups from the secondary cohort. The
reasons for choosing decimating were based on familiarity with base ten structures
observed in whole numbers and relation to decimal notation. Justification for
‘decimating’ approach relied on the ease of calculations and the connections to decimal
numbers. In contrast, technical difficulty in division process was seen as a weakness of
this approach.
Responses to Set 1 Activity 2 about further refinement of the longest LAB piece in
the context of measuring a dimension of shorter length such as measuring an eraser
showed that 6 of the 7 groups that opted for decimating in the first refinement

119
consistently applied decimating in their next refinement. The remaining one group
suggested the use of metric ruler for the second refinement which indicated an
association of metric measures as a standard measurement tool for length. This showed
that pre-service teachers utilized their prior knowledge of metric measures in
responding to the activity. However, as the length of the longest LAB piece is
deliberately not 1 metre, a further refinement using a metric ruler did not fit with the
original length of the one piece. In contrast only 3 groups out of the 12 groups that
applied halving utilized the same strategy in the next refinement in Set 1 Activity 2.
Moreover, one group solely employed partitioning of one into 4 parts and consistently
partitioned into 4 in the second refinement. The inconsistency in the next refinement
was evident in all groups who employed an intuitive approach in partitioning.
Explanations of ways to divide one into equal parts reflected different traits of the
primary and the secondary cohorts in terms of their mathematical content knowledge.
Two groups from the secondary cohort that opted for decimating approach referred to
geometry property of parallel lines to partition one as illustrated in Figure 5.7. This
reflected a higher level of formal mathematical knowledge of the secondary cohort
groups. Meanwhile one of the primary groups who opted for decimating used halving
by dividing each half into 5 parts using trial and error (by folding a scotch tape with
same length as the LAB pipe one). Justifications for ‘decimating’ from the primary
cohort groups showed links to prior knowledge such as extending the power of ten
patterns in whole number to decimals, link to decimal notation and ease of calculations.
Overall responses in Set 1- Activity 1, 2 worksheets suggested that activity of
partitioning one and refining ways of partitioning with the purpose of recording
measurement in higher accuracy were not strongly associated with decimal notation.
The fact that exploring ways of partitioning was not clearly linked with the ease in
calculating and recording the result of measurement might explain the lack of
association to decimals.
Figure 5.7: Illustration of partitioning one into 10 parts from Secondary cohort responses

120
Responses to Set 1- Activity 3 about the relationships among various LAB
pieces and the verbal names (one, tenths, hundredths, and thousandths) and the
corresponding notation suggested that the majority of groups observed the base ten
relations (one tenth, one hundredth, etc) among various pieces as predicted.
Interestingly in Set 1- Activity 4 to record the measurement of a table (length and
width) using various LAB pieces, 23 out of the 34 groups capitalised on fraction
notation and operations and made the link to decimal notation. The trend of preference
to the computational approach with fractions before decimals was also observed in cycle
1. Only 5 groups capitalised on decimal notation. This trend reflected the common
approach to decimals in the Indonesian curriculum which was strongly linked to
fractions operations.
In Set 1- Activity 5 (see Figure 5.8), place value understanding of decimals and
additive and multiplicative structures of decimals were explored through sketching out
representations of three decimals. Surveying the worksheets responses to this activity
suggested that sketching out representations of decimals was quite simple but
articulating the pattern from this activity in Set 1- Activity 7 was not straightforward
(see Figure 5.9 for samples of responses to Activity 6). Similar to findings in cycle 1,
some groups depicted association of decimal notation with fraction notation and
operations in their sketches of decimal representations.
Figure 5.8: Set 2, Activity 5-7 Cycle 2 investigating place value of decimals
5. Sketch the construction of LAB representations of the given decimal numbers.
Numbers Sketch
2.06
0.26
0.206
6. Can you observe an interesting pattern from sketching the three decimals?
7. What can you conclude from sketching out those numbers?
Overall, the goal of attending to place value of decimals was achieved, however,
fewer groups observed the structural relationships between 2.06 and 0.206 as compared
to superficial observations as documented in Table 5.2. As can be seen, the comments

121
varied from technical, superficial observations such as those related to sketching to
structural relations of decimal place value. The fact that some groups attended to
mathematical relations in various decimal place value was quite encouraging. Similarly,
responses in worksheet of Set 1- Activity 7 also showed that the majority of groups
attended to place value notions by concluding that representations of those decimals
reflected the different values of decimal digits.
Figure 5.9: Sample of worksheet response to Set 1 - Activity 5 in cycle 2
Table 5.2: Representative comments on patterns observed in Set 1- Activity 7
Patterns observed Cohort
It is easier to explain sketch of 2.06 because it is simpler Primary B
The longer the decimal digits, the more complicated the construction process Primary B
Superficial
In constructions, they all use 2 different pipes, there are 2 longer pipes and 6 shorter pipes Primary C
All decimals contain digits 2, and 6 but their places and values are different Primary A
Same digit represents different place value reflected in length of pipes representing digits Primary C
All three numbers have same digits 2 & 6 but different decomposition. 2.06 = 2 ones and 6 hundredths, 0.26 has 2 tenths and 6 hundredths, whereas 0.206 has 2 tenths and 6 thousandths
Secondary
Structural relations
Different position of decimal digits implies different values and 2.06 =
10 × 0.206 or 0.206 = 101 × 2.06. Secondary

122
In Set 1- Activity 8 (see Appendix A4) further reflections of the meaning of
decimals such as 1.23456 was probed by linking it with the activity of constructing the
number using LAB pieces. Worksheet of this activity showed that the majority of
groups attended to place value either by decomposing decimals into various place value
terms or by identifying the value of each decimal digit. Future teaching ideas probed in
Set 1- Activity 9 will be discussed later, together with teaching ideas from Set 3 –
Activity 21 in Section 5.3.2.4. The decimal number 1.23456 cannot be physically
represented by LAB model, which represent nothing smaller than a thousandth. Stacey,
Helme, Archer et al (2001) noted that it is relatively easy for students to extend the
physical model to a mental model.
5.3.2.2 Outcomes from Set 2
Set 2 activities in cycle 2 (see Appendix A4), started with playing the ‘Number
Between’ game with the whole class wherein pre-service teachers were asked to find a
number in between pair of numbers. Note that this activity was not carried out in the
first cycle due to the time constraint. Given a pair of whole numbers at the start, a
number in between the pair was sought consecutively until the class perceived the
density of decimals. Observations of whole class discussions during the ‘Number
Between’ game showed that pre-service teachers engaged in the activity and noticed the
density property of decimals through this game. Worksheet responses to Set 2 Activity
10 (see Appendix A4) recorded that 25 out of the 34 groups articulated density of
decimals, (i.e., that in between two decimals there are infinitely many decimals as their
learning point. Moreover, 2 groups among these 25 groups contrasted density of
decimals with whole numbers, by noting that there are no whole numbers in between
two consecutive whole numbers. However, worksheet of this activity also recorded two
groups which indicated S thinking. This was evident as they noted “the longer the
number of digits behind the comma, the value of the number is getting smaller” as the
property of decimals instead. Nonetheless the fact that a significant proportion of groups
(74%) indicated a positive impact of addressing density of decimals in the teaching
experiment.
Teaching ideas proposed in Set 2- Activity 11 was dominated by the inclusion of
number line and ruler to find a decimal number in between two decimals. Three main

123
strategies were observed in worksheet responses to Activity 12 to find and locate
decimals in between given pair of decimals (see Figure 5.10).
Figure 5.10: Set 2 - Activity 12 of Cycle 2
12. For each given pair of decimals in Table A, find decimals in between those pairs if they exist. Explain how do you find the answer and locate your answer on the number line.
1.5 1.51 0.99 0.999 1.7501 1.75011
Table A
Is there any model or game that you can use to assist children to solve this problem?
13. What can you conclude from Activity 12 above?
14. Can you find a decimal number larger than 0.36666001? If yes, how many decimals can you find? Give some examples!
The most popular strategy (recorded by 17 groups) was to segment the interval
between pair of decimals into 10. The second common approach (recorded by 6 groups)
was to find a mid-point of the pair of decimals. Interestingly, 2 primary cohort groups
converted decimals into fractions with common denominators to determine decimal
fractions within this range. However, by counting on the thousandths only in between 990
1000 and 9991000 , these two groups noted there were 8 or 9 decimals in between 0.99 and
0.999. Yet, at the same time by counting on ten thousandths in between 990010000 and 9990
10000 ,
they noted there were 89 decimals in between the same pair of decimals (see Figure
5.11). This approach worked well in finding decimals in between pair of decimals,
however, it led to an idea that there are only finitely many decimals in between two
given decimals which was in conflict with developing understanding of density of
decimals. Number line, ruler and LAB were the three main models proposed to assist
children in finding decimals in between in Set 1- Activity 12. The majority of groups
observed the density of decimals and noted that there were infinitely many decimals
larger than 0.36666001 recorded in the worksheet of Set 2- Activity 13 and Activity 14.
However, there are also infinitely many natural numbers larger than 0.36666001, so this
particular activity did not get at density of decimals.

124
Figure 5.11: Responses to Set 2 Activity 12 of Cycle 2 from one primary cohort group
Responses to Set 2 – Activity 15 to explore the relative magnitude of decimals,
including negative decimals, common fractions, and whole numbers and their positions
on a number line showed that many groups had difficulties with negative decimals and
finite decimals with long repeating digits such as 0.3333333333. Nearly 52% of 33
groups from both cohorts marked 31 and 0.3333333333 at the same location on the
number line and 2 groups in the primary cohorts noted that 31 = 0.3333333333. Whilst
marking 31 and 0.3333333333 was understandable considering the scale of the numbers,
the fact that two groups noted that 31 = 0.3333333333 indicated they used rounding or
truncating strategies. This strategy was confirmed during the whole class discussion in
one of the primary cohort class as recorded in the following excerpt:
Meanwhile, nearly one third of the total cohort (10 out of 33 groups completing
worksheet in Set 2 -Activity 15) placed negative decimals incorrectly on the number
line as illustrated in Figure 5.12. This problem with negative decimals was particularly
prominent in the primary cohort as 9 of the 10 groups were from the primary cohort.
Lecturer : A few groups answered that 1/3 is the same as 0.3333333333 last time. Do you think that they are the same?
Rita : They are the same
Aris : Not the same, they are close, 1/3 is the same as 0.3333 but with 3 repeating forever, whereas 0.3333333333 the digit stop.
Lecturer : How about the rest of the class? Do you think Aris is right? According to a few other groups in the worksheet, 1/3 is the same as 0.3333333333 but from this discussion they are not the same. How about the group who says they are the same, could you explain how do you arrive to this conclusion?
Rita : We are thinking in simple way, if 1/3 is converted to decimals then it is the same as 0.333 so we thought they are the same because of rounding.
Lecturer : Do you still think that they are the same now? Rita : Not really.

125
Analysis of written test responses which will be discussed in Section 5.3.2.6 confirmed
difficulties with negative decimals. The fact that the design of activities in cycle 2 did
not address negative decimals in particular was an important omission. This finding
highlighted the importance of attending to negative decimals in the future teaching. A
paper further analysing pre-service teachers’ behaviours in placing negative decimals is
in preparation (Widjaja, Stacey, & Steinle, in preparation).
Figure 5.12: Evidence of difficulties in locating negative decimals on the number line
5.3.2.3 Outcomes from Set 3
Set 3 activities were trialled in cycle 1 (see Set 2 activities in Section 4.5). These
activities were refined and trialled again with different set of pre-service teachers in
cycle 2 (see Appendix A4 for the refined LIT from cycle 1 to cycle 2). Set 3 started with
Activity 16 to sketch out various decompositions of decimal representations using LAB
pieces. More than 56% of 32 groups sketched out LAB representations without
grouping of the pieces in the sketch, only 3 groups employed grouping by 10 and 4
groups utilized grouping by 5. There were 5 groups that showed a combination of both
grouping by 5 and 10 in their sketches. This finding was similar to the finding in cycle 1
(see Section 4.3), which also documented lack of attention in grouping by 10.
Despite lack of awareness of the decimal structure in grouping representations of
decompositions, it was satisfying that the average facility of decomposing decimals
from the worksheet was quite high, i.e., 94.5%. Decomposing decimals smaller than 1,
in this case 0.123 was found to be slightly more difficult, as shown by the lower facility,
i.e., 91% compared to 98% for decomposing 1.230. Steinle and Stacey (2003a) also
noted students have more difficulty with decimals between 0 and 1 than others. The
differences might be due to the fact that thousandths could be more difficult than

126
hundredths. Moreover, 2 groups provided 10 ways of decompositions and 1 group gave
9 ways of decompositions suggesting some understanding or application of 10-structure.
In Set 3- Activity 17, various ways of expanding a decimal number 0.213
revealed one problematic item to express the decimal number 0.213 in hundredths.
There were 3 groups left this item blank in the worksheets and 1 group answered this as
21 hundredths. Similar to finding in cycle 1, those groups who had difficulties in this
item perceived that the answers should always be in whole numbers. In Set 3- Activity
18, the majority of groups pointed out that the number expander could not be used in
checking one of a non-canonical expansion of decimals (i.e., 0.213 = … ones + 1 tenth
+ … hundredths + … thousandths).
In Set 3- Activity 19, pre-service teachers were asked to observe any patterns in
expanding the same decimal number (see Appendix A4). Worksheets documented that
11 groups mentioned various ways of expanding the same decimals into related place
value without changing the value of the decimals, e.g., 0.213 = 21 hundredths + 3
thousandths and 0.213 = 2 tenths + 13 thousandths, as their observed pattern in
expanding the same decimals. Set 3- Activity 20, which aimed at linking the LAB and
various expansions of decimals using the number expander was quite straightforward.
All groups noted they could use LAB to illustrate expansions of decimals as found using
the number expander. The more interesting finding was documented in respond to Set 3-
Activity 20 on future teaching ideas after Set 3 activities, which will be discussed in the
following section.
5.3.2.4 Reflections on new learning experience and ideas for future teaching
Similar to the findings in cycle 1, incorporating concrete models in teaching
decimals and emphasising place value of decimals were the main features recorded in
ideas for future teaching on worksheet of Set 1- Activity 9 in cycle 2. Reference to LAB
or other materials (e.g., ropes, straws, or bamboo sticks) using a similar principle to
LAB to represent ones, tenths, hundredths and thousandths in decimal numbers was
recorded by 12 groups. Interestingly, 6 groups in cycle 2 proposed the fair sharing as a
context to introduce decimals through fractions. In these teaching ideas, sharing a cake
among 10 people was chosen to introduce the fraction 1/10 and then linked it with a

127
decimal 0.1 by the division algorithm. This approach of teaching reflected the
curriculum sequence in teaching decimals after fractions in Indonesian curriculum.
The worksheet for Set 3- Activity 20 showed that the primary cohort groups were
more receptive to the use of concrete models in teaching. For instance, reference to
LAB or models using a similar principle to LAB made of different materials such as
straws, bamboo sticks, ropes, and number expander were proposed by 12 groups. In
contrast, teaching ideas from the secondary cohort encompassed more symbolic models
such as number lines, number expander, and place value charts or column as illustrated
in Figure 5.13. Interestingly the place value column chart dominated the model
proposed for teaching decimals in this cohort with only one group included the use of
LAB in the teaching idea. This model was not introduced in the classroom during the
teaching experiment. It was proposed by one of the group during whole class
discussion. The different nature of the training, wherein pre-service secondary teachers
are prepared mostly for teaching secondary school explains this preference.
Figure 5.13: Teaching idea incorporating place value column chart/matrix
5.4 Findings from written test and interviews
This section will discuss findings from the written tests and the interviews to
observe the impact of the activities on pre-service teachers’ knowledge of decimals. The
discussion in this section is divided into two sections; Section 5.4.1 addresses findings
related to content knowledge whereas Section 5.4.2 attends to pedagogical content
knowledge of pre-service teachers.
ones tenths hundredths thousandths
tenths
ones
hundredths thousandths ten thousandths

128
5.4.1 Findings on Content Knowledge
Discussion of findings from pre and post-tests as well as pre and post-interviews
will focus on data gathered from 140 pre-service teachers who sat both tests in order to
gain a better indication of the impact of the activities. Pre-service teachers’ content
knowledge on various areas of decimals was evaluated by examining performance in
DCT3a and DCT3b and Part B of the tests as well as responses in the pre- and post
course interviews.
5.4.1.1 Decimal Comparison Test
Both cohorts showed improvement in their performance on DCT3a as shown by
the combined percentage of pre-service teachers who made no errors in DCT3a
increasing significantly from 45.0% to 65.7% in DCT3b as shown in Table 5.3. The
secondary cohort outperformed the primary cohort in both the pre- and post-tests.
Table 5.3: Number and percentage of pre-service teachers with no errors in two cohorts
Pre-test Post-test Cohorts Total number
of PSTs Number of PSTs with no errors
Percentage of PSTs with no errors /prim
Number of PSTs with no errors
Percentage of PSTs with no errors/sec
Primary 94 31 33.0% 49 52.1%
Secondary 46 32 69.6% 43 93.5%
TOTAL 140 63 45.0% 92 65.7%
Improvement was also evident in the increase of proportion of pre-service teachers
who were identified as Apparent experts (A1) from a total of 55% in the pre-test to
almost 79% in the post-test (see Table 5.3). Only 2 primary pre-service teachers were
identified as holding any ‘Shorter-is-Larger’ thinking, which was associated with
denominator focused thinking (S1). One of them retained S1 thinking in the post-test,
whereas another pre-service teacher moved to A1 thinking. No pre-service teacher was
diagnosed with ‘Longer-is-Larger’ thinking in cycle 2.
Interestingly all secondary pre-service teachers who participated in both tests were
identified holding some sort of A-thinking (A1, A2 or A3 thinking). A large proportion
of pre-service teachers (76.1%) held A1 thinking in the pre-test and increased to 93.5%
in the post-test. However, as will be discussed later in this section, data from Part B of
the written test showed that 32% of the 77 A1 pre-service teachers demonstrated weak

129
knowledge in content areas of decimals in the pre-test. As noted earlier, the
classification A indicates expertise only on the comparison task. Only 11% of 110 A1
pre-service teaches showed weak content knowledge in the post-test which indicated a
positive outcome of the teaching experiment. The substantial percentage of A1 pre-
service teachers showing weak content areas indicated that they might master ‘expert’
rules for comparing decimals without much understanding.
Table 5.4: Number and percentage of pre-service teachers in various thinking classification
Pre-test Post-test Thinking Classification Number of
PSTs Percentage of PSTs
Number of PSTs
Percentage of PSTs
A1 77 55.0% 110 78.7% A2 35 25.0% 13 9.3% A3 20 14.3% 12 8.6% S1 2 1.4% 1 0.7% U1 3 2.1% 4 2.9% U2 3 2.1% 0 0.0%
Total 140 100% 140 100%
Both cohorts demonstrated misconceptions associated with inappropriate use of
rounding or truncating rules. These misconceptions appeared in both the primary and
the secondary cohorts and were identified as A2 thinking (see Figure 5.14). In contrast,
a few pre-service teachers from the primary cohort held S thinking.
Figure 5.14: Classifications of thinking from two cohorts comparing pre- and post-tests
Classification of Thinking PrimaryLongitudinal
0%
10%
20%
30%
40%
50%
60%
70%
80%
90%
A1 A2 A3 S U
PRE
POST
Classification of Thinking Secondary Longitudinal
0%
10%
20%
30%
40%
50%
60%
70%
80%
90%
A1 A2 A3 S L U
PRE
POST

130
Interestingly, the interview data showed that applying a blend of strategies was a
common approach used by many pre-service teachers in comparing decimals on
DCT3a. Mixed strategies were common in pre-service teachers’ explanations during the
interviews. The following interview excerpt with Vita, a pre-service secondary teacher,
was an example of this. She was diagnosed as holding A2 thinking in the pre-test. In
general, she annexed zeros in dealing with comparisons such as 4.8 with 4.62 which
gave a correct answer (4.80 versus 4.62). However, Vita applied a rounding rule for
comparing type 4 items (such as in comparing 4.4502 with 4.45 so that 4.4502 became
4.45) and used truncating rule in dealing with type 4R items (such as in comparing
3.77777 with 3.7 so that 3.77777 became 3.7) in the pre-test. In the post-test Vita
showed improvement but still indicated reliance on rounding rules in finding the closest
decimals on item 10 and 11 of Part B of the written tests. As noted by Steinle and
Stacey (2002), the repeating digits are a distinct cause of difficulty.
Similarly, Yanti, a primary pre-service teacher, applied truncating thinking in
solving type 4 and 4R items despite her strong tendency of ‘Shorter is larger’ thinking
otherwise as recorded in the following pre-course interview excerpt:
Researcher : Can you explain why do you think decimals with same initial digits are the same?
Vita
: I was actually a bit confused last time. Because I thought 4.666 could be rounded to 4.7 so can 4.66 so they can be the same number. Also 3.77777 is a repetition (sic) of 3.7.
Researcher : But did you think that 4.4502 and 4.45 can be equal? Vita : Yes, because according to the rounding rule, 02 can be ignored Researcher : How about your strategy in comparing other pairs of decimals? Vita : For example in comparing 4.8 and 4.62, by looking at 8 and 6 we know
that 4.8 is larger than 4.62. In comparing 0.8 and 0.74, just compare -0.80 and 0.74 and I know that 80 is larger than 74 so 0.80 is larger than 0.74.
Researcher : Do you always apply this strategy consistently? Vita : No because in comparing 4.66 and 4.666 if we use this strategy, we can
conclude that 4.666 is larger but in the case of 4.666 and 4.66, they can be thought as the same number because of the repeating digits.

131
This tendency to apply mixed rules in comparing decimals was also observed in
cycle 1 data as reported in Section 4.5. The fact that reliance on rules and the tendency
to apply mixed rules without understanding was observed in both cycles suggests that
these are common features of pre-service teachers’ knowledge.
5.4.1.2 Results of Part B of the written tests
Both cohorts showed improvement in their content knowledge as indicated in their
improved mean scores shown in Table 5.5. These results suggested that both cohorts
gained advantage from the activities. Similar to finding in cycle 1, the secondary cohort
showed a stronger performance than the primary counterpart in both pre- and post-tests.
Note that the total score of 28 in cycle 2 as opposed to total score of 27 in cycle 1 (see
Table 4.4) was due to the additional item in examining place value names of a decimal
digit (Item 1d in Part B, see Appendix B5 and B6).
Table 5.5: Mean pre- and post-tests from Part B in cycle 2 (out of the total score of 28)
Pre-test Pos-test Cohort N Df
Mean Standard dev (SD) Mean Standard dev
(SD) t value p value
Primary 94 93 14.43 5.38 19.45 6.18 5.02 0.000
Secondary 46 45 18.60 4.99 23.47 3.73 4.87 0.000
Researcher : So what is your strategy in comparing decimals (4.8 versus 4.63)? Yanti : Just look at the number behind comma, here 4.8 is the same as 4 and
108 whereas 4.63 is the same as 4 and 100
63 Researcher : How about in comparing 3.7 and 3.77777, do you use the same strategy
or a different one? Yanti : If there are more than 3 digits behind comma, we just pay attention to 2
digits or less. Since 3.7 has only one digit behind comma, so just compare the first digit of both numbers.
Researcher : So how about this one, how did you come to conclusion that 7.63 is larger than 7.942?
Yanti
: Because it depends on the comma (meaning decimal digits), this one is
10063 and the other one is 1000
942 so the larger one is hundredths. Researcher : So what is your assumption? Yanti : Tenths are larger than hundredths and hundredths are larger than
thousandths

132
Figure 5.15: Box plots of pre-test and post-test score of Part B
CohortSecprim
30
25
20
15
10
5
0
96
Post-test Part B scorePre-test Part B score
As recorded in Table 5.6 and Table 5.7, pre-service teachers from both cohorts in
cycle 2 improved significantly in areas such as explicit identification of place value
names (row 1), decomposing decimals (row 2), and density of decimals (row 3). The
fact that improvement was observed in density of decimals in cycle 2 showed the
positive impact of attending to density of decimals in the activities of cycle 2. As
reported in Section 4.5, there was no significant improvement on these areas in cycle 1
when these areas were left out due to lack of time.
There were two content areas i.e., unitising decimals (row 3) and sequencing
decimals (row 5) in which both cohorts indicated no significant improvement in cycle 2.
The difference between the two cohorts in pre-service teachers’ knowledge on relative
magnitude of decimals as reflected in locating decimals on the number line and finding
the closest decimal to a given decimal. Similar to the finding in cycle 1, the primary
cohort showed difficulties with placing negative decimals on the number line and no
significant improvement was observed on this area (row 6). In contrast, the secondary
cohort with initial score of 3.34 out of 4 indicated significant improvement on this area.
Further discussions on the nature of difficulties will be presented in the next two
paragraphs.

133
Table 5.6: Mean pre- and post-test Part B of the primary cohort in cycle 2 (N=94, paired t-tests)
Table 5.7: Mean pre- and post-test Part B of the secondary cohort in cycle 2 (N=46, paired t-tests)
The pattern of erroneous responses in identifying place value name of a decimal
digit detected in cycle 1 (see discussion in Section 4.5) was confirmed with an
additional item, i.e., Item 1d in Part B in cycle 2. The addition of item 1d in Part B of
cycle 2 meant that this error pattern was better diagnosed and this added more
confidence in the results. In the pre-test of cycle 2, both cohorts recorded the existence
of this error pattern, where place value names of a decimal digit were determined by the
length of the decimal digits. It was recorded in 72 cases in the pre-test and 9 cases in the
post-test of cycle 2. Interview data offered a confirmation on the prediction about
associating place value of a decimal digit based on the length of the decimal digits as
recorded in the following interview excerpt:
Researcher : Can you explain how did you find the place value of each decimal digit
in Item 1? Vita : I made a mistake when I solved this, I think because 9.31 is the same as
931/100 so I just choose hundredths. When there are three decimal digits, I just choose thousandths etc. I just consider the length of the decimal digits.
Similar to the finding in cycle 1, both cohorts showed the highest improvement on
decomposing decimals (row 2 of Table 5.6 and Table 5.7). The pre-test responses on
Pre-test Pos-test Area df
Mean SD Mean SD t value p value Identifying place value names 94 2.70 1.115 3.54 1.114 6.239 0.000 Decomposition of decimals 94 1.06 0.841 3.02 1.270 13.962 0.000 Unitising of decimals 94 2.34 1.915 2.32 1.908 0.100 0.921 Density of decimals 94 1.62 1.907 2.57 1.775 4.359 0.000 Sequencing of decimals 94 2.53 1.284 2.55 1.449 0.127 0.899 Decimals on the number line 94 2.83 0.922 2.95 0.922 1.284 0.202 Closeness to a decimal 94 1.34 1.388 2.49 1.515 6.203 0.000
Pre-test Pos-test Area df
Mean SD Mean SD t value p value Identifying place value names 45 2.83 0.996 3.76 0.639 5.853 0.000 Decomposition of decimals 45 1.61 1.374 3.89 0.482 10.867 0.000 Unitising of decimals 45 2.52 1.761 3.00 1.563 1.856 0.070 Density of decimals 45 3.17 1.495 3.65 0.971 2.119 0.040 Sequencing of decimals 45 2.70 1.280 2.91 1.092 1.044 0.302 Decimals on the number line 45 3.34 0.708 3.60 0.620 2.890 0.006 Closeness to a decimal 45 2.43 1.515 2.65 1.402 0.927 0.359

134
this item showed that a majority of pre-service teachers from both cohorts only offered
one way of decomposing decimals. Weak knowledge of place value in decomposing
0.375 as 5 ones + 7 tenths + 3 hundredths + 0 thousandths (“reverse” thinking), found in
cycle 1, was again observed in the pre-test of cycle 2. Lack of familiarity about multiple
ways of decomposing decimals was one factor that explained the low mean scores in the
pre-test of both cohorts.
An additional item (Item 3a, 3b, Appendix B5 and Appendix B6) on unitising
decimals was included in the written test of cycle 2 to inspect the relations between
knowledge of decomposing decimals and unitising decimals. The results showed that
many pre-service teachers were unable to link decomposing and unitising decimals.
Data from written tests showed that 15% of pre-service teachers could offer 3-4 ways of
decomposing a decimal but were unable to unitise correctly in the post-test of cycle 2.
Even though the activity with the number expander model (see Figure 4.7 in Chapter 4)
tried to link various ways of decomposing decimals and the standard decimal notation, a
larger portion of the activities attended to decomposing decimals. This finding indicated
the fragmented knowledge of pre-service teachers where their improved knowledge in
decomposing decimals was not linked to knowledge of unitising decimals. This
underscored the need to guide pre-service teachers to see the link between the two
activities better.
The following interview excerpt with Rian revealed her fragmented knowledge of
place value wherein the place value names of a decimal digit was associated with the
whole number place value names of the numerator of the corresponding fraction.
Rian : I’m confused with this problem of finding digits of different place value terms for 0.375.
Researcher : So could you tell me why in the pre-test here you put 5 first? Rian : At that time, it seems to me that sometimes I have a mix of ideas,
sometime. I think that the first digit represents ones but occasionally I think that the last digit represents ones.
Researcher : So reflecting back now, how did you analyse your own thinking? Rian : Why did I do it that way? Ehm …because if I write it as 1000
375 , I think 5 here represents 5 ones, 7 here represents tens and 3 represents hundreds.
Scant place value knowledge was also reflected in a common error of unitising
decimals, e.g., noting that 2 ones + 6 tenths + 15 hundredths + 3 thousandths = 2.6153.

135
Another evidence of lack of decimal place value was captured when the order of digits
were reversed. In this case, 0 ones + 7 tenths + 1 hundredths + 12 thousandths was
written as 1.2170. During the pre-course interviews, some pre-service teachers who
answered this way explained that they reversed the digits, which signified their lack of
understanding of place value.
In contrast to findings in cycle 1, both cohorts recorded significant improvement
on density of decimals in cycle 2, which indicated the positive impact of addressing this
topic in the activities in this cycle. Note that despite the fact that both cohorts recorded
significant improvement on density, the gap between the mean scores of the two cohorts
was quite wide (see Table 5.6 and Table 5.7). The primary pre-service teachers recorded
a high proportion of blank responses (about 21% of blank responses) and showed
difficulties with density of decimals. The incorrect responses on density of decimals
could be classified into three different categories. The first category indicated
association of decimal digits with whole numbers which resulted in identifying no
decimal in between two given decimals. The second category showed knowledge on the
link between decimals and fractions but this knowledge was limited by working with
equivalent common fractions with the same denominators. The curriculum sequence
reflected in the common mathematics primary school textbooks to introduce decimals of
the same lengths might explain this approach. The third approach in the third quote
showed reliance on rounding rule which was observed in finding the number of
decimals in between 0.799 and 0.80. The tendency to rely on rounding rule in this case
could be affected by the decimals with repeating decimal digits in 0.799. The following
responses were taken from answers to Item 5 and 6 in the pre-test of cycle 2 to illustrate
the three categories of incorrect idea on density of decimals:
Riri: There is no decimals in between 3.14, and 3.15 because 3.14 and 3.15 are consecutive
numbers.
Agus: There is no decimals in between 3.14, and 3.15 because 3.14 = 3 14100 and 3.15 = 3 15
100
and there is no number in between 14100 and 15
100 . Igni: There is no decimal in between 0.799 and 0.80 because 0.80 is the result of rounding of
0.799.
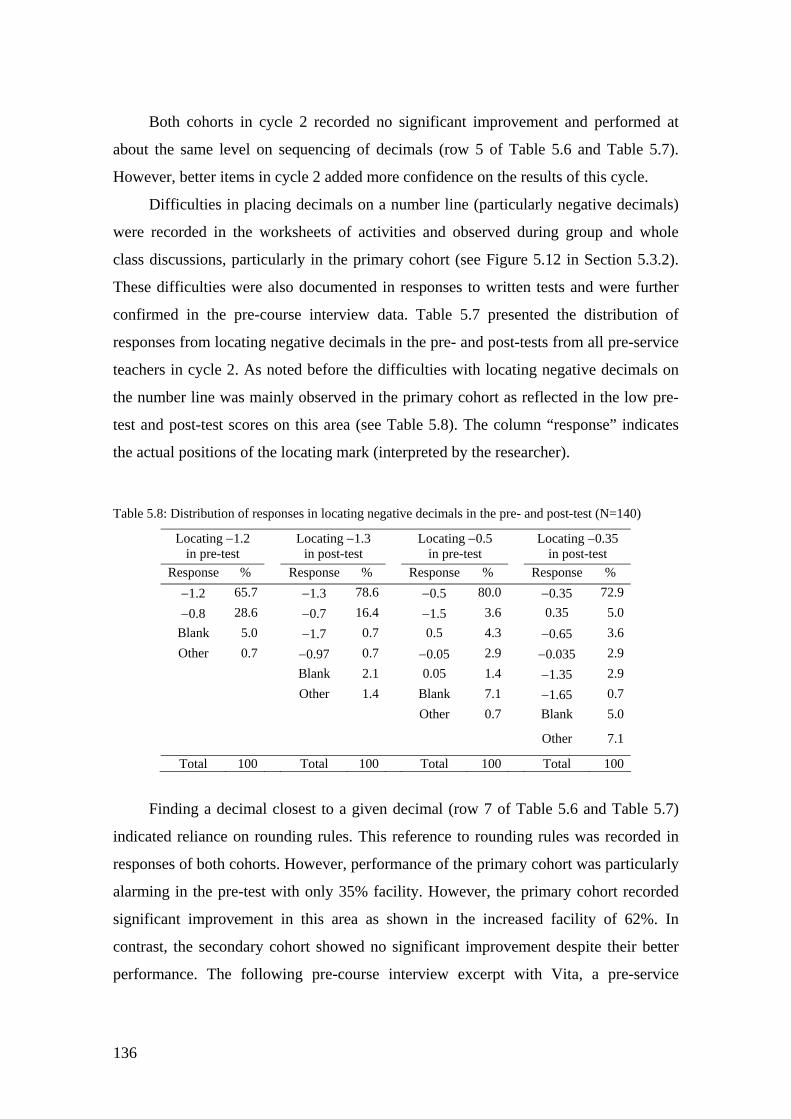
136
Both cohorts in cycle 2 recorded no significant improvement and performed at
about the same level on sequencing of decimals (row 5 of Table 5.6 and Table 5.7).
However, better items in cycle 2 added more confidence on the results of this cycle.
Difficulties in placing decimals on a number line (particularly negative decimals)
were recorded in the worksheets of activities and observed during group and whole
class discussions, particularly in the primary cohort (see Figure 5.12 in Section 5.3.2).
These difficulties were also documented in responses to written tests and were further
confirmed in the pre-course interview data. Table 5.7 presented the distribution of
responses from locating negative decimals in the pre- and post-tests from all pre-service
teachers in cycle 2. As noted before the difficulties with locating negative decimals on
the number line was mainly observed in the primary cohort as reflected in the low pre-
test and post-test scores on this area (see Table 5.8). The column “response” indicates
the actual positions of the locating mark (interpreted by the researcher).
Table 5.8: Distribution of responses in locating negative decimals in the pre- and post-test (N=140)
Locating −1.2 in pre-test
Locating −1.3 in post-test
Locating −0.5 in pre-test
Locating −0.35 in post-test
Response % Response % Response % Response % −1.2 65.7 −1.3 78.6 −0.5 80.0 −0.35 72.9 −0.8 28.6 −0.7 16.4 −1.5 3.6 0.35 5.0
Blank 5.0 −1.7 0.7 0.5 4.3 −0.65 3.6 Other 0.7 −0.97 0.7 −0.05 2.9 −0.035 2.9
Blank 2.1 0.05 1.4 −1.35 2.9 Other 1.4 Blank 7.1 −1.65 0.7 Other 0.7 Blank 5.0
Other 7.1
Total 100 Total 100 Total 100 Total 100
Finding a decimal closest to a given decimal (row 7 of Table 5.6 and Table 5.7)
indicated reliance on rounding rules. This reference to rounding rules was recorded in
responses of both cohorts. However, performance of the primary cohort was particularly
alarming in the pre-test with only 35% facility. However, the primary cohort recorded
significant improvement in this area as shown in the increased facility of 62%. In
contrast, the secondary cohort showed no significant improvement despite their better
performance. The following pre-course interview excerpt with Vita, a pre-service
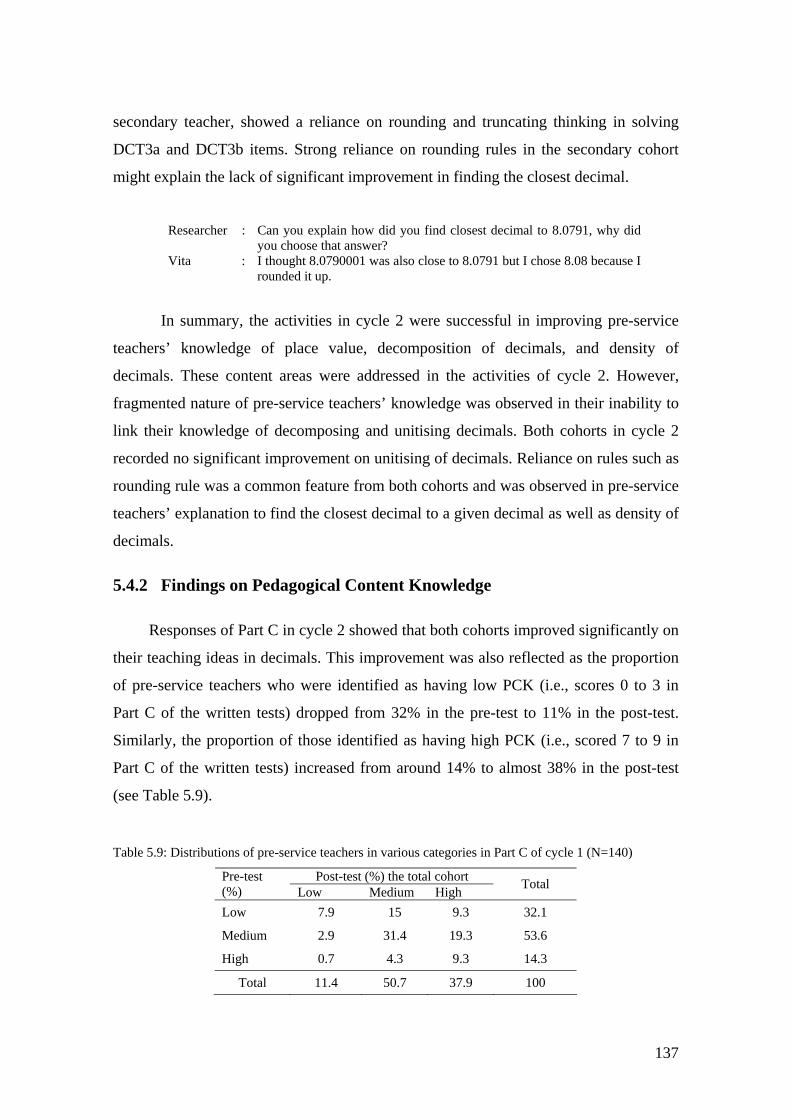
137
secondary teacher, showed a reliance on rounding and truncating thinking in solving
DCT3a and DCT3b items. Strong reliance on rounding rules in the secondary cohort
might explain the lack of significant improvement in finding the closest decimal.
Researcher : Can you explain how did you find closest decimal to 8.0791, why did
you choose that answer? Vita : I thought 8.0790001 was also close to 8.0791 but I chose 8.08 because I
rounded it up.
In summary, the activities in cycle 2 were successful in improving pre-service
teachers’ knowledge of place value, decomposition of decimals, and density of
decimals. These content areas were addressed in the activities of cycle 2. However,
fragmented nature of pre-service teachers’ knowledge was observed in their inability to
link their knowledge of decomposing and unitising decimals. Both cohorts in cycle 2
recorded no significant improvement on unitising of decimals. Reliance on rules such as
rounding rule was a common feature from both cohorts and was observed in pre-service
teachers’ explanation to find the closest decimal to a given decimal as well as density of
decimals.
5.4.2 Findings on Pedagogical Content Knowledge
Responses of Part C in cycle 2 showed that both cohorts improved significantly on
their teaching ideas in decimals. This improvement was also reflected as the proportion
of pre-service teachers who were identified as having low PCK (i.e., scores 0 to 3 in
Part C of the written tests) dropped from 32% in the pre-test to 11% in the post-test.
Similarly, the proportion of those identified as having high PCK (i.e., scored 7 to 9 in
Part C of the written tests) increased from around 14% to almost 38% in the post-test
(see Table 5.9).
Table 5.9: Distributions of pre-service teachers in various categories in Part C of cycle 1 (N=140)
Post-test (%) the total cohort Pre-test (%) Low Medium High Total
Low 7.9 15 9.3 32.1
Medium 2.9 31.4 19.3 53.6
High 0.7 4.3 9.3 14.3
Total 11.4 50.7 37.9 100

138
Both cohorts improved significantly from the pre-test to the post-test on the
overall score of Part C as shown in Table 5.10 (using paired t-tests). Despite the
significant improvement, lack of satisfactory explanations in their teaching was
observed in both cohorts and this was reflected in the low mean scores. Interviews with
20 pre-service teachers before the start of teaching experiments confirmed their
inadequate experience in incorporating models in learning and teaching both in prior
schooling and in their current training.
Table 5.10: Mean pre- and post-test of Part C scores (total score ranges from 0 to 9) Pre-test Pos-test Cohort N df Mean Standard dev Mean Standard dev
t-test p value
Primary 94 93 3.72 2.076 5.50 1.955 7.339 0.000
Secondary 46 45 5.48 1.560 6.41 1.784 3.441 0.001
Most of them recalled their learning experience of decimals as being very symbolic,
relying on operation to convert from common fractions to decimals and vice versa as
expressed by Vita (secondary cohort) and Ana (primary cohort) in the following script:
Vita : In fact at this point, using models in teaching decimals hasn’t crossed my
mind. During my training, the lecturers don’t use much manipulatives or models in our learning. It is more like a general remark or suggestion that in the future we need to use models for our teaching but don’t explicate in details how the models should be used. It is limited to observation, but we need also to share our observation and put our own thoughts and be familiar with models. I found it is still lacking.
Ana : The media for learning is inadequate… usually in learning decimals we either start with fractions or use division algorithm to convert between common
fractions and decimals, for instance finding that 21 = 0.5 using division…
That’s how my teacher taught me, it was quite confusing but I supposed we get used to it. If I have to teach it to primary school children, I am still confused myself, like this 5 is 5 ones but then how come it can be written as 50?
In cycle 2, improvements were observed in all PCK areas examined in Part C (see
Table 5.11). Table 5.11 reports results for items 15 to 18 of Part C (see Appendix B5
and B6) and scored as explained in Section 3.4.
Similar to the finding in cycle 1, written test responses in Part C showed the least
improvement in teaching ideas to give reasoning for a commonly practiced procedure

139
such as moving a decimal point in dividing decimals by power of ten (Item 16) and
linking decimals and fractions (Item 18) although the improvement is still statistically
significant for the primary cohort. In contrast, the impact of activities was better
observed in teaching ideas for comparing decimals (Item 15) and diagnosing an error
for comparing decimals (Item 17). Table 5.11: Paired t-test results of various items in Part C items of cycle 2
Improvement in teaching ideas for comparing decimals in item 15 was indicated
by the shift of main teaching strategies proposed in the written tests. It should be noted
that the low facility of item 15 in the pre-test was partly caused by 33 blank answers. In
the pre-test, common teaching ideas for comparing decimals were dominated by
reference to rounding rules and annexing zeros. Limited ideas to incorporate models in
teaching ideas for decimals were apparent in all proposed teaching ideas. In the case of
comparing decimals, a fair sharing situation of one cake with 8 people was proposed as
a model for representing the decimal 0.8, when in fact it represented a fraction 1/8
instead. This inappropriate model situation was documented in 6 pre-service teachers’
responses in the pre-test. Ruler and number lines were other models proposed for
comparing decimals. In contrast, reference to place value notions by decomposing
Pre-test Pos-test
Coh
ort No Area df
Mean SD Mean SD t value
p value
15 Teaching ideas for comparing pairs of decimals
93 0.80 0.784 1.50 0.652 7.012 0.000
16 Teaching ideas on division of decimals by 100
93 0.68 0.659 0.95 0.678 2.965 0.004
17 Diagnosis of students’ error in ordering decimals and teaching ideas to resolve it.
93 1.50 0.992 2.02 0.904 3.884 0.000
Prim
ary
18 Teaching ideas on the links between fractions and decimals
93 0.74 0.747 1.03 0.822 3.017 0.003
15 Teaching ideas for comparing pairs of decimals
45 0.76 0.673 0.96 0.868 1.386 0.173
16 Teaching ideas on division of decimals by 100
45 1.20 0.654 1.39 0.537 1.386 0.173
17 Diagnosis of students’ error in ordering decimals and teaching ideas to resolve it.
45 2.09 0.865 2.48 0.913 2.139 0.025
Seco
ndar
y
18 Teaching ideas on the links between fractions and decimals
45 1.43 0.688 1.59 0.541 1.635 0.109

140
decimals was central in teaching ideas and this was observed in 42 post-test responses to
Item 15. Moreover, the inclusion of models such as LAB, number line, and place value
charts signified the positive outcome of the activities on teaching ideas in the post-test.
Interview data recorded the progress of pre-service teachers’ teaching ideas as
illustrated in the following post-course interview responses:
Sam : In the pre-test I just mentioned the use of number line for teaching ideas but
in the post-test I also included LAB. With LAB, using ones, tenths, hundredths, thousandths and ten thousandths, we can show that for 0.7777 we need 0 ones, 7 tenths, 7 hundredths, 7 thousandths, and 7 ten thousandths to show that 0.7777 is longer than 0.770.
The pre-test responses in diagnosing errors to order decimals in Item 17 showed
that only 24% pre-service teachers from the whole cohort were able to diagnose
correctly and proposed teaching ideas that address basic notions of decimals such as
place value. Similar to responses in Item 15, rounding rules and annexing zeros as well
as comparing equivalent fractions were common in the pre-test responses to resolve an
error in ordering three decimals 0.3<0.34<0.33333. Teaching ideas to decompose
decimals in related place value terms and the use of LAB or models similar to LAB
(made from different materials such as straws, bamboo sticks, etc) as well as the use of
number line marked the improvement in teaching ideas in the post-test. Moreover,
comparing equivalent fractions with the same denominators was the second common
strategy proposed in teaching ideas in the post-test.
Analysing written responses to Item 16 about the procedure of moving a decimal
comma in solving dividing 0.5 by 100, a majority of pre-service teachers from both
cohorts agreed with this procedure because it gave correct answers quickly. ‘Invert and
multiply’ algorithm after converting the decimals into its equivalent fraction and
division algorithm were two common approaches proposed as alternatives to solve
division of decimals in the pre-test. Similar to findings in cycle 1, inadequate mastery of
the ‘invert and multiply’ algorithm was evident in some explanations, such as
0.5÷100= 20051000
1100
510
1001
105 ==×=× or 0.5÷100= 501002
1100
121 =×=÷ . These incorrect
interpretations of invert and multiply algorithm showed not only reliance on the

141
algorithm without understanding but also suggested pre-service teachers’ lack of
number sense.
The alternative teaching ideas proposed in the post-test also showed reliance on
invert and multiply algorithm after conversion to fractions. Similar to the finding in
cycle 1, only a small number of (8 out of the 140) pre-service teachers capitalized on
place value notion and LAB models in making sense of the division process as
illustrated in the following responses in the post-test:
Ken : We can use a wood cut into 10 parts to represent tenths and then used 3 of
tenths wood to represent 0.3. To divide it by 100, we can divide it into 100 parts. From this process, students can understand that the result of 0.3÷100 will be 100 times smaller than 0.3.
Erni : Explain the meaning of 0.3÷10 first, when 0.3 is divided into 10 parts, each represents 0.03. Then explain when 0.03÷10, there are 10 parts with each represents 0.003 because 0.3÷100 = 0.03÷10 so there are 10 parts, each represents 0.003. So 0.3÷100 = 0.003.
Teaching ideas in the pre-test Item 18 (Appendix B5) showed that the majority of
pre-service teachers recommended teaching fraction operation and division algorithm to
find the correct answer to the question. However, similar to responses in Item 16, both
cohorts showed lack of satisfactory explanations in teaching ideas to help students in
realizing the risk of rounding in the problem of 1/3 ×100 000 = 33 000. Fragmented and
incomplete knowledge on algorithm involving multiplication of fraction were
documented in the post-test responses, such as 1/7 × 100 000 = 7/1 × 100 000 = 70 000.
Similarly weak links between fractions and decimals were evident in responses such as
1/7 = 0.7777… (an overgeneralisation from 1/3 = 0.3333…) or 1/7 = 1.7. Improvement
was reflected in responses which indicated place value understanding in explaining the
process involved in carrying out the division algorithm.
Interestingly, teaching ideas documented in Part C of the written tests also
conveyed different traits of the two cohorts. More symbolic teaching approaches such as
subtraction, conversion to equivalent common fraction with common denominators,
multiplication of decimals by power of ten were recorded in the secondary cohort’s
teaching ideas in both the pre- and post-tests in cycle 2. Models incorporated in teaching
approaches also reflected more symbolic and formal teaching approaches such as the

142
use of the number line with some reference to LAB models. During one of the post-
course interviews, one interviewee from the secondary cohort revealed that he didn’t
bear in mind teaching ideas in the context of primary level; even though the item clearly
specified it. Instead, he addressed his explanation to the researcher whom he knew was
going to evaluate his responses. The fact that secondary pre-service teachers possessed
better skills with standard algorithms such as the division algorithm might explain their
stronger reliance on algorithms in teaching ideas. In contrast, the primary cohort
suggested concrete models such as LAB or other models such as straws, ribbons, ropes
or bamboo sticks in similar principle to LAB, or place value columns made of different
materials. Pre-service primary teachers’ own difficulty in comprehending abstract and
formal mathematical concepts along with their pedagogical awareness to primary school
students’ psychological development were attributed as factors leading most of the
primary cohort to rely on concrete models instead of more abstract models.
Overall, the primary pre-service teachers were more receptive to new teaching
ideas compare to the secondary counterparts. The fact that the primary pre-service
teachers had more exposure to practical training in schools might explain the higher
pedagogical awareness. In contrast, the secondary cohort had done no practical teaching
in schools.
5.5 Retrospective analysis
Findings from implementing 3 sets of activities with different pre-service teachers
and lecturers in cycle 2 revealed an overall trend of improvement in both CK and PCK
from both cohorts. Key notions of decimals covered in the activities such as
decomposition of decimals in expanded notation, place value, ideas for comparing
decimals, and density of decimals indicated a clear improvement. However,
performance in areas such as placements of decimals on the number line, sequencing of
decimals, and unitising of different place value parts of decimal numbers only showed a
slight improvement. Examination of areas of PCK showed significant improvements in
all areas. The positive impact of the activities were reflected meaningful explanations
which showed linked to basic notions such as place value and reference to the use of
concrete models in teaching ideas.

143
Similar to findings in cycle 1, different traits of the two cohorts were also
observed in cycle 2. In general, the secondary cohort outperformed the primary cohort
in regard to the content knowledge. However in regard to the pedagogical ideas, the
primary cohort turned out to be more receptive to the teaching ideas particularly in
incorporating the use of concrete models in creating a meaningful understanding of
decimals and taking into account the psychological development of primary school
students in the teaching approaches.
One of the main changes in cycle 2 was to better reflect the guided reinvention
principle. This was attempted in cycle 2 by exploring ways of partitioning one to record
the measurement result in the initial activity of Set 1. However, responses to this change
suggested that a majority of groups focussed on the practical issue of physically
dividing the one pipe by using a smaller unit of measurement such as hand span, tile and
pens. The refinement of partitioning, links to decimal notation, and ease of calculations
were not easily perceived. Hence the aim of the initial activity to expose pre-service
teachers with ‘guided reinvention’ experience process was not successful in this cycle. I
can say that the activities in this study did not reflect the guided reinvention tenet well.
In this respect, the issue of addressing the RME basic tenets in the design of activities
will need further study.
Pre-service teachers’ knowledge of density improved significantly, which showed
a positive impact of the inclusion of this area in the activity in this cycle. At the same
time, the task in locating decimals (including negative decimals), common fractions and
whole numbers on the same number line revealed misconceptions of negative decimals
and pointed out the important omission of addressing negative decimals in the activities.
The researcher had not foreseen the extent of these difficulties in the design of the
activities. This aspect needs to be improved in design of the activities for the future.
Similar to findings in cycle 1, pre-service teachers learnt to decompose decimals
in multiple ways related to place value in Activity 16 (See Appendix A5). Moreover,
this knowledge of decomposing decimals was translated well in teaching ideas for
comparing decimals. Majority of pre-service teachers made reference to decomposing
decimals in their teaching ideas for comparing decimals as recorded in the post-test and
post-course interviews. The nature of learning activities which emphasized group work
allowed pre-service teachers to explore multiple interpretations of decimals together and

144
learnt flexible ways of interpreting decimals. Moreover, the format of activities
encouraged flexible thinking by providing up to 8 ways to decompose a decimal
number. This arrangement stimulated pre-service teachers to share and discuss their
ideas together. Interview data and observation of group discussion documented pre-
service teachers’ improved flexibility in interpreting decimals which was something
they did not have in the past.
However, this same activity (Activity 16 in Appendix A5) that seemed to be very
successful showed lack of success in overcoming pre-service teacher’s tendency to
work in symbolic ways. For instance, many groups tended to apply arithmetic
manipulations in decomposing decimals. Pre-service teachers’ current knowledge was
one of the reasons for their tendency to take shortcuts rather than reasoning with models
that were offered in activities. Working with arithmetic operations were considered
faster. This also suggested that nearly all pre-service teachers did not need to use
concrete models as a reasoning tool. In teacher education context, the use of concrete
models was usually linked with teaching ideas to assist children’s learning. This was
observed in pre-service teachers’ general reflections of Set 3 activities which was
probed in Activity 21 (See Appendix A5) in later stage but not in their own strategies
for decomposing decimals. Fitting concrete models with pre-service teachers’ patchy
knowledge of knowledge in a way that put them in a situation to extend their knowledge
was a challenging task.
The general overview of findings from both cycles and feed forward
recommendations for future studies will be articulated in the next chapter.

145
CHAPTER 6 OVERVIEW OF FINDINGS FROM THE
TWO CYCLES
6.1 Introduction
This chapter presents the overview of the research findings from two cycles,
which consists of the overview of outcomes of the teaching experiments on content
knowledge (CK) and pedagogical content knowledge (PCK) of pre-service teachers
from the two cycles. The discussion in this chapter will address the first two research
questions of this study. The first research question looks into the impact of the designed
activities on pre-service teachers’ content knowledge, whereas the second research
question examines the impact of the designed activities on pre-service teachers’
pedagogical content knowledge. In Section 6.2, overview of improvements in various
areas of content knowledge from the two cycles will be discussed. Similarly, Section 6.3
will present an overview of improvements in various areas of pedagogical content
knowledge between two cycles. In Section 6.4, samples of four pre-service teachers’
development in content and pedagogical content knowledge will be presented. These
four cases illustrate the wide variety of pre-service teachers’ knowledge and how the
activities work on this non-uniform knowledge base. The answers to research question 1
will be discussed in Section 6.5 whereas the answers to research question 2 will be
discussed in Section 6.6. Finally, Section 6.7 will present concluding remarks on the
features of Indonesian pre-service teachers’ content and pedagogical content
knowledge.
6.2 Overview of Improvements on Content knowledge
In this section, the effects of the design experiment on content knowledge (CK)
from the two cycles will be summarized and compared. Table 6.1 presents a summary
of the outcomes on various content areas. For each of various content areas and for both
cohorts, it records whether the activities and the items of the written tests remained the
same or were refined between cycles. The table also reports whether students’

146
achievement was judged to have improved on each content area during each cycle by
comparing pre-test and post-test results. Note that in Table 6.1, improved and worse
means statistically significant improvement or decline at the statistical tests reported in
the relevant sections of Chapters 4 and 5. When the improvement or decline was not
statistically significant, the outcome is labelled the same.
As can be observed in Table 6.1, there are more areas recording improved
achievements in cycle 2 as compared to cycle 1. Overall, this pleasing result arises from
two aspects of better design of activities in cycle 2. In some cases the activities used in
cycle 1 were refined for cycle 2, and the outcomes were better. In other cases, cycle 1
did not address this area of content, but cycle 2 was able to do this, by better use of
available time. (These instances are marked by not applicable (n/a) in the refinement
column). For example, as will be discussed below, the important notions of density of
decimals and relative magnitude of decimals on the number line were missed in cycle 1
but addressed in cycle 2, which resulted in the improved achievements in these areas. A
further reason to be confident of the improved achievements in cycle 2 is that some of
the written test items were also refined between the cycles, as summarised in Table 6.1.
The new items measured improvement in a more probing fashion, giving additional
weight to the improvements noted for cycle 2. The next sections will discuss the nature
of these improvements for each content area in turn.
Table 6.1 also shows that both primary and secondary cohorts gained advantage
from the activities and recorded improved achievements in some content areas.
However, the improvements were not uniform across all content areas and showed the
different traits of the two cohorts. This will be elaborated below in the discussion of the
evaluation of improvements in different areas.
In general, content areas that were addressed in activities during the teaching
experiments such as place value and decomposition of decimals documented improved
achievements whereas areas that were not addressed in activities during the teaching
experiment such as density of decimals in cycle 1 did not show significant
improvements. There were two areas with exceptions in cycle 1 that showed decline in
the post-test results, and this will be discussed in more detail in the following sub-
sections.

147
Table 6.1: Outcome of teaching experiments on various content areas from two cycles
Results of Post-test compared with Pre-testa
Areas of content knowledge assessed in written tests
Cohort
Cycle 1 Cohort
Cycle 2 Cohort
Changes to activities between cycles
Changes to pre- & post-tests between cycles
Primary Improved Improved Identifying place value names Secondary Sameb Improved No change Refined
Primary Improved Improved Decomposition of decimals Secondary Improved Improved No change Refined
Primary Not assessed Same Unitising decimal place value Secondary Not assessed Same No change New
Primary Same Improved Density of decimals Secondary Same Improved New Refined
Primary Same Same Decimals on the number line Secondary Same Improved New Refined
Primary Declined Same Sequencing decimals Secondary Declined Same No activities Refined
Primary Same Not assessed Ordering decimals Secondary Sameb Not assessed Not activities Deleted
Primary Same Improved Closeness to a decimal Secondary Same Same
Deleted Refined
a: Improved or Declined indicates statistically significant at 0.05 level b: no room for improvement
6.2.1 Evaluating improvements on place value and decomposition of
decimals
Significant improvements in identifying place value names of a decimal digit and
decomposition of decimals were recorded in both cycles (see row 1 and 2 of Table 6.1).
As reported in Section 4.5, activities in cycle 1 addressed place value and decomposing
decimals well, as indicated by the improved achievements in place value understanding
of both cohorts. Hence, no refinement was made in these activities for cycle 2 and both
cohorts again documented significant improvements in cycle 2 in these two areas. The
written tests were refined in cycle 2 to address the limitation of the items in picking up
the incorrect way of thinking of place value observed in cycle 1. The following
paragraphs will expand on the refinement of the written tests.
The primary cohort demonstrated weak knowledge of place value in the pre-test as
reflected by the lower facility of correct responses (facility of correct answer increased
from 53% to 81%). As reported in Section 4.5, written test responses in cycle 1

148
documented a pattern of incorrect responses in identifying place value names of a
decimal digit based on the length of the decimal digits. The results of the secondary
cohort suggested there was not much room for improvement in identifying place value
names of a decimal digit (facility of correct answer increased from 87% to 90.3%). The
initial scores signified the importance of attending to place value, particularly in the
primary cohort.
The lack of room for improvement of the secondary cohort in cycle 1 signalled the
limitation of the written tests to pick up the incorrect thinking in identifying explicit
place value names. Consequently, the written test items on this area were refined
between cycles (see Section 5.2). Better items were able to reveal and confirm the
predicted error pattern (i.e., identifying place value names based on the length of
decimal digits) in cycle 2. Moreover, findings in cycle 2 documented significant
improvements in identifying place value names of a decimal digit. There is additional
confidence in the improved achievement observed in cycle 2 because this improvement
was observed using the refined items.
Decomposition of decimals into place value related terms (see row 2 of Table 6.1)
was recorded as the weakest area in the pre-test of both cycles but showed the highest
improvements in the post-tests as reported in Section 4.5 and Section 5.4. Scant place
value understanding was evident in some pre-service teachers re-ordering decimal digits
as alternatives in the pre-tests (e.g., 0.375 as 5 ones + 7 tenths + 3 hundredths + 0
thousandths). Activities such as exploring different ways of constructing a decimal
number using the concrete model LAB and illustrating their sketches in related place
value terms allowed pre-service teachers to learn multiple ways of interpreting
decimals. Interview excerpts and worksheet of activities in both cycles recorded pre-
service teachers’ comments about the novelty for them of interpreting decimals in
various ways (see more details in Section 4.5 and Section 5.4). These tasks appeared
new to them, which probably indicates low emphasis on this part of place value in their
previous schooling. The strong emphasis placed on place value and decomposing
decimals on activities in both cycles explained the significant improvements on this
area.
Linking various ways of decomposing decimals in related place value terms and
their standard decimal notation was an area of content knowledge overlooked in the

149
written test of cycle 1. It was expected that the activity of decomposing decimals with
number expanders would allow pre-service teachers to see the link between
decomposing decimals and unitising decimals. To better inspect the knowledge of
relations between expanded and standard decimal notation, new test items on unitising
decimals were added as part of the refinement of test items in cycle 2 (see row 3 of
Table 6.1).
As reported in Section 5.4, difficulties in linking decomposing and unitising
decimals were recorded in the both pre and post-test of cycle 2 (e.g., to write 2 ones + 6
tenths + 15 hundredths + 3 thousandths as 2.6153). Row 3 of Table 6.1 showed that
both cohorts recorded same results after the teaching experiments, which indicated non-
significant improvements. The common incorrect responses in the pre-test on unitising
of decimals, i.e., lining up the decimal digit and ignoring the decimal relations
suggested scant knowledge of place value. The expectation that the link between the
decomposing and unitising decimals could be made easily by pre-service teachers while
working with number expander was not attained. This signified the compartmentalized
nature of pre-service teachers’ knowledge which constrained pre-service teachers to
establish the link between decomposing and unitising decimals as indicated in the
results of pre- and post-tests in cycle 2.
6.2.2 Evaluating improvements on density and relative magnitude of
decimals on the number line
The advantage of addressing density of decimals and relative magnitude of
decimals on the number line (row 4 and 5 of Table 6.1) in Set 2 activities was reflected
in the significant improvements on these two areas in cycle 2 (see Table 5.6 and Table
5.7). These two areas were not addressed in cycle 1 activities due to lack of time and
consequently pre-service teachers from both cohorts recorded no significant
improvements on density of decimals. As reported in Section 4.5, interview data in
cycle 1 revealed the limitation of test items to pick up incorrect thinking about density
of decimals (i.e., thinking there are finitely many decimals in between two given
decimals). The refined items used in cycle 2 gave more confidence in identifying pre-
service teachers who have correct understanding of density of decimals.

150
Playing the ‘Number Between’ game at the start of Set 2 activities as a whole class
in cycle 2 was successful resolving the incorrect thinking that there was no decimal in
between some pairs of decimals. However, as reported in Section 5.3, a tendency to
work with decimals of the same length by working with the equivalent common
fractions with the same denominators tended to persist. This tendency was observed
during group and whole class discussions, particularly in the primary cohort of cycle 2
(see Section 5.3 for more details). This approach reflected the curriculum sequence in
approaching fractions and decimals, which encouraged students to work with decimals
of the same length only. Working with pairs of decimals of different lengths in the
‘Number Between’ game was one way to encourage pre-service teachers to move away
from this tendency.
The primary cohort in both cycles documented substantial difficulties with placing
negative decimals on the number line in the written tests, particularly in the pre-tests.
These difficulties reflected their weak knowledge of negative numbers, which was not
attended during the teaching experiment in cycle 1 as well as confusion between
decimals and negative numbers as has been reported by Stacey, Helme, & Steinle
(2001). As reported in Section 5.3, worksheet of activities (Set 2- Activity 15) and
observation of group discussions in cycle 2 confirmed difficulties of many primary
cohort groups with negative decimals. In some cases, this confusion also affected their
thinking about certain positive decimals. A whole class discussion was carried out with
the primary cohort classes to address these difficulties. However, this short classroom
discussion was not substantial enough to resolve difficulties with negative decimals.
The fact that these difficulties were observed in the primary cohort in both cycles
underscored the importance of attending and resolving these problems during pre-
service teachers’ training. Lack of attention to negative decimals and incorrect
association of decimals with negative numbers in the activities was acknowledged as an
important omission in the design of activities in this study particularly for the primary
cohort. An improved set of activities should include attention to this aspect.

151
6.2.3 Evaluating improvements on sequencing, ordering decimals and
closeness of decimals
The three content areas of sequencing of decimals, ordering of decimals, and
finding the closest decimal to a given decimal (see row 6, 7 and 8 of Table 6.1) were not
included in either set of activities in either cycles. Both sequencing and finding the
closest decimal to a given decimal were assessed in the written tests of both cycles after
some refinement of the test items. In cycle 1, both cohorts showed a decline in the post-
test of sequencing decimals. This was due to a lack of comparability of pre- and post-
test items, with higher cognitive load of the post-test items as reported in Section 4.5.
However, both cohorts recorded non-significant improvement on this area after a
refined set of test items was used in both the pre-test and post-test in cycle 2 (see more
detail in Section 5.4). This might indicate that lack of attention to these content areas
could be the explanation behind lack of improvement on these content areas. This raised
a concern that the weak performance on sequencing decimals might be caused by lack
of attention in the activities in both cycles on this area.
Similarly, both cohorts showed lack of significant improvement in finding a
closest decimal to a given decimal in cycle 1 (see Section 4.5). The interview data in
this cycle revealed tendency of inappropriate application of rounding and truncating
rules. Hence, the written test items were refined between cycles to identify this
behaviour more accurately. Results showed an improved achievement by the primary
cohort but lack of significant improvement (same) of the secondary cohort in cycle 2.
The low mean score of the primary cohort in the pre-test of cycle 1 explained the
significant improvement of this cohort in cycle 2. Meanwhile, stronger reliance on rules
such as rounding or truncating rules without understanding was particularly dominant in
the secondary cohort and explained lack of significant improvement of this cohort on
this area. However, despite lack of significant improvement by the secondary cohorts,
they still outperformed the primary counterparts in both cycles.
The section above has shown there were content areas recording lack of
improvements in one or both cycles which was affected by lack of attention to these
content areas on the activities and by pre-service teachers’ reliance on rules. In the next
section, students’ improvements in pedagogical content knowledge will be examined in

152
a parallel fashion. The final recommended local instruction theory for decimals will be
presented in the next chapter.
6.3 Overview of Improvements in Pedagogical Content knowledge
In this section, improvements on pedagogical content knowledge (PCK) from the
two cycles will be summarized. In Section 6.3.1 and 6.3.2, trends in areas of
improvements examining pedagogical content knowledge in both cycles will be
discussed. Contributing factors to the improvements and explanations behind lack of
success in areas with little improvement (recorded as same in Table 6.2) will be
identified and discussed. Furthermore, common trends and differences in terms of
improvement in various pedagogical content areas in the two cycles will be discussed.
Note that PCK were addressed in activities in both cycles by probing reflections
on activities at the end of the set of activities for teaching ideas. As reported in Chapter
4 and 5, the nature of the reflections on teaching ideas tended to focus on general
reflections of pre-service teachers’ participation on activities for their teaching ideas.
Hence there were not many direct links between activities which addressed particularly
teaching ideas on areas of PCK addressed in the written tests as can be observed in
Table 6.2.
Both cohorts initially showed weak pedagogical content knowledge as reported in
Section 4.5 and Section 5.4. The poor performance on PCK items in cycle 1 was
characterised by the high proportion of blank answers and lack of attention to teaching
ideas. Weak knowledge on the link between decimals and the corresponding fractions as
well as large proportion of blank answers led to poor performance on PCK items of the
primary cohort in cycle 1. As discussed in Section 4.5, it is likely that the blank answers
were due to students not being able to respond, rather than other factors such as having
insufficient time to complete the times. Meanwhile, poor PCK performance of the
secondary cohort was due to lack of articulation in teaching ideas. Hence, more
emphasis on the articulation of teaching ideas was added in cycle 2 to better observe the
pedagogical ideas (see Appendix B9 for detail of the refined written test instruments).
Fewer blank responses and increased facilities on PCK items were recorded in cycle 2.
As reported in Section 5.4, about half the pre-service teachers in cycle 2 were classified

153
as having medium PCK. However, there remained a lack of satisfactory explanations in
teaching ideas with strong reliance on rules and algorithms (sometimes incomplete and
fragmented) and lack of the use of concrete models in teaching ideas.
As shown in Table 6.2, the primary cohort in both cycles recorded significant
improvement in all PCK items, whereas the secondary cohorts’ improvement was not
significant except for teaching ideas in diagnosing students’ error in ordering decimals
and in resolving this error. These findings suggested that the primary cohorts in both
cycles were more accommodating to the teaching ideas introduced during the teaching
experiments. However, despite showing lack of significant improvements, the
secondary cohort outperformed the primary cohort as indicated in their higher mean
scores on PCK items. The following section will discuss the outcomes of teaching
experiments from the two cycles in various pedagogical content knowledge areas.
Table 6.2: Outcome of teaching experiments on various pedagogical content knowledge areas between cycles
Results of Post-test compared with Pre-testa
PCK items assessed in written tests
Cohort
Cycle 1 Cohort
Cycle 2 Cohort
Changes to activities between cycles
Changes to pre- & post-tests between cycles
Primary Improved Improved Teaching ideas for comparing pair of decimals Secondary Same Same
Deleted Refined
Primary Improved Improved Diagnosis of students’ error in ordering decimals and teaching ideas to resolve it.
Secondary Improved Improved
No activities Refined
Primary Same Improved Teaching ideas on division of decimals by 100 Secondary Same Same
No activities Refined
Primary Improved Improved Teaching ideas on the links between fraction and decimal notation Secondary Same Same
No activities Refined
a: Improved indicates statistically significant at 0.05 level
6.3.1 Evaluating improvements in teaching ideas for comparing decimals
and diagnosing an error in ordering decimals
As revealed in Table 6.2, the two cohorts showed different outcomes in terms of
improvements on teaching ideas for comparing a pair of decimals in both cycles (see
154
row 1 of Table 6.2). The primary cohort recorded significant improvements on this
teaching idea in both cycles. However, the pre-test responses documented how pre-
service teachers’ misconceptions were also revealed in their choice of models. For
example, some pre-service teachers incorrectly extended the models commonly used for
teaching fractions, i.e., fair-sharing context for teaching decimals. The interview data
revealed that lack of experience with concrete models in learning decimals and weak
knowledge on the links between fractions and decimals led to this inappropriate
extension of fraction models for teaching decimals. For some pre-service teachers this
inappropriate extension was related to and further confirmed their own misconception
of decimals and reciprocals.
Interestingly the secondary cohort in both cycles recorded no significant
improvement in teaching ideas for comparing a pair of decimals. In cycle 1, the
secondary cohort showed a better performance in both pre- and post-tests. Teaching
ideas incorporating the use of number line or subtraction for comparing decimals was
commonly found in the pre-test responses of the secondary cohort. The post-test
responses showed a tendency to provide similar teaching ideas as given in the pre-test
with some pre-service teachers referred to the use of LAB models or decomposing
decimals for comparing a pair of decimals. This explained lack of significant
improvement in teaching ideas of this cohort in cycle 1. Meanwhile as reported in
Section 5.4, there were cases indicating misinterpretation of the problem in teaching
ideas to compare decimals which explained the low facility of Item 16 particularly in
the pre-test of cycle 2 of the secondary cohort.
As reported in Section 4.5 and Section 5.4, the different traits between the two
cohorts were depicted in the choice of models in teaching ideas for comparing a pair of
decimals. The secondary cohort attended to more symbolic and formal teaching ideas
such as number line or ruler whereas the primary cohort attended more to the use of
concrete models such as LAB models in their teaching ideas.
Both cohorts in the two cycles recorded significant improvements in diagnosing an
error in ordering decimals and in articulating teaching ideas to resolve this error in the
two cycles (see row 2 Table 6.2). The initial teaching ideas for resolving an error in
ordering decimals showed strong reliance on rules such as rounding rules, and annexing
zeros. Reliance on a computational approach such as multiplying decimals by power of

155
10, subtraction, or comparing the equivalent common fractions was also common in the
pre-test from both cohorts.
Only a small proportion of teaching ideas made reference to the place value
notion. Moreover, the common models proposed in the pre-test reflected a more
symbolic teaching approach such as using the ruler or number line. This tendency to use
a symbolic teaching approach reflected the common teaching approach of decimals in
Indonesia. In contrast, teaching ideas after the enactment of activities incorporated the
use of concrete models such as LAB, and place value column charts (see Figure 5.13) to
resolve an error in comparing decimals. Post-course interview data also confirmed the
fact that concrete models introduced during the teaching experiments were useful for
improving their teaching ideas particularly for teaching decimals in the primary school
contexts. However, as reported in Section 4.5 and Section 5.4, both cycles showed the
trend that the secondary cohort opted for a symbolic teaching approach in their teaching
ideas.
Overall, both cycles recorded the shift of teaching ideas in the post-test with more
reference to the place value notion for decomposing decimals to resolve students’ error
in ordering decimals. This shift in teaching ideas was in line with improvement on
content areas, which recorded the highest improvement in decomposing decimals into
related place value terms as discussed in Section 6.2.1. Moreover, this showed the
connection between improvement in content and pedagogical content knowledge.
6.3.2 Evaluating improvements in teaching ideas on division of decimals
and linking fractions with decimals
Teaching ideas on division of decimals by 100 (see row 3 of Table 6.2, Item 18 in
Appendix B1 and B2 and Item 16 in Appendix B5 and B6) was the area least improved
on PCK items in both cycles. Neither cohort showed a significant improvement in cycle
1. Only the primary cohort recorded a significant improvement in cycle 2 but despite
this significant improvement, the performance indicated in the mean scores showed
poor teaching ideas. Extending the use of concrete model of LAB for division of
decimals was not addressed explicitly in activities of either cycle. It was expected that
pre-service teachers could link their experience in exploring decimal relationships

156
among various LAB pieces with teaching ideas for division by 100, but this proved to
be a false assumption.
The teaching ideas to demonstrate division of decimals by 100 proposed by pre-
service teachers in the pre-tests of both cycles showed a strong reliance on rules and
standard algorithms such as invert and multiply and division algorithms. However,
many of the explanations indicated pre-service teachers’ incomplete and deficient
knowledge on these algorithms. Moreover, teaching ideas in the post-tests still
documented strong reliance on these two algorithms without much understanding. Only
a small number of pre-service teachers were able to link their experience during the
teaching experiment to make sense of division of decimals by 100 as reported in Section
4.5 and Section 5.4. This could also be due to the fact that the researcher has focussed
on the meaning for the number but has not put much emphasis on the meaning for the
operation such as division.
Similarly, teaching ideas to link fractions and decimals in both pre- and post-tests
showed lack of meaningful understanding of division algorithm. The primary cohort
from both cycles recorded significant improvements in teaching ideas to link fractions
and decimals. One factor that explained the significant improvements of the primary
cohort was the large proportion of blank answers in the pre-tests. As discussed in
Section 4.5 and Section 5.4, only few pre-service teachers were able to extend their own
learning experience to give meaningful interpretation of division algorithm to link
fractions and decimals. .
In contrast, the secondary cohorts recorded no significant improvements despite
their higher mean scores compared to the primary counterparts in both cycles. Stronger
knowledge on procedures was observed in the secondary cohort teaching ideas.
However, teaching ideas which overlooked the context of teaching decimals in the
primary school such as the use of scientific notation in solving division of decimals
mathematics were documented in the secondary cohort responses.
The sections above have shown the development of PCK in both cycles and also
shown how it grew for the whole sample. In the next section, some case studies are
presented in order to demonstrate what this growth looked like in practice.

157
6.4 Samples of development on CK and PCK
This section will present samples of four pre-service teachers from the two cycles
with different initial levels of CK and PCK and the progress of their CK and PCK after
the teaching experiments.
These four pre-service teachers were selected out of the total of 28 pre-service
teachers who participated in both pre- and post-course interviews from two cycles. They
were chosen because they provided insightful responses during the interviews to
illuminate their problems and progress during the teaching experiments. A summary of
their progress based on their responses on the pre- and post-tests, pre- and post-course
interviews were included in these reports. A lot of cases of development of CK and
PCK were observed but these four pre-service teachers were chosen because their
developments not only represented the wide variety of pre-service teachers’ knowledge
but also depicted non-uniform levels of impacts of activities on pre-service teachers’
CK and PCK.
Case 1: Ayi is a secondary pre-service teacher with good content knowledge on
decimals who took part in the cycle 1 teaching experiment. Her good content knowledge
is reflected in her performance in both DCT3a and DCT3b and Part B of the written
tests. Ayi was classified as A1 based on DCT3a and DCT3b in both tests. She scored 26
out of 27 in the pre-test and 27 out of 27 in the post-test of Part B. Ayi was also part of a
video-recorded group from the secondary cohort in cycle 1. She was actively engaged in
good collaborative work during the teaching experiment. In the pre-course interviews,
she revealed that her knowledge relied on formal algorithm and rules and this was well
reflected in her articulation of teaching ideas for Part C in the pre-test (scored 4 out of 9,
classified as medium PCK). The following interview excerpt recorded her reliance on
rules and algorithms in teaching ideas to find the equivalent decimals for 1/3 and an
absence of reference to any explanatory models:
Ayi: I had trouble working on that item but I have no other way to solve that except by using division algorithm so 1/3 equals to 0.333… From there we can talk about rounding. We can see that the result will not stop here but it depends on our consensus how many decimal digits we would like to round it to… From the division, students can see that it always has 1 as a remainder so the repeated decimal digit will always be 3.

158
Ayi’s evolving knowledge was apparent in her pedagogical content knowledge as
she progressed from the score of 4 out of 9 (medium PCK) at the pre-test to score 8 out
of 9 (high PCK) in Part C of the post-test. In the post-course interview, she commented
that it was the first time for her to use concrete models in learning decimals and she was
particularly impressed with LAB model. In fact, Ayi was able to use the LAB model in
making sense the division process to find the equivalent decimals for 1/6 as documented
in the following excerpt:
Researcher: Could you explain your ideas in assisting students to understand the decimal notation of 1/6?
Ayi: If 1 is divided into 6, we use the LAB and then from 1 if we are to divide it into 6, in the first place it can't be done. Therefore, because we cannot do that, one is equal to ten tenths so now it can be divided into 6. We get one, so this one is one of the tenth. Then from ten tenths if we divide them into 6, we have each group consists of one tenth but we still have 4 tenths more and because 4 tenths can't be divided equally into 6.
Researcher: Then what happened? Ayi: Then we use the hundredths. From there, we divide them into 6, and get
6 groups of 6 hundredths, I mean each has 6 hundredths. Then from here we get 4 as a remainder again, so the students will observe that it can never be evenly divided.
Researcher: So how do you compare this teaching idea to the one you proposed in the pre-test to find the corresponding decimal for 1/3?
Ayi: Obviously it is different. Before I used long division so it is purely symbolic and just works with numbers.
Clearly, Ayi expanded her teaching knowledge from the symbolic approach based
on her prior learning experience of decimals to incorporate the use of LAB models in
understanding the division process and in linking fractions and decimals. Ayi is one
example from a group of pre-service teachers with strong initial content knowledge who
gained advantage from the teaching experiment in improving her pedagogical content
knowledge.
Case 2: Adrian is a primary pre-service teacher with weak content knowledge and
pedagogical content knowledge on decimals from cycle 1 teaching experiment. He was
classified as holding denominator focussed thinking (S1), which was indicated by his
choosing the shorter decimals as the larger decimals in the pre-test DCT3a. During the

159
pre-course interview, a confirmation for his S1 thinking was obtained as he explained
his thinking in comparing 5.62 and 5.736 as follows:
The larger one is 5.62 because this is in hundredths, it means 562/100 whereas this one s 5736/1000. I don’t use number line for this one. Another way is to compare the equivalent fractions but it will be too long.
His S behaviour was confirmed in ordering decimals, such as 0.800001 < 0.7821 <
0.788 < 0.8 < 0 (Item 3a in Part B of pre-test). Note that he has also put all of these
decimals as less than zero, indicating a sub-type of S1 behaviour.
Adrian’s teaching ideas also reflected and confirmed his S1 thinking as he
suggested teaching “tenths are larger than hundredths and thousandths” to resolve
students’ error in ordering decimals as 0.3 < 0.34 < 0.33333 (Item 19 in the pre-test of
Part C of cycle 1). Apparently his answer suggested that he might reverse the order
presented in student’s erroneous response.
Adrian’s S1 thinking was also evident in his explanation on density of decimals.
Adrian consistently answered that there is no decimal in between two decimals of the
same length. His explanation in finding no decimal between 3.14 and 3.15 (Item 5 from
Part B of the pre-test) was because “14 and 15 are two consecutive numbers”. As an S1
thinker, Adrian would think that all the decimal tenths (3.1, 3.2, 3.3 etc are larger than
all the decimal hundredths (3.01, 3.02, 303, etc) which are larger than all the decimal
thousandths (3.001, 3.002, etc). For Adrian, the decimals 3.14 and 3.15 are indeed
“consecutive”. Adrian’s weak content knowledge was reflected in his low score of Part
B (score 13 out of 27 in the pre-test).
Adrian progressed on some areas of content knowledge in the post-test and he was
classified as apparent expert (A1) on DCT3a. His improvement in content knowledge
was apparent in his ability to decompose decimals and in density of decimals and
reflected in his improved score of 17 out of 27 in the post-test. However, his S1 thinking
was still retained in ordering decimals in Item 31 of Part B, i.e., ordering
0.40001<0.4421<0.444<0.4<0. Consistent with this, he showed difficulties with placing
of negative decimals on the number line in the post-test. Despite his improvements on
some areas of content knowledge, Adrian’s content knowledge was still fragile and his
improvements seemed to be isolated.

160
Adrian also showed low pedagogical content knowledge (score 2 out of 9 in the
pre-test of Part C). He made some progress in his teaching ideas by progressing to
medium PCK (score 5 out of 9 in the post-test of Part C) and attempted to accommodate
the LAB model in his teaching ideas to link fraction 1/6 with decimals. However, as he
admitted during the post-course interview, his idea to use LAB was limited to
representing decimals after obtaining the corresponding decimals for 1/6 by the division
algorithm. Adrian did not show a tendency of S1 thinking in his teaching ideas to
resolve students’ error in comparing decimals 0.66666<0.63<0.6 (Item 19 in the post-
test of Part B) in the post-test. However, his suggestion to explain that “the longer does
not necessarily indicate the smaller” did not show a meaningful teaching idea. Clearly
Adrian’s improvement in some areas of content knowledge which was isolated seemed
to inhibit his progress in pedagogical content knowledge.
Case 3: Marni is a primary pre-service teacher with medium knowledge on
decimals who participated in the cycle 2 teaching experiment. She was classified as
holding A2 thinking and scored 15 out of 28 in Part B of the pre-test. However, Marni’s
responses in the pre-test of DCT3a to type 4, type 4R items (i.e., 17.35>17.353,
4.45>4.4502, 3.7>3.7777, and type 8 (i.e., 0>0.6, and 0.00>0.7) items showed possible
association of decimals with negative numbers. The post-course interview confirmed
Marni’s initial association of decimals with negative numbers in comparing decimals of
certain types.
Researcher: So what do you think when comparing 3.7 and 3.7777? Marni: In the case like this, where the numbers are almost the same, in
comparing them, I know that the difference between them will be 7/100, 7/1000, and 7/10000.
Researcher: How did you think of solving it in the pre-test? Marni: Somehow, I used to think of decimals as if they were negatives, using the
context of owing money. I think of comparing for example -4 and -1. I know that -4 is smaller because the value is getting further from 0.
This trend was in line with the observation by Steinle (2004) in her longitudinal
data which suggest the link between S behaviour in A2 which was expressed as below.
(Note that Steinle’s test used in the longitudinal study did not include comparisons of

161
decimals with zero as in DCT3a, so Steinle inferred this link without the direct evidence
of the test but from the interview data). … there is an evidence to support the hypothesis that A2 students are harbouring a latent misconception (S behaviour) to deal with the failure of their incomplete algorithm … this provides additional evidence that A2 students are using algorithms to compare decimals, but harbour an S behaviour. (p.208)
Marni’s low pedagogical content knowledge in the pre-test reflected her
confusion about decimals and reciprocals, which was also translated in confusing
models for decimals and reciprocals (score 2 out of 9 in the pre-test). Her strong
association of decimals with fractions and her lack of knowledge about models for
teaching decimals led her to opt for fair sharing context for teaching decimals. She
proposed an example of sharing a candy with 8 people to represent 0.8 and sharing a
candy with 88 people to represent 0.88 in the pre-test. Clearly the chosen model of
sharing a candy also highlighted her lack of exposure in the use of models in teaching
decimals and this was confirmed during the pre-course interview.
Marni was classified as holding A1 thinking in the post-test. She recorded
improvements in areas of content knowledge such as place value, decomposing and
unitising, and density of decimals. Her improvement on some content areas was
reflected in her post-test score of 22 out of 28 in part B. However, Marni still recorded
difficulties in sequencing decimals and placing decimals on the number line.
Marni also showed some progress in her pedagogical content knowledge as
evident in her improved score of 5 out of 9 (medium PCK) in the post-test of Part C. As
illustrated in the above post-interview excerpt, Marni made reference to place value
notions in her teaching ideas for comparing decimals and incorporated the LAB model
in her teaching ideas for comparing a pair of decimals. However, her teaching ideas in
division of decimals did not seem to change as she still made reference to the ‘invert
and multiply’ algorithm in her teaching idea without giving much explanation. Her
teaching idea in linking fractions and decimals also documented her fragile knowledge
on the division algorithm. Hence, the improvements that she apparently made on
content areas did not seem to translate well into teaching ideas.

162
Case 4: Vivi is a pre-service primary teacher with weak content knowledge (score
9.5 out of 27) who participated in the cycle 2 teaching experiment. She was diagnosed
as holding A2 thinking in the pre-test and indicated reliance on rounding rules as
evident in her incorrect responses in DCT3a (i.e., noting that 17.35=17.353,
4.4502=4.45, and 3.7=3.7777). Vivi’s reliance on rounding rules was confirmed in her
responses in both Part B of the pre-test by utilising rounding rules inappropriately to
find the closest decimal to a given decimal (Item 10, 11 of Part B). In her explanation,
she rounded up the given decimal 8.0791 to two decimal places and hence chose 8.08 as
the closest decimal instead of 8.079001.
Vivi also had scant knowledge of place value as evident in the way she reversed
the order of decimal digits in decomposing and unitising decimals (e.g., she answered 0
ones + 7 tenths + 1 hundredth + 12 thousandths as 1.2170). Moreover, she showed lack
of knowledge about density of decimals by noting there was no decimal in between two
given decimals and confused the positions of negative decimals on the number line. The
pre-course interview revealed that Vivi held confusion about decimals and reciprocals
as illustrated in Figure 6.1a.
Vivi’s teaching ideas in the pre-test confirmed her reliance on rounding rules
without much understanding as reflected in her medium PCK (score 4 out of 9) in the
pre-test). Reference to rounding was made in her teaching ideas to compare 0.8888 and
0.8 (Part C, item 15) and in teaching ideas to resolve an error in ordering decimals (Part
C, item 17). Inappropriate use of the rounding rule, i.e., rounding 0.33333 = 0.3, was
documented in her teaching idea to resolve an error of ordering decimals 0.3, 0.33333,
and 0.34. Clearly the use of rounding rule in this case was not helpful in resolving an
error in ordering decimals.
Figure 6.1: Vivi’s notes made during the interview
Figure 6.1a: Vivi’s pre-course interview note Figure 6.1b: Vivi’s post-course interview note

163
Vivi showed improvements in both content knowledge (score 23 out of 28 in Part
B) and pedagogical content knowledge. She progressed to high PCK (score 8 out of 9 in
Part C) and she was classified as holding A1 thinking using DCT3b in the post-test. Her
improved place value knowledge was evident in her abilities to answer 3 different ways
of decomposing decimals. She also showed improved knowledge of density of
decimals. However, her difficulties with negative decimals were not resolved by the
time of the post-test.
Improvement in pedagogical content knowledge was documented in Vivi’s
reference to place value notions by decomposing decimals for teaching ideas to compare
and order decimals in the post-test (both Item 15 and Item 17). In the post-course
interview, Vivi utilized LAB model in linking 61 with its decimal notation as recorded in
the following excerpt and illustrated in Figure 6.1 above:
Researcher: Could you explain how did you find the decimal for 1/6 using the LAB pieces?
Vivi: First 1/6 means 1 piece divided into 6 parts. We need to divide the whole piece into 10 pieces and distribute them among 6 people
Researcher: Then? Vivi: Because there were 10 parts and we use six parts so there were 4 parts
remaining, we can divide each of them into 10 shorter parts. Researcher: So first, shall we go back and work out the names of each piece again?
Vivi: First we start with one and then divide it into 6 parts, so each has 1 tenth and we have a remainder of 6 tenths… no that is wrong
Researcher: Each part has how many of what? Vivi: Each has one tenth and there are 4 remaining tenths and we divide them
again into 10, so we have 40 hundredths and divide it again into 6 parts, etc
Researcher: So how do you find the decimal notation for 1/6? Vivi: 1/6 is the same as 0.166 Researcher: Will it stop? Vivi: No the 6 will repeat forever Researcher: Why do you think it will repeat forever? Vivi: Because there is always a remainder of one
The above excerpt showed Vivi’s progress in her understanding on relations
between fractions and decimals. More importantly she was able to make a meaningful
understanding of fractions and the division process by utilizing the concrete model
LAB. It was encouraging to learn that a pre-service teacher with weak content

164
knowledge was able to progress to develop a meaningful interpretation of links between
fractions and decimals.
These four cases of pre-service teachers’ development on content and pedagogical
content knowledge depicted the wide variety of pre-service teachers’ content and
pedagogical content knowledge. These four examples show that pre-service teachers
with different initial levels of content knowledge gained advantage from the activities.
Pre-service teachers with weak initial content knowledge in both cycles, such as Adrian
and Vivi, gained advantage from their participation in the teaching experiment. They
still had more to learn and their new knowledge did not seem well integrated, but they
had made progress. However, as explained above, the fragmented nature of their
knowledge was resulted in isolated improvements in different content areas. This was
evident in Adrian’s case. Similarly, pre-service teachers with medium content
knowledge, such as Marni, also showed progress after the teaching experiment. Pre-
service teachers with strong initial content knowledge, such as Ayi, did not have much
room for improving their content knowledge. However, the advantage of participating
in the teaching experiment was clear on her evolved pedagogical content knowledge.
In line with the overall findings reported in Section 6.2 and 6.3, persistent
difficulties in some areas such as negative decimals were observed in all cases except
for Ayi. This is an area that was not adequately addressed in the activities. Further
discussions about features and characteristics of pre-service teachers’ content and
pedagogical content knowledge will be addressed in the next two sections.
6.5 Answering Research Question 1 and sub-questions
Research question 1 (see section 1.4) asked “To what extent do the activities
improve pre-service teachers’ content knowledge (CK) on decimals?”. Based on the
evidence brought together from the two cycles in section 6.2, it was clear that the
activities delivered during the teaching experiments contributed to the improvement of
pre-service teachers’ knowledge of decimals in both cycles. Discussion in Section 6.2
signified that in general areas that were well attended in the activities recorded
significant improvements. Similarly content areas that were not addressed on the

165
activities recorded non-significant improvements. Findings from both cycles recorded
different areas of concerns on content areas from the primary and the secondary cohort.
This implies that activities need to be modified to better attend different areas of
concerns of the two cohorts by offering different programs to suit the characteristics of
each cohort. This issue will be addressed later in Chapter 7.
Research question 1 also asked two sub-questions, which will now be discussed in
turn.
What is the current state of Indonesian pre-service teachers’ content knowledge of
decimals? (Research Question 1a)
Before addressing this question, I will clarify the meaning of ‘current state’ of pre-
service teachers’ knowledge. As mentioned in Section 1.1, in general, decimal topics are
not revisited and addressed in teacher education. Therefore, pre-service teachers’
knowledge measured in the pre-test and pre-course interviews could be perceived as a
reasonable indicator of the knowledge that pre-service teachers usually have. Hence,
pre-service teachers’ knowledge observed in the pre-tests is taken as representative of
the current state of their knowledge in both content and pedagogical content knowledge.
As recorded in the pre-test results and illustrated by the four samples of pre-
service teachers’ development of content knowledge and pedagogical content
knowledge, pre-service teachers’ content knowledge at the beginning of both cycles was
widely spread. Both cycles showed a trend of stronger content knowledge of pre-service
teachers from the secondary cohort compared to the primary cohorts.
The current state of Indonesian pre-service teachers’ content knowledge of
decimals could be characterised as:
*fragmented;
*with strong reliance on rules or algorithms without understanding, and
*strong association of decimals with fractions.
Each of these characteristics will be explained in the following paragraphs.
Fragmented knowledge of pre-service teachers was evident in the practice of
applying a mix of rules inappropriately without understanding to solve different
problems about decimals. Cases where pre-service teachers were able to decompose a

166
decimal 0.375 = 0 one + 3 tenths + 7 hundredths + 5 thousandths, but at the same time
said that 17.353 < 17.35 illustrated fragmented knowledge of decimals.
Strong association of decimals with fractions was evident in pre-service teachers’
tendency to revert to fraction notation and computations in working with problems
involving decimals. As reported in Section 4.5 and Section 5.4, the activity of finding
the total lengths in measuring a table recorded a strong tendency to rely on fraction
notation and operations. Similarly, in comparing and ordering decimals, many pre-
service teachers converted decimals to equivalent fractions and operated on them rather
than relied on place value notion. This strong association of decimals to fractions
reflects the sequence of Indonesian curriculum in teaching fractions before decimals
which emphasize on computational skills in working with fractions. One advantage of
this approach is that pre-service teachers acquire knowledge on relations between
decimals and fractions and certain degree of fluency in converting between fractions
and decimals. However, heavy emphasis on a computational approach and deficient
knowledge of fractions inhibit pre-service teachers from making meaningful links
between fractions and decimals.
Reliance on rules or algorithms was observed in all parts of the written tests and
recorded in pre-service teachers’ explanations given during the interviews. When
probed about the reason for using rounding, this rule was cited to simplify problems of
working with decimals of longer decimal digits. Application of rounding or truncating
rules was particularly dominant in comparing decimals with few repeated digits (such as
comparing 3.7 with 3.777) on DCT3a and DCT3b in both cycles. A similar trend of
adult students’ reliance on incomplete algorithms without understanding was reported
by Steinle and Pierce (2006) and Stacey and Steinle (2006) with nursing students.
Moreover, data in this study showed instances of inappropriate application of
rounding rules, for example in finding the closest decimal to a given decimal (see Vivi
as an example in the previous section). Teaching ideas for comparing a pair of decimals
and for ordering decimals also documented evidence of some inappropriate application
of rounding or truncating rules. For instance, whilst using rounding rules for comparing
a pair of decimals such as 0.8888 and 0.8 will lead to correct answer, it overlooks the
important aspect of developing students’ understanding of the meaning of decimals.

167
Strong reference to algorithms such as the ‘invert and multiply’ algorithm was
commonly found in teaching ideas for division of decimals. However, explanations of
these algorithms recorded in the written test responses were limited to the procedural
steps in carrying out the computations based on memorized facts which were often
incomplete or incorrect, as documented in Figure 6.2.
Figure 6.2: Deficient knowledge of invert and multiply algorithm and the division algorithm
What is the interplay between pre-service teachers’ participation in the set of
activities on decimals and their CK of decimals? (Research Question 1b)
Pre-service teachers’ current content knowledge shaped the nature of their
participation and their responses on the activities. Their strong association of decimals
with fractions based on a computational approach was evident in responses to the initial
activities of measuring and recording the result of measurement in both cycles, as
reported in Section 4.5 and Section 5.3.
Pre-service teachers’ prior knowledge including their strong reliance on rules or
algorithms without understanding explained the nature of their participation in
activities. For instance, pre-service teachers utilized their knowledge of the metric
system and their knowledge of rulers in finding the total lengths using the LAB models.
This might indicate a positive sign that these pre-service teachers were aware of the
similarities in base ten relations between metric systems and LAB models. However, the
design of LAB models was not intended to directly link to the metric system. In fact, the
use of LAB models with one unit of reference was expected to set the focus on
exploring base ten relations. This showed an example where prior knowledge of pre-
service teachers about decimals could be problematic in engaging with exploratory
activity in this study. Further discussion on this issue will be discussed in Chapter 7.

168
The fragmented nature of pre-service teachers’ knowledge was also evident in that
improvement in content areas of decimals was often isolated as illustrated in the case of
Adrian and Marni in Section 6.4. However, some pre-service teachers such as Vivi
showed an ‘aha’ moment during the post-course interview. As reported in Section 6.4,
Vivi was able to utilize LAB as a thinking tool to create a meaningful link between
fractions and decimals. Her pre-course interview note (see Figure 6.1a) and transcripts
documented her confusion of decimals and reciprocal. For pre-service teachers with
good content knowledge such as Ayi, participation in the activities contributed to
widening their pedagogical ideas particularly in the use of concrete models for teaching
decimals. There was an indication that pre-service teachers with weaker content
knowledge, represented by the primary cohort in this study gained more advantage from
the activities to improve their content knowledge on decimals.
Clearly, pre-service teachers’ participation in the set of activities resulted in
improvement on some areas of content knowledge as summarized in Table 6.1. These
improvements were not uniform across all areas of content knowledge but reflected how
well the content areas were addressed in the activities as has been explicated in the
overview of improvements in various areas in Section 6.2. Areas such as place value,
and decomposition of decimals took up a significant portion of the activities and
resulted in significant improvements on these areas. Moreover, significant improvement
on density of decimals in cycle 2 showed that addressing density in the activities
resulted in improved knowledge of pre-service teachers on density of decimals.
Similarly, areas that were not addressed in the activities of both cycles such as
sequencing decimals and finding the closest decimals to a given decimal showed lack of
significant improvements in both cycles. This trend indicated that addressing content
areas in the activities during the teaching experiment made a difference in pre-service
teachers’ knowledge in the corresponding content areas.
6.6 Answering Research Question 2 and sub-questions.
Research question 2 asked “To what extent do the activities improve pre-service
teachers’ pedagogical content knowledge (PCK) on decimals?” This has been discussed
above in section 6.3, which documented the considerable gains made by many students.

169
More reference to the basic notion of place value in the teaching ideas after enactment
of activities indicated a positive impact of activities on pre-service teachers’ PCK on
decimals. Incorporating the use of concrete models for teaching decimals to create more
meaningful understanding was clearly documented in pre-service teachers’ teaching
ideas after the teaching experiments. It was also found that strong reliance on rules and
fragmented nature of pre-service teachers’ content knowledge in some areas constrained
the uptake of new teaching ideas.
In answering research question 2 about the impact of the designed activities on
pre-service teachers’ pedagogical content knowledge, there are also two sub-questions
to answer, which are now treated in turn.
What is the current state of Indonesian pre-service teachers’ PCK of teaching
decimals? (Research question 2a)
The current state of Indonesian pre-service teachers’ PCK reflected the pre-service
teachers’ current content knowledge, and their prior learning experiences on decimals,
which also reflected the curriculum sequence of how decimals were approached in
primary school.
Strong reliance on rules and algorithms such as rounding and truncating rules,
division and invert and multiply algorithms were featured in the proposed teaching ideas
in the pre-tests of both cycles. In the pre-tests, pre-service teachers generally offered
rules as explanations, rather than explanations based on reasoning from place value, or
reasoning from models. This reliance on rules was further confirmed during the pre-
course interviews. Lack of reference to the use of models as a pedagogical tool for
learning and teaching decimals was also evident. Based on these facts, the current state
of pre-service teachers’ PCK could be characterised by teaching ideas relied on rules
and computational approach with lack of inclusion of concrete models (see Section 4.5
and Section 5.4 for more detail).
Interestingly, an attempt to extend models for teaching fractions such as fair
sharing situation for teaching ideas for decimals was found in both cycles. This also
revealed misconceptions. For instance, a model of sharing a cake with 8 people to
represent decimal 0.8 was commonly observed in both cycles. This attempt was based
on knowledge that fractions and decimals were related. However, weak knowledge on

170
the link between fractions and decimals and lack of knowledge on models for teaching
decimals resulted in teaching ideas which confused models for decimals with models for
reciprocals as reported in Section 4.5 and Section 5.4. Moreover, common model
proposed in the pre-test such as ruler and number line revealed pre-service teachers’
limited knowledge of the use of concrete models for teaching decimals. This fact was
also recorded in the interview data as reported in Section 4.5 and Section 5.4. Clearly
pre-service teachers’ knowledge of concrete models for teaching decimals was
improved by the end of the activities.
Lack of alternatives for less symbolic teaching ideas was clearly expressed during
the interviews and inhibited pre-service teachers to propose alternative ways for
teaching decimals. Meanwhile, some pre-service secondary teachers noted that they
have not been taught about teaching ideas for decimals. However, the majority of pre-
service teachers realized the limitations of this teaching approach for decimals, which
was dominated by symbolic and mechanistic approach during the pre-course interviews.
Interview excerpts by Ayi, Vita, and Ana (see Section 4.5.3 and Section 5.4.2) showed
that teaching approach on decimals was symbolic with reliance on rules and operations
with no reference to the use of concrete models.
What is the interplay between pre-service teachers’ participation in the set of
activities on decimals and their PCK of decimals? (Research question 2b)
The incorporation of concrete models for learning decimals was a new experience
for almost all pre-service teachers involved in both cycles of the teaching experiment.
This experience has expanded pre-service teachers’ knowledge of alternative ways of
teaching decimals. Pre-service teachers’ reflections notes recorded in the worksheets of
activities of cycle 1 and cycle 2 documented the positive impact of models introduced in
the teaching experiment such as LAB and the number expander. However, both cycles
showed that for the majority of pre-service teachers, the use of models were seen more
as representational tools rather than a thinking tool. Many pre-service teachers were
able to represent the numbers using the models but unable to use their actions on the
models to make sense of arithmetic operation and algorithm.
Teaching ideas related to this appears to require further work. Justification of
algorithms in terms of the models showed the least improvements in both cycles.

171
Despite attending to place value notion and making use of concrete models such as LAB
and number expanders for comparing and ordering decimals in some of the post-tests,
only a small proportion of pre-service teachers in both cycles were able to utilize
concrete models to make meaningful sense of algorithms or rules in their teaching ideas
(see Section 4.5 and Section 5.4). The fact that pre-service teachers had difficulties to
link their improved knowledge on content areas of decimals to teaching ideas indicated
the fragmented nature of pre-service teachers’ knowledge. The strong reliance of pre-
service teachers’ content knowledge on rules and algorithms without understanding
explained their struggles to utilize models in creating meaningful understanding of
decimals. Moreover, this highlighted the need for activities to enable pre-service
teachers in making use of models in creating more meaningful interpretation of
decimals and their operations.
Both cycles documented different traits of the two cohorts which seemed to reflect
different stages of their training and influenced their preference for models and teaching
approaches. Pre-service teachers from the primary cohort with some practical teaching
experience in schools demonstrated more awareness to the use of concrete models in
their teaching ideas and linked their use to the need in providing primary school
children with more hands-on learning experience. In contrast, many of the secondary
pre-service teachers revealed lack of thought about teaching ideas at this early stage of
their training. The fact that the secondary pre-service teachers had done no practical
teaching experience at schools might explain this different pedagogical awareness.
6.7 Concluding Remark
The overview of findings from the two cycles showed that the activities in both
cycles were successful, particularly in improving pre-service teachers’ knowledge of
decimal place value and in expanding meaningful interpretation of decimals. The
activities in both cycles also contributed to improvement on pre-service teachers’
pedagogical content knowledge, particularly on knowledge of the use of concrete
models for teaching decimals. However, it was observed that incorporating concrete
models in teaching ideas were still limited to representational tools, rather than as the
thinking tool. Interestingly, pre-service teachers from the primary cohort in both cycles

172
seemed to be more accommodative to the use of concrete models in teaching ideas as
compared to the secondary cohort counterparts.
Weak and fragmented content knowledge indeed affected the nature of pre-service
teachers’ participation in the designed activities. Despite the uptake of new teaching
ideas to incorporate the use concrete models for teaching decimals in more engaging
and meaningful way, reliance on old teaching approach based on rules was still
observed in both cycles. Similarly, pre-service teachers’ existing fragments of
knowledge influenced the way in which they engaged with the exploratory activities
which aim to reflect the guided reinvention tenet. This resistance to take up new
approach was commonly reported in any reform effort studies. Further discussions on
the design of activities and researcher’s reflections on the extent to which the basic
tenets of RME fitting for adaption in teacher education and the role of teacher education
in promoting the teaching tenet of RME (answering research question 3) will be taken
up in the next chapter.

173
CHAPTER 7 CONCLUSION
7.1 Introduction
This chapter starts by presenting in Section 7.2 the proposed LIT on decimals for
pre-service teachers based on the teaching experiments in two cycles. The proposed LIT
comprises goals of the designed activities, the rationale for selecting the activities and
the conjectured learning paths of the pre-service teachers. In Section 7.3, the
researcher’s reflections on the implementation of the basic tenets of RME and the RME
teaching principles based on the teaching experiments in two cycles will be discussed.
These reflections serve as a basis for articulating the role of teacher education to adapt
RME basic tenets in teaching and learning mathematics in Indonesia. This will provide
answers to research question 3. The strengths and limitations of this study will be
discussed in Section 7.4. Finally, directions and recommendations for further research
on design of activities on decimals in teacher education in Indonesian context will be
articulated in Section 7.5.
7.2 Proposed LIT for decimals
This section will present the summary of the proposed LIT on decimals in teacher
education based on the empirical experience of carrying out the activities in two cycles.
Following Graveimejer’s (2004) notion, the proposed LIT comprises learning goals,
planned activities and tools, and conjectures of pre-service teachers’ learning paths in
achieving the learning goals. As pointed out by Graveimeijer, van Galen & Keijzer
(2005), re-designing the activities based on analyses of the actual learning processes
after the trial of activities in the classroom is part of the LIT development. This has
been carried out at the end of both the first and second cycles.
In Table 7.1, a summary of the links among content areas, goals and sub-goals and
the proposed activities are offered. In Table 7.1, activities refer to either the earlier
trialled activities or the modification of activities trialled in either cycle 1 or cycle 2.
The earlier trialled activities are as given in the Appendices. The modified activities are

174
not given in this thesis, but section 7.2.1 describes the modifications that should be
made in the future. Conjectured learning paths of pre-service teachers will be discussed
along with the modified activities in Section 7.2.1. General features of the proposed LIT
will be presented in Section 7.2.2.
Table 7.1 gives the program for primary pre-service teachers. For secondary
teachers, the same activities can be used but they can be expected to complete them in a
shorter time.
Table 7.1: Proposed LIT on decimals in teacher education
Content areas in the activities
Goals and sub-goals Activities Time for primary
Place value of decimals
PSTs* develop meaningful understanding of decimals based on place value. PSTs can express base ten
relations in decimal place value digits.
Revisiting decimal place value relations using length as a model.(Modification of Set 1- Activity 1 of cycle 2)
Exploring ways of refining the tenths in the context of getting more accurate measurement (Modification of Set 1- Activity 2 of cycle 2)
PSTs can use the base ten relations observed in establishing the names for LAB pieces and in linking them with the formal notation.
Establishing the name reflecting the base ten relations in various LAB pieces (Set 1- Activity 3 of cycle 1).
Reasoning about the choice of subsequent refining of one into ten (Modification of Set 1- Activity 3 of cycle 2).
PSTs can explore the additive and multiplicative structures in the context of measuring length and recording the result in formal notation.
Measuring by iterating different pieces of LAB and recording the result of measurement using decimal notation (Set 1- Activity 4 of cycle 2).
PSTs can apply their knowledge of place value for interpreting and comparing decimals.
Articulating teaching ideas for interpreting decimals and comparing pairs of decimals. (Set 1- Activity 7 of cycle 1)
1 meeting of 100 minutes
Decomposing and unitising decimal place value
PSTs can decompose decimals in various ways
Finding multiple ways of decomposing the same decimals (Set 3- Activity 16 of cycle 2).
Decomposing decimals in symbolic form (Set 3- Activity 17 of cycle 2).
1 meeting of 100 minutes
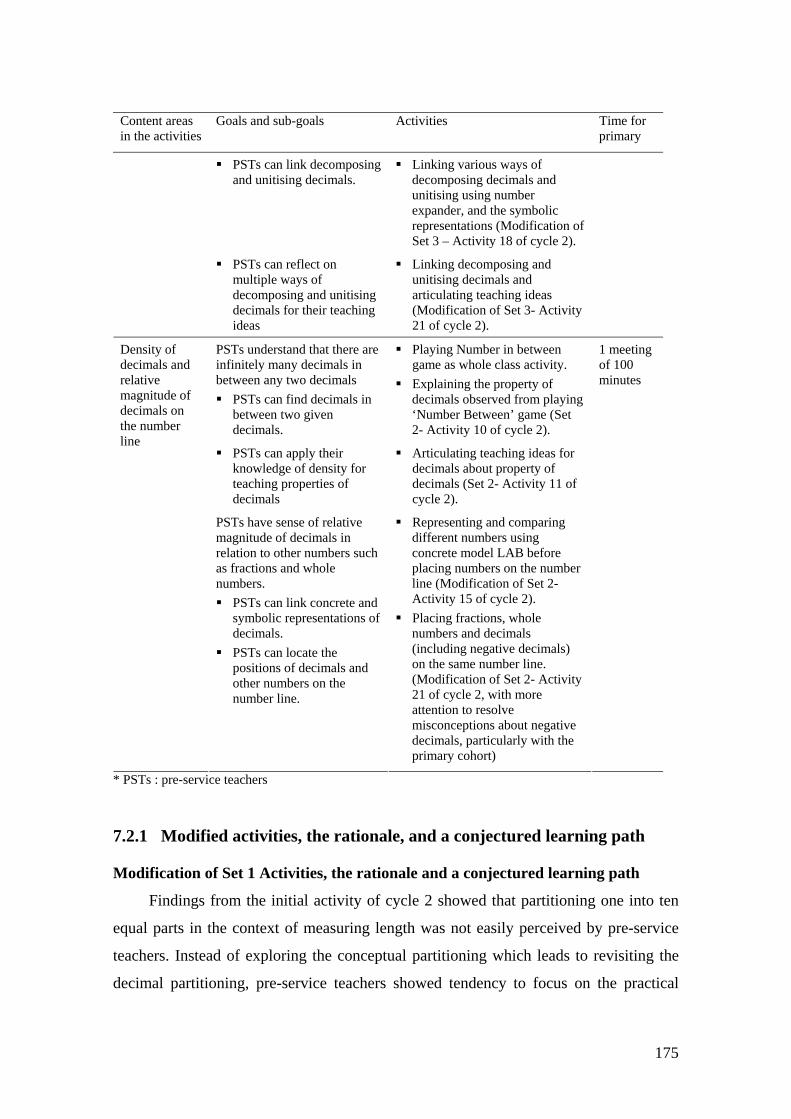
175
Content areas in the activities
Goals and sub-goals Activities Time for primary
PSTs can link decomposing and unitising decimals.
Linking various ways of decomposing decimals and unitising using number expander, and the symbolic representations (Modification of Set 3 – Activity 18 of cycle 2).
PSTs can reflect on multiple ways of decomposing and unitising decimals for their teaching ideas
Linking decomposing and unitising decimals and articulating teaching ideas (Modification of Set 3- Activity 21 of cycle 2).
PSTs understand that there are infinitely many decimals in between any two decimals PSTs can find decimals in
between two given decimals.
Playing Number in between game as whole class activity.
Explaining the property of decimals observed from playing ‘Number Between’ game (Set 2- Activity 10 of cycle 2).
PSTs can apply their knowledge of density for teaching properties of decimals
Articulating teaching ideas for decimals about property of decimals (Set 2- Activity 11 of cycle 2).
Density of decimals and relative magnitude of decimals on the number line
PSTs have sense of relative magnitude of decimals in relation to other numbers such as fractions and whole numbers. PSTs can link concrete and
symbolic representations of decimals.
PSTs can locate the positions of decimals and other numbers on the number line.
Representing and comparing different numbers using concrete model LAB before placing numbers on the number line (Modification of Set 2- Activity 15 of cycle 2).
Placing fractions, whole numbers and decimals (including negative decimals) on the same number line. (Modification of Set 2- Activity 21 of cycle 2, with more attention to resolve misconceptions about negative decimals, particularly with the primary cohort)
1 meeting of 100 minutes
* PSTs : pre-service teachers
7.2.1 Modified activities, the rationale, and a conjectured learning path
Modification of Set 1 Activities, the rationale and a conjectured learning path
Findings from the initial activity of cycle 2 showed that partitioning one into ten
equal parts in the context of measuring length was not easily perceived by pre-service
teachers. Instead of exploring the conceptual partitioning which leads to revisiting the
decimal partitioning, pre-service teachers showed tendency to focus on the practical

176
aspects of physical partitioning as reported in Section 5.4. This finding concurs with a
study by Keijzer, van Galen, & Oosterwall (2004) who reported difficulties in
perceiving the choice for a decimal system in partitioning one shown by the primary
school children in the Netherlands. Indeed the rationale for choosing a decimal system
of repeated partitioning into ten is based on simplicity of operating with decimals by
extending whole number algorithms. This is very sophisticated and not evident in a
measuring context, unless operations with the numbers are called for. The history of
decimal notation showed that the invention of decimal notation by Simon Stevin was
made quite late in 1585 (see Figure 7.1).
Figure 7.1: History of decimal notation (Steinle et al., 2006)
Based on the above facts, the modified initial activity in the proposed LIT will
focus on having pre-service teachers revisit the decimal place value structure, whereas
the rationale of partitioning one into ten will be included as whole class discussion,
rather than individual or group guided discovery. Both the longest piece of LAB
(representing one) and one tenth of the one piece of LAB are given at the start to guide
pre-service teachers in revisiting the decimal place value structures in the context of
measuring length and refining the measurement unit. It is expected that pre-service
teachers are able to observe and capitalize on this one tenth relation for the next
refinement for measuring and recording the result of shorter lengths. Note that, this
initial activity differed from the activity in cycle 1 when all the LAB pieces were
presented at the same time.

177
The modified activities are considered as ‘less structured’ because the longest
piece of LAB and the ‘one tenth’ of the longest LAB piece will be given but not the
relationship between them. Instead, pre-service teachers are expected to explore this
relationship in the context of refining the result of measurement. By extending the ‘one
tenth’ relation for the next refinement, the need for ‘one hundredth’ piece of LAB will
surface. Similarly, the need for further refinement in the context of measuring shorter
lengths for greater accuracy, will lead to reinvention of a thousandth, and so on.
This activity is then followed by an activity to establish the names of the LAB
pieces and to link them with the formal notation as trialled in Set 1- Activity 3 of cycle
1 (see Appendix A2). Discussion about the rationale for successive partitioning into 10
as the basis for the decimal system will be carried out as a whole class discussion.
Learning about the notion of successive partitioning into ten will provide insights for
pre-service teachers on the common approach of applying whole number rules in
operating with decimals, particularly in addition and subtraction. In achieving this aim,
an explicit task to explore the link between whole number place value and the endless
base ten chain will be provided to guide pre-service teachers in making this link. This
serves as a modification of Set 1- Activity 3 from cycle 2 in Appendix A4.
In the next sequence, Set 1- Activity 4 of cycle 1 (see Appendix A2) entails pre-
service teachers capitalizing on decimal relations and notation to record the result of
measuring lengths by iterating different pieces of the LAB model (e.g., placing 3 tenths
together and recording as 0.3). Finally, Set 1 activities resume with teaching ideas to
interpret decimals and compare the size of decimals, which was the same as Set 1-
Activity 7 of cycle 1 in Appendix A2. It is expected that pre-service teachers will draw
on base ten relations explored in the previous activities as well as their new experience
with concrete models in learning decimals in their teaching ideas for interpreting and
comparing decimals. Moreover, it is expected that multiplicative and additive relations
will be explored in the teaching ideas for interpreting and comparing pairs of decimals.
Modification of Set 2 Activities, the rationale and a conjectured learning path
Set 2 of the proposed LIT starts with an activity to explore various ways of
decomposing decimals into place value terms (Set 3- Activity 16 of cycle 2 in Appendix
A4). In this activity, pre-service teachers are encouraged to explore different ways of

178
decomposing decimals. Findings from both cycles (see Section 4.5 and Section 5.4)
documented that the majority of pre-service teachers lack of knowledge about multiple
ways of interpreting decimals. Moreover, the concrete model LAB was noted as useful
in helping them to create a meaningful interpretation of decimals. Following this, Set 3 -
Activity 17 of cycle 2 (see Appendix A4) to decompose decimals in symbolic forms is
carried out. Establishing the link between decomposing and unitising decimals in related
place value is explored using the number expander model designed in Set 3- Activity 18
of cycle 2 (see Appendix A4). However, findings in both cycles showed that a majority
of pre-service teachers failed to notice the link between decomposing and unitising of
decimals. Therefore in the proposed LIT, the reflection task places a stronger emphasis
on place value knowledge in linking decomposing and unitising of decimals in
modification of Set 3- Activity 21 of cycle 2.
Modification of Set 3 Activities, the rationale and a conjectured learning path
Set 3 activities in the proposed LIT started with playing the ‘Number Between’
game as a whole class activity, which is followed by a task to articulate the property of
decimals learnt from this game as contained in Set 2- Activity 10 of cycle 2 (see
Appendix A4). Findings reported in Chapter 5 indicated that this activity was useful in
acquainting pre-service teachers about density of decimals. Moreover, it confronts pre-
service teachers’ misconceptions about decimals such as thinking that decimals form a
discrete system evident in responses such as ‘there is no decimal in between 3.14 and
3.15.
Building a sense of relative magnitude of decimals among other numbers such
as whole numbers and fractions is a key part of number sense. Findings in both cycles
showed a strong reliance on the algorithm and lack of meaningful understanding of the
link between decimals and fractions. However, the fact that a few pre-service teachers
were able to make a meaningful link between decimals and fractions indicated a
promising result. Therefore in the proposed LIT, Set 2- Activity 15 of cycle 2 (see
Appendix A4) is modified by linking decimals and fractions using the concrete model
of LAB as whole class discussion before placing the numbers on the number line.
Both cycles also revealed a trend of difficulties with negative decimals,
particularly the primary cohort when they undertook Set 2, Activity 21 of cycle 2

179
containing a task of placing decimals, whole numbers and fractions on the same number
line (see Appendix A4). Taking into account this trend of difficulties, more time will be
spent to elicit and to resolve any misconception about negative decimals during whole
class and group discussions, particularly in the primary cohort.
Based on experience in both cycles, the realistic time recommendation to carry
out the whole set activities in the proposed LIT is 3 meetings of approximately 100
minutes for the primary cohort. As reported in Section 4.5 and Section 5.4, the primary
cohort in both cycles showed weaker knowledge of decimals. For instance, pre-service
teachers in both cycles tended to have difficulties with negative decimals. For the
secondary cohort, the activity of placing decimals on the number line (Set 2- Activity 21
of cycle 2) could be abbreviated. The data in both cycles suggested that the secondary
cohort show that this activity did not show many difficulties with negative decimals.
Hence, it is considered realistic to carry out the whole set of activities in 2 meetings of
approximately 100 minutes for the secondary cohort.
This proposed LIT addresses the meaning of decimal notation and its basic
properties. However, the evidence from the written post-test and interviews showed that
pre-service teachers could use LAB to help them think about these aspects of decimals,
but many of them were not able to transfer this knowledge to a meaningful
understanding of decimal algorithms (e.g., finding a decimal expansion of 1/6). This
needs to be addressed in teacher education, following this LIT or in conjunction with
instruction on whole number place value.
7.2.2 General features of activities in the proposed LIT
The general features of the recommended activities can be summarized as follows:
• Reasoning about base ten relations in place value using length as a model;
• Promoting flexible thinking by exploring different ways of interpreting or
representing decimals;
• Utilizing concrete models in creating meaningful understanding;
• Interactive modes of learning through group and classroom discussion.
These features were perceived as important components of revisiting the notion
and properties of decimals for pre-service teachers considering the nature of their

180
knowledge about decimals in this study as discussed earlier in Chapter 6. The enactment
of these features of activities about decimals with pre-service teachers is affected by the
role of teacher education in Indonesia in adapting the RME. The following section will
present the researcher’s reflections on the attempts to interpret and to accommodate the
basic tenets of RME and the teaching principles of RME in the activities.
7.3 Reflections on the role of teacher education in Indonesia in
adapting RME (Answering Research Question 3)
As noted in Chapter 1, the reflections on basic tenets of RME and the role of
teacher education in Indonesia to adapt these tenets formed an underlying concern in
this study. Research question 3 stated: “How can teacher education assist Indonesian
schools to adapt RME principles?”. Assisting the Indonesian schools to adapt the RME
principles is the underlying goal of this thesis, but it is only indirectly addressed. The
thesis has assumed that RME in schools will be promoted by introducing pre-service
teachers to activities designed to reflect RME teaching principles. It would also be
necessary to introduce pre-service teachers to the RME theory but this has not been part
of the experimental work. However, two aspects of teacher education role will be
explored in this thesis. The first aspect is the extent to which the RME tenets are
suitable for adaption by Indonesian teacher education in the context of revisiting and
improving pre-service teachers’ content and pedagogical content knowledge. Another
role is the role of teacher education in acquainting pre-service teachers with RME
teaching principles.
The researcher’s reflections were based on the empirical work carried out in the
two cycles of teaching experiments. In this respect, the interpretations of the basic tenets
of RME in the design of activities of this study were limited by the early stage of
adapting RME in the Indonesian context through the PMRI project and the researcher’s
limited experience in designing RME based teaching activities.
Section 7.3.1 will start with reflections on the extent to which the basic tenets of
RME are reflected in the activities of this study and how appropriate the tenets for
adaption by teacher education in Indonesia. In Section 7.3.2, reflections on the teaching

181
principles of RME recorded in pre-service teachers’ responses during the teaching
experiments will be reported.
7.3.1 Reflections on the basic tenets of RME in activities from two cycles
This section will review the researchers’ reflections on efforts to accommodate
the basic tenets of RME in the design of activities and the enactment of the activities
and the challenges faced during the teaching experiment over the two cycles.
Guided reinvention tenet
The initial activity (Set 1 activities) in both cycles attempted to reflect the guided
reinvention tenet particularly in the initial activity as reported in Chapter 4 and Chapter
5. The initial activity in cycle 1 tried to address the guided reinvention tenet for
revisiting decimal place value by exploring decimal relations using the concrete model
LAB and establishing the names for different pieces of LAB model based on their
length. However, it was observed that partitioning into 10 shorter parts as already
‘embedded’ in various pieces of LAB left not much room for the interpretation of
guided reinvention tenet in cycle 1. This initial activity in Set 1- Activity 1 of cycle 1
was perceived as ‘too structured’ from the RME perspective and did not leave much
room for guided reinvention in the activities to take place.
The initial activity in cycle 1 was refined by giving more attention to better reflect
the guided reinvention tenet in cycle 2. It was expected that exploring ways of
partitioning one in the context of refining the unit of measurement would lead to an
exploration of repeated refinement of one into ten parts, the salient characteristic of
decimal system pertaining both decimals and whole numbers. However, the initial
activities of cycle 2 were ‘too open’ and not engineered well enough. Consequently,
little success was recorded with respect to the choice of partitioning one into ten.
However, this lack of success was also due to the fact that the rationale for
choosing a decimal system was rather sophisticated as discussed in Section 7.2.1 and
hence may not be suitable for guided reinvention. Similar difficulty in grasping the
choice of decimal system was reported in Keijzer et al. (2004) study with the primary
school children in the Netherlands. This demonstrates that guided reinvention route for

182
decimals is indeed difficult for both the primary school children and pre-service
teachers.
Besides the limitation of design activities in reflecting the guided reinvention
tenet in this study, interpreting the guided reinvention tenet for design activities in
teacher education level has a problematic face. Pre-service teachers’ prior knowledge
about decimals and the nature of their knowledge (which was characterised in section
6.5 as fragmented and strongly reliant on rules) impeded pre-service teachers from
engaging in the activities with a fresh perspective as intended by the design. So, for
example, instead of logically thinking through the situations with the intention of
solving the problem presented, the pre-service teachers often tried to patch together a
solution from their partially remembered rules. This presents a challenge for
interpretation of guided reinvention tenet in teacher education and calls for revisiting the
interpretation of the guided reinvention tenet in teacher education level in general.
Didactical phenomenology tenet
The review of literature about RME in Section 2.4 has pointed out several
phenomenological aspects for decimals including system of measurement (metric
measures), and money in some countries. However, prior studies (see Brekke, 1996;
Brousseau, 1997) pointed out the fact that the use of money context and metric
measures (e.g., m and cm) might reinforce the idea of decimals as a pair of whole
numbers.
Both cycles of this study employed the context of measuring length (not in metric
units) as the didactical phenomenon to explore the basic notion of repeated refinement
into ten (see Section 4.2.3). In this study, the phenomenon of measuring length and
refining the measurement tools was explored using a linear concrete model based on
length, called Linear Arithmetic Blocks (LAB) instead of the standard metric ruler. The
choice of linear concrete model LAB was perceived to fit with the context of measuring
length in the design of activities for this study. Moreover, the linear nature of LAB
model was seen to bridge the link to the more symbolic model of the number line.
As reported in Section 4.5 and Section 5.3, pre-service teachers’ prior knowledge
affected the way they responded to the problems presented in the activities. For
instance, instead of creating measurements using the LAB, some students measured in

183
LAB, then measured LAB pieces in centimetres and then presented the requested length
in centimetres. These students did not engage in the measurement task as presented in
the didactic situation, because of their prior knowledge. The fragmented knowledge of
pre-service teachers discussed in Chapter 6 explained the reason for pre-service
teachers’ tendency to jump into the conclusion for the story, rather than to engage with
the reasoning processes which were intended to promote in the activities.
Mediating model tenet
The mediating model of RME functions to link informal to formal knowledge.
Gravemeijer (1997; 1998) differentiates a progression in the levels of use of models,
(see Section 2.4.1 for detail). Students begin working in the concrete situation of the
model, and they progress to using the model to answer mathematical questions, and
finally they achieve the goal of working with the mathematical objects only, unattached
to the model.
In this study, various models were employed based on teaching ideas adapted from
earlier studies on decimals (Condon & Archer, 1999; Gravemeijer, 1998; Steinle et al.,
2006). Figure 7.2 shows the main uses of the three main models: LAB, number line and
number expander. As illustrated in Figure 7.2, the LAB model was useful to introduce
the additive structure of decimal notation (e.g., showing 0.23 as 2 tenths placed
alongside 3 hundredths pieces), and the multiplicative structure (e.g., replacing one
tenth by ten hundredths). The strength of the number expander was to highlight the
multiple interpretations of decimals related to unitising (e.g., by showing that 0.684 is
equal to 6 tenths + 8 hundredths + 4 thousandths, but also 68 hundredths + 4
thousandths. The number line was used as the main model for thinking about density of
decimals, although the concept of successive partitioning of LAB pieces into ten
(beyond the physical limits of the concrete objects) is also relevant. The positive
comments from the pre-service teachers reported in Chapters 4 and 5 showed that the
use of these models were beneficial.

184
Figure 7.2: Main uses of models for learning decimals
It was realized after the reflections of cycle 2 that the use of models in both cycles
of the study had not examined transitions of models at different levels well as proposed
by Gravemeijer (1997; 1998) and that that the study had not purposively gathered
evidence about the transitions occurring. However, some relevant observations can be
made.
However, outcomes of the activities, responses in the post-tests and post-
interviews of both cycles showed that the LAB models were useful in mediating the
abstract notion of decimals and its interpretations. In both cycles, pre-service teachers
employed the LAB models in explaining their ideas for comparing decimals and finding
multiple ways of interpreting decimals. As reported in Chapter 4 and Chapter 5, few
pre-service teachers who were able to relate the LAB models for making a meaningful
interpretation of division of decimals by 100 (e.g., solving a division of 0.3 by 100 by
replacing 3 tenths of LAB pieces with 3 thousandths pieces of LAB). Moreover, both
cycles recorded a few pre-service teachers who were able to extend the use of concrete
model LAB with formal algorithm such as division algorithm. However, this trend is
understandable as the activities in this study did not attend to decimal operation and
standard procedures such as division algorithm.
Density Number line (LAB)
Additive structure a) 0.34 = 0.3 + 0.04 b) 0.4 = 0.3 + 0.1 LAB
Multiplicative structure a) 0.3 = 0.03 × 10 c) 10×0.01 =0.1 b) 0.3 = 3 × 0.1 d) 0.7=70 ×0.01 LAB, number expander
Key notions for learning decimals
Knowledge of decimal as real numbers
Multiple interpretations of decimals
Knowledge of decimal notation
Relative and absolute magnitude of decimals

185
The other two models, i.e., the number expander and the number line model were
perceived as more symbolic models. The number expander model was found most
useful in showing various ways of interpreting decimals, which was based on the
multiplicative structure of decimals. Pre-service teachers observed the advantage of the
number expander model in that the number expander model was seen as a more
symbolic compared to the LAB model, and required some knowledge of decimal place
value. As reported in Chapter 4 and Chapter 5, the number line model was useful in
revealing pre-service teachers’ knowledge and difficulties with decimals particularly
with negative decimals in the primary cohort. In cycle 2, activities using the number line
model in the ‘Number Between’ game was successful in addressing density of decimals.
The fact that pre-service teachers already have acquired some knowledge of
decimals at the ‘formal level’ leads to a tendency of pre-service teachers to skip the
process and to fit in their formal knowledge of decimals, particularly based on
computational skill. This presented a challenge for interpreting the mediating model
tenet in the activities, and possibly more generally in teacher education. Similar
difficulties were also reported by Barnes (2004) who designed an intervention activities
on place value, fractions, and decimals for low attainers (Grade 10, 11, and 12) in South
Africa.
7.3.2 Reflection on the role of RME teaching principles
Overall pre-service teachers were quite positive about the new teaching and learning
style as observed in the reflection notes and anecdotal comments during the teaching
experiments in the two cycles. There were two aspects of teaching and learning style in
line with the instructional principles of RME (see Section 2.4.2) particularly evident in
pre-service teachers’ reflections as will be explained below.
Students’ contribution
Students’ active contribution in constructing their knowledge is one of the
essential features of the RME teaching principles (see principle 3 in Section 2.4.2). The
designed activities in this study reflected this teaching principle by placing a heavy
emphasis on engaging pre-service teachers in group activities and calling for pre-service
teachers to reflect on their learning process for their future teaching. The use of concrete

186
models and hands on activities were designed to encourage pre-service teachers’ active
construction and contribution to revisit and improve their knowledge of decimals and its
basic properties. Reflection notes reported in Section 4.5 and Section 5.4 documented
that the approach in carrying out the activities was perceived as engaging and
meaningful approach. Pre-service teachers’ contribution was observed during the group
and whole class discussion in both cycles to be at a medium to high level and more than
the researcher expected. During the whole class discussion, representative of groups
presented their responses to the activities in front of the classes. Other groups
contributed to the whole class discussion by asking questions or presenting different
solutions. However, in a few occasion, the lecturers had to facilitate pre-service
teachers’ contribution by encouraging them to participate in the whole class discussion.
Considering previous learning style of the majority of pre-service teachers which was
dominated by a passive role for students, this level of encouragement from the lecturer
is reasonable and in fact necessary. With a determined effort to encourage pre-service
teachers’ active contribution in the learning process, the researcher believes that this
principle of having students’ contribution in the learning will benefit pre-service
teachers and their future students.
Interactivity
Treffers (1987) defines interactive instruction as “instruction where is the
opportunity to consult, to participate, to negotiate, to cooperate, with review afterwards
and where the teacher holds back from providing explanations.” (p.261). Therefore, the
interactivity of learning process in the RME teaching principle (see principle 4 in
Section 2.4.2) was characterized by the presence of explicit negotiation through
discussion and cooperation in learning. These characteristics of learning were exercised
in this study through the use of group and whole class discussions as the main mode of
carrying out the activities, which promotes cooperation and negotiation of ideas in
learning process. The role of lecturers in this study which was mainly as facilitator for
delivering the activities and whole class discussion (see Chapter 3) served the purpose
to accommodate the interactive learning.
Positive responses about the interactive nature of activities were articulated by
pre-service teachers in both cycles. Moreover, pre-service teachers contrasted

187
favourably the interactive learning approach on decimals introduced in this study with
their prior learning approach, which focussed on symbolic operation with decimals and
‘spoon-feeding’ teaching. As documented in pre-service teachers’ reflections on the
activities in Section 4.5 and Section 5.3, the interactive way of learning was one part of
a learning approach which they appreciated.
Overall, pre-service teachers’ positive comments on less symbolic and more
interactive teaching styles in line with the RME teaching and learning principles, in my
opinion, indicated a promising impact of implementing the RME teaching principles in
teacher education in Indonesia. This was in line with findings from prior studies
(Armanto, 2002; Hadi, 2002; Widjaja & Heck, 2003) on the impact of PMRI which has
been attributed in creating an active and engaging learning atmosphere in mathematics
classrooms. The lecturers who participated in the study also expressed positive
comments about the more interactive teaching approach and increased role of pre-
service teachers’ contribution. One of the practical issues for implementing learning
through discussion is the size of the classes in Indonesia. In general, the class size is
quite big (over 40 students per class), which might be challenging for ensuring that the
intended learning goals can be achieved through group and whole class discussions.
Clearly, the change of classroom and learning culture require a determined effort from
both lectures and pre-service teachers involved.
This relates to the increased role of teacher education in establishing and
disseminating RME in Indonesian context through PMRI project. As shown in this
study, the process of adapting RME tenets in activities for teacher education faces some
challenges. The efforts to interpret the basic tenets of RME in activities for pre-service
teachers show that the design process to accommodate RME tenets well in the activities
is quite complex, although promising in many respects.
Teacher education has played a key role to introduce and to implement RME
teaching approach to primary schools in Indonesia through PMRI project (Sembiring,
2007; Zulkardi & Ilma, 2007). Overall the testing showed that attention to basic
concepts of decimal numbers is needed in teacher education and that the activities
assisted pre-service teachers to make good progress. This study accepts some
unresolved issues regarding on how to translate and interpret some aspects of the basic

188
tenets of RME into the design of activities on decimals in teacher education, particularly
the guided reinvention tenet. However, based on the positive outcome of the activities
designed in this study as reported in Chapter 6, the LIT proposed as a result of this study
is recommended for revisiting decimals in teacher education. Further attention to the
interpretation of guided reinvention tenet in teacher education will need special
attention in the future studies.
7.4 Strengths and Limitations of the study
The strengths of this study can be summarized in the following points:
This study offers insights about design and enactment of activities on decimals
based on empirical studies in teacher education in Indonesia over two cycles. It
revealed the nature of pre-service teachers’ content knowledge and pedagogical
content knowledge. Accounting for both pre-service teachers’ nature of content
and pedagogical content knowledge enables better design of activities in teacher
education. This study was able to analyse students’ thinking about decimals very
deeply because it was built on extensive prior research in the area.
Close observations in both cycles with the researcher acting as a participant
observer enabled detailed monitoring of the success and lack of success of
activities. This methodological aspect allowed the researcher to observe the
learning and document responses to refinement of activities and research
instruments between cycles and to reflect on the findings based on the
observations.
Various data sources (i.e., written tests, observations, and interviews) enable the
researcher to triangulate the findings and examine the phenomena from a variety
of perspectives. The availability of various data involving 258 pre-service
teachers over two cycles to examine the issues investigated in this study added
confidence on the results obtained from this study.
The fact that this study operated within the time constraints of teacher education
could be perceived as both limitation and strength of this study. The limited
number of meeting (4-5 meetings in each class) inhibited the researcher from
addressing some of limitations and difficulties experienced by pre-service

189
teachers observed during the teaching experiment. However, the limited number
of meetings could be considered as the strength of this study because it meant
that the activities were tested within the real constraints of teacher education.
The fact that the lecturers in charge of the classes carried out the learning
activities in both cycles was also the strength of this study as it showed that the
activities have been trialled and tested in the practical setting which design
researchers call “the crucible of practice” (Dede, Nelson, Ketelhut, Clarke, &
Bowman, 2004; Shavelson, Phillips, Towne, & Feuer, 2003).
Looking at RME in designing LIT on decimals in the context of teacher
education rather than school education, adds a new area to the research literature
and developments of RME.
The researcher acknowledges the following limitations of this study:
Lack of success in attempts to reflect some of the RME basic tenets in this study
signified the complexity of designing and engineering the RME activities in
teacher education level. However, this study also has highlighted a problematic
aspect of interpreting the guided reinvention tenet for designing activities on
decimals in teacher education, which warrants further research and theorising.
The fact that this study was carried out in one teacher education institution,
which might not be a representative case of teacher education in Indonesia was
one of the limitations of this study. Apart from its involvement with PMRI
project, the researcher knows of no characteristic of this institution that would
influence the results.
The measurement of PCK in activities and only 4 items of the written tests is
another limitation of this study. The data obtained from pre-service teachers’
reflections on activities was not specific enough to pick up the intended aspect
of PCK. Nonetheless, the fact that observation of PCK measures in this study
was based on extensive data was expected to compensate on this limitation.
The activities designed in this study focus just on decimals are not typical of
RME activities, which seem to often link several areas of mathematics. In this
respect, the sole focus on decimals might be considered as a limitation of the
study in reflecting the teaching tenet of RME. On the other hand, the sole focus

190
on decimals enabled the researcher to have a more comprehensive understanding
and difficulties of pre-service teachers’ CK and PCK on decimals. This study
has demonstrated that decimal is an important area that needed attention, which
might have been missed because of the incorrect perception that decimals are
easy. Decimal number is a very central topic, which has characteristics that
make it applicable to other areas of number (e.g., whole numbers etc). Therefore
having an LIT on decimals as a framework of reference for pre-service teachers
is useful.
7.5 Directions and Recommendations for further study
Findings of this study signified the importance of revisiting and addressing the
incomplete and fragmented knowledge of pre-service teachers about decimals. In
contrary to the common perception of decimals as a simple and easy topic, this study
showed that many pre-service teachers had weak knowledge of decimals which limited
their teaching ideas. Positive comments on the use of concrete models and the
interactive mode of learning about decimals were voiced by pre-service teachers in both
cycles. Moreover, the experience of learning decimals in a less symbolic way has
enriched pre-service teachers’ teaching ideas about decimals for future teaching ideas in
the primary school. Hence it is recommended that teacher education capitalises on
teaching activities that incorporates the use of concrete models in revisiting pre-service
teachers’ knowledge about decimals.
One of the challenges in designing activities on decimals for teacher education is
the need to attend to both content and pedagogical content knowledge. The researcher is
aware of the fact that designing activities for pre-service teachers that they can directly
use in schools provides a direct way to improve pre-service teachers’ repertoire of
teaching ideas. However, the activities that are suitable for children are often not those
that will engage pre-service teachers in the experience of learning mathematics and
challenge their underlying ideas. Consequently, activities that are devised to fit with
pre-service teachers’ knowledge such as the one designed in this study, could not be
considered as the only vehicle to improve pre-service teachers’ teaching ideas in the
classroom. In the researcher‘s opinion, it would be more realistic for pre-service

191
teachers to engage in the activities that challenge their own ideas. Moreover, it is
important for pre-service teachers to learn how to adapt and interpret their own learning
experience for their future teaching. Some discussion on how the experiences that the
pre-service teachers have experienced would be modified for children would enhance
the teacher education course. Whether it should follow the work proposed in the LIT or
be part of another course needs further investigation.
The RME instructional principle that emphasizes and encourages the interactive
learning process and active role of the learners is a promising approach for learning
mathematics. Introducing the new style of teaching to pre-service teachers is important
for the success of this national initiative. Teacher education is playing a key role in the
current dissemination of PMRI because the strategy for dissemination has been through
a program of strengthening the teacher education. This indicates that further research
into the design of RME-inspired LITs on other topics for pre-service teachers will be
useful.
The proposed LIT on decimals from this study is at an initial stage and open for
adjustments, particularly with respect to reflection of the RME tenets in teacher
education level. The accumulated research literature and practical experience of
introducing educational reform in Indonesia and other countries should be seriously
considered in planning for the widespread introduction of teaching according to RME.

192
REFERENCES
Armanto, D. (2002). Teaching multiplication and division realistically in Indonesian
primary Schools: A prototype of local instructional theory. Enschede: PrintPartners Ipskamp.
Ball, D. L. (1990). The mathematical understanding that prospective teachers bring to teacher education. Elementary School Journal, 90(4), 449-466.
Ball, D. L., & Bass, H. (2000). Interweaving content and pedagogy in teaching and learning to teach: Knowing and using mathematics. In J. Boaler (Ed.), Multiple Perspectives on Mathematics Teaching and Learning: International Perspectives on Mathematics Education (pp. 83-104). Westport, CT: Ablex Publishing.
Ball, D. L., & Bass, H. (2003). Toward a practice-based theory of mathematical knowledge for teaching. In B. Davis & E. Simmt (Eds.), Proceedings of the 2002 Annual Meeting of the Canadian Mathematics Education Study Group (pp. 3-14). Edmonton, AB: CMESG/GCEDM.
Bana, J., Farrell, B., & McIntosh, A. (1997). Student error patterns in fraction and decimal concepts. In F. Biddulph & K. Carr (Eds.), Proceedings of the 20th Annual Conference of the Mathematics Education Research Group of Australasia Incorporated (Vol. 1, pp. 81-87). Rotorua, New Zealand: MERGA.
Barnes, H. E. (2004). A developmental case study: Implementing the theory of realistic mathematics education with low attainers. University of Pretoria, Pretoria.
Basso, M., Bonotto, C., & Sorzio, P. (1998). Children's understanding of the decimal numbers through the use of the ruler. In A. Olivier & K. Newstead (Eds.), Proceedings of the 22nd Conference of the International Group of the Pyschology of Mathematics Education (Vol. 2, pp. 72-79). Stellenbosch, South Africa: PME.
Baturo, A. (2000). Construction of a numeration model: A theoretical analysis. In J. Bana & A. Chapman (Eds.), Proceedings of the 23rd Annual Conference of the Mathematics Education Research Group of Australasia (pp. 95-103). Fremantle, WA: MERGA.
Baturo, A. (2004). Empowering Andrea to help year 5 students construct fraction understanding In M. J. Hoines & A. B. Fugelstad (Eds.), Proceedings 28th Annual Conference of the International Group for the Psychology of Mathematics Education (Vol. 2, pp. 95-102). Bergen, Norway: PME.
Baturo, A. R. (1997). The Implication of multiplicative structure for students' understanding of decimal-number numeration. In F. Biddulph & K. Carr (Eds.), Proceedings of the 20th Annual Conference of the Mathematics Education Research Group of Australasia (Vol. 1, pp. 88-95). Rotorua, NZ: MERGA.

193
Behr, M., Khoury, H. A., Harel, G., Post, T., & Lesh, R. (1997). Conceptual unit
analysis of preservice elementary school teachers' strategies on a rational-number-as-operator task. Journal for Research in Mathematics Education, 28(1), 48-69.
Bell, A., Swan, M., & Taylor, G. (1981). Choice of operation in verbal problems with decimal numbers. Educational Studies in Mathematics, 12, 399-420.
Boufi, A., & Skaftourou, F. (2002). Supporting students' reasoning with decimal numbers: A study of a classroom's mathematical development. In A. D. Cockburn & E. Nardi (Eds.), Proceedings of the 26th Conference of the International group for the Psychology of Mathematics Education (Vol. 2, pp. 153-160). Norwich: PME.
Brekke, G. (1996). A decimal number is a pair of whole number. In L. Puig & A. Gutierrez (Eds.), Proceedings of the 20th Conference of the International Group for the Psychology of Mathematics Education (Vol. 2, pp. 137-143). Valencia, Spain: PME.
Brousseau, G. (1997). Theory of didactical situations in mathematics. Dordrecht, The Netherlands: Kluwer Academic Publishers.
Carpenter, T., Corbitt, M. K., Kepner, H. S., Linquist, M. M., & Reys, R. E. (1981). Decimals: results and implications from national assessment. Arithmetic Teacher, 28(8), 34-37.
Cobb, P., Confrey, J., diSessa, A., Lehrer, R., & Schauble, L. (2003). Design Experiments in Educational Research. Educational Researcher, 32(1), 9-13.
Cobb, P., Stephan, M., McClain, K., & Gravemeijer, K. (2001). Participating in classroom mathematical practices. The Journal of the Learning Sciences, 10(1&2), 113-163.
Collins, A., Joseph, D., & Bielaczys. (2004). Design research: Theoretical and methodological issues. The Journal of the Learning Sciences, 13(1), 15-42.
Condon, C., & Archer, S. (1999). Lesson ideas and activities for teaching decimals: Department of Science and Mathematics Education, The University of Melbourne.
Dede, C., Nelson, B., Ketelhut, D. J., Clarke, J., & Bowman, C. (2004). Design-based research strategies for studying situated learning in a multi-user virtual environment. In Y. B. Kafai, W. A. Sandoval, N. Enyedy, A. S. Nixon & F. Hererra (Eds.), Embracing Diversity In The Learning Sciences: Proceedings of the Sixth International Conferences of the Learning Sciences (pp. 158-165). Santa Monica, CA: University of California of Los Angeles.
Drijvers, P. (2004). Classroom-based research in mathematics education: Overview of doctoral research published by Freudenthal Institute. Utrecht: Freudenthal Instituut.
Edelson, D. C. (2002). Design research: what we learn when we engage in design. The Journal of the Learning Sciences, 11(1), 105-121.

194
Encyclopaedia Britannica Educational Corp. (1998). Britannica mathematics in context. Chicago: Encyclopaedia Britannica Educational Corp.
English, L. D., & Halford, G. S. (1995). Mathematics education: Models and processes. Mahwah, N.J.: Lawrence Erlbaum Associates.
Fauzan, A., Slettenhaar, D., & Plomp, T. (2002). Traditional mathematics education vs. realistic mathematics education: Hoping for changes. In P. Valero & O. Skovsmose (Eds.), Proceedings of the 3rd International Mathematics Education and Society Conference (pp. 1-4). Copenhagen: Centre for Research Learning in Mathematics.
Freudenthal, H. (1973). Mathematics as an educational task. Dordrecht, The Netherlands: D. Reidel Publishing Company.
Freudenthal, H. (1983). Didactical phenomenology of mathematical structures. Dordrecht, The Netherlands: D. Reidel Publishing Company.
Freudenthal, H. (1991). Revisiting mathematics education, China lectures. Dordrecht, The Netherlands: Kluwer Academic Publishers.
Fuglestad, A. B. (1996). Teaching decimal numbers with spreadsheet as support for diagnostic teaching. In A. Buquet, J. Cabrera, E. Rodriguez & M. H. Sanchez (Eds.), ICME 8 (pp. 79-89). Spain: ICME.
Glasgow, R., Ragan, G., Fields, W. M., Reys, R., & Wasman, D. (2000). The decimal dilemma. Teaching Children Mathematics, 89-93.
Graeber, A. O. (1999). Forms of knowing mathematics: What preservice teachers should learn. Educational Studies in Mathematics, 38(1-3), 189-208.
Gravemeijer, K. (1994a). Developing realistic mathematics education. Utrecht: Freudenthal Institute.
Gravemeijer, K. (1994b). Educational development and developmental research in mathematics education. Journal for Research in Mathematics Education, 25(5), 443-471.
Gravemeijer, K. (1997). Mediating between concrete and abstract. In T. Nunes & P. Bryant (Eds.), Learning and Teaching Mathematics: An International Perspective (pp. 315-345). Hove: Psychology Press.
Gravemeijer, K. (1998). Developmental research as a research method. In J. Kilpatrick & A. Sierpinska (Eds.), Mathematics Education as a research method (Vol. 2, pp. 277-295). Dordrecht, The Netherlands: Kluwer Academic.
Gravemeijer, K. (2004). Local instruction theories as means of support for teachers in reform mathematics education. Mathematical Thinking and Learning, 6(2), 105-128.
Gravemeijer, K., & Doorman, M. (1999). Context problems in realistic mathematics education: A calculus course as an example. Educational Studies in Mathematics, 39, 111-129.
195
Gravemeijer, K., van Galen, F., & Keijzer, R. (2005). Designing instruction on proportional reasoning with average speed In H. L. Chick & J. L. Vincent (Eds.), Proceeding of the 29 Conference of the International Group for the Psychology of Mathematics Education (Vol. 1, pp. 103-108). Melbourne PME.
Grossman, A. (1983). Decimal notation: an important research finding. Arithmetic Teacher, 30(9), 32-33.
Hadi, S. (2002). Effective teacher professional development for implementation of realistic mathematics education in Indonesia. University of Twente, Enschede.
Hadi, S. (2007). Adapting European curriculum materials for Indonesian schools: A design of learning trajectory of fraction for elementary school mathematics Paper presented at the EARCOME 4, Penang, Malaysia.
Hadi, S., Plomp, T., & Suryanto. (2002). Introducing realistic mathematics education to junior highschool mathematics teachers in Indonesia. Paper presented at the 2nd International Conference on The Teaching of Mathematics (at the undergraduate level).
Hart, K. (Ed.). (1981). Children's understanding of mathematics 11-16. London: Murray.
Helme, S., & Stacey, K. (2000). Can minimal support for teachers make a difference to students' understanding of decimals? Mathematics Teacher Education and Development, 2, 105-120.
Hiebert, J. (1992). Mathematical, cognitive, and instructional analyses of decimal fractions. In G. Leinhardt, R. Putnam & R. A. Hattrup (Eds.), Analysis of Arithmetic for Mathematics Teaching (pp. 283-322). Hillsdale, New Jersey: Lawrence Erlbaum Associates.
Hiebert, J., Morris, A. K., Berk, D., & Jansen, A. (2007). Preparing teachers to learn from teaching Journal of Teacher Education, 58(1), 47-61.
Hiebert, J., & Wearne, D. (1986). Procedures over concepts: The acquisition of decimal number knowledge. In J. Hiebert (Ed.), Conceptual and Procedural Knowledge: The Case of Mathematics (pp. 199-223). Hillsdale, NJ: Lawrence Erlbaum Associates.
Hiebert, J., & Wearne, D. (1987). Cognitive effects of instruction designed to promote meaning for written mathematical symbols. In J. C. Bergeron, N. Herscovics & C. Kieran (Eds.), Proceedings of the 11th Conference for the International Group for the Psychology of Mathematics Education (Vol. 1, pp. 391-397). Montreal: PME.
Hiebert, J., Wearne, D., & Taber, S. (1991). Fourth graders' gradual constructions of decimal fractions during instruction using different physical representations. Elementary School Journal, 91(4), 321-341.
Hunter, R., & Anthony, G. (2003). Percentages: A foundation for supporting students' understanding of decimals. In L. Braggs, C. Campbell, G. Herbert & J. Mousley (Eds.), Proceedings of the 20th Annual Conference of the Mathematics Education Research Group of Australasia (Vol. 2, pp. 452-459). Deakin University, Geelong: MERGA.

196
Irwin, K. (1995). Students' Images of Decimal Fractions. In L. Meira & D. Carraher (Eds.), Proceedings of the 19th Conference of the International Group for the Psychology of Mathematics Education (Vol. 3, pp. 3-50 - 53-57). Reclife, Brazil: PME.
Irwin, K. C. (1996). Making sense of decimals. In J. Mulligan & M. Mitchelmore (Eds.), Children's Number Learning: A Research Monograph of MERGA/ AAMT (pp. 243-257). Adelaide: AAMT.
Irwin , K. C. (2001). Using Everyday Knowledge of Decimals to Enhance Understanding. Journal for Research in Mathematics Education, 32(4), 399-420.
Irwin, K. C. (2001). Using everyday knowledge of decimals to enhance understanding. Journal for Research in Mathematics Education, 32(4), 399-420.
Keijzer, R., van Galen, F., & Oosterwall, L. (2004). Reinvention revisited: Learning and teaching decimals as an example. Paper presented at the ICME 10.
Kelly, A. E. (2003). Research as a design. Educational Researcher, 32(1), 3-4. Khafid, M., & Suyati. (2004a). Pelajaran matematika penekanan pada berhitung 5A.
Jakarta: Erlangga. Khafid, M., & Suyati. (2004b). Pelajaran matematika penekanan pada berhitung 6A.
Jakarta: Erlangga. Kilpatrick, J., Swafford, J., & Findell. (2001). Adding it up: Helping children learn
mathematics Washington, DC: National Academy Press. Kloosterman, P., Warfield, J., Wearne, D., Koc, Y., Martin, W. G., & Strutchens, M.
(2004). Fourth-grade students' knowledge of mathematics and perceptions of learning mathematics. In P. Kloosterman & F. K. J. Lester (Eds.), Results and Interpretations of the 1990 through 2000 Mathematics Assessment of Educational Progress (pp. 71-103). Reston, VA: NCTM.
Kouba, V. L., Brown, C. A., Carpenter, T. P., Lindquist, M. M., Silver, E. A., & Swafford, J. O. (1988). Results of the fourth NAEP assessment of mathematics: Number, operations, and word problems. Arithmetic Teacher, 35(8), 14-19.
Lachance, A., & Confrey, J. (2002). Helping students build a path of understanding from ratio and proportion to decimal notation. Journal of Mathematical Behavior, 20(4), 503-526.
Lampert, M. (1989). Choosing and using mathematical tools in classroom discourse. In J. Brophy (Ed.), Advances in Research on Teaching (Vol. 1, pp. 223-264). Greenwich, CT: JAI Press.
Leinhardt, G., Putnam, R. T., Stein, M. K., & Baxter, J. A. (1991). Where subject knowledge matters. Advances in Research on Teaching, 2, 87-113.
Listyastuti, H., & Aji, M. M. (2002a). Matematika kelas 6 SD. Klaten: PT Intan Pariwara.
Listyastuti, H., & Aji, M. M. (2002b). Matematika, kelas 5 SD. Klaten: PT Intan Pariwara.

197
Markovitz, Z., & Sowder, J. (1994). Developing number sense: An intervention study in grade 7. Journal for Research in Mathematics Education, 25(1), 4-29.
McIntosh, A., Reys, B. J., & Reys, R. E. (1992). A proposed framework for examining basic number sense. For the Learning of Mathematics, 12(3), 2-8, 44.
Menon, R. (2004). Preservice teachers' number sense. Focus on Learning Problems in Mathematics, 26(2), 49-61.
Merenlouto, K. (2003). Abstracting the density of numbers on the number line- a quasi-experimental study. In N. A. Pateman, B. J. Dougherty & J. Zilliox (Eds.), Proceedings of the 2003 Joint Meeting of PME and PMENA (Vol. 3, pp. 285 - 292). Honolulu, HI: CRDG, College of Education, the University of Hawai'i.
Michaelidou, N., Gagatsis, A., & Pitta-Pantazi, D. (2004). The number line as a representation of decimal numbers: A research with sixth grade students. In M. J. Hoines & A. B. Fuglestad (Eds.), Proceedings of the 28th Conference of the International Group for the Psychology of Mathematics Education (Vol. 3, pp. 305-312). Bergen, Norway: PME.
Moloney, K., & Stacey, K. (1997). Changes with age in students' conceptions of decimal notation. Mathematics Education Research Journal, 9(1), 25-38.
Moss, J. (2005). Pipes, tubes, and beakers: New approaches to teaching rational-number system. In S. Donovan & J. D. Bransford (Eds.), How Students Learn: History, Mathematics, and Science in the Classroom (pp. 309-349). Washington: The National Academies Press.
Moss, J., & Case, R. (1999). Developing children's understanding of the rational numbers: A new model and an experimental curriculum. Journal for Research in Mathematics Education, 30(2), 122-148.
Nesher, P., & Peled, I. (1986). Shifts in Reasoning. Educational Studies in Mathematics, 17(1), 67-79.
Owens, D. T., & Super, D. B. (1993). Teaching and learning decimal fractions. In D. T. Owens (Ed.), Research Ideas for the Classroom (pp. 137-158). New York: Macmillan Publishing Company.
Padberg, F. (2002). The transition from concrete to abstract decimal fractions: Taking stock at the beginning of 6th grade in German schools. In B. Barton, K. C. Irwin, M. Pfannkuch & M. O. J. Thomas (Eds.), Proceedings of the 25th Annual Conference of the Mathematics Education Research Group of Australasia (Vol. 2, pp. 536-542). Auckland: MERGA.
Peled, I., & Shabari, J. A. (2003). Improving decimal number conception by transfer from fractions to decimals. In N. A. Pateman, B. J. Dougherty & J. Zilliox (Eds.), Proceedings of the 27th Conference of the International Group for the Psychology of Mathematics Education (Vol. 4, pp. 1-6). Hawaii: PME.
Putt, I. J. (1995). Preservice teacher ordering of decimal numbers: When more is smaller and less is larger! Focus on Learning Problems in Mathematics, 17(3), 1-15.

198
Research Advisory Committee. (1996). Justification and reform. Journal for Research in Mathematics Education, 27(5), 516-520.
Resnick, L. B., Nesher, P., Leonard, F., Magone, S., Omanson, S., & Peled, I. (1989). Conceptual bases of arithmetic errors: The case of decimal fractions. Journal for Research in Mathematics Education, 20(1), 8-27.
Reys, R., Reys, B., McIntosh, A., Emmanuelson, G., Johansson, B., & Yang, D. C. (1999). Assessing number sense of students in Australia, Sweden, Taiwan, and the United States. School Science and Mathematics, 99(2), 61-70.
Rittle-Johnson, B., Siegler, R. S., & Alibali, M. W. (2001). Developing conceptual understanding and procedural skill in mathematics: An iterative process. Journal of Educational Psychology, 93(2), 346-362.
Rouche, A., & Clarke, D. (2004). When does successful comparison of decimals reflect conceptual understanding? In I. Putt, R. Farragher & M. McLean (Eds.), Proceedings of the 27th Annual Conference of the Mathematics Education Research Group of Australasia (pp. 486-493). Sydney: MERGA.
Sackur-Grisvard, C., & Leonard, F. (1985). Intermediate cognitive organizations in the process of learning a mathematical concept: The order of positive decimal numbers Cognition and Instruction, 2(2), 154-174.
Sembiring, R. K. (2007). PMRI: History, progress, and challenges. Paper presented at the EARCOME 4, Penang, Malaysia
Shavelson, R. J., Phillips, D. C., Towne, L., & Feuer, M. J. (2003). On the science of education design studies. Educational Researcher, 32(1), 25-28.
Shulman, L. S. (1986). Those who understand: Knowledge growth in teaching. Educational Researcher, 15(2), 4-14.
Shulman, L. S. (1987). Knowledge and teaching: foundations of the new reform. Harvard Educational Review, 57(1), 1-22.
Simon, M. A. (1995). Reconstructing mathematics pedagogy from a constructivist perspective. Journal for Research in Mathematics Education, 26(2), 114-145.
Sowder, J. (1997). Place value as the key to teaching decimal operations. Teaching Children Mathematics, 3(8), 448-453.
Stacey, K. (2005). Travelling the road to expertise: A longitudinal study of learning. In H. L. Chick & J. L. Vincent (Eds.), Proceedings of the 29th Conference of the International Group for the Psychology of Mathematics Education (Vol. 1, pp. 19-36). Melbourne: PME.
Stacey, K., Helme, S., Archer, S., & Condon, C. (2001). The effect of epistemic fidelity and accessibility on teaching with physical materials: A comparison of two models for teaching decimal numeration. Educational Studies in Mathematics, 47(2), 199-221.
Stacey, K., Helme, S., & Steinle, V. (2001). Confusions between decimals, fractions, and negative numbers: A consequence of the mirror as a conceptual metaphor in three different ways. In M. v. d. Heuvel-Panhuizein (Ed.), Proceedings of the 25th Conference of the International Group for the Psychology of Mathematics Education (Vol. 4, pp. 217-224). Utrecht, the Netherlands: PME.

199
Stacey, K., Helme, S., Steinle, V., Baturo, A., Irwin, K., & Bana, J. (2001). Preservice teachers' knowledge of difficulties in decimal numeration. Journal of Mathematics Teacher Education, 4(3), 205-225.
Stacey, K., & Steinle, V. (1998). Refining the classification of students' interpretation of decimal notation. Hiroshima Journal of Mathematics Education, 6, 49-69.
Stacey, K., & Steinle, V. (1999). A longitudinal study of children's thinking about decimals: A preliminary analysis. In O. Zaslavsky (Ed.), Proceedings of the 23rd Conference of the International Group of the Psychology of Mathematics Education (pp.??). Haifa, Israel: PME.
Stacey, K., & Steinle, V. (2006). Contrasting Decimal Conceptions of Adult and School Students. In J. Novotna, H. Moraova, M. Kratka & N. Stehlikova (Eds.), Proceedings 30th Conference of the International Group for the Psychology of Mathematics Education (Vol. 1, pp. 424). Prague: PME.
Steinle, V. (2004). Changes with age in students' misconceptions of decimal numbers. Unpublished PhD thesis, University of Melbourne, Melbourne.
Steinle, V., & Pierce, R. (2006). Incomplete or incorrect understanding of decimals: An important deficit for student nurses. In J. Novotna, H. Moraova, M. Kratka & N. Stehlikova (Eds.), Proceedings 30th Conference of the International Group for the Psychology of Mathematics Education (Vol. 5, pp. 161-168). Prague: PME.
Steinle, V., & Stacey, K. (1998a). The incidence of misconceptions of decimal notation amongst students in Grade 5 to 10. In C. Kanes, M. Goos & E. Warren (Eds.), Proceedings of the 21st annual conference of the Mathematics Education Research Group of Australasia (Vol. 2, pp. 548-555). Gold Coast, Australia: MERGA.
Steinle, V., & Stacey, K. (1998b). Students and decimal notation: Do they see what we see? In J. Gough & J. Mousley (Eds.), Mathematics: Exploring all angles: Proceedings of the 25 Annual Conference of The Mathematical Association of Victoria. (Vol. 35). Brunswick, Victoria: The Mathematical Association of Victoria.
Steinle, V., & Stacey, K. (2001). Visible and invisible zeros: Source of confusion in decimal notation. In J. Bobis, B. Perry & M. Mitchelmore (Eds.), Proceedings of the 24th Annual Conference of the Mathematics Education Research Group of Australasia (Vol. 2, pp. 434-441). Sydney: MERGA.
Steinle, V., & Stacey, K. (2002). Further evidence of conceptual difficulties with decimal notation. In B. Barton, K. C. Irwin, M. Pfannkuch & M. O. J. Thomas (Eds.), 25th Annual Conference of the Mathematics Education Research Group of Australasia Incorporated (Vol. 2, pp. 633-640). Auckland: MERGA.
Steinle, V., & Stacey, K. (2003a). Exploring the right, probing questions to uncover decimal misconceptions. In L. Braggs, C. Campbell, G. Herbert & J. Mousley (Eds.), Proceedings of the 26th Annual Conference of the Mathematics Education Research Group of Australasia (Vol. 2, pp. 634-641). Geelong: MERGA.

200
Steinle, V., & Stacey, K. (2003b). Grade-related trends in the prevalence and
persistence of decimal misconceptions. In N. A. Pateman, B. J. Dougherty & J. Zilliox (Eds.), Proceedings of the 27th Conference of the International Group of the Psychology of Mathematics Education (Vol. 4, pp. 259-266). Hawaii: PME.
Steinle, V., & Stacey, K. (2004a). A longitudinal study of students' understanding of decimal notation: An overview and refined results. In I. Putt, R. Faragher & M. McLean (Eds.), Proceedings of the 27th Annual Conference of the Mathematics Education Research Group of Australasia (pp. 541-548). Townsville: MERGA.
Steinle, V., & Stacey, K. (2004b). Persistence of decimal misconceptions and readiness to move to expertise. In M. J. Hoines & A. B. Fuglestad (Eds.), Proceedings of the 28th Conference of the International Group for the Psychology of Mathematics Education (Vol. 1, pp. 225-232). Bergen-Norway: Bergen University College.
Steinle, V., Stacey, K., & Chambers, D. (2002). Teaching and Learning about Decimals CD (Version 2.1). Melbourne: The University of Melbourne.
Steinle, V., Stacey, K., & Chambers, D. (2006). Teaching and learning about decimals CD (Version 3.1). Melbourne: The University of Melbourne.
Strauss, A. L. (1987). Qualitative analysis for social sciences. Cambridge: Cambridge University Press.
Strauss, A. L., & Corbin, J. (1990). Basics of qualitative research (1st ed.). Thousand Oaks, CA.
Streefland, L. (1991). Fractions in realistic mathematics education. Dordrecht: Kluwer Academic Publishers.
Swan, M. (1990). Becoming numerate: Developing conceptual structures. In S. Willis (Ed.), Being Numerate: What Counts? (pp. 44-71). Victoria, Australia: The Australian Council for Educational Research Ltd.
Swan, M. (2001). Dealing with misconceptions in mathematics. In P. Gates (Ed.), Issues in Mathematics Teaching (pp. 147-165). New York: Routedge Falmer.
The Design-Based Research Collective. (2003). Design-based research: An emerging paradigm for educational inquiry. Educational Researcher, 32(1), 5-8.
Thipkong, S., & Davis, E. J. (1991). Preservice elementary teachers' misconceptions in interpreting and applying decimals. School Science and Mathematics, 91(3), 93-99.
Thompson, C. S., & Walker, V. (1996). Connecting decimals and other mathematical content. Teaching Children Mathematics, 8(2), 496-502.

201
Treffers, A. (1987). Three dimensions. A model of goal and theory descriptions in mathematics instruction - the Wiskobas Project. Dordrecht: Reidel Publishing Company.
Tromp, C. (1999). Number between: Making a game of decimal numbers. Australian Primary Mathematics Classroom, 4(3), 9-11.
Tsao, Y.-L. (2005). The number sense of pre-service elementary school teachers College Student Journal 39(4), 647-679.
van den Akker, J. (1999). Principles and methods of developmental research. In J. van den Akker, R. B. Branch, K. Gustafson, N. Nieveen & T. Plomp (Eds.), Design Approaches and Tools in Education and Training (pp. 1-14). Dordrecht, The Netherlands: Kluwer Academic Publishers.
van den Heuvel-Panhuizen, M. (2001). Realistic Mathematics Education as a work in progress. In F. L. Lin (Ed.), Common Sense in Mathematics Education, Proceedings of 2001 The Netherlands and Taiwan Conference on Mathematics Education (pp. 1-43). Taipei, Taiwan.
van den Heuvel-Panhuizen, M. (2003). The didactical use of models in realistic mathematics education: An example from a longitudinal trajectory on percentage. Educational Studies in Mathematics, 54, 9-35.
Victorian Department of Education and Early Childhood Development. (2007). The principles of learning and teaching P-12. Retrieved. from http://www.education.vic.gov.au/studentlearning/teachingprinciples/.
Watson, J. M., Collis, K. F., & Campbell, J. K. (1995). Developmental structure in the understanding of common and decimal Fractions. Focus on Learning Problems in Mathematics, 17(1), 1-24.
Wearne, D., & Hiebert, J. (1988a). A cognitive approach to meaningful mathematics instruction: Testing a local theory using decimal numbers. Journal for Research in Mathematics Education, 19(5), 371-384.
Wearne, D., & Hiebert, J. (1988b). Constructing and using meaning for mathematical symbols: The case of decimal fractions. In J. Hiebert & M. Behr (Eds.), Number Concepts and Operations in Middle Grades (pp. 220-235). Reston, Virginia: The National Council of Teachers of Mathematics, Inc.
Widjaja, W. (2005). Didactical analysis of learning activities on decimals for Indonesian pre-service teachers. In H. L. Chick & J. L. Vincent (Eds.), Proceedings of the 29th Annual Conference of the International Group of the Psychology of Mathematics Education (pp. 332). Melbourne, Australia: PME.
Widjaja, W., & Stacey, K. (2006). Promoting pre-service teachers' understanding of decimal notation and its teaching. In J. Novotná, H. Moraová, M. Krátká & N. Stehlíková (Eds.), The Proceedings of 30th Annual Conference of Psychology of Mathematics Education (Vol. 5, pp. 385-392). Prague, Czech Republic: PME.
Widjaja, W., Stacey, K., & Steinle, V. (in preparation). Locating negative decimals on the number line: Insights from pre-service teachers’ works.

202
Widjaja, Y. B., & Heck, A. (2003). How a realistic mathematics education approach and microcomputer-based laboratory worked in lessons on graphing at an Indonesian junior high school. Journal of Science and Mathematics in Southeast Asia, 26(2), 1-51.
Wood, T., & Berry, B. (2003). What Does "Design Research" Offer Mathematics Teacher Education. Journal of Mathematics Teacher Education, 6, 195-199.
Zulkardi, & Ilma, R. (2007). PMRI: An innovation approach for developing a quality of mathematics education in Indonesia. Paper presented at the EARCOME 4, Penang, Malaysia.
Zulkardi, Nieveen, N., van den Akker, J., & de Lange, J. (2002). Designing, evaluating and implementing an innovative learning environment for supporting mathematics education reform in Indonesia: The CASCADE-IMEI study. In P. Valero & O. Skovsmose (Eds.), 3rd International Mathematics Education and Society Conference (pp. 1-5). Copenhagen: Center for Research in Learning Mathematics.

Appendix A
Appendix A1: Trial version of Activities
Appendix A2: Conjectured LIT for cycle 1
Appendix A3: Sets of Activities in cycle 1 (Indonesian version)
Appendix A4: Refined LIT in cycle 2
Appendix A5: Sets of Activities in cycle 2 (Indonesian version)
203
A-PDF Merger DEMO : Purchase from www.A-PDF.com to remove the watermark

Appendix A1: Trial version of Activities
Name:
Understanding of decimal notation
Activities:
1. Call the length of the longest unit as “a rod”. Observe and explore the relationships of other pieces of LAB, and establish the
labels of the other pieces. Piece Label
a rod
2. Use LAB to measure the length of the sides of the table as appear in the picture below:
A = …………………………
B = …………………………………
If you are to find the difference between the lengths of the two sides using the rods, what strategy will you use? ……………………………………………………………………………………………..…..……………………………………………………………………………
3. Match the cards with the LAB pieces and fill in the table with corresponding labels, decimal and fractional notations. From hereon, we will focus on the use of decimal notation and its verbal names
100
1 0.001 a tenth a hundredth one
1
101
10001 0.01 a thousandth 0.1
Appendix A1

Sketch of the pieces Verbal Names
Decimal& Fractional Notations
4. Now look back at task 3 and express the result of your measurement in task 3 again by employing the decimal notation and its labels.
The length of side A is ……………………..……………………. rods
The length of side B is …………………... ……………………… rods
5. Illustrate the construction of the following length by drawing the sketch of LAB representations.
Sketch of representation of the decimals (need not be scaled)
0.206 rods
0.26 rods
0.260 rods
6. What can you conclude from the construction process above?
………………………………………………………………………………………………………………………………………………………………………………………………………………………………………………………………………………………
Appendix A1

What is the length that 6 represent in 0.26 rods?
…………………………………………………………………………………….
Is it the same length that 6 has in 2.06 rods? . Is it the same that 6 has in 0.260 rods? YES / NO YES / NO Why? Why?
7. Rounding to the nearest
What length made only of tenths is 0.57 rods closest to? ………………………………………………………………………………………… What length made only of tenths is 0.53 rods closest to? ………………………………………………………………………………………… What length made only of tenths is 0.55 rods closest to? ………………………………………………………………………………………….
Imagine if you divide the thousandth of a rod into ten equal pieces, then what will you
call that piece? How do you write it using decimal notation?
………………………………………………………………………………………………………………………………………………………………………………………… If you divide it again into ten equal smaller pieces, what will you call that piece and how do you write it using decimal notation? ………………………………………………………………………………………………………………………………………………………………………………………… 8. Now if we want to measure things with certain length by using only hundredths pieces, please answer the following questions. What length made only of hundredths is 0.666 closest to?
What length made only of thousandths is 1.55569 closest to?
9. Compare the following decimals and express the relations by using the sign > (larger than), < (smaller than), or = (equal). You may use the LAB to find the answers if you need to.
0.5 0.51 0.9 0.90 0 0.6
Appendix A1

4.66 4.6666 2.56 2.56123 1.91211999 1.991212
What strategy did you use when you compared and ordered the length represented by the above decimals?
Please justify your strategy.
Appendix A1

Name:
Understanding of equivalent decimals Understanding of the additive structure of decimals Understanding the unitising and re-unitising
Activities:
10. Use the LAB to construct a decimal 0.213. Answering the following questions might be helpful.
0.213 = 2 tenths + .……… hundredths + ..…….. thousandths 0.213 = 2 tenths + 0 hundredths + ..…….. thousandths 0.213 = 0 tenths + .…….. hundredths + ……… thousandths 0.213 = 1 tenth + ……….. hundredths + …….. thousandths 0.213 = ………. tenths + ……….. thousandths 0.213 = ………. hundredths + ..…..….. thousandths 0.213 = ..………..hundredths 0.213 = .……….. thousandths
11. Now can you find more ways to construct 0.213? What can you conclude? …………………………………………………………………………………………………………………………………………………………………………………………………………………………………………………………………………………………………………………………………………………………………………
12. Use the number expander to check your answers above.
Appendix A1

Name:
Understanding of the multiplicative structure of decimals
Activities:
13. Observe the relationships between (a) 2 and 2 tenths (b) 2 tenths and 2 hundredths (c) 2 hundredths and 2 thousandths
2 ones = ……... tenths .
2 tenths =…….. hundredths. 2 hundredths = …….thousandths.
Therefore,
ones tenths
Therefore, Therefore,
hundredths thousandths
What pattern of relationships can you find? Express that relation in the following diagram.
Do you think this pattern will continue the same for 2 thousandths and 2 ten-thousandths?
tenths hundredths
ones tenths hundredths thousandths
Appendix A1

Conversely,
2 tenths = ....... ones.
2 hundredths = .......... tenths. 2 thousandths = …....hundredths
Therefore, Therefore,
tenths hundredths
Therefore,
hundredths thousandths ones tenths
14. Using the observed pattern, fill in the following gaps.
What pattern of relationships can you find? Express that in the following diagram.
Do you think this pattern will continue the same for 2 thousandths and 2 ten-thousandths?
ones tenths hundredths thousandths
0.1 = …….. tenths = ………..hundredths = ……… thousandths
…… ones = …….. tenths = ………. hundredths = 11 thousandths
3.07 = ……. tenths = ………. hundredths = ……… thousandths
Appendix A1
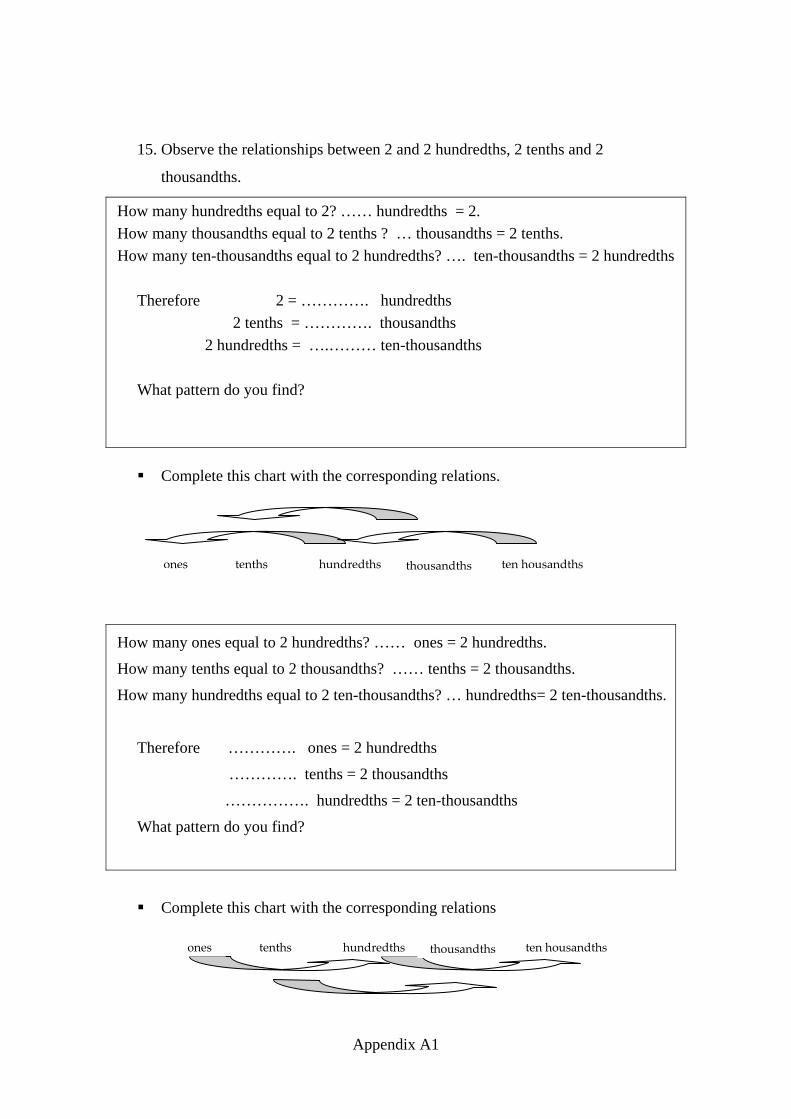
15. Observe the relationships between 2 and 2 hundredths, 2 tenths and 2
thousandths.
How many hundredths equal to 2? …… hundredths = 2. How many thousandths equal to 2 tenths ? … thousandths = 2 tenths. How many ten-thousandths equal to 2 hundredths? …. ten-thousandths = 2 hundredths Therefore 2 = …………. hundredths 2 tenths = …………. thousandths 2 hundredths = ….……… ten-thousandths What pattern do you find?
Complete this chart with the corresponding relations.
How many ones equal to 2 hundredths? …… ones = 2 hundredths.
How many tenths equal to 2 thousandths? …… tenths = 2 thousandths.
How many hundredths equal to 2 ten-thousandths? … hundredths= 2 ten-thousandths.
ones tenths hundredths thousandths ten housandths
Therefore …………. ones = 2 hundredths
…………. tenths = 2 thousandths
……………. hundredths = 2 ten-thousandths
What pattern do you find?
Complete this chart with the corresponding relations
ones tenths hundredths thousandths ten housandths
Appendix A1

16. Fill out this table to express the relationships above. = ones tenths hundredths thousandths ten-thousandths
2 ones
2 tenths
2 hundredths 2 thousandths
2 ten-thousandths
Appendix A1

Name:
Understanding density of decimals
Activities:
17. Using the LAB to construct pairs of the given decimal numbers in Set A below. For each pair, please check whether you could find decimal numbers in between the pair of numbers. If yes, please write the number/s in the middle boxes.
0.9 1
0.1 0.11 0.66
0.666 1.21 1.23
1.5 1.51 1 1.001
Set A
18. Use the number line to locate the pair of decimal numbers given in the Set B, and discuss whether it is possible to find any number in between a given pair:
0.7501 0.75011 0.600 0.60001
2.2452 2.245201 0.366666 0.36666001
Set B
19. What can you conclude from working with the problems in Set A and Set B?
………………………………………………………………………………………
…………………………………………………………………………....................
20. Can you find any decimal number that is bigger than 0.36666001? If yes, how
many can you find? Name a few examples.
………………………………………………………………………………………
………………………………………………………………………………………
Appendix A1

21. Locate the following numbers in the number line:
a) 2, 2 ¼, -1 , , 0.3333333333, 0.3334 , 2.25 31
b) 1.5, 51 , 0.21 , 1/10, 0.1, 0.010, 0.100
c) -1.65, ½ , 0.6, -0.9999, 0.9999, 0.501
⎜ ⎜ ⎜ ⎜
0 1
⎜ ⎜ ⎜
0 1
⎜ ⎜ ⎜
0 1
Appendix A1

213

Appendix A2 – Conjectured LIT for Cycle 1
Goals
• To construct meaningful understanding of decimals by seeing the connection between decimal, fraction notation, verbal words and concrete models.
• To understand different ways of interpreting decimals that is to recognise the equivalence of decimals using unitising
• Understanding the magnitude of decimals that is to determine the order of decimals based on the understanding of place value concept and not based on the whole number rules.
• Understanding the additive and multiplicative structures of decimals that is to recognise that a decimal can be represented as a linear combination of powers of 10 and to recognise the base ten multiplicative structure of decimals.
• Understanding the density of decimals that is to recognise that there is infinitely many decimals in between a pair of decimals.
Decimals notation, additive and multiplicative structures, equivalent decimals, density of decimals
215
Resources needed to teach this unit: • Set 1 • Set 2 • Set 3 • Linear Arithmetic Blocks (LAB) • Number expander • Black board • Number line
Appendix A2
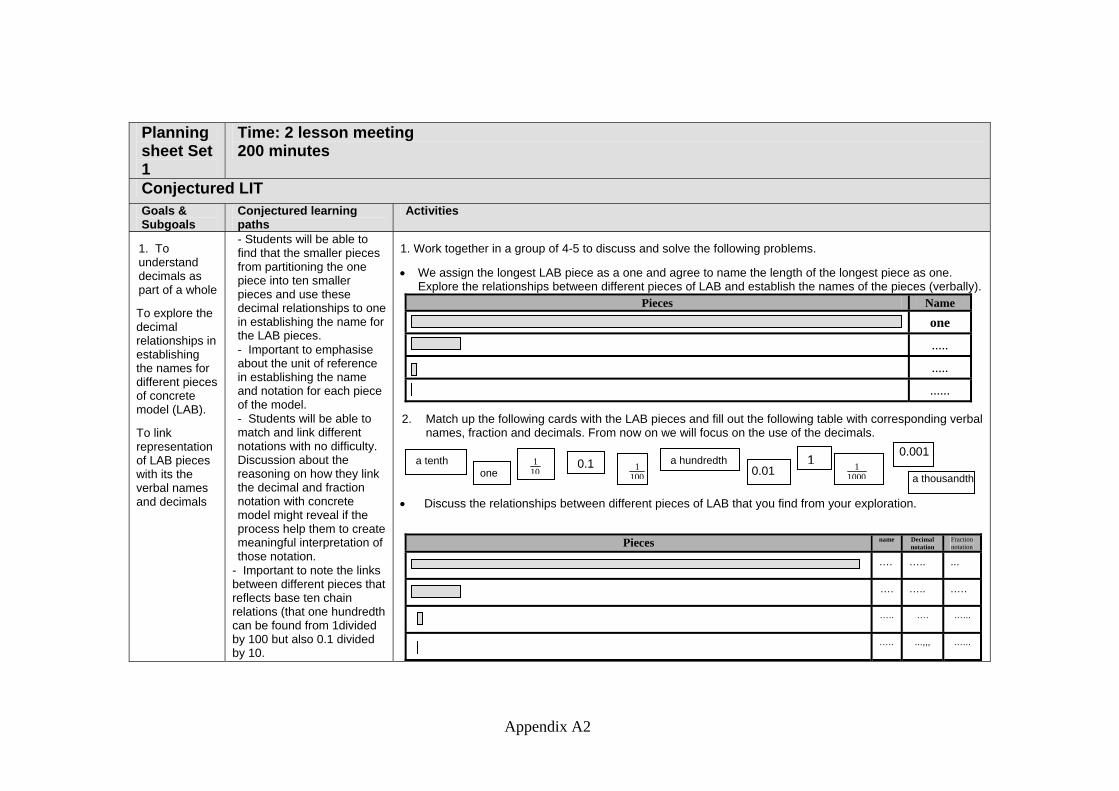
Planning sheet Set 1
Time: 2 lesson meeting 200 minutes
Conjectured LIT Goals & Subgoals
Conjectured learning paths
Activities
1. To understand decimals as part of a whole
To explore the decimal relationships in establishing the names for different pieces of concrete model (LAB).
To link representation of LAB pieces with its the verbal names and decimals
- Students will be able to find that the smaller pieces from partitioning the one piece into ten smaller pieces and use these decimal relationships to one in establishing the name for the LAB pieces. - Important to emphasise about the unit of reference in establishing the name and notation for each piece of the model. - Students will be able to match and link different notations with no difficulty. Discussion about the reasoning on how they link the decimal and fraction notation with concrete model might reveal if the process help them to create meaningful interpretation of those notation.
- Important to note the links between different pieces that reflects base ten chain relations (that one hundredth can be found from 1divided by 100 but also 0.1 divided by 10.
1. Work together in a group of 4-5 to discuss and solve the following problems.
• We assign the longest LAB piece as a one and agree to name the length of the longest piece as one. Explore the relationships between different pieces of LAB and establish the names of the pieces (verbally).
Pieces Name
one
.....
.....
......
2. Match up the following cards with the LAB pieces and fill out the following table with corresponding verbal names, fraction and decimals. From now on we will focus on the use of the decimals.
• Discuss the relationships between different pieces of LAB that you find from your exploration.
Pieces name Decimal
notation Fraction notation
…. ….. ...
…. ….. .….
….. …. …...
.…. ...,,, …...
0.001a tenth 0.1
101 a hundredth
one a thousandth1001 1
10001 0.01
Appendix A2

To use the notation establish in previous activity in recording the result of the measurement. To observe and to use the extended notation of decimal and link it with the conventional decimals.
- In discussing the idea to use the LAB pieces to measure dimension of a table or a chair, it is expected that students will explore the additive structure of decimals as well as multiplicative structure. The multiplicative structure. - Based on the finding of the first cycle, it is possible that some groups find the conversion of the length of each LAB pieces in metric measures using a ruler. If this happen then there is a need to discuss and emphasize that both approach utilize the repeated partitioning into ten smaller units.
3. Working in the same group, now Discuss with your ideas to measure the length and width of your table using the LAB pieces with good
accuracy? Explain your ideas. 4. Explain why do you choose the above approach in measuring the table and record the answers in
decimals. Discuss what concepts or properties did you apply when you record the result of your measurement in decimals.
To observe the importance of place value in decimals. To observe the additive and multiplicative structure in decimals.
-By sketching the LAB model that represent the decimals, students are expected to observe the additive and multiplicative structure in decimals
A = …………………………………………………
B = ………………………………………………
- The sketch of construction aims to encourage reflection on the activity. - Discussion should emphasize on decimal place value in decimals. - The teacher leads the discussion about the role of a decimal comma to note the
5. Sketch the representation of the following decimals. Please note that there is no need to have a precise
scale. Do you think there is a unique way to sketch a decimal number? What can you conclude from this process?
Decimals Sketch of decimals
2.06
0.26
0.206
• What is the value of 6 in 0.26? ………. Is it the same as the value of 6 in 2.06? Why?
Is it the same as the value of 6 in 0.206? Why?
Appendix A2

position of a unit/one. - The discussion needs to highlight the pattern between 2.06 and 0.206.
What can you tell about the role of decimal point in the decimal number? • Do you observe any interesting pattern in sketching out the decimals 2.06 and 0.206? Explain
To use rounding to hundredths in the context of measurement using LAB model.
- By answering this question, idea about rounding to a certain unit (hundredths) can be explored.
6. If you are asked to measure something with only the hundredth piece of LAB, how would you respond to the following questions:
• How many hundredth pieces are needed to find a length closest to 0.666? • How many hundredth pieces are needed to find a length closest to 1.55569?
To explore ideas of how to help students understanding and comparing the magnitude of decimals.
- The linear nature of LAB model might help students to represent and thus compare two decimals based on length.
7. What is your idea to use the LAB model to help your students in comparing the following pairs of decimals. Explain your reasons.
0.9 0.90
- Discuss how the students extend the model in comparing decimals with more than 3 decimal digits. Whether the models are extended or just leave behind to help students in solving this problem.
0 0.6 1.666 1.66 1.912999 1.9912
To reflect on their learning experiences and accommodate new learning experiences in their ideas for future teaching
- Focus on what new things the students learn from their experience. What do they find meaningful or less meaningful. - Can they translate their experiences into their ideas for future teaching in giving meaning to decimals?
8. Based on what you learnt last week, write your new experience about decimals? Explain your reasons. 9. Explain your ideas based on your experience about how to introduce decimals to primary school
students.
Appendix A2

Planning sheet Set 2
Time: 1 lesson meeting 100 minutes
Conjectured LIT Goals & Subgoals Conjectured
learning paths HLP Activities
To promote an understanding of different interpretation of decimals
Students are asked to explore different ways of constructing equivalent decimals. The practical limitation of the model (limited number of pieces) may not allow students to construct 0.213 as 213 thousandths. However, this relationship is important to observe. Therefore, questions that help student observe the pattern and allow them to generalize are posed.
10. Using the LAB pieces, show how you will help students to give meaning to a decimal number 0.123 and 1.23. Try to find as many alternatives as possible and sketch your constructions.
Sketches How
many ones
How many tenths
How many hundredths
How many thousandths
0.123 0.123 0.123 0.123 0.123 0.123 0.123 0.123
Sketches How many ones
How many tenths
How many hundredths
How many thousandths
1.230 1.230 1.230 1.230 1.230 1.230 1.230 1.230
• What concepts or properties of decimals did you learn when doing the above activity? • Is there any new teaching idea for decimal that you learn from this activity?
Appendix A2

11. Based on the above activity and your sketches, now fill out the gaps in the following problem: It is hypothesized that students might explore the non-canonical expansion, i.e., knowing for example that 0.213 = 1 tenth + 11 hundredths + 3 thousandths.
0.213 = ... ones+ 2 tenths + .….. hundredths + ..….. thousandths 0.213 = ... ones + 2 tenth + 0 hundredths + ……. thousandths 0.213 = … ones + 0 tenths + … hundredths + ….. thousandths 0.213 = … ones + 1 tenth + .... hundredths + .... thousandths 0.213 = ..… hundredths + .... thousandths 0.213 = .… hundredths 0.213 = .… thousandths
To promote an understanding of the additive and multiplicative structure of decimals
To provide links between the activity of constructing the decimal number using LAB and the symbolic representations.
Number expander model of decimal number 1.027 (Indonesian version)
12. Use a number expander model to check your answers above! 13. What is the relationship between number expander model and the LAB model?
To reflect on their learning experience and build up ideas for their future teaching.
To reflect on the learning experience with the group. To gain ideas for future teaching from reflection on their activities.
14. Write your new learning experience about decimals in these learning activities with the group? 15. Write what did you learn about decimals from these activities that you could use later to teach
decimals in primary school. Provide specific examples that your group can find.
Appendix A2

Planning sheet Set 3
Time: 1 lesson meeting 100 minutes
Conjectured LIT Goals & Subgoals Conjectured
learning paths Activities
To promote an understanding of the density of decimals.
The use of the number line to locate decimals is meant to overcome the practical limitation of concrete model. Students can be asked to first determine the length of one unit and then locate the decimals on the number line. Discussion needs to help students understand that there are infinite numbers of decimals in between a pair of decimals.
16. Use the LAB to construct pairs of the given decimals in Set A (See below). For each pair, please check
whether you could find decimals in between the pair of numbers. If yes, please name the number, and explain how you find the number or numbers.
1 0.9 0.66 0.666 1.21 1.23
1.5 1.51 1 1.001
Set A
17. Use the number line to locate the pairs of decimals given in the Set B, and discuss whether it is
possible to find any number in between a given pair 0.1 0.11 0.7501 0.7501 0.600 0.60001 2.2452 2.245201
0.366666 0.3666601
Set B
18. What can you learn from working with the problems above? 19. Can you find any decimal that is bigger than 0.36666601? 20. Can you find any decimal that is bigger than 99.999999?
Appendix A2

To link decimals, fractions, and whole numbers on a number line.
• It is expected that in this activity confusion and misconception involving common fractions and decimals can be confronted and resolved in the discussions.
21. Locate the following numbers on the same number line.
31
a) 2 ; 2¼ ; -1 ; ; 0.333333333 ; 0.3334 ; 2.25
51
101
b) 1.5 ; ; 0.21 ; ; 0.1 ; 0.010 ; 0.100
21
c) -1 ; ; 0.6 ; -0.9999 ; 0.501 ; 0
• It is expected that any confusion or difficulty will be captured in their reflection notes.
Appendix A2

Appendix A3
Appendix A3- Sets of Activities in cycle 1 (Indonesian version)
Nama:
1. Disepakati bahwa batangan “Linear Arithmetic Blocks” (LAB) yang terpanjang kita sebut satu. Sekarang, perhatikan hubungan antara unit-unit LAB dengan ukuran yang berbeda. Tuliskan hubungan antara batangan-batangan LAB yang berbeda ukuran tersebut satu dengan yang lain dengan memberi nama pada batangan yang lain.
Batangan Nama
Satu
2. Sekarang pasangkan kartu-kartu berikut dengan batangan LAB dan isilah tabel berikut dengan nama, notasi pecahan dan desimal yang bersesuaian. Mulai sekarang, kita akan memusatkan perhatian pada penggunaan notasi desimal dan label yang bersesuaian.
Sketsa dari batang-batang LAB Nama Notasi desimal
Notasi pecahan
Sepersepuluh
0,1 101
Seperseratus satu
Seperseribu
1001
10001
0,01
0,001
1

Appendix A3
3. Diskusikan dalam kelompok bagaimana gagasan anda untuk mengukur meja di dekat anda dengan menggunakan batangan tersebut sehingga diperoleh hasil yang cukup akurat? Jelaskan gagasan yang anda diskusikan tersebut.
……………………………………………………………………………………………………
……………………………………………………………………………………………………
……………………………………………………………………………………………………
……………………………………………………………………………………………………
……………………………………………………………………………………………………
……………………………………………………………………………………………………
.……………………………………………………………………………………………………
……………………………………………………………………………………………………
4. Ceritakan mengapa anda memilih cara pengukuran yang demikian dan tuliskan
hasil pengukuran anda berdasarkan cara yang dipilih.
Penjelasan:
……………………………………………………………………………………………………
……………………………………………………………………………………………………
……………………………………………………………………………………………………
……………………………………………………………………………………………………
……………………………………………………………………………………………………
……………………………………………………………………………………………………
……………………………………………………………………………………………………
……………………………………………………………………………………………………
A = ………………………………………
B = …………………………………
Penjelasan

Appendix A3
5. Gambarkan konstruksi batang-batang LAB yang bersesuaian dengan notasi desimal yang diberikan di bawah ini.
Sketsa representasi dari bilangan desimal (tidak perlu sesuai skala yang akurat)
2,06
0,26
0,206
Apa yang dapat kamu simpulkan dari proses konstruksi di atas?
.……………………………………………………………………………………………………
……………………………………………………………………………………………………
.……………………………………………………………………………………………………
……………………………………………………………………………………………………
……………………………………………………………………………………………………
………………….…………………………………………………………………………………
……………………………………………………………………………………………………
……………………….……………………………………………………………………………
………….…………………………………………………………………………………………
Berapakah nilai dari 6 pada 0,26 ……………………………………………………………………………….
Apakah sama dengan nilai dari 6 pada 2,06? Apakah sama dengan nilai dari 6 pada 0,206? Ya/Tidak. Ya/Tidak Mengapa? Mengapa?
6. Jika kamu mengukur suatu benda dengan panjang tertentu hanya menggunakan batangan dengan ukuran seper-seratusan, jawablah pertanyaan-pertanyaan berikut ini.
Berapa panjang yang disusun dari batangan seper-seratusan yang terdekat dengan 0,666?
……………………
Berapa panjang yang disusun dari batangan seper-seratusan yang terdekat dengan 1,55569 ?
………………...

Appendix A3
7. Bagaimana gagasanmu untuk menggunakan batangan LAB untuk membantu siswa anda membandingkan desimal berikut yaitu untuk menentukan mana bilangan desimal yang terbesar atau memutuskan bahwa keduanya sama besar.
0,9 0,90 0 0,6 1,666 1,66 1,912999 1,9912
Penjelasan:
……………………………………………………………………………………………………
…………….………………………………………………………………………………………
……………………………………………………………………………………………………
……………………………………………………………………………………………………
……………………………………………………………………………………………………
……………………………………………………………………………………………………
……………………………………………………………………………………………………
……………………………………………………………………………………………………
……………………………………………………………………………………………………
……………………………………………………………………………………………………
……………………………………………………………………………………………………
………………….…………………………………………………………………………………
……………………………………………………………………………………………………
……………………………………………………………………………………………………
………………….…………………………………………………………………………………
……………………………………………………………………………………………………
……………………………………………………………………………………………………
………………….…………………………………………………………………………………
……………………………………………………………………………………………………
……………………………………………………………………………………………………
………………….…………………………………………………………………………………

Appendix A3
8. Berdasarkan pengalaman belajar minggu lalu, tuliskan pengalaman belajar baru yang anda peroleh tentang desimal!
……………………………………………………………………………………………………
……………………………………………………………………………………………………
……………………………………………………………………………………………………
……………………………………………………………………………………………………
……………………………………………………………………………………………………
……………………………………………………………………………………………………
……………………………………………………………………………………………………
……………………………………………………………………………………………………
9. Tuliskan gagasanmu bagaimana membelajarkan tentang desimal kepada siswa SD
berdasarkan pengalamanmu menyelesaikan soal minggu yang lalu.
……………………………………………………………………………………………………
……………………………………………………………………………………………………
……………………………………………………………………………………………………
……………………………………………………………………………………………………
……………………………………………………………………………………………………
……………………………………………………………………………………………………
……………………………………………………………………………………………………
……………………………………………………………………………………………………
……………………………………………………………………………………………………
……………………………………………………………………………………………………
……………………………………………………………………………………………………

Appendix A3
Nama:
10. Dengan menggunakan batangan LAB, perlihatkan bagaimana anda membantu siswa anda untuk memberi makna pada bilangan desimal 0,123 dan 1,230. Cobalah untuk menemukan beberapa alternatif jawaban dan gambarkan sketsa konstruksi anda!
Sketsa Berapa banyak satuan
Berapa banyak seper-
sepuluhan
Berapa banyak seper-
seratusan
Berapa banyak seper-
seribuan
0,123
0,123
0,123
0,123
0,123
0,123
0,123
0,123
Sketsa Berapa banyak satuan
Berapa banyak seper-
sepuluhan
Berapa banyak seper-
seratusan
Berapa banyak seper-
seribuan
1,230
1,230
1,230
1,230
1,230
1,230
1,230
1,230

Appendix A3
11. Berdasarkan kegiatan sebelumnya (Kegiatan 1), sekarang isilah titik-titik berikut ini:
12. Gunakan “number expander” (pengekspansi bilangan) untuk memeriksa jawaban anda! Bagaimana anda merespon siswa anda yang menanyakan prinsip matematis dari alat ini?
……………………………………………………………………………………………………
……………………………………………………………………………………………………
……………………………………………………………………………………………………
……………………………………………………………………………………………………
……………………………………………………………………………………………………
……………………………………………………………………………………………………
13. Menurut anda bagaimana hubungan alat ini, pengekspansi bilangan dengan model
LAB?
……………………………………………………………………………………………………
……………………………………………………………………………………………………
……………………………………………………………………………………………………
……………………………………………………………………………………………………
……………………………………………………………………………………………………
0,213 = ….. satuan + 2 seper-sepuluhan + .…seper-seratusan +….seper-seribuan
0,213 = …. satuan + 2 seper-sepuluhan + 0 seper-seratusan + ..…. seper-seribuan
0,213 = ….. satuan + 0 seper-sepuluhan + .….seper-seratusan + ……seper-seribuan
0,213 = …. satuan + 1 seper-sepuluhan + …… seper-seratusan + ……seper-seribuan
0,213 = ……… seper-sepuluhan + …….. seper-seribuan
0,213 = ………. seper-seratusan + ..……. seper-seribuan
0,213 = ..………. seper-seratusan
0,213 = .……… seper-seribuan
Pengekspansi bilangan (number expander)

Appendix A3
14. Tuliskan pengalaman anda tentang desimal yang baru dari kegiatan belajar ini bersama kelompok.
……………………………………………………………………………………………………
……………………………………………………………………………………………………
……………………………………………………………………………………………………
……………………………………………………………………………………………………
……………………………………………………………………………………………………
……………………………………………………………………………………………………
……………………………………………………………………………………………………
……………………………………………………………………………………………………
……………………………………………………………………………………………………
……………………………………………………………………………………………………
15. Tuliskan apa yang anda pelajari tentang desimal dari kegiatan ini yang selanjutnya
dapat anda gunakan untuk mengajar siswa SD belajar tentang desimal di kelas? Berikan contoh khusus yang anda temukan dalam diskusi kelompok.
……………………………………………………………………………………………………
……………………………………………………………………………………………………
……………………………………………………………………………………………………
……………………………………………………………………………………………………
……………………………………………………………………………………………………
……………………………………………………………………………………………………
……………………………………………………………………………………………………
……………………………………………………………………………………………………
……………………………………………………………………………………………………
……………………………………………………………………………………………………

Appendix A3
Nama:
16. Untuk setiap pasangan bilangan desimal dalam Tabel A yang diberikan, carilah bilangan desimal di antara pasangan tersebut jika ada. Diskusikan dalam kelompok bagaimana cara menemukan bilangan tersebut dan berikan beberapa contoh serta gambarkan contoh yang anda temukan pada garis bilangan.
Tabel A
……………………………………………………………………………………………………
……………………………………………………………………………………………………
……………………………………………………………………………………………………
……………………………………………………………………………………………………
……………………………………………………………………………………………………
……………………………………………………………………………………………………
Tempat untuk menggambar garis bilangan
0,1 0,11
0,66 0,666
1,5 1,51
1 1,001

Appendix A3
17. Sekarang gunakan garis bilangan untuk menentukan letak dari bilangan desimal yang diberikan pada tabel B. Diskusikan dengan kelompok anda, apakah mungkin mencari bilangan desimal di antara pasangan bilangan desimal tersebut.
Tabel B
Tempat untuk menggambar garis bilangan
……………………………………………………………………………………………………
……………………………………………………………………………………………………
……………………………………………………………………………………………………
……………………………………………………………………………………………………
……………………………………………………………………………………………………
18. Apa yang dapat anda simpulkan dari soal 1 dan 2?
……………………………………………………………………………………………………
……………………………………………………………………………………………………
……………………………………………………………………………………………………
……………………………………………………………………………………………………
……………………………………………………………………………………………………
……………………………………………………………………………………………………
0,7501 0,75011
0,600 0,60001
2,2452 2,245201
0,366666 0,36666001

Appendix A3
19. Dapatkah anda menemukan bilangan desimal yang lebih besar dari 0,36666001? Jika ya, ada berapa banyak bilangan desimal yang anda temukan? Sebutkan
beberapa contoh dari yang anda temukan!
……………………………………………………………………………………………………
……………………………………………………………………………………………………
……………………………………………………………………………………………………
……………………………………………………………………………………………………
……………………………………………………………………………………………………
……………………………………………………………………………………………………
20. Dapatkah anda menemukan bilangan desimal yang lebih besar dari 99,9999999? Jika ya, ada berapa banyak bilangan desimal yang anda temukan? Sebutkan beberapa contoh dari yang anda temukan!
……………………………………………………………………………………………………
……………………………………………………………………………………………………
……………………………………………………………………………………………………
……………………………………………………………………………………………………
……………………………………………………………………………………………………
……………………………………………………………………………………………………
……………………………………………………………………………………………………
……………………………………………………………………………………………………

Appendix A3
21. Tentukan letak dari bilangan berikut pada garis bilangan di bawah ini:
a) 2 ; 2¼ ; -1 ; 31 ; 0,3333333333 ; 0,3334 ; 2,25
b) 1,5 ; 51 ; 0,21 ; 1/10 ; 0,1 ; 0,010 ; 0,100
c) -1,65 ; ½ ; 0,6 ; -0,9999 ; 0,9999 ; 0,501
0 1
0 1
0 1

Appendix A4
Appendix A4 – Refinement of LIT from Cycle 1 to Cycle 2
Goals
• To construct meaningful understanding of decimal notation by seeing the connection between decimal, fraction notation, verbal words and concrete models.
• To understand different ways of interpreting decimals that is to recognise the equivalence of decimals using unitising.
• Understanding the magnitude of decimals that is to determine the order of decimals based on the understanding of place value concept and not based on the whole number rules.
• Understanding the additive and multiplicative structures of decimals that is to recognise that a decimal can be represented as a linear combination of powers of 10 and to recognise the base ten multiplicative structure of decimals.
• Understanding the density of decimals that is to recognise that there is infinitely many decimals in between a pair of decimals.
Resources needed to teach this unit:
• Set 1
• Set 2
• Set 3
• Linear Arithmetic Blocks (LAB)
• Number expander
• Black board
• Strings
Decimals notation, additive and
multiplicative structures, equivalent
decimals, density of decimals

Appendix A4
Planning
sheet Set 1
Time: 2 lesson meeting 200 minutes
Goals & Subgoals Conjectured learning paths
Activities
1. To understand decimals as part of a whole
• To explore the decimal relationships in establishing the names for different pieces of concrete model (LAB).
• To link representation of LAB pieces with its the verbal names and decimal notation.
- Students will be able to find that the smaller pieces from partitioning the one piece into ten smaller pieces and use these decimal relationships to one in establishing the name for the LAB pieces.
- Important to emphasise about the unit of reference in establishing the name and notation for each piece of the model.
- Students will be able to match and link different notations with no difficulty. Discussion about the reasoning on how they link the decimal and fraction notation with concrete model might reveal if the process help them to create meaningful interpretation of those notation.
- Important to note the links between different pieces that reflects base ten chain relations (that one hundredth can be found from 1divided by
Work together in a group of 4-5 to discuss and solve the following problems.
1. You are given this LAB piece and we agree to call it one. If you were to measure the length and width of your table with the piece, how many parts would you divide the piece into? Explain why do you choose this? What is the advantage and limitation of your choice?
If you want to get a more accurate result compared to the one before, what do you need to do?
2. Now if you need to measure the length of an eraser, how would you divide the piece?
3. Write the relationships among different LAB pieces and establish the names which reflect the relation to the longest LAB piece, called one.
Pieces name Decimal notation
Fraction notation
…..
…..
….
…..
…..
.….
…...
….
…...
.…..
...,,,
…...

Appendix A4
100 but also 0.1 divided by 10.
• To use the notation establish in previous activity in recording the result of the measurement.
• To observe and to use the extended notation of decimal and link it with the conventional decimal notation.
- In discussing the idea to use the LAB pieces to measure dimension of a table or a chair, it is expected that students will explore the additive structure of decimals as well as multiplicative structure.
- The finding of the first cycle suggests that some groups find the conversion of the length of each LAB pieces in metric measures using a ruler. If this happens then there is a need to discuss and emphasize that both approach utilize the repeated partitioning into ten smaller units.
4. Working in the same group, now
• Discuss your ideas to measure the length and width of your table using the LAB pieces with good accuracy.
• Record the result of your measurement in decimal notation and explain how did you get the result.
• To observe the importance of place value in decimal notation.
• To observe the additive and multiplicative structure in decimal notation.
-By sketching the LAB model that represent the decimal numbers, students are expected to observe the additive and multiplicative structure in decimal notation
- The sketch of construction aims to encourage reflection on the activity.
- Discussion should emphasize on decimal place value in decimal notation.
5. Sketch the representation of the following decimal numbers. Please note that there is no need to have a precise scale. Do you think there is a unique way to sketch a decimal number? What can you conclude from this process?
Decimal numbers
Sketch of decimal numbers
2.06
0.26
0.206
6. What is the interesting pattern that you observe from constructing these decimals? 7. What can you conclude from the construction activity?
A = …………………………………………………
B = ………………………………………………

Appendix A4
• To reflect on their learning experiences and accommodate new learning experiences in their ideas for future teaching
- Focus on what new things the students learn from their experience. What do they find meaningful or less meaningful.
- Can they translate their experiences into their ideas for future teaching in giving meaning to decimal notation?
8. After your experience with LAB model in representing decimals, discuss in your group your interpretation of
decimals such as 1.23456? 9. Do you have new ideas about how to introduce decimals in the primary schools? Include examples when possible.

Appendix A4
Planning
sheet Set 2 Activities
Understanding density of decimals Time: 1 lesson meeting 100 minutes
Goals & Subgoals
Conjectured learning paths
Activities
• To promote an understanding of the density of decimals.
� The use of the number line to locate decimals is meant to overcome the practical limitation of concrete model. Students can be asked to first determine the length of one unit and then locate the decimals on the number line.
� Discussion needs to help students understand that there are infinite numbers of decimals in between a pair of decimals.
Play Number in between games in front as a whole class activity. First, students are asked to nominate two numbers and volunteer students are asked to come in front and locate a decimal number in between the two starting numbers. (It can be played with the number line drawn on the black board or using a rope and some piece of papers with numbers proposed written on it). The same activity is repeated several times until students get an idea that they can always find a decimal number in between two decimal numbers. Later in the group they will be asked to further deepen the discussion by thinking about the number of decimal numbers in between two decimals. 10. Explain what property of decimals that your learn from playing the ‘Number Between’ game? 11. What are your ideas for teaching decimals based on your experience in playing the ‘Number Between’ game?
12. For each pair of decimals in Table A below, discuss in your group whether it is possible to find decimals in between
the pairs. Explain how did you find that number, give some examples and locate them on the number line.
13. What can you conclude from Activity 12 above?
14. Can you find a decimal number that is larger than 0.366666001? If so, how many decimals can you find? Give few examples.
1.5 1.51
0.99 0.999
1.7501 1.75011
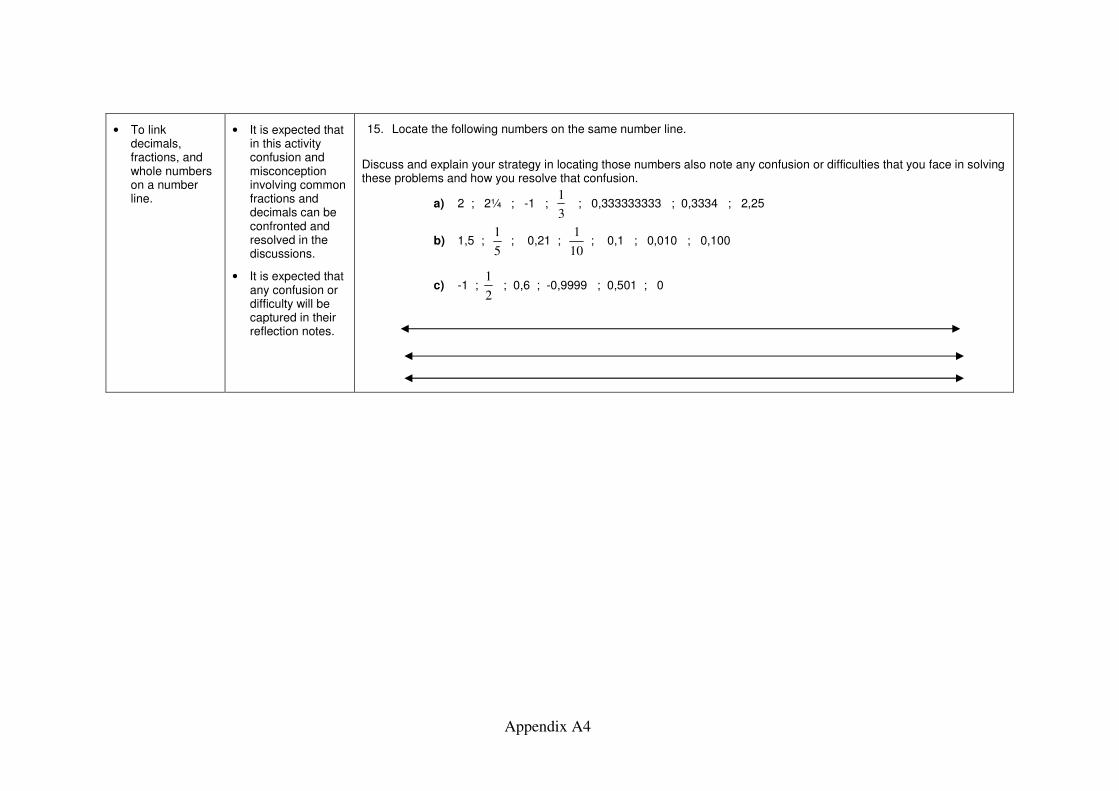
Appendix A4
• To link decimals, fractions, and whole numbers on a number line.
• It is expected that in this activity confusion and misconception involving common fractions and decimals can be confronted and resolved in the discussions.
• It is expected that any confusion or difficulty will be captured in their reflection notes.
15. Locate the following numbers on the same number line.
Discuss and explain your strategy in locating those numbers also note any confusion or difficulties that you face in solving these problems and how you resolve that confusion.
a) 2 ; 2¼ ; -1 ; 3
1 ; 0,333333333 ; 0,3334 ; 2,25
b) 1,5 ; 5
1 ; 0,21 ;
10
1 ; 0,1 ; 0,010 ; 0,100
c) -1 ; 2
1 ; 0,6 ; -0,9999 ; 0,501 ; 0
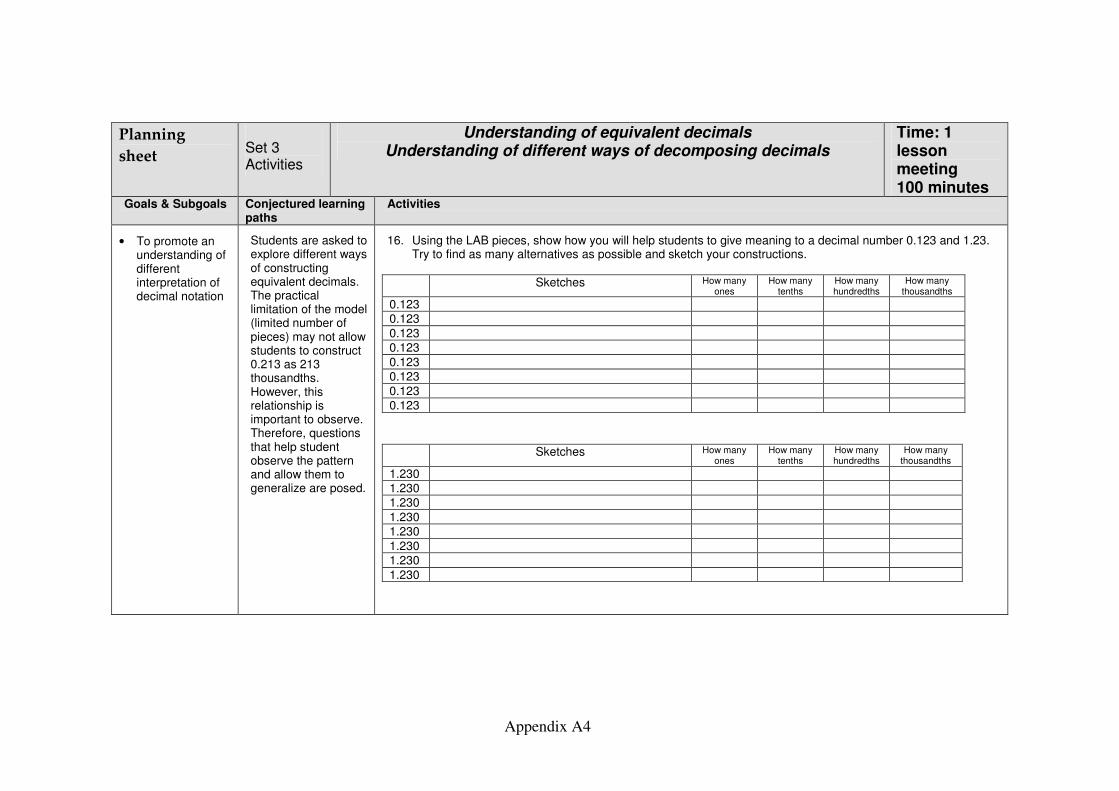
Appendix A4
Planning
sheet Set 3 Activities
Understanding of equivalent decimals Understanding of different ways of decomposing decimals
Time: 1 lesson meeting 100 minutes
Goals & Subgoals Conjectured learning paths
Activities
• To promote an understanding of different interpretation of decimal notation
Students are asked to explore different ways of constructing equivalent decimals. The practical limitation of the model (limited number of pieces) may not allow students to construct 0.213 as 213 thousandths. However, this relationship is important to observe. Therefore, questions that help student observe the pattern and allow them to generalize are posed.
16. Using the LAB pieces, show how you will help students to give meaning to a decimal number 0.123 and 1.23. Try to find as many alternatives as possible and sketch your constructions.
Sketches How many ones
How many tenths
How many hundredths
How many thousandths
0.123
0.123
0.123
0.123
0.123
0.123
0.123
0.123
Sketches How many ones
How many tenths
How many hundredths
How many thousandths
1.230
1.230
1.230
1.230
1.230
1.230
1.230
1.230

Appendix A4
• To promote an understanding of the additive and multiplicative structure of decimals
It is hypothesized that students might explore the non-canonical expansion, i.e., knowing for example that 0.213 = 1 tenth + 11 hundredths + 3 thousandths.
17. Based on the above activity and your sketches, now fill out the gaps in the following problem:
Q 0.213 = ... ones+ 2 tenths + .….. hundredths + ..….. thousandths 0.213 = ... ones + 2 tenth + 0 hundredths + ……. thousandths 0.213 = … ones + 0 tenths + … hundredths + ….. thousandths 0.213 = … ones + 1 tenth + .... hundredths + .... thousandths 0.213 = ..… hundredths + .... thousandths 0.213 = .… hundredths 0.213 = .… thousandths
• • To provide links
between the activity of constructing the decimal number using LAB and the symbolic representations.
Number expander model of decimal number 1.027 (Indonesian version)
18. Explore different ways of decomposing decimal numbers using the number expander for 0.213. List all of the different ways you found.
19. Did you find any pattern from expanding the same decimal number? What is your conclusion?
• To reflect on their learning experience and build up ideas for their future teaching.
• To reflect on the learning experience with the group.
• To gain ideas for future teaching from reflection on their activities.
20. Can you use LAB to illustrate the expansion of decimals as you find using the number expander?
21. Do you have new teaching ideas for decimals in the primary school?

Appendix A5 – Cycle 2 Activities (Indonesian version)
Nama:
1. Tuliskan gagasan kelompok anda untuk membagi batang satu sehingga anda dapat membandingkan dan menuliskan hasil pengukuran seakurat mungkin.
Jelaskan mengapa anda memilih pembagian yang demikian? Dalam penjelasan ini, sebutkan keunggulan dan kelemahan dari pembagian yang anda pilih. 2. Diskusikan gagasan anda jika masalah pengukuran di atas diperluas
menjadi masalah pengukuran benda yang lebih pendek seperti mengukur dimensi panjang dan lebar dari karet penghapus anda. Bagaimana pembagian selanjutnya dari batangan satu yang dipakai di awal?
Appendix A5

3. Tuliskan hubungan antara batangan-batangan LAB yang berbeda ukuran
tersebut satu dengan yang lain dengan memberi nama pada batangan yang lain.
Batangan Nama Notasi Hubungan
4. Sekarang tuliskan hasil dari pengukuran meja yang anda lakukan dengan
menggunakan notasi desimal. Tuliskan bagaimana hasil tersebut anda dapatkan.
A = …………………………………
Penjelasan:
B = ………………………………
5. Gambarkan konstruksi batang-batang LAB yang bersesuaian denagn notasi desimal yang diberikan di bawah ini.
Appendix A5

Bilangan desimal
Sketsa batang (tidak perlu sesuai skala yang akurat)
2,06
0,26
0,206
6. Adakan pola menarik yang kamu temukan dalam proses konstruksi ketiga
bilangan tersebut? 7. Apa yang dapat kamu simpulkan dari proses konstruksi ini?
Appendix A5

Refleksi
8. Dari proses konstruksi bilangan desimal dengan LAB, bagaimana pemahaman atau interpretasi anda tentang bilangan desimal, misalnya 1,23456?
9. Gagasan baru apakah yang dapat anda gunakan untuk memberikan pemahaman akan bilangan desimal pada siswa SD? Berikan contoh konkrit yang muncul dalam proses diskusi kelompok anda.
Appendix A5

Nama:
10. Jelaskan sifat atau konsep bilangan decimal apakah yang anda pelajari dan amati dari permainan ‘Number Between’ tadi?
11. Bagaimana gagasan anda untuk mengembangkan pembelajan decimal di Sekolah Dasar berdasarkan permainan ‘Number Between’ tadi?
Appendix A5

12. Untuk setiap pasangan bilangan desimal dalam Tabel A, carilah bilangan desimal di antara pasangan tersebut jika ada. Jelaskan cara anda menemukan bilangan tersebut, berikan contoh-contoh dan gambarkan pada garis bilangan.
13. Apa yang dapat kamu simpulkan dari soal 12 di atas?
14. Dapatkah anda menemukan bilangand desimal yang lebih besar dari 0,36666001? Jika ya, ada berapa banyak bilangan desimal yang anda temukan? Sebutkan beberapa contoh dari yang anda temukan!
Adakah model atau alat peraga atau permainan yang dapat pakai untuk membantu siswa menyelesaikan masalah ini?
1,5 1,51 0,99 0,999 1,7501 1,75011
Appendix A5
Tabel A

Appendix A5
15. Tentukan letak dari bilangan berikut pada garis bilangan di bawah ini:
a) 2 ; 2¼ ; -1 ; 31 ; 0,3333333333 ; 0,3334 ; 2,25
⎜ ⎜ ⎜ ⎜ ⎜
0 1
⎜ ⎜ ⎜ ⎜ ⎜
0 1
⎜ ⎜ ⎜ ⎜ ⎜
0 1
b) 1,5 ; 51 ; 0,21 ; 1/10 ; 0,1 ; 0,010 ; 0,100
c) -1,65 ; ½ ; 0,6 ; -0,9999 ; 0,9999 ; 0,501

Nama:
16. Dengan menggunakan batangan LAB, carilah berbagai kemungkinan mengkonstruksi dan memberi makna pada dua bilangan berikut.
Sketsa Berapa
banyak satuan
Berapa banyak
per-sepuluhan
Berapa banyak
per-seratusan
Berapa banyak
per-seribuan
0,123
0,123
0,123
0,123
0,123
0,123
0,123
0,123 Sketsa Berapa
banyak satuan
Berapa banyak
per-sepuluhan
Berapa banyak
per-seratusan
Berapa banyak
per-seribuan
1,23
1,23
1,23
1,23
1,23
1,23
1,23
1,23
Appendix A5

17. Berdasarkan kegiatan sebelumnya, isilah titik-titik berikut ini:
0,213 = … satuan + 2 per-sepuluhan + .…per-seratusan +… per-seribuan
0,213 = … satuan + 2 per-sepuluhan + 0 per-seratusan + … per-seribuan
0,213 = … satuan + 0 per-sepuluhan + …. per-seratusan +…. per-seribuan
0,213 = … satuan + 1 per-sepuluhan + … per-seratusan + …. per-seribuan
0,213 = … per-sepuluhan + …. per-seribuan
0,213 = … per-seratusan + ..… per-seribuan
0,213 = ..… per-seratusan
0,213 = .… per-seribuan
Model pengekspansi bilangan menunjukkan berbagai ekspansi bilangan desimal dalam berbagai nilai tempat yang berbeda.
Pengekspansi bilangan (number expander)
18. Tuliskan berbagai ekspansi dari bilangan desimal 0,213 yang kamu temukan
dengan menggunakan model pengekspansi bilangan.
19. Apakah kamu dapat melihat pola tertentu dalam mengekspansi bilangan desimal yang sama? Apa yang dapat kamu simpulkan?
Appendix A5

Appendix A5
20. Dapatkah anda menggunakan model LAB untuk mengilustrasikan hasil
ekspansi suatu bilangan desimal dengan menggunakan pengekspansi bilangan? Berikan contoh.
21. Adakah gagasan baru yang dapat anda pakai untuk mengajar di Sekolah
Dasar?

Appendix B
Appendix B1: Pre-test cycle 1 Part A, B, and C (English version)
Appendix B2: Post-test cycle 1 Part A, B, and C (English version)
Appendix B3: Pre-course interview cycle 1 (English version)
Appendix B4: Post-course interview cycle 1 (English version)
Appendix B5: Pre-test cycle 2 Part A, B, and C (Indonesian version)
Appendix B6: Post-test cycle 2 Part A, B, and C (Indonesian version)
Appendix B7: Pre-course interview cycle 2 (English version)
Appendix B8: Post-course interview cycle 2 (English version)
Appendix B9 Record of changes of the written tests from cycle 1 to cycle 2

Appendix B1: Pre-test Cycle 1 Part A, B, and C (English version)
Part A
Name: _______________________________________________ Student number:____________________ Date: ___________
For each pair of decimals below, circle the larger decimal or write = in between!
4.8 4.63 2.681 2.94 3.92 3.4813
0.74 0.8 0.41 0.362 0.374 0.2165
2.6 2.83 5.62 5.736 7.942 7.63
0.6 0.73 0.426 0.37 0.62 0.827
1.86 1.87 0.3 0.4 2.4 2.3
3.0 3 0.0 0 0.8 0.80000
4.08 4.7 3.72 3.073 0.3 0.03
3.72 3.07 8.052 8.514 0.0004 0.4
17.35 17.353 4.4502 4.45 0 0.6
4.666 4.66 3.7 3.77777 0.7 0.00

Appendix B1
Part B
Written test items Rationale for
item
Concept
1. Tick the boxes that indicate the value of digit 1 in the following
decimal numbers:
a) 9.31?
� a tenth � a hundredth � a thousandth � a ten thousandth
b) 23.001?
� a tenth � a hundredth � a thousandth � a ten thousandth
c) 5.1064?
� a tenth � a hundredth � a thousandth � a ten thousandth
Recognise the
place value names
of a decimal digit
Place value
2. Fill in the gaps with as many options as you can to make this a
correct statement.
b) 0.375 = …ones+…tenths+… hundredths +…thousandths
= …ones+…tenths+… hundredths +…thousandths
= …ones+…tenths+.. .hundredths +…thousandths
= …ones+…tenths+… hundredths +…thousandths
c) 1.025 = …ones+…tenths+… hundredths +…thousandths
= …ones+…tenths+… hundredths +…thousandths
= …ones+…tenths+….hundredths +…thousandths
= …ones+…tenths+… hundredths +…thousandths
Recognise the
different ways of
decomposing
decimals
Place value.
Additive and
multiplicative
structures of
decimals
3. Order the following decimals from smallest to largest:
a) 0 0.788 0.7821 0.8 0.80000
b) 0.375 0 0.0025 0.125000 0.3752
Recognise the
relative magnitude
of decimals
Sequencing
decimals
4. Write three numbers that follows for each of sequence:
a) 1.5; 1; 0.5; …. ; …… ; ……
b) 0.092 ; 0.094 ; 0.096 ; …… ; …… ; …….
Recognise the
magnitude of
decimals and
sequence of
decimals
Sequencing of
decimal
numbers
5. How many decimal numbers can you find in between 3.14 and
3.15? Tick one of the options and explain briefly your reasoning
� None, because…………………………………………..
� 1, namely ………………………………………………
� Less than 200, because…………………………….……
� More than 200, because …………………………………
6. How many decimal numbers can you find in between 0.799 and
0.80? Tick one of the options and explain briefly your reasoning
� None, because…………………………………………..
� 1, namely ………………………………………………
� Less than 200, because…………………………….……
� More than 200, because …………………………………
Observe density of
decimals. i.e. there
are infinitely many
decimals in
between two
decimals
Density of
decimals

Appendix B1
Written test items Rationale for
item
Concept
7. Write the decimal numbers pointed by the arrows A and B in the
corresponding boxes. Explain briefly how do you find the
answers.
8. Write the decimal numbers pointed by the arrows A and B in the
corresponding boxes. Explain briefly how do you find the
answers.
Observe
knowledge of
relative magnitude
of decimals on the
number line
Decimals on
the number
line
9. Mark the position of the following decimal numbers in the
number line: -1.1 ; -0.35 ; 1.6 ; 0.25 ; 1.05
Recognise the
position of
decimals
(including
negative decimals)
on the number line
Decimals on
the number
line
10. Tick the decimal number which is closest to 8.0791
� 8.08 � 8.0917 � 8.709 � 8.079001
11. Tick the decimal number which is closest to 0.10793
� 0.11793 � 0.10693 � 0.10783 � 0.10795
Recognise place
value in
determining the
closeness of two
decimals
Place value.
Relative
magnitude of
decimals
12. Ratna needs 0.25 hours to go to school by bus. If Ratna leaves
home at 7.15 a.m. what time Ratna will arrive at school?
Recognise
decimals in units
of time
Multiplication
and addition of
decimals
13. Ani wants to bake a cake for Rina’s birthday. Based on the
recipe, she will need 1.25 kg of flour. Because the store Ani
went to shop only sell the flour in small package of 100 grams,
how many packages will Ani need to buy?
Recognise
rounding in up in
contextual
problems
involving metric
measurements
Multiplication
and division of
decimals in
daily life
contexts
14. A truck can carry 3.8 tonnes of rice. How many kilograms of rice
can the truck carry? Hint: 1 tonne = 1000 kg
Recognise
decimals in metric
measurements
Multiplication
of decimals by
1000
15. Bayu bought 10 bottles of 1.25 litres coke for a picnic with his
friends. How many litres of coke altogether did Bayu buy?
Recognise base
ten chain in
decimals in the
metric context
Multiplication
of decimals by
10
16. The distance between two cities is 12.5 km. What is the distance
of those two cities on the map whose scale is 1: 100.000? With
this scale. 1 distance unit represents 100.000 on the ground.
Recognise base
ten chain in
decimals in the
metric context
Division of
decimals by
power of 10
-1 0 1 2
2.0 2.1 2.2
A B A
A =
B =
Explanation………………………………………………
…………………………………………………….………
……………………………………………………………
C =
D =
Explanation………………………………………………
…………………………………………………….………
……………………………………………………………
2.0 2.1 2.2
D C

Appendix B1
Part C
17. What is your idea of teaching your students to find the
larger number between 0 and 0.6?
Observe teaching
ideas on the meaning
of decimals and their
magnitude
Place value
and
magnitude of
decimals
18. How will you teach your students to divide 0.5 by 100? Observe teaching
idea on division of
decimals
Division of
decimals by
100
19. Responding to a problem of ordering decimal numbers
0.34; 0.33333. and 0.3; a student answered 0.3 < 0.34 <
0.33333. In your opinion, what is this student need to
understand? How would you help this student to
understand it?
Diagnose
misconceptions in
ordering decimals
and teaching ideas to
resolve it
Place value
and relative
magnitude of
decimals
20. How will assist your students in converting 1/3 into
decimal number?
Observe ideas in
linking fractions and
decimals
Link between
fractions and
decimals

Appendix B2: Post-test Cycle 1 Part A, B and C (English version)
Part A
Name: _______________________________________________ Student number:____________________ Date: ___________
For each pair of decimals below, circle the larger decimal or write = in between!
1.9 1.74 1.1503 1.15 0 0.7
0.81 0.9 3.792 3.81 0.8 0.00
3.7 3.94 0.72 0.673 4.63 4.1924
0.7 0.84 5.73 5.847 0.481 0.3275
1.777 1.77 0.737 0.68 8.813 8.74
2.97 2.98 4.8 4.88888 0.73 0.938
4.0 4 0.7 0.6 0.9 0.90000
1.09 1.8 0.00 0 3.7 3.6
4.83 4.08 4.83 4.084 0.4 0.04
28.45 28.454 9.053 9.521 0.0006 0.6

Appendix B2
Part B
Written Test item Rationale for
item
Concept
1. Tick the boxes that indicate the value of digit 3 in the following
decimal numbers:
a) 9.31?
� a tenth � a hundredth � a thousandth � a ten thousandth
b) 23.001?
� a tenth � a hundredth � a thousandth � a ten thousandth
c) 5.1063?
� a tenth � a hundredth � a thousandth � a ten thousandth
Recognise the place
value of each digits
in decimal numbers
Place value
2. Fill in the gaps with as many options as you can to make this a
correct statement.
a) 0.753 = …ones+...tenths+... hundredths +…thousandths
= …ones+...tenths+… hundredths +…thousandths
= …ones+...tenths+.. .hundredths +…thousandths
= …ones+...tenths+… hundredths +…thousandths
b) 2.051 = …ones+...tenths+… hundredths +…thousandths
= …ones+...tenths+… hundredths +…thousandths
= ...ones+...tenths+….hundredths +…thousandths
= ...ones+...tenths+….hundredths +…thousandths
Recognise the
different ways of
representing a
decimal number by
using unitising and
re-unitising
Place value,
additive and
multiplicativ
e structures
in decimals
3. Order the following decimals from smallest to largest:
a) 0.40001 0.444 0.4421 0.4 0
b) 0.273 0 0.0013 0.11300 0.2731
4. Write three numbers that follows for each of sequence:
a) 1.4; 1; 0.6; …. ; …… ; ……
b) 0.0125 ; 0.025 ; 0.0375; …… ; …… ; …….
Recognise the
magnitude of
decimals and
sequence of decimals
Sequencing
of decimal
numbers
5. How many decimal numbers can you find in between 2.18 and
2.19? Tick one of the options and explain briefly your reasoning
� None, because…………………………………………..
� 1, namely ……………………………………………...
� Less than 200, because…………………………….…...
� More than 200, because …………………...…………...
6. How many decimal numbers can you find in between 0.899 and
0.90? Tick one of the options and explain briefly your reasoning
� None, because…………………………………………..
� 1, namely ……………………………………………...
� Less than 200, because…………………………….…...
� More than 200, because …………………...…………...
Observe density
property of decimals,
i.e. there are
infinitely many
decimals in between
two decimals
Density of
decimals

Appendix B2
Written Test item Rationale for
item
Concept
7. Write the decimal numbers pointed by the arrows A and B in the
corresponding boxes. Explain briefly how do you find the
answers.
8. Write the decimal numbers pointed by the arrows A and B in the
corresponding boxes. Explain briefly how do you find the
answers.
Locate the decimals
on the number line
and gain information
about the thinking
process
Decimals on
the number
line
9. Mark the position of the following decimal numbers in the number
line: -0.9 ; -0.45 ; 0.15; 1.4
Recognise the
position of decimals
(including negative
decimals) on the
number line
Decimals on
the number
line
10. Tick the decimal number which is closest to 3.0751
� 3.075001 � 3.0715 � 3.075 � 3.751
11. Tick the decimal number which is closest to 0.10793
� 0.10691 � 0.107 � 0.10693 � 0.1069
Recognise place
value in determining
the closeness of two
decimals
Place value
12. Santi were asked by her mother to buy some 1 kg milk powder
for her baby sister. The store only sell the milk in package of 400
grams, so how many packages does Santi need buy to fulfil her
mother request?
Recognise decimals
in time units. Multiplicatio
n and
addition of
decimals
13. To travel by plane from Jakarta to Yogyakarta takes 1.5 hours. If
the plane leaves Soekarno Hatta airport in Jakarta at 17:45, what
time will the plane arrive in Yogyakarta, assuming there is no
delay in the flight schedule?
Recognise the
conversion of
decimals involving
metric measurements
Multiplicatio
n and
division of
decimals in
daily life
contexts
14. Tanti bought a package of 0.250 kg red beans in the supermarket.
If one kilogram red bean costs 9900 rupiahs, how much did Tanti
need to pay?
Recognise the
conversion of
decimals involving
metric measurements
Multiplicatio
n of decimals
by 1000
15. Hani bought 10 cans of 330 mills coke of different flavours for a
farewell party with friends. How many litres coke in total did
Hani buy?
Recognise the
conversion of
decimals involving
Multiplicatio
n of decimals
by 10
-1 0 1 2
3.0 3.1 3.2
A B
A
A =
B =
Explanation………………………………………………
…………………………………………………….………
……………………………………………………………
C =
D =
Explanation………………………………………………
…………………………………………………….………
……………………………………………………………
1.0 1.1 1.2
D C

Appendix B2
Written Test item Rationale for
item
Concept
metric measurements
16. The distance between two cities is 21.7 km. What is the distance
of those two cities on the map whose scale is 1: 100,000? With
this scale, 1 distance unit represents 100,000 on the ground.
Recognise the
conversion of
decimals involving
metric measurements
Division of
decimals by
power of 10
Part C
17. What is your idea of teaching your students to find the larger
number between 0.7777 and 0.770?
Observe ideas for
teaching comparison
of decimals
Place value
and
magnitude
of decimals
18. How will you teach your students to divide 0.3 by 100? Ideas to link division
of decimals with
meaningful ideas for
teaching it
Division of
decimals by
100
19. Responding to a problem of ordering decimal numbers 0.63 ;
0.66666, and 0.6; a student answered 0.66666 < 0.63 < 0.6. In
your opinion, what is the thinking behind this student’s answer?
How would you help this student to understand it?
Diagnose
misconceptions in
ordering decimals and
find ideas to resolve it
Place value
and
magnitude
of decimals
20. How will assist your students in converting 1/6 into decimal
number?
Observe ideas in
explaining the
relationship between
common fractions
and decimals
Common
fractions and
infinite
recurring
decimals

Appendix B3
Appendix B3: Pre-course Interview Protocols Cycle 1
Pre-course interview items Rationale
1. How did your teacher introduce the decimal number
to you, for example to introduce a decimal number
0.6? Were you given examples from real life? So if
you are teaching in primary school, what is your idea
of teaching/introducing decimal numbers such as
0.6? Do you have any idea of using a model to help
children learn decimals?
To learn pre-service teachers’ prior learning
experience, understanding of decimal notation and
ideas for introducing decimals in their future
teaching including ideas for using models.
2. How were you taught on how to multiply decimals
numbers by 10, for instance to do 2.05 × 10? How
would you teach 2.05 × 10 to your students? If a
student does not understand your explanation, how
would you help them? If your students still have
problems in understanding that, what will you do?
To gain insights about prior schooling experience
shapes pre-service teachers’ teaching ideas on
multiplication of decimals. It allows the researcher
to learn if knowledge on multiplication of
decimals is based on place value concept or more
on following standard procedures. Observe ideas
on the same topic for teaching.
3. How was your experience in learning addition of two
decimals, for example how did your teacher teach
you to add 1.8 and 1.31? Is the reason for lining up
the decimal comma explained to you? What are your
ideas to teach addition of decimals in the future?
To gain insights about pre-service teachers’
knowledge on addition of decimals, whether their
knowledge of lining up the decimal comma is
related to underlying notion of place value.
Observe teaching ideas on addition of decimals.
4. How did your teacher teach about rounding of
decimal numbers for example to round the number
23.4128 (or 23.4189) to two digits decimal numbers?
How would you teach rounding for your future
students? Do you have any new idea or use any
model to teach rounding?
To gain insights into pre-service teachers’
knowledge about rounding rules. Observe pre-
service teachers’ teaching ideas on rounding..
5. Could you identify three models that you can or may
use in helping students learn about decimals in
primary school? Explain how each model assists you
to understand a particular concept of decimals
better?
To inspect pre-service teachers ideas about the role
of models in teaching and learning decimals.
6. Would you explain how did you get this answer?
Can you think of another way to solve this problem?
(ask as follow up questions to items with error in the
pre-test.
These questions will confirm/investigate further
the thinking involved in solving problems.
Question will vary for different interviewees
depend on their responses in the pre-test.
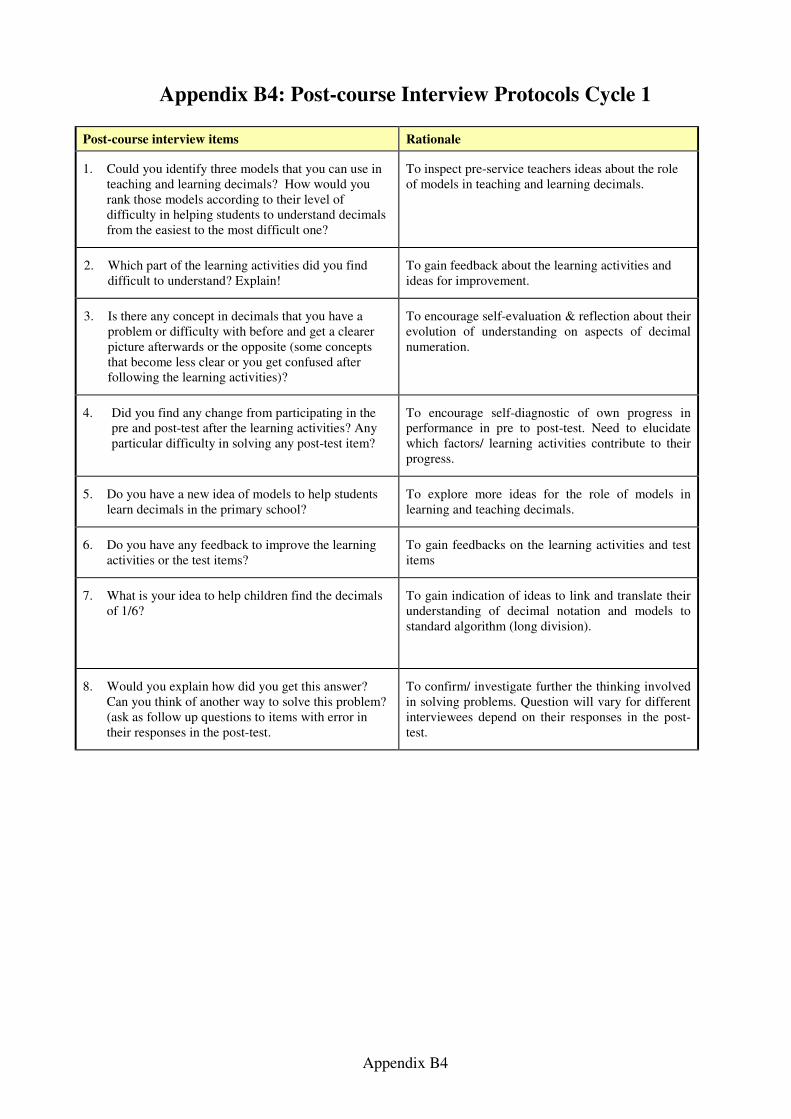
Appendix B4
Appendix B4: Post-course Interview Protocols Cycle 1
Post-course interview items Rationale
1. Could you identify three models that you can use in
teaching and learning decimals? How would you
rank those models according to their level of
difficulty in helping students to understand decimals
from the easiest to the most difficult one?
To inspect pre-service teachers ideas about the role
of models in teaching and learning decimals.
2. Which part of the learning activities did you find
difficult to understand? Explain!
To gain feedback about the learning activities and
ideas for improvement.
3. Is there any concept in decimals that you have a
problem or difficulty with before and get a clearer
picture afterwards or the opposite (some concepts
that become less clear or you get confused after
following the learning activities)?
To encourage self-evaluation & reflection about their
evolution of understanding on aspects of decimal
numeration.
4. Did you find any change from participating in the
pre and post-test after the learning activities? Any
particular difficulty in solving any post-test item?
To encourage self-diagnostic of own progress in
performance in pre to post-test. Need to elucidate
which factors/ learning activities contribute to their
progress.
5. Do you have a new idea of models to help students
learn decimals in the primary school?
To explore more ideas for the role of models in
learning and teaching decimals.
6. Do you have any feedback to improve the learning
activities or the test items?
To gain feedbacks on the learning activities and test
items
7. What is your idea to help children find the decimals
of 1/6?
To gain indication of ideas to link and translate their
understanding of decimal notation and models to
standard algorithm (long division).
8. Would you explain how did you get this answer?
Can you think of another way to solve this problem?
(ask as follow up questions to items with error in
their responses in the post-test.
To confirm/ investigate further the thinking involved
in solving problems. Question will vary for different
interviewees depend on their responses in the post-
test.

Appendix B5 - Pre-test cycle2 (Indonesian version)
Bagian A
Nama: _______________________________________________ Nomor mahasiswa: ______________________ Tanggal: ___________
Petunjuk: Untuk setiap pasangan bilangan di bawah ini, lingkarilah bilangan yang terbesar atau tuliskan tanda = diantaranya!
4,8 4,63 2,681 2,94 3,92 3,4813
0,74 0,8 0,41 0,362 0,374 0,2165
2,6 2,83 5,62 5,736 7,942 7,63
0,6 0,73 0,426 0,37 0,62 0,827
1,86 1,87 0,3 0,4 2,4 2,3
3,0 3 0,0 0 0,8 0,80000
4,08 4,7 3,72 3,073 0,3 0,03
3,72 3,07 8,052 8,514 0,0004 0,4
17,35 17,353 4,4502 4,45 0 0,6
4,666 4,66 3,7 3,77777 0,7 0,00

Appendix B5
Bagian B
Nama: _________________ ___________________________ Nomor mahasiswa:_______________
Program Studi: _______________________________________________________________________
1. Berilah tanda silang pada kotak yang tersedia untuk menandakan nilai dari 1 pada
bilangan desimal berikut:
a) 9,31? � seper-sepuluh � seper-seratus � seper-seribu � seper-sepuluhribu
b) 23,001? � seper-sepuluh � seper-seratus � seper-seribu � seper-sepuluhribu
c) 5,1064? � seper-sepuluh � seper-seratus � seper-seribu � seper-sepuluhribu
d) 2,318? � seper-sepuluh � seper-seratus � seper-seribu � seper-sepuluhribu
2. Isilah titik-titik di bawah sehingga didapat pernyataan yang benar sebanyak mungkin
anda bisa:
0,375 = …..… satu + ……… sepersepuluh + ……… seperseratus + ..…… seperseribu
0,375 = …..… satu + ……… sepersepuluh + ……… seperseratus + ..…… seperseribu
0,375 = …..… satu + ……… sepersepuluh + ……… seperseratus + ..…… seperseribu
0,375 = …..… satu + ……… sepersepuluh + ……… seperseratus + ..…… seperseribu
3. Tuliskan notasi desimal untuk masing-masing bilangan berikut:
a) 2 satuan + 6 persepuluhan + 15 perseratusan + 3 perseribuan = ………. ……………..
b) 0 satuan + 7 persepuluhan + 1 perseratusan + 12 perseribuan = ………. ……………..
4. Tuliskan tiga bilangan selanjutnya untuk setiap barisan bilangan berikut:
a) 1,092 ; 1,094 ; 1,096 ; …………… ; ….………….. ; …………...
2. 1,125 ; 1,25 ; 1,375 ; …….……. ; …………….... ; ……….…..
5. Berapa banyak bilangan desimal antara 3,14 dan 3,15? Berilah tanda silang pada salah
satu pilihan berikut dan jelaskan secara singkat alasan anda.
� Tidak ada, karena………………………………………………………………………………..
� 1, yaitu ………………………………………………………………………………………….
� Kurang dari 200, karena ……….………………………………………………………..........
� Lebih dari 200 tapi berhingga banyaknya karena…………...……………………………...
� Tak berhingga banyaknya ……………………………………………………………………
6. Berapa banyak bilangan desimal di antara 0,799 dan 0,80? Berilah tanda silang pada
salah satu pilihan berikut dan jelaskan secara singkat alasan anda
� Tidak ada, karena ………………………………………………………………………….. ...
� 1, yaitu …………………………………………………………………………….....................
� Kurang dari 200, karena ............................................................................................................
� Lebih dari 200 tapi berhingga banyaknya karena ……………...………………………….
� Tak berhingga banyaknya…………………………………………………………………….

Appendix B5
7. Tuliskan bilangan desimal yang bersesuaian pada kotak yang tersedia.
8. Tuliskan bilangan desimal yang bersesuaian pada kotak yang tersedia.
9. Berilah tanda panah untuk menunjukkan posisi bilangan desimal berikut pada garis
bilangan: -1,2 ; -0,5 ; 1,6 ; 0,25.
10. Berilah tanda silang pada bilangan desimal yang terdekat dengan 8,0791
� 8,08 � 8,0917 � 8,709 � 8,079001
Jelaskan bagaimana anda mendapat jawaban ini!
…………………………………………………………………………………………………………
…………………………………………………………………………………………………………
11. Berilah tanda silang pada bilangan desimal yang terdekat dengan 0,55
� 0,56 � 0,551 � 0,6 � 0,5511
Jelaskan bagaimana anda mendapat jawaban ini!
…………………………………………………………………………………………………………
………………………………………………………………………………………………………..
0 -1 1 2
B
……...…………………………………………………………………………………………………………
……………………………………………………..…….……………………………………………………
………………………………..…...…………………………………………………………………………
……………………………………………………………………………………………………………….
A =
B =
Penjelasan
A
2,1 2,2 2,0
D
. C
……...……………………………………………………………………………………………………………
…………………………..…….…………………………………………………………………………………
…...…...…………………………………………………………………………………….……………………
……………………………………………………………………………………………………………………
2,0
C =
D =
Penjelasan 2,1 2,2

Appendix B5
12. Ratna membutuhkan waktu 0,25 jam untuk berangkat ke sekolah dengan menggunakan
bis. Jika Ratna berangkat dari rumah pukul 7:45 pagi, pukul berapakah Ratna akan tiba
di sekolah?
……………………………………………………………………………………………………
……………………………………………………………………………………………………
…………………………………………………………………………………….………………
………………………………………………………………….………...….................................
13. Ani ingin membuat kue untuk ulang tahun sahabatnya Nina. Berdasarkan buku resep
yang dipakainya, untuk membuat satu loyang kue, Ani memerlukan 1,25 kilogram
tepung. Karena toko tempat Ani berbelanja hanya menjual tepung dalam kemasan 100
grams, berapa banyak kemasan yang perlu dibeli oleh Ani?
……………………………………………………………………………………………..………
…………………………………………………………………………………………..…………
………………………………………………………………………………...………..…………
…………………………………………………………………………........................................
14. Bayu membeli 10 botol coca-cola kemasan 1,25 liter untuk acara piknik bersama teman-
teman. Berapa liter keseluruhan coca-cola yang dibeli oleh Bayu?
….………………………………………………………………………………….………...….….
..……………………………………………………………………………………………………
……………………………………………………………………………………………...………
…………………………………………………………………………………………………….

Appendix B5
Bagian C
15. Jelaskan gagasan anda mengajarkan siswa di Sekolah Dasar menemukan bilangan
yang lebih besar dari 0.8 dan 0.8888. Sebutkan alat peraga atau model yang dapat anda
gunakan dalam gagasan anda (jika ada).
….………………………………………………………………………………….………...….….
..……………………………………………………………………………………………………
……………………………………………………………………………………………...………
……………………………………………………………………………………………………..
16. Saat ditanya bagaimana membagi 0,5 dengan 100, seorang siswa menjelaskan dengan
menggeser koma sebanyak dua angka desimal sehingga mendapat 0,005.
a) Apakah menurut anda ide siswa tersebut benar? Mengapa?
b) Jika anda berpikir bahwa penting bagi siswa untuk dapat menalar gagasan
daripada sekedar mengingat rumus, bagaimana gagasan anda untuk menjelaskan
0,5 dibagi 100 dengan cara yang lain?
….………………………………………………………………………………….………...…..…
...……………………………………………………………………………………………………
……………………………………………………………………………………………..………
…………………………………………………………………………………………...…………
………………………………………………………………………………………..……………
17. Menanggapi permasalahan mengurutkan bilangan desimal 0,34 ; 0,33333 dan 0,3 ;
seorang siswa menjawab demikian 0,3 < 0,34 < 0,33333.
a) Menurut pendapatmu, gagasan apa yang membuat siswa menjawab demikian?
b) Bagaimana idemu untuk membantu siswa ini untuk mengerti hal tersebut?
….………………………………………………………………………………….………...…..…
...……………………………………………………………………………………………………
……………………………………………………………………………………………...………
…………………………………………………………………………………………..…………
………………………………………………………………………………………..……………
……………………………………………………………………………………..………………
18. Ketika diminta untuk menyelesaikan 3
1× 100000, Tata menjawab
3
1× 100000 = 33000.
a) Apakah anda setuju dengan jawaban Tata?
b) Bagaimana gagasan anda sebagai guru membantu Tata?
.………………………………………………………………………………….………...……...
…………………………………………………………………………………………………..…
……………………………………………………………………………………………............
…………………………………………………………………………………………………..…
………………………………………………………………………………………………..……
……………………………………………………………………………………………..………
Terima kasih

Appendix B6: Post-test cycle 2 Part A, B and C (Indonesian version)
Bagian A
Nama: _________________________________________ Nomor mahasiswa: ______________________ Tanggal: ___________
Petunjuk: Untuk setiap pasangan bilangan di bawah ini, lingkarilah bilangan yang terbesar atau tuliskan tanda = diantaranya!
1,9 1,74 1,1503 1,15 0 0,7
0,81 0,9 3,792 3,81 0,8 0,00
3,7 3,94 0,72 0,673 4,63 4,1924
0,7 0,84 5,73 5,847 0,481 0,3275
1,777 1,77 0,737 0,68 8,813 8,74
2,97 2,98 4,8 4,88888 0,73 0,938
4,0 4 0,7 0,6 0,9 0,90000
1,09 1,8 0,00 0 3,7 3,6
4,83 4,08 4,83 4,084 0,4 0,04
28,45 28,454 9,053 9,521 0,0006 0,6

Appendix B6
. Bagian B
Nama: _________________ ___________________________ Nomor mahasiswa:_______________
Program Studi: _______________________________________________________________________
1. Berilah tanda silang pada kotak yang tersedia untuk menandakan nilai dari 1 pada
bilangan desimal berikut:
a) 9,31? � seper-sepuluh � seper-seratus � seper-seribu � seper-sepuluhribu
b) 23,001? � seper-sepuluh � seper-seratus � seper-seribu � seper-sepuluhribu
c) 5,1064? � seper-sepuluh � seper-seratus � seper-seribu � seper-sepuluhribu
d) 2,318? � seper-sepuluh � seper-seratus � seper-seribu � seper-sepuluhribu
2. Isilah titik-titik di bawah sehingga didapat pernyataan yang benar sebanyak mungkin
anda bisa:
0,375 = …..… satu + ……… sepersepuluh + ……… seperseratus + ..…… seperseribu
0,375 = …..… satu + ……… sepersepuluh + ……… seperseratus + ..…… seperseribu
0,375 = …..… satu + ……… sepersepuluh + ……… seperseratus + ..…… seperseribu
0,375 = …..… satu + ……… sepersepuluh + ……… seperseratus + ..…… seperseribu
3. Tuliskan notasi desimal untuk masing-masing bilangan berikut:
a) 2 satuan + 6 persepuluhan + 15 perseratusan + 3 perseribuan = ………. ……………..
b) 0 satuan + 7 persepuluhan + 1 perseratusan + 12 perseribuan = ………. ……………..
4. Tuliskan tiga bilangan selanjutnya untuk setiap barisan bilangan berikut:
a) 1,092 ; 1,094 ; 1,096 ; …………… ; ….………….. ; …………...
b) 1,125 ; 1,25 ; 1,375 ; …….……. ; …………….... ; ……….…..
5. Berapa banyak bilangan desimal antara 3,14 dan 3,15? Berilah tanda silang pada salah
satu pilihan berikut dan jelaskan secara singkat alasan anda.
� Tidak ada, karena………………………………………………………………………………..
� 1, yaitu ………………………………………………………………………………………….
� Kurang dari 200, karena ……….………………………………………………………..........
� Lebih dari 200 tapi berhingga banyaknya karena…………...……………………………...
� Tak berhingga banyaknya ……………………………………………………………………
6. Berapa banyak bilangan desimal di antara 0,799 dan 0,80? Berilah tanda silang pada
salah satu pilihan berikut dan jelaskan secara singkat alasan anda
� Tidak ada, karena ………………………………………………………………………….. ...
� 1, yaitu …………………………………………………………………………….....................
� Kurang dari 200, karena ............................................................................................................
� Lebih dari 200 tapi berhingga banyaknya karena ……………...………………………….
� Tak berhingga banyaknya…………………………………………………………………….

Appendix B6
7. Tuliskan bilangan desimal yang bersesuaian pada kotak yang tersedia.
8. Tuliskan bilangan desimal yang bersesuaian pada kotak yang tersedia.
9. Berilah tanda panah untuk menunjukkan posisi bilangan desimal berikut pada garis
bilangan: -1,3 ; -0,35 ; 1,4 ; 0,75.
10. Berilah tanda silang pada bilangan desimal yang terdekat dengan 3,0751
� 3,075001 � 3,0715 � 3,075 � 3,751
Jelaskan bagaimana anda mendapat jawaban ini! ……………………………………………………………………………………………………
……………………………………………………………………………………………………
11. Berilah tanda silang pada bilangan desimal yang terdekat dengan 0,10692
� 0,10691 � 0,107 � 0,10693 � 0,1069
Jelaskan bagaimana anda mendapat jawaban ini! ……………………………………………………………………………………………………
……………………………………………………………………………………………………
0 -1 1 2
D
. C
……...……………………………………………………………………………………………………………
…………………………..…….…………………………………………………………………………………
…...…...…………………………………………………………………………………….……………………
……………………………………………………………………………………………………………………
3,0
C =
D =
Penjelasan 3,1 3,2
B
……...…………………………………………………………………………………………………………
……………………………………………………..…….……………………………………………………
………………………………..…...…………………………………………………………………………
……………………………………………………………………………………………………………….
A =
B =
Penjelasan
A
3,1 3,2 3,0

Appendix B6
12. Santi diminta ibu membeli susu bubuk formula bayi Entamil untuk adiknya sebanyak 1
kg. Kebetulan kemasan susu 1 kg habis dan hanya tersedia kemasan 400 gram, berapa
banyak kemasan susu yang harus dibeli Santi agar cukup sesuai pesanan ibu?
……………………………………………………………………………………………………
……………………………………………………………………………………………………
…………………………………………………………………………………….………………
………………………………………………………………….………...…................................
13. Diketahui lama perjalanan dari Jakarta ke Yogyakarta memerlukan waktu selama 1,25
jam. Jika pesawat meninggalkan bandara Soekarno Hatta Jakarta pada pukul 17:45,
pukul berapakah pesawat tersebut akan tiba di Yogyakarta?
…………………………………………………………………………………………………..…
………………………………………………………………………………………………..……
……………………………………………………………………………………………..………
……………………………………………………………………………………………………
14. Hani membeli 100 kaleng fanta kemasan 330 mililiter dengan aneka rasa untuk pesta
perpisahan bersama teman-teman. Berapa liter keseluruhan fanta yang dibeli oleh Hani
jika diketahui 1 liter = 1000 mililiter.
….………………………………………………………………………………….………...….….
..……………………………………………………………………………………….……..……
……………………………………………………………………………………………….….…
……………………………………………………………………………………………….……

Appendix B6
Bagian C
15. Jelaskan gagasan anda mengajarkan siswa di Sekolah Dasar menemukan bilangan ynag
lebih besar dari 0,7777 dan 0,770. Sebutkan alat peraga atau model yang dapat anda
gunakan dalam gagasan anda (jika ada).
….………………………………………………………………………………….………...….….
..……………………………………………………………………………………….……………
………………………………………………….….…………………………...…………………
………………………………………………..………………………...…………………………
…………………………………………………..…………………...……………………………
………………………………………………………………….….………………………………
………………………………………………….………...….…...………………………………
16. Saat ditanya bagaimana membagi 0,3 dengan 100, seorang siswa menjelaskan dengan
menggeser koma sebanyak dua angka desimal sehingga mendapat 0,003.
a) Apakah menurut anda ide siswa tersebut benar? Mengapa?
b) Jika anda berpikir bahwa penting bagi siswa untuk dapat menalar gagasan daripada
sekedar mengingat rumus, bagaimana gagasan anda untuk menjelaskan 0,3 dibagi
100 dengan cara yang lain?
….………………………………………………………………………………….………...…..…
...……………………………………………………………………………………………………
.…………………………………………………………………………………………..…………
.………………………………………………………………………….....…………...…...……
…………………………………………………………………………………………..…………
17. Menanggapi permasalahan mengurutkan bilangan desimal 0,63 ; 0,66666 dan 0,6 ;
seorang siswa menjawab demikian 0,66666 < 0,63 < 0,6.
a) Menurut pendapatmu, gagasan apa yang membuat siswa menjawab demikian?
b) Bagaimana idemu untuk membantu siswa ini untuk mengerti hal tersebut?
….………………………………………………………………………………….………...…..…...…
………………………………………………………………………………………………….………
………………………………………………………………………………….....……………………
……………………………………………………………………………..……………………………
……………………………………………………………………..……………………………………
……………………………………………………………..……………………………………………
18. Ketika diminta untuk menyelesaikan 7
1× 100000, Tata menjawab
7
1× 100000 = 14000.
a) Apakah anda setuju dengan jawaban Tata?
b) Bagaimana gagasan anda sebagai guru membantu Tata?
…………………………………………………………………………………………………..….…
………………………………………………………………………………………………………...
...………………………………………………………………………………….…
…………………………………………………………………………………………………..….…
………………………………………………………………………………………………………...
……...……...…………………………………………………………………………
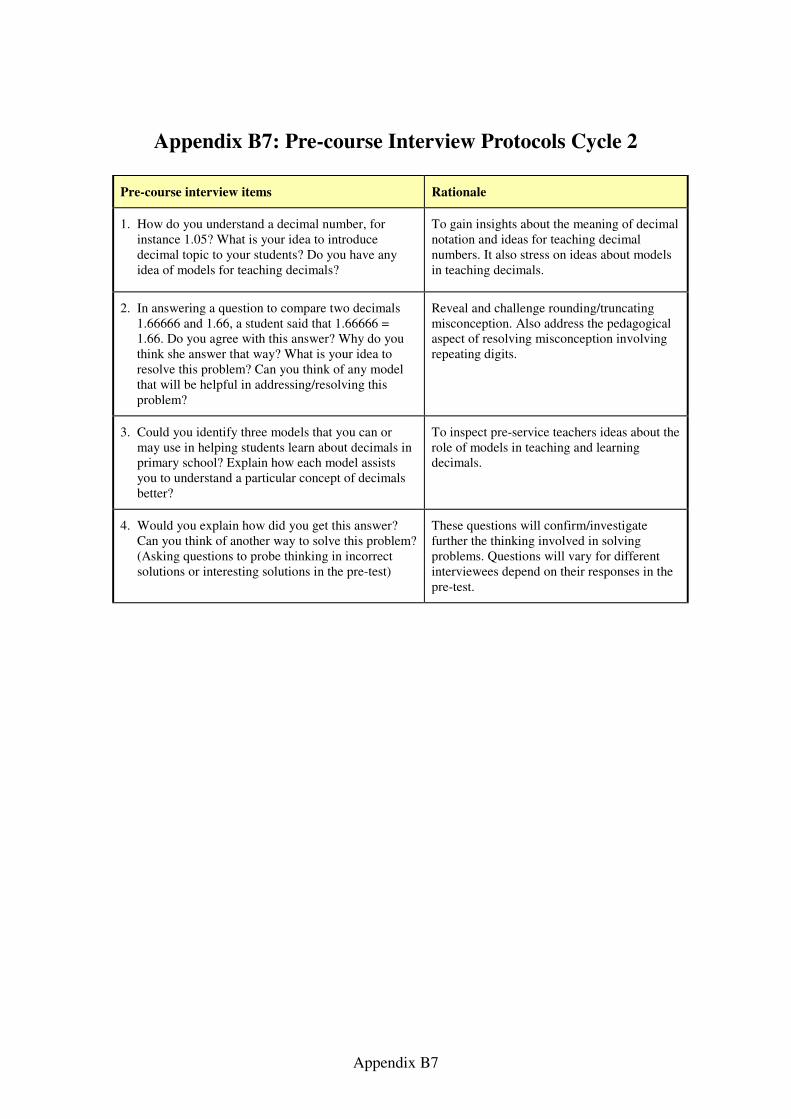
Appendix B7
Appendix B7: Pre-course Interview Protocols Cycle 2
Pre-course interview items Rationale
1. How do you understand a decimal number, for
instance 1.05? What is your idea to introduce
decimal topic to your students? Do you have any
idea of models for teaching decimals?
To gain insights about the meaning of decimal
notation and ideas for teaching decimal
numbers. It also stress on ideas about models
in teaching decimals.
2. In answering a question to compare two decimals
1.66666 and 1.66, a student said that 1.66666 =
1.66. Do you agree with this answer? Why do you
think she answer that way? What is your idea to
resolve this problem? Can you think of any model
that will be helpful in addressing/resolving this
problem?
Reveal and challenge rounding/truncating
misconception. Also address the pedagogical
aspect of resolving misconception involving
repeating digits.
3. Could you identify three models that you can or
may use in helping students learn about decimals in
primary school? Explain how each model assists
you to understand a particular concept of decimals
better?
To inspect pre-service teachers ideas about the
role of models in teaching and learning
decimals.
4. Would you explain how did you get this answer?
Can you think of another way to solve this problem?
(Asking questions to probe thinking in incorrect
solutions or interesting solutions in the pre-test)
These questions will confirm/investigate
further the thinking involved in solving
problems. Questions will vary for different
interviewees depend on their responses in the
pre-test.

Appendix B8
Appendix B8: Post-course Interview Protocols Cycle 2
Post-course interview items Rationale
1. Could you identify three models that you can use in
teaching and learning decimals? How would you rank
those models according to their level of difficulty in
helping students to understand decimals from the
easiest to the most difficult one?
To inspect pre-service teachers ideas about the role
of models in teaching and learning decimals.
2. Is there any concept in decimals that you have a
problem or difficulty with before and get a clearer
picture afterwards or the opposite (some concepts that
become less clear or you get confused after following
the learning activities)?
To encourage self-evaluation & reflection about their
evolution of understanding on aspects of decimal
numeration.
3. Did you find any change from participating in the pre
and post-test after the learning activities? Any
particular difficulty in solving any post-test item?
To encourage self-diagnostic of own progress in
performance in pre to post-test. Need to elucidate
which factors/ learning activities contribute to their
progress.
4. In answering a question to compare two decimals
1.66666 and 1.66, a student said that 1.66666 = 1.66.
Do you agree with this answer? Why do you think she
answer that way? What is your idea to resolve this
problem? Can you think of any model that will be
helpful in addressing/resolving this problem?
To reveal and challenge rounding/truncating
misconception
To address the pedagogical aspect of resolving
misconceptions involving decimals with repeated
digits.
5. Would you explain how did you get this answer? Can
you think of another way to solve this problem?
(Asking questions to probe thinking in incorrect
solutions or interesting solutions in the post-test).
To confirm/ investigate further the thinking involved
in solving problems. Question will vary for different
interviewees depend on their answers in the post-test.

Appendix C
Appendix C1: Excerpts from trial of Set 1 activities with volunteer pre-service teachers
in Melbourne
Appendix C2: Samples of pre-course interview from cycle 1
Appendix C3: Samples of post-course interview from cycle 1
Appendix C4: Table of responses to Initial Activity Set 1 Activity 1 in cycle 2

Appendix C1
Appendix C1: Excerpts from Trial of Activities with Volunteer
Pre-service Teachers in Melbourne on exploring the way to
label LAB pieces
Activity 1 - Wednesday March 30, 2005
If we agree to name this longest piece a rod, how would you label the other pieces to
reflect the relationships among those pieces to a rod.
Students
J Do we have to name the other pieces?
M We have to make up the names in relation to the rod.
R It is not exactly one meter, yeah we don’t know. Just call this a rod
M A deci
J But doesn’t go with a rod, right?
M Ehm, yeah
J A straw… a rod.. a… a
M So what we are going to. So these will be a little, mini littles aren’t they?
We need to observe the relationships
J Can we write on this? That’s okay. So I’m going to write one tenth of a rod.
R Yeap, that’s good.
J And how many are
M There’ll be a tenth of this, so a hundred of a rod
L I think a hundredth , a hundredth of the smaller pieces
J So a hundredth
M This will be a thousandth
J Thousandths
M That’s why they make up
J We need to give them names ….a rod… a length
R I think that can be considered a name, just like this one yeah
J Oh that can be considered name, yeah
L Can be considered name yeah
M So we don’t have to think of decis, milis, so we don’t have to worry
R If you want to write it like that is also another option
M I said, a milli, decis, and …what did I say for hundredths?
R Decis, millis, I miss the other one.
M Decis, milli, and a centi
J I don’t understand your thinking but that’s okay. No yeah
M I am just trying to work what’s for a hundredth
R So okay
J We could call the smallest one a splinter.
R Okay, the next thing, we are going to use these pieces to measure the length of the
sides of the table.
J Oh okay
L This A, this is B right
R You can also use this one as a connector
J Which table are we going to measure? That one
M May be you want to measure the other side
J Which table are we going to measure?
L This one

Appendix C1
R May be that one
L It is the same
R Yeah, it is the same, you are right
J Okay, sorry…. one rod, we’ve got we need to gave them a name
L A name
J We’ll give the second one , a stick
M Or a deci, I’ve got deci, centi and mili
J a stick
L Yeah, This one can be
M Eh Just said what she said a tenth, just call it a tenth,
J Makes it easier if every piece has a name
L Yeah
J We call the smallest one a splinter, what should the middle one be? A stick
L Looks like pasta. What do you call for that… the snack for breakfast.
J The snackfood. A chessle, we can call it a chessle
L How do you spell it
J CHEESS
M No CHEEZLE
J CHEEZLE. Okay, so
J The last one is a SPLINTER
L So how do you spell it…. a SPLINTER
J Okay so we’ve got
J It is a rod plus a stick

Appendix C2
Appendix C2:
Samples of Pre-course Interviews cycle 1 grouped by questions
Question 1
How did your teacher introduce the decimals to you for the first time, for instance in introducing the decimals 0.6? Were you given examples from real life?
Student class Responses
susilo prim A So if you are teaching in primary school, what is your idea of teaching/ introducing decimal numbers such as 0.6 or 0.9? Do you have an idea of using a model to help children learn decimals?
hery prim A Yes, when I was in high school, I was introduced first introduced to fractions and then decimals. For example, 0.6 is one eh..six over ten. No model was used, directly from fraction, we were taught the concept first but I can't remember
yulius prim A Frankly, I was not good in mathematics so when the teacher taught me, I didn't pay attention. I was neither good nor interested in mathematics. As far as I can remember, we were learning slowly by doing exercises from the book which introduce the decimals. Then we were asked to memorize them. After that we were given exercises and asked to solve the exercises in front of the class.
adrian prim A We started from zero, and then after zero we continued first with fractions, for instance what is the tenth, and then the hundredth, and the thousandth. Directly, that a tenth is zero point one but I forgot whether the process of getting to zero point one was explained or not.
nita prim C It was by dividing the numerator with the denominator. Before we learnt multiplication and division an+A9d it was linked to fractions. I forgot whether we had models or pictures to learn decimals.
susi prim C As far as I remember the teacher often did not come to the class and we were taught only for instance how to add 0.25 and other numbers, there was no explanation about the process, and no manipulatives so for me it was abstract and not clear. Meanwhile we were in the pre-operational concrete stage so if we were given models or manipulatives, perhaps I would be able to understand it better or faster the topics.
ismi prim C I suppose when the teacher taught me decimals, I understood it well and if I had questions, I would ask him. For instance for 0.6, 0.6 is six tenths. If we have one digit after the decimal comma, it means that the number is tenths, and if there are two decimal digits it means that the number is hundredths, that is what I understand.
dian prim C Decimals is a number that is divided by ten or powers of 10, multiplied by 10 and powers of 10. Not sure of I understood, because I used to memorized it, like in doing multiplication. Well…. I don't really understand it but I remember the rules.

Appendix C2
aris prim C decimals are numbers with a comma. 0.6, decimals is a number which is divided by a hundred, right? (to my knowledge) the decimal is linked with division. Yes, use division.Using a ruler, this is zero and this is one for example. One... zero point one... oh it does not fit, change the interval to two (0.2) ... like this.
nana sec we can get 0.6 from 6/10. Back then, it was taught just by dividing 6 into 10. Because this is less than 10, then 0 is added and then this becomes zero and a comma then divide it by 6. Yes, I had difficulty for example with bigger number, there must be a problem. In the past, we were only taught that because we add a zero here then we need to add a zero here too.
yaya sec not sure if I remember, I think I forget, as far as I remember it is only 6 divided by 10 or 6/10, that is all. We write the number into tenths. As I recalled, the teacher never use any model in teaching decimals. In my memory, we were told that 6/10 equals to 0.6 and 6/100 would be 0.06, it depends on the divisors.b
novo sec For 0.6, my teacher used to teach starting from fractions. To find the decimal notation of 6/10 we just divide 6 by 10. For instance this is 6 and this is 10, because we cannot divide this, then we add 0 and then this is 6 so we get 0.6. In fact, I was not quite clear from fraction 6/10 and then because the comment that 6/10 cannot be divided. Decimals 0.6, what is it like, was difficult for me. It is still difficult to draw how long it is, is still difficult. (the model) using a ruler for instance, a ruler of 30 cm long and for example here is 2.6. Perhaps at first 6/10, since we already have a calculator, we can use a calculator and to find out what is 6 divided by 10 and the calculator will show 0.6
ayi sec As I remember decimals are the continuation of fractions. From fractions to convert to decimals, we need to bring the denominator into 10 or 100 when we started to introduce simple fractions such as 0.5. It is always linked with fractions. No, we have some word problems but I forgot how was it like.. difficult, but seems to me it is still related to fractions. For example in the word problems
Question 2
So if you are teaching in primary school, what is your idea of teaching/ introducing decimal numbers such as 0.6 or 0.9? Do you have an idea of using a model to help children learn decimals?
Student class Responses
nana sec perhaps through fractions and then using division but I am also confused why we can add a zero here and a zero there because it was given like that. Perhaps also with telling a story, yeah perhaps like before. A story like mom has one loaf of bread which she would like to divide to four kids so each will get a quarter. So if the bread is divided for four kids meaning that the bread need to be sliced into four parts.

Appendix C2
novo sec For me, I prefer to use a ruler. I think it is more easy for children to comprehend, like this is 2 centimeter and 6 milimetre for children it will be easier to understand that using a ruler. (for you, why do you think the division algorithm is difficult?) because when the child first divide 6 by 10, it is said that it can't then we do this (note: adding a zero after 1). The we have 6 becomes 60 nad this is 0 and then we add a comma, the student might have a problem in understanding that. The teacher used to teach that because 6 can't be divided into 10 then we add 0 here and then we add a comma here. The from 6 to multiply 6 by 10 to get 60 so now it can be divided by 10 and get 6. The teacher only told us that that is the way so I just follow the teachers' way.
ayi sec to be honest, for me when I answered it I knew the answers but to explain it to students, I don't know. First I will introduce what is decmials. First by using fractions, based on my understanding, we need to start with fractions then I will introduce decimals
nita prim C for me, mathematics is difficult and I don't quite understand decimal either. What can I say? I don't really know how to convert from decimals to fractions but from fractions to decimals, for instance 0.6 is six tenths with long division perhaps. Divide both the numerator and denominatro by 10 so 6 can't be divided by 10 therefore we add 0, so the answer will have a comma, 60 divided by 10 is 6 and 6 times 10 is 60. Perhaps like this, 6 parts divided into 10 people, how was that? Before, it is divided into 6 and then divided again into 10 parts.
ismi prim C to be honest, for me when I answered it I knew the answers but to explain it to students, I don't know. First I will introduce what is decmials. First by using fractions, based on my understanding, we need to start with fractions then I will introduce decimals and then combine those two. Perhaps we can use their daily experiences, for primary school children, using word problems will be easier. For example sharing a cake. One cake is divided for several students for example there is one cake and there are 10 children then we just need to divide one cake into 10. One part is a tenth so if we are asked .. if each child gets a tenth of one, then how many are .. for instance there are four children. Four children means.. eh.. it means that there are ten cakes, then if each child gets 2 cakes, then the total is 8 and we have 2 left over. Then we divide 2 into 4 children and each gets two and a half.

Appendix C2
dian prim C Well.. Clearly not using memorization but to date I haven't been able to explain it to students, I am afraid of sharing misconceptions. Using concrete materilas, and posing questions until the students get to their own understanding, discovering themselves. For instance, using a cake as an example...but a cake is more to help learn with fractions and not decimals. For decimals, we can multply the numbers by tenths. (With the cake) well 0.6 means we have to find.. like if we need to find percents.. how much is 0.6 of 1 so we divide the cake into equal pieces.. from one.. multiply it by six tenths of it, so... how many parts right... probably six parts... I don't know, I weak at mathematics
aris prim C with division of whole numbers.
susilo prim A Clearly I won't use the same approach my teacher used before because I feel that my teacher gave lots of examples but we don't really know how we can apply them in real life. So I will try to use method different than what my teacher used to apply in the classusioom. Possibly I will try to make students build an understanding of fractions first because decimals is related to fractions. Students need to understand what fractions are, how to do operations with fractions. for instance, a fraction 1/2, what 1/2 looks like? I will give them a model, divided into two and then how to convert a fraction 1/2 into decimal and how to do it.
hery primA well, perhaps using another media so that stundets can understand more, not just know the concept. I haven't had an idea yet. Perhaps introduce the concept and then assist them using media but haven't exactly have a fixed media in my mind
yulius prim A teaching decimals by writing it in a small piece of paper to be introduced to students, and then ask students to come up in the front of the class and choose which one of the numbers. Using a piece of paper and then cut them into few parts from 0.1 to 0.4 and then ask students to infroduce the decimals from the smallest to the largest.
adrian prim A perhaps like what I said before, for instance 0.6 means 6/10. Because this is 10 then we have one zero so directly we will have 0.6. For fraction I have an idea about models like half a circle can represent a half but for decimals, it was introduced directly (in symbolic forms). We can use half a circle and it is 0.5 Yes, it is the same.

Appendix C2
Question 3
How were you taught to multiply decimals with 10, for instance to multiply 2.05 and 10? Did your teacher explain why do you have to count and move the decimal comma?
Student class Responses
susilo prim A directly using an algorithm like this, we mutliply .. One … then the comma depends on the number of digits after the decimal comma. Because 10 does not have a decimal comma … and if there are 2 digits after the decimal comma in this decimal, then to count, we count one, two from the back. Because we have been taught about multiplication of whole numbers with algorithm so it is easy to multiply. It is only because there are decimal commas, .. the teacher directly taught that if there are two digits after the decimal comma, then the answer will also have two digits after the decimal comma. We do the multiplication the same as we did for whole numbers and then just count the digits after the decimal comma. For instance if we have two here, zero zero then we add two and two so we have four. No, we were not explained the reasons, just follow teachers' way.
hery prim A In the past, it was easy, because this is 10, then… we just need to move the comma in front one step. Perhaps based on calculation only, we will get this but manually we can just move the decimal comma if we multiply. If we are dividing then we move the decimal comma in front. No, we are not told the reason because we are only in elementary school but in highschool it was not explained because we already knew decimals.
aris prim C 2.05 multiply by 10, you just multiply them like whole numbers.. It is the same as 205 times 10 yeah the whole numbers mutliplication but here you can find the comma from here. There are two digits so one, two, here it is. No I wasn't told the reason just like that.
dian prim C direct way, just multiply 10 by 2.05. two point zero five, we multiply the digit one by one and then order them and write the number then we figure out how many digits after decimal comma. My teacher only told me that the decimal digits in the result of the multiplication is the same as the decimal digits in the number we multiply.
susi prim C I can't remember
ismi prim C for me, mostly I used a direct way… but to explain it to students, I am not sure.. My teacher used to teach me that if we multiply by 10, just move the decimal comma one. For instance 1.05 multiply by 10 meaning the 0 is moved to this. If for example, it is multiplied by 100 then we move the decimal comma here. The explanation is 1.05 equals to 105 hundredths, because it has two digits after a decimal comma, we just need to multiply it by 10, it means that we can cross this which means that the result is 105 tenths and 105 tenths is the same as 10.5 because it is tenths. Tenths means that we

Appendix C2
move the decimal comma in this direction.
nana sec with multiplication algorithm. It is similar to addition of decimals but here we don't have to line up the decimal comma then to determine where the decimal comma is, we count how many digits are there after the decimal comma and correspond it with the decimal comma of the result. My teacher explained the reason but I forgot. In principle, if we multiply 2.05 by 1.5 for example, we don't need to line up the decimal comma but the important thing is to count the number of digits after the decimal comma. I am still confused why we need to line up the decimal comma when for addition but not need to do it for multiplication?
novo sec it is like this, this is the same as 205 divided by 100 and multplied by 10 so if we multiply 205 and 10, we get 2050 and then divided by 100, the answer will be 20.5. So first I convert the number into fraction, multiply it and then divide it using division algorithm. I have no problem with this approach because before I already learnt about fractions. It starts with fractions and then how to convert fractions into decimals. From decimals, we possibly can.. of course we can convert from decimals into fractions. When we study fractions, we learn about operation with fractions and other whole numbers. That 10 is whole number so we can understand it easily.
ayi sec the simplest way that I can remember is by moving the decimal comma. If we mutliply by 10 then the value wuill increase by 10 imes so we just need to move the decimal comma for one place. I think it is related to multiplication algorithm but I used to have problems mutliplying with zeros so I had problems with multiplying numbers with commas and zeros but then I was taught this way and the one that I remembered the most is moving decimal comma strategy. I think the explanation is given because for instance, 2.05 equals to 205 hundredths and if it is multiplied by 10 then the simpler way is to conver it to 205/10 and two hundred and five tenths equals to 20.5.
Question 4
What is your own idea of teaching multiplication of decimal with 10?
Student class Responses
susilo prim A perhaps because I don't know decimals in real life, perhaps I just use the same way as my teachers.
yulius prim A Probably I will use th same approach as my teahers' ecause that is the only way I know. Perhaps one day if I am teaching my own students.. I will try my best to seek assistance except this way, because I should be able to help children so that can learn better than me. Try to learn harder. Now I still had obstacles. Last semester I used to ask my lecturer and friends but up to now, I am still having problems, haven't resolved my lack of knowledge

Appendix C2
adrian prim A yeah the same like this. If we have two decimal digits meaning that we have hundredths, just like that. . To help children who have difficulty, we can explain that 2.05 means that 205 hundredths and when we multiply it by 10, then we cross this one and this one and then get 205/10 or 20.5. Explain it again if the students still don't understand.
nita prim C perhaps just by moving the decimal comma. If we use this (refer to mutliplication algorithm) the students might find it difficult. What I mean by moving the decimal comma is we move the decimal comma to the right for multiplication and to the left for division. Because if we are multiplying 2.05 and 10, if we multiply by 10 it means that 2.05 ten times so it will get bigger whereas if we divide it, it will get smaller. Therefore if we multiply by 10, 100, or 1000 , the value will get bigger and the comma should be moved to the right.
susi prim C I have no idea yet, still difficult for me
ismi prim C the students need to understand fractions very well. I still have a vague idea how to helo students. I am still struggling when we are asked to explain it to students.
nana sec When I teach, since I don't really know how to explain why the rules apply. I am confused what is exactly the reason. No idea yet.
ani sec perhaps using this, because children might not understand why the comma is moved. With moving decimal comma rules, we can use it if we still have many problems to solve and we are in the rush. My understanding is perhaps we start from this hundred, because for example this 0 is a hundredth then it follows from that.
yaya sec Ehm… how should I do it… the same perhaps. For instance, this is 2.00 if it is multiplied by 10 then it cannot be 2.00 or 200 that would be wrong. So the comma needs to be moved only one place behind.
novo sec for instance if we go for the easy way, if we multiply 2.05 by 10 then we can tell the students that if we multiply the number by 10 , we need to move the decimal comma one place to the right, that is all. How to give meaning to this rule, well I don't know, it is difficult. My teacher didn't set the rules, no but first ask to convert decimals into fractions and then multiply it by 10. After students have enough practice then they are given tips or methods to solve the problems faster by moving the decimal comma. By decomposing 2.05 into 2 plus 0.0 plus 0.05 and then multiply them by 10. This becomes 2 multiplied by 10 plus 0.0 multiplied by 10 plus 0.05 multiplied by 10.
ayi sec No idea. From the process at that time, perhaps because I am still confused with division algorithm using simple numbers so this becomes difficult. As soon as I understand the mutliplication algorithm then eventhough there are zeros in the middle before the comma but I can understand it, so that is the basic.

Appendix C2
PreQ9 pretest questions - different items asked for different students depend on their responses to the tests and try to explicate their thoughts
Student class DCT3a Comparison Test
yulius prim A perhaps my principle last time was if 0.0 means that it has other digit behind and 0 is a whole number so one possibility that I can think of is that 0 is bigger than 0.6 because it has no decimal digit, just like that. The larger one is the one without a comma. That was what I remember.
yuliusus prim A because this one has more digits so I choose 4.45 as the larger
hery prim A 0 is the larger because 0.6 is six tenths and it tenths smaller than 0 because probably the value is smaller than 0.
hery prim A perhaps the theory is the same, so I round
4.4502 to two decimal places to 4.45 so they are the same but if not using rounding then they are different, of course 4.45 is larger because 4.4502 is 4 and 1/4502 whereas 4.45 is 4 and 1/45. So when we are dividing 1/4502 will be smaller
adrian prim A the larger one is 5.62 because this is in hundredths, it means 562/100 whereas this one is 5736/1000. I don’t use the number line for this one. The other ones can use fractions equivalent as well but it will be long.
aris prim C 17.35 and 17.353 are the same because we can truncate the 3 in 17.353 as it is less than 5. Similarly 4.4502 = 4.45 and 1.86 = 1.87 because they all can rounded to 1.9.
nita prim C because both 17.35 and 17.353 are rounded to 17.4 so they are the same also 4.4502 is the same as 4.45 by rounding
susi prim C I answer 4.6666 = 4.6; 3.7= 3.77777 because I remember that my teacher taught me that we can discard the other digits so that is what remember. I don't really know if that is correct. I was told to discard the digits after the comma so at the end they are the same and I wasn't told how many digits that can be ignored so I say they are the same
ismi prim C The way I solved this is by using a number line, 0 is here and 0.6 is around here. Hence comparing 0.6 and 0, then 0 is larger because it is more in the right side. If not, it is the same, here is 0 and here is 0.6 and 0 is the same as 0.000 and 0.6 is the same as 0.600. So this way is the same, this (0) is closer to the right. 0.00 and 0.7 perhaps it is the same like this one.
hery prim A perhaps the theory is the same, so I round the number to two decimal places to 4.45 so they are the same. If we don't use rounding then 4.45 is larger because 4.4502 is 4 and 1/4502 whereas 4.45 is 4 and 1/45 so when we are dividing so 4.4502 will be smaller

Appendix C2
Part B Item 2a decomposing of decimal 0.375
Student class DCT3a Comparison Test
yulius prim A from my opinion, this zero comma means that it is one over something. For instance 0.37 has two digits (decimal). Because this (0.375) has three digits, then it has tenths, hundredths, and thousandths. That 0.3 is 3 thousandths, that is what I remember. Last time, I just change the order of the digits.
nita prim C this is 0 times1 and then 3 divided by 10 is 0.3 and we have 0.7 divided by 100 equals to 0.07. This is 3 tenths so 3 tenths is 0.3. 0.7 times a hundredth, …0.7 divided by a hundred, so we move the decimal comma twice and get 0.007 . No this is wrong I add one too many
susi prim C I could not do that part because I haven't learnt it before.
yaya sec I just think that since we need to decompose this decimals and there are 4 places, this one is 0 units, 3 tenths, 7 hundredths, and 5 thousandths. I don't exactly how to work it out correctly but I just order the digits and then move the digits in different places, move the 3 in front and then 7, 5, 0. I think it was spontaneous and I was a bit confused what did the question mean so I just tried to answer like this but I have no idea whether this works.
ayi sec first I didn't understand the question but then it cross my mind while working on other item that 0.375 does not have to come from 0.3 times 1 and then I find the other alternatives. That is actually the last problem I was working on.
3 density item (Part B 5 or 6) Would you explain why do you choose this option (>200 or <200)
Student class DCT3a Comparison Test
susilo prim A Because this is 3.14 and there are 3.1401, 3.1402 and 3.140021, thousandths, hundredth. If we cound up until 3.15 there will be so many of them. It is not countable because this is 3.14 so it is in hundredths, if we add one more digit, it will be thousandhts, 3.1401 and if we add more 3.1402 until perhaps hundred thousandths and millionths there will be so many and they are infinitely many.
hery prim A there is, because this is 14 and 15 (referring to decimal digits of 3.14 and 3.15). It is difficult…. I think there is none because their difference is only 1.
nita prim C I could not answer that one, perhaps there are numbers in between those numbers but I cannot tell, don’t know.
ismi prim C I chose more than 200 because if we can add more zeros digits after 4 and the difference between them is 0.01. So after 1 we can add zero zero zero and those places we can fill in with 1, 2, or 3 and we can continue further to the left. So there are infinite places that we can continue to fill.

Appendix C2
nana sec 3.142, 3.143, 3.144, 3.145 and so on until it it get close to 3.15. I think they are finite numbers in between because there is a boundary. For example if this is 2.1 then after this will be 2.10 and then this one is 2.11, 2.12, 2.13.. Because tis is 2.0 then possibly here are 2.01, 2.03, 2.03 etc.
yaya sec I just think that between 3.14 and 3.15 because there is a difference, like between 2 and 3 there is a difference. Therefore here there must be 2.1, 2.2, 2.3 so I think for 3.14 there must be 3.141, 3.142, 3.143 and so on until 3.15. How many are there, well last time I counted perhaps there were nine?
novo sec first I thought that since 3.14 equals to 3.140 equals to 3.140000 and so on. Similarly 3.15 is the same as 3.150 and 3.15000 and so on. Then the interval between them can be 10 and between this one and this one there are hundreds (hundredths?) interval and then for this case .. 3.1500 the interval is thousands so there should be more than 200 because thousandths implies that there will be more than 200. I personally think that there are 998 but because the option is only more than 200 then I choose the one with more than 200 as an option.
ayi sec at that time I remember that behind 3.14 there are infinitely many zeros, it can go very long so I imagine that from 0 we can make infinite digits, it can start from units to tens so clearly there are infinitely many numbers in between.
Part C Item 17 How to help students to divide 0.5 by 100?
Student class DCT3a Comparison Test
aris prim C I was wrong when I did this test, because a comma is gone then we could just cross this out. Cross these out again and yes, so 0.5 divided by 100, to get rid off the comma, automatically this will be gone. So we have 5 divide by 10. To explain it because this comma is gone then we can just corss this out and add, add this here. So we will have five tenths .. oh no that was wrong.
ismi prim C for this problem, I use reverse multiplication principle but I was a bit confused when I solved this one, may be just use fractions like before that 0.5 is the same as 5/10 and divide this by 100. So the fraction will be 5/100. So the answer is 200, that was how I taught in junior highschool. that division is the same as reverse multiplication.
Part C Item 19 Why do you think the student ordering 0.3<0.34< 0.333333? How would you help studetns who answer this? Would you explain your thinking process when asnwering this problem?
Student class DCT3a Comparison Test
susilo prim A Because the longer the digits in tenths, hundredths, thousandths, ten thousandths and etc. does not mean that the number will be larger but it becomes smaller. In this case perrhaps because hundredths is smaller than tenths and thousandths is
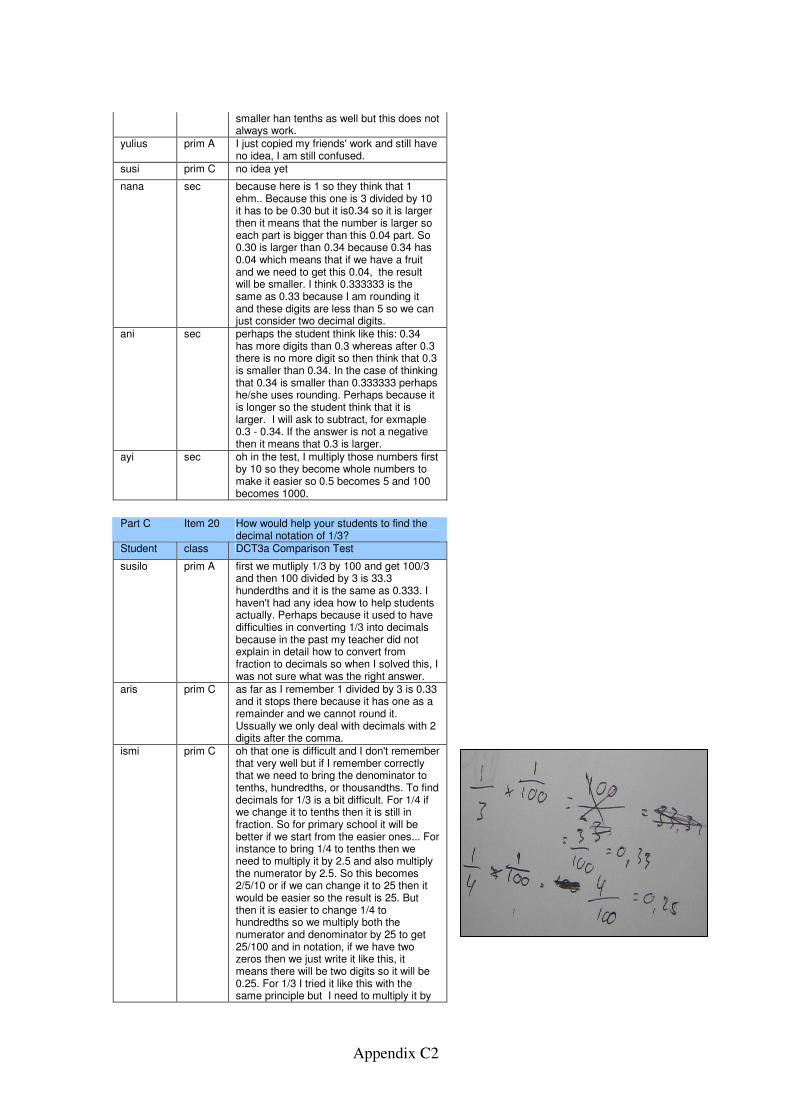
Appendix C2
smaller han tenths as well but this does not always work.
yulius prim A I just copied my friends' work and still have no idea, I am still confused.
susi prim C no idea yet
nana sec because here is 1 so they think that 1 ehm.. Because this one is 3 divided by 10 it has to be 0.30 but it is0.34 so it is larger then it means that the number is larger so each part is bigger than this 0.04 part. So 0.30 is larger than 0.34 because 0.34 has 0.04 which means that if we have a fruit and we need to get this 0.04, the result will be smaller. I think 0.333333 is the same as 0.33 because I am rounding it and these digits are less than 5 so we can just consider two decimal digits.
ani sec perhaps the student think like this: 0.34 has more digits than 0.3 whereas after 0.3 there is no more digit so then think that 0.3 is smaller than 0.34. In the case of thinking that 0.34 is smaller than 0.333333 perhaps he/she uses rounding. Perhaps because it is longer so the student think that it is larger. I will ask to subtract, for exmaple 0.3 - 0.34. If the answer is not a negative then it means that 0.3 is larger.
ayi sec oh in the test, I multiply those numbers first by 10 so they become whole numbers to make it easier so 0.5 becomes 5 and 100 becomes 1000.
Part C Item 20 How would help your students to find the decimal notation of 1/3?
Student class DCT3a Comparison Test
susilo prim A first we mutliply 1/3 by 100 and get 100/3 and then 100 divided by 3 is 33.3 hunderdths and it is the same as 0.333. I haven't had any idea how to help students actually. Perhaps because it used to have difficulties in converting 1/3 into decimals because in the past my teacher did not explain in detail how to convert from fraction to decimals so when I solved this, I was not sure what was the right answer.
aris prim C as far as I remember 1 divided by 3 is 0.33 and it stops there because it has one as a remainder and we cannot round it. Ussually we only deal with decimals with 2 digits after the comma.
ismi prim C oh that one is difficult and I don't remember that very well but if I remember correctly that we need to bring the denominator to tenths, hundredths, or thousandths. To find decimals for 1/3 is a bit difficult. For 1/4 if we change it to tenths then it is still in fraction. So for primary school it will be better if we start from the easier ones... For instance to bring 1/4 to tenths then we need to multiply it by 2.5 and also multiply the numerator by 2.5. So this becomes 2/5/10 or if we can change it to 25 then it would be easier so the result is 25. But then it is easier to change 1/4 to hundredths so we multiply both the numerator and denominator by 25 to get 25/100 and in notation, if we have two zeros then we just write it like this, it means there will be two digits so it will be 0.25. For 1/3 I tried it like this with the same principle but I need to multiply it by

Appendix C2
thousandhts and ten thousandths
yaya sec I answered it wrong last time. I divided it by 10 to convert to decimal right? Tes, perhaps we can teach it like this, to convert 1/3 to decimal, well.. It was difficult to answer this one. I always get it wrong. If we divide 1 by 3 just do it in direct way using division algorithm. 1 divided by 3 we will get 0.333. I memorized that because it is taught that way. The digits are repeating infinitely but I wasn't told the reason just know that it is the same as 0.33333 and the 3 will repeat forever. I could not explain the reason to myself so how possibly can I help the students?
novo sec I tend to use the division algorithm. 1 divided by 3 if we want to write all the 3s, it will be forever so we just need to write 0.33. If we want to show that the 3 will repeat forever, we just need to add three dots at the end. I have no other idea except using division algorithm to solve this, haven't thought about models.
ayi sec I had trouble working on that item but I have no other way to solve that except by using division algorith so 1/3 equals to 0.33… from there we can talk about rounding. We can see that the result won’t stop here but it depends on our consensus how many decimal digits we would like to round it to. My sense is, in this case since the repeated digits are the same (3) the student might be able to see it eaisly but for instance if the repeated digits are 625 (meaning 0.625625625...) then they might find it difficult. Here from the division, the student can see that it always has 1 as remainde so the repeated decimal digits will always be 3 but I am a bit nervous when the digits are repeating after few digits.

Appendix C3
Appendix C3
Samples of Post-course Interviews cycle 1 grouped by
questions PostQ1 Based on your learning experience, could you come up with three models or more to help
primary school kids learn about decimals? Would you also please rate the models based on their level of difficulty to help students from the easiest to the most difficult one?
Student class Responses
aris prim C
the LAB, using fruits: water melon to be cut into ten pieces, a circular model, a paper with ones, tenths, hundredhts, thousandths (referring to the number expander), food. The easiest one is the LAB because based on my own learning experience, it is easier using the LAB than using the paper that we used last time (referring to the number expander), I understood better using LAB because the one is divided into ten, hundredths, and thousandths. With the circular model, the division into tenths, hundredths, and thousandths is yet to be done whereas in the LAB those relationships can be observed. With the number expanders, the students need to fill in the numbers but this can be considered as easy as well.
nita prim C
using the LAB, the other alternative is using a piece of paper, also we can use bamboo sticks which we cut according to the scale. We can also use buttons, but the cannot be used to measure things whereas the LAB can be used to measure the length of something but buttons can be used for counting and expressing the different digit values: ones, tenths, hundredths, and thousandths. Food such as water melon also can be used but it is too difficult to measure and compare them but bing cut, a water melon can be used as a model. According to me for the higher grades such as 4 or 5, the LAB model is easier but for the lower grade, using buttons will be easier because they are more practical, it is like using an abacus to count. However, we need to realize that the buttons can only represent the different place value but the proportion among the different size of the buttons don't express the decimal relationships as like in the LAB pieces but they are more practical and affordable.
nita prim C
A piece of paper is similar to the LAB model, they are both based on a scale, the students use the ruler to divide the paper into smaller pieces. In fact, the LAB is easier but a piece of paper is more available around the students to find so it is more practical. We can also use a bamboo sticks that hold similar principle as the LAB. we collect the bamboo sticks and measure the length of the one piece and then measure the length of a tenth stick, the way we divide them into tenths is similar to the LAB.
susi prim C
using the LAB, using the number expander. For me, they are interesting because at the end, I understand which one is the one, which one is the tenths, which one is the hundredth and the thousandth. from there, it is clear, so it is suitable for children because children will not count on the memorization but they understand the ones, and they can find out from measuring that the tenth is shorter, so they can compare. Another model that is not discussed in our group is the circular model using a hard paper but it is difficult to diffentiate the tenths, hundreths,.. It is also because it is a circle, it might be difficult to understood by students.
ismi prim C
using the LABs, and also using paper strips. For instance to model one we can use a paper strip of 10 cm long and 2 cm wide to represent a tenth. Also we can use the paper, the folded paper, but I think it is not easy to understand, I am afraid that the primary school students will be confused with the number expander model particularly that they have different options/ways of representing the same decimal number. For instance, given 2.059, they might come up with an answer of 2 ones, 0 tenths. Then 5 is 5 hundredths, so it can be reunitised again,right. For instance to 2 hundreths and then the remainder will be 39 eh.. See if there are different possible answers like this, it is for students to perceive. It is easier using the LAB. I myself was also confused at the beginning but my friends in my group helped me. After seeing many examples discussed in the classroom, I got a clearer picture of it works. With LAB, I came to an understanding of why we call these as tenths because there are ten tenths in one, similarly a hundred consists of ten tenths, and a thousand consist of ten hundredths.
nana sec The first is to use the LAB, using the LAB, the longest piece is a one and then to represent the tenth, we divide the one piece into ten parts. Another model is a piece of paper, if we consider that as one and to get a quarter, we divide one into four parts. To get a tenth, we divide one into ten equal parts, each part is a tenth. Then to get a hundred, we divide one tenths into ten parts. The easiest one is a piece of paper because the students have it and they can easily draw and cut them into smaller pieces by themselves whereas the LAB is difficult to access but we can change the LAB with the bamboo sticks, they share similar principle. For the paper model, the teacher need to make sure that the size is easier to divide, for instance 10 by 10 cm so that each of the piece is 1 cm length. The students can use a ruler to divide the paper.

Appendix C3
ayi sec from our group, we just think to change the materials of the LAB with a more simple and more general stuff for students which are more available and affordable such as straws but the principle are the same (based on division by ten). We can also try with the three dimensional model such as a cube. We think that if they already understand the fractions concept, it would be good if they don't count only on the LAB which is based on length but the students can also learn a more complicated model. So if they master the linear model, they should have been able to understand the more difficult one, i.e., the spatial model. It is difficult to come up with a completely new mode, because amongst us, this is the first time we find a model for decimal. It is very rare to make a model for decimals so we only have this experience as a benchmark. Based on our group discussion, and what we did in the classes, clearly it is easier to use the LAB. Because, eventhough the LAB looks like a three dimensional model but the prominent feature is the length whereas it is more difficult to divide the spatial model, besides we need to consider also the volume. From Mr. Marpaung task we also learn about the paper model.
novo sec Using the LAB, I'm quite interesetd in using the LAB. According to me, it is very helpful especially for the primary school students to understand the decimal numbers. It is helpful in a sense that if the longest piece of the LAB is one meter, then how long is the tenth? The if we arrange them, we can learn how many tenths are in one. Another way is to use the ruler for example, if this is 0.1 and 0.2, then to explain how big is 0.13, we need to divide the interval into ten. For example, here is 0.13. We can also use the number expander, that is also useful in helpin the kids to understand place value because often we confuse the place value for tenths and hundredths and add them together. For me, I prefer to use the number line because for primary school kids, they will have problem to understand how big is 0.13 and where is located between what numbers? With the number line, it is helpful because 0.1 is divided into ten and there are the hundredths, so 3 here represents the hundredth so this is 0.13. The LAB is limited for instance to represent 1.39283 because we only have tenths, hundredths and thousandths pieces so we don't know how to represent this number with the LAB.
ani sec We have learnt using the LAB so perhaps the first model will be the LAB. The second one, we can use a plastic rope to show the fraction 1/3. The last one is to use a piece of paper like in Mr. Marpaung's task which we divide one piece of paper into ten smaller parts and then ask what is one part of the smaller piece. So we divide one piece of paper into ten smaller parts, then one of the part is one tenth. If we divide it into one hundred, we divide one tenth into ten smaller parts again. Then to get one thousandth, we divide the one hundredth into ten smaller parts. We cut the paper based on their area, their size. We can also use a cube as a model. Amongst the four models, I think the LAB is the easiest one because the model clearly show how many of the smaller units are in the bigger unit. We can check easily by lining them up with the connector and check the answer. It will be faster and easier. However, the difficulty with using the LAB in primary school is we need plenty of them. For instance, like yesterday we only have limited number of the smaller units so if we have to represent a certain number, we need to have more of them.
adrian primA Yeah, we can use the model like the LAB but we can change the materials using woods. According to me the easiest model should be the one that the students are familiar with, those that they can find easily everywhere. The model I proposed using the woods are similar in principle with the LAB model, it is the material that are different.
susilo primA The first model is the LAB, with the learning experience that we had, I might be able to implement that in the primary school later. The second one is using grid paper which might be used to replace the LAB. The third one is using the floor tiles. with the paper strips, eh.. first with the LAB, we can explain the value of tenths, ones, hundredths of the decimals. We can represent the value of those units with the LAB,.. I mean we can tell the how long the unit is using the LAB, the same thing works with the paper strips. For instance, to represent 0.1 or a tenth we can use one of the smaller box, whereas we represent 1 with 10 grid blocks (long pause to draw the pictures of the model). For example, for this one we use 20 block papers whereas for 0.1, this means that 2 of these are combined to become 0.1. Whereas for 0.01, we can it smaller like this. It is divided into 10 again and again and the principle is similar to the LAB. with the floor tiles, it is the same, if we represent 20 tiles as 1, then 2 of the tiles will be 0.1. I chose 20 because if we use 10, there will be to small when we get to the hundredths.
PostQ3 is there any form concept in decimals that you have a problem or difficulty with before you followed the learning activities but after that you get a clearer picture or the opposite, if you feel like there are some concepts that become less clear or you get confused after following the learning activities?
Student class Responses
nita prim C
The difference that I felt is before when I saw decimal numbers, if the difference is small then I thought that they are all the same, but know I know that they are different.

Appendix C3
novo sec perhaps from my friends in a group, we have a new viewpoint for instance about the model, we find that we can use models in learning decimals and it is quite helpful, for instance if we are going to teach in elementary school then it is very helpful.
ani sec Yes, there are many new things, before I didn't know how to use the LAB, now I know. I come to an understanding what is 0.1, how to get 0.1, 0.01 . Before, I was just taught by the teacher, we already had 0.1. I didn't know where it comes from.
nana sec Yes, item 2, this one is the one then 7 is the tenth, tthen 5 is the hundredths and 3 is the thousandhs. For instance this one, this is 0 one, and then I take 75 hundredths wihch means that this is 75 hundredths and this one is 753 thousandths. I studied it in the group discussion in the activities with the number expander. We can also use the LAB, in which one is divided into 10 to get 0.1 and then divided again to get 0.01 and the smallest piece is 0.001.
PostQ4 Did you find any change from participating in the pre and the posttest after the learning activities? / Any particular difficulty in solving any post-test item?
Student class Responses
ayi sec I felt more ease in the posttest. Before, it is very focussed on the algorithm but now I started to understand the concept. If 1 is divided into 6, we use the LAB and then from 1 if we are to divide it into 6, in the first place it can't be done. Therefore, because we cannot do that, one is equal to ten tenths so now it can be divided into 6. We get one, so this one is one of the tenth. Then from ten tenths if we divide them into 6, we have each group consists of one tenth but we still have 4 more and because 4 can't be divided equally into 6, then we use the hundredths. From there, we divide them into 6, and get 6 groups of 6 hundredths, I mean each has 6 hundredths. Then from here we get 4 as a remainder again, so the students will observe that it can never be evenly divided.
novo sec about finding the decimals of 1/3, before I could not solve that problem, but now I have an idea. In the learning activities, we are asked to think how to represent 1/3 using the LAB, then I get an idea, based on the fact that 1/3 is equal to 0.333 continue forever, we can represent it by arranging 3 tenths, 3 hundredths, and 3 thousandths together. We did it after we find the decimal of 1/3 using the division algorithm. using model.. difficult... if we link it with a mode. For instance using the longest one of the LAB (the one), if we are finding 1/3 meaning three equal parts of one then each part will be less than one so.. zero comma something. to find the next decimal number in a sequence (Question 4b), the trouble is to connect, for instance 0.1 and 0.25. They are both divisible by5, divisible by 5, … right or wrong?… It is difficult, I tend to divide both numbers because when I see 1.25, I think the next one should be found by division.
ani sec the test item that ask how many numbers in between two decimal numbers, I do not understand why one of the choices is more than 200? Why using 200?
adrian perhaps, the problem of finding new ideas or new ways to explain things to children.
ismi prim C
for me the difficult part is in comparing 0.81 and 0.9, trying to find which one is close to 0. For this one because they are decimals, so if we draw them, they should be on the left side of 0, so I am looking for the one which is closer to 0 or positive. .. here . but oops, this is negative, I was thinking like that before the left side because it is closer to zero.
nita prim C
I also did not understand this question (Posttest item 4a, 4b), for me it is unclear. I didn't understand Question 5 as well, I didn't understand how many decimal numbers are in between two decimals. In my experience, the group work has been quite helpful because we can discuss and solve the problems together. For instance asking "how did we find this answer, it is explained or perhaps if I have an idea but the other friends think differently then I will consider again which one is right.
PostQ5 So do you have a new idea of models to help students learn decimals in the primary school?
Student class Responses
ismi prim C
No, not yet, I am still having trouble myself when I had to help students in my teaching rounds.

Appendix C3
PostQ6 Do you have any feedbacks for to improve the learning activities or the test items?
Student class Responses
ayi sec the time provided for the tests is too short especially because few last questions require us to think. Also items from this part (word problems), I don't know what are the goals of these questions, because before and after the learning activities, there is no change in the way we answer these questions. So what concepts being targeted by these questions for me are not clear, I cannot tell whether my answers are based on concepts or they are still the same as before (procedural). Also, the learning activities should be carried out more relax, it is a bit too intense including the presentation of the group discussions. We think that the design of the learning activity is good, it started from the beginning so it builds the concept in a more holistic way, from the start, when the students didn't know what is fraction, from the simplest to a more difficult ones. Yet, we think that it takes a lot of time to undestand from the beginning till the end whereas if we teach later we need to find something that works for a more limited time.
novo sec to connect what we do with models with the algorithm is still difficult (referring to his process of finding 1/3 using the model and connect it with the steps in the division algorithm)
ani sec to make students more active, you can add more group problems because if we are listening to lectures, we get bored but if we are having group discussions, we have no choice except of participating in the discussions.
adrian primA it is already good. I was having a problem at the beginning but because we are working in groups so a friend can help me. By communicating each other own thoughts, then I come to know
Part C Item 20
What is your idea to help children find the decimals of 1/6?
Student class Responses
novo Oh right.. That one I am still a bit confuse, how we can represent that so that the primary school kids can understand. If we are using the LAB, for 1/6, 1 is divided by 6, it can be difficult to find it but for us, we can divide 1 by 6 and get the results. For the primary school students I am not sure how we can help them to find 1/6.
susilo I was quite mixed up, I just answered by using the LAB but I am not very optimistic that the idea will work out well with primary school student. This is one so we divide it into 6, by first measuring the length and then divide it into 6. Same with this one, we also divide this into 6. That's how I think but when I came to the smallest pieces, I had problems to divide it into 6 then I got stuck so I just left it like that. Perhaps I can, with this one, we just divide thisinto 10 equal parts… so this is one, there are 10 so we connect these 10 and then we take only 6, and because there are not enough, we use the smaller pieces and connect them together. .. For instance, here are 5, then add 5 more here and here add 5 more until they have the same length.
ismi prim C
Ussually I try to bring it to the equivalent fraction first ... but for 1/6 I think it is still difficult. If I start with examples, I will start with the simpler one, for instance 1/4, this is 1 so 1/4 means that 1 is divided by 4, whereas 1 consists of 10 so we will find the result of 2.5. First 1 is divided into 2 frist, and then theose two are divided into 2 again. ..perhaps so we will have 5 but we need 5 more because this is 1 right and I didn't think directly using 3. I started to find 1/2 first, and then divide this part into 3 as well as the other part into 3. Yes, we can.. here we have 5 parts to be divided into 3, one, one and then we have 2 more which then those 2 parts have to be divided into thre but then it will take a very long steps to get the answer. ... For me the process is too long. From my understanding, to get the decimals we need to find decimal fractions in tenths, hundredths, or thousandths first, so in the case of 1/6, we should bring the denominator into tenths, hundredths or thousandths.
novo sec the idea is to give the students models to see what is 1 and then how to model 1 divided by 3, then from that we can teach them the division algorithm to get the answers faster.

Appendix C4
Appendix C4
Table of responses to Initial Activity Set 1 Activity 1 in cycle 2
Ways of partitioning Number
of cases
Frequency Cases in
primary
Cases in
secondary
Halving includes
partitioning into 2, 4, 8, 16,
etc.
13 38.2% 12 1
Decimating 7 20.6% 5 2
Using hands’ span,
partitioning into 6
7 20.6% 3 4
Into 5 3 8.8% 3 0
Others, (using hands span or
pen’s length)
3 8.8% 0 3
TOTAL 34 100% 24 10

Minerva Access is the Institutional Repository of The University of Melbourne
Author/s:
Widjaja, Wanty
Title:
Local instruction theory on decimals: The case of Indonesian pre-service teachers
Date:
2008
Citation:
Widjaja, W. (2008). Local instruction theory on decimals: The case of Indonesian pre-service
teachers . PhD Thesis, Faculty of Education, Education, University of Melbourne.
Publication Status:
Unpublished
Persistent Link:
http://hdl.handle.net/11343/39485
File Description:
Local instruction theory on decimals
Terms and Conditions:
Terms and Conditions: Copyright in works deposited in Minerva Access is retained by the
copyright owner. The work may not be altered without permission from the copyright owner.
Readers may only download, print and save electronic copies of whole works for their own
personal non-commercial use. Any use that exceeds these limits requires permission from
the copyright owner. Attribution is essential when quoting or paraphrasing from these works.