IRS00134 Appendix B used in opposition to IRS motion for summary judgment
Upload
khangminh22Category
view
0download
0
North 40 Specific Plan DRAFT Last Modified: July 2, 2014
Appendix A Market Study and Business Opportunities Assessment
Appendix B Tree List
Appendix C Young Adult, Senior, and Empty Nester Design Summary
Appendix D Los Gatos Sustainability Plan
Appendix E Discretionary Approval Table
This Page Intentionally Left Blank
draft | May 2014

North 40 Specific Plan DRAFT Last Modified: July 2, 2014
Appendix A - Market Study and Business Opportunities Assessment

This Page Intentionally Left Blank
appendixA
draft | May 2014

1
M
arke
t Stu
dy &
Bus
ines
s O
ppor
tuni
ties
Ass
essm
ent
To
wn
of L
os G
atos
Sub
mitt
ed b
y B
AE
Urb
an E
cono
mic
s A
ugus
t 12,
201
1

bae
urba
n ec
onom
ics
Aug
ust 1
2, 2
011
Ms.
Jess
ica
von
Bor
ck
Econ
omic
Vita
lity
Man
ager
To
wn
of L
os G
atos
P.
O. B
ox 9
49
Los G
atos
, CA
950
31
Dea
r Ms.
Von
Bor
ck:
On
beha
lf of
BA
E U
rban
Eco
nom
ics,
Inc.
, we
are
plea
sed
to su
bmit
the
encl
osed
Nor
th 4
0 M
arke
t St
udy
and
Bus
ines
s Dev
elop
men
t Stra
tegy
for t
he T
own
of L
os G
atos
pur
suan
t to
Purc
hase
Ord
er
Con
tract
#20
1103
17.
W
e ha
ve e
njoy
ed w
orki
ng w
ith y
ou a
nd y
our s
taff
col
leag
ues a
s wel
l as t
he N
orth
40
Adv
isor
y C
omm
ittee
, Pla
nnin
g C
omm
issi
on, a
nd T
own
Cou
ncil
on th
is e
xciti
ng o
ppor
tuni
ty to
enh
ance
the
Tow
n’s e
cono
mic
vita
lity
thro
ugh
the
deve
lopm
ent o
f the
Nor
th 4
0 Sp
ecifi
c Pl
an a
rea.
Si
ncer
ely,
Dav
id L
.R. S
hive
r R
aym
ond
Ken
nedy
Pr
inci
pal
Vic
e Pr
esid
ent
San
Fran
cisc
o Sa
cram
ento
Lo
s An
gele
s W
ashi
ngto
n D
C N
ew Y
ork
City
12
85 6
6th S
tree
t 80
3 2nd
Str
eet
5405
Wils
hire
Blv
d.
1346
U S
tree
t N
W
121
Wes
t 27
th S
tree
t Se
cond
Flo
or
Suit
e A
Suit
e 29
1 Su
ite
403
Suit
e 70
5 Em
eryv
ille,
CA
9460
8 D
avis
, CA
956
16
Los
Ange
les,
CA
9003
6 W
ashi
ngto
n, D
C 20
009
New
Yor
k, N
Y 10
001
510.
547.
9380
53
0.75
0.21
95
213.
471.
2666
20
2.58
8.89
45
212.
683.
4486
ww
w.b
ae1.
com


Ta
ble
of
Co
nte
nts
Ex
ecut
ive
Sum
mar
y ...
......
......
......
......
......
......
......
......
......
......
......
......
......
......
......
......
..... 1
Site
Des
crip
tion
and
Loca
tion .
......
......
......
......
......
......
......
......
......
......
......
......
......
......
......
......
.. 1
Dem
ogra
phic
and
Eco
nom
ic O
verv
iew
.....
......
......
......
......
......
......
......
......
......
......
......
......
......
. 1
Ret
ail M
arke
t Ass
essm
ent ..
......
......
......
......
......
......
......
......
......
......
......
......
......
......
......
......
......
. 2
Off
ice
Mar
ket A
sses
smen
t ....
......
......
......
......
......
......
......
......
......
......
......
......
......
......
......
......
.... 6
Hot
el M
arke
t Ass
essm
ent .
......
......
......
......
......
......
......
......
......
......
......
......
......
......
......
......
......
.. 7
Con
fere
nce/
Mee
ting
Spac
e M
arke
t Ass
essm
ent .
......
......
......
......
......
......
......
......
......
......
......
.... 8
Stra
tegi
es fo
r Nor
th 4
0 D
evel
opm
ent ..
......
......
......
......
......
......
......
......
......
......
......
......
......
......
.. 8
Site
Des
crip
tion
......
......
......
......
......
......
......
......
......
......
......
......
......
......
......
......
......
......
. 13
Site
Loc
atio
n ....
......
......
......
......
......
......
......
......
......
......
......
......
......
......
......
......
......
......
.. 15
Dem
ogra
phic
Ove
rvie
w ..
......
......
......
......
......
......
......
......
......
......
......
......
......
......
......
.... 1
9
Def
initi
on o
f Ret
ail T
rade
Are
a vs
. Mar
ket A
rea .
......
......
......
......
......
......
......
......
......
......
......
. 19
Popu
latio
n an
d H
ouse
hold
Tre
nds .
......
......
......
......
......
......
......
......
......
......
......
......
......
......
.....
24
Hou
seho
ld C
hara
cter
istic
s ....
......
......
......
......
......
......
......
......
......
......
......
......
......
......
......
......
... 2
6 Em
ploy
men
t Tre
nds .
......
......
......
......
......
......
......
......
......
......
......
......
......
......
......
......
......
......
... 2
8
Ret
ail M
arke
t Ass
essm
ent:
Exis
ting
Ret
ail R
eal E
stat
e C
ondi
tions
......
......
......
......
. 33
Ret
ail R
eal E
stat
e M
arke
t Con
ditio
ns ..
......
......
......
......
......
......
......
......
......
......
......
......
......
.....
33
Ove
rvie
w o
f Los
Gat
os a
nd R
etai
l Tra
de A
rea
Ret
ail N
odes
.....
......
......
......
......
......
......
......
.. 34
Ret
ail M
arke
t Ass
essm
ent:
Sale
s an
d Le
akag
e A
naly
sis .
......
......
......
......
......
......
..... 4
5
Estim
ated
Ret
ail S
ales
in L
os G
atos
and
the
RTA
by
Maj
or R
etai
l Cat
egor
y ....
......
......
......
.. 45
R
etai
l Sal
es b
y M
ajor
Ret
ail C
ateg
ory
in L
os G
atos
, San
ta C
lara
Cou
nty,
and
Cal
iforn
ia ..
.. 49
Lo
s Gat
os T
axab
le R
etai
l Sal
es b
y D
istri
ct ...
......
......
......
......
......
......
......
......
......
......
......
......
.. 54
Le
akag
e an
d In
ject
ion
Ana
lysi
s for
Los
Gat
os a
nd th
e R
etai
l Tra
de A
rea
(RTA
) .....
......
......
. 59
Ret
ail M
arke
t Ass
essm
ent:
Sum
mar
y ...
......
......
......
......
......
......
......
......
......
......
......
.... 7
1
Exis
ting
Con
ditio
ns ...
......
......
......
......
......
......
......
......
......
......
......
......
......
......
......
......
......
......
.. 71
Le
akag
e an
d In
ject
ion
Ana
lysi
s ....
......
......
......
......
......
......
......
......
......
......
......
......
......
......
......
74
Pote
ntia
l for
New
Ret
ail D
evel
opm
ent i
n Lo
s Gat
os ...
......
......
......
......
......
......
......
......
......
.....
75
Offi
ce M
arke
t Ass
essm
ent .
......
......
......
......
......
......
......
......
......
......
......
......
......
......
......
77
Off
ice
Inve
ntor
y ....
......
......
......
......
......
......
......
......
......
......
......
......
......
......
......
......
......
......
......
77
Off
ice
Mar
ket T
rend
s ....
......
......
......
......
......
......
......
......
......
......
......
......
......
......
......
......
......
.... 7
7 O
ffic
e Em
ploy
men
t Tre
nds .
......
......
......
......
......
......
......
......
......
......
......
......
......
......
......
......
.... 8
0 O
ffic
e D
eman
d A
naly
sis .
......
......
......
......
......
......
......
......
......
......
......
......
......
......
......
......
......
.. 82
Hot
el M
arke
t Ass
essm
ent ..
......
......
......
......
......
......
......
......
......
......
......
......
......
......
......
. 89
Exis
ting
Supp
ly ...
......
......
......
......
......
......
......
......
......
......
......
......
......
......
......
......
......
......
......
.. 89
Pl
anne
d an
d Pr
opos
ed C
ompe
titio
n ...
......
......
......
......
......
......
......
......
......
......
......
......
......
......
. 91
Perf
orm
ance
Tre
nds .
......
......
......
......
......
......
......
......
......
......
......
......
......
......
......
......
......
......
... 9
3
Mee
ting
Spac
e M
arke
t Ass
essm
ent .
......
......
......
......
......
......
......
......
......
......
......
......
... 97
Hot
el M
eetin
g Sp
ace .
......
......
......
......
......
......
......
......
......
......
......
......
......
......
......
......
......
......
.. 97
D
ay-U
se M
eetin
g Fa
cilit
ies .
......
......
......
......
......
......
......
......
......
......
......
......
......
......
......
......
.. 10
2 D
eman
d fr
om M
ajor
Em
ploy
ers .
......
......
......
......
......
......
......
......
......
......
......
......
......
......
......
107
Opp
ortu
nitie
s &
Str
ateg
ies
for D
evel
opm
ent .
......
......
......
......
......
......
......
......
......
.... 1
09
Ove
rvie
w ...
......
......
......
......
......
......
......
......
......
......
......
......
......
......
......
......
......
......
......
......
.... 1
09
Ret
ail D
evel
opm
ent O
ppor
tuni
ties .
......
......
......
......
......
......
......
......
......
......
......
......
......
......
... 1
10
Ret
ail D
evel
opm
ent S
trate
gies
......
......
......
......
......
......
......
......
......
......
......
......
......
......
......
.... 1
14
Off
ice
Dev
elop
men
t Opp
ortu
nitie
s ....
......
......
......
......
......
......
......
......
......
......
......
......
......
.....
116
Hot
el D
evel
opm
ent O
ppor
tuni
ties .
......
......
......
......
......
......
......
......
......
......
......
......
......
......
... 1
18
Con
fere
nce
and
Mee
ting
Spac
e D
evel
opm
ent O
ppor
tuni
ties .
......
......
......
......
......
......
......
.... 1
19
Prio
ritiz
ing
Opp
ortu
nitie
s ....
......
......
......
......
......
......
......
......
......
......
......
......
......
......
......
......
.. 12
1
App
endi
ces .
......
......
......
......
......
......
......
......
......
......
......
......
......
......
......
......
......
......
..... 1
25

Ex
ec
uti
ve
Su
mm
ary
Site
Des
crip
tion
and
Loca
tion
The
Nor
th 4
0 si
te is
a h
ighl
y st
rate
gic
loca
tion
in th
e W
est V
alle
y fo
r new
com
mer
cial
de
velo
pmen
t:
− Th
e N
orth
40
site
is lo
cate
d at
the
inte
rsec
tion
of H
ighw
ays 8
5 an
d 17
, mak
ing
it a
high
ly v
isib
le a
nd d
esira
ble
loca
tion
for a
var
iety
of u
ses,
parti
cula
rly fo
r ret
ail,
hote
l, an
d m
eetin
g/co
nfer
ence
faci
litie
s.
− Th
e N
orth
40’
s loc
atio
n at
the
cros
sroa
ds o
f the
Wes
t Val
ley’
s fre
eway
syst
em m
akes
it
easi
ly a
cces
sibl
e to
man
y of
the
regi
on’s
maj
or h
ubs o
f act
ivity
, inc
ludi
ng m
ajor
em
ploy
ers s
uch
as A
pple
Com
pute
r, N
etfli
x, a
nd c
ultu
ral a
ttrac
tions
in d
ownt
own
San
Jose
. D
emog
raph
ic a
nd E
cono
mic
Ove
rvie
w
Whi
le L
os G
atos
itse
lf is
a sm
all c
omm
unity
, the
Tow
n an
d th
e Re
tail
Trad
e Ar
ea (R
TA) t
hat i
t is
situ
ated
in h
ave
a si
gnifi
cant
con
cent
ratio
n of
hig
h-in
com
e ho
useh
olds
and
hig
h ra
tes o
f ho
meo
wne
rshi
p th
at re
taile
rs a
nd h
otel
ope
rato
rs w
ill li
kely
find
attr
activ
e –d
espi
te m
odes
t fut
ure
popu
latio
n an
d ho
useh
old
grow
th:
−
The
Tow
n of
Los
Gat
os h
ad a
pop
ulat
ion
of 2
9,41
3 in
201
0 an
d ex
perie
nced
lim
ited
popu
latio
n or
hou
seho
ld g
row
th in
the
last
dec
ade.
− Lo
s Gat
os is
cha
ract
eriz
ed b
y re
lativ
ely
smal
l hou
seho
lds,
a hi
gh ra
te o
f hom
e ow
ners
hip,
and
hig
h in
com
es.
The
med
ian
hous
ehol
d si
ze fo
r Los
Gat
os w
as 2
.35
pers
ons p
er h
ouse
hold
in 2
010
com
pare
d to
the
Bay
Are
a av
erag
e ho
useh
old
size
of
2.69
. Th
e To
wn’
s med
ian
annu
al h
ouse
hold
inco
me
is o
ver $
115,
000,
sign
ifica
ntly
hi
gher
than
the
$79,
000
figur
e fo
r the
Bay
Are
a. A
ppro
xim
atel
y 63
per
cent
of
occu
pied
hou
sing
uni
ts a
re o
wne
r-oc
cupi
ed, i
n co
ntra
st to
just
ove
r 56
perc
ent f
or th
e B
ay A
rea.
− W
hile
not
at t
he le
vels
of t
he T
own,
the
Ret
ail T
rade
Are
a (R
TA) w
ith a
201
0 po
pula
tion
of 6
06,0
00 a
lso
has h
igh
inco
mes
and
hig
h ra
tes o
f hom
e ow
ners
hip.
The
m
edia
n ho
useh
old
inco
me
was
just
ove
r $94
,000
in 2
010.
The
RTA
’s h
omeo
wne
rshi
p ra
te w
as 6
1 pe
rcen
t of o
ccup
ied
hous
ing
units
. Th
e R
TA re
pres
ents
pop
ulat
ion
and
buyi
ng p
ower
with
in a
10
min
ute
driv
e of
the
Nor
th 4
0 si
te.
−
Bot
h Lo
s Gat
os a
nd th
e R
etai
l Tra
de A
rea
will
exp
erie
nce
mod
est p
opul
atio
n gr
owth
fr
om 2
010
to 2
020.
Bas
ed o
n th
e To
wn’
s rec
ently
ado
pted
Gen
eral
Pla
n, th
e To
wn
is
N
orth
For
ty S
peci
fic P
lan
Mar
ket S
tudy
and
Bus
ines
s Dev
elop
men
t Stra
tegy
Pa
ge 1
of 1
50
slat
ed to
add
app
roxi
mat
ely
3,20
0 re
side
nts o
ver t
he d
ecad
e, b
ased
in p
art o
n th
e po
tent
ial f
or n
ew h
ousi
ng a
t the
Nor
th 4
0 si
te.
Futu
re re
side
ntia
l dev
elop
men
t op
portu
nitie
s in
the
Tow
n an
d th
e R
TA w
ill la
rgel
y be
infil
l on
site
s suc
h as
the
Nor
th 4
0.
D
espi
te a
com
mut
e pa
ttern
of m
ore
resi
dent
s com
mut
ing
out o
f the
RTA
than
oth
ers c
omm
utin
g in
, th
ere
are
near
ly 1
00,0
00 w
orke
rs c
omm
utin
g in
to th
e RT
A ev
ery
day
who
mos
t lik
ely
patr
oniz
e lo
cal r
etai
lers
and
serv
ice
prov
ider
s. T
he N
orth
40
site
ben
efits
from
the
prox
imity
of m
ajor
em
ploy
ers i
n th
e ad
jace
nt G
ood
Sam
arita
n H
ospi
tal a
nd o
ther
med
ical
faci
litie
s –th
ese
empl
oyee
s m
ay b
e ta
rget
mar
ket f
or n
ew re
tail:
− Lo
s Gat
os a
nd th
e R
TA fu
nctio
n as
a b
edro
om re
side
ntia
l com
mun
ity in
Sili
con
Val
ley
with
mor
e re
side
nts c
omm
utin
g ou
t eve
ry d
ay fo
r wor
k (1
86,9
00) t
han
com
mut
e in
(9
8,30
0).
− G
ood
Sam
arita
n ho
spita
l is t
wo
min
ute
driv
e fr
om th
e N
orth
40
site
, em
ploy
s 1,8
00
peop
le a
nd g
ener
ates
88,
000
patie
nt d
ays a
nnua
lly.
−
Col
umbi
a H
ealth
Car
e/M
issi
on O
aks H
ospi
tal i
s a th
ree
min
ute
driv
e fr
om th
e N
orth
40
and
em
ploy
s 2,0
00 p
eopl
e.
Ret
ail M
arke
t Ass
essm
ent
Los G
atos
has
a v
ery
stro
ng re
tail
sect
or w
ith a
div
erse
mix
of r
etai
lers
:
− R
etai
l sal
es fo
r the
Tow
n fo
r 200
8 ar
e es
timat
ed a
t app
roxi
mat
ely
$838
mill
ion.
Th
e th
ree
larg
est c
ateg
orie
s by
sale
s vol
ume
are
mot
or v
ehic
le a
nd p
arts
dea
lers
at
30 p
erce
nt, f
ood
and
beve
rage
stor
es a
t 23
perc
ent,
and
food
serv
ices
and
drin
king
pl
aces
at 1
5 pe
rcen
t. T
he p
ropo
rtion
of t
he T
own’
s tot
al re
tail
sale
s in
mot
or
vehi
cle
and
food
stor
e sa
les a
re v
ery
high
, alth
ough
mot
or v
ehic
le sa
les h
ave
decl
ined
sinc
e 20
08.
− O
n a
per c
apita
bas
is, r
etai
l sal
es in
Los
Gat
os a
re q
uite
hig
h, a
t $28
,653
ann
ually
co
mpa
red
to le
ss th
an $
14,0
00 a
nnua
lly fo
r the
RTA
; the
onl
y se
ctor
s lag
ging
the
RTA
in p
er c
apita
sale
s are
the
build
ing
mat
eria
ls g
roup
and
gen
eral
mer
chan
dise
st
ores
.
−
The
Tow
n is
unu
sual
in th
at it
als
o at
tract
s sho
pper
s for
eve
ryda
y ite
ms s
uch
as
groc
erie
s, du
e in
par
t to
the
loca
tion
of su
perm
arke
ts a
nd d
rugs
tore
s nea
r the
edg
es
of T
own
and
in p
art d
ue to
the
lack
of s
hopp
ing
in M
onte
Ser
eno,
Sar
atog
a an
d ot
her n
earb
y un
inco
rpor
ated
are
as.
Nor
th F
orty
Spe
cific
Pla
n M
arke
t Stu
dy a
nd B
usin
ess D
evel
opm
ent S
trate
gy
Page
2 o
f 150

−
Long
-term
dec
lines
in re
tail
sale
s in
Los G
atos
ove
r the
last
dec
ade
have
bee
n re
late
d la
rgel
y to
the
decl
ine
in th
e au
tom
otiv
e se
ctor
. In
201
0, ta
xabl
e m
otor
ve
hicl
e sa
les i
n th
e To
wn
wer
e on
ly 2
1 pe
rcen
t of 2
000
leve
ls a
fter a
djus
ting
for
infla
tion.
− W
ith it
s hig
h pe
r cap
ita sa
les l
evel
s, Lo
s Gat
os sh
ows i
njec
tions
of s
ales
in m
ost
maj
or re
tail
cate
gorie
s, in
dica
ting
attra
ctio
n of
shop
pers
from
out
side
the
Tow
n.
−
The
Tow
n is
unu
sual
in th
at it
als
o at
tract
s sho
pper
s for
eve
ryda
y ite
ms s
uch
as
groc
erie
s, du
e in
par
t to
the
loca
tion
of su
perm
arke
ts a
nd d
rugs
tore
s nea
r the
edg
es
of T
own
and
in p
art d
ue to
the
lack
of r
etai
l in
Mon
te S
eren
o, S
arat
oga
and
othe
r ne
arby
uni
ncor
pora
ted
area
s.
−
Inje
ctio
ns a
re a
lso
high
for m
otor
veh
icle
and
par
ts d
eale
rs a
nd fo
od se
rvic
es
(whi
ch in
clud
es re
stau
rant
s).
Two
cate
gorie
s, bu
ildin
g m
ater
ials
and
gen
eral
m
erch
andi
se st
ores
, sta
nd o
ut fo
r the
ir su
bsta
ntia
l lea
kage
s.
−
The
Tow
n’s p
rimar
y re
tail
area
s are
the
Dow
ntow
n, L
os G
atos
Bou
leva
rd a
nd th
e fo
ur n
eigh
borh
ood
cent
ers.
The
se a
reas
com
bine
d m
ake
up 5
9 pe
rcen
t of a
ll Lo
s G
atos
reta
il ou
tlets
but
gen
erat
e 88
per
cent
of t
he T
own’
s tax
able
reta
il sa
les.
Lo
s Gat
os’ D
ownt
own,
whi
le im
pact
ed b
y re
gion
al a
nd n
atio
nal e
cono
mic
tren
ds, h
as re
mai
ned
a st
rong
regi
onal
reta
il de
stin
atio
n, a
ttrac
ting
shop
pers
from
out
side
the
Tow
n.
−
Dow
ntow
n is
seen
as a
reta
il de
stin
atio
n, d
raw
ing
shop
pers
from
Los
Gat
os a
s wel
l as
oth
er n
earb
y co
mm
uniti
es.
Dow
ntow
n is
als
o a
tour
ist d
estin
atio
n, w
ith o
ut-o
f-to
wne
rs c
omin
g to
exp
erie
nce
the
smal
l tow
n an
d pe
dest
rian-
frie
ndly
am
bien
ce.
In
2010
, Dow
ntow
n Lo
s Gat
os g
ener
ated
app
roxi
mat
ely
$209
mill
ion
in ta
xabl
e re
tail
sale
s, or
ove
r 50
perc
ent o
f the
Tow
n’s t
otal
taxa
ble
reta
il sa
les,
conf
irmin
g its
si
gnifi
canc
e as
a sh
oppi
ng d
estin
atio
n an
d as
a ta
x ge
nera
tor f
or th
e To
wn.
− O
n an
infla
tion-
adju
sted
bas
is, t
his s
ales
leve
l has
dec
lined
from
taxa
ble
sale
s of
$225
mill
ion
in 2
008,
but
has
rebo
unde
d fr
om $
198
mill
ion
in 2
009.
Thi
s rec
ent
uptic
k is
due
in p
art t
o in
crea
sing
sale
s at t
he A
pple
Sto
re.
− Th
e D
ownt
own
Cor
e ar
ea a
ccou
nts f
or n
early
thre
e-qu
arte
rs o
f all
busi
ness
es in
the
Dow
ntow
n. T
he la
rges
t con
cent
ratio
ns a
re in
app
arel
, eat
ing
and
drin
king
, and
ot
her r
etai
l, w
hich
incl
udes
var
ious
type
s of s
peci
alty
reta
il ou
tlets
such
as s
porti
ng
good
s, to
y, a
nd b
ooks
/sta
tione
ry st
ores
. Th
e C
ore
is c
hara
cter
ized
by
smal
ler f
loor
pl
ates
, and
bec
ause
of t
he fo
rmul
a re
tail
ordi
nanc
e as
wel
l as t
he li
mite
d nu
mbe
r of
larg
er st
ore
spac
es a
vaila
ble,
the
Cor
e co
ntai
ns fe
w c
hain
reta
ilers
.
N
orth
For
ty S
peci
fic P
lan
Mar
ket S
tudy
and
Bus
ines
s Dev
elop
men
t Stra
tegy
Pa
ge 3
of 1
50

−
Form
ula
reta
il, w
hile
rest
ricte
d in
the
Dow
ntow
n C
ore,
nev
erth
eles
s acc
ount
s for
a
sign
ifica
nt p
ropo
rtion
of t
axab
le re
tail
sale
s. In
201
0, st
ores
des
igna
ted
as fo
rmul
a re
tail
in th
e D
ownt
own
Cor
e pr
ovid
ed o
ver 3
0 pe
rcen
t of t
axab
le re
tail
sale
s in
the
area
, whi
le m
akin
g up
onl
y 11
per
cent
of t
he re
tail
outle
ts (e
xclu
ding
food
-rel
ated
re
tail
and
serv
ice
stat
ions
). E
xclu
ding
thes
e sa
me
outle
ts, (
not s
ubje
ct to
the
form
ula
reta
il or
dina
nce)
, for
mul
a re
taile
rs a
ccou
nt fo
r ove
r hal
f of t
he ta
xabl
e re
tail
sale
s in
the
Dow
ntow
n C
ore.
Lo
s Gat
os B
oule
vard
is a
mix
of c
omm
unity
shop
ping
cen
ters
anc
hore
d by
supe
rmar
kets
, aut
o de
aler
s and
rela
ted
busi
ness
es, a
nd fr
ee-s
tand
ing
reta
il ou
tlets
.
−
The
four
larg
er sh
oppi
ng c
ente
rs a
re a
ll an
chor
ed b
y su
perm
arke
ts, i
n a
clus
ter t
hat
serv
es L
os G
atos
and
nea
rby
area
s of C
ampb
ell a
nd S
an Jo
se.
The
high
pro
porti
on
of su
perm
arke
ts in
dica
tes t
he a
rea
is a
shop
ping
des
tinat
ion
for f
ood
item
s.
− Lo
s Gat
os B
oule
vard
had
taxa
ble
reta
il sa
les o
f app
roxi
mat
ely
$152
mill
ion
in
2010
, a st
eep
decl
ine
from
ear
lier y
ears
resu
lting
larg
ely
from
dec
reas
ing
sale
s in
the
auto
mot
ive
sect
or.
Th
e ne
ighb
orho
od c
ente
rs a
re la
rgel
y oc
cupi
ed b
y lo
cal-s
ervi
ng re
taile
rs p
rovi
ding
eve
ryda
y co
nven
ienc
e go
ods a
nd se
rvic
es.
−
Los G
atos
has
four
maj
or n
eigh
borh
ood
cent
ers:
Rin
cona
da C
ente
r, D
owni
ng
Cen
ter,
Wal
gree
ns S
quar
e, a
nd V
ason
a St
atio
n.
−
Thes
e ne
ighb
orho
od c
ente
rs a
re a
ll lo
cate
d at
or n
ear t
he T
own
boun
darie
s, th
us
attra
ctin
g sh
oppe
rs fr
om o
utsi
de th
e To
wn
sinc
e th
ey re
pres
ent t
he c
lose
st g
roce
ry
or d
rug
stor
e sh
oppi
ng.
Thes
e ce
nter
s com
bine
d ac
coun
ted
for a
muc
h sm
alle
r pr
opor
tion
of re
tail
sale
s tha
n D
ownt
own
or L
os G
atos
Bou
leva
rd.
Th
e Re
tail
Trad
e Ar
ea c
onta
ins a
larg
e m
ix a
nd v
arie
ty o
f reg
iona
l ret
ail s
hopp
ing
dest
inat
ions
w
hich
will
be
com
petit
ive
with
any
regi
on-s
ervi
ng re
tail
at th
e N
orth
40.
− Th
e R
TA’s
reta
il sa
les f
or 2
008
are
estim
ated
at a
ppro
xim
atel
y $8
.4 b
illio
n, a
bout
10
tim
es th
e sa
les i
n Lo
s Gat
os a
lone
. Th
e R
TA’s
leve
ls o
f per
cap
ita re
tail
sale
s ar
e on
ly a
bout
hal
f the
leve
ls fo
r the
Tow
n.
−
Leve
ls o
f lea
kage
s and
inje
ctio
ns a
ppea
r to
be m
uch
low
er o
n a
per c
apita
bas
is,
indi
catin
g a
rela
tive
bala
nce
betw
een
reta
il sa
les a
nd re
side
nt e
xpen
ditu
res i
n m
ost
cate
gorie
s.
Nor
th F
orty
Spe
cific
Pla
n M
arke
t Stu
dy a
nd B
usin
ess D
evel
opm
ent S
trate
gy
Page
4 o
f 150

The
Tow
n m
ay b
e ab
le to
enh
ance
its r
etai
l bas
e in
a ra
nge
of re
tail
type
s.
−
Alo
ng w
ith g
ener
al m
erch
andi
se st
ores
and
hom
e im
prov
emen
t cen
ters
, spe
cific
st
ore
type
s tha
t app
ear t
o be
lack
ing
in sa
les i
n th
e To
wn
incl
ude
appl
ianc
e st
ores
, an
d sp
ecia
lty fo
od st
ores
such
as m
eat m
arke
ts, f
ish
and
seaf
ood
mar
kets
, and
pr
oduc
e m
arke
ts.
The
sale
s inj
ectio
ns fo
r clo
thin
g an
d cl
othi
ng a
cces
sorie
s sto
res
refle
cts a
n ov
eral
l stre
ngth
, but
the
appa
rel s
tore
s in
the
Tow
n te
nd to
be
high
-end
st
ores
, not
nec
essa
rily
carr
ying
the
type
s of i
nexp
ensi
ve e
very
day
appa
rel m
ore
com
mon
ly fo
und
in m
any
gene
ral m
erch
andi
se st
ores
.
−
Giv
en th
e To
wn’
s alre
ady-
stro
ng a
ttrac
tion
as a
food
shop
ping
des
tinat
ion
and
dem
ogra
phic
pro
file,
the
lack
of s
peci
alty
food
stor
es m
ay a
lso
repr
esen
t an
oppo
rtuni
ty to
bro
aden
the
food
reta
iling
mix
and
enh
ance
the
Tow
n’s s
trong
po
sitio
n fo
r thi
s ret
ail c
ateg
ory.
− To
som
e ex
tent
, the
leak
age
of re
tail
sale
s in
certa
in c
ateg
orie
s dom
inat
ed b
y la
rge-
form
at st
ores
of 3
0,00
0 sq
uare
feet
or m
ore
refle
cts t
he T
own’
s des
ire to
reta
in a
sm
all-t
own
feel
, with
smal
ler s
hops
and
in th
e D
ownt
own
Cor
e, li
mite
d fo
rmul
a re
tail.
As a
resu
lt, th
ere
are
few
reta
il sp
aces
in L
os G
atos
of a
ppro
xim
atel
y 10
,000
squa
re fe
et o
r mor
e th
at a
re a
vaila
ble
to a
ccom
mod
ate
larg
er u
sers
such
as
appl
ianc
e st
ores
, hom
e im
prov
emen
t sto
res,
or g
ener
al m
erch
andi
se st
ores
. W
hile
th
e To
wn
will
und
oubt
edly
seek
to re
tain
its c
hara
cter
, app
ropr
iate
ly d
esig
ned
deve
lopm
ent a
t the
Nor
th 4
0 si
te m
ay p
rese
nt a
n op
portu
nity
to p
rovi
de re
tail
spac
e fo
r lar
ger u
sers
that
mig
ht c
ompl
emen
t the
exi
stin
g re
tail
mix
in L
os G
atos
an
d pr
ovid
e go
ods a
nd se
rvic
es th
at re
side
nts c
urre
ntly
seek
els
ewhe
re.
N
orth
For
ty S
peci
fic P
lan
Mar
ket S
tudy
and
Bus
ines
s Dev
elop
men
t Stra
tegy
Pa
ge 5
of 1
50
Offi
ce M
arke
t Ass
essm
ent
Whi
le th
e Lo
s Gat
os o
ffice
mar
ket c
ompr
ises
a sm
all p
erce
ntag
e of
the
regi
onal
offi
ce m
arke
t it h
as
perf
orm
ed b
ette
r offi
ce sp
ace
in th
e M
arke
t Are
a an
d So
uth
Bay,
− Lo
s Gat
os c
urre
ntly
has
an
offic
e in
vent
ory
estim
ated
by
Cor
nish
and
Car
ey
Com
mer
cial
New
mar
k K
nigh
t Fra
nk to
be
appr
oxim
atel
y 1.
4 m
illio
n sq
uare
feet
, re
pres
entin
g ap
prox
imat
ely
2.2
of to
tal i
nven
tory
in th
e So
uth
Bay
.
− H
isto
rical
ly th
e Lo
s Gat
os o
ffic
e m
arke
t has
gen
eral
ly o
utpe
rfor
med
its M
arke
t Are
a an
d So
uth
Bay
ben
chm
arks
with
hig
her o
ccup
ancy
rate
s and
rent
s. T
he c
urre
nt
aver
age
full-
serv
ice
aski
ng re
nt in
Los
Gat
os is
$2.
58 p
er sq
uare
foot
com
pare
d to
$2
.39
for s
pace
in th
e M
arke
t Are
a an
d $2
.48
in th
e So
uth
Bay
as a
who
le.
Los G
atos
ha
s an
offic
e va
canc
y ra
te o
f 8.8
per
cent
com
pare
d to
9.3
per
cent
in th
e M
arke
t Are
a an
d 16
.6 p
erce
nt in
the
Sout
h B
ay.
The
Tow
n’s h
ighe
r lea
se ra
tes a
nd lo
wer
vac
ancy
ra
te in
dica
te th
at is
an
attra
ctiv
e an
d de
sira
ble
offic
e lo
catio
n.
−
Dur
ing
the
Gre
at R
eces
sion
Los
Gat
os re
nts w
ere
com
pres
sed
to n
ear t
he m
arke
t av
erag
e an
d ha
ve re
boun
ded
slig
htly
dur
ing
the
curr
ent r
ecov
ery.
Whi
le d
eman
d el
sew
here
in th
e So
uth
Bay
has
sign
ifica
ntly
stre
ngth
ened
, off
ice
dem
and
has n
ot fu
lly
reco
vere
d in
Los
Gat
os.
Dem
and
tend
s to
be d
riven
by
smal
ler u
sers
and
end
use
rs th
at
requ
ire la
rger
floo
r pla
tes s
uch
as N
etfli
x.
The
Nor
th 4
0 w
ould
be
an a
ttrac
tive
site
for o
ffice
and
em
ploy
men
t pro
ject
ions
supp
ort
cons
truc
tion
of o
ffice
spac
e, ta
king
into
acc
ount
exi
stin
g va
cant
spac
e an
d pl
anne
d an
d pr
opos
ed
proj
ects
.
− B
ased
upo
n em
ploy
men
t pro
ject
ions
pre
pare
d by
the
Ass
ocia
tion
of B
ay A
rea
Gov
ernm
ents
(AB
AG
), B
AE
estim
ates
that
the
Mar
ket A
rea
can
supp
ort a
n ad
ditio
nal
698,
000
to 9
57,0
00 fe
et o
f new
off
ice
spac
e be
twee
n 20
10 a
nd 2
030
afte
r acc
ount
ing
for p
lann
ed a
nd p
ropo
sed
proj
ects
, inc
ludi
ng th
e pr
opos
ed 5
50,0
00 sq
uare
foot
off
ice
use
at th
e A
lbrig
ht si
te in
Los
Gat
os.
− W
ith it
s stro
ng lo
catio
n, th
e N
orth
40
site
cou
ld c
aptu
re b
etw
een
70,0
00 a
nd 1
91,0
00
squa
re fe
et o
f thi
s tot
al n
et d
eman
d, a
pply
ing
a 10
and
20
perc
ent c
aptu
re ra
te.
−
Pote
ntia
l off
ice
prod
uct t
ypes
cou
ld in
clud
e la
rger
Cla
ss A
spac
e fo
r lar
ger u
sers
or a
n en
d us
er (1
00,0
00+
squa
re fe
et) o
r med
ical
off
ices
. A
noth
er p
oten
tial t
arge
t mar
ket
coul
d be
mul
titen
ant C
lass
B o
r A sp
ace
for s
tart-
ups,
smal
l ven
ture
s, an
d m
edic
al
offic
e th
at w
ould
find
the
who
le p
acka
ge o
f Nor
th 4
0 am
eniti
es h
ighl
y at
tract
ive
(e.g
., re
tail
and
hote
l/mee
ting
spac
e).
Nor
th F
orty
Spe
cific
Pla
n M
arke
t Stu
dy a
nd B
usin
ess D
evel
opm
ent S
trate
gy
Page
6 o
f 150
Hot
el M
arke
t Ass
essm
ent
Los G
atos
has
two
exis
ting
high
-end
full
serv
ice
hote
l pro
pert
ies.
The
per
form
ance
of h
otel
s with
in
the
Mar
ket A
rea
has f
ollo
wed
the
busi
ness
cyc
le b
ut h
as o
ut-p
erfo
rmed
its S
anta
Cla
ra C
ount
y be
nchm
ark.
− Th
e M
arke
t Are
a fo
r hot
els h
as a
n in
vent
ory
of a
lmos
t 2,0
00 ro
oms,
repr
esen
ting
7.6
perc
ent o
f the
tota
l roo
ms i
n Sa
nta
Cla
ra C
ount
y. O
ver 7
9 pe
rcen
t of t
hese
room
s in
the
Mar
ket A
rea
are
in p
rope
rties
con
side
red
as “
upsc
ale”
or b
ette
r by
Smith
Tra
vel
Res
earc
h (S
TR).
−
Los G
atos
is h
ome
to tw
o hi
gh-e
nd fu
ll se
rvic
e ho
tels
with
186
room
s, or
9%
of h
igh-
end
hote
l roo
ms i
n th
e M
arke
t Are
a.
−
Thro
ugho
ut th
e cu
rren
t bus
ines
s cyc
le, h
otel
pro
perti
es in
the
Mar
ket A
rea
have
co
nsis
tent
ly o
ut-p
erfo
rmed
thos
e in
oth
er p
arts
of S
anta
Cla
ra C
ount
y w
ith re
spec
t to
occu
panc
y le
vels
and
room
reve
nues
. O
ccup
ancy
in M
arke
t Are
a pr
oper
ties p
eake
d at
75
per
cent
in 2
007,
fell
to a
low
of 6
5 pe
rcen
t, an
d re
cove
red
to 7
2 pe
rcen
t as o
f the
en
d of
201
0. I
n co
ntra
st, p
rope
rties
in S
anta
Cla
ra C
ount
y ro
se to
a h
igh
of 7
0 pe
rcen
t in
200
7, d
ropp
ed to
a lo
w o
f 58
perc
ent i
n 20
09, a
nd ro
se b
ack
to 6
8 pe
rcen
t in
2010
.
−
Rev
enue
s in
the
Mar
ket A
rea
have
not
reco
vere
d as
stro
ngly
as o
ccup
ancy
: the
ave
rage
da
ily ra
te p
eake
d at
$14
8 in
200
8 an
d no
w st
ands
at $
127.
Rev
enue
per
ava
ilabl
e ro
om
also
follo
ws a
sim
ilar t
rend
. H
ighe
r occ
upan
cies
hav
e be
en a
chie
ved
by m
aint
aini
ng
com
petit
ive
room
rate
s. W
hile
a sm
all p
art o
f the
Mar
ket A
rea
and
Sant
a C
lara
hos
pita
lity
mar
ket,
Los G
atos
has
bee
n an
at
trac
tive
dest
inat
ion.
− In
terv
iew
s with
key
com
mun
ity a
nd b
usin
ess i
nfor
man
ts in
dica
te th
at L
os G
atos
’ ex
istin
g lo
dgin
g fa
cilit
ies a
nd o
vera
ll co
mm
unity
am
eniti
es c
ompl
emen
t the
mai
n de
man
d dr
iver
s for
ove
rnig
ht ro
om st
ays i
n Lo
s Gat
os, w
hich
incl
ude:
• B
usin
ess t
rave
l gen
erat
ed n
ot o
nly
by fi
rms l
ocat
ed in
Los
Gat
os, b
ut a
lso
thos
e lo
cate
d in
dow
ntow
n Sa
n Jo
se a
nd o
ther
are
as o
f cen
tral S
ilico
n V
alle
y; g
ener
al m
anag
ers o
f loc
al h
otel
s hav
e fo
und
cons
ider
able
succ
ess
mar
ketin
g to
hig
h-le
vel b
usin
ess t
rave
lers
, par
ticul
arly
thos
e w
ho tr
avel
w
ith th
eir s
pous
es;
• Le
isur
e tra
vel r
elat
ed to
shop
ping
and
din
ing
in d
ownt
own
Los G
atos
, as
wel
l as a
rea
win
erie
s; a
nd
• W
eddi
ngs a
nd o
ther
soci
al e
vent
s.
N
orth
For
ty S
peci
fic P
lan
Mar
ket S
tudy
and
Bus
ines
s Dev
elop
men
t Stra
tegy
Pa
ge 7
of 1
50
New
hot
el c
onst
ruct
ion
is p
lann
ed in
Cup
ertin
o.
−
Two
plan
ned
and
prop
osed
hot
el p
roje
cts w
ould
add
as m
any
as 3
70 ro
oms t
o th
e M
arke
t Are
a w
ith a
t lea
st 1
23 ro
oms d
eem
ed u
psca
le o
r bet
ter.
The
se tw
o pr
ojec
ts a
re
loca
ted
at th
e no
rther
n en
d of
the
Mar
ket A
rea
in C
uper
tino.
Th
ere
are
oppo
rtun
ities
for n
ew h
otel
dev
elop
men
t at t
he N
orth
40
site
.
− Th
ere
is a
not
ewor
thy
lack
of n
atio
nal a
nd g
loba
l lux
ury
hote
l bra
nded
pro
perti
es in
Si
licon
Val
ley.
The
loca
tion
and
setti
ng o
f the
Nor
th 4
0 co
uple
d w
ith L
os G
atos
’ ric
h se
t of a
men
ities
may
be
attra
ctiv
e to
luxu
ry h
otel
iers
look
ing
for a
Sili
con
Val
ley
pres
ence
or t
o bo
utiq
ue o
pera
tors
/dev
elop
ers s
eeki
ng to
exp
and
in th
e M
arke
t Are
a.
−
One
dis
adva
ntag
e to
the
Nor
th 4
0 si
te fo
r glo
bal l
uxur
y br
ands
is it
s loc
atio
n ou
tsid
e a
maj
or b
usin
ess c
lust
er.
Con
fere
nce/
Mee
ting
Spac
e M
arke
t Ass
essm
ent
−
Ther
e is
a g
ener
al la
ck o
f mee
ting
and
conf
eren
ce sp
ace
that
can
acc
omm
odat
e m
ore
than
250
per
sons
in th
e M
arke
t Are
a.
−
Inte
rvie
ws w
ith k
ey in
form
ants
indi
cate
that
ther
e w
ould
be
loca
l sup
port
for n
ew,
stat
e-of
-the-
art m
eetin
g fa
cilit
ies w
ith a
cap
acity
of 2
50 to
500
per
sons
.
Stra
tegi
es fo
r Nor
th 4
0 D
evel
opm
ent
Dev
elop
ing
Use
s C
ompl
emen
tary
to D
ownt
own
Los
Gat
os
The
Gen
eral
Pla
n EI
R g
uida
nce
stat
es th
at n
ew d
evel
opm
ent a
t the
Nor
th 4
0 sh
ould
“co
mpl
emen
t an
d no
t com
pete
with
Los
Gat
os’ d
ownt
own
and
the
rest
of t
he c
omm
unity
.” B
AE
has f
orm
ulat
ed
seve
ral s
trate
gies
to h
onor
this
goa
l of c
ompl
emen
tary
reta
il de
velo
pmen
t: R
etai
l Stra
tegy
1: E
stab
lish
a cl
ear d
iffer
ence
in th
e sh
oppi
ng e
xper
ienc
e be
twee
n th
e D
ownt
own
and
Nor
th 4
0. T
he T
own’
s For
mul
a R
etai
l Ord
inan
ce h
elps
mai
ntai
n th
e do
wnt
own’
s sm
all-t
own
feel
and
a la
rge
pres
ence
of i
ndep
ende
nt re
taile
rs w
ith u
niqu
e pr
oduc
ts a
nd se
rvic
es a
nd
limits
the
num
ber o
f for
mul
a re
taile
rs su
ch a
s the
pre
sent
mix
of S
ur L
a Ta
ble,
App
le S
tore
, B
anan
a R
epub
lic, R
esto
ratio
n H
ardw
are,
and
the
Gap
am
ong
othe
rs.
The
Nor
th 4
0 ex
perie
nce
shou
ld b
e di
ffer
entia
ted
by a
focu
s on
form
ula
reta
il w
ith le
ss e
mph
asis
on
inde
pend
ent r
etai
lers
. A
ddin
g fo
rmul
a re
tail
to th
e To
wn-
wid
e in
vent
ory
of re
tail
prop
ertie
s wou
ld h
elp
Los G
atos
ca
ptur
e sa
les (
and
gene
rate
add
ition
al sa
les t
ax re
venu
e) fr
om T
own
resi
dent
s who
cur
rent
ly tr
avel
ou
tsid
e th
e to
wn
to sh
op a
t for
mul
a re
tail
outle
ts a
s wel
l as f
rom
shop
pers
who
wou
ld c
ome
from
ou
tsid
e Lo
s Gat
os.
Ther
e ar
e se
vera
l loc
al e
xam
ples
of d
ownt
owns
and
new
shop
ping
com
plex
es
com
plem
entin
g ea
ch o
ther
with
such
diff
eren
tiate
d sh
oppi
ng e
xper
ienc
es: D
ownt
own
and
Stan
ford
Nor
th F
orty
Spe
cific
Pla
n M
arke
t Stu
dy a
nd B
usin
ess D
evel
opm
ent S
trate
gy
Page
8 o
f 150

Shop
ping
Cen
ter i
n Pa
lo A
lto, a
nd E
lmw
ood/
Roc
krid
ge a
nd B
ay S
treet
in th
e in
ner E
ast B
ay
(Ber
kele
y, O
akla
nd, a
nd E
mer
yvill
e).
Ret
ail S
trat
egy
1.1:
For
mul
ate
a co
ordi
nate
d m
arke
t cam
paig
n fo
r bo
th th
e D
ownt
own
and
Nor
th 4
0 re
tail
deve
lopm
ent.
A c
oope
rativ
e m
arke
ting
effo
rt be
twee
n th
e To
wn
of L
os G
atos
, loc
al D
ownt
own
mer
chan
ts, a
nd th
e N
orth
40
deve
lope
r can
hel
p br
and
and
posi
tion
each
reta
il di
stric
t app
ropr
iate
ly to
rein
forc
e th
eir r
espe
ctiv
e co
re
stre
ngth
s and
cro
ss-m
arke
t eve
nts a
nd a
nnou
ncem
ents
–al
l to
rein
forc
e Lo
s Gat
os a
s a
shop
ping
des
tinat
ion.
R
etai
l Str
ateg
y 1.
2: C
ontin
ue a
nd E
nhan
ce D
ownt
own
Mer
chan
t Vita
lity
Prog
ram
s.
The
Tow
n of
Los
Gat
os p
rese
ntly
ope
rate
s sev
eral
pro
gram
s orie
nted
to b
usin
ess
deve
lopm
ent a
nd m
erch
ant a
ssis
tanc
e. T
hese
pro
gram
whi
ch in
clud
e bu
sine
ss w
orks
hops
in
par
tner
ship
with
the
Cha
mbe
r of C
omm
erce
and
Wes
t Val
ley
Col
lege
, men
torin
g se
rvic
es fo
r sm
all b
usin
esse
s, an
d m
arke
ting
even
ts, s
houl
d be
con
tinue
d an
d en
hanc
ed to
of
fer a
ssis
tanc
e to
mer
chan
ts d
ownt
own
to e
ffec
tivel
y m
arke
t to
new
shop
pers
bro
ught
in
by th
e N
orth
40.
R
etai
l Str
ateg
y 1.
3: R
einf
orce
the
Dow
ntow
n’s R
ole
as C
omm
unity
Hub
and
Soc
ial
Cen
ter.
By
cont
inui
ng to
pro
gram
Far
mer
s Mar
kets
, mus
ic a
nd a
rt fe
stiv
als,
and
spec
ial
even
ts, L
os G
atos
can
mai
ntai
n th
e D
ownt
own
as th
e To
wn’
s com
mun
ity h
ub.
With
its
dive
rse
set o
f bui
ldin
gs a
nd tr
aditi
onal
stre
et la
yout
the
Dow
ntow
n of
fers
an
auth
entic
sm
all d
ownt
own
expe
rienc
e th
at is
har
d fo
r a n
ew d
evel
opm
ent t
hat i
s pla
nned
at o
ne ti
me
to re
prod
uce
and
com
pete
with
. Th
e re
cent
repo
rted
purc
hase
of t
he L
os G
atos
The
ater
by
a lo
cal i
nves
tmen
t gro
up to
kee
p it
as a
smal
l mov
ie th
eate
r will
boo
st th
e To
wn’
s eff
orts
to
mai
ntai
n a
vita
l Dow
ntow
n.
R
etai
l Str
ateg
y 1.
4: B
rand
ing
and
Iden
tify
for
Los
Gat
os S
hopp
ing
Dis
tric
ts.
The
bran
ding
of t
he N
orth
40
for a
ny re
tail
use
shou
ld b
e ap
proa
ched
from
the
idea
that
stro
ng
iden
titie
s for
all
Los G
atos
’ sho
ppin
g di
stric
ts sh
ould
be
rein
forc
ed a
nd b
rand
ed to
off
er
Los G
atos
as a
who
le “
pack
age”
of s
hopp
ing
and
leis
ure
activ
ities
, inc
ludi
ng n
earb
y w
iner
ies.
Bra
ndin
g an
d id
entit
y sh
ould
be
acco
mpl
ishe
d in
par
t by
wel
l des
igne
d an
d co
nsis
tent
ly a
pplie
d w
ayfin
ding
and
sign
age
treat
men
ts th
at c
lear
ly id
entif
y w
here
one
is
with
in th
e To
wn.
For
new
shop
pers
com
ing
into
Los
Gat
os fo
r ret
ail a
t the
Nor
th 4
0, th
e N
orth
40
coul
d se
rve
as a
“ga
tew
ay”
to th
e To
wn
with
info
rmat
ion
kios
ks (b
oth
porta
ble/
seas
onal
and
per
man
ent).
R
etai
l Str
ateg
y 1.
5: Im
prov
e W
ay F
indi
ng a
nd P
ublic
Par
king
Sig
nage
. So
me
key
info
rman
ts re
porte
d th
at a
per
cept
ion
of la
ck o
f par
king
pre
sent
s a b
arrie
r to
loca
l res
iden
ts
patro
nizi
ng D
ownt
own
mer
chan
ts a
nd b
usin
esse
s. M
ost r
esid
ents
vis
it D
ownt
own
by c
ar
and
park
ing
whi
le a
dequ
ate
is so
met
imes
be
diff
icul
t to
find
or is
not
alw
ays i
n th
e m
ost
N
orth
For
ty S
peci
fic P
lan
Mar
ket S
tudy
and
Bus
ines
s Dev
elop
men
t Stra
tegy
Pa
ge 9
of 1
50
conv
enie
nt lo
catio
ns.
Inst
alla
tion
of b
ette
r d
irect
iona
l sig
nage
or e
lect
roni
c si
gns w
ith
avai
labl
e sp
aces
not
ed lo
ts c
ould
hel
p ov
erco
me
this
per
cept
ion.
R
etai
l Str
ateg
y 1.
6: P
rovi
de S
hutt
le o
r “S
hare
d B
ike”
Pro
gram
to L
ink
Nor
th 4
0 an
d D
ownt
own.
By
prov
idin
g a
shut
tle c
onne
ctio
n an
d/or
free
bic
ycle
rent
al, t
he N
orth
40
and
Dow
ntow
n co
uld
be li
nked
to p
rom
ote
easy
mov
emen
t bet
wee
n th
e tw
o di
stric
ts.
Man
y ci
ties i
n bo
th th
e U
nite
d St
ates
and
Eur
ope
(suc
h as
Par
is, P
ortla
nd, a
nd P
ragu
e) p
rovi
de
free
, sha
red-
use
bicy
cles
to e
ncou
rage
sust
aina
ble
and
heal
thy
alte
rnat
ive
trans
porta
tion
over
shor
t dis
tanc
es.
Stat
ions
cou
ld b
e es
tabl
ishe
d at
the
Nor
th 4
0 an
d D
ownt
own.
Stra
tegy
2: P
rom
ote
New
Ret
ail a
t the
Nor
th 4
0 to
Pro
vide
Goo
ds a
nd S
ervi
ces
that
are
Le
akin
g fro
m th
e C
omm
unity
and
Gen
erat
e M
ore
Sal
es T
ax R
even
ue fo
r the
Tow
n. T
o st
reng
then
and
div
ersi
fy it
s sal
es ta
x ba
se, t
he T
own
shou
ld c
onsi
der p
rom
otin
g ne
w fo
rmul
a re
tail
at th
e N
orth
40
site
sinc
e th
e To
wn’
s ow
n ex
perie
nce
with
form
ula
reta
il D
ownt
own
has s
how
n th
at ju
st a
few
form
ula
reta
ilers
can
gen
erat
e a
larg
e am
ount
of s
ales
tax
reve
nue.
The
Nor
th 4
0 co
uld
offe
r a n
ew a
nd fr
esh
shop
ping
exp
erie
nce
in c
ontra
st to
som
e of
the
olde
r fac
ilitie
s out
side
th
e To
wn
in th
e R
TA, t
hus p
oten
tially
attr
actin
g ne
w sh
oppe
rs fr
om o
utsi
de th
e To
wn.
Stra
tegy
2.1
: Avo
id “
Tax
-shi
ftin
g” fr
om R
eloc
atio
n of
For
mul
a R
etai
l Dow
ntow
n to
N
orth
40.
Whi
le so
me
may
dis
favo
r for
mul
a re
tail
Dow
ntow
n, in
ord
er fo
r the
Tow
n to
re
aliz
e a
net f
isca
l gai
n, fo
rmul
a re
taile
rs D
ownt
own
shou
ld b
e en
cour
aged
to re
mai
n D
ownt
own
and
not r
eloc
ate
to th
e N
orth
40.
Thi
s can
be
achi
eved
thro
ugh
non-
com
pete
cl
ause
s in
the
Tow
n’s d
evel
opm
ent a
gree
men
t with
the
Nor
th 4
0 de
velo
per o
r thr
ough
ot
her l
egal
ly a
ppro
pria
te m
echa
nism
s. S
trate
gy 4
: Pro
mot
e N
ew R
etai
lers
that
will
Cap
ture
Exi
stin
g S
ales
Lea
kage
. Lo
s Gat
os
shou
ld c
onsi
der u
sing
the
Nor
th 4
0 de
velo
pmen
t opp
ortu
nity
to e
stab
lish
new
reta
il us
es in
the
gene
ral m
erch
andi
se h
ome
impr
ovem
ent c
ateg
orie
s by
perm
ittin
g la
rger
floo
r pla
te (e
.g.,
over
30
,000
squa
re fo
ot) f
loor
pla
tes.
Ret
ail S
trate
gy 5
: Enc
oura
ge N
ew S
peci
alty
Ret
ail a
t Nor
th 4
0. L
os G
atos
shou
ld w
ork
with
th
e N
orth
40
deve
lope
r to
iden
tify
new
spec
ialty
reta
il us
es th
at w
ill c
ompl
emen
t the
Tow
n’s m
ix
such
as s
peci
alty
food
s (e.
g., “
mar
ket h
all”
), an
app
lianc
e st
ore,
as w
ell a
s for
mul
a re
tail
that
will
br
ing
in sh
oppe
rs fr
om o
utsi
de L
os G
atos
. R
etai
l Stra
tegy
3: E
ncou
rage
Nei
ghbo
rhoo
d an
d C
onve
nien
ce R
etai
l at t
he N
orth
40.
The
To
wn
shou
ld e
ncou
rage
nei
ghbo
rhoo
d an
d co
nven
ienc
e re
tail
at th
e N
orth
40
to su
ppor
t not
onl
y ne
w re
side
nts a
t the
site
but
oth
er n
earb
y re
side
ntia
l and
bus
ines
s nei
ghbo
rhoo
d ac
ross
Los
Gat
os
Bou
leva
rd.
N
orth
For
ty S
peci
fic P
lan
Mar
ket S
tudy
and
Bus
ines
s Dev
elop
men
t Stra
tegy
Pa
ge 1
0 of
150

N
orth
For
ty S
peci
fic P
lan
Mar
ket S
tudy
and
Bus
ines
s Dev
elop
men
t Stra
tegy
Pa
ge 1
1 of
150
Offi
ce S
trate
gy 1
: Pro
mot
e N
ew O
ffice
Spa
ce to
Exp
and
Tow
n In
vent
ory.
Los
Gat
os sh
ould
en
cour
age
a m
ix o
f new
off
ice
spac
e at
the
Nor
th 4
0 si
te g
eare
d to
pro
vidi
ng la
rge-
plac
e C
lass
A
offic
e as
wel
l as n
ew C
lass
A o
r B sp
ace
conf
igur
ed fo
r mul
titen
ants
. O
ffice
Stra
tegy
2: P
ursu
e th
e C
once
pt o
f a “L
os G
atos
Inno
vatio
n C
ente
r.” T
he N
orth
40
repr
esen
ts a
pot
entia
l opp
ortu
nity
to a
ccom
mod
ate
star
t-up
and
new
ven
ture
s and
cre
ate
jobs
by
esta
blis
hing
a fa
cilit
y pr
ovid
ing
shar
e-w
ork
spac
es a
nd so
cial
net
wor
king
/col
labo
ratio
n op
portu
nitie
s. H
otel
Stra
tegy
1:
Dev
elop
Lan
guag
e in
the
Spe
cific
Pla
n th
at w
ill E
ncou
rage
/Per
mit
a N
ew H
igh-
end
Hot
el/L
odgi
ng U
se a
t the
Nor
th 4
0. T
he T
own
shou
ld c
onsi
der a
hot
el u
se fo
r th
e N
orth
40
to e
xpan
d th
e To
wn’
s inv
ento
ry o
f hig
h-en
d ho
tel p
rope
rties
and
com
plet
e an
ove
rall
amen
ity p
acka
ge a
t the
Nor
th 4
0.
Mee
ting
Spa
ce S
trate
gy 1
: In
corp
orat
e M
eetin
g S
pace
into
a H
otel
Dev
elop
men
t. S
ince
a
day
conf
eren
ce c
ente
r typ
ical
ly re
quire
s sub
sidy
, the
Tow
n sh
ould
con
side
r inc
orpo
ratin
g a
conf
eren
ce/m
eetin
g sp
ace
use
into
a n
ew h
otel
pro
perty
. To
mee
t the
larg
e m
eetin
g sp
ace
gap
in
the
Mar
ket A
rea,
Los
Gat
os c
ould
con
side
r req
uirin
g as
has
the
City
of C
uper
tino
a sp
ace
with
a
capa
city
for u
p to
400
to 5
00 a
s a c
ondi
tion
of h
otel
use
. Th
e ho
tel w
ould
hav
e to
be
size
d ov
er
150
to 2
00 ro
oms t
o su
ppor
t suc
h a
mee
ting
spac
e.


Sit
e D
es
cri
pti
on
Th
e N
orth
40
site
is lo
cate
d in
the
Tow
n of
Los
Gat
os w
ithin
San
ta C
lara
Cou
nty.
The
Nor
th 4
0 ar
ea is
bou
nded
to th
e ea
st b
y Lo
s Gat
os B
oule
vard
, to
the
wes
t by
Hig
hway
17,
to th
e so
uth
by
Lark
Ave
nue,
and
to th
e no
rth b
y H
ighw
ay 8
5, a
nd c
onsi
sts o
f app
roxi
mat
ely
44 a
cres
. Th
e ar
ea is
pr
edom
inan
tly a
gric
ultu
ral i
n us
e, w
ith p
ocke
ts o
f exi
stin
g re
side
ntia
l use
prim
arily
alo
ng B
enne
tt W
ay, a
nd B
urto
n R
oad
and
seve
ral n
onre
side
ntia
l use
s loc
ated
alo
ng L
os G
atos
Bou
leva
rd.
The
area
con
sist
s of A
PNs 4
24-0
7-00
9, 0
10, 0
24 th
roug
h 02
7, 0
31 th
roug
h 03
7, 0
52 th
roug
h 05
4, 0
60,
063
thro
ugh
065,
070
, 081
thro
ugh
086,
090
, 094
thro
ugh
096,
099
, 100
, and
424
-06-
115,
116
, and
12
9. T
he si
te sl
opes
dow
nwar
d sl
ight
ly to
the
wes
t fro
m L
os G
atos
Bou
leva
rd.
Fi
gure
1:
Site
Map
Sou
rce:
Goo
gle
Ear
th P
ro
North 40
Project
Site
N
orth
For
ty S
peci
fic P
lan
Mar
ket S
tudy
and
Bus
ines
s Dev
elop
men
t Stra
tegy
Pa
ge 1
3 of
150

Sit
e L
oc
ati
on
Th
e N
orth
40
Spec
ific
Plan
Are
a (th
e “N
orth
40”
) is l
ocat
ed a
t the
inte
rsec
tion
of H
ighw
ay 1
7,
whi
ch c
onne
cts S
anta
Cru
z to
Sili
con
Val
ley,
and
Hig
hway
85,
whi
ch sw
ings
thro
ugh
wes
tern
Sa
nta
Cla
ra C
ount
y fr
om M
offe
tt Fi
eld
in M
ount
ain
Vie
w to
Sou
th S
an Jo
se.
In a
dditi
on, L
os
Gat
os B
oule
vard
, a b
usy
com
mer
cial
thor
ough
fare
, run
s alo
ng th
e ea
ster
n ed
ge o
f the
site
. Th
ese
high
way
s car
ry su
bsta
ntia
l vol
umes
of t
raff
ic, m
akin
g th
e N
orth
40
wel
l pos
ition
ed in
term
s of b
oth
vehi
cula
r acc
ess a
nd v
isib
ility
for a
var
iety
of c
omm
erci
al u
ses.
The
Nor
th 4
0’s l
ocat
ion
at th
e cr
ossr
oads
of t
he W
est V
alle
y’s f
reew
ay sy
stem
mak
es it
eas
y to
re
ach
man
y of
the
regi
on’s
maj
or a
ttrac
tions
. Si
tuat
ed in
Los
Gat
os a
mid
st S
anta
Cla
ra C
ount
y’s
afflu
ent r
esid
entia
l bel
t, th
e N
orth
40
is p
roxi
mat
e to
bot
h th
e sc
enic
San
ta C
ruz
Mou
ntai
ns a
nd th
e no
des o
f hig
h te
chno
logy
that
def
ine
Silic
on V
alle
y. T
he fo
llow
ing
two
tabl
es (T
able
s 1 a
nd 2
) de
tail
dist
ance
s and
driv
e tim
es b
etw
een
the
Nor
th 4
0 an
d th
e re
gion
’s k
ey a
ttrac
tions
and
maj
or
empl
oyer
s, re
spec
tivel
y. (
Not
e th
at th
e lis
t of m
ajor
em
ploy
ers i
s lim
ited
to th
e M
arke
t Are
a as
de
fined
for t
he o
ffic
e an
d ho
tel m
arke
ts.)
A d
iscu
ssio
n of
the
stra
tegi
c im
porta
nce
of th
ese
near
by
“dem
and
gene
rato
rs”
is p
rovi
ded
in th
e an
alyt
ical
sect
ions
that
follo
w.
N
orth
For
ty S
peci
fic P
lan
Mar
ket S
tudy
and
Bus
ines
s Dev
elop
men
t Stra
tegy
Pa
ge 1
5 of
150

Tabl
e 1:
Dem
and
Gen
erat
ors,
Sel
ecte
d So
uth
Bay
and
San
ta C
ruz
Are
a
Dis
tanc
efr
om S
iteD
rive
Tim
eD
eman
d G
ener
ator
s(m
iles)
(min
utes
) (a)
Not
es (b
)G
ood
Sam
arita
n H
ospi
tal (
San
Jos
e)0.
82
88,0
00 a
nnua
l pat
ient
day
sE
l Cam
ino
Hos
pita
l Los
Gat
os (c
)1.
87
Dow
ntow
n Lo
s G
atos
2.7
8S
anta
Cla
ra V
alle
y M
edic
al C
ente
r (S
an J
ose)
5.4
1012
6,00
0 an
nual
pat
ient
day
sS
anta
na R
ow/V
alle
y Fa
ir (S
an J
ose)
6.4
7O
ver 2
.0 m
illio
n sf
com
bine
d re
tail
Mon
talv
o A
rts C
ente
r (S
arat
oga)
6.5
1420
0,00
0 an
nual
vis
itors
Win
ches
ter M
yste
ry H
ouse
(San
Jos
e)6.
811
San
ta C
lara
Uni
vers
ity8.
512
9,00
0 fu
ll-tim
e st
uden
tsD
ownt
own
San
Jos
e9.
312
Det
ails
bel
owTr
iton
Mus
eum
of A
rt (S
anta
Cla
ra)
9.8
1517
5,00
0 an
nual
vis
itors
Nor
man
Y. M
inet
a S
an J
ose
Int'l
Airp
ort
10.8
178.
2 m
illion
ann
ual p
asse
nger
sS
anta
Cla
ra C
onve
ntio
n C
ente
r10
.819
302,
000
sf m
eetin
g sp
ace
NA
SA
Am
es R
esea
rch
Cen
ter (
Mtn
. Vie
w)
14.4
20C
ompu
ter H
isto
ry M
useu
m (M
tn. V
iew
)14
.919
75,0
00 a
nnua
l vis
itors
CA
's G
reat
Am
eric
a Th
eme
Par
k (S
anta
Cla
ra)
15.5
21S
tanf
ord
Uni
vers
ity21
.929
14,5
00 fu
ll-tim
e st
uden
tsU
C S
anta
Cru
z27
.138
16,7
50 fu
ll-tim
e st
uden
ts
Attr
actio
ns in
Dow
ntow
n Sa
n Jo
se
Chi
ldre
n's
Dis
cove
ry M
useu
m8.
312
300,
000
annu
al v
isito
rsS
an J
ose
Con
vent
ion
Cen
ter
8.9
1227
2,00
0 sf
mee
ting
spac
eS
an J
ose
Cen
ter f
or P
erfo
rmin
g A
rts8.
912
HP
Pav
ilion
9.0
1228
0,00
0 sf
mee
ting
spac
e;
seat
s up
to 2
0,00
0B
alle
t San
Jos
e9.
213
64,0
00 a
nnua
l atte
ndee
sTe
ch M
useu
m o
f Inn
ovat
ion
9.3
1344
6,00
0 an
nual
vis
itors
San
Jos
e S
tate
Uni
vers
ity9.
313
24,0
00 fu
ll-tim
e st
uden
tsS
an J
ose
Rep
erto
ry T
heat
er9.
514
100,
000
annu
al a
ttend
ees
San
Jos
e M
useu
m o
f Art
9.6
1489
,000
ann
ual v
isito
rsO
pera
San
Jos
e (C
alifo
rnia
The
ater
)9.
813
76,0
00 a
nnua
l atte
ndee
s
Not
es:
(a) D
rive
times
cal
cula
ted
from
the
inte
rsec
tion
of L
ark
Ave
. and
Los
Gat
os B
lvd.
usi
ng G
oogl
e M
aps.
(b) A
ll pe
rform
ance
figu
res
are
repo
rted
for 2
009.
(c) F
orm
erly
Com
mun
ity H
ospi
tal o
f Los
Gat
os.
Info
rmat
ion
on th
e nu
mbe
r of p
atie
nt d
ays
is u
nava
ilabl
e be
caus
e pa
tient
day
s at
the
Los
Gat
os c
ampu
s ar
e re
porte
d in
agg
rega
te w
ith th
ose
at th
e M
ount
ain
Vie
w c
ampu
s.S
ourc
es: S
ilicon
Val
ley/
San
Jos
e B
usin
ess
Jour
nal;
City
of S
an J
ose,
201
0; B
AE
, 201
1.
Nor
th F
orty
Spe
cific
Pla
n M
arke
t Stu
dy a
nd B
usin
ess D
evel
opm
ent S
trate
gy
Page
16
of 1
50

Tabl
e 2:
Maj
or P
ublic
and
Priv
ate
Sect
or E
mpl
oyer
s, M
arke
t Are
a, 2
010
D
ista
nce
Driv
e Ti
me
from
Site
(min
utes
)Pr
ivat
e Se
ctor
Em
ploy
ers
(a)
Indu
stry
Loca
tion
(mile
s) (b
)(b
) (c)
Empl
oyee
s(d
)G
ood
Sam
arita
n H
ospi
tal
Hea
lth c
are
San
Jos
e0.
82
1,85
0C
ourts
ide
Tenn
is C
lub
Hea
lth &
fitn
ess
Los
Gat
os1.
04
200
Col
umbi
a H
ealth
Car
e/M
issi
on O
aks
Hos
pita
lH
ealth
car
eLo
s G
atos
1.2
32,
000
Net
flix
E-c
omm
erce
Los
Gat
os1.
36
900
El C
amin
o H
ospi
tal L
os G
atos
Hea
lth c
are
Los
Gat
os1.
87
700
Bar
racu
da N
etw
orks
Inc.
Tele
com
mun
icat
ions
Cam
pbel
l1.
87
250
Xilin
x In
c.S
emic
ondu
ctor
sS
an J
ose
2.1
71,
320
Ala
in P
inel
Rea
ltors
Hom
e re
alty
Los
Gat
os2.
47
220
Ver
izon
Tele
com
mun
icat
ions
Los
Gat
os2.
78
200
(e)
eBay
Inc.
E-co
mm
erce
San
Jos
e4.
89
3,30
0O
'Con
nor H
ospi
tal
Hea
lth c
are
San
Jos
e6.
610
1,31
5Tr
end
Mic
ro In
c.So
ftwar
eC
uper
tino
7.7
1325
0O
racl
e C
orp.
Info
rmat
ion
tech
nolo
gyC
uper
tino
(f)7.
914
8,00
0(f)
Pega
syst
ems
(form
erly
Cho
rdia
nt)
Sof
twar
eC
uper
tino
8.0
1428
5H
ewle
tt-Pa
ckar
d C
o. (g
)In
form
atio
n te
chno
logy
Cup
ertin
o10
.215
3,00
0Ap
ple
Inc.
Com
pute
rs/c
onsu
mer
Cup
ertin
o (f)
10.6
1510
,000
(f)el
ectro
nics
Publ
ic S
ecto
r Em
ploy
ers
Los
Gat
os U
nion
Sch
ool D
istri
ctS
choo
l dis
trict
Los
Gat
os1.
34
300
Los
Gat
os-S
arat
oga
Hig
h S
choo
l Dis
trict
Sch
ool d
istri
ctLo
s G
atos
2.1
630
0S
anta
Cla
ra V
alle
y M
edic
al C
ente
rH
ealth
car
eS
an J
ose
5.7
104,
935
San
Jose
/Eve
rgre
en C
omm
. Col
lege
Dis
trict
Hig
her e
duca
tion
San
Jos
e (f)
6.0
121,
200
(f)C
uper
tino
Uni
on S
choo
l Dis
trict
Sch
ool d
istri
ctC
uper
tino
8.2
151,
679
Foot
hill/
De
Anz
a C
omm
. Col
lege
Dis
trict
Hig
her e
duca
tion
Cup
ertin
o (f)
8.7
131,
241
(f)
Not
es:
(a) L
arge
reta
ilers
wer
e om
itted
from
the
tabl
e as
they
are
unl
ikel
y to
gen
erat
e de
man
d fo
r eith
er c
onfe
renc
e sp
ace
orov
erni
ght r
oom
sta
ys.
(b) D
ista
nces
and
driv
e tim
es a
re re
porte
d fo
r the
hea
dqua
rters
or p
rinci
pal o
ffice
loca
tion
with
in th
e M
arke
t Are
a.(c
) Driv
e tim
es c
alcu
late
d fro
m th
e in
ters
ectio
n of
Lar
k Av
e. a
nd L
os G
atos
Blv
d. u
sing
Goo
gle
Map
s.(d
) Est
imat
es d
raw
n fro
m d
iffer
ent s
ourc
es w
ith d
iffer
ent s
tand
ards
of r
epor
ting.
The
refo
re, w
hile
som
e fig
ures
repr
esen
tfu
ll-tim
e eq
uiva
lent
em
ploy
ees,
oth
ers
repr
esen
t ful
l- an
d pa
rt-tim
e em
ploy
ees.
(e) N
umbe
r of e
mpl
oyee
s re
porte
d fo
r 200
9 be
caus
e 20
10 d
ata
was
not
ava
ilabl
e. H
owev
er, a
s To
wn
of L
os G
atos
reco
rds
show
em
ploy
men
t rem
aini
ng fl
at b
etw
een
2005
and
200
9, th
is a
ssum
ptio
n is
dee
med
fair
and
accu
rate
.(f)
Num
ber o
f em
ploy
ees
are
repo
rted
for a
ll of
Sili
con
Val
ley.
Est
imat
es o
f the
num
ber l
ocat
ed s
olel
y w
ithin
the
Mar
ket A
rea
wer
e no
t ava
ilabl
e.(g
) HP
has
sol
d its
Cup
ertin
o of
fices
to A
pple
and
pla
ns to
con
solid
ate
its w
orkf
orce
in P
alo
Alto
by
Oct
ober
201
2.
Sou
rces
: Sili
con
Val
ley/
San
Jos
e B
usin
ess
Jour
nal;
Tow
n of
Los
Gat
os; C
ity o
f Cam
pbel
l; C
ity o
f Cup
ertin
o; C
ity o
f San
Jose
, 201
0; C
ount
y of
San
ta C
lara
; BA
E, 2
011.
N
orth
For
ty S
peci
fic P
lan
Mar
ket S
tudy
and
Bus
ines
s Dev
elop
men
t Stra
tegy
Pa
ge 1
7 of
150

De
mo
gra
ph
ic O
ve
rvie
w
In th
is se
ctio
n B
AE
pres
ents
bac
kgro
und
info
rmat
ion
on c
urre
nt a
nd p
roje
cted
dem
ogra
phic
and
ec
onom
ic c
ondi
tions
in th
e To
wn
of L
os G
atos
and
the
Ret
ail T
rade
Are
a. F
or c
ompa
rison
pu
rpos
es, d
ata
from
San
ta C
lara
Cou
nty
as a
who
le a
nd th
e B
ay A
rea
are
also
pro
vide
d.
Dev
elop
ing
a pr
ofile
of h
ow L
os G
atos
and
surr
ound
ing
com
mun
ities
hav
e ch
ange
d—an
d ar
e ex
pect
ed to
cha
nge—
help
s to
iden
tify
key
fact
ors t
hat w
ill in
fluen
ce fu
ture
mar
ket c
ondi
tions
, an
d to
ass
ess t
he p
oten
tial i
mpa
cts o
f pro
spec
tive
deve
lopm
ent o
n ex
istin
g co
mm
erci
al p
rope
rties
an
d ce
nter
s. Th
is a
naly
sis u
tiliz
es d
ata
publ
ishe
d by
the
U.S
. Cen
sus B
urea
u, th
e C
alifo
rnia
Em
ploy
men
t D
evel
opm
ent D
epar
tmen
t (ED
D),
the
Ass
ocia
tion
of B
ay A
rea
Gov
ernm
ents
(AB
AG
), an
d C
larit
as—
a pr
ivat
e ve
ndor
that
pro
vide
s est
imat
es o
f cur
rent
and
futu
re d
emog
raph
ic c
ondi
tions
. D
efin
ition
of R
etai
l Tra
de A
rea
vs. M
arke
t Are
a O
ne g
oal o
f thi
s res
earc
h ef
fort
is to
pro
vide
an
over
view
of t
he m
arke
t dem
and
for s
ever
al
com
mer
cial
real
est
ate
prod
ucts
und
er c
onsi
dera
tion
as u
ses o
f the
Nor
th 4
0 Sp
ecifi
c Pl
an
prop
ertie
s (N
orth
40)
, inc
ludi
ng: r
etai
l, of
fice,
hot
el, a
nd m
eetin
g sp
ace.
In
a d
ense
ly u
rban
ized
are
a su
ch a
s Wes
tern
Sili
con
Val
ley
(Wes
t Val
ley)
, com
mer
cial
act
ivity
ex
tend
s acr
oss p
oliti
cal b
ound
arie
s. R
esid
ents
of L
os G
atos
will
trav
el to
Cam
pbel
l, Sa
n Jo
se,
and
beyo
nd to
wor
k an
d sh
op, a
nd v
ice
vers
a. T
here
fore
, whe
n an
alyz
ing
the
dem
and
for n
ew
com
mer
cial
dev
elop
men
t, it
is c
ritic
al to
iden
tify
the
popu
latio
n th
at c
an re
ason
ably
be
expe
cted
to
use
the
deve
lopm
ent i
n qu
estio
n, ra
ther
than
just
the
popu
latio
n liv
ing
in th
e im
med
iate
vi
cini
ty.
In
this
ana
lysi
s, tw
o su
ch b
road
er g
eogr
aphi
es a
re u
sed:
the
Ret
ail T
rade
Are
a (th
e “R
TA”)
and
th
e O
ffic
e/H
otel
/Mee
ting
Spac
e M
arke
t Are
a (th
e “M
arke
t Are
a”).
Whi
le th
ese
two
area
s sha
re
muc
h in
com
mon
, the
y fe
atur
e di
stin
ct b
ound
arie
s tha
t ref
lect
the
fact
that
reta
il ac
tivity
in th
e W
est V
alle
y fo
llow
s a d
iffer
ent g
eogr
aphi
c lo
gic
than
bus
ines
s act
ivity
, whi
ch e
ncom
pass
es
offic
e, h
otel
, and
mee
ting
uses
. Th
e fo
llow
ing
sect
ion
defin
es th
e R
TA a
nd M
arke
t Are
a ac
cord
ing
to th
ese
dist
inct
logi
cs.
Ret
ail T
rade
Are
a
For m
ost c
onsu
mer
s, th
e de
cisi
on a
bout
whe
ther
or n
ot to
shop
at a
cer
tain
reta
il ou
tlet i
s de
term
ined
in la
rge
part
by tr
avel
tim
e an
d w
heth
er o
r not
ther
e is
a c
ompa
rabl
e ou
tlet t
hat c
an b
e re
ache
d in
less
tim
e. S
ince
the
pote
ntia
l ret
ail o
utle
ts to
be
loca
ted
on th
e si
te a
re st
ill u
nkno
wn,
B
AE
has c
hose
n a
reta
il tra
de a
rea
that
refle
cts t
hat t
he si
te is
like
ly to
dra
w fr
om b
eyon
d Lo
s G
atos
itse
lf. S
ince
the
larg
er W
est V
alle
y ar
ea c
onta
ins a
n ab
unda
nce
of re
tail
oppo
rtuni
ties,
as a
st
artin
g po
int a
10-
min
ute
driv
e tim
e w
as u
sed
in d
elin
eatin
g th
e re
tail
trade
are
a. H
owev
er, a
s sh
own
in F
igur
e 2,
a g
eogr
aphy
bas
ed o
n dr
ive
time
is h
ighl
y irr
egul
ar, s
kew
ed b
y th
e im
pact
of
N
orth
For
ty S
peci
fic P
lan
Mar
ket S
tudy
and
Bus
ines
s Dev
elop
men
t Stra
tegy
Pa
ge 1
9 of
150

Nor
th F
orty
Spe
cific
Pla
n M
arke
t Stu
dy a
nd B
usin
ess D
evel
opm
ent S
trate
gy
Page
20
of 1
50
free
way
s and
geo
grap
hic
boun
darie
s suc
h as
hill
side
s. B
AE
has t
hus t
rans
late
d dr
ive
time
into
a
corr
espo
ndin
g gr
oup
of Z
ip C
odes
in o
rder
to c
reat
e an
are
a fo
r whi
ch d
emog
raph
ic a
nd m
ore
relia
ble
reta
il sa
les d
ata
can
be d
eriv
ed.
Not
e th
at w
hile
som
e Zi
p C
odes
gro
ssly
exp
and
the
boun
darie
s of t
he R
TA b
eyon
d th
e 10
-min
ute
thre
shol
d, th
ey e
ncom
pass
spar
sely
dev
elop
ed
hills
ides
in th
e Sa
nta
Cru
z M
ount
ains
. W
hile
resi
dent
s of t
hese
are
as m
ay li
ve b
eyon
d a
10-
min
ute
driv
e tim
e, L
os G
atos
and
the
mor
e ur
bani
zed
porti
ons o
f the
RTA
repr
esen
t the
clo
sest
av
aila
ble
shop
ping
opp
ortu
nitie
s. Th
e ul
timat
e re
tail
mix
at t
he N
orth
40
may
attr
act a
dditi
onal
shop
pers
from
out
side
this
def
ined
R
etai
l Tra
de A
rea.
How
ever
, usi
ng th
is a
rea
for t
he a
naly
sis a
ssur
es th
at a
“w
orst
cas
e” sc
enar
io
with
resp
ect t
o po
tent
ial i
mpa
cts o
n ex
istin
g re
tail
node
s in
Los G
atos
.

Figu
re 2
: Ret
ail T
rade
Are
a
S
ourc
e: B
AE
, 201
1.
N
orth
For
ty S
peci
fic P
lan
Mar
ket S
tudy
and
Bus
ines
s Dev
elop
men
t Stra
tegy
Pa
ge 2
1 of
150
Nor
th F
orty
Spe
cific
Pla
n M
arke
t Stu
dy a
nd B
usin
ess D
evel
opm
ent S
trate
gy
Page
22
of 1
50
Offi
ce/H
otel
/Mee
ting
Spac
e M
arke
t Are
a Th
e M
arke
t Are
a (s
ee F
igur
e 3)
diff
ers s
light
ly fr
om th
e R
etai
l Tra
de A
rea
desc
ribed
abo
ve.
Whi
le it
is a
lso
base
d on
a 1
0-m
inut
e dr
ive
time,
the
Mar
ket A
rea
is tr
imm
ed d
own
in o
rder
to
refle
ct th
e re
aliti
es o
f Sili
con
Val
ley’
s com
petit
ive
busi
ness
subm
arke
ts.
Spec
ifica
lly, t
he M
arke
t A
rea
has b
een
desi
gned
to e
xclu
de d
ownt
own
San
Jose
, Sun
nyva
le, a
nd S
anta
Cla
ra.
Dow
ntow
n Sa
n Jo
se is
a d
istin
ct c
omm
erci
al n
ode
that
feat
ures
a d
ense
clu
ster
of c
orpo
rate
of
fices
, maj
or h
otel
and
con
fere
nce
faci
litie
s, an
d la
rge
cultu
ral i
nstit
utio
ns.
If a
bus
ines
s tra
vele
r is
vis
iting
the
Sout
h B
ay in
ord
er to
atte
nd a
mee
ting
or e
vent
dow
ntow
n, th
en it
is li
kely
that
he
/she
will
stay
at o
ne o
f dow
ntow
n’s m
any
hote
ls.
Sim
ilarly
, if a
com
pany
wan
ts to
be
loca
ted
amid
st th
e hi
gh v
olum
e of
bus
ines
s ser
vice
s and
tran
sit o
ptio
ns th
at d
ownt
own
prov
ides
, the
n th
at
com
pany
is u
nlik
ely
to se
ek o
ffic
e sp
ace
else
whe
re.
As s
uch,
dow
ntow
n Sa
n Jo
se sh
ould
be
cons
ider
ed a
dis
tinct
bus
ines
s sub
mar
ket w
ith w
hich
the
Nor
th 4
0 w
ill n
ot c
ompe
te d
irect
ly.
The
Mar
ket A
rea
ther
efor
e ex
clud
es m
ost l
and
east
of H
ighw
ay 8
7.
In a
sim
ilar v
ein,
the
area
surr
ound
ing
San
Jose
Inte
rnat
iona
l Airp
ort a
nd H
ighw
ay 1
01—
incl
udin
g N
orth
San
Jose
, San
ta C
lara
, and
Sun
nyva
le—
feat
ures
uni
que
qual
ities
that
dis
tingu
ish
it fr
om L
os G
atos
and
adj
acen
t are
as.
If a
bus
ines
s tra
vele
r wan
ts to
be
clos
e to
the
airp
ort,
then
th
ere
he/s
he w
ill o
pt to
stay
at o
ne o
f the
man
y ho
tels
nea
rby,
rath
er th
an o
n th
e N
orth
40
site
, w
hich
is a
ppro
xim
atel
y 10
min
utes
aw
ay.
Sim
ilarly
, the
Nor
th 4
0 lie
s too
far f
rom
the
101
Cor
ridor
to a
ttrac
t off
ice
tena
nts f
or w
hom
that
par
ticul
ar m
ilieu
of i
nnov
atio
n pr
ovid
es a
st
rate
gic
posi
tion.
As s
uch,
mos
t lan
d no
rth a
nd w
est o
f I-2
80 a
nd I-
880
has b
een
excl
uded
from
th
e M
arke
t Are
a.1
From
a c
omm
erci
al st
andp
oint
, the
Nor
th 4
0 is
loca
ted
in a
dis
tinct
regi
on o
f Sili
con
Val
ley
that
is
as m
uch
defin
ed b
y its
loca
tion
at th
e fo
ot o
f the
San
ta C
ruz
Mou
ntai
ns a
s it i
s by
its a
bilit
y to
at
tract
tech
nolo
gy fi
rms.
The
bou
ndar
ies o
f the
Mar
ket A
rea
refle
ct th
is re
ality
by
enco
mpa
ssin
g la
rge
resi
dent
ial a
reas
, inc
ludi
ng e
xclu
sive
enc
lave
s and
hill
side
s, hi
stor
ic d
ownt
owns
, and
a fe
w
clus
ters
of b
usin
ess a
ctiv
ity w
ith th
e po
tent
ial t
o at
tract
the
Val
ley’
s lea
ding
inno
vato
rs.
How
ever
, thi
s bou
ndar
y lin
e do
es n
ot se
rve
as a
“ha
rd”
edge
. D
ecis
ions
rega
rdin
g w
heth
er o
r not
a
site
loca
ted
outs
ide
of th
e M
arke
t Are
a w
as re
leva
nt to
the
anal
ysis
at h
and
wer
e m
ade
on a
ca
se-b
y-ca
se b
asis
. In
such
inst
ance
s, B
AE
used
its l
ongs
tand
ing
know
ledg
e of
Sili
con
Val
ley
busi
ness
pat
tern
s to
judg
e th
e lik
elih
ood
that
such
pro
perti
es w
ould
com
pete
with
the
Nor
th 4
0 fo
r off
ice,
hot
el, a
nd/o
r con
fere
nce
user
s.
1 It
shou
ld b
e no
ted
that
key
info
rman
ts in
terv
iew
ed fo
r thi
s rep
ort i
ndic
ate
that
hot
els i
n do
wnt
own
Los G
atos
are
abl
e to
attr
act s
ome
busi
ness
trav
el a
way
from
the
hear
t of S
ilico
n V
alle
y by
mar
ketin
g Lo
s Gat
os’ u
niqu
e an
d w
alka
ble
hist
oric
env
ironm
ent.
How
ever
, as t
he N
orth
40
is lo
cate
d ou
tsid
e of
the
orbi
t of d
ownt
own
Los G
atos
, a p
rosp
ectiv
e ho
tel s
houl
d no
t be
cons
ider
ed d
irect
ly c
ompe
titiv
e w
ith st
anda
rd h
otel
pro
duct
s in
dow
ntow
n Sa
n Jo
se a
nd th
e 10
1 C
orrid
or.

Figu
re 3
: Offi
ce/H
otel
/Mee
ting
Spac
e M
arke
t Are
a
Sou
rce:
BA
E, 2
011.
N
orth
For
ty S
peci
fic P
lan
Mar
ket S
tudy
and
Bus
ines
s Dev
elop
men
t Stra
tegy
Pa
ge 2
3 of
150

Popu
latio
n an
d H
ouse
hold
Tre
nds
Popu
latio
n gr
owth
has
bee
n lim
ited
in th
e To
wn
of L
os G
atos
; bet
wee
n 20
00 a
nd 2
010,
the
Tow
n ad
ded
only
821
resi
dent
s to
reac
h a
popu
latio
n of
29,
413
in 2
010,
am
ount
ing
to o
nly
a 0.
3 pe
rcen
t co
mpo
und
annu
al ra
te o
f gro
wth
. Th
e R
TA g
rew
at a
slig
htly
mor
e ra
pid
rate
yea
r-ov
er-y
ear,
addi
ng a
ppro
xim
atel
y 30
,000
resi
dent
s. W
hile
the
RTA
gre
w o
n pa
r with
the
Bay
Are
a as
a
who
le (0
.5 p
erce
nt p
er a
nnum
), Sa
nta
Cla
ra C
ount
y ex
perie
nced
a sl
ight
ly h
ighe
r gro
wth
rate
. Th
e sl
ower
gro
wth
for L
os G
atos
and
the
RTA
is li
kely
due
to th
e fa
ct th
at th
e de
velo
pabl
e la
nd
in th
e W
est V
alle
y is
rela
tivel
y bu
ilt o
ut.
Tabl
e 3:
Pop
ulat
ion
Tren
ds, 2
000-
2010
Avg.
Ann
ual
% C
hang
eG
eogr
aphy
2000
2010
2000
-201
0To
wn
of L
os G
atos
28,5
9229
,413
0.3%
Ret
ail T
rade
Are
a (a
)57
5,58
260
6,05
60.
5%S
anta
Cla
ra C
ount
y1,
682,
585
1,78
1,64
20.
6%9-
Cou
nty
Bay
Are
a (b
)6,
783,
760
7,15
0,73
90.
5%
Not
es:
(a) S
ee F
igur
e 2
for d
efin
ition
of t
he R
etai
l Tra
de A
rea.
(b) T
he B
ay A
rea
cons
ists
of t
he C
ount
ies
of A
lam
eda,
Con
tra C
osta
,M
arin
, Nap
a, S
an F
ranc
isco
, San
Mat
eo, S
anta
Cla
ra, S
olan
o, a
ndS
onom
a.
Sou
rces
: U.S
. Cen
sus,
200
0 &
201
0; B
AE
, 201
1.
Acc
ordi
ng to
the
Ass
ocia
tion
of B
ay A
rea
Gov
ernm
ents
’ Pro
ject
ions
200
9, L
os G
atos
will
co
ntin
ue to
see
very
lim
ited
grow
th o
ver t
he n
ext t
wo
deca
des,
with
the
RTA
show
ing
a sl
ight
ly
high
er g
row
th ra
te.
As s
how
n in
Tab
le 4
, AB
AG
pro
ject
s tha
t Los
Gat
os w
ill a
dd o
nly
500
new
re
side
nts b
etw
een
2010
and
203
0. T
his a
mou
nts t
o ju
st a
1.7
per
cent
cha
nge
over
all,
refle
ctin
g th
e fa
ct th
at A
BA
G e
stim
ated
that
Los
Gat
os h
as a
lim
ited
abili
ty to
acc
omm
odat
e fu
ture
re
side
ntia
l exp
ansi
on.
How
ever
, the
Tow
n’s r
ecen
tly a
dopt
ed G
ener
al P
lan
allo
ws f
or e
noug
h ad
ditio
nal h
ousi
ng su
ch th
at th
e pr
ojec
ted
popu
latio
n of
the
Tow
n in
202
0 co
uld
reac
h 32
,600
.2 A
sign
ifica
nt p
ortio
n of
this
gro
wth
(750
hou
sing
uni
ts),
thou
gh, i
s pro
ject
ed fo
r the
Nor
th 4
0 si
teso
the
abili
ty o
f the
Tow
n to
reac
h th
is fi
gure
will
dep
end
larg
ely
on th
e ou
tcom
e of
the
Nor
th 4
0 Sp
ecifi
c Pl
an p
roce
ss c
urre
ntly
und
erw
ay.
,
AB
AG
pro
ject
s tha
t the
pop
ulat
ion
of th
e R
TA (e
xclu
ding
San
Jose
3 ) will
gro
w b
y fiv
e pe
rcen
t, or
aro
und
8,60
0 pe
ople
. R
elat
ive
to th
e si
ze o
f the
RTA
, thi
s is v
ery
limite
d gr
owth
.
2 Tow
n of
Los
Gat
os 2
020
Gen
eral
Pla
n D
raft
Envi
ronm
enta
l Im
pact
Rep
ort,
prep
ared
for t
he T
own
of L
os
Gat
os b
y D
esig
n, C
omm
unity
& E
nviro
nmen
t, M
arch
10,
201
0.
Nor
th F
orty
Spe
cific
Pla
n M
arke
t Stu
dy a
nd B
usin
ess D
evel
opm
ent S
trate
gy
Page
24
of 1
50
3 AB
AG
doe
s not
pub
lish
proj
ectio
ns fo
r sub
-city
are
as.
Ther
efor
e, th
e R
TA in
Tab
le 5
is tr
eate
d as
the
Tow
n of
Los
Gat
os a
nd th
e C
ities
of M
onte
Ser
eno,
Sar
atog
a, C
uper
tino,
and
Cam
pbel
l, as
wel
l as t
heir
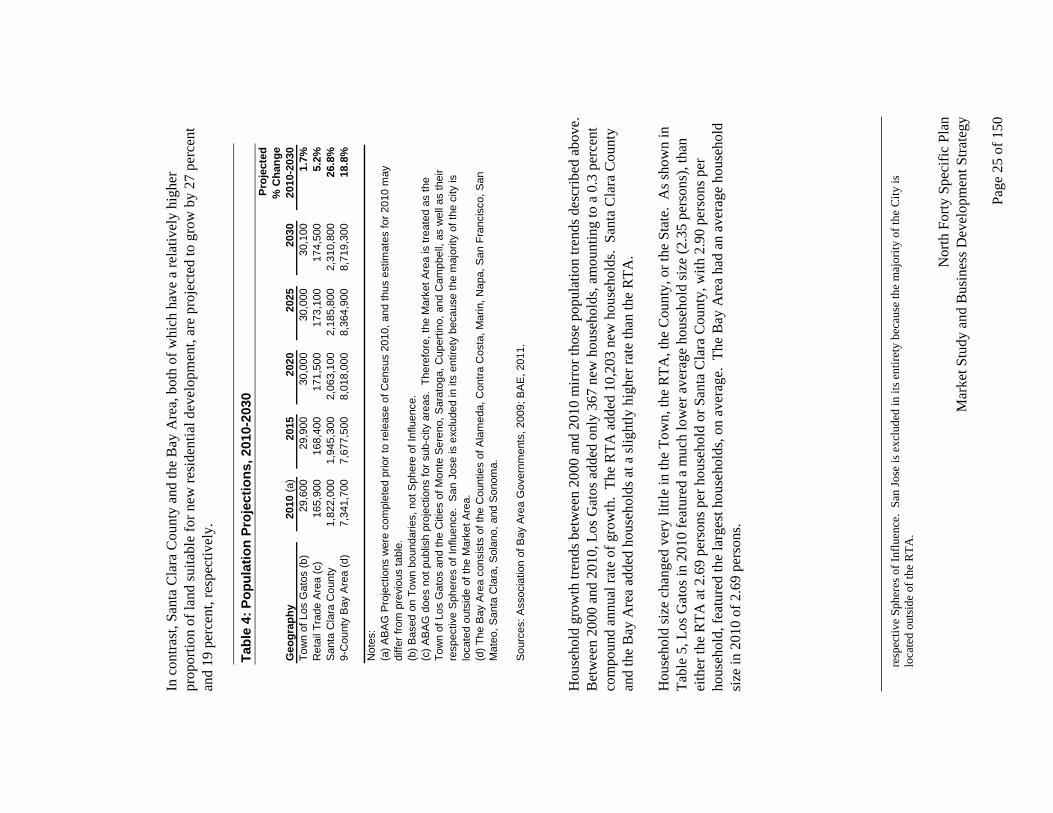
In c
ontra
st, S
anta
Cla
ra C
ount
y an
d th
e B
ay A
rea,
bot
h of
whi
ch h
ave
a re
lativ
ely
high
er
prop
ortio
n of
land
suita
ble
for n
ew re
side
ntia
l dev
elop
men
t, ar
e pr
ojec
ted
to g
row
by
27 p
erce
nt
and
19 p
erce
nt, r
espe
ctiv
ely.
Tabl
e 4:
Pop
ulat
ion
Proj
ectio
ns, 2
010-
2030
Pr
ojec
ted
% C
hang
eG
eogr
aphy
2010
(a)
2015
2020
2025
2030
2010
-203
0To
wn
of L
os G
atos
(b)
29,6
0029
,900
30,0
0030
,000
30,1
001.
7%R
etai
l Tra
de A
rea
(c)
165,
900
168,
400
171,
500
173,
100
174,
500
5.2%
San
ta C
lara
Cou
nty
1,82
2,00
01,
945,
300
2,06
3,10
02,
185,
800
2,31
0,80
026
.8%
9-C
ount
y B
ay A
rea
(d)
7,34
1,70
07,
677,
500
8,01
8,00
08,
364,
900
8,71
9,30
018
.8%
Not
es:
(a) A
BA
G P
roje
ctio
ns w
ere
com
plet
ed p
rior t
o re
leas
e of
Cen
sus
2010
, and
thus
est
imat
es fo
r 201
0 m
aydi
ffer f
rom
pre
viou
s ta
ble.
(b) B
ased
on
Tow
n bo
unda
ries,
not
Sph
ere
of In
fluen
ce.
(c) A
BA
G d
oes
not p
ublis
h pr
ojec
tions
for s
ub-c
ity a
reas
. Th
eref
ore,
the
Mar
ket A
rea
is tr
eate
d as
the
Tow
n of
Los
Gat
os a
nd th
e C
ities
of M
onte
Ser
eno,
Sar
atog
a, C
uper
tino,
and
Cam
pbel
l, as
wel
l as
thei
rre
spec
tive
Sph
eres
of I
nflu
ence
. S
an J
ose
is e
xclu
ded
in it
s en
tiret
y be
caus
e th
e m
ajor
ity o
f the
city
islo
cate
d ou
tsid
e of
the
Mar
ket A
rea.
(d) T
he B
ay A
rea
cons
ists
of t
he C
ount
ies
of A
lam
eda,
Con
tra C
osta
, Mar
in, N
apa,
San
Fra
ncis
co, S
anM
ateo
, San
ta C
lara
, Sol
ano,
and
Son
oma.
Sou
rces
: Ass
ocia
tion
of B
ay A
rea
Gov
ernm
ents
, 200
9; B
AE
, 201
1.
Hou
seho
ld g
row
th tr
ends
bet
wee
n 20
00 a
nd 2
010
mirr
or th
ose
popu
latio
n tre
nds d
escr
ibed
abo
ve.
Bet
wee
n 20
00 a
nd 2
010,
Los
Gat
os a
dded
onl
y 36
7 ne
w h
ouse
hold
s, am
ount
ing
to a
0.3
per
cent
co
mpo
und
annu
al ra
te o
f gro
wth
. Th
e R
TA a
dded
10,
203
new
hou
seho
lds.
San
ta C
lara
Cou
nty
and
the
Bay
Are
a ad
ded
hous
ehol
ds a
t a sl
ight
ly h
ighe
r rat
e th
an th
e R
TA.
H
ouse
hold
size
cha
nged
ver
y lit
tle in
the
Tow
n, th
e R
TA, t
he C
ount
y, o
r the
Sta
te.
As s
how
n in
Ta
ble
5, L
os G
atos
in 2
010
feat
ured
a m
uch
low
er a
vera
ge h
ouse
hold
size
(2.3
5 pe
rson
s), t
han
eith
er th
e R
TA a
t 2.6
9 pe
rson
s per
hou
seho
ld o
r San
ta C
lara
Cou
nty,
with
2.9
0 pe
rson
s per
ho
useh
old,
feat
ured
the
larg
est h
ouse
hold
s, on
ave
rage
. Th
e B
ay A
rea
had
an a
vera
ge h
ouse
hold
si
ze in
201
0 of
2.6
9 pe
rson
s.
N
orth
For
ty S
peci
fic P
lan
Mar
ket S
tudy
and
Bus
ines
s Dev
elop
men
t Stra
tegy
resp
ectiv
e Sp
here
s of I
nflu
ence
. Sa
n Jo
se is
exc
lude
d in
its e
ntire
ty b
ecau
se th
e m
ajor
ity o
f the
City
is
loca
ted
outs
ide
of th
e R
TA.
Pa
ge 2
5 of
150
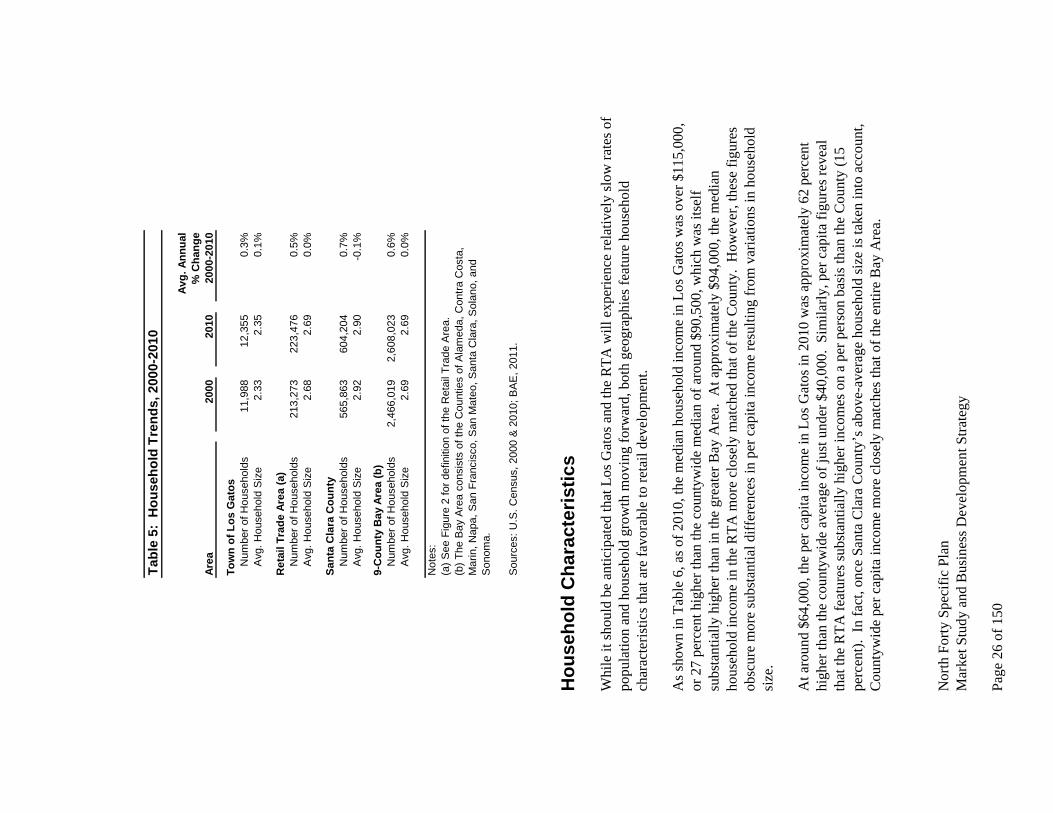
Tabl
e 5:
Hou
seho
ld T
rend
s, 2
000-
2010
Avg.
Ann
ual
% C
hang
eAr
ea20
0020
1020
00-2
010
Tow
n of
Los
Gat
osN
umbe
r of H
ouse
hold
s11
,988
12,3
550.
3%A
vg. H
ouse
hold
Siz
e2.
332.
350.
1%
Ret
ail T
rade
Are
a (a
)N
umbe
r of H
ouse
hold
s21
3,27
322
3,47
60.
5%A
vg. H
ouse
hold
Siz
e2.
682.
690.
0%
Sant
a C
lara
Cou
nty
Num
ber o
f Hou
seho
lds
565,
863
604,
204
0.7%
Avg
. Hou
seho
ld S
ize
2.92
2.90
-0.1
%
9-C
ount
y B
ay A
rea
(b)
Num
ber o
f Hou
seho
lds
2,46
6,01
92,
608,
023
0.6%
Avg
. Hou
seho
ld S
ize
2.69
2.69
0.0%
Not
es:
(a) S
ee F
igur
e 2
for d
efin
ition
of t
he R
etai
l Tra
de A
rea.
(b) T
he B
ay A
rea
cons
ists
of t
he C
ount
ies
of A
lam
eda,
Con
tra C
osta
,M
arin
, Nap
a, S
an F
ranc
isco
, San
Mat
eo, S
anta
Cla
ra, S
olan
o, a
ndS
onom
a.
Sou
rces
: U.S
. Cen
sus,
200
0 &
201
0; B
AE
, 201
1.
Hou
seho
ld C
hara
cter
istic
s W
hile
it sh
ould
be
antic
ipat
ed th
at L
os G
atos
and
the
RTA
will
exp
erie
nce
rela
tivel
y sl
ow ra
tes o
f po
pula
tion
and
hous
ehol
d gr
owth
mov
ing
forw
ard,
bot
h ge
ogra
phie
s fea
ture
hou
seho
ld
char
acte
ristic
s tha
t are
favo
rabl
e to
reta
il de
velo
pmen
t. A
s sho
wn
in T
able
6, a
s of 2
010,
the
med
ian
hous
ehol
d in
com
e in
Los
Gat
os w
as o
ver $
115,
000,
or
27
perc
ent h
ighe
r tha
n th
e co
unty
wid
e m
edia
n of
aro
und
$90,
500,
whi
ch w
as it
self
subs
tant
ially
hig
her t
han
in th
e gr
eate
r Bay
Are
a. A
t app
roxi
mat
ely
$94,
000,
the
med
ian
hous
ehol
d in
com
e in
the
RTA
mor
e cl
osel
y m
atch
ed th
at o
f the
Cou
nty.
How
ever
, the
se fi
gure
s ob
scur
e m
ore
subs
tant
ial d
iffer
ence
s in
per c
apita
inco
me
resu
lting
from
var
iatio
ns in
hou
seho
ld
size
. A
t aro
und
$64,
000,
the
per c
apita
inco
me
in L
os G
atos
in 2
010
was
app
roxi
mat
ely
62 p
erce
nt
high
er th
an th
e co
unty
wid
e av
erag
e of
just
und
er $
40,0
00.
Sim
ilarly
, per
cap
ita fi
gure
s rev
eal
that
the
RTA
feat
ures
subs
tant
ially
hig
her i
ncom
es o
n a
per p
erso
n ba
sis t
han
the
Cou
nty
(15
perc
ent).
In
fact
, onc
e Sa
nta
Cla
ra C
ount
y’s a
bove
-ave
rage
hou
seho
ld si
ze is
take
n in
to a
ccou
nt,
Cou
ntyw
ide
per c
apita
inco
me
mor
e cl
osel
y m
atch
es th
at o
f the
ent
ire B
ay A
rea.
Nor
th F
orty
Spe
cific
Pla
n M
arke
t Stu
dy a
nd B
usin
ess D
evel
opm
ent S
trate
gy
Page
26
of 1
50

Tabl
e 7
show
s rat
es o
f ow
ner-
occu
panc
y th
at c
orre
spon
d to
the
hier
arch
y of
hou
seho
ld in
com
e di
scus
sed
abov
e. A
s of 2
010,
app
roxi
mat
ely
63 a
nd 6
1 pe
rcen
t of h
ouse
hold
s in
Los G
atos
and
th
e R
TA, r
espe
ctiv
ely,
ow
ned
the
hom
es in
whi
ch th
ey li
ved,
as c
ompa
red
to 5
8 an
d 56
per
cent
in
the
Cou
nty
and
Bay
Are
a, re
spec
tivel
y. T
aken
toge
ther
, the
se d
ata
indi
cate
that
the
Tow
n of
Los
G
atos
and
the
RTA
feat
ure
abov
e-av
erag
e le
vels
of p
er c
apita
inco
me
and
hom
eow
ners
hip,
bot
h of
whi
ch li
kely
tran
slat
e to
incr
ease
d co
nsum
er sp
endi
ng.
Tabl
e 6:
Inc
ome,
201
0
M
edia
nH
ouse
hold
Per C
apita
Geo
grap
hyIn
com
eIn
com
eTo
wn
of L
os G
atos
$115
,371
$64,
227
Ret
ail T
rade
Are
a (a
)$9
4,26
4$4
5,61
3S
anta
Cla
ra C
ount
y$9
0,58
1$3
9,54
99-
Cou
nty
Bay
Are
a (b
)$7
8,98
1$3
8,28
2
Not
es:
(a) S
ee F
igur
e 2
for d
efin
ition
of t
he R
etai
l Tra
de A
rea.
(b) T
he B
ay A
rea
cons
ists
of t
he C
ount
ies
of A
lam
eda,
Con
tra C
osta
, Mar
in, N
apa,
San
Fra
ncis
co, S
an M
ateo
, San
ta
Cla
ra, S
olan
o, a
nd S
onom
a.
Sou
rces
: Cla
ritas
, 201
0; B
AE
, 201
1.
Tabl
e 7:
Ow
ner a
nd R
ente
r Occ
upan
cy, 2
010
O
ccup
ied
Hou
sing
Uni
ts%
Ow
ner-
% R
ente
r-G
eogr
aphy
Occ
upie
dO
ccup
ied
Tow
n of
Los
Gat
os63
.0%
37.0
%R
etai
l Tra
de A
rea
(a)
61.4
%38
.6%
San
ta C
lara
Cou
nty
57.6
%42
.4%
9-C
ount
y B
ay A
rea
(b)
56.2
%43
.8%
Not
es:
(a) S
ee F
igur
e 2
for d
efin
ition
of t
he R
etai
l Tra
de A
rea.
(b) T
he B
ay A
rea
cons
ists
of t
he C
ount
ies
of A
lam
eda,
Con
tra C
osta
, Mar
in, N
apa,
San
Fra
ncis
co, S
an M
ateo
, San
ta
Cla
ra, S
olan
o, a
nd S
onom
a.
Sou
rces
: U.S
. Cen
sus
2010
; BA
E, 2
011.
N
orth
For
ty S
peci
fic P
lan
Mar
ket S
tudy
and
Bus
ines
s Dev
elop
men
t Stra
tegy
Pa
ge 2
7 of
150

Empl
oym
ent T
rend
s Ta
ble
8 co
ntai
ns in
form
atio
n on
com
mut
er fl
ows i
n an
d ou
t of t
he R
TA in
200
0, th
e m
ost r
ecen
t ye
ar fo
r whi
ch su
ch d
ata
are
avai
labl
e. T
hese
flow
s are
of i
nter
est t
o th
is re
port
beca
use
wor
kers
co
mm
utin
g in
to th
e R
TA re
pres
ent a
n ad
ditio
nal s
ourc
e of
dem
and
for r
etai
l sal
es, w
hile
co
mm
utin
g ou
t rep
rese
nt a
pot
entia
l los
s of s
ales
, as t
hose
wor
kers
may
cho
ose
to sh
op c
lose
r to
whe
re th
ey w
ork
rath
er th
an w
here
they
resi
de.
As o
f 200
0, 6
5 pe
rcen
t of w
orke
rs re
sidi
ng in
side
the
RTA
com
mut
ed e
lsew
here
to w
ork,
whi
le
only
49
perc
ent o
f tho
se w
orke
rs w
orki
ng in
side
the
RTA
com
mut
ed in
from
els
ewhe
re.
On
the
who
le, r
ough
ly tw
ice
as m
any
wor
kers
(187
,000
) com
mut
ed o
ut o
f the
RTA
on
a da
ily b
asis
than
th
e nu
mbe
r tha
t com
mut
ed in
(98,
000)
.
Tabl
e 8:
Com
mut
er F
low
s, 2
000
RTA
Res
iden
ts b
y Pl
ace
of W
ork
(a)
Plac
e of
Wor
kN
umbe
r%
Tot
alIn
Ret
ail T
rade
Are
a10
0,66
5
35.0
%E
lsew
here
in S
anta
Cla
ra C
ount
y15
8,91
3
55.3
%E
lsew
here
out
side
San
ta C
lara
Cou
nty
28,0
16
9.
7%To
tal
287,
594
100.
0%
Res
iden
ts C
omm
utin
g ou
t of A
rea
186,
929
65.0
%
RTA
Wor
kers
by
Plac
e of
Res
iden
ce (a
)
Plac
e of
Res
iden
ceN
umbe
r%
Tot
alIn
Ret
ail T
rade
Are
a10
0,66
5
50.6
%E
lsew
here
in S
anta
Cla
ra C
ount
y68
,291
34.3
%E
lsew
here
out
side
San
ta C
lara
Cou
nty
29,9
64
15
.1%
Tota
l19
8,92
010
0.0%
Wor
kers
Com
mut
ing
into
Are
a98
,255
49
.4%
Sour
ces:
Cen
sus
Tran
spor
tatio
n P
lann
ing
Pac
kage
, 200
0; B
AE
,20
11.
A
s sho
wn
in F
igur
e 4,
San
ta C
lara
Cou
nty
has u
nder
gone
two
econ
omic
cyc
les o
ver t
he c
ours
e of
the
past
dec
ade,
bot
h of
whi
ch c
ause
d la
rge
chan
ges i
n re
gion
al e
mpl
oym
ent.
Bet
wee
n 20
00
and
2004
, em
ploy
men
t fel
l mar
kedl
y as
a re
sult
of th
e In
tern
et b
ust.
The
num
ber o
f em
ploy
ed
resi
dent
s in
Los G
atos
and
San
ta C
lara
Cou
nty
fell
by 1
6 pe
rcen
t and
15
perc
ent,
resp
ectiv
ely,
ca
usin
g un
empl
oym
ent t
o ne
arly
dou
ble
(see
Tab
le 9
).
Nor
th F
orty
Spe
cific
Pla
n M
arke
t Stu
dy a
nd B
usin
ess D
evel
opm
ent S
trate
gy
Page
28
of 1
50

Figu
re 4
: Em
ploy
men
t Tre
nds
in th
e C
ivili
an L
abor
For
ce, 2
000-
Mar
ch 2
011
Tow
n of
Los
Gat
os
0.0%
1.0%
2.0%
3.0%
4.0%
5.0%
6.0%
7.0%
8.0%
13,5
00
14,0
00
14,5
00
15,0
00
15,5
00
16,0
00
16,5
00
17,0
00
17,5
00
Resident Unemployment Rate
Employed Residents
Em
ploy
men
tU
nem
ploy
men
t Rat
e
S
anta
Cla
ra C
ount
y
0.0%
2.0%
4.0%
6.0%
8.0%
10.0
%
12.0
%
750,
000
775,
000
800,
000
825,
000
850,
000
875,
000
900,
000
925,
000
950,
000
Resident Unemployment Rate
Employed Residents
Em
ploy
men
tU
nem
ploy
men
t Rat
e
S
ourc
es: C
alifo
rnia
Em
ploy
men
t Dev
elop
men
t Dep
artm
ent;
BA
E, 2
011.
B
etw
een
2004
and
200
8, th
e ec
onom
y un
derw
ent a
reco
very
. H
owev
er, o
nly
abou
t a th
ird o
f the
jo
bs lo
st d
urin
g th
e In
tern
et b
ust w
ere
reca
ptur
ed, r
efle
ctin
g th
e fa
ct th
at th
e do
t-com
“bu
bble
” at
th
e on
set o
f the
dec
ade
led
to u
nrea
listic
em
ploy
men
t inf
latio
n. T
he m
id-d
ecad
e re
cove
ry,
N
orth
For
ty S
peci
fic P
lan
Mar
ket S
tudy
and
Bus
ines
s Dev
elop
men
t Stra
tegy
Pa
ge 2
9 of
150

Nor
th F
orty
Spe
cific
Pla
n M
arke
t Stu
dy a
nd B
usin
ess D
evel
opm
ent S
trate
gy
Page
30
of 1
50
ther
efor
e, d
id n
ot le
ad to
reco
very
to th
e pe
ak le
vels
of e
mpl
oym
ent a
chie
ved
in 2
000.
Sin
ce
2008
, the
regi
onal
eco
nom
y ha
s dec
lined
con
side
rabl
y, o
win
g la
rgel
y to
the
natio
nwid
e re
cess
ion
spur
red
by th
e ho
usin
g m
arke
t bus
t. T
houg
h th
e jo
b lo
sses
incu
rred
dur
ing
the
late
st c
rash
hav
e be
en sm
all r
elat
ive
to th
e In
tern
et b
ust,
unem
ploy
men
t has
spik
ed to
unp
rece
dent
ed le
vels
due
to
pers
iste
ntly
hig
h un
empl
oym
ent i
n th
e co
nstru
ctio
n se
ctor
. It
shou
ld b
e no
ted
that
the
unem
ploy
men
t rat
e in
Los
Gat
os re
mai
ned
cons
iste
ntly
low
er th
an in
th
e re
st o
f the
Cou
nty
thro
ugh
the
two
econ
omic
boo
m/b
usts
that
cha
ract
eriz
ed th
e pr
evio
us
deca
de.
As o
f Mar
ch 2
011,
une
mpl
oym
ent i
n Lo
s Gat
os w
as u
nder
seve
n pe
rcen
t, as
opp
osed
to
over
ten
perc
ent i
n th
e C
ount
y as
a w
hole
. A
fter p
eaki
ng in
201
0, th
e ra
te o
f une
mpl
oym
ent i
n bo
th g
eogr
aphi
es h
as b
egun
to fa
ll, th
ough
the
long
-term
traj
ecto
ry o
f em
ploy
men
t rem
ains
un
certa
in.
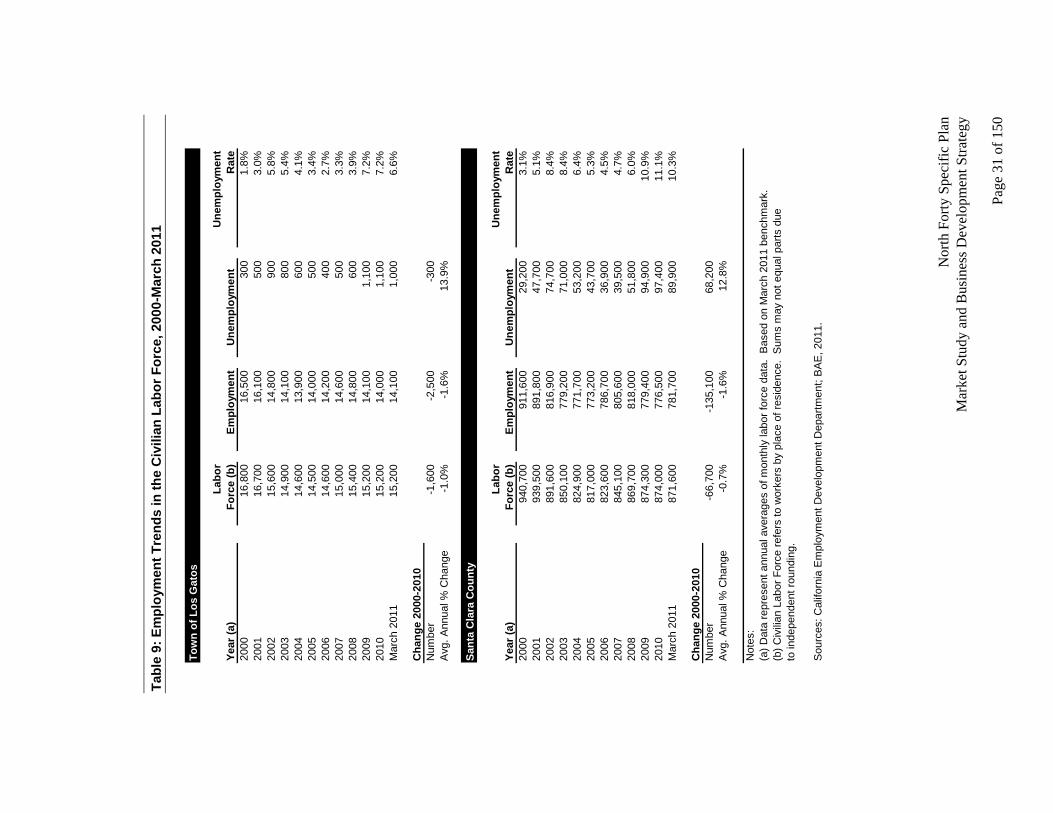
N
orth
For
ty S
peci
fic P
lan
Mar
ket S
tudy
and
Bus
ines
s Dev
elop
men
t Stra
tegy
Pa
ge 3
1 of
150
Tabl
e 9:
Em
ploy
men
t Tre
nds
in th
e C
ivili
an L
abor
For
ce, 2
000-
Mar
ch 2
011
To
wn
of L
os G
atos
Labo
rU
nem
ploy
men
tYe
ar (a
)Fo
rce
(b)
Empl
oym
ent
Une
mpl
oym
ent
Rat
e20
0016
,800
16,5
0030
01.
8%20
0116
,700
16,1
0050
03.
0%20
0215
,600
14,8
0090
05.
8%20
0314
,900
14,1
0080
05.
4%20
0414
,600
13,9
0060
04.
1%20
0514
,500
14,0
0050
03.
4%20
0614
,600
14,2
0040
02.
7%20
0715
,000
14,6
0050
03.
3%20
0815
,400
14,8
0060
03.
9%20
0915
,200
14,1
001,
100
7.2%
2010
15,2
0014
,000
1,10
07.
2%M
arch
201
115
,200
14,1
001,
000
6.6%
Cha
nge
2000
-201
0N
umbe
r-1
,600
-2,5
00-3
00A
vg. A
nnua
l % C
hang
e-1
.0%
-1.6
%13
.9%
Sant
a C
lara
Cou
nty
Labo
rU
nem
ploy
men
tYe
ar (a
)Fo
rce
(b)
Empl
oym
ent
Une
mpl
oym
ent
Rat
e20
0094
0,70
091
1,60
029
,200
3.1%
2001
939,
500
891,
800
47,7
005.
1%20
0289
1,60
081
6,90
074
,700
8.4%
2003
850,
100
779,
200
71,0
008.
4%20
0482
4,90
077
1,70
053
,200
6.4%
2005
817,
000
773,
200
43,7
005.
3%20
0682
3,60
078
6,70
036
,900
4.5%
2007
845,
100
805,
600
39,5
004.
7%20
0886
9,70
081
8,00
051
,800
6.0%
2009
874,
300
779,
400
94,9
0010
.9%
2010
874,
000
776,
500
97,4
0011
.1%
Mar
ch 2
011
871,
600
781,
700
89,9
0010
.3%
Cha
nge
2000
-201
0N
umbe
r-6
6,70
0-1
35,1
0068
,200
Avg
. Ann
ual %
Cha
nge
-0.7
%-1
.6%
12.8
%
Not
es:
(a) D
ata
repr
esen
t ann
ual a
vera
ges
of m
onth
ly la
bor f
orce
dat
a. B
ased
on
Mar
ch 2
011
benc
hmar
k.(b
) Civ
ilian
Lab
or F
orce
refe
rs to
wor
kers
by
plac
e of
resi
denc
e. S
ums
may
not
equ
al p
arts
due
to in
depe
nden
t rou
ndin
g.
Sou
rces
: Cal
iforn
ia E
mpl
oym
ent D
evel
opm
ent D
epar
tmen
t; B
AE
, 201
1.

Re
tail
Ma
rke
t A
ss
es
sm
en
t:
Ex
isti
ng
Re
tail
Re
al
Es
tate
C
on
dit
ion
s
This
cha
pter
pro
files
exi
stin
g re
tail
real
est
ate
cond
ition
s in
the
Ret
ail T
rade
Are
a (R
TA) a
nd L
os
Gat
os.
The
RTA
has
a la
rge
num
ber o
f ret
ail n
odes
and
cen
ters
pot
entia
lly c
ompe
titiv
e w
ith th
e N
orth
40,
and
als
o w
ith e
xist
ing
reta
il ce
nter
s and
dis
trict
s in
Los G
atos
. Th
is c
hapt
er
sum
mar
izes
ove
rall
mar
ket t
rend
s in
the
regi
onal
and
loca
l ret
ail r
eal e
stat
e m
arke
t, fo
llow
ed b
y br
ief p
rofil
es o
f som
e of
the
key
reta
il no
des i
n Lo
s Gat
os a
nd th
e R
TA.
The
anal
ysis
her
e is
ba
sed
on se
vera
l are
a to
urs,
inte
rvie
ws w
ith b
roke
rs h
andl
ing
reta
il pr
oper
ties,
and
addi
tiona
l re
sear
ch in
clud
ing
onlin
e se
arch
es a
nd c
onta
cts w
ith st
ore
oper
ator
s and
staf
f in
Los G
atos
and
ot
her j
uris
dict
ions
in th
e ar
ea.
The
next
cha
pter
dis
cuss
es re
tail
sale
s and
pro
vide
s a le
akag
e an
alys
is, a
nd th
e ch
apte
r fol
low
ing
that
sum
mar
izes
the
reta
il m
arke
t ass
essm
ent.
Ret
ail R
eal E
stat
e M
arke
t Con
ditio
ns
In a
ny re
tail
mar
ket,
exis
ting
reta
il sp
ace
is v
acat
ed o
n a
regu
lar b
asis
due
to fu
nctio
nal
obso
lesc
ence
or t
he g
ener
al c
ycle
of r
etai
l clo
sure
s and
ope
ning
s ove
r tim
e. F
or in
stan
ce, u
ntil
rece
ntly
ther
e ha
d be
en a
long
-term
tren
d in
the
supe
rmar
ket i
ndus
try to
war
d la
rger
stor
es a
nd
cons
olid
atio
n, w
ith o
lder
stor
es re
used
by
“sec
ond
gene
ratio
n” te
nant
s suc
h as
dol
lar s
tore
s, fu
rnitu
re o
utle
ts, a
nd e
ven
non-
reta
il us
es su
ch a
s fitn
ess c
ente
rs.4 T
hus a
ny re
tail
mar
ket i
s lik
ely
to h
ave
a ce
rtain
per
cent
age
of v
acan
t spa
ce d
ue to
nor
mal
turn
over
and
cha
nges
in re
taili
ng; i
n fa
ct, s
ome
amou
nt o
f vac
anci
es k
eeps
rent
s mor
e af
ford
able
and
pre
vent
s the
mar
ket f
rom
st
agna
ting
due
to ro
adbl
ocks
to th
e en
try o
f new
com
petit
ors.
O
vera
ll, th
e re
tail
real
est
ate
mar
ket i
n Lo
s Gat
os h
as fa
red
wel
l thr
ough
the
curr
ent e
cono
mic
do
wnt
urn.
Acc
ordi
ng to
Ter
rano
mic
s, a
maj
or re
gion
al re
tail
brok
erag
e fir
m, a
t the
end
of 2
010,
th
e re
tail
vaca
ncy
rate
in L
os G
atos
was
5.0
per
cent
, wel
l with
in n
orm
al ra
nges
for c
omm
erci
al
vaca
ncie
s.5 O
vera
ll, W
est C
ount
y6 show
ed a
vac
ancy
rate
of 5
.5 p
erce
nt a
t yea
r-en
d 20
10.
Cou
ntyw
ide,
the
repo
rted
rate
was
som
ewha
t hig
her,
at 6
.7 p
erce
nt.
With
in th
e R
TA, C
uper
tino
show
ed th
e hi
ghes
t vac
ancy
rate
, at 1
8.5
perc
ent.
The
5.0
per
cent
rate
for L
os G
atos
was
up
from
3.
7 pe
rcen
t at y
ear-
end
2009
, but
bec
ause
of t
he si
ze o
f the
inve
ntor
y co
vere
d fo
r the
Tow
n, a
si
ngle
vac
ant s
pace
of a
ppro
xim
atel
y 10
,000
squa
re fe
et c
ould
cau
se th
is fl
uctu
atio
n. B
roke
rs
N
orth
For
ty S
peci
fic P
lan
Mar
ket S
tudy
and
Bus
ines
s Dev
elop
men
t Stra
tegy
4 Mor
e re
cent
ly, n
iche
gro
cery
stor
es su
ch a
s Tra
der J
oe’s
, Fre
sh &
Eas
y, G
roce
ry O
utle
t, an
d et
hnic
su
perm
arke
ts h
ave
star
ted
to o
ccup
y sm
alle
r spa
ces t
hat a
re e
ither
new
or t
hat h
ave
been
vac
ated
by
supe
rmar
ket c
hain
stor
es, i
n so
me
case
s sub
divi
ding
a la
rger
supe
rmar
ket s
pace
and
onl
y us
ing
a po
rtion
of i
t. 5 S
anta
Cla
ra C
ount
y Re
tail
Repo
rt, Y
ear-
End
2010
, Ter
rano
mic
s. It
is im
porta
nt to
not
e th
at T
erra
nom
ics
does
not
nec
essa
rily
cove
r all
reta
il sp
ace
in a
n ar
ea, b
ut th
e tre
nds s
how
n sh
ould
be
indi
cativ
e of
ove
rall
mar
ket c
ondi
tions
.
6 Def
ined
by
Terr
anom
ics a
s Pal
o A
lto, M
ount
ain
Vie
w, L
os A
ltos,
Sunn
yval
e, C
uper
tino,
Sar
atog
a, a
nd L
os
Gat
os.
Pa
ge 3
3 of
150

Nor
th F
orty
Spe
cific
Pla
n M
arke
t Stu
dy a
nd B
usin
ess D
evel
opm
ent S
trate
gy
Page
34
of 1
50
inte
rvie
wed
als
o co
nfirm
ed th
e To
wn’
s low
reta
il va
canc
y ra
te, e
spec
ially
rela
tive
to th
e C
ount
y ov
eral
l.7 The
bro
kers
stat
ed tw
o ke
y re
ason
s for
the
stro
ng o
ccup
ancy
in T
own:
a li
mite
d su
pply
, pa
rticu
larly
for l
arge
r spa
ces o
f 10,
000
squa
re fe
et o
r mor
e; a
nd th
e ve
ry st
rong
dem
ogra
phic
s of
Los G
atos
. Fo
r the
se la
rger
floo
r pla
tes,
dem
and
exce
eds s
uppl
y, so
whe
n su
ch a
spac
e be
com
es
avai
labl
e (e
.g.,
due
to la
rger
cor
pora
te b
ankr
uptc
ies,
such
as B
orde
rs),
they
are
re-te
nant
ed in
sh
ort o
rder
. In
fact
, one
of t
he k
ey d
river
s for
vac
anci
es n
atio
nally
in th
e la
st fe
w y
ears
has
bee
n th
e cl
osur
e of
ch
ain
stor
es d
ue to
ban
krup
tcie
s and
dow
nsiz
ing;
Circ
uit C
ity a
nd B
orde
rs a
re tw
o ex
ampl
es o
f th
is.
In L
os G
atos
, the
rece
ntly
clo
sed
Bor
ders
in O
ld T
own
exem
plifi
es th
is tr
end,
as d
oes t
he
cons
olid
atio
n of
the
Gap
und
er o
ne ro
of.
How
ever
, man
y of
thes
e va
cant
box
es n
atio
nally
are
in
prim
e or
hig
h-vi
sibi
lity
loca
tions
and
are
bei
ng re
-tena
nted
as a
resu
lt. I
n an
y ca
se, t
he li
mite
d am
ount
of n
atio
nal c
hain
reta
il in
the
Tow
n ha
s lim
ited
its e
xpos
ure
to th
ese
type
s of v
acan
cies
. R
ents
dro
pped
dur
ing
the
rece
ssio
n, b
ut a
re st
ill st
rong
er th
an su
rrou
ndin
g co
mm
uniti
es a
nd h
ave
rebo
unde
d so
mew
hat.
Bro
kers
repo
rt re
nts r
angi
ng fr
om $
2 to
$5
per s
quar
e fo
ot, w
ith
Dow
ntow
n co
mm
andi
ng th
e hi
ghes
t ren
ts, p
artic
ular
ly a
t the
sout
h en
d of
Dow
ntow
n. O
ne
brok
er a
ctiv
e in
mul
tiple
cen
ters
and
pro
perti
es re
porte
d th
at re
nts i
n Lo
s Gat
os d
ropp
ed 1
5 to
20
perc
ent o
vera
ll, b
ut o
nly
five
to te
n pe
rcen
t dow
ntow
n.
Ove
rvie
w o
f Los
Gat
os a
nd R
etai
l Tra
de A
rea
Ret
ail N
odes
Th
e R
etai
l Tra
de A
rea
(RTA
) has
a la
rge
num
ber o
f ret
ail n
odes
and
cen
ters
that
cou
ld b
e co
mpe
titiv
e w
ith th
e N
orth
40,
and
that
com
pete
with
exi
stin
g re
taile
rs in
Los
Gat
os, w
ho a
re in
tu
rn c
once
ntra
ted
in c
erta
in a
reas
of t
he T
own.
Fol
low
ing
is a
des
crip
tion
of so
me
of th
e ke
y re
gion
-ser
ving
reta
il no
des,
follo
wed
by
a de
scrip
tion
of th
e re
tail
dist
ricts
of L
os G
atos
. Th
e To
wn’
s ret
ail d
istri
cts a
re d
escr
ibed
in m
ore
deta
il, w
ith th
e fo
cus f
or th
e R
TA o
n m
ajor
cen
ters
ra
ther
than
an
inve
ntor
y of
all
reta
il ce
nter
s. C
ompe
titiv
e R
etai
l Cen
ters
in R
etai
l Tra
de A
rea
The
RTA
con
tain
s a n
umbe
r of r
etai
l con
cent
ratio
ns.
The
focu
s her
e is
on
maj
or re
tail
node
s and
ce
nter
s tha
t wou
ld c
onst
itute
the
com
petit
ion
for r
egio
n-se
rvin
g re
tail
at th
e N
orth
40
site
. Th
ese
node
s and
cen
ters
are
show
n in
Fig
ure
5. W
hile
ther
e ar
e m
any
smal
ler c
onve
nien
ce-o
rient
ed
cent
ers a
nd o
ther
reta
il ce
nter
s, th
ey a
re se
en a
s prim
arily
loca
l-ser
ving
and
not
com
petit
ive
with
th
e N
orth
40’
s pot
entia
l ret
ail t
enan
ts.8
7 A
list
of b
roke
rs in
terv
iew
ed c
an b
e fo
und
in A
ppen
dix
F.
8 Muc
h of
the
info
rmat
ion
on th
e re
gion
al c
ente
rs w
as p
rovi
ded
by H
urst
/Har
rigan
Ass
ocia
tes,
with
add
ition
al
rese
arch
and
ver
ifica
tion
by B
AE.
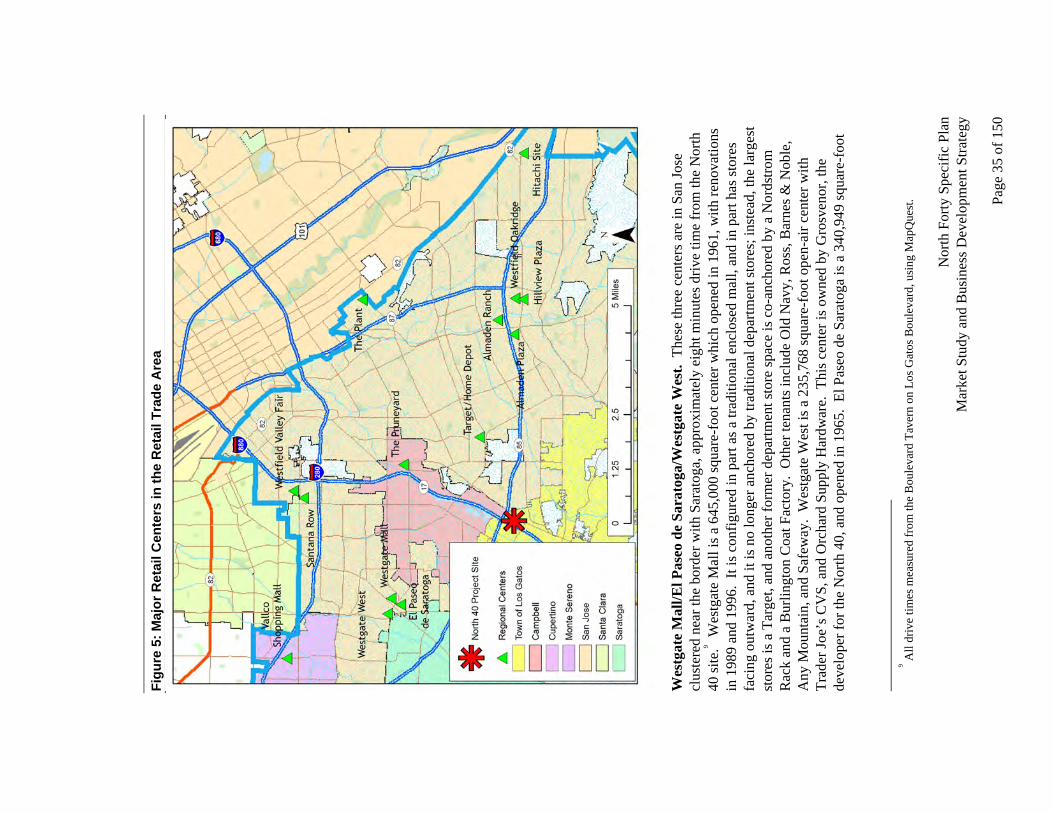
Figu
re 5
: Maj
or R
etai
l Cen
ters
in th
e R
etai
l Tra
de A
rea
W
estg
ate
Mal
l/El P
aseo
de
Sara
toga
/Wes
tgat
e W
est.
The
se th
ree
cent
ers a
re in
San
Jose
cl
uste
red
near
the
bord
er w
ith S
arat
oga,
app
roxi
mat
ely
eigh
t min
utes
driv
e tim
e fr
om th
e N
orth
40
site
.9 Wes
tgat
e M
all i
s a 6
45,0
00 sq
uare
-foo
t cen
ter w
hich
ope
ned
in 1
961,
with
reno
vatio
ns
in 1
989
and
1996
. It
is c
onfig
ured
in p
art a
s a tr
aditi
onal
enc
lose
d m
all,
and
in p
art h
as st
ores
fa
cing
out
war
d, a
nd it
is n
o lo
nger
anc
hore
d by
trad
ition
al d
epar
tmen
t sto
res;
inst
ead,
the
larg
est
stor
es is
a T
arge
t, an
d an
othe
r for
mer
dep
artm
ent s
tore
spac
e is
co-
anch
ored
by
a N
ords
trom
R
ack
and
a B
urlin
gton
Coa
t Fac
tory
. O
ther
tena
nts i
nclu
de O
ld N
avy,
Ros
s, B
arne
s & N
oble
, A
ny M
ount
ain,
and
Saf
eway
. W
estg
ate
Wes
t is a
235
,768
squa
re-f
oot o
pen-
air c
ente
r with
Tr
ader
Joe’
s CV
S, a
nd O
rcha
rd S
uppl
y H
ardw
are.
Thi
s cen
ter i
s ow
ned
by G
rosv
enor
, the
de
velo
per f
or th
e N
orth
40,
and
ope
ned
in 1
965.
El P
aseo
de
Sara
toga
is a
340
,949
squa
re-f
oot
N
orth
For
ty S
peci
fic P
lan
Mar
ket S
tudy
and
Bus
ines
s Dev
elop
men
t Stra
tegy
9 All
driv
e tim
es m
easu
red
from
the
Bou
leva
rd T
aver
n on
Los
Gat
os B
oule
vard
, usi
ng M
apQ
uest
.
Pa
ge 3
5 of
150

Nor
th F
orty
Spe
cific
Pla
n M
arke
t Stu
dy a
nd B
usin
ess D
evel
opm
ent S
trate
gy
Page
36
of 1
50
open
-air
cent
er o
rigin
ally
ope
ned
in 1
974,
and
was
com
plet
ely
rebu
ilt in
199
7. I
t is a
ncho
red
by
REI
, Pet
co, L
ucky
, Off
ice
Max
, and
an
AM
C 1
4-sc
reen
mov
ie th
eate
r com
plex
.
Val
lco
Shop
ping
Mal
l. T
his e
nclo
sed
mal
l spa
ns N
orth
Wol
fe R
oad
in C
uper
tino
in th
e no
rthw
est p
ortio
n of
the
RTA
and
is a
ppro
xim
atel
y 13
min
utes
driv
e tim
e fr
om th
e N
orth
40
site
. Th
e 1.
3 m
illio
n sq
uare
-foo
t cen
ter o
pene
d in
197
5, a
nd is
anc
hore
d by
Mac
y’s,
JC P
enne
y, a
nd
Sear
s, an
d in
clud
es a
n A
MC
16-
scre
en th
eate
r com
plex
, an
ice
rink,
and
a b
owlin
g al
ley.
Whi
le
som
e re
nova
tions
wer
e co
mpl
eted
in 2
007,
esp
ecia
lly w
ith re
spec
t to
the
mov
ie th
eate
r com
plex
, th
is c
ente
r has
per
haps
the
mos
t dat
ed a
ppea
ranc
e of
the
RTA
cen
ters
dis
cuss
ed h
ere.
Acc
ordi
ng
to th
e C
ity o
f Cup
ertin
o, th
is c
ente
r has
app
rova
ls fo
r a 4
6,00
0 sq
uare
-foo
t exp
ansi
on, b
ut th
e de
velo
per i
ndic
ates
a y
ear o
r mor
e of
inte
rnal
revi
ew w
ill o
ccur
prio
r to
brea
king
gro
und.
10
The
Pru
neya
rd/K
ohl’s
/Fry
’s E
lect
roni
cs.
This
reta
il co
ncen
tratio
n is
loca
ted
near
the
Ham
ilton
A
venu
e ex
it fr
om H
ighw
ay 1
7 in
Cam
pbel
l, ap
prox
imat
ely
seve
n m
inut
es d
rive
time
from
the
Nor
th 4
0 si
te.
The
Prun
eyar
d is
a 2
50,0
00 sq
uare
foot
life
styl
e ce
nter
loca
ted
at S
outh
Bas
com
an
d Ea
st C
ampb
ell A
venu
e w
hich
firs
t ope
ned
in 1
969,
and
und
erw
ent s
ubst
antia
l ren
ovat
ion
in
the
1990
s and
late
r. It
is p
art o
f a la
rger
mix
ed-u
se p
roje
ct w
hich
incl
udes
a h
otel
and
off
ice
spac
e. K
ey te
nant
s inc
lude
Bar
nes &
Nob
le, T
rade
r Joe
’s, M
arsh
alls
, and
the
Cam
era
7 C
inem
as.
N
earb
y on
the
othe
r sid
e of
Hig
hway
17
on H
amilt
on a
re tw
o m
ajor
free
-sta
ndin
g st
ores
, Koh
l’s
and
Fry’
s Ele
ctro
nics
. Th
e Fr
y’s s
ells
a w
ide
varie
ty o
f ele
ctro
nics
and
app
lianc
es, a
nd w
ould
pr
ovid
e su
bsta
ntia
l com
petit
ion
for a
sim
ilar o
utle
t at t
he N
orth
40.
T
arge
t/Hom
e D
epot
on
Hill
sdal
e. T
hese
stor
es in
San
Jose
are
the
hom
e im
prov
emen
t cen
ter
and
larg
e-fo
rmat
dis
coun
t gen
eral
mer
chan
dise
stor
e cl
oses
t to
the
Nor
th 4
0 si
te, a
t six
min
utes
dr
ive
time
from
the
Nor
th 4
0 si
te.
Each
of t
hese
stor
es is
app
roxi
mat
ely
110,
000
squa
re fe
et.
Ther
e ar
e a
num
ber o
f oth
er b
usin
esse
s clu
ster
ed in
the
vici
nity
, inc
ludi
ng T
J Max
x, 2
4 H
our
Fitn
ess,
and
Payl
ess S
hoe
Sour
ce.
W
estf
ield
Oak
ridg
e an
d E
nvir
ons.
Wes
tfiel
d O
akrid
ge is
a re
gion
al m
all o
f app
roxi
mat
ely
1.3
mill
ion
squa
re fe
et, a
ncho
red
by M
acy’
s, Se
ars,
and
Targ
et, w
ith a
tota
l of o
ver 2
00 st
ores
, in
clud
ing
a 20
-scr
een
thea
ter c
ompl
ex.
This
cen
ter o
pene
d in
197
3, a
nd h
as b
een
exte
nsiv
ely
rem
odel
ed o
ver t
he y
ears
, inc
ludi
ng a
maj
or re
cons
truct
ion
of th
e ci
nem
a co
mpl
ex in
200
3. I
t is
appr
oxim
atel
y ei
ght m
inut
es d
rive
time
from
the
Nor
th 4
0 si
te.
Ther
e ar
e se
vera
l oth
er c
ente
rs a
nd fr
eest
andi
ng re
tail
stor
es in
the
vici
nity
of t
his m
all.
The
se
incl
ude
the
559,
000
squa
re-f
oot A
lmad
en P
laza
, anc
hore
d by
Cos
tco,
with
Bar
nes &
Nob
le, R
oss,
and
Trad
er Jo
e’s,
and
Hill
view
Pla
za, a
ncho
red
by K
ohl’s
and
Hom
e D
epot
. A
lmad
en R
anch
is a
pr
opos
ed p
ower
cen
ter t
o th
e no
rth o
f Hig
hway
85
on A
lmad
en E
xpre
ssw
ay, p
lann
ed a
t 350
,000
to
400
,000
squa
re fe
et w
ith a
pos
sibl
e op
enin
g da
te in
201
2. A
dditi
onal
ly, W
alm
art h
as p
lans
to
10
For
pla
nned
and
pro
pose
d pr
ojec
ts in
the
RTA
, see
App
endi
x B
.

re-te
nant
a v
acan
t Exp
o D
esig
n C
ente
r spa
ce o
n th
e no
rthw
est c
orne
r of A
lmad
en E
xpre
ssw
ay
and
Hig
hway
85.
The
re is
a B
est B
uy fr
ontin
g A
lmad
en E
xpre
ssw
ay a
djac
ent t
o th
is fo
rmer
Ex
po D
esig
n C
ente
r.
The
Pla
nt.
The
Plan
t is a
val
ue-o
rient
ed p
ower
cen
ter a
t the
eas
tern
edg
e of
the
RTA
at
Mon
tere
y H
ighw
ay a
nd C
urtn
er A
venu
e in
San
Jose
, 13
min
utes
driv
e tim
e fr
om th
e N
orth
40
site
. O
pene
d in
200
7, th
e Pl
ant t
otal
s 643
,325
squa
re fe
et, a
ncho
red
by T
arge
t and
Hom
e D
epot
, w
ith B
est B
uy, T
oys R
Us/
Bab
ies R
Us a
nd R
oss a
s oth
er m
ajor
tena
nts.
W
estf
ield
Val
ley
Fair
. Th
is u
psca
le re
gion
al m
all i
s loc
ated
at t
he n
orth
ern
edge
of t
he R
TA,
stra
ddlin
g th
e Sa
n Jo
se/S
anta
Cla
ra b
orde
r,11 n
ine
min
utes
driv
e tim
e fr
om th
e N
orth
40
site
. O
rigin
ally
ope
ned
as tw
o ce
nter
s in
the
1950
s and
con
solid
ated
into
one
larg
e m
all i
n th
e la
te
1980
s, th
e ce
nter
has
seen
subs
tant
ial r
emod
elin
g an
d re
conf
igur
atio
n ov
er th
e ye
ars,
and
curr
ently
incl
udes
app
roxi
mat
ely
1.5
mill
ion
squa
re fe
et o
f spa
ce.
Anc
hor t
enan
ts in
clud
e N
ords
trom
, Mac
y’s,
and
Mac
y’s M
en’s
& H
ome,
with
ove
r 250
add
ition
al st
ores
. Th
e ce
nter
has
ap
prov
ed p
lans
for a
n ad
ditio
nal 5
50,0
00 sq
uare
-foo
t exp
ansi
on, p
ossi
bly
incl
udin
g N
eim
an
Mar
cus a
nd B
loom
ingd
ale’
s as a
dditi
onal
anc
hors
, but
thes
e pl
ans h
ave
been
on
hold
pen
ding
ec
onom
ic re
cove
ry.
Ther
e is
a m
ovie
thea
ter c
ompl
ex ju
st to
the
sout
h of
this
cen
ter o
n W
inch
este
r Bou
leva
rd.
Sant
ana
Row
. A
n up
scal
e op
en-a
ir lif
esty
le c
ente
r, Sa
ntan
a R
ow fi
rst o
pene
d in
200
3, a
nd is
lo
cate
d di
rect
ly a
cros
s Ste
vens
Cre
ek B
oule
vard
from
Wes
tfiel
d V
alle
y Fa
ir, w
ith a
dditi
onal
co
nstru
ctio
n oc
curr
ing
sinc
e th
en, i
nclu
ding
reta
il, o
ffic
e, a
nd re
side
ntia
l spa
ce.
This
mix
ed-u
se
com
plex
cur
rent
ly in
clud
es 5
82,0
00 sq
uare
feet
of r
etai
l spa
ce, a
nd a
lso
incl
udes
resi
dent
ial,
offic
e, a
nd h
otel
use
s, in
an
atte
mpt
to c
reat
e an
env
ironm
ent r
esem
blin
g an
urb
an M
ain
Stre
et.
Tena
nts i
nclu
de B
est B
uy, A
nthr
opol
ogie
, Bro
oks B
roth
ers,
Cra
te &
Bar
rel,
and
the
six-
scre
en
Cin
éArts
San
tana
Row
mov
ie th
eate
r com
plex
show
ing
a m
ix o
f firs
t-run
maj
or m
ovie
s and
in
depe
nden
t, fo
reig
n, a
nd d
ocum
enta
ry fi
lms.
Whi
le d
omin
ated
by
form
ula
reta
ilers
, the
reta
il m
ix o
f thi
s cen
ter s
omew
hat r
esem
bles
that
of d
ownt
own
Los G
atos
in ta
rget
ing
high
er-in
com
e sh
oppe
rs a
nd in
the
mix
of s
hops
and
din
ing,
and
its o
peni
ng w
as th
e su
bjec
t of c
once
rn a
mon
g re
taile
rs in
Los
Gat
os.
The
impa
cts o
f its
ope
ning
on
Dow
ntow
n ar
e di
scus
sed
late
r in
this
repo
rt in
the
sale
s ana
lysi
s cha
pter
. H
itach
i Site
. A
t the
far e
aste
rn e
dge
of th
e R
TA o
n C
ottle
Roa
d ne
ar w
here
Hig
hway
85
term
inat
es a
t U.S
. 101
at 1
1 m
inut
es d
rive
time
from
the
Nor
th 4
0 si
te, i
s a 1
00-a
cre
site
pro
pose
d fo
r bot
h re
side
ntia
l and
com
mer
cial
dev
elop
men
t, w
ith 3
0 ac
res e
ntitl
ed fo
r ret
ail d
evel
opm
ent,
adja
cent
to a
Low
e’s a
nd a
n O
rcha
rd S
uppl
y H
ardw
are,
with
a W
alm
art a
cros
s Mon
tere
y H
ighw
ay.
N
orth
For
ty S
peci
fic P
lan
Mar
ket S
tudy
and
Bus
ines
s Dev
elop
men
t Stra
tegy
11 W
hile
the
map
of t
he R
TA sh
ows t
his c
ente
r as i
nsid
e its
bou
ndar
ies,
the
cent
er u
ses a
San
ta C
lara
Zip
C
ode
that
is n
ot in
clud
ed in
the
RTA
def
initi
on.
Thus
the
sale
s in
this
cen
ter a
re n
ot p
art o
f tho
se re
porte
d fo
r th
e R
TA.
Pa
ge 3
7 of
150

Nor
th F
orty
Spe
cific
Pla
n M
arke
t Stu
dy a
nd B
usin
ess D
evel
opm
ent S
trate
gy
Page
38
of 1
50
In su
mm
ary,
the
RTA
con
tain
s a la
rge
mix
and
var
iety
of r
egio
nal r
etai
l cen
ters
rang
ing
from
di
scou
nt to
hig
h en
d sh
oppi
ng, a
nd fr
om p
ower
cen
ters
to li
fest
yle
cent
ers t
o m
ajor
enc
lose
d m
alls
. In
add
ition
to th
ese
cent
ers,
ther
e ar
e ot
her r
egio
nal c
ente
rs b
eyon
d th
e R
TA th
at d
raw
sh
oppe
rs fr
om th
e R
TA; f
or e
xam
ple,
Sta
nfor
d Sh
oppi
ng C
ente
r is a
n up
scal
e op
en-a
ir m
all w
ith
Nei
man
Mar
cus a
nd B
loom
ingd
ale’
s and
oth
er sm
all h
igh-
end
shop
s; si
mila
r ret
ail o
r new
out
lets
fo
r the
se st
ores
in L
os G
atos
cou
ld re
capt
ure
high
-inco
me
dest
inat
ion
shop
pers
from
the
RTA
. A
t th
e ot
her e
nd o
f the
spec
trum
, the
Gre
at M
all i
n M
ilpita
s is a
larg
e ou
tlet m
all t
hat i
s eas
ily
acce
ssib
le fr
om th
e R
TA.
Ther
e ar
e nu
mer
ous o
ther
cen
ters
in th
e re
gion
that
may
als
o at
tract
R
TA re
side
nts.
Dev
elop
men
t at t
he N
orth
40
coul
d se
rve
to a
ttrac
t and
reca
ptur
e sa
les i
n ty
pes o
f re
tail
not c
urre
ntly
foun
d in
Los
Gat
os, a
chie
ving
the
Tow
n’s g
oals
as s
tate
d in
its r
ecen
tly
adop
ted
Gen
eral
Pla
n to
“su
ppor
t an
activ
e bu
sine
ss c
omm
unity
that
pro
vide
s a w
ide
varie
ty o
f go
ods a
nd se
rvic
es a
nd a
bro
ad ra
nge
of e
mpl
oym
ent o
ppor
tuni
ties,
min
imiz
ing
the
need
to tr
avel
to
oth
er c
omm
uniti
es,”
12 a
s wel
l as e
nhan
cing
the
fisca
l hea
lth o
f the
Tow
n.
Ret
ail D
istr
icts
and
Cen
ters
in L
os G
atos
Th
e To
wn
of L
os G
atos
has
a n
umbe
r of d
istin
ct re
tail
dist
ricts
and
cen
ters
. Fo
r ana
lytic
al
purp
oses
, the
maj
ority
of r
etai
lers
in th
e To
wn
are
in o
ne o
f the
follo
win
g ar
eas:
• D
ownt
own
• Lo
s Gat
os B
oule
vard
•
Nei
ghbo
rhoo
d C
ente
rs
Dow
ntow
n. T
his l
arge
r are
a in
clud
es th
ree
suba
reas
, the
Dow
ntow
n C
ore,
Dow
ntow
n N
orth
, and
th
e B
loss
om H
ill/U
nive
rsity
dis
trict
, as s
how
n in
Fig
ure
6. T
he D
ownt
own
Cor
e re
pres
ents
the
“hea
rt” o
f Los
Gat
os, w
ith a
mix
of s
mal
l sho
ps in
a sm
all-t
own
mai
n-st
reet
setti
ng w
ith m
any
hist
oric
stru
ctur
es, p
rimar
ily a
long
San
ta C
ruz
Ave
nue
and
Mai
n St
reet
. D
ownt
own
Nor
th is
m
ore
auto
-orie
nted
, with
a fe
w la
rger
stor
es, a
nd m
ore
conv
entio
nal s
trip
cent
ers a
s wel
l as
scat
tere
d fr
ee-s
tand
ing
outle
ts a
long
Nor
th S
anta
Cru
z. B
loss
om H
ill/U
nive
rsity
con
sist
s lar
gely
of
non
-ret
ail u
ses,
incl
udin
g of
fice
and
resi
dent
ial,
with
the
larg
est c
once
ntra
tion
of re
tail
and
serv
ice
busi
ness
es a
long
the
east
side
of U
nive
rsity
sout
h of
Blo
ssom
Hill
Roa
d.
Bas
ed o
n St
ate
Boa
rd o
f Equ
aliz
atio
n (S
BO
E) d
ata,
the
mix
of b
usin
esse
s by
type
is a
s sho
wn
in
Tabl
e 10
, kee
ping
in m
ind
that
bec
ause
of v
aryi
ng st
ore
size
s, th
e m
ix b
y bu
sine
ss ty
pe d
oes n
ot
nece
ssar
ily re
pres
ent t
he p
ropo
rtion
s of s
ales
for e
ach
cate
gory
.13 R
etai
l sal
es a
re d
iscu
ssed
in
mor
e de
tail
in su
bseq
uent
sect
ions
of t
his r
epor
t.
12
Tow
n of
Los
Gat
os 2
020
Gen
eral
Pla
n, p
repa
red
for t
he T
own
of L
os G
atos
, pre
pare
d by
Des
ign,
C
omm
unity
& E
nviro
nmen
t, Ja
nuar
y 7,
201
1, p
. VIS
-1.
13 N
ote
that
bus
ines
ses n
ot re
quire
d to
col
lect
sale
s tax
es a
re n
ot in
the
SBO
E lis
tings
, so
the
focu
s her
e is
la
rgel
y on
the
reta
il se
ctor
. In
clud
es b
usin
esse
s act
ive
at a
ny ti
me
in 2
010.

Figu
re 6
: Los
Gat
os R
etai
l Dis
tric
ts
A
s sho
wn
in T
able
10,
the
Cor
e ar
ea a
ccou
nts f
or n
early
thre
e-qu
arte
rs o
f all
busi
ness
es in
the
Dow
ntow
n, a
nd h
as th
e st
rong
est o
rient
atio
n to
war
d re
tail.
SB
OE
lists
243
reta
il bu
sine
sses
in
the
Cor
e, a
cros
s all
the
maj
or re
tail
cate
gorie
s. T
he la
rges
t con
cent
ratio
ns a
re in
app
arel
, eat
ing
and
drin
king
, and
oth
er re
tail.
App
roxi
mat
ely
one-
third
of b
usin
esse
s are
in th
e “a
ll ot
her o
utle
ts”
cate
gory
, whi
ch in
clud
es w
hole
sale
, ind
ustry
, and
bus
ines
s and
per
sona
l ser
vice
s. T
able
11
prov
ides
a m
ore
deta
iled
brea
kdow
n of
thes
e ca
tego
ries f
or th
e D
ownt
own
Cor
e; th
e m
ajor
ity o
f th
e ot
her o
utle
ts a
re a
lso
cons
umer
orie
nted
per
sona
l ser
vice
s bus
ines
ses (
e.g.
, hai
r sal
ons)
.
N
orth
For
ty S
peci
fic P
lan
Mar
ket S
tudy
and
Bus
ines
s Dev
elop
men
t Stra
tegy
Pa
ge 3
9 of
150
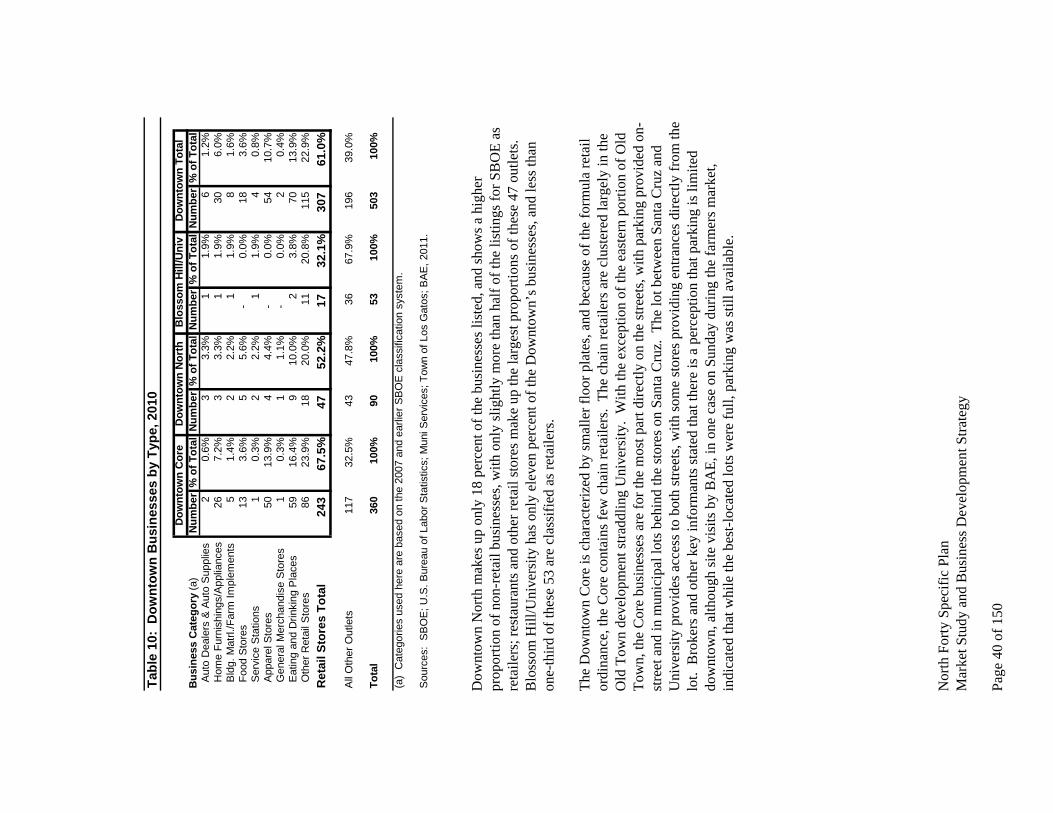
Tabl
e 10
: D
ownt
own
Bus
ines
ses
by T
ype,
201
0
Dow
ntow
n C
ore
Dow
ntow
n N
orth
Blo
ssom
Hill
/Uni
vD
ownt
own
Tota
lB
usin
ess
Cat
egor
y (a
)N
umbe
r%
of T
otal
Num
ber
% o
f Tot
alN
umbe
r%
of T
otal
Num
ber
% o
f Tot
al A
uto
Dea
lers
& A
uto
Sup
plie
s2
0.6%
3
3.3%
1
1.9%
6
1.
2% H
ome
Furn
ishi
ngs/
App
lianc
es26
7.
2%3
3.
3%1
1.
9%30
6.
0% B
ldg.
Mat
rl./F
arm
Impl
emen
ts5
1.4%
2
2.2%
1
1.9%
8
1.
6% F
ood
Sto
res
13
3.6%
5
5.6%
-
0.
0%18
3.
6% S
ervi
ce S
tatio
ns1
0.3%
2
2.2%
1
1.9%
4
0.
8% A
ppar
el S
tore
s50
13
.9%
4
4.4%
-
0.
0%54
10
.7%
Gen
eral
Mer
chan
dise
Sto
res
1
0.
3%1
1.
1%-
0.0%
2
0.
4% E
atin
g an
d D
rinki
ng P
lace
s59
16
.4%
9
10.0
%2
3.
8%70
13
.9%
Oth
er R
etai
l Sto
res
86
23.9
%18
20.0
%11
20.8
%11
5
22
.9%
Ret
ail S
tore
s To
tal
243
67.5
%47
52
.2%
17
32.1
%30
7
61
.0%
All
Oth
er O
utle
ts11
7
32
.5%
43
47
.8%
36
67
.9%
196
39.0
%
Tota
l36
0
10
0%90
100%
53
10
0%50
3
10
0%
(a)
Cat
egor
ies
used
her
e ar
e ba
sed
on th
e 20
07 a
nd e
arlie
r SB
OE
cla
ssifi
catio
n sy
stem
.
Sou
rces
: S
BO
E; U
.S. B
urea
u of
Lab
or S
tatis
tics;
Mun
i Ser
vice
s; T
own
of L
os G
atos
; BA
E, 2
011.
Dow
ntow
n N
orth
mak
es u
p on
ly 1
8 pe
rcen
t of t
he b
usin
esse
s lis
ted,
and
show
s a h
ighe
r pr
opor
tion
of n
on-r
etai
l bus
ines
ses,
with
onl
y sl
ight
ly m
ore
than
hal
f of t
he li
stin
gs fo
r SB
OE
as
reta
ilers
; res
taur
ants
and
oth
er re
tail
stor
es m
ake
up th
e la
rges
t pro
porti
ons o
f the
se 4
7 ou
tlets
. B
loss
om H
ill/U
nive
rsity
has
onl
y el
even
per
cent
of t
he D
ownt
own’
s bus
ines
ses,
and
less
than
on
e-th
ird o
f the
se 5
3 ar
e cl
assi
fied
as re
taile
rs.
Th
e D
ownt
own
Cor
e is
cha
ract
eriz
ed b
y sm
alle
r flo
or p
late
s, an
d be
caus
e of
the
form
ula
reta
il or
dina
nce,
the
Cor
e co
ntai
ns fe
w c
hain
reta
ilers
. Th
e ch
ain
reta
ilers
are
clu
ster
ed la
rgel
y in
the
Old
Tow
n de
velo
pmen
t stra
ddlin
g U
nive
rsity
. W
ith th
e ex
cept
ion
of th
e ea
ster
n po
rtion
of O
ld
Tow
n, th
e C
ore
busi
ness
es a
re fo
r the
mos
t par
t dire
ctly
on
the
stre
ets,
with
par
king
pro
vide
d on
-st
reet
and
in m
unic
ipal
lots
beh
ind
the
stor
es o
n Sa
nta
Cru
z. T
he lo
t bet
wee
n Sa
nta
Cru
z an
d U
nive
rsity
pro
vide
s acc
ess t
o bo
th st
reet
s, w
ith so
me
stor
es p
rovi
ding
ent
ranc
es d
irect
ly fr
om th
e lo
t. B
roke
rs a
nd o
ther
key
info
rman
ts st
ated
that
ther
e is
a p
erce
ptio
n th
at p
arki
ng is
lim
ited
dow
ntow
n, a
lthou
gh si
te v
isits
by
BA
E, in
one
cas
e on
Sun
day
durin
g th
e fa
rmer
s mar
ket,
indi
cate
d th
at w
hile
the
best
-loca
ted
lots
wer
e fu
ll, p
arki
ng w
as st
ill a
vaila
ble.
N
orth
For
ty S
peci
fic P
lan
Mar
ket S
tudy
and
Bus
ines
s Dev
elop
men
t Stra
tegy
Pa
ge 4
0 of
150

Tabl
e 11
: D
ownt
own
Cor
e B
usin
ess
Det
ail,
2010
Bus
ines
s C
ateg
ory
(a)
Num
ber
% o
f Tot
al A
uto
Dea
lers
& A
uto
Sup
plie
s2
0.
6% H
ome
Furn
ishi
ngs/
App
lianc
es26
7.2%
Bld
g. M
atrl.
/Far
m Im
plem
ents
5
1.4%
Foo
d S
tore
s13
3.6%
Ser
vice
Sta
tions
1
0.3%
App
arel
Sto
res
50
13
.9%
Gen
eral
Mer
chan
dise
Sto
res
1
0.3%
Eat
ing
and
Drin
king
Pla
ces
59
16
.4%
Oth
er R
etai
l Sto
res
Art,
Gift
, Nov
eltie
s8
2.
2%B
oat/M
otor
cycl
e1
0.
3%C
igar
Sto
res
2
0.6%
Flor
ists
2
0.6%
Jew
elry
Sto
res
1 2
3.
3%Li
quor
Sto
res
2
0.6%
Mus
ic S
tore
s2
0.
6%O
ffice
Eqp
mt S
tore
Cou
n t1
0.
3%S
econ
d H
and
Sto
res
4
1.1%
Spe
cial
ty S
tore
s44
12.2
%S
porti
ng G
oods
5
1.4%
Sta
tione
ry/B
ooks
3
0.8%
Oth
er R
etai
l Sub
tota
l86
23.9
%
Ret
ail S
tore
s To
tal
243
67.5
%
All
Oth
er O
utle
tsB
usin
ess
To B
usin
ess
3610
.0%
Per
sona
l Ser
vice
s65
18.1
%M
isce
llane
ous
164.
4%A
ll O
ther
Out
lets
Sub
tota
l11
732
.5%
Tota
l36
0
10
0%
Sour
ces:
SBO
E; U
.S. B
urea
u of
Lab
or S
tatis
tics;
Mun
i Ser
vice
s; T
own
of L
os G
atos
; BAE
, 201
1.
In th
e N
orth
suba
rea,
ther
e ar
e so
me
larg
er st
ores
, esp
ecia
lly W
algr
eens
and
the
soon
-to-o
pen
rebu
ilt a
nd e
xpan
ded
Safe
way
,14 a
nd c
onve
ntio
nal s
trip
cent
ers s
uch
as th
e W
algr
eens
Cen
ter a
nd
the
Los G
atos
Sho
ppin
g C
ente
r, w
ith st
ores
set b
ack
from
the
stre
et b
y pa
rkin
g lo
ts.
Th
e m
ix o
f ret
ail t
ypes
, as w
ell a
s the
leak
age
anal
ysis
for L
os G
atos
as d
iscu
ssed
in th
e ne
xt
chap
ter,
indi
cate
that
Dow
ntow
n is
seen
as a
reta
il de
stin
atio
n, d
raw
ing
shop
pers
from
Los
Gat
os
as w
ell a
s oth
er n
earb
y co
mm
uniti
es.
Inte
rvie
ws w
ith re
taile
rs, b
roke
rs, a
nd o
ther
key
in
form
ants
15 c
onfir
med
this
. B
ecau
se o
f a la
ck o
f ret
ail,
Mon
te S
eren
o an
d Sa
rato
ga re
side
nts i
n pa
rticu
lar a
ppea
r to
be a
ttrac
ted
to L
os G
atos
for b
oth
the
dow
ntow
n sp
ecia
lty sh
ops,
as w
ell a
s th
e co
nven
ienc
e-or
ient
ed re
tail
in th
e D
ownt
own
Nor
th a
rea
and
on L
os G
atos
Bou
leva
rd.
For
inst
ance
, the
re-o
peni
ng S
afew
ay w
ill b
e th
e cl
oses
t sup
erm
arke
t to
Mon
te S
eren
o re
side
nts.
14
Gra
nd o
peni
ng is
set f
or A
ugus
t 26,
201
1. h
ttp://
safe
way
dow
ntow
nlos
gato
s.com
, acc
esse
d Ju
ly 1
5, 2
011.
N
orth
For
ty S
peci
fic P
lan
Mar
ket S
tudy
and
Bus
ines
s Dev
elop
men
t Stra
tegy
15 A
list
of k
ey in
form
ants
can
be
foun
d in
App
endi
x F.
Pa
ge 4
1 of
150

Shop
pers
from
oth
er n
earb
y ci
ties,
such
as C
uper
tino,
Cam
pbel
l, an
d Sa
n Jo
se, h
ave
ampl
e co
nven
ienc
e-or
ient
ed re
tail
near
by b
ut c
ome
to L
os G
atos
for t
he D
ownt
own
expe
rienc
e.
Add
ition
ally
, som
e in
form
ants
stat
ed th
at th
e D
ownt
own
is a
lso
a to
uris
t des
tinat
ion,
with
out
-of-
tow
ners
(par
ticul
arly
thos
e st
ayin
g at
the
loca
l hot
els)
com
ing
to e
xper
ienc
e th
e sm
all t
own
and
pede
stria
n-fr
iend
ly a
mbi
ence
. L
os G
atos
Bou
leva
rd.
Los G
atos
Bou
leva
rd is
a m
ix o
f com
mun
ity sh
oppi
ng c
ente
rs, a
uto
deal
ers a
nd re
late
d bu
sine
sses
, and
free
-sta
ndin
g re
tail
outle
ts.
The
four
larg
est s
hopp
ing
cent
ers
are
each
anc
hore
d by
a su
perm
arke
t. T
he a
rea
is d
efin
ed a
s sho
wn
in F
igur
e 6
abov
e.
Los G
atos
Bou
leva
rd is
stro
ngly
diff
eren
tiate
d fr
om D
ownt
own
in it
s ret
ail m
ix, w
ith a
mor
e lim
ited
num
ber o
f sto
res c
arry
ing
“com
paris
on”
good
s suc
h as
hom
e fu
rnis
hing
s and
app
arel
(see
Ta
ble
12).
The
re a
re c
onsi
dera
bly
mor
e m
id-s
ize
stor
e sp
aces
, suc
h as
the
supe
rmar
kets
, dru
g st
ores
, and
har
dwar
e st
ore.
The
re a
re a
ppro
xim
atel
y 10
0 re
tail
outle
ts in
the
area
, as c
ompa
red
to
over
300
Dow
ntow
n. T
here
are
als
o a
subs
tant
ial n
umbe
r of n
on-r
etai
l bus
ines
ses s
uch
as
busi
ness
and
per
sona
l ser
vice
s, su
ch a
s aut
o re
pair
whi
ch d
oes a
lso
sell
parts
and
thus
repo
rts
taxa
ble
sale
s.
Tabl
e 12
: Lo
s G
atos
Bou
leva
rd B
usin
esse
s by
Typ
e, 2
010
Bus
ines
s C
ateg
ory
(a)
Num
ber
% o
f Tot
al A
uto
Dea
lers
& A
uto
Sup
plie
s13
7.
9% H
ome
Furn
ishi
ngs/
App
lianc
es3
1.
8% B
ldg.
Mat
rl./F
arm
Impl
emen
ts2
1.
2% F
ood
Sto
res
13
7.9%
Ser
vice
Sta
tions
4
2.4%
App
arel
Sto
res
1
0.6%
Gen
eral
Mer
chan
dise
Sto
res
2
1.2%
Eat
ing
and
Drin
king
Pla
ces
23
13.9
% O
ther
Ret
ail S
tore
s37
22
.4%
Ret
ail S
tore
s To
tal
98
59.4
%
All
Oth
er O
utle
ts67
40
.6%
Tota
l16
5
10
0%
(a)
Cat
egor
ies
used
her
e ar
e ba
sed
on th
e 20
07 a
nd e
arlie
r SB
OE
cla
ssifi
catio
n sy
stem
.
Sour
ces:
SBO
E; U
.S. B
urea
u of
Lab
or S
tatis
tics;
Mun
i Ser
vice
s; T
own
of L
os G
atos
; BAE
, 201
1.
W
hile
the
Dow
ntow
n co
nfig
urat
ion
allo
ws f
or a
stro
ng p
edes
trian
-orie
nted
exp
erie
nce,
Los
Gat
os
Bou
leva
rd is
gen
eral
ly a
uto-
orie
nted
. Th
e B
oule
vard
’s re
tail
mix
is b
ifurc
ated
bet
wee
n th
e au
to-
rela
ted
reta
il an
d th
e co
nven
ienc
e-or
ient
ed sh
oppi
ng p
rovi
ded
by th
e fo
ur su
perm
arke
t-orie
nted
ce
nter
s. H
owev
er, t
wo
of th
e su
perm
arke
ts, W
hole
Foo
ds a
nd T
rade
r Joe
’s, a
re n
iche
su
perm
arke
ts ra
ther
than
mor
e ge
neric
mar
kets
. Lu
nard
i’s is
par
t of a
smal
ler r
egio
nal c
hain
, and
br
oker
inte
rvie
ws a
nd o
ther
sour
ces i
ndic
ate
extre
mel
y st
rong
sale
s. A
s will
be
seen
from
the
leak
age
anal
ysis
dis
cuss
ion,
the
Tow
n is
a st
rong
attr
acto
r for
gro
cery
shop
pers
, lik
ely
due
in p
art
Nor
th F
orty
Spe
cific
Pla
n M
arke
t Stu
dy a
nd B
usin
ess D
evel
opm
ent S
trate
gy
Page
42
of 1
50

to th
e va
riety
of s
tore
s on
Los G
atos
Bou
leva
rd th
at a
re a
lso
easi
ly a
cces
sibl
e to
par
ts o
f C
ampb
ell a
nd S
an Jo
se.
B
ecau
se o
f the
reta
il m
ix th
is a
rea
serv
es la
rgel
y as
a sh
oppi
ng d
estin
atio
n fo
r eve
ryda
y ne
eds
(asi
de fr
om th
e re
mai
ning
new
car
dea
lers
), co
mpl
emen
ting
the
Dow
ntow
n’s m
ore
spec
ializ
ed
and
regi
on-s
ervi
ng m
ix.
This
was
con
firm
ed b
y th
e ke
y in
form
ants
inte
rvie
wed
, alth
ough
ther
e ar
e so
me
spec
ialty
shop
s suc
h as
the
Woo
den
Toy
Hor
se S
tore
whi
ch d
raw
from
a b
road
er a
rea.
Th
e re
mai
ning
new
car
dea
lers
are
Moo
re B
uick
, Los
Gat
os A
cura
, and
Los
Gat
os L
uxur
y C
ars.
In
rece
nt y
ears
, Los
Gat
os B
oule
vard
has
lost
Che
vrol
et, H
onda
, and
For
d de
aler
ship
s as t
he
auto
mot
ive
indu
stry
has
rest
ruct
ured
in th
e fa
ce o
f dec
linin
g sa
les.
The
re a
re a
var
iety
of a
uto-
rela
ted
anci
llary
bus
ines
ses,
whi
ch in
clud
e ca
r ren
tal f
acili
ties,
auto
repa
ir, a
nd a
uto
parts
out
lets
.
In a
dditi
on to
the
thre
e su
perm
arke
ts m
entio
ned
abov
e, th
ere
is a
Nob
Hill
Foo
ds in
the
El G
ato
Vill
age
cent
er.
Rite
Aid
is lo
cate
d in
the
Blo
ssom
Hill
Sho
ppin
g C
ente
r with
Who
le F
oods
, and
C
VS/
Phar
mac
y is
in K
ings
Cou
rt w
ith L
unar
di’s
. Th
e C
VS
is m
ovin
g to
a fr
ee-s
tand
ing
stor
e in
th
e ne
ar fu
ture
on
the
form
er si
te o
f the
Che
vrol
et d
eale
rshi
p. T
here
are
als
o pl
ans f
or
appr
oxim
atel
y 30
,000
squa
re fe
et o
f com
mer
cial
spac
e on
the
form
er si
te o
f the
For
d de
aler
ship
(s
ee A
ppen
dix
B fo
r pla
nned
and
pro
pose
d de
velo
pmen
ts).
Oth
er re
tail
in th
e ar
ea in
clud
es a
bro
ad v
arie
ty o
f res
taur
ants
, one
of t
he T
own’
s tw
o ha
rdw
are
stor
es, L
os G
atos
Ace
Har
dwar
e, a
nd a
n O
ffic
e D
epot
acr
oss f
rom
the
Nor
th 4
0 si
te.
Unl
ike
Dow
ntow
n, se
vera
l of t
he re
stau
rant
s are
fast
-foo
d fr
anch
ises
such
as M
cDon
ald’
s and
Jack
-in-
the-
Box
. N
eigh
borh
ood
Serv
ing
Cen
ters
. Lo
s Gat
os h
as fo
ur m
ajor
nei
ghbo
rhoo
d ce
nter
s, as
show
n in
ab
ove
in F
igur
e 6:
•
Rin
cona
da C
ente
r •
Dow
ning
Cen
ter
• W
algr
eens
Squ
are
• V
ason
a St
atio
n Th
ese
cent
ers a
re c
onve
nien
ce-o
rient
ed, w
ith a
ncho
rs a
nd o
ther
stor
es th
at la
rgel
y se
rve
near
by
resi
dent
s rat
her t
hat a
ttrac
ting
a re
gion
al c
lient
ele.
Int
eres
tingl
y, th
ese
neig
hbor
hood
cen
ters
are
al
l loc
ated
at o
r nea
r the
Tow
n bo
unda
ries,
thus
attr
actin
g sh
oppe
rs fr
om o
utsi
de th
e To
wn
sinc
e th
ey re
pres
ent t
he c
lose
st g
roce
ry o
r dru
g st
ore
shop
ping
. Th
e tw
o su
perm
arke
ts a
nd tw
o dr
ug
stor
es in
thes
e ce
nter
s thu
s con
tribu
te to
the
Tow
n’s c
aptu
re o
f sal
es e
ven
in lo
cal-s
ervi
ng re
tail
cate
gorie
s, as
dis
cuss
ed in
the
leak
age
anal
ysis
.
N
orth
For
ty S
peci
fic P
lan
Mar
ket S
tudy
and
Bus
ines
s Dev
elop
men
t Stra
tegy
Pa
ge 4
3 of
150
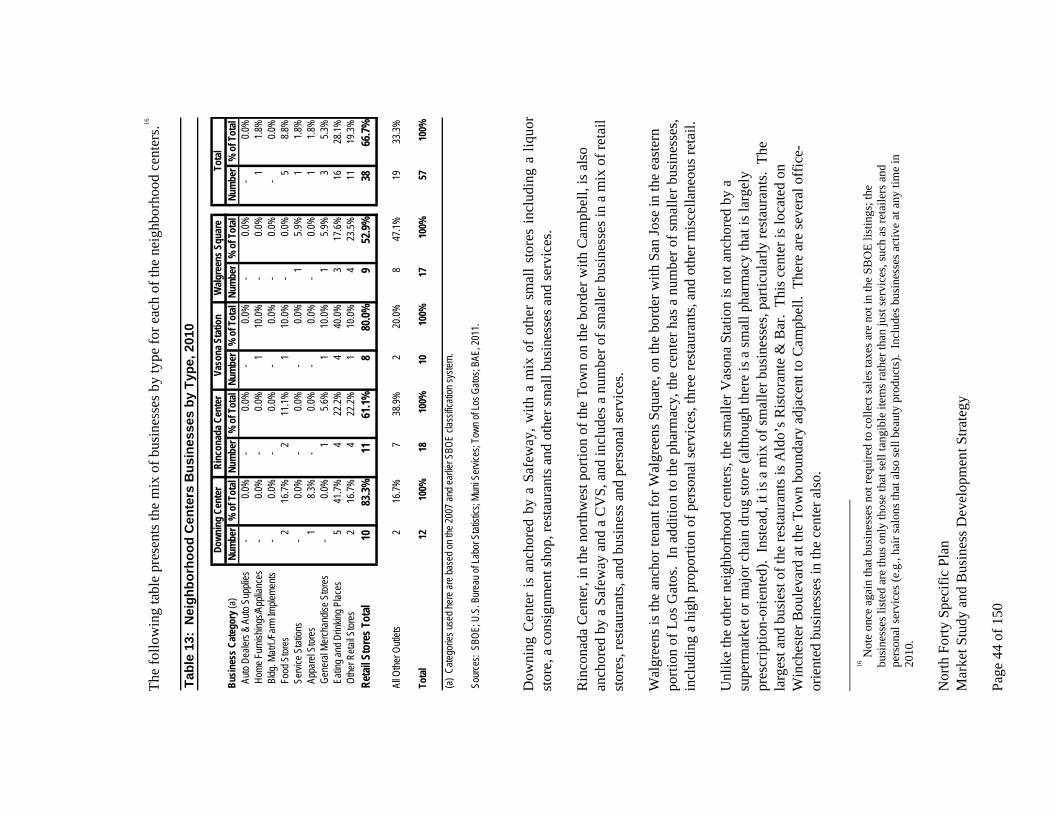
The
follo
win
g ta
ble
pres
ents
the
mix
of b
usin
esse
s by
type
for e
ach
of th
e ne
ighb
orho
od c
ente
rs.16
Ta
ble
13:
Nei
ghbo
rhoo
d C
ente
rs B
usin
esse
s by
Typ
e, 2
010
Down
ing
Cent
erRi
ncon
ada C
ente
rVa
sona
Sta
tion
Walg
reen
s Squ
are
Tota
lBu
sines
s Cat
egor
y (a)
Num
ber
% o
f Tot
alNu
mbe
r%
of T
otal
Num
ber
% o
f Tot
alNu
mbe
r%
of T
otal
Num
ber
% o
f Tot
al A
uto D
ealer
s & A
uto S
uppli
es-
0.0%
-
0.0
%-
0.0%
-
0.0
%-
0.0%
Hom
e Fur
nishin
gs/A
pplia
nces
-
0.0
%-
0.0%
1
10.0%
-
0.0
%1
1.8
% B
ldg. M
atrl./F
arm
Imple
ments
-
0.0
%-
0.0%
-
0.0
%-
0.0%
-
0.0
% F
ood S
tores
2
16.7%
2
11.1%
1
10.0%
-
0.0
%5
8.8
% S
ervic
e Stat
ions
-
0.0
%-
0.0%
-
0.0
%1
5.9
%1
1.8
% A
ppar
el St
ores
1
8.3%
-
0.0
%-
0.0%
-
0.0
%1
1.8
% G
ener
al Me
rchan
dise S
tores
-
0.0
%1
5.6
%1
10
.0%1
5.9
%3
5.3
% E
ating
and D
rinkin
g Plac
es5
41
.7%4
22
.2%4
40
.0%3
17
.6%16
28
.1% O
ther R
etail S
tores
2
16.7%
4
22.2%
1
10.0%
4
23.5%
11
19.3%
Reta
il Sto
res T
otal
10
83
.3%11
61.1%
8
80.0%
9
52.9%
38
66
.7%
All O
ther O
utlets
2
16.7%
7
38.9%
2
20.0%
8
47.1%
19
33.3%
Tota
l12
10
0%18
10
0%10
10
0%17
10
0%57
10
0%
(a)
Categ
ories
used
here
are b
ased
on th
e 200
7 and
earlie
r SBO
E cla
ssific
ation
syste
m.
Sour
ces:
SBO
E; U
.S. B
urea
u of L
abor
Stat
istics
; Mun
i Ser
vices
; Tow
n of L
os G
atos;
BAE,
2011
.
Dow
ning
Cen
ter
is a
ncho
red
by a
Saf
eway
, with
a m
ix o
f ot
her
smal
l sto
res
incl
udin
g a
liquo
r st
ore,
a c
onsi
gnm
ent s
hop,
rest
aura
nts a
nd o
ther
smal
l bus
ines
ses a
nd se
rvic
es.
R
inco
nada
Cen
ter,
in th
e no
rthw
est p
ortio
n of
the
Tow
n on
the
bord
er w
ith C
ampb
ell,
is a
lso
anch
ored
by
a Sa
few
ay a
nd a
CV
S, a
nd in
clud
es a
num
ber o
f sm
alle
r bus
ines
ses i
n a
mix
of r
etai
l st
ores
, res
taur
ants
, and
bus
ines
s and
per
sona
l ser
vice
s.
Wal
gree
ns is
the
anch
or te
nant
for W
algr
eens
Squ
are,
on
the
bord
er w
ith S
an Jo
se in
the
east
ern
porti
on o
f Los
Gat
os.
In a
dditi
on to
the
phar
mac
y, th
e ce
nter
has
a n
umbe
r of s
mal
ler b
usin
esse
s, in
clud
ing
a hi
gh p
ropo
rtion
of p
erso
nal s
ervi
ces,
thre
e re
stau
rant
s, an
d ot
her m
isce
llane
ous r
etai
l. U
nlik
e th
e ot
her n
eigh
borh
ood
cent
ers,
the
smal
ler V
ason
a St
atio
n is
not
anc
hore
d by
a
supe
rmar
ket o
r maj
or c
hain
dru
g st
ore
(alth
ough
ther
e is
a sm
all p
harm
acy
that
is la
rgel
y pr
escr
iptio
n-or
ient
ed).
Inst
ead,
it is
a m
ix o
f sm
alle
r bus
ines
ses,
parti
cula
rly re
stau
rant
s. T
he
larg
est a
nd b
usie
st o
f the
rest
aura
nts i
s Ald
o’s R
isto
rant
e &
Bar
. Th
is c
ente
r is l
ocat
ed o
n W
inch
este
r Bou
leva
rd a
t the
Tow
n bo
unda
ry a
djac
ent t
o C
ampb
ell.
The
re a
re se
vera
l off
ice-
orie
nted
bus
ines
ses i
n th
e ce
nter
als
o.
Nor
th F
orty
Spe
cific
Pla
n M
arke
t Stu
dy a
nd B
usin
ess D
evel
opm
ent S
trate
gy
Page
44
of 1
50
16 N
ote
once
aga
in th
at b
usin
esse
s not
requ
ired
to c
olle
ct sa
les t
axes
are
not
in th
e SB
OE
listin
gs; t
he
busi
ness
es li
sted
are
thus
onl
y th
ose
that
sell
tang
ible
item
s rat
her t
han
just
serv
ices
, suc
h as
reta
ilers
and
pe
rson
al se
rvic
es (e
.g.,
hair
salo
ns th
at a
lso
sell
beau
ty p
rodu
cts)
. In
clud
es b
usin
esse
s act
ive
at a
ny ti
me
in
2010
.

Re
tail
Ma
rke
t A
ss
es
sm
en
t:
Sa
les
an
d L
ea
ka
ge
An
aly
sis
Th
is se
ctio
n ex
amin
es re
tail
sale
s con
ditio
ns in
Los
Gat
os a
nd th
e R
etai
l Tra
de A
rea
(RTA
).
Dat
a fo
r the
Tow
n an
d th
e R
TA a
re p
rese
nted
, alo
ng w
ith c
ompa
rativ
e da
ta fr
om S
anta
Cla
ra
Cou
nty
and
Cal
iforn
ia.
The
anal
ysis
pre
sent
s an
over
view
of r
etai
l sal
es fo
cusi
ng o
n ca
tego
ries
that
mig
ht re
pres
ent t
he p
rimar
y co
mpe
titio
n w
ith re
tail
at th
e N
orth
40
site
. A
leak
age
anal
ysis
fo
r the
Tow
n an
d th
e R
TA is
und
erta
ken
to id
entif
y th
e re
lativ
e st
reng
th o
f maj
or re
tail
sect
ors.
Th
e pr
imar
y so
urce
of i
nfor
mat
ion
on g
ener
al re
tail
expe
nditu
res i
n C
alifo
rnia
is th
e ta
xabl
e re
tail
sale
s dat
a pu
blis
hed
by th
e St
ate
Boa
rd o
f Equ
aliz
atio
n (S
BO
E).
SBO
E pu
blis
hes T
axab
le S
ales
in
Cal
iforn
ia, a
qua
rterly
and
ann
ual p
ublic
atio
n th
at re
ports
taxa
ble
sale
s by
maj
or st
ore
cate
gorie
s by
city
and
cou
nty.
With
adj
ustm
ents
mad
e to
take
into
acc
ount
non
taxa
ble
sale
s suc
h as
food
and
pre
scrip
tions
, thi
s sou
rce
usua
lly o
ffer
s the
bes
t bas
elin
e da
ta fo
r jur
isdi
ctio
ns fo
r w
hich
it is
ava
ilabl
e. H
owev
er, b
egin
ning
in 2
009
SBO
E us
ed a
new
cat
egor
izat
ion
of b
usin
esse
s th
at m
akes
com
paris
ons w
ith e
arlie
r dat
a an
d a
cont
inue
d tim
e se
ries d
iffic
ult i
f not
impo
ssib
le.
B
ecau
se o
f the
lim
itatio
ns w
ith S
BO
E da
ta w
ith re
spec
t to
avai
labi
lity
for s
ubar
eas o
f lar
ger c
ities
su
ch a
s San
Jose
whi
ch m
akes
up
a la
rge
porti
on o
f the
RTA
, and
for u
ninc
orpo
rate
d ar
eas (
whi
ch
also
con
stitu
te p
art o
f the
RTA
), th
e le
akag
e an
alys
is it
self
utili
zes e
stim
ates
bas
ed o
n 20
08 Z
ip
Cod
e an
d C
ount
y B
usin
ess P
atte
rns e
mpl
oym
ent d
ata
benc
hmar
ked
to a
djus
ted
data
on
sale
s per
em
ploy
ee fr
om th
e 20
07 E
cono
mic
Cen
sus,
with
adj
ustm
ents
by
cate
gory
mad
e ba
sed
on
cros
sche
cks w
ith S
BO
E da
ta a
nd to
refle
ct m
ore
curr
ent c
ondi
tions
. Th
e us
e of
this
dat
a so
urce
al
so a
llow
s ana
lysi
s by
far m
ore
deta
il by
reta
il se
ctor
. Es
timat
ed R
etai
l Sal
es in
Los
Gat
os a
nd th
e R
TA
by M
ajor
Ret
ail C
ateg
ory
As n
oted
abo
ve, r
etai
l sal
es d
ata
for t
he o
vera
ll R
TA c
anno
t be
deriv
ed fr
om th
e av
aila
ble
taxa
ble
sale
s dat
a, si
nce
thos
e da
ta a
re n
ot p
ublis
hed
sepa
rate
ly fo
r sal
es in
the
porti
on o
f San
Jose
whi
ch
is in
the
RTA
or f
or th
e un
inco
rpor
ated
por
tions
of t
he R
TA.
Furth
erm
ore,
bec
ause
of d
iscl
osur
e is
sues
, the
leve
l of d
etai
l ava
ilabl
e fo
r som
e of
the
citie
s in
the
RTA
is in
suff
icie
nt fo
r the
ana
lysi
s he
re.
In o
rder
to c
ompa
re a
ctua
l exp
endi
ture
s for
all
RTA
resi
dent
s with
pot
entia
l exp
endi
ture
s by
stor
e ca
tego
ry, a
n al
tern
ativ
e es
timat
e m
etho
dolo
gy fo
r est
imat
ing
sale
s for
the
over
all R
TA
has b
een
deve
lope
d. T
his p
oint
-in-ti
me
estim
ate
can
then
als
o ac
coun
t for
the
entir
e po
pula
tion
of th
e R
TA to
der
ive
per c
apita
sale
s est
imat
es fo
r use
in c
ompa
rison
with
a b
ench
mar
k fo
r the
le
akag
e an
alys
is.
For c
ompa
rativ
e pu
rpos
es, s
imila
r est
imat
es h
ave
been
der
ived
for t
he T
own
of
Los G
atos
, San
ta C
lara
Cou
nty,
and
Cal
iforn
ia.
Th
ese
estim
ates
hav
e be
en d
eriv
ed u
sing
the
mos
t rec
ent a
vaila
ble
data
from
the
Cen
sus o
f Ret
ail
Trad
e an
d Zi
p C
ode
Bus
ines
s Pat
tern
s. T
hese
est
imat
es p
rovi
de p
oint
-in-ti
me
data
for t
he T
own
N
orth
For
ty S
peci
fic P
lan
Mar
ket S
tudy
and
Bus
ines
s Dev
elop
men
t Stra
tegy
Pa
ge 4
5 of
150

Nor
th F
orty
Spe
cific
Pla
n M
arke
t Stu
dy a
nd B
usin
ess D
evel
opm
ent S
trate
gy
Page
46
of 1
50
al ,
ell
and
the
RTA
by
deta
iled
reta
il ca
tego
ry.
Furth
er e
xpla
natio
n of
the
met
hodo
logy
can
be
foun
d in
A
ppen
dix
I. Fo
r the
pur
pose
s of t
he a
naly
sis h
ere,
the
estim
ated
reta
il sa
les h
ave
been
gro
uped
into
ele
ven
cate
gorie
s:
•
Mot
or V
ehic
le a
nd P
arts
Dea
lers
•
Hom
e Fu
rnis
hing
s and
App
lianc
e St
ores
•
Bld
g. M
atrl.
and
Gar
den
Equi
p. a
nd S
uppl
ies
• Fo
od a
nd B
ever
age
Stor
es
• H
ealth
and
Per
sona
l Car
e St
ores
•
Gas
olin
e St
atio
ns
• C
loth
ing
and
Clo
thin
g A
cces
sorie
s Sto
res
• Sp
ortin
g G
oods
, Hob
by, B
ook,
and
Mus
ic S
tore
s •
Gen
eral
Mer
chan
dise
Sto
res17
•
Mis
cella
neou
s Sto
re R
etai
lers
•
Food
Ser
vice
s and
Drin
king
Pla
ces18
Sa
les a
t non
-sto
re re
taile
rs (e
.g. m
ail o
rder
and
auc
tion
hous
es) a
re n
ot in
clud
ed in
the
anal
ysis
, no
r are
sale
s occ
urrin
g at
non
-ret
ail o
utle
ts.
Los
Gat
os
As s
how
n in
Tab
le 1
4, re
tail
sale
s for
the
Tow
n fo
r 200
8 ar
e es
timat
ed a
t app
roxi
mat
ely
$838
m
illio
n (a
ll sa
les a
re p
rese
nted
in in
flatio
n-ad
just
ed 2
010
dolla
rs).
The
thre
e la
rges
t cat
egor
ies
are
mot
or v
ehic
le a
nd p
arts
dea
lers
at 3
0 pe
rcen
t of s
ales
,19 fo
od a
nd b
ever
age
stor
es a
t 23
perc
ent,
and
food
serv
ices
and
drin
king
pla
ces a
t 15
perc
ent.
The
pro
porti
on o
f the
Tow
n’s t
otre
tail
sale
s in
mot
or v
ehic
le a
nd fo
od st
ore
sale
s are
con
side
rabl
y hi
gher
than
foun
d in
the
RTA
the
Cou
nty,
or t
he S
tate
. Th
e To
wn
show
s alm
ost n
o sa
les i
n G
ener
al M
erch
andi
se st
ores
, wbe
low
the
prop
ortio
ns fo
r the
oth
er g
eogr
aphi
es.
On
a pe
r cap
ita b
asis
, ret
ail s
ales
in L
os G
atos
ar
e qu
ite h
igh,
at $
28,6
53 a
nnua
lly c
ompa
red
to le
ss th
an $
14,0
00 a
nnua
lly fo
r the
oth
er th
ree
geog
raph
ies.
Sev
eral
sect
ors h
ave
per c
apita
sale
s at m
ore
than
twic
e th
e le
vels
foun
d in
the
RTA
; the
onl
y se
ctor
s lag
ging
the
RTA
in p
er c
apita
sale
s are
the
build
ing
mat
eria
ls g
roup
and
ge
nera
l mer
chan
dise
stor
es.
Whi
le th
e le
akag
e an
alys
is w
ill p
rese
nt a
mor
e re
fined
pic
ture
, the
pr
opor
tions
of p
er c
apita
sale
s by
cate
gory
are
a fi
rst i
ndic
ator
of s
treng
ths a
nd w
eakn
esse
s in
the
reta
il se
ctor
in L
os G
atos
.
17
Incl
udes
stor
es th
at se
ll a
broa
d ra
nge
of m
erch
andi
se.
Exam
ples
incl
ude
tradi
tiona
l dep
artm
ent s
tore
s suc
h as
Mac
y’s,
disc
ount
dep
artm
ent s
tore
s suc
h as
Wal
mar
t, an
d w
areh
ouse
stor
es su
ch a
s Cos
tco.
18
Thi
s cat
egor
y in
clud
es a
ll ty
pes o
f res
taur
ants
, as w
ell a
s cat
erin
g se
rvic
es.
19 A
s not
ed, t
hese
are
est
imat
ed sa
les f
rom
200
8; a
s will
be
seen
from
the
SBO
E da
ta, m
otor
veh
icle
sale
s ha
ve d
eclin
ed c
onsi
dera
bly
sinc
e th
en.

Ret
ail T
rade
Are
a Th
e R
TA’s
reta
il sa
les f
or 2
008
are
estim
ated
at a
ppro
xim
atel
y $8
.4 b
illio
n, a
bout
10
times
the
sale
s in
Los G
atos
alo
ne.
Whi
le so
mew
hat s
mal
ler p
ropo
rtion
ally
than
for t
he T
own,
mot
or
vehi
cle
and
parts
dea
lers
, foo
d an
d be
vera
ge st
ores
, and
food
serv
ices
and
drin
king
pla
ces a
re th
e th
ree
larg
est c
ateg
orie
s for
sale
s. W
hile
ther
e ar
e so
me
varia
tions
by
stor
e ca
tego
ry, t
he R
TA’s
le
vels
of p
er c
apita
sale
s are
muc
h cl
oser
to th
e co
unty
wid
e an
d st
atew
ide
leve
ls th
an th
e To
wn’
s.
Onc
e ag
ain,
the
leak
age
anal
ysis
will
pre
sent
a m
ore
refin
ed p
ictu
re, b
ut th
ese
leve
ls o
f per
cap
ita
sale
s rel
ativ
e to
the
larg
er a
reas
are
indi
cativ
e of
a g
ener
al b
alan
ce b
etw
een
the
reta
il su
pply
and
de
man
d fo
r the
RTA
as a
who
le.
N
orth
For
ty S
peci
fic P
lan
Mar
ket S
tudy
and
Bus
ines
s Dev
elop
men
t Stra
tegy
Pa
ge 4
7 of
150
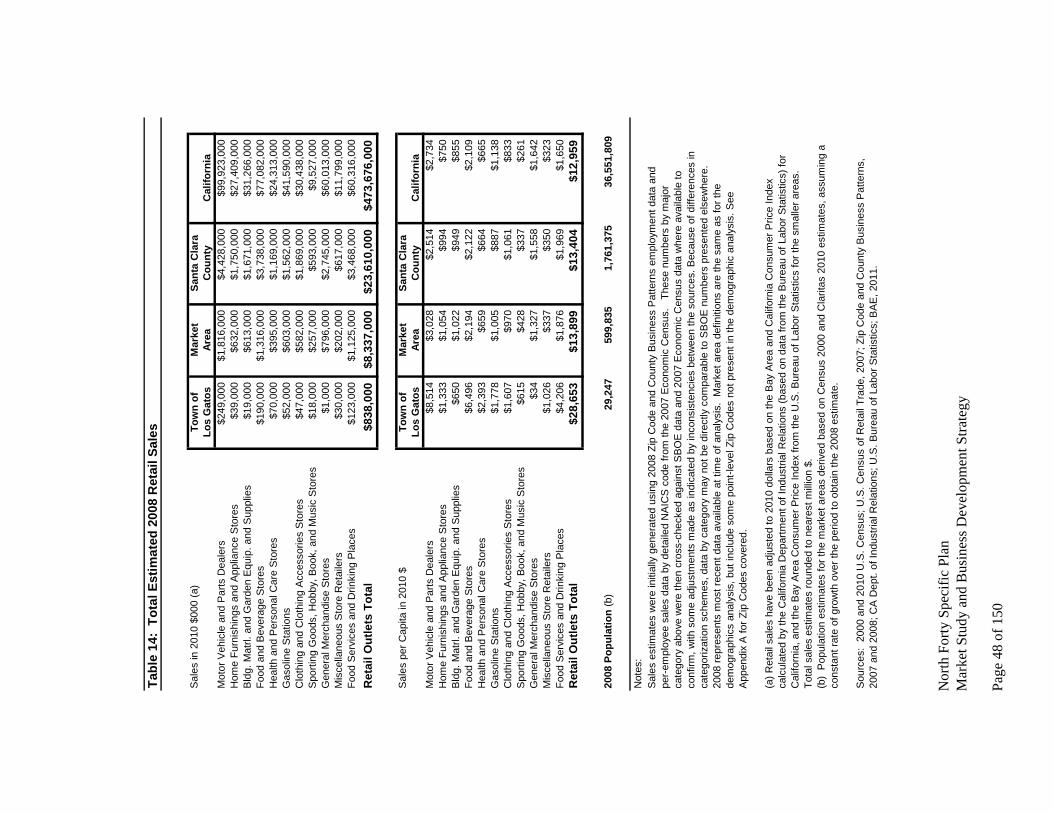
Tabl
e 14
: To
tal E
stim
ated
200
8 R
etai
l Sal
es
Sal
es in
201
0 $0
00 (a
)To
wn
ofM
arke
tSa
nta
Cla
raLo
s G
atos
Area
Cou
nty
Cal
iforn
iaM
otor
Veh
icle
and
Par
ts D
eale
rs$2
49,0
00$1
,816
,000
$4,4
28,0
00$9
9,92
3,00
0H
ome
Furn
ishi
ngs
and
App
lianc
e S
tore
s$3
9,00
0$6
32,0
00$1
,750
,000
$27,
409,
000
Bld
g. M
atrl.
and
Gar
den
Equ
ip. a
nd S
uppl
ies
$19,
000
$613
,000
$1,6
71,0
00$3
1,26
6,00
0Fo
od a
nd B
ever
age
Sto
res
$190
,000
$1,3
16,0
00$3
,738
,000
$77,
082,
000
Hea
lth a
nd P
erso
nal C
are
Sto
res
$70,
000
$395
,000
$1,1
69,0
00$2
4,31
3,00
0G
asol
ine
Sta
tions
$52,
000
$603
,000
$1,5
62,0
00$4
1,59
0,00
0C
loth
ing
and
Clo
thin
g A
cces
sorie
s S
tore
s$4
7,00
0$5
82,0
00$1
,869
,000
$30,
438,
000
Spo
rting
Goo
ds, H
obby
, Boo
k, a
nd M
usic
Sto
res
$18,
000
$257
,000
$593
,000
$9,5
27,0
00G
ener
al M
erch
andi
se S
tore
s$1
,000
$796
,000
$2,7
45,0
00$6
0,01
3,00
0M
isce
llane
ous
Sto
re R
etai
lers
$30,
000
$202
,000
$617
,000
$11,
799,
000
Food
Ser
vice
s an
d D
rinki
ng P
lace
s$1
23,0
00$1
,125
,000
$3,4
68,0
00$6
0,31
6,00
0R
etai
l Out
lets
Tot
al$8
38,0
00$8
,337
,000
$23,
610,
000
$473
,676
,000
Sal
es p
er C
apita
in 2
010
$ To
wn
ofM
arke
tSa
nta
Cla
raLo
s G
atos
Area
Cou
nty
Cal
iforn
iaM
otor
Veh
icle
and
Par
ts D
eale
rs$8
,514
$3,0
28$2
,514
$2,7
34H
ome
Furn
ishi
ngs
and
App
lianc
e S
tore
s$1
,333
$1,0
54$9
94$7
50B
ldg.
Mat
rl. a
nd G
arde
n E
quip
. and
Sup
plie
s$6
50$1
,022
$949
$855
Food
and
Bev
erag
e S
tore
s$6
,496
$2,1
94$2
,122
$2,1
09H
ealth
and
Per
sona
l Car
e S
tore
s$2
,393
$659
$664
$665
Gas
olin
e S
tatio
ns$1
,778
$1,0
05$8
87$1
,138
Clo
thin
g an
d C
loth
ing
Acc
esso
ries
Sto
res
$1,6
07$9
70$1
,061
$833
Spo
rting
Goo
ds, H
obby
, Boo
k, a
nd M
usic
Sto
res
$615
$428
$337
$261
Gen
eral
Mer
chan
dise
Sto
res
$34
$1,3
27$1
,558
$1,6
42M
isce
llane
ous
Sto
re R
etai
lers
$1,0
26$3
37$3
50$3
23Fo
od S
ervi
ces
and
Drin
king
Pla
ces
$4,2
06$1
,876
$1,9
69$1
,650
Ret
ail O
utle
ts T
otal
$28,
653
$13,
899
$13,
404
$12,
959
2008
Pop
ulat
ion
(b)
29,2
4759
9,83
51,
761,
375
36,5
51,8
09
Not
es:
Sal
es e
stim
ates
wer
e in
itial
ly g
ener
ated
usi
ng 2
008
Zip
Cod
e an
d C
ount
y B
usin
ess
Pat
tern
s em
ploy
men
t dat
a an
dpe
r-em
ploy
ee s
ales
dat
a by
det
aile
d N
AIC
S c
ode
from
the
2007
Eco
nom
ic C
ensu
s.
Thes
e nu
mbe
rs b
y m
ajor
cate
gory
abo
ve w
ere
then
cro
ss-c
heck
ed a
gain
st S
BO
E d
ata
and
2007
Eco
nom
ic C
ensu
s da
ta w
here
ava
ilabl
e to
conf
irm, w
ith s
ome
adju
stm
ents
mad
e as
indi
cate
d by
inco
nsis
tenc
ies
betw
een
the
sour
ces.
Bec
ause
of d
iffer
ence
s in
cate
goriz
atio
n sc
hem
es, d
ata
by c
ateg
ory
may
not
be
dire
ctly
com
para
ble
to S
BO
E n
umbe
rs p
rese
nted
els
ewhe
re.
2008
repr
esen
ts m
ost r
ecen
t dat
a av
aila
ble
at ti
me
of a
naly
sis.
Mar
ket a
rea
defin
ition
s ar
e th
e sa
me
as fo
r the
dem
ogra
phic
s an
alys
is, b
ut in
clud
e so
me
poin
t-lev
el Z
ip C
odes
not
pre
sent
in th
e de
mog
raph
ic a
naly
sis.
See
App
endi
x A
for Z
ip C
odes
cov
ered
.
(a) R
etai
l sal
es h
ave
been
adj
uste
d to
201
0 do
llars
bas
ed o
n th
e B
ay A
rea
and
Cal
iforn
ia C
onsu
mer
Pric
e In
dex
calc
ulat
ed b
y th
e C
alifo
rnia
Dep
artm
ent o
f Ind
ustri
al R
elat
ions
(bas
ed o
n da
ta fr
om th
e B
urea
u of
Lab
or S
tatis
tics)
for
Cal
iforn
ia, a
nd th
e B
ay A
rea
Con
sum
er P
rice
Inde
x fro
m th
e U
.S. B
urea
u of
Lab
or S
tatis
tics
for t
he s
mal
ler a
reas
. To
tal s
ales
est
imat
es ro
unde
d to
nea
rest
mill
ion
$.(b
) P
opul
atio
n es
timat
es fo
r the
mar
ket a
reas
der
ived
bas
ed o
n C
ensu
s 20
00 a
nd C
larit
as 2
010
estim
ates
, ass
umin
g a
cons
tant
rate
of g
row
th o
ver t
he p
erio
d to
obt
ain
the
2008
est
imat
e.
Sou
rces
: 20
00 a
nd 2
010
U.S
. Cen
sus;
U.S
. Cen
sus
of R
etai
l Tra
de, 2
007;
Zip
Cod
e an
d C
ount
y B
usin
ess
Pat
tern
s,20
07 a
nd 2
008;
CA
Dep
t. of
Indu
stria
l Rel
atio
ns; U
.S. B
urea
u of
Lab
or S
tatis
tics;
BA
E, 2
011.
Nor
th F
orty
Spe
cific
Pla
n M
arke
t Stu
dy a
nd B
usin
ess D
evel
opm
ent S
trate
gy
Page
48
of 1
50
Ret
ail S
ales
by
Maj
or R
etai
l Cat
egor
y in
Los
Gat
os, S
anta
Cla
ra
Cou
nty,
and
Cal
iforn
ia
The
follo
win
g se
ctio
n pr
esen
ts h
isto
ric d
ata
on re
tail
sale
s by
maj
or st
ore/
outle
t cat
egor
y, to
su
pple
men
t the
sing
le-y
ear e
stim
ate
prov
ided
in th
e pr
evio
us se
ctio
n. T
he fo
llow
ing
disc
ussi
on
relie
s on
taxa
ble
sale
s dat
a pu
blis
hed
by S
BO
E. U
nfor
tuna
tely
, SB
OE
taxa
ble
sale
s dat
a ar
e no
t av
aila
ble
for t
he R
etai
l Tra
de A
rea
as a
who
le; t
he d
iscu
ssio
n he
re fo
cuse
s on
Los G
atos
, with
co
mpa
rativ
e da
ta fr
om S
anta
Cla
ra C
ount
y an
d th
e C
alifo
rnia
pro
vide
d. A
ll da
ta a
re p
rese
nted
in
cons
tant
201
0 do
llars
, bas
ed o
n th
e B
ay A
rea
and
Cal
iforn
ia C
onsu
mer
Pric
e In
dexe
s. It
is
impo
rtant
to n
ote
that
the
disc
ussi
on h
ere
spec
ifica
lly c
over
s tax
able
sale
s, no
t tot
al sa
les.
For
in
stan
ce, f
ood
purc
hase
s, pr
escr
iptio
n dr
ugs,
and
serv
ices
(e.g
., au
to re
pair)
are
not
taxa
ble.
N
ever
thel
ess t
he ta
xabl
e sa
les d
ata
are
the
best
indi
cato
r ava
ilabl
e of
reta
il sa
les t
rend
s by
maj
or
stor
e ca
tego
ry o
ver a
per
iod
of y
ears
, eve
n th
ough
they
do
not p
rovi
de c
ompl
ete
cove
rage
of t
he
reta
il se
ctor
, and
thus
the
estim
ates
are
low
er th
an p
rovi
ded
by th
e Zi
p C
ode
data
dis
cuss
ed
abov
e. T
he le
akag
e an
alys
is fo
llow
ing
the
mar
ket o
verv
iew
is b
ased
on
the
stat
ic e
stim
ate
deriv
ed fr
om Z
ip C
ode
and
Cou
nty
Bus
ines
s Pat
tern
s and
the
Econ
omic
Cen
sus i
n or
der t
o co
ver
the
tota
l ret
ail s
ecto
r. B
ecau
se o
f the
recl
assi
ficat
ion
of b
usin
esse
s by
SBO
E be
ginn
ing
with
200
9, it
is n
ot p
ossi
ble
to
cons
iste
ntly
trac
k re
tail
sale
s by
maj
or st
ore
cate
gory
into
200
9 w
ith th
e pu
blis
hed
data
. Ev
en a
tim
e se
ries f
or o
vera
ll re
tail
sale
s is n
ot a
vaila
ble,
as s
ome
busi
ness
es w
ere
mov
ed o
ut o
f ret
ail
and
into
the
“all
othe
r out
lets
” ca
tego
ry.
This
is p
artic
ular
ly a
pro
blem
in L
os G
atos
, whe
re
Net
flix,
a m
ajor
sale
s tax
gen
erat
or, w
as m
oved
out
of t
he re
tail
grou
p –
thus
the
trend
line
for
tota
l ret
ail s
ales
show
s a si
gnifi
cant
dro
p fr
om 2
008
to 2
009,
but
this
is n
ot d
ue to
an
actu
al
decl
ine
in sa
les.
As a
resu
lt, re
tail
sale
s by
maj
or c
ateg
ory
are
disc
usse
d fo
r the
200
0 to
200
8 pe
riod,
and
then
sepa
rate
ly fo
r 200
9.
For L
os G
atos
, BA
E ob
tain
ed m
ore
rece
nt d
ata
for t
he 2
008
thro
ugh
2010
per
iod,
usi
ng th
e ol
der
clas
sific
atio
n sy
stem
. H
owev
er, t
hese
dat
a ar
e no
t dire
ctly
com
para
ble
to th
e 20
00 th
roug
h 20
08
data
due
to d
iffer
ing
data
repo
rting
met
hodo
logi
es, a
nd th
e sa
me
sour
ce d
ata
was
not
ava
ilabl
e fo
r Sa
nta
Cla
ra C
ount
y or
Cal
iforn
ia.
N
orth
For
ty S
peci
fic P
lan
Mar
ket S
tudy
and
Bus
ines
s Dev
elop
men
t Stra
tegy
Pa
ge 4
9 of
150

Los
Gat
os
Bet
wee
n 20
00 a
nd 2
008,
tota
l inf
latio
n-ad
just
ed ta
xabl
e re
tail
sale
s in
Los G
atos
dip
ped
in th
e ea
rly p
art o
f the
dec
ade
follo
win
g th
e do
t-com
bus
t, an
d th
en g
radu
ally
incr
ease
d to
pea
k at
ne
arly
$76
0 an
nual
ly in
200
6 (s
ee F
igur
e 7)
. B
y 20
08, t
otal
reta
il sa
les h
ad d
eclin
ed a
gain
to
$694
mill
ion
in 2
010
dolla
rs.
How
ever
, prio
r to
2009
, Net
flix
was
cla
ssifi
ed a
s a re
tail
outle
t (in
th
e “o
ther
reta
il st
ores
” ca
tego
ry),
skew
ing
sale
s upw
ard
as th
eir s
ales
boo
med
. Fi
gure
7 a
lso
show
s tot
al re
tail
sale
s exc
ludi
ng N
etfli
x an
d th
e en
tire
othe
r ret
ail s
ubca
tego
ry; t
his s
how
s the
re
mai
nder
of t
axab
le re
tail
sale
s pea
king
in 2
005,
with
a d
eclin
e in
eve
ry y
ear t
hrou
gh 2
008.
Th
ese
chan
ges i
n re
tail
sale
s occ
urre
d ag
ains
t a b
ackg
roun
d of
ver
y lim
ited
popu
latio
n gr
owth
in
the
Tow
n.
Figu
re 7
: Lo
s G
atos
Tax
able
Ret
ail S
ales
and
Pop
ulat
ion
Tren
ds, 2
000-
2008
Not
es: P
opul
atio
n da
ta d
eriv
ed fr
om 2
000
and
2010
Cen
sus,
with
ass
umpt
ion
of c
onst
ant a
nnua
l gro
wth
. Al
l sal
es s
how
n in
201
0 do
llars
. Fo
r det
ails
, see
App
endi
x C
.
Sour
ce:
BA
E 2
011,
bas
ed o
n so
urce
s as
not
ed in
App
endi
x C
.
‐10,000
20,000
30,000
40,000
50,000
60,000
70,000
80,000
$0
$100
,000
$200
,000
$300
,000
$400
,000
$500
,000
$600
,000
$700
,000
$800
,000
2000
2001
2002
2003
2004
2005
2006
2007
2008
Population
Taxable Sales in $000
Total Retail Sales
Exclud
ing Other Retail Stores
Popu
latio
n
SB
OE-
publ
ishe
d sa
les d
ata
from
200
9 ar
e no
t com
para
ble
to e
arlie
r yea
rs, d
ue to
SB
OE’
s re
clas
sific
atio
n of
all
outle
ts.
How
ever
, ann
ual s
ales
for t
he 2
008
thro
ugh
2010
per
iod
are
show
n in
the
data
obt
aine
d fo
r the
City
onl
y. A
s sho
wn
in F
igur
e 8,
taxa
ble
reta
il sa
les c
ontin
ued
thei
r de
clin
e in
to 2
009,
but
stab
ilize
d an
d re
boun
ded
slig
htly
in 2
010.
In
2010
, tot
al ta
xabl
e re
tail
sale
s w
ere
estim
ated
at s
light
ly m
ore
than
$40
0 m
illio
n.20
Nor
th F
orty
Spe
cific
Pla
n M
arke
t Stu
dy a
nd B
usin
ess D
evel
opm
ent S
trate
gy
Page
50
of 1
50
20 N
ote
that
this
tota
l exc
lude
s Net
flix.
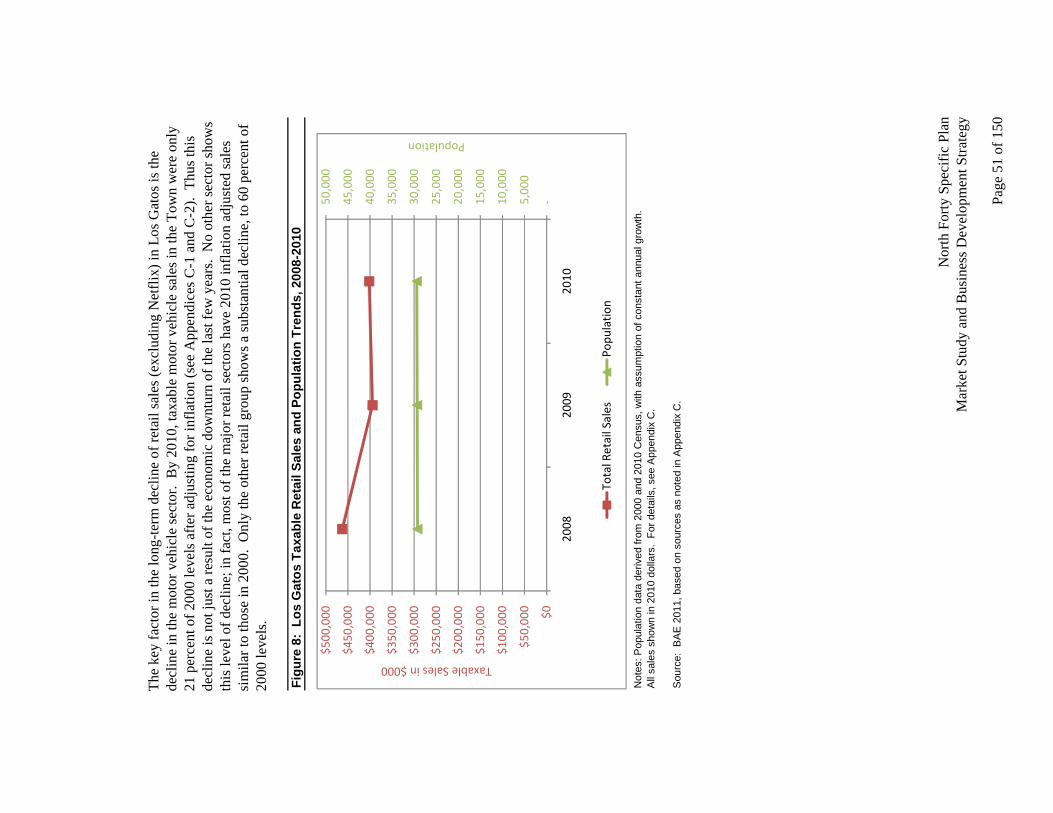
The
key
fact
or in
the
long
-term
dec
line
of re
tail
sale
s (ex
clud
ing
Net
flix)
in L
os G
atos
is th
e de
clin
e in
the
mot
or v
ehic
le se
ctor
. B
y 20
10, t
axab
le m
otor
veh
icle
sale
s in
the
Tow
n w
ere
only
21
per
cent
of 2
000
leve
ls a
fter a
djus
ting
for i
nfla
tion
(see
App
endi
ces C
-1 a
nd C
-2).
Thu
s thi
s de
clin
e is
not
just
a re
sult
of th
e ec
onom
ic d
ownt
urn
of th
e la
st fe
w y
ears
. N
o ot
her s
ecto
r sho
ws
this
leve
l of d
eclin
e; in
fact
, mos
t of t
he m
ajor
reta
il se
ctor
s hav
e 20
10 in
flatio
n ad
just
ed sa
les
sim
ilar t
o th
ose
in 2
000.
Onl
y th
e ot
her r
etai
l gro
up sh
ows a
subs
tant
ial d
eclin
e, to
60
perc
ent o
f 20
00 le
vels
.
Figu
re 8
: Lo
s G
atos
Tax
able
Ret
ail S
ales
and
Pop
ulat
ion
Tren
ds, 2
008-
2010
Not
es: P
opul
atio
n da
ta d
eriv
ed fr
om 2
000
and
2010
Cen
sus,
with
ass
umpt
ion
of c
onst
ant a
nnua
l gro
wth
. A
ll sa
les
show
n in
201
0 do
llars
. Fo
r det
ails
, see
App
endi
x C
.
Sou
rce:
BA
E 2
011,
bas
ed o
n so
urce
s as
not
ed in
App
endi
x C
.
‐5,000
10,000
15,000
20,000
25,000
30,000
35,000
40,000
45,000
50,000
$0
$50,00
0
$100
,000
$150
,000
$200
,000
$250
,000
$300
,000
$350
,000
$400
,000
$450
,000
$500
,000
2008
2009
2010
Population
Taxable Sales in $000
Total Retail Sales
Popu
latio
n
N
orth
For
ty S
peci
fic P
lan
Mar
ket S
tudy
and
Bus
ines
s Dev
elop
men
t Stra
tegy
Pa
ge 5
1 of
150

Sant
a C
lara
Cou
nty
The
Cou
nty
also
show
s a p
atte
rn o
f tax
able
reta
il sa
les d
eclin
e ea
rly in
the
deca
de, f
ollo
wed
by
a m
id-d
ecad
e in
crea
se, a
nd a
noth
er d
eclin
e la
te in
the
deca
de.
On
an in
flatio
n-ad
just
ed b
asis
, sal
es
neve
r aga
in a
chie
ve th
e 20
00 le
vels
of n
early
$25
bill
ion
in a
nnua
l tax
able
reta
il sa
les;
in 2
008
taxa
ble
reta
il sa
les w
ere
belo
w $
20 b
illio
n in
the
Cou
nty
(see
Fig
ure
9).
In 2
009,
this
fell
furth
er
to u
nder
$17
bill
ion.
21
Figu
re 9
: Sa
nta
Cla
ra C
ount
y Ta
xabl
e R
etai
l Sal
es a
nd P
opul
atio
n Tr
ends
, 200
0-20
08
Not
es: P
opul
atio
n da
ta d
eriv
ed fr
om 2
000
and
2010
Cen
sus,
with
ass
umpt
ion
of c
onst
ant a
nnua
l gro
wth
. Al
l sal
es s
how
n in
201
0 do
llars
. Fo
r det
ails
, see
App
endi
x C
.
Sour
ce:
BA
E 2
011,
bas
ed o
n so
urce
s as
not
ed in
App
endi
x C
.
‐500,000
1,000,000
1,500,000
2,000,000
2,500,000
3,000,000
$0
$5,000,000
$10,00
0,000
$15,00
0,000
$20,00
0,000
$25,00
0,000
$30,00
0,000
2000
2001
2002
2003
2004
2005
2006
2007
2008
Population
Taxable Sales in $000
Total Retail Sales
Popu
latio
n
Nor
th F
orty
Spe
cific
Pla
n M
arke
t Stu
dy a
nd B
usin
ess D
evel
opm
ent S
trate
gy
Page
52
of 1
50
21 B
ecau
se o
f the
recl
assi
ficat
ion
of b
usin
esse
s in
2009
, it i
s pos
sibl
e th
at so
me
of th
e ch
ange
bet
wee
n 20
08
and
2009
is d
ue to
bus
ines
ses f
orm
erly
cla
ssifi
ed a
s ret
ail n
ow b
eing
exc
lude
d fr
om th
at g
roup
(e.g
., N
etfli
x in
Los
Gat
os).

Cal
iforn
ia
As s
how
n in
Fig
ure
10, t
axab
le re
tail
sale
s lev
els f
or C
alifo
rnia
wer
e re
lativ
ely
flat f
rom
200
0 th
roug
h 20
02, r
efle
ctin
g th
e do
t-com
bus
t and
pos
t 9/1
1 de
clin
e, e
ffec
ts o
f whi
ch w
ere
not a
s gr
eatly
felt
stat
ewid
e as
in S
anta
Cla
ra C
ount
y. S
tate
wid
e sa
les t
hen
incr
ease
d th
roug
h 20
05,
with
dec
lines
sinc
e th
at y
ear.
Infla
tion-
adju
sted
est
imat
ed sa
les o
f $36
1 bi
llion
for 2
008
are
belo
w 2
000
leve
ls (a
lso
infla
tion-
adju
sted
), ev
en th
ough
the
popu
latio
n of
the
stat
e in
crea
sed
by
eigh
t per
cent
in th
e sa
me
perio
d. I
n 20
09, t
otal
infla
tion-
adju
sted
taxa
ble
reta
il sa
les f
or th
e st
ate
wer
e re
porte
d at
$31
5 bi
llion
, ind
icat
ing
a fu
rther
dec
line.
22
Figu
re 1
0: C
alifo
rnia
Tax
able
Ret
ail S
ales
and
Pop
ulat
ion
Tren
ds, 2
000-
2008
Not
es: P
opul
atio
n da
ta d
eriv
ed fr
om 2
000
and
2010
Cen
sus,
with
ass
umpt
ion
of c
onst
ant a
nnua
l gro
wth
. Al
l sal
es s
how
n in
201
0 do
llars
. Fo
r det
ails
, see
App
endi
x C
.
Sour
ce:
BA
E 2
011,
bas
ed o
n so
urce
s as
not
ed in
App
endi
x C
.
‐5,000,000
10,000,000
15,000,000
20,000,000
25,000,000
30,000,000
35,000,000
40,000,000
45,000,000
50,000,000
$0
$50,00
0,000
$100,000,000
$150,000,000
$200,000,000
$250,000,000
$300,000,000
$350,000,000
$400,000,000
$450,000,000
$500,000,000
2000
2001
2002
2003
2004
2005
2006
2007
2008
Population
Taxable Sales in $000
Total Retail Sales
Popu
latio
n
N
orth
For
ty S
peci
fic P
lan
Mar
ket S
tudy
and
Bus
ines
s Dev
elop
men
t Stra
tegy
22 A
s with
the
Cou
nty,
the
recl
assi
ficat
ion
of b
usin
esse
s in
2009
mak
es it
pos
sibl
e th
at so
me
of th
e ch
ange
be
twee
n 20
08 a
nd 2
009
is d
ue to
bus
ines
ses f
orm
erly
cla
ssifi
ed a
s ret
ail n
ow b
eing
exc
lude
d fr
om th
at g
roup
.
Pa
ge 5
3 of
150

Los
Gat
os T
axab
le R
etai
l Sal
es b
y D
istr
ict
The
follo
win
g an
alys
is is
bas
ed o
n in
form
atio
n pr
ovid
ed b
y th
e To
wn,
bro
ken
out b
y th
ree
sepa
rate
suba
reas
: Dow
ntow
n, in
clud
ing
the
Dow
ntow
n C
ore,
Dow
ntow
n N
orth
, and
Blo
ssom
H
ill/U
nive
rsity
; Los
Gat
os B
oule
vard
; and
the
neig
hbor
hood
serv
ing
cent
ers,
incl
udin
g R
inco
nada
Cen
ter,
Vas
ona
Stat
ion,
Wal
gree
ns S
quar
e, a
nd D
owni
ng C
ente
r. Fi
gure
11
prov
ides
an
over
view
of r
ecen
t tax
able
reta
il sa
les b
y su
bare
a, a
s wel
l as a
n in
dica
tion
of th
e le
vels
of s
ales
tax
gene
ratio
n by
eac
h su
bare
a re
lativ
e to
eac
h ot
her a
nd th
e To
wn.
D
ownt
own
is th
e la
rges
t of t
he th
ree
suba
reas
in te
rms o
f tax
able
sale
s, w
ith L
os G
atos
Bou
leva
rd
slig
htly
low
er a
nd th
e ne
ighb
orho
od c
ente
rs c
ontri
butin
g a
far s
mal
ler s
hare
of t
he T
own’
s ove
rall
taxa
ble
reta
il sa
les.
23
Nor
th F
orty
Spe
cific
Pla
n M
arke
t Stu
dy a
nd B
usin
ess D
evel
opm
ent S
trate
gy
Page
54
of 1
50
23 T
he d
iscu
ssio
n he
re is
with
resp
ect t
o ta
xabl
e re
tail
sale
s, no
t tot
al re
tail
sale
s. T
he th
ree
stor
e ty
pes w
here
th
is is
sign
ifica
nt fa
ctor
are
aut
o de
aler
s (w
hich
ofte
n pr
ovid
e no
n-ta
xabl
e se
rvic
es),
food
stor
es, a
nd d
rug
stor
es.
Not
e th
at N
etfli
x sa
les h
ave
been
exc
lude
d fr
om a
ll ye
ars.

Dow
ntow
n In
201
0, D
ownt
own
Los G
atos
gen
erat
ed a
ppro
xim
atel
y $2
09 m
illio
n in
taxa
ble
reta
il sa
les,
or
over
50
perc
ent o
f the
Tow
n’s t
otal
, ind
icat
ing
its si
gnifi
canc
e as
a sh
oppi
ng d
estin
atio
n an
d as
a
tax
gene
rato
r for
the
Tow
n (s
ee T
able
15)
. O
n an
infla
tion-
adju
sted
bas
is, t
his s
ales
leve
l has
de
clin
ed fr
om $
225
mill
ion
in 2
008,
but
has
rebo
unde
d fr
om $
198
mill
ion
in 2
009.
Thi
s upt
ick
is
due
in p
art t
o in
crea
sing
sale
s at t
he A
pple
Sto
re, w
hich
is o
ne o
f the
top
25 la
rges
t sal
es ta
x ge
nera
tors
in th
e To
wn.
W
hile
dis
clos
ure
rule
s for
SB
OE
data
lim
it th
e de
tail
that
can
be
prov
ided
, the
Tab
le a
lso
show
s so
me
sale
s by
cate
gory
. O
f the
dis
clos
ed c
ateg
orie
s, Ea
ting
and
Drin
king
Pla
ces s
how
ann
ual
taxa
ble
sale
s in
the
rang
e of
app
roxi
mat
ely
$64
mill
ion
to $
67 m
illio
n, a
nd A
ppar
el S
tore
s hav
e sa
les a
t app
roxi
mat
ely
$25
to $
27 m
illio
n an
nual
ly.
Bot
h of
thes
e ca
tego
ries h
ad y
ear-
over
-yea
r sa
les d
eclin
es b
etw
een
2008
and
200
9, b
ut in
crea
ses b
etw
een
2009
and
201
0. A
ppar
el sa
les i
n 20
10 w
ere
abov
e 20
08 le
vels
on
an in
flatio
n-ad
just
ed b
asis
. M
ost o
f the
rem
aini
ng ta
xabl
e sa
les
are
lum
ped
toge
ther
in th
e O
ther
Ret
ail S
tore
s cat
egor
y, w
hich
bec
ause
of t
he d
iscl
osur
e is
sues
al
so in
clud
es a
utom
otiv
e, h
ome
furn
ishi
ngs/
appl
ianc
es, s
ervi
ce st
atio
ns, a
nd g
ener
al m
erch
andi
se
stor
es.24
Thi
s lar
ge g
roup
ing
of st
ores
show
s dec
linin
g ta
xabl
e sa
les i
n 20
09, w
ith li
mite
d re
cove
ry in
201
0 to
$10
6 m
illio
n.
With
in th
e ov
eral
l Dow
ntow
n ar
ea, t
he C
ore
is re
spon
sibl
e fo
r 80
perc
ent o
f tot
al ta
xabl
e sa
les
(als
o sh
own
in T
able
15)
. D
ownt
own
Nor
th m
akes
up
16 p
erce
nt o
f the
Dow
ntow
n to
tal,
with
the
rem
aind
er c
omin
g fr
om th
e B
loss
om H
ill/U
nive
rsity
are
a. T
hese
per
cent
ages
var
y lit
tle o
ver t
he
thre
e-ye
ar p
erio
d.
N
orth
For
ty S
peci
fic P
lan
Mar
ket S
tudy
and
Bus
ines
s Dev
elop
men
t Stra
tegy
24 U
nder
this
cla
ssifi
catio
n sy
stem
ther
e ar
e tw
o ge
nera
l mer
chan
dise
stor
es, t
he tw
o ph
arm
acie
s. In
som
e ot
her t
able
s in
the
anal
ysis
her
e fo
r rec
ent d
ata,
they
hav
e be
en p
lace
d in
the
heal
th a
nd p
erso
nal c
are
stor
es
cate
gory
per
NA
ICS.
Pa
ge 5
5 of
150

Tabl
e 15
: D
ownt
own
Taxa
ble
Ret
ail S
ales
Tre
nds,
200
8-20
10
Sal
es in
201
0 $0
00 (a
) (b)
(c)
2008
2009
2010
Aut
o D
eale
rs &
Aut
o S
uppl
ies
##
# H
ome
Furn
ishi
ngs
and
App
lianc
es#
##
Bld
g. M
atrl.
and
Far
m Im
plem
ents
$5,5
28$4
,399
$5,6
54 F
ood
Sto
res
$4,7
10$4
,323
$4,4
57 S
ervi
ce S
tatio
ns#
##
App
arel
Sto
res
$26,
413
$24,
805
$26,
574
Gen
eral
Mer
chan
dise
Sto
res
##
# E
atin
g an
d D
rinki
ng P
lace
s$6
7,83
2$6
3,87
9$6
5,61
4 O
ther
Ret
ail S
tore
s (c
)$1
20,6
33$1
00,2
44$1
06,3
71R
etai
l Sto
res
Tota
l$2
25,1
15$1
97,6
50$2
08,6
71
Dow
ntow
n C
ore
$180
,586
$160
,168
$166
,913
Dow
ntow
n N
orth
$34,
448
$29,
771
$32,
508
Blo
ssom
Hill
/Uni
vers
ity$1
0,08
0$7
,710
$9,2
50
(a)
Ret
ail s
ales
hav
e be
en a
djus
ted
to 2
010
dolla
rs b
ased
on
the
Bay
Are
a C
onsu
mer
Pric
e In
dex,
U.S
.B
urea
u of
Lab
or S
tatis
tics.
C
ateg
orie
s us
ed h
ere
are
base
d on
the
2007
and
ear
lier S
BO
E c
lass
ifica
tion
syst
em, d
ue to
the
sour
ce u
sed.
(b)
Ana
lysi
s ex
clud
es a
ll no
n-re
tail
outle
ts (b
usin
ess
and
pers
onal
ser
vice
s) re
porti
ng ta
xabl
e sa
les.
(c)
A "#
" sig
n in
dica
tes
data
una
vaila
bilit
y fo
r the
cat
egor
y du
e to
SB
OE
con
fiden
tialit
y ru
les
that
sup
pres
sda
ta w
hen
ther
e ar
e fo
ur o
r few
er o
utle
ts o
r sal
es in
a c
ateg
ory
dom
inat
ed b
y on
e st
ore.
Sup
pres
sed
sale
sha
ve b
een
com
bine
d w
ith O
ther
Ret
ail S
tore
s.
Sour
ces:
SBO
E; U
.S. B
urea
u of
Lab
or S
tatis
tics;
Mun
i Ser
vice
s; T
own
of L
os G
atos
; BAE
, 201
1.
Fo
rmul
a re
tail,
whi
le re
stric
ted
in th
e D
ownt
own
Cor
e, n
ever
thel
ess a
ccou
nts f
or a
sign
ifica
nt
prop
ortio
n of
taxa
ble
reta
il sa
les.
In 2
010,
stor
es d
esig
nate
d as
form
ula
reta
il in
the
Dow
ntow
n C
ore
prov
ided
ove
r 30
perc
ent o
f all
taxa
ble
reta
il sa
les i
n th
e ar
ea, w
hile
mak
ing
up o
nly
11
perc
ent o
f the
reta
il ou
tlets
(exc
ludi
ng fo
od-r
elat
ed re
tail
and
serv
ice
stat
ions
). A
ppen
dix
J pr
ovid
es a
map
show
ing
the
loca
tion
of fo
rmul
a re
taile
rs in
the
Dow
ntow
n C
ore.
O
ver h
alf o
f the
Dow
ntow
n C
ore’
s tax
able
sale
s in
appa
rel s
tore
s are
in fo
rmul
a re
tail
stor
es, a
nd
a m
uch
high
er p
ropo
rtion
of t
axab
le sa
les i
n ho
me
furn
ishi
ngs a
nd a
pplia
nces
are
in fo
rmul
a re
tail
stor
es.
The
only
dru
g st
ore
dow
ntow
n is
Pha
rmac
a, a
form
ula
reta
iler.
The
rece
ntly
clo
sed
Bor
der’
s, a
form
ula
stor
e, w
as th
e on
ly b
ooks
tore
. Ex
clud
ing
rest
aura
nts a
nd fo
od st
ores
(nei
ther
of
whi
ch a
re su
bjec
t to
the
form
ula
reta
il or
dina
nce)
, for
mul
a re
taile
rs a
ccou
nt fo
r ove
r hal
f of t
he
taxa
ble
reta
il sa
les i
n th
e D
ownt
own
Cor
e.
Long
-term
tren
ds in
ove
rall
taxa
ble
sale
s in
the
Dow
ntow
n C
ore
from
200
0 th
roug
h 20
10 a
re
pres
ente
d in
Tab
le 1
6.25
Thi
s per
iod
cove
rs tw
o m
ajor
rece
ssio
ns a
nd th
e op
enin
g in
200
3 of
Sa
ntan
a R
ow, a
maj
or p
erce
ived
com
petit
or fo
r Dow
ntow
n Lo
s Gat
os.
As s
how
n, in
infla
tion-
Nor
th F
orty
Spe
cific
Pla
n M
arke
t Stu
dy a
nd B
usin
ess D
evel
opm
ent S
trate
gy
Page
56
of 1
50
25 A
dditi
onal
det
ail b
y ca
tego
ry is
una
vaila
ble
due
to S
BO
E di
sclo
sure
rule
s.

adju
sted
dol
lars
, sal
es w
ere
subs
tant
ially
hig
her i
n 20
00 th
an in
201
0. S
ales
dec
lined
from
200
0 th
roug
h 20
03, b
ut re
boun
ded
in 2
004
even
with
San
tana
Row
ope
ning
in 2
003.
Sal
es in
crea
sed
agai
n in
200
5, d
eclin
ed in
200
6, in
crea
sed
to a
pos
t-201
0 pe
ak in
200
7, a
nd th
en d
eclin
ed a
s the
re
cess
ion
took
hol
d, re
achi
ng th
e lo
w p
oint
of t
he d
ecad
e in
200
9. A
mod
est i
ncre
ase
was
seen
in
2010
. It
appe
ars t
hat g
ener
al m
acro
econ
omic
regi
onal
tren
ds w
ere
a gr
eate
r fac
tor i
nflu
enci
ng
sale
s lev
els i
n th
e C
ore
than
the
addi
tiona
l com
petit
ion
prov
ided
by
Sant
ana
Row
. M
uch
of th
is d
eclin
e, h
owev
er, w
as n
ot in
the
maj
or re
tail
cate
gorie
s for
the
Cor
e, b
ut in
stea
d in
au
to-r
elat
ed re
tail
(dea
lers
and
serv
ice
stat
ions
) and
non
-ret
ail o
utle
ts (p
erso
nal a
nd b
usin
ess
serv
ices
). T
he k
ey re
tail
sect
ors c
ombi
ned
show
ed sm
alle
r dec
lines
ove
r the
dec
ade,
and
eat
ing
and
drin
king
pla
ces s
how
ed m
uch
less
var
iatio
n ov
er th
e te
n ye
ars.
Ta
ble
16:
Dow
ntow
n C
ore
Taxa
ble
Ret
ail S
ales
Tre
nds
Sales
in 20
10 $0
00 (a
)20
0020
0120
0220
0320
0420
0520
0620
0720
0820
0920
10Re
tail S
tore
s Tot
al$2
26,50
9$1
91,59
6$1
69,50
9$1
64,74
9$1
79,01
6$2
02,58
4$1
91,59
0$2
07,46
5$1
80,58
6$1
60,16
8$1
66,91
3
All O
ther O
utlets
$23,0
38$2
0,582
$12,5
79$1
0,526
$10,3
64$9
,398
$11,7
66$1
2,011
$10,0
01$9
,385
$8,22
0
Tota
l All O
utlet
s$2
49,54
7$2
12,17
9$1
82,08
8$1
75,27
5$1
89,38
0$2
11,98
2$2
03,35
6$2
19,47
5$1
90,58
7$1
69,55
4$1
75,13
4
Key R
etail S
ector
s (b)
$119
,352
$106
,677
$91,4
09$8
3,804
$91,1
38$9
2,523
$89,5
97$9
5,287
$95,2
31$8
4,540
$97,8
07Ea
ting &
Drin
king P
laces
$62,4
07$5
7,763
$55,5
96$5
7,526
$57,7
12$6
2,057
$61,1
72$6
6,876
$62,0
53$5
8,503
$59,1
08Ot
her O
utlets
, Com
bined
(c)
$33,1
05$2
8,353
$19,4
13$1
7,746
$17,9
41$1
7,480
$18,8
84$1
6,275
$13,9
35$1
2,611
$11,9
77
(a)
Retai
l sale
s hav
e bee
n adju
sted t
o 201
0 doll
ars b
ased
on th
e Bay
Are
a Con
sume
r Pric
e Ind
ex, fr
om th
e U.S
. Bur
eau o
f Lab
or S
tatist
ics.
(b)
Includ
es al
l retai
l sec
tors e
xcep
t auto
deale
rs &
supp
lies,
servi
ce st
ation
s, an
d eati
ng an
d drin
king p
laces
.(c)
Inclu
des a
uto de
alers
& su
pplie
s, se
rvice
s stat
ions,
and n
on-re
tail (a
ll othe
r outl
ets).
Sour
ces:
2000
and 2
010 U
.S. C
ensu
s; St
ate B
oard
of E
quali
zatio
n; CA
Dep
t. of In
dustr
ial R
elatio
ns; U
.S. B
urea
u of L
abor
Stat
istics
; BAE
, 201
1.
In
sum
mar
y, D
ownt
own’
s tax
able
reta
il sa
les d
eclin
ed a
s the
rece
ssio
n to
ok h
old
in 2
009,
but
ha
ve re
cove
red
som
ewha
t in
2010
, alb
eit n
ot to
the
leve
ls o
f 200
8. T
he C
ore
cons
titut
es th
e la
rge
maj
ority
of s
ales
in th
e ov
eral
l Dow
ntow
n ar
ea.
Whi
le fo
rmul
a re
tail
outle
ts m
ake
up o
nly
a sm
all p
ropo
rtion
of a
ll st
ores
in th
e D
ownt
own
Cor
e, th
ey g
ener
ate
near
ly o
ne-th
ird o
f the
Cor
e’s
taxa
ble
reta
il sa
les,
and
are
dom
inan
t sal
es in
app
arel
stor
es, h
ome
furn
ishi
ngs a
nd a
pplia
nce
stor
es, a
nd g
ener
al m
erch
andi
se/d
rug
stor
es.
Excl
udin
g re
stau
rant
s and
food
stor
es (w
hich
are
no
t sub
ject
to th
e fo
rmul
a re
tail
ordi
nanc
e), f
orm
ula
reta
ilers
acc
ount
for o
ver h
alf o
f the
taxa
ble
sale
s in
the
Dow
ntow
n C
ore.
Lo
s G
atos
Bou
leva
rd
As s
how
n in
Tab
le 1
7, th
e Lo
s Gat
os B
oule
vard
com
mer
cial
dis
trict
had
taxa
ble
reta
il sa
les o
f ap
prox
imat
ely
$152
mill
ion
in 2
010.
Thi
s is a
stee
p de
clin
e fr
om $
191
mill
ion
in 2
008
(infla
tion
adju
sted
), an
d re
sults
larg
ely
from
dec
lines
in th
e au
tom
otiv
e se
ctor
, due
to th
e cl
osur
e of
two
N
orth
For
ty S
peci
fic P
lan
Mar
ket S
tudy
and
Bus
ines
s Dev
elop
men
t Stra
tegy
Pa
ge 5
7 of
150

maj
or d
eale
rshi
ps.
Taxa
ble
sale
s in
the
auto
mot
ive
sect
or o
n Lo
s Gat
os B
oule
vard
dec
lined
from
$8
0 m
illio
n in
200
8 to
$57
mill
ion
in 2
010.
D
ue to
SB
OE
data
rule
s, th
e on
ly o
ther
sect
ors p
rese
nted
sepa
rate
ly a
re fo
od st
ores
and
eat
ing
and
drin
king
pla
ces.
Foo
d st
ore
sale
s hav
e be
en re
lativ
ely
cons
tant
at s
light
ly b
elow
$22
mill
ion
annu
ally
, as c
onsu
mer
s con
tinue
to p
urch
ase
groc
erie
s eve
n as
they
forg
o la
rger
pur
chas
es su
ch
as c
ars.
Mos
t of t
hese
sale
s occ
ur a
t the
four
supe
rmar
kets
, with
lim
ited
sale
s at s
catte
red
smal
ler
outle
ts.
It sh
ould
be
note
d th
at a
s a “
rule
of t
hum
b,”
only
abo
ut o
ne-th
ird o
f foo
d st
ore
sale
s are
ta
xabl
e; if
non
-taxa
ble
sale
s are
con
side
red,
the
food
stor
es g
ener
ate
a m
uch
larg
er sh
are
of re
tail
sale
s on
Los G
atos
Bou
leva
rd.
Eatin
g an
d dr
inki
ng p
lace
s hav
e se
en a
ver
y sl
ight
dec
line
over
th
e 20
08 to
201
0 pe
riod,
to a
ppro
xim
atel
y $1
4 m
illio
n an
nual
ly in
201
0. O
ther
reta
il ou
tlets
co
mbi
ned
have
als
o se
en a
dec
line
in ta
xabl
e sa
les,
from
$73
mill
ion
in 2
008
to $
59 m
illio
n in
20
10.
Tabl
e 17
: Lo
s G
atos
Bou
leva
rd T
axab
le R
etai
l Sal
es T
rend
s, 2
008-
2010
Sal
es in
201
0 $0
00 (a
) (b)
(c)
2008
2009
2010
Aut
o D
eale
rs &
Aut
o S
uppl
ies
$80,
449
$57,
481
$56,
771
Hom
e Fu
rnis
hing
s an
d A
pplia
nces
##
# B
ldg.
Mat
rl. a
nd F
arm
Impl
emen
ts#
##
Foo
d S
tore
s$2
1,55
7$2
1,53
6$2
1,79
2 S
ervi
ce S
tatio
ns#
##
App
arel
Sto
res
##
# G
ener
al M
erch
andi
se S
tore
s#
##
Eat
ing
and
Drin
king
Pla
ces
$15,
528
$15,
276
$14,
498
Oth
er R
etai
l Sto
res
(c)
$73,
102
$59,
962
$59,
018
Ret
ail S
tore
s To
tal
$190
,636
$154
,255
$152
,078
(a)
Ret
ail s
ales
hav
e be
en a
djus
ted
to 2
010
dolla
rs b
ased
on
the
Bay
Are
a C
onsu
mer
Pric
e In
dex,
U.S
.B
urea
u of
Lab
or S
tatis
tics.
C
ateg
orie
s us
ed h
ere
are
base
d on
the
2007
and
ear
lier S
BO
E c
lass
ifica
tion
syst
em, d
ue to
the
sour
ce u
sed.
(b)
Ana
lysi
s ex
clud
es a
ll no
n-re
tail
outle
ts (b
usin
ess
and
pers
onal
ser
vice
s) re
porti
ng ta
xabl
e sa
les.
(c)
A "#
" sig
n in
dica
tes
data
una
vaila
bilit
y fo
r the
cat
egor
y du
e to
SB
OE
con
fiden
tialit
y ru
les
that
sup
pres
sda
ta w
hen
ther
e ar
e fo
ur o
r few
er o
utle
ts o
r sal
es in
a c
ateg
ory
dom
inat
ed b
y on
e st
ore.
Sup
pres
sed
sale
sha
ve b
een
com
bine
d w
ith O
ther
Ret
ail S
tore
s.
Sour
ces:
SBO
E; U
.S. B
urea
u of
Lab
or S
tatis
tics;
Mun
i Ser
vice
s; T
own
of L
os G
atos
; BAE
, 201
1.
N
orth
For
ty S
peci
fic P
lan
Mar
ket S
tudy
and
Bus
ines
s Dev
elop
men
t Stra
tegy
Pa
ge 5
8 of
150

Nei
ghbo
rhoo
d C
ente
rs
The
neig
hbor
hood
cen
ters
(Dow
ning
Cen
ter,
Rin
cona
da C
ente
r, V
ason
a St
atio
n, a
nd W
algr
eens
Sq
uare
) pro
vide
a m
uch
smal
ler s
hare
of t
he T
own’
s sal
es ta
x th
an D
ownt
own
or L
os G
atos
B
oule
vard
. Th
ese
cent
ers c
ombi
ned
acco
unte
d fo
r app
roxi
mat
ely
$34
mill
ion
in ta
xabl
e re
tail
sale
s in
2010
(see
Tab
le 1
8).
With
the
exce
ptio
n of
Vas
ona
Stat
ion,
thes
e ce
nter
s are
dom
inat
ed
by su
perm
arke
ts o
r cha
in p
harm
acie
s and
thus
dis
clos
ure
rule
s pro
hibi
t sho
win
g in
form
atio
n on
in
divi
dual
cen
ters
or b
y ty
pe o
f ret
ail.
Ta
ble
18:
Nei
ghbo
rhoo
d C
ente
rs T
axab
le R
etai
l Sal
es T
rend
s, 2
008-
2010
Sal
es in
201
0 $0
00 (a
) (b)
(c)
2008
2009
2010
Ret
ail S
tore
s To
tal
$38,
604
$36,
769
$33,
741
(a)
Ret
ail s
ales
hav
e be
en a
djus
ted
to 2
010
dolla
rs b
ased
on
the
Bay
Are
a C
onsu
mer
Pric
e In
dex,
U.S
.B
urea
u of
Lab
or S
tatis
tics.
C
ateg
orie
s us
ed h
ere
are
base
d on
the
2007
and
ear
lier S
BO
E c
lass
ifica
tion
syst
em, d
ue to
the
sour
ce u
sed.
(b)
Ana
lysi
s ex
clud
es a
ll no
n-re
tail
outle
ts (b
usin
ess
and
pers
onal
ser
vice
s) re
porti
ng ta
xabl
e sa
les.
(c)
A "#
" sig
n in
dica
tes
data
una
vaila
bilit
y fo
r the
cat
egor
y du
e to
SB
OE
con
fiden
tialit
y ru
les
that
sup
pres
sda
ta w
hen
ther
e ar
e fo
ur o
r few
er o
utle
ts o
r sal
es in
a c
ateg
ory
dom
inat
ed b
y on
e st
ore.
Sup
pres
sed
sale
sha
ve b
een
com
bine
d w
ith O
ther
Ret
ail S
tore
s.
Sour
ces:
SBO
E; U
.S. B
urea
u of
Lab
or S
tatis
tics;
Mun
i Ser
vice
s; T
own
of L
os G
atos
; BA
E, 2
011.
Le
akag
e an
d In
ject
ion
Ana
lysi
s fo
r Los
Gat
os a
nd th
e R
etai
l Tr
ade
Are
a (R
TA)
Ove
rvie
w o
f Met
hodo
logy
R
etai
l lea
kage
and
inje
ctio
n an
alys
is c
ompa
res a
ctua
l ret
ail s
ales
in a
n ar
ea w
ith so
me
benc
hmar
k th
at p
rovi
des a
mea
sure
of t
he p
oten
tial s
ales
gen
erat
ed b
y th
at a
rea's
resi
dent
s. If
sale
s lev
els a
re
belo
w th
e pr
edic
ted
leve
l, th
e ar
ea m
ay b
e ab
le to
supp
ort i
ncre
ased
sale
s, ei
ther
thro
ugh
the
open
ing
of n
ew o
utle
ts ta
rget
ing
thos
e le
akag
es o
r a re
posi
tioni
ng o
f exi
stin
g ou
tlets
thro
ugh
chan
ges i
n st
rate
gy a
nd m
arke
ting,
mer
chan
dise
mix
, or s
tore
con
figur
atio
n su
ch th
at th
ey c
ould
ca
ptur
e a
porti
on o
f tha
t lea
kage
.
A lo
wer
-than
-pre
dict
ed sa
les v
olum
e is
a st
rong
indi
cato
r tha
t con
sum
ers a
re tr
avel
ing
outs
ide
the
area
to sh
op; t
hus,
the
sale
s are
“le
akin
g” o
ut o
f the
stud
y ar
ea.
Con
vers
ely,
if th
e ar
ea sh
ows
mor
e sa
les t
han
wou
ld b
e ex
pect
ed fr
om th
e ar
ea's
char
acte
ristic
s, th
ere
are
sale
s “in
ject
ions
” in
to
the
stud
y ar
ea.
Ofte
n, a
n in
ject
ion
of sa
les i
ndic
ates
that
the
stud
y ar
ea is
serv
ing
as th
e re
gion
al
shop
ping
des
tinat
ion
for a
bro
ader
are
a. O
n th
e ot
her h
and,
if a
n ar
ea sh
ows s
ubst
antia
l lea
kage
, it
may
be
due
to th
e pr
esen
ce o
f a re
gion
-ser
ving
reta
il no
de o
utsi
de b
ut n
ear t
he st
udy
area
ca
ptur
ing
thos
e “l
eake
d” sa
les.
N
orth
For
ty S
peci
fic P
lan
Mar
ket S
tudy
and
Bus
ines
s Dev
elop
men
t Stra
tegy
Pa
ge 5
9 of
150
Nor
th F
orty
Spe
cific
Pla
n M
arke
t Stu
dy a
nd B
usin
ess D
evel
opm
ent S
trate
gy
Page
60
of 1
50
Ther
e ar
e a
num
ber o
f fac
tors
that
can
be
used
to p
redi
ct sa
les l
evel
s, w
ith th
e tw
o m
ost i
mpo
rtant
fa
ctor
s bei
ng th
e nu
mbe
r of p
erso
ns in
the
area
and
the
disp
osab
le in
com
e av
aila
ble
to th
at
popu
latio
n. A
dditi
onal
fact
ors i
nflu
enci
ng re
tail
spen
ding
in a
n ar
ea in
clud
e ho
useh
old
type
, age
of
pop
ulat
ion,
num
ber o
f wor
kers
in th
e ar
ea (i
.e.,
dayt
ime
popu
latio
n), t
ouris
m e
xpen
ditu
res,
tenu
re p
atte
rns (
owne
r vs.
rent
er),
and
cultu
ral f
acto
rs.
A
s not
ed a
bove
, Los
Gat
os a
nd th
e R
TA h
ave
over
all p
er c
apita
sale
s abo
ve c
ount
y an
d st
atew
ide
leve
ls.
This
alo
ne, h
owev
er, d
oes n
ot in
dica
te th
at th
ese
area
s are
nec
essa
rily
capt
urin
g sa
les
from
oth
er lo
cale
s; fo
r ins
tanc
e, h
ighe
r inc
ome
leve
ls c
ould
acc
ount
in p
art f
or d
iffer
ing
loca
l sp
endi
ng p
atte
rns,
and
shop
ping
pat
tern
s may
var
y du
e to
con
sum
er p
refe
renc
es a
s wel
l as t
he
reta
il op
tions
ava
ilabl
e lo
cally
.
To b
ette
r det
erm
ine
the
leve
ls o
f lea
kage
s and
inje
ctio
ns fo
r Los
Gat
os a
nd th
e R
TA, B
AE
has
obta
ined
a N
iels
en/C
larit
as R
etai
l Mar
ket P
oten
tial O
ppor
tuni
ty G
ap (R
MP)
repo
rt fo
r the
two
geog
raph
ies.
Thi
s rep
ort e
stim
ates
reta
il de
man
d ba
sed
on th
e C
onsu
mer
Exp
endi
ture
Sur
vey,
a
natio
nal s
urve
y co
nduc
ted
for t
he D
epar
tmen
t of L
abor
Bur
eau
of L
abor
Sta
tistic
s by
the
U.S
. C
ensu
s Bur
eau
whi
ch m
easu
res c
onsu
mer
exp
endi
ture
s and
pro
vide
s dat
a on
diff
erin
g sp
endi
ng
patte
rns b
y ag
e, in
com
e, e
thni
city
, and
oth
er v
aria
bles
. Th
is so
urce
info
rmat
ion
is c
onve
rted
to
expe
cted
exp
endi
ture
s by
stor
e ty
pe, t
o ob
tain
an
estim
ate
of d
eman
d by
reta
il st
ore
cate
gory
. N
ext,
BA
E fin
e-tu
ned
the
RM
P ex
pend
iture
est
imat
es b
ased
on
actu
al e
xpen
ditu
re p
atte
rns i
n Sa
nta
Cla
ra C
ount
y as
refle
cted
in to
tal r
etai
l sal
es b
y m
ajor
stor
e ca
tego
ry.
Fo
llow
ing
the
calc
ulat
ion
of th
e R
MP
expe
nditu
re e
stim
ate,
the
next
step
in th
e le
akag
e an
alys
is
is th
e us
e of
an
adju
stm
ent f
acto
r by
stor
e ca
tego
ry to
take
into
acc
ount
cha
nges
in a
ctua
l sal
es
and
pote
ntia
l dem
and
sinc
e 20
08, t
he y
ear f
or w
hich
act
ual d
ata
wer
e ob
tain
ed.26
For
Los
Gat
os,
thes
e ad
just
men
t fac
tors
are
der
ived
from
the
chan
ge in
act
ual s
ales
by
maj
or st
ore
cate
gory
be
twee
n 20
08 a
nd 2
010
as in
dica
ted
in th
e an
alys
is o
f tax
able
sale
s dat
a, a
nd o
n a
natio
nal
dem
and
adju
stm
ent f
acto
r bas
ed o
n ch
ange
s in
infla
tion-
adju
sted
per
cap
ita sa
les d
eriv
ed fr
om
natio
nal d
ata
on e
stim
ated
reta
il sa
les.
The
se m
ultip
liers
var
y by
reta
il st
ore
type
; for
inst
ance
, si
nce
food
item
s are
a d
aily
nec
essi
ty, f
ood
stor
e sa
les h
ave
not d
eclin
ed a
s muc
h on
a p
erce
ntag
e ba
sis a
s oth
er c
ateg
orie
s.27
For
the
RTA
, the
nat
iona
l adj
usto
r is u
sed
thro
ugho
ut, s
ince
no
com
para
tive
data
for 2
010
are
avai
labl
e fo
r the
are
a.
The
refin
ed d
eman
d/ex
pend
iture
dat
a ar
e th
en c
ompa
red
to th
e es
timat
ed sa
les b
y m
ajor
stor
e ca
tego
ry fo
r Los
Gat
os a
nd th
e R
TA a
s sho
wn
abov
e in
Tab
le 1
9, o
n a
tota
l and
per
cap
ita b
asis
.
26
Tax
able
sale
s dat
a co
uld
not b
e ob
tain
ed fo
r the
RTA
as i
t cro
sses
juris
dict
iona
l bou
ndar
ies a
nd in
clud
es
unin
corp
orat
ed a
reas
for w
hich
dat
a ar
e no
t pub
lishe
d. T
he d
ata
sour
ce u
sed
also
take
s int
o ac
coun
t tot
al
reta
il sa
les,
not j
ust t
axab
le sa
les.
27 T
he p
roce
dure
her
e is
con
serv
ativ
e in
that
it a
djus
ts e
xpec
ted
sale
s dow
nwar
d to
refle
ct c
urre
nt
rece
ssio
nary
con
ditio
ns.
It is
pos
sibl
e th
at e
cono
mic
con
ditio
ns w
ill im
prov
e by
the
time
any
reta
il ou
tlets
ac
tual
ly o
pen
in th
e N
orth
40.

The
resu
lts o
f the
leak
age
anal
ysis
are
sum
mar
ized
in F
igur
e 12
and
Tab
le 1
9, w
ith d
etai
l on
this
an
alys
is p
rovi
ded
in A
ppen
dice
s D a
nd E
. Lo
s G
atos
Lea
kage
Ana
lysi
s W
ith it
s hig
h pe
r cap
ita sa
les l
evel
s, Lo
s Gat
os sh
ows i
njec
tions
of s
ales
in m
ost m
ajor
stor
e ca
tego
ries,
as sh
own
in F
igur
e 12
. In
ject
ions
are
par
ticul
arly
hig
h fo
r foo
d an
d be
vera
ge st
ores
, m
otor
veh
icle
and
par
ts d
eale
rs, f
ood
serv
ices
, and
hea
lth a
nd p
erso
nal c
are
stor
es.28
Tw
o ca
tego
ries,
build
ing
mat
eria
ls a
nd g
ener
al m
erch
andi
se st
ores
, sta
nd o
ut fo
r the
ir su
bsta
ntia
l le
akag
es; o
ver h
alf o
f pot
entia
l res
iden
t exp
endi
ture
s in
the
build
ing
mat
eria
ls c
ateg
ory
are
leak
ing
out o
f Los
Gat
os, a
nd n
early
all
resi
dent
exp
endi
ture
s for
gen
eral
mer
chan
dise
stor
es
appe
ar to
be
leak
ing
out o
f Los
Gat
os.
The
lack
of s
ales
in g
ener
al m
erch
andi
se st
ores
is d
irect
ly
rela
ted
to th
e la
ck o
f suc
h st
ores
in L
os G
atos
;29 in
fact
, the
Cal
iforn
ia S
tate
Boa
rd o
f Equ
aliz
atio
n (S
BO
E) d
oes n
ot c
urre
ntly
repo
rt an
y ou
tlets
in th
is c
ateg
ory
in th
e To
wn.
For
the
build
ing
mat
eria
ls g
roup
, the
re a
re se
vera
l out
lets
incl
udin
g tw
o ha
rdw
are
stor
es, b
ut th
e To
wn
does
not
ha
ve a
larg
e ho
me
impr
ovem
ent s
tore
such
as H
ome
Dep
ot o
r an
inde
pend
ent l
umbe
r yar
d.
Ove
rall,
the
anal
ysis
indi
cate
s tha
t by
maj
or st
ore
cate
gory
, Los
Gat
os h
as e
stim
ated
com
bine
d in
ject
ions
of n
early
$32
0 m
illio
n in
reta
il sa
les a
nnua
lly, a
nd c
ombi
ned
estim
ated
leak
ages
of
appr
oxim
atel
y $8
0 m
illio
n an
nual
ly.
Th
e hi
gh le
vel o
f inj
ectio
ns o
f sal
es fo
r foo
d an
d be
vera
ge st
ores
is p
artic
ular
ly n
otew
orth
y, si
nce
groc
erie
s are
a c
onve
nien
ce it
em th
at is
usu
ally
pur
chas
ed lo
cally
. To
som
e ex
tent
, thi
s is d
ue to
th
e lo
catio
n of
the
stor
es in
Los
Gat
os.
The
Safe
way
stor
es in
the
Dow
ning
and
Rin
cona
da
Cen
ters
are
nea
r the
Tow
n bo
unda
ry, a
nd th
eir s
peci
fic lo
cal t
rade
are
as in
clud
e ar
eas o
utsi
de th
e To
wn.
Fur
ther
mor
e, th
e tw
o ne
ighb
orin
g ci
ties o
f Sar
atog
a an
d es
peci
ally
Mon
te S
eren
o an
d th
e un
inco
rpor
ated
are
as to
the
sout
h of
Tow
n ha
ve li
mite
d re
tail
offe
rings
, with
Los
Gat
os o
ffer
ing
the
clos
est s
hopp
ing
for s
ome
of th
eir r
esid
ents
. Th
is m
ay b
e a
fact
or fo
r oth
er st
ore
type
s als
o,
parti
cula
rly h
ealth
and
per
sona
l car
e st
ores
.
Add
ition
ally
, Los
Gat
os B
oule
vard
has
four
supe
rmar
kets
on
a m
ajor
arte
rial s
treet
whi
ch
cont
inue
s int
o ne
ighb
orin
g C
ampb
ell a
nd S
an Jo
se; t
wo
of th
ese
stor
es, W
hole
Foo
ds a
nd T
rade
r Jo
e’s,
are
nich
e st
ores
whi
ch li
kely
dra
w fr
om a
larg
er a
rea
than
a g
ener
ic n
eigh
borh
ood-
serv
ing
stor
e w
ould
, and
Lun
ardi
’s is
a sm
alle
r loc
al c
hain
whi
ch a
lso
attra
cts s
hopp
ers f
rom
a la
rger
tra
de a
rea.
A
noth
er is
sue
to c
onsi
der i
n ev
alua
ting
leak
ages
and
inje
ctio
ns is
the
pote
ntia
l for
subs
titut
ion
by
stor
e ty
pe.
For e
xam
ple,
app
arel
can
be
purc
hase
d in
bot
h cl
othi
ng st
ores
and
gen
eral
m
erch
andi
se st
ores
. In
Los
Gat
os, t
he la
ck o
f gen
eral
mer
chan
dise
stor
es m
ay b
e re
spon
sibl
e fo
r so
me
inje
ctio
ns, p
artic
ular
ly fo
r dru
g st
ores
, whi
ch a
re in
the
heal
th a
nd p
erso
nal c
are
stor
e
N
orth
For
ty S
peci
fic P
lan
Mar
ket S
tudy
and
Bus
ines
s Dev
elop
men
t Stra
tegy
28 T
he h
ealth
and
per
sona
l car
e st
ores
cat
egor
y in
clud
es p
harm
acie
s as t
he la
rges
t sub
cate
gory
. 29
The
clo
sest
maj
or g
ener
al m
erch
andi
se st
ore
to L
os G
atos
is th
e Ta
rget
on
Hill
side
Ave
nue
in S
an Jo
se.
Pa
ge 6
1 of
150

Nor
th F
orty
Spe
cific
Pla
n M
arke
t Stu
dy a
nd B
usin
ess D
evel
opm
ent S
trate
gy
Page
62
of 1
50
cate
gory
.30 W
hile
the
maj
ority
of d
rug
stor
e do
llars
are
spen
t at t
he p
resc
riptio
n co
unte
r, ch
ain
drug
stor
es st
ock
a va
riety
of e
very
day
item
s tha
t are
typi
cally
foun
d in
larg
er d
isco
unt
depa
rtmen
t sto
res.
Sup
erm
arke
ts a
lso
carr
y a
sele
ctio
n of
hou
sew
ares
, pap
er g
oods
, and
oth
er
item
s tha
t one
mig
ht a
lso
purc
hase
at a
dis
coun
t dep
artm
ent s
tore
.
One
add
ition
al k
ey fa
ctor
is th
at o
ne o
utle
t with
ext
rem
ely
stro
ng sa
les c
an m
ask
poor
pe
rfor
man
ce b
y th
e re
st o
f tha
t sto
re c
ateg
ory.
For
exa
mpl
e, in
Los
Gat
os th
e ho
me
furn
ishi
ngs
and
appl
ianc
es c
ateg
ory
is d
omin
ated
by
sale
s in
the
App
le S
tore
. Th
is st
ore’
s ext
rem
ely
stro
ng
sale
s may
be
mas
king
lim
ited
sale
s acr
oss t
he re
mai
nder
of t
he c
ateg
ory.
Thi
s iss
ue w
ill b
e ex
plor
ed in
the
disc
ussi
on o
f per
cap
ita sa
les b
y m
ore
deta
iled
stor
e ty
pe fo
und
afte
r the
leak
age
anal
ysis
for t
he R
TA.
R
etai
l Tra
de A
rea
Leak
age
Ana
lysi
s Fo
r the
larg
er R
TA, t
he le
vels
of l
eaka
ges a
nd in
ject
ions
app
ear t
o be
muc
h lo
wer
on
a pe
r cap
ita
basi
s, in
dica
ting
a re
lativ
e ba
lanc
e be
twee
n re
tail
sale
s and
resi
dent
exp
endi
ture
s in
mos
t ca
tego
ries.
Eve
n th
ough
the
RTA
is m
uch
mor
e po
pulo
us th
an th
e To
wn,
est
imat
ed c
ombi
ned
inje
ctio
ns a
re lo
wer
, at a
ppro
xim
atel
y $2
30 m
illio
n an
nual
ly, a
nd a
re c
once
ntra
ted
in a
uto-
rela
ted
reta
il. T
he c
ombi
ned
leak
ages
are
gre
ater
, at n
early
$59
0 m
illio
n an
nual
ly, b
ut a
re sp
read
acr
oss
a nu
mbe
r of c
ateg
orie
s, w
ith th
e la
rges
t lea
kage
s in
the
gene
ral m
erch
andi
se st
ore
cate
gory
. Th
e le
akag
es in
the
gene
ral m
erch
andi
se c
ateg
ory
may
be
rela
ted
in p
art t
o W
estfi
eld
Val
ley
Fair’
s pr
esen
ce ju
st o
utsi
de th
e R
TA a
lthou
gh it
cer
tain
ly a
ttrac
ts sa
les o
ut o
f the
RTA
to it
s anc
hor
stor
es.31
30
In fa
ct, u
p un
til 2
009,
SB
OE
clas
sifie
d dr
ug st
ores
as g
ener
al m
erch
andi
se st
ores
. 31
Val
ley
Fair
stra
ddle
s the
San
ta C
lara
/San
Jose
city
line
and
has
a S
anta
Cla
ra Z
ip C
ode
addr
ess w
hich
is n
ot
part
of th
e R
TA.

Figu
re 1
2: P
er C
apita
Ret
ail S
ales
Lea
kage
s by
Maj
or R
etai
l Sto
re C
ateg
ory
Sou
rce:
BA
E U
rban
Eco
nom
ics,
bas
ed o
n so
urce
s as
not
ed in
Tab
le 1
9 an
d A
ppen
dice
s D
and
I.
General Merchandise Stores
Bldg. M
atrl. and Garden Equip. and Supplies
Sporting G
oods, Hobby, Book, and Music Stores
Clothing and Clothing Accessories Stores
Hom
e Furnishings and Appliance Stores
Miscellaneous Store Retailers
Gasoline Stations
Health and Personal Care Stores
Food Se
rvices and Drinking Places
Motor Vehicle and Parts D
ealers
Food and Beverage Stores
Ann
ual Per Cap
ita Leakages/Injection
s
Los Gatos Per Cap
ita Re
tail Sales Leakages
Injections
→ba
e←Leakages
General Merchandise Stores
Food Services and Drinking Places
Clothing and Clothing Accessories Stores
Food and Beverage Stores
Health and Personal Care Stores
Miscellaneous Store Retailers
Hom
e Furnishings and Appliance Stores
Bldg. M
atrl. and Garden Equip. and Supplies
Gasoline Stations
Sporting G
oods, Hobby, Book, and Music Stores
Motor Vehicle and Parts D
ealers
Ann
ual Per Cap
ita Leakages/Injection
s
Trad
e Area Pe
r Ca
pita Retail Sales Leakages
Injections
→ba
e←Leakages
N
orth
For
ty S
peci
fic P
lan
Mar
ket S
tudy
and
Bus
ines
s Dev
elop
men
t Stra
tegy
Pa
ge 6
3 of
150

Tabl
e 19
: Su
mm
ary
of L
eaka
ge A
naly
sis
Los
Gat
os20
10 T
otal
Ann
ual
Inje
ctio
n/R
etai
l Sal
es in
$00
0To
tal
Per C
apita
Leak
age
Inje
ctio
n/In
ject
ion/
(Lea
kage
)(L
eaka
ge)
Estim
ated
Estim
ated
as %
of
Sale
sR
esid
ent
Pote
ntia
lSt
ore
Cat
egor
yin
Are
aEx
pend
iture
s$0
00
Sale
sM
otor
Veh
icle
and
Par
ts D
eale
rs$1
61,3
39$9
2,14
8$6
9,19
1$2
,352
75%
Hom
e Fu
rnis
hing
s an
d A
pplia
nce
Sto
res
$47,
964
$36,
100
$11,
864
$403
33%
Bld
g. M
atrl.
and
Gar
den
Equ
ip. a
nd S
uppl
ies
$14,
043
$35,
723
Food
and
Bev
erag
e S
tore
s$1
79,3
36$7
6,83
6$1
02,5
00$3
,485
133%
Hea
lth a
nd P
erso
nal C
are
Sto
res
$70,
701
$26,
001
$44,
700
$1,5
2017
2%G
asol
ine
Sta
tions
$44,
782
$28,
923
$15,
858
$539
55%
Clo
thin
g an
d C
loth
ing
Acc
esso
ries
Sto
res
$48,
247
$39,
330
$8,9
17$3
0323
%S
porti
ng G
oods
, Hob
by, B
ook,
& M
usic
Sto
res
$18,
819
$13,
141
$5,6
78$1
9343
%G
ener
al M
erch
andi
se S
tore
s$9
99$5
8,32
2M
isce
llane
ous
Sto
re R
etai
lers
$26,
420
$13,
389
$13,
031
$443
97%
Food
Ser
vice
s an
d D
rinki
ng P
lace
s$1
19,8
18$7
3,75
8$4
6,06
0$1
,566
62%
T
otal
$732
,467
$493
,672
$238
,795
$8,1
1948
%
Mar
ket A
rea
($21
,680
)($
737)
-61%
($57
,323
)($
1,94
9)-9
8%
2010
Tot
al A
nnua
l
In
ject
ion/
Ret
ail S
ales
in $
000
Tota
lPe
r Cap
itaEs
timat
edEs
timat
edas
% o
fSa
les
Res
iden
tPo
tent
ial
Stor
e C
ateg
or
Leak
age
Inje
ctio
n/In
ject
ion/
(Lea
kage
)(L
eaka
ge)
yin
Are
aEx
pend
iture
s$0
00
Sale
sM
otor
Veh
icle
and
Par
ts D
eale
rs$1
,682
,675
$1,5
13,9
89$1
68,6
86$2
7811
%H
ome
Furn
ishi
ngs
and
App
lianc
e S
tore
s$5
60,8
62$5
81,0
31B
ldg.
Mat
rl. a
nd G
arde
n E
quip
. and
Sup
plie
s$5
60,2
38$5
77,2
76Fo
od a
nd B
ever
age
Sto
res
$1,3
19,4
41$1
,361
,405
Hea
lth a
nd P
erso
nal C
are
Sto
res
$399
,097
$436
,516
Gas
olin
e S
tatio
ns$5
34,0
82$5
10,1
14$2
3,96
8$4
05%
Clo
thin
g an
d C
loth
ing
Acc
esso
ries
Sto
res
$565
,599
$658
,592
Spo
rting
Goo
ds, H
obby
, Boo
k, &
Mus
ic S
tore
s$2
52,7
96$2
14,3
17$3
8,47
9$6
318
%G
ener
al M
erch
andi
se S
tore
s$7
98,9
72$1
,002
,377
Mis
cella
neou
s S
tore
Ret
aile
rs$1
96,3
99$2
23,7
13Fo
od S
ervi
ces
and
Drin
king
Pla
ces
$1,1
27,3
84$1
,276
,097
T
otal
$7,9
97,5
44$8
,355
,427
All
sale
s an
d le
akag
es a
re in
201
0 do
llars
. Fo
r det
ail o
n m
etho
dolo
gy a
nd s
ourc
es, s
ee A
ppen
dice
s D
and
I.
Sou
rces
: B
AE
, bas
ed o
n so
urce
s as
not
ed in
App
endi
x D
.
($20
,169
)($
33)
-3%
($17
,038
)($
28)
-3%
($41
,963
)($
69)
-3%
($37
,419
)($
62)
-9%
($92
,993
)($
153)
-14%
($20
3,40
5)($
336)
-20%
($27
,314
)($
45)
-12%
($14
8,71
4)($
245)
-12%
($35
7,88
2)($
591)
-4%
Nor
th F
orty
Spe
cific
Pla
n M
arke
t Stu
dy a
nd B
usin
ess D
evel
opm
ent S
trate
gy
Page
64
of 1
50

Com
para
tive
Ret
ail S
ales
by
Det
aile
d St
ore
Cat
egor
y W
hile
the
leak
age
anal
ysis
abo
ve p
rovi
des a
bro
ad-b
rush
pic
ture
of t
he re
tail
mar
ket i
n Lo
s Gat
os
and
the
RTA
, a m
ore
deta
iled
appr
oach
shou
ld g
ive
a be
tter v
iew
of p
artic
ular
subc
ateg
orie
s tha
t m
ay h
ave
wea
k or
stro
ng sa
les r
elat
ive
to th
e po
pula
tion
base
. Th
e fo
llow
ing
anal
ysis
dril
ls d
own
to m
ore
deta
iled
stor
e ty
pes b
y N
AIC
S co
de, b
y co
mpa
ring
annu
al p
er c
apita
sale
s for
Los
Gat
os
and
the
RTA
with
San
ta C
lara
Cou
nty.
Th
is a
naly
sis i
s not
a m
ore
deta
iled
vers
ion
of th
e le
akag
e an
alys
is it
self,
but
a sl
ight
ly d
iffer
ent
type
of a
naly
sis.
Firs
t, it
does
not
take
into
acc
ount
cha
nges
in sa
les s
ince
200
8, a
s it w
as n
ot
poss
ible
to p
rovi
de a
djus
tmen
ts a
t thi
s gre
ater
leve
l of d
etai
l. F
or e
xam
ple,
the
decl
ines
in m
otor
ve
hicl
e sa
les d
ue to
dea
ler c
losu
res i
s not
take
n in
to a
ccou
nt, n
or a
re th
e in
crea
sing
sale
s for
the
App
le S
tore
, whi
ch w
ere
cons
ider
ably
hig
her i
n 20
10 th
an 2
008.
Thi
s is n
oted
in th
e di
scus
sion
w
hich
follo
ws w
ith re
spec
t to
car d
eale
rs a
nd th
e A
pple
Sto
re.
Seco
nd, t
he a
naly
sis i
nclu
des n
o ad
just
men
ts fo
r loc
al d
emog
raph
ics (
e.g.
, hig
h in
com
es a
nd h
ome
owne
rshi
p) a
s pro
vide
d by
the
RM
P re
port
from
Nie
lsen
/Cla
ritas
. Th
e ab
ility
of c
onsu
mer
s to
subs
titut
e be
twee
n st
ore
type
s an
d th
e qu
ality
of t
he R
MP
data
do
not r
easo
nabl
y al
low
per
cap
ita sa
les a
djus
tmen
t fac
tors
for
thes
e m
ore
deta
iled
stor
e ty
pes.
Th
e ta
bles
in th
e fo
llow
ing
disc
ussi
on h
ighl
ight
the
subc
ateg
orie
s whe
re L
os G
atos
’ per
cap
ita
sale
s are
mor
e th
an 5
0 pe
rcen
t bel
ow th
ose
for S
anta
Cla
ra C
ount
y, a
s the
se m
ay re
pres
ent s
ome
of th
e be
tter o
ppor
tuni
ties t
o ex
pand
reta
il in
the
Tow
n, a
nd b
ecau
se th
is e
xtre
me
leve
l of
varia
tion
wou
ld st
ill b
e pr
esen
t eve
n if
adju
stm
ents
for l
ocal
con
ditio
ns in
the
Tow
n an
d th
e R
TA
had
been
pos
sibl
e. S
ince
the
Cou
nty
has l
ower
ove
rall
inco
me
leve
ls a
nd lo
wer
exp
ecte
d re
side
nt
expe
nditu
res,
this
is a
stro
ng in
dica
tor o
f sub
cate
gorie
s whe
re th
ere
is a
subs
tant
ial g
ap b
etw
een
sale
s and
exp
endi
ture
s in
the
Tow
n.32
The
follo
win
g di
scus
sion
is o
rgan
ized
by
maj
or re
tail
cate
gory
as s
how
n in
the
leak
age
anal
ysis
abo
ve.
N
orth
For
ty S
peci
fic P
lan
Mar
ket S
tudy
and
Bus
ines
s Dev
elop
men
t Stra
tegy
32 It
shou
ld a
lso
be n
oted
that
the
sale
s fig
ures
her
e in
this
det
aile
d an
alys
is a
re b
ased
on
2008
sale
s and
are
in
flatio
n-ad
just
ed o
nly,
and
hav
e no
t bee
n ad
just
ed to
acc
ount
for c
hang
es in
the
econ
omy
and
reta
il m
ix
subs
eque
nt to
200
8, su
ch a
s the
dec
line
in n
ew c
ar sa
les i
n Lo
s Gat
os d
ue to
the
clos
ure
of se
vera
l car
de
aler
ship
s and
the
over
all d
eclin
e in
the
econ
omy.
The
prio
r ove
rall
leak
age
anal
ysis
sect
ion
mak
es
adju
stm
ents
for t
hese
fact
ors.
Pa
ge 6
5 of
150

Mot
or V
ehic
le a
nd P
arts
Dea
lers
. A
s not
ed in
the
leak
age
anal
ysis
abo
ve, L
os G
atos
is
attra
ctin
g sa
les i
n th
is c
ateg
ory,
eve
n af
ter a
djus
ting
for t
he c
onsi
dera
bly
low
er sa
les l
evel
s of
2010
. W
ithin
the
cate
gory
, the
Tow
n’s s
ales
are
con
cent
rate
d in
the
new
car
dea
ler s
ubca
tego
ry;33
fu
rther
mor
e, L
os G
atos
has
two
luxu
ry c
ar d
eale
rs se
lling
rela
tivel
y ex
pens
ive
auto
mob
iles.
The
To
wn
has n
o us
ed c
ar, R
V, o
r boa
t dea
lers
, but
thes
e ar
e re
tail
type
s unl
ikel
y to
find
suita
ble
site
s in
Los
Gat
os.
Furth
erm
ore,
thes
e su
bcat
egor
ies a
ppea
r to
be b
ette
r-re
pres
ente
d in
the
larg
er
RTA
, so
the
gene
ral r
egio
n is
fairl
y w
ell-s
erve
d. O
nce
agai
n, it
is im
porta
nt to
not
e th
at th
e sa
les
in th
is d
etai
led
anal
ysis
are
from
200
8, a
nd d
o no
t alw
ays r
efle
ct c
urre
nt c
ondi
tions
, e.g
., de
aler
cl
osur
es.
Lo
s Gat
osRe
tail T
rade
Are
a20
08 E
stim
ated
Ann
ual P
er C
apita
Sale
s in
2010
$Pe
r Cap
itaAs
%Pe
r Cap
itaAs
%Sa
nta C
lara
Sales
of C
ount
ySa
lesof
Cou
nty
Coun
tyNe
w ca
r dea
lers
$8,10
036
6%$2
,699
122%
$2,21
1Us
ed ca
r dea
lers
$00%
$59
153%
$39
Recr
eatio
nal v
ehicl
e dea
lers
$00%
$00%
$17
Motor
cycle
, ATV
, and
perso
nal w
atercr
aft de
alers
$154
297%
$68
131%
$52
Boat
dea
lers
$00%
$12
166%
$7Al
l oth
er m
otor
vehi
cle d
ealer
s$0
0%$1
225
9%$5
Auto
motiv
e par
ts an
d acc
esso
ries s
tores
$123
114%
$98
90%
$108
Tire d
ealer
s$1
4419
2%$8
010
7%$7
5Mo
tor V
ehicl
e and
Par
ts D
ealer
s$8
,521
$3,02
8$2
,514
H
ome
Furn
ishi
ngs a
nd A
pplia
nce
Stor
es.
The
broa
d-br
ush
leak
age
anal
ysis
in th
e pr
evio
us
sect
ion
of th
is re
port
indi
cate
s sub
stan
tial i
njec
tions
for t
his m
ajor
cat
egor
y ov
eral
l, lik
ely
driv
en
in la
rge
part
by th
e A
pple
Sto
re.
Unf
ortu
nate
ly, t
he sa
les d
ata
pres
ente
d do
not
show
this
eff
ect
fully
, as t
he st
ore
had
not y
et re
ache
d cu
rren
t sal
es le
vels
and
the
follo
win
g nu
mbe
rs d
o no
t tak
e in
to a
ccou
nt th
e in
crea
se in
sale
s in
the
App
le S
tore
sinc
e 20
08.
Nev
erth
eles
s, th
e da
ta d
o in
dica
te so
me
pote
ntia
l opp
ortu
nitie
s for
Los
Gat
os.
Whi
le th
e To
wn
also
show
s stro
ng p
er
capi
ta fu
rnitu
re st
ore
sale
s, ap
plia
nce
stor
e an
d el
ectro
nics
(exc
ludi
ng c
ompu
ters
) sto
res s
how
sa
les b
elow
cou
ntyw
ide
leve
ls.
App
lianc
e st
ores
in p
artic
ular
app
ear t
o be
a g
ap in
the
reta
il m
ix.
Alth
ough
com
pute
r sto
re sa
les s
how
n he
re b
ased
on
2008
dat
a ap
pear
low
, thi
s sub
cate
gory
may
no
long
er h
ave
such
low
per
cap
ita sa
les d
ue to
the
App
le S
tore
’s in
crea
sing
sale
s.
Los G
atos
Reta
il Tra
de A
rea
2008
Est
imat
ed A
nnua
l Per
Cap
ita S
ales i
n 20
10 $
Per C
apita
As %
Per C
apita
As %
Sant
a Clar
aSa
lesof
Cou
nty
Sales
of C
ount
yCo
unty
Furn
iture
stor
es$4
4832
0%$1
4310
2%$1
40Flo
or co
verin
g stor
es$2
756
%$4
185
%$4
9W
indow
trea
tmen
t stor
es$1
727
4%$6
96%
$6Al
l othe
r hom
e fur
nishin
gs st
ores
$561
374%
$207
138%
$150
Hous
ehol
d ap
plian
ce st
ores
$10
20%
$47
95%
$50
Radi
o, te
levisi
on, a
nd o
ther
elec
troni
cs st
ores
$89
37%
$251
104%
$241
Com
pute
r and
softw
are s
tore
s$1
1635
%$3
3410
0%$3
35Ca
mera
and p
hotog
raph
ic su
pplie
s stor
es$7
230
6%$2
610
9%$2
3Ho
me F
urni
shin
gs an
d Ap
plian
ce S
tore
s$1
,340
$1,05
4$9
94
Nor
th F
orty
Spe
cific
Pla
n M
arke
t Stu
dy a
nd B
usin
ess D
evel
opm
ent S
trate
gy
Page
66
of 1
50
33 T
he so
urce
s for
thes
e ta
bles
can
be
foun
d in
App
endi
x A
.
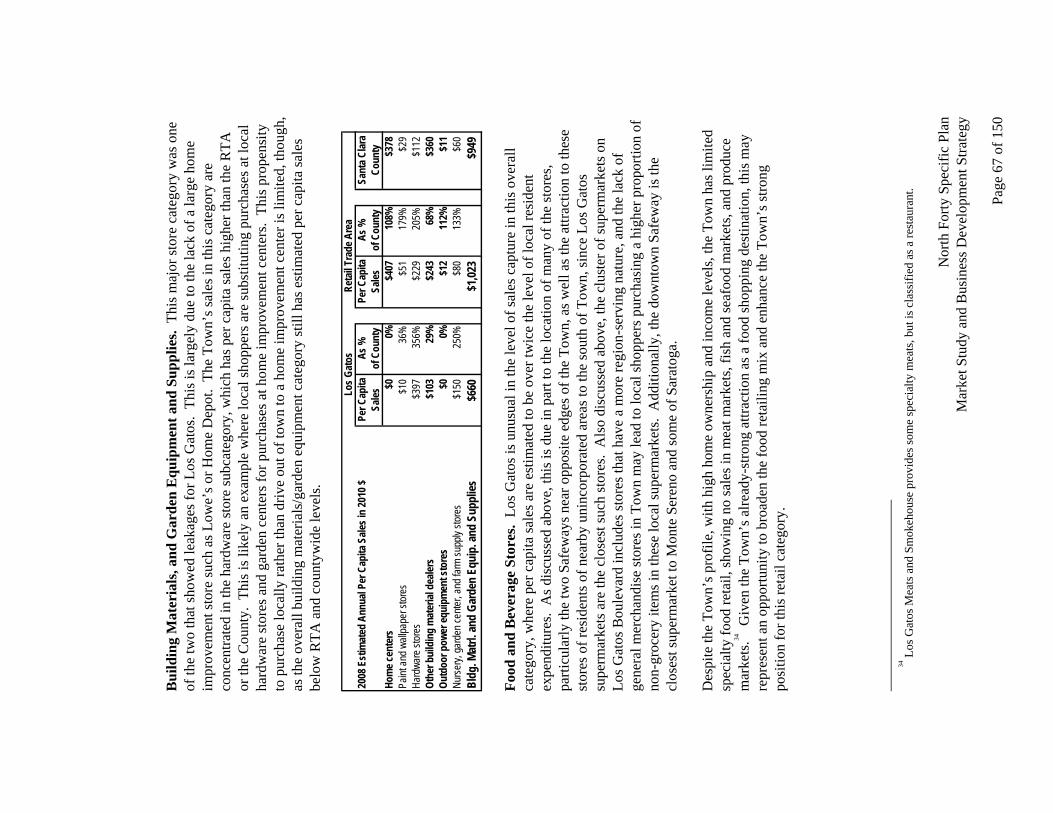
Bui
ldin
g M
ater
ials
, and
Gar
den
Equ
ipm
ent a
nd S
uppl
ies.
Thi
s maj
or st
ore
cate
gory
was
one
of
the
two
that
show
ed le
akag
es fo
r Los
Gat
os.
This
is la
rgel
y du
e to
the
lack
of a
larg
e ho
me
impr
ovem
ent s
tore
such
as L
owe’
s or H
ome
Dep
ot.
The
Tow
n’s s
ales
in th
is c
ateg
ory
are
conc
entra
ted
in th
e ha
rdw
are
stor
e su
bcat
egor
y, w
hich
has
per
cap
ita sa
les h
ighe
r tha
n th
e R
TA
or th
e C
ount
y. T
his i
s lik
ely
an e
xam
ple
whe
re lo
cal s
hopp
ers a
re su
bstit
utin
g pu
rcha
ses a
t loc
al
hard
war
e st
ores
and
gar
den
cent
ers f
or p
urch
ases
at h
ome
impr
ovem
ent c
ente
rs.
This
pro
pens
ity
to p
urch
ase
loca
lly ra
ther
than
driv
e ou
t of t
own
to a
hom
e im
prov
emen
t cen
ter i
s lim
ited,
thou
gh,
as th
e ov
eral
l bui
ldin
g m
ater
ials
/gar
den
equi
pmen
t cat
egor
y st
ill h
as e
stim
ated
per
cap
ita sa
les
belo
w R
TA a
nd c
ount
ywid
e le
vels
.
Los G
atos
Reta
il Tra
de A
rea
2008
Est
imat
ed A
nnua
l Per
Cap
ita S
ales i
n 20
10 $
Per C
apita
As %
Per C
apita
As %
Sant
a Clar
aSa
lesof
Cou
nty
Sales
of C
ount
yCo
unty
Hom
e cen
ters
$00%
$407
108%
$378
Paint
and w
allpa
per s
tores
$10
36%
$51
179%
$29
Hard
ware
stor
es$3
9735
6%$2
2920
5%$1
12Ot
her b
uild
ing
mat
erial
dea
lers
$103
29%
$243
68%
$360
Outd
oor p
ower
equi
pmen
t sto
res
$00%
$12
112%
$11
Nurse
ry, ga
rden
cente
r, an
d far
m su
pply
store
s$1
5025
0%$8
013
3%$6
0Bl
dg. M
atrl.
and
Gard
en E
quip
. and
Sup
plies
$6
60$1
,023
$949
Fo
od a
nd B
ever
age
Stor
es.
Los G
atos
is u
nusu
al in
the
leve
l of s
ales
cap
ture
in th
is o
vera
ll ca
tego
ry, w
here
per
cap
ita sa
les a
re e
stim
ated
to b
e ov
er tw
ice
the
leve
l of l
ocal
resi
dent
ex
pend
iture
s. A
s dis
cuss
ed a
bove
, thi
s is d
ue in
par
t to
the
loca
tion
of m
any
of th
e st
ores
, pa
rticu
larly
the
two
Safe
way
s nea
r opp
osite
edg
es o
f the
Tow
n, a
s wel
l as t
he a
ttrac
tion
to th
ese
stor
es o
f res
iden
ts o
f nea
rby
unin
corp
orat
ed a
reas
to th
e so
uth
of T
own,
sinc
e Lo
s Gat
os
supe
rmar
kets
are
the
clos
est s
uch
stor
es.
Als
o di
scus
sed
abov
e, th
e cl
uste
r of s
uper
mar
kets
on
Los G
atos
Bou
leva
rd in
clud
es st
ores
that
hav
e a
mor
e re
gion
-ser
ving
nat
ure,
and
the
lack
of
gene
ral m
erch
andi
se st
ores
in T
own
may
lead
to lo
cal s
hopp
ers p
urch
asin
g a
high
er p
ropo
rtion
of
non-
groc
ery
item
s in
thes
e lo
cal s
uper
mar
kets
. A
dditi
onal
ly, t
he d
ownt
own
Safe
way
is th
e cl
oses
t sup
erm
arke
t to
Mon
te S
eren
o an
d so
me
of S
arat
oga.
D
espi
te th
e To
wn’
s pro
file,
with
hig
h ho
me
owne
rshi
p an
d in
com
e le
vels
, the
Tow
n ha
s lim
ited
spec
ialty
food
reta
il, sh
owin
g no
sale
s in
mea
t mar
kets
, fis
h an
d se
afoo
d m
arke
ts, a
nd p
rodu
ce
mar
kets
.34 G
iven
the
Tow
n’s a
lread
y-st
rong
attr
actio
n as
a fo
od sh
oppi
ng d
estin
atio
n, th
is m
ay
repr
esen
t an
oppo
rtuni
ty to
bro
aden
the
food
reta
iling
mix
and
enh
ance
the
Tow
n’s s
trong
po
sitio
n fo
r thi
s ret
ail c
ateg
ory.
N
orth
For
ty S
peci
fic P
lan
Mar
ket S
tudy
and
Bus
ines
s Dev
elop
men
t Stra
tegy
34 L
os G
atos
Mea
ts a
nd S
mok
ehou
se p
rovi
des s
ome
spec
ialty
mea
ts, b
ut is
cla
ssifi
ed a
s a re
stau
rant
.
Pa
ge 6
7 of
150
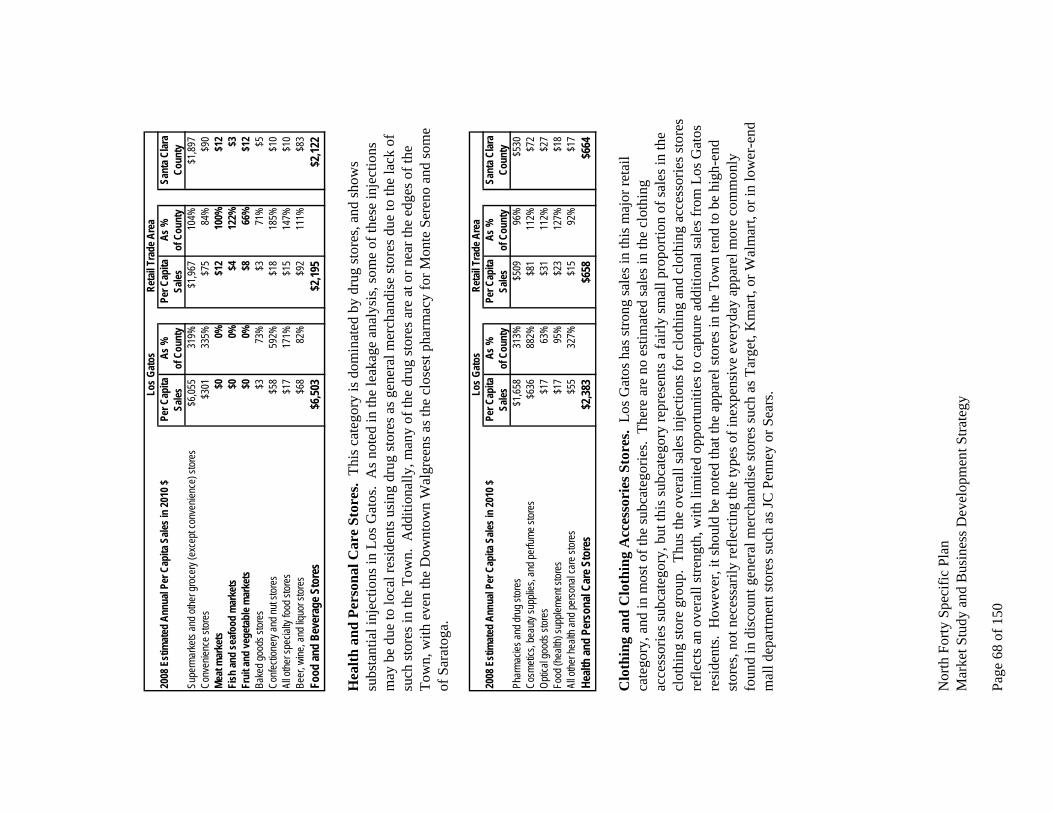
Los G
atos
Reta
il Tra
de A
rea
2008
Est
imat
ed A
nnua
l Per
Cap
ita S
ales i
n 20
10 $
Per C
apita
As %
Per C
apita
As %
Sant
a Clar
aSa
lesof
Cou
nty
Sales
of C
ount
yCo
unty
Supe
rmar
kets
and o
ther g
roce
ry (e
xcep
t con
venie
nce)
stor
es$6
,055
319%
$1,96
710
4%$1
,897
Conv
enien
ce st
ores
$301
335%
$75
84%
$90
Meat
mar
kets
$00%
$12
100%
$12
Fish
and
seaf
ood
mar
kets
$00%
$412
2%$3
Frui
t and
vege
tabl
e mar
kets
$00%
$866
%$1
2Ba
ked g
oods
stor
es$3
73%
$371
%$5
Confe
ction
ery a
nd nu
t stor
es$5
859
2%$1
818
5%$1
0Al
l othe
r spe
cialty
food
stor
es$1
717
1%$1
514
7%$1
0Be
er, w
ine, a
nd liq
uor s
tores
$68
82%
$92
111%
$83
Food
and
Beve
rage
Sto
res
$6,50
3$2
,195
$2,12
2
Hea
lth a
nd P
erso
nal C
are
Stor
es.
This
cat
egor
y is
dom
inat
ed b
y dr
ug st
ores
, and
show
s su
bsta
ntia
l inj
ectio
ns in
Los
Gat
os.
As n
oted
in th
e le
akag
e an
alys
is, s
ome
of th
ese
inje
ctio
ns
may
be
due
to lo
cal r
esid
ents
usi
ng d
rug
stor
es a
s gen
eral
mer
chan
dise
stor
es d
ue to
the
lack
of
such
stor
es in
the
Tow
n. A
dditi
onal
ly, m
any
of th
e dr
ug st
ores
are
at o
r nea
r the
edg
es o
f the
To
wn,
with
eve
n th
e D
ownt
own
Wal
gree
ns a
s the
clo
sest
pha
rmac
y fo
r Mon
te S
eren
o an
d so
me
of S
arat
oga.
Los G
atos
Reta
il Tra
de A
rea
2008
Est
imat
ed A
nnua
l Per
Cap
ita S
ales i
n 20
10 $
Per C
apita
As %
Per C
apita
As %
Sant
a Clar
aSa
lesof
Cou
nty
Sales
of C
ount
yCo
unty
Phar
macie
s and
drug
stor
es$1
,658
313%
$509
96%
$530
Cosm
etics
, bea
uty su
pplie
s, an
d per
fume s
tores
$636
882%
$81
112%
$72
Optic
al go
ods s
tores
$17
63%
$31
112%
$27
Food
(hea
lth) s
upple
ment
store
s$1
795
%$2
312
7%$1
8Al
l othe
r hea
lth an
d per
sona
l car
e stor
es$5
532
7%$1
592
%$1
7He
alth
and
Pers
onal
Care
Sto
res
$2,38
3$6
58$6
64
Clo
thin
g an
d C
loth
ing
Acc
esso
ries
Sto
res.
Los
Gat
os h
as st
rong
sale
s in
this
maj
or re
tail
cate
gory
, and
in m
ost o
f the
subc
ateg
orie
s. T
here
are
no
estim
ated
sale
s in
the
clot
hing
ac
cess
orie
s sub
cate
gory
, but
this
subc
ateg
ory
repr
esen
ts a
fairl
y sm
all p
ropo
rtion
of s
ales
in th
e cl
othi
ng st
ore
grou
p. T
hus t
he o
vera
ll sa
les i
njec
tions
for c
loth
ing
and
clot
hing
acc
esso
ries s
tore
s re
flect
s an
over
all s
treng
th, w
ith li
mite
d op
portu
nitie
s to
capt
ure
addi
tiona
l sal
es fr
om L
os G
atos
re
side
nts.
How
ever
, it s
houl
d be
not
ed th
at th
e ap
pare
l sto
res i
n th
e To
wn
tend
to b
e hi
gh-e
nd
stor
es, n
ot n
eces
saril
y re
flect
ing
the
type
s of i
nexp
ensi
ve e
very
day
appa
rel m
ore
com
mon
ly
foun
d in
dis
coun
t gen
eral
mer
chan
dise
stor
es su
ch a
s Tar
get,
Km
art,
or W
alm
art,
or in
low
er-e
nd
mal
l dep
artm
ent s
tore
s suc
h as
JC P
enne
y or
Sea
rs.
Nor
th F
orty
Spe
cific
Pla
n M
arke
t Stu
dy a
nd B
usin
ess D
evel
opm
ent S
trate
gy
Page
68
of 1
50

Los G
atos
Reta
il Tra
de A
rea
2008
Est
imat
ed A
nnua
l Per
Cap
ita S
ales i
n 20
10 $
Per C
apita
As %
Per C
apita
As %
Sant
a Clar
aSa
lesof
Cou
nty
Sales
of C
ount
yCo
unty
Men's
cloth
ing st
ores
$41
89%
$38
82%
$46
Wom
en's
clothi
ng st
ores
$431
231%
$113
60%
$186
Child
ren's
and i
nfants
' clot
hing s
tores
$65
147%
$43
98%
$44
Fami
ly clo
thing
stor
es$5
5712
9%$4
6310
7%$4
33Cl
othi
ng ac
cess
ories
stor
es$1
031
%$1
134
%$3
3Ot
her c
lothin
g stor
es$9
219
6%$7
014
8%$4
7Sh
oe st
ores
$106
83%
$102
80%
$128
Jewe
lry st
ores
$222
184%
$119
99%
$120
Lugg
age a
nd le
ather
good
s stor
es$8
236
5%$1
253
%$2
2Cl
othi
ng an
d Cl
othi
ng A
cces
sorie
s Sto
res
$1,60
7$9
70$1
,061
Sp
ortin
g G
oods
, Hob
by, B
ook,
and
Mus
ic S
tore
s. A
mon
g th
is g
roup
of s
tore
type
s, Lo
s Gat
os
show
s per
cap
ita sa
les a
bove
San
ta C
lara
Cou
nty
for m
ost s
ubca
tego
ries.
Spo
rting
goo
ds st
ore
sale
s, th
e la
rges
t cat
egor
y, a
re d
ue in
larg
e pa
rt to
the
Tow
n’s b
icyc
le sh
ops.
Los
Gat
os sh
ows n
o sa
les f
or n
ews d
eale
rs/n
ewss
tand
s and
pre
reco
rded
tape
, com
pact
dis
c, a
nd re
cord
stor
es, b
ut
thes
e ca
tego
ries a
re sm
all c
ateg
orie
s whi
ch h
ave
been
impa
cted
by
a sw
itch
to o
nlin
e ne
ws
read
ing
and
dow
nloa
dabl
e m
usic
. A
dditi
onal
ly, t
he p
er c
apita
boo
k st
ore
sale
s sho
wn
here
for t
he
Tow
n do
not
take
into
acc
ount
the
rece
nt c
losu
re o
f Bor
ders
; it i
s pos
sibl
e th
ere
may
now
be
an
oppo
rtuni
ty fo
r a sm
alle
r, in
depe
nden
t boo
ksto
re in
Los
Gat
os, b
ut th
is su
bcat
egor
y ha
s als
o be
en
impa
cted
by
onlin
e sa
les (
e.g.
, Am
azon
) and
now
by
e-re
ader
s, w
hich
may
aff
ect t
he p
oten
tial
long
-term
via
bilit
y of
such
a st
ore.
Los G
atos
Reta
il Tra
de A
rea
2008
Est
imat
ed A
nnua
l Per
Cap
ita S
ales i
n 20
10 $
Per C
apita
As %
Per C
apita
As %
Sant
a Clar
aSa
lesof
Cou
nty
Sales
of C
ount
yCo
unty
Spor
ting g
oods
stor
es$2
7420
7%$2
0815
8%$1
32Ho
bby,
toy, a
nd ga
me st
ores
$144
218%
$82
124%
$66
Sewi
ng, n
eedle
work,
and p
iece g
oods
stor
es$5
144
7%$2
218
8%$1
1Mu
sical
instru
ment
and s
uppli
es st
ores
$14
52%
$24
91%
$27
Book
stor
es$1
1612
9%$8
494
%$9
0Ne
ws d
ealer
s and
new
ssta
nds
$00%
$00%
$1Pr
erec
orde
d ta
pe, c
ompa
ct d
isc, a
nd re
cord
stor
es$0
0%$9
89%
$10
Spor
ting
Good
s, Ho
bby,
Book
, and
Mus
ic St
ores
$5
98$4
29$3
37
Gen
eral
Mer
chan
dise
Sto
res.
Los
Gat
os is
alm
ost e
ntire
ly la
ckin
g in
gen
eral
mer
chan
dise
st
ores
, and
as a
resu
lt ha
s alm
ost n
o sa
les i
n th
is c
ateg
ory.
Whi
le so
me
of th
ese
sale
s may
be
occu
rrin
g in
oth
er ty
pes o
f out
lets
such
as d
rug
stor
es, t
his c
ateg
ory
over
all r
epre
sent
s a
subs
tant
ial g
ap in
the
reta
il m
ix in
the
Tow
n.
N
orth
For
ty S
peci
fic P
lan
Mar
ket S
tudy
and
Bus
ines
s Dev
elop
men
t Stra
tegy
Pa
ge 6
9 of
150

Los G
atos
Reta
il Tra
de A
rea
2008
Est
imat
ed A
nnua
l Per
Cap
ita S
ales i
n 20
10 $
Per C
apita
As %
Per C
apita
As %
Sant
a Clar
aSa
lesof
Cou
nty
Sales
of C
ount
yCo
unty
Depa
rtmen
t sto
res (
exce
pt d
iscou
nt d
epar
tmen
t sto
res)
$00%
$449
103%
$435
Disc
ount
dep
artm
ent s
tore
s$0
0%$4
5978
%$5
87W
areh
ouse
club
s and
supe
rcen
ters
$00%
$239
51%
$468
All o
ther g
ener
al me
rchan
dise s
tores
$44
65%
$181
264%
$68
Gene
ral M
erch
andi
se S
tore
s $4
4$1
,328
$1,55
8
Mis
cella
neou
s Sto
re R
etai
lers
. Lo
s Gat
os h
as e
xtre
mel
y st
rong
per
cap
ita sa
les a
cros
s the
stor
e ty
pes c
ompr
isin
g th
is c
atch
-all
maj
or c
ateg
ory.
The
two
stor
e ty
pes w
ith v
ery
limite
d pe
r cap
ita
sale
s hav
e sp
ecia
l mar
ket n
iche
s tha
t are
not
subs
tant
ial o
ppor
tuni
ties i
n th
e co
ntex
t of t
he L
os
Gat
os re
tail
mix
.
Los G
atos
Reta
il Tra
de A
rea
2008
Est
imat
ed A
nnua
l Per
Cap
ita S
ales i
n 20
10 $
Per C
apita
As %
Per C
apita
As %
Sant
a Clar
aSa
lesof
Cou
nty
Sales
of C
ount
yCo
unty
Floris
ts$3
830
0%$1
915
3%$1
3Of
fice s
uppli
es an
d stat
ioner
y stor
es$2
0928
9%$8
011
0%$7
2Gi
ft, no
velty
, and
souv
enir s
tores
$431
825%
$70
134%
$52
Used
mer
chan
dise
stor
es$1
028
%$3
082
%$3
6Pe
t and
pet s
uppli
es st
ores
$243
374%
$76
117%
$65
Art d
ealer
s$2
149
5%$7
169%
$4Ma
nufa
ctur
ed (m
obile
) hom
e dea
lers
$00%
$00%
$51
Toba
cco s
tores
$17
107%
$21
133%
$16
All o
ther m
iscell
aneo
us st
ore r
etaile
rs (e
xcep
t toba
cco s
tores
)$5
814
3%$3
586
%$4
1Mi
scell
aneo
us S
tore
Ret
ailer
s $1
,026
$337
$350
Fo
od S
ervi
ces a
nd D
rink
ing
Plac
es.
The
Tow
n’s o
vera
ll st
reng
th in
this
cat
egor
y as
indi
cate
d ab
ove
in th
e le
akag
e an
alys
is c
arrie
s thr
ough
for a
lmos
t all
of th
e su
bcat
egor
ies.
Ful
l-ser
vice
re
stau
rant
s hav
e pa
rticu
lar s
trong
per
cap
ita sa
les o
n an
abs
olut
e ba
sis,
mak
ing
up a
ppro
xim
atel
y ha
lf of
the
rest
aura
nt sa
les i
n th
e To
wn.
The
onl
y su
btyp
e la
ckin
g in
Los
Gat
os is
caf
eter
ias/
grill
bu
ffet
s/bu
ffet
s. T
his n
iche
is p
roba
bly
not p
artic
ular
ly w
ell-s
uite
d to
the
area
dem
ogra
phic
pr
ofile
of h
igh
inco
me
hous
ehol
ds.
Lo
s Gat
osRe
tail T
rade
Are
a20
08 E
stim
ated
Ann
ual P
er C
apita
Sale
s in
2010
$Pe
r Cap
itaAs
%Pe
r Cap
itaAs
%Sa
nta C
lara
Sales
of C
ount
ySa
lesof
Cou
nty
Coun
tyFu
ll-ser
vice r
estau
rants
$2,18
126
3%$8
7310
5%$8
31Lim
ited-
servi
ce re
staur
ants
$684
110%
$648
104%
$622
Cafe
teria
s, gr
ill bu
ffets
, and
buf
fets
$00%
$26
91%
$29
Snac
k and
nona
lcoho
lic be
vera
ge ba
rs$4
6827
6%$1
9211
3%$1
70Fo
od se
rvice
contr
actor
s$5
6123
3%$8
335
%$2
40Ca
tere
rs$1
2345
5%$1
763
%$2
7Mo
bile f
ood s
ervic
es$7
753%
$192
%$1
Drink
ing pl
aces
(alco
holic
beve
rage
s)$1
8537
9%$3
673
%$4
9Fo
od S
ervic
es an
d Dr
inkin
g Pl
aces
$4
,209
$1,87
6$1
,969
N
orth
For
ty S
peci
fic P
lan
Mar
ket S
tudy
and
Bus
ines
s Dev
elop
men
t Stra
tegy
Pa
ge 7
0 of
150
Re
tail
Ma
rke
t A
ss
es
sm
en
t: S
um
ma
ry
Exis
ting
Con
ditio
ns
Los G
atos
has
fare
d re
lativ
ely
wel
l with
resp
ect t
o its
reta
il re
al e
stat
e ov
er th
e pa
st fe
w y
ears
. C
urre
ntly
, the
reta
il va
canc
y ra
te fo
r the
Tow
n is
est
imat
ed a
t app
roxi
mat
ely
five
perc
ent,
indi
cativ
e of
a b
alan
ced
mar
ket w
here
vac
anci
es o
ccur
as a
regu
lar p
art o
f the
bus
ines
s cyc
le.
Vac
ancy
rate
s for
the
entir
ety
of w
est S
anta
Cla
ra C
ount
y ar
e sl
ight
ly h
ighe
r, bu
t stil
l not
at
extre
mel
y hi
gh ra
tes o
n av
erag
e. F
or th
e To
wn,
low
vac
anci
es h
ave
been
driv
en b
y th
e st
rong
de
mog
raph
ics o
f the
are
a, a
nd b
y a
cons
train
ed su
pply
; the
supp
ly o
f spa
ces o
f 10,
000
squa
re fe
et
or m
ore
is p
artic
ular
ly li
mite
d. T
he li
mite
d pr
esen
ce o
f nat
iona
l cha
ins s
uch
as B
orde
rs th
at h
ave
unde
rgon
e do
wns
izin
g an
d liq
uida
tion
has a
lso
help
ed k
eep
vaca
ncie
s low
er in
Los
Gat
os.
Ren
ts
in L
os G
atos
dec
lined
at t
he o
nset
of t
he re
cess
ion,
but
hav
e si
nce
rebo
unde
d so
mew
hat.
D
ownt
own
has s
how
n th
e st
rong
est r
ents
and
less
er d
olla
r dec
reas
es.
The
RTA
con
tain
s a la
rge
mix
and
var
iety
of r
egio
nal r
etai
l cen
ters
rang
ing
from
dis
coun
t to
high
en
d sh
oppi
ng, a
nd fr
om p
ower
cen
ters
to li
fest
yle
cent
ers t
o m
ajor
enc
lose
d m
alls
. In
add
ition
to
thes
e ce
nter
s, th
ere
are
othe
r reg
iona
l cen
ters
bey
ond
the
RTA
that
dra
w sh
oppe
rs fr
om th
e R
TA.
Som
e of
thes
e ce
nter
s bot
h w
ithin
and
out
side
the
RTA
will
be
com
petit
ive
with
any
regi
on-s
ervi
ng
reta
il at
the
Nor
th 4
0, d
epen
ding
on
the
parti
cula
r sho
ppin
g ex
perie
nce
that
is p
rovi
ded
by th
e pr
ojec
t. T
he R
TA’s
reta
il sa
les f
or 2
008
are
estim
ated
at a
ppro
xim
atel
y $8
.4 b
illio
n, a
bout
10
times
the
sale
s in
Los G
atos
alo
ne.
Whi
le so
mew
hat s
mal
ler p
ropo
rtion
ally
than
for t
he T
own,
m
otor
veh
icle
and
par
ts d
eale
rs, f
ood
and
beve
rage
stor
es, a
nd fo
od se
rvic
es a
nd d
rinki
ng p
lace
s ar
e th
e th
ree
larg
est c
ateg
orie
s for
sale
s in
the
RTA
. Th
ere
are
som
e va
riatio
ns b
y st
ore
cate
gory
, bu
t the
RTA
’s le
vels
of p
er c
apita
sale
s are
muc
h cl
oser
to th
e co
unty
wid
e an
d st
atew
ide
leve
ls
than
the
Tow
n’s.
R
etai
l sal
es fo
r the
Tow
n fo
r 200
8 ar
e es
timat
ed a
t app
roxi
mat
ely
$838
mill
ion
(in in
flatio
n-ad
just
ed 2
010
dolla
rs).
The
thre
e la
rges
t cat
egor
ies b
y sa
les v
olum
e ar
e m
otor
veh
icle
and
par
ts
deal
ers a
t 30
perc
ent,
food
and
bev
erag
e st
ores
at 2
3 pe
rcen
t, an
d fo
od se
rvic
es a
nd d
rinki
ng p
lace
s at
15
perc
ent.
The
pro
porti
on o
f the
Tow
n’s t
otal
reta
il sa
les i
n m
otor
veh
icle
and
food
stor
e sa
les
are
cons
ider
ably
hig
her t
han
foun
d in
the
RTA
, the
Cou
nty,
or t
he S
tate
, alth
ough
they
hav
e de
clin
ed si
nce
2008
. Th
e To
wn
show
s alm
ost n
o sa
les i
n ge
nera
l mer
chan
dise
stor
es, w
ell b
elow
th
e pr
opor
tions
for t
he o
ther
geo
grap
hies
. O
n a
per c
apita
bas
is, r
etai
l sal
es in
Los
Gat
os a
re q
uite
hi
gh, a
t $28
,653
ann
ually
com
pare
d to
less
than
$14
,000
ann
ually
for t
he o
ther
thre
e ge
ogra
phie
s.
Seve
ral s
ecto
rs h
ave
per c
apita
sale
s at m
ore
than
twic
e th
e le
vels
foun
d in
the
RTA
; the
onl
y se
ctor
s lag
ging
the
RTA
in p
er c
apita
sale
s are
the
build
ing
mat
eria
ls g
roup
and
gen
eral
m
erch
andi
se st
ores
.
Tota
l inf
latio
n-ad
just
ed ta
xabl
e re
tail
sale
s in
Los G
atos
dip
ped
in th
e ea
rly p
art o
f the
last
dec
ade
follo
win
g th
e do
t-com
bus
t, an
d th
en g
radu
ally
incr
ease
d to
a p
eak
in 2
006;
sale
s dec
lined
aga
in
N
orth
For
ty S
peci
fic P
lan
Mar
ket S
tudy
and
Bus
ines
s Dev
elop
men
t Stra
tegy
Pa
ge 7
1 of
150

thro
ugh
2009
, the
n re
cove
red
slig
htly
in 2
010.
The
se c
hang
es in
reta
il sa
les o
ccur
red
agai
nst a
ba
ckgr
ound
of v
ery
limite
d po
pula
tion
grow
th in
the
Tow
n.
The
key
fact
or in
the
long
-term
dec
line
of re
tail
sale
s in
Los G
atos
is th
e de
clin
e in
the
mot
or
vehi
cle
sect
or.
By
2010
, tax
able
mot
or v
ehic
le sa
les i
n th
e To
wn
wer
e on
ly 2
1 pe
rcen
t of 2
000
leve
ls a
fter a
djus
ting
for i
nfla
tion.
Mos
t of t
he m
ajor
reta
il se
ctor
s hav
e 20
10 in
flatio
n ad
just
ed
sale
s sim
ilar t
o th
ose
in 2
000.
Asi
de fr
om th
e au
tom
otiv
e se
ctor
, onl
y th
e ca
tch-
all o
ther
reta
il gr
oup
(whi
ch in
clud
es sp
ecia
lty re
tail
such
as s
porti
ng g
oods
and
boo
ks) s
how
s a su
bsta
ntia
l de
clin
e, to
60
perc
ent o
f 200
0 le
vels
.
The
Tow
n’s p
rimar
y re
tail
area
s are
the
Dow
ntow
n, L
os G
atos
Bou
leva
rd a
nd th
e ne
ighb
orho
od
cent
ers.
Dow
ntow
n ha
s thr
ee su
bare
as: t
he D
ownt
own
Cor
e, D
ownt
own
Nor
th, a
nd th
e B
loss
om
Hill
/Uni
vers
ity d
istri
ct.
The
Dow
ntow
n C
ore
repr
esen
ts th
e “h
eart”
of L
os G
atos
, with
a m
ix o
f sm
all s
hops
in a
smal
l-tow
n m
ain-
stre
et se
tting
with
num
erou
s his
toric
stru
ctur
es, p
rimar
ily a
long
Sa
nta
Cru
z A
venu
e an
d M
ain
Stre
et.
Th
e C
ore
area
acc
ount
s for
nea
rly th
ree-
quar
ters
of a
ll bu
sine
sses
in th
e D
ownt
own,
and
has
the
stro
nges
t orie
ntat
ion
tow
ard
reta
il. T
he la
rges
t con
cent
ratio
ns a
re in
app
arel
, eat
ing
and
drin
king
, an
d ot
her r
etai
l, w
hich
incl
udes
var
ious
type
s of s
peci
alty
reta
il ou
tlets
such
as s
porti
ng g
oods
, toy
, an
d bo
oks/
stat
ione
ry st
ores
. Th
e C
ore
is c
hara
cter
ized
by
smal
ler f
loor
pla
tes,
and
beca
use
of th
e fo
rmul
a re
tail
ordi
nanc
e, th
e C
ore
cont
ains
few
cha
in re
taile
rs.
With
the
exce
ptio
n of
the
east
ern
porti
on o
f Old
Tow
n, th
e C
ore
busi
ness
es a
re fo
r the
mos
t par
t dire
ctly
adj
acen
t to
the
stre
et a
nd
side
wal
ks, w
ith p
arki
ng p
rovi
ded
on-s
treet
and
in m
unic
ipal
lots
beh
ind
the
stor
es o
n Sa
nta
Cru
z.
In th
e N
orth
suba
rea,
ther
e ar
e so
me
larg
er st
ores
, esp
ecia
lly W
algr
eens
and
the
soon
-to-o
pen
rebu
ilt a
nd e
xpan
ded
Safe
way
, and
con
vent
iona
l stri
p ce
nter
s suc
h as
the
Wal
gree
ns C
ente
r and
the
Los G
atos
Sho
ppin
g C
ente
r, w
ith st
ores
set b
ack
from
the
stre
et b
y pa
rkin
g lo
ts.
D
ownt
own
is se
en a
s a re
tail
dest
inat
ion,
dra
win
g sh
oppe
rs fr
om L
os G
atos
as w
ell a
s oth
er n
earb
y co
mm
uniti
es, e
spec
ially
Mon
te S
eren
o an
d Sa
rato
ga, w
hich
hav
e lim
ited
reta
il of
ferin
gs a
nd c
ome
to D
ownt
own
for e
very
day
item
s, sp
ecia
lty g
oods
and
serv
ices
, and
din
ing.
Sho
pper
s fro
m o
ther
ne
arby
citi
es su
ch a
s Cup
ertin
o, C
ampb
ell,
and
San
Jose
, hav
e am
ple
conv
enie
nce-
orie
nted
reta
il ne
arby
but
com
e to
Los
Gat
os fo
r the
dow
ntow
n ex
perie
nce.
Dow
ntow
n is
als
o a
tour
ist
dest
inat
ion,
with
out
-of-
tow
ners
com
ing
to e
xper
ienc
e th
e sm
all t
own
and
pede
stria
n-fr
iend
ly
ambi
ence
. In
201
0, D
ownt
own
Los G
atos
gen
erat
ed a
ppro
xim
atel
y $2
09 m
illio
n in
taxa
ble
reta
il sa
les,
or
over
50
perc
ent o
f the
Tow
n’s t
otal
, con
firm
ing
its si
gnifi
canc
e as
a sh
oppi
ng d
estin
atio
n an
d as
a
tax
gene
rato
r for
the
Tow
n. O
n an
infla
tion-
adju
sted
bas
is, t
his s
ales
leve
l has
dec
lined
from
$22
5 m
illio
n in
200
8, b
ut h
as re
boun
ded
from
$19
8 m
illio
n in
200
9. T
his u
ptic
k is
due
in p
art t
o in
crea
sing
sale
s at t
he A
pple
Sto
re, w
hich
is o
ne o
f the
larg
est s
ales
tax
gene
rato
rs in
the
Tow
n.
Nor
th F
orty
Spe
cific
Pla
n M
arke
t Stu
dy a
nd B
usin
ess D
evel
opm
ent S
trate
gy
Page
72
of 1
50

With
in th
e ov
eral
l Dow
ntow
n ar
ea, t
he C
ore
is re
spon
sibl
e fo
r 80
perc
ent o
f tot
al ta
xabl
e sa
les.
Lo
ng-te
rm tr
ends
in o
vera
ll ta
xabl
e sa
les i
n th
e D
ownt
own
Cor
e sh
ow th
at in
infla
tion-
adju
sted
do
llars
, sal
es w
ere
subs
tant
ially
hig
her i
n 20
00 th
an in
201
0. S
ales
dec
lined
from
200
0 th
roug
h 20
03, b
ut re
boun
ded
in 2
004
even
with
San
tana
Row
ope
ning
in 2
003.
Sal
es in
crea
sed
agai
n in
20
05, d
eclin
ed in
200
6, in
crea
sed
to a
pos
t-201
0 pe
ak in
200
7, a
nd th
en d
eclin
ed a
s the
rece
ssio
n to
ok h
old,
reac
hing
the
low
poi
nt o
f the
dec
ade
in 2
009.
A m
odes
t inc
reas
e w
as se
en in
201
0. I
t ap
pear
s tha
t gen
eral
mac
roec
onom
ic re
gion
al tr
ends
wer
e a
grea
ter f
acto
r inf
luen
cing
sale
s lev
els
in th
e C
ore
than
the
addi
tiona
l com
petit
ion
prov
ided
by
Sant
ana
Row
. M
uch
of th
is d
eclin
e, h
owev
er, w
as n
ot in
the
maj
or re
tail
cate
gorie
s con
side
red
key
sect
ors f
or th
e C
ore,
but
inst
ead
in a
uto-
rela
ted
reta
il (d
eale
rs a
nd se
rvic
e st
atio
ns) a
nd n
on-r
etai
l out
lets
(per
sona
l an
d bu
sine
ss se
rvic
es).
The
key
reta
il se
ctor
s com
bine
d sh
owed
smal
ler d
eclin
es o
ver t
he d
ecad
e,
and
eatin
g an
d dr
inki
ng p
lace
s sho
wed
lim
ited
varia
tion
over
the
ten
year
s.
Form
ula
reta
il, w
hile
rest
ricte
d in
the
Dow
ntow
n C
ore,
nev
erth
eles
s acc
ount
s for
a si
gnifi
cant
pr
opor
tion
of ta
xabl
e re
tail
sale
s. In
201
0, st
ores
des
igna
ted
as fo
rmul
a re
tail
in th
e D
ownt
own
Cor
e pr
ovid
ed o
ver 3
0 pe
rcen
t of t
axab
le re
tail
sale
s in
the
area
, whi
le m
akin
g up
onl
y se
ven
perc
ent o
f the
reta
il ou
tlets
. O
ver h
alf o
f the
Dow
ntow
n C
ore’
s tax
able
sale
s in
appa
rel s
tore
s are
in
form
ula
reta
il st
ores
, and
a m
uch
high
er p
ropo
rtion
of t
axab
le sa
les i
n ho
me
furn
ishi
ngs a
nd
appl
ianc
es a
re in
form
ula
reta
il st
ores
(due
to th
e A
pple
Sto
re).
The
onl
y dr
ug st
ore
dow
ntow
n is
Ph
arm
aca,
a fo
rmul
a re
taile
r. T
he re
cent
ly c
lose
d B
orde
r’s,
a fo
rmul
a st
ore,
was
the
only
bo
okst
ore.
Exc
ludi
ng re
stau
rant
s and
food
stor
es (n
eith
er o
f the
m su
bjec
t to
the
form
ula
reta
il or
dina
nce)
, for
mul
a re
taile
rs a
ccou
nt fo
r ove
r hal
f of t
he ta
xabl
e re
tail
sale
s in
the
Dow
ntow
n C
ore.
Lo
s Gat
os B
oule
vard
is a
mix
of c
omm
unity
shop
ping
cen
ters
, aut
o de
aler
s and
rela
ted
busi
ness
es,
and
free
-sta
ndin
g re
tail
outle
ts.
The
four
larg
est s
hopp
ing
cent
ers a
re e
ach
anch
ored
by
a su
perm
arke
t. L
os G
atos
Bou
leva
rd is
stro
ngly
diff
eren
tiate
d fr
om D
ownt
own
in it
s ret
ail m
ix, w
ith
a m
ore
limite
d nu
mbe
r of s
tore
s car
ryin
g “c
ompa
rison
” go
ods s
uch
as h
ome
furn
ishi
ngs a
nd
appa
rel.
The
re a
re c
onsi
dera
bly
mor
e m
id-s
ize
stor
e sp
aces
, suc
h as
the
supe
rmar
kets
, dru
g st
ores
, an
d th
e ha
rdw
are
stor
e. W
hile
the
Dow
ntow
n co
nfig
urat
ion
allo
ws f
or a
stro
ng p
edes
trian
-orie
nted
ex
perie
nce,
Los
Gat
os B
oule
vard
is g
ener
ally
aut
o-or
ient
ed.
Lo
s Gat
os B
oule
vard
had
taxa
ble
reta
il sa
les o
f app
roxi
mat
ely
$152
mill
ion
in 2
010.
Thi
s is a
st
eep
decl
ine
from
$19
1 m
illio
n in
200
8 (in
flatio
n ad
just
ed),
resu
lting
larg
ely
from
dec
lines
in th
e au
tom
otiv
e se
ctor
, due
to th
e cl
osur
e of
two
maj
or d
eale
rshi
ps.
Taxa
ble
sale
s in
the
auto
mot
ive
sect
or o
n Lo
s Gat
os B
oule
vard
dec
lined
from
$80
mill
ion
in 2
008
to $
57 m
illio
n in
201
0.
Los G
atos
has
four
maj
or n
eigh
borh
ood
cent
ers:
Rin
cona
da C
ente
r, D
owni
ng C
ente
r, W
algr
eens
Sq
uare
, and
Vas
ona
Stat
ion.
The
se c
ente
rs a
re c
onve
nien
ce-o
rient
ed, w
ith a
ncho
rs a
nd o
ther
stor
es
that
larg
ely
serv
e ne
arby
resi
dent
s rat
her t
hat a
ttrac
ting
a re
gion
al c
lient
ele.
Int
eres
tingl
y, th
ese
neig
hbor
hood
cen
ters
are
all
loca
ted
at o
r nea
r the
Tow
n bo
unda
ries,
thus
attr
actin
g sh
oppe
rs fr
om
outs
ide
the
Tow
n si
nce
they
repr
esen
t the
clo
sest
gro
cery
or d
rug
stor
e sh
oppi
ng.
Thes
e ce
nter
s
N
orth
For
ty S
peci
fic P
lan
Mar
ket S
tudy
and
Bus
ines
s Dev
elop
men
t Stra
tegy
Pa
ge 7
3 of
150

com
bine
d ac
coun
ted
for a
ppro
xim
atel
y $3
4 m
illio
n in
taxa
ble
reta
il sa
les i
n 20
10, a
muc
h sm
alle
r pr
opor
tion
than
Dow
ntow
n or
Los
Gat
os B
oule
vard
.
Leak
age
and
Inje
ctio
n A
naly
sis
Ret
ail l
eaka
ge a
nd in
ject
ion
anal
ysis
com
pare
s act
ual r
etai
l sal
es in
an
area
with
som
e be
nchm
ark
that
pro
vide
s a m
easu
re o
f the
pot
entia
l sal
es g
ener
ated
by
that
are
a's re
side
nts.
If sa
les l
evel
s are
be
low
the
pred
icte
d le
vel,
the
area
may
be
able
to su
ppor
t inc
reas
ed sa
les,
eith
er th
roug
h th
e op
enin
g of
new
out
lets
targ
etin
g th
ose
leak
ages
or a
repo
sitio
ning
of e
xist
ing
outle
ts th
roug
h ch
ange
s in
stra
tegy
and
mar
ketin
g, m
erch
andi
se m
ix, o
r sto
re c
onfig
urat
ion
such
that
they
cou
ld
capt
ure
a po
rtion
of t
hat l
eaka
ge.
Lo
s G
atos
W
ith it
s hig
h pe
r cap
ita sa
les l
evel
s, Lo
s Gat
os sh
ows i
njec
tions
of s
ales
in m
ost m
ajor
stor
e ca
tego
ries.
Inje
ctio
ns a
re p
artic
ular
ly h
igh
for f
ood
and
beve
rage
stor
es, m
otor
veh
icle
and
par
ts
deal
ers,
food
serv
ices
(whi
ch in
clud
es re
stau
rant
s), a
nd h
ealth
and
per
sona
l car
e st
ores
. Tw
o ca
tego
ries,
build
ing
mat
eria
ls a
nd g
ener
al m
erch
andi
se st
ores
, sta
nd o
ut fo
r the
ir su
bsta
ntia
l le
akag
es; o
ver h
alf o
f pot
entia
l res
iden
t exp
endi
ture
s in
the
build
ing
mat
eria
ls c
ateg
ory
are
leak
ing
out o
f Los
Gat
os, a
nd n
early
all
resi
dent
exp
endi
ture
s for
gen
eral
mer
chan
dise
stor
es a
ppea
r to
be
leak
ing
out o
f Los
Gat
os.
The
lack
of s
ales
in g
ener
al m
erch
andi
se st
ores
is d
ue to
the
near
or
com
plet
e ab
senc
e of
such
stor
es in
Los
Gat
os.
For t
he b
uild
ing
mat
eria
ls g
roup
, the
re a
re se
vera
l ou
tlets
incl
udin
g tw
o ha
rdw
are
stor
es, b
ut th
e To
wn
does
not
hav
e a
larg
e ho
me
impr
ovem
ent s
tore
su
ch a
s Hom
e D
epot
or a
n in
depe
nden
t lum
ber y
ard.
Ove
rall,
the
anal
ysis
indi
cate
s tha
t by
maj
or
stor
e ca
tego
ry, L
os G
atos
has
est
imat
ed c
ombi
ned
inje
ctio
ns o
f nea
rly $
320
mill
ion
in re
tail
sale
s an
nual
ly, a
nd c
ombi
ned
estim
ated
leak
ages
of a
ppro
xim
atel
y $8
0 m
illio
n an
nual
ly.
Th
e hi
gh le
vel o
f inj
ectio
ns o
f sal
es fo
r foo
d an
d be
vera
ge st
ores
and
for h
ealth
and
per
sona
l car
e st
ores
is p
artic
ular
ly n
otew
orth
y, si
nce
groc
erie
s and
dru
g st
ore
item
s are
con
veni
ence
goo
ds th
at
are
usua
lly p
urch
ased
loca
lly.
To so
me
exte
nt, t
his i
s due
to th
e lo
catio
n of
the
stor
es in
Los
Gat
os,
ofte
n in
cen
ters
nea
r the
bou
ndar
ies o
f the
Tow
n. F
urth
erm
ore,
the
two
neig
hbor
ing
citie
s of
Sara
toga
and
esp
ecia
lly M
onte
Ser
eno
and
the
unin
corp
orat
ed a
reas
to th
e so
uth
of T
own
have
lim
ited
reta
il of
ferin
gs, w
ith L
os G
atos
off
erin
g th
e cl
oses
t eve
ryda
y sh
oppi
ng fo
r som
e of
thei
r re
side
nts.
O
ne a
dditi
onal
key
fact
or is
that
one
out
let w
ith e
xtre
mel
y st
rong
sale
s can
mas
k po
or p
erfo
rman
ce
by th
e re
st o
f tha
t sto
re c
ateg
ory.
For
exa
mpl
e, in
Los
Gat
os th
e ho
me
furn
ishi
ngs a
nd a
pplia
nces
ca
tego
ry is
dom
inat
ed b
y sa
les i
n th
e A
pple
Sto
re.
This
stor
e’s e
xtre
mel
y st
rong
sale
s are
mas
king
lim
ited
sale
s acr
oss t
he re
mai
nder
of t
he c
ateg
ory.
R
etai
l Tra
de A
rea
For t
he la
rger
RTA
, the
leve
ls o
f lea
kage
s and
inje
ctio
ns a
ppea
r to
be m
uch
low
er o
n a
per c
apita
ba
sis,
indi
catin
g a
rela
tive
bala
nce
betw
een
reta
il sa
les a
nd re
side
nt e
xpen
ditu
res i
n m
ost
Nor
th F
orty
Spe
cific
Pla
n M
arke
t Stu
dy a
nd B
usin
ess D
evel
opm
ent S
trate
gy
Page
74
of 1
50
cate
gorie
s. E
ven
thou
gh th
e R
TA is
muc
h m
ore
popu
lous
than
the
Tow
n, e
stim
ated
com
bine
d in
ject
ions
are
low
er, a
t app
roxi
mat
ely
$230
mill
ion
annu
ally
, and
are
con
cent
rate
d in
aut
o-re
late
d re
tail.
The
com
bine
d le
akag
es a
re g
reat
er, a
t nea
rly $
590
mill
ion
annu
ally
, but
are
spre
ad a
cros
s a
num
ber o
f cat
egor
ies,
with
the
larg
est l
eaka
ges i
n th
e ge
nera
l mer
chan
dise
stor
e ca
tego
ry.
C
ompa
rativ
e R
etai
l Sal
es b
y D
etai
led
Stor
e C
ateg
ory
The
anal
ysis
dril
led
dow
n to
mor
e de
taile
d st
ore
type
s, co
mpa
ring
annu
al p
er c
apita
sale
s for
Los
G
atos
and
the
RTA
with
San
ta C
lara
Cou
nty
and
the
Stat
e by
det
aile
d N
AIC
S su
bcat
egor
y. T
his
com
paris
on h
ighl
ight
s the
subc
ateg
orie
s tha
t mig
ht re
pres
ent s
ome
of th
e be
tter o
ppor
tuni
ties t
o ex
pand
reta
il in
the
Tow
n. S
peci
fic st
ore
type
s tha
t app
ear t
o be
lack
ing
in sa
les i
n th
e To
wn
incl
ude
appl
ianc
e st
ores
, and
spec
ialty
food
stor
es su
ch a
s mea
t mar
kets
, fis
h an
d se
afoo
d m
arke
ts,
and
prod
uce
mar
kets
. Th
e sa
les i
njec
tions
for c
loth
ing
and
clot
hing
acc
esso
ries s
tore
s ref
lect
s an
over
all s
treng
th, b
ut th
e ap
pare
l sto
res i
n th
e To
wn
tend
to b
e hi
gh-e
nd st
ores
, not
nec
essa
rily
carr
ying
the
type
s of i
nexp
ensi
ve e
very
day
appa
rel m
ore
com
mon
ly fo
und
in m
any
gene
ral
mer
chan
dise
stor
es.
The
per c
apita
boo
k st
ore
sale
s for
the
Tow
n do
not
take
into
acc
ount
the
rece
nt c
losu
re o
f Bor
ders
; whi
le th
ere
mig
ht n
ow b
e an
opp
ortu
nity
for a
smal
ler,
inde
pend
ent
book
stor
e in
Los
Gat
os, t
his s
ubca
tego
ry h
as b
een
serio
usly
impa
cted
by
onlin
e sa
les a
nd n
ow b
y e-
read
ers,
whi
ch m
ay a
ffec
t the
pot
entia
l lon
g-te
rm v
iabi
lity
of su
ch a
stor
e.
As n
oted
pre
viou
sly,
Los
Gat
os is
alm
ost e
ntire
ly la
ckin
g in
all
cate
gorie
s of g
ener
al m
erch
andi
se
stor
es, a
nd a
s a re
sult
has a
lmos
t no
sale
s in
this
cat
egor
y. W
hile
som
e of
thes
e sa
les m
ay b
e oc
curr
ing
in o
ther
type
s of o
utle
ts su
ch a
s dru
g st
ores
, thi
s cat
egor
y ov
eral
l rep
rese
nts a
subs
tant
ial
gap
in th
e re
tail
mix
in th
e To
wn.
Po
tent
ial f
or N
ew R
etai
l Dev
elop
men
t in
Los
Gat
os
Los G
atos
has
a v
ery
stro
ng re
tail
sect
or, e
ven
taki
ng in
to a
ccou
nt th
e de
clin
e in
aut
o sa
les o
ver t
he
last
dec
ade.
The
Dow
ntow
n, w
hile
impa
cted
by
regi
onal
and
nat
iona
l eco
nom
ic tr
ends
, has
re
mai
ned
a st
rong
reta
il de
stin
atio
n, b
ringi
ng in
shop
pers
from
out
side
the
Tow
n. T
he T
own
is
unus
ual i
n th
at it
als
o at
tract
s sho
pper
s for
eve
ryda
y ite
ms s
uch
as g
roce
ries,
due
in p
art t
o th
e lo
catio
n of
supe
rmar
kets
and
dru
gsto
res n
ear t
he e
dges
of T
own
and
in p
art d
ue to
the
lack
of
shop
ping
in M
onte
Ser
eno,
Sar
atog
a an
d ot
her n
earb
y un
inco
rpor
ated
are
as.
Th
e le
akag
e an
alys
is sh
ows t
hat t
he T
own
is lo
sing
reta
il sa
les i
n th
e ge
nera
l mer
chan
dise
stor
e an
d bu
ildin
g m
ater
ials
stor
e ca
tego
ries t
o ot
her r
etai
l out
lets
. Th
ese
leak
ages
are
due
larg
ely
to th
e la
ck
of la
rge-
form
at st
ores
in th
ese
cate
gorie
s in
Los G
atos
. In
par
ticul
ar, t
here
are
alm
ost n
o sa
les i
n To
wn
in th
e ge
nera
l mer
chan
dise
stor
e ca
tego
ry.
Ther
e ar
e sa
les i
n th
e bu
ildin
g m
ater
ials
cat
egor
y,
as th
ere
are
two
hard
war
e st
ores
and
seve
ral o
ther
out
lets
in T
own
in th
is c
ateg
ory,
but
ther
e is
not
a
hom
e im
prov
emen
t cen
ter s
uch
as H
ome
Dep
ot o
r Low
e’s.
Add
ition
ally
, the
Tow
n ha
s lim
ited
optio
ns fo
r app
lianc
es a
nd c
onsu
mer
ele
ctro
nics
; the
App
le S
tore
, whi
le e
xtre
mel
y su
cces
sful
, pr
ovid
es a
lim
ited
rang
e of
item
s lar
gely
from
one
man
ufac
ture
r.
N
orth
For
ty S
peci
fic P
lan
Mar
ket S
tudy
and
Bus
ines
s Dev
elop
men
t Stra
tegy
Pa
ge 7
5 of
150

Giv
en th
e To
wn’
s alre
ady-
stro
ng a
ttrac
tion
as a
food
shop
ping
des
tinat
ion
and
dem
ogra
phic
pr
ofile
, the
lack
of s
peci
alty
food
stor
es m
ay a
lso
repr
esen
t an
oppo
rtuni
ty to
bro
aden
the
food
re
taili
ng m
ix a
nd e
nhan
ce th
e To
wn’
s stro
ng p
ositi
on fo
r thi
s ret
ail c
ateg
ory.
Whi
le sp
ecia
lty fo
od
stor
es m
ight
cap
ture
som
e sa
les g
oing
to th
e su
perm
arke
ts, t
hey
coul
d al
so c
reat
e a
syne
rgy
that
at
tract
s mor
e fo
od sh
oppe
rs to
the
Tow
n. F
or e
xam
ple,
in th
e R
ockr
idge
nei
ghbo
rhoo
d in
Nor
th
Oak
land
, a T
rade
r Joe
’s c
an b
e fo
und
in c
lose
pro
xim
ity to
Mar
ket H
all w
ith it
s mix
of s
peci
alty
fo
od v
endo
rs in
clud
ing
a pr
oduc
e st
ore,
a m
eat c
ount
er, a
seaf
ood
coun
ter,
and
a pa
sta
shop
. Sa
few
ay a
lso
has a
stor
e ne
ar M
arke
t Hal
l, w
ith p
lans
for e
xpan
sion
. A
cros
s fro
m th
e Sa
few
ay a
re
a st
anda
lone
but
cher
shop
and
ano
ther
pro
duce
mar
ket.
In B
erke
ley,
ther
e ar
e se
vera
l spe
cial
ty
food
stor
es c
lust
ered
nea
r the
Mon
tere
y M
arke
t on
Hop
kins
Stre
et.
To
som
e ex
tent
, the
leak
ages
refle
ct th
e To
wn’
s des
ire to
reta
in a
smal
l-tow
n fe
el, w
ith sm
alle
r sh
ops a
nd in
the
Dow
ntow
n C
ore,
lim
ited
form
ula
reta
il. A
s a re
sult,
ther
e ar
e fe
w re
tail
spac
es in
Lo
s Gat
os o
f app
roxi
mat
ely
10,0
00 sq
uare
feet
or m
ore
that
are
ava
ilabl
e to
acc
omm
odat
e la
rger
us
ers s
uch
as a
pplia
nce
stor
es, h
ome
impr
ovem
ent s
tore
s, or
gen
eral
mer
chan
dise
stor
es.
Whi
le th
e To
wn
will
dou
btle
ss se
ek to
reta
in it
s cha
ract
er, a
ppro
pria
tely
des
igne
d de
velo
pmen
t at t
he N
orth
40
site
may
pre
sent
an
oppo
rtuni
ty to
pro
vide
reta
il sp
ace
for l
arge
r use
rs th
at m
ight
com
plem
ent
the
exis
ting
reta
il m
ix in
Los
Gat
os.
Nor
th F
orty
Spe
cific
Pla
n M
arke
t Stu
dy a
nd B
usin
ess D
evel
opm
ent S
trate
gy
Page
76
of 1
50

Off
ice
Ma
rke
t A
ss
es
sm
en
t Th
e pu
rpos
e of
this
sect
ion
is to
off
er a
n ov
ervi
ew o
f the
loca
l off
ice
mar
ket a
nd id
entif
y po
tent
ial
oppo
rtuni
ties f
or fu
rther
eva
luat
ion
as p
art o
f the
Nor
th 4
0 Sp
ecifi
c Pl
an p
roce
ss.
Cur
rent
and
hi
stor
ical
dat
a ar
e pr
ovid
ed in
ord
er to
reve
al h
ow th
e lo
cal o
ffic
e m
arke
t has
per
form
ed o
ver t
he
cour
se o
f the
mos
t rec
ent e
cono
mic
cyc
le a
nd su
gges
t whe
re th
e m
arke
t is h
eadi
ng.
In a
dditi
on,
this
sect
ion
cons
ider
s em
ploy
men
t tre
nds i
n Sa
nta
Cla
ra C
ount
y—co
mbi
ning
his
toric
al d
ata
and
futu
re p
roje
ctio
ns—
in o
rder
to d
eter
min
e th
e po
tent
ial d
eman
d fo
r new
off
ice
spac
e. A
n ex
haus
tive
list o
f pro
ject
s cur
rent
ly in
the
deve
lopm
ent p
ipel
ine
is p
rovi
ded
in o
rder
to d
eter
min
e w
heth
er fu
ture
con
stru
ctio
n w
ill a
bsor
b an
y an
d al
l pot
entia
l dem
and,
or w
heth
er th
ere
will
rem
ain
resi
dual
dem
and
that
may
supp
ort o
ffic
e us
e as
one
com
pone
nt o
f the
Nor
th 4
0 de
velo
pmen
t pr
ogra
m.
Offi
ce In
vent
ory
As s
how
n in
Tab
le 2
0, th
e To
wn
had
appr
oxim
atel
y 1.
4 m
illio
n sq
uare
feet
of o
ffic
e sp
ace
at th
e en
d of
the
first
qua
rter 2
011,
acc
ordi
ng to
dat
a fu
rnis
hed
by C
orni
sh &
Car
ey C
omm
erci
al
New
mar
k K
nigh
t Fra
nk.
This
repr
esen
ts a
bout
12
perc
ent o
f the
11.
7 m
illio
n sq
uare
feet
of o
ffic
e sp
ace
in th
e M
arke
t Are
a bu
t onl
y a
frac
tion
of th
e So
uth
Bay
inve
ntor
y of
61.
6 m
illio
n sq
uare
feet
(2
.2 p
erce
nt).
A re
pres
enta
tive
of C
orni
sh &
Car
ey c
onta
cted
by
BA
E in
dica
ted
that
mos
t of t
he
Tow
n’s o
ffic
e in
vent
ory
is c
ompr
ised
of C
lass
C a
nd B
bui
ldin
gs a
nd th
at d
ue to
the
age
and
floor
pl
ate
conf
igur
atio
n of
the
Tow
n’s e
xist
ing
build
ings
it is
diff
icul
t to
find
spac
e in
the
75,0
00 to
10
0,00
0 sq
uare
foot
rang
e in
Cla
ss A
bui
ldin
gs.
Offi
ce M
arke
t Tre
nds
Figu
re 1
3 ch
arts
the
fluct
uatio
ns o
f bot
h av
erag
e as
king
rent
s and
vac
ancy
rate
s in
Los G
atos
, the
M
arke
t Are
a, a
nd th
e en
tire
Sout
h B
ay o
ver t
he la
st fi
ve y
ears
.35 A
s sho
wn,
vac
ancy
rate
s in
crea
sed
in b
oth
Los G
atos
and
the
Mar
ket A
rea
betw
een
2006
and
200
9, ri
sing
fast
er a
t the
ons
of th
e G
reat
Rec
essi
on in
200
8/20
09.
Like
wis
e, a
fter d
eclin
ing
at th
e on
set o
f the
stud
y pe
riod,
va
canc
y th
roug
hout
the
Sout
h B
ay sp
iked
in
et
201
0.
Star
ting
in 2
010
vaca
ncy
rate
s dec
lined
in L
os G
atos
and
the
Mar
ket A
rea
and
fell
shar
ply
in th
e fir
st q
uarte
r of 2
011.
Acr
oss t
he S
outh
Bay
, vac
anci
es re
mai
ned
high
unt
il th
e en
d of
the
first
qu
arte
r 201
1 w
hen
leas
ing
activ
ity p
icke
d up
to re
duce
vac
ancy
rate
s. T
he sh
ift in
vac
ancy
rate
s ge
nera
lly re
flect
s an
incr
ease
in te
chno
logy
and
tech
nolo
gy-r
elat
ed le
asin
g. D
espi
te re
cent
gai
ns,
vaca
ncy
rate
s in
Los G
atos
, the
Mar
ket A
rea,
and
Sou
th B
ay a
re st
ill m
arke
dly
high
er a
t the
end
of
the
deca
de th
an th
ey w
ere
in th
e m
iddl
e. T
rend
s ove
r the
last
five
yea
rs in
dica
te th
at L
os G
atos
35
Acc
ordi
ng to
Cor
nish
& C
arey
Com
mer
cial
New
mar
k K
nigh
t Fra
nk’s
form
ulat
ion,
the
Sout
h B
ay c
onsi
sts o
f C
ampb
ell,
Cup
ertin
o, L
os G
atos
, Milp
itas,
Mou
ntai
n V
iew
, San
ta C
lara
, San
Jose
, Sar
atog
a, a
nd S
unny
vale
. It
excl
udes
Pal
o A
lto.
N
orth
For
ty S
peci
fic P
lan
Mar
ket S
tudy
and
Bus
ines
s Dev
elop
men
t Stra
tegy
Pa
ge 7
7 of
150

tend
s to
expe
rienc
e sl
ight
ly lo
wer
leve
ls o
f vac
ancy
than
the
Mar
ket A
rea,
whi
ch it
self
feat
ures
su
bsta
ntia
lly lo
wer
vac
ancy
than
the
regi
on.
The
Tow
n’s p
erfo
rman
ce m
ay b
e at
tribu
ted
to
med
ical
off
ice
tena
nts t
hat t
end
to b
e st
able
dur
ing
rece
ssio
ns a
s wel
l as d
eman
d by
bus
ines
s ow
ners
and
exe
cutiv
es th
at se
ek a
n of
fice
loca
tion
clos
e to
thei
r res
iden
ce.
A
ll th
ree
geog
raph
ies s
aw a
n in
crea
se in
ave
rage
ask
ing
rent
s bet
wee
n 20
06 a
nd 2
008.
Ren
ts
bega
n to
bac
kslid
e th
erea
fter d
urin
g th
e G
reat
Rec
essi
on, a
lbei
t at a
diff
eren
t rat
e de
pend
ing
on
geog
raph
y. A
s of t
he e
nd o
f firs
t qua
rter o
f 201
1, a
skin
g re
nts i
n Lo
s Gat
os w
ere
low
er th
an th
ey
wer
e in
200
6, m
arki
ng a
rela
tivel
y sw
ift ra
te o
f dec
line
afte
r pea
king
abo
ve $
3.00
in 2
008.
By
cont
rast
, ave
rage
ask
ing
rent
s in
the
Mar
ket A
rea
and
Sout
h B
ay d
eclin
ed m
ore
slow
ly, c
ausi
ng th
e pe
rfor
man
ce g
ap b
etw
een
Los G
atos
and
surr
ound
ing
subm
arke
ts to
nar
row
.
Figu
re 1
3: A
vera
ge A
skin
g R
ent a
nd V
acan
cy R
ate,
Los
Gat
os v
s. M
arke
t Are
a vs
. Sou
th
Bay
, 200
6-Q
1 20
11 (a
)
$0.0
0
$0.5
0
$1.0
0
$1.5
0
$2.0
0
$2.5
0
$3.0
0
$3.5
0
2006
2007
2008
2009
2010
Q1-
2011
Average Asking Rent (full svc.
0%3%6%9%12%
15%
18%
21%
Vacancy Rate
Los
Gat
os V
acan
cyM
arke
t Are
a Va
canc
ySo
uth
Bay
Vaca
ncy
(a)
Los
Gat
os R
ent
Mar
ket A
rea
Rent
Sout
h Ba
y Re
nt (a
)
Not
e:
(a) T
he S
outh
Bay
offi
ce m
arke
t inc
lude
s C
ampb
ell,
Cup
ertin
o, L
os G
atos
, Milp
itas,
Mou
ntai
n V
iew
, San
ta C
lara
, San
Jose
, Sar
atog
a, a
nd S
unny
vale
. It
excl
udes
Pal
o A
lto.
Sou
rces
: Cor
nish
& C
arey
Com
mer
cial
New
mar
k K
nigh
t Fra
nk, 2
005-
2010
; BA
E, 2
011.
Ta
ble
20 p
rovi
des a
mor
e de
taile
d ov
ervi
ew o
f mar
ket c
ondi
tions
as o
f the
firs
t qua
rter o
f 201
1.
The
snap
shot
pro
vide
d re
veal
s tha
t at p
rese
nt, r
egio
nal v
acan
cy ra
tes a
re c
ontin
uing
to d
eclin
e,
fuel
ed su
bsta
ntia
lly b
y po
sitiv
e ne
t abs
orpt
ion
in C
uper
tino
whe
re A
pple
Com
pute
r Inc
. is
Nor
th F
orty
Spe
cific
Pla
n M
arke
t Stu
dy a
nd B
usin
ess D
evel
opm
ent S
trate
gy
Page
78
of 1
50

head
quar
tere
d. T
he S
outh
Bay
has
seen
subs
tant
ial n
et a
bsor
ptio
n (a
ppro
xim
atel
y 76
3,00
0 sq
uare
fe
et) i
n th
e fir
st q
uarte
r of 2
011,
acc
ount
ed fo
r by
larg
e bl
ocks
of s
pace
at M
offe
tt To
wer
s in
Sunn
yval
e be
ing
leas
ed to
tech
nolo
gy c
ompa
nies
. O
n th
e w
hole
, ask
ing
rent
s in
the
Mar
ket A
rea
are
cont
inui
ng to
slid
e, th
ough
ask
ing
rent
s are
clim
bing
, slig
htly
, in
Los G
atos
.36 T
here
fore
, the
lo
cal o
ffic
e m
arke
t is s
how
ing
som
e si
gns o
f rec
over
y, p
artic
ular
ly in
Los
Gat
os.
Tabl
e 20
: Offi
ce M
arke
t Ove
rvie
w, S
outh
Bay
, Fou
rth
Qua
rter
201
1 (a
)
Ove
rall
Net
Abs
orpt
ion
Avg.
Ask
ing
Offi
ce M
arke
tIn
vent
ory
(sf)
Vaca
ncy
Rat
eQ
4 20
10-Q
1 20
11R
ent (
$/sf
) (b)
Los
Gat
os1,
368,
790
8.8%
(64)
$2.5
8M
arke
t Are
a11
,745
,205
9.3%
52,6
72$2
.39
Cam
pbel
l2,
267,
022
16.7
%(1
9,01
9)$2
.19
Cup
ertin
o4,
054,
170
7.9%
34,7
54$2
.85
Los
Gat
osse
e ab
ove
Sar
atog
a32
3,12
89.
9%1,
686
$2.6
7W
est S
an J
ose
(c)
3,73
2,09
56.
5%35
,315
$1.9
1S
outh
Bay
(a)
61,6
17,1
1516
.6%
762,
961
$2.4
8
Not
es:
(a) T
he S
outh
Bay
offi
ce m
arke
t inc
lude
s C
ampb
ell,
Cup
ertin
o, L
os G
atos
, Milp
itas,
Mou
ntai
n V
iew
, San
Jos
e, S
anta
Cla
ra, S
arat
oga,
and
Sun
nyva
le.
It ex
clud
es P
alo
Alto
.(b
) Offi
ce re
nts
are
full
serv
ice.
(c) D
ata
prov
ider
trac
ks o
ffice
sub
mar
ket c
ondi
tions
in W
est S
an J
ose,
whi
ch fa
lls w
holly
insi
deth
e M
arke
t Are
a.
Sou
rces
: Cor
nish
& C
arey
Com
mer
cial
New
mar
k K
nigh
t Fra
nk; B
AE
, 201
1.
In su
m, a
t the
pea
k of
an
econ
omic
cyc
le, w
hen
offic
e sp
ace
is in
hig
h de
man
d, L
os G
atos
ou
tper
form
s bot
h th
e M
arke
t Are
a an
d So
uth
Bay
with
low
er v
acan
cies
and
hig
her r
ents
. A
t the
tro
ugh
of th
e cy
cle,
how
ever
, whi
le L
os G
atos
mai
ntai
ns a
bove
-ave
rage
occ
upan
cy, r
enta
l rat
es
conv
erge
with
the
regi
onal
ave
rage
. A
s the
loca
l eco
nom
y re
cove
rs, i
t rem
ains
to b
e se
en w
heth
er
this
pat
tern
will
reem
erge
, cau
sing
off
ice
rent
s in
Los G
atos
to ri
se a
bove
com
petin
g su
bmar
kets
, on
ce a
gain
. To
just
ify n
ew sp
ecul
ativ
e C
lass
A, s
teel
fram
e co
nstru
ctio
n, re
nts w
ould
nee
d to
rise
to
abo
ve $
3.25
to $
3.50
per
squa
re fo
ot o
n a
full
serv
ice
basi
s –th
is re
ntal
rang
e re
flect
s the
rent
re
quire
d to
mak
e a
new
off
ice
proj
ect f
inan
cial
ly fe
asib
le.
36
“A
skin
g re
nt”
refe
rs to
the
liste
d re
ntal
rate
and
doe
s not
refle
ct th
e ac
tual
con
tract
rate
that
a la
ndlo
rd a
nd
tena
nt a
gree
to in
an
exec
uted
leas
e; a
skin
g re
nts t
end
to b
e so
mew
hat h
ighe
r tha
n ac
tual
con
tract
rent
s.
N
orth
For
ty S
peci
fic P
lan
Mar
ket S
tudy
and
Bus
ines
s Dev
elop
men
t Stra
tegy
Pa
ge 7
9 of
150

Offi
ce E
mpl
oym
ent T
rend
s A
s dis
cuss
ed in
the
Dem
ogra
phic
and
Eco
nom
ic O
verv
iew
sect
ion
abov
e, S
anta
Cla
ra C
ount
y un
derw
ent t
wo
maj
or e
cono
mic
cyc
les o
ver t
he c
ours
e of
the
last
dec
ade:
the
Inte
rnet
Boo
m th
at
peak
ed in
200
0 an
d th
e cr
edit-
led
expa
nsio
n fr
om 2
004
thro
ugh
2007
. Th
roug
hout
this
tum
ultu
ous
perio
d, h
owev
er, t
he u
nem
ploy
men
t rat
e in
Los
Gat
os re
mai
ned
cons
iste
ntly
low
er th
an in
the
rest
of
the
Cou
nty.
As o
f Mar
ch 2
011,
une
mpl
oym
ent i
n Lo
s Gat
os w
as u
nder
seve
n pe
rcen
t, as
op
pose
d to
ove
r ten
per
cent
in th
e C
ount
y as
a w
hole
, and
app
eare
d to
be
on th
e de
clin
e in
bot
h th
e m
icro
- and
mac
ro-r
egio
ns (S
ee F
igur
e 4
in th
e D
emog
raph
ic &
Eco
nom
ic O
verv
iew
cha
pter
). D
urin
g th
e m
ost r
ecen
t boo
m/b
ust (
2004
to p
rese
nt),
tota
l em
ploy
men
t with
in th
e Sa
n Jo
se-
Sunn
yval
e-Sa
nta
Cla
ra M
etro
polit
an S
tatis
tical
Are
a bo
ttom
ed o
ut a
t abo
ut th
e sa
me
leve
l at
whi
ch it
beg
an.
How
ever
, the
ove
rall
bala
nce
of th
e cy
cle
obsc
ures
diff
eren
tial t
rend
s by
indu
stry
. A
few
sect
ors u
nder
wen
t ste
ady
incr
ease
s in
empl
oym
ent,
even
gro
win
g am
idst
the
mar
ket
dow
ntow
n be
twee
n 20
08 a
nd 2
010,
incl
udin
g: In
form
atio
n (4
6 pe
rcen
t); E
duca
tiona
l Ser
vice
s (25
pe
rcen
t); a
nd H
ealth
Car
e &
Soc
ial A
ssis
tanc
e (2
0 pe
rcen
t). I
n ad
ditio
n, jo
bs in
Pro
fess
iona
l, Sc
ient
ific
& T
echn
ical
Ser
vice
s gre
w b
y se
ven
perc
ent o
ver t
he c
ours
e of
the
cycl
e, d
espi
te
decl
inin
g so
mew
hat f
rom
thei
r pea
k in
200
8. O
n th
e ot
her h
and,
a fe
w se
ctor
s con
tract
ed ra
pidl
y du
ring
the
bust
, cau
sing
ove
rall
decl
ines
in e
mpl
oym
ent o
ver t
he c
ours
e of
the
cycl
e. S
ever
al o
f th
e se
ctor
s tha
t suf
fere
d th
e w
orst
ove
rall
job
loss
es w
ere
thos
e tie
d to
the
hous
ing
mar
ket,
incl
udin
g: C
onst
ruct
ion
(29
perc
ent);
Rea
l Est
ate
& R
enta
l & L
easi
ng (1
6 pe
rcen
t); a
nd F
inan
ce &
In
sura
nce
(11
perc
ent).
Ta
ble
21 a
ggre
gate
s em
ploy
men
t tre
nds i
nto
two
broa
d ca
tego
ries:
thos
e th
at te
nd to
gen
erat
e de
man
d fo
r off
ice
spac
e an
d th
ose
that
don
’t (s
ee T
able
foot
note
for a
det
aile
d br
eakd
own)
. A
s sh
own,
dur
ing
the
upsw
ing
of th
e la
st c
ycle
(200
4 to
200
8), o
ffic
e em
ploy
men
t gre
w a
t nea
rly
twic
e th
e ra
te o
f non
-off
ice
empl
oym
ent.
Dur
ing
the
bust
that
follo
wed
, off
ice
empl
oym
ent
decl
ined
by
less
than
one
per
cent
, whi
le n
on-o
ffic
e em
ploy
men
t fel
l by
an e
stim
ated
ten
perc
ent.
Th
eref
ore,
des
pite
the
econ
omic
tum
ult,
offic
e de
man
d se
ctor
s add
ed a
n es
timat
ed 2
7,00
0 jo
bs
betw
een
2004
and
Mar
ch 2
011,
whi
le n
on-o
ffic
e se
ctor
s she
d ar
ound
29,
000
jobs
. Th
is tr
end
indi
cate
s a sh
ift o
f tec
hnol
ogy
empl
oym
ent f
rom
trad
ition
al R
&D
to o
ffic
e fu
nctio
ns.
Nor
th F
orty
Spe
cific
Pla
n M
arke
t Stu
dy a
nd B
usin
ess D
evel
opm
ent S
trate
gy
Page
80
of 1
50

Tabl
e 21
: Em
ploy
men
t Tre
nds
by S
ecto
r, Sa
n Jo
se-S
unny
vale
-San
ta C
lara
MSA
, 200
4-M
arch
201
1 (a
)
Empl
oym
ent
% C
hang
e20
08-
2004
-In
dust
ry S
ecto
r20
0420
08M
ar. 2
011
2004
-200
8M
ar. 2
011
Mar
. 201
1To
tal F
arm
Em
ploy
men
t6,
700
6,10
04,
400
-9.0
%-2
7.9%
-34.
3%M
inin
g &
Log
ging
100
300
200
200.
0%-3
3.3%
100.
0%C
onst
ruct
ion
43,0
0044
,200
30,5
002.
8%-3
1.0%
-29.
1%M
anuf
actu
ring
167,
200
168,
000
155,
800
0.5%
-7.3
%-6
.8%
Who
lesa
le T
rade
34,5
0039
,800
35,5
0015
.4%
-10.
8%2.
9%R
etai
l Tra
de82
,900
84,4
0077
,400
1.8%
-8.3
%-6
.6%
Tran
spor
tatio
n, W
areh
ousi
ng &
Util
ities
13,5
0013
,500
11,9
000.
0%-1
1.9%
-11.
9%In
form
atio
n32
,600
42,3
0047
,500
29.8
%12
.3%
45.7
%Fi
nanc
e &
Insu
ranc
e20
,500
19,9
0018
,200
-2.9
%-8
.5%
-11.
2%R
eal E
stat
e &
Ren
tal &
Lea
sing
14,7
0014
,400
12,4
00-2
.0%
-13.
9%-1
5.6%
Pro
fess
iona
l, S
cien
tific
& T
echn
ical
Ser
vice
s10
0,90
011
4,00
010
7,80
013
.0%
-5.4
%6.
8%M
anag
emen
t of C
ompa
nies
& E
nter
pris
es12
,100
9,70
09,
800
-19.
8%1.
0%-1
9.0%
Adm
inis
trativ
e &
Sup
port
& W
aste
Ser
vice
s52
,600
55,2
0048
,000
4.9%
-13.
0%-8
.7%
Edu
catio
nal S
ervi
ces
28,4
0033
,000
35,5
0016
.2%
7.6%
25.0
%H
ealth
Car
e &
Soc
ial A
ssis
tanc
e66
,800
75,2
0080
,300
12.6
%6.
8%20
.2%
Leis
ure
& H
ospi
talit
y70
,900
78,1
0072
,800
10.2
%-6
.8%
2.7%
Oth
er S
ervi
ces
25,0
0025
,400
25,2
001.
6%-0
.8%
0.8%
Gov
ernm
ent
96,3
0097
,800
94,1
001.
6%-3
.8%
-2.3
%To
tal (
b)86
8,70
092
1,00
086
7,30
06.
0%-5
.8%
-0.2
%
Offi
ce D
eman
d Se
ctor
s (c
)34
9,05
037
8,80
037
6,50
08.
5%-0
.6%
7.9%
Non
-Offi
ce S
ecto
rs51
9,65
054
2,20
049
0,80
04.
3%-9
.5%
-5.6
%
Not
es:
(a) T
he S
an J
ose-
Sun
nyva
le-S
anta
Cla
ra M
SA
was
use
d in
stea
d of
San
ta C
lara
Cou
nty
beca
use
mor
e up
-to-d
ate
info
rmat
ion
was
ava
ilabl
e fo
r the
MS
A, w
hich
incl
udes
bot
h S
anta
Cla
ra a
nd S
an B
enito
Cou
ntie
s.(b
) Num
bers
may
not
sum
to to
tal d
ue to
roun
ding
erro
r.(c
) Con
sist
s of
thos
e se
ctor
s th
at p
redo
min
antly
gen
erat
e de
man
d fo
r offi
ce s
pace
, inc
ludi
ng: I
nfor
mat
ion;
Fin
ance
&In
sura
nce;
Pro
fess
iona
l, S
cien
tific
& T
echn
ical
Ser
vice
s; M
anag
emen
t of C
ompa
nies
& E
nter
pris
es H
ealth
Car
e &
Soc
ial
Ass
ista
nce;
Gov
ernm
ent;
and
50%
of e
mpl
oym
ent i
n bo
th R
eal E
stat
e &
Ren
tal &
Lea
sing
and
Oth
er S
ervi
ces,
refle
ctin
gth
e fa
ct th
at th
ese
cate
gorie
s co
mbi
nes
offic
e an
d no
n-of
fice
task
s.S
ourc
es: C
alifo
rnia
Em
ploy
men
t Dev
elop
men
t Dep
artm
ent,
2010
; BA
E, 2
011.
N
orth
For
ty S
peci
fic P
lan
Mar
ket S
tudy
and
Bus
ines
s Dev
elop
men
t Stra
tegy
Pa
ge 8
1 of
150

Offi
ce D
eman
d A
naly
sis
The
follo
win
g ta
ble
calc
ulat
es th
e lo
ng-te
rm d
eman
d fo
r new
off
ice
spac
e ba
sed
on th
e A
ssoc
iatio
n of
Bay
Are
a G
over
nmen
ts’ (
AB
AG
) pro
ject
ion
of e
mpl
oym
ent g
row
th b
y br
oad
indu
stry
sect
or b
etw
een
2010
and
203
0. B
y ap
plyi
ng th
e ap
prox
imat
e pe
rcen
tage
of j
obs i
n ea
ch
sect
or th
at ta
ke p
lace
in a
n of
fice
and
a de
man
d fa
ctor
of 2
50 g
ross
squa
re fe
et o
f bui
ldin
g sp
ace
per n
ew j
ob, t
he c
alcu
lato
r est
imat
es h
ow m
uch
offic
e sp
ace
will
be
need
ed in
ord
er to
ac
com
mod
ate
job
grow
th o
ver t
he n
ext t
wen
ty y
ears
. Ta
ble
22: P
roje
cted
Lon
g-Te
rm D
eman
d fo
r Offi
ce S
pace
, Mar
ket A
rea,
201
0-20
30
Pr
ojec
ted
Perc
ent
New
Offi
cePr
ojec
ted
New
Job
sO
ffice
Offi
ceD
eman
dD
eman
d Pe
rIn
dust
ry S
ecto
r20
10-2
030
(a)
Jobs
(b)
Jobs
(sf)
(c)
Year
(sf)
Mar
ket A
rea
(d)
Fina
ncia
l & P
rofe
ssio
nal S
ervi
ces
4,13
074
%3,
039
759,
680
37,9
84H
ealth
, Edu
catio
n &
Rec
reat
iona
l Ser
vice
s4,
850
38%
1,82
645
6,42
622
,821
Oth
er2,
690
53%
1,41
835
4,49
317
,725
Tota
l11
,670
6,28
21,
570,
599
78,5
30
Not
es:
(a) B
ased
on
AB
AG
pro
ject
ions
from
200
9.(b
) Bas
ed o
n B
LS d
ata
rega
rdin
g in
dust
ry e
mpl
oym
ent b
y oc
cupa
tion
in 2
008.
Num
bers
repr
esen
t the
per
cent
age
of
wor
kers
with
in e
ach
indu
stry
that
tend
to la
bor i
n an
offi
ce.
(c) D
eriv
ed b
y ap
plyi
ng th
e nu
mbe
r of n
ew o
ffice
jobs
to 2
50 s
quar
e fe
et, o
r the
est
imat
ed g
ross
squ
are
foot
age
requ
ired
per e
mpl
oyee
with
an
effic
ienc
y fa
ctor
of 9
0%.
(d) A
BA
G d
oes
not p
ublis
h pr
ojec
tions
for s
ub-c
ity a
reas
. Th
eref
ore,
the
Mar
ket A
rea
is tr
eate
d as
the
Tow
n of
Los
G
atos
and
the
Citi
es o
f Mon
te S
eren
o, S
arat
oga,
Cup
ertin
o, a
nd C
ampb
ell,
as w
ell a
s th
eir r
espe
ctiv
e S
pher
es o
f In
fluen
ce.
San
Jos
e is
exc
lude
d in
its
entir
ety
beca
use
the
maj
ority
of t
he c
ity is
loca
ted
outs
ide
of th
e M
arke
t Are
a.S
ourc
es: A
ssoc
iatio
n of
Bay
Are
a G
over
nmen
ts, 2
009;
U.S
. Bur
eau
of L
abor
Sta
tistic
s; B
AE
, 201
1.
As s
how
n, th
e M
arke
t Are
a37 w
ill g
ain
appr
oxim
atel
y 6,
300
new
off
ice
jobs
by
2030
, cre
atin
g a
dem
and
for o
ver 1
.5 m
illio
n gr
oss s
quar
e fe
et o
f off
ice
spac
e, o
r 78,
000
squa
re fe
et p
er y
ear.
H
owev
er, s
ome
of th
at d
eman
d w
ill b
e ab
sorb
ed b
y va
canc
ies i
n ex
istin
g bu
ildin
gs, w
hile
ano
ther
po
rtion
may
be
abso
rbed
by
new
bui
ldin
gs c
onst
ruct
ed e
lsew
here
in th
e M
arke
t Are
a. T
able
23
take
s the
se so
urce
s of c
ompe
titiv
e su
pply
und
er c
onsi
dera
tion
in o
rder
to c
alcu
late
the
proj
ecte
d re
sidu
al d
eman
d fo
r new
off
ice
spac
e, w
hich
cou
ld p
rese
nt a
mar
ket o
ppor
tuni
ty fo
r off
ice
deve
lopm
ent a
t the
Nor
th 4
0.
37 A
BA
G d
oes n
ot p
ublis
h pr
ojec
tions
for s
ub-c
ity a
reas
. Th
eref
ore,
the
Mar
ket A
rea
is tr
eate
d as
the
Tow
n of
Lo
s Gat
os a
nd th
e C
ities
of M
onte
Ser
eno,
Sar
atog
a, C
uper
tino,
and
Cam
pbel
l, as
wel
l as t
heir
resp
ectiv
e Sp
here
s of I
nflu
ence
. Sa
n Jo
se is
exc
lude
d in
its e
ntire
ty b
ecau
se th
e m
ajor
ity o
f the
City
is lo
cate
d ou
tsid
e of
th
e M
arke
t Are
a.
Nor
th F
orty
Spe
cific
Pla
n M
arke
t Stu
dy a
nd B
usin
ess D
evel
opm
ent S
trate
gy
Page
82
of 1
50

Tabl
e 23
: Res
idua
l Dem
and
Cal
cula
tor,
Mar
ket A
rea
Proj
ecte
d D
eman
d fo
r Offi
ce S
pace
, 201
0-20
30 (s
f)1,
570,
599
Vaca
ncy
Vaca
ntEx
istin
g In
vent
ory
and
Vaca
ncy,
1Q
11 (a
)In
vent
ory
(sf)
Rat
e (s
f)In
vent
ory
(sf)
Los
Gat
os1,
368,
790
8.8%
121,
001
Cam
pbel
l2,
267,
022
16.7
%37
8,81
9C
uper
tino
4,05
4,17
07.
9%31
8,25
2S
arat
oga
323,
128
9.9%
31,9
90To
tal
8,01
3,11
085
0,06
2
Cal
cula
tion
of R
esid
ual D
eman
d: 7
% M
arke
t Vac
ancy
v. 1
0% M
arke
t Vac
ancy
(b)
Low
Vac
anc y
Hig
h Va
canc
yC
alcu
late
Exi
stin
g In
vent
ory
Ded
uctio
nV
acan
cy R
ate,
1Q
1110
.6%
10.6
%Le
ss "N
orm
al" V
acan
cy (b
)7.
0%-
10.0
%-
Per
cent
Abs
orba
ble
3.6%
0.6%
Exi
stin
g In
vent
ory
(sf)
8,01
3,11
0x
8,01
3,11
0x
Abso
rbab
le A
vaila
ble
Inve
ntor
y (s
f)28
9,14
548
,751
Cal
cula
te D
educ
tion
for N
ew P
lann
ed a
nd P
ropo
sed
Offi
ce
Exp
ecte
d N
et N
ew O
ffice
(sf)
(c)
613,
770
613,
770
Less
"Nor
mal
" Vac
ancy
(b)
42,9
64-
61,3
77-
Abso
rbab
le N
et N
ew O
ffice
(sf)
570,
806
552,
393
Cal
cula
te N
et R
esid
ual D
eman
dP
roje
cted
Dem
and
for O
ffice
Spa
ce, 2
010-
2030
(sf)
1,57
0,59
91,
570,
599
Less
Abs
orba
ble
Ava
ilabl
e In
vent
ory
(sf)
289,
145
-48
,751
-Le
ss A
bsor
babl
e N
et N
ew O
ffice
(sf)
570,
806
-55
2,39
3-
Res
idua
l Dem
and
(sf)
710,
648
969,
455
Not
es:
(a) W
est S
an J
ose
is e
xclu
ded
in o
rder
to m
atch
the
geog
raph
ies
used
in th
e pr
ojec
ted
offic
e de
man
dca
lcul
ator
(AB
AG
).(b
) It i
s as
sum
ed th
at a
cer
tain
am
ount
of "
norm
al" v
acan
cy w
ill a
lway
s ex
ist.
Bas
ed o
n ob
serv
atio
n of
his
toric
altre
nds,
it is
ass
umed
that
bet
wee
n 7
to 1
0 pe
rcen
t of c
urre
nt a
nd fu
ture
inve
ntor
y w
ill re
mai
n va
cant
.(c
) R
epre
sent
s Ex
pect
ed N
ew O
ffice
Con
stru
ctio
n fro
m T
able
24.
Sou
rces
: Cor
nish
& C
arey
Com
mer
cial
New
mar
k Kn
ight
Fra
nk; B
AE
, 201
1.
A
s of t
he fo
urth
qua
rter o
f 201
0, th
e M
arke
t Are
a fe
atur
ed a
roun
d 93
0,00
0 sq
uare
feet
of v
acan
t in
vent
ory,
am
ount
ing
to a
n 11
.6 p
erce
nt v
acan
cy ra
te (W
est S
an Jo
se w
as e
xclu
ded
from
this
ta
bula
tion
in o
rder
to m
atch
the
avai
labl
e da
ta o
n em
ploy
men
t gro
wth
from
AB
AG
). H
owev
er, n
ot
all o
f thi
s vac
ant s
uppl
y sh
ould
be
cons
ider
ed c
ompe
titiv
e fo
r fut
ure
dem
and
abso
rptio
n. O
ffic
e m
arke
ts n
ever
ach
ieve
100
per
cent
occ
upan
cy.
Ther
efor
e, it
shou
ld b
e as
sum
ed th
at th
ere
will
al
way
s be
a no
rmal
ized
am
ount
of v
acan
cy.
Bas
ed o
n ob
serv
atio
n of
his
toric
al tr
ends
, thi
s ana
lysi
s as
sum
es th
at th
e M
arke
t Are
a w
ill a
lway
s fea
ture
a se
ven
to te
n pe
rcen
t rat
e of
vac
ancy
. A
s suc
h,
Tabl
e 23
pre
sent
s tw
o an
alys
es o
f res
idua
l dem
and:
one
in w
hich
a “
norm
al”
vaca
ncy
rate
of s
even
pe
rcen
t is a
ssum
ed, a
nd o
ne in
whi
ch a
“no
rmal
” va
canc
y ra
te o
f ten
per
cent
is a
ssum
ed.
N
orth
For
ty S
peci
fic P
lan
Mar
ket S
tudy
and
Bus
ines
s Dev
elop
men
t Stra
tegy
Pa
ge 8
3 of
150

Nor
th F
orty
Spe
cific
Pla
n M
arke
t Stu
dy a
nd B
usin
ess D
evel
opm
ent S
trate
gy
Page
84
of 1
50
If th
e m
arke
t exp
erie
nces
a h
igh
dem
and
for o
ffic
e, le
adin
g to
a se
ven
perc
ent n
orm
aliz
ed ra
te o
f va
canc
y, th
en a
roun
d 37
0,00
0 sq
uare
feet
of e
xist
ing
avai
labl
e in
vent
ory
can
be c
onsi
dere
d co
mpe
titiv
e w
ith a
Nor
th 4
0 of
fice
proj
ect.
On
the
othe
r han
d, a
ssum
ing
a te
n pe
rcen
t nor
mal
ized
ra
te, a
roun
d 13
0,00
0 sq
uare
feet
of e
xist
ing
avai
labl
e in
vent
ory
mig
ht c
ompe
te w
ith th
e N
orth
40.
Ei
ther
scen
ario
wou
ld le
ave
the
bulk
of t
he p
roje
cted
1.5
mill
ion
squa
re fe
et o
f dem
and
as re
sidu
al.
Som
e of
that
resi
dual
dem
and,
how
ever
, will
like
ly b
e ca
ptur
ed b
y ot
her n
ew o
ffic
e de
velo
pmen
ts
with
in th
e M
arke
t Are
a. T
able
24
lists
all
offic
e de
velo
pmen
ts c
urre
ntly
und
er c
onst
ruct
ion
or
unde
r pla
nnin
g re
view
in th
e M
arke
t Are
a.38
Whi
le th
ere
are
five
larg
e de
velo
pmen
ts o
r sub
stan
tial
reha
bs u
nder
con
side
ratio
n in
the
vici
nity
, all
but o
ne o
f the
m a
re st
alle
d du
e to
stric
t com
mer
cial
le
ndin
g st
anda
rds a
nd li
nger
ing
econ
omic
unc
erta
inty
(sm
alle
r, ne
ighb
orho
od-s
ervi
ng p
rodu
cts
seem
to b
e m
ovin
g fo
rwar
d). 3
9 Whi
le c
ity o
ffic
ials
pla
n to
pro
vide
con
tinuo
us su
ppor
t to
thes
e la
rger
pro
ject
s, th
eir e
vent
ual r
ealiz
atio
n w
ill b
e tie
d to
the
busi
ness
cyc
le, a
nd it
is th
eref
ore
unkn
own
whe
n an
d if
they
will
com
e on
-line
. To
mov
e fo
rwar
d, th
ese
proj
ect d
evel
oper
s wou
ld
have
to se
cure
eith
er a
sing
le e
nd-u
ser t
enan
t or “
pre-
leas
e” o
ver 5
0 pe
rcen
t of p
ropo
sed
spac
e to
m
ultip
le te
nant
s (e.
g., s
ecur
e bi
ndin
g le
ase
agre
emen
ts fo
r spa
ce to
satis
fy lo
an u
nder
writ
ing
stan
dard
s).
Proj
ects
with
out s
uch
com
mitm
ents
are
refe
rred
as “
spec
ulat
ive”
pro
ject
s and
are
ty
pica
lly d
iffic
ult t
o fin
ance
whe
n cr
edit
cond
ition
s are
tigh
tene
d.
In o
rder
to a
ccou
nt fo
r thi
s unc
erta
inty
, it i
s ass
umed
that
onl
y 50
per
cent
of t
he g
ross
net
new
of
fice
spac
e in
the
deve
lopm
ent p
ipel
ine—
amou
ntin
g to
aro
und
614,
000
squa
re fe
et—
will
be
built
in
a ti
mef
ram
e th
at is
com
petit
ive
with
the
deve
lopm
ent o
f the
Nor
th 4
0. A
ssum
ing,
aga
in, t
hat
seve
n to
ten
perc
ent o
f new
off
ice
cons
truct
ion
will
rem
ain
vaca
nt, t
his l
eave
s som
ewhe
re b
etw
een
698,
000
and
957,
000
squa
re fe
et o
f res
idua
l pro
ject
ed d
eman
d in
the
Mar
ket A
rea.
A
s dis
cuss
ed a
bove
, the
Nor
th 4
0 is
a h
ighl
y de
sira
ble
loca
tion
for m
arqu
ee o
ffic
es.
Hig
hway
s 17
and
85 p
rovi
de e
asy
acce
ss fo
r em
ploy
ees,
as w
ell a
s exc
elle
nt v
isib
ility
with
Sili
con
Val
ley
com
mut
ers,
man
y of
who
m a
re in
dust
ry th
ough
t-lea
ders
and
eng
age
regu
larly
in in
ter-
firm
ne
twor
king
. Th
eref
ore,
it sh
ould
be
assu
med
that
a N
orth
40
offic
e pr
ojec
t wou
ld b
e a
desi
rabl
e pr
oduc
t cap
able
of c
aptu
ring
a co
mpe
titiv
e po
rtion
of r
esid
ual d
eman
d. A
ssum
ing
a 10
to 2
0 pe
rcen
t cap
ture
rate
, the
Nor
th 4
0 co
uld
supp
ort a
nyw
here
from
70,
000
to 1
91,0
00 sq
uare
feet
of
offic
e sp
ace,
mak
ing
offic
e a
pote
ntia
lly st
rate
gic
use
for t
he si
te. 4
0
38
On
June
7, 2
011,
App
le C
ompu
ter I
nc. a
nnou
nced
pla
ns to
dev
elop
a 1
.1 m
illio
n sq
uare
foot
cor
pora
te
cam
pus o
n a
50-a
cre
site
with
exi
stin
g im
prov
emen
ts th
at it
pur
chas
ed in
200
6. A
s of t
he d
ate
of th
is d
raft
repo
rt, n
o su
bmitt
al h
as b
een
mad
e to
the
City
of C
uper
tino.
Hen
ce, n
o in
form
atio
n is
ava
ilabl
e to
inco
rpor
ate
into
the
anal
ysis
rega
rdin
g de
mol
ition
/rete
ntio
n of
exi
stin
g st
ruct
ures
and
new
con
stru
ctio
n (e
.g.,
an e
stim
ate
of
net n
ew sp
ace
to b
e de
velo
ped
on it
s pro
perty
).
39 T
he A
lbrig
ht O
ffic
e R
edev
elop
men
t pro
ject
in L
os G
atos
, whi
ch c
ould
yie
ld a
s muc
h as
550
,000
squa
re fe
et
of n
ew C
lass
A o
ffic
e sp
ace,
is c
urre
ntly
act
ive,
but
the
Tow
n C
ounc
il ha
s yet
to a
ppro
ve th
e re
quire
d re
zoni
ng.
40 T
his e
stim
ate
may
und
erst
ate
dem
and
for n
ew o
ffic
e sp
ace
sinc
e it
does
not
diff
eren
tiate
bet
wee
n C
lass
A
spac
e an
d C
lass
B/C
spac
e. D
eman
d fo
r new
off
ice
spac
e is
typi
cally
for C
lass
A w
hile
ava
ilabl
e in
vent
ory
may
be
prim
arily
com
pose
d of
old
er, l
ess f
unct
iona
l Cla
ss B
and
C p
rope
rties
.

Table 24: Planned and Proposed Office Developments, Market Area, April 2011 Name
Location/Drive TimeDeveloper Size (sf) Est. Timing Comments
Under Construction
San Jose (a)Willow Glen Town Square Office 24,000 office Early 2012 Class A office w/ common amenities over ground-floor retail1104 Lincoln Ave. (14 mins) 0 demo (office) (completion) requires demolition of 9,500 sf of existing retailPaja Investments 24,000 new Class A
Approved (Construction Not Yet Commenced)
Los GatosWalker Medical Building 20,600 office Late 2011 2-story medical office building located between Good14881 National Ave. (1 min) 0 demo (office) (start); see Samaritan Hospital and the North 40; requires the demolition oLee Walker 20,600 new Class A comments two single-family homes; developer in the process of applying
for extension, but hopes to break ground in 2011
15400 Los Gatos Blvd. (1 min) 20,000 office Start date Redevelopment of former auto dealership for 2-story mixed-Developer unknown 0 demo (office) unknown; use structure w/ Class A office above restaurant/retail;
20,000 new Class A see comments developer is not moving forward at the moment; Town hasgranted approval for Planned Development.
55 Los Gatos-Saratoga Rd. (5 mins) 2,000 office Stalled; see Mixed-use structure w/ office and retail and renovation ofPelio & Associates 0 demo comments adjacent 56-room Los Gatos Motor Inn; developer currently
2,000 new Class A in dispute with San Jose Water; project will not move forwarduntil dispute is resolved
Campbell649 Creekside Way (5 mins) 170,000 office Stalled; see 5-story glass office building; developer has received twoSouth Bay Development Co. 0 demo comments extensions; developer intention is to construct when
170,000 new Class A a specific user for the project is identified.
CupertinoMain Street Cupertino 100,000 office Start date 17-acre mixed-use development w/ Class A office, retail, Stevens Creek Blvd. & Finch Ave. (14 mins) 0 demo unknown; athletic club, hotel, and senior housing around 1-acre park; Sand Hill Property Co. 100,000 new Class A see comments EIR outlines several options; final development program is yet
to be determined; City has seen no activity since approvalswere granted in 2009 and believes that developer intends totenant commercial space before commencing construction
North Forty Specific Plan
Market Study and Business Development Strategy
Page 85 of 150
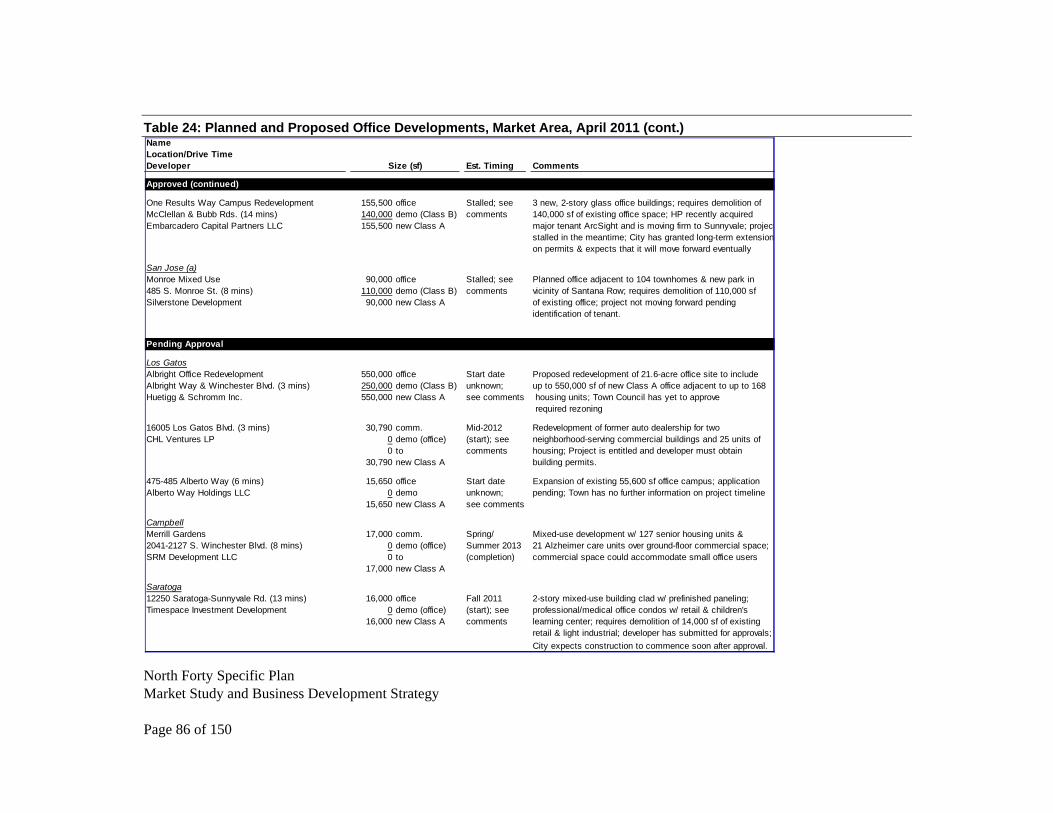
Table 24: Planned and Proposed Office Developments, Market Area, April 2011 (cont.) Name Location/Drive TimeDeveloper Size (sf) Est. Timing Comments
Approved (continued)
One Results Way Campus Redevelopment 155,500 office Stalled; see 3 new, 2-story glass office buildings; requires demolition ofMcClellan & Bubb Rds. (14 mins) 140,000 demo (Class B) comments 140,000 sf of existing office space; HP recently acquiredEmbarcadero Capital Partners LLC 155,500 new Class A major tenant ArcSight and is moving firm to Sunnyvale; project
stalled in the meantime; City has granted long-term extensionon permits & expects that it will move forward eventually
San Jose (a)Monroe Mixed Use 90,000 office Stalled; see Planned office adjacent to 104 townhomes & new park in485 S. Monroe St. (8 mins) 110,000 demo (Class B) comments vicinity of Santana Row; requires demolition of 110,000 sfSilverstone Development 90,000 new Class A of existing office; project not moving forward pending
identification of tenant.
Pending Approval
Los GatosAlbright Office Redevelopment 550,000 office Start date Proposed redevelopment of 21.6-acre office site to includeAlbright Way & Winchester Blvd. (3 mins) 250,000 demo (Class B) unknown; up to 550,000 sf of new Class A office adjacent to up to 168Huetigg & Schromm Inc. 550,000 new Class A see comments housing units; Town Council has yet to approve
required rezoning
16005 Los Gatos Blvd. (3 mins) 30,790 comm. Mid-2012 Redevelopment of former auto dealership for twoCHL Ventures LP 0 demo (office) (start); see neighborhood-serving commercial buildings and 25 units of
0 to comments housing; Project is entitled and developer must obtain30,790 new Class A building permits.
475-485 Alberto Way (6 mins) 15,650 office Start date Expansion of existing 55,600 sf office campus; applicationAlberto Way Holdings LLC 0 demo unknown; pending; Town has no further information on project timeline
15,650 new Class A see comments
CampbellMerrill Gardens 17,000 comm. Spring/ Mixed-use development w/ 127 senior housing units &2041-2127 S. Winchester Blvd. (8 mins) 0 demo (office) Summer 2013 21 Alzheimer care units over ground-floor commercial space;SRM Development LLC 0 to (completion) commercial space could accommodate small office users
17,000 new Class A
Saratoga12250 Saratoga-Sunnyvale Rd. (13 mins) 16,000 office Fall 2011 2-story mixed-use building clad w/ prefinished paneling;Timespace Investment Development 0
North Forty Specific Plan Market Study and Business Development Strategy
demo (office) (start); see professional/medical office condos w/ retail & children's16,000 new Class A comments learning center; requires demolition of 14,000 sf of existing
retail & light industrial; developer has submitted for approvals;City expects construction to commence soon after approval.
Page 86 of 150

North Forty Specific Plan
Market Study and Business Development Strategy
Page 87 of 150
Table 24: Planned and Proposed Office Developments, Market Area, April 2011 (cont.) NameLocation/Drive TimeDeveloper Size (sf) Est. Timing Comments
Pending Approval (continued)
12260 Saratoga-Sunnyvale Rd. (13 mins) 16,000 office Fall 2011 Mixed-use Muslim community center w/ prayer space, retail Muslim Community Group (name unknown) 0 demo (office) (start); see & office; requires demolition of existing light industrial uses
16,000 new Class A comments (sf unknown); City expects developer to submit for approvalssoon & commence construction thereafter; Ancillory office.
Summary
Max. Planned and Proposed Class A Office (sf) (b) 1,227,540Planned Demolition of Class A Space (sf) 0Net New Planned and Proposed Class A Office (sf) 1,227,540Expected % Completed in Competitive Timeframe (c 50% xExpected Net New Class A Office (sf) 613,770
Notes:(a) List of projects in San Jose only includes those with 25,000 sf or more office space.(b) Assumes that all "commercial" space is fully tenanted with office users.(c) Many of these projects face significant hurdles in terms of financial feasibility before they may come to fruition. Therefore, it is assumed that only 50% of thesupply in the pipeline will be completed within a timeframe deemed competitive with prospective office development at the North 40 site.Sources: Silicon Valley/San Jose Business Journal, 2009-2011; Los Gatos Patch; Town of Los Gatos; City of Campbell; City of Cupertino; City of San Jose; City of Saratoga; BAE, 2011.


Ho
tel
Ma
rke
t A
ss
es
sm
en
t Th
e pu
rpos
e of
this
sect
ion
is to
ass
ess t
he p
oten
tial f
or m
arke
t abs
orpt
ion
of a
new
hot
el
deve
lopm
ent a
t the
Nor
th 4
0. T
his a
naly
sis d
raw
s on
perf
orm
ance
dat
a fr
om a
rea
hote
ls p
rovi
ded
by S
mith
Tra
vel R
esea
rch
(STR
) to
reve
al h
ow th
e M
arke
t Are
a pe
rfor
ms i
n re
latio
n to
the
Cou
nty
as a
who
le, a
nd h
ow th
e G
reat
Rec
essi
on h
as a
ffec
ted
that
per
form
ance
. In
add
ition
, thi
s sec
tion
cons
ider
s how
the
site
rela
tes g
eogr
aphi
cally
to k
ey d
eman
d dr
iver
s—su
ch a
s maj
or in
stitu
tions
and
le
isur
e de
stin
atio
ns—
as w
ell a
s com
petin
g pr
oper
ties i
n or
der t
o ju
dge
the
viab
ility
of n
ew h
otel
de
velo
pmen
t. In
sigh
ts fr
om in
terv
iew
s con
duct
ed w
ith k
ey in
form
ants
kno
wle
dgea
ble
abou
t the
lo
cal h
otel
mar
ket a
re p
rovi
ded,
whe
n ap
plic
able
, as w
ell.
Exis
ting
Supp
ly
Tabl
e 25
on
the
follo
win
g pa
ge p
rese
nts a
bre
akdo
wn
of th
e ho
tel r
oom
s in
the
Mar
ket A
rea
and
Sant
a C
lara
Cou
nty
acco
rdin
g to
STR
’s b
rand
cla
ssifi
catio
n sy
stem
.41 A
s sho
wn,
the
Mar
ket A
rea
feat
ures
nea
rly 2
,000
hot
el ro
oms,
or a
roun
d 7.
6 pe
rcen
t of t
he to
tal n
umbe
r of r
oom
s in
the
Cou
nty.
Com
pare
d to
the
Cou
nty,
how
ever
, the
Mar
ket A
rea
feat
ures
an
abov
e-av
erag
e pr
opor
tion
of u
psca
le ro
oms,
refle
ctin
g th
e fa
ct th
at th
e W
est V
alle
y is
com
pris
ed o
f hig
h-en
d re
side
ntia
l co
mm
uniti
es.
Hot
el ro
oms q
ualif
ied
by S
TR a
s “up
scal
e” o
r bet
ter (
incl
udin
g ro
oms a
t upp
er-ti
er
inde
pend
ent p
rope
rties
) acc
ount
for 7
9 pe
rcen
t of s
uppl
y in
the
Mar
ket A
rea,
as c
ompa
red
to
arou
nd 6
8 pe
rcen
t in
the
Cou
nty
as a
who
le.
Inte
rvie
ws w
ith re
pres
enta
tives
of t
he L
os G
atos
Cha
mbe
r of C
omm
erce
indi
cate
that
this
co
ncen
tratio
n to
war
ds st
ylis
h pr
oper
ties w
ith h
igh-
qual
ity a
men
ities
com
plem
ents
the
mai
n de
man
d dr
iver
s for
ove
rnig
ht ro
om st
ays i
n Lo
s Gat
os, w
hich
incl
ude:
• B
usin
ess t
rave
l gen
erat
ed n
ot o
nly
by fi
rms l
ocat
ed in
Los
Gat
os, b
ut a
lso
thos
e lo
cate
d in
dow
ntow
n Sa
n Jo
se a
nd o
ther
are
as o
f cen
tral S
ilico
n V
alle
y;
• Le
isur
e tra
vel r
elat
ed to
shop
ping
and
din
ing
in d
ownt
own
Los G
atos
, as
wel
l as a
rea
win
erie
s; a
nd
• W
eddi
ngs a
nd o
ther
soci
al e
vent
s.
Hot
el L
os G
atos
and
Tol
l Hou
se H
otel
, for
exa
mpl
e, b
oth
feat
ure
upsc
ale
rest
aura
nts a
nd p
rovi
de
acce
ss to
full-
serv
ice
day
spas
. Lo
cate
d ad
jace
nt to
dow
ntow
n Lo
s Gat
os’ u
niqu
e re
tail
envi
ronm
ent a
nd th
e m
any
vine
yard
s in
the
near
by S
anta
Cru
z M
ount
ains
, the
se h
otel
s are
wel
l-po
sitio
ned
to c
aptu
re lu
crat
ive
wee
kend
trav
el.
Furth
er, t
hey
prov
ide
an a
llurin
g al
tern
ativ
e to
ho
tels
loca
ted
in d
ownt
own
San
Jose
or o
ff o
f Hig
hway
101
, whi
ch la
ck th
e hi
stor
ical
cha
rm a
nd
conv
enie
nt w
alka
bilit
y of
dow
ntow
n Lo
s Gat
os.
Acc
ordi
ng to
the
Cha
mbe
r, th
e ge
nera
l man
ager
s
41 S
mith
Tra
vel R
esea
rch
only
pub
lishe
s dat
a on
thos
e ho
tels
and
mot
els t
hat r
espo
nd to
the
com
pany
’s su
rvey
s.
Ther
efor
e, a
ll ST
R d
ata
repr
esen
ts a
sam
ple,
rath
er th
an a
100
per
cent
cou
nt.
How
ever
, as t
heir
surv
eys y
ield
a
very
hig
h pa
rtici
patio
n ra
te, S
TR d
ata
is d
eem
ed a
relia
ble
repr
esen
tatio
n of
the
hote
l mar
ket a
s a w
hole
.
Nor
th F
orty
Spe
cific
Pla
n M
arke
t Stu
dy a
nd B
usin
ess D
evel
opm
ent S
trate
gy
Page
89
of 1
50
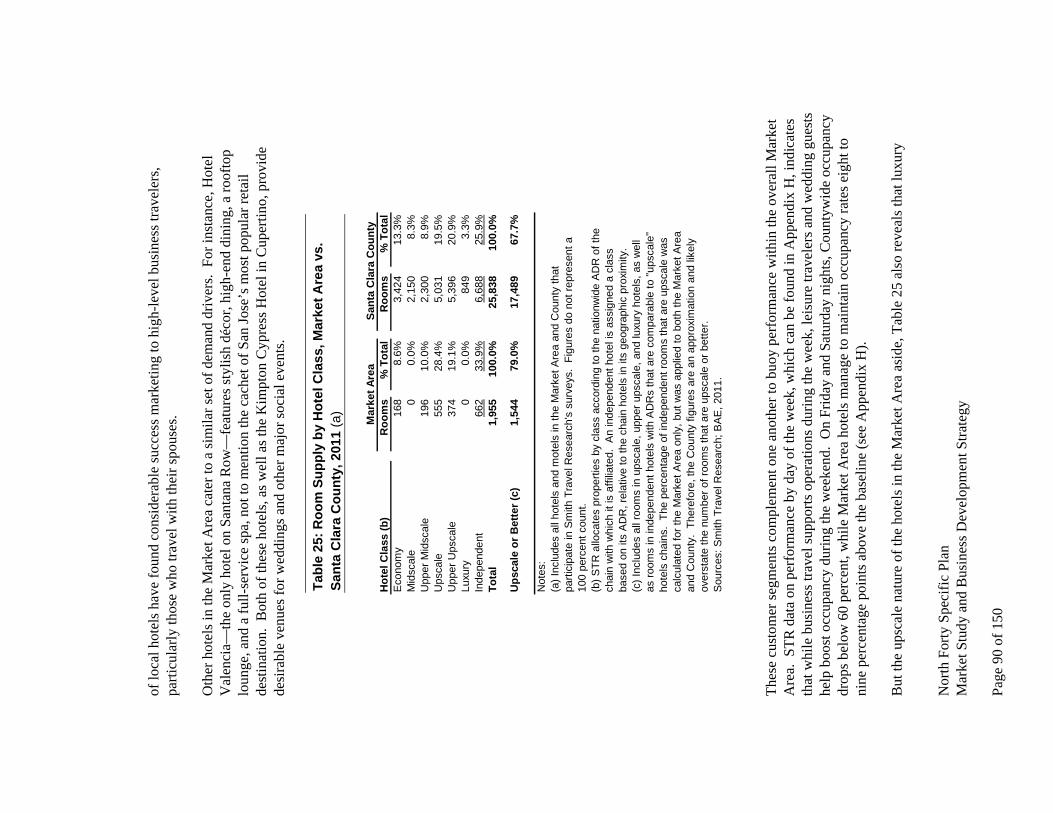
of lo
cal h
otel
s hav
e fo
und
cons
ider
able
succ
ess m
arke
ting
to h
igh-
leve
l bus
ines
s tra
vele
rs,
parti
cula
rly th
ose
who
trav
el w
ith th
eir s
pous
es.
Oth
er h
otel
s in
the
Mar
ket A
rea
cate
r to
a si
mila
r set
of d
eman
d dr
iver
s. F
or in
stan
ce, H
otel
V
alen
cia—
the
only
hot
el o
n Sa
ntan
a R
ow—
feat
ures
styl
ish
déco
r, hi
gh-e
nd d
inin
g, a
roof
top
loun
ge, a
nd a
full-
serv
ice
spa,
not
to m
entio
n th
e ca
chet
of S
an Jo
se’s
mos
t pop
ular
reta
il de
stin
atio
n. B
oth
of th
ese
hote
ls, a
s wel
l as t
he K
impt
on C
ypre
ss H
otel
in C
uper
tino,
pro
vide
de
sira
ble
venu
es fo
r wed
ding
s and
oth
er m
ajor
soci
al e
vent
s.
Tabl
e 25
: Roo
m S
uppl
y by
Hot
el C
lass
, Mar
ket A
rea
vs.
Sant
a C
lara
Cou
nty,
201
1 (a
)
Mar
ket A
rea
Sant
a C
lara
Cou
nty
Hot
el C
lass
(b)
Roo
ms
% T
otal
Roo
ms
% T
otal
Eco
nom
y16
88.
6%3,
424
13.3
%M
idsc
ale
00.
0%2,
150
8.3%
Upp
er M
idsc
ale
196
10.0
%2,
300
8.9%
Ups
cale
555
28.4
%5,
031
19.5
%U
pper
Ups
cale
374
19.1
%5,
396
20.9
%Lu
xury
00.
0%84
93.
3%In
depe
nden
t66
233
.9%
6,68
825
.9%
Tota
l1,
955
100.
0%25
,838
100.
0%
Ups
cale
or B
ette
r (c)
1,54
479
.0%
17,4
8967
.7%
Not
es:
(a) I
nclu
des
all h
otel
s an
d m
otel
s in
the
Mar
ket A
rea
and
Cou
nty
that
parti
cipa
te in
Sm
ith T
rave
l Res
earc
h's
surv
eys.
Fig
ures
do
not r
epre
sent
a10
0 pe
rcen
t cou
nt.
(b) S
TR a
lloca
tes
prop
ertie
s by
cla
ss a
ccor
ding
to th
e na
tionw
ide
AD
R o
f the
chai
n w
ith w
hich
it is
affi
liate
d. A
n in
depe
nden
t hot
el is
ass
igne
d a
clas
sba
sed
on it
s A
DR
, rel
ativ
e to
the
chai
n ho
tels
in it
s ge
ogra
phic
pro
xim
ity.
(c) I
nclu
des
all r
oom
s in
ups
cale
, upp
er u
psca
le, a
nd lu
xury
hot
els,
as
wel
las
room
s in
inde
pend
ent h
otel
s w
ith A
DR
s th
at a
re c
ompa
rabl
e to
"ups
cale
"ho
tels
cha
ins.
The
per
cent
age
of in
depe
nden
t roo
ms
that
are
ups
cale
was
calc
ulat
ed fo
r the
Mar
ket A
rea
only
, but
was
app
lied
to b
oth
the
Mar
ket A
rea
and
Cou
nty.
The
refo
re, t
he C
ount
y fig
ures
are
an
appr
oxim
atio
n an
d lik
ely
over
stat
e th
e nu
mbe
r of r
oom
s th
at a
re u
psca
le o
r bet
ter.
Sou
rces
: Sm
ith T
rave
l Res
earc
h; B
AE
, 201
1.
Thes
e cu
stom
er se
gmen
ts c
ompl
emen
t one
ano
ther
to b
uoy
perf
orm
ance
with
in th
e ov
eral
l Mar
ket
Are
a. S
TR d
ata
on p
erfo
rman
ce b
y da
y of
the
wee
k, w
hich
can
be
foun
d in
App
endi
x H
, ind
icat
es
that
whi
le b
usin
ess t
rave
l sup
ports
ope
ratio
ns d
urin
g th
e w
eek,
leis
ure
trave
lers
and
wed
ding
gue
sts
help
boo
st o
ccup
ancy
dur
ing
the
wee
kend
. O
n Fr
iday
and
Sat
urda
y ni
ghts
, Cou
ntyw
ide
occu
panc
y dr
ops b
elow
60
perc
ent,
whi
le M
arke
t Are
a ho
tels
man
age
to m
aint
ain
occu
panc
y ra
tes e
ight
to
nine
per
cent
age
poin
ts a
bove
the
base
line
(see
App
endi
x H
). B
ut th
e up
scal
e na
ture
of t
he h
otel
s in
the
Mar
ket A
rea
asid
e, T
able
25
also
reve
als t
hat l
uxur
y
Nor
th F
orty
Spe
cific
Pla
n M
arke
t Stu
dy a
nd B
usin
ess D
evel
opm
ent S
trate
gy
Page
90
of 1
50

hote
l roo
ms r
epre
sent
a m
inut
e sh
are
of C
ount
y w
ide
supp
ly (t
hree
per
cent
). T
he F
airm
ont S
an
Jose
, with
805
room
s, co
mpr
ises
the
vast
maj
ority
of t
his m
arke
t seg
men
t, w
hile
the
Ros
ewoo
d R
esor
t at C
orde
Val
le in
San
Mar
tin a
ccou
nts f
or th
e re
mai
ning
44
room
s.42
The
Mar
ket A
rea
does
no
t con
tain
any
nam
e-br
and
luxu
ry p
rope
rties
. D
espi
te S
ilico
n V
alle
y’s g
loba
l rep
utat
ion
as a
cen
ter o
f hig
h te
chno
logy
, man
y of
the
wor
ld’s
mos
t fa
mou
s hot
el p
rodu
cts a
re m
issi
ng fr
om th
e re
gion
. M
anda
rin O
rient
al, S
t. R
egis
, and
Le
Mer
idie
n al
l hav
e ho
tels
in S
an F
ranc
isco
, and
Ritz
-Car
lton
has h
otel
s in
both
San
Fra
ncis
co a
nd H
alf M
oon
Bay
. B
ut n
one
of th
ese
bran
ds h
ave
a pr
esen
ce in
the
Sout
h B
ay, w
here
the
only
luxu
ry p
rodu
cts o
f gl
obal
not
orie
ty a
re W
Sili
con
Val
ley
in N
ewar
k an
d Fo
ur S
easo
ns S
ilico
n V
alle
y in
Eas
t Pal
o A
lto.
Alth
ough
the
Nor
th 4
0 si
te is
out
side
a m
ajor
bus
ines
s clu
ster
it is
a sh
ort d
rive
from
man
y de
man
d ge
nera
tors
and
off
ers a
n en
hanc
ed le
vel o
f cul
tura
l and
recr
eatio
nal a
men
ities
. Pl
anne
d an
d Pr
opos
ed C
ompe
titio
n A
t the
tim
e of
writ
ing,
onl
y tw
o ne
w h
otel
s wer
e pr
opos
ed fo
r dev
elop
men
t with
in th
e M
arke
t A
rea,
as s
how
n in
Tab
le 2
6. I
f bui
lt, th
ese
proj
ects
will
add
app
roxi
mat
ely
123
room
s dee
med
up
scal
e or
bet
ter t
o th
e M
arke
t Are
a. H
owev
er, b
oth
pros
pect
ive
site
s are
loca
ted
appr
oxim
atel
y 15
m
inut
es a
way
alo
ng S
teve
ns C
reek
Blv
d. in
Cup
ertin
o, w
here
the
inte
nt is
like
ly to
cap
ture
bus
ines
s ge
nera
ted
by A
pple
and
oth
er m
ajor
cor
pora
te te
nant
s. F
urth
er, o
ne o
f the
pro
pose
d ho
tels
is to
be
loca
ted
amid
st th
e M
ain
Stre
et m
ixed
-use
dev
elop
men
t, w
hich
will
striv
e to
cre
ate
a se
lf-co
ntai
ned
hub
of a
ctiv
ity a
kin
to S
anta
na R
ow.
As s
uch,
thes
e pr
ojec
ts, i
n th
e ca
se th
at th
ey sh
ould
com
e to
fr
uitio
n, sh
ould
be
cons
ider
ed in
dire
ctly
com
petit
ive
with
a p
rosp
ectiv
e N
orth
40
hote
l in
term
s of
room
stay
s. Ta
ble
1, fi
rst d
iscu
ssed
in th
e Si
te D
escr
iptio
n ab
ove,
pro
vide
s a li
st o
f maj
or in
stitu
tions
and
le
isur
e de
stin
atio
ns in
the
San
Jose
-San
ta C
ruz
met
ro a
rea
that
may
be
capa
ble
of sp
arki
ng d
eman
d fo
r ove
rnig
ht ro
om st
ays a
t a N
orth
40
hote
l.
This
list
reve
als t
hat t
he m
etro
are
a fe
atur
es m
yria
d po
tent
ial d
eman
d ge
nera
tors
, inc
ludi
ng a
nu
mbe
r of a
rts a
nd e
nter
tain
men
t ven
ues,
busi
ness
hub
s, an
d un
iver
sitie
s. H
owev
er, m
ost a
ll of
the
site
s lis
ted
are
serv
ed b
y ex
istin
g no
des o
f hot
el ro
oms t
hat,
for a
ll in
tent
s and
pur
pose
s, ha
ve th
e ca
paci
ty to
abs
orb
dem
and
gene
rate
d by
nea
rby
attra
ctio
ns.
42 R
osew
ood
Res
ort a
lso
has a
pro
perty
in M
enlo
Par
k ou
tsid
e th
e M
arke
t Are
a to
the
north
(app
roxi
mat
ely
23
mile
s).
Nor
th F
orty
Spe
cific
Pla
n M
arke
t Stu
dy a
nd B
usin
ess D
evel
opm
ent S
trate
gy
Page
91
of 1
50

Tabl
e 26
: Pla
nned
and
Pro
pose
d H
otel
Dev
elop
men
ts, M
arke
t Are
a, A
pril
2011
Nam
eLo
catio
n/D
rive
Tim
eB
rand
Mee
ting
Dev
elop
erC
lass
Roo
ms
Est.
Tim
ing
Spac
e (s
f)R
esta
uran
tAm
eniti
es
Cup
ertin
oH
yatt
Pla
ce C
uper
tino
Hya
tt P
lace
123
Sum
mer
201
16,
000
The
Gal
lery
:Fi
tnes
s ce
nter
, 10
165
N. D
e A
nza
Blv
d. (1
3 m
ins)
Ups
cale
(sta
rt); p
lans
gues
t kitc
hen/
pool
, sau
na,
Sha
shi C
orpo
ratio
nto
ope
n by
win
e ba
rsp
a, e
xecu
tive
end
of 2
012
boar
d ro
om &
lo
unge
Mai
n S
treet
Cup
ertin
oY
et to
be
Up
to 2
50S
tart
date
Mos
t det
ails
are
yet
to b
e de
term
ined
; as
aS
teve
ns C
reek
Blv
d. &
de
term
ined
unkn
own
cond
ition
of a
ppro
val,
City
has
stip
ulat
ed th
at if
Finc
h A
ve. (
14 m
ins)
hote
l inc
lude
s 16
0+ ro
oms,
then
dev
elop
erS
and
Hill
Pro
perty
Co.
mus
t pro
vide
a b
anqu
et fa
cilit
y fo
r 400
peo
ple
Sou
rces
: City
of C
uper
tino;
BA
E, 2
011.
Dem
and
Gen
erat
ors
Whi
le d
ownt
own
San
Jose
, for
inst
ance
, hou
ses a
den
se c
lust
er o
f mee
ting
and
cultu
ral c
ente
rs, i
t al
so fe
atur
es o
ne o
f the
regi
on’s
larg
est c
once
ntra
tions
of h
otel
room
s. W
hile
ther
e ar
e so
me
indi
catio
ns th
at e
xecu
tive-
leve
l tra
vele
rs m
ay c
hoos
e to
stay
in L
os G
atos
—ra
ther
than
clo
ser t
o th
eir p
oint
of b
usin
ess i
n Sa
n Jo
se o
r els
ewhe
re, a
s dis
cuss
ed a
bove
—th
e av
erag
e bu
sine
ss tr
avel
er
or to
uris
t is l
ikel
y to
opt
for a
hot
el th
at p
rovi
des m
ore
read
y ac
cess
to th
e re
gion
’s p
rinci
pal
attra
ctio
ns.
Sim
ilarly
, whi
le S
tanf
ord
Uni
vers
ity a
nd U
C S
anta
Cru
z ha
ve th
e po
tent
ial t
o ge
nera
te
room
dem
and,
esp
ecia
lly a
roun
d gr
adua
tion,
they
bot
h re
pres
ent a
driv
e tim
e of
30
min
utes
or
mor
e, a
nd th
eref
ore
mar
k th
e ab
solu
te o
uter
orb
it of
the
Nor
th 4
0’s r
each
in th
e ho
spita
lity
mar
ket.
On
the
othe
r han
d, n
earb
y m
edic
al c
ente
rs m
ay p
rese
nt a
via
ble
mar
ket c
apab
le o
f sup
porti
ng
addi
tiona
l hot
el su
pply
. Th
e N
orth
40
sits
dire
ctly
acr
oss L
os G
atos
Blv
d. fr
om th
e ex
pans
ive
Goo
d Sa
mar
itan
Hos
pita
l, w
hich
was
rank
ed th
e fo
urth
larg
est h
ospi
tal i
n Si
licon
Val
ley
in te
rms o
f gr
oss p
atie
nt re
venu
e in
200
9 by
the
Silic
on V
alle
y/Sa
n Jo
se B
usin
ess J
ourn
al.
In a
dditi
on, E
l C
amin
o H
ospi
tal L
os G
atos
(for
mer
ly C
omm
unity
Hos
pita
l of L
os G
atos
) and
San
ta C
lara
Val
ley
Med
ical
Cen
ter—
the
seco
nd la
rges
t hos
pita
l in
Silic
on V
alle
y, a
ccor
ding
to th
e Jo
urna
l—ar
e bo
th
loca
ted
with
in a
10-
min
ute
driv
e of
the
site
. C
ombi
ned,
thes
e fa
cilit
ies a
mou
nt to
wel
l ove
r 20
0,00
0 pa
tient
cen
sus d
ays p
er y
ear,
mea
ning
that
, on
any
give
n da
y, th
ere
are
an a
vera
ge o
f ove
r 55
0 pa
tient
s hos
pita
lized
in th
e su
rrou
ndin
g ar
ea.
In a
dditi
on, e
ach
of th
ese
hosp
itals
is fl
anke
d by
co
mpl
emen
tary
med
ical
labs
and
off
ices
, man
y of
whi
ch h
andl
e ou
tpat
ient
pro
cedu
res.
Th
ese
com
plex
es h
ave
the
pote
ntia
l to
gene
rate
dem
and
for n
earb
y ho
tel r
oom
s. In
terv
iew
s with
ad
min
istra
tive/
gues
t ser
vice
s sta
ff fr
om G
ood
Sam
arita
n an
d El
Cam
ino
Hos
pita
ls in
dica
te th
at
both
org
aniz
atio
ns re
ly o
n ar
ea h
otel
s to
acco
mm
odat
e vi
sitin
g do
ctor
s, re
sear
cher
s, an
d ex
ecut
ives
, as
wel
l as p
atie
nts t
rave
lling
long
-dis
tanc
es fo
r hos
pita
l pro
cedu
res a
nd/o
r ext
ende
d re
habi
litat
ion.
In
the
case
of t
he la
tter,
patie
nts m
ay b
e tra
velli
ng w
ith fa
mily
and
frie
nds t
hat a
lso
requ
ire
Nor
th F
orty
Spe
cific
Pla
n M
arke
t Stu
dy a
nd B
usin
ess D
evel
opm
ent S
trate
gy
Page
92
of 1
50

acco
mm
odat
ions
. U
nder
such
circ
umst
ance
s, pr
oxim
ity is
at a
pre
miu
m, a
s pat
ient
s and
thei
r vi
sito
rs w
ant t
o be
abl
e to
reac
h th
e ho
spita
l as q
uick
ly a
s pos
sibl
e.
At p
rese
nt, G
ood
Sam
arita
n pl
aces
trav
ellin
g st
aff i
n th
e M
arrio
tt R
esid
ence
Inn
or L
arks
pur
Land
ing,
as t
hey
prov
ide
amen
ities
that
less
en th
e bu
rden
of e
xten
ded
stay
s, an
d pl
aces
exe
cutiv
es
in H
otel
Val
enci
a on
San
tana
Row
. B
oth
exte
nded
stay
pro
perti
es a
re lo
cate
d w
ithin
a fi
ve to
ten
min
ute
driv
e in
Cam
pbel
l. H
owev
er, a
repr
esen
tativ
e of
the
Hos
pita
l ind
icat
es th
at a
Nor
th 4
0 ho
tel
wou
ld b
e a
wel
com
ed c
onve
nien
ce, p
artic
ular
ly if
it w
ere
to o
ffer
rate
s or d
isco
unts
bel
ow th
e ex
istin
g pr
ice
poin
t for
com
para
ble
prop
ertie
s. S
imila
rly, a
repr
esen
tativ
e of
El C
amin
o H
ospi
tal
Los G
atos
, whi
ch sp
ecia
lizes
in h
ip a
nd jo
int w
ork,
bel
ieve
s tha
t a h
otel
gea
red
tow
ards
long
-term
st
ays—
one
that
has
a p
ool a
nd a
llow
s pet
s, fo
r exa
mpl
e—co
uld
acco
mm
odat
e th
eir r
ehab
pat
ient
s. In
add
ition
to d
eman
d ge
nera
ted
by n
earb
y m
edic
al c
ompl
exes
, hig
h-en
d le
isur
e tra
vel f
ocus
ed o
n re
tail,
scen
ery,
and
the
arts
may
pre
sent
a se
cond
ary
oppo
rtuni
ty fo
r hot
el d
evel
opm
ent.
The
Nor
th
40 si
te is
loca
ted
mid
way
bet
wee
n do
wnt
own
Los G
atos
and
San
tana
Row
/Val
ley
Fair,
am
ount
ing
to a
maj
or a
xis o
f ups
cale
reta
il. S
imila
rly, t
he si
te p
rovi
des s
trate
gic
acce
ss to
par
ks a
nd v
iney
ards
ne
stle
d in
to th
e hi
lls a
bove
Los
Gat
os a
nd S
arat
oga,
whi
ch is
als
o ho
me
to th
e po
pula
r Mon
talv
o A
rts C
ente
r. It
shou
ld b
e no
ted
that
Sar
atog
a is
und
erse
rved
by
hote
l roo
ms,
and
both
pub
lic
offic
ials
and
bus
ines
s rep
rese
ntat
ives
stee
r vis
itors
to lo
dgin
g op
tions
in L
os G
atos
. H
owev
er, a
s ex
istin
g ho
tels
in d
ownt
own
Los G
atos
pro
vide
imm
edia
te a
cces
s to
loca
l sho
ppin
g an
d di
ning
, thi
s st
rate
gy w
ould
rely
on
prov
idin
g co
nven
ient
tran
spor
tatio
n lin
kage
s bet
wee
n th
e N
orth
40
and
near
by a
ttrac
tions
. Pe
rfor
man
ce T
rend
s D
ata
prov
ided
by
STR
allo
ws f
or c
ompa
rison
bet
wee
n th
e pe
rfor
man
ce o
f hot
els l
ocat
ed w
ithin
the
Mar
ket A
rea
and
thos
e lo
cate
d w
ithin
San
ta C
lara
Cou
nty
at la
rge.
STR
gat
hers
info
rmat
ion
on
key
perf
orm
ance
indi
cato
rs fr
om p
artic
ipat
ing
hote
ls.
Whi
le S
TR d
oes n
ot c
aptu
re 1
00 p
erce
nt
parti
cipa
tion,
the
vast
maj
ority
of a
rea
hote
ls sh
are
info
rmat
ion,
allo
win
g fo
r a m
eani
ngfu
l ana
lysi
s of
the
hosp
italit
y m
arke
t.
As s
how
n in
Fig
ure
14, o
vera
ll oc
cupa
ncy
in th
e M
arke
t Are
a pe
aked
in 2
007
at 7
5 pe
rcen
t. W
hile
oc
cupa
ncy
fell
rapi
dly
over
the
follo
win
g tw
o ye
ars d
ue to
the
natio
nal r
eces
sion
, bot
tom
ing
out
arou
nd 6
5 pe
rcen
t in
2009
, it s
hot b
ack
up in
201
0 to
72
perc
ent,
near
ing
peak
leve
ls.
Roo
m
dem
and
in th
e M
arke
t Are
a in
201
0 ac
tual
ly e
xcee
ded
dem
and
in 2
007,
clim
bing
to o
ver 5
10,0
00
room
-nig
hts f
rom
a p
revi
ous p
eak
of a
roun
d 49
0,00
0. T
his g
row
th in
dem
and
is o
bscu
red
by th
e fa
ct th
at th
e M
arrio
t Cou
rtyar
d in
Cam
pbel
l ope
ned
in e
arly
201
0, a
ddin
g 16
2 ro
oms t
o th
e M
arke
t A
rea,
thus
supp
ress
ing
the
over
all o
ccup
ancy
rate
. In
oth
er w
ords
, the
Mar
ket A
rea
expe
rienc
ed
mor
e de
man
d fo
r hot
el ro
om-n
ight
s in
2010
than
it d
id d
urin
g its
pre
-rec
essi
on p
eak.
For
mor
e-de
taile
d ST
R d
ata,
see
App
endi
x H
.
N
orth
For
ty S
peci
fic P
lan
Mar
ket S
tudy
and
Bus
ines
s Dev
elop
men
t Stra
tegy
Pa
ge 9
3 of
150

Figu
re 1
4: O
ccup
ancy
Rat
e an
d R
oom
Dem
and,
Mar
ket A
rea,
200
5-20
10 (a
)
350,
000
400,
000
450,
000
500,
000
550,
000
600,
000
650,
000
54%
58%
62%
66%
70%
74%
78%
2005
2006
2007
2008
2009
2010
Room Demand (b)
Occupancy Rate
Occ
upan
cyR
oom
Dem
and
(b)
N
otes
: (a
) Inc
lude
s al
l hot
els
and
mot
els
in th
e M
arke
t Are
a an
d C
ount
y th
at p
artic
ipat
e in
Sm
ith T
rave
l Res
earc
h’s
surv
eys.
Fi
gure
s do
not
repr
esen
t a 1
00 p
erce
nt c
ount
. (b
) Roo
m d
eman
d re
pres
ents
the
num
ber o
f roo
ms
sold
ove
r a g
iven
tim
e pe
riod,
exc
ludi
ng c
ompl
imen
tary
room
s.
Sour
ces:
Sm
ith T
rave
l Res
earc
h; B
AE, 2
011.
H
owev
er, t
his i
ncre
ase
in d
eman
d ha
s not
cau
sed
a pr
opor
tiona
l inc
reas
e in
reve
nue.
As s
how
n in
Fi
gure
15,
loca
l hot
els h
ave
enco
urag
ed sa
les b
y dr
oppi
ng ra
tes.
Bet
wee
n 20
05 a
nd 2
008,
the
aver
age
daily
rate
(AD
R) i
n th
e M
arke
t Are
a cl
imbe
d fr
om $
122
to $
148,
bef
ore
falli
ng to
$12
9 in
20
09.
Bet
wee
n 20
09 a
nd 2
010,
loca
l hot
els a
ctua
lly lo
wer
ed th
eir r
ates
a li
ttle
furth
er, t
hus
ince
ntiv
izin
g de
man
d. T
his t
actic
has
pro
ven
succ
essf
ul, a
nd w
hile
rate
s dro
pped
slig
htly
from
20
09 to
201
0, re
venu
e pe
r ava
ilabl
e ro
om (R
evPA
R) r
ever
sed
its re
cess
iona
ry d
eclin
e, re
boun
ding
fr
om $
83 to
$92
. Th
eref
ore,
whi
le h
otel
s in
the
Mar
ket A
rea
have
em
erge
d fr
om th
e re
cess
ion
show
ing
stro
ng d
eman
d an
d oc
cupa
ncy,
hot
el re
venu
es m
ovin
g fo
rwar
d w
ill d
epen
d on
the
abili
ty
of o
pera
tors
to ra
ise
room
rate
s with
out d
isco
urag
ing
sale
s. N
orth
For
ty S
peci
fic P
lan
Mar
ket S
tudy
and
Bus
ines
s Dev
elop
men
t Stra
tegy
Pa
ge 9
4 of
150
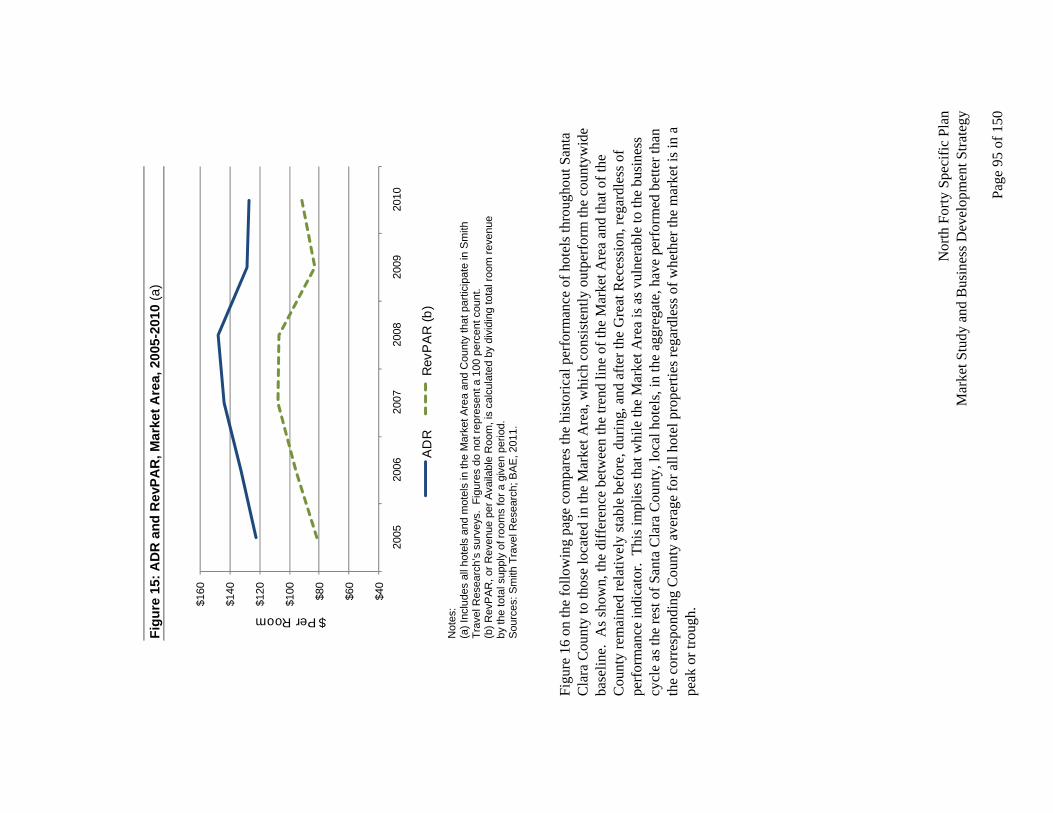
Figu
re 1
5: A
DR
and
Rev
PAR
, Mar
ket A
rea,
200
5-20
10 (a
)
$40
$60
$80
$100
$120
$140
$160
2005
2006
2007
2008
2009
2010
$ Per Room
AD
RR
evP
AR
(b)
N
otes
: (a
) Inc
lude
s al
l hot
els
and
mot
els
in th
e M
arke
t Are
a an
d C
ount
y th
at p
artic
ipat
e in
Sm
ith
Trav
el R
esea
rch’
s su
rvey
s. F
igur
es d
o no
t rep
rese
nt a
100
per
cent
cou
nt.
(b) R
evPA
R, o
r Rev
enue
per
Ava
ilabl
e R
oom
, is
calc
ulat
ed b
y di
vidi
ng to
tal r
oom
reve
nue
by th
e to
tal s
uppl
y of
room
s fo
r a g
iven
per
iod.
So
urce
s: S
mith
Tra
vel R
esea
rch;
BAE
, 201
1.
Figu
re 1
6 on
the
follo
win
g pa
ge c
ompa
res t
he h
isto
rical
per
form
ance
of h
otel
s thr
ough
out S
anta
C
lara
Cou
nty
to th
ose
loca
ted
in th
e M
arke
t Are
a, w
hich
con
sist
ently
out
perf
orm
the
coun
tyw
ide
base
line.
As s
how
n, th
e di
ffer
ence
bet
wee
n th
e tre
nd li
ne o
f the
Mar
ket A
rea
and
that
of t
he
Cou
nty
rem
aine
d re
lativ
ely
stab
le b
efor
e, d
urin
g, a
nd a
fter t
he G
reat
Rec
essi
on, r
egar
dles
s of
perf
orm
ance
indi
cato
r. T
his i
mpl
ies t
hat w
hile
the
Mar
ket A
rea
is a
s vul
nera
ble
to th
e bu
sine
ss
cycl
e as
the
rest
of S
anta
Cla
ra C
ount
y, lo
cal h
otel
s, in
the
aggr
egat
e, h
ave
perf
orm
ed b
ette
r tha
n th
e co
rres
pond
ing
Cou
nty
aver
age
for a
ll ho
tel p
rope
rties
rega
rdle
ss o
f whe
ther
the
mar
ket i
s in
a pe
ak o
r tro
ugh.
N
orth
For
ty S
peci
fic P
lan
Mar
ket S
tudy
and
Bus
ines
s Dev
elop
men
t Stra
tegy
Pa
ge 9
5 of
150

Figu
re 1
6: O
ccup
ancy
Rat
e, A
DR
and
Rev
PAR
, Mar
ket A
rea
vs. S
anta
Cla
ra
Cou
nty,
200
5-20
10 (a
)
50%
55%
60%
65%
70%
75%
80%
2005
2006
2007
2008
2009
2010
Occupancy Rate
Mar
ket A
rea
Cou
nty
$40
$60
$80
$100
$120
$140
$160
2005
2006
2007
2008
2009
2010
$ Per Room
Mar
ket A
rea
AD
RC
ount
y A
DR
Rev
PA
R (b
)R
evP
AR
(b)
N
otes
: (a
) Inc
lude
s al
l hot
els
and
mot
els
in th
e M
arke
t Are
a an
d C
ount
y th
at p
artic
ipat
e in
Sm
ith T
rave
l R
esea
rch’
s su
rvey
s. F
igur
es d
o no
t rep
rese
nt a
100
per
cent
cou
nt.
(b) R
evPA
R, o
r Rev
enue
per
Ava
ilabl
e R
oom
, is
calc
ulat
ed b
y di
vidi
ng to
tal r
oom
reve
nue
by th
e to
tal s
uppl
y of
room
s fo
r a g
iven
per
iod.
Sour
ces:
Sm
ith T
rave
l Res
earc
h; B
AE, 2
011.
N
orth
For
ty S
peci
fic P
lan
Mar
ket S
tudy
and
Bus
ines
s Dev
elop
men
t Stra
tegy
Pa
ge 9
6 of
150

Me
eti
ng
Sp
ac
e M
ark
et
As
se
ss
me
nt
The
purp
ose
of th
is se
ctio
n is
to a
sses
s the
pot
entia
l for
mar
ket a
bsor
ptio
n of
mee
ting
faci
litie
s on
the
Nor
th 4
0. T
wo
type
s of f
acili
ties a
re c
onsi
dere
d: (1
) hot
els t
hat f
eatu
re sp
ace
for b
usin
ess
mee
tings
of 5
0 to
500
peo
ple
and
(2) d
edic
ated
day
-use
con
fere
nce
faci
litie
s tha
t can
hos
t mee
tings
of
a si
mila
r sca
le, b
ut d
o no
t fea
ture
atta
ched
hot
el ro
oms.
No
data
is a
vaila
ble
to a
sses
s the
ut
iliza
tion
or p
erfo
rman
ce o
f the
se ty
pes o
f fac
ilitie
s. T
here
fore
, thi
s ana
lysi
s ser
ves m
ostly
to
desc
ribe
the
type
and
geo
grap
hica
l dis
tribu
tion
of e
xist
ing
faci
litie
s in
the
Mar
ket A
rea,
whi
ch
mak
e up
the
com
petit
ive
supp
ly.
In a
dditi
on, a
n an
alys
is o
f how
the
site
rela
tes g
eogr
aphi
cally
to
maj
or e
mpl
oyer
s is p
rovi
ded
in o
rder
to sh
ed li
mite
d in
sigh
t ont
o w
heth
er o
r not
dem
and
can
supp
ort a
dditi
onal
con
fere
nce
faci
litie
s. In
sigh
ts fr
om in
terv
iew
s con
duct
ed w
ith k
ey in
form
ants
kn
owle
dgea
ble
abou
t the
loca
l con
fere
nce
mar
ket a
re p
rovi
ded,
as w
ell,
in o
rder
to fu
rther
sugg
est
the
mag
nitu
de a
nd ty
pe o
f exi
stin
g de
man
d.
Hot
el M
eetin
g Sp
ace
As s
how
n in
Fig
ure
17 a
nd T
able
s 27
and
28, t
he h
otel
s tha
t fea
ture
mee
ting
spac
e fo
r 50
to 5
00
peop
le a
re c
once
ntra
ted
in a
few
dis
tinct
clu
ster
s with
in th
e M
arke
t Are
a. D
ownt
own
Los G
atos
fe
atur
es a
col
lect
ion
of fu
ll-se
rvic
e ho
tels
with
mee
ting
spac
e. A
noth
er c
lust
er e
xist
s in
Cam
pbel
l ar
ound
the
Prun
eyar
d Sh
oppi
ng C
ente
r, in
clud
ing
two
limite
d-se
rvic
e fa
cilit
ies a
nd th
e C
ourty
ard
San
Jose
Cam
pbel
l, w
hich
ope
ned
in 2
010.
43 S
an Jo
se fe
atur
es Jo
ie d
e V
ivre
’s M
oorp
ark
Hot
el
and
Hot
el V
alen
cia,
whi
ch p
rovi
des t
he o
nly
sour
ce o
f mee
ting
spac
e on
San
tana
Row
. Fi
nally
, th
e la
rges
t clu
ster
of r
oom
s exi
sts i
n C
uper
tino
in th
e vi
cini
ty o
f App
le’s
cor
pora
te h
eadq
uarte
rs
and
a la
rge
outp
ost o
f Ora
cle
empl
oyee
s. T
he a
rea
of C
uper
tino
arou
nd S
teve
ns C
reek
and
Nor
th
De
Anz
a B
oule
vard
s is o
ne o
f the
stro
nges
t off
ice
hubs
with
in th
e M
arke
t Are
a, a
nd it
s pro
min
ent
tech
nolo
gy te
nant
s lik
ely
driv
e a
sign
ifica
nt p
ortio
n of
the
dem
and
for b
usin
ess t
rave
l and
mee
ting
spac
e. I
n fa
ct, t
wo
mor
e ho
tels
are
pla
nned
for t
his a
rea,
repr
esen
ting
the
only
hot
el d
evel
opm
ents
cu
rren
tly in
the
pipe
line
in th
e en
tire
Mar
ket A
rea.
At p
rese
nt th
ere
are
no h
otel
s in
the
Mar
ket
Are
a th
at c
an a
ccom
mod
ate
mor
e th
an 2
85 p
eopl
e in
a si
ngle
room
. A
123
-roo
m H
yatt
Plac
e re
cent
ly re
ceiv
ed p
lann
ing
appr
oval
, and
the
proj
ect i
s sla
ted
for
com
plet
ion
by th
e en
d of
201
2. W
ith 6
,000
squa
re fe
et o
f mee
ting
spac
e, th
e H
yatt
Plac
e w
ill
beco
me
the
Mar
ket A
rea’
s lar
gest
hot
el m
eetin
g fa
cilit
y in
term
s of c
onfe
renc
e sq
uare
foot
age.
A
noth
er h
otel
is p
lann
ed a
s par
t of t
he 1
7-ac
re M
ain
Stre
et C
uper
tino
deve
lopm
ent a
t Val
lco
Park
way
. W
hile
the
over
all p
roje
ct is
pro
gres
sing
slow
ly, a
s the
dev
elop
er se
eks t
o te
nant
the
offic
e an
d re
tail
com
pone
nts b
efor
e br
eaki
ng g
roun
d, th
e ho
tel w
ill li
kely
be
the
first
pha
se to
m
ove
forw
ard.
The
dev
elop
er h
as n
ot y
et a
nnou
nced
whe
ther
or n
ot th
e pr
ojec
t will
incl
ude
43 F
ull s
ervi
ce h
otel
s off
er m
ore
in se
rvic
es a
nd a
ccom
mod
atio
ns th
an li
mite
d se
rvic
e ho
tel p
rope
rties
, typ
ical
ly
an a
ttach
ed re
stau
rant
, 24-
hour
val
et se
rvic
e, d
ry c
lean
ing,
hea
ted
pool
s and
saun
as, w
ell-e
quip
ped
fitne
ss
cent
ers,
guar
ante
ed h
igh-
spee
d w
irele
ss In
tern
et a
cces
s, an
d hi
gher
-end
furn
ishi
ng a
nd fi
nish
es.
Nor
th F
orty
Spe
cific
Pla
n M
arke
t Stu
dy a
nd B
usin
ess D
evel
opm
ent S
trate
gy
Page
97
of 1
50

Nor
th F
orty
Spe
cific
Pla
n M
arke
t Stu
dy a
nd B
usin
ess D
evel
opm
ent S
trate
gy
Page
98
of 1
50
mee
ting
spac
e. H
owev
er, a
s a c
ondi
tion
of a
ppro
val,
Sand
Hill
Pro
perty
Co.
has
agr
eed
to p
rovi
de
a 40
0-pe
rson
ban
quet
faci
lity
if th
e ho
tel e
xcee
ds 1
60 ro
oms.
Figu
re 1
7: E
xist
ing
and
Prop
osed
Mee
ting
Hot
els,
Mar
ket A
rea
So
urce
: BAE
, 201
1

Table 27: Comparable Hotels with Meeting Space, Market Area (a) Name AmenitiesLocation/Drive Time Meeting Bus. Outdoor FitnessBrand (if applicable) Class Rooms Built Rates (a) Food & Bev. Space (sf) Center Pool Hot tub Center Other
Full Service
Los GatosLos Gatos Lodge Independent 128 1958 $99-159 Los Gatos 5,000 No Yes No Yes Bocce court,55 Los Gatos-Saratoga Rd. (5 mins) Lodge Bar & putting green
Grill
Hotel Los Gatos Upper 71 2002 $189-279 Dio Deka 3,472 No Heated Yes No Full svc. Spa 210 E. Main St. (7 mins) Upscale Rest. Elia on-site; Summit Hotel & Resorts afternoon tea
available; comp.access to nearby gym
Toll House Hotel Independent 115 1983 $184-344 3 Degrees 3,694 Yes No Yes Yes Full svc. Spa 140 S. Santa Cruz Ave. (8 mins) Rest. & Los Gatos Larkspur Collection Lounge next door;
comp. bike rentals, same-day laundry
CampbellCourtyard San Jose Upscale 162 2010 $115-205 The Bistro 1,738 Yes Yes Yes Yes655 Creekside Way (8 mins)Courtyard by Marriott
CupertinoHilton Garden Inn Cupertino Upscale 164 1998 $79-139 Great 1,650 Yes Yes Yes Yes10741 N. Wolfe Rd. (12 mins) AmericanHilton Garden Inn Grill
Cypress Hotel Upper 224 2002 $159-259 Park Place 3,625 Yes Heated No Yes Hosted wine 10050 S. De Anza Blvd. (13 mins) Upscale Rest. hourKimpton
North Forty Specific Plan
Market Study and Business Development Strategy
Page 99 of 150

North Forty Specific Plan Market Study and Business Development Strategy Page 100 of 150
Table 27: Comparable Hotels with Meeting Space, Market Area (a) (cont.) Name AmenitiesLocation/Drive Time Meeting Bus. Outdoor FitnessBrand (if applicable) Class Rooms Built Rates (a) Food & Bev. Space (sf) Center Pool Hot tub Center Other
San JoseHotel Valencia Santana Row Independent 212 2003 $226-256 Citrus Rest. 3,804 Yes Yes No Yes Full svc. Ayoma355 Santana Row (8 mins) V Bar Lifespa; Valencia Group Cielo Lounge balcony rooms
available
Moorpark Hotel Upper 79 2001 $111-149 Park Bar & 1,865 Yes Heated Yes Yes Billiards loft; 4241 Moorpark Ave. (9 mins) Upscale Grill comp. wine Joie de Vivre hour
Limited Service
CampbellPruneyard Plaza Hotel Independent 171 1989 $144-244 N/A 4,090 Yes Heated Yes Yes1995 S. Bascom Ave. (9 mins)
Campbell Inn Independent 95 1985 $114-249 N/A 1,000 Yes Yes No No Tennis courts;675 E. Campbell Ave. (10 mins) comp. access
to nearby gym, bike rentals, 24-hour shuttleto SJO
CupertinoCupertino Inn Independent 125 1987 $219-239 N/A 1,720 No Heated Yes No Comp. access10889 N. De Anza Blvd. (11 mins) to nearby gym,
limo service to SJO, cocktails/hors d'ouevres nightly
Notes:(a) Includes all hotels that feature indoor meeting spaces that can accommodate groups of 50 to 500 persons seated theater style.(b) Price survey conducted on April 18, 2011. Ranges exclude ultra-luxury suites on the high end.Sources: Smith Travel Research; BAE, 2011.

Tabl
e 28
: Sum
mar
y of
Mee
ting
Spac
es a
t Com
para
ble
Hot
els,
Mar
ket A
rea
(a)
Nam
eC
apac
ity b
y C
onfig
urat
ion
Loca
tion/
Driv
e Ti
me
Mee
ting
Spac
e (a
)Si
ze (s
f)Th
eate
rC
lass
Ban
quet
Rec
eptio
n
Los
Gat
osLo
s G
atos
Lod
geE
l Gat
o R
oom
1,80
015
080
120
N/A
55 L
os G
atos
-Sar
atog
a R
d. (5
min
s)D
e A
nza
Roo
m1,
242
100
4080
N/A
Gar
den
Roo
m1,
240
9035
75N
/A
Hot
el L
os G
atos
Mon
te S
eren
o R
oom
1,90
010
080
150
200
210
E. M
ain
St.
(7 m
ins)
Sal
ons
AB
C o
r CD
E1,
225
6060
80N
/AS
alon
s B
C o
r CB
953
5040
60N
/A
Toll
Hou
se H
otel
Lark
spur
1/2
1,92
018
090
150
N/A
140
S. S
anta
Cru
z A
ve. (
8 m
ins)
Lark
spur
11,
152
100
4080
N/A
Lark
spur
275
870
3050
N/A
Din
ing
Roo
m57
650
3036
N/A
Cam
pbel
lC
ourty
ard
San
Jos
eC
ampb
ell R
oom
1,39
090
5464
N/A
655
Cre
eksi
de W
ay (8
min
s)
Pru
neya
rd P
laza
Hot
elH
arve
st R
oom
1,06
090
6590
9019
95 S
. Bas
com
Ave
. (9
min
s)O
rcha
rd R
oom
730
6040
6080
Fire
side
Atri
um81
260
3650
50
Cam
pbel
l Inn
Din
ing
Roo
m1,
000
60N
/AN
/A60
675
E. C
ampb
ell A
ve. (
10 m
ins)
Cup
ertin
oC
uper
tino
Inn
De
Anz
a R
oom
760
6040
55N
/A10
889
N. D
e A
nza
Blv
d. (1
1 m
ins)
Hilt
on G
arde
n In
n C
uper
tino
Gar
den
Roo
m A
BC
1,65
012
060
9012
010
741
N. W
olfe
Rd.
(12
min
s)G
arde
n R
oom
AB
or B
C1,
100
8040
6080
Cyp
ress
Hot
elC
ali B
allro
om3,
040
250
150
200
250
1005
0 S
. De
Anz
a B
lvd.
(13
min
s)C
ali A
, B o
r C1,
026
7030
6070
Par
kvie
w1,
245
100
5080
125
Par
kvie
w W
est
745
6030
5075
San
Jos
eH
otel
Val
enci
a S
anta
na R
owV
alen
cia
2,26
820
010
017
028
535
5 S
anta
na R
ow (8
min
s)V
alen
cia
I or I
I1,
134
100
5684
140
San
tana
768
5030
5080
Moo
rpar
k H
otel
Gen
try R
oom
1,08
660
3240
8042
41 M
oorp
ark
Ave
. (9
min
s)
Not
e:(a
) Inc
lude
s al
l spa
ces
that
can
acc
omm
odat
e a
busi
ness
mee
ting
of 5
0 to
500
per
sons
sea
ted
thea
ter s
tyle
. O
utdo
orsp
aces
are
exc
lude
d.S
ourc
e: B
AE
, 201
1.
Nor
th F
orty
Spe
cific
Pla
n M
arke
t Stu
dy a
nd B
usin
ess D
evel
opm
ent S
trate
gy
Page
101
of 1
50
Day
-Use
Mee
ting
Faci
litie
s Fi
gure
18
and
Tabl
e 29
reve
al th
at th
e M
arke
t Are
a is
larg
ely
devo
id o
f ded
icat
ed, d
ay-u
se m
eetin
g fa
cilit
ies t
hat a
re d
esig
ned
for b
usin
ess u
se. 4
4 Whi
le a
num
ber o
f fac
ilitie
s exi
st th
at c
an
acco
mm
odat
e bu
sine
ss m
eetin
gs o
f 50
to 5
00 p
eopl
e, th
e bu
lk o
f the
m a
re p
ublic
ly ru
n co
mm
unity
ce
nter
s and
com
mun
ity c
olle
ges.
Tho
ugh
man
y of
thes
e pr
oper
ties w
ere
rece
ntly
con
stru
cted
or
reno
vate
d, a
nd a
ll ar
e ou
tfitte
d w
ith so
me
degr
ee o
f mee
ting
equi
pmen
t, th
ey m
ay n
ot a
ppea
r pr
ofes
sion
al e
noug
h to
app
eal t
o ce
rtain
bus
ines
s use
rs.
H
isto
ric b
uild
ings
com
pris
e th
e ne
xt la
rges
t seg
men
t of d
ay-u
se m
eetin
g sp
ace.
The
se fa
cilit
ies
incl
ude
the
Ope
ra H
ouse
and
Tes
taro
ssa
Win
ery
in L
os G
atos
, the
Foo
thill
Clu
b in
Sar
atog
a, a
nd
the
Vill
a R
agus
a in
Cam
pbel
l. H
owev
er, h
isto
ric fa
cilit
ies m
ay b
e m
ore
appr
opria
te fo
r wed
ding
s an
d so
cial
func
tions
than
they
are
for m
eetin
gs.
In o
rder
to h
old
a m
eetin
g on
-site
, bus
ines
ses
ofte
n ha
ve to
eith
er su
pply
thei
r ow
n au
diov
isua
l equ
ipm
ent o
r wor
k th
roug
h th
e fa
cilit
y to
obt
ain
it fo
r a fe
e.
44 W
hile
the
HP
Pavi
lion
is a
lso
loca
ted
with
in th
e M
arke
t Are
a, it
is n
ot li
kely
that
a lo
cal b
usin
ess l
ooki
ng to
ho
ld a
mee
ting
wou
ld v
iew
it a
s a d
esira
ble
site
. B
AE
atte
mpt
ed u
nsuc
cess
fully
on
seve
ral o
ccas
ions
to c
onta
ct
mee
ting
staf
f at t
he P
avili
on in
ord
er to
con
firm
the
user
pro
file.
Nor
th F
orty
Spe
cific
Pla
n M
arke
t Stu
dy a
nd B
usin
ess D
evel
opm
ent S
trate
gy
Page
102
of 1
50

N
orth
For
ty S
peci
fic P
lan
Mar
ket S
tudy
and
Bus
ines
s Dev
elop
men
t Stra
tegy
Pa
ge 1
03 o
f 150
Figu
re 1
8: E
xist
ing
Day
-Use
Mee
ting
Faci
litie
s, M
arke
t Are
a
So
urce
: BAE
, 201
1

Table 29: Comparable Day-Use Meeting Facilities, Market Area (a) Name Capacity by ConfigurationLocation/Drive Time Description Meeting Space Size (sf) Theater Class Banquet Reception Amenities
Los GatosOpera House Banquet Facility Historic building Main Room 3,500 250 60 260 350 Comp. WiFi, 140 W. Main St. (7 mins) in downtown Mezzanine 1,400 75 30 50 190 tables, chairs,
Los Gatos dinnerware;on-site caterer
Testarossa Winery Historic vineyard Palazzio Room 1,655 80 60 120 120 Comp. WiFi, 300-A College Ave. (9 mins) near downtown tables, chairs,
Los Gatos dinnerware,non-alcoholic drinks; meetingequipmentavailable (fee);wine discounts
Jewish Community Center Modern community Auditorium 4,000 450 N/A 250 N/A Meeting14855 Oka Rd. (1 min) center across equipment
Hwy. 17 from the avalable;North 40 on-site caterer;
kosher only
CampbellVilla Ragusa Historic building East Gallery Combo 8,700 600 500 475 N/A Comp. tables, 35 S. Second St. (9 mins) in downtown West Gallery Combo 7,000 500 350 350 N/A chairs,
Campbell East Gallery 5,000 450 350 250 N/A dinnerware;Campbell Gallery 3,700 275 175 175 N/A full commercialWest Gallery 3,200 275 175 175 N/A kitchen; meeting
equipment available (fee)
CupertinoDe Anza College Community Main Dining Room 10,080 528 450 450 N/A21250 Stevens Creek Blvd. (12 mins) college w/ renov. Conference A/B 5,022 400 280 280 N/A
meeting spaces Conference A 2,494 150 72 72 N/Aavailable for rent Conference B 3,132 200 125 125 N/A
Fireside Lounge 2,250 90 120 120 N/A
North Forty Specific Plan Market Study and Business Development Strategy Page 104 of 150

Table 29: Comparable Day-Use Meeting Facilities, Market Area (a) (cont.)
Name Capacity by ConfigurationLocation/Drive Time Description Meeting Space Size (sf) Theater Class Banquet Reception Amenities
Community Hall Modern, City- Community Room N/A 170 50 152 320 Comp. tables,10350 Torre Ave. (13 mins) owned event chairs; meeting
facility in Civic equipmentCenter; doubles available;as Council catering kitchen;chambers; built green room2007
Quinlan Community Center City-owned Cupertino Room 4,000 300 100 275 300 Comp. tables,10185 N. Stelling Rd. (13 mins) community center; Social Room 875 80 50 80 100 chairs; meeting
doubles as City equipmentoffices and available;multipurpose full svc. kitchenspace; built 1990
San JoseCamden Community Center City-owned Multiuse Room 4,200 300 200 250 400 Comp. tables,3369 Union Ave. (6 mins) community center; chairs; meeting
renov. 2006 equipmentavailable
SaratogaSaratoga Community Center City-owned Multipurpose Room 3,250 300 200 200 300 Comp. tables,19655 Allendale Ave. (10 mins) community/senior Senior Center Room 2,200 200 125 125 200 chairs; projector
center in Civic available; 2 fullCenter svc. kitchens
Saratoga Foothill Club Historic social hall Main Room N/A 200 N/A 150 150 Comp. tables,20399 Park Pl. (12 mins) near downtown chairs; full svc.
Saratoga; redwood kitcheninteriors; designedby Julia Morgan
North Forty Specific Plan
Market Study and Business Development Strategy
Page 105 of 150
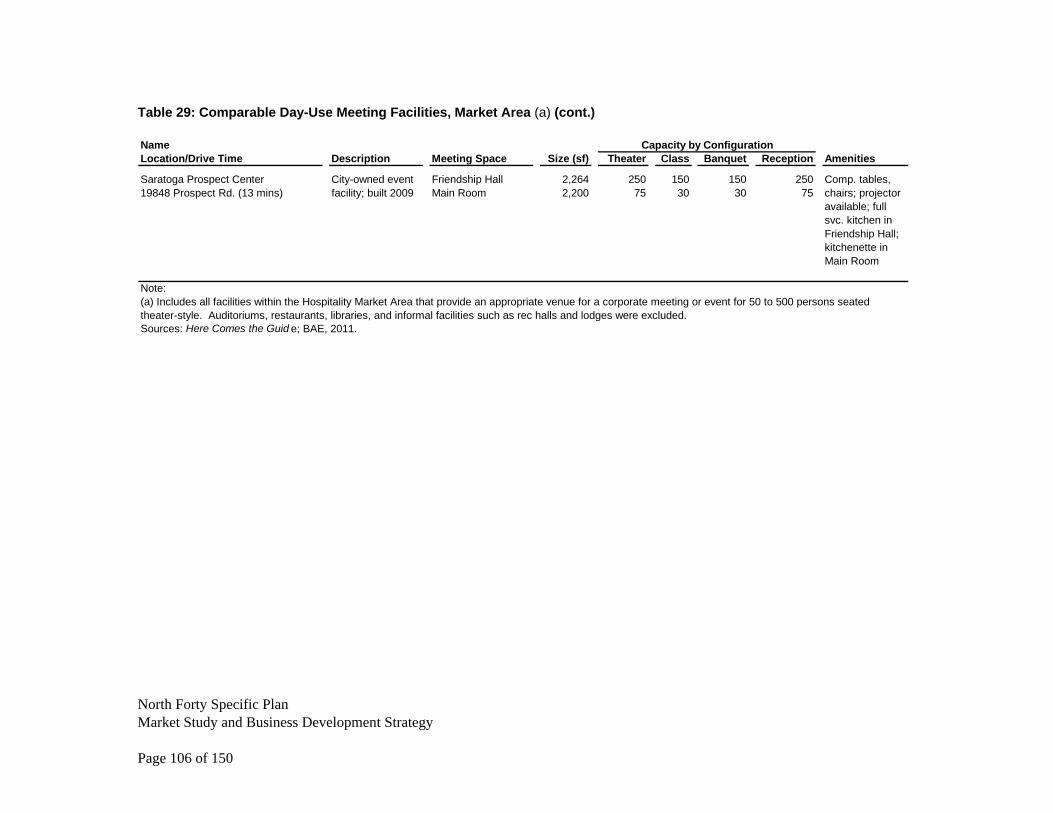
North Forty Specific Plan Market Study and Business Development Strategy Page 106 of 150
Table 29: Comparable Day-Use Meeting Facilities, Market Area (a) (cont.) Name Capacity by ConfigurationLocation/Drive Time Description Meeting Space Size (sf) Theater Class Banquet Reception Amenities
Saratoga Prospect Center City-owned event Friendship Hall 2,264 250 150 150 250 Comp. tables,19848 Prospect Rd. (13 mins) facility; built 2009 Main Room 2,200 75 30 30 75 chairs; projector
available; full svc. kitchen inFriendship Hall; kitchenette in Main Room
Note:(a) Includes all facilities within the Hospitality Market Area that provide an appropriate venue for a corporate meeting or event for 50 to 500 persons seated theater-style. Auditoriums, restaurants, libraries, and informal facilities such as rec halls and lodges were excluded.Sources: Here Comes the Guid e; BAE, 2011.

Dem
and
from
Maj
or E
mpl
oyer
s It
is a
ssum
ed th
at th
e pr
imar
y so
urce
of d
eman
d fo
r mee
ting
faci
litie
s on
the
Nor
th 4
0 w
ould
be
near
by fi
rms o
r org
aniz
atio
ns th
at re
quire
spac
e fo
r lar
ge g
roup
act
iviti
es, s
uch
as se
min
ars,
sale
s m
eetin
gs, a
nd tr
ade
show
s. T
able
2 in
the
Site
Des
crip
tion
sect
ion
lists
maj
or p
rivat
e- a
nd p
ublic
-se
ctor
em
ploy
ers l
ocat
ed w
ithin
the
Mar
ket A
rea
in o
rder
of d
ista
nce
from
the
subj
ect s
ite.
As d
iscu
ssed
abo
ve, m
edic
al c
ente
rs a
ccou
nt fo
r a si
gnifi
cant
shar
e of
em
ploy
men
t in
the
proj
ect
vici
nity
. G
ood
Sam
arita
n H
ospi
tal,
Col
umbi
a H
ealth
Car
e/M
issi
on O
aks H
ospi
tal,
El C
amin
o H
ospi
tal L
os G
atos
, San
ta C
lara
Val
ley
Med
ical
Cen
ter,
and
O’C
onno
r Hos
pita
l all
lie w
ithin
a
ten-
min
ute
driv
ing
radi
us.
Col
lect
ivel
y, th
is c
onst
ella
tion
of c
ore
heal
th c
are
prov
ider
s em
ploy
s ov
er 1
0,00
0 pe
ople
. Ta
king
into
con
side
ratio
n th
e cl
uste
rs o
f med
ical
off
ices
and
labs
that
ag
glom
erat
e ar
ound
eac
h ho
spita
l, he
alth
car
e is
a m
ajor
eco
nom
ic fo
rce
in th
e W
est V
alle
y—on
e th
at g
rew
by
over
two
perc
ent a
nnua
lly C
ount
ywid
e be
twee
n 20
00 a
nd 2
009.
W
hile
San
ta C
lara
Val
ley
Med
ical
Cen
ter a
nd O
’Con
nor H
ospi
tal a
re si
tuat
ed c
lose
r to
mee
ting
hote
ls in
Cam
pbel
l and
San
Jose
, as w
ell a
s Cam
pbel
l’s V
illa
Rag
usa,
the
Nor
th 4
0 is
idea
lly
situ
ated
to se
rve
Goo
d Sa
mar
itan,
Mis
sion
Oak
s, an
d El
Cam
ino’
s Los
Gat
os c
ampu
s. In
terv
iew
s w
ith m
eetin
g pl
anne
rs fr
om G
ood
Sam
arita
n an
d El
Cam
ino
Hos
pita
l ind
icat
e th
at w
hile
El
Cam
ino
gene
rate
s litt
le d
eman
d fo
r off
-site
mee
ting
spac
e, G
ood
Sam
arita
n co
nduc
ts a
n av
erag
e of
tw
o of
f-si
te m
eetin
gs p
er q
uarte
r. T
hese
incl
ude
boar
d m
eetin
gs, d
irect
or m
eetin
gs, u
nion
-ba
rgai
ning
sess
ions
, and
oth
er e
vent
s. G
ood
Sam
arita
n cu
rren
tly u
ses t
he T
oll H
ouse
Hot
el fo
r co
nven
tiona
l mee
tings
bec
ause
of i
ts p
roxi
mity
, but
ofte
n lo
oks u
p to
15
mile
s aw
ay fo
r ven
ues t
o ho
st it
s dire
ctor
mee
tings
, whi
ch re
quire
an
ambi
ence
that
app
eals
to e
xecu
tive
clie
ntel
e. H
igh-
end
mee
tings
mak
e up
the
bulk
of o
ff-s
ite e
vent
s gen
erat
ed b
y th
e ho
spita
l. In
add
ition
to h
ealth
car
e, T
able
2 sh
ows t
hat i
nfor
mat
ion
tech
nolo
gy is
the
othe
r key
priv
ate
empl
oym
ent e
ngin
e in
the
Mar
ket A
rea.
Los
Gat
os it
self
hous
es a
por
tion
of V
eriz
on’s
cor
pora
te
offic
es a
nd th
e he
adqu
arte
rs o
f ris
ing
e-co
mm
erce
pow
erho
use
Net
flix,
loca
ted
only
a fe
w m
inut
es
from
the
Nor
th 4
0. H
owev
er, t
he la
rges
t clu
ster
s of t
ech
firm
s with
in th
e M
arke
t Are
a ar
e lo
cate
d in
Cup
ertin
o an
d Sa
n Jo
se.
In
San
Jose
, the
Mar
ket A
rea
enca
psul
ates
the
offic
es o
f eB
ay a
nd X
ilinx
—a
sem
icon
duct
or
desi
gner
—w
hile
exc
ludi
ng th
e bu
lk o
f the
city
’s te
ch fi
rms,
whi
ch a
re lo
cate
d do
wnt
own
and
in
Nor
th S
an Jo
se.
Nev
erth
eles
s, bo
th o
f the
se fi
rms h
ave
the
pote
ntia
l to
gene
rate
dem
and
for N
orth
40
mee
ting
spac
e, p
artic
ular
ly X
ilinx
, who
se C
ambr
ian
Park
off
ices
are
loca
ted
in re
lativ
e is
olat
ion
from
mos
t of t
he V
alle
y’s b
usin
ess s
ervi
ces.
In a
dditi
on, C
uper
tino
is h
ome
to th
e w
orld
wid
e he
adqu
arte
rs o
f App
le a
s wel
l as o
ffic
es o
f Red
woo
d C
ity-b
ased
Ora
cle
and
smal
ler s
oftw
are
com
pani
es su
ch a
s Tre
nd M
icro
and
Peg
asys
tem
s.45
Whi
le th
ese
firm
s and
oth
ers a
mou
nt to
a
N
orth
For
ty S
peci
fic P
lan
Mar
ket S
tudy
and
Bus
ines
s Dev
elop
men
t Stra
tegy
Pa
ge 1
07 o
f 150
45 W
hile
HP
curr
ently
hou
ses a
ppro
xim
atel
y 3,
000
empl
oyee
s in
Cup
ertin
o, th
e co
mpa
ny h
as a
nnou
nced
pla
ns
to re
loca
te th
ose
jobs
to P
alo
Alto
by
the
end
of 2
012;
App
le In
c. h
as re
cent
ly a
nnou
nced
pla
ns to
rede
velo
p th
e
sign
ifica
nt n
ode
with
in S
ilico
n V
alle
y’s i
nnov
atio
n ec
onom
y, C
uper
tino
is re
lativ
ely
satu
rate
d w
ith
both
hot
el a
nd d
ay-u
se m
eetin
g op
tions
, and
will
onl
y be
com
e m
ore
so o
nce
mee
ting
hote
ls n
ow in
th
e pi
pelin
e be
com
e av
aila
ble.
H
P si
te fo
r a n
ew c
orpo
rate
cam
pus t
hat c
ould
ulti
mat
e pe
rmit
the
com
pany
to h
ouse
up
to 1
2,00
0 em
ploy
ees i
n C
uper
tino
.
Nor
th F
orty
Spe
cific
Pla
n M
arke
t Stu
dy a
nd B
usin
ess D
evel
opm
ent S
trate
gy
Page
108
of 1
50
Op
po
rtu
nit
ies
& S
tra
teg
ies
fo
r D
ev
elo
pm
en
t
Ove
rvie
w
The
Nor
th 4
0 si
te, a
t the
inte
rsec
tion
of tw
o m
ajor
free
way
s in
a m
ajor
met
ropo
litan
are
a, in
a
loca
le w
ith a
ver
y st
rong
dem
ogra
phic
pro
file,
is e
xtre
mel
y w
ell-s
ituat
ed to
cap
ture
reta
il sa
les a
nd
othe
r bus
ines
s fro
m re
side
nts o
f Los
Gat
os a
nd o
ther
nea
rby
com
mun
ities
, and
bey
ond.
Giv
en th
e si
te’s
stro
ng lo
catio
nal a
ttrib
utes
, it i
s lik
ely
that
any
of a
bro
ad ra
nge
of b
usin
ess t
ypes
wou
ld b
e ve
ry su
cces
sful
at s
ite.
How
ever
, Los
Gat
os re
side
nts a
nd e
lect
ed o
ffic
ials
are
legi
timat
ely
conc
erne
d ab
out i
mpa
cts o
n ot
her b
usin
esse
s in
the
Tow
n, p
artic
ular
ly th
e D
ownt
own
Cor
e w
hich
is
a m
ajor
ass
et o
f the
Tow
n, a
nd se
eks u
ses t
hat w
ould
be
com
plem
enta
ry to
the
Dow
ntow
n. T
he
Tow
n al
so d
esire
s to
pres
erve
its s
mal
l-tow
n ch
arac
ter,
as st
ated
in it
s Gen
eral
Pla
n. T
he G
ener
al
Plan
als
o st
ates
, tho
ugh,
that
ther
e is
ove
rall
com
mun
ity c
onse
nsus
that
the
tow
n be
a “
full-
serv
ice
com
mun
ity th
at is
als
o en
viro
nmen
tally
sens
itive
” an
d sh
ould
“su
ppor
t an
activ
e bu
sine
ss
com
mun
ity th
at p
rovi
des a
wid
e va
riety
of g
oods
and
serv
ices
and
a b
road
rang
e of
em
ploy
men
t op
portu
nitie
s, m
inim
izin
g th
e ne
ed to
trav
el to
oth
er c
omm
uniti
es.”
46 T
he p
roce
ss o
f dev
elop
ing
the
Nor
th 4
0 si
te is
in la
rge
part
a pr
oces
s of b
alan
cing
the
goal
s of r
etai
ning
the
Tow
n’s s
mal
l-to
wn
char
acte
r whi
le e
xpan
ding
the
busi
ness
com
mun
ity su
ch th
at L
os G
atos
resi
dent
s hav
e le
ss
need
to tr
avel
els
ewhe
re fo
r goo
ds a
nd se
rvic
es.
Th
e G
ener
al P
lan
EIR
pro
vide
s gen
eral
gui
delin
es fo
r the
cur
rent
Nor
th 4
0 Sp
ecifi
c Pl
an P
roce
ss:
•
Com
plem
ent a
nd n
ot c
ompe
te w
ith L
os G
atos
’ Dow
ntow
n an
d th
e re
st o
f the
com
mun
ity.
• B
e ba
sed
on su
stai
nabl
e an
d “s
mar
t” d
evel
opm
ent p
ract
ices
. •
Inco
rpor
ate
mix
ed-u
se d
evel
opm
ent w
ith re
side
ntia
l use
s to
the
sout
h an
d re
tail
mix
ed-u
se to
the
north
. •
Incl
ude
a pl
aza
at th
e ce
nter
of t
he m
ixed
-use
are
a an
d a
park
at t
he c
ente
r of t
he re
side
ntia
l are
a.
• Pr
ovid
e fo
r a v
arie
ty o
f res
iden
tial h
ousi
ng ty
pes,
both
rent
al a
nd o
wne
r occ
upie
d.
• Pr
ovid
e at
leas
t 150
uni
ts o
f hou
sing
aff
orda
ble
to h
ouse
hold
s at t
he m
oder
ate
inco
me
leve
l or
belo
w.
• In
clud
e hi
gh-q
ualit
y ar
chite
ctur
e an
d de
sign
that
refle
cts t
he ru
ral a
nd a
gric
ultu
ral h
isto
ry o
f the
site
. •
Prov
ide
pede
stria
n-or
ient
ed b
uild
ings
alo
ng th
e Lo
s Gat
os B
oule
vard
fron
tage
, with
min
imal
pa
rkin
g or
ient
ed to
the
stre
et.
• Ta
ke a
dvan
tage
of t
he g
rade
cha
nge
acro
ss th
e si
te b
y in
clud
ing
split
-leve
l bui
ldin
gs th
at a
llow
for
two
floor
s of r
etai
l and
“tu
ck u
nder
” pa
rkin
g.
• C
ontin
ue th
e “b
oule
vard
trea
tmen
t” a
long
Los
Gat
os B
oule
vard
, with
inte
rcon
nect
ions
from
one
pa
rcel
’s d
rive
aisl
e to
the
next
.
N
orth
For
ty S
peci
fic P
lan
Mar
ket S
tudy
and
Bus
ines
s Dev
elop
men
t Stra
tegy
Pa
ge 1
09 o
f 150
46 T
own
of L
os G
atos
202
0 G
ener
al P
lan,
pre
pare
d fo
r the
Tow
n of
Los
Gat
os, p
repa
red
by D
esig
n, C
omm
unity
&
Env
ironm
ent,
Janu
ary
7, 2
011,
p. V
IS-1
.

• In
clud
e co
nnec
tions
to e
xist
ing
inte
rsec
tions
alo
ng L
os G
atos
Bou
leva
rd a
nd L
ark
Ave
nue.
•
Dev
elop
gat
eway
or l
andm
ark
feat
ures
at L
os G
atos
Bou
leva
rd a
nd L
ark
Ave
nue,
and
at L
os G
atos
B
oule
vard
and
the
Hig
hway
85
off r
amp.
•
Prov
ide
an e
asily
acc
essi
ble,
fully
con
nect
ed st
reet
net
wor
k th
at e
ncou
rage
s wal
king
. •
Prov
ide
a ve
geta
tive
buff
er a
nd sc
reen
ing
alon
g H
ighw
ays 1
7 an
d 85
. •
Pres
erve
Tow
n ch
arac
ter a
nd v
iew
s, in
clud
ing:
Pres
ervi
ng v
iew
s of t
he h
ills f
rom
Hig
hway
s 17
and
85.
Li
mit
build
ing
heig
hts t
o a
two-
stor
y m
axim
um a
long
Los
Gat
os B
oule
vard
.
Lim
it bu
ildin
g he
ight
s to
a fo
ur-s
tory
max
imum
on
mos
t of t
he si
te.
Pr
ovid
e fo
r the
pos
sibl
e de
velo
pmen
t of a
max
imum
five
stor
y ho
tel.47
Th
e G
ener
al P
lan,
for t
he p
urpo
ses o
f its
EIR
, des
crib
es a
max
imum
bui
ldab
le e
nvel
ope
for t
he si
te
to a
sses
s im
pact
s and
gui
de fu
ture
dev
elop
men
t. T
he st
ated
land
use
mix
pro
vide
s for
max
imum
ca
paci
ty o
f 750
hou
sing
uni
ts a
nd 5
80,0
00 sq
uare
feet
of r
etai
l and
off
ice
uses
on
the
site
, as w
ell a
s a
hote
l. T
he u
ltim
atel
y ap
prov
ed p
lan
may
pro
vide
for a
low
er d
ensi
ty o
f dev
elop
men
t. Th
e fo
llow
ing
disc
ussi
on o
f pot
entia
l ret
ail,
offic
e, h
otel
, and
con
fere
nce
cent
er o
ppor
tuni
ties i
s in
the
cont
ext o
f bot
h th
e m
arke
t ass
essm
ent a
nd th
ese
Tow
n gu
idel
ines
for t
he N
orth
40
site
. R
etai
l Dev
elop
men
t Opp
ortu
nitie
s La
rge-
Form
at R
etai
l Th
e re
tail
anal
ysis
not
ed se
vera
l gap
s in
the
over
all r
etai
l mix
in L
os G
atos
, whe
re th
ere
wou
ld b
e op
portu
nitie
s to
broa
den
the
Tow
n’s r
etai
l bas
e. T
he tw
o m
ajor
cat
egor
ies w
ith su
bsta
ntia
l lea
kage
ar
e ge
nera
l mer
chan
dise
stor
es a
nd b
uild
ing
mat
eria
ls st
ores
. In
par
ticul
ar, t
he T
own
is la
ckin
g in
a
larg
e de
partm
ent s
tore
(dis
coun
t/goo
d va
lue
such
as T
arge
t or N
ords
trom
Rac
k or
regu
lar,
such
as
Nor
dstro
m M
acy’
s, or
JC P
enne
y), a
nd a
hom
e im
prov
emen
t cen
ter s
uch
as H
ome
Dep
ot.
Whi
le
som
e of
the
item
s sto
cked
by
thes
e st
ores
can
be
foun
d at
loca
l dru
g st
ores
, har
dwar
e st
ores
, and
ot
her o
utle
ts, t
he le
vel o
f lea
kage
con
firm
s tha
t Tow
n re
side
nts a
re le
avin
g Lo
s Gat
os to
shop
at
larg
er st
ores
such
as T
arge
t or m
all d
epar
tmen
t sto
res t
hat c
arry
a b
road
rang
e of
goo
ds.
Los G
atos
al
so h
as li
mite
d sa
les i
n st
ores
car
ryin
g m
ajor
app
lianc
es, s
uch
as B
est B
uy, S
ears
, or W
este
rn
App
lianc
e. A
s not
ed th
e lik
ely
cand
idat
es a
re la
rge-
form
at st
ores
whi
ch u
sual
ly re
quire
larg
e flo
or
plat
es48
, suc
h as
Tar
get,
Low
e’s,
or B
est B
uy.49
Whi
le th
ese
stor
es w
ould
be
com
plem
enta
ry to
the
47 T
own
of L
os G
atos
202
0 G
ener
al P
lan,
pre
pare
d fo
r the
Tow
n of
Los
Gat
os, p
repa
red
by D
esig
n, C
omm
unity
&
Env
ironm
ent,
Janu
ary
7, 2
011,
pp.
3-2
1 to
3-2
3.
48 In
the
cont
ext o
f the
reta
il sp
ace
inve
ntor
y in
Los
Gat
os, l
arge
-for
mat
reta
il is
def
ined
her
e as
stor
es re
quiri
ng
30,0
00 sq
uare
feet
or m
ore
of sp
ace.
49
Eve
n th
ough
ther
e is
a T
arge
t nea
rby
in S
an Jo
se, t
his s
ite is
a st
rong
er lo
catio
n, a
nd if
the
mar
ket i
s stro
ng
enou
gh, T
arge
t will
bui
ld st
ores
in c
lose
pro
xim
ity.
One
exa
mpl
e is
in th
e Ea
st B
ay, w
here
Tar
get r
ecen
tly
Nor
th F
orty
Spe
cific
Pla
n M
arke
t Stu
dy a
nd B
usin
ess D
evel
opm
ent S
trate
gy
Page
110
of 1
50

exis
ting
reta
il m
ix in
the
Tow
n, a
nd w
ould
be
less
like
ly to
com
pete
with
exi
stin
g st
ores
, esp
ecia
lly
thos
e D
ownt
own,
it is
cle
ar th
at sa
tisfy
ing
this
reta
il de
man
d w
hile
reta
inin
g th
e To
wn’
s sm
all-
tow
n ch
arac
ter a
nd m
eetin
g th
e ge
nera
l gui
delin
es fo
r dev
elop
men
t on
the
Nor
th 4
0 si
te re
pres
ents
a
com
plex
bal
anci
ng a
ct.
His
toric
ally
, the
com
pani
es o
pera
ting
thes
e st
ores
pre
fer l
arge
floo
r pla
tes o
n a
sing
le fl
oor w
ith
exte
nsiv
e su
rfac
e pa
rkin
g, b
ut in
rece
nt y
ears
they
hav
e sh
own
mor
e fle
xibi
lity
in st
ore
conf
igur
atio
n in
ord
er to
ent
er d
esira
ble
unde
rser
ved
mar
kets
whe
re la
rge
vaca
nt p
arce
ls a
re
unav
aila
ble
for t
radi
tiona
l lar
ge-f
orm
at re
tail
deve
lopm
ent,
parti
cula
rly in
bui
lt ou
t urb
aniz
ed a
reas
. A
ppen
dix
G p
rese
nts s
ever
al e
xam
ples
of s
tore
s on
mul
tiple
-flo
or st
ore
spac
es a
nd in
mix
-use
co
nfig
urat
ions
acr
oss t
he n
atio
n, in
clud
ing
Targ
et, W
alm
art,
Bes
t Buy
, Hom
e D
epot
, and
Who
le
Food
s in
seve
ral m
ajor
U.S
. citi
es.
In a
noth
er m
ore
loca
l exa
mpl
e, in
San
Fra
ncis
co T
arge
t rec
ently
be
gan
reno
vatio
ns to
bui
ld a
smal
ler-
form
at st
ore
of a
ppro
xim
atel
y 85
,000
squa
re fe
et in
the
Met
reon
com
plex
in S
an F
ranc
isco
. W
hile
Los
Gat
os re
pres
ents
a le
ss u
rban
mar
ket t
han
thes
e ex
ampl
es, T
arge
t has
bui
lt st
ores
in a
two-
stor
y co
nfig
urat
ion
else
whe
re in
mor
e su
burb
an lo
catio
ns
in th
e B
ay A
rea,
incl
udin
g th
e st
ore
in A
lban
y in
the
East
Bay
. A
maj
or h
ome
impr
ovem
ent s
tore
is
pro
babl
y no
t sui
tabl
e fo
r thi
s site
giv
en d
esig
n an
d si
te c
onst
rain
ts, b
ut e
ven
Low
e’s h
as
cons
truct
ed a
t lea
st o
ne st
ore
in a
hor
izon
tal m
ixed
use
con
figur
atio
n; in
Cha
rlotte
, NC
, the
re is
a
Low
e’s p
rovi
ding
roof
top
park
ing
whi
ch is
buf
fere
d fr
om a
resi
dent
ial n
eigh
borh
ood
by
tow
nhou
ses o
n tw
o si
des.
Sp
ecia
lty F
ood
For s
peci
alty
food
stor
es su
ch a
s mea
t mar
kets
and
pro
duce
mar
kets
, a c
onfig
urat
ion
sim
ilar t
o M
arke
t Hal
l in
the
Roc
krid
ge n
eigh
borh
ood
in N
orth
Oak
land
whe
re sh
oppe
rs c
an w
alk
thro
ugh
mul
tiple
stor
es u
nder
one
roof
, or i
nste
ad w
ith e
ach
stor
e or
ient
ed m
ore
tow
ard
the
side
wal
k an
d st
reet
, sho
uld
prov
ide
an a
ppro
pria
te sc
ale
of b
uild
ing
deve
lopm
ent f
or th
is c
ompo
nent
. Th
is ty
pe
of u
se, a
long
with
som
e sm
alle
r per
sona
l ser
vice
bus
ines
ses,
or o
ther
loca
l-ser
ving
bus
ines
ses,
wou
ld a
lso
be su
ppor
ted
by re
side
nts o
f any
new
hou
sing
dev
elop
ed o
n th
e N
orth
40
site
, en
hanc
ing
the
pede
stria
n or
ient
atio
n of
the
deve
lopm
ent.
Alth
ough
ther
e is
som
e ris
k th
at sp
ecia
lty
food
mar
kets
cou
ld c
anni
baliz
e sa
les f
rom
the
exis
ting
supe
rmar
kets
, the
y w
ould
als
o en
hanc
e Lo
s G
atos
Bou
leva
rd’s
pos
ition
as a
gro
cery
des
tinat
ion
and
thus
may
attr
act a
dditi
onal
food
shop
pers
to
Los
Gat
os.
Fo
rmul
a R
etai
l Th
e re
tail
anal
ysis
indi
cate
d th
at w
hile
form
ula
reta
ilers
con
stitu
te a
smal
l per
cent
age
of st
ores
in
the
Dow
ntow
n, th
ey a
ccou
nt fo
r a si
gnifi
cant
ly h
ighe
r per
cent
age
of re
tail
sale
s, es
peci
ally
in th
e ap
pare
l and
hom
e fu
rnis
hing
s/ap
plia
nces
cat
egor
y. G
iven
the
build
able
env
elop
e of
com
mer
cial
sp
ace
at th
e N
orth
40
site
, eve
n if
som
e la
rger
gen
eral
mer
chan
dise
or a
pplia
nce
stor
es lo
cate
in th
e pr
ojec
t alo
ng w
ith so
me
smal
l spe
cial
ty a
nd lo
cal-s
ervi
ng b
usin
esse
s, th
ere
is th
e po
tent
ial f
or
cons
ider
ably
mor
e re
tail
spac
e. A
s not
ed p
revi
ousl
y, th
e lo
catio
n at
the
inte
rsec
tion
of tw
o m
ajor
N
orth
For
ty S
peci
fic P
lan
Mar
ket S
tudy
and
Bus
ines
s Dev
elop
men
t Stra
tegy
Pa
ge 1
11 o
f 150
open
ed a
stor
e in
Em
eryv
ille,
onl
y a
few
min
ute’
s driv
e tim
e fr
om it
s Alb
any
stor
e. I
n C
olm
a/D
aly
City
, Ta
rget
has
stor
es e
ven
clos
er to
geth
er, o
n op
posi
te si
des o
f the
sam
e hi
ghw
ay in
terc
hang
e.

free
way
s ind
icat
es th
at th
is is
a p
rime
loca
tion
for r
egio
n-se
rvin
g re
tail,
whi
ch c
ould
take
the
form
of
add
ition
al fo
rmul
a re
tail
stor
es.
A
s the
Dow
ntow
n fo
cus h
as b
een
to re
tain
and
exp
and
its sm
all t
own
appe
al, i
t may
ulti
mat
ely
beco
me
even
mor
e fo
cuse
d on
inde
pend
ent s
tore
s as i
t rep
ositi
ons.
If th
e To
wn,
how
ever
, is
proa
ctiv
e in
con
tinui
ng to
sche
dule
con
certs
, far
mer
s mar
kets
, and
oth
er e
vent
s Dow
ntow
n, a
s wel
l as
wor
king
with
the
deve
lope
r of t
he N
orth
40
site
on
coor
dina
ted
mar
ketin
g ef
forts
, the
impa
cts
mig
ht b
e su
ffic
ient
ly m
itiga
ted.
The
Dow
ntow
n w
ould
still
pro
vide
an
attra
ctiv
e sh
oppi
ng a
nd
dini
ng d
estin
atio
n; R
ockr
idge
Ave
nue
or P
iedm
ont A
venu
e in
Nor
th O
akla
nd p
rovi
de e
xam
ples
of
succ
essf
ul re
tail
dist
ricts
with
ver
y lit
tle fo
rmul
a re
tail.
Th
e st
reng
ths o
f the
Nor
th 4
0 si
te a
s a re
gion
al d
estin
atio
n w
ith st
rong
dem
ogra
phic
s sho
uld
prov
ide
the
ince
ntiv
e fo
r ret
aile
rs to
be
mor
e fle
xibl
e as
to h
ow a
stor
e is
scal
ed a
nd c
onfig
ured
, su
ch th
at th
e de
sign
is d
eem
ed a
ppro
pria
te fo
r the
Tow
n an
d do
es n
ot g
ive
the
appe
aran
ce o
f a
subu
rban
pow
er c
ente
r. F
or th
is p
artic
ular
site
, the
larg
er re
tail
uses
shou
ld b
e co
nfig
ured
on
the
north
end
of t
he si
te w
ith a
ny o
ther
larg
e us
ers (
e.g.
, hot
el),
with
smal
ler m
ixed
-use
, suc
h as
bu
ildin
gs c
onta
inin
g sp
ecia
lty fo
od o
r oth
er sm
alle
r sho
ps w
ith o
ffic
e or
resi
denc
es a
bove
, cou
ld
act a
s a b
uffe
r for
mor
e re
side
ntia
l are
as.
M
ovie
The
ater
s/En
tert
ainm
ent C
ente
r O
ne c
omm
erci
al u
se th
at h
as n
ot b
een
expl
ored
in th
is re
port
but w
as m
entio
ned
in th
e ke
y in
form
ant i
nter
view
s is t
he p
oten
tial f
or a
new
mov
ie th
eate
r/ent
erta
inm
ent c
ompl
ex.
Dow
ntow
n Lo
s Gat
os h
as a
smal
l mov
ie th
eate
r, bu
t the
Tow
n m
ight
ben
efit
from
add
ition
al sc
reen
s off
erin
g a
broa
der v
arie
ty o
f mov
ies;
som
e th
eate
r-go
ers a
t the
Nor
th 4
0 si
te m
ight
als
o ch
oose
to d
ine
in th
e D
ownt
own,
esp
ecia
lly if
cro
ss-p
rom
otio
nal e
ffor
ts a
re u
nder
take
n. I
n ad
ditio
n to
mov
ie th
eate
rs,
ther
e m
ay b
e op
portu
nitie
s to
inco
rpor
ate
othe
r lar
ger f
amily
ent
erta
inm
ent v
enue
s suc
h as
a
bow
ling
alle
y, a
rock
clim
bing
gym
, an
indo
or sp
orts
cen
ter,
or si
mila
r oth
er re
crea
tion-
rela
ted
uses
. W
hile
the
anal
ysis
her
e ha
s not
cov
ered
thes
e us
es, t
he d
evel
oper
s sho
uld
expl
ore
the
pote
ntia
l for
such
use
s at t
he N
orth
40
site
. Th
e D
ownt
own
thea
ter h
as re
cent
ly se
en a
n ow
ners
hip
chan
ge, a
nd T
own
staf
f rep
ort t
hat p
lans
are
to c
onve
rt ba
ck to
a si
ngle
aud
itoriu
m, a
nd re
purp
ose
it su
ch th
at it
is a
lso
avai
labl
e as
a lo
cal p
erfo
rmin
g ar
ts o
r mee
ting
spac
e.
Sum
mar
y of
Ret
ail O
ppor
tuni
ties
The
dow
ntow
n th
eate
r iss
ue e
pito
miz
es so
me
of th
e is
sues
that
nee
d to
be
cons
ider
ed in
co
nsid
erin
g th
e ba
lanc
e be
twee
n th
e ex
istin
g bu
sine
sses
in L
os G
atos
, and
gro
win
g th
e ov
eral
l bu
sine
ss b
ase
to th
e be
nefit
of t
he e
ntire
Tow
n an
d w
ith re
spec
t to
bein
g ab
le to
pro
vide
a g
reat
er
varie
ty o
f sho
ppin
g op
portu
nitie
s. S
ome
of th
e ke
y fa
ctor
s to
cons
ider
in th
is b
alan
cing
act
are
as
follo
ws:
• W
hile
man
y of
thes
e re
tail
and
ente
rtain
men
t use
s wou
ld g
ener
ally
be
com
plem
enta
ry to
th
e D
ownt
own,
it is
impo
rtant
to re
cogn
ize
that
it w
ould
be
virtu
ally
impo
ssib
le to
find
a
reta
il us
e th
at w
ould
not
com
pete
at l
east
som
ewha
t with
exi
stin
g st
ores
in th
e D
ownt
own
Nor
th F
orty
Spe
cific
Pla
n M
arke
t Stu
dy a
nd B
usin
ess D
evel
opm
ent S
trate
gy
Page
112
of 1
50
and
else
whe
re in
Los
Gat
os.
For e
xam
ple,
Tar
get s
tore
s ofte
n in
clud
e a
phar
mac
y, w
hich
co
uld
com
pete
with
exi
stin
g dr
ug st
ores
in T
own,
and
Bes
t Buy
sells
a se
lect
ion
of A
pple
pr
oduc
ts.
How
ever
, the
four
nei
ghbo
rhoo
d ce
nter
s wou
ld p
roba
bly
be re
lativ
ely
unaf
fect
ed
by re
gion
-ser
ving
use
s at t
he N
orth
40
site
, sin
ce th
ey a
re st
rong
ly o
rient
ed to
war
d ne
ighb
orho
od c
onve
nien
ce sh
oppi
ng.
•
The
Dow
ntow
n’s u
niqu
e ch
arac
ter i
s bas
ed o
n th
e la
rge
varie
ty o
f and
mix
of i
ndep
ende
nt
shop
s in
smal
ler s
pace
s cre
atin
g a
smal
l-tow
n at
mos
pher
e, w
ith a
lim
ited
num
ber o
f fo
rmul
a re
tail
busi
ness
es.
How
ever
, the
form
ula
reta
il cu
rren
tly lo
cate
d in
the
Cor
e ac
coun
ts fo
r a si
gnifi
cant
per
cent
age
of re
tail
sale
s, an
d dr
aws s
hopp
ers t
hat m
ay a
lso
patro
nize
the
inde
pend
ent s
tore
s. T
o th
e ex
tent
that
new
dev
elop
men
t at t
he N
orth
40
coul
d ca
use
any
form
ula
reta
ilers
to re
loca
te fr
om D
ownt
own,
this
cou
ld h
ave
impa
cts o
n re
mai
ning
bus
ines
ses t
here
, and
may
requ
ire a
djus
tmen
ts th
at c
ould
be
less
pro
blem
atic
if
the
chan
ge is
mor
e gr
adua
l.
• Th
e N
orth
40
also
has
the
pote
ntia
l to
serv
e as
a h
ospi
talit
y di
stric
t ser
ving
nea
rby
med
ical
fa
cilit
ies,
offic
es, a
nd c
linic
s bor
derin
g Lo
s Gat
os in
San
Jose
. N
eigh
borh
ood
and
conv
enie
nce
reta
il, a
long
with
lodg
ing
and
mee
ting
spac
e, w
ould
be
attra
ctiv
e to
the
area
’s
robu
st m
edic
al c
omm
unity
sinc
e it
is w
ithin
a sh
ort w
alk
or d
rive
acro
ss L
os G
atos
B
oule
vard
.
• If
the
Nor
th 4
0 is
dev
elop
ed a
s mix
ed u
se, t
here
will
be
syne
rgie
s ben
efic
ial t
o al
l the
use
s.
For e
xam
ple,
loca
l res
iden
ces w
ould
ben
efit
from
reta
il th
at c
ould
acc
esse
d on
foot
rath
er
than
by
auto
mob
ile.
Ente
rtain
men
t use
s wou
ld b
enef
it fr
om n
earb
y re
stau
rant
s or s
hops
, as
wou
ld a
hot
el/c
onfe
renc
e ce
nter
use
. O
ffic
e us
es m
ight
allo
w fo
r sha
red
park
ing
with
re
tail.
Th
e st
reng
ths o
f the
Nor
th 4
0 si
te a
s a re
gion
al d
estin
atio
n w
ith st
rong
dem
ogra
phic
s sho
uld
prov
ide
the
ince
ntiv
e fo
r ret
aile
rs to
be
mor
e fle
xibl
e as
to h
ow a
stor
e is
scal
ed a
nd c
onfig
ured
, su
ch th
at th
e de
sign
is d
eem
ed a
ppro
pria
te fo
r the
Tow
n an
d do
es n
ot g
ive
the
appe
aran
ce o
f a
subu
rban
pow
er c
ente
r. F
or th
is p
artic
ular
site
, the
larg
er re
tail
uses
shou
ld b
e co
nfig
ured
on
the
north
end
of t
he si
te w
ith a
ny o
ther
larg
e us
ers (
e.g.
, hot
el),
with
smal
ler m
ixed
-use
, suc
h as
bu
ildin
gs c
onta
inin
g sp
ecia
lty fo
od o
r oth
er sm
alle
r sho
ps w
ith o
ffic
e or
resi
denc
es a
bove
, cou
ld
act a
s a b
uffe
r for
mor
e re
side
ntia
l are
as.
In
sum
mar
y, th
ere
is n
o “i
deal
wor
ld”
solu
tion
that
will
per
fect
ly m
eet a
ll th
e va
rious
goa
ls o
f the
Lo
s Gat
os c
omm
unity
– a
ny c
omm
erci
al la
nd u
se p
rodu
ct c
omes
with
som
e le
vel o
f bot
h bu
sine
ss
risk
and
a ne
ed fo
r adj
ustm
ent a
s exi
stin
g bu
sine
sses
adj
ust t
o ac
com
mod
ate
and
com
pete
with
new
re
tail
user
s. C
hang
e re
pres
ents
bot
h ris
k an
d op
portu
nity
. H
opef
ully
, the
Spe
cific
Pla
n pr
oces
s w
ill le
ad to
thou
ghtfu
l con
side
ratio
n of
thes
e is
sues
as t
he p
lann
ing
and
deve
lopm
ent p
roce
ss
cont
inue
s.
Nor
th F
orty
Spe
cific
Pla
n M
arke
t Stu
dy a
nd B
usin
ess D
evel
opm
ent S
trate
gy
Page
113
of 1
50

Ret
ail D
evel
opm
ent S
trat
egie
s D
evel
opin
g U
ses
Com
plem
enta
ry to
Dow
ntow
n Lo
s G
atos
Th
e G
ener
al P
lan
EIR
gui
danc
e st
ates
that
new
dev
elop
men
t at t
he N
orth
40
shou
ld “
com
plem
ent
and
not c
ompe
te w
ith L
os G
atos
’ dow
ntow
n an
d th
e re
st o
f the
com
mun
ity.”
BA
E ha
s for
mul
ated
se
vera
l stra
tegi
es to
hon
or th
is g
oal o
f com
plem
enta
ry re
tail
deve
lopm
ent:
Ret
ail S
trate
gy 1
: Est
ablis
h a
clea
r diff
eren
ce in
the
shop
ping
exp
erie
nce
betw
een
the
Dow
ntow
n an
d N
orth
40.
The
Tow
n’s F
orm
ula
Ret
ail O
rdin
ance
hel
ps m
aint
ain
the
dow
ntow
n’s
smal
l-tow
n fe
el a
nd a
larg
e pr
esen
ce o
f ind
epen
dent
reta
ilers
with
uni
que
prod
ucts
and
serv
ices
and
lim
its th
e nu
mbe
r of f
orm
ula
reta
ilers
such
as t
he p
rese
nt m
ix o
f Sur
La
Tabl
e, A
pple
Sto
re, B
anan
a R
epub
lic, R
esto
ratio
n H
ardw
are,
and
the
Gap
am
ong
othe
rs.
The
Nor
th 4
0 ex
perie
nce
shou
ld b
e di
ffer
entia
ted
by a
focu
s on
form
ula
reta
il w
ith le
ss e
mph
asis
on
inde
pend
ent r
etai
lers
. A
ddin
g fo
rmul
a re
tail
to th
e To
wn-
wid
e in
vent
ory
of re
tail
prop
ertie
s wou
ld h
elp
Los G
atos
cap
ture
sale
s (a
nd g
ener
ate
addi
tiona
l sal
es ta
x re
venu
e) fr
om T
own
resi
dent
s who
cur
rent
ly tr
avel
out
side
the
tow
n to
shop
at f
orm
ula
reta
il ou
tlets
as w
ell a
s fro
m sh
oppe
rs w
ho w
ould
com
e fr
om o
utsi
de L
os
Gat
os.
Ther
e ar
e se
vera
l loc
al e
xam
ples
of d
ownt
owns
and
new
shop
ping
com
plex
es
com
plem
entin
g ea
ch o
ther
with
such
diff
eren
tiate
d sh
oppi
ng e
xper
ienc
es: D
ownt
own
and
Stan
ford
Sh
oppi
ng C
ente
r in
Palo
Alto
, and
Elm
woo
d/R
ockr
idge
and
Bay
Stre
et in
the
inne
r Eas
t Bay
(B
erke
ley,
Oak
land
, and
Em
eryv
ille)
.
R
etai
l Str
ateg
y 1.
1: F
orm
ulat
e a
coor
dina
ted
mar
ket c
ampa
ign
for
both
the
Dow
ntow
n an
d N
orth
40
reta
il de
velo
pmen
t. A
coo
pera
tive
mar
ketin
g ef
fort
betw
een
the
Tow
n of
Los
Gat
os, l
ocal
Dow
ntow
n m
erch
ants
, and
the
Nor
th 4
0 de
velo
per c
an h
elp
bran
d an
d po
sitio
n ea
ch re
tail
dist
rict a
ppro
pria
tely
to re
info
rce
thei
r res
pect
ive
core
st
reng
ths a
nd c
ross
-mar
ket e
vent
s and
ann
ounc
emen
ts –
all t
o re
info
rce
Los G
atos
as a
sh
oppi
ng d
estin
atio
n.
Ret
ail S
trat
egy
1.2:
Con
tinue
and
Enh
ance
Dow
ntow
n M
erch
ant V
italit
y Pr
ogra
ms.
Th
e To
wn
of L
os G
atos
pre
sent
ly o
pera
tes s
ever
al p
rogr
ams o
rient
ed to
bus
ines
s de
velo
pmen
t and
mer
chan
t ass
ista
nce.
The
se p
rogr
am w
hich
incl
ude
busi
ness
wor
ksho
ps
in p
artn
ersh
ip w
ith th
e C
ham
ber o
f Com
mer
ce a
nd W
est V
alle
y C
olle
ge, m
ento
ring
serv
ices
for s
mal
l bus
ines
ses,
and
mar
ketin
g ev
ents
, sho
uld
be c
ontin
ued
and
enha
nced
to
offe
r ass
ista
nce
to m
erch
ants
dow
ntow
n to
eff
ectiv
ely
mar
ket t
o ne
w sh
oppe
rs b
roug
ht in
by
the
Nor
th 4
0.
Ret
ail S
trat
egy
1.3:
Rei
nfor
ce th
e D
ownt
own’
s Rol
e as
Com
mun
ity H
ub a
nd S
ocia
l C
ente
r. B
y co
ntin
uing
to p
rogr
am F
arm
ers M
arke
ts, m
usic
and
art
fest
ival
s, an
d sp
ecia
l ev
ents
, Los
Gat
os c
an m
aint
ain
the
Dow
ntow
n as
the
Tow
n’s c
omm
unity
hub
. W
ith it
s di
vers
e se
t of b
uild
ings
and
trad
ition
al st
reet
layo
ut th
e D
ownt
own
offe
rs a
n au
then
tic
smal
l dow
ntow
n ex
perie
nce
that
is h
ard
for a
new
dev
elop
men
t tha
t is p
lann
ed a
t one
tim
e to
repr
oduc
e an
d co
mpe
te w
ith.
The
rece
nt re
porte
d pu
rcha
se o
f the
Los
Gat
os T
heat
er b
y
Nor
th F
orty
Spe
cific
Pla
n M
arke
t Stu
dy a
nd B
usin
ess D
evel
opm
ent S
trate
gy
Page
114
of 1
50

a lo
cal i
nves
tmen
t gro
up to
kee
p it
as a
smal
l mov
ie th
eate
r will
boo
st th
e To
wn’
s eff
orts
to
mai
ntai
n a
vita
l Dow
ntow
n.
R
etai
l Str
ateg
y 1.
4: B
rand
ing
and
Iden
tify
for
Los
Gat
os S
hopp
ing
Dis
tric
ts.
The
bran
ding
of t
he N
orth
40
for a
ny re
tail
use
shou
ld b
e ap
proa
ched
from
the
idea
that
stro
ng
iden
titie
s for
all
Los G
atos
’ sho
ppin
g di
stric
ts sh
ould
be
rein
forc
ed a
nd b
rand
ed to
off
er
Los G
atos
as a
who
le “
pack
age”
of s
hopp
ing
and
leis
ure
activ
ities
, inc
ludi
ng n
earb
y w
iner
ies.
Bra
ndin
g an
d id
entit
y sh
ould
be
acco
mpl
ishe
d in
par
t by
wel
l des
igne
d an
d co
nsis
tent
ly a
pplie
d w
ayfin
ding
and
sign
age
treat
men
ts th
at c
lear
ly id
entif
y w
here
one
is
with
in th
e To
wn.
For
new
shop
pers
com
ing
into
Los
Gat
os fo
r ret
ail a
t the
Nor
th 4
0, th
e N
orth
40
coul
d se
rve
as a
“ga
tew
ay”
to th
e To
wn
with
info
rmat
ion
kios
ks (b
oth
porta
ble/
seas
onal
and
per
man
ent).
R
etai
l Str
ateg
y 1.
5: Im
prov
e W
ay F
indi
ng a
nd P
ublic
Par
king
Sig
nage
. So
me
key
info
rman
ts re
porte
d th
at a
per
cept
ion
of la
ck o
f par
king
pre
sent
s a b
arrie
r to
loca
l res
iden
ts
patro
nizi
ng D
ownt
own
mer
chan
ts a
nd b
usin
esse
s. M
ost r
esid
ents
vis
it D
ownt
own
by c
ar
and
park
ing
whi
le a
dequ
ate
is so
met
imes
be
diff
icul
t to
find
or is
not
alw
ays i
n th
e m
ost
conv
enie
nt lo
catio
ns.
Inst
alla
tion
of b
ette
r d
irect
iona
l sig
nage
or e
lect
roni
c si
gns w
ith
avai
labl
e sp
aces
not
ed lo
ts c
ould
hel
p ov
erco
me
this
per
cept
ion.
R
etai
l Str
ateg
y 1.
6: P
rovi
de S
hutt
le o
r “S
hare
d B
ike”
Pro
gram
to L
ink
Nor
th 4
0 an
d D
ownt
own.
By
prov
idin
g a
shut
tle c
onne
ctio
n an
d/or
free
bic
ycle
rent
al, t
he N
orth
40
and
Dow
ntow
n co
uld
be li
nked
to p
rom
ote
easy
mov
emen
t bet
wee
n th
e tw
o di
stric
ts.
Man
y ci
ties i
n bo
th th
e U
nite
d St
ates
and
Eur
ope
(suc
h as
Par
is, P
ortla
nd, a
nd P
ragu
e) p
rovi
de
free
, sha
red-
use
bicy
cles
to e
ncou
rage
sust
aina
ble
and
heal
thy
alte
rnat
ive
trans
porta
tion
over
shor
t dis
tanc
es.
Stat
ions
cou
ld b
e es
tabl
ishe
d at
the
Nor
th 4
0 an
d D
ownt
own.
Stra
tegy
2: P
rom
ote
New
Ret
ail a
t the
Nor
th 4
0 to
Pro
vide
Goo
ds a
nd S
ervi
ces
that
are
Le
akin
g fro
m th
e C
omm
unity
and
Gen
erat
e M
ore
Sal
es T
ax R
even
ue fo
r the
Tow
n. T
o st
reng
then
and
div
ersi
fy it
s sal
es ta
x ba
se, t
he T
own
shou
ld c
onsi
der p
rom
otin
g ne
w fo
rmul
a re
tail
at th
e N
orth
40
site
sinc
e th
e To
wn’
s ow
n ex
perie
nce
with
form
ula
reta
il D
ownt
own
has s
how
n th
at
just
a fe
w fo
rmul
a re
taile
rs c
an g
ener
ate
a la
rge
amou
nt o
f sal
es ta
x re
venu
e. T
he N
orth
40
coul
d of
fer a
new
and
fres
h sh
oppi
ng e
xper
ienc
e in
con
trast
to so
me
of th
e ol
der f
acili
ties o
utsi
de th
e To
wn
in th
e R
TA, t
hus p
oten
tially
attr
actin
g ne
w sh
oppe
rs fr
om o
utsi
de th
e To
wn.
Stra
tegy
2.1
: Avo
id “
Tax
-shi
ftin
g” fr
om R
eloc
atio
n of
For
mul
a R
etai
l Dow
ntow
n to
N
orth
40.
Whi
le so
me
may
dis
favo
r for
mul
a re
tail
Dow
ntow
n, in
ord
er fo
r the
Tow
n to
re
aliz
e a
net f
isca
l gai
n, fo
rmul
a re
taile
rs D
ownt
own
shou
ld b
e en
cour
aged
to re
mai
n D
ownt
own
and
not r
eloc
ate
to th
e N
orth
40.
Thi
s can
be
achi
eved
thro
ugh
non-
com
pete
cl
ause
s in
the
Tow
n’s d
evel
opm
ent a
gree
men
t with
the
Nor
th 4
0 de
velo
per o
r thr
ough
ot
her l
egal
ly a
ppro
pria
te m
echa
nism
s.
Nor
th F
orty
Spe
cific
Pla
n M
arke
t Stu
dy a
nd B
usin
ess D
evel
opm
ent S
trate
gy
Page
115
of 1
50
Stra
tegy
4: P
rom
ote
New
Ret
aile
rs th
at w
ill C
aptu
re E
xist
ing
Sal
es L
eaka
ge.
Los G
atos
sh
ould
con
side
r usi
ng th
e N
orth
40
deve
lopm
ent o
ppor
tuni
ty to
est
ablis
h ne
w re
tail
uses
in th
e ge
nera
l mer
chan
dise
hom
e im
prov
emen
t cat
egor
ies b
y pe
rmitt
ing
larg
er fl
oor p
late
(e.g
., ov
er
30,0
00 sq
uare
foot
) flo
or p
late
s. S
trate
gy 5
: Enc
oura
ge N
ew S
peci
alty
Ret
ail a
t Nor
th 4
0. L
os G
atos
shou
ld w
ork
with
the
Nor
th 4
0 de
velo
per t
o id
entif
y ne
w sp
ecia
lty re
tail
uses
that
will
com
plem
ent t
he T
own’
s mix
such
as
spec
ialty
food
s (e.
g., “
mar
ket h
all”
), an
app
lianc
e st
ore,
as w
ell a
s for
mul
a re
tail
that
will
brin
g in
shop
pers
from
out
side
Los
Gat
os.
Stra
tegy
3: E
ncou
rage
Nei
ghbo
rhoo
d an
d C
onve
nien
ce R
etai
l at t
he N
orth
40.
The
Tow
n sh
ould
enc
oura
ge n
eigh
borh
ood
and
conv
enie
nce
reta
il at
the
Nor
th 4
0 to
supp
ort n
ot o
nly
new
re
side
nts a
t the
site
but
oth
er n
earb
y re
side
ntia
l and
bus
ines
s nei
ghbo
rhoo
d ac
ross
Los
Gat
os
Bou
leva
rd.
O
ffice
Dev
elop
men
t Opp
ortu
nitie
s Th
e O
ffic
e M
arke
t Ass
essm
ent c
hapt
er in
dica
ted
that
the
Los G
atos
off
ice
mar
ket h
as g
ener
ally
ou
tper
form
ed th
e br
oade
r Mar
ket A
rea
and
Sout
h B
ay b
y m
aint
aini
ng lo
wer
vac
ancy
rate
s and
hi
gher
leas
e re
ntal
rate
s ove
r the
pas
t sev
eral
yea
rs.
How
ever
, muc
h of
the
Tow
n’s i
nven
tory
is in
ol
der C
lass
B a
nd C
bui
ldin
gs w
ith fe
w p
rope
rties
that
can
acc
omm
odat
e co
mpa
nies
seek
ing
spac
e in
the
75,0
00 to
100
,000
squa
re fo
ot ra
nge.
A re
sidu
al d
eman
d es
timat
e su
gges
ts th
at th
e si
te c
ould
ca
ptur
e be
twee
n 70
,000
to 1
91,0
00 sq
uare
feet
of n
ew o
ffic
e de
man
d. T
he N
orth
40
site
off
ers a
n at
tract
ive
loca
tion
and
can
enha
nce
the
Tow
n’s o
ffic
e in
vent
ory
in se
vera
l pos
itive
way
s. N
ew C
lass
A O
ffice
Spa
ce T
arge
ted
to L
arge
or S
ingl
e U
sers
O
ne o
ppor
tuni
ty fo
r off
ice
deve
lopm
ent a
t the
Nor
th 4
0 w
ould
be
allo
catin
g a
porti
on o
f the
site
to
new
Cla
ss A
off
ice
spac
e ta
rget
ed to
tena
nts s
eeki
ng la
rge
floor
pla
tes (
25,0
00 to
35,
000
per f
loor
or
50,
000
to 1
05,0
00 sq
uare
feet
per
bui
ldin
g, a
ssum
ing
two
or th
ree
stor
ies.
Loc
al b
roke
rage
firm
s re
port
that
dur
ing
the
first
six
mon
ths o
f 201
1 th
ere
has b
een
a si
gnifi
cant
incr
ease
in th
e nu
mbe
r of
tena
nts s
eeki
ng o
ver 1
00,0
00 sq
uare
feet
of s
pace
. B
y of
ferin
g la
rger
floo
r pla
tes,
new
off
ice
spac
e at
the
Nor
th 4
0 w
ould
like
ly n
ot c
ompe
te si
gnifi
cant
ly w
ith th
e D
ownt
own
sinc
e th
e D
ownt
own
offic
e m
arke
t is c
ompr
ised
of o
lder
and
smal
ler p
rope
rties
. In
stea
d, n
ew o
ffic
e sp
ace
at th
e N
orth
40
wou
ld m
ost l
ikel
y co
mpe
te w
ith o
ther
com
para
ble
Cla
ss A
pro
perti
es in
the
Wes
t Val
ley.
N
ew C
lass
B o
r A M
ultit
enan
t Spa
ce
In a
dditi
on to
add
ing
larg
er fl
oor p
late
spac
e to
the
Los G
atos
inve
ntor
y, th
e N
orth
40
site
cou
ld
also
add
new
Cla
ss B
or A
spac
e de
sign
ed fo
r mul
titen
ant o
ccup
ancy
for s
mal
l to
med
ium
tena
nts,
parti
cula
rly m
edic
al se
rvic
e pr
ovid
ers,
labs
, and
supp
ort f
irms,
taki
ng a
dvan
tage
of t
he si
te’s
pr
oxim
ity to
a si
gnifi
cant
clu
ster
of m
edic
al in
stitu
tions
and
clin
ics.
Thi
s opp
ortu
nity
wou
ld
expa
nd th
e To
wn’
s inv
ento
ry b
y ad
ding
new
spac
e to
mee
t dem
and
gene
rate
d in
the
curr
ent
busi
ness
cyc
le b
ut w
ould
pot
entia
lly c
ompe
te w
ith o
ther
exi
stin
g pr
oper
ties i
n Lo
s Gat
os.
The
Nor
th F
orty
Spe
cific
Pla
n M
arke
t Stu
dy a
nd B
usin
ess D
evel
opm
ent S
trate
gy
Page
116
of 1
50

bene
fit to
the
Tow
n w
ould
be
addi
ng n
ew st
ate-
of-th
e-ar
t fac
ilitie
s to
its o
ffic
e in
vent
ory,
ther
eby
offe
ring
a gr
eate
r cho
ice
to b
usin
esse
s wis
hing
to lo
cate
in L
os G
atos
. N
ew M
ultit
enan
t Offi
ce S
pace
Pac
kage
d as
Los
Gat
os’ “
Inno
vatio
n C
ente
r”
A th
ird o
ppor
tuni
ty fo
r the
Tow
n an
d N
orth
40
deve
lope
r to
cons
ider
wou
ld b
e to
est
ablis
h an
“i
nnov
atio
n ce
nter
” or
“te
chno
logy
hub
” th
at o
ffer
s a v
arie
ty o
f off
ice
and
shar
ed w
ork
spac
es
targ
eted
to v
entu
re c
apita
l com
pani
es a
nd st
art-u
p fir
ms.
The
se c
ente
rs ty
pica
lly o
ffer
flex
ible
sp
ace
conf
igur
atio
ns fr
om a
sing
le d
esk
to sp
ace
for 2
0 to
30
empl
oyee
s as w
ell a
s fle
xibl
e le
ase
term
s fro
m m
onth
-to-m
onth
to a
typi
cal t
erm
of t
hree
-to-f
ive
year
s. T
hese
faci
litie
s are
des
igne
d to
pr
omot
e co
llabo
ratio
n an
d cr
oss f
ertil
izat
ion
of id
eas a
nd te
chno
logy
am
ong
tena
nts w
ith sh
ared
ki
tche
ns, l
oung
es, a
nd sp
ecia
l eve
nts s
pace
s. T
he re
viva
l of e
arly
-sta
ge v
entu
re fu
ndin
g of
new
te
chno
logy
com
pani
es a
long
with
the
larg
e ba
se o
f ven
ture
cap
ital a
nd te
chno
logy
pro
fess
iona
ls in
Lo
s Gat
os a
nd su
rrou
ndin
g co
mm
uniti
es m
ay p
rovi
de a
bas
e of
supp
ort f
or su
ch a
con
cept
. H
avin
g on
site
am
eniti
es su
ch a
s a h
otel
, mee
ting
spac
e, a
nd c
onve
nien
ce re
tail
wou
ld b
e cr
itica
l to
mak
e th
is c
once
pt fe
asib
le.
Man
y of
thes
e ce
nter
s are
size
d be
twee
n 5,
000
and
30,0
00 sq
uare
feet
and
th
us w
ould
not
pre
empt
oth
er o
ffic
e de
velo
pmen
t at t
he N
orth
40
site
. A
pot
entia
l con
stra
int f
or
this
opp
ortu
nity
, how
ever
, may
be
the
Nor
th 4
0’s d
ista
nce
from
exi
stin
g st
art-u
p cl
uste
rs in
Pal
o A
lto, M
enlo
Par
k, a
nd M
ount
ain
Vie
w.
Sum
mar
y of
Offi
ce O
ppor
tuni
ties
Off
ice
deve
lopm
ent a
t the
Nor
th 4
0 w
ould
be
cons
iste
nt w
ith th
e To
wn’
s Gen
eral
Pla
n by
pr
ovid
ing
a su
ppor
tabl
e us
e to
com
plem
ent r
etai
l and
oth
er c
omm
erci
al u
ses i
n th
e no
rther
n po
rtion
of
the
site
. Th
e G
ener
al P
lan
guid
elin
es c
allin
g fo
r sus
tain
able
and
“sm
art”
dev
elop
men
t, pe
dest
rian-
orie
nted
des
ign,
and
am
eniti
es su
ch a
s pla
zas a
nd la
ndm
ark
feat
ures
wou
ld e
nhan
ce th
e m
arke
tabi
lity
of n
ew o
ffic
e de
velo
pmen
t by
givi
ng th
e N
orth
40
a st
rong
bra
nd a
nd im
age
to
dist
ingu
ish
it fr
om o
ther
pro
perti
es in
the
Mar
ket A
rea.
The
Tow
n ha
s sev
eral
off
ice
deve
lopm
ent
oppo
rtuni
ties t
hat c
an b
e pu
rsue
d by
the
Nor
th 4
0 de
velo
per.
As s
een
with
oth
er p
lann
ed a
nd
prop
osed
off
ice
proj
ects
in th
e M
arke
t Are
a, sp
ecul
ativ
e of
fice
inve
stm
ent m
ay b
e di
ffic
ult t
o fin
ance
with
out h
avin
g pr
e-le
ased
50
perc
ent o
r mor
e of
pla
nned
spac
e. L
endi
ng re
quire
men
ts m
ay
then
mak
e pr
ovis
ion
of n
ew C
lass
B o
r A m
ultit
enan
t and
“in
nova
tion
cent
er”
mor
e ch
alle
ngin
g to
fin
ance
com
pare
d to
off
ice
spac
e fo
r an
iden
tifie
d cr
edit-
wor
thy
sing
le te
nant
requ
iring
a la
rge
quan
tity
of sp
ace.
Hen
ce, t
he u
ltim
ate
feas
ibili
ty o
f off
ice
spac
e at
the
Nor
th 4
0 w
ill d
epen
d to
gr
eat e
xten
t upo
n th
e de
velo
per’
s cap
acity
to fi
nanc
e ne
w d
evel
opm
ent a
nd su
cces
s at s
ecur
ing
leas
ing
com
mitm
ents
. O
vera
ll, n
ew o
ffic
e de
velo
pmen
t at t
he N
orth
40
site
will
add
new
, hig
hly
func
tiona
l spa
ce th
e To
wn’
s inv
ento
ry, i
mpr
ovin
g its
abi
lity
to re
tain
and
attr
act b
usin
ess a
nd
bols
terin
g th
e To
wn’
s ove
rall
econ
omic
pro
sper
ity.
Offi
ce S
trate
gy 1
: Pro
mot
e N
ew O
ffice
Spa
ce to
Exp
and
Tow
n In
vent
ory.
Los
Gat
os sh
ould
de
velo
p la
ngua
ge a
s par
t of t
he S
peci
fic P
lan
proc
ess t
hat w
ould
pro
mot
e th
e ex
pans
ion
of th
e To
wn’
s inv
ento
ry o
f off
ice
spac
e, sp
ecifi
cally
enc
oura
ging
a m
ix o
f new
off
ice
spac
e at
the
Nor
th
40 si
te g
eare
d to
pro
vidi
ng la
rge-
plac
e C
lass
A o
ffic
e as
wel
l as n
ew C
lass
A o
r B sp
ace
conf
igur
ed
for m
ultit
enan
ts.
N
orth
For
ty S
peci
fic P
lan
Mar
ket S
tudy
and
Bus
ines
s Dev
elop
men
t Stra
tegy
Pa
ge 1
17 o
f 150

Offi
ce S
trate
gy 2
: Pur
sue
the
Con
cept
of a
“Los
Gat
os In
nova
tion
Cen
ter.”
The
Nor
th 4
0 re
pres
ents
a p
oten
tial o
ppor
tuni
ty to
acc
omm
odat
e st
art-u
p an
d ne
w v
entu
res a
nd c
reat
e jo
bs b
y es
tabl
ishi
ng a
faci
lity
prov
idin
g sh
ared
-wor
k sp
ace,
col
labo
rativ
e w
orks
pace
, or c
o-w
orki
ng
faci
litie
s, an
d so
cial
net
wor
king
/col
labo
ratio
n op
portu
nitie
s. L
os G
atos
shou
ld c
onsi
der a
dopt
ing
Spec
ific
Plan
lang
uage
enc
oura
ging
est
ablis
hmen
t of a
“Lo
s Gat
os In
nova
tion
Cen
ter”
that
is
targ
eted
to st
art-u
ps, e
ntre
pren
eurs
, or s
elf-
empl
oyed
indi
vidu
als s
eeki
ng a
ltern
ativ
e w
orks
pace
an
d/or
aff
orda
ble
offic
e sp
ace
and
supp
ort s
ervi
ces.
Hot
el D
evel
opm
ent O
ppor
tuni
ties
The
Ass
ocia
tion
of B
ay A
rea
Gov
ernm
ents
pro
ject
s tha
t San
ta C
lara
Cou
nty
will
add
nea
rly
500,
000
resi
dent
s and
386
,000
jobs
by
2030
. W
hile
the
Mar
ket A
rea
is sl
ated
to g
row
at a
muc
h sl
ower
pac
e, it
is n
onet
hele
ss p
roje
cted
to a
dd n
early
9,0
00 re
side
nts a
nd o
ver 1
1,00
0 jo
bs.
In su
m,
both
the
mic
ro- a
nd m
acro
-reg
ions
in w
hich
the
Nor
th 4
0 si
ts a
re sl
ated
to g
row
ove
r the
com
ing
deca
des,
gene
ratin
g as
yet
unm
et d
eman
d fo
r new
hot
el ro
oms.
The
Nor
th 4
0 is
idea
lly si
tuat
ed to
se
rve
this
gro
win
g po
pula
tion
beca
use
of it
s loc
atio
n at
the
inte
rsec
tion
of tw
o of
Sili
con
Val
ley’
s m
ost-t
rave
rsed
hig
hway
s.
This
loca
tion
puts
the
Nor
th 4
0 w
ithin
a re
lativ
ely
shor
t driv
ing
dist
ance
of m
any
of th
e re
gion
’s
larg
est c
orpo
ratio
ns a
nd in
stitu
tions
, as w
ell p
opul
ar le
isur
e de
stin
atio
ns.
Whi
le so
me
of th
ose
dem
and
driv
ers a
re a
lread
y w
ell-s
erve
d by
nea
rby
hote
ls, t
he N
orth
40
is g
eogr
aphi
cally
pos
ition
ed
to c
aptu
re st
rate
gic
mar
ket s
hare
am
ong
the
thriv
ing
med
ical
com
plex
es a
nd le
isur
e at
tract
ions
of
the
Wes
t Val
ley.
At t
he ti
me
of th
is w
ritin
g, o
nly
two
new
hot
els w
ere
bein
g co
nsid
ered
for
deve
lopm
ent w
ithin
the
Mar
ket A
rea,
indi
catin
g a
lack
of c
ompe
titio
n m
ovin
g its
way
thro
ugh
the
pipe
line.
Fur
ther
, bot
h of
thos
e pr
ojec
ts w
ere
orie
nted
tow
ard
capt
urin
g bu
sine
ss fr
om A
pple
and
ot
her m
ajor
cor
pora
te te
nant
s in
Cup
ertin
o.
As s
how
n in
the
Hot
el M
arke
t Ass
essm
ent c
hapt
er, a
n an
alys
is o
f com
para
tive
trend
dat
a fr
om S
TR
indi
cate
s tha
t exi
stin
g ho
tels
in th
e M
arke
t Are
a co
nsis
tent
ly o
utpe
rfor
med
the
coun
tyw
ide
base
line
befo
re, d
urin
g, a
nd a
fter t
he G
reat
Rec
essi
on in
term
s of b
oth
room
rate
s and
occ
upan
cy.
This
fa
vora
ble
perf
orm
ance
ow
es, i
n pa
rt, to
the
fact
that
the
Mar
ket A
rea
is a
n am
enity
-ric
h en
viro
nmen
t cap
able
of a
ttrac
ting
high
-pay
ing
busi
ness
cus
tom
ers,
leis
ure
trave
lers
, and
par
ties
seek
ing
a pi
ctur
esqu
e se
tting
for w
eddi
ngs o
r oth
er so
cial
eve
nts.
By
appe
alin
g to
this
bal
ance
d bl
end
of m
arke
t seg
men
ts, A
rea
hote
ls re
tain
abo
ve-a
vera
ge ro
om ra
tes o
n th
e w
eeke
nd, w
hen
pric
es fa
ll of
f mor
e dr
astic
ally
in le
ss-a
llurin
g pa
rts o
f the
Cou
nty.
Th
e So
uth
Bay
app
ears
und
erse
rved
by
nam
e-br
and
luxu
ry h
otel
pro
duct
s giv
en th
e si
ze o
f its
bu
sine
ss m
arke
t with
onl
y th
e Fa
irmon
t in
Dow
ntow
n Sa
n Jo
se, F
our S
easo
n in
Eas
t Pal
o A
lto, W
H
otel
in N
ewar
k, a
nd R
osew
ood
Sand
Hill
in P
alo
Alto
.
Nor
th F
orty
Spe
cific
Pla
n M
arke
t Stu
dy a
nd B
usin
ess D
evel
opm
ent S
trate
gy
Page
118
of 1
50

The
Nor
th 4
0, th
eref
ore,
mig
ht p
rove
via
ble
as a
site
for a
flag
ship
nam
e-br
and
luxu
ry h
otel
in th
e So
uth
Bay
. B
y as
soci
atin
g th
e br
and
with
Los
Gat
os’ s
tylis
h re
puta
tion—
as in
, “Th
e R
itz-C
arlto
n Lo
s Gat
os”—
such
a h
otel
has
a p
oten
tial t
o be
com
e th
e go
-to d
estin
atio
n fo
r man
y of
Sili
con
Val
ley’
s mos
t dis
crim
inat
ing
trave
lers
. H
owev
er, a
pot
entia
l lim
itatio
n of
the
Nor
th 4
0 fo
r a
glob
ally
bra
nded
hot
el is
its l
ocat
ion
outs
ide
a m
ajor
bus
ines
s hub
such
as d
ownt
own
San
Jose
or
Palo
Alto
, acc
ordi
ng to
ope
rato
rs a
nd h
otel
indu
stry
exp
erts
con
tact
ed b
y th
e N
orth
40
deve
lope
r.
Alte
rnat
ivel
y, a
ppea
ling
to a
regi
onal
bou
tique
hot
elie
r cou
ld p
rese
nt a
n ad
ditio
nal o
ppor
tuni
ty.
Joie
de
Viv
re a
nd K
impt
on a
re b
oth
Bay
Are
a-ba
sed
oper
ator
s tha
t are
look
ing
to e
xpan
d th
eir
pres
ence
in d
estin
atio
n en
viro
nmen
ts su
ch a
s Los
Gat
os.
Whi
le e
ach
of th
ese
com
pani
es o
pera
tes a
pr
oper
ty w
ithin
the
Mar
ket A
rea—
Joie
de
Viv
re in
Wes
t San
Jose
, and
Kim
pton
in C
uper
tino—
they
hav
e de
mon
stra
ted
a w
illin
gnes
s and
des
ire to
find
new
opp
ortu
nitie
s for
mar
ket s
hare
, eve
n in
lo
catio
ns w
here
they
alre
ady
have
a p
rese
nce.
With
its m
arqu
ee lo
catio
n an
d po
tent
ial t
o ap
peal
to
exec
utiv
e-le
vel t
rave
lers
and
recr
eatio
nalis
ts a
like,
the
Nor
th 4
0 co
uld
repr
esen
t jus
t suc
h an
op
portu
nity
to th
ese
grow
ing
hosp
italit
y gr
oups
. H
otel
Stra
tegy
1:
Dev
elop
Lan
guag
e in
the
Spe
cific
Pla
n th
at w
ill E
ncou
rage
/Per
mit
a N
ew H
igh-
end
Hot
el/L
odgi
ng U
se a
t the
Nor
th 4
0. T
he T
own
shou
ld c
onsi
der a
hot
el u
se fo
r th
e N
orth
40
to e
xpan
d th
e To
wn’
s inv
ento
ry o
f hig
h-en
d ho
tel p
rope
rties
and
com
plet
e an
ove
rall
amen
ity p
acka
ge a
t the
Nor
th 4
0.
Con
fere
nce
and
Mee
ting
Spac
e D
evel
opm
ent O
ppor
tuni
ties
The
Mee
ting
Spac
e M
arke
t Ass
essm
ent i
ndic
ated
that
the
area
dire
ctly
surr
ound
ing
the
Nor
th 4
0 is
un
ders
erve
d by
bot
h ex
istin
g an
d pr
opos
ed m
eetin
g ho
tels
. A
ppro
xim
atel
y 38
per
cent
of t
he h
otel
m
eetin
g sp
ace
in th
e M
arke
t Are
a is
loca
ted
in L
os G
atos
—tw
ice
as m
uch
as is
loca
ted
in e
ither
C
ampb
ell o
r Cup
ertin
o, th
e tw
o ne
xt la
rges
t mee
ting
hote
l clu
ster
s (no
te th
at th
is b
alan
ce w
ill
chan
ge w
hen
two
new
hot
els i
n C
uper
tino
com
e on
-line
). L
os G
atos
’ exi
stin
g su
pply
of h
otel
m
eetin
g sp
ace
is c
once
ntra
ted
dow
ntow
n. I
nter
view
s with
key
info
rman
ts c
onfir
m th
at th
e m
ajor
ity o
f exi
stin
g co
nfer
ence
act
ivity
in L
os G
atos
take
s pla
ce a
t the
Tol
l Hou
se H
otel
and
Hot
el
Los G
atos
. Th
ese
faci
litie
s, ho
wev
er, a
re h
ampe
red
by th
eir s
ize.
As s
how
n in
Tab
le 2
8 in
the
Mee
ting
Spac
e M
arke
t Ass
essm
ent c
hapt
er, m
ost o
f the
mee
ting
hote
ls in
the
Mar
ket A
rea
are
unab
le to
ac
com
mod
ate
mor
e th
an 2
50 p
erso
ns se
ated
thea
ter-
styl
e (a
ll ch
airs
), an
d, in
fact
, the
ave
rage
se
ated
cap
acity
is c
lose
r to
100.
The
Tol
l Hou
se H
otel
and
Hot
el L
os G
atos
can
seat
a m
axim
um
of 1
80 a
nd 1
50 g
uest
s, re
spec
tivel
y. R
epre
sent
ativ
es o
f the
Los
Gat
os C
ham
ber o
f Com
mer
ce
conf
irm th
at th
ere
is a
nee
d fo
r eve
nt sp
ace
in L
os G
atos
that
can
hol
d m
ore
than
200
peo
ple.
Th
e ex
istin
g da
y-us
e fa
cilit
ies,
on th
e ot
her h
and,
are
dis
tribu
ted
mor
e ev
enly
thro
ugho
ut th
e M
arke
t Are
a, a
nd b
oth
the
Jew
ish
Com
mun
ity C
ente
r (JC
C) i
n Lo
s Gat
os a
nd th
e C
amde
n C
omm
unity
Cen
ter i
n Sa
n Jo
se a
re lo
cate
d in
clo
se p
roxi
mity
to th
e N
orth
40.
Whi
le th
e
N
orth
For
ty S
peci
fic P
lan
Mar
ket S
tudy
and
Bus
ines
s Dev
elop
men
t Stra
tegy
Pa
ge 1
19 o
f 150
Test
aros
sa W
iner
y an
d th
e O
pera
Hou
se a
re a
lso
som
ewha
t res
trict
ed w
ith re
gard
to si
ze—
seat
ing
up to
80
and
250
peop
le th
eate
r-st
yle,
resp
ectiv
ely—
the
JCC
can
seat
up
to 4
50 p
eopl
e. I
ndee
d,
man
y of
the
day-
use
faci
litie
s els
ewhe
re w
ithin
the
Mar
ket A
rea
can
acco
mm
odat
e gr
oups
in
exce
ss o
f 250
peo
ple.
How
ever
, mos
t of t
hese
faci
litie
s are
focu
sed
on c
omm
unity
use
rs a
nd d
o no
t nec
essa
rily
prov
ide
the
ambi
ence
requ
ired
by m
ore-
prof
essi
onal
gro
ups.
Rep
rese
ntat
ives
of
the
Los G
atos
Cha
mbe
r of C
omm
erce
indi
cate
that
the
JCC
, for
exa
mpl
e, is
not
a c
ompe
titiv
e ve
nue
for S
ilico
n V
alle
y bu
sine
ss m
eetin
gs b
ecau
se it
is re
lativ
ely
info
rmal
and
impo
ses k
oshe
r re
stric
tions
on
dini
ng.
Acc
ordi
ng to
loca
l exp
erts
, Los
Gat
os la
cks a
des
tinat
ion
conf
eren
ce c
ente
r tha
t has
the
pote
ntia
l to
com
pete
with
hig
h-en
d fa
cilit
ies i
n C
uper
tino
and
San
Jose
. Th
ey e
nvis
ion
a st
eady
stre
am o
f us
ers f
rom
with
in th
e Lo
s Gat
os c
omm
unity
, inc
ludi
ng lo
cal b
usin
esse
s, tra
de a
ssoc
iatio
ns, a
nd
non-
prof
it gr
oups
look
ing
to h
old
a fu
ndra
iser
. Th
e C
ham
ber i
tsel
f is i
n ne
ed o
f a la
rge
spac
e th
at
can
acco
mm
odat
e tra
de e
vent
s tha
t sho
wca
se lo
cal i
ndus
tries
, suc
h as
a “
Tast
e of
Los
Gat
os”
high
light
ing
loca
l res
taur
ants
. D
eman
d w
ould
als
o lik
ely
be g
ener
ated
by
Goo
d Sa
mar
itan
Hos
pita
l, w
hich
val
ues e
xecu
tive-
leve
l spa
ce th
at is
clo
se b
y.
The
Cha
mbe
r als
o fo
rese
es a
stro
ng re
gion
al d
eman
d fo
r hig
h-en
d m
eetin
g sp
ace
in L
os G
atos
, w
hich
it w
ould
like
to fu
rther
pro
mot
e as
a d
estin
atio
n by
wor
king
with
a c
onfe
renc
e fa
cilit
y to
m
arke
t the
spac
e to
indu
stry
lead
ers i
n th
e W
est V
alle
y. K
ey in
form
ants
obs
erve
that
a su
cces
sful
fa
cilit
y of
this
nat
ure
wou
ld fe
atur
e th
e fo
llow
ing:
a la
rge
spac
e to
acc
omm
odat
e 20
0 or
mor
e pe
ople
as w
ell a
s sm
alle
r bre
akou
t roo
ms;
the
abili
ty to
tran
sitio
n fr
om a
bus
ines
s mee
ting
to a
n ev
enin
g ev
ent;
top-
of-th
e-lin
e au
diov
isua
l equ
ipm
ent a
nd W
iFi;
high
-qua
lity
food
opt
ions
; and
ne
arby
hot
el ro
oms,
espe
cial
ly if
mar
ketin
g to
larg
e co
nfer
ence
s and
/or w
eddi
ngs.
New
con
fere
nce
and
mee
ting
spac
e w
ith 2
00+
capa
city
cou
ld c
ompl
emen
t the
exi
stin
g fa
cilit
ies i
n Lo
s Gat
os b
y ex
pand
ing
the
size
of t
he m
arke
t tha
t cou
ld b
e ac
com
mod
ated
. N
ew c
onfe
renc
e an
d m
eetin
g sp
ace
faci
litie
s at t
he N
orth
40
wou
ld a
dvan
ce th
e G
ener
al P
lan
goal
s for
mix
ed
com
mer
cial
use
s at t
he n
orth
ern
end
of th
e si
te a
nd, i
nteg
rate
d w
ith n
ew re
tail
and
offic
e us
es,
wou
ld p
oten
tially
off
er a
dyn
amic
setti
ng fo
r bus
ines
s and
pro
fess
iona
l mee
tings
as w
ell a
s exp
and
the
scop
e of
off
erin
gs fo
r lar
ger s
peci
al e
vent
s.
Whi
le th
is re
port
finds
that
ther
e m
ay b
e m
arke
t sup
port
for n
ew c
onfe
renc
e an
d m
eetin
g sp
ace
faci
litie
s, ne
w st
and-
alon
e co
nfer
ence
cen
ters
are
rare
ly p
rofit
able
and
typi
cally
requ
ire a
n op
erat
ing
subs
idy.
Typ
ical
ly c
onfe
renc
e ce
nter
s and
mee
ting
spac
e fa
cilit
ies a
re o
ffer
ed in
as
soci
atio
n w
ith a
hot
el, l
ever
agin
g m
eetin
g an
d co
nfer
ence
spac
e to
gen
erat
ing
over
nigh
t sta
ys a
s w
ell a
s foo
d an
d be
vera
ge sa
les f
rom
mee
ting
atte
ndee
s. H
ence
the
scop
e an
d sc
ale
of a
ny n
ew
conf
eren
ce a
nd m
eetin
g sp
ace
at th
e N
orth
40
wou
ld b
e dr
iven
prim
arily
by
a ho
tel o
pera
tor
brou
ght t
o th
e pr
oper
ty.
N
orth
For
ty S
peci
fic P
lan
Mar
ket S
tudy
and
Bus
ines
s Dev
elop
men
t Stra
tegy
Pa
ge 1
20 o
f 150

N
orth
For
ty S
peci
fic P
lan
Mar
ket S
tudy
and
Bus
ines
s Dev
elop
men
t Stra
tegy
Pa
ge 1
21 o
f 150
Mee
ting
Spa
ce S
trate
gy 1
: In
corp
orat
e M
eetin
g S
pace
into
a H
otel
Dev
elop
men
t. S
ince
a
day
conf
eren
ce c
ente
r typ
ical
ly re
quire
s sub
sidy
, the
Tow
n sh
ould
con
side
r inc
orpo
ratin
g a
conf
eren
ce/m
eetin
g sp
ace
use
into
a n
ew h
otel
pro
perty
. To
mee
t the
larg
e m
eetin
g sp
ace
gap
in
the
Mar
ket A
rea,
Los
Gat
os c
ould
con
side
r req
uirin
g as
has
the
City
of C
uper
tino
a sp
ace
with
a
capa
city
for u
p to
400
to 5
00 a
s a c
ondi
tion
of h
otel
use
. Th
e ho
tel w
ould
hav
e to
be
size
d ov
er
150
to 2
00 ro
oms t
o su
ppor
t suc
h a
mee
ting
spac
e.
Prio
ritiz
ing
Opp
ortu
nitie
s To
ass
ist t
he T
own
of L
os G
atos
with
furth
er e
valu
atin
g an
d fo
rmul
atin
g a
com
mer
cial
de
velo
pmen
t pro
gram
for t
he N
orth
40,
BA
E ha
s pre
pare
d a
mat
rix th
at su
mm
ariz
es fi
ndin
gs b
y ke
y de
cisi
on-m
akin
g cr
iteria
. Th
is m
atrix
can
be
foun
d on
the
follo
win
g tw
o pa
ges.
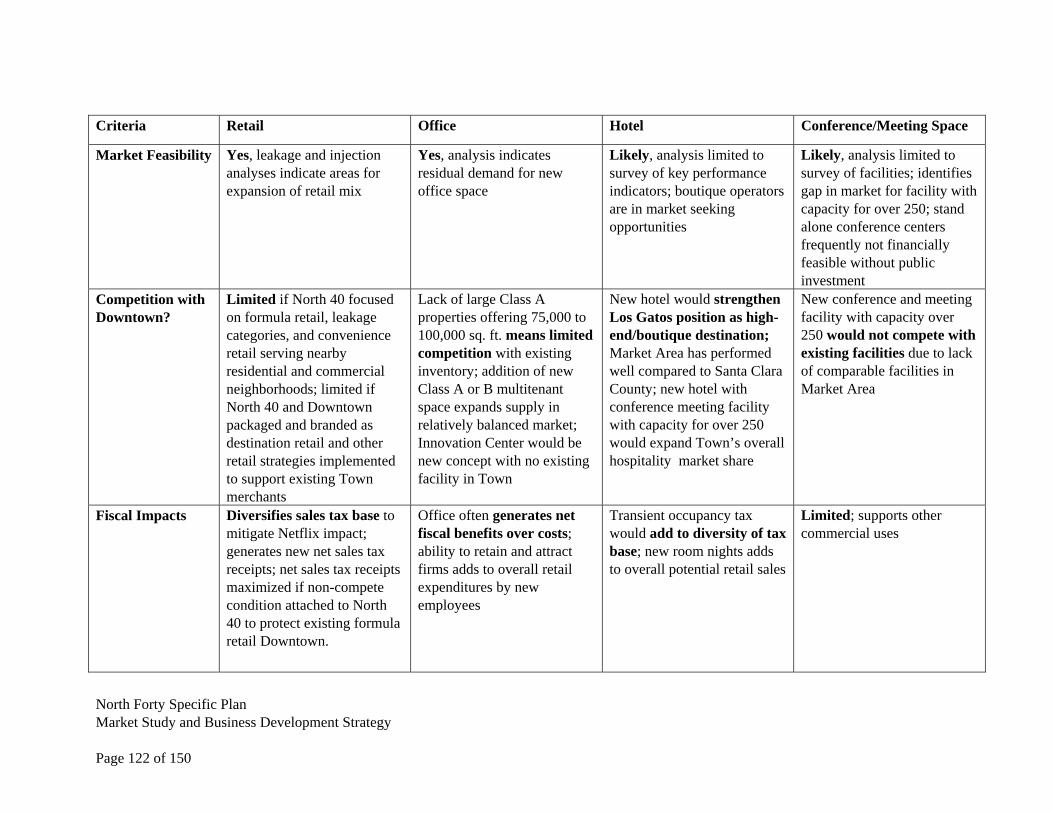
Criteria Retail Office Hotel Conference/Meeting Space
Market Feasibility Yes, leakage and injection analyses indicate areas for expansion of retail mix
Yes, analysis indicates residual demand for new office space
Likely, analysis limited to survey of key performance indicators; boutique operators are in market seeking opportunities
Likely, analysis limited to survey of facilities; identifies gap in market for facility with capacity for over 250; stand alone conference centers frequently not financially feasible without public investment
Competition with Downtown?
Limited if North 40 focused on formula retail, leakage categories, and convenience retail serving nearby residential and commercial neighborhoods; limited if North 40 and Downtown packaged and branded as destination retail and other retail strategies implemented to support existing Town merchants
Lack of large Class A properties offering 75,000 to 100,000 sq. ft. means limited competition with existing inventory; addition of new Class A or B multitenant space expands supply in relatively balanced market; Innovation Center would be new concept with no existing facility in Town
New hotel would strengthen Los Gatos position as high-end/boutique destination; Market Area has performed well compared to Santa Clara County; new hotel with conference meeting facility with capacity for over 250 would expand Town’s overall hospitality market share
New conference and meeting facility with capacity over 250 would not compete with existing facilities due to lack of comparable facilities in Market Area
Fiscal Impacts Diversifies sales tax base to mitigate Netflix impact; generates new net sales tax receipts; net sales tax receipts maximized if non-compete condition attached to North 40 to protect existing formula retail Downtown.
Office often generates net fiscal benefits over costs; ability to retain and attract firms adds to overall retail expenditures by new employees
Transient occupancy tax would add to diversity of tax base; new room nights adds to overall potential retail sales
Limited; supports other commercial uses
North Forty Specific Plan Market Study and Business Development Strategy Page 122 of 150
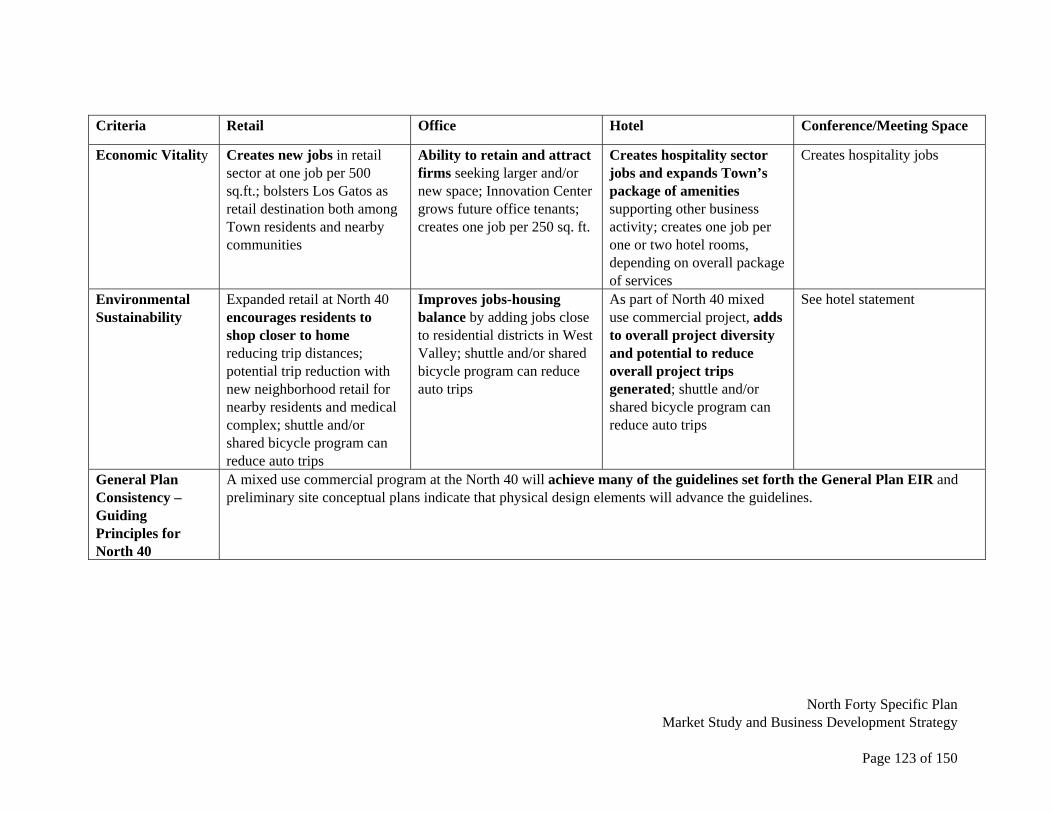
North Forty Specific Plan
Market Study and Business Development Strategy
Page 123 of 150
Criteria Retail Office Hotel Conference/Meeting Space
Economic Vitality Creates new jobs in retail sector at one job per 500 sq.ft.; bolsters Los Gatos as retail destination both among Town residents and nearby communities
Ability to retain and attract firms seeking larger and/or new space; Innovation Center grows future office tenants; creates one job per 250 sq. ft.
Creates hospitality sector jobs and expands Town’s package of amenities supporting other business activity; creates one job per one or two hotel rooms, depending on overall package of services
Creates hospitality jobs
Environmental Sustainability
Expanded retail at North 40 encourages residents to shop closer to home reducing trip distances; potential trip reduction with new neighborhood retail for nearby residents and medical complex; shuttle and/or shared bicycle program can reduce auto trips
Improves jobs-housing balance by adding jobs close to residential districts in West Valley; shuttle and/or shared bicycle program can reduce auto trips
As part of North 40 mixed use commercial project, adds to overall project diversity and potential to reduce overall project trips generated; shuttle and/or shared bicycle program can reduce auto trips
See hotel statement
General Plan Consistency – Guiding Principles for North 40
A mixed use commercial program at the North 40 will achieve many of the guidelines set forth the General Plan EIR and preliminary site conceptual plans indicate that physical design elements will advance the guidelines.


Ap
pe
nd
ice
s
N
orth
For
ty S
peci
fic P
lan
Mar
ket S
tudy
and
Bus
ines
s Dev
elop
men
t Stra
tegy
Pa
ge 1
25 o
f 150

Appe
ndix
A:
Zip
Cod
es in
Ret
ail T
rade
Are
a
Zip
Cod
eC
ity95
008
Cam
pbel
l95
009
Cam
pbel
l PO
Box
9501
1C
ampb
ell P
O B
ox95
014
Cup
ertin
o95
015
Cup
ertin
o P
O B
ox95
030
Los
Gat
os95
031
Los
Gat
os P
O B
ox95
032
Los
Gat
os95
033
Los
Gat
os95
042
New
Alm
aden
9507
0S
arat
oga
9507
1S
arat
oga
PO
Box
9511
7S
an J
ose
9511
8S
an J
ose
9512
0S
an J
ose
9512
3S
an J
ose
9512
4S
an J
ose
9512
5S
an J
ose
9512
6S
an J
ose
9512
8S
an J
ose
9512
9S
an J
ose
9513
0S
an J
ose
9513
6S
an J
ose
Not
e: P
O B
oxes
Zip
Cod
es m
ay h
ave
busi
ness
es li
sted
in Z
ip C
ode
Bus
ines
s P
atte
rns.
Sou
rce:
BA
E U
rban
Eco
nom
ics,
201
1.
Nor
th F
orty
Spe
cific
Pla
n M
arke
t Stu
dy a
nd B
usin
ess D
evel
opm
ent S
trate
gy
Page
126
of 1
50
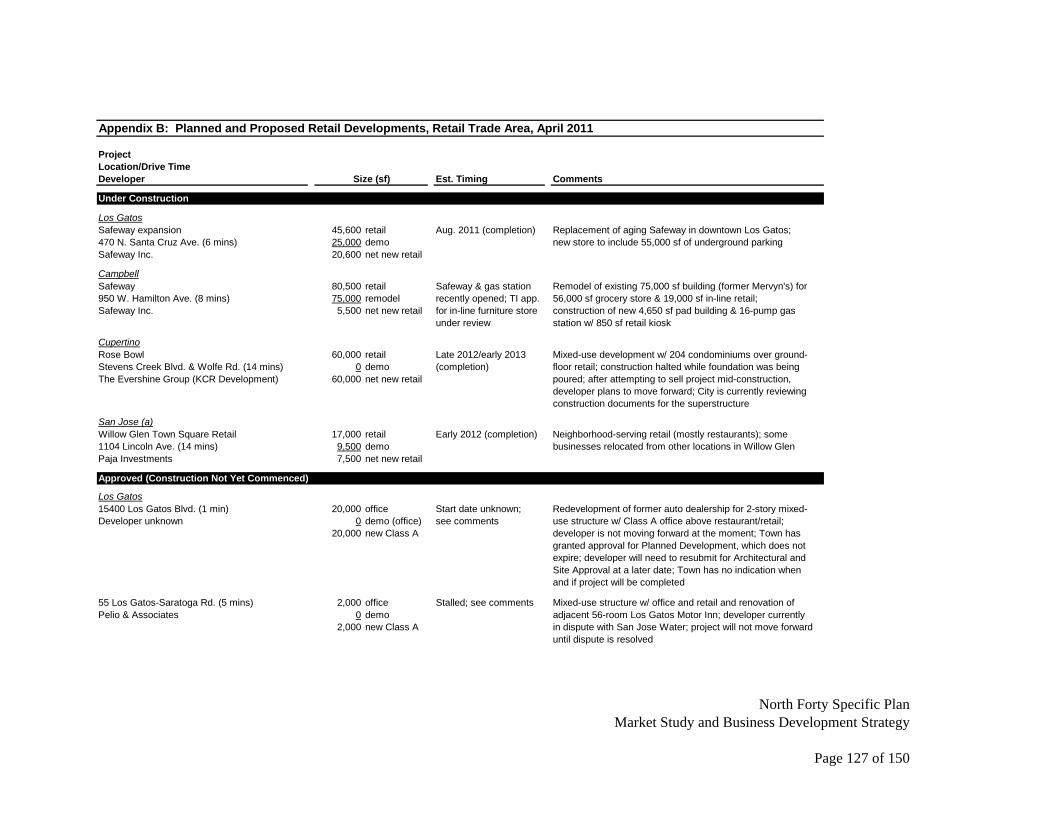
Appendix B: Planned and Proposed Retail Developments, Retail Trade Area, April 2011
ProjectLocation/Drive TimeDeveloper Size (sf) Est. Timing Comments
Under Construction
Los GatosSafeway expansion 45,600 retail Aug. 2011 (completion) Replacement of aging Safeway in downtown Los Gatos;470 N. Santa Cruz Ave. (6 mins) 25,000 demo new store to include 55,000 sf of underground parkingSafeway Inc. 20,600 net new retail
CampbellSafeway 80,500 retail Safeway & gas station Remodel of existing 75,000 sf building (former Mervyn's) for 950 W. Hamilton Ave. (8 mins) 75,000 remodel recently opened; TI app. 56,000 sf grocery store & 19,000 sf in-line retail; Safeway Inc. 5,500 net new retail for in-line furniture store construction of new 4,650 sf pad building & 16-pump gas
under review station w/ 850 sf retail kiosk
CupertinoRose Bowl 60,000 retail Late 2012/early 2013 Mixed-use development w/ 204 condominiums over ground-Stevens Creek Blvd. & Wolfe Rd. (14 mins) 0 demo (completion) floor retail; construction halted while foundation was beingThe Evershine Group (KCR Development) 60,000 net new retail poured; after attempting to sell project mid-construction,
developer plans to move forward; City is currently reviewingconstruction documents for the superstructure
San Jose (a)Willow Glen Town Square Retail 17,000 retail Early 2012 (completion) Neighborhood-serving retail (mostly restaurants); some 1104 Lincoln Ave. (14 mins) 9,500 demo businesses relocated from other locations in Willow GlenPaja Investments 7,500 net new retail
Approved (Construction Not Yet Commenced)
Los Gatos15400 Los Gatos Blvd. (1 min) 20,000 office Start date unknown; Redevelopment of former auto dealership for 2-story mixed-Developer unknown 0 demo (office) see comments use structure w/ Class A office above restaurant/retail;
20,000 new Class A developer is not moving forward at the moment; Town hasgranted approval for Planned Development, which does notexpire; developer will need to resubmit for Architectural andSite Approval at a later date; Town has no indication whenand if project will be completed
55 Los Gatos-Saratoga Rd. (5 mins) 2,000 office Stalled; see comments Mixed-use structure w/ office and retail and renovation ofPelio & Associates 0 demo adjacent 56-room Los Gatos Motor Inn; developer currently
2,000 new Class A in dispute with San Jose Water; project will not move forwarduntil dispute is resolved
North Forty Specific Plan
Market Study and Business Development Strategy
Page 127 of 150
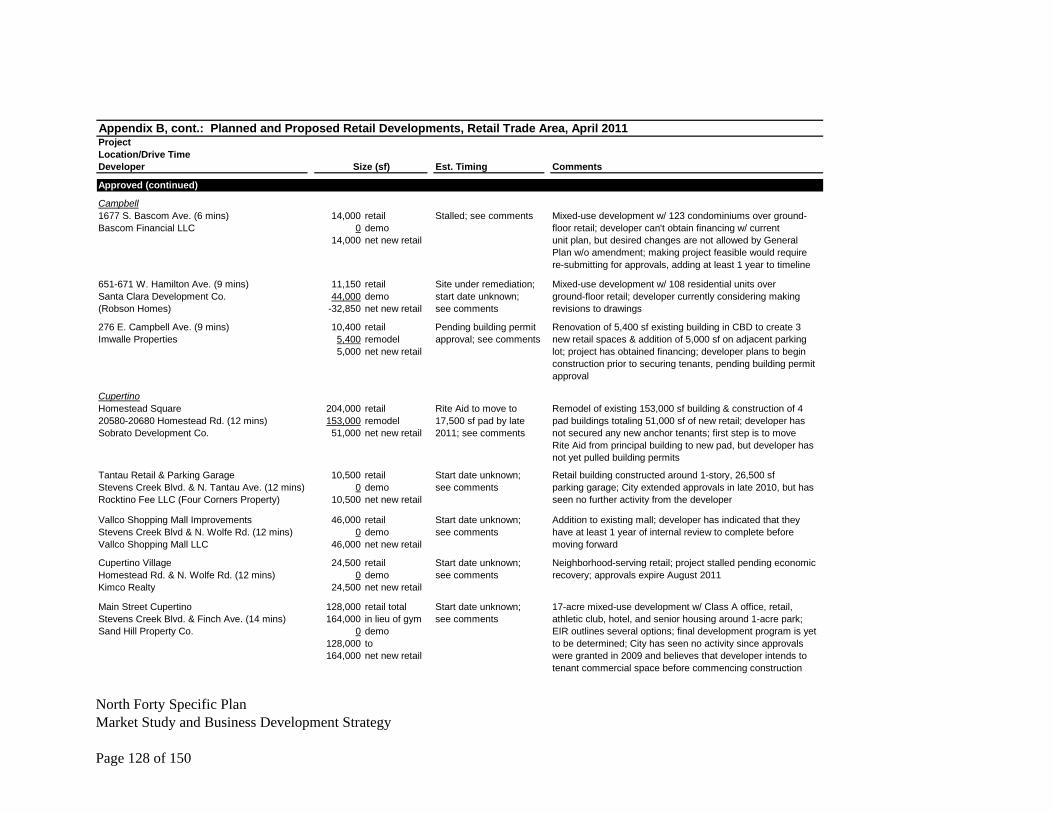
North Forty Specific Plan Market Study and Business Development Strategy Page 128 of 150
Appendix B, cont.: Planned and Proposed Retail Developments, Retail Trade Area, April 2011ProjectLocation/Drive TimeDeveloper Size (sf) Est. Timing Comments
Approved (continued)
Campbell1677 S. Bascom Ave. (6 mins) 14,000 retail Stalled; see comments Mixed-use development w/ 123 condominiums over ground-Bascom Financial LLC 0 demo floor retail; developer can't obtain financing w/ current
14,000 net new retail unit plan, but desired changes are not allowed by GeneralPlan w/o amendment; making project feasible would requirere-submitting for approvals, adding at least 1 year to timeline
651-671 W. Hamilton Ave. (9 mins) 11,150 retail Site under remediation; Mixed-use development w/ 108 residential units overSanta Clara Development Co. 44,000 demo start date unknown; ground-floor retail; developer currently considering making (Robson Homes) -32,850 net new retail see comments revisions to drawings
276 E. Campbell Ave. (9 mins) 10,400 retail Pending building permit Renovation of 5,400 sf existing building in CBD to create 3 Imwalle Properties 5,400 remodel approval; see comments new retail spaces & addition of 5,000 sf on adjacent parking
5,000 net new retail lot; project has obtained financing; developer plans to beginconstruction prior to securing tenants, pending building permit approval
CupertinoHomestead Square 204,000 retail Rite Aid to move to Remodel of existing 153,000 sf building & construction of 420580-20680 Homestead Rd. (12 mins) 153,000 remodel 17,500 sf pad by late pad buildings totaling 51,000 sf of new retail; developer hasSobrato Development Co. 51,000 net new retail 2011; see comments not secured any new anchor tenants; first step is to move
Rite Aid from principal building to new pad, but developer hasnot yet pulled building permits
Tantau Retail & Parking Garage 10,500 retail Start date unknown; Retail building constructed around 1-story, 26,500 sfStevens Creek Blvd. & N. Tantau Ave. (12 mins) 0 demo see comments parking garage; City extended approvals in late 2010, but hasRocktino Fee LLC (Four Corners Property) 10,500 net new retail seen no further activity from the developer
Vallco Shopping Mall Improvements 46,000 retail Start date unknown; Addition to existing mall; developer has indicated that theyStevens Creek Blvd & N. Wolfe Rd. (12 mins) 0 demo see comments have at least 1 year of internal review to complete beforeVallco Shopping Mall LLC 46,000 net new retail moving forward
Cupertino Village 24,500 retail Start date unknown; Neighborhood-serving retail; project stalled pending economicHomestead Rd. & N. Wolfe Rd. (12 mins) 0 demo see comments recovery; approvals expire August 2011Kimco Realty 24,500 net new retail
Main Street Cupertino 128,000 retail total Start date unknown; 17-acre mixed-use development w/ Class A office, retail, Stevens Creek Blvd. & Finch Ave. (14 mins) 164,000 in lieu of gym see comments athletic club, hotel, and senior housing around 1-acre park; Sand Hill Property Co. 0 demo EIR outlines several options; final development program is yet
128,000 to to be determined; City has seen no activity since approvals164,000 net new retail were granted in 2009 and believes that developer intends to
tenant commercial space before commencing construction
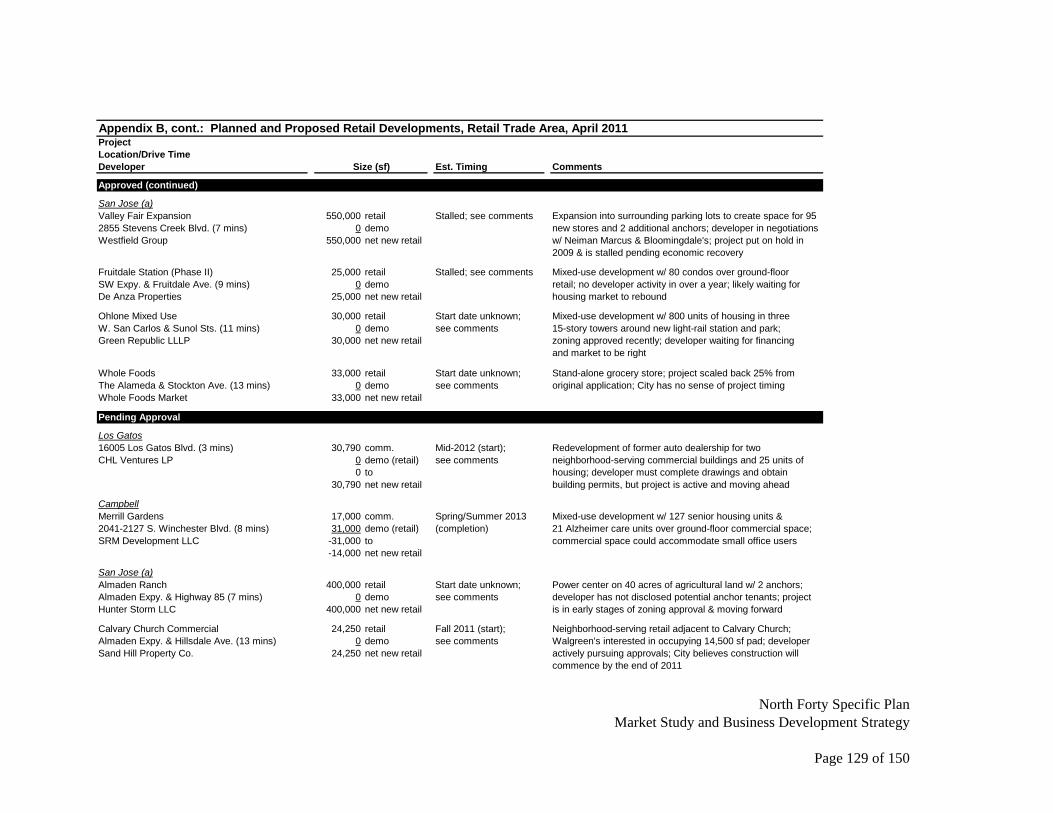
North Forty Specific Plan
Market Study and Business Development Strategy
Page 129 of 150
Appendix B, cont.: Planned and Proposed Retail Developments, Retail Trade Area, April 2011ProjectLocation/Drive TimeDeveloper Size (sf) Est. Timing Comments
Approved (continued)
San Jose (a)Valley Fair Expansion 550,000 retail Stalled; see comments Expansion into surrounding parking lots to create space for 952855 Stevens Creek Blvd. (7 mins) 0 demo new stores and 2 additional anchors; developer in negotiationsWestfield Group 550,000 net new retail w/ Neiman Marcus & Bloomingdale's; project put on hold in
2009 & is stalled pending economic recovery
Fruitdale Station (Phase II) 25,000 retail Stalled; see comments Mixed-use development w/ 80 condos over ground-floorSW Expy. & Fruitdale Ave. (9 mins) 0 demo retail; no developer activity in over a year; likely waiting forDe Anza Properties 25,000 net new retail housing market to rebound
Ohlone Mixed Use 30,000 retail Start date unknown; Mixed-use development w/ 800 units of housing in threeW. San Carlos & Sunol Sts. (11 mins) 0 demo see comments 15-story towers around new light-rail station and park;Green Republic LLLP 30,000 net new retail zoning approved recently; developer waiting for financing
and market to be right
Whole Foods 33,000 retail Start date unknown; Stand-alone grocery store; project scaled back 25% fromThe Alameda & Stockton Ave. (13 mins) 0 demo see comments original application; City has no sense of project timingWhole Foods Market 33,000 net new retail
Pending Approval
Los Gatos16005 Los Gatos Blvd. (3 mins) 30,790 comm. Mid-2012 (start); Redevelopment of former auto dealership for twoCHL Ventures LP 0 demo (retail) see comments neighborhood-serving commercial buildings and 25 units of
0 to housing; developer must complete drawings and obtain 30,790 net new retail building permits, but project is active and moving ahead
CampbellMerrill Gardens 17,000 comm. Spring/Summer 2013 Mixed-use development w/ 127 senior housing units &2041-2127 S. Winchester Blvd. (8 mins) 31,000 demo (retail) (completion) 21 Alzheimer care units over ground-floor commercial space;SRM Development LLC -31,000 to commercial space could accommodate small office users
-14,000 net new retail
San Jose (a)Almaden Ranch 400,000 retail Start date unknown; Power center on 40 acres of agricultural land w/ 2 anchors;Almaden Expy. & Highway 85 (7 mins) 0 demo see comments developer has not disclosed potential anchor tenants; projectHunter Storm LLC 400,000 net new retail is in early stages of zoning approval & moving forward
Calvary Church Commercial 24,250 retail Fall 2011 (start); Neighborhood-serving retail adjacent to Calvary Church;Almaden Expy. & Hillsdale Ave. (13 mins) 0 demo see comments Walgreen's interested in occupying 14,500 sf pad; developerSand Hill Property Co. 24,250 net new retail actively pursuing approvals; City believes construction will
commence by the end of 2011

North Forty Specific Plan Market Study and Business Development Strategy Page 130 of 150
Appendix B, cont.: Planned and Proposed Retail Developments, Retail Trade Area, April 2011ProjectLocation/Drive TimeDeveloper Size (sf) Est. Timing Comments
Pending Approval (continued)
Saratoga12250 Saratoga-Sunnyvale Rd. (13 mins) 3,500 retail Fall 2011 (start); Mixed-use development w/ professional/medical officeTimespace Investment Development 14,000 demo see comments condos, retail & children's learning center; developer has
-10,500 net new retail submitted for approvals; City expects construction to commence soon after
12260 Saratoga-Sunnyvale Rd. (13 mins) 6,000 retail Fall 2011 (start); Mixed-use Muslim community center w/ prayer space, retail &Muslim Community Group (name unknown) 0 demo (retail) see comments office; City expects developer to submit for approvals soon &
6,000 net new retail commence construction thereafter
Summary
Max. Planned and Proposed Retail (sf) (b) 1,829,190Planned Remodel of Existing Retail (sf) -233,400Planned Demolition of Existing Retail (sf) -123,500Planned Net New Retail (sf) 1,472,290
Note:(a) List of projects in San Jose only includes those with 25,000 sf or more retail space.(b) Assumes the maximum allowable buildout of retail at the Cupertino Main St. project and that all "commercial" projects are fully tenanted with retail users.Sources: Silicon Valley/San Jose Business Journal, 2009-2011; Los Gatos Patch; Town of Los Gatos; City of Campbell; City of Cupertino; City of San Jose; City of Saratoga; BAE, 2011.

North Forty Specific Plan
Market Study and Business Development Strategy
Page 131 of 150
Appendix C: Retail Sales Trends Appendix C-1: Los Gatos Taxable Retail Sales Trends, 2000-2009
Sales in 2010 $000 (a) (b) (c) 2000 2001 2002 2003 2004 2005 2006 2007 2008 Motor Vehicles and Parts $297,832 $264,904 $235,020 $196,148 $195,073 $207,525 $182,137 $158,495 $100,134 Home Furnishings and Appliances $39,533 $34,463 $27,916 $27,636 $31,111 $31,786 $28,937 $24,400 $17,112 Building Materials $12,564 $12,646 $11,218 $10,687 $10,892 $13,023 $14,253 $15,092 $16,701 Food Stores $48,956 $47,049 $45,994 $44,179 $46,122 $47,001 $46,845 $47,573 $46,371 Service Stations $48,920 $42,777 $37,597 $41,462 $45,867 $48,562 $51,677 $54,181 $56,145 Apparel Stores $33,540 $31,468 $27,996 $26,521 $29,677 $30,397 $29,203 $29,948 $27,845 General Merchandise Stores $21,419 $20,045 $19,171 $19,412 $20,289 $19,886 $20,201 $20,422 $20,473 Eating and Drinking Places $87,819 $82,981 $81,790 $82,288 $87,206 $90,580 $90,482 $98,751 $94,598 Other Retail Stores $122,102 $107,630 $118,799 $145,139 $208,666 $244,936 $295,123 $305,340 $315,119
Retail Stores Total $712,685 $643,962 $605,501 $593,473 $674,903 $733,697 $758,859 $754,202 $694,498Excluding Other Retail Stores $590,582 $536,332 $486,702 $448,334 $466,237 $488,761 $463,737 $448,862 $379,379
Sales per Capita in 2010 $ (d) 2000 2001 2002 2003 2004 2005 2006 2007 2008 Motor Vehicles and Parts $10,417 $9,239 $8,173 $6,802 $6,746 $7,156 $6,263 $5,435 $3,424 Home Furnishings and Appliances $1,383 $1,202 $971 $958 $1,076 $1,096 $995 $837 $585 Building Materials $439 $441 $390 $371 $377 $449 $490 $517 $571 Food Stores $1,712 $1,641 $1,600 $1,532 $1,595 $1,621 $1,611 $1,631 $1,585 Service Stations $1,711 $1,492 $1,308 $1,438 $1,586 $1,675 $1,777 $1,858 $1,920 Apparel Stores $1,173 $1,097 $974 $920 $1,026 $1,048 $1,004 $1,027 $952 General Merchandise Stores $749 $699 $667 $673 $702 $686 $695 $700 $700 Eating and Drinking Places $3,071 $2,894 $2,844 $2,854 $3,016 $3,124 $3,111 $3,386 $3,234 Other Retail Stores $4,271 $3,754 $4,132 $5,033 $7,216 $8,446 $10,148 $10,470 $10,774
Retail Stores Total $24,926 $22,459 $21,058 $20,581 $23,339 $25,300 $26,094 $25,860 $23,746Excluding Other Retail Stores $20,656 $18,705 $16,926 $15,548 $16,123 $16,854 $15,946 $15,391 $12,972
Population 28,592 28,673 28,754 28,836 28,918 29,000 29,082 29,164 29,247
(a) Retail sales have been adjusted to 2010 dollars based on the Bay Area Consumer Price Index, U.S. Bureau of Labor Statistics. At the beginning of 2007, SBOE madesome minor changes to their classification system, thus year-to-year comparisons with previous years should be made with caution. Beginning in 2009, SBOE mademajor changes in their classification system, such that comparisons with the data here cannot be made. 2009 data presented in a separate table.(b) Analysis excludes all non-retail outlets (business and personal services) reporting taxable sales.(c) A "#" sign indicates data unavailability for the category due to SBOE confidentiality rules that suppress data when there are four or fewer outlets or sales in acategory dominated by one store. Suppressed sales have been combined with Other Retail Stores.(d) Per capita sales calculated based on sales divided by population. Population for each year has been estimated by assuming a constant annual growth rate from 2000through 2010. 2000 population from decennial Census, and 2010 population estimate from Claritas.
Sources: 2000 and 2010 U.S. Census; State Board of Equalization; CA Dept. of Industrial Relations; U.S. Bureau of Labor Statistics; BAE, 2011.
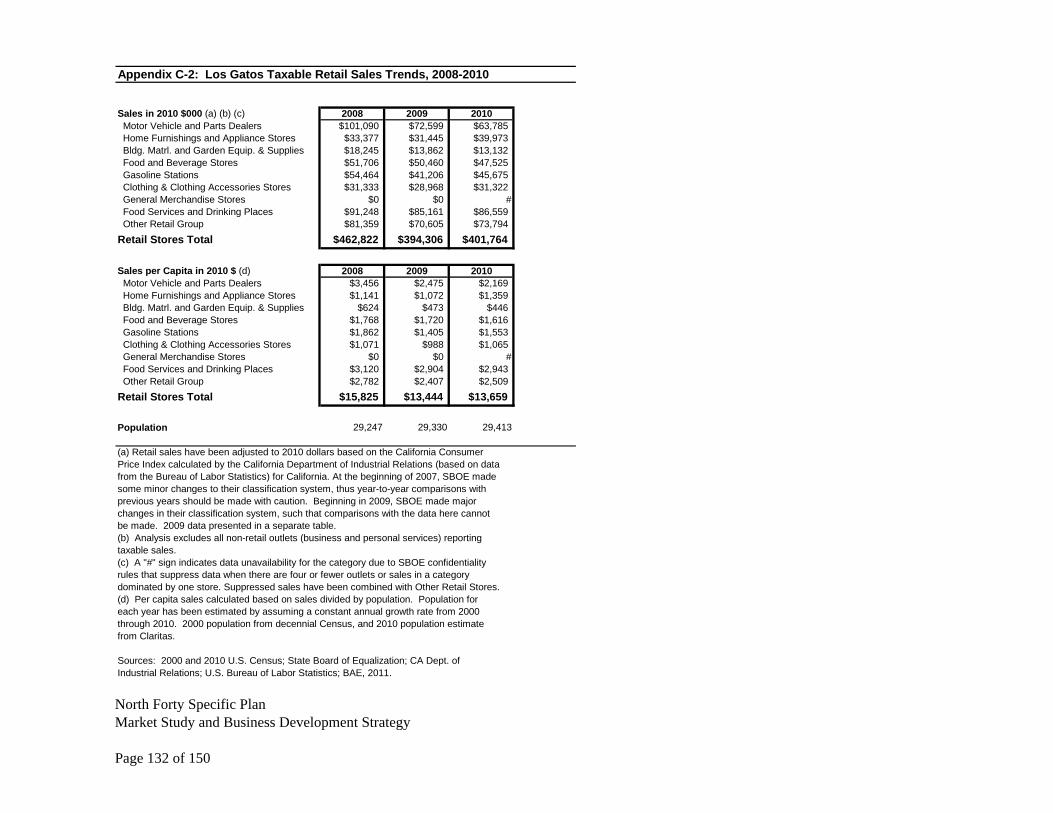
North Forty Specific Plan Market Study and Business Development Strategy Page 132 of 150
Appendix C-2: Los Gatos Taxable Retail Sales Trends, 2008-2010
Sales in 2010 $000 (a) (b) (c) 2008 2009 2010 Motor Vehicle and Parts Dealers $101,090 $72,599 $63,785 Home Furnishings and Appliance Stores $33,377 $31,445 $39,973 Bldg. Matrl. and Garden Equip. & Supplies $18,245 $13,862 $13,132 Food and Beverage Stores $51,706 $50,460 $47,525 Gasoline Stations $54,464 $41,206 $45,675 Clothing & Clothing Accessories Stores $31,333 $28,968 $31,322 General Merchandise Stores $0 $0 # Food Services and Drinking Places $91,248 $85,161 $86,559 Other Retail Group $81,359 $70,605 $73,794Retail Stores Total $462,822 $394,306 $401,764
Sales per Capita in 2010 $ (d) 2008 2009 2010 Motor Vehicle and Parts Dealers $3,456 $2,475 $2,169 Home Furnishings and Appliance Stores $1,141 $1,072 $1,359 Bldg. Matrl. and Garden Equip. & Supplies $624 $473 $446 Food and Beverage Stores $1,768 $1,720 $1,616 Gasoline Stations $1,862 $1,405 $1,553 Clothing & Clothing Accessories Stores $1,071 $988 $1,065 General Merchandise Stores $0 $0 # Food Services and Drinking Places $3,120 $2,904 $2,943 Other Retail Group $2,782 $2,407 $2,509Retail Stores Total $15,825 $13,444 $13,659
Population 29,247 29,330 29,413
(a) Retail sales have been adjusted to 2010 dollars based on the California ConsumerPrice Index calculated by the California Department of Industrial Relations (based on datafrom the Bureau of Labor Statistics) for California. At the beginning of 2007, SBOE madesome minor changes to their classification system, thus year-to-year comparisons withprevious years should be made with caution. Beginning in 2009, SBOE made majorchanges in their classification system, such that comparisons with the data here cannotbe made. 2009 data presented in a separate table.(b) Analysis excludes all non-retail outlets (business and personal services) reportingtaxable sales.(c) A "#" sign indicates data unavailability for the category due to SBOE confidentialityrules that suppress data when there are four or fewer outlets or sales in a categorydominated by one store. Suppressed sales have been combined with Other Retail Stores.(d) Per capita sales calculated based on sales divided by population. Population foreach year has been estimated by assuming a constant annual growth rate from 2000through 2010. 2000 population from decennial Census, and 2010 population estimatefrom Claritas.
Sources: 2000 and 2010 U.S. Census; State Board of Equalization; CA Dept. ofIndustrial Relations; U.S. Bureau of Labor Statistics; BAE, 2011.

North Forty Specific Plan
Market Study and Business Development Strategy
Page 133 of 150
Appendix C-3: Campbell Taxable Retail Sales Trends
Sales in 2010 $000 (a) (b) (c) 2000 2001 2002 2003 2004 2005 2006 2007 2008 Motor Vehicles and Parts $29,553 $29,448 $24,457 $25,945 $27,386 $33,478 $32,619 $28,239 $24,761 Home Furnishings and Appliances $49,176 $41,412 $37,166 $32,810 $40,082 $14,545 $19,919 $26,330 $55,131 Building Materials $164,012 $142,786 $130,739 $131,992 $157,045 $155,747 $152,911 $135,163 $105,582 Food Stores $31,480 $32,574 $32,342 $32,367 $31,879 $32,245 $33,754 $33,737 $32,022 Service Stations $70,019 $60,345 $62,600 $64,704 $68,319 $73,646 $71,980 $74,366 $77,807 Apparel Stores $30,978 $27,771 $26,766 $26,267 $28,542 $28,330 $40,562 $40,906 $32,401 General Merchandise Stores $64,186 $60,599 $57,985 $53,307 $53,496 $53,581 $53,275 $51,271 $50,793 Eating and Drinking Places $114,778 $111,665 $110,383 $102,625 $104,291 $108,089 $110,271 $114,787 $114,852 Other Retail Stores $222,199 $172,348 $137,458 $133,533 $135,889 $160,876 $161,516 $148,830 $127,585Retail Stores Total $776,382 $678,945 $619,895 $603,549 $646,928 $660,538 $676,806 $653,629 $620,936
Sales per Capita in 2010 $ (d) 2000 2001 2002 2003 2004 2005 2006 2007 2008 Motor Vehicles and Parts $775 $770 $637 $674 $709 $864 $839 $724 $633 Home Furnishings and Appliances $1,289 $1,082 $968 $852 $1,038 $375 $513 $675 $1,410 Building Materials $4,301 $3,732 $3,407 $3,429 $4,067 $4,020 $3,935 $3,467 $2,700 Food Stores $825 $851 $843 $841 $825 $832 $869 $865 $819 Service Stations $1,836 $1,577 $1,631 $1,681 $1,769 $1,901 $1,852 $1,908 $1,990 Apparel Stores $812 $726 $697 $682 $739 $731 $1,044 $1,049 $829 General Merchandise Stores $1,683 $1,584 $1,511 $1,385 $1,385 $1,383 $1,371 $1,315 $1,299 Eating and Drinking Places $3,010 $2,919 $2,876 $2,666 $2,701 $2,790 $2,838 $2,945 $2,937 Other Retail Stores $5,826 $4,505 $3,582 $3,469 $3,519 $4,153 $4,156 $3,818 $3,263Retail Stores Total $20,357 $17,747 $16,153 $15,678 $16,752 $17,051 $17,417 $16,768 $15,879
Population 38,138 38,257 38,377 38,497 38,618 38,739 38,860 38,982 39,104
(a) Retail sales have been adjusted to 2010 dollars based on the Bay Area Consumer Price Index, U.S. Bureau of Labor Statistics. At the beginning of 2007, SBOE madesome minor changes to their classification system, thus year-to-year comparisons with previous years should be made with caution. Beginning in 2009, SBOE mademajor changes in their classification system, such that comparisons with the data here cannot be made. 2009 data presented in a separate table.(b) Analysis excludes all non-retail outlets (business and personal services) reporting taxable sales.(c) A "#" sign indicates data unavailability for the category due to SBOE confidentiality rules that suppress data when there are four or fewer outlets or sales in a categorydominated by one store. Suppressed sales have been combined with Other Retail Stores.(d) Per capita sales calculated based on sales divided by population. Population for each year has been estimated by assuming a constant annual growth rate from 2000through 2010. 2000 and 2010 population from decennial Census.
Sources: 2000 and 2010 U.S. Census; State Board of Equalization; CA Dept. of Industrial Relations; U.S. Bureau of Labor Statistics; BAE, 2011.

North Forty Specific Plan Market Study and Business Development Strategy Page 134 of 150
Appendix C-4: Saratoga Taxable Retail Sales Trends
Sales in 2010 $000 (a) (b) (c) 2000 2001 2002 2003 2004 2005 2006 2007 2008 Motor Vehicles and Parts $4,388 $4,112 $4,145 $4,176 $4,228 $4,332 $4,454 $4,278 $4,256 Home Furnishings and Appliances $10,057 $7,858 $6,855 $5,285 $5,436 $5,802 $5,107 $5,721 $4,334 Building Materials # # # $3,087 # # # # # Food Stores $12,499 $12,413 $11,699 $10,342 $9,741 $9,369 $9,273 $8,932 $9,296 Service Stations $9,259 $7,805 $6,670 $7,389 $8,958 $9,784 $10,066 $10,892 # Apparel Stores $1,192 $1,776 $1,543 $1,189 $1,703 $1,178 $1,123 $1,704 $1,483 General Merchandise Stores $7,314 $6,870 $6,683 # $6,782 # # # # Eating and Drinking Places $35,047 $28,998 $28,357 $25,154 $26,604 $27,560 $27,937 $22,024 $23,461 Other Retail Stores $20,607 $20,496 $19,034 $21,658 $17,709 $22,603 $22,096 $21,129 $29,274Retail Stores Total $100,363 $90,329 $84,985 $78,280 $81,160 $80,629 $80,056 $74,680 $72,103
Sales per Capita in 2010 $ (d) 2000 2001 2002 2003 2004 2005 2006 2007 2008 Motor Vehicles and Parts $147 $138 $139 $140 $142 $145 $149 $143 $142 Home Furnishings and Appliances $337 $263 $230 $177 $182 $194 $171 $191 $145 Building Materials # # # $103 # # # # # Food Stores $419 $416 $392 $346 $326 $314 $310 $299 $311 Service Stations $310 $261 $223 $247 $300 $327 $337 $364 # Apparel Stores $40 $60 $52 $40 $57 $39 $38 $57 $50 General Merchandise Stores $245 $230 $224 # $227 # # # # Eating and Drinking Places $1,174 $971 $950 $842 $890 $922 $935 $737 $784 Other Retail Stores $691 $687 $637 $725 $593 $756 $739 $707 $979Retail Stores Total $3,363 $3,026 $2,846 $2,621 $2,717 $2,698 $2,678 $2,498 $2,411
Population 29,843 29,851 29,860 29,868 29,876 29,884 29,893 29,901 29,909
(a) Retail sales have been adjusted to 2010 dollars based on the Bay Area Consumer Price Index, U.S. Bureau of Labor Statistics. At the beginning of 2007, SBOE madesome minor changes to their classification system, thus year-to-year comparisons with previous years should be made with caution. Beginning in 2009, SBOE mademajor changes in their classification system, such that comparisons with the data here cannot be made. 2009 data presented in a separate table.(b) Analysis excludes all non-retail outlets (business and personal services) reporting taxable sales.(c) A "#" sign indicates data unavailability for the category due to SBOE confidentiality rules that suppress data when there are four or fewer outlets or sales in a categorydominated by one store. Suppressed sales have been combined with Other Retail Stores.(d) Per capita sales calculated based on sales divided by population. Population for each year has been estimated by assuming a constant annual growth rate from 2000through 2010. 2000 and 2010 population from decennial Census.
Sources: 2000 and 2010 U.S. Census; State Board of Equalization; CA Dept. of Industrial Relations; U.S. Bureau of Labor Statistics; BAE, 2011.

North Forty Specific Plan
Market Study and Business Development Strategy
Page 135 of 150
Appendix C-5: Cupertino Taxable Retail Sales Trends
Sales in 2010 $000 (a) (b) (c) 2000 2001 2002 2003 2004 2005 2006 2007 2008 Motor Vehicles and Parts $56,273 $53,152 # # $20,864 $3,257 $3,524 $3,295 $3,212 Home Furnishings and Appliances $45,819 $30,429 $25,229 $20,999 $15,310 $16,165 $10,329 $10,276 $9,810 Building Materials $8,595 $6,528 $5,815 $4,612 # # # # # Food Stores $31,689 $30,024 $29,869 $28,320 $28,305 $29,345 $28,300 $30,826 $31,200 Service Stations $58,475 $52,898 $45,317 $50,496 $56,881 $64,243 $63,152 $67,564 $68,515 Apparel Stores $41,148 $33,569 $29,579 $26,371 $23,756 $22,769 $20,138 $19,231 $16,145 General Merchandise Stores $241,853 $223,030 $195,546 $176,279 $176,379 $168,180 $158,377 $159,050 $143,162 Eating and Drinking Places $119,193 $113,281 $100,376 $98,065 $96,902 $109,771 $116,023 $118,231 $112,054 Other Retail Stores $156,062 $149,798 $140,683 $110,273 $77,314 $73,682 $77,731 $275,321 $214,737Retail Stores Total $759,108 $692,707 $572,415 $515,415 $495,711 $487,413 $477,574 $683,794 $598,836
Sales per Capita in 2010 $ (d) 2000 2001 2002 2003 2004 2005 2006 2007 2008 Motor Vehicles and Parts $1,113 $1,037 # # $390 $60 $64 $59 $57 Home Furnishings and Appliances $906 $593 $485 $398 $286 $298 $188 $184 $173 Building Materials $170 $127 $112 $87 # # # # # Food Stores $627 $586 $574 $537 $529 $541 $514 $552 $551 Service Stations $1,157 $1,032 $871 $957 $1,063 $1,183 $1,147 $1,210 $1,209 Apparel Stores $814 $655 $569 $500 $444 $419 $366 $344 $285 General Merchandise Stores $4,785 $4,350 $3,760 $3,341 $3,296 $3,098 $2,876 $2,847 $2,527 Eating and Drinking Places $2,358 $2,209 $1,930 $1,859 $1,811 $2,022 $2,107 $2,117 $1,978 Other Retail Stores $3,088 $2,922 $2,705 $2,090 $1,445 $1,357 $1,412 $4,929 $3,790Retail Stores Total $15,018 $13,510 $11,006 $9,769 $9,263 $8,979 $8,673 $12,242 $10,569
Population 50,546 51,273 52,010 52,758 53,516 54,286 55,066 55,858 56,661
(a) Retail sales have been adjusted to 2010 dollars based on the Bay Area Consumer Price Index, U.S. Bureau of Labor Statistics. At the beginning of 2007, SBOE madesome minor changes to their classification system, thus year-to-year comparisons with previous years should be made with caution. Beginning in 2009, SBOE mademajor changes in their classification system, such that comparisons with the data here cannot be made. 2009 data presented in a separate table.(b) Analysis excludes all non-retail outlets (business and personal services) reporting taxable sales.(c) A "#" sign indicates data unavailability for the category due to SBOE confidentiality rules that suppress data when there are four or fewer outlets or sales in a categorydominated by one store. Suppressed sales have been combined with Other Retail Stores.(d) Per capita sales calculated based on sales divided by population. Population for each year has been estimated by assuming a constant annual growth rate from 2000through 2010. 2000 and 2010 population from decennial Census.
Sources: 2000 and 2010 U.S. Census; State Board of Equalization; CA Dept. of Industrial Relations; U.S. Bureau of Labor Statistics; BAE, 2011.

North Forty Specific Plan Market Study and Business Development Strategy Page 136 of 150
Appendix C-6: San Jose Taxable Retail Sales Trends
Sales in 2010 $000 (a) (b) (c) 2000 2001 2002 2003 2004 2005 2006 2007 2008 Motor Vehicles and Parts $2,246,877 $1,895,444 $1,699,864 $1,695,468 $1,777,480 $1,766,284 $1,722,330 $1,630,225 $1,161,933 Home Furnishings and Appliances $534,878 $451,038 $414,410 $389,236 $392,143 $407,490 $396,502 $379,454 $413,622 Building Materials $919,880 $870,164 $863,878 $854,269 $954,004 $957,969 $951,797 $822,866 $714,557 Food Stores $515,471 $500,637 $479,433 $460,596 $453,354 $450,808 $444,997 $449,822 $419,588 Service Stations $988,115 $914,038 $770,909 $862,294 $997,982 $1,145,959 $1,226,762 $1,311,833 $1,428,528 Apparel Stores $402,134 $400,181 $406,380 $430,972 $490,782 $534,272 $559,487 $566,337 $599,003 General Merchandise Stores $1,606,208 $1,454,137 $1,352,055 $1,326,210 $1,364,526 $1,429,670 $1,448,971 $1,501,148 $1,389,893 Eating and Drinking Places $1,126,989 $1,073,618 $1,024,134 $1,041,052 $1,118,423 $1,174,522 $1,226,715 $1,270,164 $1,256,330 Other Retail Stores $2,372,973 $1,937,026 $1,661,955 $1,577,785 $1,543,576 $1,590,265 $1,713,726 $1,789,965 $1,333,694Retail Stores Total $10,713,525 $9,496,283 $8,673,016 $8,637,880 $9,092,270 $9,457,240 $9,691,285 $9,721,815 $8,717,148
Sales per Capita in 2010 $ (d) 2000 2001 2002 2003 2004 2005 2006 2007 2008 Motor Vehicles and Parts $2,511 $2,106 $1,878 $1,863 $1,943 $1,920 $1,862 $1,752 $1,242 Home Furnishings and Appliances $598 $501 $458 $428 $429 $443 $429 $408 $442 Building Materials $1,028 $967 $955 $939 $1,043 $1,041 $1,029 $884 $764 Food Stores $576 $556 $530 $506 $495 $490 $481 $484 $449 Service Stations $1,104 $1,016 $852 $948 $1,091 $1,245 $1,326 $1,410 $1,527 Apparel Stores $449 $445 $449 $474 $536 $581 $605 $609 $640 General Merchandise Stores $1,795 $1,616 $1,494 $1,457 $1,491 $1,554 $1,566 $1,614 $1,486 Eating and Drinking Places $1,259 $1,193 $1,132 $1,144 $1,222 $1,277 $1,326 $1,365 $1,343 Other Retail Stores $2,652 $2,152 $1,837 $1,734 $1,687 $1,728 $1,852 $1,924 $1,426Retail Stores Total $11,971 $10,552 $9,584 $9,493 $9,937 $10,279 $10,475 $10,450 $9,318
Population 894,943 899,917 904,918 909,947 915,004 920,089 925,203 930,344 935,515
(a) Retail sales have been adjusted to 2010 dollars based on the Bay Area Consumer Price Index, U.S. Bureau of Labor Statistics. At the beginning of 2007, SBOE madesome minor changes to their classification system, thus year-to-year comparisons with previous years should be made with caution. Beginning in 2009, SBOE mademajor changes in their classification system, such that comparisons with the data here cannot be made. 2009 data presented in a separate table.(b) Analysis excludes all non-retail outlets (business and personal services) reporting taxable sales.(c) A "#" sign indicates data unavailability for the category due to SBOE confidentiality rules that suppress data when there are four or fewer outlets or sales in a categorydominated by one store. Suppressed sales have been combined with Other Retail Stores.(d) Per capita sales calculated based on sales divided by population. Population for each year has been estimated by assuming a constant annual growth rate from 2000through 2010. 2000 and 2010 population from decennial Census.
Sources: 2000 and 2010 U.S. Census; State Board of Equalization; CA Dept. of Industrial Relations; U.S. Bureau of Labor Statistics; BAE, 2011.

North Forty Specific Plan
Market Study and Business Development Strategy
Page 137 of 150
Appendix C-7: Santa Clara County Taxable Retail Sales Trends
Sales in 2010 $000 (a) (b) (c) 2000 2001 2002 2003 2004 2005 2006 2007 2008 Motor Vehicles and Parts $4,968,565 $4,265,768 $3,772,377 $3,640,370 $3,757,926 $3,796,149 $3,733,332 $3,651,501 $2,767,127 Home Furnishings and Appliances $1,486,510 $1,159,752 $1,003,560 $924,979 $950,271 $954,578 $956,731 $948,802 $1,091,072 Building Materials $1,792,956 $1,647,928 $1,566,758 $1,581,975 $1,827,088 $1,849,946 $1,880,555 $1,665,481 $1,385,137 Food Stores $1,064,362 $1,031,159 $982,775 $949,633 $937,851 $931,964 $923,447 $937,407 $886,946 Service Stations $1,825,002 $1,662,170 $1,460,927 $1,636,789 $1,890,416 $2,140,128 $2,284,313 $2,443,177 $2,579,392 Apparel Stores $1,106,359 $1,058,166 $1,039,426 $1,076,539 $1,202,588 $1,311,924 $1,374,616 $1,404,572 $1,452,716 General Merchandise Stores $3,604,051 $3,258,536 $3,028,507 $2,998,936 $3,110,365 $3,186,897 $3,239,571 $3,277,075 $3,008,658 Eating and Drinking Places $2,893,614 $2,681,991 $2,518,527 $2,477,754 $2,612,452 $2,738,626 $2,876,838 $2,962,251 $2,937,559 Other Retail Stores $6,218,929 $4,719,754 $3,985,797 $3,840,683 $3,991,103 $4,303,219 $4,520,575 $4,599,032 $3,612,357Retail Stores Total $24,960,348 $21,485,224 $19,358,654 $19,127,657 $20,280,059 $21,213,429 $21,789,977 $21,889,299 $19,720,964
Sales per Capita in 2010 $ (d) 2000 2001 2002 2003 2004 2005 2006 2007 2008 Motor Vehicles and Parts $2,953 $2,521 $2,217 $2,127 $2,183 $2,193 $2,144 $2,085 $1,571 Home Furnishings and Appliances $883 $685 $590 $540 $552 $551 $549 $542 $619 Building Materials $1,066 $974 $921 $924 $1,061 $1,068 $1,080 $951 $786 Food Stores $633 $609 $577 $555 $545 $538 $530 $535 $504 Service Stations $1,085 $982 $858 $956 $1,098 $1,236 $1,312 $1,395 $1,464 Apparel Stores $658 $625 $611 $629 $699 $758 $789 $802 $825 General Merchandise Stores $2,142 $1,926 $1,779 $1,752 $1,807 $1,841 $1,860 $1,871 $1,708 Eating and Drinking Places $1,720 $1,585 $1,480 $1,448 $1,518 $1,582 $1,652 $1,691 $1,668 Other Retail Stores $3,696 $2,789 $2,342 $2,244 $2,318 $2,485 $2,596 $2,626 $2,051Retail Stores Total $14,835 $12,696 $11,374 $11,175 $11,780 $12,252 $12,513 $12,499 $11,196
Population 1,682,585 1,692,238 1,701,946 1,711,709 1,721,529 1,731,405 1,741,338 1,751,328 1,761,375
(a) Retail sales have been adjusted to 2010 dollars based on the Bay Area Consumer Price Index, U.S. Bureau of Labor Statistics. At the beginning of 2007, SBOE madesome minor changes to their classification system, thus year-to-year comparisons with previous years should be made with caution. Beginning in 2009, SBOE mademajor changes in their classification system, such that comparisons with the data here cannot be made. 2009 data presented in a separate table.(b) Analysis excludes all non-retail outlets (business and personal services) reporting taxable sales.(c) A "#" sign indicates data unavailability for the category due to SBOE confidentiality rules that suppress data when there are four or fewer outlets or sales in a categorydominated by one store. Suppressed sales have been combined with Other Retail Stores.(d) Per capita sales calculated based on sales divided by population. Population for each year has been estimated by assuming a constant annual growth rate from 2000through 2010. 2000 population from decennial Census, and 2010 population estimate from Claritas.
Sources: 2000 and 2010 U.S. Census; State Board of Equalization; CA Dept. of Industrial Relations; U.S. Bureau of Labor Statistics; BAE, 2011.

North Forty Specific Plan Market Study and Business Development Strategy Page 138 of 150
Appendix C-8: California Retail Sales Trends
Sales in 2010 $000 (a) (b) (c) 2000 2001 2002 2003 2004 2005 2006 2007 2008 Motor Vehicles and Parts $73,642,245 $75,900,902 $77,819,616 $79,912,840 $82,184,658 $82,436,082 $77,157,652 73,870,970 55,052,561 Home Furnishings and Appliances $17,645,813 $16,650,104 $17,050,368 $18,001,228 $19,051,612 $19,475,949 $18,739,358 17,451,059 17,360,769 Building Materials $32,201,355 $33,046,559 $34,232,032 $36,580,862 $43,119,528 $44,417,809 $42,916,841 34,082,440 26,897,348 Food Stores $23,852,975 $23,508,143 $23,108,197 $23,130,272 $23,023,767 $23,664,615 $23,569,585 23,441,943 21,706,335 Service Stations $32,725,704 $30,753,380 $29,176,773 $33,030,343 $38,043,921 $43,195,866 $46,978,937 49,141,160 52,503,918 Apparel Stores $16,677,991 $16,720,376 $17,106,352 $18,091,201 $19,692,408 $20,958,227 $21,376,110 21,766,676 22,327,906 General Merchandise Stores $59,494,013 $58,935,268 $59,121,960 $60,246,539 $62,640,249 $63,603,573 $63,887,556 62,513,093 56,955,574 Eating and Drinking Places $46,035,129 $46,019,714 $46,432,224 $47,731,290 $50,255,519 $51,983,992 $53,069,313 53,914,527 52,540,412 Other Retail Stores $70,385,615 $65,577,936 $63,720,144 $64,910,580 $68,645,636 $71,181,970 $71,718,413 67,744,788 55,330,512 Retail Stores Total $372,660,839 $367,112,382 $367,767,667 $381,635,156 $406,657,299 $420,918,084 $419,413,765 $403,926,655 $360,675,335
Sales per Capita in 2010 $ (d) 2000 2001 2002 2003 2004 2005 2006 2007 2008 Motor Vehicles and Parts $2,174 $2,220 $2,254 $2,293 $2,336 $2,321 $2,151 $2,040 $1,506 Home Furnishings and Appliances $521 $487 $494 $516 $541 $548 $523 $482 $475 Building Materials $951 $966 $992 $1,050 $1,225 $1,250 $1,197 $941 $736 Food Stores $704 $687 $669 $664 $654 $666 $657 $647 $594 Service Stations $966 $899 $845 $948 $1,081 $1,216 $1,310 $1,357 $1,436 Apparel Stores $492 $489 $495 $519 $560 $590 $596 $601 $611 General Merchandise Stores $1,756 $1,723 $1,712 $1,729 $1,780 $1,790 $1,781 $1,727 $1,558 Eating and Drinking Places $1,359 $1,346 $1,345 $1,369 $1,428 $1,463 $1,480 $1,489 $1,437 Other Retail Stores $2,078 $1,918 $1,846 $1,862 $1,951 $2,004 $2,000 $1,871 $1,514Retail Stores Total $11,002 $10,735 $10,653 $10,950 $11,557 $11,849 $11,695 $11,156 $9,868
Population 33,873,086 34,196,883 34,523,776 34,853,794 35,186,966 35,523,323 35,862,895 36,205,713 36,551,809
(a) Retail sales have been adjusted to 2010 dollars based on the California Consumer Price Index, from the CA Dept. of Industrial Relations, based on data from the U.S. Bureau of Labor Statistics.At the beginning of 2007, SBOE made some minor changes to their classification system, thus year-to-year comparisons with previous years should be made with caution. Beginning in 2009,SBOE made major changes in their classification system, such that comparisons with the data here cannot be made. 2009 data presented in a separate table.(b) Analysis excludes all non-retail outlets (business and personal services) reporting taxable sales.(c) A "#" sign indicates data unavailability for the category due to SBOE confidentiality rules that suppress data when there are four or fewer outlets or sales in a categorydominated by one store. Suppressed sales have been combined with Other Retail Stores.(d) Per capita sales calculated based on sales divided by population. Population for each year has been estimated by assuming a constant annual growth rate from 2000through 2010. 2000 population from decennial Census, and 2010 population estimate from Claritas.
Sources: 2000 and 2010 U.S. Census; State Board of Equalization; CA Dept. of Industrial Relations; U.S. Bureau of Labor Statistics; BAE, 2011.
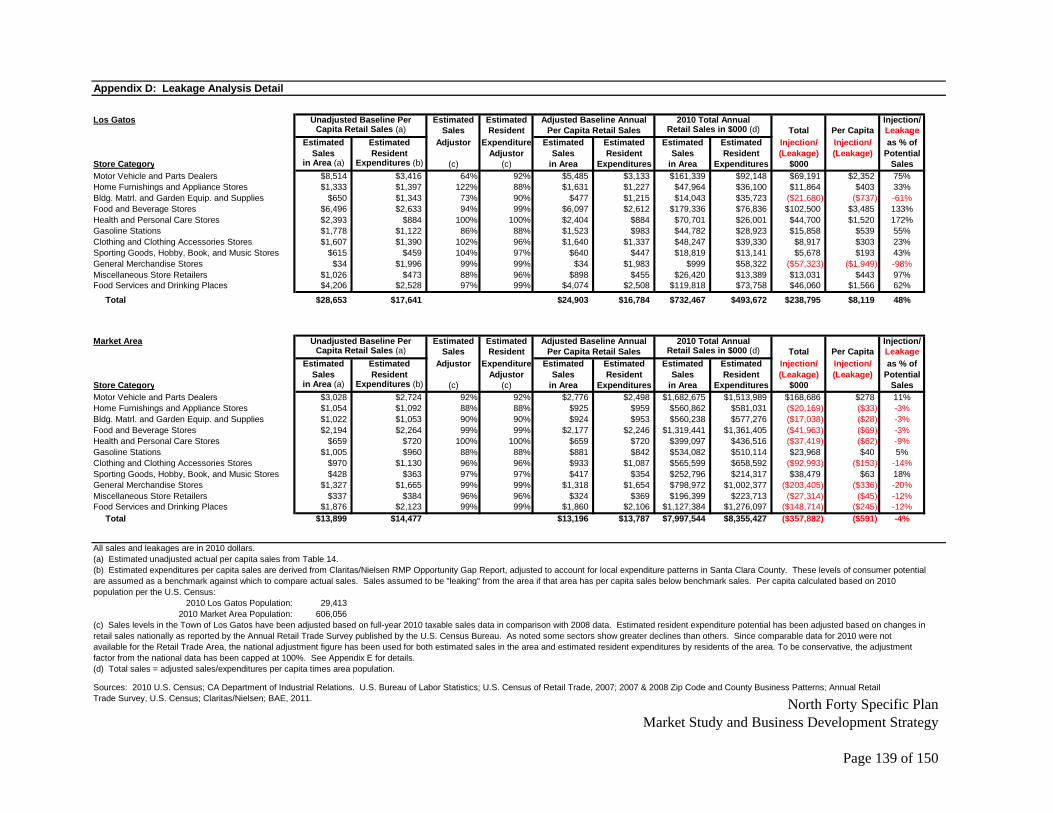
North Forty Specific Plan Market Study and Business Development Strategy
Page 139 of 150
Appendix D: Leakage Analysis Detail
Los Gatos Unadjusted Baseline Per Estimated Estimated Adjusted Baseline Annual 2010 Total Annual Injection/Capita Retail Sales (a) Sales Resident Per Capita Retail Sales Retail Sales in $000 (d) Total Per Capita Leakage
AEstimated Estimated djustor Expenditure Estimated Estimated Estimated EstimatedSales Resident
Injection/ Injection/ as % ofAdjustor Sales Resident Sales Resident ) Potential
Store Categor(Leakage) (Leakage
in Area Expenditures(a) (b)y (c) (c) in Area Expenditures in Area Expenditures SalesMotor Vehicle and Parts Dealers $8,514 $3,416 64% 92% $5,485 $3,133 $161,339 $92,148 $69,191 $2,352 75%Home Furnishings and Appliance Stores $1,333 $1,397 122% 88% $1,631 $1,227 $47,964 $36,100 $11,864 $403 33%Bldg. Matrl. and Garden Equip. and Supplies $650 $1,343 73% 90% $477 $1,215 $14,043 $35,723Food and Beverage Stores $6,496 $2,633 94% 99% $6,097 $2,612 $179,336 $76,836Health and Personal Care Stores $2,393 $884 100% 100% $2,404 $884 $70,701 $26,001 $44,700 $1,520 172%Gasoline Stations $1,778 $1,122 86% 88% $1,523 $983 $44,782 $28,923 $15,858 $539 55%Clothing and Clothing Accessories Stores $1,607 $1,390 102% 96% $1,640 $1,337 $48,247 $39,330 $8,917 $303 23%Sporting Goods, Hobby, Book, and Music Stores $615 $459 104% 97% $640 $447 $18,819 $13,141 $5,678 $193 43%General Merchandise Stores $34 $1,996 99% 99% $34 $1,983 $999 $58,322Miscellaneous Store Retailers $1,026 $473 88% 96% $898 $455 $26,420 $13,389Food Services and Drinking Places $4,206 $2,528 97% 99% $4,074 $2,508 $119,818 $73,758 $46,060 $1,566 62%
Total $28,653 $17,641 $24,903 $16,784 $732,467 $493,672 $238,795 $8,119 48%
Market Area
$000
($21,680) ($737) -61%$102,500 $3,485 133%
($57,323) ($1,949) -98%$13,031 $443 97%
Unadjusted Baseline Per Estimated Estimated Adjusted Baseline Annual 2010 Total Annual Injection/Capita Retail Sales Sales in $000Sales Resident Per Capita Retail Sales Retail (a) (d) Total Per Capita
Estimated EstimatedLeakage
Adjustor Expenditure Estimated Estimated Estimated Estimated as % ofSales Resident
Injection/ Injection/Adjustor Sales Resident Sales Resident ) Potential
Store Categor(Leakage) (Leakage
in Area Expenditures(a) (b)y (c) (c) in Area Expenditures in Area Expenditures $000 SalesMotor Vehicle and Parts Dealers $3,028 $2,724 92% 92% $2,776 $2,498 $1,682,675 $1,513,989 $168,686 $278 11%Home Furnishings and Appliance Stores $1,054 $1,092 88% 88% $925 $959 $560,862 $581,031Bldg. Matrl. and Garden Equip. and Supplies $1,022 $1,053 90% 90% $924 $953 $560,238 $577,276Food and Beverage Stores $2,194 $2,264 99% 99% $2,177 $2,246 $1,319,441 $1,361,405Health and Personal Care Stores $659 $720 100% 100% $659 $720 $399,097 $436,516Gasoline Stations $1,005 $960 88% 88% $881 $842 $534,082 $510,114 $23,96 $40 5%Clothing and Clothing Accessories Stores $970 $1,130 96% 96% $933 $1,087 $565,599 $658,592Sporting Goods, Hobby, Book, and Music Stores $428 $363 97% 97% $417 $354 $252,796 $214,317 $38,47 $63 18%General Merchandise Stores $1,327 $1,665 99% 99% $1,318 $1,654 $798,972 $1,002,377Miscellaneous Store Retailers $337 $384 96% 96% $324 $369 $196,399 $223,713Food Services and Drinking Places $1,876 $2,123 99% 99% $1,860 $2,106 $1,127,384 $1,276,097 Total $13,899 $14,477 $13,196 $13,787 $7,997,544 $8,355,427
All sales and leakages are in 2010 dollars.(a) Estimated unadjusted actual per capita sales from Table 14.(b) Estimated expenditures per capita sales are derived from Claritas/Nielsen RMP Opportunity Gap Report, adjusted to account for local expenditure patterns in Santa Clara County. These levels of consumer potentialare assumed as a benchmark against which to compare actual sales. Sales assumed to be "leaking" from the area if that area has per capita sales below benchmark sales. Per capita calculated based on 2010population per the U.S. Census:
2010 Los Gatos Population: 29,413 2010 Market Area Population: 606,056
(c) Sales levels in the Town of Los Gatos have been adjusted based on full-year 2010 taxable sales data in comparison with 2008 data. Estimated resident expenditure potential has been adjusted based on changes inretail sales nationally as reported by the Annual Retail Trade Survey published by the U.S. Census Bureau. As noted some sectors show greater declines than others. Since comparable data for 2010 were notavailable for the Retail Trade Area, the national adjustment figure has been used for both estimated sales in the area and estimated resident expenditures by residents of the area. To be conservative, the adjustmentfactor from the national data has been capped at 100%. See Appendix E for details.(d) Total sales = adjusted sales/expenditures per capita times area population.
Sources: 2010 U.S. Census; CA Department of Industrial Relations. U.S. Bureau of Labor Statistics; U.S. Census of Retail Trade, 2007; 2007 & 2008 Zip Code and County Business Patterns; Annual RetailTrade Survey, U.S. Census; Claritas/Nielsen; BAE, 2011.
($20,169) ($33) -3%($17,038) ($28) -3%($41,963) ($69) -3%($37,419) ($62) -9%
8($92,993) ($153) -14%
9($203,405) ($336) -20%($27,314) ($45) -12%
($148,714) ($245) -12%($357,882) ($591) -4%
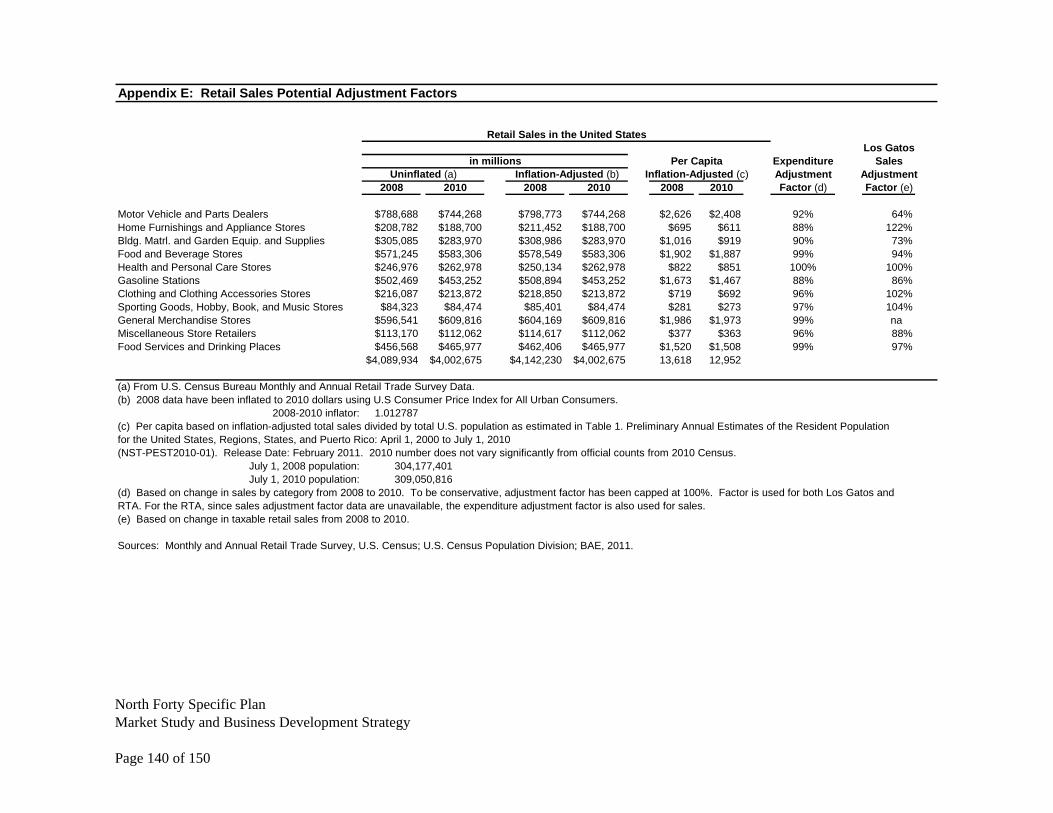
North Forty Specific Plan Market Study and Business Development Strategy Page 140 of 150
Appendix E: Retail Sales Potential Adjustment Factors
Retail Sales in the United StatesLos Gatos
in millions Per Capita Expenditure SalesUninflated (a) Inflation-Adjusted (b) Inflation-Adjusted (c) Adjustment Adjustment
2008 2010 2008 2010 2008 2010 Factor (d) Factor (e)
Motor Vehicle and Parts Dealers $788,688 $744,268 $798,773 $744,268 $2,626 $2,408 92% 64%Home Furnishings and Appliance Stores $208,782 $188,700 $211,452 $188,700 $695 $611 88% 122%Bldg. Matrl. and Garden Equip. and Supplies $305,085 $283,970 $308,986 $283,970 $1,016 $919 90% 73%Food and Beverage Stores $571,245 $583,306 $578,549 $583,306 $1,902 $1,887 99% 94%Health and Personal Care Stores $246,976 $262,978 $250,134 $262,978 $822 $851 100% 100%Gasoline Stations $502,469 $453,252 $508,894 $453,252 $1,673 $1,467 88% 86%Clothing and Clothing Accessories Stores $216,087 $213,872 $218,850 $213,872 $719 $692 96% 102%Sporting Goods, Hobby, Book, and Music Stores $84,323 $84,474 $85,401 $84,474 $281 $273 97% 104%General Merchandise Stores $596,541 $609,816 $604,169 $609,816 $1,986 $1,973 99% naMiscellaneous Store Retailers $113,170 $112,062 $114,617 $112,062 $377 $363 96% 88%Food Services and Drinking Places $456,568 $465,977 $462,406 $465,977 $1,520 $1,508 99% 97%
$4,089,934 $4,002,675 $4,142,230 $4,002,675 13,618 12,952
(a) From U.S. Census Bureau Monthly and Annual Retail Trade Survey Data.(b) 2008 data have been inflated to 2010 dollars using U.S Consumer Price Index for All Urban Consumers.
2008-2010 inflator: 1.012787(c) Per capita based on inflation-adjusted total sales divided by total U.S. population as estimated in Table 1. Preliminary Annual Estimates of the Resident Populationfor the United States, Regions, States, and Puerto Rico: April 1, 2000 to July 1, 2010(NST-PEST2010-01). Release Date: February 2011. 2010 number does not vary significantly from official counts from 2010 Census.
July 1, 2008 population: 304,177,401July 1, 2010 population: 309,050,816
(d) Based on change in sales by category from 2008 to 2010. To be conservative, adjustment factor has been capped at 100%. Factor is used for both Los Gatos andRTA. For the RTA, since sales adjustment factor data are unavailable, the expenditure adjustment factor is also used for sales.(e) Based on change in taxable retail sales from 2008 to 2010.
Sources: Monthly and Annual Retail Trade Survey, U.S. Census; U.S. Census Population Division; BAE, 2011.

App
endi
x F:
Lis
t of K
ey In
form
ants
Li
sa P
orria
M
anag
er, A
dmin
istra
tive
Serv
ices
Sa
mar
itan
Med
ical
Cen
ter
Jean
Altm
an
Man
ager
, Gue
st S
ervi
ces &
Gov
ernm
ent R
elat
ions
Off
icer
El
Cam
ino
Hos
pita
l R
onee
Nas
si
Exec
utiv
e D
irect
or
Los G
atos
Cha
mbe
r of C
omm
erce
D
iann
e A
nder
son
Cha
ir of
the
Boa
rd
Los G
atos
Cha
mbe
r of C
omm
erce
Sl
oan
Muk
ai
Prop
rieto
r Th
e W
oode
n H
orse
Toy
Sto
re
Fred
dy H
owel
l Pr
oprie
tor
Los G
atos
Bird
wat
cher
B
ob B
ortfi
eld
Prop
rieto
r V
inta
ges –
Est
ate
Sale
Ant
ique
s Sh
aron
Ste
rling
B
roke
r G
rosv
enor
Pr
oper
ties:
Tra
der J
oe’s
Sho
ppin
g C
ente
r (N
ot p
erso
nally
invo
lved
with
Nor
th 4
0 pr
ojec
t) Sh
ahra
m M
ouss
avi
Bro
ker
Terr
anom
ics
Prop
ertie
s: O
ld T
own
Cen
ter,
Kin
gs C
ourt
N
orth
For
ty S
peci
fic P
lan
Mar
ket S
tudy
and
Bus
ines
s Dev
elop
men
t Stra
tegy
Pa
ge 1
41 o
f 150

Dou
g Fe
rrar
i Pr
inci
pal
Prim
e C
omm
erci
al
Prop
ertie
s: L
os G
atos
Sho
ppin
g C
ente
r, Lo
s Gat
os V
illag
e Sq
uare
, New
Tow
n Sh
oppi
ng C
ente
r, va
rious
bui
ldin
gs in
the
dow
ntow
n co
re
Jam
es C
hung
B
roke
r Te
rran
omic
s Pr
oper
ties:
120
Nor
th S
anta
Cru
z, 3
5 W
est M
ain
Patty
Ste
ele
Vic
e Pr
esid
ent
Cor
nish
& C
arey
Com
mer
cial
N
ewm
ark
Kni
ght F
rank
Nor
th F
orty
Spe
cific
Pla
n M
arke
t Stu
dy a
nd B
usin
ess D
evel
opm
ent S
trate
gy
Page
142
of 1
50
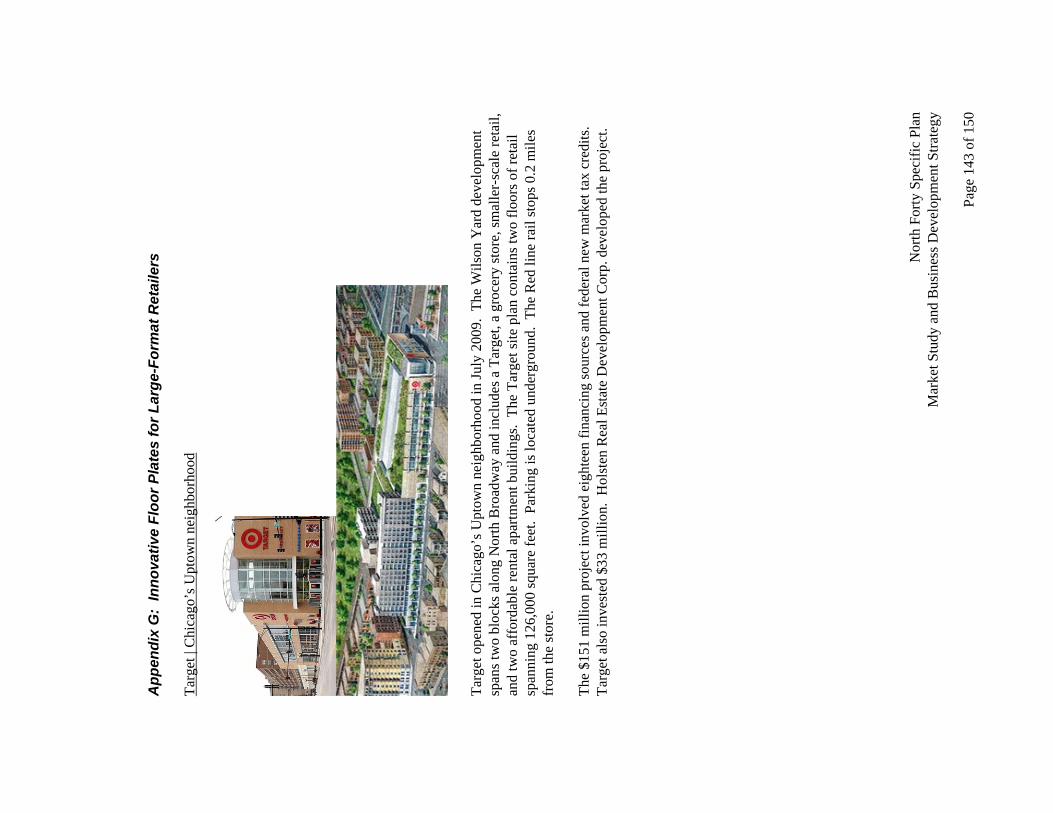
App
endi
x G
: In
nova
tive
Floo
r Pla
tes
for L
arge
-For
mat
Ret
aile
rs
Targ
et |
Chi
cago
’s U
ptow
n ne
ighb
orho
od
Ta
rget
ope
ned
in C
hica
go’s
Upt
own
neig
hbor
hood
in Ju
ly 2
009.
The
Wils
on Y
ard
deve
lopm
ent
span
s tw
o bl
ocks
alo
ng N
orth
Bro
adw
ay a
nd in
clud
es a
Tar
get,
a gr
ocer
y st
ore,
smal
ler-
scal
e re
tail,
an
d tw
o af
ford
able
rent
al a
partm
ent b
uild
ings
. Th
e Ta
rget
site
pla
n co
ntai
ns tw
o flo
ors o
f ret
ail
span
ning
126
,000
squa
re fe
et.
Park
ing
is lo
cate
d un
derg
roun
d. T
he R
ed li
ne ra
il st
ops 0
.2 m
iles
from
the
stor
e.
The
$151
mill
ion
proj
ect i
nvol
ved
eigh
teen
fina
ncin
g so
urce
s and
fede
ral n
ew m
arke
t tax
cre
dits
. Ta
rget
als
o in
vest
ed $
33 m
illio
n. H
olst
en R
eal E
stat
e D
evel
opm
ent C
orp.
dev
elop
ed th
e pr
ojec
t.
N
orth
For
ty S
peci
fic P
lan
Mar
ket S
tudy
and
Bus
ines
s Dev
elop
men
t Stra
tegy
Pa
ge 1
43 o
f 150

Wal
mar
t | W
ashi
ngto
n D
C
W
alm
art i
s pre
parin
g to
ope
n fo
ur st
ores
in W
ashi
ngto
n D
C o
ver t
he n
ext t
wo
year
s. O
ne st
ore,
lo
cate
d at
1st a
nd H
Stre
et N
W, i
s cur
rent
ly in
pla
nnin
g st
ages
. Th
e de
sign
show
case
s a si
x-st
ory
build
ing
atop
thre
e le
vels
of u
nder
grou
nd p
arki
ng.
The
grou
nd fl
oor l
evel
con
tain
s 10,
000
squa
re
feet
of r
etai
l spa
ce fo
r sm
all,
loca
l ret
aile
rs.
Wal
mar
t will
occ
upy
76,0
00-1
26,0
00 sq
uare
feet
on
the
2nd fl
oor,
whi
ch is
con
side
rabl
y sm
alle
r tha
n th
eir s
tand
ard
185,
000
squa
re su
per c
ente
r flo
or
plat
e. T
here
will
als
o be
four
stor
ies o
f apa
rtmen
ts a
bove
Wal
mar
t. T
he to
tal c
ompl
ex w
ill o
ccup
y ov
er fo
ur a
cres
. Th
e pr
opos
ed p
arki
ng ra
tios a
re th
ree
to fo
ur sp
aces
for e
very
1,0
00 sq
uare
feet
of
reta
il. T
he si
te is
loca
ted
0.4
mile
s fro
m U
nion
Sta
tion.
Th
e de
velo
pers
are
JBG
, JB
GR
, and
Ben
nett
Gro
up.
MV
+A A
rchi
tect
s of B
ethe
sda,
Mar
ylan
d is
th
e ar
chite
ct.
Nor
th F
orty
Spe
cific
Pla
n M
arke
t Stu
dy a
nd B
usin
ess D
evel
opm
ent S
trate
gy
Page
144
of 1
50

Hom
e D
epot
| N
ew Y
ork
City
, Man
hatta
n
Hom
e D
epot
firs
t ope
ned
in N
ew Y
ork
City
in 2
004
and
occu
pied
the
base
men
t and
gro
und
floor
le
vel o
f tw
o hi
stor
ic b
uild
ings
. Th
e ar
chite
ct u
nite
d a
pair
of li
mes
tone
bui
ldin
gs, a
nd u
pgra
ded
the
200
foot
cas
t-iro
n fa
çade
. H
ome
Dep
ot ta
kes u
p 10
6,00
0 sq
uare
feet
. Th
e flo
or p
lan
incl
udes
a 2
-st
ory
loft-
styl
e in
terio
r with
esc
alat
ors t
o th
e ba
sem
ent l
evel
. A
bove
Hom
e D
epot
is 5
00,0
00
squa
re fe
et o
f off
ice
spac
e.
Who
le F
oods
@ U
nion
Squ
are
| New
Yor
k C
ity, M
anha
ttan
Who
le F
oods
ope
ned
in U
nion
Squ
are
in N
ew Y
ork
City
in 2
005.
It o
ccup
ies 4
7,00
0 sq
uare
feet
w
ithin
a 2
50,0
00 sq
uare
-foo
t bui
ldin
g. T
he st
ore
fron
ts a
3.5
-acr
e pa
rk, a
nd is
loca
ted
with
in a
m
ixed
-use
dis
trict
that
incl
udes
off
ice,
resi
dent
s, st
uden
ts, a
nd a
mix
of r
etai
l typ
es.
The
stor
e sp
ans t
hree
stor
ies.
Gro
cerie
s are
loca
ted
in th
e ba
sem
ent l
evel
, and
pre
pare
d fo
ods a
nd c
heck
out
N
orth
For
ty S
peci
fic P
lan
Mar
ket S
tudy
and
Bus
ines
s Dev
elop
men
t Stra
tegy
Pa
ge 1
45 o
f 150

coun
ters
are
situ
ated
on
the
grou
nd fl
oor.
The
mez
zani
ne le
vel p
rovi
des s
eatin
g w
ith la
rge
win
dow
s tha
t ove
rlook
the
park
. Fo
reve
r 21
(26,
000
squa
re fe
et),
File
ne’s
Bas
emen
t (92
,000
squa
re fe
et),
and
DSW
(26,
000
sf) a
re
othe
r ret
ail t
enan
ts in
the
build
ing,
stac
ked
verti
cally
abo
ve W
hole
Foo
ds.
Vor
nado
Rea
lty T
rust
bo
ught
the
build
ing
in 1
993,
and
put
$46
mill
ion
into
its r
enov
atio
n.
Bes
t Buy
, Con
tain
er S
tore
, Ace
Har
dwar
e | W
ashi
ngto
n D
C, T
enle
ytow
n
Th
is is
an
urba
n re
habi
litat
ion
of a
n ol
d Se
ars R
oebu
ck b
uild
ing
that
had
bee
n ab
ando
ned
in th
e 19
90s.
The
dev
elop
er, R
oads
ide
Dev
elop
men
t, co
nver
ted
the
build
ing
into
a m
ixed
-use
de
velo
pmen
t cal
led
City
line
at T
enle
y, w
hich
ope
ned
in 2
005.
Ace
Har
dwar
e oc
cupi
es a
bel
ow-
grad
e sp
ace,
and
Bes
t Buy
and
the
Con
tain
er S
tore
are
situ
ated
at s
treet
leve
l. L
uxur
y co
ndom
iniu
ms r
ise
abov
e th
e re
tail
floor
s, an
d pa
rkin
g is
pro
vide
d un
derg
roun
d. T
he
cond
omin
ium
s wer
e pr
iced
bet
wee
n $3
00,0
00 a
nd $
1,00
0,00
0. T
he si
te is
loca
ted
385
feet
from
th
e Te
nley
tow
n m
etro
stop
. N
orth
For
ty S
peci
fic P
lan
Mar
ket S
tudy
and
Bus
ines
s Dev
elop
men
t Stra
tegy
Pa
ge 1
46 o
f 150

Lock
woo
d Pl
ace
| Bal
timor
e
Lo
ckw
ood
Plac
e is
a d
evel
opm
ent t
hat c
onta
ins m
ixed
-use
off
ice,
reta
il, a
nd p
arki
ng lo
cate
d in
do
wnt
own
Bal
timor
e by
the
Inne
r Har
bor.
The
com
plex
con
tain
s a m
ulti-
stor
y of
fice
tow
er w
ith
250,
000
squa
re fe
et o
f Cla
ss A
off
ice
spac
e. A
djac
ent t
o th
e of
fice
tow
er is
a th
ree-
stor
y sh
oppi
ng
com
plex
that
cov
ers 9
8,00
0 sq
uare
feet
. B
est B
uy (3
7,00
0 sf
) and
File
ne’s
Bas
emen
t (30
,000
sf)
are
the
anch
or te
nant
s, an
d th
ere
are
a va
riety
of s
mal
ler-
scal
e re
stau
rant
s. A
940
-spa
ce st
ruct
ured
pa
rkin
g ga
rage
is lo
cate
d at
the
back
of t
he b
uild
ing.
The
pro
ject
was
dev
elop
ed b
y D
avid
S.
Bro
wn
Ente
rpris
es a
nd A
&R
Dev
elop
men
t. T
he si
te is
loca
ted
with
in th
e do
wnt
own
in a
n ur
ban
loca
tion,
and
has
har
bor v
iew
s.
N
orth
For
ty S
peci
fic P
lan
Mar
ket S
tudy
and
Bus
ines
s Dev
elop
men
t Stra
tegy
Pa
ge 1
47 o
f 150

App
endi
x H
: Hot
el M
arke
t Ove
rvie
w, M
arke
t Are
a vs
. San
ta C
lara
Cou
nty,
200
5-Fe
b. 2
011
(a)
His
toric
Ove
rvie
w (2
005-
2010
)
Occ
upan
cy R
ate
Aver
age
Dai
ly R
ate
Rev
PAR
(b)
Roo
m D
eman
d (c
)M
arke
tM
arke
tM
arke
tM
arke
tYe
arAr
eaC
ount
yD
iff.
Area
Cou
nty
Diff
.Ar
eaC
ount
yD
iff.
Area
Cou
nty
% S
hare
2005
66.5
%62
.6%
4.0%
$122
$100
$23
$81
$62
$19
414,
316
5,99
7,75
46.
9%20
0672
.1%
68.3
%3.
8%$1
33$1
08$2
5$9
6$7
4$2
247
1,93
76,
414,
232
7.4%
2007
75.0
%69
.9%
5.2%
$144
$119
$25
$108
$83
$25
491,
106
6,53
6,06
87.
5%20
0872
.5%
66.1
%6.
4%$1
48$1
24$2
4$1
07$8
2$2
547
4,16
46,
170,
795
7.7%
2009
64.5
%57
.9%
6.6%
$129
$105
$24
$83
$61
$22
421,
849
5,38
1,56
17.
8%20
1072
.1%
66.6
%5.
5%$1
27$1
05$2
2$9
2$7
0$2
251
0,91
26,
228,
963
8.2%
Cur
rent
Mar
ket O
verv
iew
(Mar
ch 2
010-
Feb.
201
1)
Occ
upan
cy R
ate
Aver
age
Dai
ly R
ate
Rev
PAR
(b)
Roo
m D
eman
d (c
)M
arke
tM
arke
tM
arke
tM
arke
tM
onth
Area
Cou
nty
Diff
.Ar
eaC
ount
yD
iff.
Area
Cou
nty
Diff
.Ar
eaC
ount
y%
Sha
reM
ar-1
066
.3%
65.3
%0.
9%$1
26$1
06$2
0$8
4$6
9$1
440
,162
519,
157
7.7%
Apr
-10
66.2
%65
.8%
0.4%
$125
$104
$21
$83
$68
$14
38,8
0150
5,82
67.
7%M
ay-1
076
.0%
68.7
%7.
3%$1
25$1
06$2
0$9
5$7
3$2
346
,086
546,
109
8.4%
Jun-
1080
.3%
73.0
%7.
2%$1
28$1
06$2
2$1
03$7
7$2
547
,082
561,
770
8.4%
Jul-1
077
.1%
70.9
%6.
3%$1
24$1
02$2
1$9
6$7
3$2
346
,754
563,
381
8.3%
Aug
-10
78.3
%70
.5%
7.8%
$127
$103
$24
$100
$73
$27
47,4
4556
0,90
08.
5%S
ep-1
078
.7%
70.2
%8.
5%$1
29$1
06$2
3$1
02$7
5$2
746
,141
540,
492
8.5%
Oct
-10
80.6
%73
.9%
6.7%
$130
$110
$20
$105
$81
$23
48,8
3958
7,92
18.
3%N
ov-1
073
.0%
65.4
%7.
7%$1
29$1
09$2
0$9
4$7
2$2
342
,840
503,
532
8.5%
Dec
-10
62.1
%52
.5%
9.6%
$125
$101
$24
$78
$53
$24
37,6
5541
8,08
39.
0%Ja
n-11
64.9
%61
.2%
3.7%
$136
$111
$25
$88
$68
$20
39,3
2748
7,39
18.
1%Fe
b-11
75.7
%67
.9%
7.8%
$137
$113
$24
$104
$77
$27
41,4
2648
8,06
98.
5%
Dai
ly A
vera
ges
(d)
Occ
upan
cy R
ate
Aver
age
Dai
ly R
ate
Rev
PAR
(b)
Mar
ket
Mar
ket
Mar
ket
Day
of W
eek
Area
Cou
nty
Diff
.Ar
eaC
ount
yD
iff.
Area
Cou
nty
Diff
.S
unda
y53
.8%
49.5
%4.
3%$1
28$1
05$2
4$6
9$5
2$1
7M
onda
y71
.2%
65.9
%5.
3%$1
43$1
19$2
3$1
02$7
9$2
3Tu
esda
y79
.4%
73.9
%5.
5%$1
45$1
22$2
3$1
15$9
0$2
5W
edne
sday
79.8
%74
.0%
5.8%
$145
$122
$23
$116
$90
$26
Thur
sday
71.0
%65
.1%
5.9%
$137
$112
$25
$97
$73
$24
Frid
ay65
.7%
57.4
%8.
3%$1
16$9
4$2
2$7
6$5
4$2
2Sa
turd
ay66
.8%
58.2
%8.
6%$1
15$9
2$2
3$7
7$5
4$2
3To
tal
69.7
%63
.4%
6.2%
$134
$111
$23
$94
$70
$24
Not
es:
(a) I
nclu
des
all h
otel
s an
d m
otel
s in
the
Mar
ket A
rea
and
Cou
nty
that
par
ticip
ate
in S
mith
Tra
vel R
esea
rch'
s su
rvey
s. F
igur
es d
o no
tre
pres
ent a
100
per
cent
cou
nt.
(b) R
evP
AR
, or R
even
ue p
er A
vaila
ble
Roo
m, i
s ca
lcul
ated
by
divi
ding
tota
l roo
m re
venu
e by
the
tota
l sup
ply
of ro
oms
for a
giv
en p
erio
d.(c
) Roo
m D
eman
d re
pres
ents
the
num
ber o
f roo
ms
sold
ove
r the
cou
rse
of a
giv
en ti
me
perio
d, e
xclu
ding
com
plim
enta
ry ro
oms.
(d) D
aily
Ave
rage
s ca
lcul
ated
ove
r the
last
thre
e ye
ars,
from
Mar
ch 2
008
to F
eb. 2
011.
Sou
rces
: Sm
ith T
rave
l Res
earc
h; B
AE
, 201
1.
Nor
th F
orty
Spe
cific
Pla
n M
arke
t Stu
dy a
nd B
usin
ess D
evel
opm
ent S
trate
gy
Page
148
of 1
50

N
orth
For
ty S
peci
fic P
lan
Mar
ket S
tudy
and
Bus
ines
s Dev
elop
men
t Stra
tegy
Pa
ge 1
49 o
f 150
y.
App
endi
x I:
Not
es o
n M
etho
dolo
gy fo
r Ret
ail S
ales
and
Lea
kage
Est
imat
es
BA
E ha
s dev
elop
ed p
oint
-in-ti
me
estim
ates
of r
etai
l sal
es b
y si
x-di
git N
AIC
S50 c
ateg
ory,
app
lyin
g sa
les p
er e
mpl
oyee
dat
a by
NA
ICS
from
the
2007
Cen
sus o
f Ret
ail T
rade
to g
ener
ate
estim
ates
of
tota
l ret
ail s
ales
by
cate
gory
for 2
008,
the
mos
t rec
ent d
ata
avai
labl
e at
the
time
of a
naly
sis.
It
shou
ld b
e no
ted
that
thes
e es
timat
es sh
ould
be
cons
ider
ed a
s app
roxi
mat
e, si
nce
the
exac
t em
ploy
men
t num
bers
for e
ach
stor
e ty
pe a
re n
ot a
vaila
ble;
inst
ead,
the
publ
ishe
d da
ta g
roup
stor
es
into
an
empl
oym
ent c
lass
size
.51 H
owev
er, t
he a
vaila
bilit
y of
SB
OE
and
Econ
omic
Cen
sus d
ata
for t
he sa
me
gene
ral p
erio
d (2
007
or 2
008)
mad
e re
finem
ents
pos
sibl
e ba
sed
on c
ross
-che
ckin
g th
e Zi
p C
ode-
deriv
ed e
stim
ates
aga
inst
the
othe
r sou
rces
and
mak
ing
adju
stm
ents
acc
ordi
ngly
, so
thes
e th
e fig
ures
shou
ld re
ason
ably
est
imat
e th
e or
der o
f mag
nitu
de o
f ove
rall
reta
il sa
les b
y ca
tego
rTh
ese
estim
ates
hav
e th
e ad
vant
age
over
est
imat
es b
ased
on
taxa
ble
data
in th
at a
ll re
tail
sale
s are
in
clud
ed, s
o no
adj
ustm
ent f
acto
rs a
re n
eces
sary
to g
et fr
om S
BO
E da
ta to
tota
l ret
ail s
ales
. Th
e di
sadv
anta
ge o
f the
se e
stim
ates
is th
at th
e da
ta a
re n
ot a
s cur
rent
as w
hat S
BO
E ca
n pr
ovid
e. I
t is
impo
rtant
to n
ote
the
data
are
from
200
8, w
hen
the
impa
cts o
f the
hou
sing
mar
ket m
eltd
own
and
rece
ssio
n w
ere
not y
et a
t the
ir pe
ak.
The
leak
age
anal
ysis
in th
is re
port
adju
sts t
hese
sale
s lev
els t
o ta
ke in
to a
ccou
nt m
ore
curr
ent c
ondi
tions
, as s
how
n in
App
endi
x E.
W
ith re
spec
t to
the
taxa
ble
reta
il sa
les a
naly
sis b
ased
on
Stat
e B
oard
of E
qual
izat
ion
data
, it i
s ex
trem
ely
impo
rtant
to n
ote
that
tota
l tax
able
reta
il sa
les f
rom
the
2008
thro
ugh
2010
Tow
n da
ta
(e.g
., Fi
gure
8 a
nd 1
1) a
re g
roup
ed so
mew
hat d
iffer
ently
, and
thus
can
not b
e co
mpa
red
to th
e 20
00
thro
ugh
2008
SB
OE
data
.
50
The
Nor
th A
mer
ican
Indu
stria
l Cla
ssifi
catio
n Sy
stem
(NA
ICS)
is a
fede
rally
-dire
cted
syst
em fo
r cla
ssify
ing
esta
blis
hmen
ts b
y in
dust
ry.
51
For
exa
mpl
e, o
ne st
ore
size
cat
egor
y in
the
Zip
Cod
e B
usin
ess P
atte
rns r
ange
s fro
m 2
5 to
49
empl
oyee
s;
estim
ates
are
bas
ed o
n a
cent
ral p
oint
in th
is ra
nge,
sinc
e th
e ex
act n
umbe
r of e
mpl
oyee
s is u
nkno
wn.

North Forty Specific Plan Market Study and Business Development Strategy Page 150 of 150
Appendix J: Location of Formula Retail Businesses in the Downtown Core

North 40 Specific Plan DRAFT Last Modified: July 2, 2014
Appendix B - Tree List

This Page Intentionally Left Blank
appendixB
draft | May 2014

B-1Last Modified: July 2, 2014 North 40 Specific Plan
appendix BAppendix B - Tree List
Botanical Name Common Name Native? Water Needs Sunlight Type Height Width Notes
Perimeter Trees
Pinus Radiata Monterey Pine Y Minimal Full E 80'-100' 25'-35'
fast growing, can be susceptible to disease
Populus Nigra Lombardy Poplar N Moderate Full D 40'-100' 15'-30'
fast growing, tough trees, rural character
Sequoia Sempervirens Redwood Y Moderate Full,
Partial E 70’-90' 15'-30' plant 7’ min apart

B-2 draft | May 2014
appendixBAppendix B - Tree List
Botanical Name Common Name Native? Water Needs Sunlight Type Height Width Notes
Orchard Trees
Juglans Californica Hindsii
California Black Walnut Y Full D 30’-60’ 30’-40’ Bears fruit
Malus Floribunda "Parrsi" Pink Crabapple N Moderate Full D 12'-20' 12'-20'
small flowering tree, bears fruit (not very edible) but nice form
Prunus Blireana Purple Leaf Plum N Moderate Full D 40’ 25’
pink blossoms, well drained soil, ornamental, no fruit
Prunus Cerasifera Cherry Plum N Moderate Full D 10’-18’ 10’-18’
pink blossoms, ornamental, no fruit

B-3Last Modified: July 2, 2014 North 40 Specific Plan
appendix BAppendix B - Tree List
Botanical Name Common Name Native? Water Needs Sunlight Type Height Width Notes
Orchard Trees (continued)
Prunus Kwansan or Aki Bono Japanese Cherry N Moderate Full D 40’ 25’
flowering accent tree, formal shape, evokes orchard but no fruit
Prunus Persica Peach N Moderate Full D 10’-18’ 10’-18’ bears fruit
Prunus Persica Nucipersica Nectarine N Moderate Full D 40’ 25’ bears fruit
Prunus Salicina Japanese Plum N Moderate Full D 10’-18’ 10’-18’ bears fruit

B-4 draft | May 2014
appendixBAppendix B - Tree List
Botanical Name Common Name Native? Water Needs Sunlight Type Height Width Notes
Orchard Trees (continued)
Pyrus Calleryana Callery Pear N Moderate Full D 40’ 25’flowering, ornamental, no fruit
Common Open Space Trees
Acer ‘Sango Kaku’ Coral Bark Japanese Maple N Moderate Partial,
Shade D 15’-20’ 15’-20’ Beautiful fall color
Aesculus Californica
California Buckeye Y Moderate,
Minimal Full D 10’-20’+ 30’+
male only, seeds are slightly toxic if ingested, drought tolerant
Arbutus Menziesii Pacific Madrone Y Moderate, Minimal Full E 20’-100’ 20’-100’
needs good drainage, beautiful bark

B-5Last Modified: July 2, 2014 North 40 Specific Plan
appendix BAppendix B - Tree List
Botanical Name Common Name Native? Water Needs Sunlight Type Height Width Notes
Common Open Space Trees (continued)
Cedrus Deodara Deodar Cedar N Moderate, Minimal Full E 80’ 40’ Well
drained soil
Koelreuteria Paniculata Goldenrain Tree N Moderate Full D 20’-35’ 25’-40’
Showy yellow flowers
Lagerstroemia Species Crape Myrtles N Moderate, Low Full D 15’-25' 20'-25'
flowering specimen, nice branch structure, beautiful flowers
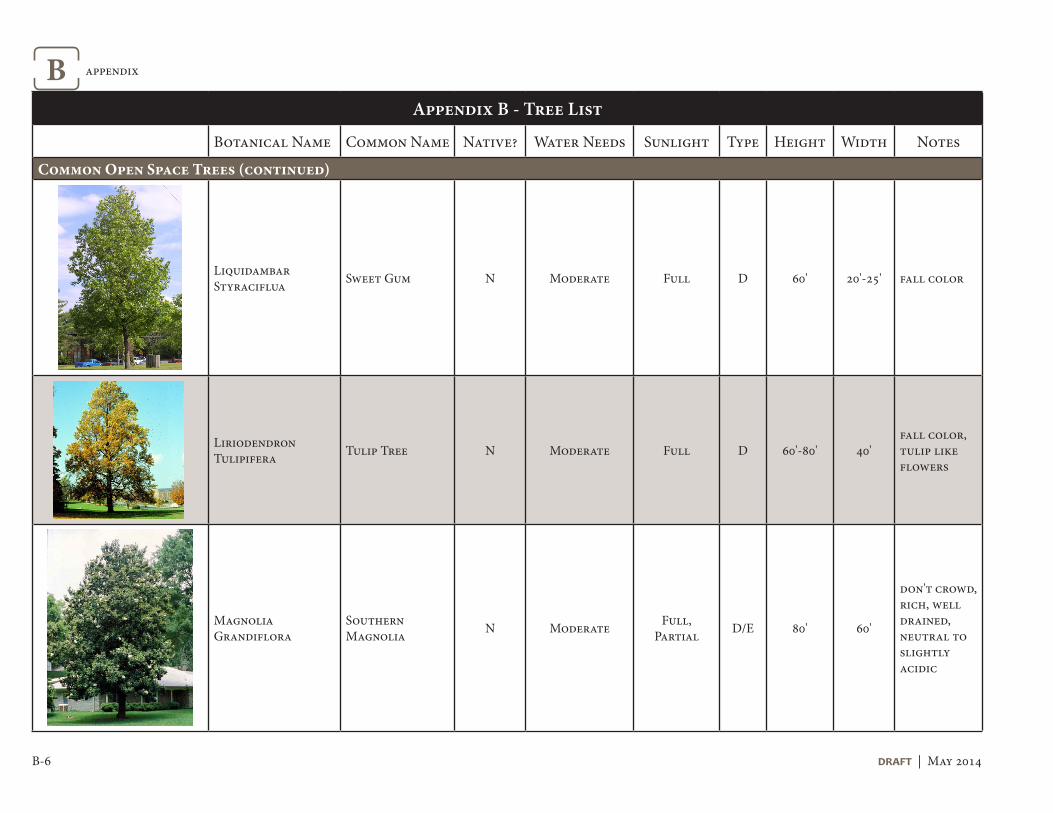
B-6 draft | May 2014
appendixBAppendix B - Tree List
Botanical Name Common Name Native? Water Needs Sunlight Type Height Width Notes
Common Open Space Trees (continued)
Liquidambar Styraciflua Sweet Gum N Moderate Full D 60' 20'-25' fall color
Liriodendron Tulipifera Tulip Tree N Moderate Full D 60'-80' 40'
fall color, tulip like flowers
Magnolia Grandiflora
Southern Magnolia N Moderate Full,
Partial D/E 80' 60'
don't crowd, rich, well drained, neutral to slightly acidic

B-7Last Modified: July 2, 2014 North 40 Specific Plan
appendix BAppendix B - Tree List
Botanical Name Common Name Native? Water Needs Sunlight Type Height Width Notes
Common Open Space Trees (continued)
Magnolia Grandiflora "Little Gem"
Dwarf Southern Magnolia N Moderate Full E 8’ 12'-15'
neat small columnar tree, nice flowers, fragrance evergreen
Magnolia Soulangiana "Stellata"
Saucer Magnolia N Moderate Full, Partial D 12'-18' 6'-12'
flowering specimen, nice branch structure, beautiful flowers
Malus Floribunda "Parrsi" Pink Crabapple N Moderate Full D 12'-20' 12'-20'
small flowering tree, bears fruit (not very edible) but nice form
Pinus Canariensis Canary Island Pine N Minimal Full E 50'-80' 20'-35'

B-8 draft | May 2014
appendixBAppendix B - Tree List
Botanical Name Common Name Native? Water Needs Sunlight Type Height Width Notes
Common Open Space Trees (continued)
Pinus Pinea Italian Stone Pine N Minimal Full E 40'-80' 40'-60'
develops into an umbrella
Pistacia Chinensis Chinese Pistachio N Moderate,
Minimal Full D 30'-60' 30'-60' fall color, edible nuts
Platanus Racemosa Sycamore Y Moderate Full D 30'-80' 20'-50'tolerates heat and wind

B-9Last Modified: July 2, 2014 North 40 Specific Plan
appendix BAppendix B - Tree List
Botanical Name Common Name Native? Water Needs Sunlight Type Height Width Notes
Common Open Space Trees (continued)
Prunus Kwansan or Aki Bono Japanese Cherry N Moderate Full D 20’-25’ 20'-25'
flowering accent tree, formal shape, evokes orchard but no fruit
Quercus Agrifolia Coast Live Oak Y Minimal Full E 20'-70' 20'-70'
greedy roots, drops leaves in early spring
Quercus Douglasii Blue Oak Y Minimal Full D 30'-50' 40'-70' fall colors
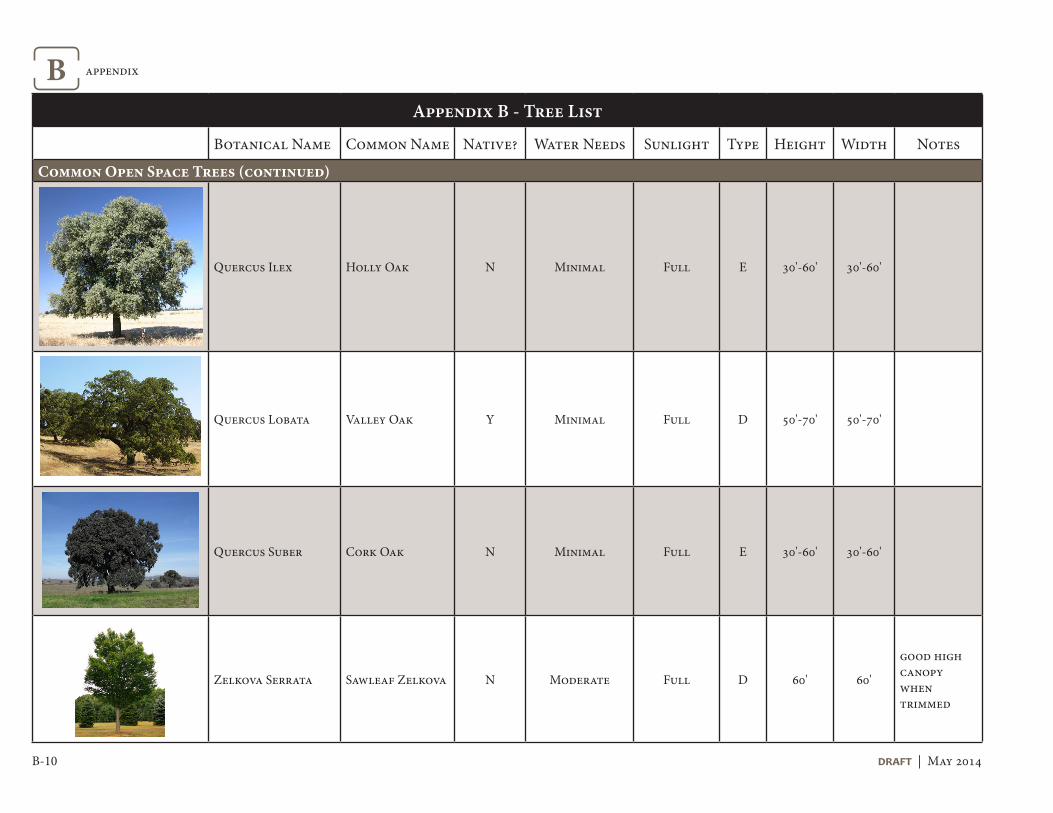
B-10 draft | May 2014
appendixBAppendix B - Tree List
Botanical Name Common Name Native? Water Needs Sunlight Type Height Width Notes
Common Open Space Trees (continued)
Quercus Ilex Holly Oak N Minimal Full E 30'-60' 30'-60'
Quercus Lobata Valley Oak Y Minimal Full D 50'-70' 50'-70'
Quercus Suber Cork Oak N Minimal Full E 30'-60' 30'-60'
Zelkova Serrata Sawleaf Zelkova N Moderate Full D 60' 60'
good high canopy when trimmed

B-11Last Modified: July 2, 2014 North 40 Specific Plan
appendix BAppendix B - Tree List
Botanical Name Common Name Native? Water Needs Sunlight Type Height Width Notes
Specimen Trees
Acer Palmatum Japanese Maple N Moderate Partial, Shade D 20' 20' beautiful
fall color
Betula Utilis Jacquemontii Himalayan Birch N Moderate Full D 40' 20'
Cercidiphyllum Japonicum Katsura Tree N Moderate Full,
Partial D 40' 25' fall colors
Cercis Occidentalis Western Redbud Y Moderate, Minimal
Full, Partial D 10'-18' 10'-18' pink
blossoms

B-12 draft | May 2014
appendixBAppendix B - Tree List
Botanical Name Common Name Native? Water Needs Sunlight Type Height Width Notes
Street Trees
Cinnamomum Camphora Camphor Tree N Minimal Full,
Partial E 50'+ 60'some amount of litter
Ginkgo Biloba Maiden Hair Tree N Moderate Full D 30'-50' 15'-25'
Laurus Nobilis Sweet Bay N Moderate, Minimal
Full, Partial E 12'-40' 12'-40'

B-13Last Modified: July 2, 2014 North 40 Specific Plan
appendix BAppendix B - Tree List
Botanical Name Common Name Native? Water Needs Sunlight Type Height Width Notes
Street Trees (continued)
Liquidambar Styraciflua Sweet Gum N Moderate Full D 60' 20'-25' fall color
Magnolia Grandiflora
Southern Magnolia N Moderate Full,
Partial D/E 80' 60'
don't crowd, rich, well drained, neutral to slightly acidic

B-14 draft | May 2014
appendixBAppendix B - Tree List
Botanical Name Common Name Native? Water Needs Sunlight Type Height Width Notes
Street Trees (continued)
Melaleuca Linariifolia Melaleuca N Minimal Full E 20'-30' 20'-25'
Tilia Cordata Little Leaf Linden Y Moderate Full D 30'-50' 15'-30'
tolerant of city conditions

North 40 Specific Plan DRAFT Last Modified: July 2, 2014
Appendix C - Young Adult, Senior, and Empty Nester Design Summary

This Page Intentionally Left Blank
appendixC
draft | May 2014

C-1North 40 Specific Plan
appendix C
Last Modified: July 2, 2014
RESIDENTIAL CHARACTERISTICS FOR SPECIFIC DEMOGRAPHICSAt the time of this Specific Plan, some of the unmet needs of the Town of Los Gatos include residential product types that respond to emerging needs of the senior, empty nester, and young adult population. The following is a summary of current trends associated with these demographics.
GEN Y Gen Y - The generation born between 1981 - 1999 (13-31 years old) - now larger than the baby boomer generation.
Gen Y residential/neighborhood design focuses on the wants and needs of the 20–30 year old. There are numerous articles written about Gen Y and the ways that new development can attract this demographic.
Below is a summary of key points of what Gen Y is looking for in their living spaces and neighborhoods:
• Smaller household sizes (more married couples without kids, more people living alone, and more single parents)
• Smaller units with some larger units featuring loft characteristics
• Loft characteristics include: Open floor plan; few, if any, bedrooms; unfinished character (exposed ductwork, brick; industrial look)
• Affordable studio units with ample common areas for socializing
• Denser neighborhoods - this generation is more ethnically diverse and more comfortable in denser housing alternatives
• Urban/infill locations or suburban mixed-use neighborhoods as they seek more activity and a sense of place
• Lifestyle amenities nearby: large coffee shops like Kreuzberg or Starbucks, entertainment, music, technology, theaters, restaurants, shopping, parks, nightlife, wine bars
• Cultural activities
• Walkable distance to services, activities, jobs, and transit
• Lively and vibrant neighborhood
• Amenities within living complex: common gathering areas, clubhouse, barbecue area, common gardens, fitness center, pool, hot tub, tanning beds, wine bar
• Safe
• Affordable
• Stairs are acceptable as opposed to elevators
• Architectural Design: flexible spaces (rooms that can be utilized for office, entertainment or sleeping) authentic, tall ceilings, environmentally friendly design elements, sunny protected plaza spaces, modern design elements, technologically advanced, environmentally efficient)

C-2
appendixC
draft | May 2014
• Walkable neighborhoods with public transit
• Affordable housing and services
• Access to quality health care
• Opportunities for continuing education, culture, and an active lifestyle
• Access to passive open space and trails
• Multi-generational settings
BABY BOOMERS Baby Boomers - the generation born between 1946 - 1964 (48-66 years old)
Residential design focused on attracting the ‘empty nester’ or move-down residential is a current trend for new development. The baby boomer generation is diverse and no one product type will suit their needs. Evidence suggests that as baby boomer households mature, a greater number of them will be interested in more housing options that are oriented towards smart growth principles, (a North 40 guiding principle in the 2020 General Plan).
The trends suggest that baby boomers want:
• Smart Growth developments in the suburbs. Despite speculation that a large number of maturing baby boomers will return to urban areas when they reach retirement age, the data suggests that only 11 percent of retirement-aged suburbanites have moved back to central cities. There is a greater tendency for baby boomers that are interested in being close to urban amenities to stay in the suburbs so there will be demand for Smart Growth developments in the suburban communities.
• Luxury move-down units
• On the luxury end, larger units ranging from 1,500 to over 2,000 sf; moderately priced housing could be smaller in size
• Stacked flats
• Elimination of stairs
• Low-maintenance balconies/terraces instead of yards
• Places where baby boomers can meet new friends, have a social life, live healthier, be close to essential services, and have low-maintenance housing. In a traditional retirement setting, the community center serves this purpose. In a smart growth setting a plaza, coffee shop, or bookstore will satisfy more sophisticated interests
C-3North 40 Specific Plan
appendix C
Last Modified: July 2, 2014
DESIGNING FOR GEN Y AND BABY BOOMERS How does design attract Gen Y and Baby Boomers instead of families?
There is an art to designing residential products to target certain generations. The desirable design characteristics are ever-evolving.
Some current trends include:
• Design of units (e.g., families want attached vs. detached units; yard vs. patio/terrace, direct access to yards vs. elevators – ease of access for riding a bike, playing outside, etc.)
• Size of units – typically for both the Gen Y and Baby Boomers, the units are smaller than those required for families; however, there are some hip Gen Y loft products and higher-end Baby Boomer products designed with larger footprints.
• Garage access – families prefer garages connected directly to homes (for storage, child safety, infant carrier, ease of access, unloading groceries, etc.)
• Density - higher density products (stacked flats) are not good for families due to noise issues (children running and playing in flats)
• Common amenities within complex (tot lots vs. wine bar)
• Amenities in the locale (nightlife, personal service and recreation vs. schools, parks and grocery stores)

This Page Intentionally Left Blank
appendixC
draft | May 2014
North 40 Specific Plan DRAFT Last Modified: July 2, 2014
Appendix D - Los Gatos Sustainability Plan

This Page Intentionally Left Blank
appendixD
draft | May 2014

D-3North 40 Specific Plan | draft
appendix D
Last Modified: July 2, 2014
LOS GATOS SUSTAINABILITY PLAN EXCERPTS
TR-1a Emphasis on Pedestrian Entrances
Measure TR-1a requires all new buildings, excluding single-family homes, to include a principal functional entry that faces a public space such as a street, square, park, paseo, or plaza, in addition to any entrance from a parking lot, to encourage pedestrian foot traffic.
Action Items and Responsible Parties
To implement this measure, the Town will amend the Municipal Code and Design Guidelines to include this requirement. New residential and nonresidential development, except for single-family homes, will be subject to this requirement, incorporating it either into the project design or as mitigation in the applicable environmental document pursuant to the California Environmental Quality Act (CEQA). In addition, the Community Development Department will review architectural plans for consistency with this measure.
TR-1b Pedestrian or Bicycle Connections
Measure TR-1b requires new projects, excluding single-family homes, to include pedestrian or bicycle through-connections to existing sidewalks and existing or future bicycle facilities, unless prohibited by topographical conditions.
Action Items and Responsible Parties
To implement this measure, the Town will amend the Municipal Code and Design Guidelines to include this requirement. New residential and nonresidential development, except for single-family homes, will be subject to this requirement, incorporating it either into the project design or as mitigation in the applicable environmental document pursuant to CEQA. In addition, the Community Development Department will review development applications for consistency with this measure.
TR-4b Bicycle Facilities in Development Projects
Measure TR-4b requires bicycle parking facilities and on-site showers in major non-residential development and redevelopment projects.
Action Items and Responsible Parties
To implement this measure, the Town will amend the Municipal Code to include this requirement. Significant new non-residential development and redevelopment will be subject to this requirement, incorporating it either into the project design or as mitigation in the applicable environmental document pursuant to CEQA. In addition, the Community Development Department will review development applications for consistency with this measure.
TR-4b Bicycle Facilities in Development Projects
Measure TR-4b requires bicycle parking facilities and on-site showers in major non-residential development and redevelopment projects.
D-4
appendixD
draft | May 2014
Action Items and Responsible Parties
To implement this measure, the Town will amend the Municipal Code to include this requirement. Significant new non-residential development and redevelopment will be subject to this requirement, incorporating it either into the project design or as mitigation in the applicable environmental document pursuant to CEQA. In addition, the Community Development Department will review development applications for consistency with this measure.
GB-4 Solar Orientation
Measure GB-4 requires that development reduce energy use through solar orientation by taking advantage of shade, prevailing winds, landscaping, and sun screens.
RE-2 New Solar Homes Partnership
Measure RE-2 requires that residential projects of six units or more participate in the California Energy Commission’s New Solar Homes Partnership, which provides rebates to developers of six units or more who offer solar power in 50 percent of new units and is a component of the California Solar Initiative, or a similar program with solar power requirements equal to or greater than those of the California Energy Commission’s New Solar Homes Partnership.
RE-3 Renewable Energy Generation in Projects
Measure RE-3 requires that new or major rehabilitations of commercial, office, or industrial development greater than or equal to 20,000 square feet in size incorporate solar or other renewable energy generation to provide 15 percent or more of the project’s energy needs.
RE-5 Solar Ready Features
Measure RE-5 requires that all new buildings be constructed to allow for the easy, cost-effective installation of future solar energy systems, where feasible.
EC-1 Energy-Efficient Appliances and Lighting
Measure EC-1 requires new development to use energy-efficient appliances that meet ENERGY STAR standards and energy-efficient lighting technologies that exceed Title 24 standards by 30 percent.
EC-3 Energy-Efficient Outdoor Lighting
Measure EC-3 requires that outdoor lighting fixtures be energy-efficient.
EC-9 Heat Island Mitigation Plan
Measure EC-9 directs the Town to develop a “heat island” mitigation plan that requires cool roofs, cool pavements, and strategically placed shade trees.
EC-10 Heat Gain Reduction
Measure EC-10 requires all new development and major rehabilitation projects to incorporate strategies to reduce heat gain for 50 percent of the nonroof impervious site landscape.
WW-1 Water Use and Efficiency Requirements
Measure WW-1 requires all water use and efficiency measures identified as voluntary in the California Green Building Standards Code for all new development.

D-5North 40 Specific Plan | draft
appendix D
Last Modified: July 2, 2014
WW-3 Bay Friendly Landscaping
Measure WW-3 requires new development to use native plants or other appropriate non-invasive plants that are drought-tolerant.
OS-1 Community Garden and Urban Farm Sites Inventory
Measure OS-1 directs the Town to identify and inventory potential community garden and urban farm sites, and develop a program to establish community gardens in appropriate locations. (We have a group that is pushing for community gardens at this site)
OS-2 Garden Areas in New Development
Measure OS-2 encourages significant new residential developments over 50 units to include space that can be used to grow food.
This Page Intentionally Left Blank
appendixD
draft | May 2014

North 40 Specific Plan DRAFT Last Modified: July 2, 2014
Appendix E - Discretionary Approval Table

This Page Intentionally Left Blank
appendixE
draft | May 2014

E-3North 40 Specific Plan | draft
appendix E
Last Modified: July 2, 2014
Chapter Item SummaryDevelopment Review
CommitteePlanning
CommissionTown Council
2 Mixed-use parking reductionArchitecture and Site
Review (A & S)
2 Shared parking agreements Review and approval by Director of Community
Development
2North 40 Neighborhood identification signage
(entry features - location and quantity)Architecture and Site
Review (A & S)
2 Specific Plan standards and guidelines exceptionsArchitecture and Site
Review (A & S)
2Height exceptions (limited towers, spires, elevator penthouses…)
as described in Chapter 2 Architecture and Site
Review (A & S)
2Additional height allowances to the 35' or the 45' limits
in the Transition District per Chapter 2
Architecture and Site Review (A & S) and
Conditional Use Permit (CUP)
2Additional height for office (over 35') and hotel (over 45')
uses located in Transition and Northern Districts per Chapter 2
Architecture and Site Review (A & S) and
Conditional Use Permit (CUP)
2 Final street frontage setbacksArchitecture and Site
Review (A & S)
2 Reduced parking requirement for senior/affordable housingApproval by Director of
Community Development if findings can be made
2 Tandem parking restriction per Chapter 2Approval by the Director of Community Development
4 Street locations and dimensionsArchitecture and Site
Review (A & S)
6 Development applications for new structuresArchitecture and Site
Review (A & S)
Minor Specific Plan AmendmentDirector of Community
Development
6 Major Specific Plan AmendmentPlanning Commission
Recommendation Town Council Approval
Discretionary Approval Summary Table
This Page Intentionally Left Blank
appendixE
draft | May 2014
Copyright © 2022 FDOKUMEN