Antihyperglycemic and Lipid Profile Effects of Salvia ... - MDPI
16
molecules Article Antihyperglycemic and Lipid Profile Effects of Salvia amarissima Ortega on Streptozocin-Induced Type 2 Diabetic Mice Jesus Ivan Solares-Pascasio 1,2 , Guillermo Ceballos 2 , Fernando Calzada 1, *, Elizabeth Barbosa 2 and Claudia Velazquez 3 Citation: Solares-Pascasio, J.I.; Ceballos, G.; Calzada, F.; Barbosa, E.; Velazquez, C. Antihyperglycemic and Lipid Profile Effects of Salvia amarissima Ortega on Streptozocin- Induced Type 2 Diabetic Mice. Molecules 2021, 26, 947. https:// doi.org/10.3390/molecules26040947 Academic Editors: Farid Chemat, Maurizio Battino, Jesus Simal-Gandara and Esra Capanoglu Received: 13 December 2020 Accepted: 7 February 2021 Published: 11 February 2021 Publisher’s Note: MDPI stays neutral with regard to jurisdictional claims in published maps and institutional affil- iations. Copyright: © 2021 by the authors. Licensee MDPI, Basel, Switzerland. This article is an open access article distributed under the terms and conditions of the Creative Commons Attribution (CC BY) license (https:// creativecommons.org/licenses/by/ 4.0/). 1 Unidad de InvestigaciónMédica en Farmacología, UMAE Hospital de Especialidades-2 ◦ Piso CORSE Centro Médico Nacional Siglo XXI, IMSS, Av. Cuauhtémoc 330, Col. Doctores, CP 06720 Ciudad de México, Mexico; [email protected] 2 Instituto Politécnico Nacional, Escuela Superior de Medicina, IPN, Salvador Díaz Mirón esq. Plan de San Luis S/N, Miguel Hidalgo, Casco de Santo Tomas, CP 11340 Ciudad de México, Mexico; [email protected] (G.C.); [email protected] (E.B.) 3 Área Académica de Farmacia, Instituto de Ciencias de la Salud, Universidad Autónoma del Estado de Hidalgo, Km 4.5, Carretera Pachuca-Tulancingo, Unidad Universitaria, CP 42076 Pachuca, Mexico; [email protected] * Correspondence: [email protected]; Tel.: +52-1-55-5627-6900 (ext. 21367) Abstract: Salvia amarissima Ortega was evaluated to determinate its antihyperglycemic and lipid profile properties. Petroleum ether extract of fresh aerial parts of S. amarissima (PEfAPSa) and a secondary fraction (F6Sa) were evaluated to determine their antihyperglycemic activity in streptozo- cin-induced diabetic (STID) mice, in oral tolerance tests of sucrose, starch, and glucose (OSTT, OStTT, and OGTT, respectively), in terms of glycated hemoglobin (HbA1c), triglycerides (TG), and high- density lipoprotein (HDL). In acute assays at doses of 50 mg/kg body weight (b.w.), PEfAPSa and F6Sa showed a reduction in hyperglycemia in STID mice, at the first and fifth hour after of treatment, respectively, and were comparable with acarbose. In the sub-chronic test, PEfAPSa and F6Sa showed a reduction of glycemia since the first week, and the effect was greater than that of the acarbose control group. In relation to HbA1c, the treatments prevented the increase in HbA1c. In the case of TG and HDL, PEfAPSa and F6Sa showed a reduction in TG and an HDL increase from the second week. OSTT and OStTT showed that PEfAPSa and F6Sa significantly lowered the postprandial peak at 1 h after loading but only in sucrose or starch such as acarbose. The results suggest that S. amarissima activity may be mediated by the inhibition of disaccharide hydrolysis, which may be associated with an α-glucosidase inhibitory effect. Keywords: Salvia amarissima Ortega; diabetes mellitus; antihyperglycemic activity; lipid profile 1. Introduction Diabetes mellitus (DM) type 2 is a complex chronic metabolic disease, characterized by hyperglycemia, and produced by a deficiency or loss of insulin activity; DM is generally accompanied by alterations like dyslipidemia, hypertension, obesity, or hyperinsuline- mia [1–3]. According to estimates of the International Diabetes Federation (IDF), in 2019, more than 463 million people had DM (9.3% of the global population) [1,2]. In terms of DM cases, Mexico is the sixth highest ranked country in the world (12.8 million case), and DM is the second highest cause of mortality [2,3]. Treatment of DM includes adoption of healthy habits and is accompanied by pharmacological therapy [2,4], including biguanides, sulfonylureas, glitazones, α-glucosidase inhibitors, dipeptidyl peptidase-IV (DPP-IV) in- hibitors, and incretin analogue therapies. The search for novel effective antidiabetic agents that avoid or reduce the side effects of these compounds is a continuous undertaking [5,6]. The use of traditional medicine, based on medicinal plants or phytotherapy, particu- larly in developing countries, includes a large number of individual medicines and, in some Molecules 2021, 26, 947. https://doi.org/10.3390/molecules26040947 https://www.mdpi.com/journal/molecules
-
Upload
khangminh22 -
Category
Documents
-
view
3 -
download
0
Transcript of Antihyperglycemic and Lipid Profile Effects of Salvia ... - MDPI

molecules
Article
Antihyperglycemic and Lipid Profile Effects ofSalvia amarissima Ortega on Streptozocin-Induced Type 2Diabetic Mice
Jesus Ivan Solares-Pascasio 1,2 , Guillermo Ceballos 2, Fernando Calzada 1,*, Elizabeth Barbosa 2
and Claudia Velazquez 3
�����������������
Citation: Solares-Pascasio, J.I.;
Ceballos, G.; Calzada, F.; Barbosa, E.;
Velazquez, C. Antihyperglycemic and
Lipid Profile Effects of Salvia
amarissima Ortega on Streptozocin-
Induced Type 2 Diabetic Mice.
Molecules 2021, 26, 947. https://
doi.org/10.3390/molecules26040947
Academic Editors: Farid Chemat,
Maurizio Battino,
Jesus Simal-Gandara and
Esra Capanoglu
Received: 13 December 2020
Accepted: 7 February 2021
Published: 11 February 2021
Publisher’s Note: MDPI stays neutral
with regard to jurisdictional claims in
published maps and institutional affil-
iations.
Copyright: © 2021 by the authors.
Licensee MDPI, Basel, Switzerland.
This article is an open access article
distributed under the terms and
conditions of the Creative Commons
Attribution (CC BY) license (https://
creativecommons.org/licenses/by/
4.0/).
1 Unidad de Investigación Médica en Farmacología, UMAE Hospital de Especialidades-2◦ Piso CORSE CentroMédico Nacional Siglo XXI, IMSS, Av. Cuauhtémoc 330, Col. Doctores, CP 06720 Ciudad de México, Mexico;[email protected]
2 Instituto Politécnico Nacional, Escuela Superior de Medicina, IPN, Salvador Díaz Mirón esq. Plan de San LuisS/N, Miguel Hidalgo, Casco de Santo Tomas, CP 11340 Ciudad de México, Mexico; [email protected] (G.C.);[email protected] (E.B.)
3 Área Académica de Farmacia, Instituto de Ciencias de la Salud, Universidad Autónoma del Estado deHidalgo, Km 4.5, Carretera Pachuca-Tulancingo, Unidad Universitaria, CP 42076 Pachuca, Mexico;[email protected]
* Correspondence: [email protected]; Tel.: +52-1-55-5627-6900 (ext. 21367)
Abstract: Salvia amarissima Ortega was evaluated to determinate its antihyperglycemic and lipidprofile properties. Petroleum ether extract of fresh aerial parts of S. amarissima (PEfAPSa) and asecondary fraction (F6Sa) were evaluated to determine their antihyperglycemic activity in streptozo-cin-induced diabetic (STID) mice, in oral tolerance tests of sucrose, starch, and glucose (OSTT, OStTT,and OGTT, respectively), in terms of glycated hemoglobin (HbA1c), triglycerides (TG), and high-density lipoprotein (HDL). In acute assays at doses of 50 mg/kg body weight (b.w.), PEfAPSa andF6Sa showed a reduction in hyperglycemia in STID mice, at the first and fifth hour after of treatment,respectively, and were comparable with acarbose. In the sub-chronic test, PEfAPSa and F6Sa showeda reduction of glycemia since the first week, and the effect was greater than that of the acarbosecontrol group. In relation to HbA1c, the treatments prevented the increase in HbA1c. In the case ofTG and HDL, PEfAPSa and F6Sa showed a reduction in TG and an HDL increase from the secondweek. OSTT and OStTT showed that PEfAPSa and F6Sa significantly lowered the postprandialpeak at 1 h after loading but only in sucrose or starch such as acarbose. The results suggest thatS. amarissima activity may be mediated by the inhibition of disaccharide hydrolysis, which may beassociated with an α-glucosidase inhibitory effect.
Keywords: Salvia amarissima Ortega; diabetes mellitus; antihyperglycemic activity; lipid profile
1. Introduction
Diabetes mellitus (DM) type 2 is a complex chronic metabolic disease, characterizedby hyperglycemia, and produced by a deficiency or loss of insulin activity; DM is generallyaccompanied by alterations like dyslipidemia, hypertension, obesity, or hyperinsuline-mia [1–3]. According to estimates of the International Diabetes Federation (IDF), in 2019,more than 463 million people had DM (9.3% of the global population) [1,2]. In terms ofDM cases, Mexico is the sixth highest ranked country in the world (12.8 million case), andDM is the second highest cause of mortality [2,3]. Treatment of DM includes adoption ofhealthy habits and is accompanied by pharmacological therapy [2,4], including biguanides,sulfonylureas, glitazones, α-glucosidase inhibitors, dipeptidyl peptidase-IV (DPP-IV) in-hibitors, and incretin analogue therapies. The search for novel effective antidiabetic agentsthat avoid or reduce the side effects of these compounds is a continuous undertaking [5,6].
The use of traditional medicine, based on medicinal plants or phytotherapy, particu-larly in developing countries, includes a large number of individual medicines and, in some
Molecules 2021, 26, 947. https://doi.org/10.3390/molecules26040947 https://www.mdpi.com/journal/molecules

Molecules 2021, 26, 947 2 of 16
cases, substitute allopathic treatments, because the latter are less economically accessiblethan medicinal plants [7]. In Mexico, it has been reported that approximately 383 plantspecies are used for treatment of DM; however, not all of these have been systematicallystudied to assess their clinical or preclinical efficacy [8].
Due to lack of information of medicinal plants, it is important to provide more in-formation about Mexican flora and their use in traditional medicine due to their healthimplications, including their toxicity, and to establish if they are safe or effective. The infor-mation obtained in this study could be used to expand the knowledge and use of Salviaamarissima Ortega. Recent studies of potential antidiabetic plants were related to diversemechanisms of how they generate antihyperglycemic activity, such as α-glucosidase in-hibitors, protein tyrosine phosphatase 1B inhibitors (PTP-1B), insulin secretion, or inhibitionof DPP-IV [9–20]. Rural populations use herbal products or combine them with allopathictreatments for the control of blood glucose levels [21,22]. These treatments include speciessuch as Salvia amarissima Ortega (Syn. Salvia circinata Cav.), which is a perennial aro-matic shrub native to Mexico, commonly known as “bretónica”, “diabetina”, “prodigiosa”,“salvia”, or “insulina”, and used in Mexican traditional medicine for the treatment of ulcers,helminthiasis, and diabetes [9,21,23,24]. In previous studies, medium and high polarityextracts were isolated from S. amarissima: phenolic compounds (rosmarinic acid, rutin,pedalitin, apigenin-7-O-β-D-glucoside, 6-hydroxyluteoline, 2-(3-4-dimethoxyphenyl)-5-6-dihydroxy-7-methoxy-4H-chromen-4-one, 5,6,4′-trihydroxy-7-3′-dimethoxyflavone, andisoquercitrin) and terpenoids (amarisolides A–G, amarissinines A–C, acetylamarisine B,teotihuacanin, α-bourbanene, β-caryophyllene, δ-elemene, α-caryophyllene, β-selinene,germacrene D, and spathulenol [14,15,24–26]. Among these, amarisolide A, rutin, pedalitin,apigenin-7-O-β-D-glucoside, and 2-(3-4-dimethoxyphenyl)-5-6-dihydroxy-7-methoxy-4H-chromen-4-one are α-glucosidase inhibitors. In addition, amarisolide A, rutin, rosmarinicacid, isoquercitrin, and pedalitin are protein–tyrosine phosphatase 1B inhibitors (PTP-1B) [14,24]. It is important to highlight that low polarity extracts of fresh aerial parts havenot been studied; however, the study of non-polar compounds is scarce, including whenthey showed effects in pre-clinical sub-chronic studies [9,15,24]. The focused polarity ofthis study provides information for the selection of the best conditions for potential herbalpreparations or pharmaceutical products obtained from S. amarissima.
The aim of this study was to evaluate the antihyperglycemic and lipid profile effectsof the non-polar extract of Salvia amarissima and its active fraction in male normoglycemicand streptozocin-induced diabetes mellitus type 2 mice.
2. Materials and Methods2.1. General Information
Methanol (CC: 904903), ethyl acetate (CC:10382681), and petroleum ether (CC: 8032324)solvents were purchased from J.T. BakerTM (Thermo Fisher Scientific, Waltham, MA, USA).Streptozocin (75% α-anomer basis, PN: S0130-5 G), nicotinamide (99.5%, PN: 47865-U),glucose (anhydrous, PN: D9434-1 Kg), sucrose (99.5% GC, PN: S9378-1 Kg), starch (CC336155-1 Kg), acarbose (PN: PHR1253-500 mg), and canagliflozin (95%, PN:721174-1 G)were obtained from Sigma-Aldrich® (Saint Louis, MO, USA). Silica gel (high purity grade(7734), pore size 60 Å, 70,230 mesh; CC: 391484-5 Kg) was purchased from Merck® (Merck®,Darmstadt, Germany).
2.2. Plant Material
Salvia amarissima Ortega fresh aerial parts were collected in San Gregorio Atlapulco,Xochimilco, Mexico. The plant was identified by M.Sc. Santiago Xolalpa from the herbar-ium of the National Medical Center XXI Century, Mexican Institute of Social Security (IMSS)in México City, and a voucher specimen (16263) was made and deposited at the herbarium.

Molecules 2021, 26, 947 3 of 16
2.3. Obtaining the Petroleum Ether Extract of Salvia amarissima
Fresh aerial parts of the plant were cut (3 kg) in small pieces and then all were addedto 9 L of petroleum ether to perform a metabolite extraction by thorough maceration atroom temperature for one week; this extraction process was performed twice [10]. At thecompletion, the extract was collected through filtration and concentrated at 40 ◦C in a rotaryevaporator coupled to a vacuum system (Büchi Labortechnik AG, Flawil, Switzerland); theextract was named PEfAPSa (petroleum ether extract of fresh aerial parts of S. amarissima).The final dry weight of the extract was 8.01 g of yellow wax with a yield of 0.27%.
2.4. Column-Chromatography and Phytochemical Screening
To better understand the activity of PEfAPSa, the dry extract was subjected to columnchromatography using ethyl acetate (EtOAc) and methanol (MeOH) solvent elution oversilica gel 60 G, successively using 150 mL of petroleum ether-EtOAc (100:0 to 0:100) foreach fraction, followed by a mixture of EtOAc–MeOH (90:10 to 50:50). As result, sevenfractions were obtained, namely F1Sa, F2Sa, F3Sa, F4Sa, F5Sa, F6Sa, and F7Sa. Of these,based on the results of the acute assays of the fractions obtained, only Fraction 6 (F6Sa) waspurified by preparative thin layer chromatography (TLC) silica gel 60F-254 (Merck), usinga petroleum ether–acetone (85:15) mixture as the mobile phase to obtain the secondarymetabolites. The process was repeated as needed with the remaining extract to obtainthe largest number of fractions for in vivo experiments and preliminary analysis of purecompounds. Preliminary qualitative identification of pure compounds was conducted interpene compounds and was performed by TLC using sulfuric acid (10% in water) and/orceric sulphate as revelators; pure compounds and terpenes standard had an Rf of 0.14 andwere positive to ceric sulphate, indicating the presence of terpene compounds in F6Sa, butthey were not yet characterized [27].
2.5. Animal In Vivo Assays
Male (for acute and sub-chronic assays, and oral tolerance tests (OTTs)) and female (fortoxicity) Balb/c mice (20–25 g) were obtained from the animal bioterium of the NationalMedical Center XXI Century, Mexican Institute of Social Security (IMSS) in Mexico City,where animals were raised and maintained under standard laboratory conditions (condi-tions (12 h/12 h light/dark cycles; temperature, 25 ± 2 ◦C; humidity 55–80%) accordingto the Mexican Official Norm [10,28]. Food and water were provided ad libitum. Theexperimental protocol was registered and approved by the Local Research Committee withinstitutional register number FIS/IMSS/PROT/PRIO/19/110.
2.6. Toxicity Test
To determine if the PEfAPSa could be used safely, the acute toxic class method test 423from the OECD [29] was performed. Fifteen Balb/c mice (only females), fasted overnightbut allowed free access to water, were randomly assigned to the following groups ofthree mice each (n = 3): (I) negative control only administered with distilled water, andalso healthy mice administered with extract in a single dose at (II) 3 mg/kg b.w., (III)30 mg/kg b.w., (IV) 300 mg/kg b.w., and (V) 3000 mg/kg b.w. Mice were not fed for 4 hafter administration. Signs of toxic effects and/or lethality were observed in the first 6 hafter single administration and then for 48 h, and mice were examined for neurotoxic signssuch as dizziness, lethargy, or aggressiveness. At the 0, 2, and 4 h mark after the load of theextract, glycemia was measured in all the treatment groups. The general health conditionsof mice were observed daily for a period of 14 days for mortality, toxic effects, and/orchanges in behavioral patterns. At the end of the experiment, the animals were sacrificedin a CO2 saturation chamber. Then, internal major organs (stomach, gut, kidney, spleen,

Molecules 2021, 26, 947 4 of 16
and liver) were extracted, macroscopical observations were performed, and the relativeorgan weight was calculated [30,31] using the following formula:
Relative organ weight =Organ weight (g)
Body weight of the animal on sacrifice day (g)× 100
2.7. Nicotinamide–Streptozotocin-Induced Experimental Hyperglycemia in Mice
Experimental hyperglycemia was induced in male Balb/c mice intraperitoneallyby injection of streptozotocin (STZ) at a dose of 100 mg/kg b.w. dissolved in citratebuffer solution (pH 4), which was maintained in ice prior to use. Fifteen minutes afterthe nicotinamide (NA) injection, intraperitoneal injection of nicotinamide at a dose of240 mg/kg b.w. dissolved in distilled water were made in each male mouse at day zero.One week later, blood samples were taken from each animal, and those mice that showedblood glucose ≥210 mg/dL were considered as hyperglycemic and with experimentaldiabetes and were selected for the following studies [27].
2.8. Acute Antihyperglycemic Assay
To determine how PEfAPSa and F6Sa generate a diminution of glycemia, acute assaysin diabetic animals were performed. Animals were divided into experimental groups of sixanimals each (n = 6), and treatments were administrated by the intragastric route with acannula in a single administration divided into different groups of the following treatments:acarbose, PEfAPSa, and fractions 1–7 of S. amarissima. The quantities applied to the animalgroups are listed below.
Acarbose acute activity: (I) streptozocin-induced diabetic (STID) mice control, (II)STID mice + acarbose 50 mg/kg b.w., and (III) STID mice + acarbose 100 mg/kg b.w. Thiswas performed at the same time as the PEfAPSa assay.
Acute activity of PEfAPSa: (I) STID mice control, (II) STID mice + acarbose 100 mg/kgb.w. as drug control group, (III) STID mice + PEfAPSa 50 mg/kg b.w., (IV) STID mice+ PEfAPSa 100 mg/kg b.w., and (V) STID mice + PEfAPSa 300 mg/kg b.w. This wasperformed at the same time as the acarbose assay.
Acute assay of fractions: (I) STID mice control, (II) STID mice + acarbose 100 mg/kgb.w., (III) STID mice + F1Sa 50 mg/kg b.w., (IV) STID mice + F2Sa 50 mg/kg b.w., (V) STIDmice + F3Sa 50 mg/kg b.w., (VI) STID mice + F4Sa 50 mg/kg b.w., (VII) STID mice + F5Sa50 mg/kg b.w., (VIII) STID mice + F6Sa 50mg/kg b.w., and (IX) STID mice + F7Sa 50mg/kgb.w.
Acute activity of F6Sa: (I) STID mice control, (II) STID mice + acarbose 100 mg/kgb.w., (III) STID mice + F6Sa 25 mg/kg b.w., (IV) STID mice + F6Sa 50 mg/kg b.w., (V) STIDmice + F6Sa 100 mg/kg b.w.
The healthy mice group was administrated with vehicle (Tween 80:H2O, 2:98). Bloodsamples were collected at 0, 1, 3, 5, and 7 h after the first administration of each treatment.These assays were performed at the same time [10,27].
2.9. Sub-Chronic Assay
The sub-chronic assay was performed on diabetic mice to observe the behavior of thetreatments, contrasting healthy and diabetic animals. Diabetic mice were divided into 4experimental groups of six animals each (n = 6), and treatments were administrated dailyby the intragastric route for six weeks as follows: (I) diabetic mice administered only withvehicle (Tween 80:H2O, 2:98), (II) PEfAPSa (50 mg/kg b.w.), (III) F6Sa (50 mg/kg b.w.),(IV) acarbose (100 mg/kg b.w.) as reference group, and (V) healthy group administeredonly with vehicle. Blood glucose levels (mg/dL) and body weight variations (g) wereevaluated every 7 days, and every 15 days, evaluations were made of glycated hemoglobin(HbA1c), triglycerides (TG), and high-density lipoprotein (HDL). HbA1c, TG, and HDLblood samples were obtained by puncture in the caudal vein to obtain blood samples.HbA1c was measured by Clover A1c Analyzer (Infopia Co., Ltd., Anyang, Korea) using
Molecules 2021, 26, 947 5 of 16
40 µL, and TG and HDL were measured with the lipid panel of Cardiocheck ProfessionalPA Silver (Polymer Technology Systems, Whitestown, IN, USA) using 40 µL of blood. Atthe end of the experiment, the animals were sacrificed in a CO2 saturation chamber, organswere macroscopically evaluated [9,28], and the relative organ weight of each animal wascalculated with the equation in Section 2.6 [30,31].
2.10. Oral Tolerance Test (OTT)
To identify part of the probable mechanism by which the plant exerts its activity,inhibition of α-glucosidases (with sucrose and starch) or the glucose transport mechanism(glucose), studies were conducted consistent with other plants species from diverse fam-ilies, such as Calea ternifolia [9], Annona cherimolla [10], or Scutellaria baicalensis [11], forexample, that had been studied as antihyperglycemic agents [8–13]. The OTT techniquewas performed after an overnight fasting (18 h) of normoglycemic mice. Mice were di-vided into groups of six animals each and administrated with the following treatments:(I) Tween 80:H2O (2:98), (II) PEfAPSa (50 mg/kg b.w.), (III) PEfAPSa (100 mg/kg b.w.),(IV) F6Sa (50 mg/kg b.w.), (V) F6Sa (100 mg/kg b.w.), (VI) acarbose (100 mg/kg b.w.) ascontrol for oral sucrose tolerance test (OSTT) and oral starch tolerance test (OStTT), or (VII)canagliflozin (100 mg/kg) control for oral glucose tolerance test (OGTT). Baseline (time0 h) was set before the administration of the treatment previously described; after 30 min,the respective treatment was administered to the mice as follows: glucose (1.5 g/kg b.w.),sucrose (3 g/kg b.w.), and starch (3 g/kg b.w.). Blood samples were collected at 1, 2, and4 h after the glucose load [9,27].
2.11. Collection of Blood Glucose and Determination of Blood Glucose
Blood samples for each assay were collected from the caudal vein by a small incisionat the end of the tail, and the glucose levels (mg/dL) were measured using a commercialglucometer (Accu-chek Performa, Roche Diagnostics GmbH, Manheim, Germany).
2.12. Statistical Analysis
Data are expressed as the mean (±) with the standard error of the mean (SEM). Statis-tical significance was determined by one-way analysis of variance (ANOVA) followed bythe Dunnet test (GraphPad Prism Version 6.01; GraphPad Software Inc., La Jolla, CA, USA),with post hoc test * p-values < 0.05 indicating significant differences between experimentalgroup means.
3. Results3.1. In Vivo Assays3.1.1. Acute Oral Toxicity Test of the PEfAPSa
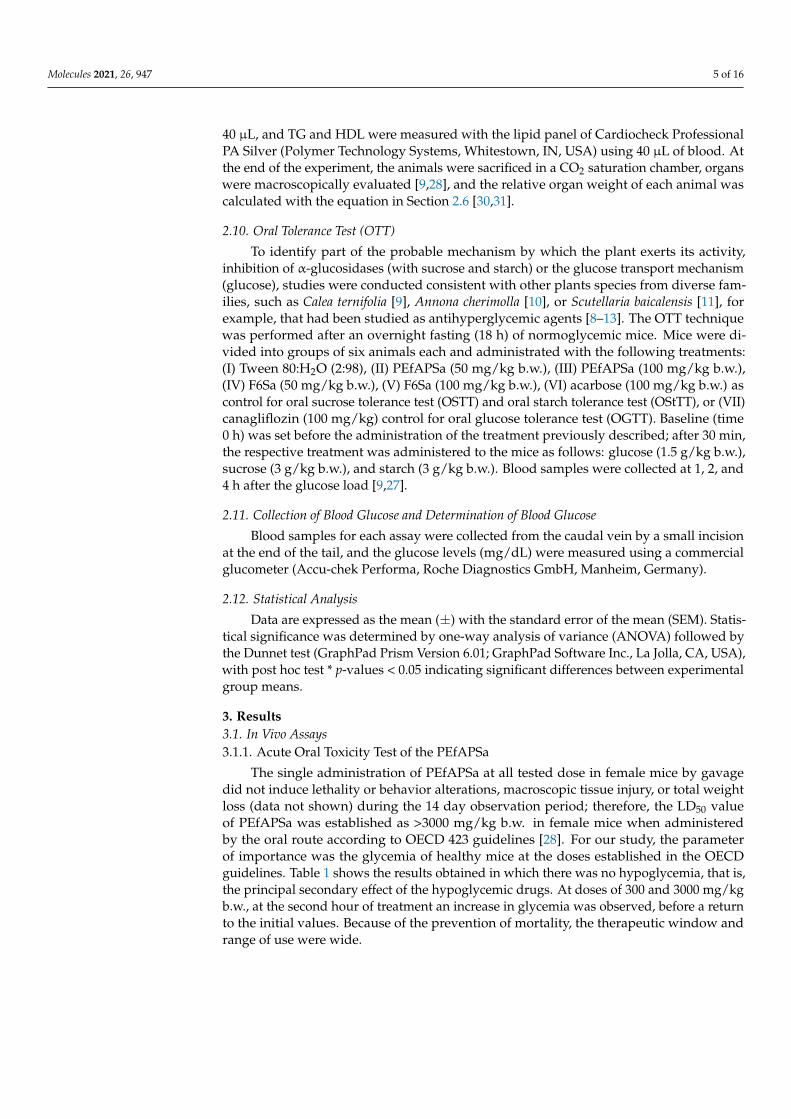
The single administration of PEfAPSa at all tested dose in female mice by gavagedid not induce lethality or behavior alterations, macroscopic tissue injury, or total weightloss (data not shown) during the 14 day observation period; therefore, the LD50 valueof PEfAPSa was established as >3000 mg/kg b.w. in female mice when administeredby the oral route according to OECD 423 guidelines [28]. For our study, the parameterof importance was the glycemia of healthy mice at the doses established in the OECDguidelines. Table 1 shows the results obtained in which there was no hypoglycemia, that is,the principal secondary effect of the hypoglycemic drugs. At doses of 300 and 3000 mg/kgb.w., at the second hour of treatment an increase in glycemia was observed, before a returnto the initial values. Because of the prevention of mortality, the therapeutic window andrange of use were wide.

Molecules 2021, 26, 947 6 of 16
Table 1. Glycemia measurements in the toxicity assay of PEfAPSa.
Treatments
Time (h) Healthy MiceHealthy Mice +
PEfAPSa 3 mg/kgb.w.
Healthy Mice +PEfAPSa
30 mg/kg b.w.
Healthy Mice +PEfAPSa
300 mg/kg b.w.
Healthy Mice +PEfAPSa
3000 mg/kg b.w.
0 116.67 ± 3.96 119.33 ± 2.00 113.44 ± 2.37 108.78 ± 1.51 115.67 ± 2.002 114.78 ± 3.32 115.33 ± 2.62 117.33 ± 5.43 129.11 ± 3.19 * 151.56 ± 1.79 *4 110.89 ± 1.63 109.67 ± 1.23 109.89 ± 1.15 112.89 ± 2.75 115.67 ± 1.62
Toxicity of the PEfAPSa at doses of 3, 30, 300, and 3000 mg/kg b.w. in healthy mice. * p < 0.05 represents significantly different one-wayANOVA followed by Dunnet’s post hoc test for comparison with respect to vehicle at the same time.
3.1.2. Evaluation of Acute Antihyperglycemic Effect of PEfAPSa
The acute antihyperglycemic activity was evaluated to determine the potential antihy-perglycemic effect of PEfAPSa and to select the dose for the subsequent sub-chronic assay,which indicates the behavior of the PEfAPSa at different doses (Figure 1A). Furthermore,this assay was used to evaluate two doses of acarbose to determine that to be used as thedrug control. The extract was evaluated at three single doses of 50, 100, and 300 mg/kgb.w. Among these, two doses, namely 50 and 300 mg/kg b.w., generated a significantdecrease in hyperglycemia in STID mice in all of the measured times. The effect wascomparable to that obtained with acarbose at a dose of 100 mg/kg b.w. For subsequentstudies, the dose of 50 mg/kg b.w. of PEfAPSa was selected, considering it is a lowerdose with major and constant effects with time. In contrast, those diabetic mice that wereadministered with PEfAPSa at a dose of 100 mg/kg b.w. showed increased levels of bloodglucose compared even to those results obtained from the group of diabetic mice withouttreatment (375 mg/dL), for which results were discarded. The dose selected for acarbosewas 100 mg/kg b.w. because it had a similar effect as that observed with PEfAPSa at a doseof 50 mg/kg b.w. until the last hour of evaluation. The dose of 300 mg/kg b.w. did notgenerate hypoglycemia as seen in the toxicity assay in healthy mice, as shown in Figure 1A.
3.1.3. Evaluation of Acute Antihyperglycemic Activity of the Secondary Fractions (F2Sa,F5Sa, and F6Sa) of Salvia amarissima
Once the effect of PEfAPSa and acarbose were evaluated and adequate doses wereselected, the extract was subjected to column chromatography, as described in Section 2,obtaining seven fractions named F1Sa, F2Sa, F3Sa, F4Sa, F5Sa, F6Sa, and F7Sa. These wereevaluated to identify those that had antihyperglycemic activities similar to that of PEfAPSa.Figure 2 shows the fractions that had some antihyperglycemic activity. The fractions thatshowed activity were F2Sa, F5Sa, and F6Sa. F2Sa and F5Sa had activity at the first and thirdhours, respectively, but lost their activity after that time. F6Sa showed a reduction of bloodglucose from the third hour and maintained its activity, similar to the case of PEfAPSa, andin the last two hours to the case of the acarbose control group. This fraction (F6Sa) wasselected for later assays (Figure 1B).
3.1.4. Acute Activity of F6Sa of Salvia amarissima
After demonstrating the activity of F6Sa, it was evaluated at three different doses (25,50, and 100 mg/kg b.w.), to identify which of these had better antihyperglycemic activity,and the behavior of the fraction in STID mice. The single dose of F6Sa at 50 mg/kg b.w.(Figure 1C) induced a decrease in glycemia to almost 324 mg/dL, 5 h after administration,compared with the mice vehicle group (386 mg/dL), showing similar activity at the fifthhour to the acarbose control group (323 mg/dL). Diabetic animals treated with F6Sa atdoses of 25 and 100 mg/kg b.w. increased glycemic levels to 449 mg/dL and 428 mg/dL,respectively, compared to the vehicle group. Because of these results, the selected dose was50 mg/kg b.w. for later assays. As seen in Figure 1C, F6Sa showed similar behavior to thecase in which there was no dose-dependent relationship between the evaluated doses.

Molecules 2021, 26, 947 7 of 16
Molecules 2021, 26, x FOR PEER REVIEW 7 of 16
compared with the mice vehicle group (386 mg/dL), showing similar activity at the fifth hour to the acarbose control group (323 mg/dL). Diabetic animals treated with F6Sa at doses of 25 and 100 mg/kg b.w. increased glycemic levels to 449 mg/dL and 428 mg/dL, respectively, compared to the vehicle group. Because of these results, the selected dose was 50 mg/kg b.w. for later assays. As seen in Figure 1C, F6Sa showed similar behavior to the case in which there was no dose-dependent relationship between the evaluated doses.
(A)
(B)
(C)
Figure 1. Acute assays of streptozocin-induced diabetic (STID) mice of (A) PEfAPSa in diabetic mice at doses of 50, 100, and 300 mg/kg b.w., and acarbose at doses of 50 and 100 mg/kg b.w.; (B) active fractions (F2Sa, F5Sa, and F6Sa) obtained from PEfAPSa, every fraction evaluated at the dose of 50 mg/kg; (C) effect of Fraction 6 (F6Sa) in diabetic mice at doses of 25, 50, and 100 mg/kg b.w. Each point represents the mean ± SEM, n = 6. * p < 0.05 represents significantly different two-way ANOVA followed by Dunnet’s post hoc test for comparison with respect to STID mice con-trol group at the same time.
Figure 1. Acute assays of streptozocin-induced diabetic (STID) mice of (A) PEfAPSa in diabetic miceat doses of 50, 100, and 300 mg/kg b.w., and acarbose at doses of 50 and 100 mg/kg b.w.; (B) activefractions (F2Sa, F5Sa, and F6Sa) obtained from PEfAPSa, every fraction evaluated at the dose of50 mg/kg; (C) effect of Fraction 6 (F6Sa) in diabetic mice at doses of 25, 50, and 100 mg/kg b.w. Eachpoint represents the mean ± SEM, n = 6. * p < 0.05 represents significantly different two-way ANOVAfollowed by Dunnet’s post hoc test for comparison with respect to STID mice control group at thesame time.
3.2. Subchronic Assay3.2.1. Organ Weight Measurement of PEfAPSa, F6Sa, and Acarbose on STID Mice ofSubchronic Assay
As seen in Table 2, the analysis of the organs with the sub-chronic assay indicatethat, with the exception of the spleen, differences exist between the diabetic control groupand the diverse treatments. In the case of the liver in PEfAPSa and F6Sa, a diminutionof the organ weight occurred, but this was similar to the healthy mice control, and in the

Molecules 2021, 26, 947 8 of 16
macroscopic analysis there were no changes in the case of the STID mice liver, which had apale color. PEfAPSa generated a reduction of the kidneys, but there was no relationshipwith the results shown in Figure 1C. Finally, for the results of the intestine, a significantincrease in weight occurred in the diabetic control. This could be explained as a result of thepolyphagia inherent with diabetes mellitus. PEfAPSa and F6Sa maintained similar valuesto that of the healthy control group. Finally, PEfAPSa and F6Sa generated a diminution ofthe intestine weight compared to the diabetic control group and the acarbose group andwas also similar to the healthy group (Table 2).
Table 2. Relative organ weight of the sub-chronic assay PEfAPSa.
Treatments
Organs Healthy Mice STID + Vehicle STID + PEfAPSa(50 mg/kg b.w.)
STID + F6Sa(50 mg/kg b.w.)
STID + Acarbose(100 mg/kg b.w.)
Pancreas 0.225 ± 0.054 0.121 ± 0.056 0.109 ± 0.035 0.111 ± 0.060 0.226 ± 0.100Spleen 0.085 ± 0.016 0.115 ± 0.033 0.089 ± 0.005 0.096 ± 0.020 0.093 ± 0.032
Stomach 0.392 ± 0.073 0.227 ± 0.032 0.288 ± 0.338 0.136 ± 0.084 0.696 ± 0.217 *Liver 1.073 ± 0.152 1.592 ± 0.183 1.220 ± 0.315 * 0.638 ± 0.587 * 1.465 ± 0.090
Kidneys 0.123 ± 0.022 0.430 ± 0.035 0.160 ± 0.014 * 0.170 ± 0.024 * 0.166 ± 0.012 *Intestine 1.487 ± 0.051 3.390 ± 0.396 1.838 ± 0.842 * 0.824 ± 1.445 * 2.442 ± 0.450 *
Relative organ weight of the sub-chronic assay PEfAPSa, F6Sa, and acarbose on STID mice. Subchronic activity of PEfAPSa 50 mg/kgb.w., F6Sa 50 mg/kg b.w., and acarbose 100 mg/kg b.w. in STID mice. Each point represents the mean ± SEM, n = 6. * p < 0.05 representssignificantly different one-way ANOVA followed by Dunnet’s post hoc test for comparison with respect to STID mice control of therespective organ. Relative organ weight was calculated as (organ weight (g)/body weight of animal on sacrifice day (g)) × 100.
3.2.2. Subchronic Assessment of Blood Glucose with PEfAPSa, F6Sa, and Acarbose onSTID Mice
Once the active doses of the diverse treatments of the acute assays were selected, thesub-chronic assay was performed. This test validated the STID mice model to measuredifferent parameters that are altered in diabetes mellitus, such as glucose, HbA1c, TG,HDL, and organ alterations. In the case of validation of the diabetic model, the STID miceof the control group did not undergo a recovery, and glucose levels suggested that thedevelopment of experimental diabetes in animals was constant over time, with glycemiaincreasing from 347 to 471 mg/dL at the end of the experiment (Figure 2A). This is similarto poorly controlled diabetic patients. In contrast, the healthy vehicle group did not showan increase in blood glucose. The acarbose group showed constant glycemic levels (329to 313 mg/dL) in all of the assays. The PEfAPSa group showed major activity comparedto the acarbose group, with a decrease from 323 to 262 mg/dL. The F6Sa group showedmajor activity from the first week of treatment (259 mg/dL), maintaining glucose levelssignificantly lower than those of the control group at the end of the experimental period,and showed similar activity to the acarbose group (313 mg/dL). PEfAPSa and F6Sa showedbetter activity compared to the acarbose control group in the six weeks of treatment(Figure 2A).
3.2.3. Glycated Hemoglobin Measurement of PEfAPSa, F6Sa, and Acarbose on STID Miceof Subchronic Assay
The animals of the sub-chronic assay were also used for complementary analysis.HbA1c was used in the complementary test to confirm and predict the degree of progressionof the disease (Figure 2B). The evaluation of the HbA1c for the sub-chronic assay indicateda partial relationship with the glucose level evaluation of previous results (Figure 2A). Thehealthy group maintained values from 4.5 to 5.3%, whereas the diabetic group showedvalues of 7.6 to 9%, and the acarbose, PEfAPSa, and F6Sa groups generated similar values,of between 7.3 to 7.5%, as shown in Figure 2B. These results indicate that the evaluatedtreatments have similarities, as also seen in the results shown in Figure 2A,B.

Molecules 2021, 26, 947 9 of 16
3.2.4. Measurement of Lipids Parameters in Subchronic Assay of PEfAPSa, F6Sa, andAcarbose on STID Mice
Other measured parameters that were found to have significant changes in diabetesmellitus were the TG and HDL. These parameters were also related in the metabolicsyndrome and cardiovascular diseases [3]. The changes that generate S. amarissima in thelipid profile can serve to broaden the therapeutic uses of the plant. The variations observedin Figure 2C,D were measured in the sub-chronic assay.
Triglyceride Measurement of the Subchronic Assay of PEfAPSa, F6Sa, and Acarbose onSTID Mice
The values obtained (Figure 2C) indicated that from the second week, all of thetreatments showed a decrease in the values of TG. PEfAPSa and F6Sa maintained majoractivity for six weeks. They also maintained a lower concentration of this parameter andhad a better effect than that observed with the acarbose group, which from the fourth weekshowed an increase in the TG values and at the end of the assay was similar to that of theSTID mice group. This indicates that a reduction of the TG generates an improvementof diabetic management, decreasing the possibility of alterations in other parametersassociated in a diabetic complex like dyslipidemias and/or cardiovascular complications,incorporating complementary activity for the use of the plant.
HDL Measurement of the Subchronic Assay of PEfAPSa, F6Sa, and Acarbose on STID Mice
The measured HDL values (Figure 2D) indicate that PEfAPSa and F6Sa, at the secondweek, increased the HDL values, followed by a similar decrease in the values for both cases.The combination of results could indicate an effective optimum control and reduction ofcardiovascular disease associated with diabetes mellitus.
3.3. Oral Tolerance Test Assays
The principal mechanisms studied from the plants were focused on the inhibitionof glucosidase enzymes and glucose transport mechanisms [7–12]. The α-glucosidaseenzymes mostly used for the evaluations of the glucosidase enzymes were sucrose andstarch, and glucose was used for the glucose transporter, because the enzymes are focusedon the degradation of disaccharides and polysaccharides. These tests were carried out toevaluate the activity of the different glucosidase enzymes (Figure 3A,B) and of the glucosetransport (Figure 3C).
Molecules 2021, 26, x FOR PEER REVIEW 9 of 16
3.2.3. Glycated Hemoglobin Measurement of PEfAPSa, F6Sa, and Acarbose on STID Mice of Subchronic Assay
The animals of the sub-chronic assay were also used for complementary analysis. HbA1c was used in the complementary test to confirm and predict the degree of progres-sion of the disease (Figure 2B). The evaluation of the HbA1c for the sub-chronic assay indicated a partial relationship with the glucose level evaluation of previous results (Fig-ure 2A). The healthy group maintained values from 4.5 to 5.3%, whereas the diabetic group showed values of 7.6 to 9%, and the acarbose, PEfAPSa, and F6Sa groups generated similar values, of between 7.3 to 7.5%, as shown in Figure 2B. These results indicate that the evaluated treatments have similarities, as also seen in the results shown in Figure 2A,B.
3.2.4. Measurement of Lipids Parameters in Subchronic Assay of PEfAPSa, F6Sa, and Acarbose on STID Mice
Other measured parameters that were found to have significant changes in diabetes mellitus were the TG and HDL. These parameters were also related in the metabolic syn-drome and cardiovascular diseases [3]. The changes that generate S. amarissima in the lipid profile can serve to broaden the therapeutic uses of the plant. The variations observed in Figure 2C,D were measured in the sub-chronic assay. Triglyceride Measurement of the Subchronic Assay of PEfAPSa, F6Sa, and Acarbose on STID Mice
The values obtained (Figure 2C) indicated that from the second week, all of the treat-ments showed a decrease in the values of TG. PEfAPSa and F6Sa maintained major activ-ity for six weeks. They also maintained a lower concentration of this parameter and had a better effect than that observed with the acarbose group, which from the fourth week showed an increase in the TG values and at the end of the assay was similar to that of the STID mice group. This indicates that a reduction of the TG generates an improvement of diabetic management, decreasing the possibility of alterations in other parameters associ-ated in a diabetic complex like dyslipidemias and/or cardiovascular complications, incor-porating complementary activity for the use of the plant. HDL Measurement of the Subchronic Assay of PEfAPSa, F6Sa, and Acarbose on STID Mice
The measured HDL values (Figure 2D) indicate that PEfAPSa and F6Sa, at the second week, increased the HDL values, followed by a similar decrease in the values for both cases. The combination of results could indicate an effective optimum control and reduc-tion of cardiovascular disease associated with diabetes mellitus.
(A)
Figure 2. Cont.

Molecules 2021, 26, 947 10 of 16Molecules 2021, 26, x FOR PEER REVIEW 10 of 16
(B)
(C)
(D)
Figure 2. Subchronic assay results of the treatments: healthy mice, STID mice control group, STID mice + PEfAPSa 50 mg/kg b.w., STID mice + F6Sa 50 mg/kg b.w., and STID mice + acarbose 100 mg/kg b.w.; (A) glycemia in mg/dL, (B) HbA1c, (C) TG in mg/dL, and (D) HDL in mg/dL. Each point represents the mean ± SEM, n = 6. * p < 0.05 represents significantly different two-way ANOVA followed by Dunnet’s post hoc test for comparison with respect to STID mice control group at the same time and parameter measured.
3.3. Oral Tolerance Test Assays The principal mechanisms studied from the plants were focused on the inhibition of
glucosidase enzymes and glucose transport mechanisms [7–12]. The α-glucosidase en-zymes mostly used for the evaluations of the glucosidase enzymes were sucrose and starch, and glucose was used for the glucose transporter, because the enzymes are focused on the degradation of disaccharides and polysaccharides. These tests were carried out to evaluate the activity of the different glucosidase enzymes (Figure 3A,B) and of the glucose transport (Figure 3C).
Figure 2. Subchronic assay results of the treatments: healthy mice, STID mice control group, STIDmice + PEfAPSa 50 mg/kg b.w., STID mice + F6Sa 50 mg/kg b.w., and STID mice + acarbose100 mg/kg b.w.; (A) glycemia in mg/dL, (B) HbA1c, (C) TG in mg/dL, and (D) HDL in mg/dL.Each point represents the mean ± SEM, n = 6. * p < 0.05 represents significantly different two-wayANOVA followed by Dunnet’s post hoc test for comparison with respect to STID mice control groupat the same time and parameter measured.
3.3.1. Oral Sucrose Tolerance Test (OSTT)
In the OSTT (Figure 3A), the principal source of glucose is from the degradation of thedisaccharide sucrose; the healthy control group in the assay maintained a blood glucoseaverage of 100 mg/dL, and the acarbose control group showed a decrease in glycemia to 81mg/dL in the first hour and then to 65 mg/dL. The PEfAPSa did not induce a decrease inpostprandial glycemia. Only F6Sa generated a diminution of the blood glucose levels thatwas similar to that of the healthy control group (121 mg/dL), as shown in Figure 3A. All ofthe treatments, with the exception of acarbose, returned to the values similar to those of thecontrol group at the second hour. This indicates that part of the effect observed in acute andsub-chronic assays could be related to the inhibition of the hydrolysis of carbohydrates.

Molecules 2021, 26, 947 11 of 16
Molecules 2021, 26, x FOR PEER REVIEW 11 of 16
3.3.1. Oral Sucrose Tolerance Test (OSTT) In the OSTT (Figure 3A), the principal source of glucose is from the degradation of
the disaccharide sucrose; the healthy control group in the assay maintained a blood glu-cose average of 100 mg/dL, and the acarbose control group showed a decrease in glycemia to 81 mg/dL in the first hour and then to 65 mg/dL. The PEfAPSa did not induce a decrease in postprandial glycemia. Only F6Sa generated a diminution of the blood glucose levels that was similar to that of the healthy control group (121 mg/dL), as shown in Figure 3A. All of the treatments, with the exception of acarbose, returned to the values similar to those of the control group at the second hour. This indicates that part of the effect observed in acute and sub-chronic assays could be related to the inhibition of the hydrolysis of car-bohydrates.
3.3.2. Oral Starch Tolerance Test (OStTT) In the case of the OStTT (Figure 3B), all of the treatments generated an inhibition of
the glucose postprandial peak of the first hour after the starch loading, which was similar to the values of the acarbose group. The effects appeared to be more active at the doses of 50 mg/kg b.w. in both cases. The results suggest that if the carbohydrate is more complex, the activity of the treatment could be improved.
3.3.3. Oral Glucose Tolerance Test (OGTT) The results of the OGTT (Figure 3C) show that all of the evaluated treatments gener-
ated a reduction of the postprandial peak in comparison with the glucose group. Only PEfAPSa at 50 mg/dL generated an increase in blood glucose at the first hour with the dose of 50 mg/kg b.w. This indicated that the activity is not related to glucose transport.
(A)
(B)
Molecules 2021, 26, x FOR PEER REVIEW 12 of 16
(C)
Figure 3. Oral tolerance test of healthy mice, PEfAPSa, at 50 and 100 mg/kg b.w., F6Sa at doses of 50 and 100 mg/kg b.w. in the subsequent carbohydrates. (A) Sucrose at a dose of 3 g/kg b.w., and acarbose at a dose of 100 mg/kg b.w. (B) Starch at a dose of 3 g/kg b.w. and acarbose at a dose of 100 mg/kg b.w. (C) Glucose at a dose of 1.5 g/kg b.w. and canagliflozin at a dose of 100 mg/kg b.w. Each point represents the mean ± SEM, n = 6; * p < 0.05 represents significantly different two-way ANOVA followed by Dunnet’s post hoc test for comparison with respect to healthy control group with carbohydrate load at the same time.
4. Discussion S. amarissima is a plant used in traditional Mexican medicine to treat DM. The back-
ground of the plant includes ethnomedical uses [21,23], and use in the evaluation of polar and medium polar extracts (MeOH:acetone and aqueose extracts), as well as in products obtained from these extracts (flavonoids and diterpens) [14,15,24–26]. The aforementioned studies focus on acute assays and some tolerances, while the present work provides infor-mation regarding acute, sub-chronic, and oral tolerance test assays of a non-polar extract and fraction. In addition, this study provides information regarding the behavior of HbA1c, TG, and HDL in a sub-chronic assay and information regarding the part of the mechanism through which they exert their effects.
The evaluation of the extract (PEfAPSa), according to acute toxic class method test 423 from the OECD guidelines [29], indicates that the estimated LD50 for the present study is determined as uncategorized because, at the maximum evaluated dose (3000 mg/kg b.w.), this dosage causes no mortality. The information provided by this assay is useful for choosing the range of doses that can be used for an acute assay in STID with non-polar petroleum ether extract. These results are in accordance with those of another research group [24], who described the LD50 of an aqueous extract (>5 g/kg). Additionally, in this experiment, the glycemia levels in the first 4 h of treatment indicated that no doses gener-ated hypoglycemia, which is one of the side effects of the most common antidiabetic drugs [31].
The results of acute assays in STID mice, shown previously in Figure 1A–C, the model used in the assays conducted in this study, has been corroborated as a viable model for the evaluation of antidiabetic treatments where streptozotocin generates a disfunction in the pancreatic β-cells [10,30,32–34]. This work is focused on the evaluation of the non-polar petroleum ether extract (PEfAPSa) and its respective fractions, because studies fo-cused on high-polarity compounds, such as flavonoids, or medium polarity compounds, such as diterpenes, possess antidiabetic activity, excluding the assessment of non-polar compounds [8–10]. In STID mice, single doses of petroleum ether extract (PEfAPSa) showed a diminution of glycemia at doses of 50 and 300 mg/dL, and a dose of 50 mg/dL was selected as the optimal dose because, according to the results, it seems that a dose–response relationship was not observed between them. Following analysis of PEfAPSa’s antihyperglycemic effects, it was fractionated in a chromatographic silica gel column, and seven fractions were obtained, named F1Sa–F7Sa.
Figure 3. Oral tolerance test of healthy mice, PEfAPSa, at 50 and 100 mg/kg b.w., F6Sa at doses of50 and 100 mg/kg b.w. in the subsequent carbohydrates. (A) Sucrose at a dose of 3 g/kg b.w., andacarbose at a dose of 100 mg/kg b.w. (B) Starch at a dose of 3 g/kg b.w. and acarbose at a dose of100 mg/kg b.w. (C) Glucose at a dose of 1.5 g/kg b.w. and canagliflozin at a dose of 100 mg/kg b.w.Each point represents the mean ± SEM, n = 6; * p < 0.05 represents significantly different two-wayANOVA followed by Dunnet’s post hoc test for comparison with respect to healthy control groupwith carbohydrate load at the same time.
3.3.2. Oral Starch Tolerance Test (OStTT)
In the case of the OStTT (Figure 3B), all of the treatments generated an inhibition ofthe glucose postprandial peak of the first hour after the starch loading, which was similarto the values of the acarbose group. The effects appeared to be more active at the doses of50 mg/kg b.w. in both cases. The results suggest that if the carbohydrate is more complex,the activity of the treatment could be improved.

Molecules 2021, 26, 947 12 of 16
3.3.3. Oral Glucose Tolerance Test (OGTT)
The results of the OGTT (Figure 3C) show that all of the evaluated treatments gen-erated a reduction of the postprandial peak in comparison with the glucose group. OnlyPEfAPSa at 50 mg/dL generated an increase in blood glucose at the first hour with thedose of 50 mg/kg b.w. This indicated that the activity is not related to glucose transport.
4. Discussion
S. amarissima is a plant used in traditional Mexican medicine to treat DM. The back-ground of the plant includes ethnomedical uses [21,23], and use in the evaluation of polarand medium polar extracts (MeOH:acetone and aqueose extracts), as well as in productsobtained from these extracts (flavonoids and diterpens) [14,15,24–26]. The aforementionedstudies focus on acute assays and some tolerances, while the present work provides infor-mation regarding acute, sub-chronic, and oral tolerance test assays of a non-polar extractand fraction. In addition, this study provides information regarding the behavior of HbA1c,TG, and HDL in a sub-chronic assay and information regarding the part of the mechanismthrough which they exert their effects.
The evaluation of the extract (PEfAPSa), according to acute toxic class method test423 from the OECD guidelines [29], indicates that the estimated LD50 for the present studyis determined as uncategorized because, at the maximum evaluated dose (3000 mg/kgb.w.), this dosage causes no mortality. The information provided by this assay is useful forchoosing the range of doses that can be used for an acute assay in STID with non-polarpetroleum ether extract. These results are in accordance with those of another researchgroup [24], who described the LD50 of an aqueous extract (>5 g/kg). Additionally, inthis experiment, the glycemia levels in the first 4 h of treatment indicated that no dosesgenerated hypoglycemia, which is one of the side effects of the most common antidiabeticdrugs [31].
The results of acute assays in STID mice, shown previously in Figure 1A–C, the modelused in the assays conducted in this study, has been corroborated as a viable model forthe evaluation of antidiabetic treatments where streptozotocin generates a disfunctionin the pancreatic β-cells [10,30,32–34]. This work is focused on the evaluation of thenon-polar petroleum ether extract (PEfAPSa) and its respective fractions, because studiesfocused on high-polarity compounds, such as flavonoids, or medium polarity compounds,such as diterpenes, possess antidiabetic activity, excluding the assessment of non-polarcompounds [8–10]. In STID mice, single doses of petroleum ether extract (PEfAPSa)showed a diminution of glycemia at doses of 50 and 300 mg/dL, and a dose of 50 mg/dLwas selected as the optimal dose because, according to the results, it seems that a dose–response relationship was not observed between them. Following analysis of PEfAPSa’santihyperglycemic effects, it was fractionated in a chromatographic silica gel column, andseven fractions were obtained, named F1Sa–F7Sa.
From the evaluated fractions, the fraction that maintained a similar activity to thatof the extract was fraction 6 (F6Sa) in STID mice acute assays. From the three differentevaluated doses, the selected dose was 50 mg/kg b.w., which showed antihyperglycemicactivity at the fifth and seventh hours of treatment, being similar in time to PEfAPSa. Thissimilarity is related to the presence of compounds that generate a glycemia reduction inSTID mice, and these results show that the non-polar compounds obtained from petroleumether extract can be as effective as polar and non-polar extracts, while fresh parts canbe used in place of dry parts [14,15,24–26]. The benefit of the extended time effect inacute assays of PEfAPSa and F6Sa indicates that these treatments could be administratedless frequently throughout the day, while still being effective. Additionally, as seen inthe PEfAPSa acute assay, the results of F6Sa indicate that there was no a dose–responserelationship, an effect described as hormesis because the response was independent of thedose or because there was a biphasic dose–response relationship. To definitively confirmthe presence of hormesis, it is necessary to evaluate more doses to generate a completedose–response curve [35,36]. After the identification of the active fraction (F6Sa), it was

Molecules 2021, 26, 947 13 of 16
subjected to preparative thin-layer chromatography, from which some products wereidentified. Three of these were preliminarily identified as terpene compounds, whichcould be inferred by their positive reaction to ceric sulphate, in which the color observedchanged from purple to red. Plants of this family (Lamiaceae) contain a high quantityof terpenoids (monoterpenes, diterpenes, and triterpenes) [37–40], as in the case of S.amarissima, having been identified as neo-clerodane diterpenes, such as amarisolides,amarissinins, and teotihuacanine [24–26,38,41].
The diabetes mellitus 2 experimental model was suitable because glycemia levels weremaintained above 350 mg/dL [31,34], generating similar biochemical changes to diabetesin humans (glycemia and HbA1c) [31]. The evaluation of the effects in the sub-chronicassay, using the previously selected doses, indicated that PEfAPSa and F6Sa showed higheractivity than the control (acarbose) during the time of the assay. Our evaluation of HbA1csuggests that PEfAPSa and F6Sa have similar effects to the acarbose control group, with thethree groups showing similar assay results, as shown by the effects below. The similaritywith acarbose indicates that products with activity over α-glucosidase enzymes could exist,therefore affecting the HbA1c levels [3].
DM2 is characterized by relative insulin deficiency and a decrease in lipoprotein dueto a decrease in adiponectin, resulting in high levels of low-density lipoprotein and TG andlow levels of HDL. As reported in Kidwai [3], a relationship exists between high levels ofHbA1c and dyslipidemia; HbA1c increases the risk of hypertriglyceridemia by 2.69% [3] aswell as the development of a high risk of cardiovascular disease. As seen with PEfAPSaand F6Sa, the reduction in glycemia in acute and sub-chronic assays, TG, and maintenanceof HbA1c, suggest that these two therapies are viable treatments for diabetes mellitus andfor the control of HbA1c values, avoiding its increase and for TG and HDL taking themcloser to healthy mice values than diabetic animals.
The OTT was used to determine the treatments’ potential mechanisms of action.These assays are focused on various glucosidase enzymes for a specific kind of bond (α-glycosidic bond), and on glucose transport. As seen in previous results, the OGTT showedthat the effects of the extract, fraction, and compounds are not related to the glucosetransport because there were no changes in the glucose postprandial peak in the first hour.Furthermore, in the case of sucrose and starch, PEfAPSa and F6Sa inhibit the postprandialglucose peak, whereby the action of the treatments is focused on these enzymes (α 1–2 forsucrose and mixtures of α 1–4 and α 1–6 for starch), which is congruent with the previousresults. These effects, in part, could be explained because the enzymes have significantpermeability in the small intestine, which makes it possible for them to travel through theintestine or to another part of the body [42–46]. This explains how PEfAPSa and F6Sa canmaintain the levels of hemoglobin in sub-chronic assays, reducing the levels of glucoseobtained from the diet.
5. Conclusions
PEfAPSa and F6Sa showed activity in acute and sub-chronic assays of STID miceand in the regulation of the levels of blood glucose in the acute assay and HbA1c in thesub-chronic assay. Lipid parameters indicate that these could be effective complementarytreatments for dyslipidemias associated with DM.
In the OTT, the activity is focused on sucrose and starch enzymes, and does notinvolve glucose transport. This indicates that the combination of secondary metabolitescontained in the extract and the fraction are responsible for the antihyperglycemic activityin acute and long administration periods. Futures studies will evaluate different terpeniccompounds and combinations of those products to find the best mix for a better treatment.
Author Contributions: Conceptualization, J.I.S.-P. and F.C.; methodology, J.I.S.-P., G.C., C.V., E.B.,and F.C.; validation and formal analysis, J.I.S.-P., C.V., E.B., and F.C.; investigation, J.I.S.-P.; resources,G.C. and F.C.; writing—original draft preparation, J.I.S.-P.; supervision, G.C. and F.C.; project admin-istration, G.C. and F.C.; funding acquisition, G.C. and F.C. All authors have read and agreed to thepublished version of the manuscript.

Molecules 2021, 26, 947 14 of 16
Funding: The research was supported by grants from Instituto Mexicano del Seguro Social (IMSS):FIS/IMSS/PROT/PRIO/19/110 and FIS/IMSS/PROT/G17-2/1722 awarded to F.C.
Institutional Review Board Statement: The study was conducted according to the guidelines of theDeclaration of Helsinki, and in accordance with the regulations of the relevant clinical research ethicsapproved by the Local Ethics Committee of the Instituto Mexicano del Seguro Social, protocol codesR-2019-3601-227 (01-August-2019) and R-2019-3601-004 (01-January-2019).
Informed Consent Statement: Not applicable.
Data Availability Statement: The data presented in this study are available on request from thecorresponding author.
Acknowledgments: This work is taken in part from the Ph.D. thesis of Jesus Ivan Solares Pascasio. Wewould like to thank the National Council of Science and Technology for the scholarship (455972), andcontract grant sponsor FIS/IMSS/PROT/PRIO/19/110 and Gabriel Alfonso Gutiérrez-Rebolledo.
Conflicts of Interest: The authors declare no conflict of interest.
Sample Availability: Not available.
References1. WHO: World Health Organization. Informe Mundial Sobre la Diabetes, Resumen de Orientación. Available online:
https://apps.who.int/iris/bitstream/handle/10665/204877/WHO_NMH_NVI_16.3_spa.pdf;jsessionid=D89B7AA6513AE700A7ECC662D47C5EEE?sequence=1 (accessed on 15 August 2020).
2. IDF, Diabetes Atlas 2017, 9th Edition. Available online: https://www.diabetesatlas.org/ (accessed on 15 August 2020).3. Kidwai, S.S.; Nageen, A.; Bashir, F.; Ara, J. HbA1c—A predictor of dyslipidemia in type 2 diabetes mellitus. Pak. J. Med. Sci. 2020,
36, 1339–1343. [CrossRef] [PubMed]4. INEGI Instituto Nacional de Geografía y Estadística Comunicado de Prensa. Available online: https://www.inegi.org.mx/
contenidos/saladeprensa/boletines/2018/EstSociodemo/DEFUNCIONES2017.pdf (accessed on 15 August 2020).5. Zárate, A.; Islas, S.; Saucedo, R. Eficacia y efectos adversos de los antidiabéticos orales. Gac. Med. Mex. 2014, 150, 5–7. [PubMed]6. Tran, L.; Zielinski, A.; Roach, A.H.; Jende, J.A.; Householder, A.M.; Cole, E.E.; Atway, S.A.; Amornyard, M.; Accursi, M.L.; Shieh,
S.W.; et al. The Pharmacologic Treatment of Type 2 Diabetes: Oral Medications. Ann. Pharmacother. 2015, 119, 1–17. [CrossRef][PubMed]
7. World Health Organization (WHO). Programme on Tradicional Medicine Regulatory Situation of Herbal Medicines-A WorldwideReview; World Health Organization. 1998. Available online: http://apps.who.int/iris/handle/10665/63801 (accessed on 17August 2019).
8. Mata, R.; Cristians, S.; Escandón-Rivera, S.; Juárez-Reyes, K.; Rivero-Cruz, I. Mexican antidiabetic herbs: Valuable sources ofinhibitors of α-glucosidases. J. Nat. Prod. 2013, 76, 468–483. [CrossRef] [PubMed]
9. Escandón-Rivera, S.; Pérez-Vásquez, A.; Navarrete, A.; Hernández, M.; Linares, E.; Bye, R.; Mata, R. Anti-hyperglycemic activityof major compounds from Calea ternifolia. Molecules 2017, 22, 289. [CrossRef] [PubMed]
10. Calzada, F.; Solares-Pascasio, J.; Ordoñez-Razo, R.; Velazquez, C.; Barbosa, E.; García-Hernández, N.; Mendez-Luna, D.; Correa-Basurto, J. Antihyperglycemic activity of the leaves from Annona cherimola miller and rutin on alloxan-induced diabetic rats.Pharmacogn. Res. 2017, 9, 1. [CrossRef] [PubMed]
11. Li, K.; Yao, F.; Xue, Q.; Fan, H.; Yang, L.; Li, X.; Sun, L.; Liu, Y. Inhibitory effects against α-glucosidase and α-amylase of theflavonoids-rich extract from Scutellaria baicalensis shoots and interpretation of structure–activity relationship of its eight flavonoidsby a refined assign-score method. Chem. Cent. J. 2018, 12. [CrossRef]
12. Martínez, A.L.; Madariaga-Mazón, A.; Rivero-Cruz, I.; Bye, R.; Mata, R. Antidiabetic and Antihyperalgesic Effects of a Decoctionand Compounds from Acourtia thurberi. Planta Med. 2017, 83, 534–544. [CrossRef]
13. Chávez-Silva, F.; Cerón-Romero, L.; Arias-Durán, L.; Navarrete-Vázquez, G.; Almanza-Pérez, J.; Román-Ramos, R.; Ramírez-Ávila, G.; Perea-Arango, I.; Villalobos-Molina, R.; Estrada-Soto, S. Antidiabetic effect of Achillea millefollium through multitargetinteractions: α-glucosidases inhibition, insulin sensitization and insulin secretagogue activities. J. Ethnopharmacol. 2018, 212, 1–7.[CrossRef]
14. Salinas-Arellano, E.; Pérez-Vásquez, A.; Rivero-Cruz, I.; Torres-Colin, R.; González-Andrade, M.; Rangel-Grimaldo, M.; Mata, R.Flavonoids and Terpenoids with PTP-1B Inhibitory Properties from the Infusion of Salvia amarissima Ortega. Molecules 2020, 25,3530. [CrossRef]
15. Mata, R.; Figueroa, M.; Navarrete, A.; Rivero-Cruz, I. Chemistry and Biology of Selected Mexican Medicinal Plants. Prog. Chem.Org. Nat. Prod. 2019, 108, 1–142. [CrossRef]
16. Calzada, F.; Bautista, E.; Barbosa, E.; Salazar-Olivo, L.A.; Alvidrez-Armendáriz, E.; Yepez-Mulia, L. Antiprotozoal Activity ofSecondary Metabolites from Salvia circinata. Rev. Bras. Farmacogn. 2020, 30, 593–596. [CrossRef]
17. Calzada, F.; Bautista, E. Plants used for the treatment of diarrhoea from Mexican flora with amoebicidal and giadicidal activity,and their phytochemical constituents. J. Ethnopharmacol. 2020, 253, 112676. [CrossRef] [PubMed]

Molecules 2021, 26, 947 15 of 16
18. Kumar, V.; Sachan, R.; Rahman, M.; Sharma, K.; Al-Abbasi, F.A.; Anwar, F. Prunus amygdalus extract exert antidiabetic effect viainhibition of DPP-IV: In-silico and in-vivo approaches. J. Biomol. Struct. Dyn. 2020, 1–15. [CrossRef] [PubMed]
19. Lankatillake, C.; Huynh, T.; Dias, D.A. Understanding glycaemic control and current approaches for screening antidiabeticnatural products from evidence-based medicinal plants. Plant Methods 2019, 15, 1–35. [CrossRef]
20. Rey, D.; Miranda Sulis, P.; Alves Fernandes, T.; Gonçalves, R.; Silva Frederico, M.J.; Costa, G.M.; Aragon, M.; Ospina, L.F.; MenaBarreto Silva, F.R. Astragalin augments basal calcium influx and insulin secretion in rat pancreatic islets. Cell Calcium 2019, 80,56–62. [CrossRef]
21. Castro Juarez, C.J.; Villa Ruano, N.; Ramirez García, S.A.; Mosso Gonzalez, C. Uso medicinal de plantas antidiabéticas en ellegado etnobotánico oaxaqueño. Rev. Cuba. Plantas Med. 2014, 19, 101–120. Available online: http://scielo.sld.cu/scielo.php?script=sci_arttext&pid=S1028-47962014000100012&lng=es&tlng=es (accessed on 17 August 2020).
22. Andrade-Cetto, A.; Heinrich, M. Mexican plants with hypoglycaemic effect used in the treatment of diabetes. J. Ethnopharmacol.2005, 99, 325–348. [CrossRef]
23. López Ferrer, C.E.; Sánchez Dirzo, G.; Arrieta Baez, D.; Román García, J.H. Estudio preliminar fitoquímico y de la actividadantimicrobiana de Salvia amarissima Ort. Investig. Univ. Multidiscip. Rev. Investig. Univ. Simón Bolívar 2010, 9, 7. Available online:http://dialnet.unirioja.es/servlet/articulo?codigo=3705814&info=resumen&idioma=ENG (accessed on 17 August 2020).
24. Flores-Bocanegra, L.; González-Andrade, M.; Bye, R.; Linares, E.; Mata, R. α-Glucosidase Inhibitors from Salvia circinata. J. Nat.Prod. 2017, 80, 1584–1593. [CrossRef]
25. Bautista, E.; Fragoso-Serrano, M.; Ortiz-Pastrana, N.; Toscano, R.A.; Ortega, A. Structural elucidation and evaluation of multidrug-resistance modulatory capability of amarissinins A–C, diterpenes derived from Salvia amarissima. Fitoterapia 2016, 114, 1–6.[CrossRef]
26. Bautista, E.; Fragoso-Serrano, M.; Toscano, R.A.; García-Peña, M.D.R.; Ortega, A. Teotihuacanin, a Diterpene with an UnusualSpiro-10/6 System from Salvia amarissima with Potent Modulatory Activity of Multidrug Resistance in Cancer Cells. Org. Lett.2015, 17, 3280–3282. [CrossRef]
27. Valdés, M.; Calzada, F.; Mendieta-Wejebe, J.E.; Merlín-Lucas, V.; Velázquez, C.; Barbosa, E. Antihyperglycemic effects of Annonadiversifolia safford and its acyclic terpenoids: α-glucosidase and selective SGLT1 inhibitiors. Molecules 2020, 25, 3361. [CrossRef]
28. NOM-062-ZOO-1999. Norma Oficial Mexicana NOM-062-ZOO-1999: Especificaciones técnicas Para la Producción, Cuidado yuso de los Animales de Laboratorio. Available online: http://publico.senasica.gob.mx/?doc=743 (accessed on 15 August 2020).
29. Organisation for Economic Co-operation and Development. Test No. 423: Acute Oral toxicity-Acute Toxic Class Method. InOECD Guidelines for the Testing of Chemicals, Section 4; OECD Publishing: Paris, France, 2002. [CrossRef]
30. Porwal, M.; Khan, N.A.; Maheshwari, K.K. Evaluation of acute and subacute oral toxicity induced by ethanolic extract ofMarsdenia tenacissima leaves in experimental rats. Sci. Pharm. 2017, 85, 29. [CrossRef] [PubMed]
31. Grunberger, G. Should Side Effects Influence the Selection of Antidiabetic Therapies in Type 2 Diabetes? Curr. Diab. Rep. 2017, 17.[CrossRef]
32. Katisart, T.; Konsue, A. Acute toxicity of flower extracts from Dolichandrone serrulata in mice. Phcog. Res. 2019, 11, 230–235.Available online: https://www.phcogres.com/text.asp?2019/11/3/230/265056 (accessed on 17 August 2020). [CrossRef]
33. Diab, R.A.H.; Fares, H.; Abedi-Valugerdi, M.; Kumagai-Braesch, M.; Holgersson, J.; Hassan, M. Immunotoxicological Effects ofStreptozotocin and Alloxan: In Vitro and In Vivo Studies. Immunol. Lett. 2015, 163, 193–198. [CrossRef] [PubMed]
34. Andrade-Cetto, A.; Becerra-Jiménez, J.; Cárdenas-Vázquez, R. Alfa-glucosidase-inhibiting activity of some Mexican plants usedin the treatment of type 2 diabetes. J. Ethnopharmacol. 2008, 116, 27–32. [CrossRef] [PubMed]
35. López-Diazguerrero, N.E.; Yazmín, V.; Puertos, G.; Hernández-Bautista, R.J.; Alarcón-Aguilar, A.; Luna-López, A.; Fainstein,M.K.; Königsberg, M. Hormesis: Lo que no mata, fortalece. Gac. Med. Mex. 2013, 149, 438–447. Available online: https://www.anmm.org.mx/GMM/2013/n4/GMM_149_2013_4_438-447.pdf (accessed on 17 August 2020).
36. Calabrese, E.J.; Calabrese, V.; Giordano, J. The role of hormesis in the functional performance and protection of neural systems.Brain Circ. 2017, 3, 1–13. [CrossRef] [PubMed]
37. Ghosh, S.; Rangan, L. Molecular Docking and Inhibition Kinetics of α-glucosidase Activity by Labdane Diterpenes Isolated fromTora Seeds (Alpinia nigra B.L. Burtt.). Appl. Biochem. Biotechnol. 2014, 175, 1477–1489. [CrossRef]
38. Fragoso-serrano, M.; Ortiz-pastrana, N.; Luna-cruz, N.; Toscano, R.A.; Alpuche-Solís, A.G.; Ortega, A.; Bautista, E. Amarisolide F,an Acylated Diterpenoid Glucoside and Related Terpenoids from Salvia Amarissima. J. Nat. Prod. 2018, 82, 631–635. [CrossRef]
39. Montesino, N.L.; Schmidt, T.J. Salvia species as sources of natural products with antiprotozoal activity. Int. J. Mol. Sci. 2018, 19,264. [CrossRef] [PubMed]
40. Wu, Y.B.; Ni, Z.Y.; Shi, Q.W.; Dong, M.; Kiyota, H.; Gu, Y.C.; Cong, B. Constituents from salvia species and their biologicalactivities. Chem. Rev. 2012, 112, 5967–6026. [CrossRef] [PubMed]
41. Maldonado, E.; Cárdenas, J.; Bojórquez, H.; Escamilla, E.M.; Ortega, A. Amarisolide, a neo-clerodane diterpene glycoside fromSalvia amarissima. Phytochemistry 1996, 42, 1105–1108. [CrossRef]
42. Karakaya, S.; Gözcü, S.; Güvenalp, Z.; Özbek, H.; Yuca, H.; Dursunoglu, B.; Kazaz, C.; Kılıç, C.S. The α-amylase and α-glucosidaseinhibitory activities of the dichloromethane extracts and constituents of Ferulago bracteata roots. Pharm. Biol. 2018, 56, 18–24.[CrossRef] [PubMed]
43. Ding, H.; Hu, X.; Xu, X.; Zhang, G.; Gong, D. Inhibitory mechanism of two allosteric inhibitors, oleanolic acid and ursolic acid onα-glucosidase. Int. J. Biol. Macromol. 2018, 107, 1844–1855. [CrossRef]

Molecules 2021, 26, 947 16 of 16
44. Cogollo Carvajal, A.M.; Restrepo Múnera, L.M.; Ruiz Correa, A.M. Caracterización de diferentes cepas de células Caco-2 para suuso en ensayos de permeabilidad in vitro. Rev. Cuba. Farm. 2016, 50, 1–9. Available online: http://revfarmacia.sld.cu/index.php/far/rt/printerFriendly/38/42 (accessed on 19 August 2020).
45. Yee, S.W. In vitro permeability across Caco-2 cells (Colonic) can predict in vivo absorption in man-Fact or myth. Pharm. Res.1997, 36, 763–766. Available online: https://link.springer.com/article/10.1023/A:1012102522787 (accessed on 19 August 2020).[CrossRef]
46. Wang, X.X.; Liu, G.Y.; Yang, Y.F.; Wu, X.W.; Xu, W.; Yang, X.W. Intestinal Absorption of Triterpenoids and Flavonoids fromGlycyrrhizae radix et rhizoma in the Human Caco-2 Monolayer Cell Model. Molecules 2017, 22, 1627. [CrossRef]