Anthropometric models to predict appendicular lean soft tissue in adolescent athletes
10
Anthropometric Models to Predict Appendicular Lean Soft Tissue in Adolescent Athletes ANA L. QUITERIO 1 , ELVIS A. CARNERO', ANALIZA M. SILVA', BRIANNA C. BRIGHT 2 , and LUIS B. SARDINHA' 'Exercise and Health Laboratory, Faculty of Human Movement, Technical University of Lisbon, Lisboa, PORTUGAL; and 2 Department of Pediatrics, College of Medicine, University of Oklahoma Health Sciences Center, Oklahoma Ciiy, OK ABSTRACT QUITERIO, A. L., E. A. CARNERO, A. M. SILVA. B. C. BRIGHT, and L. B. SARDINHA. Anthropometric Models to Predict Appendicular Lean Soft Tissue in AdolescentAthletes. Med. Sci. Sports Exerc., Vol. 41, No. 4, pp. 828-836, 2009. Purpose: Skeletal muscle (SM), which is found mainly within the appendicular lean soft tissue (ALST) compartment, is a biological important body compartment. Simple.and accurate methods to estimate both SM and ALST remain difficult to obtain. We aimed to develop and to cross-validate anthropometric models for ALST in athletes, using dual-energy x-ray absorptiometry (DXA) as the reference method. Methods: ALST equations were developed in 176 athletic boys (15.0 + 2.8 yr; 64.5 + 15.8 kg; 1.72 + 0.15 n) and 92 athletic girls (14.6 ± 2.8 yr; 53.0 ± 13.1 kg; 1.61 ± 0.13 m). Skinfolds were measured at the triceps, the thigh, and medial calf, and circumferences were measured at the midupper arm, the midthigh, and the midcalf. ALST was assessed using DXA (QDR-4500; Hologic, Walthman, MA; fan-beam mode). Two models were developed: a body weight model (WHt model) and a corrected muscle girth model (CMG model, which included the parameters height x CAG 2 , height x CTG 2 , and height x CCG 2 , where CAG is corrected arm girth, CTG is corrected thigh girth, and CCG is the corrected calf). Simple regression analysis was used to identify the best model fit. The equations were internally cross-validated using the predicted residual sum of squares method, and performance of new equations was analyzed by regression analysis and agreement between methods. Results: The new WHt model generated the following equation: ALST = -20.338 + 0.199(W) + 3.294(gender) + 14.230(height) + 0.192(age), where gender = I for male and 0 for female. The CMG model produced the following equation: ALST = 3.260 + 0.002(height x CTG 2 ) + 0.007(height x CAG 2 ) + 0.003(height x CCG 2 ). WHt equation had an R2 = 0.91 and an SEE = 2.00 kg, whereas CMG equation presented an R2 = 0.93 and an SEE = 1.80 kg. In both equations, slopes and intercepts did not differ from the line of identity; no mean differences between predicted and measured values and no trend line were observed (P > 0.05). Conclusions: Both models accurately predict ALST in young athletes, affording a practical means to quantify this compartment. Key Words: SKELETAL MUSCLE, DXA, SKINFOLDS, CROSS-VALIDATION keletal muscle (SM), the largest nonadipose tissue component at the tissue level of human body composition (33), plays an importan*t role in physical activity performance and many nutritional, physiological, metabolic, and biochemical processes (15,21,33). In sports science, it is remarkable that there are no simple and inexpensive satisfactory methods for estimating the mass of the SM in athletes, whereas there is a large body of studies addressing accurate body fat estimations. Information on the physiological profile of an athlete would be improved adding valid regional and total SM measures. Additionally, Address for correspondence: Luis B. Sardinha, Ph.D., Exercise and Health Laboratory, Faculty of Human Movement, Technical University of Lisbon, Estrada da Costa, Cruz Quebrada, 1495-688, Lisboa, Portugal, E-mail: [email protected] Submitted for publication March 2008. Accepted for publication October 2008. 0195-9131/09/4104-0828/0 MEDICINE & SCIENCE IN SPORTS & EXERCISE, Copyright © 2009 by the American College of Sports Medicine DOI: 10.1249/MSS.0b013e31818ffe4b simple and accurate methods to evaluate this large and functionally important compartment, easily applied during the training routines, would enable coaches to regularly evaluate athletes and monitor the effects of different training regimes, 'maintaining the athletes with healthy weights, without a loss of lean tissue, while improving their sports performance. Despite the potential usefulness of information on the mass of the SM of the human body, accurate and practical methods to quantify SM mass are difficult to assess, costly, and involve imaging techniques, such as computed axial tomography (CT) and magnetic resonance imaging (MRI). In addition, CT method exposes the subject to radiation, which limits its application in children and adolescents (19,27). A practical alternative to assess SM is dual-energy x-ray absorptiometry (DXA) instruments, which are widely available, noninvasive, and can be easily performed in children and adolescents. Whole-body DXA systems enables investigators to identify specific regions for analysis and to separate lower and upper limbs from trunk and its masses into bone, fat, and lean soft tissue compartments (27) using DXA regional specific anatomical landmarks. 828
Transcript of Anthropometric models to predict appendicular lean soft tissue in adolescent athletes
Anthropometric Models to PredictAppendicular Lean Soft Tissue inAdolescent Athletes
ANA L. QUITERIO 1, ELVIS A. CARNERO', ANALIZA M. SILVA', BRIANNA C. BRIGHT 2, and LUIS B. SARDINHA'
'Exercise and Health Laboratory, Faculty of Human Movement, Technical University of Lisbon, Lisboa, PORTUGAL;and 2Department of Pediatrics, College of Medicine, University of Oklahoma Health Sciences Center, Oklahoma Ciiy, OK
ABSTRACT
QUITERIO, A. L., E. A. CARNERO, A. M. SILVA. B. C. BRIGHT, and L. B. SARDINHA. Anthropometric Models to PredictAppendicular Lean Soft Tissue in AdolescentAthletes. Med. Sci. Sports Exerc., Vol. 41, No. 4, pp. 828-836, 2009. Purpose: Skeletalmuscle (SM), which is found mainly within the appendicular lean soft tissue (ALST) compartment, is a biological important bodycompartment. Simple.and accurate methods to estimate both SM and ALST remain difficult to obtain. We aimed to develop and tocross-validate anthropometric models for ALST in athletes, using dual-energy x-ray absorptiometry (DXA) as the reference method.Methods: ALST equations were developed in 176 athletic boys (15.0 + 2.8 yr; 64.5 + 15.8 kg; 1.72 + 0.15 n) and 92 athletic girls (14.6 ±2.8 yr; 53.0 ± 13.1 kg; 1.61 ± 0.13 m). Skinfolds were measured at the triceps, the thigh, and medial calf, and circumferences weremeasured at the midupper arm, the midthigh, and the midcalf. ALST was assessed using DXA (QDR-4500; Hologic, Walthman, MA;fan-beam mode). Two models were developed: a body weight model (WHt model) and a corrected muscle girth model (CMG model,which included the parameters height x CAG 2, height x CTG2, and height x CCG 2, where CAG is corrected arm girth, CTG iscorrected thigh girth, and CCG is the corrected calf). Simple regression analysis was used to identify the best model fit. The equationswere internally cross-validated using the predicted residual sum of squares method, and performance of new equations was analyzed byregression analysis and agreement between methods. Results: The new WHt model generated the following equation: ALST = -20.338 +0.199(W) + 3.294(gender) + 14.230(height) + 0.192(age), where gender = I for male and 0 for female. The CMG model produced thefollowing equation: ALST = 3.260 + 0.002(height x CTG2 ) + 0.007(height x CAG2) + 0.003(height x CCG 2). WHt equation had anR2 = 0.91 and an SEE = 2.00 kg, whereas CMG equation presented an R2 = 0.93 and an SEE = 1.80 kg. In both equations, slopes andintercepts did not differ from the line of identity; no mean differences between predicted and measured values and no trend line wereobserved (P > 0.05). Conclusions: Both models accurately predict ALST in young athletes, affording a practical means to quantify thiscompartment. Key Words: SKELETAL MUSCLE, DXA, SKINFOLDS, CROSS-VALIDATION
keletal muscle (SM), the largest nonadipose tissue
component at the tissue level of human bodycomposition (33), plays an importan*t role in physical
activity performance and many nutritional, physiological,metabolic, and biochemical processes (15,21,33). In sportsscience, it is remarkable that there are no simple andinexpensive satisfactory methods for estimating the mass ofthe SM in athletes, whereas there is a large body of studiesaddressing accurate body fat estimations. Information onthe physiological profile of an athlete would be improvedadding valid regional and total SM measures. Additionally,
Address for correspondence: Luis B. Sardinha, Ph.D., Exercise and HealthLaboratory, Faculty of Human Movement, Technical University of Lisbon,Estrada da Costa, Cruz Quebrada, 1495-688, Lisboa, Portugal, E-mail:[email protected] for publication March 2008.Accepted for publication October 2008.
0195-9131/09/4104-0828/0MEDICINE & SCIENCE IN SPORTS & EXERCISE,Copyright © 2009 by the American College of Sports Medicine
DOI: 10.1249/MSS.0b013e31818ffe4b
simple and accurate methods to evaluate this large andfunctionally important compartment, easily applied duringthe training routines, would enable coaches to regularlyevaluate athletes and monitor the effects of differenttraining regimes, 'maintaining the athletes with healthyweights, without a loss of lean tissue, while improvingtheir sports performance.
Despite the potential usefulness of information on themass of the SM of the human body, accurate and practicalmethods to quantify SM mass are difficult to assess, costly,and involve imaging techniques, such as computed axialtomography (CT) and magnetic resonance imaging (MRI).In addition, CT method exposes the subject to radiation,which limits its application in children and adolescents(19,27). A practical alternative to assess SM is dual-energyx-ray absorptiometry (DXA) instruments, which are widelyavailable, noninvasive, and can be easily performed inchildren and adolescents. Whole-body DXA systemsenables investigators to identify specific regions for analysisand to separate lower and upper limbs from trunk and itsmasses into bone, fat, and lean soft tissue compartments(27) using DXA regional specific anatomical landmarks.
828
Given that lean soft tissue of the extremities is almostentirely SM, except for a small amount of skin andconnective tissues, DXA affords an opportunity to estimateappendicular SM mass through the measurements ofappendicular lean soft tissue (ALST) (34) and by summingALST measures of the extremities, that is, in both the rightand the left arms and legs. Accordingly, many authors haveproposed the use of DXA to estimate total and regional SM(8,12,16,17,32,34). Despite the great interest of studying theextremity muscle per se, the appendages account for thelarger portion (73-75%) of total body SM (12,29). Thisconcept underlies the rational for using DXA for SM massestimates.
Nevertheless, DXA is still costly and is not a portableinstrument, which limits its application in epidemiologicaland field studies. Anthropometry has been referred as apractical and an inexpensive method to estimate SM. Inyoung athletes, anthropometric measurements are easily toperform and can be widely used because minimal training isrequired to accurately assess anthropometric values. Earlystudies reported the use of anthropometric predictionmodels for quantifying SM (5,22). Both these investigationswere based on a small sample of cadavers of elderly men.Recently, Lee et al. (19) developed and cross-validatedanthropometric prediction formulas for total body SM usingMRI as the reference method in a large heterogeneoussample. The general concept is that three quarters of total-body SM exists in the extremities, and ALST is primarilySM. In addition, the model proposed by Lee et al. (19) wasbased on anthropometric dimensions, assuming that whole-body SM is conceptually in the form of a cylinder, thatskinfold (SKF)-corrected limb circumferences provides ameasure of corresponding appendicular lean tissue circum-ferences, that appendicular lean tissue circumferencessquared creates an estimate of lean tissue area, and thatthe product of summed estimated appendicular lean tissueareas and height provides a measure of total-body SM (19).Although the authors found that the designed model wasaccurate in SM mass prediction in a healthy heterogeneousadult population, its applicability in adolescent athletes isunknown.
Moreover, although sports scientists and investigatorsfrom several others disciplines have been interested in thestudy of SM compartment in athletes to improve health,fitness, and sports performance (1,18,23,26), unfortunately,to our knowledge, there are no simple, inexpensive, andnoninvasive methods for SM mass prediction in adolescentathletes, which is a gap in sports science because SM iscentral in exercise performance.
Hence, the goal of the present investigation was todevelop and cross-validate practical anthropometric modelsfor ALST in young athletes, assuming that the largerproportion of SM is in the extremities and the appendicularSM is the main contributor to ALST. Additionally, based onprevious studies (5,19,22) where the overall theme is thatwhole-body SM is in the form of a cylinder, we investigated
whether SKF thickness, circumference measurements and
stature (components of the cylinder's dimensions of the. SMmass of the human body), and also body weight would beuseful tools for accurately quantifying ALST in youngathletes.
SUBJECTS AND METHODS
Study Design
Portuguese young athletes were recruited from the
following local sports clubs through written- and/or oral
advertisements: 75 from swimming, 47 from gymnasts, 40from basketball, 38 from judo, 35 from rugby, 10 fromvolleyball, 8 from soccer, 8 from triathlon, and 7 from
handball. Each participant and one parent were informed
about the research design and procedures, with parentalconsent being obtained by signing a written consent forn'All procedures and consent forms were approved by theEthical Committee of the Faculty of Human Movement,Technical University of Lisbon, Portugal.
Subjects
A total of 176 athletic boys (15.0 ± 2.8 yr; 64.5 + 15.8 kg;1.72 ± 0.15 m; 9.4 + 6.7 h'wk-1 of training) and 92 athleticgirls (14.6 + 2.8 yr; 53.0 ± 13.1 kg; 1.61 ± 0.13 m; 11.8 +
5.2 h'wk-1 of training) participated in this investigation.The inclusion criterion for the athletes was current
participation in competitive sports at national and interna-tional levels. The athletes should take part in regularphysical training for at least two intense hours per week
and for at least 3 yr. Athletes who were taking medicationfor illness, injuries, or any kind of unnatural supplementsdid not take part of the study. In addition, we found fouramenorrheic gymnasts that were also excluded from thestudy. We did not evaluate the amenorrheic athletes to
ensure that all girls had similar hormonal conditions andbecause abnormal menstrual patterns are often associatedwith an extremely low body weight and fat content. Finally,those athletes who were in a process of gaining or losingweight also did not take part in this investigation.
Maturation
Subjects were grouped by Tanner stage, determined by
self-assessment, according to Tanner (30). A self-evaluationmethod was used to identify the degrees of development ofthe genital organs, breast, and pubic hair..
Sports Training
Hours per week of sports training (h-wk-1) were self-reported by athletes, using a specific questionnaire, devel-
oped for the study. The questionnaire included five
questions: 1) Which competitive sport do you practice?; 2)
How old were you when you started training?; 3) How
APPENDICULAR LEAN MASS IN ADOLESCENT ATHLETES Medicine & Science in Sports & Exercises .829
many days per week are you engaged on sport training?Please indicate in which days of the week do you practice;4) Are you engaged on training more than one time perday? If no, please indicate how long takes the training, ineach of the week days. If yes, please indicate which weekdays do you practice twice and how long takes eachtraining; 5) Do you usually miss training? Please indicate:often (a); some times (b); exceptionally (c),: almost never(d). Please describe the reason that makes you miss training.
Each coach also reported how many times per week didathletes take part of training and at what time were thehabitual training sessions. The coaches confirmed theanswers of each athlete at the time of the measurements orlater on the training. Training participation was alsoassessed using standard club assiduity reports, fulfilled bythe coaches, during the previous 12 months of the trainingseason. Hours per week were determined by multiplying thenumber of training sessions performed during a week byhours per training session. Modifications of usual trainingintensity and volume caused by injuries, illness, andcompetition were noted and accounted for in the finalcalculation.
Assessment of Body Composition
Body composition measurements were performed on thesame day, during a visit to the study laboratory, over a4-h period. The measurements were performed by thesame technician in standardized conditions. Subjects wereasked to fast from the previous evening and also to avoidmoderate-to-vigorous exercise training intensity from theprevious 24 h.
Anthropometric measures. Anthropometric measure-ments were performed using standardized procedures. Themeasurements were performed by a highly trained techni-cian in standardized conditions.
Body weight was measured twice using an electronicscale (SECA model 770, Hamburg, Germany) to the nearest0.1 kg, with the average used as their weight. Stature wasalso measured twice, without shoes, to the nearest 0.1 cmwith the average used as their height.
Skinfolds (SKF) were measured three times to the nearest0.1 mm and averaged for analysis. All SKF measurementswere made on the right site of the body, at appropriatelymarked sites, using a Lange caliper (Cambridge Scientific,Cambridge, MD). SKF were measured at the triceps, thethigh, and the medial calf according to the standardizedanatomic locations and methods (20). On the basis of test-retest using 10 subjects, the technical error of measurements(TEM) for triceps, thigh, and medial calf SKF measure-ments were 0.39, 0.47, and 0.39 mm, respectively, accord-ing to the following equation: (Id2 / 2n) 2 , where d standsfor the difference between repeated measurements, and n isthe number of paired repeated measurements. The intraclasscoefficient of correlation (ICC) for triceps, thigh, andmedial calf SKF were 0.997, 0.994, and 0.996, respectively.
Circumference measurements were made in the planeorthogonal, according to the standardized procedures (20).Circumferences were measured at the midupper arm, themidthigh, and the midcalf three times and averaged foranalysis. On the basis of test-retest using 10 subjects, theTEM for the midupper arm, the midthigh, and the midcalfcircumference measurements were 0.04, 0.35, and 0.27 cm,respectively.- The ICC were 1.000, 0.998, and 0.995,respectively.
Each limb circumference (Climb) was corrected forsubcutaneous adipose tissue thickness, according to Leeet al. (19). The corrected muscle circumferences (Cm) werecalculated as Cm = Climb -- TS, where S stands for the SKFcaliper measurement, which is assumed to be twice thesubcutaneous adipose tissue thickness.
DXA. Whole-body and regional body composition wereestimated by using DXA (QDR-4500; Hologic, Walthman,MA; fan-beam mode). After completion the scans, thesystem provided the total and the regional body composi-tion results of fat-free soft tissue, body fat, and bone mineralcontent (BMC). The DXA system software first dividespixels into bone mineral and soft tissue compartments. Softtissue is then further separated into lean soft tissue and fat(25). Appendicular lean soft tissue (ALST) mass wasconsidered as the sum of lean soft tissue in both left andright arms and legs. The same laboratory technicianpositioned the subjects, performed the scans, and executedthe analyses using the standard protocol. On the basis oftest-retest using 10 subjects, the TEM and the coefficient ofvariation for BMC in our laboratory were 0.02 kg and 1.6%,respectively.
Statistical Analysis
Descriptive results are expressed in terms of groupmeans + SD, and between-gender differences were exploredby using Student's t-test.
Two anthropometric prediction models were prepared: abody weight model (WHt model) and a corrected musclegirth model (CMG model). First, we select age, gender,maturation, body weight, and height as the independentvariables (WHt equation). We develop a model based onbody weight and height, without corrected muscle girthsparameters, because it enables these measures, which arewidely used and easily to perform without specifictechnician training, to predict ALST. In the second model(CMG equation), each limb circumference corrected forsubcutaneous adipose tissue thickness was added, alongwith age, gender, and maturation. For dimensional consis-tency, corrected muscle circumferences were squared andmultiplied by height so that each term of the equation tookthe form of a length cubed, providing a measure of totalmuscle area and regional variation in SM mass anddistribution area (19,22): height x CAG2; height x CTG 2;height x CCG2 , where CAG is corrected arm girth, CTG iscorrected tight girth, and CCG is corrected calf girth.
830. Official Journal of the American College of Sports Medicine
p.-
a
http://www.acsm-msse.org
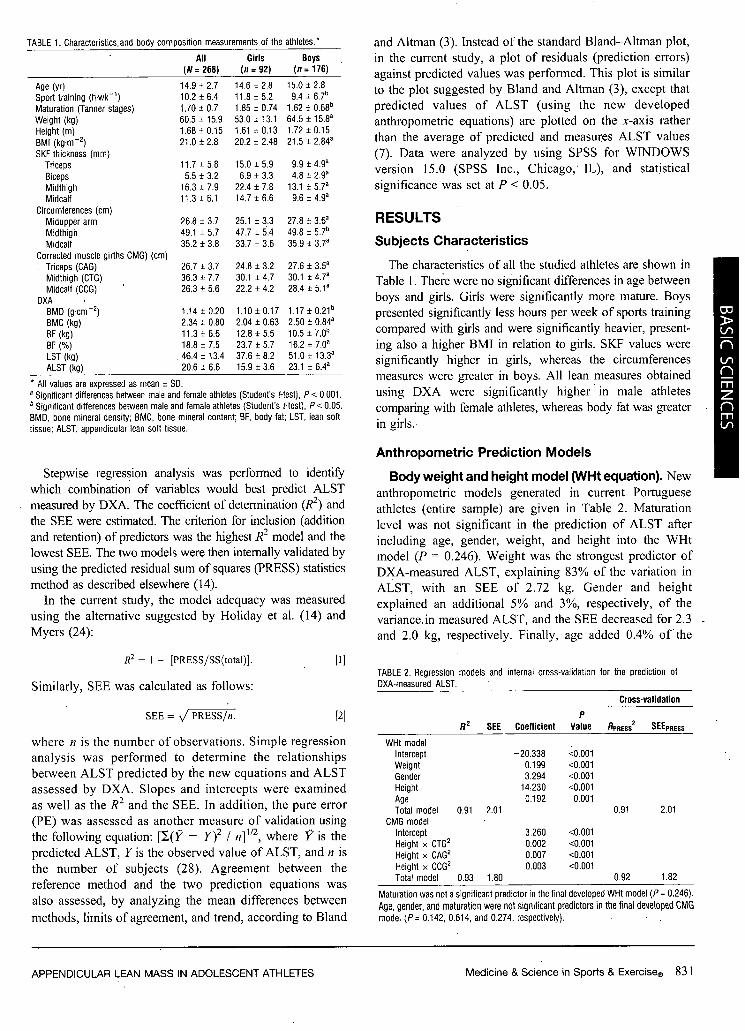
TABLE 1. Characteristics.and body composition measurements of the athletes.*
All(N = 268)
Girls(n = 92)
Boys(n = 176)
Age (yr) 14.9 ± 2.7 14.6 ± 2.8 15.0 ± 2.8Sport training (h.wk-1) 10.2 ± 6.4 11.8 ± 5.2 9.4 ± 6.7'Maturation (Tanner stages) 1.70 + 0.7 1.85 ± 0.74 1.62 ± 0.68bWeight (kg) 60.5 ± 15.9 53.0 ± 13.1 64.5 ± 15.8aHeight (m) 1.68 ± 0.15 1.61 ± 0.13 1.72 ± 0.15BMI (kg.m -2) 21.0 ± 2.8 20.2 ± 2.48 21.5 ± 2.840SKF thickness (mm)
Triceps 11.7 ± 5.8 15.0 ± 5.9 9.9 ± 4.9a
Biceps 5.5 + 3.2 6.9 ± 3.3 4.8 ± 2.9YMidthigh 16.3 ± 7.9 22.4 ± 7.8 13.1 ± 5.7aMidcalf 11.3 ± 6.1 14.7 ± 6.6 9.6 ± 4.91
Circumferences (cm)Midupper arm 26.8 ± 3.7 25.1 + 3.3 27.8 ± 3.6a
Midthigh 49.1 ± 5.7 47.7 ± 5.4 49.8 ± 5.7b
Midcalf 35.2 ± 3.8 33.7 ± 3.6 35.9 ± 37a
Corrected muscle girths CMG) (cm)Triceps (CAG) 26.7 ± 3.7 24.8 ± 3.2 27.6 ± 3.5a
Midthigh (CTG) 36.3 ± 7.7 30.1 ± 4.7 30.1 ± 4.7Midcalf (CCG) 26.3 ± 5.6 22.2 ± 4.2 28.4 ± 5.1a
DXABMD (g-cm -2) 1.14 + 0.20 1.10 ± 0.17 1.17 ± 0.21'BMC (kg) 2.34 ± 0.80 2.04 ± 0.63 2.50 ± 0.84a
BF (kg) 11.3 ± 6.6 12.8 ± 5.5 10.5 ± 7.0b
BF (%) 18.8 ± 7.5 23.7 ± 5.7 16.2 ± 7.0aLST (kg) 46.4 ± 13.4 37.6 ± 8.2 51.0 ± 13.33ALST (kg) 20.6 ± 6.6 15.9 ± 3.6 23.1 ± 6.4a
* All values are expressed as mean ± SD.
Significant differences between male and female athletes (Student's t-test), P < 0.001.Significant differences between male and female athletes (Student's t-test), P < 0.05.
BMD, bone mineral density; BMC, bone mineral content; BF, body fat; LST, lean softtissue; ALST, appendicular lean soft tissue.
Stepwise regression analysis was performed to identifywhich combination of variables would best predict ALST
measured by DXA. The coefficient of determination (RJ2) andthe SEE were estimated. The criterion for inclusion (addition
and retention) of predictors was the highest R2 model and thelowest SEE. The two models were then internally validated by
using the predicted residual sum of squares (PRESS) statisticsmethod as described elsewhere (14).
In the current study, the model adequacy was measured
using the alternative suggested by Holiday et al. (14) andMyers (24):
R2
= I - [PRESS/SS(total)].
Similarly, SEE was calculated as follows:
SEE PRESS/n.
Ill
[2]
where n is the number of observations. Simple regressionanalysis was performed to determine the relationships
between ALST predicted by the new equations and ALSTassessed by DXA. Slopes and intercepts were examined
as well as the R2 and the SEE. In addition, the pure error(PE) was assessed as another measure of validation using
the following equation: [Y(V1 - y)2 / n]112, where V' is the
predicted ALST, Y is the observed value of ALST, and n isthe number of subjects (28). Agreement between thereference method and the two prediction equations was
also assessed, by analyzing the mean differences between
methods, limits of agreement, and trend, according to Bland
Maturation was not a significant predictor in the final developed WHit model (P = 0.246).Age, gender, and maturation were not significant predictors in the final developed CMGmodel (P= 0.142, 0.614, and 0.274, respectively).
APPENDICULAR LEAN MASS IN ADOLESCENT ATHLETES
and Altman (3). Instead of the standard Bland-Altman plot,in the current study, a plot of residuals (prediction errors)against predicted values was performed. This plot is similar
to the plot suggested by Bland and Altman (3), except thatpredicted values of ALST (using the new developedanthropornetric equations) are plotted on the x-axis ratherthan the average of predicted and measures ALST values(7). Data were analyzed by using SPSS for WINDOWSversion 15.0 (SPSS Inc., Chicago, IL), and statistical
significance was set at P < 0.05.
RESULTS
Subjects Characteristics
The characteristics of all the studied athletes are shown inTable 1. There were no significant differences in age between
boys and girls. Girls were significantly more mature. Boyspresented significantly less hours per week of sports training
compared with girls and were significantly heavier, present-ing also a higher BMI in relation to girls. SKF values weresignificantly higher in girls, whereas the circumferencesmeasures were greater in boys. All lean measures obtained
using DXA were significantly higher in male athletescomparing with female athletes, whereas body fat was greaterin girls.
Anthropometric Prediction Models
Body weight and height model (WHt equation). Newanthropometric models generated in current Portugueseathletes (entire sample) are given in Table 2. Maturationlevel was not significant in the prediction of ALST after
including age, gender, weight, and height into the WHtmodel (P = 0.246). Weight was the strongest predictor of
DXA-measured ALST, explaining 83% of the variation inALST, with an SEE of 2.72 kg. Gender and height
explained an additional 5% and 3%, respectively, of the
variance. in measured ALST, and the SEE decreased for 2.3
and 2.0 kg, respectively. Finally, age added 0.4% ofthe
TABLE 2. Regression models and internal cross-validation for the prediction of
DXA-measured ALST.
Cross-validation
PR
2 SEE Coefficient Value RPRESS2
SEEPRESS
WHt modelIntercept -20.338 <0.001Weight 0.199 <0.001Gender 3.294 <0.001Height 14.230 <0.001Age 0.192 0.001Total model 0.91 2.01 0.91 2.01
CMG modelIntercept 3.260 <0.001Height x CTG2 0.002 <0.001Height x CAG2 0.007 <0.001Height x COG2 0.003 <0.001Total model 0.93 1.80 0.92 1.82
Medicine & Science in Sports & Exercisee 831
variation in ALST, with the final equation accounting for91% of the variability of ALST (R2 = 0.91; SEE = 2.0 kg;P < 0.05). The slope of gender had a clinically meaningful(b = 3.294) because it indicates that for a given weight,male athletes had approximately more 3.3 kg of ALSTcomparing with female athletes.
The selected prediction equation based on weight andheight was (Table 2):
ALST = -20.388 + 0.199 (W) + 3.294 (gender) + 14.230 (Ht)+ 0.192 (age), [3]
where gender = I for male athletes and 0 for femaleathletes, W is weight (kg), Ht is height (in), and age is inyears.
Corrected muscle girth model (CMG equation). Age,gender, or maturation level were not significant in predictingDXA-measured ALST after including CMG parametersinto the model (P = 0.142, 0.614, and 0.274, respectively).The results obtained in stepwise regression analysis indicatethat all the three corrected limb circumferences (CTG,CAG, and CCG) explained 86% of the variance in ALST,with an SEE of 2.43 kg (data not shown). However, thestronger predictors of ALST were the square of eachcorrected limb circumferences multiplied by height. Theparameter height x CTG2 explained 84% of the variation inALST, with an SEE of 2.63 kg. Height x CAG 2 and heightx CCG 2 explained an additional 6% and 2% of thevariability in ALST, with SEE of 2.04 and 1.80 kg,respectively (P < 0.001; Table 2). Considering the strongerpredictors, that is, the square of all the corrected musclesgirths multiplied by height, the selected equation was thendeveloped (Table 2):
ALST =3.260 + 0.002 (Ht x CTG2 ) + 0.007 (Ht x CAG 2
+ (Ht x CCG2), -[4]
where CTG is corrected thigh girth, CAG is corrected armgirth, and CCG is corrected calf girth.
Cross-Validation of New GeneratedAnthropometric Models-
The developed models were validated by using thePRESS statistics method. The accuracy of the two devel-oped anthropometric prediction equations is illustrated inTable 2. Considering the new developed anthropometricmodels, the high R2 and the low SEE observed after usingthe PRESS statistic method indicate an excellent accuracyfor both methods, although CMG model presented a higherR2 and a lower SEE than the model based on weight andheight (R12 = 0.92 vs 0.91; SEE = 1.82 vs 2.01 kg,respectively).
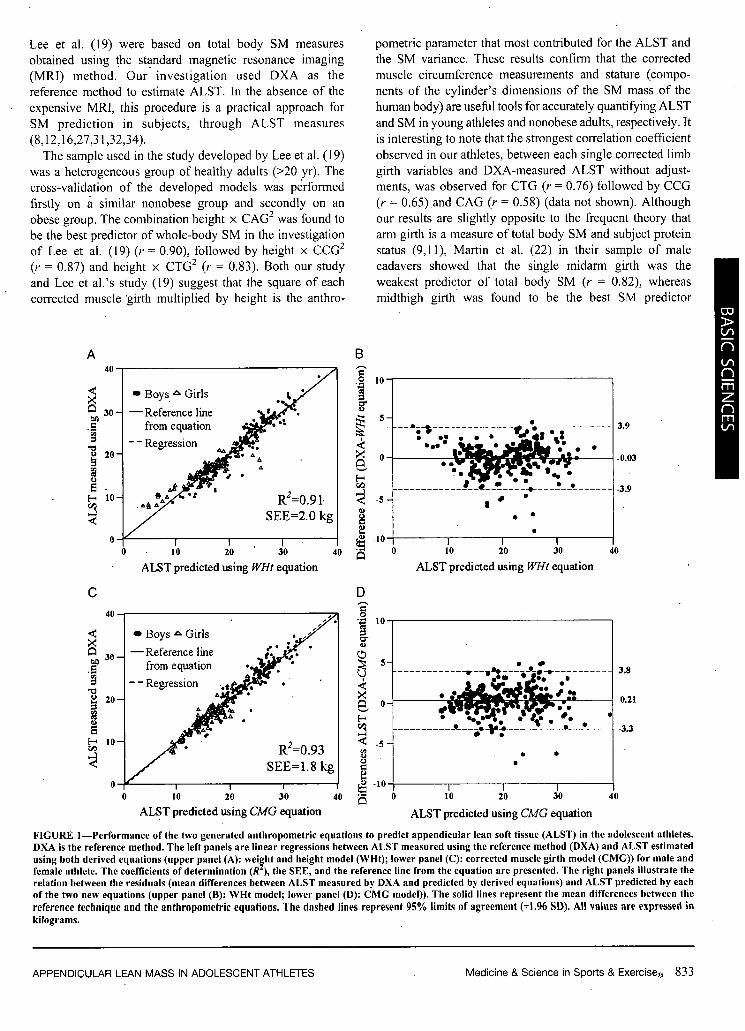
Regression analysis between predicted and measuredALST showed that WHt equation had an R2 of 0.91 andan SEE of 2.00 kg (Fig. IA), whereas CMG equation wasstrongly, correlated with DXA-measured ALST and the
resulting regression equation had an R2 of 0.93 and a lowerSEE of 1.80 kg (Fig. IC). In both equations, slopes andintercepts did not differ from the line of identity becauseslopes were not significantly different from 1 and interceptswere not significantly different from 0 (P > 0.05). Inaddition, the PE for ALST predicted using CMG equationwas lower than using WHt model (0.34 vs 1.42 kg,respectively). The relation between residuals and predictedALST values is illustrated in Figure IB and D. Nosignificant mean differences between predicted and mea-sured values and small limits of agreement were found(bias ± 1.96 SD = -0.03 ± 3.90 kg, P - 0.057; and bias +1.96 SD = 0.21 + 3.55 kg, P = 0.822, using the WHt and theCMG equations, respectively). As shown in Figure lB andD, the spread of prediction error was consistent across therange of predicted ALST using both the new developedequations, and no significant trend line was observed(r = -0.003, P = 0.958; and r = 0.093, P - 0.130, usingWHt and CMG equations, respectively).
DISCUSSION
The primary aim of the present investigation was todevelop two anthropometric models to predict ALST inathletes based on DXA-ALST as the reference method. Thefirst model is a simple and a rapid weight and height model,using also gender and age as predictive factors. The secondmodel is based on anthropometric dimensions of limbgirths. Both new anthropometric models showed to bevalid, nonbiased, and to accurately predict ALST becausehigh coefficients of determination were obtained, the slopesand intercepts of the regressions did not differ from the lineof identity, no significant mean differences betweenpredicted and measured ALST were observed, small limitsof agreement were found, and the relation between residualsand predicted ALST from derived equations showed nosignificant trend line. In addition, both equations werefound to have high values of RPRESS2 and low SEEPRESS, inparticular the CMG equation (0.92 and 1.82 kg, respec-tively). The PRESS method avoids data splitting, and thus alarge number of subjects were used to develop and cross-validate the new anthropometric equations. It is establishedthat, in generally, PRESS statistics generates less confidentestimates of an equation's potential (14), which underscoresthe accuracy of our prediction equations.
To our knowledge, this is the first study aimed to developand cross-validate anthropometric equations for ALSTbased on DXA instrument in young athletes.
The current investigation was based on earlier reports(5,22) and extends the study developed by Lee et al. (19),which was designed with the underlying concept thatwhole-body SM is in the form of a cylinder and thecombination of SKF thickness, circumference values, andstature can be used to obtain the cylinder's dimensions ofbody. The previous anthropometric models purposed by
832 Official Journal of the American College of Sports Medicine hftp://www.acsm-msse.org
Lee et al. (19) were based on total body SM measuresobtained using the standard magnetic resonance imaging(MRI) method. Our investigation used DXA as thereference method to estimate ALST. In the absence of theexpensive MRI, this procedure is a practical approach forSM prediction in subjects, through ALST measures(8,12,16,27,31,32,34).
The sample used in the study developed by Lee et al. (19)was a heterogeneous group of healthy adults (>20 yr). Thecross-validation of the developed models was performedfirstly on a similar nonobese group and secondly on anobese group. The combination height x CAG 2 was found tobe the best predictor of whole-body SM in the investigationof Lee et al. (19) (r = 0.90), followed by height x CCG2
(r = 0.87) and height x CTG 2 (r = 0.83). Both our studyand Lee et al.'s study (19) suggest that the square of eachcorrected muscle 'girth multiplied by height is the anthro-
A
At
0
ALST predicted using WHt equation
C
SD
, R2=0.93SEE=1.8 kg
10 20 30 . 4
ALST predicted using CMG equation.0
pometric parameter that most contributed for the ALST andthe SM variance. These results confirm that the correctedmuscle circumference measurements and stature (compo-nents of the cylinder's dimensions of the SM mass of thehuman body) are useful tools for accurately quantifying ALSTand SM in young athletes and nonobese adults, respectively. Itis interesting to note that the strongest correlation coefficientobserved in our athletes, between each single corrected limbgirth variables and DXA-measured ALST without adjust-ments, was observed for CTG (r = 0.76) followed by CCG(r = 0.65) and CAG (r = 0.58) (data not shown). Although
our results are slightly opposite to the frequent theory thatarm girth is a measure of total body SM and subject proteinstatus (9,11), Martin et al. (22) in their sample of male
cadavers showed that the single midarm girth was theweakest predictor of total body SM (r = 0.82), whereasmidthigh girth was found to be the best SM predictor
B
D
U
E"I-
C)
.D
ALST predicted using WHt equation
10 20 30
ALST predicted using CMG equation
3.8
0.21
-3.3
FIGURE 1-Performance of the two generated anthropometric equations to predict appendicular lean soft tissue (ALST) in the adolescent athletes.DXA is the reference method. The left panels are linear regressions between ALST measured using the reference method (DXA) and ALST estimated
using both derived equations (upper panel (A): weight and height model (WHt); lower panel (C): corrected muscle girth model (CMG)) for male andfemale athlete. The coefficients of determination (R ), the SEE, and the reference line from the equation are presented. The right panels illustrate therelation between the residuals (mean differences between ALST measured by DXA and predicted by derived equations) and ALST predicted by eachof the two new equations (upper panel (B): WHt model; lower panel (D): CMG model)). The solid lines represent the mean differences between the
reference technique and the anthropometric equations. The dashed lines represent 95% limits of agreement (+1.96 SD). All values are expressed in
kilograms.
APPENDICULAR LEAN MASS IN ADOLESCENT ATHLETES Medicine & Science in Sports & Exerciseq 833
(r = 0.94), followed by the calf-girth (r = 0.84), which is inaccordance with our results (22). In the present study, wedid not included the forearm measure, as Martin et al. (22)did, because it was suggested that, nowadays, forearm valueis an atypical measurement and the single midarm girthshould be used (10,19).
Even considering the simplistic and empirical assumptionthat the human body is in the form of a cylinder andconsequently, including the respective parameters to con-struct the corrected muscle girths model, after the cross-validation stage, our results suggest that using thesedimensional measures provides an excellent and nonbiasedmethod to accurately predict ALST in athletes (R = 0.93,SEE = 1.80 kg). This approach was also demonstrated toaccurately predict SM in nonobese adults (R2 = 0.89, SEE =2.5 kg) and to a less extend in obese subjects (R 2 = 0.83,SEE = 2.9 kg) (19).
Regarding our first developed model, based on the simplemeasures of body weight and height, after performing astepwise regression analysis, we found body mass to be thestrongest ALST predictor, explaining 83% of the variancein ALST. Overall, the final model included weight, gender,height, and age and presented an R2 = 0.91 with a low SEEof 2.01 kg. Lee et al. (19) also developed a model based onbody weight and height values, including age and gender.aspredictor variables, demonstrating, however, lower accura-cy in their two cross-validation stages in nonobese andobese adults comparing with our athlete's model (19). Ourfindings indicate that with easy anthropometric measures,such as body mass and stature, ALST is able to beaccurately predicted in adolescents, with low individualvariability. Additionally, our results showed a weaksignificant association between ALST and maturation levelbefore adjustments (R2
- 0.17, P < 0.0001; data not shown).Nevertheless, we observed that the Tanner stages failed tocontribute significantly to the final developed anthropomet-ric models, after the addition of body weight, height, andCMG interaction terms (P = 0.246 and 0.274 for WHt andCMG models, respectively). The strong contribution- ofbody mass and CMG interaction terms for the prediction ofALST may have left little variance of ALST to be explainedby maturation level. Moreover, the young athletes used inthe current investigation presented a similar maturationlevel (mean Tanner stage = 1.7 + 0.7), which also may havecontributed to the weak effect of maturity on ALSTvariance. Kim et al. (16) also demonstrated that the Tannerstages did not enter into the final SM-developed model afterincluding ALST, body weight, and interaction of heightwith ALST.
Anthropometry has been widely used in field andepidemiological studies because it is simple to perform,inexpensive and noninvasive, and also despite theimportance of the SM mass in the human bodymetabolism, few studies have been conducted to devel-oped and to cross-validate anthropometric models topredict SM or ALST. We are aware of two anthropo-
metric approaches to estimate muscle mass in adults(10,19). Unfortunately, data reporting SM estimates inchildren, adolescents, and young athletes are lacking.Kim et al. (16) developed and cross-validated a whole-body DXA SM equation for children based on the referenceMRI technique. First, this author tested the validity of aprevious adult DXA SM model (17) in a sample of pediatricsubjects, concluding that the previous adult model was validin children and adolescents who were at the final Tannerstage 5, but below this stage, there was an overestimation ofSM in the pediatric sample. The recent pediatric DXA-prediction models developed by Kim et al. (16) showed toaccurately predict SM (R2 = 0.98-0.99, SEE = 0.6-0.5 kg).Two important issues from the previous investigations,based on DXA and MRI measurements, shall be consideredin our study of young athletes: first, children and adoles-cents below Tanner stage 5 are likely to present a smallerportion of total-body SM relative to ALST (ratio SM/ALST -
1.01) compared with the adult group (ratio SM/ALST =1.11); and second, ALST measured by using DXAexplained per se 98.2% of the variance in MRI-measuredSM (16). These observations are relevant because we usedDXA to estimate ALST, assuming that the greatestportion of ALST is mainly SM and that the largestportion of the total SM is within the limbs segments(appendicular SM), as it was previously reported (13,28).The high correlation found between ALST assessed byDXA and SM determined by using the standard MRI in apediatric sample confirms these assumptions in children andadolescents (16), although it seems that the intrinsicportions of the three SM measures are likely to changefrom the assumed stable relations, with growth andmaturation processes.
Anthropometric approaches in athletes have been widelyused (2,4,6,7,35), but lack of information regarding accurateanthropometric methods to predict ALST in these popula-tion is available. This is an important handicap in the sportsscience and human body composition fields because SM isfundamental for movement and consequently for exerciseperformance (21).
Our new anthropometric models provide simple andaccurate methods for ALST prediction in young athletes,with the underlying concept that the greatest portion ofALST is SM. The parameters used in the current investi-gation and their inherent assumptions need, however, to becritically tested in similar athletic populations.
Study Limitations
Although we achieved sufficient diverse athletic popula-tion, mainly because we avoid splitting data for the cross-validation procedure, the race effect was not tested in thecurrent investigation.
The square of each corrected muscle girths multiplied byheight is the anthropometric parameter based on theconceptual assumption that the human body is in the form
834 Official Journal of the American College of Sports Medicine hfttp://www.acsm-msse.org
of a cylinder. These measures showed to accurately predictALST, although the human anatomic assumption used tobuild this empirical model tends to oversimplify the humananatomy.
Finally, we used DXA system (and measured ALST) asthe reference method instead of MRI or CT (and measuredSM) to developed anthropometric models.
CONCLUSIONS
In summary, two new anthropometric models weredeveloped for children and adolescent athletes and werecross-validated to ensure its applicability in similar samples.The first model is based on simple body weight and heightmeasures, and the second model uses dimensional param-eters based on SKF and limb circumferences (correctedmuscle girths). Both anthropometric models showed to
REFERENCES
1. Andreoli A, Monteleone M, Van Loan M, Promenzio L, TarantinoU, De Lorenzo A. Effects of different sports on bone density andmuscle mass in highly trained athletes. Med Sci Sports Exerc.2001;33(4):507-11.
2. Bertini 1, Pujia A, Giampietro M. A follow-up study of thevariations in the body composition of karate athletes. ActaDiabetol. 2003;40(Suppl 1):St42-4.
3. Bland JM, Altman DG. Statistical methods for assessing agree-ment between two methods of clinical measurement. Lancet.1986;1:307-10.
4. Damsgaard R, Bencke J, Matthiesen G, Petersen JH, Muller J.Body proportions, body composition and pubertal development ofchildren in competitive sports. Scand J Med Sci Sports. 2001;11:54-60.
5. Doupe MB, Martin AD, Searle MS, Kriellaars DJ, GiesbrechtGG. A new formula for population-based estimation ofwhole body muscle mass in males. Can J Appl Physiol. 1997;22:598-608.
6. Duthie GM, Pyne DB, Hopkins WG, Livingstone S, Hooper SL.Anthropometry profiles of elite rugby players: quantifyingchanges in lean mass. Br J Sports Med. 2006;40:202-7.
7. Evans EM, Rowe DA, Misic MM, Prior BM, Amgrimsson SA.Skinfold prediction equation for athletes developed using a four-component model. Med Sci Sports Exerc. 2005;37(11):2006-11.
8. Fuller NJ, Laskey MA, Elia M. Assessment of the composition ofmajor body regions by dual-energy x-ray absorptiometry (DEXA),with special reference to limb muscle mass. Clin Physiol. 1992;12:253-66.
9. Gurney JM, Jelliffe DB. Arm anthropometry in nutritionalassessment: nomogram for rapid calculation of muscle circumfer-ence and cross-sectional muscle and fat areas. Am J Clin Nutr.1973;26:912-5.
10. Heymsfield SB, McManus C, Smith J, Stevens V, Nixon DW.Anthropometric measurement of muscle mass: revised equationsfor calculating bone-free arm muscle area. Am J Clin Nutr. 1982;36:680-90.
11. Heymsfield SB, McManus C, Stevens V, Smith J. Muscle mass:reliable indicator of protein-energy malnutrition severity andoutcome. Am J Clin Nutr. 1982;35:1192-9.
12. Heymsfield SB, Smith R, Aulet M, et al. Appendicular skeletalmuscle mass: measurement by dual-photon absorptiometry. Am JClin Nutr. 1990;52:214-8.
accurately predict DXA-measured ALST at a group basisand also at an individual basis because high correlationcoefficients were found between predicted and measuredmeans and low limits of agreement were also observed,with no mean differences between predicted and measuredvalues. These new generated equations afford a practical
means to quantify ALST in young athletes. Additionalvalidation studies are needed to critically validate thesemodels in similar samples within an exercise and sportstraining context.
The authors gratefully acknowledge the effort of the participants,their parents, and coaches, without whom this study would not havebeen possible. This research was supported by the PortugueseScience and Technology Foundation.
The results of the present study do not constitute endorsementby the American College of Sports Medicine.
13. Heymsfield SB, Wang Z, Baumgartner RN, Ross R. Human bodycomposition: advances in models and methods. Annu Rev Nutr.1997;17:527-58.
14. Holiday DB, Ballard JE, McKeown BC. PRESS-related statistics:regression tools for cross-validation and case diagnostics. Med SciSports Exerc. 1995;27(4):612-20.
15. Janssen I, Heymsfield SB, Wang ZM, Ross R. Skeletal musclemass and distribution in 468 men and women aged 18-88 yr.JAppl Physiol. 2000;89:81-8.
16. Kim J, Shen W, Gallagher D, et al. Total-body skeletal musclemass: estimation by dual-energy x-ray absorptiometry in childrenand adolescents. Am J Clin Nutr. 2006;84:1014-20.
17. Kim J, Wang Z, Heymsfield SB, Baumgartner RN, Gallagher D.Total-body skeletal muscle mass: estimation by a new dual-energyx-ray absorptiometry method. Am J Clin Nutr. 2002;76:378-83.
18. Kubo J, Chishaki T, Nakamura N, et al. Differences in fat-freemass and muscle thicknesses at various sites according to.performance level among judo athletes. J Strength Cond Res.2006;20:654-7.
19. Lee RC, Wang Z, Heo M, Ross R, Janssen 1, Heymsfield SB.Total-body skeletal muscle mass: development and cross-valida-tion of anthropometric prediction models. Am J Clin Nutr. 2000;72:796-803.
20. Lohman TG, Roche AF, Martorell R. Anthropometric Standard-ization Reference Manual. Champaign: Human Kintetics; 1988.p. 125-9.
21. Lukaski HC. Measurement of muscle mass. In: Roche AF,Heymsfield SB, Lohman TG, editors. Human Body Composition:Methods and Findings. Champaign: Human Kinetics; 1996.p. 217-56.
22. Martin AD, Spenst LF, Drinkwater DT, Clarys JP. Anthropomet-ric estimation of muscle mass in men. Med Sci Sports Exerc.1990;22(5):729-33.
23. Midorikawa T, Sekiguchi 0, Beckley MD, Bemben MG, Abe T.A comparison of organ-tissue level body composition betweencollege-age male athletes and nonathletes. Int J Sports Med.2007;28:100-5.
24. Myers RH. Classical and Modern Regression with Applications.Boston: Duxbury Press; 1986. p. 100-66.
25. Pietrobelli A, Formica C, Wang Z, Heymsfield SB. Dual-energy
x-ray absorptiometry body composition model: review of physicalconcepts. Am J Physiol. 1996;27 I:E941-51.
APPENDICULAR LEAN MASS IN ADOLESCENT ATHLETES Medicine & Science in Sports & Exercisee 835
26. Prior BM, Modlesky CM, Evans EM, et a]. Muscularity and thedensity of the fat-free mass in athletes. J Appl Physiol. 2001;90:1523-31.
27. Shih R, Wang Z, Heo M, Wang W, Heymsfield SB. Lower limbskeletal muscle mass: development of dual-energy x-ray absorpti-ometry prediction model. J Appl Physiol. 2000;89:1380-6.
28. Sun SS, Chumlea C. Statistical methods. In: Heymsfield SB,Lohman TG, Wang Z, Going S, editors. Human Body Composi-tion. Champaign: Human Kinetics; 2005. p. 151-60.
29. Snyder WS, Cook MJ, Nasset ES, Karhansen LR, Howells GP,Tipton IH. Report of the Task Group on Reference Men. Oxford(UK): Pergamon Press; 1975. p. 108-12.
30. Tanner JM. Growth and Adolescence. Oxford (UK): BlackwellScientific. 1962. p. 28-39.
31. Visser M, Fuerst T, Lang T, Salamone L, Harris TB. Validity offan-beam dual-energy x-ray absorptiometry for measuring fat-free
mass and leg muscle mass. Health, Aging, and Body CompositionStudy-Dual-Energy X-ray Absorptiometry and Body Composi-tion Working Group. J Appl Physiol. 1999;87:1513-20.
32. Wang W, Wang Z, Faith MS, Kotler D, Shih R, Heymsfield SB.Regional skeletal muscle measurement: evaluation of new dual-energy x-ray absorptiometry model. J Appl Physiol. 1999;87:1163-71.
33. Wang ZM, Pierson Jr RN, Heymsfield SB. The five-level model:a new approach to organizing body-composition research. Am JClin Nutr. 1992;56:19-28.
34. Wang ZM, Visser M, Ma R, et al. Skeletal muscle mass:evaluation of neutron activation and dual-energy x-ray absorpti-ometry methods. J App? Physiol. 1996;80:824-31.
35. Warner ER, Fornetti WC, Jallo JJ, Pivamik JM. A skinfold modelto predict fat-free mass in female athletes. JAthI Train. 2004;39:259-62.
836 Official Journal of the American College of Sports Medicine htt p://www.acsm-msse.org
COPYRIGHT INFORMATION
TITLE: Anthropometric Models to Predict Appendicular LeanSoft Tissue in Adolescent Athletes
SOURCE: Med Sci Sports Exercise 41 no4 Ap 2009
The magazine publisher is the copyright holder of this article and itis reproduced with permission. Further reproduction of this article inviolation of the copyright is prohibited.