Anthropogenic transformation of the Bytom area relief in the period of 1883-1994
8
Environmental & Socio-economic Studies Environmental & Socio-economic Studies ______________________________________________________________________________________ 2013, 1, 1: 1-8 Anthropogenic transformations of the Bytom area relief in the period of 1883-1994 Maksymilian Solarski Department of Physical Geography, Faculty of Earth Sciences, University of Silesia, Będzińska Str. 60, 41-200 Sosnowiec, Poland, E–mail address: [email protected] _________________________________________________________________________________________________________________________________________________________________________________________ ABSTRACT In this article an attempt was made to analyse the Bytom city relief changes in 1883-1994 years. It concentrates on the forms which are an effect of the mining and metallurgical activity such as subsidence depressions and dumps. Two digital relief models representing a topographic situation in year 1883 and 1994 were made by the Vertical Mapper tool in order to determine changes in the relief. The models were made by linear vectorization of contour lines, which then were processed into points. The made points were interpolated by the natural neighbour method. Maps of slopes, area profiles, contour line sketches and hypsographic curves were generated for two time periods on basis of the digital relief models. An area and values of subsidence for areas subjected to the mining activity, changes of the slopes, an average land altitude in 1883 and 1994 year were determined and an anthropogenic denudation ratio was also calculated. As the result of the research made, it has been established that the area of the subsidence is 3727 ha (about 54% of the city area) and the maximum value of subsidence is about 37 meters, there was a growth of the slopes at a simultaneous drop of the land average altitude, and the anthropogenic denudation ratio is 44 mm/year (800 greater than the natural denudation ratio). KEY WORDS: anthropogenic denudation, subsidence basins, coal mining, Upper Silesian Coal Basin __________________________________________________________________________________________________________________________________________________________________ 1. Introduction The contemporary landscape of Bytom is a result of interactions (in the past and nowadays) between the processes shaping the natural environment and activities of a human being, although the role of the human being in shaping the physiognomy of those areas became more and more important with the technological progress. Since the Neolithic times the activities of the human being have had a great influence on the transformation of the primary ecosystems, and it results in shaping the cultural landscape (PULINOWA ET AL., 2008). For ages the natural environment of those areas has been subjected mainly to agricultural anthropopressure identified with extensive land use. However, an intensive mining activity connected with rich deposits of zinc and lead ores, running shallow under the area surface was begun relatively early, as early as the Middle Ages (the 12 th century). Although the most dynamic changes commenced at the beginning of the 19 th century, at that time an intensive development of coal mining, metallurgy and urbanization connected with it began in the Upper Silesian region. Long-term anthropopressure resulted in dynamic changes of the relief identified with positive and negative forms, being an outcome of a direct or indirect activity of the human being. The relief is one of the landscape elements, which transformations are relatively easy to be observed by analysis of large-scale maps. According to KANIECKI (1996) cartographic materials being developed since the end of the 18 th century are characterised by such good accuracy and cartometry features that they can be compared with contemporary materials. In the article an attempt has been made to investigate the transformations of the Bytom area relief in years 1883-1994. The fact that the relief in a form of counter intervals was begun to be presented only in the 80’s of the 19 th century on the topographic maps, was the main reason for determining this time period. An intention of the author was to observe both quantitative (statistical) and qualitative transformations of the selected relief forms, which took place under an influence of the human being activity in the analyzed period. 1
Transcript of Anthropogenic transformation of the Bytom area relief in the period of 1883-1994

Environmental & Socio-economic Studies
Environmental & Socio-economic Studies ______________________________________________________________________________________
2013, 1, 1: 1-8
Anthropogenic transformations of the Bytom area relief in the period of 1883-1994
Maksymilian Solarski
Department of Physical Geography, Faculty of Earth Sciences, University of Silesia, Będzińska Str. 60, 41-200 Sosnowiec, Poland, E–mail address: [email protected]
_________________________________________________________________________________________________________________________________________________________________________________________
ABS TR AC T In this article an attempt was made to analyse the Bytom city relief changes in 1883-1994 years. It concentrates on the forms which are an effect of the mining and metallurgical activity such as subsidence depressions and dumps. Two digital relief models representing a topographic situation in year 1883 and 1994 were made by the Vertical Mapper tool in order to determine changes in the relief. The models were made by linear vectorization of contour lines, which then were processed into points. The made points were interpolated by the natural neighbour method. Maps of slopes, area profiles, contour line sketches and hypsographic curves were generated for two time periods on basis of the digital relief models. An area and values of subsidence for areas subjected to the mining activity, changes of the slopes, an average land altitude in 1883 and 1994 year were determined and an anthropogenic denudation ratio was also calculated. As the result of the research made, it has been established that the area of the subsidence is 3727 ha (about 54% of the city area) and the maximum value of subsidence is about 37 meters, there was a growth of the slopes at a simultaneous drop of the land average altitude, and the anthropogenic denudation ratio is 44 mm/year (800 greater than the natural denudation ratio). KEY WORDS: anthropogenic denudation, subsidence basins, coal mining, Upper Silesian Coal Basin __________________________________________________________________________________________________________________________________________________________________ 1. Introduction
The contemporary landscape of Bytom is a result of interactions (in the past and nowadays) between the processes shaping the natural environment and activities of a human being, although the role of the human being in shaping the physiognomy of those areas became more and more important with the technological progress. Since the Neolithic times the activities of the human being have had a great influence on the transformation of the primary ecosystems, and it results in shaping the cultural landscape (PULINOWA ET AL., 2008). For ages the natural environment of those areas has been subjected mainly to agricultural anthropopressure identified with extensive land use. However, an intensive mining activity connected with rich deposits of zinc and lead ores, running shallow under the area surface was begun relatively early, as early as the Middle Ages (the 12th century). Although the most dynamic changes commenced at the beginning of the 19th century, at that time an intensive development of coal mining, metallurgy
and urbanization connected with it began in the Upper Silesian region. Long-term anthropopressure resulted in dynamic changes of the relief identified with positive and negative forms, being an outcome of a direct or indirect activity of the human being.
The relief is one of the landscape elements, which transformations are relatively easy to be observed by analysis of large-scale maps. According to KANIECKI (1996) cartographic materials being developed since the end of the 18th century are characterised by such good accuracy and cartometry features that they can be compared with contemporary materials. In the article an attempt has been made to investigate the transformations of the Bytom area relief in years 1883-1994. The fact that the relief in a form of counter intervals was begun to be presented only in the 80’s of the 19th century on the topographic maps, was the main reason for determining this time period. An intention of the author was to observe both quantitative (statistical) and qualitative transformations of the selected relief forms, which took place under an influence of the human being activity in the analyzed period.
1
2. Study area Bytom is located in the south-west Poland, in
the central part of the Silesian voivodeship and it constitutes one of the cities of so called Katowice conurbation. The city location is determined by the geographical coordinates: 50°19′03’’ N in the south, 50°24′49’’ N in the north, 18°47′19’’ E in the west, and 18°57′48’’ E in the east. The city area is 69.44 km², and a number of its inhabitants slightly above 176 thou. (ROCZNIK DEMOGRAFICZNY, 2012). It is one of the oldest Upper Silesian cities and its location dates back to year 1254 (DRABINA, 2000). It is also one of the oldest industrial centers of Upper Silesia, as already in the Middle Ages the mining activity connected with presence of metal ores in the substratum was conducted in this region.
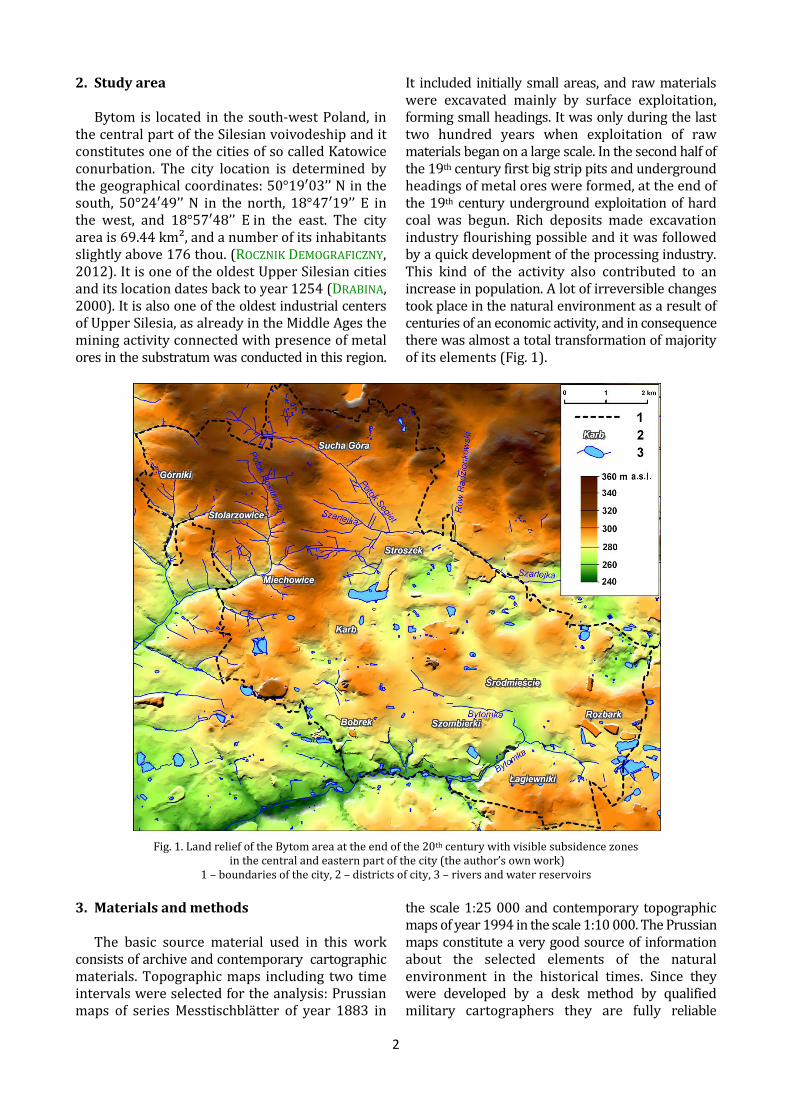
It included initially small areas, and raw materials were excavated mainly by surface exploitation, forming small headings. It was only during the last two hundred years when exploitation of raw materials began on a large scale. In the second half of the 19th century first big strip pits and underground headings of metal ores were formed, at the end of the 19th century underground exploitation of hard coal was begun. Rich deposits made excavation industry flourishing possible and it was followed by a quick development of the processing industry. This kind of the activity also contributed to an increase in population. A lot of irreversible changes took place in the natural environment as a result of centuries of an economic activity, and in consequence there was almost a total transformation of majority of its elements (Fig. 1).
Fig. 1. Land relief of the Bytom area at the end of the 20th century with visible subsidence zones
in the central and eastern part of the city (the author’s own work) 1 – boundaries of the city, 2 – districts of city, 3 – rivers and water reservoirs
3. Materials and methods
The basic source material used in this work
consists of archive and contemporary cartographic materials. Topographic maps including two time intervals were selected for the analysis: Prussian maps of series Messtischblätter of year 1883 in
the scale 1:25 000 and contemporary topographic maps of year 1994 in the scale 1:10 000. The Prussian maps constitute a very good source of information about the selected elements of the natural environment in the historical times. Since they were developed by a desk method by qualified military cartographers they are fully reliable
2

(MARSZELEWSKI & PODGÓRSKI, 2004; KONIAS, 2010). Two digital relief models representing a topographic situation in year 1883 and 1994 were made by the Vertical Mapper tool in order to determine changes in the relief. The models were made by the linear vectorization of contour lines, which then were processed into points. The made points were interpolated by the natural neighbour method. Maps of gradients, area profiles and contour line sketches were generated for two time periods on
basis of the digital relief models. In order to present the relief transformations of the area in question in a synthetic way, hypsographic curves were made and on their basis the average height of the area and the anthropogenic denudation index were calculated for years 1883 and 1994. A database was made for each elaboration. The last stage of the relief change analysis was to make a map of subsidence of the Bytom area (Fig. 2).
Fig. 2. Values of the area subsidence in Bytom at the end of the 20th century (1994)(the author’s own work) 1 – boundaries of the city, 2 – boundaries of coal mines, 3 – mining waste heaps, 4 – morphological profiles,
5 – values of subsidence [m] 4. Results and discussion
Bytom is one of the oldest industrial centers of
Upper Silesia. Exploitation of the mineral raw materials was already performed on the city area in the Middle Ages, although those activities did not cause significant disturbances of natural conditions. A development of the mining technology in 13 and 14th century enabled to make underground exploitation with use of pits and adits. At those times the area of the contemporary Bytom was covered with hundreds of pits, around which waste rocks were stored. A progress in the mining industry, which was made in 16 and 17th century allowed going to a level of about 90 m underground. At that time the biggest changes concerned the water
circulation, which was modified by operating of numerous adits dewatering the deposits. However, it was only the human activity performed on the Bytom area in the period of last 200 years, which stamped its influence on the city physiography. In the period of the city greatness there were six big mines excavating coal in its area, they were: Centrum, Bobrek, Miechowice, Powstańców Śląskich, Rozbark and Szombierki (JAROS, 1984).
The dynamic industry development, especially after the World War II, resulted in the influx of a large number of people, what implicated territorial expansion of settlement units. Overlapping of the mentioned factors was the reason for the almost total transformation of the central and eastern part of this area. Anthropogenic relief forms, functioning
3
in the landscape until now, are an effect of those transformations. In general they can be divided into forms being an effect of the direct activity of the human being (waste heaps, embankments, dykes, mounds, windrow cones, patches, warpie, knolls, holes etc.) or an effect of the indirect activity of the human being (subsidence basins, hollows, depression cones, faults, alluvial cones) (ŻMUDA, 1973). Since the research the area is rather big (over 69 km2) and high accumulation of the anthropogenic relief forms on the city area, the forms which are connected with underground exploitation of hard coal at great depths were subjected to the analysis.
The relief models made for two time periods reflect a state of the Bytom relief. A comparison of both models enabled to divide the investigation area into two parts. The northern part (districts: Górniki, Stolarzowice and Sucha Góra), of which the relief underwent slight changes in the period in question and the southern part, which is characterized by substantial transformations (Fig. 2). The northern part of the city area was subjected in predominance to the agricultural anthropopressure, and headings of zinc and lead ores, sand, clay and solid rock quarries occupied here only small areas. Thus, in this case you can say about a predominant role of the agricultural denudation in transforming the relief of this part of the city. The main contours of the relief and the height ratios did not undergo changes. There was a different situation in the city part, which is located in the south of the Szarlejka and Rokitnicki Potok valleys (Fig. 1).
An intensive development of coal mining in this region began in half of the 19th century. Vast subsidence of the land, called subsidence basin, which was the result of mining exploitation performed „until collapse” underground at great depths, is visible on the surface (Fig. 2). The subsidence size at this type of exploitation depends, first of all, on the geological structure, the rock mass disturbance before earlier exploitation and hydrogeological conditions (WACH, 1991). The region
in the question was especially susceptible to that kind of influences, because the exploitation of metal ores, conducted earlier on a large scale, resulted in significant slackness of Triassic rocks of the overlayer and formation of a vast depression sink within their area. It had a great influence on acceleration and intensification of the subsidence process, which according to PERSKI & JURA (1999) usually begins about 3–4 months after passage of the exploitation front. As it results from the investigations of those authors, at the beginning the ground sinks to a few millimeters a day, after a few months the subsidence reaches tens of millimeters. The process usually lasts a few years after finishing exploitation (PERSKI & JURA, 1999). Those authors determined a value of the ground subsidence for 10-20 cm a year in the downtown of Bytom by the InSAR techniques and associated its presence in this part of the city with overlapping of two phenomena – post-exploitation relaxation of a rock center at greater depths and reactivation of older, medieval caverns of silver, zinc and lead headings (PERSKI & JURA, 2003). The ground subsidence on the GZW (Upper Silesian Coal Basin) area, thus on the investigated area, began to take place on a larger scale after the World War II, what was connected directly with a significant increase in excavating, and in some cases even with overexploitation of coal (PUKOWSKA-MITKA, 2002).
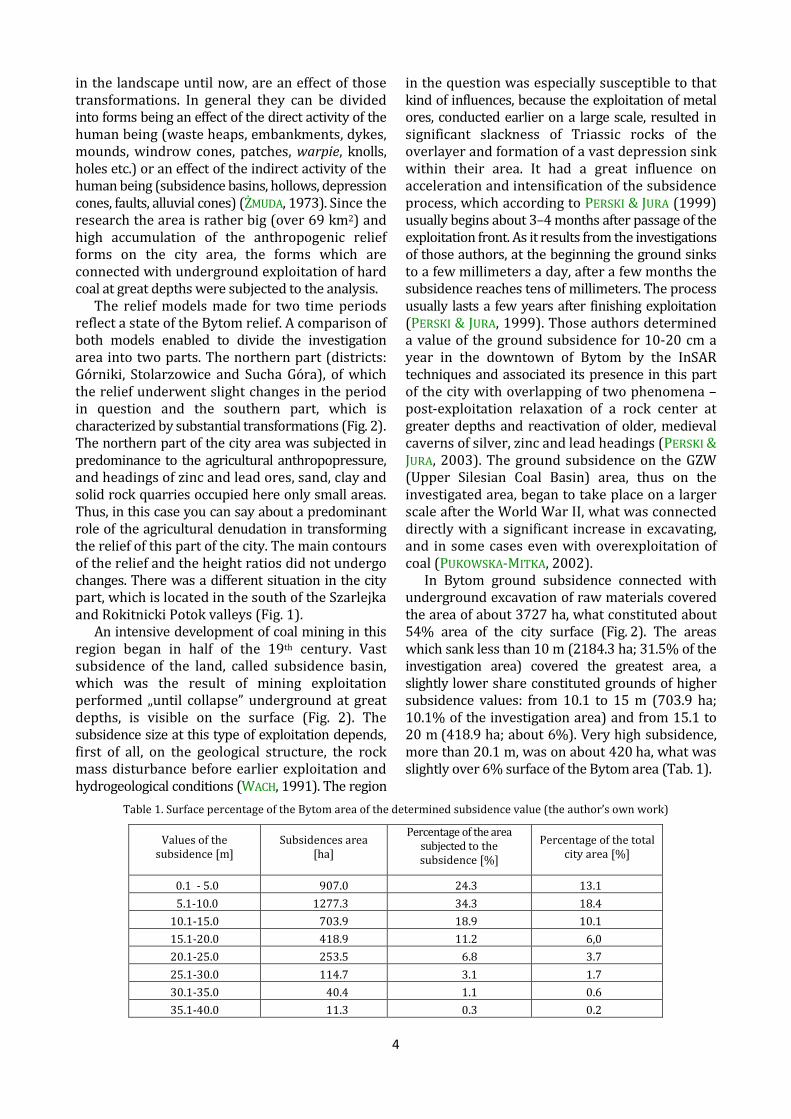
In Bytom ground subsidence connected with underground excavation of raw materials covered the area of about 3727 ha, what constituted about 54% area of the city surface (Fig. 2). The areas which sank less than 10 m (2184.3 ha; 31.5% of the investigation area) covered the greatest area, a slightly lower share constituted grounds of higher subsidence values: from 10.1 to 15 m (703.9 ha; 10.1% of the investigation area) and from 15.1 to 20 m (418.9 ha; about 6%). Very high subsidence, more than 20.1 m, was on about 420 ha, what was slightly over 6% surface of the Bytom area (Tab. 1).
Table 1. Surface percentage of the Bytom area of the determined subsidence value (the author’s own work)
Values of the subsidence [m]
Subsidences area [ha]
Percentage of the area subjected to the subsidence [%]
Percentage of the total city area [%]
0.1 - 5.0 907.0 24.3 13.1 5.1-10.0 1277.3 34.3 18.4 10.1-15.0 703.9 18.9 10.1 15.1-20.0 418.9 11.2 6,0 20.1-25.0 253.5 6.8 3.7 25.1-30.0 114.7 3.1 1.7 30.1-35.0 40.4 1.1 0.6 35.1-40.0 11.3 0.3 0.2
4
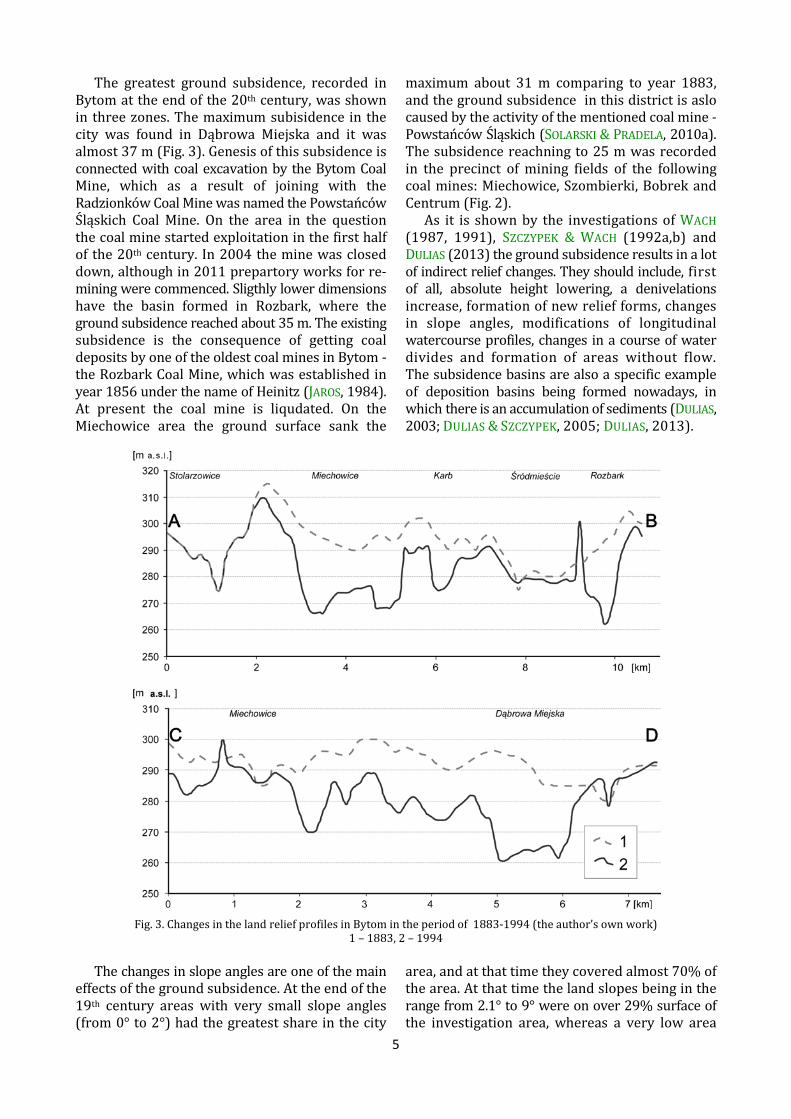
The greatest ground subsidence, recorded in Bytom at the end of the 20th century, was shown in three zones. The maximum subisidence in the city was found in Dąbrowa Miejska and it was almost 37 m (Fig. 3). Genesis of this subsidence is connected with coal excavation by the Bytom Coal Mine, which as a result of joining with the Radzionków Coal Mine was named the Powstańców Śląskich Coal Mine. On the area in the question the coal mine started exploitation in the first half of the 20th century. In 2004 the mine was closed down, although in 2011 prepartory works for re-mining were commenced. Sligthly lower dimensions have the basin formed in Rozbark, where the ground subsidence reached about 35 m. The existing subsidence is the consequence of getting coal deposits by one of the oldest coal mines in Bytom - the Rozbark Coal Mine, which was established in year 1856 under the name of Heinitz (JAROS, 1984). At present the coal mine is liqudated. On the Miechowice area the ground surface sank the
maximum about 31 m comparing to year 1883, and the ground subsidence in this district is aslo caused by the activity of the mentioned coal mine - Powstańców Śląskich (SOLARSKI & PRADELA, 2010a). The subsidence reachning to 25 m was recorded in the precinct of mining fields of the following coal mines: Miechowice, Szombierki, Bobrek and Centrum (Fig. 2).
As it is shown by the investigations of WACH (1987, 1991), SZCZYPEK & WACH (1992a,b) and DULIAS (2013) the ground subsidence results in a lot of indirect relief changes. They should include, first of all, absolute height lowering, a denivelations increase, formation of new relief forms, changes in slope angles, modifications of longitudinal watercourse profiles, changes in a course of water divides and formation of areas without flow. The subsidence basins are also a specific example of deposition basins being formed nowadays, in which there is an accumulation of sediments (DULIAS, 2003; DULIAS & SZCZYPEK, 2005; DULIAS, 2013).
Fig. 3. Changes in the land relief profiles in Bytom in the period of 1883-1994 (the author’s own work)
1 – 1883, 2 – 1994
The changes in slope angles are one of the main effects of the ground subsidence. At the end of the 19th century areas with very small slope angles (from 0° to 2°) had the greatest share in the city
area, and at that time they covered almost 70% of the area. At that time the land slopes being in the range from 2.1° to 9° were on over 29% surface of the investigation area, whereas a very low area
5
percentage was occupied by grounds having above 9.1° (0.9%). Then, river valley-sides were characterized by the greatest land slopes, and hilltops slightly lower ones. The situation was different at the end of the 20th century.
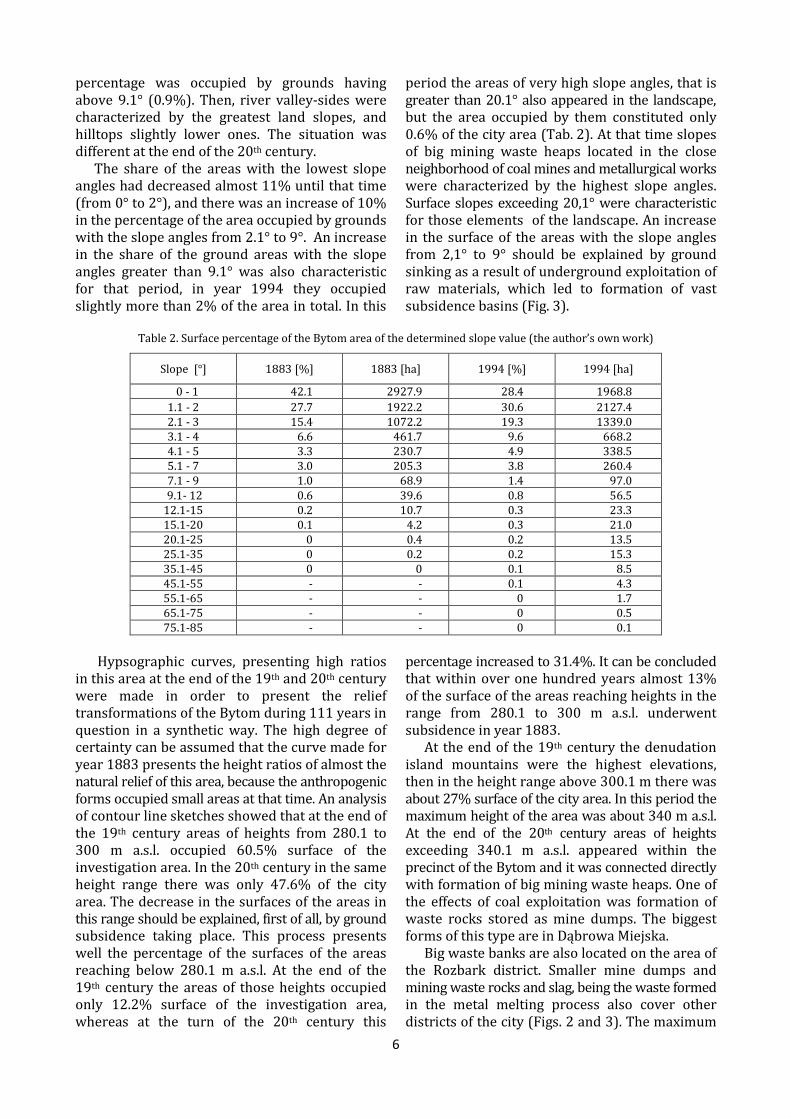
The share of the areas with the lowest slope angles had decreased almost 11% until that time (from 0° to 2°), and there was an increase of 10% in the percentage of the area occupied by grounds with the slope angles from 2.1° to 9°. An increase in the share of the ground areas with the slope angles greater than 9.1° was also characteristic for that period, in year 1994 they occupied slightly more than 2% of the area in total. In this
period the areas of very high slope angles, that is greater than 20.1° also appeared in the landscape, but the area occupied by them constituted only 0.6% of the city area (Tab. 2). At that time slopes of big mining waste heaps located in the close neighborhood of coal mines and metallurgical works were characterized by the highest slope angles. Surface slopes exceeding 20,1° were characteristic for those elements of the landscape. An increase in the surface of the areas with the slope angles from 2,1° to 9° should be explained by ground sinking as a result of underground exploitation of raw materials, which led to formation of vast subsidence basins (Fig. 3).
Table 2. Surface percentage of the Bytom area of the determined slope value (the author’s own work)
Slope [°] 1883 [%] 1883 [ha] 1994 [%] 1994 [ha]
0 - 1 42.1 2927.9 28.4 1968.8 1.1 - 2 27.7 1922.2 30.6 2127.4 2.1 - 3 15.4 1072.2 19.3 1339.0 3.1 - 4 6.6 461.7 9.6 668.2 4.1 - 5 3.3 230.7 4.9 338.5 5.1 - 7 3.0 205.3 3.8 260.4 7.1 - 9 1.0 68.9 1.4 97.0
9.1- 12 0.6 39.6 0.8 56.5 12.1-15 0.2 10.7 0.3 23.3 15.1-20 0.1 4.2 0.3 21.0 20.1-25 0 0.4 0.2 13.5 25.1-35 0 0.2 0.2 15.3 35.1-45 0 0 0.1 8.5 45.1-55 - - 0.1 4.3 55.1-65 - - 0 1.7 65.1-75 - - 0 0.5 75.1-85 - - 0 0.1
Hypsographic curves, presenting high ratios
in this area at the end of the 19th and 20th century were made in order to present the relief transformations of the Bytom during 111 years in question in a synthetic way. The high degree of certainty can be assumed that the curve made for year 1883 presents the height ratios of almost the natural relief of this area, because the anthropogenic forms occupied small areas at that time. An analysis of contour line sketches showed that at the end of the 19th century areas of heights from 280.1 to 300 m a.s.l. occupied 60.5% surface of the investigation area. In the 20th century in the same height range there was only 47.6% of the city area. The decrease in the surfaces of the areas in this range should be explained, first of all, by ground subsidence taking place. This process presents well the percentage of the surfaces of the areas reaching below 280.1 m a.s.l. At the end of the 19th century the areas of those heights occupied only 12.2% surface of the investigation area, whereas at the turn of the 20th century this
percentage increased to 31.4%. It can be concluded that within over one hundred years almost 13% of the surface of the areas reaching heights in the range from 280.1 to 300 m a.s.l. underwent subsidence in year 1883.
At the end of the 19th century the denudation island mountains were the highest elevations, then in the height range above 300.1 m there was about 27% surface of the city area. In this period the maximum height of the area was about 340 m a.s.l. At the end of the 20th century areas of heights exceeding 340.1 m a.s.l. appeared within the precinct of the Bytom and it was connected directly with formation of big mining waste heaps. One of the effects of coal exploitation was formation of waste rocks stored as mine dumps. The biggest forms of this type are in Dąbrowa Miejska.
Big waste banks are also located on the area of the Rozbark district. Smaller mine dumps and mining waste rocks and slag, being the waste formed in the metal melting process also cover other districts of the city (Figs. 2 and 3). The maximum
6
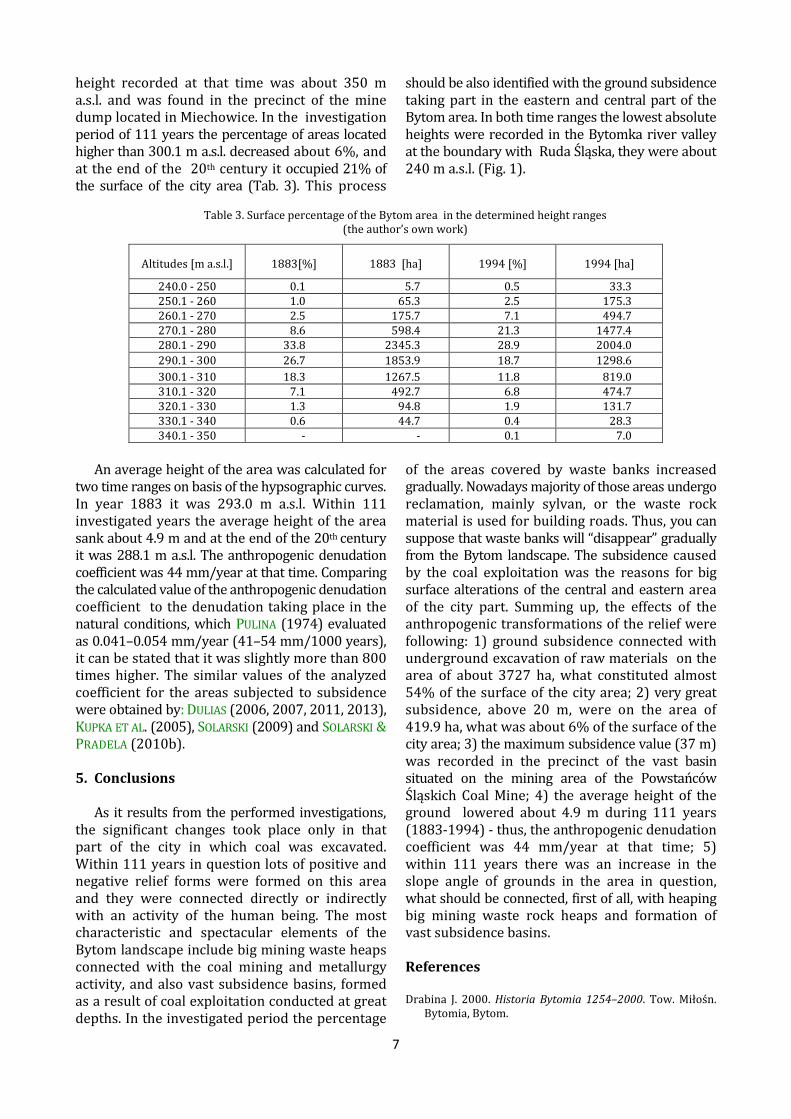
height recorded at that time was about 350 m a.s.l. and was found in the precinct of the mine dump located in Miechowice. In the investigation period of 111 years the percentage of areas located higher than 300.1 m a.s.l. decreased about 6%, and at the end of the 20th century it occupied 21% of the surface of the city area (Tab. 3). This process
should be also identified with the ground subsidence taking part in the eastern and central part of the Bytom area. In both time ranges the lowest absolute heights were recorded in the Bytomka river valley at the boundary with Ruda Śląska, they were about 240 m a.s.l. (Fig. 1).
Table 3. Surface percentage of the Bytom area in the determined height ranges
(the author’s own work)
Altitudes [m a.s.l.] 1883[%] 1883 [ha] 1994 [%] 1994 [ha]
240.0 - 250 0.1 5.7 0.5 33.3 250.1 - 260 1.0 65.3 2.5 175.3 260.1 - 270 2.5 175.7 7.1 494.7 270.1 - 280 8.6 598.4 21.3 1477.4 280.1 - 290 33.8 2345.3 28.9 2004.0 290.1 - 300 26.7 1853.9 18.7 1298.6 300.1 - 310 18.3 1267.5 11.8 819.0 310.1 - 320 7.1 492.7 6.8 474.7 320.1 - 330 1.3 94.8 1.9 131.7 330.1 - 340 0.6 44.7 0.4 28.3 340.1 - 350 - - 0.1 7.0
An average height of the area was calculated for
two time ranges on basis of the hypsographic curves. In year 1883 it was 293.0 m a.s.l. Within 111 investigated years the average height of the area sank about 4.9 m and at the end of the 20th century it was 288.1 m a.s.l. The anthropogenic denudation coefficient was 44 mm/year at that time. Comparing the calculated value of the anthropogenic denudation coefficient to the denudation taking place in the natural conditions, which PULINA (1974) evaluated as 0.041–0.054 mm/year (41–54 mm/1000 years), it can be stated that it was slightly more than 800 times higher. The similar values of the analyzed coefficient for the areas subjected to subsidence were obtained by: DULIAS (2006, 2007, 2011, 2013), KUPKA ET AL. (2005), SOLARSKI (2009) and SOLARSKI & PRADELA (2010b).
5. Conclusions
As it results from the performed investigations,
the significant changes took place only in that part of the city in which coal was excavated. Within 111 years in question lots of positive and negative relief forms were formed on this area and they were connected directly or indirectly with an activity of the human being. The most characteristic and spectacular elements of the Bytom landscape include big mining waste heaps connected with the coal mining and metallurgy activity, and also vast subsidence basins, formed as a result of coal exploitation conducted at great depths. In the investigated period the percentage
of the areas covered by waste banks increased gradually. Nowadays majority of those areas undergo reclamation, mainly sylvan, or the waste rock material is used for building roads. Thus, you can suppose that waste banks will “disappear” gradually from the Bytom landscape. The subsidence caused by the coal exploitation was the reasons for big surface alterations of the central and eastern area of the city part. Summing up, the effects of the anthropogenic transformations of the relief were following: 1) ground subsidence connected with underground excavation of raw materials on the area of about 3727 ha, what constituted almost 54% of the surface of the city area; 2) very great subsidence, above 20 m, were on the area of 419.9 ha, what was about 6% of the surface of the city area; 3) the maximum subsidence value (37 m) was recorded in the precinct of the vast basin situated on the mining area of the Powstańców Śląskich Coal Mine; 4) the average height of the ground lowered about 4.9 m during 111 years (1883-1994) - thus, the anthropogenic denudation coefficient was 44 mm/year at that time; 5) within 111 years there was an increase in the slope angle of grounds in the area in question, what should be connected, first of all, with heaping big mining waste rock heaps and formation of vast subsidence basins. References Drabina J. 2000. Historia Bytomia 1254–2000. Tow. Miłośn.
Bytomia, Bytom.
7
Dulias R. 2003. Subsidence depressions in Upper Silesian Coal Basin. Geomorfologický sbornik, 2: 11-14.
Dulias R. 2006. Possibilities to apply topographic maps on large scale to research on relief changes in mining areas. Anthropogenic asp. of landsc. transform., 4: 23-28.
Dulias R. 2007. Wpływ górnictwa węgla kamiennego na zmiany rzeźby obszaru KWK Miechowice na Wyżynie Śląskiej. Acta Geogr. Siles., 1: 5-12.
Dulias R. 2011. Impact of mining subsidence on the relief of the Rybnik Plateau, Poland. Zeit. fur Geomorph., vol. 55, Suppl, 1: 25-36.
Dulias R. 2013. Denudacja antropogeniczna na obszarach górniczych na przykładzie Górnośląskiego Zagłębia Węglowego. Wyd. Uniw. Śl., Katowice.
Dulias R., Szczypek T. 2005. Badania antropogenicznych basenów sedymentacyjnych z Wyżyny Śląskiej z zastosowaniem 137Cs. Geomorfologický sbornik, 4: 15-18.
Jaros J. 1984. Słownik historyczny kopalń węgla na ziemiach polskich. Wyd. II, 1. Śląski Inst. Nauk., Katowice.
Kaniecki A. 1996. Problemy metodyczne związane z badaniem przemian stosunków wodnych na obszarach zurbanizowanych. Dziejowe przemiany stosunków wodnych na obszarach zurbanizowanych. Kom. Hydrogr., PTG, WNoZ UŚ, IGF UAM, Sosnowiec: 54-66.
Konias A. 2010. Kartografia topograficzna państwa i zaboru pruskiego od II połowy XVIII wieku do połowy XX wieku. Wyd. Nauk. AP w Słupsku, Słupsk.
Kupka R., Szczypek T., Wach J. 2005. Skutki 200-letniej eksploatacji węgla kamiennego w Katowicach. Geomorfologický sbornik, 4: 11-13.
Marszelewski W., Podgórski Z. 2004. Zmiany ilościowe oczek i jezior na Pojezierzu Chełmińskim w świetle materiałów kartograficznych z XIX i XX wieku. Przegl. Geogr., 76, 1: 33-50.
Perski Z., Jura D. 1999. ERS SAR interferometry for the land subsidence detection in coal mining areas. Earth Observation Quarterly, 63: 25-29.
Perski Z., Jura D. 2003. Identification and measurement of mining subsidence with SAR interferometry: potentials and limitations. Proc. of 11th Int. Symp. on Deformation Measurements, Santorini Greece: 165-171.
Pukowska-Mitka M. 2002. Cykle węglowe w Górnośląskim Okręgu Przemysłowym. Wyd. Nauk. UŚ, Katowice.
Pulina M. 1974. Denudacja chemiczna na obszarach krasu węglanowego. Zakł. Narod. im. Ossolińskich, Prace Geogr. PAN, Wrocław-Warszawa-Kraków.
Pulinowa M.Z., Czylok A., Nita J. 2008. Fenomen miejsca. Uwarunkowania przyrodnicze procesu zasiedlania przestrzeni Będzina. [in:] Pulinowa M.Z. (ed.): Będzin 1358-2008. Środowisko przyrodniczo-geograficzne. Muzeum Zagłębia w Będzinie, Będzin: 317-354.
Rocznik Demograficzny 2012. GUS, Warszawa. Solarski M. 2009. Przemiany wybranych komponentów krajobrazu
Wyżyny Miechowickiej w latach 1827–1996. WNoZ, Uniw. Śl. (manuscript).
Solarski M., Pradela A. 2010a. Przebieg zjawisk lodowych w zbiorniku wodnym w niecce osiadania w sezonie zimowym 2008/2009. Kształt. środ. geogr. i ochr. przyr. na obsz. uprzem. i zurb., 42: 70-79.
Solarski M., Pradela A. 2010b. Przemiany wybranych form rzeźby Wyżyny Miechowickiej w latach 1883–1994. Z badań nad wpływem antropopresji na środowisko, 11: 78-92.
Szczypek T., Wach J. 1992a. Antropopresja a przebieg naturalnych procesów rzeźbotwórczych (na przykładzie Wyżyny Śląskiej). Kształt. środ. geogr. i ochr. przyr. na obsz. uprzem. i zurb., 4: 5-12.
Szczypek T., Wach J. 1992b. Antropogeniczne przeobrażenia rzeźby na uprzemysłowionym i zurbanizowanym obszarze Wyżyny Śląskiej. Aktualne problemy ekologiczne regionu górnośląskiego w edukacji szkolnej dzieci i młodzieży, WNoZ UŚ, Region. Ośr. Eduk. Środ., Wydz. Ekol. Urzędu Wojew. w Katowicach, Rogoźnik: 54-61.
Wach J. 1987. Zmiany profilu podłużnego Kłodnicy w wyniku osiadań górniczych. [in:] Problemy geograficzne górnośląsko-ostrawskiego regionu przemysłowego. Mat. symp. polsko-czechosł. ODN IKN, WNoZ, Uniw. Śl., Katowice-Sosnowiec: 126-130.
Wach J. 1991. Wpływ antropopresji na kształtowanie się rzeźby terenu województwa katowickiego. [in:] Człowiek i jego środowisko w górnośląsko-ostrawskim regionie przemysłowym. Mat. symp. polsko-czeskiego, WNoZ UŚ, Sosnowiec: 115-119.
Żmuda S. 1973. Antropogeniczne przeobrażenia środowiska przyrodniczego konurbacji górnośląskiej. PWN, Warszawa – Kraków.
8