ACTINOBACTERIA ISOLATES FROM TIN TAILINGS AND FOREST SOIL FOR BIOREMEDIATION OF HEAVY METALS
Upload
khangminh22Category
view
0download
0
HAL Id: tel-03667945https://tel.archives-ouvertes.fr/tel-03667945
Submitted on 13 May 2022
HAL is a multi-disciplinary open accessarchive for the deposit and dissemination of sci-entific research documents, whether they are pub-lished or not. The documents may come fromteaching and research institutions in France orabroad, or from public or private research centers.
L’archive ouverte pluridisciplinaire HAL, estdestinée au dépôt et à la diffusion de documentsscientifiques de niveau recherche, publiés ou non,émanant des établissements d’enseignement et derecherche français ou étrangers, des laboratoirespublics ou privés.
Actinobacteria communities in natural andanthropogenic environments
Andrea Faitova
To cite this version:Andrea Faitova. Actinobacteria communities in natural and anthropogenic environments. Bacteri-ology. Université de Lyon; Univerzita Karlova (Prague), 2021. English. �NNT : 2021LYSE1028�.�tel-03667945�

N°d’ordre NNT :
THESE de DOCTORAT DE L’UNIVERSITE DE LYON opérée au sein de
l’Université Claude Bernard Lyon 1
Ecole Doctorale N° 341 Ecosystèmes Evolution Modélisation Microbiologie
Spécialité de doctorat : Ecologie Microbienne Discipline : BIOLOGIE
Soutenue publiquement le 11/02/2021, par :
Andrea Faitova (Buresova)
Actinobacteria communities in natural and anthropogenic environments
Devant le jury composé de :
JURADO Valme (Chercheure – Institute des ressources naturelles et d´agrobiologie de Seville, Espagne) - Rapporteure
KYSELKOVA Martina (Chercheure – Académie tchéque des Sciences – Prague, République Tchéque) - Rapporteure
HEUILIN Thierry (Directeur de Recherche CNRS rovence UMR 7265 – BIAM)-Examinateur MOËNNE-LOCCOZ Yvan (Professeur – Université Claude Bernard Lyon 1) - Examinateur

PETRUSEK Adam (Professeur – Université Charles de Prague) - Examinateur STORCH David (Professeur – Université Charles de Prague) - Examinateur
MARECKOVA Marketa (Chercheure – Institute de recherche sur la production végétale -Prague, République Tchéque) - Directeurice de thèse
RODRIGUEZ-NAVA Veronica (Professeure des Universités – Université Claude Bernard Lyon 1) - Directeurice de thèse
KOPECKY Jan (Chercheure – Institute de recherche sur la production végétale -Prague, République Tchéque) - Invité

Joint PhD. thesis between
Charles University in Prague
Faculty of Science
and
Université Claude Bernard Lyon 1
École Doctorale Evolution, Ecosystémes, Microbiologie et Modélisation
To obtain the degree of Doctor in Natural Sciences from both universities (Cotutelle)
Mgr. Ing. Andrea Faitová (Burešová)
Actinobacteria communities in natural and anthropogenic
environments
Thesis supervisors:
RNDr. Markéta Ságová- PhD. and Prof. Veronica Rodriguez-Nava
Prague, December 2020

2

3
Declaration
I hereby declare that I have written this thesis independently, using the listed references; or in
cooperation with other paper co-authors. I have submitted neither this thesis, nor any of its parts, to
acquire any other academic degree.
Prague, 3rd December 2020
Andrea Faitová (Burešová)

4
Contents
Abstract 10 Abstrakt (In Czech) 12 Résumé (In French) 14 Aim and outline of the thesis 16 Introduction
o Microbes in a changing world 21 o Actinobacteria in terrestrial ecosystems 23 o Environmental factors driving Actinobacteria communities 24 o Techniques for in situ Actinobacteria determination 26 Part 1: Cave environments and microbial inhabitants 28 o Human derived changes in show caves 30 o Problematic of Lascaux Cave 32 o Actinobacteria roles in caves 33 Part 2: Decomposition of plant litter and the climate change 35 o Microbial colonizers of litter 36 o Actinobacteria as one of the main litter decomposers 38
Summary and conclusions 42
References 47
Original research papers 60
-Part 1-
Paper I: Usefulness of hsp65 marker as a complement to 16S rRNA sequences to demonstrate differences in Actinobacteria community according to anthropization of
limestone caves and occurrence of visual marks in Lascaux Cave
-Part 2-
Paper II: Succession of microbial decomposers is determined by litter type but sites conditions drive decomposition rate
Paper III: Litter chemical quality and bacterial community structure influenced
decomposition in acidic forest soil
Paper IV: Litter traits and rainfall reduction alter microbial litter decomposers: the evidence from three Mediterranean forests
Appendix

5
The thesis is based on the following papers:
I. Buresova A., Alonso L., Moënne-Loccoz Y., Kopecky J., Sagova-Mareckova M., Vautrin F., Rodriguez-Nava V., (in prep.), Usefulness of hsp65 marker as a complement to 16S rRNA sequences to demonstrate differences in Actinobacteria community according to anthropization of limestone caves and occurrence of visual marks in Lascaux Cave, Molecular Ecology
II. Buresova A., Kopecky J., Hrdinkova V., Kamenik Z., Omelka M. and Sagova-Mareckova M., (2019), Succession of Microbial Decomposers Is Determined by Litter Type, but Site Conditions Drive Decomposition Rates, Applied and Environmental Microbiology, 85 (24): e01760-19
III. Buresova A., Tejnecky V., Kopecky J., Drabek O., Madrova P., Rerichova N., Omelka M., Krizova P., Nemecek K., Parr T. B., Ohno T. and Sagova-Mareckova M., (under
revision), Litter chemical quality and bacterial community structure determined decomposition in acidic forest soil, European Journal of Soil Biology
IV. Pereira S., Buresova A., Kopecky J., Madrova P., Aupic-Samain A., Fernandez C., Baldy V. and Sagova-Mareckova M., (2019), Litter traits and rainfall reduction alter microbial litter decomposers: the evidence from three Mediterranean forests, FEMS Microbiology Ecology, 95 (12): fiz168

6
Authors´ contribution
I. Veronica Rodriguez-Nava and Yvan Moënne-Loccoz prepared the original paper
concept. Lise Alonso and Yvan-Moënne Loccoz did sampling in caves. Lisa Alonso
made extraction of DNA from samples and 16S rRNA amplicon sequencing. Andrea
Buresova and Florian Vautrin created the hsp65 reference database. Andrea
Buresova amplified hsp65 gene (PCR) for amplicon sequencing processed and
analyzed the 16S rRNA and hsp65 sequence data and a statistical analysis with help
of Jan Kopecky. Andrea Buresova did drafting and writing the manuscript. Final
editing of the manuscript was done by Veronica Rodriguez-Nava, Marketa Sagova-
Mareckova, Yvan Moënne-Loccoz and Andrea Buresova.
II. Marketa Sagova-Mareckova, Jan Kopecky prepared the original paper concept and
together with Veronica Hrdinková participated at field sampling and conducted
mass loss measurement. Andrea Buresova conducted DNA extraction, amplicon
sequencing, quantitative real-time PCR analysis, extracellular enzyme activities,
prepared samples for nutrients content analysis and made extracts for HPLC
ere
processed by Jan Kopecky. Sequence data were processed by Andrea Buresova and
Jan Kopecky. Marek Omelka performed statistical analysis. Andrea Buresova was
responsible for manuscript writing and final editing was performed by Marketa
Sagova-Mareckova, Jan Kopecky and Andrea Buresova.
III. Vaclav Tejnecky and Marketa Sagova-Mareckova and Jan Kopecky prepared the
original paper concept. Together with Petra Krizova, Karel Nemecek and Nada
Rerichova they participated at field sampling. Chemical analysis did Vaclav
Tejnecky, Nada Rerichova, Ondrej Drabek and Karel Nemecek. Thomas B. Parr and
Tsutomo Ohno conducted the measurements of humification index and aromaticity
of studied litter. Pavla Madrova and Andrea Buresova extracted DNA from litter.
Andrea Buresova did a microbiological analysis (Illumina Sequencing, ddPCR of
bacteria and fungi) and with Jan Kopecky processed sequence data. The statistical
analysis was conducted by Marek Omelka. Manuscript writing performed Andrea

7
Buresova and together with Marketa Sagova-Mareckova and Vaclav Tejnecky did
final editing.
IV. Virginia Baldy, Catherine Fernandez and Marketa Sagova-Mareckova prepared the
original paper concept and together with Susana Pereira participated at a field
sampling. Susana Pereira, Andrea Buresova and Pavla Madrova extracted DNA and
conducted microbiological analysis (qPCR, Illumina MiSeq). Jan Kopecky
performed analysis of sequence data. Adrianne Aupic-Samain did the chemical
analysis of the leaves samples. Susana Pereira was responsible for manuscript
writing and final editing was performed by Marketa Sagova-Mareckova and
Virginia Baldy
On behalf of all the co-authors, I declare the participation of Andrea Faitová (Burešová) at research and papers writing as described above.
Marketa Sagova-Mareckova

8
Abbreviations
AMOVA: Analysis of molecular variance
ddPCR: Droplet digital polymerase chain reaction
DNA: Deoxyribonucleic Acid
HOMOVA: Homogenity of molecular variance
hsp65: 65-kDa Heat shock protein
PCR: Polymerase chain reaction
qPCR: Quantitative real-time polymerase chain reaction
rRNA: Ribosomal ribonucleic acid

9
Acknowledgements
I would like to express my biggest thanks to my Czech supervisor Markéta Mare ková,
for her valuable leading, support and advising during my studies. Without her support I would
not have opportunities to gain such valuable research experiences from our Czech laboratory at
Crop Research Institute and Czech University of Life Science but also from great research
institutions from abroad. I would like to thanks my French supervisor Veronica Rodriguez-
Nava for her enthusiasm and great advices during my stay in France as well as during the article
writing and thesis preparation. I am also grateful for financial support from her institution to
participate at FEMS 2019 conference with a poster presentation. Special thanks are also for Jan
Kopecký, since many of the analysis and experiments I performed would not be done without
his help and advising.
I am pleased to have an opportunity to cooperate on the Lascaux Cave project with Yvan
Moënne-Loccoz, and I thank him for his valuable comments on the article. Similarly, I would
like to thanks to Václav Tejnecký for his cooperation on decomposition experiments and
helping me with improvement of our article.
It was a pleasure to share the office with a fantastic researcher Daria Rapoport, whose
support motivated me many times in improving my research work and never give up . I also
thank to Tereza Patrmanová and Pavla Mádrová, for their help and for
creating friendly environment at our workplace. I also thank to all members from the French
laboratory Bacterial Opportunistic Pathogens and Environment for their patience and help
during my work.
My special thanks belong to the Josef Hlavka Foundation, Campus France (French
Government) and Charles University (Mobility Fond, ERASMUS) for financial supports
enabled me to study the doctorate within the Cotutelle program in France and in Czech
Republic, perform research stay at foreign institutions or participate at research conferences
abroad.
My deep thanks belong to my family, which supported me whole the 23 years of my
studies.

10
Abstract
Actinobacteria are important bacterial group participating in various ecosystem
processes particularly in the decomposition of complex organic compounds. Their abilities
enable them to surviving in harsh conditions of oligotrophic habitats like lakes, deserts, cave
walls or recalcitrant and resistant litter in soil, where Actinobacteria often dominate. Although
certain biotic and abiotic factors were recognized to modulate Actinobacteria incidence in such
habitats, the influence of anthropogenic pressure on their communities is scarcely known. The
main objective of this thesis is therefore to determine differences of Actinobacteria
communities under the direct (the human visitors changing microenvironment of caves, part
1) and indirect (climate change factors like altered precipitation or plant litter quality, part 2)
anthropogenic influence in two habitats, plant litter in soil and cave walls, where Actinobacteria
play important roles and dominate.
In a first part of the thesis we monitored Actinobacteria communities in French
limestone caves walls differently affected by humans (pristine versus anthropized caves). For
identification of important species like potential pathogens or pigments producing
Actinobacteria using amplicon sequencing of environmental DNA (Illumina MiSeq), we firstly
used a molecular marker gene hsp65 coding for heat shock protein specific for Actinobacteria.
Special attention was payed to anthropogenically most affected Lascaux Cave with Paleolithic
paintings. There, a comparison of different rooms differently affected by a human-derived
intervention as well as between visual dark marks and unmarked areas on the wall paintings
were compared (paper I). In the second part, we monitored litter Actinobacteria communities
during a decomposition process under manipulated precipitation (paper IV), on different litter
type, quality and origin (papers II, III, IV) in different forests including Mediterranean oak
and pine forests (paper IV), mountainous spruce and beech forests (paper III), a beech
temperate forest (paper II)) and also one grassland (paper II).
Our results show that Actinobacteria communities were strongly dependent to
anthropized/pristine status of caves (Part 1) as well as climatic and litter quality changes during
the decomposition (Part 2). In caves (Part 1), Actinobacteria community structure indicated
the anthropogenic disturbance, because typical pristine and anthropogenic taxa identified
according to the hsp65 marker were recovered in relation to an anthropization status (paper I).
Moreover, the dominance of Streptomyces was found in the area with visual dark marks

11
suggesting the marked areas were factor influencing this group (paper I). During
decomposition (part 2), we found that Actinobacteria were i) affected by litter type regardless
its origin but their dominance on recalcitrant litter type did not result in faster decomposition
(papers II, III, IV), ii) not directly affected by climatic conditions (paper III, IV) but were
site-specific (papers II, III, IV) with a potential to dominate introduced coniferous forests
(papers III, IV), and iii) in decomposition process had opposite strategies to fungi, since were
influenced by different conditions than fungi (papers II, III, IV). Overall, Actinobacteria
respond to anthropogenic pressure on a community and species level and are also able to adapt
to harsh conditions and thus, these changes leading to Actinobacteria persistence in ecosystems.
Consequently, Actinobacteria might be considered as stress-tolerant microbes, which may also
benefit from man-made disturbances.
Key words: Actinobacteria, caves, decomposition of plant litter, climate change,
anthropization, hsp65 marker, fungi

12
Abstrakt (In Czech)
Actinobacteria
aktinobakterie
a v
a
k nebo kvality rostlinného opadu, )
aktinobakterie
V a
fr versus
ch patogen nebo
ch aktinobakteri
hsp
aktinobakterie
Paleolitickými malbami. V této
porovnány tmav
I a
odlišným a s
kvalitou ( ) v ho bukového a borového lesa
, horského smrkového a bukového lesa ( ), bukového lesa
( ) a také stepi ( ).
a
v ). S a v
( skupiny
byly identifikované (po hsp65 markeru)

13
Streptomyces oblastech s tmavými
tato tmavá a
( ladného procesu ( aktinobakterie i) byly
), ii)
nkami ( ), ale byly habitat-specifické ( )
s ), a iii)
( ). Aktinobakterie
i é
perzistenci a v ekosystémech. V ýt
aktinobakterie
: Actinobacteria ,
, hsp65 marker, houby

14
Résumé (In French)
Les actinobactéries sont un groupe bactérien important participant dans plusieurs
processus écosystémiques comme la décomposition de composés organiques. Les
actinobactéries possèdent des nombreuses capacités leur permettant de survivre dans des
conditions difficiles comme celles retrouvées dans des habitats oligotrophes tels que les lacs,
déserts, parois des grottes ou la litière végétale récalcitrante du sol où les actinobactéries
dominent. Bien que certains facteurs biotiques et abiotiques ont été reconnus comme
modulateurs de l'incidence des actinobactéries dans ces écosystèmes, l'influence des conditions
changeantes provoquées par la pression anthropique sur leurs communautés reste inconnue.
L´objectif principal de cette thèse est donc de déterminer des différences dans les communautés
d’actinobactéries sous l’influence anthropique directe (visiteurs humains modifiant le
microenvironnement des grottes, partie 1) et indirecte (facteurs liées à des changements
climatiques : précipitations ou qualité de la litière végétale, partie 2) dans deux habitats : litière
végétale du sol et parois des grottes, où les actinobactéries jouent un rôle important et
prédominent.
Dans une première partie de la thèse, nous avons suivi les communautés
d´actinobactéries dans des parois de grottes calcaires françaises affectées différemment par
l´homme (grottes vierges ou anthropisées). Pour la détection d´espèces potentiellement
pathogènes ou productrices de pigments à partir d´ADN environnemental (Illumina MiSeq),
nous avons utilisé le marqueur moléculaire hsp65 spécifique pour le genre Actinobacteria. Une
attention particulière a été portée á la grotte de Lascaux, abritant des peintures paléolithiques et
étant une des plus affectées d’un point de vue anthropique. Une comparaison au niveau de
plusieurs salles affectées de façon différente par l’intervention humaine ainsi qu´entre zones
des mêmes salles avec des marques visuelles d´origine microbienne sur les peintures murales a
été faite dans cette grotte (article I). Dans la deuxième partie, nous avons surveillé les
communautés d’actinobactéries de la litière végétale au cours d´un processus de décomposition
sous conditions modifiées prévues (précipitation modifiée (article IV), différents types,
qualités et origines de litière, (articles II, III, IV) dans différentes forêts (chêne méditerranéen
et pin (article IV)), épicéa de montagne et hêtre (article III), forêt tempérée de hêtre (article
II) et prairie (article II)).

15
Nos résultats montrent que les communautés d’actinobactéries étaient fortement
dépendantes du statut anthropisé/vierge des grottes (partie 1) ainsi que des changements
climatiques et de qualité des litières pendant la décomposition (partie 2). Dans les grottes
(partie 1), la structure des communautés d’actinobactéries a indiqué des perturbations
anthropiques, où des taxons typiques d’environnements vierges ou anthropiques comprenant
des espèces potentiellement pathogènes (identifiées selon le marqueur hsp65) ont été trouvés
ayant un rapport avec l’anthropisation (article I). De plus, la domination du genre Streptomyces
a été trouvée dans les zones avec des marques visuelles suggérant que les zones marquées sont
un facteur affectant ce groupe (article I). Lors de la décomposition (partie 2), nous avons
constaté que les actinobactéries i) étaient affectées par le type de litière quel que soit son origine,
mais leur dominance sur de la litière récalcitrante n´a pas entraîné une décomposition plus
rapide (articles II, III, IV), ii) n´étaient pas directement affectés par les conditions climatiques
(article III, IV) mais plutôt spécifiques au site (articles II, III, IV) avec du potentiel pour
dominer dans des forêts de conifères introduites (articles III, IV), et iii) étaient influencées par
des conditions différentes à celles des champignons (articles II, III, IV). Dans l´ensemble, les
actinobactéries répondent principalement aux changements anthropiques au niveau de
communautés ou d’espèces et sont capables de s 'adapter á ces changements conduisant á leur
persistance dans les écosystèmes. Les Actinobactéries peuvent être mentionnées comme des
microorganismes tolérants au stress et, dans une certaine mesure, comme bénéficiant des
perturbations d´origine humaine.
Mots clés: Actinobactéries, grottes, décomposition des litières végétales, changement
climatique, anthropisation, marqueur hsp65, champignons

16
Aim and outline of the thesis
The thesis focuses on communities of terrestrial Actinobacteria under the anthropogenic
influence in French caves and during plant litter decomposition in forests and grassland habitats
in the Czech Republic, France and Austria. The first part describes the direct influence of
humans on Actinobacteria inhabiting wall surfaces of caves in France under different human
impact. The aim was to show how Actinobacteria react to human disturbance and coincide with
the stability of these habitats. Such intervention as a biocide treatment but also the high
frequency of visitors, which represent the alteration of microclimate due to their metabolism
and introduction of allochthonous microbes and nutrients, represent direct anthropogenic
factors affecting autochthonous microbial inhabitants. The second part focuses on the indirect
consequences of global climate changes on communities of soil and litter Actinobacteria. The
aim was to show how forest and grassland Actinobacteria, as an important part of soil
decomposer community, will respond to changes in litter quality and habitat properties but also
to the reduction of rainfall as expected from the climate change. For more complex insight, the
other important microbial decomposers within the community were also analyzed to see
possible relationships typical for the respective environmental and substrate conditions.
The overall aim of the thesis was to uncover the ecology of Actinobacteria in habitats
modified by human activities directly or indirectly. Using a combination of environments,
where Actinobacteria play the dominant role we were able to determine the sensitivity of this
group to anthropogenic changes in open and less stable (plant litter) versus isolated and
relatively more stable (caves) habitats. Using the novel marker gene hsp65 for analysis of
Actinobacteria communities from eDNA, we were able to overcome the problem of
unculturable strains in identifying the cave Actinobacteria to the species level in French caves,
Lascaux, Rouffignac, Mouflon and Reille. That helped us to identify in detail the part of the
community that was affected by human interventions or by the presence of visual dark marks
(black stains and dark areas on cave walls) of microbial origin in the Lascaux Cave (part 1). In
the part two, where we quantitatively and qualitatively measured the reaction of Actinobacteria
to other decomposers and environmental factors, we firstly showed the abiotic but also biotic
ones driving Actinobacteria activities during decomposition (part 2). The work further
demonstrates the necessity to include Actinobacteria into environmental monitoring and
prediction models as a one of the indicative microbial groups.

17
We focus on the following subjects:
1) Detailed analysis of Actinobacteria communities of four French caves and also
individual rooms within the Lascaux Cave. The questions were: 1) Are Actinobacteria
in caves shaped according to the anthropization status (presence of visitors, application
of chemicals)? 2) Can we identify with a novel marker (hsp65) Actinobacteria species
related specifically to anthropized/pristine habitats, for example potentially pathogenic
and novel species?
2) Comparison of Actinobacteria between dark visual marks and unmarked areas on wall
paintings within the Lascaux Cave. The questions were: Are visual marks in the highly
anthropized Lascaux Cave a factor affecting Actinobacteria communities?
3) Quantitative and qualitative analysis of changes in Actinobacteria communities in
relation to altered litter type in different forests and grassland. The questions were: Are
Actinobacteria affected by changes in precipitation, litter quality and origin at the
studied sites? Are Actinobacteria able to adapt to altered litter quality regardless of the
environment or time of decomposition?
4) Determination of Actinobacteria successional patterns over the decomposition process
and comparison with the other important microbial decomposers, especially fungi. The
questions were: Are Actinobacteria initial, middle or late-stage decomposers? Do they
have similar or opposite colonization patterns to other decomposers? Could be these
patterns affected with changes in litter and environmental conditions?
After a short introduction which is divided into two sections (part 1, part 2), the thesis is
concluded by general summary and conclusions of the obtained results. The main part of the
thesis is also divided into two sections (part 1, part 2) and consists of four original research
papers. In the appendix, my curriculum vitae containing all my publications and trainings can
be found.

18
Outline of the original papers
This thesis consists of four papers (I-IV). The paper I focused on communities of
Actinobacteria in French caves differently affected by anthropization (visited versus non-
visited caves) with closer focus on Lascaux cave, which was disturbed to a high extent and thus
already closed to visitors. Three papers (II-IV) focused on microbial communities during litter
decomposition with closer focus on Actinobacteria. Within that, paper II describes one-year
decomposition experiment with litters of different origin and quality at beech forest and
grassland sites, while the paper III is focused on later stage decomposition (15 to 29 months
of decomposition) of two highly recalcitrant litters in beech (native) and spruce (introduced)
mountainous forests. The paper IV describes recalcitrant oak (native) and pine (introduced)
litter decomposition under the altered precipitation conditions in Mediterranean forests.
Paper I (Buresova et al., in prep, Molecular Ecology) focused on Actinobacteria
communities colonizing walls in French caves differently affected by humans (Lascaux,
Rouffignac – anthropized, Mouflon, Reille – pristine). In addition, in Lascaux cave, samples of
different rooms (entrance Sas-1, Passage banks, Passage inclined planes, Apse, Diaclase) were
picked wall from visual marks (black stains and dark area) and unmarked area. DNA was
extracted and amplicons of heat shock protein gene hsp65 and 16S rRNA gene fragments were
sequenced (Illumina MiSeq). The taxonomical database for assignment of hsp65 amplicons was
designed. Comparison of 16S rRNA and hsp65 markers showed higher variability of hsp65
than 16S rRNA gene enabling higher resolution of Actinobacteria at species level especially
for Nocardia, Mycobacteria, Streptomyces and others. Actinobacteria communities differed
between Lascaux, Rouffignac and both pristine caves. The results showed that anthropization
level affected Actinobacteria community structure where high diversity of Nocardia was
typical for visited Rouffignac and Mycobacteria for already closed Lascaux cave. Both caves
contained potentially pathogenic species which were identified thanks to the hsp65 reference
database. Pristine caves harbored high proportions of typical pristine caves dwellers Gaiellales
similarly to Diaclase, which is considered as pristine part within the anthropized Lascaux cave.
Concerning the visual marks in Lascaux cave, Actinobacteria were shaped according to these
micro-habitats and domination of Streptomyces were the predominating group in the visual
marks.

19
Paper II (Buresova et al. 2019, Applied and Environmental Microbiology) described
Actinobacteria communities over the decomposition process of autochthonous and
allochthonous litter at beech forest and grassland sites. Over the transplant litterbag
decomposition experiment the mass loss of litter (Fagus sylvatica - lowest quality defined by
C, N, P, autochtonous in beech forest and allochtonous in grassland; Carex humilis and
Astragalus exscapus - middle and highest litter quality, respectively, autochtonous in grassland
and allochtonous in beech forest), C, N and P changes, and hydrolytic and oxidative
extracellular enzymes activities were measured. Bacterial community structure was determined
by 16S rRNA gene amplicon sequencing (Illumina MiSeq), and quantities of fungi ( as 18S
rRNA gene copy numbers), Actinobacteria (16S rRNA gene), Alphaproteobacteria (16S rRNA
gene) and Firmicutes (16S rRNA gene) were measured using quantitative real-time PCR.
Extracellular enzyme activities were higher at forest site, where also decomposition was faster,
but where Actinobacteria 16S rRNA genes were less abundant. Actinobacteria, contrary to
fungi, preffered the litter regardless its quality and origin. The fastest decomposed litter at both
sites was the most nutritious one, which however was not the preferred one for neither fungi
nor Actinobacteria. Dynamics (i.e. variation over time) of Actinobacteria and fungi was highly
litter specific but not site specific. Actinobacteria 16S rRNA gene abundance increased in later
stages, similarly as for Firmicutes, and differing from fungi and Alphaproteobacteria.
Actinobacteria and fungi were differently influenced by litter or site conditions, but had similar
strategies in colonizing the litter over time. Actinobacteria should be more and fungi less
affected by changes in complex site conditions, because Actinobacteria were site specialists
and fungi site generalists. But Actinobacteria adapted to decompose the litter regardless its
quality, and may be potentially less affected by changes in vegetation cover and resulting litter
quality.
Paper III (Buresova et al., under revision, European Journal of Soil Biology) built on our
previous results where Actinobacteria increased over the decomposition. This paper focused on
late stage decomposition of recalcitrant beech (native) and spruce (introduced) litter under the
mountainous climate. All abiotic conditions like a parent rock and climate were identical at for
both sites since the forests were located next to each other on the hillside. A litterbag experiment
was set and a later stage was determined to months 15, 19 and 29. Bacterial community structure
(16S rRNA gene, Illumina Miseq), fungal and bacterial abundance (ITS region and 16S rRNA

20
gene, respectively, ddPCR), micronutrients, macronutrients and characteristics of organic
matter were measured over that period in the litter. Nutrients were also measured in soil profiles.
Our results showed that fungal and bacterial abundance did not change between the sites with
different litter and was therefore affected by other than litter characteristics, for example site
conditions. Contrary to Proteobacteria, Actinobacteria dominated in late stages on the more
recalcitrant introduced spruce litter which however did not lead to a higher decomposition rate.
Paper IV (Pereira et al 2019, FEMS Microbiology Ecology) focused on Actinobacteria
community changes under the reduction of rainfall during decomposition of allochtonous and
autochtonous litter in Mediterranean two deciduous and one coniferous forests. The results
show that, contrary to fungi, Actinobacteria abundances (16S rRNA gene, qPCR) were not
affected by reduced precipitation. Actinobacteria dominated at each site in deciduous litter,
while coniferous litter was colonized by fungi with higher preference, especially in deciduous
forests (18S rRNA gene, qPCR). In coniferous forest, both microbial groups dominated on
deciduous litter with lower lignin content and the highest availability of nutrients. It suggests
that in coniferous forest both groups had similar strategies and colonized the more nutritious
deciduous litter. Actinobacteria were not affected by rainfall reduction but were affected by
litter quality.

21
Introduction
Microbes in a changing world
Human derived changes on earth resulted in a new geological epoch called the
Anthropocene, which consists of three stages called paleoanthropocene, industrial revolution
and great acceleration (Gillings and Paulsen, 2014). During those stages the widespread of
agriculture and industry together with the high population growth, consumption of energy and
resources represented a new selection pressure for the natural ecosystems. Consequently, the
loss of biodiversity, elevated production of greenhouse gases and chemical pollution are some
of the main outcomes challenging the stability of the nature nowadays (Gillings and Paulsen,
2014; Zhu and Penuelas, 2020).
The human impact influenced microbial communities across many biomes and might
be reflected in various measures, such as stability, diversity and functioning of microbial
communities (Zhu and Penuelas, 2020). Such human impacts might have direct and indirect
influences. For example, the pollution of environment by toxic substances (Abdu et al., 2017)
and eutrophication (Schobben et al., 2016) can directly negatively affect microbes. On the
contrary, the changes in vegetation cover (Prieto et al., 2019), precipitation events and
temperature (Suseela et al., 2014) due to a climate changes like increase CO2 production are
examples how human affect microbes indirectly.
The alteration of temperatures and precipitation regimes represented one of the
predicted effects of climate change with direct consequences to microbes. It was suggested that
the warming and higher frequencies of freeze/thaw cycles might promote animal and plant
pathogens and suppress decomposers of organic carbon compounds as well as those involved
in N-cycling (Garcia et al., 2020). Another finding revealed that thawing of permafrost might
unleash danger pathogens and promote carbon release from soil, which has in turn a negative
feedback for the climate change (Gross, 2019). The promotion of long drought with more
intense rain events were expected also in arid habitats and might promote further soil
degradation together with decrease of microbial diversity ( Maestre et al., 2012; Meisner et al.,
2018).

22
On the other hand, plant diversity and biomass alteration changes are another indirect
consequences of climate change which can modulate the activity, biomass and structure of
microbial communities (Lange et al., 2015). The plant diversity decreased and proportions of
structural components of plant tissues might slow down the decomposition. The climate change
scenarios through warming and drought might affect the nutrient content in plant tissues and
thus palatability for microbes (Rosenblatt, 2018). These and other climate-related changes
might in turn result in settlement of stress tolerance communities (Garcia et al., 2020).
Human activity might directly affect microbial communities by organic and inorganic
pollution by biocides, heavy metals but also excess of nutrients. The high concentration of
heavy metals (Lee et al., 2002; Száková et al., 2016) or pesticides (Pose-Juan et al., 2017) in
soil might decrease of microbial biomass together with enzymatic activities as a reaction to
toxic stress. However, although some microbes might be sensitive to heavy metals, others are
resistant or adapt over time (Chen et al., 2020). Simultaneously, pesticide amendments might
shift microbial community towards high proportions of microbes capable to degrade the
respective organic pollutant (Bragança et al., 2019). Also, the excess of nutrients reached by
fertilization was associated with shifts in microbial diversity as a reaction to eutrophication. In
soil, nitrogen fertilization might shift the microbial community towards dominance of
copiotrophic microbial taxa like Firmicutes, Proteobacteria and Zygomycota contrary to the
oligotrophic like Acidobacteria (Francioli et al., 2016). Moreover, high nutrient amendments
might promote mineralization of stable and recalcitrant organic matter, which is known as a
“priming effect”, (Meier and Bowman, 2008) and thus promote emission of CO2 and CH4 to
the atmosphere.
Some studies focused only on diversity indices of bacterial or fungal community or
overall microbial biomass (Száková et al., 2016; Wagg et al., 2019), which however could not
be a sufficient indicator of which changes we can expect in relation to anthropogenic pressure.
We apply as a fact, that more diverse community maintain more functions (Delgado-Baquerizo
et al., 2016) but since microbes are not functionally equivalent (Bray et al., 2012; Wertz et al.,
2006) the crucial question should be, if such diverse community contain specific taxa
responsible for respective modulations in ecosystems. Moreover in this context arise a question
what are the main microbial groups to which these changes are significant (McGuire and
Treseder, 2010). At the same time, does these groups maintain key roles in ecosystems? If so,
which feedbacks can be expected through modulation of their abundances, proportions and

23
interactions in community and activity? Then, we have to consider such key groups jointly with
other community members, since with the interactions in the community we can completely
gain the biotic and abiotic factors affecting their functioning (Bani et al., 2018).
Actinobacteria in terrestrial ecosystems
Actinobacteria are phylogenetically diverse and ubiquitous gram positive class of
bacteria further characterized by high content of cytosine a guanine in their genomic DNA
(Barka et al., 2016). Actinobacteria sustain important ecosystem functions since among other
activities they participate in carbon cycling and nutrient transformation. They possess useful
enzymes and also produce metabolites of various functions, for example antiobitics and thus
have broad applications in biotechnology and biomedicine (Sharma et al., 2014). Since we face
the problems of antibiotic resistance and new diseases, which call for exploration of novel
searching for unknown Actinobacteria especially from underexplored habitats with capacity to
produce new metabolites are one of the main goals nowadays (Rangseekaew and Pathom-Aree,
2019). Due to Actinobacteria high application potential many studies focus on Actinobacteria
production of therapeutics, antifungal substances, enzymes or degradation of pollutants but
much fewer are concerned about their ecological demands affecting their distribution and
functioning in natural habitats.
High frequencies of Actinobacteria were monitored in various types of terrestrial,
aquatic ecosystems and in the atmosphere. In terrestrial ecosystems, free living Actinobacteria
are highly abundant especially in soil, where they count 10 6 to 10 9 cells per gram (Barka et
al., 2016). Since Actinobacteria have broad adaptations to live in oligotrophic conditions
Actinobacteria live epilithically and endolithically on building surfaces, rocks, stone
monuments and statues (McNamara et al., 2006; Mihajlovski et al., 2017). Their advantages
include the capability to produce resistant spores as a reaction to harsh conditions (B.-Z. Fang
et al., 2017; Makhalanyane et al., 2015). Moreover, Actinobacteria produce pigments like
melanin to be protected against high radiation, temperature extremes and free radicals
(Manivasagan et al., 2013). That enables their survival in extreme habitats such as deserts and
semideserts (Makhalanyane et al., 2015), alkaline saline soils (Shi et al., 2019), polluted soils
(Alvarez et al., 2017), permafrost soils (Aszalós et al., 2020; Hansen et al., 2007), subterranean
habitats (De Mandal et al., 2017; Hershey et al., 2018).

24
Besides that, Actinobacteria are important symbionts but also pathogens of plants and
humans. In plants they can for example caused potatoes common scabs for which the
Streptomyces genera are responsible (Marketa Sagova-Mareckova et al., 2015). Within the
Clavibacter genera are plant pathogenic species like C. michiganensis subsp. sepedonicus
causing bacterial root rot of potatoe or C. michiganensis subsp. michiganensis causing bacterial
wilt and canker of tomato (Bentley et al., 2008). For humans, many diseases including
tuberculosis, cystic fibrosis, pulmonary disease, nocardiosis and others caused Actinobacteria
genera like for example Nocardia (N. pneumoniae, N. farcinica, N. asteroides) (Boiron et al.,
1992; Taj-Aldeen et al., 2013) and Mycobacterium (M. tuberculosis, M. abscessus, M. avium)
(Gagneux, 2018; To et al., 2020). Rhodococcus equi is an example of animal pathogen, namely
of horses, ruminants and pigs, that might causes opportunistic infections for humans (Vázquez-
Boland and Meijer, 2019).
Environmental factors driving Actinobacteria communities
Actinobacteria, their diversity, activity and abundance are highly dependent on pH,
moisture and temperature. The pH was considered to be the main factor affecting
Actinobacteria community. In the study performed in different soils of temperate forest and
meadow Actinobacteria abundance negatively correlated to pH (Sagova-Mareckova et al.,
2011). Some Actinobacteria were considered acidophilic including the new species Trebonia
kvetii isolated from highly acidic soil (Rapoport et al., 2020). Similarly, acidic soil pH favorited
some Actinobacteria genera for example Acidimicrobium, but alkaline soil pH favorited genera
such as Nocardia, Micrococcus and Mycobacterium (Jenkins et al., 2009). In addition, another
study based on Actinobacteria from rock surfaces suggested they most grew on media with
neutral pH (B.-Z. Fang et al., 2017).
Aquatic Actinobacteria were found in free water and sediments of saline and fresh water
habitats where pH (Newton et al., 2007), UV-radiation (Rasuk et al., 2017), nutrients
(Holmfeldt et al., 2009) and various other factors affected their community structure (Kurtbóke,
2017; Sharma et al., 2014). Therefore, Actinobacteria have also adaptation to live in aquatic
ecosystems, but these are not the subject of the thesis. Terrestrial Actinobacteria prefer humid
habitats but well oxidized since they are generally considered as aerobes or microaerophiles
since their counts in waterlogged habitats declined to about 102 or 103 per dry gram of soil

25
(Kurtbóke, 2017). Yet, hydration of arid soil after the dry period was linked to Actinobacteria
abundance decline with subsequent increase after the habitat recovery as the oxygen availability
increased . Similarly in the Mediterranean forest, Actinobacteria
abundance were not influenced by the rainfall exclusion (Pereira et al., 2019). That suggested
terrestrial Actinobacteria were well adapted to dry conditions because their proportions
significantly increased with dryness but not only in warm but also in cold climates including
Arctic soil (Rego et al., 2019). Yet, some Actinobacteria dominated waterlogged habitats
(Kopecky et al., 2011).
Optimal growth temperature for Actinobacteria is between 25 – 30°C however,
thermophilic and psychrophilic Actinobacteria also exist (Barka et al., 2016; Li et al., 2010).
The temperatures might have determining effect on the size and composition of Actinobacteria
communities not only directly but also indirectly through the litter quality and substrate
availability (Jenkins et al., 2009; Kurtbóke, 2017). Actinobacteria seasonal changes between
winter and summer showed, that higher diversity with higher proportions of unknown taxa were
found in winter (M. Sagova-Mareckova et al., 2015). Similar results were found in deciduous
forest, where the known Actinobacteria taxa were higher in winter in upper horizons where the
highest amount of organic matter was located (Kopecky et al., 2011). For example, in the
grassland and forest sites Actinobacteria proportions increased especially in July and then in
January more visibly in grassland, however it again seemed to be dependent on nutrients
availability (Buresova et al., 2019). Actinobacteria might dominate high nutritious habitat
(Francioli et al., 2016), but as was mentioned earlier, their competitive advantage represented
also the capability to overcome oligotrophic conditions and to utilize recalcitrant substrates
(Barton and Jurado, 2007).
Although it is certain that Actinobacteria communities are driven by environmental
forces, different factors affect Actinobacteria and a single resolute pattern cannot be recognized.
Above that Actinobacteria participated in many biotic interactions so might be suppressed by
fungal pathogen or facilitated by the assembly of microbes or plants, for which Actinobacteria
mediated available sources of energy by degradation of resistant compounds (Radha et al.,
2017). Cooperation or competition of Actinobacteria with other microbial community members
might be mediated by secondary metabolites production, however in nature has been scarcely
investigated (Miao and Davies, 2010).

26
Techniques for in situ Actinobacteria determination
Culture dependent analyses of microbial diversity represented a big problem in the past
since only the cultivable bacteria were recovered (Penny R. Hirsch et al., 2010). The cultivation
approach is limited not only due to missing knowledge on requirements of the microbes for
growth conditions and nutrients but also for the absence of cooperating microbes or their
metabolites, which allow growth of the other ones (Lewis, 2009). Moreover, these techniques
are time-consuming contrary to culture independent methods (Penny R. Hirsch et al., 2010).
With the expansion of in situ molecular techniques, the ecological role and community
structure of microorganisms including Actinobacteria can be done in situ (Barka et al., 2016).
The gene coding the small ribosomal subunit (16S rRNA gene) is the most frequently used
molecule for description of prokaryotic microbial communities and molecular taxonomy.
Currently, the next generation sequencing is the preferred sequencing method but even its high
throughput capacities generally cannot resolve individual sequences at the species level (Fox et
al., 1992; Penny R Hirsch et al., 2010). Moreover, this gene cannot be used for issuing
abundance because for example in Actinobacteria there are on average 3.1±1.7 16S rRNA
copies per genome depending on the particular genus/species, while in Firmicutes it is on
average 5.8±2.8 copies and in Proteobacteria from 2.2±1.3 copies in Alphaproteobacteria to
5.8±2.8 copies in Gammaproteobacteria . Above that a single
bacterium can harbor diverse copies of the gene, while identical gene copies can be found in
different bacteria, which complicates the molecular taxonomical identification especially to the
species level (Pei et al., 2010).
Alternatively, highly conserved protein coding genes from primary metabolism were
proposed for identification of closely related bacteria including Actinobacteria. Generally,
genes coding rpoB (beta subunit of RNA polymerase), gyrA, gyrB (A, B subunit of DNA
gyrase), secA (ATPase secretory preprotein translocase), atpD (beta subunit of ATP synthase
F1), gap (glyceraldehyde-3-phosphate dehydrogenase), pnp (polyribonucleotide
nucleotidyltransferase), ftsZ (tubulin-like GTP-binding protein) or dnaK (chaperone Hsp70 in
DNA biosynthesis), as well as the 23S rRNA gene are used (Gtari et al., 2015; Martens et al.,
2008). rpoB coding beta subunit of DNA polymerase exists in a single copy, but it is not
conserved enough to be amplified by universal primers (Ogier et al., 2019; Vos et al., 2012).
For Actinobacteria, sodA, hsp65, the recA gene encoding DNA recombination and repair

27
systems were used (Adékambi and Drancourt, 2004). DNA gyrase subunit B encoding gene
gyrB was used for differentiation of Nocardia species, however only some species were more
distinct according to gyrB than 16S rRNA (Takeda et al., 2010). Simultaneously, hsp65 gene
coding heat shock protein is present in genome in a single copy and has been used as a molecular
marker for identifying a large number of Actinobacteria isolates -Nava et al., 2007,
2006), but has never been sequenced from in situ samples (from environmental DNA).
Although such markers might employed drawbacks like lacking databases for assigning the
taxonomy, they might be used in combination with other housekeeping genes in Multi Locus
Sequence Analysis (MLSA) studies (Diancourt et al., 2005; Ogier et al., 2019). Usually five or
more genes were sequenced for definition species within the genus as for example for Frankia
alni gene markers atp1, ftsZ, dnaK, gyrA and secA were used (Nouioui et al., 2019). For genetic
relatedness between Ensifer species (Alphaproteobacteria) ten genes encoding atpD, dnaK,
gap, glnA, gltA, gyrB, pnp, recA, rpoB and thrC were used (Martens et al., 2008). However,
recently is more reliable method for species identification the whole genome sequencing
(Verma et al., 2013).

28
Part 1: Cave environments and microbial inhabitants
Caves are underexplored habitats unique in its stable microclimatic conditions and
isolation from the surrounding environment. The isolation from the sunlight results in the
absence of phototrophic primary production (Tomczyk- . The
chemoheterotrophic or chemolithotrophic microbes living in caves are under the pressure due
to nutrient deficit, to which they are adapted by alternative nutrient acquisition strategies
(Barton and Jurado, 2007; Ortiz et al., 2014). This selective pressure consequently resulted in
unique microbial communities (De Mandal et al., 2017). Microbes might face harsh conditions,
which might cause high DNA damage due to high calcium content, which resulted in
overabundance of DNA-repair enzymes (Ortiz et al., 2014). Cooperative microbiological
interactions predominate over competition in such habitats, since the limited inorganic and
complex organic nutrients are unlikely to be acquired by a single organism due to high energy
demand versus little energy gain in those processes. Those living conditions consequently
explain the high microbial diversity (Barton and Jurado, 2007), and low microbial biomass
(<106 cells/g) observed in caves (Hershey and Barton, 2018).
In caves, the microbial communities are driven by the type of habitat like the rock wall,
sediment, water, air (Wu et al., 2015). It was even suggested that the sample type is a stronger
determinant of the variability of cave microbial communities than the differences between caves
(Zhu et al., 2019). The most ubiquitous bacterial phyla in caves were found Proteobacteria and
Actinobacteria (Tomczyk- while other highly abundant groups
were Firmicutes, Verrucomicrobia or Acidobacteria (De Mandal et al., 2017; Zhu et al., 2019).
The presence of Archaea were frequently found in caves, such as Thaumarchaeota, most likely
thanks to their various CO2 fixation pathways (Ortiz et al., 2014). Fungi in caves were found to
be parasites of animals or decomposers especially of organics, which entered the cave
externally. In that case, the organics were covered by conidia of such fungi like Aspergillus,
Penicillium or Mucor, which were at the same time generally the most frequently reported
genera from caves together with Histoplasma or Geomyces (Vanderwolf et al., 2013).
Some of the most ubiquitous cave taxa could be also found in soil, which is explained
by the seeding hypothesis suggesting that these microbes were carried by the percolating water
into a newly created cave. However, the long-time impact and selective pressure sorted for

29
microbes with unique adaptations (Hershey and Barton, 2018) and precisely those adaptations
lead to the high proportions of unknown and endemic microbes observed in caves (Lavoie et
al., 2017). Those included for example Actinobacteria species Hoyosella altamirensis and
Nocardia altamirensis, which were firstly isolated from Altamira cave wall (Jurado et al., 2009,
2008) and Nocardia jejuensis from a Korean cave (Lee, 2006). More recently, Nonomurea
cavernae and Bacillus antri were examples of bacteria isolated from a karst cave of China (B.
Z. Fang et al., 2017; Rao et al., 2019). Also, novel fungal species were isolated from caves like
three highly oligotrophic fungal species Cephalotrichum guizhouense, Cephalotrichum laeve
and Cephalotrichum oligotriphicum (Jiang et al., 2017) or filamentous fungi with high
cellulolytic activity (Paula et al., 2019).
Some cave microbes represent a source of novel secondary metabolites used as
therapeutics. Cervimyxin, Xiakemycin, Hypogeamicin and Huanglongmycin are examples of
new antibiotic and anticancer metabolites produced by Actinobacteria (Rangseekaew and
Pathom-Aree, 2019). Interestingly, some caves are also reservoirs of antibiotic resistance or
pathogenic microbes. Their presence was in the past attributed to the human activity, which
later became controversial since they were found also in natural and isolated caves without any
human intervention (Bhullar et al., 2012; Jurado et al., 2010).
The microbial inhabitants of caves are driven by biotic and abiotic conditions and in
turn modify the inner environment since some act as constructive or destructive agents. More
specifically, microbial mineral precipitation in caves resulted in the formation of speleothems,
calcium carbonate, iron precipitation and others are driven by number of processes (Banerjee
and Joshi, 2013; Tomczyk- z, 2015). In the Altamira cave, the mineral
deposits were found to be associated with microbial colonies, while the biomineralization was
driven by microenvironmental conditions like high humidity, temperature and CO2 production
(Cuezva et al., 2009). Also, the pH of biofilm strongly influenced calcium carbonate dissolution
and precipitation. The pH increase was associated with precipitation and thus carbonate
formation, while pH decrease caused carbonate dissolution (Banerjee and Joshi, 2013).
Some studies suggest Actinobacteria and fungi to be one of the crucial microbes
inducing mineral deposition (Tomczyk- .
However, although Actinobacteria and Proteobacteria dominated speleothems of Karstic
caves, metabolically dominating groups associated with calcium carbonate precipitation were

30
Proteobacteria and Firmicutes (Dhami et al., 2018). Another study pointed on the most
important role in mineral deposition of those cyanobacteria, algae and fungi able to create
biofilms and mats (Banerjee and Joshi, 2013).
Microbes might colonize cave surfaces and create a biofilm, which is made of microbial
consortia held together by polymers leading to their protection and effective use of energy
sources (Mulec et al., 2015). The biofilms may be colorless but also highly pigmented, which
might indicate its functional composition and reflect the microenvironmental factors driving its
creation (Banerjee and Joshi, 2013). The green biofilm consists of green algae and
cyanobacteria in the areas where light, artificial or natural light in the entrance of cave are
present (Urzì et al., 2010). The yellow biofilm in lava tubes was linked to percolation of organic
matter originated from lignin degradation containing yellow colored phenolic compounds. In
this type of biofilm, Proteobacteria followed by Actinobacteria dominated, however, the latter
group was metabolically more active (Gonzalez-Pimentel et al., 2018). Black and white
pigmented biofilms were found to have alkaline pH and thus, are contrary to yellow biofilms
responsible for speleothems induced by precipitation (Portillo and Gonzalez, 2010). Dark color
of biofilms might be caused by algae producing black pigments like Nostoc and melanized fungi
like Aspergillus niger, Acremonium or Ochroconis .
Althought these dark pigments like melanin might have protective functions for example
against free radicals their roles in cave biofilms are not completely clear (Agustinho and
Nosanchuk, 2017; Mulec et al., 2015).
Human derived changes in show caves
Pristine caves are fragile habitats, where human derived intervention might cause
disruption of structure and functioning of microbial communities. However, microbes are to
some extend resilient to the influence from human activity and are able to mitigate the impact
(Tomczyk- . That was demonstrated for example by the effect of
human urine, which represented enrichment of nitrogen as well as introduction of commensal
organisms (Johnston et al., 2012). As a result, the indigenous cave microbiome including the
endemic species took an advantage of nitrogen and organic compounds enrichment without
alteration of their community composition (Johnston et al., 2012). Another study suggested,

31
that microbial community composition remained unchanged, but the enrichment by exogenous
nutrients in show caves increased microbial biomass (Adetutu et al., 2012).
Unfortunately, the situation was changing rapidly once the cave became open to public
suggesting that the level of anthropization might be the crucial determinant of the cave
microbiome over other environmental factors (Moldovan et al., 2020). Extensive physical
human impact can also began with installation of walkways, lights and other utilities and more
drastically continued with high frequency of visitors (Bercea et al., 2019). The visitors directly
changed the inner microclimate by their metabolism, including production of CO2, H2O, and
heat and by consumption of O2 (Hoyos et al., 1998). Moreover, each visitor brought to a cave
not only external organic and inorganic matter on their shoes or clothes but also exogenous
microbes like human or animal-associated commensals or pathogens, representing new
potential colonisators and thus, aliens for true microbial cave dwellers (Leuko et al., 2017). At
the end, the remediation of human impact by physico-chemical and biological treatments might
even more drastically affect the cave microbiome in a negative way (Martin-Sanchez et al.,
2015).
Some cave microbes might react to the human induced changes by coloration, creation
of microbial mats and by deterioration of rock walls and historical paintings induced by pH
decrease, production of acids and enzymes (Banerjee and Joshi, 2013; Carlo et al., 2016).
Indeed, the problem with wall paintings endanger by bacteria and fungi try to deal with such
world renowned caves like Altamira, Roman tombs, Lascaux and others (Martin-Sanchez et al.,
2015; Schabereiter-Gurtner et al., 2002). The secondary calcium deposits of white color
(moonmilk) endangered the Etruscan wall paintings in Italian tomb, where Proteobacteria,
Acidobacteria and Actinobacteria dominated (Cirigliano et al., 2018). It was a similar case for
moonmilk deposits on wall paintings of Altamira cave, where Proteobacteria and
Actinobacteria dominated (Portillo and Gonzalez, 2011). The paintings of ancient Egyptian
tombs suffered from color changes performed by Actinobacteria species, namely Streptomyces,
by oxalic and citric acids, pigments like melanin, karotenoids and hydrogen sulphide production
(Abdel-Haliem et al., 2013). On the contrary to that study, the melanin in black stains on wall
Paleolithic paintings of Lascaux Cave were found to originated from fungi, namely from species
from Ochroconis genera (De La Rosa et al., 2017).

32
The human contamination can also resulted in presence of bacterial, fungal and viral
opportunistic pathogens, which can affect the health especially of immunosuppressed visitors
or those with lower defense (Carlo et al., 2016; Jurado et al., 2010). The anthropogenically
contaminated species such as Escherichia and Lysinibacillus might enter the cave with heavy
rains (Davis et al., 2020), others can enter the cave with visitors (Bercea et al., 2019) or with
animals (Jurado et al., 2010). Bacterial opportunistic pathogens caused various skin, brain
and/or lung infections including for example those from groups Actinobacteria (Nocardia,
Mycobacterium, Rhodococcus, Kribella), Alphaproteobacteria (Aurantimonas) and
Spirochaete (Jurado et al., 2010). Known human pathogens Staphylococcus aureus and Bacillus
spp. were detected in one of the largest show cave in Japan (Ando and Murakami, 2020). In
Chinese cave, fungi related species associated with human and animal mycotoxicosis was
isolated from dead bats (Karunarathna et al., 2020). Also Vanderwolf et al., (2013) mentioned
in his review some cave pathogenic fungi like Histoplasma capsulatum and Geomyces
destructans. Histoplasma capsulatum produce pulmonary histoplasmosis which was relatively
frequent in caves explorers while the species from a genus Geomyces cause skin and nails
human diseases (Jurado et al., 2010; Nováková, 2009).
Problematic of Lascaux Cave
The example of drastic human induced alteration of a cave microbiome is a case of
Lascaux Cave in France (Martin-Sanchez et al., 2015). The Lascaux Cave is located in
Dordogne department in south-western France and contain wall Paleolithic paintings. The cave
was discovered in 1940 and in 1948 was open to public. In 1955 increased amount of CO2,
humidity and temperature in the cave due to high number of visits per day so the air conditioning
machine was installed. In 1960 the green colonies with green algae and a calcite film coating
from water condensation appeared along the walls. since the microbial colonization progressed,
the cave was closed in 1963 to a public. Consequently, the biocide treatment containing
formaldehyde solution was applied, followed by antibiotic spraying which suppressed green
colonies for some time. Interestingly, in 1966 lichens appeared in cave but bacteria and fungi
remain stable (Bastian et al., 2010; Martin-Sanchez et al., 2015). However, in 2001 white fungal
mycelia appeared at the walls while the treatment of 50% benzalkonium chloride dissolved in
ethanol or water was unsuccessful for suppression of their proliferation (Martin-Sanchez et al.,

33
2015). More aggressive treatments were applied, which however resulted only in proliferation
of white mucus of Pseudomonas fluorescens and five month later first black microbial colonies
appeared on the walls of the cave (Bastian et al., 2007). The mechanical cleaning and new
biocide treatments were used against the black stains, however without a long lasting success
(Bastian et al., 2010).
Black stains represent recently the major problem for preservation of cave paintings.
The microbial composition was therefore studied to use successful treatment for their
elimination. Black stains were considered as most likely fungal origin, since the Dematiaceous
hyphomycetes producing olivaceous to black colonies, together with species from genera
Verticillium and Scolecobasidium were firstly isolated from stains (Fabiola Bastian et al., 2009).
The melanin producing fungi Scolecobasidium tshawytschae appeared in stains most likely as
a reaction to previous organic treatment since is typical for oil-contaminanted soils (Bastian et
al., 2010). More recently, the novel fungal species of the genus Ochroconis, O. lascauxensis
and O. anomala, which produced melanin were isolated from the stains (De La Rosa et al.,
2017). Based on sequencing approach, strong interactions between fungal and bacterial species
(for example between Aspergillus, Janibacter and Streptomyces) were found in the black stains
(Alonso et al., 2018), pointing on a possibility that more complex microbial relationships play
a role in stains creation. The microbial concentration in islands of nutrients in the oligotrophic
cave walls might lead to increase competition linked to antibiotic production, which stress fungi
to melanin production. However, if these fungi are during the creation of the black stains
influenced by other microbes or how they in turn affect microbiology of the caves remain
unclear but might be crucial for a definitive black stain suppression.
Actinobacteria roles in caves
Actinobacteria are highly abundant in many caves worldwide (Tomczyk-
Zielenkiewicz, 2015). The suggestion that harsh conditions of caves are for this group highly
favorable over the surrounding habitat was supported by a study where Actinobacteria
dominated lava caves bacterial community contrary to the aboveground soil (Lavoie et al.,
2017). Moreover, Actinobacteria advantage lie in the abilities to adapt to starving conditions,
which for them represent a strong selection factor leading to an evolution of novel species. It

34
was supported by the study from Hamedi et al., (2019) who found that the highest number of
novel Actinobacteria species were associated with the most oligotrophic part of the cave.
Actinobacteria could fight against oligotrophy by production of extracellular hydrolytic and
oxidative enzymes enable them to degrade even very recalcitrant organic compounds coming
to the cave (Hamedi et al., 2019; Le Roes-Hill and Prins, 2016). However, another effect of
some oxidative enzymes like laccase might be oxidation of phenolic molecules with subsequent
polymerization into dark melanin-like pigments (Al Khatib et al., 2018). Indeed, some
Actinobacteria like Streptomyces (Abdel-Haliem et al., 2013; Cuezva et al., 2012; Mitova et
al., 2017), Pseudonocardia (Porca et al., 2012) or Nocardioides (Groth et al., 1999) were found
to be responsible for pigmented stain formation on walls of caves.
The caves harbor unique Actinobacteria communities, some Actinobacteria were
mentioned to be typical for pristine caves like Gaiellales (Zhu et al., 2019) while other for
anthropized caves, like Pseudonocardiaceae (Lavoie et al., 2017). However, some genera like
Streptomyces were also found typical for both types of caves (Maciejewska et al., 2017).
Nocardiaceae might be also considered typical pristine cave members (De Mandal et al., 2017),
however some species from that genera are known human pathogens and might be introduced
into cave by visitors (Jurado et al., 2010). Also other pathogenic Actinobacteria species like
Dietzia maris or Kocuria rosea were recovered from the air of visited Slovenian cave (Mulec
et al., 2017). Therefore, the presence and proportions of potential pathogens in the community
associated with visited caves is important to be monitored in relation to visitor’s health.

35
Part 2: Decomposition of plant litter and the climate change
Soil is the largest reservoir of organic carbon in terrestrial ecosystems and plant litter
decomposition is a dynamic process where nutrients from litter are sequentially returning back
to the soil (Berg, 2018; Moorhead and Sinsabaugh, 2006). This process is to a large extent
affected by climate (temperature, precipitation) (Glassman et al., 2018; Jin et al., 2013), soil
quality (pH, bedrock material, fertility) (Delgado-Baquerizo et al., 2015), litter characteristics
(quality, quantity, accessibility) (Prieto et al., 2019) and decomposer organisms like soil fauna
(Frouz et al., 2015) and microbes (Baker et al., 2018). Climate was the most important factor
especially when considering its effect on a regional scale, while the litter played more
prominent role on a lower spatial scale (Berg, 2000). However, some studies denied the climate
factor as a primary control on the decomposition process (Bradford et al., 2014) or assumed
that its role was dependent only with combination with other factors as for example microbial
communities or litter quality (Glassman et al., 2018; Thiessen et al., 2013).
More specifically for the climate, microbial communities were differently affected by
temperature, where bacteria shifted more strongly in relation to changes in climate
characteristics than fungi (Glassman et al., 2018). Temperature sensitivity also depended on a
litter recalcitrancy according to Arrhenius theory: the more recalcitrant the litter was, the more
dependent it was on temperature (Thiessen et al., 2013). However, the more recent study in a
field experiment showed that the more the organic matter was stabilized, the less it was sensitive
to temperature, which directly contrasted with the Arrhenius theory (Moinet et al., 2020). Also
a precipitation was found to have a predominant effect on the decomposition, since it eliminated
the moisture limitation of microbes and stimulated their activity (Jarvis et al., 2007; Smith et
al., 2010).
Concerning the litter quality, the litter of higher quality (i.e. high diversity of more
nutritious litter, lowe C:N:P ratio) was colonized by more diverse microbial decomposers
contrary to lower quality litter (high proportions of structural polymers like hemicellulose and
lignin, higher C:N:P ratio) and resulted in faster decomposition (Bray et al., 2012; McDaniel et
al., 2014). The litter quality changed over time and microbial decomposers reflected these
changes (Buresova et al., 2019). According to the general point of view, first stages of
decomposition were accompanied with a loss of nutrients and r-selected microbial taxa, while

36
the recalcitrant debris remained in late stages and were associated with K-selected microbial
taxa (F Bastian et al., 2009; Philippot et al., 2010). Other study suggested that mostly earlier
stages of decomposition (especially C and N loss) were regulated by biotic factors - microbial
but also nematodes community, while late stages were driven by abiotic factors - initial litter
quality and soil moisture -Palacios et al., 2016). More specifically for litter quality, the
initial stage of decomposition was driven by P-related characteristics, while later stages were
mostly controlled by C:N, phenolics:N, phenolics:P and lignin:N ratios (Ge et al., 2013). Other
studies suggested that N and P might stimulated decomposition in earlier stages and inhibit
decomposition in later stages due to creation of unavailable complexes (Ge et al., 2013;
Vitousek et al., 2010). However, as mentioned in the study by Bani et al., (2018), the
decomposition was a very complex and complicated process where all factors needed to be
considered jointly for more reliable application of decomposition models.
The climatic models predicted changes in temperature as a reaction to greenhouse gas
emissions and included temperature increase with rainfall reduction, however with more
extreme precipitation events (Field et al., 2012). As a result, plant litter production and litter
quality would be modified, which would have consequences on decomposition dynamics. As
decomposition dynamics affected the nutrients availability in soil, the litter quality of new litter
would be in turn modified, which shifted the balance of nutrient and C cycling (Prieto et al.,
2019). However, it was indicated that direct climate changes in rainfall controlled the C and N
mineralization to a greater extent than the indirect ones, namely CO2-induced changes in litter
quality (Jin et al., 2013). The impacts of climate changes might also directly affect
decomposition, for example by inhibition of enzyme activities due to soil drought as a reaction
to warming and reduced rainfall (Suseela et al., 2014). Although the rain event in dry soil
increased decomposition activity more than intense rain event in wet soils (Lee et al., 2014),
too high intensity of rain might reduce oxygen availability for decomposers (Schwartz et al.,
2007) and slow down the decomposition. The direct changes in climate conditions influenced
more bacterial than fungal litter community, which specifically impacted decomposition rates
but also a type of degraded carbon (Glassman et al., 2018).

37
Microbial colonizers of litter
Fungi
Although soil fauna might contribute to a large extent to physical fragmentation of litter
and its mixing with organic and mineral horizons (Frouz et al., 2013), microbes were the main
mediators of plant litter decomposition (Bani et al., 2018). Fungi were always considered
crucial in decomposition since they produced variety of extracellular enzymes including those
which were able to decompose even very recalcitrant polymers like lignin from plant litter
(Purahong et al., 2014). Fungi were divided into subcommunities according to different stages
and function in decomposition. The early-stage subcommunity produced hydrolytic and
oxidative enzymes while the later stage subcommunity contributed to laccase and peroxidase
production (Purahong et al., 2016a). At the same time, earlier stages fungi were mostly
identified as Ascomycota and later stages fungi as Basidiomycota (Purahong et al., 2016b).
Concerning the abiotic factors affecting fungi during decomposition, fungal communities were
less responsible to climate changes than bacteria (Glassman et al., 2018). It was contradictory
to a study where a fungal community structure was alternated with changes in a high and a low
soil moisture, however it did not affect the litter decomposition (Kaisermann et al., 2015).
In our study (Buresova et al., 2019), fungi were concluded as site generalists, but
substrate specialists since they preferentially colonized one litter type. Indeed, fungi were
mostly known to be driven by a litter quality since they could select for a certain litter type
thanks to their colonizing abilities and selective translocation of potentially limiting nutrients
by fungal hyphs (Song et al., 2010). Generally, fungi were known as dwellers of typical
recalcitrant litter, like deadwood (Johnston et al., 2016). It was in accordance with a study,
where fungi were explored to be earlier colonizers and their decomposition of leaf litter might
facilitate a bacterial decomposition (Purahong et al., 2014). In spite of this, it was found that
fungi were associated to a high quality C source, which contrasted the generally known
hypothesis of their K-strategist orientation (Rousk and Frey, 2015). Simultaneously, high
quality litter stimulated the production of fungal but not bacterial hydrolytic enzymes
(Schneider et al., 2012).

38
Bacteria
As opposed to fungi, bacteria were believed to be r-strategic decomposers but latest
studies showed that some bacteria were able to be K-strategists (Bani et al., 2018). Many
bacteria including Proteobacteria, Acidobacteria, Actinobacteria, Firmicutes and
Bacteroidetes were recovered from deadwood, where they most likely cooperated or competed
during decomposition with fungi (Johnston et al., 2016). Although some bacterial groups might
utilize easily accessible low-molecular weight compounds or scavenge the products of
decomposition from other microbes (Šnajdr et al., 2011), others were able to directly participate
in the process by a production of hydrolytic and oxidative enzymes 2014).
For example, glycoside hydrolases -1,4-endoglucanase, cellobiohydrolase and -d-
glucosidase were produced by isolates from groups Actinobacteria, Proteobacteria and
Firmicutes suggesting they were able to completely hydrolytically decompose cellulose (Woo
et al., 2014). Within that, oxidases and peroxidases were highly active in Gordonia
(Actinobacteria) and less active in Aquitalea (Proteobacteria), suggested these strains were
able to degrade lignin although with different efficiency (Woo et al., 2014). Production of
chitinase might be linked to N-rich substrates including fungal biomass. With this enzyme,
bacteria might mediate decomposition of death fungal biomass (Tlaskal et al., 2016) or actively
inhibited fungal growth (Lacombe-Harvey et al., 2018).
Actinobacteria as one of the main litter decomposers
Actinobacteria were one of the most dominating bacterial group during the plant litter
decomposition in different ecosystems (Glassman et al., 2018; Johnston et al., 2016). Soil and
litter dwelling Actinobacteria were advantageous during decomposition due to their abilities to
better colonize the litter thanks to their mycelial growth (De Boer et al., 2005), extracellular
enzymes (Le Roes-Hill and Prins, 2016) and secondary metabolites production. Secondary
metabolites might serve as inhibiting or communicating molecules, which might modulate the
relationships of community during the decomposition (Polkade et al., 2016).
Actinobacteria were known to be litter and soil quality dependent, which was supported
by a study where Actinobacteria but not a fungal biomass increased after complex organic
fertilizers addition to a soil (Jenkins et al., 2009). Actinobacteria were also promoted by

39
inorganic inputs including external S supply (Xu et al., 2016). However, N amendment in the
late stages down-regulated Actinobacteria but not fungal abundance. It might be caused by
limitation of C because Actinobacteria were found to regulate CO2 emission derived from litter
and were thus more than fungi dependent on C availability (Xu et al., 2016). Generally, it was
presumed that Actinobacteria colonize low nutritious and recalcitrant substrates (Kurtbóke,
2017). Since the decomposition process was sorted into different stages according to actual
quality of decomposing litter, Actinobacteria should therefore be associated with the later
stages when recalcitrant residues remained (F Bastian et al., 2009). Some study indeed found
Actinobacteria as late-stage decomposers, however they explained it as a result of
Actinobacteria slow growth, which might indicate low contribution to C flow through microbial
food web (López-Mondéjar et al., 2018).
Concerning the direct effect of climate change during decomposition, although
Actinobacteria were generally considered highly seasonally responsible (Kopecky et al., 2011;
M. Sagova-Mareckova et al., 2015), they could be stable during the altered climatic conditions.
The example is a study by Tikhonova et al., (2019) where Actinobacteria dominated in a part
of the microbial decomposers community, which remained stable during temperature increase.
However, more studies are necessary to understand how Actinobacteria are during
decomposition responsible to direct or indirect climate changes. Since they are subjected to
variety of factors, including pH, the complexity of factors is necessary to take into account for
understanding how climate change affects Actinobacteria community structure and biomass.
Extracellular hydrolytic and oxidative enzymes
Actinobacteria were found to produce variety of extracellular hydrolytic (Lacombe-
Harvey et al., 2018) and oxidative enzymes (Le Roes-Hill and Prins, 2016; Woo et al., 2014).
Production of such enzymes like for example chitinases, cellulases, -glucanases and xylanases
aided them in existing under different conditions thus enable them to inhabited multiple niches
(Bennur et al., 2015). In recent years, Actinobacteria were interestingly found producing
oxidative enzymes like peroxidases and laccase with potential application in biotechnological
processes or bioremediation (Le Roes-Hill and Prins, 2016). Especially laccases have attracted
much attention recently, because, contrary to fungal laccase, Actinobacteria laccases were
active in a wider range of abiotic factors like pH and temperature (Fernandes et al., 2014). With
laccase and other oxidases and peroxidases, Actinobacteria could decompose lignin, although

40
it was assumed that with lower efficiency than fungi (Bugg et al., 2011). With hydrolytic
- -xylosidase they could degrade the low-
molecular weight compounds containing lignocellulosic polymers and potentially cooperated
on a lignin degradation with other microbes like fungi et al.,
2014). Concerning other types of enzymes, Actinobacteria might acquire phosphate from
organic esters by production of phosphatases (Lladó et al., 2017) or nitrogen from N-rich
polymers like fungal hyphs by chitinases (Lacombe-Harvey et al., 2018). Moreover, some
studies suggested that with chitinases Actinobacteria might suppress fungal growth (Gasmi et
al., 2019).
The enzymology of bacteria in general is less explored and one study contemplated that
bacteria break the lignin by oxidative enzymes and laccase due to protection against toxicity of
phenolic compounds rather than to decompose lignin (Lladó et al., 2017). These questions
might be important in relation to other stress like situations including environmental factors
changes and low nutrient contents. Therefore, understanding enzyme production under stress
conditions might be crucial in determining how carbon storage in soil would be affected under
amplified climate conditions.
Relationship of main decomposers
Since the results predicting how abiotic factors explain Actinobacteria community
structure and abundance are not always consistent, the biotic factors such as interaction with
other community members might explain the rest of the unknown variability driving
Actinobacteria (Bani et al., 2018; De Boer et al., 2005; Purahong et al., 2016b). If different
microbial groups have a similar role in decomposition, their niches overlap. The mutual
cooperation or competition, but also different sensitivity to environmental conditions and other
variables, which regulated microbes, resulted in niche separation (Kielak et al., 2016; Leibold
and McPeek, 2006). For example, Actinobacteria abundance decreased over decomposition
from winter to spring, which was contrary to Proteobacteria. It might point on Actinobacteria
seasonality over decomposition process together with niche separation over time with another
dominant bacterial decomposer (Schneider et al., 2012). Similarly, Actinobacteria increased the
most among other bacteria after litter addition to the soil, but more in a case, where fungi did
not dominate (Malik et al., 2016). Simultaneously, it was found that when Actinobacteria

41
increased, especially after organic input to soil, a fungal abundance falls (Jenkins et al., 2009).
It suggested a negative relationship between these two groups, a niche separation and a potential
inhibition of fungi by Actinobacteria. On the contrary, Actinobacteria colonizing organic
substrate might also facilitate a growth of microbes already present in the substrate suggesting
a synergistic interaction (Rousk et al., 2008; Zhao et al., 2016). The mutual relationship between
Actinobacteria and fungi has rarely been studied in a single experiment although Actinobacteria
advantages during decomposition are generally similar for fungi, making Actinobacteria the
main fungal competitors (De Boer et al., 2005).

42
Summary and conclusions
Actinobacteria community in anthropized and pristine caves
The thesis shows that Actinobacteria may serve as indicators of human derived
contamination in caves since Actinobacteria community structure differed between anthropized
and pristine caves (paper I). More precisely, Actinobacteria indicated the least affected caves
(Mouflon, Reille) and one room within the Lascaux Cave (Diaclase) by high proportions of
typical pristine taxa from the order Gaiellales (Zhu et al., 2019), the environmental clone MB-
A2-108_fa (Kumar De, 2019; Zhang et al., 2019) and unknown Actinobacteria taxa
(Rangseekaew and Pathom-Aree, 2019). Rouffignac Cave was identified as being under
intermediate human-derived pressure due to the coexistence of Actinobacteria groups, which
were earlier recognized as typical for pristine caves, namely Jiangellaceae (Rangseekaew and
Pathom-Aree, 2019)) as well as typically anthropized, namely by observation of high richness
but low eveness of Nocardia including potentially pathogenic species (Jurado et al., 2010;
Modra et al., 2017; Roxburgh et al., 2004)). The Lascaux Cave was characterized by high
proportions of Mycobacteriaceae, a group containing potentially pathogenic members (Jurado
et al., 2010; Modra et al., 2017). These findings point to the shift of Actinobacteria community
towards high diversity and proportions of potential human pathogens in the visited caves.
Use of the novel marker gene hsp65 for identification of Actinobacteria species
In the thesis, it is demonstrated that the hsp65 gene marker had higher nucleotide
polymorphism and higher molecular distances than the 16S rRNA gene especially on the lowest
taxonomic level of Actinobacteria (paper I). We designed a database, where sequences of
paralogous genes were recognized and marked but only groups from the class Actinobacteria
were targeted by selective primers and were thus, successfully identified by the database
(Telenti et al., 1993). Although the 16S rRNA marker identified more groups on higher
taxonomic ranks than hsp65 marker, the hsp65 marker identified more species. Therefore, the
hsp65 gene could be used as a supportive marker complementary to the 16S rRNA based studies
where identification of Actinobacteria to the species level is needed. However, the
identification of Actinobacteria with the hsp65 gene marker has a limitation because the

43
database has only a limited number of deposited sequences compared to the 16S rRNA
reference databases and primers were not complementary to all Actinobacteria taxa.
Visual dark marks on walls of the highly anthropized Lascaux Cave in relation to
Actinobacteria communities
The differences of Actinobacteria community between visual marks (black stains and
dark areas) and unmarked areas on cave walls were demonstrated, while higher diversity was
measured in visual marks (paper I). Furthermore, higher proportions of Streptomyces with the
highest proportion of S. mirabilis were identified in the visual marks especially at the cave
entrance. Streptomycetes might contribute to pigment production as was monitored in other
studies (Abdel-Haliem et al., 2013; Cuezva et al., 2012). Moreover, Streptomycetes were
dominating in pigmented areas of other caves like Altamira, Spain (Groth et al., 1999). These
findings suggest that Streptomyces were influenced by visual marks and potentially, might be
involved in the visual marks formation. However, more detailed studies on the pigment
production or interaction with the pigment forming fungi with Streptomyces is needed for
understanding their role.
Actinobacteria communities in relation to litter changes during decomposition
Concerning the decomposition process in temperate climate, Actinobacteria abundance
was not favorized by any studied litter type or its origin. but their dynamics over one year were
dependent on litter type and their abundance increased in later stages of decomposition (paper
II). It implies that Actinobacteria were functionally redundant since their decomposition
strategies function according to the litter quality rather than the litter type and origin (Glassman
et al., 2018) (paper II). In the Mediterranean climate, Actinobacteria preferred deciduous litter
with the highest nutrient content but also with structural compounds such as lignin, cellulose,
hemicellulose regardless of its origin (paper IV). Similarly, in a mountainous forest,
Actinobacteria dominated later-stage bacterial community on the more resistant spruce litter
compared to the beech litter (paper III).
These results show that Actinobacteria were mostly favorized by a recalcitrant litter or
stages, when the litter became recalcitrant (F Bastian et al., 2009; Bray et al., 2012; Bugg et al.,

44
2011; Fierer et al., 2007). Moreover, Actinobacteria were able to adapt to changes in a litter,
however, their dominance did not lead to an increased rate of decomposition (paper III, IV).
It shows that Actinobacteria were adaptable to litter alteration with a potential to dominate the
recalcitrant litter but the changes did not promote decomposition and thus also carbon and
nutrients release.
Actinobacteria adaptability to changes in habitat properties
In the thesis, Actinobacteria occurring in the litter were not affected by rainfall reduction
in Mediterranean forests (paper IV) and also in the temperate mountainous forest, other than
climate characteristics affected their abundance (paper III). The comparison of temperate
grassland and beech forest showed that the grassland harbored higher abundance of
Actinobacteria but the decomposition was overall faster at the forest site (paper II).
Therefore, not only climatic characteristics, but also another factor or complex site
conditions affected Actinobacteria in these habitats (paper II, III, IV). Actinobacteria were
considered slow-growing thus, their response to actual weather changes might be retarded
(López-Mondéjar et al., 2018) or they might be resistant to weather changes due to the spore
formation (Acosta- -Z. Fang et al., 2017). When comparing the forest
habitats, Actinobacteria were able to adapt to introduced coniferous forests in both
Mediterranean and temperate mountainous climate since they finally dominated the spruce or
pine bacterial community in comparison to the native beech or oak deciduous forests,
respectively (papers III, IV). Generally, acidic and nutrient-limited coniferous forest might
enable the increase of Actinobacteria proportions because they are more than other community
members adaptable to such harsh conditions, again suggesting Actinobacteria as oligotrophic
and adaptable taxa.
However, the dominance of Actinobacteria at the respective sites (grassland (paper II),
coniferous forests (papers III, IV)) did not lead to more intense decomposition of litter contrary
to deciduous forests (paper II, III, IV). These results suggest that climate change would affect
Actinobacteria indirectly through habitat alteration and the altered habitats dominated by
Actinobacteria might be linked to slower carbon release from the litter.

45
Actinobacteria as late-stage decomposers with opposite patterns to other decomposers
The succession of microbial decomposers during decomposition with closer focus on
Actinobacteria and fungi has been rarely investigated. In the temperate beech forest and
grassland, Actinobacteria were similarly to fungi driven by a litter quality but an overall
abundance of fungi was comparable between the sites while Actinobacteria abundance was site
specific. Moreover, Actinobacteria were similarly to Firmicutes late-stage colonizers but fungi
and Alphaproteobacteria were initial stage litter colonizers (paper II). In the Mediterranean
climate, Actinobacteria were not affected by rainfall reduction contrary to fungi (paper IV).
There, Actinobacteria were favorized by deciduous litter, while fungi mostly by coniferous
litter except for the coniferous forest, where both groups coexisted in a high abundance at the
same litter (papers IV). These findings point to the niche separation between Actinobacteria
and fungi but also Actinobacteria and other decomposers during litter decomposition
(Firmicutes, Alphaproteobacteria) (paper II).
Concerning the Actinobacteria and fungi, they had opposite strategies driven by
different factors (paper II, III, IV) and their succession over time was opposite (paper II).
However, in certain situations such as on the most palatable litter type in the coniferous forest
(paper IV), intermediately recalcitrant litter type in the grassland (paper II)) their niches were
overlapping (paper II, IV), which might point to a synergistic interaction (Meidute et al.,
2008). Overall, Actinobacteria and fungi were litter quality dependent however, fungi seemed
to be affected more by direct climatic factors (papers III, IV) and Actinobacteria more by
indirect climatic factors such as habitat alteration (papers II, III, IV). Therefore, the climate
derived changes leading to altered litter or precipitation might shift the fungal to actinobacterial
ratio and thus the relationship between the two groups potentially leading to an altered
decomposition process and carbon cycling.
Concluding remarks
From the results described above, I conclude that Actinobacteria communities might
play important roles in anthropogenic and natural habitats and are directly and indirectly
influenced by human-derived changes. The thesis might help in improving the study of
Actinobacteria with a novel marker gene hsp65. We also suggest that Actinobacteria are
adaptable members of microbial communities, particularly to man-induced changes in caves

46
and during decomposition processes on a plant litter. Consequently, this taxonomic group might
be proposed as a bioindicator in monitoring of environmental quality or in prediction models.
Thus, Actinobacteria deserve a closer attention and more studies showing how their activity is
modified by human derived changes. Moreover, our results show that interactions between
Actinobacteria and other microbial members, especially fungi, might play an important role in
driving the ecology of Actinobacteria in the studied environments. Thus, new experiments that
would uncover the positive or negative interactions between Actinobacteria and fungi are
proposed for understanding their combined contribution to decomposition and carbon cycling.

47
References Abdel-Haliem, M.E.F., Sakr, A.A., Ali, M.F., Ghaly, M.F., Sohlenkamp, C., 2013. Characterization of
Streptomyces isolates causing colour changes of mural paintings in ancient Egyptian tombs. Microbiol. Res. 168, 428–437. https://doi.org/10.1016/j.micres.2013.02.004
Abdu, N., Abdullahi, A.A., Abdulkadir, A., 2017. Heavy metals and soil microbes. Environ. Chem. Lett. 15, 65–84. https://doi.org/10.1007/s10311-016-0587-x
Acosta- e-Kucera, J., Zak, J., Wester, D., Cox, S., 2014. Predominant bacterial and fungal assemblages in agricultural soils during a record drought/heat wave and linkages to enzyme activities of biogeochemical cycling. Appl. Soil Ecol. 84, 69–82. https://doi.org/10.1016/j.apsoil.2014.06.005
Adékambi, T., Drancourt, M., 2004. Dissection of phylogenetic relationships among 19 rapidly growing Mycobacterium species by 16S rRNA, hsp65, sodA, recA and rpoB gene sequencing. Int. J. Syst. Evol. Microbiol. 54, 2095–2105. https://doi.org/10.1099/ijs.0.63094-0
Adetutu, E.M., Thorpe, K., Shahsavari, E., Bourne, S., Cao, X., Fard, R.M.N., Kirby, G., Ball, A.S., 2012. Bacterial community survey of sediments at Naracoorte Caves, Australia. Int. J. Speleol. 41, 137–147. https://doi.org/10.5038/1827-806X.41.2.2
Agustinho, D.P., Nosanchuk, J.D., 2017. Functions of Fungal Melanins, in: Reference Module in Life Sciences. Elsevier. https://doi.org/10.1016/b978-0-12-809633-8.12091-6
Al Khatib, M., Harir, M., Costa, J., Baratto, M., Schiavo, I., Trabalzini, L., Pollini, S., Rossolini, G., Basosi, R., Pogni, R., 2018. Spectroscopic Characterization of Natural Melanin from a Streptomyces cyaneofuscatus Strain and Comparison with Melanin Enzymatically Synthesized by Tyrosinase and Laccase. Molecules 23, 1916. https://doi.org/10.3390/molecules23081916
Alonso, L., Creuzé-des-Châtelliers, C., Trabac, T., Dubost, A., Moënne-Loccoz, Y., Pommier, T., 2018. Rock substrate rather than black stain alterations drives microbial community structure in the passage of Lascaux Cave. Microbiome 6, 216. https://doi.org/10.1186/s40168-018-0599-9
Alvarez, A., Saez, J.M., Davila Costa, J.S., Colin, V.L., Fuentes, M.S., Cuozzo, S.A., Benimeli, C.S., Polti, M.A., Amoroso, M.J., 2017. Actinobacteria: Current research and perspectives for bioremediation of pesticides and heavy metals. Chemosphere. https://doi.org/10.1016/j.chemosphere.2016.09.070
Water Environ. Res. wer.1355. https://doi.org/10.1002/wer.1355
Aszalós, J.M., Szabó, A., Megyes, M., Anda, D., Nagy, B., Borsodi, A.K., 2020. Bacterial Diversity of a High-Altitude Permafrost Thaw Pond Located on Ojos del Salado (Dry Andes, Altiplano-Atacama Region). Astrobiology 20, 754–765. https://doi.org/10.1089/ast.2018.2012
Baker, N.R., Khalili, B., Martiny, J.B.H., Allison, S.D., 2018. Microbial decomposers not constrained by climate history along a Mediterranean climate gradient in southern California. Ecology 99, 1441–1452. https://doi.org/10.1002/ecy.2345
Banerjee, S., Joshi, S.R., 2013. Insights into cave architecture and the role of bacterial biofilm. Proc. Natl. Acad. Sci. India Sect. B - Biol. Sci. 83, 277–290. https://doi.org/10.1007/s40011-012-0149-3
Bani, A., Pioli, S., Ventura, M., Panzacchi, P., Borruso, L., Tognetti, R., Tonon, G., Brusetti, L., 2018. The role of microbial community in the decomposition of leaf litter and deadwood. Appl. Soil Ecol. 126, 75–84.
Barka, E.A., Vatsa, P., Sanchez, L., Gaveau-Vaillant, N., Jacquard, C., Klenk, H.-P., Clément, C., Ouhdouch, Y., van Wezel, G.P., 2016. Taxonomy, Physiology, and Natural Products of Actinobacteria. Microbiol. Mol. Biol. Rev. 80, 1–43. https://doi.org/10.1128/mmbr.00019-15
Barton, H.A., Jurado, V., 2007. What’s Up Down There? Microbial Diversity in Caves Microorganisms in caves survive under nutrient-poor conditions and are metabolically versatile and unexpectedly diverse. Microbe 2, 132–138.

48
Bastian, Fabiola, Alabouvette, C., Journal, O., 2009. Lights and shadows on the conservation of a rock art cave: the case of Lascaux cave International Journal of Speleology International Journal of Speleology Lights and shadows on the conservation of a rock art cave: The case of Lascaux Cave, International Journal of Speleology.
Bastian, F, Bouziri, L., Nicolardot, B., Ranjard, L., 2009. Impact of wheat straw decomposition on successional patterns of soil microbial community structure. Soil Biol. Biochem. 41, 262–275.
Bastian, F., Jurado, V., Novakova, A., Alabouvette, C., Saiz-Jimenez, C., 2010. The microbiology of Lascaux Cave. Microbiology 156, 644–652. https://doi.org/10.1099/mic.0.036160-0
Bastian, F., Orial, G., François, A., Alabouvette, C., 2007. La grotte de Labactéries et champignons interagissent. Biofutur 26, 28–31.
Bennur, T., Kumar, A.R., Zinjarde, S., Javdekar, V., 2015. Nocardiopsis species: Incidence, ecological roles and adaptations. Microbiol. Res. 174, 33–47. https://doi.org/10.1016/J.MICRES.2015.03.010
Bentley, S.D., Corton, C., Brown, S.E., Barron, A., Clark, L., Doggett, J., Harris, B., Ormond, D., Quail, M.A., May, G., Francis, D., Knudson, D., Parkhill, J., Ishimaru, C.A., 2008. Genome of the actinomycete plant pathogen Clavibacter michiganensis subsp. sepedonicus suggests recent niche adaptation. J. Bacteriol. 190, 2150–2160. https://doi.org/10.1128/JB.01598-07
-Bucur, R., Moldovan, O.T., Kenesz, M., Constantin, S., 2019. Yearly microbial cycle of human exposed surfaces in show caves. Subterr. Biol. 31, 1–14. https://doi.org/10.3897/subtbiol.31.34490
Berg, B., 2018. Decomposing litter; limit values; humus accumulation, locally and regionally. Appl. Soil Ecol. 123, 494–508. https://doi.org/10.1016/J.APSOIL.2017.06.026
Berg, B., 2000. Litter decomposition and organic matter turnover in northern forest soils. For. Ecol. Manage. 133, 13–22. https://doi.org/10.1016/S0378-1127(99)00294-7
Bhullar, K., Waglechner, N., Pawlowski, A., Koteva, K., Banks, E.D., Johnston, M.D., Barton, H.A., Wright, G.D., 2012. Antibiotic Resistance Is Prevalent in an Isolated Cave Microbiome. PLoS One 7, e34953. https://doi.org/10.1371/journal.pone.0034953
Boiron, P., Provost, F., Chevrier, G., Dupont, B., 1992. Review of nocardial infections in France 1987 to 1990. Eur. J. Clin. Microbiol. Infect. Dis. 11, 709–714. https://doi.org/10.1007/BF01989975
Bradford, M.A., Ii, R.J.W., Baldrian, P., Crowther, T.W., Maynard, D.S., Oldfield, E.E., Wieder, W.R., Wood, S.A., King, J.R., 2014. Climate fails to predict wood decomposition at regional scales. https://doi.org/10.1038/NCLIMATE2251
Bragança, I., Mucha, A.P., Tomasino, M.P., Santos, F., Lemos, P.C., Delerue-Matos, C., Domingues, V.F., 2019. Deltamethrin impact in a cabbage planted soil: Degradation and effect on microbial community structure. Chemosphere 220, 1179–1186. https://doi.org/10.1016/j.chemosphere.2019.01.004
Bray, S.R., Kitajima, K., Mack, M.C., 2012. Temporal dynamics of microbial communities on decomposing leaf litter of 10 plant species in relation to decomposition rate. Soil Biol. Biochem. 49, 30–37. https://doi.org/10.1016/j.soilbio.2012.02.009
Bugg, T.D.H., Ahmad, M., Hardiman, E.M., Singh, R., 2011. The emerging role for bacteria in lignin degradation and bio-product formation. Curr. Opin. Biotechnol. 22, 394–400. https://doi.org/10.1016/j.copbio.2010.10.009
Buresova, A., Kopecky, J., Hrdinkova, V., Kamenik, Z., Omelka, M., Sagova-Mareckova, M., 2019. Succession of microbial decomposers is determined by litter type, but site conditions drive decomposition rates. Appl. Environ. Microbiol. 85. https://doi.org/10.1128/AEM.01760-19
Carlo, E. Di, Chisesi, R., Barresi, G., Barbaro, S., Lombardo, G., Rotolo, V., Sebastianelli, M., Travagliato, G., Palla, F., 2016. Fungi and Bacteria in Indoor Cultural Heritage Environments: Microbial-related Risks for Artworks and Human Health. Environ. Ecol. Res. 4, 257–264. https://doi.org/10.13189/eer.2016.040504
Chen, X., Zhao, Y., Zhao, X., Wu, J., Zhu, L., Zhang, X., Wei, Z., Liu, Y., He, P., 2020. Selective pressures of

49
heavy metals on microbial community determine microbial functional roles during composting: Sensitive, resistant and actor. J. Hazard. Mater. 398, 122858. https://doi.org/10.1016/j.jhazmat.2020.122858
Cirigliano, A., Tomassetti, M.C., Di Pietro, M., Mura, F., Maneschi, M.L., Gentili, M.D., Cardazzo, B., Arrighi, C., Mazzoni, C., Negri, R., Rinaldi, T., 2018. Calcite moonmilk of microbial origin in the Etruscan Tomba degli Scudi in Tarquinia, Italy. Sci. Rep. 8, 1–10. https://doi.org/10.1038/s41598-018-34134-y
Cuezva, S., Fernandez- -Marine, M., Serrano-Ortiz, P., Hermosin, B., Cañaveras, J.C., Sanchez-Moral, S., Saiz-Jimenez, C., 2012. The biogeochemical role of Actinobacteria in Altamira Cave, Spain. FEMS Microbiol. Ecol. 81, 281–290. https://doi.org/10.1111/j.1574-6941.2012.01391.x
Cuezva, S., Sanchez-Moral, S., Saiz-Jimenez, C., Carlos Canaveras, J., 2009. Microbial Communities and Associated Mineral Fabrics in Altamira Cave, Spain. Int. J. Speleol. 38, 83–92.
Davis, M.C., Messina, M.A., Nicolosi, G., Petralia, S., Baker, M.D., Mayne, C.K.S., Dinon, C.M., Moss, C.J., Onac, B.P., Garey, J.R., 2020. Surface runoff alters cave microbial community structure and function. PLoS One 15, e0232742. https://doi.org/10.1371/journal.pone.0232742
De Boer, W., Folman, L.B., Summerbell, R.C., Boddy, L., 2005. Living in a fungal world: Impact of fungi on soil bacterial niche development. FEMS Microbiol. Rev. 29, 795–811. https://doi.org/10.1016/j.femsre.2004.11.005
De La Rosa, J.M., Martin-Sanchez, P.M., Sanchez-Cortes, S., Hermosin, B., Knicker, H., Saiz-Jimenez, C., 2017. Structure of melanins from the fungi Ochroconis lascauxensis and Ochroconis anomala contaminating rock art in the Lascaux Cave. Sci. Rep. 7, 1–11. https://doi.org/10.1038/s41598-017-13862-7
De Mandal, S., Chatterjee, R., Kumar, N.S., 2017. Dominant bacterial phyla in caves and their predicted functional roles in C and N cycle. BMC Microbiol. 17, 1–9. https://doi.org/10.1186/s12866-017-1002-x
Delgado- -Palacios, P., Milla, R., Gallardo, A., Maestre, F.T., 2015. Soil characteristics determine soil carbon and nitrogen availability during leaf litter decomposition regardless of litter quality. Soil Biol. Biochem. 81, 134–142. https://doi.org/10.1016/j.soilbio.2014.11.009
Delgado-Baquerizo, M., Maestre, F.T., Reich, P.B., Jeffries, T.C., Gaitan, J.J., Encinar, D., Berdugo, M., Campbell, C.D., Singh, B.K., 2016. Microbial diversity drives multifunctionality in terrestrial ecosystems. Nat. Commun. 7, 1–8. https://doi.org/10.1038/ncomms10541
Dhami, N.K., Mukherjee, A., Watkin, E.L.J., 2018. Microbial diversity and mineralogical-mechanical properties of calcitic cave speleothems in natural and in vitro biomineralization conditions. Front. Microbiol. 9. https://doi.org/10.3389/fmicb.2018.00040
Diancourt, L., Passet, V., Verhoef, J., Grimont, P.A.D., Brisse, S., 2005. Multilocus Sequence Typing of Klebsiella pneumoniae Nosocomial Isolates. J. Clin. Microbiol. 43, 4178–4182. https://doi.org/10.1128/JCM.43.8.4178-4182.2005
Fang, B.-Z., Salam, N., Han, M.-X., Jiao, J.-Y., Cheng, J., Wei, D.-Q., Xiao, M., Li, W.-J., 2017. Insights on the Effects of Heat Pretreatment, pH, and Calcium Salts on Isolation of Rare Actinobacteria from Karstic Caves. Front. Microbiol. 8. https://doi.org/10.3389/fmicb.2017.01535
Fang, B.Z., Hua, Z.S., Han, M.X., Zhang, Z.T., Wang, Y.H., Yang, Z.W., Zhang, W.Q., Xiao, M., Li, W.J., 2017. Nonomuraea cavernae sp. Nov., a novel actinobacterium isolated from a karst cave sample. Int. J. Syst. Evol. Microbiol. 67, 4692–4697. https://doi.org/10.1099/ijsem.0.002364
Fernandes, A.R.T., da Silveira, W.B., Passos, M.L.F., Zucchi, T.D., 2014. Laccases from Actinobacteria-What We Have and What to Expect. SciRes. Adv. Microbiol. 4, 285–296. https://doi.org/10.4236/aim.2014.46035
Field, C.B., Barros, V., Stocker, T.F., Dahe, Q., Jon Dokken, D., Ebi, K.L., Mastrandrea, M.D., Mach, K.J., Plattner, G.K., Allen, S.K., Tignor, M., Midgley, P.M., 2012. Managing the risks of extreme events and disasters to advance climate change adaptation: Special report of the intergovernmental panel on climate change, Managing the Risks of Extreme Events and Disasters to Advance Climate Change Adaptation:

50
Special Report of the Intergovernmental Panel on Climate Change. https://doi.org/10.1017/CBO9781139177245
Fierer, N., Bradford, M.A., Jackson, R.B., 2007. Toward an ecological classification of soil bacteria. Ecology 88, 1354–1364. https://doi.org/10.1890/05-1839
Fox, G.E., Wisotzkey, J.D., Jurtshuk, P., 1992. How Close Is Close: 16S rRNA Sequence Identity May Not Be Sufficient To Guarantee Species Identity. Int. J. Syst. Bacteriol. 42, 166–170. https://doi.org/10.1099/00207713-42-1-166
Francioli, D., Schulz, E., Lentendu, G., Wubet, T., Buscot, F., Reitz, T., 2016. Mineral vs. organic amendments: Microbial community structure, activity and abundance of agriculturally relevant microbes are driven by long-term fertilization strategies. Front. Microbiol. 7, 1446. https://doi.org/10.3389/fmicb.2016.01446
K., Franklin, J., Nawrot, J., Groninger, J.W., Stahl, P.D., 2013. Soil biota in post-mining sites along a climatic gradient in the USA: Simple communities in shortgrass prairie recover faster than complex communities in tallgrass prairie and forest. Soil Biol. Biochem. 67. https://doi.org/10.1016/j.soilbio.2013.08.025
Frouz, J.meta-analysis of enclosure studies. Eur. J. Soil Biol. 68, 18–24. https://doi.org/10.1016/j.ejsobi.2015.03.002
Gagneux, S., 2018. Ecology and evolution of Mycobacterium tuberculosis. Nat. Rev. Microbiol. https://doi.org/10.1038/nrmicro.2018.8
-Palacios, P., Shaw, E.A., Wall, D.H., Hättenschwiler, S., 2016. Temporal dynamics of biotic and abiotic drivers of litter decomposition. Ecol. Lett. 19, 554–563. https://doi.org/10.1111/ele.12590
Garcia, M.O., Templer, P.H., Sorensen, P.O., Sanders-DeMott, R., Groffman, P.M., Bhatnagar, J.M., 2020. Soil Microbes Trade-Off Biogeochemical Cycling for Stress Tolerance Traits in Response to Year-Round Climate Change. Front. Microbiol. 11, 616. https://doi.org/10.3389/fmicb.2020.00616
Gasmi, M., Kitouni, M., Carro, L., Pujic, P., Normand, P., Boubakri, H., 2019. Chitinolytic actinobacteria isolated from an Algerian semi-arid soil: development of an antifungal chitinase-dependent assay and GH18 chitinase gene identification. Ann. Microbiol. 69, 395–405. https://doi.org/10.1007/s13213-018-1426-z
Ge, X., Zeng, L., Xiao, W., Huang, Z., Geng, X., Tan, B., 2013. Effect of litter substrate quality and soil nutrients on forest litter decomposition: A review. Acta Ecol. Sin. 33, 102–108. https://doi.org/10.1016/j.chnaes.2013.01.006
Gillings, M.R., Paulsen, I.T., 2014. Microbiology of the anthropocene. Anthropocene 5, 1–8. https://doi.org/10.1016/j.ancene.2014.06.004
Glassman, S.I., Weihe, C., Li, J., Albright, M.B.N., Looby, C.I., Martiny, A.C., Treseder, K.K., Allison, S.D., Martiny, J.B.H., 2018. Decomposition responses to climate depend on microbial community composition. Proc. Natl. Acad. Sci. U. S. A. 115, 11994–11999. https://doi.org/10.1073/pnas.1811269115
Gonzalez-Pimentel, J.L., Miller, A.Z., Jurado, V., Laiz, L., Pereira, M.F.C., Saiz-Jimenez, C., 2018. Yellow coloured mats from lava tubes of La Palma (Canary Islands, Spain) are dominated by metabolically active Actinobacteria. Sci. Rep. 8, 1–11. https://doi.org/10.1038/s41598-018-20393-2
Gross, M., 2019. Permafrost thaw releases problems. Curr. Biol. 29, R39–R41. https://doi.org/10.1016/j.cub.2018.12.045
Groth, I., Vettermann, R., Schuetze, B., Schumann, P., Saiz-Jimenez, C., 1999. Actinomycetes in Karstic caves of northern Spain (Altamira and Tito Bustillo). J. Microbiol. Methods 36, 115–122. https://doi.org/10.1016/S0167-7012(99)00016-0
Gtari, M., Ghodhbane-Gtari, F., Nouioui, I., Ktari, A., Hezbri, K., Mimouni, W., Sbissi, I., Ayari, A., Yamanaka, T., Normand, P., Tisa, L.S., Boudabous, A., 2015. Cultivating the uncultured: Growing the recalcitrant

51
cluster-2 Frankia strains. Sci. Rep. 5. https://doi.org/10.1038/srep13112
Hamedi, J., Kafshnouchi, M., Ranjbaran, M., 2019. A Study on actinobacterial diversity of Hampoeil cave and screening of their biological activities. Saudi J. Biol. Sci. 26, 1587–1595. https://doi.org/10.1016/j.sjbs.2018.10.010
Hansen, A.A., Herbert, R.A., Mikkelsen, K., Jensen, L.L., Kristoffersen, T., Tiedje, J.M., Lomstein, B.A., Finster, K.W., 2007. Viability, diversity and composition of the bacterial community in a high Arctic permafrost soil from Spitsbergen, Northern Norway. Environ. Microbiol. 9, 2870–2884. https://doi.org/10.1111/j.1462-2920.2007.01403.x
Hershey, O.S., Barton, H.A., 2018. The Microbial Diversity of Caves. Springer, Cham, pp. 69–90. https://doi.org/10.1007/978-3-319-98852-8_5
Hershey, O.S., Kallmeyer, J., Wallace, A., Barton, M.D., Barton, H.A., 2018. High microbial diversity despite extremely low biomass in a deep karst aquifer. Front. Microbiol. 9. https://doi.org/10.3389/fmicb.2018.02823
Hirsch, Penny R., Mauchline, T.H., Clark, I.M., 2010. Culture-independent molecular techniques for soil microbial ecology. Soil Biol. Biochem. 42, 878–887. https://doi.org/10.1016/J.SOILBIO.2010.02.019
Hirsch, Penny R, Mauchline, T.H., Clark, I.M., 2010. Culture-independent molecular techniques for soil microbial ecology. Soil Biol. Biochem. 42, 878–887. https://doi.org/10.1016/j.soilbio.2010.02.019
Holmfeldt, K., Dziallas, C., Titelman, J., Pohlmann, K., Grossart, H.-P., Riemann, L., 2009. Diversity and abundance of freshwater Actinobacteria along environmental gradients in the brackish northern Baltic Sea. Environ. Microbiol. 11, 2042–2054. https://doi.org/10.1111/j.1462-2920.2009.01925.x
Hoyos, M., Cañaveras, J.C., Sánchez-Moral, S., Sanz-Rubio, E., Soler, V., 1998. Microclimatic characterization of a karstic cave: Human impact on microenvironmental parameters of a prehistoric rock art cave (Candamo Cave, northern Spain). Environ. Geol. 33, 231–242. https://doi.org/10.1007/s002540050242
Jarvis, P., Rey, A., Petsikos, C., Wingate, L., Rayment, M., Pereira, J., Banza, J., David, J., Miglietta, F., Borghetti, M., Manca, G., Valentini, R., 2007. Drying and wetting of Mediterranean soils stimulates decomposition and carbon dioxide emission: The “Birch effect,” in: Tree Physiology. Heron Publishing, pp. 929–940. https://doi.org/10.1093/treephys/27.7.929
Jenkins, S.N., Waite, I.S., Blackburn, A., Husband, R., Rushton, S.P., Manning, D.C., O’Donnell, A.G., 2009. Actinobacterial community dynamics in long term managed grasslands. Antonie van Leeuwenhoek, Int. J. Gen. Mol. Microbiol. 95, 319–334. https://doi.org/10.1007/s10482-009-9317-8
Jiang, J.-R., Cai, L., Liu, F., 2017. Oligotrophic fungi from a carbonate cave, with three new species of Cephalotrichum. Mycology 8, 164–177. https://doi.org/10.1080/21501203.2017.1366370
Jin, V.L., Haney, R.L., Fay, P.A., Polley, H.W., 2013. Soil type and moisture regime control microbial C and N mineralization in grassland soils more than atmospheric CO2-induced changes in litter quality. Soil Biol. Biochem. 58, 172–180. https://doi.org/10.1016/j.soilbio.2012.11.024
Johnston, M.D., Muench, B.A., Banks, E.D., Barton, H.A., 2012. Human urine in Lechuguilla cave: the microbiological impact and potential for bioremediation. J. Cave Karst Stud. 74, 278–291. https://doi.org/10.4311/2011MB0227
Johnston, S.R., Boddy, L., Weightman, A.J., 2016. Bacteria in decomposing wood and their interactions with wood-decay fungi. FEMS Microbiol. Ecol. 92, fiw179. https://doi.org/10.1093/femsec/fiw179
Jurado, V., Boiron, P., Kroppenstedt, R.M., Laurent, F., Couble, A., Laiz, L., Klenk, H.-P., Gonzalez, J.M., Saiz-Jimenez, C., Mouniee, D., Bergeron, E., Rodriguez-Nava, V., 2008. Nocardia altamirensis sp. nov., isolated from Altamira cave, Cantabria, Spain. Int. J. Syst. Evol. Microbiol. 58, 2210–2214. https://doi.org/10.1099/ijs.0.65482-0
Jurado, V., Kroppenstedt, R.M., Saiz-Jimenez, C., Klenk, H.P., Mouniée, D., Laiz, L., Couble, A., Pötter, G., -Nava, V., 2009. Hoyosella altamirensis gen. nov., sp. nov., a new member of the
order Actinomycetales isolated from a cave biofilm. Int. J. Syst. Evol. Microbiol. 59, 3105–3110.

52
https://doi.org/10.1099/ijs.0.008664-0
Jurado, V., Laiz, L., Rodriguez-Nava, V., Boiron, P., Hermosin, B., Sanchez-Moral, S., Saiz-Jimenez, C., 2010. Pathogenic and opportunistic microorganisms in caves. Int. J. Speleol. 39 (1), 15–24.
Kaisermann, A., Maron, P.A., Beaumelle, L., Lata, J.C., 2015. Fungal communities are more sensitive indicators to non-extreme soil moisture variations than bacterial communities. Appl. Soil Ecol. 86, 158–164. https://doi.org/10.1016/j.apsoil.2014.10.009
Karunarathna, S.C., Dong, Y., Karasaki, S., Tibpromma, S., Hyde, K.D., Lumyong, S., Xu, J., Sheng, J., Mortimer, P.E., 2020. Discovery of novel fungal species and pathogens on bat carcasses in a cave in Yunnan Province, China. Emerg. Microbes Infect. 9, 1554–1566. https://doi.org/10.1080/22221751.2020.1785333
Kielak, A.M., Scheublin, T.R., Mendes, L.W., van Veen, J.A., Kuramae, E.E., 2016. Bacterial community succession in pine-wood decomposition. Front. Microbiol. 7, 231. https://doi.org/10.3389/fmicb.2016.00231
Kopecky, J., Kyselkova, M., Omelka, M., Cermak, L., Novotna, J., Grundmann, G.L., Moënne-Loccoz, Y., Sagova-Mareckova, M., 2011. Actinobacterial community dominated by a distinct clade in acidic soil of a waterlogged deciduous forest. FEMS Microbiol. Ecol. 78, 386–394. https://doi.org/10.1111/j.1574-6941.2011.01173.x
Kumar De, A., 2019. Profiling bacterial diversity of B2 Cave, a limestone cave of Baratang, Andaman and Nicobar islands, India. Proc. Indian Natl. Sci. Acad. 85, 853–862. https://doi.org/10.16943/ptinsa/2019/49589
Kurtbóke, D., 2017. Ecology and habitat distribution of actinobacteria, in: Biology and Biotechnology of Actinobacteria. Springer International Publishing, pp. 123–149. https://doi.org/10.1007/978-3-319-60339-1_6
Lacombe-Harvey, M.È., Brzezinski, R., Beaulieu, C., 2018. Chitinolytic functions in actinobacteria: ecology, enzymes, and evolution. Appl. Microbiol. Biotechnol. 102, 7219–7230. https://doi.org/10.1007/s00253-018-9149-4
Lange, M., Eisenhauer, N., Sierra, C.A., Bessler, H., Engels, C., Griffiths, R.I., Mellado-Vázquez, P.G., Malik, A.A., Roy, J., Scheu, S., Steinbeiss, S., Thomson, B.C., Trumbore, S.E., Gleixner, G., 2015. Plant diversity increases soil microbial activity and soil carbon storage. Nat. Commun. 6, 6707. https://doi.org/10.1038/ncomms7707
Lavoie, K.H., Winter, A.S., Read, K.J.H., Hughes, E.M., Spilde, M.N., Northup, D.E., 2017. Comparison of bacterial communities from lava cave microbial mats to overlying surface soils from Lava Beds National Monument, USA. PLoS One 12, e0169339. https://doi.org/10.1371/journal.pone.0169339
Le Roes-Hill, M., Prins, A., 2016. Biotechnological Potential of Oxidative Enzymes from Actinobacteria, in: Actinobacteria - Basics and Biotechnological Applications. pp. 200–226. https://doi.org/10.5772/61321
Lee, H., Fitzgerald, J., Hewins, D.B., McCulley, R.L., Archer, S.R., Rahn, T., Throop, H.L., 2014. Soil moisture and soil-litter mixing effects on surface litter decomposition: A controlled environment assessment. Soil Biol. Biochem. 72, 123–132. https://doi.org/10.1016/j.soilbio.2014.01.027
Lee, I.S., Kim, O.K., Chang, Y.Y., Bae, B., Kim, H.H., Baek, K.H., 2002. Heavy metal concentrations and enzyme activities in soil from a contaminated Korean shooting range. J. Biosci. Bioeng. 94, 406–411. https://doi.org/10.1016/S1389-1723(02)80217-1
Lee, S.D., 2006. Nocardia jejuensis sp. nov., a novel actinomycete isolated from a natural cave on Jeju Island, Republic of Korea. Int. J. Syst. Evol. Microbiol. 56, 559–562. https://doi.org/10.1099/ijs.0.63866-0
Leibold, M., McPeek, M., 2006. Coexistence of the niche and neutral perspectives in community ecology. Ecology 87, 1399–1410.
Leuko, S., Koskinen, K., Sanna, L., D’Angeli, I.M., De Waele, J., Marcia, P., Moissl-Eichinger, C., Rettberg, P., 2017. The influence of human exploration on the microbial community structure and ammonia oxidizing

53
potential of the Su Bentu limestone cave in Sardinia, Italy. PLoS One 12, e0180700. https://doi.org/10.1371/journal.pone.0180700
Lewis, K., 2009. Persisters, Biofilms, and the Problem of Cultivability. Springer, Berlin, Heidelberg, pp. 203–216. https://doi.org/10.1007/978-3-540-85465-4_7
Li, H.R., Yu, Y., Luo, W., Zeng, Y.X., 2010. Marisediminicola antarctica gen. nov., sp. nov., an actinobacterium isolated from the Antarctic. Int. J. Syst. Evol. Microbiol. 60, 2535–2539. https://doi.org/10.1099/ijs.0.018754-0
Lladó, S., López-Mondéjar, R., Baldrian, P., 2017. Forest Soil Bacteria: Diversity, Involvement in Ecosystem Processes, and Response to Global Change. Microbiol. Mol. Biol. Rev. 81, e00063-16. https://doi.org/10.1128/MMBR.00063-16
López-Mondéjar, R., Brabcová, V., Štursová, M., Davidová, A., Jansa, J., Cajthaml, T., Baldrian, P., 2018. Decomposer food web in a deciduous forest shows high share of generalist microorganisms and importance of microbial biomass recycling. ISME J. 12, 1768–1778. https://doi.org/10.1038/s41396-018-0084-2
Maciejewska, Baurain, D., Compère, P., Carnol, M., Barton, H.A., Rigali, S., 2017. Assessment of the Potential Role of Streptomyces in Cave Moonmilk Formation. Front. Microbiol. 8, 1181. https://doi.org/10.3389/fmicb.2017.01181
Makhalanyane, T.P., Valverde, A., Gunnigle, E., Frossard, A., Ramond, J.-B., Cowan, D.A., 2015. Microbial ecology of hot desert edaphic systems. FEMS Microbiol. Rev. 39, 203–221. https://doi.org/10.1093/femsre/fuu011
Malik, A.A., Chowdhury, S., Schlager, V., Oliver, A., Puissant, J., Vazquez, P.G.M., Jehmlich, N., von Bergen, M., Griffiths, R.I., Gleixner, G., 2016. Soil Fungal:Bacterial Ratios Are Linked to Altered Carbon Cycling. Front. Microbiol. 7, 1247. https://doi.org/10.3389/fmicb.2016.01247
Manivasagan, P., Venkatesan, J., Sivakumar, K., Kim, S.K., 2013. Actinobacterial melanins: Current status and perspective for the future. World J. Microbiol. Biotechnol. 29, 1737–1750. https://doi.org/10.1007/s11274-013-1352-y
Martens, M., Dawyndt, P., Coopman, R., Gillis, M., De Vos, P., Willems, A., 2008. Advantages of multilocus sequence analysis for taxonomic studies: A case study using 10 housekeeping genes in the genus Ensifer (including former Sinorhizobium). Int. J. Syst. Evol. Microbiol. 58, 200–214. https://doi.org/10.1099/ijs.0.65392-0
Martin-Sanchez, P.M., Miller, A.Z., Saiz-Jimenez, C., 2015. Lascaux Cave: An Example of Fragile Ecological Balance in Subterranean Environments. Microb. Life Cave Syst. https://doi.org/10.1515/9783110339888-015
McDaniel, M.D., Grandy, A.S., Tiemann, L.K., Weintraub, M.N., 2014. Crop rotation complexity regulates the decomposition of high and low quality residues. Soil Biol. Biochem. 78, 243–254. https://doi.org/10.1016/J.SOILBIO.2014.07.027
McGuire, K.L., Treseder, K.K., 2010. Microbial communities and their relevance for ecosystem models: Decomposition as a case study. Soil Biol. Biochem. 42, 529–535. https://doi.org/10.1016/j.soilbio.2009.11.016
McNamara, C.J., Perry IV, T.D., Bearce, K.A., Hernandez-Duque, G., Mitchell, R., 2006. Epilithic and endolithic bacterial communities in limestone from a Maya archaeological site. Microb. Ecol. 51, 51–64. https://doi.org/10.1007/s00248-005-0200-5
Meidute, S., Demoling, F., Bååth, E., 2008. Antagonistic and synergistic effects of fungal and bacterial growth in soil after adding different carbon and nitrogen sources. Soil Biol. Biochem. 40, 2334–2343. https://doi.org/10.1016/J.SOILBIO.2008.05.011
Meier, C.L., Bowman, W.D., 2008. Links between plant litter chemistry, species diversity, and below-ground ecosystem function. Proc. Natl. Acad. Sci. U. S. A. 105, 19780–19785.

54
https://doi.org/10.1073/pnas.0805600105
Meisner, A., Jacquiod, S., Snoek, B.L., Hooven, F.C., Freedman, Z.B., 2018. Drought Legacy Effects on the Composition of Soil Fungal and Prokaryote Communities 9, 1–12. https://doi.org/10.3389/fmicb.2018.00294
Miao, V., Davies, J., 2010. Actinobacteria: The good, the bad, and the ugly, in: Antonie van Leeuwenhoek, International Journal of General and Molecular Microbiology. Springer, pp. 143–150. https://doi.org/10.1007/s10482-010-9440-6
Mihajlovski, A., Gabarre, A., Seyer, D., Bousta, F., Di Martino, P., 2017. Bacterial diversity on rock surface of the ruined part of a French historic monument: The Chaalis abbey. Int. Biodeterior. Biodegrad. 120, 161–169. https://doi.org/10.1016/j.ibiod.2017.02.019
Mitova, M., Ivanova, M., Iliev, M., 2017. ACTINOBACTERIA AS A COMPONENT OF MICROBIAL COMMUNITY FORMED ON ROCK PAINTINGS OF MAGURA CAVE , BULGARIA 102, 127–138.
Modra, H., Bartos, M., Hribova, P., Ulmann, V., Hubelova, D., Konecny, O., Gersl, M., Kudelka, J., Voros, D., Pavlik, I., 2017. Detection of mycobacteria in the environment of the Moravian Karst (Bull Rock Cave and the relevant water catchment area): the impact of water sediment, earthworm castings and bat guano. Vet. Med. (Praha). 62 (2017), 153–168. https://doi.org/10.17221/126/2016-VETMED
Moinet, G.Y.K., Moinet, M., Hunt, J.E., Rumpel, C., Chabbi, A., Millard, P., 2020. Temperature sensitivity of decomposition decreases with increasing soil organic matter stability. Sci. Total Environ. 704, 135460. https://doi.org/10.1016/j.scitotenv.2019.135460
-Bucur, R., Constantin, S., Kenesz, M., Mirea, I.C., Petculescu, A., Robu, M., Arghir, R.A., 2020. Management of water bodies in show caves – A microbial approach. Tour. Manag. 78, 104037. https://doi.org/10.1016/j.tourman.2019.104037
Moorhead, D.L., Sinsabaugh, R.L., 2006. A theoretical model of litter decay and microbial interaction. Ecol. Monogr. 76, 151–174. https://doi.org/10.1890/0012-9615(2006)076[0151:ATMOLD]2.0.CO;2
Mulec, J., Oarga-Mulec, A., Šturm, S., Tomazin, R., Matos, T., 2017. Spacio-Temporal Distribution and Tourist Impact on Airborne Bacteria in a Cave (Škocjan Caves, Slovenia). Diversity 9, 28. https://doi.org/10.3390/d9030028
Mulec, J., Oarga-Mulec, A., Tomazin, R., Matos, T., 2015. Characterization and fluorescence of yellow biofilms in karst caves, southwest Slovenia. Int. J. Speleol. 44, 107–114. https://doi.org/10.5038/1827-806X.44.2.1
Newton, R.J., Jones, S.E., Helmus, M.R., McMahon, K.D., 2007. Phylogenetic ecology of the freshwater Actinobacteria acI lineage. Appl. Environ. Microbiol. 73, 7169–7176. https://doi.org/10.1128/AEM.00794-07
Nouioui, I., Ghodhbane-Gtari, F., Jando, M., Tisa, L.S., Klenk, H.P., Gtari, M., 2019. Frankia torreyi sp. nov., the first actinobacterium of the genus Frankia Brunchorst 1886, 174 AL isolated in axenic culture. Antonie van Leeuwenhoek, Int. J. Gen. Mol. Microbiol. 112, 57–65. https://doi.org/10.1007/s10482-018-1131-8
Nováková, A., 2009. Microscopic fungi isolated from the Domica Cave system (Slovak Karst National Park, Slovakia). A review. Int. J. Speleol. 38, 71–82. https://doi.org/10.5038/1827-806X.38.1.8
Ogier, J.C., Pagès, S., Galan, M., Barret, M., Gaudriault, S., 2019. RpoB, a promising marker for analyzing the diversity of bacterial communities by amplicon sequencing. BMC Microbiol. 19, 2–16. https://doi.org/10.1186/s12866-019-1546-z
Ortiz, M., Legatzki, A., Neilson, J.W., Fryslie, B., Nelson, W.M., Wing, R.A., Soderlund, C.A., Pryor, B.M., Maier, R.M., 2014. Making a living while starving in the dark: metagenomic insights into the energy dynamics of a carbonate cave. ISME J. 8, 478–491. https://doi.org/10.1038/ismej.2013.159
Paula, C.C.P.D., Montoya, Q. V., Meirelles, L.A., Farinas, C.S., Rodrigues, A., Seleghim, M.H.R., 2019. High cellulolytic activities in filamentous fungi isolated from an extreme oligotrophic subterranean environment (Catão cave) in Brazil. An. Acad. Bras. Cienc. 91, 9–11. https://doi.org/10.1590/0001-3765201920180583

55
Pei, A.Y., Oberdorf, W.E., Nossa, C.W., Agarwal, A., Chokshi, P., Gerz, E.A., Jin, Z., Lee, P., Yang, L., Poles, M., Brown, S.M., Sotero, S., DeSantis, T., Brodie, E., Nelson, K., Pei, Z., 2010. Diversity of 16S rRNA genes within individual prokaryotic genomes. Appl. Environ. Microbiol. 76, 3886–3897. https://doi.org/10.1128/AEM.02953-09
Pereira, S., Burešová, A., Kopecky, J., Mádrová, P., Aupic-Samain, A., Fernandez, C., Baldy, V., Sagova-Mareckova, M., 2019. Litter traits and rainfall reduction alter microbial litter decomposers: The evidence from three Mediterranean forests. FEMS Microbiol. Ecol. 95, fiz168. https://doi.org/10.1093/femsec/fiz168
Philippot, L., Andersson, S.G.E., Battin, T.J., Prosser, J.I., Schimel, J.P., Whitman, W.B., Hallin, S., 2010. The ecological coherence of high bacterial taxonomic ranks. Nat. Rev. Microbiol. 8, 523–529. https://doi.org/10.1038/nrmicro2367
Polkade, A. V., Mantri, S.S., Patwekar, U.J., Jangid, K., 2016. Quorum Sensing: An Under-Explored Phenomenon in the Phylum Actinobacteria. Front. Microbiol. 7, 131. https://doi.org/10.3389/fmicb.2016.00131
141–149. https://doi.org/10.5038/1827-806X.44.2.4
-Bertok, D., Saiz-Jimenez, C., microbial communities growing on the walls of geographically distinct caves indicates a common core of microorganisms involved in their formation. FEMS Microbiol. Ecol. 81, 255–266. https://doi.org/10.1111/j.1574-6941.2012.01383.x
Portillo, M.C., Gonzalez, J.M., 2011. Moonmilk Deposits Originate from Specific Bacterial Communities in Altamira Cave (Spain). Microb. Ecol. 61, 182–189. https://doi.org/10.1007/s00248-010-9731-5
Portillo, M.C., Gonzalez, J.M., 2010. Differential effects of distinct bacterial biofilms in a cave environment. Curr. Microbiol. 60, 435–438. https://doi.org/10.1007/s00284-009-9561-1
Pose-Juan, E., Igual, J.M., Sánchez- -Cruz, M.S., 2017. Influence of Herbicide Triasulfuron on Soil Microbial Community in an Unamended Soil and a Soil Amended with Organic Residues. Front. Microbiol. 8, 378. https://doi.org/10.3389/fmicb.2017.00378
Prieto, I., Almagro, M., Bastida, F., Querejeta, J.I., 2019. Altered leaf litter quality exacerbates the negative impact of climate change on decomposition. J. Ecol. 1365-2745.13168. https://doi.org/10.1111/1365-2745.13168
Purahong, W., Krüger, D., Buscot, F., Wubet, T., 2016a. Correlations between the composition of modular fungal communities and litter decomposition-associated ecosystem functions. Fungal Ecol. 22, 106–114. https://doi.org/10.1016/J.FUNECO.2016.04.009
Purahong, W., Schloter, M., Pecyna, M.J., Kapturska, D., Däumlich, V., Mital, S., Buscot, F., Hofrichter, M., Gutknecht, J.L.M., Krüger, D., 2014. Uncoupling of microbial community structure and function in decomposing litter across beech forest ecosystems in Central Europe. Sci. Rep. 4, 7014. https://doi.org/10.1038/srep07014
Purahong, W., Wubet, T., Lentendu, G., Schloter, M., Pecyna, M.J., Kapturska, D., Hofrichter, M., Krüger, D., Buscot, F., 2016b. Life in leaf litter: novel insights into community dynamics of bacteria and fungi during litter decomposition. Mol. Ecol. 25, 4059–4074. https://doi.org/10.1111/mec.13739
Radha, T.K., Rao, D.L.N., Sreeramulu, K.R., 2017. Actinobacteria of arid and semi-arid soils: Antagonism to fungal pathogens and plant growth promoting potential. J. Pure Appl. Microbiol. 11, 1045–1052. https://doi.org/10.22207/JPAM.11.2.47
Rangseekaew, P., Pathom-Aree, W., 2019. Cave Actinobacteria as Producers of Bioactive Metabolites. Front. Microbiol. 10, 387. https://doi.org/10.3389/fmicb.2019.00387
Rao, M.P.N., Dong, Z.Y., Zhang, H., Niu, X.K., Zhang, K., Fang, B.Z., Xiao, M., Kang, Y.Q., Li, W.J., 2019. Bacillus antri sp. Nov., isolated from cave soil. Int. J. Syst. Evol. Microbiol. 69, 2335–2339.

56
https://doi.org/10.1099/ijsem.0.003473
Rapoport, D., Sagova-J., 2020. Trebonia kvetii gen. Nov., sp. nov., an acidophilic actinobacterium, and proposal of the new actinobacterial family treboniaceae fam. nov. Int. J. Syst. Evol. Microbiol. 70, 5106–5114. https://doi.org/10.1099/ijsem.0.004388
-Resistant Actinobacteria from High-Altitude Andean Lakes: Isolation, Characterization and Antagonistic Activities. Photochem. Photobiol. 93, 865–880. https://doi.org/10.1111/php.12759
Rego, A., Raio, F., Martins, T.P., Ribeiro, H., Sousa, A.G.G., Séneca, J., Baptista, M.S., Lee, C.K., Craig Cary, S., Ramos, V., Carvalho, M.F., Leão, P.N., Magalhães, C., 2019. Actinobacteria and cyanobacteria diversity in terrestrial Antarctic microenvironments evaluated by culture-dependent and independent methods. Front. Microbiol. 10, 1018. https://doi.org/10.3389/fmicb.2019.01018
-Nava, V., Couble, A., Devulder, G., Flandrois, J.-P., Boiron, P., Laurent, F., 2006. Use of PCR-restriction enzyme pattern analysis and sequencing database for hsp65 gene-based identification of Nocardia species. J. Clin. Microbiol. 44, 536–46. https://doi.org/10.1128/JCM.44.2.536-546.2006
-Nava, V., Khan, Z.U., Pötter, G., Kroppenstedt, R.M., Boiron, P., Laurent, F., 2007. Nocardia coubleae sp. nov., isolated from oil-contaminated Kuwaiti soil. https://doi.org/10.1099/ijs.0.64815-0
Rosenblatt, A.E., 2018. Shifts in plant nutrient content in combined warming and drought scenarios may alter reproductive fitness across trophic levels. Oikos 127, 1853–1862. https://doi.org/10.1111/oik.05272
Rousk, J., Demoling, L.A., Bahr, A., Bååth, E., 2008. Examining the fungal and bacterial niche overlap using selective inhibitors in soil. FEMS Microbiol. Ecol. 63, 350–358. https://doi.org/10.1111/j.1574-6941.2008.00440.x
Rousk, J., Frey, S.D., 2015. Revisiting the hypothesis that fungal-to-bacterial dominance characterizes turnover of soil organic matter and nutrients. Ecol. Monogr. 85, 457–472. https://doi.org/10.1890/14-1796.1
Roxburgh, S.H., Shea, K., Wilson, J.B., 2004. The intermediate disturbance hypothesis: Patch dynamics and mechanisms of species coexistence. Ecology 85, 359–371. https://doi.org/10.1890/03-0266
Sagova-Mareckova, M., Cermak, L., Omelka, M., Kyselkova, M., Kopecky, J., 2015. Bacterial diversity and abundance of a creek valley sites reflected soil pH and season. Open Life Sci. 10, 61–70.
Sagova-Mareckova, Marketa, Daniel, O., Omelka, M., Kristufek, V., Divis, J., Kopecky, J., 2015. Determination of Factors Associated with Natural Soil Suppressivity to Potato Common Scab. https://doi.org/10.1371/journal.pone.0116291
Sagova-Mareckova, M., Omelka, M., Cermak, L., Kamenik, Z., Olsovska, J., Hackl, E., Kopecky, J., Hadacek, F., 2011. Microbial communities show parallels at sites with distinct litter and soil characteristics. Appl. Environ. Microbiol. 77, 7560–7567. https://doi.org/10.1128/AEM.00527-11
Schabereiter-Gurtner, C., Saiz-Jimenez, C., Pinar, G., Lubitz, W., Rölleke, S., 2002. Altamira cave Paleolithic paintings harbor partly unknown bacterial communities. FEMS Microbiol. Lett. 211, 7–11. https://doi.org/10.1111/j.1574-6968.2002.tb11195.x
Schneider, T., Keiblinger, K.M., Schmid, E., Sterflinger-Gleixner, K., Ellersdorfer, G., Roschitzki, B., Richter, A., Eberl, L., Zechmeister-Boltenstern, S., Riedel, K., 2012. Who is who in litter decomposition? Metaproteomics reveals major microbial players and their biogeochemical functions. ISME J. 6, 1749–1762. https://doi.org/10.1038/ismej.2012.11
Schobben, M., Stebbins, A., Ghaderi, A., Strauss, H., Korn, D., Korte, C., 2016. Eutrophication, microbial-sulfate reduction and mass extinctions. Commun. Integr. Biol. https://doi.org/10.1080/19420889.2015.1115162
Schwartz, E., Adair, K.L., Schuur, E. a., 2007. Bacterial community structure correlates with decomposition parameters along a Hawaiian precipitation gradient. Soil Biol. Biochem. 39, 2164–2167. https://doi.org/10.1016/j.soilbio.2007.02.013

57
Sharma, M., Dangi, P., Choudhary, M., 2014. Actinomycetes: source, identification, and their applications. Int. J. Curr. Microbiol. Appl. Sci. 3, 801–832.
Shi, S., Tian, L., Nasir, F., Bahadur, A., Batool, A., Luo, S., Yang, F., Wang, Z., Tian, C., 2019. Response of microbial communities and enzyme activities to amendments in saline-alkaline soils. Appl. Soil Ecol. 135, 16–24. https://doi.org/10.1016/j.apsoil.2018.11.003
Smith, W.K., Gao, W., Steltzer, H., Wallenstein, M.D., Tree, R., 2010. Moisture availability influences the effect of ultraviolet-B radiation on leaf litter decomposition. Glob. Chang. Biol. 16, 484–495. https://doi.org/10.1111/j.1365-2486.2009.01973.x
Šnajdr, J., Cajthaml, T., Valášková, V., Merhautová, V., Petránková, M., Spetz, P., Leppänen, K., Baldrian, P., 2011. Transformation of Quercus petraea litter: Successive changes in litter chemistry are reflected in differential enzyme activity and changes in the microbial community composition. FEMS Microbiol. Ecol. 75, 291–303. https://doi.org/10.1111/j.1574-6941.2010.00999.x
Song, F., Fan, X., Song, R., 2010. Review of mixed forest litter decomposition researches. Acta Ecol. Sin. 30, 221–225. https://doi.org/10.1016/j.chnaes.2010.06.006
A., Soares, M.I.M., Gillor, O., 2017. The Impact of Hydration and Temperature on Bacterial Diversity in Arid Soil Mesocosms. Front. Microbiol. 8, 1078. https://doi.org/10.3389/fmicb.2017.01078
Suseela, V., Tharayil, N., Xing, B., Dukes, J.S., 2014. Warming alters potential enzyme activity but precipitation regulates chemical transformations in grass litter exposed to simulated climatic changes. Soil Biol. Biochem. 75, 102–112. https://doi.org/10.1016/j.soilbio.2014.03.022
Száková, J., Burešová, A., Praus, L -Komárek, J., Grohová, S., Tlustoš, P., 2016. The response of mercury (Hg) transformation in soil to sulfur compounds and sulfur-rich biowaste application. Environ. Earth Sci. 75, 584. https://doi.org/10.1007/s12665-016-5387-x
Taj-Aldeen, S.J., Deshmukh, A., Doiphode, S., Wahab, A.A., Allangawi, M., Muzrkchi, A. Al, Klaassen, C.H., Meis, J.J., 2013. Molecular Identification and Susceptibility Pattern of Clinical Nocardia Species: Emergence of Nocardia crassostreae as an Agent of Invasive Nocardiosis. Can. J. Infect. Dis. Med. Microbiol. 24, e33–e38.
Takeda, K., Kang, Y., Yazawa, K., Gonoi, T., Mikami, Y., 2010. Phylogenetic studies of Nocardia species based on gyrB gene analyses. J. Med. Microbiol. 59, 165–171. https://doi.org/10.1099/jmm.0.011346-0
Telenti, A., Marchesi, F., Balz, M., Bally, F., Bottger, E.C., Bodmer, T., 1993. Rapid identification of mycobacteria to the species level by polymerase chain reaction and restriction enzyme analysis. J. Clin. Microbiol. 31, 175–178.
Thiessen, S., Gleixner, G., Wutzler, T., Reichstein, M., 2013. Both priming and temperature sensitivity of soil organic matter decomposition depend on microbial biomass - An incubation study. Soil Biol. Biochem. 57, 739–748. https://doi.org/10.1016/j.soilbio.2012.10.029
Tikhonova, E.N., Men’ko, E. V., Ulanova, R. V., Li, H., Kravchenko, I.K., 2019. Effect of Temperature on the Taxonomic Structure of Soil Bacterial Communities during Litter Decomposition. Microbiol. (Russian Fed. 88, 781–785. https://doi.org/10.1134/S0026261719060195
occurrence pattern of cellulolytic taxa and potential decomposers of fungal mycelia. FEMS Microbiol. Ecol. 92, fiw177. https://doi.org/10.1093/femsec/fiw177
To, K., Cao, R., Yegiazaryan, A., Owens, J., Venketaraman, V., 2020. General Overview of Nontuberculous Mycobacteria Opportunistic Pathogens: Mycobacterium avium and Mycobacterium abscessus. J. Clin. Med. 9, 2541. https://doi.org/10.3390/jcm9082541
Tomczyk- –19. https://doi.org/10.1080/01490451.2014.1003341

58
Urzì, C., De Leo, F., Bruno, L., Albertano, P., 2010. Microbial Diversity in Paleolithic Caves: A Study Case on the Phototrophic Biofilms of the Cave of Bats (Zuheros, Spain). Microb. Ecol. 60, 116–129. https://doi.org/10.1007/s00248-010-9710-x
Vanderwolf, K.J., Malloch, D., McAlpine, D.F., Forbes, G.J., 2013. A world review of fungi, yeasts, and slime molds in caves Karen. Int. J. Speleol. 42, 77–96. https://doi.org/10.5038/1827-806X.42.1.9
Vázquez-Boland, J.A., Meijer, W.G., 2019. The pathogenic actinobacterium Rhodococcus equi: what’s in a name? Mol. Microbiol. 112, 1–15. https://doi.org/10.1111/mmi.14267
Verma, M., Lal, D., Kaur, Jaspreet, Saxena, A., Kaur, Jasvinder, Anand, S., Lal, R., 2013. Phylogenetic analyses of phylum Actinobacteria based on whole genome sequences. Res. Microbiol. 164, 718–728. https://doi.org/10.1016/j.resmic.2013.04.002
Consequences for Bacterial Community Analyses. PLoS One 8, e57923. https://doi.org/10.1371/journal.pone.0057923
and Lignin in Lignocellulose by Soil Actinobacteria. PLoS One 9, e89108. https://doi.org/10.1371/JOURNAL.PONE.0089108
Vitousek, P.M., Porder, S., Houlton, B.Z., Chadwick, O.A., 2010. Terrestrial phosphorus limitation: mechanisms, implications, and nitrogen–phosphorus interactions. Ecol. Appl. 20, 5–15. https://doi.org/10.1890/08-0127.1
Vos, M., Quince, C., Pijl, A.S., de Hollander, M., Kowalchuk, G.A., 2012. A comparison of rpoB and 16S rRNA as markers in pyrosequencing studies of bacterial diversity. PLoS One 7, e30600. https://doi.org/10.1371/journal.pone.0030600
Wagg, C., Schlaeppi, K., Banerjee, S., Kuramae, E.E., van der Heijden, M.G.A., 2019. Fungal-bacterial diversity and microbiome complexity predict ecosystem functioning. Nat. Commun. 10, 1–10. https://doi.org/10.1038/s41467-019-12798-y
Wertz, S., Degrange, V., Prosser, J.I., Poly, F., Commeaux, C., Freitag, T., Guillaumaud, N., Roux, X. Le, 2006. Maintenance of soil functioning following erosion of microbial diversity. Environ. Microbiol. 8, 2162–2169. https://doi.org/10.1111/j.1462-2920.2006.01098.x
Woo, H.L., Hazen, T.C., Simmons, B. a., DeAngelis, K.M., 2014. Enzyme activities of aerobic lignocellulolytic bacteria isolated from wet tropical forest soils. Syst. Appl. Microbiol. 37, 60–67. https://doi.org/10.1016/j.syapm.2013.10.001
Wu, Y., Tan, L., Liu, W., Wang, B., Wang, J., Cai, Y., Lin, X., 2015. Profiling bacterial diversity in a limestone cave of the western Loess Plateau of China. Front. Microbiol. 6, 244. https://doi.org/10.3389/fmicb.2015.00244
Xu, Y., Fan, J., Ding, W., Bol, R., Chen, Z., Luo, J., Bolan, N., 2016. Stage-specific response of litter decomposition to N and S amendments in a subtropical forest soil. Biol. Fertil. Soils 52, 711–724. https://doi.org/10.1007/s00374-016-1115-7
Zhang, B., Wu, X., Tai, X., Sun, L., Wu, M., Zhang, W., Chen, X., Zhang, G., Chen, T., Liu, G., Dyson, P., 2019. Variation in Actinobacterial Community Composition and Potential Function in Different Soil Ecosystems Belonging to the Arid Heihe River Basin of Northwest China. Front. Microbiol. 10, 2209. https://doi.org/10.3389/fmicb.2019.02209
Zhao, Y., Lu, Q., Wei, Y., Cui, H., Zhang, X., Wang, X., Shan, S., Wei, Z., 2016. Effect of actinobacteria agent inoculation methods on cellulose degradation during composting based on redundancy analysis. Bioresour. Technol. 219, 196–203. https://doi.org/10.1016/j.biortech.2016.07.117
Zhu, H.Z., Zhang, Z.F., Zhou, N., Jiang, C.Y., Wang, B.J., Cai, L., Liu, S.J., 2019. Diversity, distribution and co-occurrence patterns of bacterial communities in a karst cave system. Front. Microbiol. 10, 1726. https://doi.org/10.3389/fmicb.2019.01726

59
Zhu, Y., Penuelas, J., 2020. Changes in the environmental microbiome in the Anthropocene. Glob. Chang. Biol. 26, 3175–3177. https://doi.org/10.1111/gcb.15086

60
Original research papers

-Part 1-
Paper I: Usefulness of hsp65 marker as a complement to 16S
rRNA sequences to demonstrate differences in Actinobacteria
community according to anthropization of limestone caves and
occurrence of visual marks in Lascaux Cave

1
Usefulness of hsp65 marker as a complement to 16S rRNA sequences to demonstrate 1
differences in Actinobacteria community according to anthropization of limestone caves and 2
occurrence of visual marks in Lascaux Cave 3
4
Buresova Andrea1,2,3, Kopecky Jan3, Sagova-Mareckova Marketa3, Alonso Lise1, Vautrin Florian1, 5
Moënne-Loccoz Yvan1, Rodriguez-Nava Veronica1 6
7
1Univ Lyon, Université Claude Bernard Lyon 1, CNRS, INRAE, VetAgro Sup, UMR5557 8
Ecologie Microbienne, F-69622 Villeurbanne, France, 9
2Department of Ecology, Faculty of Science, Charles University in Prague, Vinicna 7, Prague, 10
Czech Republic, 11
3Laboratory for Diagnostics, Epidemiology and Ecology of Microorganisms, Crop Research 12
Institute, Drnovska 507, CZ-16106 Prague 6, Ruzyne, Czech Republic 13
14
15
16

2
Abstract 17
Actinobacteria are important cave inhabitants, but knowledge of how anthropization and 18
anthropization-related visual marks affect this community on cave walls is missing. We compared 19
Actinobacteria communities among four French limestone caves (Mouflon, Reille, Rouffignac, 20
and Lascaux) ranging from pristine to anthropized and within Lascaux Cave between marked and 21
unmarked areas on walls in different rooms (Sas-1, Passage, Apse, and Diaclase). In addition to 22
the 16S rRNA gene marker, 441-bp fragments of a heat shock protein gene (hsp65) were used for 23
the identification of Actinobacteria to the species level by Illumina MiSeq analysis. The hsp65 24
marker revealed higher resolution for species and richness (at 99% OTUs cutoff) assessment than 25
did 16S rRNA, which on the other hand identified more taxa on higher taxonomic ranks. 26
Actinobacteria communities varied between Mouflon and Reille (both pristine), Rouffignac 27
(anthropized/visited), and Lascaux (strongly anthropized and now closed to the public). 28
Rouffignac displayed high diversity of Nocardia, including species with potential pathogeny (i.e. 29
N. carnea, N. paucivorans, N. abscessus), and Lascaux high Mycobacterium abundance, whereas 30
Gaiellales were typical in pristine caves and the Diaclase i.e. the least affected room of Lascaux 31
Cave. Within Lascaux, the Pseudonocardiaceae dominated on unmarked walls and the 32
Streptomycetaceae (especially Streptomyces mirabilis) on marked surfaces, raising questions on 33
the possible role of S. mirabilis in the formation of visual marks. Our results show how the use of 34
the hsp65 marker, well beyond the resolution provided by 16S rRNA sequences, enabled for the 35
first time to document species-level variations of the Actinobacteria community according to the 36
extent of anthropogenic pressure. This approach proved effective when comparing different 37
limestone caves or specific conditions within a cave. 38
39

3
Introduction 40
41
Limestone caves are considered to be rather isolated habitats that are extremely limited in 42
organic carbon (Barton et al., 2007), which leads to the development of microbial strategies 43
enabling adaptation to oligotrophic conditions and a high calcium content (Barton & Jurado, 2007; 44
De Mandal, Chatterjee, & Kumar, 2017; Ortiz et al., 2014). Some of these caves contain Paleolithic 45
artwork and thus are frequently visited by tourists (Alonso et al., 2019; Schabereiter-Gurtner, Saiz-46
Jimenez, Pinar, Lubitz, & Rölleke, 2002). As a result, human-derived dispersion of endogenous as 47
well as exogenous nutrients and microorganisms inside the caves together with the human 48
metabolism may change their internal microclimatic and microbiological conditions (Hoyos, 49
Cañaveras, Sánchez-Moral, Sanz-Rubio, & Soler, 1998; Mulec, 2014). Microorganisms can be 50
resilient to changes to some extent (Johnston, Muench, Banks, & Barton, 2012; Tomczyk-Żak & 51
Zielenkiewicz, 2016). Community shifts may also take place, which deserves attention if it could 52
favor microorganisms with biodeterioration ability (F. Bastian, Jurado, Novakova, Alabouvette, & 53
Saiz-Jimenez, 2010; Fernandez-Cortes et al., 2011; Sánchez-Moral et al., 1999) or increase the 54
proportion of species harboring strains with pathogenic potential (Bercea, Năstase-Bucur, 55
Moldovan, Kenesz, & Constantin, 2019; Neral, Rajput, & Rai, 2015; Rajput, Rai, & Biswas, 2012). 56
If it were the case, such shifts could represent a threat for cave conservation and the health of 57
visitors, respectively. 58
Actinobacteria represent an important cave taxonomic group, from which many potentially 59
pathogenic (Valme Jurado et al., 2010), biotechnologically relevant (Bhullar et al., 2012; Hamedi, 60
Kafshnouchi, & Ranjbaran, 2019; Syiemiong & Jha, 2019) and novel (Fang et al., 2017; V. Jurado 61
et al., 2008; Valme Jurado, Kroppenstedt, et al., 2009; Rangseekaew & Pathom-aree, 2019) species 62
have been found in these environments. Actinobacteria can dominate both in anthropized 63

4
(Gonzalez-Pimentel et al., 2018) and pristine caves (De Mandal et al., 2017), but some 64
actinobacterial taxa are specific only one type of cave. For example, Pseudonocardiaceae are 65
known as indicators of urban contamination (Miller et al., 2018) and dominate in some anthropized 66
caves, but this dominance is most likely due to their ability to degrade exogenous organic 67
compounds (Lavoie et al., 2017; Porca, Jurado, Žgur-Bertok, Saiz-Jimenez, & Pašić, 2012). This 68
is partially true as well for Streptomycetaceae, which were also found among pristine cave 69
inhabitants (Maciejewska et al., 2017). Furthermore, these taxonomic groups seem to be prominent 70
in pigment-forming communities on the walls of certain show caves (Cuezva et al., 2012; Porca et 71
al., 2012). In contrast, Euzebyales (Gonzalez-Pimentel et al., 2018), Nocardiaceae (De Mandal et 72
al., 2017) and Gaiellales (Zhu et al., 2019) represent oligotrophic taxa that dominate in pristine 73
caves, most likely because of their ability to degrade complex compounds which are indigenously 74
present in the cave or fix CO2. 75
Actinobacteria taxonomic identification in these environments has largely been based on 76
culture-dependent approaches and 16S rRNA sequencing (De Mandal et al., 2017; Yasir, 2018). 77
The culture-dependent approaches limits the coverage of the community and thus should be used 78
only as a supportive determinant with molecular approaches (Hamedi et al., 2019; Long et al., 79
2019). The 16S rRNA gene is the marker most frequently used for bacterial systematics but 80
generally cannot resolve individual sequences at the species level (Fox, Wisotzkey, & Jurtshuk, 81
1992; Hirsch, Mauchline, & Clark, 2010). In addition, identical 16S rRNA gene sequences can be 82
found in different taxa or different 16S rRNA gene sequences in a single species (Větrovský & 83
Baldrian, 2013). Other protein-coding genes with high sequence polymorphisms (i.e., rpoB, gyrB, 84
hsp65) permit the distinction between closely-related strains. However, some of these protein-85
coding markers may also have their limits as it is the case of rpoB gene who is present twice is 86

5
some genus belonging to Actinobacteria, they only target limited number of Actinobacteria or no 87
appropriate reference database is available for taxonomic identification (Gao & Gupta, 2012; 88
Takeda, Kang, Yazawa, Gonoi, & Mikami, 2010; Vos, Quince, Pijl, de Hollander, & Kowalchuk, 89
2012). Nevertheless, the gene of a molecular chaperone, the 65-kDa heat-shock protein (hsp65), 90
when amplified by specific primers (Telenti et al., 1993), has been used as a molecular marker for 91
identifying a large number of Actinobacteria isolates (Rodríguez-Nava et al., 2006, 2007). This 92
gene is present in Actinobacteria genomes as a single copy, unlike the 16S rRNA gene marker 93
(Colaco & MacDougall, 2014), and hsp65 is considered to be a good candidate for making detailed 94
Actinobacteria community assessments from environmental DNA. Additionally, the amplified 95
fragment length of hsp65 (441 bp) is sufficient for amplicon sequencing. 96
Lascaux Cave underwent several events of microbial outgrowth since the 1960s, as well as 97
(sometimes unsuccessful) chemical treatments, which resulted in the formation of various visual 98
marks (including stains) and threatened Paleolithic artwork (F. Bastian et al., 2010; Martin-99
Sanchez, Miller, & Saiz-Jimenez, 2015). For the sake of cave conservation, Lascaux was closed 100
to the public in 1963. Although the few microbiological studies conducted in this cave suggest that 101
Actinobacteria is one of prevalent groups (Alonso et al., 2018, 2019; Martin-Sanchez, Nováková, 102
Bastian, Alabouvette, & Saiz-Jimenez, 2012), a more complete investigation of the Actinobacteria 103
community is lacking, especially at the species level. If we consider that key functional traits can 104
be related to precise species within the Actinobacteria, we can hypothesize that such an assessment 105
would allow a better discrimination of Actinobacteria communities according to ecological 106
conditions. 107
The objective of this work was to assess the usefulness of hsp65 marker (as a complement 108
to 16S rRNA sequence data) for a deeper, species-level appraisal of the Actinobacteria community 109

6
in caves, and to show variations according to cave conditions and especially human-induced 110
disturbances (Mammola, 2019). These aims were achieved by comparing Actinobacteria 111
communities in pristine limestone caves (Reille and Mouflon Caves) and anthropized caves 112
(Lascaux and Rouffignac Caves), and within Lascaux Cave of marked and unmarked areas in 113
different rooms (i.e., Sas-1, Passage, Apse, and Diaclase). To this end, Actinobacteria were 114
identified for the first time to the species level in cave environments, using metabarcoding analysis 115
of the hsp65 gene marker. 116
117

7
Materials and methods118
Study site description and sample collection119
Samples were collected in May - June 2016 from the walls of four limestone caves located 120
in the Dordogne department of southwestern France: Lascaux (45°03'13'' N 1°10'12''E, 235 m 121
length); Rouffignac (45°00'31"N 0°59'16"E, 8,000 m length); Reille (45°07'09.5"N 1°07'11.2"E, 122
2,000 m length) and Mouflon (44°55'N 1°5'E, 280 m length) (Fig. 1A).123
124
Fig. 1. Map of A. Dordogne area with the cave locations (Lascaux, Rouffignac, Reille and125
Mouflon; white squares – pristine and gray squares – anthropized). Map of B. Lascaux Cave 126
(entrance Sas-1, Passage, Apse, and Diaclase).127
128
Lascaux and Rouffignac caves contain Paleolithic wall paintings and engravings and are 129
listed as UNESCO World Heritage Sites. Both caves are anthropized, Rouffignac being open for 130
touristic visits since 1959 (with up to 500 visitors per day) (5) and Lascaux being closed after 15 131
years of tourism (with up to 2000 visitors per day). Various visual marks have developed at 132
different times in Lascaux Cave, and extensive chemical treatments have been applied (13,42, 44, 133

8
45). Mouflon and Reille Caves are in a pristine state (5). The entrance of Mouflon Cave was locked 134
shortly after discovery, whereas Reille is occasionally explored by seasoned speleologists. 135
In Lascaux Cave, samples were taken from the walls of four distinct rooms representing 136
different cave environments that were located progressively farther from the entrance in the 137
following order: Sas-1, Passage, Apse and Diaclase (Fig. 1B). Sas-1 is a man-made, calcareous 138
airlock entrance and is isolated by doors from the cave interior and exterior. The Passage is a 139
central alley connecting different rooms of Lascaux Cave. In the Passage, samples were taken from 140
two mineral substrates: clay deposits (banks, later referred to as Passage B) and near-vertical 141
limestone walls (inclined planes, later referred to as Passage IP). In the Apse, samples were 142
collected from limestone inclined planes. The Diaclase is a distinct compartment located below 143
the main part of the cave and was least-affected by humans. It is separated from the Apse by a trap 144
door, received limited biocide treatments, and was never open to tourists. Samples originated from 145
limestone walls located immediately below the Apse, in an area of the Diaclase termed the Shaft 146
of the Dead Man. 147
Within each room, samples were collected from visual marks and unstained surfaces, as 148
described (Alonso et al., 2018). Approximately 50 mg of wall material samples (3-6 replicates) 149
were collected using sterile scalpels and placed in liquid nitrogen for transportation to the 150
laboratory, where they were stored at -80°C until DNA extraction. Overall, six samples from 151
Rouffignac, six from Mouflon, five from Reille and 41 from Lascaux (five from Sas-1, six from 152
Passage B, six from Passage IP, 18 from Apse and six from Diaclase) were used for subsequent 153
microbial analysis (Table S1). Sampling was performed in accordance with the caves’ rules and 154
regulations. 155
156

9
DNA extraction and amplicon sequencing 157
DNA extraction was performed using the FastDNA SPIN Kit for Soil (MP Biomedicals, 158
Illkirch, France) following the manufacturer’s instructions and was adapted to the low sample 159
amounts, as described (Alonso et al., 2018). The elution step was achieved using two volumes of 160
50 μl elution buffer for each sample. 161
For bacterial 16S rRNA gene amplification, we used the primers 341F 162
(CCTACGGGNGGCWGCAG) and 805R (GACTACHVGGGTATCTAATCC), which target the 163
V3-V4 region (428-bp fragments) (Herlemann et al., 2011). Amplification and sequencing were 164
carried out by the Fasteris Company (Geneva, Switzerland) using the Illumina MiSeq Reagent Kit 165
v3 (600 cycles) with the paired-end mode, resulting in 2 × 300 bp sequence reads, as described by 166
Alonso et al. (Alonso et al., 2018). 167
The 441-bp fragments of the 65-kDa heat shock protein gene (hsp65) were amplified by 168
PCR using the specific primers TB11 (ACCAACGATGGTGTGTCCAT) and TB12 169
(CTTGTCGAACCGCATACCCT) from Telenti et al. (Telenti et al., 1993). Amplification was 170
carried out in a reaction mixture with a total volume of 25 μl in packaged PCR tubes (Ready-to-171
Go PCR Beads; Amersham Biosciences, Piscataway, NJ) (2.5 U of Taq polymerase puRe Taq, 10 172
mM Tris-HCl [pH 9], 50 mM KCl, 1.5 mM MgCl2, and 200 μM of each deoxynucleoside 173
triphosphate) with primers (0.2 – 0.4 μM, depending on the template concentration) and DNA (1 174
– 40 ng). The PCR cycling protocol consisted of an initial denaturation at 94°C for 5 min, then 35 175
cycles of denaturation (94°C for 60 s), annealing (55°C for 60 s), and elongation (72°C for 60 s) 176
(Rodríguez-Nava et al., 2006). Sequencing was carried out (together with purification and quality 177
control) by the Biofidal Company (Biofidal, Vaulx-en-Velin, France – http://www.biofidal-178
lab.com) using the Illumina MiSeq Flow Cell V3 with the paired-end mode, resulting in 2 x 300 179

10
bp sequence reads. Overall, 50 samples for 16S rRNA gene and 45 samples for hsp65 were 180
successfully sequenced, but sequences for both markers were obtained for only 37 samples (Table 181
S1). 182
183
Processing and analysis of sequence data 184
The paired sequence reads from sequencing were merged using FLASh (Fast Length 185
Adjustment of Short reads (Magoč & Salzberg, 2011)) with a maximum of 25% mismatches in the 186
overlapping region. The sequences were then filtered and aligned using reference alignments of 187
the hsp65 gene sequences (this work) or using the 16S rRNA gene sequences from the Silva 188
database (Quast et al., 2012). Chimeric sequences were removed using the integrated Vsearch tool 189
(Rognes, Flouri, Nichols, Quince, & Mahé, 2016) according to the MiSeq standard operating 190
procedure (MiSeq SOP, February 2018) (Kozich, Westcott, Baxter, Highlander, & Schloss, 2013) 191
in Mothur v. 1.39.5 software (Schloss et al., 2009). Taxonomical assignments of sequence libraries 192
were performed in Mothur using the hsp65 reference database for the hsp65 sequences and the 193
recreated SEED database subset of the Silva Small Subunit rRNA Database, release 132 (Yilmaz 194
et al., 2014), adapted for use in Mothur (https://mothur.org/w/images/a/a4/Sylva.seed_v132.tgz), 195
as the reference database for the 16S rRNA gene sequences. 196
The sequences of plastids and mitochondria and those not classified in the domain Bacteria 197
(from the 16S rRNA sequence library), as well as sequences identified as homologs for hsp65 198
(groEL, in the database renamed as GROESL; see the hsp65 reference database design section) 199
(from the hsp65 sequence library), were discarded. The sequence library was clustered into 200
operational taxonomic units (OTUs) using the Uparse pipeline in Usearch v10.0.240 software 201
(OTUs at a 97% cutoff) (35) and Mothur (OTUs at a 99% cutoff). The OTU table was further 202

11
processed using tools implemented in Mothur. For 16S rRNA genes, only sequences 203
corresponding to Actinobacteria were used. 204
For comparison of Actinobacteria among the caves, 25 samples for hsp65 and 24 samples 205
for 16S rRNA genes were used. Apse and Diaclase (both unmarked areas) were chosen as 206
representative samples for Lascaux Cave except for core microbiome analysis, for which all the 207
Lascaux Cave samples were included. To test the differences among locations in Lascaux Cave, 208
33 samples for hsp65 and 38 samples for 16S rRNA were used. Among those, from marked areas 209
16 samples for hsp65 and 20 samples for 16S rRNA were used. From unmarked areas 17 samples 210
for hsp65 and 18 samples for 16S rRNA were used (Table S1). For 16S rRNA marker, Sas-1 211
unmarked area samples are missing for the analysis, because low number of replicates were 212
successfully sequenced. To obtain the highest number of replicates per sample, all samples, even 213
when they were not common to both markers, were included in the analysis. 37 common samples 214
for both markers were used for analyses comparing the usefulness of both makers (rarefaction 215
analysis, comparison of diversity indices and number of taxa recovered at different taxonomy 216
ranks). 217
Rarefaction analysis was performed to analyze the richness of the Actinobacteria OTUs 218
based on two cutoffs (i.e., 97% and 99%) as a function of sample number. The alpha diversity 219
indices (richness: Chao 1, evenness: Simpson Evenness, and diversity: Inverse Simpson) were 220
calculated in Mothur (97%, 99% OTU cutoff). Significant differences among samples were 221
calculated by ANOVA with Tukey´s post hoc test (P < 0.05; Caves and locations in Lascaux Cave), 222
t tests and F tests (P < 0.05; marked/unmarked areas) in Past 4.02 software (Hammer, Harper, & 223
Ryan, 2001). 224

12
Bray-Curtis distance matrices describing the differences in bacterial community 225
composition among individual samples were calculated. The Actinobacterial communities in the 226
caves, in the different locations of Lascaux Cave, and between marked and unmarked areas within 227
each location were compared by nonmetric multidimensional scaling (NMDS) according to both 228
gene markers (97% OTU cutoff). Analysis of molecular variance (AMOVA) and homogeneity of 229
molecular variance (HOMOVA) were calculated in Mothur with 100,000 iterations for the same 230
factors (97% OTU cutoff). 231
Pairwise comparisons with Metastats (Segata et al., 2011) and biomarker searching 232
analysis with Lefse (Segata et al., 2011) were calculated to identify the Actinobacteria OTUs that 233
were significantly different among the respective caves, locations and marked/unmarked areas in 234
Lascaux Cave (99% OTU cutoffs). Metastats was also used to compare the relative abundances of 235
Streptomyces sequences among the marked/unmarked areas (hsp65 marker). Venn diagrams were 236
created in Mothur to test the number of OTUs that encompassed the core microbiome for the 237
different caves and four rooms (e.g., Sas-1, Passage, Apse, and Diaclase) in Lascaux Cave (99% 238
OTU cutoff). 239
Taxonomical classification of OTUs was performed with Mothur by using the hsp65 and 240
16S rRNA reference databases, and the hsp65 marker was verified by BLASTN in the online 241
databases of the National Center for Biotechnology Information (NCBI; U.S. National Library of 242
Medicine, MD, USA). The taxonomical composition of the core microbiome was constructed 243
using the Krona tool (Ondov, Bergman, & Phillippy, 2011). The number of taxa recovered with 244
the common samples by hsp65 and 16S rRNA at different taxonomic ranks were calculated and 245
displayed by Venn diagrams. 246

13
Co-occurrence networks were used to predict how marked/unmarked areas and different 247
locations influenced the relative abundances of Actinobacteria in Lascaux Cave. Spearman 248
correlation coefficients were computed in Mothur for Lascaux Cave OTUs and were categorized 249
according to their significantly different proportions in the marked/unmarked areas regardless of 250
the location in Lascaux Cave (Metastats) or for the Lascaux Cave locations (Lefse) (99% OTU 251
cutoff). Only significant (P < 0.03) correlations higher than 0.8/0.8 and lower than -0.35/-0.5 for 252
the hsp65/16S rRNA markers, respectively, were visualized in Gephi 0.9.2. (M. Bastian, 253
Heymann, & Jacomy, 2009) by Fruchterman-Reingold spatialization (Fruchterman & Reingold, 254
1991). The average degree, eigenvector centrality and modularity were computed, and the 255
minimum number of links was filtered to 5 (using a degree range filter). 256
Figures were plotted using the vegan package (Oksanen et al., 2018) in the R computing 257
environment (R Core Team, 2018) and in Inkscape (v0.92; http://www.inkscape.org). 258
The Illumina MiSeq 16S rRNA and hsp65 gene amplicon sequences were deposited in the 259
NCBI Sequence Read Archive (www.ncbi.nlm.nih.gov/sra). 260
261
In silico analysis 262
Determination of the differences in the variability of the hsp65 and 16S rRNA partial gene 263
sequences between pairs of Actinobacteria strains at different taxonomical levels (e.g., intraclass, 264
intraorder, intrafamily, and intragenus) was performed on genomes retrieved from the Integrated 265
Microbial Genomes and Microbiomes database (IMG; University of California, CA, USA, 266
https://img.jgi.doe.gov/). For the analysis, sequences from the available genomes of 47 species 267
from the order Streptomycetales (Streptomyces, Kitakatospora, Table S2) and 58 species from the 268
order Corynebacteriales (family Corynebacteriaceae: Corynebacterium; family Gordoniaceae: 269

14
Gordonia; family Mycobacteriaceae: Mycobacterium; family Nocardiaceae: Nocardia, 270
Rhodococcus; Table S2) were used. Sequences were aligned and trimmed to the amplified length 271
of both gene markers in BioEdit 7.2.5 software (Hall, Biosciences, & Carlsbad, 2011). The 272
pairwise distances between sequences were calculated in Mothur v. 1.39.5 software (Schloss et al., 273
2009). 274
275
hsp65 reference database design 276
For taxonomic assignment using the hsp65 marker, the reference database of the 277
Actinobacteria hsp65 gene was constructed similarly to that of the rpoB marker in the study of 278
Ogier et al. (2019) (Ogier, Pagès, Galan, Barret, & Gaudriault, 2019). Sequences homologous to 279
the 65-kDA heat shock protein (hsp65) of the reference strain Nocardia asteroides ATCC 14759 280
(Rodríguez-Nava et al., 2006) amplified by the TB11 and TB12 primers (Telenti et al., 1993) were 281
collected in the online databases of IMG and NCBI. Paralogs of heat shock proteins, such as groEL 282
genes from Escherichia coli (Colaco & MacDougall, 2014; Duchêne, Kieser, Hopwood, 283
Thompson, & Mazodier, 1994; C. M. S. Kumar, Mande, & Mahajan, 2015), were identified using 284
maximum-likelihood, FastTree 2.1 (Price, Dehal, & Arkin, 2010) and were kept in the reference 285
database (renamed as GROESL sequences) as an outgroup that enabled amplified sequences 286
belonging to this variant to be discarded. 287
The hsp65 database contained 5,165 sequences, of which 1,782 sequences were denoted as 288
GROESL at the time of the analysis. Evaluation of the TB11 and TB12 primer complementarity 289
with the sequences from the reference database was performed using the OligoAnalyzer 3.1 tool 290
(http://www.idtdna.com/calc/analyzer). The percent coverage of the primers of Actinobacteria 291
genomes from different classes and orders was determined with primer BLAST using the RefSeq 292

15
reference genomes (NCBI). Only targets with no mismatches for the last three nucleotides at the 293
3´ end and no more than 4 overall mismatches were included. 294

16
Results295
Sequence polymorphism of hsp65 versus 16S rRNA genes for cave Actinobacteria296
A total of 1,799,680 hsp65 and 1,919,236 16S rRNA gene sequence reads were obtained 297
for cave Actinobacteria. They were mapped to 968 (97% cutoff) and 4,265 OTUs (99% cutoff) for 298
hsp65, vs only 299 (97% cutoff) and 718 OTUs (99% cutoff) for 16S rRNA genes.299
The curves of 16S rRNA genes for both cutoffs were more skewed and thus indicated an 300
accumulation of identical OTUs due to their repeated sampling, which did not increase with a 301
stricter cutoff, in contrast to hsp65 (Fig. 2A). These results are in accordance with the in silico302
analysis of hsp65 and 16S rRNA partial gene sequences downloaded from genomes available on 303
IMG, where the pairwise distances between hsp65 sequences, even for closely related species, 304
were higher than those between 16S rRNA genes (Fig. 2B).305
Fig. 2. A. Rarefaction curves for the 37 common samples of the hsp65 and 16S rRNA genes at the 306
97% and 99% OTU cutoffs. The X-axis indicates the number of samples, and the Y-axis indicates 307
the number of OTUs. B. Pairwise molecular distances between sequences of the hsp65 (Y axes) 308
and 16S rRNA (X axes) genes among Actinobacteria species from different taxonomical levels 309
with the R2 level for each equation.310
311
0
0.05
0.1
0.15
0.2
0.25
0.3
0 0.05 0.1 0.15 0.2
Pairwise distances between 16S rRNA sequences
Intra - genus (R2 = 0.269)
Intra- order (R2 =0.18)
Intra - family (R2 =0.028)
Intra - class (R2 =0.045)
0
500
1000
1500
2000
2500
3000
3500
4000
4500
0 2 4 6 8 10 12 14 16 18 20 22 24 26 28 30 32 34 36
Number of samples
hsp65 - 99%
16S rRNA - 99%
hsp65 - 97%
16S rRNA - 97%
37

17
The hsp65 primers targeted hsp65 sequences from the reference database with lower 312
numbers of mismatches compared to the outgroup (i.e., distant homologs renamed in the database 313
as GROESL, GroEl of Escherichia coli and Chloroflexi members) (Table S3). However, the 314
primers targeted only selected groups from the class Actinobacteria as can be seen from analysis 315
with representative genomes from online database (Table S4). Moreover, the number of taxa 316
identified at class or lower categories is shown in a Fig. 3. At the class level, 20% of the detected 317
class with hsp65 were also recovered with 16S rRNA, 32.3% it was for order 36.1% for family, 318
24.6% for genus-level taxa. Although the number of taxa detected uniquely by hsp65 marker had 319
increasing trend with the lower taxonomic category, contrary to 16S rRNA, hsp65 detected overall 320
lower number of taxa. However, on a species level overall 168 species were recovered only by 321
hsp65 marker, where the highest species number were found for Streptomyces, Mycobacterium 322
and Nocardia genera (Table S5). 323
324

18
Fig 3. Venn diagrams showing the number of different Actinobacteria taxa recovered with hsp65 325
(blue) or 16S rRNA (red) at different taxonomic ranks. (A) Class, (B) Order, (C) Family, (E) 326
Genus.327
328
This means that the 16S rRNA marker was more suited for broad taxonomic profiling of 329
the Actinobacteria community. In comparison, the hsp65 marker could distinguish between 330
selected Actinobacteria species, which the 16S marker failed to achieve, and thus it completed the 331
results from the 16S rRNA marker (Table S5).332
333
Actinobacteria diversity in caves based on hsp65 versus 16S rRNA genes334
According to the diversity analysis based on 37 common samples of both markers, the 335
hsp65 marker recorded higher richness (Chao-1 index) and eveness (Simpson evenness index) only 336
when considering the 99% OTU cutoff than 16S rRNA marker (Table S6). The diversity analysis 337

19
based on all samples indicated that Rouffignac Cave exhibited the highest Actinobacteria richness 338
(Chao 1 index, for the hsp65 marker; Fig. S1) but lower evenness (Simpson evenness index; for 339
both markers; Fig. S1) as well as diversity (Inverse Simpson index; for the 16S rRNA marker; Fig. 340
S1) among other caves. In contrast, the Lascaux and Rouffignac Caves had lower evenness than 341
the pristine Reille (for the 16S rRNA marker) and the Mouflon Caves (for the hsp65 marker; Fig. 342
S1). When comparing locations within Lascaux Cave, only the difference in Actinobacteria 343
richness between Sas-1 and Passage B was significant (for the 16S rRNA marker; Fig. S1). The 344
average diversity of the unmarked areas was higher than that of the marked areas for both markers, 345
(Fig. S1). Therefore, when documenting diversity hsp65 might uncovered the high richness in 346
some of the samples which was not recorded by the 16S rRNA marker. 347
348
Actinobacteria community structure in caves based on hsp65 versus 16S rRNA genes 349
NMDS analysis was conducted to compare the Actinobacteria communities in caves (97% 350
OTU cutoff). These communities did not differ significantly between pristine caves Reille and 351
Mouflon (AMOVA), based on hsp65 and 16S rRNA genes. NMDS distinguished three groups of 352
communities corresponding to Lascaux, Rouffignac, and the two pristine caves Reille and 353
Mouflon, which was further supported by AMOVA (Table S7 A). The AMOVA comparison of 354
two groups: anthropized (Lascaux and Rouffignac) and pristine (Reille and Mouflon) caves 355
showed, that they significantly differed according to both markers (hsp65: F= 3.986, p < 0.001, 356
16S rRNA: F=8.610, p < 0.001). Within Lascaux Cave, the Actinobacteria communities differed 357
largely according to all locations (i.e. Sas-1, Passage B, Passage IP, Apse, Diaclase) with both 358
markers, except that differences between Passage IP, Sas-1 (both markers) and Diaclase (hsp65) 359
were not significant due to the low number of samples (Table S7 A). Overall, the effect of surface 360

20
alterations (i.e. marked vs unmarked areas) in Lascaux Cave was significant for both markers 361
(Table S7 A), with higher Actinobacteria stability in unmarked than vs marked areas (Table S7 362
B). Passage B had the highest community stability compared to Passage IP, Apse and Diaclase 363
(Table S7 B), which was reflected in the NMDS plot, where the marked and unmarked areas in 364
Passage IP were the least separated from one another (Fig. 4). 365
Fig. 4. Sammon projection of nonmetric multidimensional scaling (NMDS) based on the Bray-366
Curtis distance matrices of the hsp65 and 16S rRNA gene markers of A. different caves and B. 367
Lascaux Cave locations and marked/unmarked areas. The F-values and P-values of overall 368
AMOVA are indicated (a - locations, b - un/marked areas; 97% OTU cutoff). 369
370
371
372
−0.4
0.0
0.4
−0.4 0.0 0.4 0.8
NMDS1
NM
DS
2
−0.4
0.0
0.4
NM
DS
2
F, P
F, Pa. = 4.279***
−0.4
0.0
0.4
−0.4 0.0 0.4
−0.6
−0.3
0.0
0.3
F, P =
F, Pa. = 4.66***
hsp65 marker 16S rRNA marker
SAS - 1
Passage B
Passage IP
Apse
Diaclase
Mouflon
Reille
Apse
Diaclase
Rouffignac
F, Pb. = 2.23** F, Pb. .= 2.66***
5 .3 2 * * *= 5 .2 7 * * *

21
Core and cave-specific Actinobacteria microbiomes based on hsp65 versus 16S rRNA genes 373
Venn diagrams indicated that the number of OTUs shared between different caves 374
(Rouffignac, Lascaux, Mouflon, Reille) was only 2 (0.04%) for the hsp65 marker vs 72 (11%) for 375
the 16S rRNA marker (Fig. S2). Similarly, the number of OTUs shared between different Lascaux 376
rooms (Sas-1, Passage, Apse, Diaclase) reached 23 OTUs (0.89%) for the hsp65 marker vs as 377
many as 88 (15.9%) for the 16S rRNA marker. The core microbiome was constituted especially 378
by Pseudonocardiales and Streptomycetales, as determined by hsp65, and Gaiellales, 379
Pseudonocardiales and strain IMCC26256_ge, as determined by 16S rRNA genes (Fig. S3). 380
The pairwise comparison of cave conditions (Rouffignac, Lascaux’s Apse and Diaclase, 381
Mouflon, Reille) using significantly different OTUs (Metastats) showed that Rouffignac (based on 382
hsp65) and Lascaux’s Apse (based on 16S rRNA genes) were most enriched in OTUs, separating 383
them from the other caves (Fig. 5). Among them, Pseudonocardiaceae, Crosiella and Nocardia 384
were the most abundant taxa that distinguished Rouffignac (for both markers), while Nocardioides, 385
Rhodococcus, Pseudonocardia distinguished Lascaux’s Apse from the other caves and Diaclase. 386
Mycobacterium was uniquely found in Lascaux’s Apse according to both markers. Pristine caves 387
were typified by Streptomyces (hsp65 marker), Gaiellales, Pseudonocardiales and the 388
environmental clones MB-A2-108_ge and IMCC26256_ge (16S rRNA genes)(Fig. 5). 389
390

22
Fig. 5. Significantly different OTUs between pairs of caves (Metastats, P < 0.005). For each cave, 391
the number of OTUs that proportionally differed from other caves and taxonomically assigned 392
OTUs proportionally the most abundant in the respective cave are indicated (99% OTU cutoff).393
394
Proportions of cave Actinobacteria in sequences libraries based on hsp65 versus 16S rRNA 395
genes396
Taxonomical analysis showed that Jiangellaceae, Actinobacteria incertae sedis 397
Brevibacteriaceae, Nocardiopsaceae and Gordoniaceae were uniquely identified by hsp65 marker 398
but not by 16S rRNA marker. Nocardioidaceae, Streptomycetaceae and Pseudonocardiaceae399
dominated the sequence libraries of both gene markers, when considering all cave conditions 400
together. Nocardioidaceae and Streptomycetaceae (according to hsp65) while Nocardiaceae and 401
Streptomycetaceae (according to 16S rRNA marker) were redundant especially in Lascaux Cave. 402
According to both gene markers, Streptomycetaceae were in a higher proportion in marked areas403
than in unmarked areas of the Lascaux cave (Fig. 6). With a closer focus on Streptomyces using 404
hsp65 marker 16S rRNA marker
26
3516
7775
14
104
148
17830
29
18
53
54
56 63 4528
57100
12487
5145
6382
1824
55
46
2

23
only the hsp65 marker, which contrary to 16S rRNA can identify the species, S. mirabilis, S. 405
niveus, and S. fulvissimus were the three species, which dominated in marked areas within Lascaux 406
Cave (Metastats P < 0.005; Fig. S4). The opposite result was found for Pseudonocardiaceae, 407
which were more proportionally abundant in Lascaux’s unmarked areas than in marked areas 408
except for Passage IP (by hsp65) and Passage B (by 16S rRNA marker) (Fig. 6). Mycobacteriaceae 409
were found to be highly abundant in Lascaux Cave, and the hsp65 marker also identified them in 410
Mouflon. Jiangellaceae was a group that was typical in Rouffignac and Passage IP (hsp65 marker). 411
Closer analysis of Nocardiaceae with the hsp65 marker uncovered the greatest richness of 412
Nocardia species in Rouffignac (including N. carnea, N. paucivorans, N. abscessus). Moreover, 413
high proportions of N. jejuensis in Lascaux and Mouflon, and N. cummidelens in Rouffignac, Apse 414
and Reille were found (Fig. S5). Both pristine caves had similar compositions of Actinobacteria 415
communities, especially Gaiellaceae, taxa related to the environmental clones MB-A2-108_fa and 416
IMCC26256_fa (16S rRNA marker), and high proportions of unclassified Actinobacteria (hsp65), 417
High proportions of unclassified Actinobacteria were similarly to pristine caves observed in 418
Diaclase (Fig. 6). 419

24
420
Fig. 6. Average proportions of families in the Actinobacteria A. hsp65 and B. 16S rRNA amplicon 421
sequence libraries from different caves (Rouffignac, Lascaux, Mouflon and Reille), Lascaux Cave 422
locations (Sas-1, Passage-B, Passage - IP, Apse and Diaclase) and marked (S)/unmarked areas (U) 423
within Lascaux.424
425
426
427
428
0
10
20
30
40
50
60
70
80
90
100Unclassified
Other families (> 1%)
Propionibacteriaceae
Intrasporangiaceae
Sporichthyaceae
Thermomonosporaceae
Nakamurellaceae
Streptosporangiaceae
Streptosporangiales unclass.
Corynebacteriales unclass.
Propionibacteriales unclass.
Micromonosporaceae
Jiangellaceae
Nocardiaceae
Mycobacteriaceae
Pseudonocardiaceae
Streptomycetaceae
Norcardioidaceae
A.
B.
0
10
20
30
40
50
60
70
80
90
100Unclassified
Other families (> 10%)
Sporichthyaceae
Cryptosporangiaceae
Iamiaceae
Mycobacteriaceae
Intrasporangiaceae
Microbacteriaceae
Solirubrobacteraceae
Gaiellaceae
MB-A2-108_fa
67-14
Streptosporangiaceae
Frankiaceae
Propionibacteriaceae
IMCC26256_fa
Ilumatobacteraceae
Nocardiaceae
Micromonosporaceae
Uncultured
Nocardioidaceae
Streptomycetaceae
Pseudonocardiaceae

25
Co-occurrence of Actinobacteria in Lascaux Cave based on hsp65 versus 16S rRNA genes 429
Co-occurrence networks showed the Spearman correlations between the relative 430
abundances of the Actinobacteria OTUs in Lascaux Cave (Fig. 7). The co-occurrence networks 431
identify OTUs significantly different for any of the Lascaux locations (calculated by Lefse) or for 432
marked/unmarked areas (calculated by Metastats). More co-occurrence connections were found 433
for hsp65 than for 16S rRNA marker. For hsp65 marker, more correlated OTUs were not indicated 434
by Lefse or Metastats as typical for any of the Lascaux location or marked/unmarked area, 435
respectively. Negative correlations between the OTUs revealed only 16S rRNA marker. 436
We found clusters of correlated OTUs dominating the unmarked areas that were also 437
significantly different in the Apse and Diaclase based on both gene markers (Fig. 7). Additionally, 438
OTUs clusters that dominated the marked areas were typical for the Diaclase and Sas-1 areas based 439
on the 16S rRNA marker. The OTUs from such distinct areas (Diaclase and Sas-1) correlated with 440
each other, suggesting that the marked areas factors affected the Actinobacteria communities in 441
both locations (Fig. 7). However, the hsp65 gene marker showed that the OTU clusters typical of 442
marked areas were not typical for any of the Lascaux Cave locations. Finally, based on 16S rRNA 443
marker, the highest number of correlations between OTUs that did not differ between the marked 444
and unmarked areas was found for those that dominated in Passage B, Sas-1 and Diaclase (Fig. 7). 445
For those OTUs, the location factor was more influential than the marked/unmarked areas. 446
Networks based on both markers include variable actors (except the OTUs in unmarked areas of 447
Apse and in Diaclase regardless marked/unmarked areas) which show that each marker cover 448
different part of community and their interactions. 449
450

26
Fig. 7. Co-occurrence networks of Actinobacteria OTUs (A. hsp65 marker, B. 16S rRNA 451
marker) between OTUs that were significantly different between marked (black) and unmarked 452
(white) areas in Lascaux Cave and those that did not differ between these areas (gray) using 453
Metastats (P < 0.05). The letters indicate OTUs that were specific for the respective Lascaux Cave 454
locations (S, Sas-1; PB, Passage banks; PI, Passage inclined planes; A, Apse; and D, Diaclase) 455
using Lefse (P < 0.03). Strong significant connections (Spearman´s correlation > 0.8 and < 0.5 for 456
16S rRNA gene and < 0.35 for hsp65 these thresholds are determined how?) are displayed (99% 457
OTU cutoff). 458
16S rRNA marker
S
S
S
S
S
S
S
S
S S
S
S
S S
S
S S
S
S
S
S
S
S
S S
S
S
S
S
S
S
S
S
S
S
S
S
S
S
S
S
SPI
PI
PI
PI
PI
PI
PB
PB
PB
PB
PB
PB
PB PB
PB PB
PB
PB
PB
PB
PB
PB
PB PB
PB
PB
PB
PB
PB
PB PB
PB
PB
PB
D
D
D D
D
D
D D D
D
D
D
D
D
D
D
D D
D
D
D
D
D
D
D
D
D D
D
A
A
A
A
A
A
A
A
A
A
A
A
A
A
A
hsp65 marker
D
D D
D
D
D
D
D D
D D
D
D
D
D
D
D
D
D
A A
A
A A
D D
A
AD
DA
A
A
D
D

27
Discussion 459
This study represents the first attempt to exploit the potential of hsp65 as a taxonomic 460
marker more discriminant than the 16S rRNA gene to document Actinobacteria diversity at the 461
species level in cave environments. Indeed, Venn results showed a higher variability for hsp65 462
sequences than for Actinobacteria 16S rRNA sequences, and a higher OTU richness (at the 99% 463
cutoff) of Actinobacteria was obtained. Moreover, thanks to hsp65 marker we evidenced 168 464
species which could not be identified by the same samples number of 16S rRNA marker. 465
Therefore, lower interspecific variation of 16S rRNA might underestimates the true diversity 466
which might be obtained by hsp65 marker as was similarly found for other protein-coding gene, 467
(namely rpoB) (Vos et al., 2012). However, overall more taxa on higher taxonomic ranks were 468
identified by 16S rRNA than hsp65 marker which might point on gaps in reference database which 469
prevent complete taxonomic assignment of hsp65 sequences. Another reason might be a problem 470
with mismatch primers. As was shown by in silico analysis, the primers amplify the gene from 471
diverse Actinobacteria genomes, but targets without perfect homology might be amplified with 472
lower efficiency leading to underestimation of some taxa (Deagle, Jarman, Coissac, Pompanon, & 473
Taberlet, 2014). It confirms that hsp65 marker is suitable complement for 16S rRNA in high 474
throughput sequencing methods, especially for specific taxonomic groups analysis into species 475
level, but possible primer biases might be take into account especially for community analysis at 476
higher taxonomic ranks. 477
In this study, the combination of hsp65 and 16S rRNA markers showed that Actinobacteria 478
diversity could vary according to anthropization in caves, at both higher (i.e., between caves) and 479
lower (i.e., between locations within one cave) spatial scales. Indeed, the actinobacterial 480
communities of anthropized (Lascaux and Rouffignac) and pristine caves (Reille and Mouflon) 481

28
differed. The occurrence of these caves in the same region and limestone vein probably facilitated 482
this observation, as geographic distance (Barraclough, Balbi, & Ellis, 2012) and geological type 483
(Zhu et al., 2019) are significant factors influencing cave communities. The core Actinobacteria 484
microbiome was relatively small (especially for hsp65) but it included typical pristine cave taxa, 485
indicating that at least part of the community was able to resist anthropogenic disturbances (Shade 486
et al., 2012). 487
Mouflon and Reille are pristine caves with evenly distributed taxa in the Actinobacteria 488
community, possibly as a result of their stable environments without man-made disturbances 489
(Mammola, 2019). Typical pristine cave taxa were evidenced in Mouflon and Reille, such as 490
Gaiellales (Zhu et al., 2019) and Actinobacteria related to the environmental clone MB-A2-491
108_ge (A. DE Kumar et al., 2019; Zhang et al., 2019) according to the 16S rRNA marker. vs 492
High proportions of Streptomyces and unclassified Actinobacteria based on hsp65 data suggest 493
that each marker selectively identify partly a different Actinobacteria community. Environmental 494
selection in oligotrophic habitats may promote high molecular evolution (Kuo & Ochman, 2009a; 495
Sagova-Mareckova et al., 2015a) and result in a high number of novel species isolated from caves 496
(A. DE Kumar et al., 2019). A similar result was also found for Streptomyces genera (Hamm et 497
al., 2017), whose genomes may undergo a high evolution rate (Cheng et al., 2015). Interestingly, 498
similar results (i.e. high proportions of Streptomyces) to those for pristine caves were obtained 499
from Diaclase, which is an isolated site within the anthropized Lascaux Cave (Kuo & Ochman, 500
2009b; Sagova-Mareckova et al., 2015b), suggesting that it has remained at least partially 501
protected from human impacts. Therefore, not only individual caves but also less-exposed 502
locations within anthopized caves maintained a typical Actinobacteria cave community, which 503
probably include novel taxa not described so far (Rangseekaew & Pathom-Aree, 2019). 504

29
Contrary to a previous study based on whole bacterial community (Alonso et al., 2019), we 505
found a high richness but low evenness of Actinobacteria in the visited Rouffignac Cave compared 506
to the pristine caves based on hsp65 marker. The high richness of Actinobacteria in this cave might 507
be a result of community response to a disturbance, since more diverse community is more resilient 508
to stressfull conditions (Shade et al., 2012). Our results are especially supported by the dominance 509
of Pseudonocardiaceae (based on 16S rRNA sequences), an indicator of human contamination 510
(Miller et al., 2018), as well as by the highest richness of Nocardia species (based on the hsp65 511
marker). More specifically, in Lascaux and Mouflon dominated N. jejuensis, the species firstly 512
isolated from a natural cave, while in Reille, Rouffignac and Apse dominated N. cummidelens, a 513
species previously isolated from rocks of Altamira cave (Valme Jurado, Fernandez-Cortes, et al., 514
2009). However, Nocardia in Rouffignac uniquely included species with pathogenic potential, 515
such as N. carnea (Boiron, Provost, Chevrier, & Dupont, 1992), N. paucivorans (Watanabe et al., 516
2006), N. testacea (Taj-Aldeen et al., 2013), and N. abscessus (Kageyama et al., 2004). Although 517
we cannot know if these environmental bacteria present any pathogenic potential, as those found 518
in human hosts, the enrichment of these species in caves points to a possible allochthonous input 519
by tourists. In turn, it raises the issue of potential health concerns, as proposed previously (Valme 520
Jurado et al., 2010), even though Actinobacteria disease problems related to cave frequentation 521
have never been reported. In contrast, Jiangellaceae are a typical pristine cave family 522
(Rangseekaew & Pathom-aree, 2019) and are another important group in Rouffignac Cave. 523
According to the intermediate disturbance hypothesis (Roxburgh, Shea, & Wilson, 2004), the 524
coexistence of typical pristine and anthropized taxa in one habitat may suggest that the cave is 525
under intermediate environmental pressure. 526

30
The actinobacterial communities in caves were highly specific even within very close 527
distances (81), since each Lascaux room hosted its own Actinobacteria populations. Lascaux Cave 528
was typified by high abundances of Mycobacterium. Similar to Nocardia in Rouffignac, this group 529
can signify external contamination (Valme Jurado et al., 2010; Modra et al., 2017). Confirming 530
the previous results from Alonso et al. (2018) that were based on the whole bacterial community 531
(Alonso et al., 2018), the different geological substrates of Lascaux’s Passage had a stronger role 532
than the occurrence of marks, but marks there (black stains) had formed years before. However, 533
the effect of geological substrate contrasted with Diaclase and Apse because these two locations 534
contained significantly different Actinobacteria, especially in unmarked areas, as shown by 535
network analysis. It is possible that the isolation and distance from the cave entrance represent the 536
best filter for alien microorganisms and enable the maintenance of the cave oligotrophic 537
community, which is typical for unmarked areas (Cuezva, Sanchez-Moral, Saiz-Jimenez, & 538
Cañaveras, 2009; Mammola, 2019). 539
Our results show that the Actinobacteria community, mainly Streptomyces, varied 540
according to the presence of visual marks. Marked areas, where Streptomycetaceae dominated, 541
exhibited much lower diversity than unmarked zones, where Pseudonocardiaceae were prevalent. 542
Similarly to our study, the group Pseudonocardiaceae was confirmed as true cave rock dwellers 543
(Zhu et al., 2019). However, contrary to our results, this group was typically found in pigmented 544
zones of pristine caves (Lavoie et al., 2017). In addition, the members from the group 545
Pseudonocardiaceae are degraders of complex molecules and indicators of anthropogenic 546
contamination (Lavoie et al., 2017; Porca et al., 2012), which suggests that the unmarked areas 547
were not completely oligotrophic (Tomczyk-Żak & Zielenkiewicz, 2016). However, the higher 548
community diversity in unmarked areas than in marked areas indicates the prevalence of 549

31
cooperative relationships, which are typical for oligotrophic cave environments (Tomczyk-Żak & 550
Zielenkiewicz, 2016). 551
In contrast, the diversity of marked areas might be reduced due to the competitive 552
advantage of invading species (Hamm et al., 2017; Van Elsas et al., 2012). In isolated cave 553
systems, invasions are expected from the cave entrance, similar to Altamira Cave, where 554
Streptomyces is the most dominant group, especially in st ains (Groth, Vettermann, Schuetze, 555
Schumann, & Saiz-Jimenez, 1999). Moreover, they are generally known to be competitively 556
effective because of their secondary metabolite production, which is supported by the prevalence 557
of the antimicrobial producers S. mirabilis, with gray mycelium (El-Sayed, 2012), S. niveus 558
(Kominek, 1972), and S. fulvissimus (Myronovskyi, Tokovenko, Manderscheid, Petzke, & 559
Luzhetskyy, 2013) in stains. Hypothetically, Streptomyces might also contribute to pigment 560
production, as indicated in different studies (Abdel-Haliem, Sakr, Ali, Ghaly, & Sohlenkamp, 561
2013; Cuezva et al., 2012), or might affect the pigment-forming fungi that are involved in black 562
stain formation in Lascaux Cave (De La Rosa et al., 2017; Frey-Klett et al., 2011). Another study 563
showed that Streptomyces cooperation with fungi in stains promoted mycelial extension and 564
secondary metabolite production of fungi (Frey-Klett et al., 2011). A previous study showed the 565
correlation between Streptomyces and pigment-forming fungi Acremonium and Exophiala in 566
Lascaux Cave, although only in unmarked areas (Alonso et al., 2018). Therefore, Streptomyces 567
role in black stains should be studied in more detail to evaluate if this group may represent a 568
missing chain for understanding stain development in Lascaux Cave. 569
To conclude, the hsp65 marker can be reliably used for differentiating Actinobacteria 570
species present in environmental samples. However, in environmental studies, hsp65 should 571
functionate as a complement for 16S rRNA gene, since 16S rRNA gene encompass larger part of 572

32
Actinobacteria community but cannot resolve species. the Actinobacteria community at different 573
spatial levels reflected the natural quality of the caves and different locations within Lascaux Cave. 574
Anthropization was shown to shape Actinobacteria communities, which altered typical cave 575
communities and was exhibited by the indicator Actinobacteria. We first found that the marked 576
areas of Lascaux Cave are an important factor shaping Actinobacteria communities, with particular 577
reference to the Streptomyces. Finally, the study revealed the linkage between Actinobacteria in 578
anthropized caves and marked areas and may help promote the conservation of 579

33
References 580
Abdel-Haliem, M. E. F., Sakr, A. A., Ali, M. F., Ghaly, M. F., & Sohlenkamp, C. (2013). Characterization of 581 Streptomyces isolates causing colour changes of mural paintings in ancient Egyptian tombs. Microbiological 582 Research, 168(7), 428–437. doi: 10.1016/j.micres.2013.02.004 583
Alonso, L., Creuzé-des-Châtelliers, C., Trabac, T., Dubost, A., Moënne-Loccoz, Y., & Pommier, T. (2018). Rock 584 substrate rather than black stain alterations drives microbial community structure in the passage of Lascaux 585 Cave. Microbiome, 6(1), 216. doi: 10.1186/s40168-018-0599-9 586
Alonso, L., Pommier, T., Kaufmann, B., Dubost, A., Chapulliot, D., Doré, J., … Moënne-Loccoz, Y. (2019). 587 Anthropization level of Lascaux Cave microbiome shown by regional-scale comparisons of pristine and 588 anthropized caves. Molecular Ecology, 28(14), 3383–3394. doi: 10.1111/mec.15144 589
Barraclough, T. G., Balbi, K. J., & Ellis, R. J. (2012). Evolving Concepts of Bacterial Species. Evolution Biology, 39, 590 148–157. doi: 10.1007/s11692-012-9181-8 591
Barton, H. A., & Jurado, V. (2007). What’s Up Down There? Microbial Diversity in Caves Microorganisms in caves 592 survive under nutrient-poor conditions and are metabolically versatile and unexpectedly diverse. Retrieved 593 from 594 https://pdfs.semanticscholar.org/cc59/ea424434255719237886aa7de76b3c99b24e.pdf?_ga=2.138095863.6183595 14355.1561451191-1159738399.1560451939 596
Barton, H. A., Taylor, N. M., Kreate, M. P., Springer, A. C., Oehrle, S. A., & Bertog, J. L. (2007). The Impact of Host 597 Rock Geochemistry on Bacterial Community Structure in Oligotrophic Cave Environments. International 598 Journal of Speleology, 36 (2), 93–104. Retrieved from www.ijs.speleo.it 599
Bastian, F., Jurado, V., Novakova, A., Alabouvette, C., & Saiz-Jimenez, C. (2010). The microbiology of Lascaux 600 Cave. Microbiology, 156(3), 644–652. doi: 10.1099/mic.0.036160-0 601
Bastian, M., Heymann, S., & Jacomy, M. (2009). Gephi: An Open Source Software for Exploring and Manipulating 602 Networks. Proceedings of the Third International ICWSM Conference (2009), 361–362. doi: 603 10.1136/qshc.2004.010033 604
Bercea, S., Năstase-Bucur, R., Moldovan, O. T., Kenesz, M., & Constantin, S. (2019). Yearly microbial cycle of 605 human exposed surfaces in show caves. Subterranean Biology, 31, 1–14. doi: 10.3897/subtbiol.31.34490 606
Bhullar, K., Waglechner, N., Pawlowski, A., Koteva, K., Banks, E. D., Johnston, M. D., … Wright, G. D. (2012). 607 Antibiotic Resistance Is Prevalent in an Isolated Cave Microbiome. PLoS ONE, 7(4), e34953. doi: 608 10.1371/journal.pone.0034953 609
Boiron, P., Provost, F., Chevrier, G., & Dupont, B. (1992). Review of nocardial infections in France 1987 to 1990. 610 European Journal of Clinical Microbiology & Infectious Diseases, 11(8), 709–714. doi: 10.1007/BF01989975 611
Cheng, K., Rong, X., Pinto-Tomás, A. A., Fernández-Villalobos, M., Murillo-Cruz, C., & Huang, Y. (2015). 612 Population genetic analysis of Streptomyces albidoflavus reveals habitat barriers to homologous recombination 613 in the diversification of streptomycetes. Applied and Environmental Microbiology, 81(3), 966–975. doi: 614 10.1128/AEM.02925-14 615
Colaco, C. A., & MacDougall, A. (2014). Mycobacterial chaperonins: the tail wags the dog. FEMS Microbiology 616 Letters, 350(1), 20–24. doi: 10.1111/1574-6968.12276 617
Cuezva, S., Fernandez-Cortes, A., Porca, E., Pašić, L., Jurado, V., Hernandez-Marine, M., … Saiz-Jimenez, C. (2012). 618 The biogeochemical role of Actinobacteria in Altamira Cave, Spain. FEMS Microbiology Ecology, 81(1), 281–619 290. doi: 10.1111/j.1574-6941.2012.01391.x 620
Cuezva, S., Sanchez-Moral, S., Saiz-Jimenez, C., & Cañaveras, J. C. (2009). Microbial communities and associated 621 mineral fabrics in Altamira Cave, Spain. International Journal of Speleology, 38(1), 83–92. doi: 10.5038/1827-622 806x.38.1.9 623
De La Rosa, J. M., Martin-Sanchez, P. M., Sanchez-Cortes, S., Hermosin, B., Knicker, H., & Saiz-Jimenez, C. (2017). 624

34
Structure of melanins from the fungi Ochroconis lascauxensis and Ochroconis anomala contaminating rock art 625 in the Lascaux Cave. Scientific Reports, 7(1), 1–11. doi: 10.1038/s41598-017-13862-7 626
De Mandal, S., Chatterjee, R., & Kumar, N. S. (2017). Dominant bacterial phyla in caves and their predicted functional 627 roles in C and N cycle. BMC Microbiology, 17(1), 1–9. doi: 10.1186/s12866-017-1002-x 628
Deagle, B. E., Jarman, S. N., Coissac, E., Pompanon, F., & Taberlet, P. (2014). DNA metabarcoding and the 629 cytochrome c oxidase subunit I marker: not a perfect match. Biology Letters, 10(9), 20140562. doi: 630 10.1098/rsbl.2014.0562 631
Duchêne, A.-M., Kieser, H. M., Hopwood, D. A., Thompson, C. J., & Mazodier, P. (1994). Characterization of two 632 groEL genes in Streptomyces coelicolor A3 (2). Gene, 144(1), 97–101. doi: 10.1016/0378-1119(94)90210-0 633
El-Sayed, M. H. (2012). Di-(2-ethylhexyl) Phthalate, a Major Bioactive Metabolite with Antimicrobial and Cytotoxic 634 Activity Isolated from the Culture Filtrate of Newly Isolated Soil Streptomyces (Streptomyces mirabilis Strain 635 NSQu-25). World Applied Sciences Journal, 20(9), 1202–1212. doi: 10.5829/idosi.wasj.2012.20.09.2868 636
Fang, B.-Z., Salam, N., Han, M.-X., Jiao, J.-Y., Cheng, J., Wei, D.-Q., … Li, W.-J. (2017). Insights on the Effects of 637 Heat Pretreatment, pH, and Calcium Salts on Isolation of Rare Actinobacteria from Karstic Caves. Frontiers in 638 Microbiology, 8. doi: 10.3389/fmicb.2017.01535 639
Fernandez-Cortes, A., Cuezva, S., Sanchez-Moral, S., Cañaveras, J. C., Porca, E., Jurado, V., … Saiz-Jimenez, C. 640 (2011). Detection of human-induced environmental disturbances in a show cave. Environmental Science and 641 Pollution Research, 18(6), 1037–1045. doi: 10.1007/s11356-011-0513-5 642
Fox, G. E., Wisotzkey, J. D., & Jurtshuk, P. (1992). How Close Is Close: 16S rRNA Sequence Identity May Not Be 643 Sufficient To Guarantee Species Identity. Int. J. Syst. Bacteriol., 42(1), 166–170. doi: 10.1099/00207713-42-1-644 166 645
Frey-Klett, P., Burlinson, P., Deveau, A., Barret, M., Tarkka, M., & Sarniguet, A. (2011). Bacterial-fungal 646 interactions: hyphens between agricultural, clinical, environmental, and food microbiologists. Microbiology and 647 Molecular Biology Reviews : MMBR, 75(4), 583–609. doi: 10.1128/MMBR.00020-11 648
Fruchterman, T. M. J., & Reingold, E. M. (1991). Graph drawing by force-directed placement. Software: Practice and 649 Experience, 21(11), 1129–1164. doi: 10.1002/spe.4380211102 650
Gao, B., & Gupta, R. (2012). Phylogenetic framework and molecular signatures for the main clades of the phylum 651 Actinobacteria. Microbiology and Molecular Biology Reviews, 76(1), 66–112. Retrieved from 652 http://mmbr.asm.org/content/76/1/66.short 653
Gonzalez-Pimentel, J. L., Miller, A. Z., Jurado, V., Laiz, L., Pereira, M. F. C., & Saiz-Jimenez, C. (2018). Yellow 654 coloured mats from lava tubes of La Palma (Canary Islands, Spain) are dominated by metabolically active 655 Actinobacteria. Sci. Rep., 8(1), 1–11. doi: 10.1038/s41598-018-20393-2 656
Groth, I., Vettermann, R., Schuetze, B., Schumann, P., & Saiz-Jimenez, C. (1999). Actinomycetes in Karstic caves of 657 northern Spain (Altamira and Tito Bustillo). Journal of Microbiological Methods, 36(1–2), 115–122. doi: 658 10.1016/S0167-7012(99)00016-0 659
Hall, T., Biosciences, I., & Carlsbad, C. (2011). BioEdit: An important software for molecular biology. GERF Bulletin 660 of Biosciences, 2(June), 60–61. doi: 10.1002/prot.24632 661
Hamedi, J., Kafshnouchi, M., & Ranjbaran, M. (2019). A Study on actinobacterial diversity of Hampoeil cave and 662 screening of their biological activities. Saudi Journal of Biological Sciences, 26(7), 1587–1595. doi: 663 10.1016/j.sjbs.2018.10.010 664
Hamm, P. S., Caimi, N. A., Northup, D. E., Valdez, E. W., Buecher, D. C., Dunlap, C. A., … Porras-Alfaro, A. (2017). 665 Western Bats as a Reservoir of Novel Streptomyces Species with Antifungal Activity. doi: 10.1128/AEM.03057-666 16 667
Hammer, Ø., Harper, D. A. T., & Ryan, P. D. (2001). PAST : PALEONTOLOGICAL STATISTICS SOFTWARE 668 PACKAGE FOR EDUCATION AND DATA ANALYSIS. 4(1), 1–9. 669

35
Herlemann, D. P. R., Labrenz, M., Jürgens, K., Bertilsson, S., Waniek, J. J., & Andersson, A. F. (2011). Transitions 670 in bacterial communities along the 2000 km salinity gradient of the Baltic Sea. ISME Journal, 5(10), 1571–671 1579. doi: 10.1038/ismej.2011.41 672
Hirsch, P. R., Mauchline, T. H., & Clark, I. M. (2010). Culture-independent molecular techniques for soil microbial 673 ecology. Soil Biol. Biochem., 42(6), 878–887. doi: 10.1016/j.soilbio.2010.02.019 674
Hoyos, M., Cañaveras, J. C., Sánchez-Moral, S., Sanz-Rubio, E., & Soler, V. (1998). Microclimatic characterization 675 of a karstic cave: human impact on microenvironmental parameters of a prehistoric rock art cave (Candamo 676 Cave, northern Spain). In Environmental Geology (Vol. 33). Springer-Verlag. Retrieved from Springer-Verlag 677 website: https://link.springer.com/content/pdf/10.1007%2Fs002540050242.pdf 678
Johnston, M. D., Muench, B. A., Banks, E. D., & Barton, H. A. (2012). Human urine in Lechuguilla cave: the 679 microbiological impact and potential for bioremediation. Journal of Cave and Karst Studies, 74(3), 278–291. 680 doi: 10.4311/2011MB0227 681
Jurado, V., Boiron, P., Kroppenstedt, R. M., Laurent, F., Couble, A., Laiz, L., … Rodriguez-Nava, V. (2008). Nocardia 682 altamirensis sp. nov., isolated from Altamira cave, Cantabria, Spain. International Journal of Systematic and 683 Evolutionary Microbiology, 58(9), 2210–2214. doi: 10.1099/ijs.0.65482-0 684
Jurado, Valme, Fernandez-Cortes, A., Cuezva, S., Laiz, L., Cañaveras, J. C., Sanchez-Moral, S., & Saiz-Jimenez, C. 685 (2009). The fungal colonisation of rock-art caves: Experimental evidence. Naturwissenschaften, 96(9), 1027–686 1034. doi: 10.1007/s00114-009-0561-6 687
Jurado, Valme, Kroppenstedt, R. M., Saiz-Jimenez, C., Klenk, H. P., Mouniée, D., Laiz, L., … Rodríguez-Nava, V. 688 (2009). Hoyosella altamirensis gen. nov., sp. nov., a new member of the order Actinomycetales isolated from a 689 cave biofilm. International Journal of Systematic and Evolutionary Microbiology, 59(12), 3105–3110. doi: 690 10.1099/ijs.0.008664-0 691
Jurado, Valme, Laiz, L., Rodriguez-Nava, V., Boiron, P., Hermosin, B., Sanchez-Moral, S., & Saiz-Jimenez, C. 692 (2010). Pathogenic and opportunistic microorganisms in caves. International Journal of Speleology, 39 (1), 15–693 24. Retrieved from www.ijs.speleo.it 694
Kageyama, A., Yazawa, K., Kudo, T., Taniguchi, H., Nishimura, K., & Mikami, Y. (2004). First Isolates of Nocardia 695 abscessus from Humans and Soil in Japan. Nippon Ishinkin Gakkai Zasshi, 45(1), 17–21. doi: 696 10.3314/jjmm.45.17 697
Kominek, L. A. (1972). Biosynthesis of novobiocin by Streptomyces niveus. Antimicrobial Agents and 698 Chemotherapy, 1(2), 123–134. doi: 10.1128/AAC.1.2.123 699
Kozich, J. J., Westcott, S. L., Baxter, N. T., Highlander, S. K., & Schloss, P. D. (2013). Development of a dual-index 700 sequencing strategy and curation pipeline for analyzing amplicon sequence data on the miseq illumina 701 sequencing platform. Appl. Environ. Microbiol., 79(17), 5112–5120. doi: 10.1128/AEM.01043-13 702
Kumar, C. M. S., Mande, S. C., & Mahajan, G. (2015). Multiple chaperonins in bacteria--novel functions and non-703 canonical behaviors. Cell Stress & Chaperones, 20(4), 555–574. doi: 10.1007/s12192-015-0598-8 704
Kumar, A. DE, Muthiyan, R., Sunder, J., Bhattacharya, D., Kundu, A., & Dam Roy, S. (2019). Profiling Bacterial 705 Diversity of B2 Cave, A Limestone Cave of Baratang, Andaman and Nicobar Islands, India. doi: 706 10.16943/ptinsa/2019/49589 707
Kuo, C. H., & Ochman, H. (2009a). Inferring clocks when lacking rocks: The variable rates of molecular evolution in 708 bacteria. Biology Direct, 4(1), 35. doi: 10.1186/1745-6150-4-35 709
Kuo, C. H., & Ochman, H. (2009b). Inferring clocks when lacking rocks: The variable rates of molecular evolution in 710 bacteria. Biology Direct, 4(1), 35. doi: 10.1186/1745-6150-4-35 711
Lavoie, K. H., Winter, A. S., Read, K. J. H., Hughes, E. M., Spilde, M. N., & Northup, D. E. (2017). Comparison of 712 bacterial communities from lava cave microbial mats to overlying surface soils from Lava Beds National 713 Monument, USA. PLoS One, 12(2). doi: 10.1371/journal.pone.0169339 714

36
Long, Y., Jiang, J., Hu, X., Zhou, J., Hu, J., & Zhou, S. (2019). Actinobacterial community in Shuanghe Cave using 715 culture-dependent and -independent approaches. World Journal of Microbiology and Biotechnology, 35(10). 716 doi: 10.1007/s11274-019-2713-y 717
Maciejewska, M., Adam, D., Naômé, A., Martinet, L., Tenconi, E., Calusinska, M., … Rigali, S. (2017). Assessment 718 of the potential role of Streptomyces in cave moonmilk formation. Front. Microbiol., 8(JUN), 1–18. doi: 719 10.3389/fmicb.2017.01181 720
Maciejewska, M., Całusińska, M., Cornet, L., Adam, D., Pessi, I., Malchair, S., … Rigali, S. (2018). High-Throughput 721 Sequencing Analysis of the Actinobacterial Spatial Diversity in Moonmilk Deposits. Antibiotics, 7(2), 27. doi: 722 10.3390/antibiotics7020027 723
Magoč, T., & Salzberg, S. L. (2011). FLASH: Fast length adjustment of short reads to improve genome assemblies. 724 Bioinformatics, 27(21), 2957–2963. doi: 10.1093/bioinformatics/btr507 725
Mammola, S. (2019). Finding answers in the dark: caves as models in ecology fifty years after Poulson and White. 726 Ecography, 42(7), 1331–1351. doi: 10.1111/ecog.03905 727
Martin-Sanchez, P. M., Miller, A. Z., & Saiz-Jimenez, C. (2015). Lascaux Cave: An Example of Fragile Ecological 728 Balance in Subterranean Environments. Microbial Life of Cave Systems. doi: 10.1515/9783110339888-015 729
Martin-Sanchez, P. M., Nováková, A., Bastian, F., Alabouvette, C., & Saiz-Jimenez, C. (2012). Use of Biocides for 730 the Control of Fungal Outbreaks in Subterranean Environments: The Case of the Lascaux Cave in France. 731 Environmental Science & Technology, 46(7), 3762–3770. doi: 10.1021/es2040625 732
Miller, A. Z., Garcia‐Sanchez, A. M., Martin‐Sanchez, P. M., Costa Pereira, M. F., Spangenberg, J. E., Jurado, V., … 733 Saiz‐Jimenez, C. (2018). Origin of abundant moonmilk deposits in a subsurface granitic environment. 734 Sedimentology, 65(5), 1482–1503. doi: 10.1111/sed.12431 735
Modra, H., Bartos, M., Hribova, P., Ulmann, V., Hubelova, D., Konecny, O., … Pavlik, I. (2017). Detection of 736 mycobacteria in the environment of the Moravian Karst (Bull Rock Cave and the relevant water catchment area): 737 the impact of water sediment, earthworm castings and bat guano. Veterinární Medicína, 62 (2017)(No. 3), 153–738 168. doi: 10.17221/126/2016-VETMED 739
Mulec, J. (2014). Human impact on underground cultural and natural heritage sites, biological parameters of 740 monitoring and remediation actions for insensitive surfaces: Case of Slovenian show caves. Journal for Nature 741 Conservation, 22(2), 132–141. doi: 10.1016/J.JNC.2013.10.001 742
Myronovskyi, M., Tokovenko, B., Manderscheid, N., Petzke, L., & Luzhetskyy, A. (2013). Complete genome 743 sequence of Streptomyces fulvissimus. Journal of Biotechnology, 168(1), 117–118. doi: 744 10.1016/j.jbiotec.2013.08.013 745
Neral, A., Rajput, Y., & Rai, V. (2015). Genotypic and Serotypic confirmations of Bacterial community to Kotumsar 746 cave for occupational safety of cave workers and visitors from pathogenic threats. International Journal of 747 Occupational Safety and Health, 5(1), 22–27. doi: 10.3126/ijosh.v5i1.16631 748
Ogier, J. C., Pagès, S., Galan, M., Barret, M., & Gaudriault, S. (2019). RpoB, a promising marker for analyzing the 749 diversity of bacterial communities by amplicon sequencing. BMC Microbiology, 19(1). doi: 10.1186/s12866-750 019-1546-z 751
Oksanen, J., Blanchet, F. G., Friendly, M., Kindt, R., Legendre, P., Mcglinn, D., … Maintainer, H. W. (2018). Package 752 “vegan” Title Community Ecology Package. Retrieved from 753 https://cran.ism.ac.jp/web/packages/vegan/vegan.pdf 754
Ondov, B. D., Bergman, N. H., & Phillippy, A. M. (2011). Interactive metagenomic visualization in a Web browser. 755 BMC Bioinformatics, 12(1), 385. doi: 10.1186/1471-2105-12-385 756
Ortiz, M., Legatzki, A., Neilson, J. W., Fryslie, B., Nelson, W. M., Wing, R. A., … Maier, R. M. (2014). Making a 757 living while starving in the dark: metagenomic insights into the energy dynamics of a carbonate cave. The ISME 758 Journal, 8(2), 478–491. doi: 10.1038/ismej.2013.159 759

37
Porca, E., Jurado, V., Žgur-Bertok, D., Saiz-Jimenez, C., & Pašić, L. (2012). Comparative analysis of yellow microbial 760 communities growing on the walls of geographically distinct caves indicates a common core of microorganisms 761 involved in their formation. FEMS Microbiology Ecology, 81(1), 255–266. doi: 10.1111/j.1574-762 6941.2012.01383.x 763
Price, M. N., Dehal, P. S., & Arkin, A. P. (2010). FastTree 2 – Approximately Maximum-Likelihood Trees for Large 764 Alignments. PLoS ONE, 5(3), e9490. doi: 10.1371/journal.pone.0009490 765
Quast, C., Pruesse, E., Yilmaz, P., Gerken, J., Schweer, T., Yarza, P., … Glöckner, F. O. (2012). The SILVA ribosomal 766 RNA gene database project: improved data processing and web-based tools. Nucleic Acids Research, 41(D1), 767 D590–D596. doi: 10.1093/nar/gks1219 768
R Core Team. (2018). R Core Team, R : A language and environment for statistical computing. R Foundation for 769 Statistical Computing, Vienna, Austria, R Foundation for Statistical Computing. 770
Rajput, Y., Rai, V., & Biswas, J. (2012). Screening of Bacterial Isolates from Various Microhabitat Sediments of 771 Kotumsar Cave: A Cogitation on Their Respective Benefits and Expected Threats for Complete Biosphere and 772 Tourists. Research Journal of Environmental Toxicology, 6(1), 13–24. 773
Rangseekaew, P., & Pathom-aree, W. (2019). Cave Actinobacteria as Producers of Bioactive Metabolites. Frontiers 774 in Microbiology, 10, 387. doi: 10.3389/fmicb.2019.00387 775
Rangseekaew, P., & Pathom-Aree, W. (2019). Cave Actinobacteria as Producers of Bioactive Metabolites. Frontiers 776 in Microbiology, 10, 387. doi: 10.3389/fmicb.2019.00387 777
Rodríguez-Nava, V., Couble, A., Devulder, G., Flandrois, J.-P., Boiron, P., & Laurent, F. (2006). Use of PCR-778 restriction enzyme pattern analysis and sequencing database for hsp65 gene-based identification of Nocardia 779 species. Journal of Clinical Microbiology, 44(2), 536–546. doi: 10.1128/JCM.44.2.536-546.2006 780
Rodríguez-Nava, V., Khan, Z. U., Pötter, G., Kroppenstedt, R. M., Boiron, P., & Laurent, F. (2007). Nocardia 781 coubleae sp. nov., isolated from oil-contaminated Kuwaiti soil. doi: 10.1099/ijs.0.64815-0 782
Rognes, T., Flouri, T., Nichols, B., Quince, C., & Mahé, F. (2016). VSEARCH: a versatile open source tool for 783 metagenomics. PeerJ, 4, e2584. doi: 10.7717/peerj.2584 784
Roxburgh, S. H., Shea, K., & Wilson, J. B. (2004). The intermediate disturbance hypothesis: Patch dynamics and 785 mechanisms of species coexistence. Ecology, 85(2), 359–371. doi: 10.1890/03-0266 786
Sagova-Mareckova, M., Ulanova, D., Sanderova, P., Omelka, M., Kamenik, Z., Olsovska, J., & Kopecky, J. (2015a). 787 Phylogenetic relatedness determined between antibiotic resistance and 16S rRNA genes in actinobacteria 788 Ecological and evolutionary microbiology. BMC Microbiology, 15(1), 81. doi: 10.1186/s12866-015-0416-6 789
Sagova-Mareckova, M., Ulanova, D., Sanderova, P., Omelka, M., Kamenik, Z., Olsovska, J., & Kopecky, J. (2015b). 790 Phylogenetic relatedness determined between antibiotic resistance and 16S rRNA genes in actinobacteria 791 Ecological and evolutionary microbiology. BMC Microbiology, 15(1), 81. doi: 10.1186/s12866-015-0416-6 792
Sánchez-Moral, S., Soler, V., Cañaveras, J. ., Sanz-Rubio, E., Van Grieken, R., & Gysels, K. (1999). Inorganic 793 deterioration affecting the Altamira Cave, N Spain: quantitative approach to wall-corrosion (solutional etching) 794 processes induced by visitors. Science of The Total Environment, 243–244, 67–84. doi: 10.1016/S0048-795 9697(99)00348-4 796
Schabereiter-Gurtner, C., Saiz-Jimenez, C., Pinar, G., Lubitz, W., & Rölleke, S. (2002). Altamira cave Paleolithic 797 paintings harbor partly unknown bacterial communities. FEMS Microbiology Letters, 211(1), 7–11. doi: 798 10.1111/j.1574-6968.2002.tb11195.x 799
Schloss, P. D., Westcott, S. L., Ryabin, T., Hall, J. R., Hartmann, M., Hollister, E. B., … Weber, C. F. (2009). 800 Introducing mothur: Open-source, platform-independent, community-supported software for describing and 801 comparing microbial communities. Appl. Environ. Microbiol., 75(23), 7537–7541. doi: 10.1128/AEM.01541-802 09 803
Segata, N., Izard, J., Waldron, L., Gevers, D., Miropolsky, L., Garrett, W. S., & Huttenhower, C. (2011). Metagenomic 804

38
biomarker discovery and explanation. Genome Biology, 12(6), R60. doi: 10.1186/gb-2011-12-6-r60 805
Shade, A., Peter, H., Allison, S. D., Baho, D. L., Berga, M., Bürgmann, H., … Gilbert, J. (2012). Fundamentals of 806 microbial community resistance and resilience. doi: 10.3389/fmicb.2012.00417 807
Syiemiong, D., & Jha, D. K. (2019). Antibacterial potential of Actinobacteria from a Limestone Mining Site in 808 Meghalaya, India. Journal of Pure and Applied Microbiology, 13(2), 789–802. doi: 10.22207/JPAM.13.2.14 809
Taj-Aldeen, S. J., Deshmukh, A., Doiphode, S., Wahab, A. A., Allangawi, M., Muzrkchi, A. Al, … Meis, J. J. (2013). 810 Molecular Identification and Susceptibility Pattern of Clinical Nocardia Species: Emergence of Nocardia 811 crassostreae as an Agent of Invasive Nocardiosis. Canadian Journal of Infectious Diseases and Medical 812 Microbiology, 24(2), e33–e38. Retrieved from https://www.hindawi.com/journals/cjidmm/2013/256025/ 813
Takeda, K., Kang, Y., Yazawa, K., Gonoi, T., & Mikami, Y. (2010). Phylogenetic studies of Nocardia species based 814 on gyrB gene analyses. Journal of Medical Microbiology, 59(2), 165–171. doi: 10.1099/jmm.0.011346-0 815
Telenti, A., Marchesi, F., Balz, M., Bally, F., Bottger, E. C., & Bodmer, T. (1993). Rapid identification of 816 mycobacteria to the species level by polymerase chain reaction and restriction enzyme analysis. Journal of 817 Clinical Microbiology, 31(2), 175–178. 818
Tomczyk-Żak, K., & Zielenkiewicz, U. (2016). Microbial Diversity in Caves. Geomicrobiol. J., 33(1), 20–38. doi: 819 10.1080/01490451.2014.1003341 820
Van Elsas, J. D., Chiurazzi, M., Mallon, C. A., Elhottova, D., Krištůfek, V., & Salles, J. F. (2012). Microbial diversity 821 determines the invasion of soil by a bacterial pathogen. Proceedings of the National Academy of Sciences of the 822 United States of America, 109(4), 1159–1164. doi: 10.1073/pnas.1109326109 823
Větrovský, T., & Baldrian, P. (2013). The Variability of the 16S rRNA Gene in Bacterial Genomes and Its 824 Consequences for Bacterial Community Analyses. PLoS ONE, 8(2), e57923. doi: 825 10.1371/journal.pone.0057923 826
Vos, M., Quince, C., Pijl, A. S., de Hollander, M., & Kowalchuk, G. A. (2012). A comparison of rpoB and 16S rRNA 827 as markers in pyrosequencing studies of bacterial diversity. PLoS ONE, 7(2). doi: 828 10.1371/journal.pone.0030600 829
Watanabe, K., Shinagawa, M., Amishima, M., Iida, S., Yazawa, K., Kageyama, A., … Mikami, Y. (2006). First 830 Clinical Isolates of Nocardia carnea, Nocardia elegans, Nocardia paucivorans, Nocardia puris and Nocardia 831 takedensis in Japan. Nippon Ishinkin Gakkai Zasshi, 47(2), 85–89. doi: 10.3314/jjmm.47.85 832
Yasir, M. (2018). Analysis of bacterial communities and characterization of antimicrobial strains from cave 833 microbiota. Brazilian Journal of Microbiology, 49(2), 248–257. doi: 10.1016/j.bjm.2017.08.005 834
Yilmaz, P., Parfrey, L. W., Yarza, P., Gerken, J., Pruesse, E., Quast, C., … Glöckner, F. O. (2014). The SILVA and 835 “all-species Living Tree Project (LTP)” taxonomic frameworks. Nucleic Acids Research, 42(D1), 643–648. doi: 836 10.1093/nar/gkt1209 837
Zhang, B., Wu, X., Tai, X., Sun, L., Wu, M., Zhang, W., … Dyson, P. (2019). Variation in Actinobacterial Community 838 Composition and Potential Function in Different Soil Ecosystems Belonging to the Arid Heihe River Basin of 839 Northwest China. Frontiers in Microbiology, 10, 2209. doi: 10.3389/fmicb.2019.02209 840
Zhu, H. Z., Zhang, Z. F., Zhou, N., Jiang, C. Y., Wang, B. J., Cai, L., & Liu, S. J. (2019). Diversity, distribution and 841 co-occurrence patterns of bacterial communities in a karst cave system. Frontiers in Microbiology, 10(JULY). 842 doi: 10.3389/fmicb.2019.01726 843
844

Supplementary Information for:
Usefulness of hsp65 marker as a complement to 16S rRNA sequences to demonstrate
differences in Actinobacteria community according to anthropization of limestone caves
and occurrence of visual marks in Lascaux Cave
Buresova Andrea1,2,3, Kopecky Jan3, Sagova-Mareckova Marketa3, Alonso Lise1, Vautrin
Florian1, Moënne-Loccoz Yvan1, Rodriguez-Nava Veronica1
1Univ Lyon, Université Claude Bernard Lyon 1, CNRS, INRAE, VetAgro Sup, UMR5557
Ecologie Microbienne, F-69622 Villeurbanne, France
2Department of Ecology, Faculty of Science, Charles University in Prague, Vinicna 7, Prague,
Czech Republic,
3Laboratory for Diagnostics and Epidemiology of Microorgansims, Crop Research Institute,
Drnovska 507, CZ-16106 Prague 6, Ruzyne, Czech Republic
This PDF file includes:
Figs. S1 to S5
Tables S1 to S7

Fig. S1. Indices of alpha diversity (richness: Chao 1, evenness: Simpson evenness, diversity:
inverse Simpson) for Actinobacteria communities among caves, different locations within
Lascaux Cave, and marked/unmarked areas. Significant differences between groups are
shown with letters (ANOVA and Tukey post hoc test; P < 0.05; 97% OTU cutoff).
16S rRNA markerhsp65 marker
50
100
150
200
250
300
A Chao- 1
0
5
10
15
20
25
30
B Inverse Simpson
0.20
0.00
0.05
0.10
0.15
0.20
0.25
0.30
0.35
0.40
0.45
0.50
DC
0.00
0.02
0.04
0.06
0.08
0.10
0.12
0.14
0.16
0.18
Simpson Eveness
Rouffignac Lascaux Mouflon Reille Rouffignac Lascaux Mouflon Reille
Simpson Eveness
a b b b ac bd cd cd
ab cd bc bc a ab a bc
0
5
10
15
20
25
30
F
Stained Unstained
Inverse SimpsonE
0
2
4
6
8
10
12
14
16
18
Stained Unstained
Inverse Simpson
0
20
40
60
80
100
120
140
160
180
G Chao-1
SAS-1 Passage IP ApsePassage B Diaclase
ab cd ac ac ac
a a b b

Fig.
Fig S2. Venn diagrams showing unique and shared OTUs between A. different caves and B.
different locations within Lascaux Cave based on hsp65 and 16S rRNA gene markers (99%
OTU cutoff).
285
SAS-1
18
1143
Passage
21
378
Apse24
391
Diaclase
16 149
52
4
4017
12
23
927
Rouffi gnac
143
2716
Lascaux
16
155
Mouflon11
239
Reille
9 19
6
4
22
14
2
A.
B.
8
Rouffi gnac
62
181
Lascaux
13
37
Mouflon25
33
Reille
8 63
44
36
3822
76
72
37
SAS-1
7
26
Passage
10
31
Apse6
42
Diaclase
54 49
54
9
8141
18
88
hsp65 marker 16S rRNA marker

Fig. S3. Taxonomical compositions of the core microbiome between A. caves and B. different
locations within Lascaux Cave based on the hsp65 and 16S rRNA gene markers (99% OTU
cutoff).
St rep t om ycet a les 5 0% 50% Pseudonocard iales22%
Corynebacteriales
A.
B.
hsp65 marker 16S rRNA marker

Fig. S4. Average proportions of species within the genus Streptomyces in the Actinobacteria
hsp65 amplicon sequence libraries significantly different in marked (S) and unmarked areas
(U) of Lascaux Cave (metastats, P < 0.05).
0
0.2
0.4
0.6
0.8
1
1.2
1.4
1.6
1.8
16.3
Streptomyces
Stained Unstained
*
*
*
**

Fig. S5. Average proportions of genus Nocardia in the Actinobacteria hsp65 gene amplicon
sequence libraries in different caves (Rouffignac, Lascaux, Mouflon and Reille) and different
locations within Lascaux Cave (Sas-1, Passage-B, Passage-IP, Apse and Diaclase).
0
0.1
0.2
0.3
0.4
0.5
0.6
0.7
0.8
0.9
N. abscessus
N. tenerifensis
N. paucivorans
N. brevicatena
N. jiangxiensis
N. rhamnosiphila
N. callitridis
N. flavorosea
N. testacea
N. ninae
N. carnea
N. goodfellowii
N. soli
N. farcinica
N. sp.
N. alba
N. asteroides
N. fluminea
N. cyriacigeorgica
N. shimofusensis
N. cummidelens
N. salmonicida
N. jejuensis
11
2
3
4
5
6
7
8
9

Sample ID Cave name Room Area Obtained sequences
Apse-S1 Lascaux Apse 16S rRNA gene
Apse-S2 Lascaux Apse hsp65, 16S rRNA gene
Apse-S3 Lascaux Apse hsp65, 16S rRNA gene
Apse-U1 Lascaux Apse hsp65, 16S rRNA gene
Apse-U2 Lascaux Apse hsp65, 16S rRNA gene
Apse-U3 Lascaux Apse hsp65, 16S rRNA gene
Apse-DZ1 Lascaux Apse 16S rRNA gene
Apse-DZ2 Lascaux Apse hsp65
Apse-DZ3 Lascaux Apse hsp65, 16S rRNA gene
Apse-DZ4 Lascaux Apse 16S rRNA gene
Apse-DZ5 Lascaux Apse hsp65, 16S rRNA gene
Apse-DZ6 Lascaux Apse hsp65, 16S rRNA gene
Apse-UDZ1 Lascaux Apse 16S rRNA gene
Apse-UDZ2 Lascaux Apse 16S rRNA gene
Apse-UDZ3 Lascaux Apse hsp65, 16S rRNA gene
Apse-UDZ4 Lascaux Apse hsp65, 16S rRNA gene
Apse-UDZ5 Lascaux Apse 16S rRNA gene
Apse-UDZ6 Lascaux Apse hsp65, 16S rRNA gene
Dia-S1 Lascaux Diaclase hsp65, 16S rRNA gene
Dia-S2 Lascaux Diaclase hsp65, 16S rRNA gene
Dia-S3 Lascaux Diaclase 16S rRNA gene
Dia-U1 Lascaux Diaclase hsp65, 16S rRNA gene
Dia-U2 Lascaux Diaclase hsp65, 16S rRNA gene
Dia-U3 Lascaux Diaclase hsp65, 16S rRNA gene
Passage B-S1 Lascaux Passage banks hsp65, 16S rRNA gene
Passage B-S2 Lascaux Passage banks hsp65, 16S rRNA gene
Passage B-S3 Lascaux Passage banks hsp65, 16S rRNA gene
Passage B-U1 Lascaux Passage banks hsp65, 16S rRNA gene
Passage B-U2 Lascaux Passage banks hsp65, 16S rRNA gene
Passage B-U3 Lascaux Passage banks hsp65, 16S rRNA gene
Passage IP-S1 Lascaux Passage inclined planes hsp65, 16S rRNA gene
Passage IP-S2 Lascaux Passage inclined planes hsp65, 16S rRNA gene
Passage IP-S3 Lascaux Passage inclined planes hsp65, 16S rRNA gene
Passage IP-U1 Lascaux Passage inclined planes hsp65, 16S rRNA gene
Passage IP-U2 Lascaux Passage inclined planes hsp65, 16S rRNA gene
Passage IP-U3 Lascaux Passage inclined planes 16S rRNA gene
SAS-1-S1 Lascaux Sas-1 (airlock-1 entrance zone, compartment 2) hsp65, 16S rRNA gene
SAS-1-S2 Lascaux Sas-1 (airlock-1 entrance zone, compartment 2) hsp65, 16S rRNA gene
SAS-1-S3 Lascaux Sas-1 (airlock-1 entrance zone, compartment 2) hsp65, 16S rRNA gene
SAS-U1 Lascaux Sas-1 (airlock-1 entrance zone, compartment 2) hsp65
SAS-U3 Lascaux Sas-1 (airlock-1 entrance zone, compartment 2) hsp65
Rouf1 Rouffignac hsp65, 16S rRNA gene
Rouf2 Rouffignac hsp65
Rouf3 Rouffignac x x hsp65
Rouf4 Rouffignac hsp65, 16S rRNA gene
Rouf5 Rouffignac hsp65, 16S rRNA gene
Rouf6 Rouffignac 16S rRNA gene
Mouf1 Mouflon 16S rRNA gene
Mouf2 Mouflon hsp65, 16S rRNA gene
Mouf3 Mouflon x x hsp65
Mouf4 Mouflon hsp65, 16S rRNA gene
Mouf5 Mouflon hsp65
Mouf6 Mouflon 16S rRNA gene
Reil1 Reille hsp65
Reil2 Reille 16S rRNA gene
Reil3 Reille x x hsp65, 16S rRNA gene
Reil4 Reille hsp65, 16S rRNA gene
Reil5 Reille 16S rRNA gene
Table S1. Location of cave samples and list of gene markers sequenced using Illumina MiSeq
Visual mark
Unmarked area
Unmarked area
Visual mark
Unmarked area
Visual mark
Unmarked area
Visual mark
Visual mark
Unmarked area
Unmarked area
Visual mark

Table S2. Genomes of Actinobacteria reference strains from the orders Streptomycetales and Corynebacteriales that were retrieved from the Integrated Microbial
Genome and Microbiome database and used for in silico analysis – comparison of the hsp65 and 16S rRNA partial gene sequences.

Number of
mismatches
Match to hsp65
[%]
Match to GROESL
[%]
Forward primer 0 30.8 0
1 74.8 0
2 86 4.2
3 98.1 56.2
4 99.1 85.4
5 100 100
Reverse primer 0 6.5 0
1 44.9 0
2 89.7 52.1
3 96.3 64.6
4 100 81.2
5 100 89.6
Table S3. Percentage of complementarity between the hsp65-specific
forward (TB11) and reverse (TB12) primers and the hsp65 sequence
database with respect to the number of mismatches.

Tab
le S
4.
Pe
rce
nt
cove
rag
e o
f th
e p
rim
ers
to
th
e Acnobacteria
Re
fSe
q r
ep
rese
nta
ve
ge
no
me
s fr
om
NC
BI
of
di
ere
nt
cla
sse
s a
nd
ord
ers
. O
nly
ta
rge
ts w
ith
no
mis
ma
tch
es
on
th
e
last
th
ree
nu
cle
od
es
of
the
3´
en
d a
nd
no
mo
re t
ha
n 4
ove
rall
mis
ma
tch
es
we
re i
ncl
ud
ed
.

Family
Nocardiaceae Nocardia (24) Rhodococcus (10)
Streptomycetaceae Streptomyces (30) Kitasatospora (1)
Mycobacteriaceae Mycobacterium (26)
Pseudonocardiaceae Amycolatopsis (7) Pseudonocardia (4) Lentzea (2) Actinomycetospora (1)
Kibdelosporangium (1) Thermocrispum (1) Saccharothrix (1) Alloactinosynnema (1)
Sciscionella (1) Actinoalloteichus (1) Actinokineospora (1)
Norcardioidaceae Nocardioides (6) Kribbella (2) Pimelobacter (1)
Marmoricola (1) Aeromicrobium (1)
Streptosporangiaceae Microbispora (1) Microtetraspora (1) Nonomuraea (1) Planomonospora (1)
Sinosporangium (1) Streptosporangium (1)
Micromonosporaceae Micromonospora (3) Longispora (1) Catelliglobosispora (1) Plantactinospora (1)
Intrasporangiaceae Janibacter (3) Knoellia (1)
Actinomycetaceae Actinomyces (3)
Jiangellaceae Jaingella (3)
Microbacteriaceae Agromyces (1) Microcella (1)
Propionibacteriaceae Cutibacterium (1) Propionibacterium (1)
Geodermatophilaceae Geodermatophilus (1) Modestobacter (1)
Micrococcaceae Micrococcus (1) Rothia (1)
Dermabacteraceae Brachybacterium (2)
Brevibacteriaceae Brevibacterium (2)
Corynebacteriaceae Corynebacterium (2)
Catenulisporaceae Catenulispora (1)
Dermacoccaceae Kytococcus (1)
Actinobacteria_incertae_sedis Thermobispora (1)
Nakamurellaceae Nakamurella (1)
Sporichthyaceae Sporichthya (1)
Nocardiopsaceae Thermobifida (1)
Genus (number of recovered species)
Table S5. Number of identified Actinobacteria species by hsp65 marker for respective genus
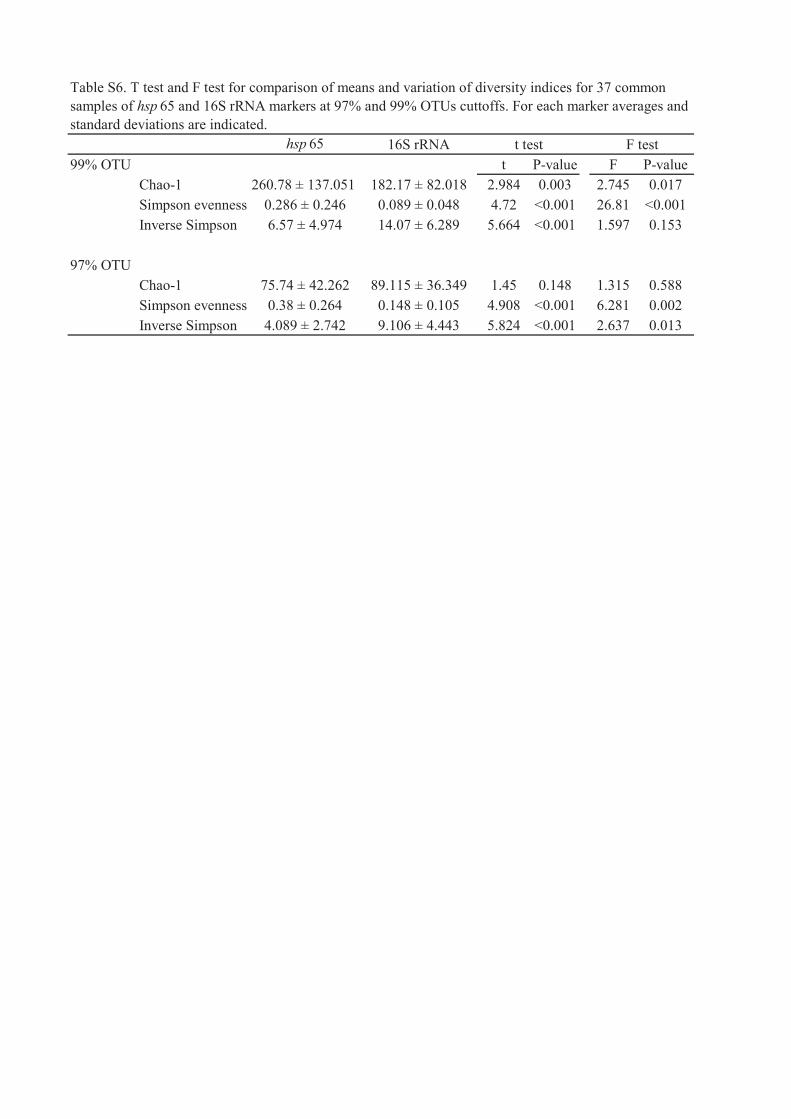
hsp 65 16S rRNA
99% OTU t P-value F P-value
Chao-1 260.78 ± 137.051 182.17 ± 82.018 2.984 0.003 2.745 0.017
Simpson evenness 0.286 ± 0.246 0.089 ± 0.048 4.72 <0.001 26.81 <0.001
Inverse Simpson 6.57 ± 4.974 14.07 ± 6.289 5.664 <0.001 1.597 0.153
97% OTU
Chao-1 75.74 ± 42.262 89.115 ± 36.349 1.45 0.148 1.315 0.588
Simpson evenness 0.38 ± 0.264 0.148 ± 0.105 4.908 <0.001 6.281 0.002
Inverse Simpson 4.089 ± 2.742 9.106 ± 4.443 5.824 <0.001 2.637 0.013
F testt test
Table S6. T test and F test for comparison of means and variation of diversity indices for 37 common
samples of hsp 65 and 16S rRNA markers at 97% and 99% OTUs cuttoffs. For each marker averages and
standard deviations are indicated.

A.
AM
OV
A
hsp
65
Df
F,
F,
F,
F,
F,
F,
F,
F,
P
Mar
ked
32
2.2
3**
Rou
ffig
nac
13
5.7
2***
Pas
sage
B10
7.8
58
**
Rei
lle
11
3.6
14
**
74
.61
7P
assa
ge
IP9
3.9
78
10
4.4
19
**
Mou
flon
12
6.2
65
**
88
.03
3*
64
.73
6A
pse
16
4.5
05
***
17
5.9
03
***16
2.5
72
***
Dia
clas
e9
4.5
18
10
5.6
35
**9
2.7
86
16
3.1
93
***
Over
all
20
5.3
17
***
Over
all
32
4.2
79
***
16
S r
RN
A
Df
F,
F,
F,
F,
F,
F,
F,
F,
P
Mar
ked
37
2.6
6***
Rou
ffig
nac
15
5.7
9***
Pas
sage
B8
10
.06
3
Rei
lle
15
5.4
3***
76
.26
3P
assa
ge
IP8
4.8
63
11
9.0
13
**
Mou
flon
15
5.3
6**
76
.32
97
2.2
60
Ap
se19
4.0
9***
22
8.1
15
***22
2.7
88
**
Dia
clas
e8
2.7
23
11
5.7
9**
11
2.9
02
**
22
3.0
05
***
Over
all
23
5.2
74
***
Over
all
37
4.6
56
***
Bo
nfe
ron
ni
pai
r-w
ise
err.
rat
e: 0
.00
8B
on
fero
nn
i p
air-
wis
e er
r. r
ate:
0.0
05
Ex
p.-
wis
e er
r. r
ate:
0.0
5
0.0
08
>*
P >
0.0
05
>*
* P
> 0
.00
1 >
P*
**
0.0
05
>*
P >
0.0
02
5 >
**
P >
0.0
01
> P
**
*0
.05
>*
P >
0.0
1 >
**
P >
0.0
01
> P
B.
HO
MO
VA
hsp
65
B,
p
Rou
ffig
na c
Las
cau
xR
eill
eS
as-1
Pas
sage
BP
assa
ge
IPA
pse
Un
mar
ked
(0.4
05
)
Rou
ffig
nac
(0
.19
3)
Sas
-1 (
0.2
29
)
Mar
ked
(0.4
53
)0
.04
8*
Las
cau
x (
0.3
03
)0
.23
5*
Pas
sage
B (
0.2
12
)0
.00
6
Rei
lle
(0.3
42
)0
.19
30
.01
0P
assa
ge
IP (
0.3
88
)0
.24
60
.36
7
Mou
flon
(0
.16
0)
0.0
26
0.3
59
0.2
95
Ap
se (
0.3
64
)0
.27
0*
0.4
33
*0
.00
5
Dia
clas
e (0
.33
3)
0.1
26
0.2
06
0.0
20
0.0
10
Over
all
0.5
73
*O
ver
all
0.6
93
*
16
S r
RN
AB
, p
Rou
ffig
nac
Las
cau
xR
eill
eS
as-1
Pas
sage
BP
assa
ge
IPA
pse
Un
mar
ked
(0.3
54
)
Rou
ffig
nac
(0
.14
5)
Sas
-1 (
0.1
53
)
Mar
ked
(0.4
05
)0
.07
86
*
Las
cau
x (
0.2
76
)0
.38
0P
assa
ge
B (
0.1
33
)0
.01
2
Rei
lle
(0.2
3)
0.1
33
0.0
34
Pas
sage
IP (
0.1
33
)0
.16
60
.53
1*
Mou
flon
(0
.19
9)
0.0
62
0.1
05
0.0
14
Ap
se (
0.3
28
)0
.36
41
.22
7*
0.0
79
Dia
clas
e (0
.37
4)
0.4
15
1.1
66
*0
.13
4*
0.0
31
Over
all
0.4
32
*O
ver
all
1.6
89
*
Bon
fero
nn
i p
air-
wis
e er
r. r
ate:
0.0
08
> P
*B
on
fero
nn
i p
air-
wis
e er
r. r
ate:
0.0
05
> P
*E
xp
.-w
ise
err.
rat
e: 0
.05
> P
*
Ap
seU
nm
ark
ed
Cav
e
Pas
sage
IPR
eill
eL
asca
ux
Rou
ffig
nac
Sas
-1P
assa
ge
B
Las
cau
x c
ave
loca
tion
Su
rfac
e ar
ea
B,
pB
, p
B,
pB
, p
Tab
le S
7. D
iffe
ren
ces
bet
wee
n A
ctin
obac
teri
a co
mm
unit
ies
bet
wee
n A
. ca
ves
, B
. dif
fere
nt
loca
tions
wit
hin
Las
caux C
ave,
and m
arked
and u
nm
arked
are
as c
alcu
late
d b
y a
nal
ysi
s of
mo
lecu
lar
var
ian
ce (
AM
OV
A)
and
hom
ogen
eity
of
mo
lecu
lar
var
ian
ce (
HO
MO
VA
) fo
r th
e hsp
65 a
nd 1
6S
rR
NA
gen
e m
arker
s (9
7%
OT
Us
cuto
ff).
Rei
lle
Un
mar
ked
Ap
seP
assa
ge
IPP
assa
ge
BS
as-1
Rou
ffig
nac
Las
cau
x
Cav
eL
asca
ux c
ave
loca
tion
Su
rfac
e ar
ea

-Part 2-
Paper II: Succession of microbial decomposers is determined
by litter type but sites conditions drive decomposition rate

Succession of Microbial Decomposers Is Determined by LitterType, but Site Conditions Drive Decomposition Rates
A. Buresova,a,b,c J. Kopecky,a V. Hrdinkova,a Z. Kamenik,d M. Omelka,e M. Sagova-Mareckovaa,f
aEpidemiology and Ecology of Microorganisms, Crop Research Institute, Prague, Czech Republic
bDepartment of Ecology, Faculty of Science, Charles University, Prague, Czech Republic
cEcologie Microbienne, Université Claude Bernard Lyon 1, Villeurbanne, France
dLaboratory for Biology of Secondary Metabolism, Institute of Microbiology, Academy of Sciences of the Czech Republic, Prague, Czech Republic
eDepartment of Probability and Mathematical Statistics, Faculty of Mathematics and Physics, Charles University in Prague, Prague, Czech Republic
fDepartment of Microbiology, Nutrition and Dietetics, Faculty of Agrobiology, Food and Natural Resources, Czech University of Life Science in Prague, Prague, Czech
Republic
ABSTRACT Soil microorganisms are diverse, although they share functions duringthe decomposition of organic matter. Thus, preferences for soil conditions and litterquality were explored to understand their niche partitioning. A 1-year-long litterbagtransplant experiment evaluated how soil physicochemical traits of contrasting sitescombined with chemically distinct litters of sedge (S), milkvetch (M) from a grass-land, and beech (B) from forest site decomposition. Litter was assessed by mass loss;C, N, and P contents; and low-molecular-weight compounds. Decomposition was de-scribed by the succession of fungi, Actinobacteria, Alphaproteobacteria, and Firmic-
utes; bacterial diversity; and extracellular enzyme activities. The M litter decomposedfaster at the nutrient-poor forest site, where the extracellular enzymes were moreactive, but microbial decomposers were not more abundant. Actinobacteria abun-dance was affected by site, while Firmicutes and fungi by litter type and Alphapro-
teobacteria by both factors. Actinobacteria were characterized as late-stage substrategeneralists, while fungi were recognized as substrate specialists and site generalists,particularly in the grassland. Overall, soil conditions determined the decompositionrates in the grassland and forest, but successional patterns of the main decomposers(fungi and Actinobacteria) were determined by litter type. These results suggest thatshifts in vegetation mostly affect microbial decomposer community composition.
IMPORTANCE Anthropogenic disturbance may cause shifts in vegetation and alterthe litter input. We studied the decomposition of different litter types under soil condi-tions of a nutrient-rich grassland and nutrient-poor forest to identify factors responsiblefor changes in the community structure and succession of microbial decomposers.This will help to predict the consequences of induced changes on the abundanceand activity of microbial decomposers and recognize if the decomposition processand resulting quality and quantity of soil organic matter will be affected at varioussites.
KEYWORDS succession, enzyme activities, forest, grassland, organic matter
Microbial community structure and activity reflect changes of biotic (soil biota) andabiotic (climate, soil chemistry, and litter quality) factors as well as ecosystem
functioning (1, 2). In particular, the complex environmental characteristics of a givensite influence the pool of microbial species at the regional scale, while litter qualityaffects the dynamics of microorganisms coming from that pool at the local scale (3, 4).
It is still debatable whether environmental conditions or litter quality plays a largerrole in decomposition (5). The transfer of litter between sites can differentiate between
Citation Buresova A, Kopecky J, Hrdinkova V,
Kamenik Z, Omelka M, Sagova-Mareckova M.
2019. Succession of microbial decomposers is
determined by litter type, but site conditions
drive decomposition rates. Appl Environ
Microbiol 85:e01760-19. https://doi.org/10
.1128/AEM.01760-19.
Editor Claire Vieille, Michigan State University
Copyright © 2019 American Society for
Microbiology. All Rights Reserved.
Address correspondence to M. Sagova-
Mareckova, [email protected].
Received 31 July 2019
Accepted 3 October 2019
Accepted manuscript posted online 11
October 2019
Published
MICROBIAL ECOLOGY
crossm
December 2019 Volume 85 Issue 24 e01760-19 aem.asm.org 1Applied and Environmental Microbiology
27 November 2019
on D
ecem
ber 3
, 2020 b
y g
uest
http
://ae
m.a
sm
.org
/D
ow
nlo
aded fro
m

these two factors because site will have a predominant effect on decomposition if thelocal communities decompose the litter to which they are preadapted faster (6). Yet, ifthe litter type affects decomposition regardless of the site, the microbes are function-ally redundant with respect to litter type (7). Therefore, to understand the factorsdriving microbial decomposition, connections between local and regional scales needto be considered over time, together with various litter types and origin (5, 8).
The roles of biotic and abiotic factors change over time as the litter is sequentiallydecomposed. As the chemical composition of litter changes, the associated microbialcommunity and extracellular enzyme activities also change (9–11). The differentialresponse of microbes to the changing litter chemistry is the basis for sorting microbesinto specific guilds (10, 12). More specifically, a nutritious organic substrate is con-nected to a wide range of nonspecialized microbes, while recalcitrant organic sub-strates are decomposed only by a limited number of taxa, which can break the resistantorganic structures (3, 13). It has been proposed that the identification of microbes fromthe late stage and/or specialized guilds should be the first step in predicting theconsequences of environmental change connected to decomposition processes intemperate areas (5, 14).
Fungi have long been considered the main microbial decomposers catalyzing thedecomposition of complex substrates (9, 15). Most studies focused on their decom-posing abilities, while factors affecting them were found to be variable (10, 16, 17).However, the role of bacteria in decomposition has also been recently highlighted (7,11). Particularly, Actinobacteria, Proteobacteria, Firmicutes, and Bacteroidetes produceextracellular enzymes and are active in substrate degradation (5, 18). Moreover, Acti-nobacteria are able to produce lignolytic enzymes and secondary metabolites and formfilaments, which are strategies similar to those of fungi (19–23). Therefore, Actinobac-teria may compete with fungi (15), but those two groups have rarely been studiedtogether during the decomposition process. Their coexistence patterns, such as nicheoverlap and/or separation (3, 15) under the influence of various abiotic factors, could bea missing biotic predictor of decomposition (5, 15, 24).
The aim of this study was to explore the interplay of factors affecting the abun-dances and succession of main decomposers. We hypothesized that main decomposerswill be site specific but will selectively inhabit different litter and shift their enzymeactivities during the decomposition stages. In particular, we wanted to determine theimportance of cross-kingdom coexistence and successional patterns of microbial com-munities in influencing the effects of litter type and soil condition on decompositionprocesses.
RESULTS
Low-molecular-weight compounds (measured by high-performance liquid chroma-tography [HPLC]) shifted over time (Fig. 1A). In January and March 2011, compoundswere separated according to litter type, while in later months they were separatedaccording to sites. The HPLC profiles of the milkvetch (M) litter type in January andMarch 2011 significantly correlated with C content (R � 6.377, P � 0.001) and mostextracellular enzymes, such as �-glucosidase (R � 7.491, P � 0.001), acid phosphatase(R � 7.776, P � 0.001), and chitinase (R � 6.152, P � 0.001), according to the permuta-tion test. Of all bacterial groups, the abundance of Actinobacteria most stronglycorrelated with the late-stage HPLC profile (R � 10.569, P � 0.001). Actinobacteria sig-nificantly correlated with soil water potential (R � 2.347, P � 0.004) and temperature(R � 4.871, P � 0.001).
Bacterial communities on the beech (B) and sedge (S) litter types separated fromthat on the M litter type, especially in January and March 2011 (Fig. 1B). Bacterialcommunities also shifted from the initial to late stages of decomposition (confirmed bySammon’s multidimensional scaling; see Fig. S1 in the supplemental material). Bacterialcommunities from a later month of decomposition significantly correlated with the abun-dances of Actinobacteria (R� 2.5940, P� 0.001), Firmicutes (R� 1.2363, P� 0.001), andbacterial diversity (R� 0.9875, P� 0.001) according to the permutation test. From January
Buresova et al. Applied and Environmental Microbiology
December 2019 Volume 85 Issue 24 e01760-19 aem.asm.org 2
on D
ecem
ber 3
, 2020 b
y g
uest
http
://ae
m.a
sm
.org
/D
ow
nlo
aded fro
m

2011, bacterial communities on the M litter type were significantly correlated with C(R� 1.3441, P� 0.001) and most extracellular enzyme activities, such as �-glucosidase(R� 1.3134, P� 0.001), cellobiohydrolase (R� 0.5805, P� 0.001), chitinase (R� 0.5606,P� 0.001), and acid phosphatase (R� 0.4410, P� 0.007). Bacterial communities on the Band S litter types in January 2011 significantly correlated with laccase (R� 0.8082,P� 0.001). The bacterial communities on the M litter from March significantly correlatedwith N (R� 0.7699, P� 0.001) and P (R� 0.5463, P� 0.002). Late-stage bacterial commu-nities significantly correlated with soil water tension (R� 0.7697, P� 0.001) and tempera-ture (R� 0.3895, P� 0.007).
Litter mass loss. Loss of dry mass significantly differed between sites in all decom-
position stages. At the forest site (F), the average residual dry mass was about 0.5 glower than the grassland site (G) (ANOVA, P � 0.001) (see Table S1 in the supplementalmaterial). Milkvetch (M) had the highest average mass loss (ANOVA, P � 0.001) (TableS1), while that of sedge (S) was significantly higher than beech (B) (ANOVA, P � 0.001)(Table S1) at both sites. Time courses of dry mass loss were similar for the same littertype regardless of the site (Fig. 2, PPerm [i.e., the P value from permutational multivariateanalysis of variance using distance matrices {PERMANOVA}] � 0.001, Table S1), whiledispersion did not differ between the litter types (Fig. 2; Table S1) (PDisp [i.e., the P valuefrom homogeneity of multivariate dispersions using dissimilarity measures] � 0.382).No significant differences were observed between the indigenous and exogenousorigin of the litter (i.e., M and S litters did not decompose faster than B litter in thegrassland and B litter did not decompose faster than M and S litters in the forest).
Carbon, nitrogen, and phosphorus contents in the litter. Carbon (C), nitrogen
(N), and phosphorus (P) contents in litter significantly differed between the forest andgrassland sites during decomposition (see Fig. S2 in the supplemental material). The Nand C contents in all litter types were significantly higher at the forest site than thegrassland site (ANOVA, P � 0.001) (Table S1), while P content showed the oppositerelationship (ANOVA, P � 0.001) (Table S1). C content did not differ between litter types
P
5
−2 −1 0 1 2
−2
−1
01
23
Fung
i
3
Actinobacteria
α-Prote
obacte
riaFirmicutes
β-glucosidasecellobiohydrolase
β-xylosidasechitinase
glucuronidaseacid phosphatase
α-glucosidase
laccase
N
C
P
SWP
T
●
●
●
●●●●
●
●
●
●
●
●
●
●
●
●●
●
●●
●
●
●
●●
●●
●1
1
1
1
1
2
2
22
2
3
3
33
3
4
4
44
4
5
55
5
6
6
667
77
7
7
1
1
1
1
12 2
2
2
2
3
3
3
3
4
4
44
5
5
5
6
6
6
67
7 77
1
1
11
1
2
2
2
2 2
3 333
3
4
44
4
4
5
5
55
5
66
6
6
6
1 1
1
1
1
2
2
2
2
2
3
33
33
44
4
4
4
5555
5
6
66
6
6
1
11
1
1
2
22
2
2
3
33
33
4
444
4
55
5
5
5
66
6
6
6
7
777
1 11
1
1
2
2
2
22
3 33
4
4
4
4
5
5
55
6
66
777
77
−2.0 −1.5 −1.0 −0.5 0 0.5 1.0 1.5
−1
.5−
1.0
−0
.50
0.5
1.0
1.5
ActinobacteriaFungiα
-Pro
teob
acte
ria
Firm
icute
s
β-glucosidase
cellobiohydrolase
β-xylosidase
chitinaseglucuronidase
acid phosphatase
arylsulphatase
α-glucosidase
laccase
N
C
bact.diversity
mass loss
SWP
T
●
●● ●
●
●
●
●●
●
●
●
●●
●●
●
●●
1
1
1
1
1
2
2
22
2
4
4
4
4
4
6
6
6
6
6
1
11 1
1
2
2
22
4
4
4
44
6
66
66
1
1
11 1
2
2
2
22
4
44
4
4
6
66
6
6
111
1
1
2
2
2
22
44
44
4
6
6
66
6
1
11
11
2
2
2
2
2
4
4
44
4
6
6
6
6
6
1
11
1
1
2
2
2
2
2
44
4
4
4
666
6
6
BA
%4.831PAC%1.961PAC
CA
P 2
1
4.7
%
CA
P 2
22
.6%
Time
1 - Jan
2 - Mar
3- May
4 - Jul
5 - Sep
6 - Nov
7 - Jan
Site
grassland
forest
Litter
Beech
Sedge
Milkvetch
FIG 1 RDA of low-molecular-weight compounds (A, Manhattan distance) and bacterial communities (B, Bray-Curtis distance) from beech (circle), milkvetch(square), and sedge (triangle) litters at the forest (full symbol) and grassland (empty symbol) sites during the decomposition experiment (5 replicates). Vectorscorrespond to the statistically significant linear variables. Numbers 1 to 7 (1 to 4, respectively, for bacterial communities) correspond to sampling months (1,January 2011; 2, March 2011; 3, May 2011; 4, July 2011; 5, September 2011; 6, November 2011; 7, January 2012). Blue arrows represent extracellular enzymeactivities.
Microbial Niches of Litter Decomposition Applied and Environmental Microbiology
December 2019 Volume 85 Issue 24 e01760-19 aem.asm.org 3
on D
ecem
ber 3
, 2020 b
y g
uest
http
://ae
m.a
sm
.org
/D
ow
nlo
aded fro
m

at both sites, while N and P contents significantly differed, with the highest contentmeasured for the M litter (P � 0.001 for N, P � 0.001 for P) (Table S1).
HPLC analysis of extractable low-molecular-weight compounds. HPLC profiles
significantly differed between sites and litter types within each site (P � 0.001 for allsampling times and litter types) (Table S2).
Extracellular enzyme activities. Overall, the activities of extracellular enzymes were
significantly higher in the forest than in the grassland (ANOVA, �-glucosidase, P� 0.001;cellobiohydrolase, P� 0.001; �-xylosidase, P� 0.001; chitinase, P� 0.001; glucuronidase,P� 0.003; acid phosphatase, P� 0.001; arylsulfatase, P� 0.001; �-glucosidase, P� 0.001;laccase, P� 0.007). Manganese peroxidase activity did not differ between the sites. Overall,higher enzyme activities were measured for the M than the S or B litters for �-glucosidase(M� B and S, P� 0.001), cellobiohydrolase (M� S, P� 0.005; M� B, P� 0.001; S� B,P� 0.001), �-xylosidase (M� S, P� 0.015; M� B, P� 0.001; S� B, P� 0.001), and acidphosphatase (M� B and S, P� 0.001). The activities on the M and S litters were notstatistically different but were higher than those of the B litter for chitinase (P� 0.001),glucuronidase (P� 0.001), and �-glucosidase (P� 0.001). The S litter had the highestlaccase activity (P� 0.007) (Table S1; Fig. 3).
Time courses of enzyme activities for chitinase, arylsulfatase, laccase, and manga-nese peroxidase were similar for the same litter type regardless of the site, whiledispersion did not differ between the litter types (chitinase, PPerm � 0.005, PDisp � 0.914;arylsulfatase, PPerm � 0.004, PDisp � 0.052; laccase, PPerm � 0.009, PDisp � 0.796; andmanganese peroxidase, PPerm � 0.001, PDisp � 0.385) (Table S1).
Bacterial communities. A total of 9,366,330 16S rRNA gene sequences were
obtained, of which 6,898,021 (i.e., 73.6%) were mapped to 13,987 operational taxo-
FIG 2 Average dry mass of beech (brown), milkvetch (yellow), and sedge (green) litters at the grasslandand forest sites during the decomposition experiment (� SD, 5 replicates). The x axis indicates samplingmonths (i.e., initial, before litterbag burial in November 2010 and then in 2-month periods from January2011; overall, 12 months). The P values indicate differences between profiles’ distances (PERMANOVA;PPerm) and dispersion (dispersion test, PDisp).
Buresova et al. Applied and Environmental Microbiology
December 2019 Volume 85 Issue 24 e01760-19 aem.asm.org 4
on D
ecem
ber 3
, 2020 b
y g
uest
http
://ae
m.a
sm
.org
/D
ow
nlo
aded fro
m

Grassland Forest
SamplingJan Mar May Jul Sep Nov Jan
β-g
luco
sidas
e[μ
M m
in-1 g
-1]
cell
obio
hydro
lase
[μM
min
-1 g
-1]
α-g
luco
sidas
e[μ
M m
in-1 g
-1]
glu
curo
nid
ase
[μM
min
-1 g
-1]
acid
phosp
hat
ase
[μM
min
-1 g
-1]
lacc
ase
[μM
min
-1 g
-1]
Mn-p
eroxid
ase
[μM
min
-1 g
-1]
aryls
ulp
hat
ase
[μM
min
-1 g
-1]
chit
inas
e[μ
M m
in-1 g
-1]
0
1E+06
2E+06
4E+04
500
1000
1500
50
100
150
0
1E+06
0
0
0
0
0
0
0
8E+04
5E+05
1.5E+06
2E+05
4E+05
1E+05
5E+04
1E+05
5E+04
1E+05
2E+05
3E+05
1E+06
0
2E+06
1.5E+05
β-x
ylo
sidas
e
[μM
min
-1 g
-1]
Jan Mar May Jul Sep Nov Jan
1.5E+05
PPerm. = 0.024
PDisp. = 0.775
PPerm. = 0.046
PDisp. = 0.962
PPerm. = 0.075
PDisp. = 0.076
PPerm. = 0.156
PDisp. = 0.117
PPerm. = 0.121
PDisp. = 0.012
PPerm. = 0.235
PDisp. = 0.879
PPerm. = 0.414
PDisp. = 0.679
PPerm. = 0.032
PDisp. = 0.365
PPerm. = 0.050
PDisp. n.d.
PPerm. = 0.386
PDisp. = 0.034
PPerm. = 0.072
PDisp. = 0.134
PPerm. < 0.001
PDisp. = 0.283
PPerm. = 0.037
PDisp. = 0.951
PPerm. = 0.366
PDisp. = 0.742
PPerm. = 0.016
PDisp. = 0.219
PPerm. = 0.016
PDisp. = 0.885
PPerm. = 0.133
PDisp. = 0.837
PPerm. = 0.001
PDisp. = 0.423
PPerm. < 0.001
PDisp. = 0.643
PPerm. < 0.001
PDisp. = 0.806
FIG 3 Extracellular enzyme activities on beech (brown), milkvetch (yellow), and sedge (green) litters atthe forest and grassland sites during the decomposition experiment (� SD, 5 replicates). The x axesindicate sampling months (January 2011 to January 2012, i.e., 2 to 14 months after litterbag burial). TheP values indicate differences between profiles’ distances (PERMANOVA; PPerm) and dispersion (dispersiontest, PDisp).
Microbial Niches of Litter Decomposition Applied and Environmental Microbiology
December 2019 Volume 85 Issue 24 e01760-19 aem.asm.org 5
on D
ecem
ber 3
, 2020 b
y g
uest
http
://ae
m.a
sm
.org
/D
ow
nlo
aded fro
m

nomic units (OTUs). The numbers per sample ranged between 12,630 and 78,406sequences, with a median at 41,137 sequences.
Bacterial communities differed significantly between the forest and grassland sitesin the first two sampling months for the M litter (P � 0.009 in January 2011, P � 0.008in March) (Table S3) and in the last two sampling months for the B and S litters(P � 0.008 and P � 0.006, respectively, in July, and both species P � 0.009 in November2011) (see Table S3 in the supplemental material). The bacterial community on the Mlitter significantly differed from that on the B and S litters (analysis of molecular variance[AMOVA], P � 0.001 and P � 0.003 at the grassland and forest sites, respectively, forboth litter types) (see Table S4 in the supplemental material), with the bacterialcommunities not differing between the latter two litter types.
The proportions of phyla in the bacterial 16S rRNA gene amplicon sequencelibraries were the highest for Proteobacteria, followed by Actinobacteria, Bacte-roidetes, Firmicutes, and Verrucomicrobia (Fig. 4). These proportions increased overtime for Actinobacteria (except on the B litter in November 2011 in the forest) andFirmicutes (especially from January to March 2011) and decreased for Proteobacteriaand Bacteroidetes from January to November 2011 (Fig. 4). Acidobacteria propor-tions were the highest in the late sampling months on the M and S litters (Fig. 4)and in soil (see Fig. S3 in the supplemental material) in January and November 2011.Verrucomicrobia proportions were the highest in the middle sampling months (Fig.4). Within the phylum Actinobacteria (see Fig. S4 in the supplemental material), thefamilies Streptomycetaceae (mostly on S plants) and Mycobacteriaceae increased atboth sites, while the proportions of Pseudonocardiaceae, Gaiellaceae, and Promi-
cromonosporaceae increased mostly in the grassland, and the order Frankiales
increased in the forest. The Trebon clade proportion increased in November 2011on the S litter in the forest (Fig. 4).
The number of OTUs (cutoff, 97%) significantly contributing to differences betweenthe sites was the lowest for the B litter and the highest for the M litter at both sitesaccording to metastats (see Fig. S5 in the supplemental material). According to therarefaction curves, the highest number of OTUs in January and March 2011 was foundat the grassland site, especially for the B and S litter types. The number of OTUs wassimilar for all litter types for both sites in July, while the highest number of OTUs inNovember was measured for the M followed by S and B litter types at the grassland site(see Fig. S6 in the supplemental material). Rarefaction analysis showed that bacterialdiversity differed between the sites (ANOVA; F � 12.86, P � 0.001). Bacterial diversity
FIG 4 Average proportions of phyla in the bacterial 16S rRNA gene amplicon sequence libraries (5 replicates).Labels on the horizontal axis indicate sampling months (January to November 2011, i.e., 2 to 12 months afterlitterbag burial) and experimental site (G, grassland; F, forest).
Buresova et al. Applied and Environmental Microbiology
December 2019 Volume 85 Issue 24 e01760-19 aem.asm.org 6
on D
ecem
ber 3
, 2020 b
y g
uest
http
://ae
m.a
sm
.org
/D
ow
nlo
aded fro
m

increased on all litter types over decomposition except for the S and B litters in theforest, where the diversity declined from July to November 2011 (see Fig. S7 in thesupplemental material).
Abundance of soil microorganisms. Overall, Alphaproteobacteria gene copies
(16S rRNA) were more abundant in the grassland than at the forest but only forJanuary and March 2011 (ANOVA, P � 0.009) (Table S1) and on the M than the B andS litters (both P � 0.001). Actinobacteria gene copies (16S rRNA) were more abun-dant in the grassland than at the forest (ANOVA, P � 0.001) (Table S1) but did notdiffer between litter types. Fungi (18S rRNA) and Firmicutes (16S rRNA) gene copiesdid not differ between the sites. Firmicutes were more abundant on the M than theB and S litters (ANOVA, both P � 0.001) (Table S1). Fungi were the least abundanton the B litter compared with both the S (ANOVA, P � 0.001) (Table S1) and M litters(P � 0.015) (Fig. 5).
0
2.0E+10
4.0E+10
6.0E+10
Fungi
Actinobacteria
α-Proteobacteria
Firmicutes
0
2.0E+10
4.0E+10
6.0E+10
Initial Jan Mar May Jul Sep Nov Jan0
2.0E+10
4.0E+10
6.0E+10
8.0E+10
Initial Jan Mar May Jul Sep Nov Jan
Be
ech
16
/18
S r
RN
A c
op
ies g
-1M
ilkvetc
h1
6/1
8S
rR
NA
co
pie
s g
-1
Se
dg
e1
6/1
8S
rR
NA
co
pie
s g
-1
tseroFdnalssarG
Sampling
≈1.3E+11
FIG 5 Abundances of fungi (18S rRNA genes), Actinobacteria, Alphaproteobacteria, and Firmicutes (16S rRNA genes) assayed byqPCR on beech, milkvetch, and sedge at the forest and grassland sites during the decomposition experiment (� SD, 5 replicates).The x axes indicate sampling months (i.e., initial in November 2010 and then in 2-month periods from January 2011; overall,14 months).
Microbial Niches of Litter Decomposition Applied and Environmental Microbiology
December 2019 Volume 85 Issue 24 e01760-19 aem.asm.org 7
on D
ecem
ber 3
, 2020 b
y g
uest
http
://ae
m.a
sm
.org
/D
ow
nlo
aded fro
m

The time courses of Actinobacteria (PPerm � 0.021; PDisp � 0.387) and fungi (PPerm �
0.001; PDisp � 0.505) were similar for the same litter type regardless of site, whiledispersion did not differ between the litter types.
DISCUSSION
Decomposition rate, extracellular enzyme activities, and litter chemistry were spe-cific according to sites and within both sites according to litter type but not litter origin.Fungi, Actinobacteria, Firmicutes, Proteobacteria, Bacteroidetes, Acidobacteria, and Ver-
rucomicrobia each had its own role in the decomposition process. Their successionalpatterns differed based on their requirements for site conditions or litter type. Actino-bacteria were identified as late-stage site-specific substrate generalists, which was theopposite pattern to fungi. The dynamics of these two groups together with bacterialcommunity composition were driven by litter type and were synchronized with themass loss of the most nutritious litter of milkvetch (M).
Overall, the forest site had higher decomposition rates and enzyme activities thanthe grassland site. The beech forest soils are considered to be an environment limitedby low soil N and P (25). Thus, nutrient limitations might stimulate microbes to produceenzymes to gain the deficient nutrients from complex substrates (26). This is alsosupported by our finding that P acquisition for all substrates, as well as enzyme activities,was significantly higher at the forest site (27, 28). In contrast, the nutrient-rich butwarmer and drier soil with diverse sources of litter at the grassland site (29) probablysufficiently covered the demands of soil microbes (30). Consequently, a higher diversityof bacterial communities was found on the grassland litter. (31).
The profiles of the low-molecular-weight compounds derived from the litter sub-strates represented the molecular environment during decomposition and were char-acteristic of each site (29) and as well as each decomposition stage within a site (32).Over time, the litter types separated mostly according to the site as opposed to thelitter types (redundancy analysis [RDA]), which demonstrates how decompositiontransforms litter to a humus type specific for a given site (33).
The bacterial communities for the sedge (S) and beech (B) litters considerably divergedbetween sites but only in the later stages of decomposition when they were composedmostly of bacteria representing the indigenous soil communities of the sites. In contrast,the associated bacterial communities on the M litter at the two sites converged over timeas the nutrient-rich M litter was sequentially exhausted (4, 10). A uniform community,therefore, reflected the final stage of decomposition for the M litter, while it possiblyrepresented only the initial depolymerization of lignin for the S and B litters (34). Further-more, the higher-quality M litter showed the largest shifts in bacterial OTUs over time, aswell as the higher decomposition rates and highest activity of hydrolytic enzymes com-pared with the B and S litters across both sites (35). Thus, local-scale decomposition wasdriven by the local community according to the litter type (33) without any effect ofendogenous or exogenous litter origin (i.e., M and S litters originating at the grassland siteand beech at the forest site), contrary to the home-field advantage theory (31).
Quantitative analysis based on 16S and 18S rRNA gene abundances suggesteddiscriminating driving factors for various microbial groups during litter decomposition.Specifically, Firmicutes and Alphaproteobacteria preferentially colonized the M litter, butcolonized Firmicutes at both sites and Alphaproteobacteria (only for January and March2011) at the grassland site. Fungi were affected more and Actinobacteria less by litterquality, similarly as in boreal peat soil (36). Therefore, Actinobacteria are substrategeneralists influenced by environmental conditions, and consequently, they can spe-cifically reflect site soil characteristics (37). In contrast, the site generalism of fungisupports this group’s resiliency to environmental factors (17). However, that contrastswith the generally acknowledged assumption of fungi sensitivity to soil pH (38). Thus,in this study, the relationship between fungi and bacteria was probably neutral becausefungi were pH dependent only if they grew in competition with bacteria (39).
The dynamics of Actinobacteria and fungi, certain enzymatic activities (arylsulfatase,chitinase, laccase, and manganese peroxidase), and mass loss were more similar for one
Buresova et al. Applied and Environmental Microbiology
December 2019 Volume 85 Issue 24 e01760-19 aem.asm.org 8
on D
ecem
ber 3
, 2020 b
y g
uest
http
://ae
m.a
sm
.org
/D
ow
nlo
aded fro
m

litter type between sites than the three litter types were similar within each site. Mostof those enzymes target complex organic substrates and were found to be (exceptmanganese peroxidase) produced by both Actinobacteria and fungi (20, 40–42). Theability of different soil communities to carry out decomposition of the same substrateover time regardless of the site implies functional redundancy (43). Such dynamicswere, however, not the case for Alphaproteobacteria and Firmicutes, which are, there-fore, likely functionally distinct (7). The results indirectly suggest that the dynamics ofActinobacteria and fungi were driven by the same factor, i.e., litter type (19).
The decomposition process is often considered to be separated into three stagescharacterized by typical microbial guilds and their functions (11). In the present study, theinitial stage (from January to March 2011) was characterized by high extracellular enzymeactivities, especially at the forest site. The bacterial communities on the M litter type werepositively affected by available N and P, suggesting that bacteria require a lower C:N buthigher N:P ratio (44), especially after intense enzyme production which likely leads tosubstantial losses of C and N (9). In this stage, a specific form of low-molecular-weightcompounds was recorded on the M litter (45). In addition, the nutrient-rich M litter had themost dynamic bacterial communities, with high incidences of fungi and Alphaproteobac-
teria (according to quantitative PCR [qPCR]). Since fungi and Alphaproteobacteria are knownfor their ability to depolymerize recalcitrant compounds (46), their initial dominance maycorrespond with carbon depolymerization of the M litter. Meanwhile, Bacteroidetes (accord-ing to amplicon sequencing) occurred on all litter types at both sites. Bacteroidetes are alsoknown for their decomposing activity, and their presence in all litter types suggested promotionby litter addition (47) regardless of its quality and origin.
The middle stage of decomposition was prevalently characterized by cellulosedecomposition (48), even though in the current study it was documented only atgrassland site from the increased activity of cellulolytic enzymes in May for the M litterand in July for the S litter. In this stage, Verrucomicrobia and Proteobacteriamake up thehighest proportion of taxa on all litter types, which suggests that they are substrategeneralists and polysaccharide decomposers (49). Fungi decreased and were replacedby bacteria at both sites possibly because bacteria are scavengers benefitting from theinitial cellulose degradation by fungi (48).
Finally, bacterial diversity increased especially on the M litter type over time, whichsuggested an increased number of ecological niches when the soil and litter communitiescombine (9, 50). The gradual incorporation of litter to the soil is supported by the relativeincrease of Acidobacteria and Actinobacteria, also increased later in the decompositionprocess, which corresponds to their relative abundance in soil, especially Actinobacteria (51).The increase of Actinobacteria, as well as Firmicutes, on the M and S litter types (accordingto both qPCR and relative proportion in sequence libraries) implies that late-stage decom-position is associated with Gram-positive K-strategist microbial groups (10, 52).
Actinobacteria were substrate generalists that adapt to litter of different decompos-ability (19, 53). Actinobacteria quantity, together with overall bacterial diversity, waspositively correlated with the structure of the late-stage bacterial communities, sug-gesting they have a specific function in that decomposition stage. This conclusion wasalso supported by the late proportional increase of the Actinobacteria families Myco-
bacteriaceae and Streptomycetaceae, of which some genera are soil saprotrophs (54) orknown for lignin breakdown (46). These families are also recognized for antimicrobialactivity, which may be utilized for competitor suppression or as a synergic communi-cation to overcome the small energetic return from recalcitrant compounds (15, 23).The relative abundance of Frankiales also increased in the late stages but only at theforest site, suggesting the advantage of the N fixation metabolism typical for this groupin decomposing recalcitrant substrates in infertile soil (53). Interestingly, we also foundan increase in the proportion of the Trebon clade later in decomposition at the forestsite but only on the S litter, supporting previous findings of that clade’s adaptation tolow pH forest soil with recalcitrant humus (55). Finally, Actinobacteria might have astrong impact on litter-derived humus formation through modulation of the molecularenvironment and interactions within the decomposer community.
Microbial Niches of Litter Decomposition Applied and Environmental Microbiology
December 2019 Volume 85 Issue 24 e01760-19 aem.asm.org 9
on D
ecem
ber 3
, 2020 b
y g
uest
http
://ae
m.a
sm
.org
/D
ow
nlo
aded fro
m

Niche partitioning is related to changes in environmental conditions (35) and mightresult from previous competition between species regulating their coexistence (56).This may be demonstrated by the different abundance maxima of the studied microbialgroups, especially fungi and Actinobacteria, on the rich M litter (57). On the poorer Band S litters, the abundance curves of Actinobacteria, fungi, and Alphaproteobacteria
were congruent, which may represent a synergistic interaction (58, 59). In spite of fungibeing the initial decomposers, they dominated over Actinobacteria in the later stages atthe forest site on the S litter, habitats favorable for fungi and unfavorable for Actino-bacteria. This is in accordance with the higher fitness of specialists (fungi) at theiroptimal environmental conditions relative to generalists (Actinobacteria) at the samesite (60). The S litter at the grassland site represents a niche overlap for Actinobacteriaand fungi since it is the most favorable habitat of both. Interestingly, in this situation,Actinobacteria dominated over fungi, which might suggest a greater contribution ofActinobacteria to ecosystem functioning (61).
Site conditions had the biggest impact on the progress of decomposition, measured aslitter mass loss, litter chemistry, and enzyme activities. The site conditions also determinedbacterial diversity, although the litter seemed to create specific niches according to the typeand stage of decomposition. Finally, the site conditions were most important for the totalabundance of Actinobacteria. In contrast, litter type determined the abundance of fungi,while the abundance of Alphaproteobacteria was related to both factors. Also, litter typeinfluenced the succession of fungi and Actinobacteria regardless of the site. Consequently,the observed patterns revealed that the decomposition process is independent of littertype and, therefore, may be relatively stable with respect to shifts of vegetation due todisturbance. However, the niches created by various litter types and decomposition stagesmay have an impact on the dynamics of the main microbial decomposers and that may leadto changes in organic matter quality and sequestration.
MATERIALS AND METHODS
Litterbag experiment. A grassland site situated on the western slope of Oblik Hill in the BohemianMassif Central, Czech Republic, and a forest site in Dorotheer Wald, Neustift near Vienna, Austria, werechosen for the litterbag experiment. Soil humidity and temperature differed between the sites (see Fig.S8 in the supplemental material). The forest site was dominated by beech (Fagus sylvatica), with acidicsoil (pH 5.3) and soil organic matter content of 11.7%. The grassland site was dominated by diverse forbs(29), with alkaline soil (pH 7.9) and soil organic matter content of 11.0%.
For the litter transplant experiment, we used beech leaves (B), collected in November 2010 at theforest site from beech trees before litter fall, and aboveground parts of a sedge (S; Carex humilis) andmilkvetch (M; Astragalus exscapus) both cut from living plants in November 2010 at the grassland site.We chose these litter types according to their quality and decomposability as described by their C:N:Pratio. B had the highest, M the lowest, and S an intermediate C:N:P ratio (Fig. S2). Polyester litterbags ofsize 10 � 10 cm with a mesh size of 1 mm were filled with 7 g of dried litter, with 70 litterbags preparedfor each litter type. The remaining litter was stored at –70°C for future analysis and was considered theinitial sampling time (initial). Overall, 105 litterbags (35 litterbags from each litter type) were placed underthe top 5 cm of the soil organic layer at each site in November 2010 (Fig. 6).
A total of 50 ml of surrounding soil and litterbag samples were collected in 2-month intervals; overall,7 samplings were performed (January, March, May, July, September, and November 2011; and January2012). Each litterbag was weighed to assess the weight loss during the decomposition process. The Mlitter was completely decomposed by January 2012 and no material remained in the litterbags. Therefore,analysis of the M litter type for this sampling time is missing (Fig. 6).
The soil and litter samples were cooled during transportation and homogenized and divided intosubsamples upon arrival at the laboratory. Litter water content was assessed by the gravimetric methodwith oven drying (62). For microbial analysis, the soil and litter samples were placed in 2-ml sterile plastictubes and stored at –70°C until further analysis. For high-performance liquid chromatography (HPLC)analysis, 100-ml glass bottles were filled with the soil and litter samples, overlaid with a methanol-water-acetic acid mixture (80:19:1 [vol/vol/vol]), and stored at –20°C. The remaining soil and litter samples wereplaced in plastic bags for an analysis of pH; organic carbon content (soil samples); and C, N, and Pcontents (litter samples) (Fig. 6).
Soil analysis. Soil moisture tension and temperature were recorded at both sites by a Microlog SP1datalogger (EMS, Brno, Czech Republic) equipped with a gypsum block sensor. From the recorded values,mean temperature and humidity were calculated for every month from November 2010 to March 2012.Soil pH was measured by a Multi 350 WTW glass electrode in a soil water extract (5 g of soil was extractedwith 20 ml of distilled water and set for 12 hours at room temperature). Soil organic matter content wasestimated by combustion in an oven at 550°C to a constant weight.
Buresova et al. Applied and Environmental Microbiology
December 2019 Volume 85 Issue 24 e01760-19 aem.asm.org 10
on D
ecem
ber 3
, 2020 b
y g
uest
http
://ae
m.a
sm
.org
/D
ow
nlo
aded fro
m

Carbon, nitrogen, and phosphorus analysis in the litter. Total phosphorus (P) content wasdetermined colorimetrically in 20 mg of dried plant litter sequentially decomposed with HNO3 and HClO4
using the ammonium molybdate-ascorbic acid method on a QuikChem 8500 flow injection analysissystem (Lachat Instruments, Hach Company, Loveland, CO, USA) at the Botanical Institute in Trebon,Czech Republic (63). Total carbon (C) and nitrogen (N) contents were determined in 2 g of dried litter byhigh-temperature combustion, followed by gas separation in a Vario Max CNS element analyzer(Elementar Analysensysteme, Hanau, Germany) by Aquatest a.s. (Prague, Czech Republic).
HPLC analysis of soluble low-molecular-weight soil metabolites. Low-molecular-weight com-pounds of the soil and litter samples were analyzed by high performance liquid chromatography (HPLC)(64). The compounds were extracted in methanol-water-acetic acid (80:19:1 [vol/vol/vol]) and thenfiltered and vacuum concentrated. The concentrated solution was fractionated using Amberlite XAD
FIG 6 Diagram showing the design of the litterbag experiment on decomposition of beech (B), milkvetch(M), and sedge (S) at the grassland (G) and forest (F) sites over 1 year (January to November 2011, i.e.,2 to 12 months after litterbag burial).
Microbial Niches of Litter Decomposition Applied and Environmental Microbiology
December 2019 Volume 85 Issue 24 e01760-19 aem.asm.org 11
on D
ecem
ber 3
, 2020 b
y g
uest
http
://ae
m.a
sm
.org
/D
ow
nlo
aded fro
m
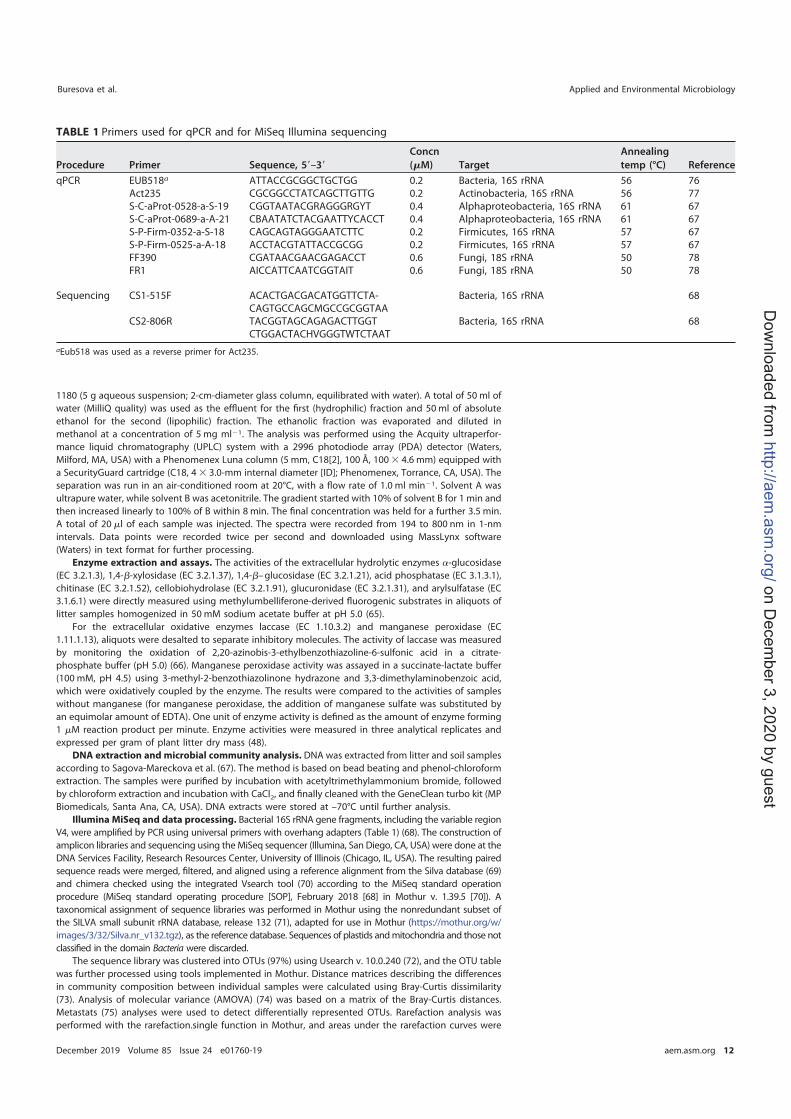
1180 (5 g aqueous suspension; 2-cm-diameter glass column, equilibrated with water). A total of 50 ml ofwater (MilliQ quality) was used as the effluent for the first (hydrophilic) fraction and 50 ml of absoluteethanol for the second (lipophilic) fraction. The ethanolic fraction was evaporated and diluted inmethanol at a concentration of 5 mg ml�1. The analysis was performed using the Acquity ultraperfor-mance liquid chromatography (UPLC) system with a 2996 photodiode array (PDA) detector (Waters,Milford, MA, USA) with a Phenomenex Luna column (5 mm, C18[2], 100 Å, 100 � 4.6 mm) equipped witha SecurityGuard cartridge (C18, 4 � 3.0-mm internal diameter [ID]; Phenomenex, Torrance, CA, USA). Theseparation was run in an air-conditioned room at 20°C, with a flow rate of 1.0 ml min�1. Solvent A wasultrapure water, while solvent B was acetonitrile. The gradient started with 10% of solvent B for 1 min andthen increased linearly to 100% of B within 8 min. The final concentration was held for a further 3.5 min.A total of 20 �l of each sample was injected. The spectra were recorded from 194 to 800 nm in 1-nmintervals. Data points were recorded twice per second and downloaded using MassLynx software(Waters) in text format for further processing.
Enzyme extraction and assays. The activities of the extracellular hydrolytic enzymes �-glucosidase(EC 3.2.1.3), 1,4-�-xylosidase (EC 3.2.1.37), 1,4-�–glucosidase (EC 3.2.1.21), acid phosphatase (EC 3.1.3.1),chitinase (EC 3.2.1.52), cellobiohydrolase (EC 3.2.1.91), glucuronidase (EC 3.2.1.31), and arylsulfatase (EC3.1.6.1) were directly measured using methylumbelliferone-derived fluorogenic substrates in aliquots oflitter samples homogenized in 50 mM sodium acetate buffer at pH 5.0 (65).
For the extracellular oxidative enzymes laccase (EC 1.10.3.2) and manganese peroxidase (EC1.11.1.13), aliquots were desalted to separate inhibitory molecules. The activity of laccase was measuredby monitoring the oxidation of 2,20-azinobis-3-ethylbenzothiazoline-6-sulfonic acid in a citrate-phosphate buffer (pH 5.0) (66). Manganese peroxidase activity was assayed in a succinate-lactate buffer(100 mM, pH 4.5) using 3-methyl-2-benzothiazolinone hydrazone and 3,3-dimethylaminobenzoic acid,which were oxidatively coupled by the enzyme. The results were compared to the activities of sampleswithout manganese (for manganese peroxidase, the addition of manganese sulfate was substituted byan equimolar amount of EDTA). One unit of enzyme activity is defined as the amount of enzyme forming1 �M reaction product per minute. Enzyme activities were measured in three analytical replicates andexpressed per gram of plant litter dry mass (48).
DNA extraction and microbial community analysis. DNA was extracted from litter and soil samplesaccording to Sagova-Mareckova et al. (67). The method is based on bead beating and phenol-chloroformextraction. The samples were purified by incubation with acetyltrimethylammonium bromide, followedby chloroform extraction and incubation with CaCl2, and finally cleaned with the GeneClean turbo kit (MPBiomedicals, Santa Ana, CA, USA). DNA extracts were stored at –70°C until further analysis.
Illumina MiSeq and data processing. Bacterial 16S rRNA gene fragments, including the variable regionV4, were amplified by PCR using universal primers with overhang adapters (Table 1) (68). The construction ofamplicon libraries and sequencing using theMiSeq sequencer (Illumina, San Diego, CA, USA) were done at theDNA Services Facility, Research Resources Center, University of Illinois (Chicago, IL, USA). The resulting pairedsequence reads were merged, filtered, and aligned using a reference alignment from the Silva database (69)and chimera checked using the integrated Vsearch tool (70) according to the MiSeq standard operationprocedure (MiSeq standard operating procedure [SOP], February 2018 [68] in Mothur v. 1.39.5 [70]). Ataxonomical assignment of sequence libraries was performed in Mothur using the nonredundant subset ofthe SILVA small subunit rRNA database, release 132 (71), adapted for use in Mothur (https://mothur.org/w/images/3/32/Silva.nr_v132.tgz), as the reference database. Sequences of plastids andmitochondria and those notclassified in the domain Bacteria were discarded.
The sequence library was clustered into OTUs (97%) using Usearch v. 10.0.240 (72), and the OTU tablewas further processed using tools implemented in Mothur. Distance matrices describing the differencesin community composition between individual samples were calculated using Bray-Curtis dissimilarity(73). Analysis of molecular variance (AMOVA) (74) was based on a matrix of the Bray-Curtis distances.Metastats (75) analyses were used to detect differentially represented OTUs. Rarefaction analysis wasperformed with the rarefaction.single function in Mothur, and areas under the rarefaction curves were
TABLE 1 Primers used for qPCR and for MiSeq Illumina sequencing
Procedure Primer Sequence, 5=–3=
Concn
(�M) Target
Annealing
temp (°C) Reference
qPCR EUB518a ATTACCGCGGCTGCTGG 0.2 Bacteria, 16S rRNA 56 76Act235 CGCGGCCTATCAGCTTGTTG 0.2 Actinobacteria, 16S rRNA 56 77S-C-aProt-0528-a-S-19 CGGTAATACGRAGGGRGYT 0.4 Alphaproteobacteria, 16S rRNA 61 67S-C-aProt-0689-a-A-21 CBAATATCTACGAATTYCACCT 0.4 Alphaproteobacteria, 16S rRNA 61 67S-P-Firm-0352-a-S-18 CAGCAGTAGGGAATCTTC 0.2 Firmicutes, 16S rRNA 57 67S-P-Firm-0525-a-A-18 ACCTACGTATTACCGCGG 0.2 Firmicutes, 16S rRNA 57 67FF390 CGATAACGAACGAGACCT 0.6 Fungi, 18S rRNA 50 78FR1 AICCATTCAATCGGTAIT 0.6 Fungi, 18S rRNA 50 78
Sequencing CS1-515F ACACTGACGACATGGTTCTA- Bacteria, 16S rRNA 68CAGTGCCAGCMGCCGCGGTAA
CS2-806R TACGGTAGCAGAGACTTGGT Bacteria, 16S rRNA 68CTGGACTACHVGGGTWTCTAAT
aEub518 was used as a reverse primer for Act235.
Buresova et al. Applied and Environmental Microbiology
December 2019 Volume 85 Issue 24 e01760-19 aem.asm.org 12
on D
ecem
ber 3
, 2020 b
y g
uest
http
://ae
m.a
sm
.org
/D
ow
nlo
aded fro
m

calculated using the trapezoidal rule in R version 3.4.4 (76). Figures were created using Inkscape (v. 0.92;http://www.inkscape.org).
Quantitative real-time PCR. Quantification of the 16S rRNA gene in Actinobacteria, Alphaproteo-bacteria, and Firmicutes and the 18S rRNA gene of fungi in the DNA extracted from litter samples wasperformed with the primers listed in Table 1 (77–79).
Quantitative PCR was performed using the StepOnePlus real-time PCR system (Applied Biosystems,Foster City, CA, USA) using 96-well plates with GoTaq qPCR master mix (Promega, Madison, WI, USA)containing SYBR green as a double-stranded DNA (dsDNA) binding dye. The reaction mixture containedin total a volume of 15 �l with 1� GoTaq qPCR master mix, primers (for concentrations see Table 1), and2-ng DNA sample. For all microbial groups, the PCR cycling protocol consisted of initial denaturation at95°C for 10 min, followed by 45 cycles of denaturation (95°C for 15 s), annealing (for respectivetemperature see Table 1), and elongation (72°C for 30 s). Standards containing a known number of copiesof the target genes 16S rRNA from Streptomyces europaeiscabiei DSM 41802 (for Actinobacteria), Bartonella-likeclone (for Alphaproteobacteria), and Paenibacillus clone (for Firmicutes) and 18S rRNA from a Penicillium sp.clone (for fungi) were serially diluted to calibrate each qPCR melting curve and were recorded to ensure qPCRspecificity. Baseline and threshold calculations were performed with StepOne v. 2.2.2. Inhibition was tested byserial DNA dilutions from each site. All qPCR measurements were done in duplicate.
Statistical analysis. All statistical calculations were done in the R computing environment (76). Theeffect of sites and litter types on bacterial community composition and the litter molecular parametersduring the decomposition process were measured as the relationship between the distance matrices ofthe HPLC profiles of low-molecular-weight compounds (HPLC) and bacterial communities using ageneralized distance covariance (80). The HPLC profiles were baseline corrected using the PTW package(81), and distances between profiles were calculated using Manhattan metrics. The distance matrices ofthe HPLC profiles and bacterial communities (exported from Mothur) were plotted by RDA projection andSammon’s multidimensional scaling using the MASS package (82). Correlations between linear variables,bacterial community, and HPLC profiles were analyzed by permutation test for capscale under a reducedmodel using the Bray-Curtis (bacterial communities) and Manhattan (HPLC) dissimilarities (with 999permutations) in the VEGAN package in R (83).
To analyze the overall quantitative differences of linear variabilities (dry mass loss; abundances ofmicrobial groups; enzyme activities; and C, N, and P contents in litter) between sites and litter types(within sites), a linear model with the additive effect of time, site, and litter type was calculated (84).
We used two tests based on the distance between the profiles as measured by correlation coeffi-cients (see p. 319 of reference 85) to analyze the qualitative similarities between the linear variables.Permutational multivariate analysis of variance (PERMANOVA; significance values denoted here as PPerm)(86) tests whether the within-group distances (same litter type) are on average shorter than thebetween-group distances (between different litter types, aimed at detection of different mean profiles).The dispersion test (significance values denoted here as PDisp), introduced in Gijbels and Omelka (87),checks whether the average within-group distances differ among groups (aiming at detecting differentdispersions of the samples). For manganese peroxidase, a Manhattan distance instead of the distancebased on the correlation coefficient was used due to zero values in some profiles.
All linear variables (dry mass loss; microbial gene quantities; C, N, and P content; and enzymeactivities, except manganese peroxidase) were logarithmically transformed (with negative values ofenzymes replaced by 1 before transformation) to make their distribution more similar to a normaldistribution.
Data availability. The Illumina MiSeq 16S rRNA gene amplicon sequences have been deposited inthe NCBI Sequence Read Archive under accession no. SRP158384 and are available under BioProjectaccession number PRJNA485178.
SUPPLEMENTAL MATERIAL
Supplemental material for this article may be found at https://doi.org/10.1128/AEM.01760-19.
SUPPLEMENTAL FILE 1, PDF file, 0.8 MB.
ACKNOWLEDGMENTS
The work was funded by the Czech Science Foundation (grant number 15-01312S);Ministry of Education, Youth and Sports of the Czech Republic, European RegionalDevelopment Fund-Project number CZ.02.1.01/0.0/0.0/16_019/0000845 and grantnumber LTC17075; and Ministry of Agriculture of the Czech Republic, institutionalsupport number MZE-RO0418.
We declare no conflict of interest.
REFERENCES
1. Purahong W, Krüger D, Buscot F, Wubet T. 2016. Correlations betweenthe composition of modular fungal communities and litter decomposition-associated ecosystem functions. Fungal Ecol 22:106–114. https://doi.org/10.1016/j.funeco.2016.04.009.
2. Lladó S, López-Mondéjar R, Baldrian P. 2017. Forest soil bacteria: diver-sity, involvement in ecosystem processes, and response to globalchange. Microbiol Mol Biol Rev 81:e00063-16. https://doi.org/10.1128/MMBR.00063-16.
Microbial Niches of Litter Decomposition Applied and Environmental Microbiology
December 2019 Volume 85 Issue 24 e01760-19 aem.asm.org 13
on D
ecem
ber 3
, 2020 b
y g
uest
http
://ae
m.a
sm
.org
/D
ow
nlo
aded fro
m

3. Fukami T. 2015. Historical contingency in community assembly: integrat-ing niches, species pools, and priority effects. Annu Rev Ecol Evol Syst46:1–23. https://doi.org/10.1146/annurev-ecolsys-110411-160340.
4. McGuire KL, Treseder KK. 2010. Microbial communities and their rele-vance for ecosystem models: decomposition as a case study. Soil BiolBiochem 42:529–535. https://doi.org/10.1016/j.soilbio.2009.11.016.
5. Bani A, Pioli S, Ventura M, Panzacchi P, Borruso L, Tognetti R, Tonon G,Brusetti L. 2018. The role of microbial community in the decompositionof leaf litter and deadwood. Appl Soil Ecol 126:75–84. https://doi.org/10.1016/j.apsoil.2018.02.017.
6. Fraser LH, Hockin AD. 2013. Litter decomposition rates of two grassspecies along a semi-arid grassland-forest ecocline. J Arid Environ 88:125–129. https://doi.org/10.1016/j.jaridenv.2012.07.009.
7. Glassman SI, Weihe C, Li J, Albright MBN, Looby CI, Martiny AC, TresederKK, Allison SD, Martiny JBH. 2018. Decomposition responses to climatedepend on microbial community composition. Proc Natl Acad Sci U S A115:11994–11999. https://doi.org/10.1073/pnas.1811269115.
8. García-Palacios P, Shaw EA, Wall DH, Hättenschwiler S. 2016. Temporaldynamics of biotic and abiotic drivers of litter decomposition. Ecol Lett19:554–563. https://doi.org/10.1111/ele.12590.
9. Purahong W, Wubet T, Lentendu G, Schloter M, Pecyna MJ, Kapturska D,Hofrichter M, Krüger D, Buscot F. 2016. Life in leaf litter: novel insightsinto community dynamics of bacteria and fungi during litter decompo-sition. Mol Ecol 25:4059–4074. https://doi.org/10.1111/mec.13739.
10. Bray SR, Kitajima K, Mack MC. 2012. Temporal dynamics of microbialcommunities on decomposing leaf litter of 10 plant species in relation todecomposition rate. Soil Biol Biochem 49:30–37. https://doi.org/10.1016/j.soilbio.2012.02.009.
11. Tlaskal V, Voríškova J, Baldrian P. 2016. Bacterial succession on decom-posing leaf litter exhibits a specific occurrence pattern of cellulolytic taxaand potential decomposers of fungal mycelia. FEMS Microbiol Ecol92:fiw177. https://doi.org/10.1093/femsec/fiw177.
12. Wertz S, Degrange V, Prosser JI, Poly F, Commeaux C, Freitag T, Guillau-maud N, Roux XL. 2006. Maintenance of soil functioning followingerosion of microbial diversity. Environ Microbiol 8:2162–2169. https://doi.org/10.1111/j.1462-2920.2006.01098.x.
13. Purahong W, Schloter M, Pecyna MJ, Kapturska D, Däumlich V, Mital S,Buscot F, Hofrichter M, Gutknecht JLM, Krüger D. 2014. Uncoupling ofmicrobial community structure and function in decomposing litteracross beech forest ecosystems in Central Europe. Sci Rep 4:7014.https://doi.org/10.1038/srep07014.
14. Moorhead DL, Sinsabaugh RL. 2006. A theoretical model of litter decayand microbial interaction. Ecol Monogr 76:151–174. https://doi.org/10.1890/0012-9615(2006)076[0151:ATMOLD]2.0.CO;2.
15. De Boer W, Folman LB, Summerbell RC, Boddy L. 2005. Living in a fungalworld: impact of fungi on soil bacterial niche development. FEMS Mi-crobiol Rev 29:795–811. https://doi.org/10.1016/j.femsre.2004.11.005.
16. Baldrian P, Zrustová P, Tláskal V, Davidová A, Merhautová V, Vrška T.2016. Fungi associated with decomposing deadwood in a natural beech-dominated forest. Fungal Ecol 23:109–122. https://doi.org/10.1016/j.funeco.2016.07.001.
17. A’Bear AD, Jones TH, Kandeler E, Boddy L. 2014. Interactive effects oftemperature and soil moisture on fungal-mediated wood decomposi-tion and extracellular enzyme activity. Soil Biol Biochem 70:151–158.https://doi.org/10.1016/j.soilbio.2013.12.017.
18. Fierer N, Bradford MA, Jackson RB. 2007. Toward an ecological classifi-cation of soil bacteria. Ecology 88:1354–1364. https://doi.org/10.1890/05-1839.
19. Vetrovský T, Steffen KT, Baldrian P. 2014. Potential of cometabolic transfor-mation of polysaccharides and lignin in lignocellulose by soil Actinobacte-ria. PLoS One 9:e89108. https://doi.org/10.1371/journal.pone.0089108.
20. Fernandes ART, da Silveira WB, Passos MLF, Zucchi TD. 2014. Laccasesfrom Actinobacteria—what we have and what to expect. Adv Microbiol04:285–296. https://doi.org/10.4236/aim.2014.46035.
21. Sagova-Mareckova M, Zadorova T, Penizek V, Omelka M, Tejnecky V,Pruchova P, Chuman T, Drabek O, Buresova A, Vanek A, Kopecky J. 2016.The structure of bacterial communities along two vertical profiles of adeep colluvial soil. Soil Biol Biochem 101:65–73. https://doi.org/10.1016/j.soilbio.2016.06.026.
22. Abdelmohsen UR, Grkovic T, Balasubramanian S, Kamel MS, Quinn RJ,Hentschel U. 2015. Elicitation of secondary metabolism in Actinomycetes.Biotechnol Adv 33:798–811. https://doi.org/10.1016/j.biotechadv.2015.06.003.
23. Sharma M, Dangi P, Choudhary M. 2014. Actinomycetes: source, identi-fication, and their applications. Int J Curr Microbiol Appl Sci 3:801–832.
24. Fukami T, Dickie IA, Paula Wilkie J, Paulus BC, Park D, Roberts A,Buchanan PK, Allen RB. 2010. Assembly history dictates ecosystemfunctioning: evidence from wood decomposer communities. Ecol Lett13:675–684. https://doi.org/10.1111/j.1461-0248.2010.01465.x.
25. Schmidt M, Veldkamp E, Corre MD. 2015. Tree species diversity effectson productivity, soil nutrient availability and nutrient response efficiencyin a temperate deciduous forest. For Ecol Manage 338:114–123. https://doi.org/10.1016/j.foreco.2014.11.021.
26. Fontaine S, Mariotti A, Abbadie L. 2003. The priming effect of organicmatter: a question of microbial competition? Soil Biol Biochem 35:837–843. https://doi.org/10.1016/S0038-0717(03)00123-8.
27. Mokany K, Raison RJ, Prokushkin AS. 2006. Critical analysis of root:shootratios in terrestrial biomes. Glob Chang Biol 12:84–96. https://doi.org/10.1111/j.1365-2486.2005.001043.x.
28. Lange M, Eisenhauer N, Sierra CA, Bessler H, Engels C, Griffiths RI,Mellado-Vázquez PG, Malik AA, Roy J, Scheu S, Steinbeiss S, Thomson BC,Trumbore SE, Gleixner G. 2015. Plant diversity increases soil microbialactivity and soil carbon storage. Nat Commun 6:6707. https://doi.org/10.1038/ncomms7707.
29. Sagova-Mareckova M, Omelka M, Cermak L, Kamenik Z, Olsovska J, HacklE, Kopecky J, Hadacek F. 2011. Microbial communities show parallels atsites with distinct litter and soil characteristics. Appl Environ Microbiol77:7560–7567. https://doi.org/10.1128/AEM.00527-11.
30. McDaniel MD, Grandy AS, Tiemann LK, Weintraub MN. 2014. Croprotation complexity regulates the decomposition of high and low qual-ity residues. Soil Biol Biochem 78:243–254. https://doi.org/10.1016/j.soilbio.2014.07.027.
31. John MGS, Orwin KH, Dickie IA. 2011. No “home” versus “away” effectsof decomposition found in a grassland-forest reciprocal litter transplantstudy. Soil Biol Biochem 43:1482–1489. https://doi.org/10.1016/j.soilbio.2011.03.022.
32. Ristok C, Leppert KN, Franke K, Scherer-Lorenzen M, Niklaus PA, Wess-johann LA, Bruelheide H. 2017. Leaf litter diversity positively affects thedecomposition of plant polyphenols. Plant Soil 419:305–317. https://doi.org/10.1007/s11104-017-3340-8.
33. Solly EF, Schöning I, Boch S, Kandeler E, Marhan S, Michalzik B, Müller J,Zscheischler J, Trumbore SE, Schrumpf M. 2014. Factors controlling decom-position rates of fine root litter in temperate forests and grasslands. PlantSoil 382:203–218. https://doi.org/10.1007/s11104-014-2151-4.
34. Dungait JAJ, Hopkins DW, Gregory AS, Whitmore AP. 2012. Soil organicmatter turnover is governed by accessibility not recalcitrance. Glob ChangBiol 18:1781–1796. https://doi.org/10.1111/j.1365-2486.2012.02665.x.
35. Kielak AM, Scheublin TR, Mendes LW, Van Veen JA, Kuramae EE,. 2016.Bacterial community succession in pine-wood decomposition. FrontMicrobiol 7:231. https://doi.org/10.3389/fmicb.2016.00231.
36. Peltoniemi K, Straková P, Fritze H, Iráizoz PA, Pennanen T, Laiho R. 2012.How water-level drawdown modifies litter-decomposing fungal andactinobacterial communities in boreal peatlands. Soil Biol Biochem 51:20–34. https://doi.org/10.1016/j.soilbio.2012.04.013.
37. Sagova-Mareckova M, Cermak L, Omelka M, Kyselkova M, Kopecky J.2015. Bacterial diversity and abundance of a creek valley sites reflectedsoil pH and season. Open Life Sci 10:61–70. https://doi.org/10.1515/biol-2015-0007.
38. Högberg MN, Högberg P, Myrold DD. 2007. Is microbial communitycomposition in boreal forest soils determined by pH, C-to-N ratio, thetrees, or all three? Oecologia 150:590–601. https://doi.org/10.1007/s00442-006-0562-5.
39. Rousk J, Brookes PC, Bååth E. 2009. Contrasting soil pH effects on fungaland bacterial growth suggest functional redundancy in carbon miner-alization. Appl Environ Microbiol 75:1589–1596. https://doi.org/10.1128/AEM.02775-08.
40. Malý S, Fiala P, Reininger D, Obdržálková E. 2014. The relationshipsamong microbial parameters and the rate of organic matter mineraliza-tion in forest soils, as influenced by forest type. Pedobiologia (Jena)57:235–244. https://doi.org/10.1016/j.pedobi.2014.09.003.
41. Chen H, Liu J, Li D, Xiao K, Wang K. 2019. Controls on soil arylsulfataseactivity at a regional scale. Eur J Soil Biol 90:9–14. https://doi.org/10.1016/j.ejsobi.2018.11.001.
42. Vrsanska M, Voberkova S, Langer V, Palovcikova D, Moulick A, Adam V,Kopel P, Vrsanska M, Voberkova S, Langer V, Palovcikova D, Moulick A,Adam V, Kopel P. 2016. Induction of laccase, lignin peroxidase and
Buresova et al. Applied and Environmental Microbiology
December 2019 Volume 85 Issue 24 e01760-19 aem.asm.org 14
on D
ecem
ber 3
, 2020 b
y g
uest
http
://ae
m.a
sm
.org
/D
ow
nlo
aded fro
m

manganese peroxidase activities in white-rot fungi using copper com-plexes. Molecules 21:1553. https://doi.org/10.3390/molecules21111553.
43. Banerjee S, Kirkby CA, Schmutter D, Bissett A, Kirkegaard JA, RichardsonAE. 2016. Network analysis reveals functional redundancy and keystonetaxa amongst bacterial and fungal communities during organic matterdecomposition in an arable soil. Soil Biol Biochem 97:188–198. https://doi.org/10.1016/j.soilbio.2016.03.017.
44. Güsewell S, Gessner MO. 2009. N:P ratios influence litter decompositionand colonization by fungi and bacteria in microcosms. Funct Ecol 23:211–219. https://doi.org/10.1111/j.1365-2435.2008.01478.x.
45. van Hees PAW, Jones DL, Finlay R, Godbold DL, Lundström US. 2005. Thecarbon we do not see—the impact of low molecular weight compoundson carbon dynamics and respiration in forest soils: a review. Soil BiolBiochem 37:1–13. https://doi.org/10.1016/j.soilbio.2004.06.010.
46. Bugg TDH, Ahmad M, Hardiman EM, Singh R. 2011. The emerging rolefor bacteria in lignin degradation and bio-product formation. Curr OpinBiotechnol 22:394–400. https://doi.org/10.1016/j.copbio.2010.10.009.
47. Sauvadet M, Chauvat M, Cluzeau D, Maron PA, Villenave C, Bertrand I.2016. The dynamics of soil micro-food web structure and functions varyaccording to litter quality. Soil Biol Biochem 95:262–274. https://doi.org/10.1016/j.soilbio.2016.01.003.
48. Šnajdr J, Cajthaml T, Valášková V, Merhautová V, Petránková M, Spetz P,Leppänen K, Baldrian P. 2011. Transformation of Quercus petraea litter:successive changes in litter chemistry are reflected in differential en-zyme activity and changes in the microbial community composition.FEMS Microbiol Ecol 75:291–303. https://doi.org/10.1111/j.1574-6941.2010.00999.x.
49. Cardman Z, Arnosti C, Durbin A, Ziervogel K, Cox C, Steen AD, Teske A.2014. Verrucomicrobia are candidates for polysaccharide-degrading bac-terioplankton in an arctic fjord of Svalbard. Appl Environ Microbiol80:3749–3756. https://doi.org/10.1128/AEM.00899-14.
50. Jackson CR. 2003. Changes in community properties during microbialsuccession. Oikos 101:444–448. https://doi.org/10.1034/j.1600-0706.2003.12254.x.
51. Štursová M, Žifcáková L, Leigh MB, Burgess R, Baldrian P. 2012. Celluloseutilization in forest litter and soil: identification of bacterial and fungaldecomposers. FEMS Microbiol Ecol 80:735–746. https://doi.org/10.1111/j.1574-6941.2012.01343.x.
52. Bastian F, Bouziri L, Nicolardot B, Ranjard L. 2009. Impact of wheat strawdecomposition on successional patterns of soil microbial communitystructure. Soil Biol Biochem 41:262–275. https://doi.org/10.1016/j.soilbio.2008.10.024.
53. Gao B, Gupta R. 2012. Phylogenetic framework and molecular signaturesfor the main clades of the phylum Actinobacteria. Microbiol Mol Biol Rev76:66–112. https://doi.org/10.1128/MMBR.05011-11.
54. Kopecky J, Kyselkova M, Omelka M, Cermak L, Novotna J, Grundmann G,Moënne-Loccoz Y, Sagova-Mareckova M. 2011. Environmental mycobac-teria closely related to the pathogenic species evidenced in an acidicforest wetland. Soil Biol Biochem 43:697–700. https://doi.org/10.1016/j.soilbio.2010.11.033.
55. Kopecky J, Kyselkova M, Omelka M, Cermak L, Novotna J, GrundmannGL, Moënne-Loccoz Y, Sagova-Mareckova M. 2011. Actinobacterial com-munity dominated by a distinct clade in acidic soil of a waterloggeddeciduous forest. FEMS Microbiol Ecol 78:386–394. https://doi.org/10.1111/j.1574-6941.2011.01173.x.
56. Leibold M, McPeek M. 2006. Coexistence of the niche and neutralperspectives in community ecology. Ecology 87:1399–1410. https://doi.org/10.1890/0012-9658(2006)87[1399:COTNAN]2.0.CO;2.
57. Rousk J, Demoling LA, Bahr A, Bååth E. 2008. Examining the fungal andbacterial niche overlap using selective inhibitors in soil. FEMS MicrobiolEcol 63:350–358. https://doi.org/10.1111/j.1574-6941.2008.00440.x.
58. Johnston SR, Boddy L, Weightman AJ. 2016. Bacteria in decomposingwood and their interactions with wood-decay fungi. FEMS Microbiol Ecol92:fiw179. https://doi.org/10.1093/femsec/fiw179.
59. Meidute S, Demoling F, Bååth E. 2008. Antagonistic and synergisticeffects of fungal and bacterial growth in soil after adding differentcarbon and nitrogen sources. Soil Biol Biochem 40:2334–2343. https://doi.org/10.1016/j.soilbio.2008.05.011.
60. Monard C, Gantner S, Bertilsson S, Hallin S, Stenlid J. 2016. Habitatgeneralists and specialists in microbial communities across a terrestrial-freshwater gradient. Sci Rep 6:37719. https://doi.org/10.1038/srep37719.
61. Strickland MS, Rousk J. 2010. Considering fungal:bacterial dominance insoils—methods, controls, and ecosystem implications. Soil Biol Biochem42:1385–1395. https://doi.org/10.1016/j.soilbio.2010.05.007.
62. Carter MR, Gregorich EG. 2008. Soil sampling and methods of analysis,second ed. Taylor & Francis Group, LLC, USA.
63. Olsen SR. 1954. Estimation of available phosphorus in soils by extrac-tion with sodium bicarbonate. US Department of Agriculture, Wash-ington, DC.
64. Kameník Z, Hadacek F, Marecková M, Ulanova D, Kopecký J, Chobot V,Plhácková K, Olšovská J. 2010. Ultra-high-performance liquid chroma-tography fingerprinting method for chemical screening of metabolitesin cultivation broth. J Chromatogr A 1217:8016–8025. https://doi.org/10.1016/j.chroma.2010.08.031.
65. Baldrian P. 2009. Microbial enzyme-catalyzed processes in soils and theiranalysis. Plant Soil Environ 55:370–378. https://doi.org/10.17221/134/2009-PSE.
66. Bourbonnais R, Paice MG. 1990. Oxidation of non-phenolic substrates.FEBS Lett 267:99–102. https://doi.org/10.1016/0014-5793(90)80298-w.
67. Sagova-Mareckova M, Cermak L, Novotna J, Plhackova K, Forstova J,Kopecky J. 2008. Innovative methods for soil DNA purification tested insoils with widely differing characteristics. Appl Environ Microbiol 74:2902–2907. https://doi.org/10.1128/AEM.02161-07.
68. Kozich JJ, Westcott SL, Baxter NT, Highlander SK, Schloss PD. 2013.Development of a dual-index sequencing strategy and curation pipelinefor analyzing amplicon sequence data on the MiSeq Illumina sequencingplatform. Appl Environ Microbiol 79:5112–5120. https://doi.org/10.1128/AEM.01043-13.
69. Quast C, Pruesse E, Yilmaz P, Gerken J, Schweer T, Yarza P, Peplies J,Glöckner FO. 2013. The SILVA ribosomal RNA gene database project:improved data processing and Web-based tools. Nucleic Acids Res41:D590–D596. https://doi.org/10.1093/nar/gks1219.
70. Rognes T, Flouri T, Nichols B, Quince C, Mahé F. 2016. VSEARCH: aversatile open source tool for metagenomics. PeerJ 4:e2584. https://doi.org/10.7717/peerj.2584.
71. Yilmaz P, Parfrey LW, Yarza P, Gerken J, Pruesse E, Quast C, Schweer T,Peplies J, Ludwig W, Glöckner FO. 2014. The SILVA and “all-species LivingTree Project (LTP)” taxonomic frameworks. Nucleic Acids Res 42:D643–D648. https://doi.org/10.1093/nar/gkt1209.
72. Edgar RC. 2013. UPARSE: highly accurate OTU sequences from microbialamplicon reads. Nat Methods 10:996–998. https://doi.org/10.1038/nmeth.2604.
73. Bray JR, Curtis JT. 1957. An ordination of the upland forest communitiesof southern Wisconsin. Ecol Monogr 27:325–349. https://doi.org/10.2307/1942268.
74. Martin AP. 2002. Phylogenetic approaches for describing and comparingthe diversity of microbial phylogenetic approaches for describing andcomparing the diversity of microbial communities. Appl Environ Microbiol68:3673–3682. https://doi.org/10.1128/aem.68.8.3673-3682.2002.
75. White JR, Nagarajan N, Pop M. 2009. Statistical methods for detectingdifferentially abundant features in clinical metagenomic samples. PLoSComput Biol 5:e1000352. https://doi.org/10.1371/journal.pcbi.1000352.
76. R Core Team. 2018. R: a language and environment for statistical com-puting. R Foundation for Statistical Computing, Vienna, Austria.
77. Muyzer G, de Waal EC, Uitterlinden AG. 1993. Profiling of complexmicrobial populations by denaturing gradient gel electrophoresis anal-ysis of polymerase chain reaction-amplified genes coding for 16S rRNA.Appl Environ Microbiol 59:695–700.
78. Stach JEM, Maldonado LA, Ward AC, Goodfellow M, Bull AT. 2003. Newprimers for the class Actinobacteria: application to marine and terrestrialenvironments. Environ Microbiol 5:828–841. https://doi.org/10.1046/j.1462-2920.2003.00483.x.
79. Prévost-Bouré CN, Christen R, Dequiedt S, Mougel C, Lelièvre M, JolivetC, Shahbazkia HR, Guillou L, Arrouays D, Ranjard L. 2011. Validation andapplication of a PCR primer set to quantify fungal communities in thesoil environment by real-time quantitative PCR. PLoS One 6:e24166.https://doi.org/10.1371/journal.pone.0024166.
80. Omelka M, Hudecová Š. 2013. A comparison of the Mantel test with ageneralised distance covariance test. Environmetrics 24:449–460. https://doi.org/10.1002/env.2238.
81. Bloemberg TG, Gerretzen J, Lunshof A, Wehrens R, Buydens L. 2013.Warping methods for spectroscopic and chromatographic signalalignment: a tutorial. Anal Chim Acta 781:14–32. https://doi.org/10.1016/j.aca.2013.03.048.
82. Venables WN, Ripley BD. 2002. Random and mixed effects, p 271–300.In Modern applied statistics with S. Springer, New York, NY.
83. Oksanen J, Blanchet FG, Friendly M, Kindt R, Legendre P, McGlinn D,Minchin PR, O’Hara RB, Simpson GL, Solymos P, Stevens MHH, Szoecs E,
Microbial Niches of Litter Decomposition Applied and Environmental Microbiology
December 2019 Volume 85 Issue 24 e01760-19 aem.asm.org 15
on D
ecem
ber 3
, 2020 b
y g
uest
http
://ae
m.a
sm
.org
/D
ow
nlo
aded fro
m

Wagner H. 2019. vegan: community ecology package. R package version2.5-6. https://CRAN.R-project.org/package�vegan.
84. Hothorn T, Everitt BS. 2014. A handbook of statistical analyses using R.Chapman and Hall/CRC, New York, NY. https://doi.org/10.1201/b17081.
85. Legendre P, Legendre L. 2012. Numerical ecology, 3rd English ed.Elsevier Science BV, Amsterdam, the Netherlands.
86. McArdle BH, Anderson MJ. 2001. Fitting multivariate models to commu-nity data: a comment on distance-based redundancy analysis. Ecology82:290–297. https://doi.org/10.2307/2680104.
87. Gijbels I, Omelka M. 2013. Testing for homogeneity of multivariatedispersions using dissimilarity measures. Biometrics 69:137–145. https://doi.org/10.1111/j.1541-0420.2012.01797.x.
Buresova et al. Applied and Environmental Microbiology
December 2019 Volume 85 Issue 24 e01760-19 aem.asm.org 16
on D
ecem
ber 3
, 2020 b
y g
uest
http
://ae
m.a
sm
.org
/D
ow
nlo
aded fro
m

1
Supplementary Information for
Decomposition was driven by site conditions, while dynamics of Actinobacteria
and fungi reflected a litter type
Buresova A., Kopecky J., Hrdinkova V., Kamenik Z., Omelka M., Sagova-Mareckova
M.
Corresponding author: Marketa Sagova-Mareckova
Email: [email protected]
This PDF file includes:
Supplementary text
Figs. S1 to S10
Tables S1 to S5
References for supplementary text citations

2
Supplementary Text
Materials and Methods
Litterbag experiment
A grassland site (G) situated at the western slope of Oblik hill in Bohemian
Massive Central, Czech Republic and a forest site (F) in Dorotheer Wald, Neustift
near Wien, Austria were chosen for the litterbag experiment. Soil pH, vegetation, soil
organic carbon content, soil humidity and temperature contrasted the sites (Fig. S1.).
The F site was dominated by beech (Fagus sylvatica), with acidic soil (pH 5.3) and
soil organic matter content 11.7%. The G site was dominated by diverse forbs (1),
with alkaline soil (pH 7.9) and soil organic matter content 11.0%.
For the experiment, we used leaves of beech (B, Fagus sylvatica) from
Fagaceae family (collected in November 2010 at the forest site), and aboveground
parts of sedge (S, Carex humilis) from Cyperaceae family, and milkvetch (M,
Astragalus exscapus) from Fabaceae family (both collected in November 2010 at the
grassland site). We chose these litter types according to their quality and
decomposability described by C:N:P ratio. B disposed of the highest, M the lowest
and S the intermediate C:N:P ratio in its tissues (Fig. S2).
The soil and litterbag samples were collected in two-month intervals; overall 7
samplings were performed (January 2011, March 2011, May 2011, July 2011,
September 2011, November 2011 and January 2012). Each litterbag was weighted to
assess the weight loss during the decomposition process. M litter was completely
decomposed in January 2012 and no material remained in the litterbags. Therefore,
analysis for this sampling time for M litter type are missing.
The soil and litter samples were cooled during transportation, homogenized
and divided into subsamples upon arrival to the laboratory. For microbial analysis, the
soil and litter samples were placed in 2 ml sterile plastic tubes and stored at -70°C
until a further analysis. For high performance liquid chromatography (HPLC) analysis
100 ml glass bottles were filled with the soil and litter samples, overlaid with a
mixture of methanol-water-acetic acid (80:19:1, vol/vol/vol) and stored in -20°C. The
remaining soil and litter samples were placed in plastic bags for analysis of pH,
organic carbon content (soil samples) and C, N and P contents (litter samples).

3
Soil analysis
Soil moisture tension and temperature were recorded at both sites by a
datalogger Microlog SP1 (EMS, Brno, Czech Republic) equipped with a gypsum
block sensor. From recorded values, mean temperature and humidity for every month
from November 2010 to March 2012 were calculated. The soil pH was measured by a
Multi 350 WTW glass electrode in a soil water extract (5 g of soil was extracted with
20 ml of distilled water and set for 12 hours at a room temperature). The soil organic
matter content was estimated by combustion in an oven at 550°C to the constant
weight.
HPLC analysis of soluble low-molecular-weight soil metabolites
The extracts of soil and litter samples in a methanol-water-acetic acid were
filtered and vacuum concentrated. The concentrated solution was fractionated using
Amberlite XAD 1180 (5 g of aqueous suspension; 2 cm diameter of a glass column,
equilibrated with water). 50 ml of water (MilliQ quality) was used as the effluent for
the first (hydrophilic) fraction; 50 ml of absolute ethanol was used for the second
(lipophilic) fraction. The ethanolic fraction was evaporated and diluted in a methanol
at a concentration of 5 mg ml-1. The analysis was performed using Acquity UPLC
system with the 2996 PDA detector (Waters, Milford, MA, USA). The column was a
Phenomenex Luna 5 mm C18(2) 100 Å, 100 × 4.6 mm, equipped with a
SecurityGuard cartridge C18, 4 × 3.0 mm ID (Phenomenex, Torrance, CA, USA). The
separation was run in the air-conditioned room at 20°C, and the flow rate was 1.0 ml
min-1. Solvent A was ultrapure water; solvent B was acetonitrile. The gradient started
with 10% of solvent B for 1 min and then increased linearly to 100% of B within 8
min. The final concentration was held for further 3.5 min. 20 μl of each sample were
injected. The spectra were recorded from 194 to 800 nm in 1 nm intervals. Data points
recorded twice per second were exported from a MassLynx software (Waters) in a text
format for further processing.
Enzyme extraction and assays
The activities of extracellular hydrolytic enzymes α – glucosidase (3.2.1.3), 1,4-
β- xylosidase (EC 3.2.1.37), 1,4-β–glucosidase (EC 3.2.1.21), acid phosphatase (EC
3.1.3.1), chitinase (EC 3.2.1.52), cellobiohydrolase (EC 3.2.1.91), glucuronidase

4
(3.2.1.31) and arylsulphatase (3.1.6.1) were measured using methylumbellyferone-
derived fluorogenic substrates directly in aliquots of litter samples homogenized in 50
mM sodium acetate buffer at pH 5.0 (2).
For extracellular oxidative enzymes laccase (EC 1.10.3.2) and manganese
peroxidase (EC 1.11.1.13), aliquots were desalted to separate inhibitory molecules.
The activity of laccase was measured by monitoring the oxidation of 2,20-azinobis-3-
ethylbenzothiazoline-6-sulfonic acid in a citrate-phosphate buffer (pH 5.0) (3). The
manganese peroxidase activity was assayed in a succinate-lactate buffer (100 mM, pH
4.5) using 3-Methyl-2-benzothiazolinone hydrazone and 3,3-dimethylaminobenzoic
acid, which were oxidatively coupled by the enzyme. The results were corrected by
activities of samples without manganese (for MnP) – the addition of manganese
sulphate was substituted by an equimolar amount of EDTA. One unit of enzyme
activity is defined as the amount of enzyme forming 1 μM of reaction product per
min. Enzyme activities were measured in three analytical replicates and expressed per
g plant litter dry mass (4).
DNA extraction and purification
DNA was extracted from 0.1 g of homogenized litter and 0.5 g of soil samples
(only from those collected in January 2011 and November 2011) by method SK
described by Sagova-Mareckova et al. (2008). The method is based on bead-beating
and phenol/chloroform extraction. The samples were purified by incubation with
acetyltrimethylammonium bromide followed by chloroform extraction and incubation
with CaCl2, and finally cleaned with GeneClean Turbo kit (MP Biomedicals, Santa
Ana, CA, USA). DNA extracts were stored at -70 °C until the further analysis.
Quantitative real-time PCR
Quantification of 16S rRNA gene of Actinobacteria, Alphaproteobacteria,
Firmicutes and 18S rRNA gene of fungi in the extracted DNA from litter samples
were performed with primers listed in Table S1(6–8).
Quantitative PCR were performed using a StepOnePlus Real-Time PCR System
(Applied Biosystems, Foster City, CA, USA) using 96-well plates with GoTaq qPCR
Master Mix (Promega, Madison, WI, USA) containing SYBR Green as a double-
stranded DNA (dsDNA) binding dye. The reaction mixture contained in a total

5
volume of 15 μl: 1× GoTaq qPCR Master Mix, primers (for concentrations see Table
S1.) and 2 ng DNA sample. For all microbial groups the PCR cycling protocol
consisted of initial denaturation at 95°C for 10 min, followed by 45 cycles of
denaturation (95°C for 15s), annealing (for respective temperature see Table S1.) and
elongation (72°C for 30s). Standards containing known number of copies of the target
genes 16S rRNA from Streptomyces europaeiscabiei DSM 41802 (for
Actinobacteria), Bartonella-like clone (for Alphaproteobacteria), Paenibacillus clone
(for Firmicutes) and 18S rRNA from Penicillium sp. clone (for fungi), were serially
diluted to calibrate each qPCR melting curve and were recorded to ensure qPCR
specificity. Baseline and threshold calculations were performed with the StepOne
v. 2.2.2 software. The inhibition was tested by serial DNA dilutions from each site. All
qPCR measurements were done in duplicate.
Illumina MiSeq and data processing
Bacterial 16S rRNA gene fragments including the variable region V4 were
amplified by PCR using universal primers with overhang adapters (Table S1.) (9).
Construction of amplicon libraries and sequencing using the MiSeq sequencer
(Illumina, San Diego, USA) were done at the DNA Services Facility, Research
Resources Center, University of Illinois (Chicago, USA). The resulting paired
sequence reads were merged, filtered, aligned using a reference alignment from the
Silva database (10), and chimera checked using integrated Vsearch tool [12]
according to the MiSeq standard operation procedure (Miseq SOP, February 2018;
(9)) in Mothur v. 1.39.5 software (11). A taxonomical assignment of sequence
libraries was performed in Mothur using the non-redundant subset of Silva Small
Subunit rRNA Database, release 132 (12) adapted for use in Mothur
(https://mothur.org/w/images/3/32/Silva.nr_v132.tgz) as the reference database.
Sequences of plastids, mitochondria, and those not classified in the domain Bacteria
were discarded.
The sequence library was clustered into OTUs using the Usearch v10.0.240
software (13), and the OTU table was further processed using tools implemented in
the Mothur software. Distance matrices describing the differences in community
composition between individual samples were calculated using the Yue-Clayton theta
calculator (14). Analysis of molecular variance (AMOVA; (15)) was based on a

6
matrix of Yue-Clayton theta distances. Metastats (16) analyses were used to detect
differentially represented OTUs. Rarefaction analysis was performed with
rarefaction.single function in Mothur, and areas under the rarefaction curves were
calculated using trapezoidal rule in the R version 3.4.4 software (17). Figures were
created using Inkscape (v0.92; http://www.inkscape.org).
The Illumina MiSeq 16S rRNA gene amplicon sequences have been deposited
in the NCBI Sequence Read Archive under accession no. SRP158384
(https://www.ncbi.nlm.nih.gov/sra/SRP158384) and are available under BioProject
no. PRJNA485178.

0
2
4
6
8
10
12
14
16
So
il m
ois
ture
ten
sion
[bar
]
0
5
10
15
20
Soil
tem
per
ature
[°C
]
Month
Jan Mar May Jul Sep NovFeb Apr Jun Aug Oct
Fig. S1. Monthly averages of soil moisture tension and soil temperature measured by datalogger
during litterbag experiment at the forest (black) and the grassland (white) sites.

0
1
2
3
0
10
20
30
40
50
0
0.5
1
1.5
2
2.5
Grassland Forest P
[g
kg
-1]
N [
%]
C [
%]
Sampling
Initial Jan Mar May Jul Sep Nov Jan Initial Jan Mar May Jul Sep Nov Jan
Fig. S2. Carbon, nitrogen and phosphorus content in dry weight of beech (black circles), milkvetch
(grey squares) and sedge (white triangles) at the forest and the grassland sites during decomposition
experiment ± SD (5 replicates). The x axes indicate sampling time (Initial - Jan, i.e. initial C,N and P
content and litterbag sampling after 2 - 14 months).


Fig. S7. Average proportions (5 replicates) of phyla in the bacterial 16S rRNA
gene amplicon sequence libraries from the soil sampled at the experimental
sites (G - grassland, F - forest) during the first (Jan) and the sixth (Nov) litter
sampling.
0
10
20
30
40
50
60
70
80
90
100
Gemmatimonadetes
unclassified
others
Chlamydiae
Patescibacteria
WPS-2
Chloroflexi
Planctomycetes
Acidobacteria
Verrucomicrobia
Firmicutes
Bacteroidetes
Actinobacteria
Proteobacteria
Pro
po
rtio
n in
th
e lib
rary
[%
]
Jan Nov
G F G F


B ForestA Grassland
M2 M4 M8 M12
S2 S4 S8 S12
B4B2 B8 B12
277 965 691
433 613 737
1010
1109
656
948
779
555
713364252
426 570
283352
534454
M2 M4 M8 M12
S2 S4 S8 S12
B4B2 B8 B12
291 722 1054
551652 796
927
1645
671
1463
584
440
508 370 359
405 661
316 488
602556 S4 S12
Fig. S9. Changes of composition of bacterial communities during plant litter decomposition assayed by
Illumina amplicon sequencing at the grassland (A, open symbols) and the forest (B, grey symbols) sites.
Numbers indicate the OTUs significantly contributing to the difference between samples in pairwise
comparison (Metastats, p < 0.05).
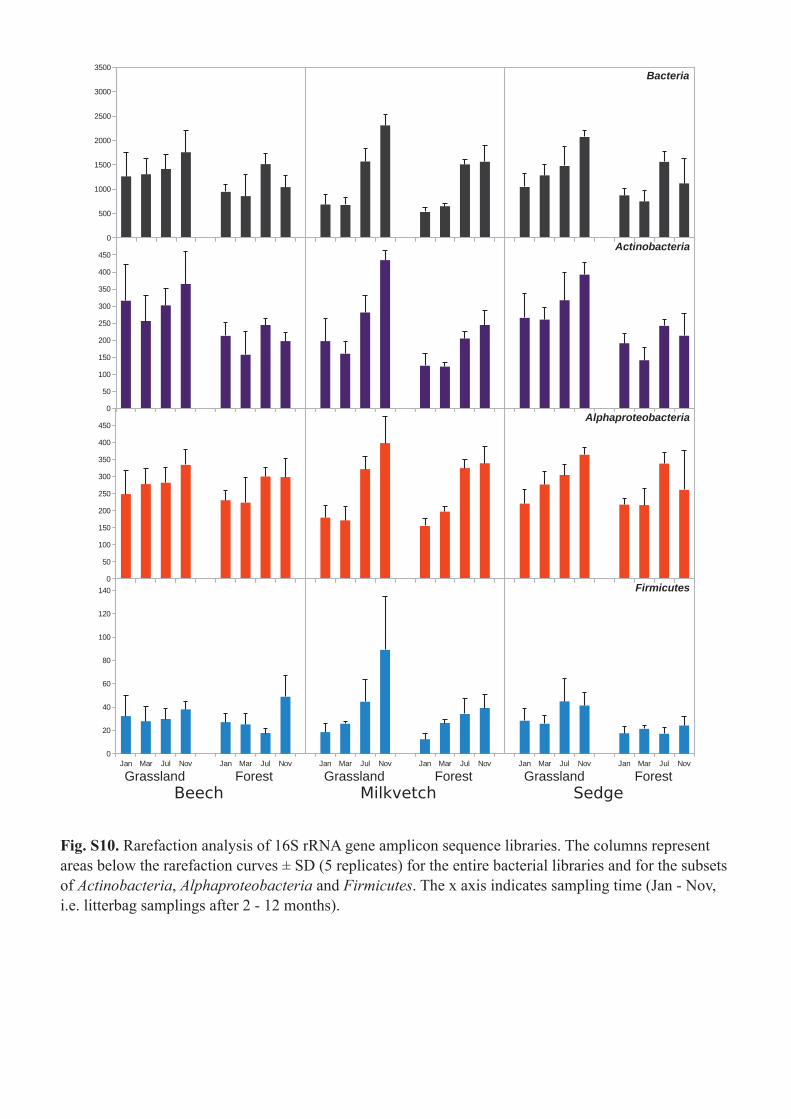
Fig. S10. Rarefaction analysis of 16S rRNA gene amplicon sequence libraries. The columns represent
areas below the rarefaction curves ± SD (5 replicates) for the entire bacterial libraries and for the subsets
of Actinobacteria, Alphaproteobacteria and Firmicutes. The x axis indicates sampling time (Jan - Nov,
i.e. litterbag samplings after 2 - 12 months).
0
500
1000
1500
2000
2500
3000
3500
Bacteria
0
50
100
150
200
250
300
350
400
450
Actinobacteria
0
50
100
150
200
250
300
350
400
450
Alphaproteobacteria
Jan Mar Jul Nov Jan Mar Jul Nov Jan Mar Jul Nov Jan Mar Jul Nov Jan Mar Jul Nov Jan Mar Jul Nov
0
20
40
60
80
100
120
140 Firmicutes
Beech Milkvetch SedgeGrassland Forest Grassland Forest Grassland Forest


For ANOVA: * P < 0.05; ** P < 0.01; *** P < 0.001
For correlation coefficient: Bonferroni-corrected critical P value < 0.0035a only for the first two sampling points (from November to January)
Table S2. Pairwise quantitative comparison of the experimental sites (F – forest, G – grassland) and plant
substrates (B – beech, M – milkvetch, S – sedge) assayed by ANOVA using linear model with the additive
effects, correlation coefficients of profiles determined by PERMANOVA using distance matrices
(P-permanova) and variability of the profiles assayed by testing for homogeneity of multivariate
dispersions using dissimilarity measures (P-disp).
CORRELATION COEFFICIENT
Sites Plant substrates P-permanova P-disp
Dry weight loss G < F***M >S***, M > B***,
S > B***0.00 0.382
N G < F*** M > B***, S*** 0.002 0.000
C G < F*** - 0.140 0.383
P G > F**M > S***, M > B***,
S > B*0.000 0.005
Actinobacteria G > F*** - 0.021 0.387
Fungi - M**, S*** > B 0.000 0.505
Alphaproteobacteriaa G > F** M > B***, S*** 0.029 0.002
Firmicutes - M > B***, S*** 0.852 0.006
- Glucosidase G < F*** M > B***, S*** 0.651 0.932
Cellobiohydrolase G < F**M > S**, M > B***,
S > B***0.278 0.867
- Xylosidase G < F***M > S*, M > B***,
S > B***0.213 0.001
N-acetylglucosaminidase
(Chitinase)G < F*** M***, S*** > B 0.005 0.914
Glucuronidase G < F** M***, S*** > B 0.125 0.000
Acid Phosphatase G < F*** M > B***, S*** 0.067 0.208
Arylsulphatase G < F*** M***, S*** > B 0.004 0.052
- Glucosidase G < F** M***, S*** > B 0.191 0.018
Laccase G < F** S > B** 0.009 0.796
Mn - peroxidase - - 0 0.385
ANOVA

B M S OVERALL
January 2011 0.008 0.000 0.000 <0.001
March 0.002 0.001 0.001 <0.001
May 0.004 0.001 0.001 <0.001
July 0.001 0.001 0.001 <0.001
September 0.003 0.001 0.001 <0.001
November 0.030 0.009 0.018 <0.001
January 2012 0.005 NA 0.008 <0.001
Bonferroni-corrected threshold P value < 0.016
Table S3. Differences (indicated by P – values) of low-molecular-weighted compounds
at beech (B), milkvetch (M) and sedge (S) between experimental sites (Forest and
grassland) at sampling times (January 2011 – Januray 2012) assayed by non-parametric
multivariate analysis using distance matrix.

B M S OVERALL
January 2011 0.098 0.009 0.418 0.002
March 0.092 0.008 0.161 <0.001
July 0.008 0.064 0.006 <0.001
November 0.009 0.039 0.009 <0.001
Bonferroni-corrected threshold P value < 0.016
Table S4. Differences (indicated by P – values ) of bacterial community at beech (B),
milkvetch (M) and sedge (S) between experimental sites (forest and grassland) at
sampling times (January 2011 – January 2012) assayed by non-parametric multivariate
analysis using Yue-Clayton distance matrix.

Table S5. AMOVA analysis of differences in composition of bacterial communities at beech (B),
milkvetch (M) and sedge (S) at the forest and the grassland sites (F-values).
df M S df M S
B 1 4.39381* 1.09189 B 1 2.67483* 1.29985
M 1 4.56859* M 1 3.05833*
* P < 0.016 (Bonferroni-corrected threshold)
Grassland Forest
References for supplementary text citations
1. Sagova-Mareckova M, Omelka M, Cermak L, Kamenik Z, Olsovska J, Hackl
E, Kopecky J, Hadacek F. 2011. Microbial communities show parallels at sites
with distinct litter and soil characteristics. Appl Environ Microbiol 77:7560–
7567.
2. Baldrian P. 2009. Microbial enzyme-catalyzed processes in soils and their
analysis. Plant, Soil Environ 55:370–378.
3. Bourbonnais R, Paice MG. 1990. Oxidation of non-phenolic substrates. FEBS
Lett 267:99–102.
4. Šnajdr J, Cajthaml T, Valášková V, Merhautová V, Petránková M, Spetz P,
Leppänen K, Baldrian P. 2011. Transformation of Quercus petraea litter:
Successive changes in litter chemistry are reflected in differential enzyme
activity and changes in the microbial community composition. FEMS
Microbiol Ecol 75:291–303.
5. Sagova-Mareckova M, Cermak L, Novotna J, Plhackova K, Forstova J,
Kopecky J. 2008. Innovative methods for soil DNA purification tested in soils
with widely differing characteristics. Appl Environ Microbiol 74:2902–2907.
6. Muyzer G., de Waal EC, Uitterlinden AG. 1993. Profiling of complex microbial
populations by denaturing gradient gel electrophoresis analysis of polymerase
chain reaction-amplified genes coding for 16S rRNA. Apply Environ Microbiol
59:695–700.
7. Stach JEM, Maldonado LA, Ward AC, Goodfellow M, Bull AT. 2003. New
primers for the class Actinobacteria: Application to marine and terrestrial
environments. Environ Microbiol 5:828–841.
8. Prévost-Bouré CN, Christen R, Dequiedt S, Mougel C, Lelièvre M, Jolivet C,
Shahbazkia HR, Guillou L, Arrouays D, Ranjard L. 2011. Validation and
application of a PCR primer set to quantify fungal communities in the soil
environment by real-time quantitative PCR. PLoS One 6.
9. Kozich JJ, Westcott SL, Baxter NT, Highlander SK, Schloss PD. 2013.
Development of a dual-index sequencing strategy and curation pipeline for
analyzing amplicon sequence data on the miseq illumina sequencing platform.
Appl Environ Microbiol 79:5112–5120.
10. Quast C, Pruesse E, Yilmaz P, Gerken J, Schweer T, Yarza P, Peplies J,
Glöckner FO. 2012. The SILVA ribosomal RNA gene database project:

improved data processing and web-based tools. Nucleic Acids Res 41:D590–
D596.
11. Rognes T, Flouri T, Nichols B, Quince C, Mahé F. 2016. VSEARCH: a
versatile open source tool for metagenomics. PeerJ 4:e2584.
12. Yilmaz P, Parfrey LW, Yarza P, Gerken J, Pruesse E, Quast C, Schweer T,
Peplies J, Ludwig W, Glöckner FO. 2014. The SILVA and “all-species Living
Tree Project (LTP)” taxonomic frameworks. Nucleic Acids Res 42:643–648.
13. Edgar RC. 2013. UPARSE: highly accurate OTU sequences from microbial
amplicon reads. Nat Methods 10:996–998.
14. Yue JC, Clayton MK. 2005. A similarity measure based on species proportions.
Commun Stat - Theory Methods 34:2123–2131.
15. Martin AP. 2002. Phylogenetic Approaches for Describing and Comparing the
Diversity of Microbial Phylogenetic Approaches for Describing and Comparing
the Diversity of Microbial Communities. DNA Seq 68:3673–3682.
16. White JR, Nagarajan N, Pop M. 2009. Statistical Methods for Detecting
Differentially Abundant Features in Clinical Metagenomic Samples. PLoS
Comput Biol 5:e1000352.
17. R Core Team. 2018. R Core Team, R : A language and environment for
statistical computing. R Found Stat Comput Vienna, Austria R Foundation for
Statistical Computing.

Paper III: Litter chemical quality and bacterial community
structure influenced decomposition in acidic forest soil

1
Litter chemical quality and bacterial community structure influenced decomposition in acidic forest 1
soil 2
3
Authors 4
Andrea Buresova 1,3,4, Vaclav Tejnecky 2, Jan Kopecky 1, Ondrej Drabek 2, Pavla Madrova 1, Nada 5
Rerichova 2, Marek Omelka 5, Petra Krizova 2, Karel Nemecek 2, Thomas B. Parr 6, Tsutomu Ohno 7, 6
Marketa Sagova-Mareckova 8 7
8
Corresponding author: Vaclav Tejnecky, email: [email protected] 9
10
1 Epidemiology and Ecology of Microorganisms, Crop Research Institute, Drnovska 507, Prague, Czech 11
Republic 12
2 Department of Soil Science and Soil Protection, Faculty of Agrobiology, Food and Natural Resources, 13
Czech University of Life Sciences Prague, Kamycka 129, Prague, Czech Republic 14
3 Department of Ecology, Faculty of Science, Charles University in Prague, Vinicna 7, Prague, Czech 15
Republic 16
4 Microbial Ecology, University Claude Bernard Lyon 1, UMR CNRS 5557, INRA 1418, Villeurbanne, 17
France 18
5 Department of Probability and Mathematical Statistics, Faculty of Mathematics and Physics, Charles 19
University in Prague, Sokolovska 68, Prague 8, Czech Republic 20
6 Department of Biology, University of Oklahoma, 730 Van Vleet Oval, Norman, OK, USA 21
7 School of Food and Agriculture, University of Maine, 5763 Rogers Hall, Orono, ME, USA 22
8 Department of Microbiology, Dietetics and Nutrition, Faculty of Agrobiology, Food and Natural 23
Resources, Czech University of Life Sciences Prague, Kamycka 129, Prague, Czech 24
Republic 25
26
27
28

2
Abstract 29
The study was designed to see if naturally occurring beech forests uptake different nutrients than 30
artificially planted spruce forests and if the structure of microbial communities participating in 31
decomposition corresponds to the soil types developed under the respective tree species. This corresponds 32
to previous observations that the soil under spruce forest is typically dominated by podzol, while the soil 33
under beech forest undergoes higher mineralization, which leads to moder humus and the development of 34
cambisol. A litterbag experiment was performed with beech and spruce litter placed respectively to beech 35
and spruce forests. In the beech forest, the observed litter decomposition rate reached the exponential faze 36
after 15 months, while in the spruce forest a steeper decrease was noted only 29 months after the litter 37
burial. Thus, the study focused on the period between 15 and 29 months to observe the exponential stages 38
of recalcitrant organic matter transformation. In this period, the chemical composition of two litters was 39
distinguished by higher contents of Mn and Ca in beech and higher content of Fe, S, N and P in spruce. 40
On top of that, the beech litter released higher amount of dissolved organic carbon and its associated 41
bacterial community was enriched with r-selected taxa, that correlated positively with organic acids and 42
cations. In contrast, the more acidic spruce litter was dominated by K-selected acidophilic community and 43
its turnover rate was slower, resulting in increased carbon sequestration. The higher pH and humus quality 44
of beech cambisol also correlates with its observed higher resilience to disturbances by acidification, pests 45
or climate change in mountainous environments. 46
47
Keywords 48
Soil type, Humus, Elemental composition, DOC, Bacteria, Fungi 49
50
51

3
1. Introduction 52
Human-introduced spruce forests are more vulnerable to environmental changes than natural beech 53
forests in the Czech Republic. The spruce forests vulnerability is even increased in acidic soils, which are 54
limited by availability of nutrients [1] and potential mobilization of toxic forms of Al [2,3]. In such 55
environments, the litter represents a major source of Ca, K, Mg, P and organic carbon (OC) in the upper 56
layer of soil [4]. 57
The precise chemical composition of litter depends mostly on the requirements of particular plant 58
species and its nutrient uptake and allocation to tissues [5,6]. The nutrient content and composition of 59
organic compounds in litter further establish the microbial community corresponding to the litter type [7]. 60
Microbial decomposers return the litter nutrients back to soil by activities mostly regulated by soil 61
chemistry, but also by local climate, i.e. precipitation, which have further impact on soil development and 62
environmental stability [8]. 63
In particular, the elevated concentration of some litter components may speed up [9] or slow down 64
the decomposition rate [10]. For example, N and P stimulate decomposition rate in earlier stages but inhibit 65
its rate in later stages due to formation of complexes, which are recalcitrant for microbes [10,11]. Litter 66
decomposition is further dependent on the amount of dissolved organic carbon (DOC) released from litter 67
and its character, as the low level of DOC with its elevated aromaticity (A254; absorbance at 254 nm) and 68
complexity of organic compounds increase the litter recalcitrance [12]. Finally, the decomposition is also 69
predicted by humification index (HIX) of the decomposed litter, which determines how the particular litter 70
contributes to the humus formation [13]. 71
Decomposition process over time may be illustrated as an asymptotic function. The upper 72
threshold of the function - limit value of decomposition – represents the phase, when the substrate is no 73
longer decomposed and remains stabilized in the soil [14]. The lag-time shows how long it takes a litter 74

4
to enter the exponential stage of decomposition. The long lag-time eventually implicates that old organic 75
matter is not necessarily stabilized and recalcitrant but that other mechanisms keep it from the 76
decomposition [15]. Later stages of litter decomposition are typically less explored due to longer time 77
required for experiments. Yet, they are needed mostly to evaluate chemical traits of recalcitrant litter and 78
its contribution to humus and soil formation. 79
Consequently, the contribution of different biotic and abiotic factors to low limit value or long lag-80
time of recalcitrant litter is not well studied, although it is important for understanding which mechanism 81
and microbial decomposers participate on the release of sequestrated nutrients. Furthermore, it is not 82
known, what is the role of different tree species in creating specific soil chemical conditions, and their 83
further influence on the composition and response of the decomposing microbial community [16,17]. 84
Bacteria are generally less studied decomposers in forest soils compared to fungi, particularly in 85
later stages of decomposition [18]. That might be due to the previous association of bacterial 86
decomposition with readily degradable nutrient rich litter. However, some recent studies found that after 87
the initial stage of decomposition, bacterial community showed increased diversity and different structure 88
than in the early stages of decomposition [19]. Moreover, bacterial phyla Actinobacteria and Firmicutes, 89
which represent K-selected decomposers, dominated in stages characterized by high proportion of a 90
recalcitrant organic matter [20]. 91
Thus, our study aimed in evaluating differences between chemical conditions and microbial 92
communities of native beech and introduced spruce litter during the decomposition stage following the 93
initial stage in two forests soils. The forests are located next to each other in the Jizera Mountains, Czech 94
Republic. They share an acid bedrock (porphyric granite) and mountainous climate with intense 95
precipitation of 800–1700 mm per year [16,21]. We hypothesized that the beech litter will promote faster 96
decomposition with a more abundant and diverse microbial community. In contrast, the spruce litter will 97

5
be preserved against decomposition by relatively high acidity and sequestrated C, which will support less 98
abundant decomposers possibly dominated by a few taxa. The comparison consisted of detailed litter 99
chemical analyses (DOC, HIX, A254), low molecular mass organic acids (LMMOA), N, P, Ca, Mn, Fe 100
together with the observation of the microbial succession on beech leaves and spruce needles using 101
quantification of bacteria (16S rRNA, ddPCR) and fungi (ITS region, ddPCR) and bacterial community 102
composition (16S rRNA, Illumina MiSeq) after months 15, 19 and 29 of decomposition. That knowledge 103
was further applied to resolve factors which support higher decomposition rate and more diverse microbial 104
community in the beech forest soil and to find the basis of the humus quality and soil type formation at 105
the two sites. 106

6
2. Materials and Methods 107
2.1. Litter bag experiment 108
The litterbag experiment was carried out in a beech forest (European beech, Fagus sylvatica L.) 109
and a spruce forest (Norway spruce, Picea abies [L.] Karst.), which grow next to each other on the Palicnik 110
hill located in the Jizera Mountains (Czech Republic; 50.8673125N, 15.2544103E), affected by 111
acidification in the past [16]. The altitude of studied plots ranged from 635 (bottom limit) to 680 m a.s.l. 112
(upper limit). The bedrock of both forest types is a medium-grained porphyric granite and granodiorite of 113
the Upper Carboniferous age. The soil under spruce was classified as the Entic and Haplic Podzols and 114
the soil under beech as the Aluminic Cambisol [22]. Mor or moder are respectively the prevailing types 115
of humus [23]. Mean annual temperatures 7.33 °C, 9 °C and 8.7 °C and mean annual precipitations 922 116
mm, 683 mm and 696 mm were measured in years 2013, 2014 and 2015, respectively, in Liberec region, 117
where the experiment was conducted [24]. Diameter at breast height of living trees was 534.6 (±153.4) 118
mm in beech forest and 405.8 (±112.4) mm in spruce forest, canopy closure was 87 % in beech and 40 % 119
in spruce forest and total area of rock was 811.9 m2 in beech forest and 10.9 m2 in spruce forest [23]. The 120
experimental layout is showed in Supplementary Fig. S1. 121
Soil samples were collected from the surface litter (L), fermentation (F), humified (H) organic and 122
organo-mineral (humic, A) horizons. Samples from subsurface B horizons (cambic or spodic) were also 123
collected. Each sample was thoroughly mixed. The soil samples were analyzed in a “fresh” state 124
representing actual soil moisture and in dry and sieved (< 2mm) state. In total, 8 beech and 7 spruce soil 125
pits were described and sampled in September 2015. 126
Newly fallen spruce needles and beech leaves were collected in November 2011. Part of the 127
collected litter was directly used for chemical analysis (denoted as the initial litter). Overall, 120 bags 128
were made of polyamide with 99 μm mesh size and 50 μm fibre diameter were filled with 5 g of dry beech 129

7
(BL) or spruce (SL) litter. Sixty bags with BL were placed in the beech forest and sixty with SL in the 130
spruce forest 1 m apart between litter (L) and fermentation (F) organic horizons in April 2013. Three 131
litterbags from each litter type were collected during each sampling period in May 2013, June 2013, July 132
2013, August 2013, September 2013, October 2013, November 2013, July 2014, November 2014 and 133
September 2015 (i.e. months 1, 2, 3, 4, 5, 6, 7, 15, 19 and 29 from the start of the experiment). After the 134
collecting, samples were weighed and frozen for further analysis. Mass loss of litter and chemical analyses 135
were assessed for all samples but only samples collected in months 15, 19 and 29 were chosen for further 136
microbiological analysis because at those dates, an increased rate of decomposition was observed. The 137
stage was thus termed exponential. 138
139
2.2. Chemical analysis 140
2.2.1. Soil analysis 141
Fresh soil samples were extracted by deionised water and pH and DOC were measured according 142
to Tejnecky et al. [16,17]. Cation exchange capacity (CEC) and exchangeable elements (Caex, Alex, H+
ex) 143
were determined according to Cools and De Vos [25] and base saturation (BS in %) was calculated as a 144
ratio between CEC and base cations (Na+, K+, Ca2+ and Mg2+). 145
146
2.2.2. Litter analyses 147
Water extracts were made from each defrosted sample (1 g of thawed sample with 30 ml deionized 148
H2O). Water extraction represents easily available elements or substances and preserves sample matrices 149
[26]. The suspension was then centrifuged at 4000 g for 15 min; finally, extracts were filtered through a 150
0.45 μm nylon membrane filter (Sigma-Aldrich, MO, USA). In aqueous extracts, the following chemical 151

8
parameters were determined: pH, main inorganic anions (NO3- w, NO2
- w, SO4
2- w and PO4
3- w, Cl-
w, F- w) 152
and low-molecular mass organic acids (LMMOA, lactate w, acetate w, formate w and oxalate w) by means 153
of ion chromatography (IC, ICS 1600; Dionex; CA, USA) with suppressed conductivity. Cations (NH4+
154
w, K+ w, Mg2+
w, Na+ w, Ca2+
w) were determined by means of ion chromatography (ICS 90, Dionex; CA, 155
USA) and the contents of selected elements (P w, Al w, Fe w, K w, Ca w, Mn w) by inductively coupled 156
plasma-optical emission spectrometer (ICP-OES, DUO iCap 7000; Thermo Scientific, MA, USA). The 157
contents of Ntot, Ctot, Stot were determined by Elementary Analyzer Flash 2000 NCS (Thermo Scientific, 158
UK). For Ctot, Stot, Ntot, 9 replicates were used for SL but 7 replicates were used for BL. The respective 159
part of each sample was oven dried (40°C), homogenized and digested in Teflon vessels with the addition 160
of HNO3 (0.5 g of samples and 5-10 ml 65 % HNO3). In the obtained solution, the contents of selected 161
elements (Ptot, Catot, Mgtot, Ktot, Altot, Fetot and Mntot) were determined by ICP-OES (DUO iCap 7000, 162
Thermo Scientific, MA, USA). Quality of digestion and analysis were controlled using standard reference 163
materials (NIST SRM 1575a Pine Needles and NCS DC 73351 Tea). The contents of elements and 164
substances were calculated to dry mass. 165
Dissolved organic carbon (DOC), absorbance at 254 nm (A254) and humification index (HIX) were 166
determined in water extracts of litter- using 0.2500 g of homogenized litter mixed with 12.5 ml of 167
deionized water incubated for 24 h at 4 °C on an orbital shaker. The 4 °C condition was selected to 168
minimize microbial DOM alteration during extraction [27]. Suspensions were centrifuged at 3000 g for 169
25 min before vacuum filtering through 0.4 μm polycarbonate membrane filter (Whatman, England). The 170
DOC concentration in the extracts was determined by high temperature catalytic oxidation using a 171
Shimadzu TOC-V analyzer (Kyoto, Japan). UV A254 was obtained using a Shimadzu UV-1800 172
spectrophotometer and a 1-cm quartz cuvette. 173

9
All litter extracts were diluted with deionized water to set the absorbance at 254 nm to 0.10 to 174
minimize inner-filtration effects in obtaining the fluorescence spectra [28]. Fluorescence spectra were 175
obtained using a Hitachi F-4500 spectrofluorometer (Tokyo, Japan). The instrumental parameters were: 176
excitation (EX) and emission (EM) slits, 5 nm; response time, 0.5 s; and scan speed, 2400 nm min-1. The 177
EM spectra were obtained using 240 nm for EX and EM recorded from 300 to 600 nm. Correction factors 178
were applied according to the manufacturer’s instructions, emission scans were blank subtracted, then 179
Raman Normalized, and then corrected for dilution in R 3.5.0 [29]. The HIX was calculated as ratio of the 180
sum of fluorescence intensities from 435 to 480 nm divided by sum of intensities from 300 to 345 nm and 181
435 to 480 nm [28]. 182
From initial litter samples, total contents of Catot, Mntot, Fetot, Ktot, Mgtot, Natot, Altot, DOC, A254 and 183
HIX were assessed. 184
185
2.3. DNA extraction and amplicon sequencing 186
DNA was extracted from 0.1 g of homogenized plant litter by method described in Sagova-187
Mareckova et al. [30]. The method is based on bead-beating and phenol/chloroform extraction. The 188
samples were purified by incubation with acetyltrimethylammonium bromide followed by chloroform 189
extraction and incubation with CaCl2. DNA samples were finally cleaned with GeneClean Turbo kit (MP 190
Biomedicals, CA, USA) and afterwards stored at -70 °C until further analysis. Fragments of the bacterial 191
16S rRNA gene including the variable region V3-V4 were amplified from the DNA samples by PCR, 192
using bacteria specific forward primer 341F (CCTACGGGAGGCAGCAG) and universal reverse primer 193
806R (GGACTACHVGGGTWTCTAAT). Construction of amplicon libraries and sequencing using 194
MiSeq sequencer (Illumina, San Diego, USA) were done at the DNA Services Facility, Research 195
Resources Center, University of Illinois (Chicago, USA). 196

10
197
2.4. Processing of sequence data 198
The resulting paired sequence reads were merged, filtered, aligned using reference alignment from 199
the Sylva database [31], and chimera checked using integrated Vsearch tool[32] following the MiSeq 200
standard operation procedure (Miseq SOP, February 2018; [33]) in Mothur v. 1.39.5 software [34]. A 201
taxonomic assignment of sequence libraries was performed in Mothur using the recreated SEED database 202
subset of Sylva Small Subunit rRNA Database, release 132 [35] adapted for use in Mothur 203
(https://mothur.org/w/images/a/a4/Sylva.seed_v132.tgz) as the reference database. 204
Sequences of plastids, mitochondria, and those not classified in the domain Bacteria were discarded. The 205
sequence library was clustered into operational taxonomic units (OTUs) using the Uparse pipeline in 206
Usearch v10.0.240 software [36], and the OTU table was further processed using tools implemented in 207
the Mothur software. Rarefaction curves were used to detect observed OTUs for respective sequence 208
numbers. Bray-Curtis distance matrices describing the differences in bacterial community composition 209
between individual samples were calculated. The Illumina MiSeq 16S rRNA gene amplicon sequences 210
were deposited in the NCBI Sequence Read Archive (www.ncbi.nlm.nih.gov/sra) as BioProject No.: 211
PRJNA494609. 212
213
2.5. Quantification of bacteria and fungi 214
Quantification of bacteria (16S rRNA genes) and fungi (ITS region) from extracted DNA were 215
done by droplet digital PCR (ddPCR). For gene amplification primers 16Seu27f 216
(AGAGTTTGATCMTGGCKCAG) [37] and mixture of 783r-a, (CTACCAGGGTATCTAATCCTG), 217
783r-b (CTACCGGGGTATCTAATCCCG) and 783r-c (CTACCCGGGTATCTAATCCGG) [38] were 218

11
used for quantification of a bacterial 16S rRNA gene and primers ITS1F 219
(CTTGGTCATTTAGAGGAAGTAA) [39] and ITS4 (TCCTCCGCTTATTGATATGC) [40] were used 220
for quantification of a fungal ITS region. Reactions were prepared with QX200 EvaGreen Digital PCR 221
Supermix (Bio-Rad Laboratories, CA, USA) with 400 μM final concentration of forward and reverse 222
primers. After generating droplets in QX200™ Droplet Generator (Bio-Rad Laboratories, CA, USA) the 223
PCR amplifications were performed (annealing temperatures: 56°C for bacteria and 54°C for fungi) and 224
droplets were detected fluorescently in Droplet Reader (Bio-Rad Laboratories, CA, USA). Results were 225
analyzed in QuantaSoft 1.7.4.0917 (Bio-Rad Laboratories, CA, USA). 226
227
2.6. Statistical analysis 228
Based on the observation of increased rate of decomposition, samples from months 15, 19 and 29 229
of each litter (n = 9) were used for statistical analysis (except for several analyses of mass loss and a few 230
selected chemical traits in the Supplementary Material). The effect of litter type and time during the whole 231
course of the experiment (from months 1 to 29) on mass loss was calculated by two-way ANOVA. Pair-232
wise differences in mass loss between each month of decomposition for BL and SL were separately 233
calculated by ANOVA and Tukey´s post-hoc test. Mass loss, chemical and microbiological variables 234
(abundance of bacteria 16S rRNA and fungi ITS region) from the three months of exponential stage 235
decomposition period on the BL (n = 9) and SL (n = 9) litter and chemical variables from the initial litter 236
(n = 3) were compared by Welch version of the two-sample t-test [41], which does not require equal 237
variances for both groups. The effect of time was not statistically analyzed. 238
Rarefaction analysis was used to demonstrate bacterial diversity expressed as the number of observed 239
OTUs with sequence numbers. Analysis of molecular variance (AMOVA) was calculated based on a 240
matrix of Bray-Curtis distances [42]. Metastats [43] analysis was used to show differences between 241

12
bacterial communities of BL and SL and to detect the differentially represented OTUs between the two 242
litter types. The outcome was also visualized as heat maps. Maximum-likelihood phylogram of the OTU 243
representative sequences was constructed using FastTree 2 [44]. Figures were created using Interactive 244
Tree of Life online tool (http://itol.embl.de; [45], and Inkscape (v0.92; http://www.inkscape.org).The 245
Bray-Curtis distance matrix was plotted by non-metric multidimensional scaling [46] using the Mass 246
package v. 7.3-51.5 [47]. Vectors of environmental variables which significantly correlated to bacterial 247
community were fitted to the nmds plot in R using function envfit from the package vegan v. 2.5-6 [48]. 248
All statistical calculations were done in the R computing environment [29] or in Mothur v. 1.39.5 software 249
[34]. Figures were plotted with the help of vegan package [49]. 250
3. Results 251
3.1. Soil chemical characteristics 252
Spruce forest soils were more acidic (pH = 3.82 ± 0.29) than beech forest soils (pH = 4.08 ± 0.27) 253
except for F horizons, where pH were not statistically different (Table 1). H+ex represents exchangeable 254
pool of H+ and significantly differed between beech and spruce soil profile except the B horizon (Table 255
1). In the uppermost L horizon, the content of Ca2+ex, base saturation (BS), cation exchange capacity (CEC) 256
and dissolved organic carbon (DOC) were significantly higher in the beech forest (Table 1). Al3+ex was 257
the lowest in L horizon and did not differ between the two forest soils (Table 1). Litter (L) organic horizons 258
thickness under beech was on average 2.7 cm and 1.8 cm under spruce and bulk density under beech was 259
0.015 g.cm-3 and 0.048 g.cm-3 under spruce. 260

13
Table 1. Spruce and beech soil horizons (L - litter, F - fermentation, H - humic, A - organic and organo-261
mineral and B - subsurface cambic or spodic horizon) differences in pH, dissolved organic carbon (DOC), 262
base saturation (BS), cation exchange capacity (CEC) and exchangeable cations (H+ex, Al3+ex, Ca2+ex). 263
Average values and standard deviations (SD), degrees of freedom (Df), t-values and p-values are indicated 264
(t-test). 265
Beech Spruce T- test
Horizon Average SD Average SD Df t - value p - value
pH L 4.99 0.21 4.59 0.12 13 4.39 < 0.001 F 4.20 0.29 3.90 0.43 13 1.62 0.129 H 4.15 0.22 3.79 0.11 13 3.96 0.002 A 4.32 0.19 3.93 0.08 12 5.10 < 0.001 B 4.51 0.10 4.32 0.09 12 3.77 0.003
DOC
[mg kg-1] L 69.43 20.20 34.36 38.42 13 2.26 0.042
F 678.0 358.1 473.8 250.8 13 1.26 0.230
H 305.8 115.5 461.4 132.4 13 -2.43 0.030 A 143.6 58.99 218.1 73.42 12 -2.10 0.058 B 57.80 17.41 27.30 15.36 12 3.48 0.005
CEC
[meq kg-1] L 185.3 27.6 115.3 6.962 13 6.50 < 0.001
F 135.0 18.2 148.5 6.515 13 -1.85 0.087
H 100 11.44 122.5 12.64 13 -3.64 0.003 A 80.58 14.36 84.81 7.703 12 -0.69 0.505 B 46.72 10.65 50.49 9.712 12 -0.69 0.502
BS [%] L 84.73 4.13 74.62 6.44 13 3.67 0.003 F 47.29 14.71 40.60 5.99 13 1.12 0.283 H 14.71 2.17 15.40 2.15 13 -0.62 0.548 A 9.753 2.007 9.943 2.106 12 -0.17 0.866 B 9.589 3.210 8.644 3.079 12 0.56 0.585
H+ex
[meq kg-1] L 3.924 0.906 15.76 2.57 13 -12.23 < 0.001
F 13.80 6.073 31.37 2.96 13 -6.95 < 0.001
H 9.080 2.566 21.03 2.59 13 -8.95 < 0.001 A 5.913 1.589 14.63 1.56 12 -10.37 < 0.001 B 2.833 0.463 3.270 0.891 12 -1.15 0.270
Al3+ex
[meq kg-1] L 2.899 6.388 7.916 5.171 13 -1.65 0.122
F 46.30 17.44 47.37 11.30 13 -0.14 0.892
H 70.19 9.06 73.10 10.20 13 -0.59 0.568 A 62.70 11.71 54.15 7.97 12 1.59 0.137 B 37.84 9.21 40.57 7.97 12 -0.59 0.565
Ca2+ex
[meq kg-1] L 125.4 21.51 60.36 12.24 13 7.04 < 0.001
F 47.10 22.68 39.09 10.36 13 0.86 0.407
H 6.063 1.531 6.055 1.784 13 0.01 0.992 A 2.668 0.582 2.238 0.732 12 1.218 0.247
B 1.651 0.506 0.949 0.187 12 3.48 0.005

14
3.2. Litter mass loss 266
Litter mass loss was affected by factors of time as well as litter type (Table S1.) The average litter 267
mass decreased from month 1 to month 29 by about 22.4 % in beech and 12.4 % in spruce forests (p < 268
0.001, Fig 1). In month 15, beech litter (BL) entered the exponential decomposition rate with the highest 269
differences in mass loss between beech and spruce (SL) litter recorded in the last month 29 (Fig. 1). The 270
mass loss most significantly differed from previous months in months 19 and 29 for BL and in month 29 271
for SL (Fig. 1). The mass loss was significantly different between BL and SL in months 15 to 29 (Table 272
S2 A). 273
Fig. 1. The average residual mass loss (±SD) of beech (yellow) and spruce (green) during litter bag 274
decomposition experiment (n = 3). The x axe indicates sampling time. 275
3.3. Litter chemical characteristics 276
In the initial litter, significantly higher contents of Catot, Mntot, Ktot, Mgtot and Natot were measured 277
for BL, while higher, Altot, Stot, Ntot, Ctot were measured for SL (Table S2 B). Differences for selected 278
elements (Ntot, Stot, Ptot, Fetot, Catot, Mntot) from month 1 to month 29 were specific for each litter type (Fig. 279
1 2 3 4 5 6 7 15 19 29 0
20
40
60
80
100
Months from the start of experiment
Lit
ter
[% o
f in
itia
l mas
s]
a ab
b
ab ab ab ab ab
ab ab
bc
a a a
ab ab
ab
ab
ab
c

15
S2; Table S3). A particularly fast decrease of Ca and Mn was observed in beech, and P in spruce in the 280
beginning of the decomposition process (Fig. S2). 281
In the exponential stage litter, (month 15, 19 and 29) contents of Catot, Mntot and pH were 282
significantly higher for BL, while Fetot, Few, Ptot, S, N were significantly higher for SL (Table S2 A). Yet, 283
most of the studied chemical parameters (NO3-w, NO2
-w, SO4
2-w, PO4
3-w, Cl-
w, F-w, NH4
+w, K+
w, Mg2+w, 284
Na+w, Ca2+
w, lactate w, acetate w, formate w, oxalate w, Pw, Alw, Altot, Mnw, Caw, Kw, Ktot, DOC, HIX) did 285
not significantly differ between the two litter types throughout the experiment (Table S2 A). 286
287
3.4. Microbial characteristics 288
Abundances of bacteria (16S rRNA gene copies) and fungi (ITS region gene copies) did not 289
significantly differ between BL and SL in months 15, 19 and 29 of decomposition (Table S2 A) but 290
composition of bacterial communities (Illumina MiSeq) differed significantly between BL and SL (Table 291
S4). 292
More specifically, the bacterial community composition was analyzed using a total of 665,606 16S 293
rRNA gene sequence reads were mapped to 2052 OTUs. Bacterial communities were represented by 294
highest proportions of Proteobacteria, followed by Actinobacteria, Firmicutes, Acidobacteria and 295
Bacteroidetes on BL and by Actinobacteria, followed by Proteobacteria, Acidobacteria, Firmicutes and 296
Bacteroidetes on SL (Fig. 2). Proportions of Acidobacteria, Actinobacteria, Bacteroidetes, Firmicutes, 297
Patescibacteria and Proteobacteria significantly differed between BL and SL (Table S4.) 298

16
Fig. 2. Average proportions of phyla in the bacterial 16S rRNA gene amplicon sequence libraries on beech 299
(B) and spruce (S) litter (n = 3) in different sampled time points. 300
301
Proportions of Proteobacteria families Acetobacteraceae and Burkholderiaceae were higher on 302
SL than on BL, while Bradyrhizobiaceae and unclassified Gammaproteobacteria were higher on BL than 303
on SL (Fig. S3). Proportions of all Actinobacteria families were higher on SL than on BL (Fig. S4). 304
Highest proportions of Solirubrobacteraceae, followed by Trebon clade, Mycobacteriaceae, were found 305
on both litter types, but proportionally lower were on BL (Fig. S4). Proportions of Firmicutes families 306
decreased in the following period with both litter types, while they were overall higher (especially in 307
month 15 and in month 29) on BL than on SL. The family Bacillaceae 1 followed by Bacillaceae 2, 308
Paenibacillaceae 1 and unclassified Bacillales dominated on BL, while Alicyclobacillaceae dominated 309
on SL (Fig. S5). 310
The phylogenetic tree was built from 839 OTUs differing significantly between communities 311
associated with SL and BL (Metastats, p < 0.05). Out of those, proportions of 294 OTUs were higher on 312
B15 B19 B29 S15 S19 S29 0
20
40
60
80
100
unclassified otherGemmatimonadetes Armatimonadetes Chloroflexi Parcubacteria Chlamydiae Planctomycetes Cand. SaccharibacteriaVerrucomicrobia Bacteroidetes Acidobacteria Firmicutes Proteobacteria Actinobacteria
Litter type, months
Pro
port
ion in the lib
rary
[%
]

17
SL and 545 OTUs on BL. OTUs corresponding to Actinobacteria, Acidobacteria, Firmicutes and Cand. 313
Saccharibacteria were proportionally higher on SL, while Proteobacteria, Bacteroidetes, 314
Verrucomicrobia, Planctomycetes and Parcubacteria on BL (Fig. 3). 315
Fig. 3. Phylogenetic tree of OTUs that significantly differed between the communities associated with 316
beech (yellow) and spruce (green) litter after 15, 19 and 29 months of decomposition (Metastats, p < 0.05, 317
n = 9). The phylogeny was inferred by maximum likelihood analysis of representative sequences of each 318
OTU. 319
320
Changes in the composition of bacterial communities showed that higher number of OTUs 321
significantly contributing to differences between months 15 and 29 were found on BL (Metastats, p < 322
0.05, Fig. 4). The number of OTUs significantly contributing to differences between litter types was the 323
highest in month 29 and the lowest in month 19 (Metastats, p < 0.05). Rarefaction curves demonstrated 324
Actinobacteria
Firmicutes
Acidobacteria
α
γ
β
δ
Planctomycetes
Verrucomicrobia
Cand.
Saccharibacteria
Bacteroidetes
Parcubacteria

18
that bacterial diversity was higher for the BL than the SL in months 15 and 19 (Fig. S6).325
326
Heat maps (supported by Metastats) showed differences between BL and SL between months 15 327
and 29 (Table S5 A, B). On BL proportions of 155 OTUs differed (Metastats, p < 0.05), out of which 123 328
OTUs proportions increased and 32 OTUs decreased. On SL, proportions of only 67 OTUs differed, out329
of which 30 increased and 37 decreased during that period. The most abundant bacterial groups separating 330
samples from month 15 and month 29 were on BL especially Actinobacteria, Proteobacteria, 331
Acidobacteria, Verrucomicrobia, Bacteroidetes, Firmicutes and WPS-2 (Table S5 A), while on SL it was 332
Acidobacteria, Actinobacteria, Proteobacteria, Patescibacteria and Firmicutes (Table S5 B). 333
Fig. 4. Changes of composition of bacterial communities during plant litter decomposition on beech (B, 334
yellow circle) and spruce (S, green triangle) after months 15, 19 and 29 assayed by Illumina amplicon 335
sequencing. Numbers indicate the OTUs significantly contributing to the difference between samples in 336
pairwise comparison (Metastats, p < 0.05, n = 3).337
3.5. NMDS analysis338
NMDS distinguished bacterial communities into two groups corresponding to BL and SL (Fig. 5). 339
The bacterial community on BL most strongly positively correlated to DOC, oxalate, K w, followed by 340
A254, Mntot, pH, Catot, Ca w, Mg2+w and bacterial diversity (Fig. 5). The bacterial community on SL most 341

19
strongly positively correlated to Ptot, followed by Fe w, Ntot, Stot, Fetot (Fig. 5). 342
Composition of bacterial communities at both sites significantly correlated to pH, Catot, Ca2+w, 343
Mg2+w, Fetot, Few, Mnw, Mntot, Ptot, PO4
3-w, Ktot, K
+w, Ntot, Stot, Altot, DOC, A254, Acetate w, Oxalate w, HIX, 344
mass loss and bacterial diversity (Table S6).345
346
Fig. 5. Sammon’s projection showing distance and relationship between bacterial communities on beech 347
(yellow circle) and spruce (green triangle) after months 15 (full symbol), 19 (empty symbol outlined by a 348
thick line) and 29 (empty symbol outlined by a thin line) of decomposition. Linear vectors represent 349
chemical and microbiological variables significantly correlating with the structure of bacterial community 350
(p < 0.001 red vectors; 0.001 < p < 0.01 blue vectors; 0.01 < p <0.05 grey vectors). A254 indicates 351
aromaticity, HIX humification index and DOC dissolved organic carbon.352
353
354
−0.5 0 0.5
−0.5
00.5
1.0
Dim 1
Dim
2
B1
B2
B3
B4
B5
B6
B7
B8
B9
S1
S2S3
S4
S5
S6
S7 S8
S9
div
pH
Mg2+w
Ca2+w
Few
Altot
Catot
Fetot
Mntot
Ntot
Stot
A254
bacterial
diversity
Kw
Ptot
DOCOxalate

20
4. Discussion 355
Abundances of bacteria and fungi did not differ between beech (BL) and spruce litter (SL) but 356
different bacterial communities were established on the two litter types after 15, 19 and 29 months of 357
decomposition, when it reached the exponential stage. The litter mainly differed by the length of time to 358
reach the exponential stage but also by chemistry of litter and its changes over the following period. That 359
complied with previous findings that the succession of bacterial communities rather than abundance 360
reflected chemical differences between litter types [50,51] and that this was transferred to situations of the 361
later decomposition stage [52,53]. 362
More specifically, beech was typical by accumulation of Ca and Mg in leaves, which led to 363
concentration of those elements in shallow soil layers and consequently to improvement of soil quality. 364
That activity is called the base-pump strategy, which describes how trees selectively uptake certain 365
nutrients from lower horizons by their roots and via litter fall increase their concentration in top soil 366
horizons [5]. In contrast, spruce needles accumulated N and S, which probably originated in anthropogenic 367
acidification (in form of HNO3- and SO4
2-,respectively) occurring in the past [16]. Also, the fresh needles 368
were enriched in Fe and Al, possibly due to preferential uptake of those elements from the granite bedrock 369
by spruce [21,54]. 370
On beech litter, bacterial communities were most strongly correlated to DOC, oxalate and Kw. 371
Total DOC increased after the initial stage of decomposition and exposed higher degree of aromatic 372
compounds (A254) [12]. Therefore, the correlation of BL community to DOC demonstrates the litter 373
degradability, which enables microbes to utilize released C specific to a given stage of decomposition. 374
The positive correlation between LMMOA (low molecular mass organic acids), especially oxalate and 375
Ca2+ to BL community can be explained by microbe solubilization of Ca from poorly dissolved 376
biominerals e.g. calcium oxalate [55]. Additionally, BL bacterial community correlation to Mntot may 377

21
reflect the activity of manganese peroxidase, since Mn2+ is an essential component of this ligninolytic 378
enzyme [4,9]. The positive relationship of organic compounds such as DOC, A254 and LMMOA with the 379
BL community together with higher weight loss supports the observed more complete decomposition of 380
this substrate and confirms that BL was subjected to a more advanced stage of decay probably entering 381
the exponential stage of decomposition [15]. 382
On spruce litter, a positive relationship of SL bacterial community to P, Fe, N and S showed that 383
these elements were not only higher there but also available to bacterial inhabitants. More precisely, P 384
was probably not precipitated by basic cations as it happened in the BL [17] and was intensively depleted 385
from SL over time. Similarly, Fe often occurs in organo-mineral complexes [56] or complexes with P-386
PO43- [57], which are resistant to degradation. However, the correlation of SL community to both Fe and 387
P suggests that the community may be enriched with bacteria, which can solubilize those complexes 388
possibly using organic acids or siderophores [58]. It is typical for activities of Actinobacteria, which 389
indeed dominated SL. A positive correlation to N may reflect either increased N litter concentration or 390
possibly also N fixation by specialized bacteria [59]. Nitrogen and P typically promote decomposition in 391
earlier stages, and thus their relatively high content may enable a gradual shift of SL into the exponential 392
decomposition stage, which was already partially noticeable [10]. Above that, N together with S belong 393
among the main agents causing soil acidification and thus, might explain the community shift towards 394
acidophilic taxa, such as a proportional increase of Acidobacteria [16,18]. 395
Interestingly, no effect of Al on bacterial communities was determined on either litter type, 396
suggesting that bacterial communities may be protected from its toxicity by three different processes; i.e. 397
while acidic SL might release Al to lower organic horizons, Al on BL might be bound by cations, inorganic 398
anions (SO42-, F-) and organic compounds (e.g. fulvic acid, DOC and organic acids) [60,61], which 399
function as natural complexation agents eliminating Al toxicity [3] or that the bacteria are adapted by 400

22
resistance developed over the time of exposure [62]. 401
Differing content and availability of nutrients of the two litter types corresponded to bacterial 402
functional groups represented by typical taxa. Proteobacteria, Bacteroidetes, Verrucomicrobia dominated 403
on BL. Especially, Betaproteobacteria and Bacteroidetes are considered r-selected, preferentially utilizing 404
easily accessible substrates in balanced environment [63]. SL was typical by higher proportion of 405
Actinobacteria, Acidobacteria and Firmicutes. Actinobacteria and Firmicutes are typical K-selected litter 406
decomposers [64] and Acidobacteria are a group, which preferentially inhabits low pH forest soils [18,65]. 407
The most pronounced differences between the communities on the two studied litter types were 408
found in Firmicutes, of which Bacillaceae and Paenibacilaceae had higher proportions on BL, while 409
Alicyclobacilales dominated on SL. Out of those, Bacilli and Paenibacilli are highly abundant in organic 410
soil horizons, where they participate at decomposition of calcareous substrates. They are also involved in 411
the N cycle, including N fixation and P solubilization in soil [66]. In comparison, the family 412
Alicyclobacilaceae suggests shifting of the SL community towards acidophilic members since its 413
members were described as thermo-acidophilic [67]. However, Bacillaceae as well as Alicyclobacilaceae 414
significantly decrease over the exponential stage on BL and SL suggesting a correlation with nutrients 415
typical for each litter type. 416
Other important exponential stage decomposers were Actinobacteria. Actinobacteria may promote 417
availability of some limiting nutrients because they produce an array of enzymes, organic acids and 418
siderophores, which participate in solubilization of organic matter and soil complexes [68]. In particular, 419
a higher proportion of Solirubrobacteraceae was observed on SL and they belong among plant growth 420
promoting bacteria [69]. Additionally, Trebon clade, a new clade of Actinobacteria occurring in acidic 421
soils [70] had higher relative abundance on SL. 422
The different modes of pedogenesis observed under spruce or beech [16] resulted from both litter 423

23
chemistry and bacterial community composition, which together provide a particular potential for 424
decomposing activities and explain the diverging decomposition rates [71]. Furthermore, on the BL, 425
higher litter Catot positively correlated to soluble C, C turnover and diversity of soil microbes, which may 426
further improve the development of soil horizons [72]. In contrast, SL with lower amounts of Mn and Ca, 427
higher amounts of Fetot, Stot, Ntot and Ptot and low pH, reduced the rate of microbial decomposition, 428
resulting in higher accumulation of lower quality litter in the soil. More specifically, lower pH in SL can 429
lead to increased mobility of Al, Mn and Fe, which leach from the L horizon to deeper parts of soil profile 430
causing the differentiation of soil profiles – creating podzol (e.g. Sauer et al. [73]). It has been observed 431
previously that even small differences between the quality of humus and soil chemistry (pH) led to 432
increasing podsolization process in cambisols [74]. Similar observation was previously reported from the 433
Giant Mountains (Czechia) [75]. Thus, soils with different characteristics are developed under the two 434
tree species and their different microbial communities and decomposition rate may have consequences in 435
the stability and resilience of beech and spruce forests. 436
437
5. Conclusions 438
Our study compared the litter decomposition rate of beech litter (BL) and spruce litter (SL). The 439
BL displayed lower C accumulation and higher release of aromatic DOC after 15, 19 and 29 months of 440
decomposition, while SL showed lower pH and higher amount of Fe, S, N and P, resulting in accumulation 441
of organic matter and thus, C sequestration in the soil. 442
The BL had the lag-time of decomposition delayed until month 15 but after that period the 443
decomposition was relatively fast and supported by readily available compounds, while promoting the 444
growth of r-selected taxa. On the contrary, SL was described as an oligotrophic environment typical with 445

24
K-selected taxa, which together with acidic conditions caused that the SL substrate to remain in the lag-446
phase during the entire experiment. 447
The litter chemical quality and specific decomposition pathways determined by the presence of 448
soil microorganisms with different life strategies lead to a consequent transformation of litter to humus 449
with different quality in beech and spruce forests. Finally, that process results to the development of soils, 450
which undergo podsolization under spruce but not beech. 451
6. Funding 452
Research was supported by the Czech University of Life Sciences Prague (internal project n. 453
21130/1312/3131), Ministry of Education, Youth and Sports of the CR (projects No. 454
CZ.02.1.01/0.0/0.0/16_019/0000845 and LTC17075), Czech Science Foundation (grant no. 15-01312S), 455
and Ministry of Agriculture of the CR (Institutional Project RO 0418). 456

25
References 457
[1] K.C. Rice, J.S. Herman, Acidification of Earth: An assessment across mechanisms and scales, Appl. 458
Geochemistry. 27 (2012) 1–14. https://doi.org/10.1016/J.APGEOCHEM.2011.09.001. 459
[2] T. Fukami, I.A. Dickie, J. Paula Wilkie, B.C. Paulus, D. Park, A. Roberts, P.K. Buchanan, R.B. 460
Allen, Assembly history dictates ecosystem functioning: evidence from wood decomposer 461
communities, Ecol. Lett. 13 (2010) 675–684. https://doi.org/10.1111/j.1461-0248.2010.01465.x. 462
[3] L. Borůvka, A. Nikodem, O. Drábek, P. Vokurková, V. Tejnecký, L. Pavlů, Assessment of soil 463
aluminium pools along three mountainous elevation gradients, J. Inorg. Biochem. 103 (2009) 1449–464
1458. https://doi.org/10.1016/j.jinorgbio.2009.07.022. 465
[4] B. Berg, Litter decomposition and organic matter turnover in northern forest soils, For. Ecol. 466
Manage. 133 (2000) 13–22. https://doi.org/10.1016/S0378-1127(99)00294-7. 467
[5] G. van der Heijden, E. Dambrine, B. Pollier, B. Zeller, J. Ranger, A. Legout, Mg and Ca uptake by 468
roots in relation to depth and allocation to aboveground tissues: results from an isotopic labeling 469
study in a beech forest on base-poor soil, Biogeochemistry. 122 (2015) 375–393. 470
https://doi.org/10.1007/s10533-014-0047-2. 471
[6] Z. Wang, A. Gottlein, G. Bartonek, Effects of growing roots of Norway spruce and European beech 472
on rhizosphere soil solution chemistry, J. Plant Nutr. Soil Sci. 164 (2001) 35–41. 473
[7] J. Rousk, S.D. Frey, Revisiting the hypothesis that fungal-to-bacterial dominance characterizes 474
turnover of soil organic matter and nutrients, Ecol. Monogr. 85 (2015) 457–472. 475
https://doi.org/10.1890/14-1796.1. 476
[8] A. Bani, S. Pioli, M. Ventura, P. Panzacchi, L. Borruso, R. Tognetti, G. Tonon, L. Brusetti, The 477
role of microbial community in the decomposition of leaf litter and deadwood, Appl. Soil Ecol. 126 478
(2018) 75–84. www.elsevier.com/locate/apsoil (accessed April 10, 2018). 479

26
[9] B. Berg, B. Erhagen, M.-B. Johansson, M. Nilsson, J. Stendahl, F. Trum, L. Vesterdal, Manganese 480
in the litter fall-forest floor continuum of boreal and temperate pine and spruce forest ecosystems - 481
A review, For. Ecol. Manage. 358 (2015) 248–260. https://doi.org/10.1016/j.foreco.2015.09.021. 482
[10] X. Ge, L. Zeng, W. Xiao, Z. Huang, X. Geng, B. Tan, Effect of litter substrate quality and soil 483
nutrients on forest litter decomposition: A review, Acta Ecol. Sin. 33 (2013) 102–108. 484
https://doi.org/10.1016/j.chnaes.2013.01.006. 485
[11] P.M. Vitousek, S. Porder, B.Z. Houlton, O.A. Chadwick, Terrestrial phosphorus limitation: 486
mechanisms, implications, and nitrogen–phosphorus interactions, Ecol. Appl. 20 (2010) 5–15. 487
https://doi.org/10.1890/08-0127.1. 488
[12] S.L. Mosier, E.S. Kane, D.L. Richter, E.A. Lilleskov, M.F. Jurgensen, A.J. Burton, S.C. Resh, 489
Interactive effects of climate change and fungal communities on wood-derived carbon in forest 490
soils, Soil Biol. Biochem. 115 (2017) 297–309. https://doi.org/10.1016/J.SOILBIO.2017.08.028. 491
[13] A. Don, K. Kalbitz, Amounts and degradability of dissolved organic carbon from foliar litter at 492
different decomposition stages, Soil Biol. Biochem. 37 (2005) 2171–2179. 493
https://doi.org/10.1016/J.SOILBIO.2005.03.019. 494
[14] B. Berg, A.V. De Santo, F.A. Rutigliano, A. Fierro, G. Ekbohm, Limit values for plant litter 495
decomposing in two contrasting soils - Influence of litter elemental composition, Acta Oecologica. 496
24 (2003) 295–302. https://doi.org/10.1016/j.actao.2003.08.002. 497
[15] M. Kleber, P.S. Nico, A. Plante, T. Filley, M. Kramer, C. Swanston, P. Sollins, Old and stable soil 498
organic matter is not necessarily chemically recalcitrant: Implications for modeling concepts and 499
temperature sensitivity, Glob. Chang. Biol. 17 (2011) 1097–1107. 500
https://escholarship.org/content/qt8q25s86p/qt8q25s86p.pdf (accessed October 2, 2018). 501

27
[16] V. Tejnecký, M. Bradová, L. Borůvka, K. Němeček, O. Šebek, A. Nikodem, J. Zenáhlíková, J. 502
Rejzek, O. Drábek, Profile distribution and temporal changes of sulphate and nitrate contents and 503
related soil properties under beech and spruce forests, Sci. Total Environ. 442 (2013) 165–171. 504
https://doi.org/10.1016/j.scitotenv.2012.10.053. 505
[17] V. Tejnecky, N. Rerichova, M. Brandova, K. Nemecek, H. Santruckova, C. Ash, O. Drabek, Litter 506
decomposition as a source of active phosphates in spruce and beech mountainous forests affected 507
by acidification, Procedia Earth Planet. Sci. 10 (2014) 130–132. 508
https://doi.org/10.1016/j.proeps.2014.08.043. 509
[18] S. Lladó, R. López-Mondéjar, P. Baldrian, Forest Soil Bacteria: Diversity, Involvement in 510
Ecosystem Processes, and Response to Global Change, Microbiol. Mol. Biol. Rev. 81 (2017) 511
e00063-16. https://doi.org/10.1128/MMBR.00063-16. 512
[19] V. Tlaskal, J. Voříškova, P. Baldrian, Bacterial succession on decomposing leaf litter exhibits a 513
specific occurrence pattern of cellulolytic taxa and potential decomposers of fungal mycelia, FEMS 514
Microbiol. Ecol. 92 (2016) fiw177. https://doi.org/10.1093/femsec/fiw177. 515
[20] A. Buresova, J. Kopecky, V. Hrdinkova, Z. Kamenik, M. Omelka, M. Sagova-Mareckova, 516
Succession of microbial decomposers is designated by litter type, but site conditions drive 517
decomposition rates., Appl. Environ. Microbiol. (2019). https://doi.org/10.1128/AEM.01760-19. 518
[21] J. Chaloupsky, J. Cervenka, J. Jetel, F. Kralik, J. Libalova, E. Pichova, J. Pokorný, K. Posmourny, 519
J. Sekyra, O. Shrbeny, K. Salansky, J. Sramek, J. Vacl, Geologie Krkonos a Jizerskych hor, 1., 520
Moravske tiskarske zavody, 1989. 521
[22] I.W.G. WRB, World reference base for soil resources 2006, World Soil Resour. Reports. 103 522
(2006). http://www.fao.org (accessed February 11, 2019). 523

28
[23] M. Bradová, V. Tejnecký, L. Borůvka, K. Němeček, C. Ash, O. Šebek, M. Svoboda, J. Zenáhlíková, 524
O. Drábek, The variations of aluminium species in mountainous forest soils and its implications to 525
soil acidification, Environ. Sci. Pollut. Res. 22 (2015) 16676–16687. 526
https://doi.org/10.1007/s11356-015-4855-2. 527
[24] Czech Hydrometeorogical Institute, Historical data - Territorial air temperature and precipitation, 528
(n.d.). http://portal.chmi.cz/historicka-data/pocasi/zakladni-informace?l=en. 529
[25] N. Cools, B. De Vos, Sampling and Analysis of Soil. In: UNECE ICP Forests Programme 530
Coordinating Centre (ed.): Manual on methods and criteria for harmonized sampling, assessment, 531
monitoring and analysis of the effects of air pollution on forests, Thünen Institute of Forest 532
Ecosystems, Eberswalde, Germany, 2016. https://doi.org/10.1063/1.2761021. 533
[26] P. Hubova, V. Tejnecky, C. Ash, L. Boruvka, O. Drabek, Low-Molecular-Mass Organic Acids in 534
the Forest Soil Environment, Mini. Rev. Org. Chem. 14 (2017) 75–84. 535
https://www.ingentaconnect.com/contentone/ben/mroc/2017/00000014/00000001/art00010 536
(accessed October 3, 2018). 537
[27] L.X. Zhou, J.W.C. Wong, Microbial Decomposition of Dissolved Organic Matter and Its Control 538
during a Sorption Experiment, J. Environ. Qual. 29 (2000) 1852. 539
https://doi.org/10.2134/jeq2000.00472425002900060017x. 540
[28] T. Ohno, Fluorescence inner-filtering correction for determining the humification index of 541
dissolved organic matter, Environ. Sci. Technol. 36 (2002) 742–746. 542
https://doi.org/10.1021/es0155276. 543
[29] R Core Team, R Core Team, R : A language and environment for statistical computing., R Found. 544
Stat. Comput. Vienna, Austria. (2018) R Foundation for Statistical Computing. 545

29
[30] M. Sagova-Mareckova, L. Cermak, J. Novotna, K. Plhackova, J. Forstova, J. Kopecky, Innovative 546
methods for soil DNA purification tested in soils with widely differing characteristics, Appl. 547
Environ. Microbiol. 74 (2008) 2902–2907. https://doi.org/10.1128/AEM.02161-07. 548
[31] C. Quast, E. Pruesse, P. Yilmaz, J. Gerken, T. Schweer, P. Yarza, J. Peplies, F.O. Glöckner, The 549
SILVA ribosomal RNA gene database project: improved data processing and web-based tools, 550
Nucleic Acids Res. 41 (2012) D590–D596. https://doi.org/10.1093/nar/gks1219. 551
[32] T. Rognes, T. Flouri, B. Nichols, C. Quince, F. Mahé, VSEARCH: a versatile open source tool for 552
metagenomics, PeerJ. 4 (2016) e2584. https://doi.org/10.7717/peerj.2584. 553
[33] J.J. Kozich, S.L. Westcott, N.T. Baxter, S.K. Highlander, P.D. Schloss, Development of a dual-554
index sequencing strategy and curation pipeline for analyzing amplicon sequence data on the miseq 555
illumina sequencing platform, Appl. Environ. Microbiol. 79 (2013) 5112–5120. 556
https://doi.org/10.1128/AEM.01043-13. 557
[34] P.D. Schloss, S.L. Westcott, T. Ryabin, J.R. Hall, M. Hartmann, E.B. Hollister, R.A. Lesniewski, 558
B.B. Oakley, D.H. Parks, C.J. Robinson, J.W. Sahl, B. Stres, G.G. Thallinger, D.J. Van Horn, C.F. 559
Weber, Introducing mothur: Open-source, platform-independent, community-supported software 560
for describing and comparing microbial communities, Appl. Environ. Microbiol. 75 (2009) 7537–561
7541. https://doi.org/10.1128/AEM.01541-09. 562
[35] P. Yilmaz, L.W. Parfrey, P. Yarza, J. Gerken, E. Pruesse, C. Quast, T. Schweer, J. Peplies, W. 563
Ludwig, F.O. Glöckner, The SILVA and “all-species Living Tree Project (LTP)” taxonomic 564
frameworks, Nucleic Acids Res. 42 (2014) 643–648. https://doi.org/10.1093/nar/gkt1209. 565
[36] R.C. Edgar, UPARSE: highly accurate OTU sequences from microbial amplicon reads, Nat. 566
Methods. 10 (2013) 996–998. https://doi.org/10.1038/nmeth.2604. 567

30
[37] L. Čermák, J. Kopecký, J. Novotná, M. Omelka, N. Parkhomenko, K. Plháčková, M. Ságová-568
Marečková, Bacterial communities of two contrasting soils reacted differently to lincomycin 569
treatment, Appl. Soil Ecol. 40 (2008) 348–358. https://doi.org/10.1016/j.apsoil.2008.06.001. 570
[38] M. Sakai, A. Matsuka, T. Komura, S. Kanazawa, Application of a new PCR primer for terminal 571
restriction fragment length polymorphism analysis of the bacterial communities in plant roots, J. 572
Microbiol. Methods. 59 (2004) 81–89. https://doi.org/10.1016/J.MIMET.2004.06.005. 573
[39] M. Gardes, T.D. Bruns, ITS primers with enhanced specificity for basidiomycetes - application to 574
the identification of mycorrhizae and rusts, Mol. Ecol. 2 (1993) 113–118. 575
https://doi.org/10.1111/j.1365-294X.1993.tb00005.x. 576
[40] T.J. White, T. Bruns, S. Lee, J.W. Taylor, Amplification and direct sequencing of fungal ribosomal 577
RNA genes for phylogenetics, Acad. Press. Inc., New York. (1990) 315–322. 578
https://scholar.google.cz/scholar?hl=cs&as_sdt=0%2C5&q=White+TJ%2C+Bruns+T%2C+Lee+579
S+%26+Taylor+J+%281990%29+PCR+protocols.+Amplification+and+Direct+Sequencing+of+580
Fungal+Ribosomal+RNA+Genes+for+Phylogenetics+%28Innins+MA%2C+Gelfand+DH%2C+S581
ninsky+JJ+%26+Whi (accessed February 5, 2019). 582
[41] B.L. Welch, On the comparison of several mean values: an alternative approach, Biometrika. 38 583
(1951) 330–336. https://doi.org/10.1093/biomet/38.3-4.330. 584
[42] A.P. Martin, Phylogenetic Approaches for Describing and Comparing the Diversity of Microbial 585
Communities, DNA Seq. 68 (2002) 3673–3682. https://doi.org/10.1128/AEM.68.8.3673. 586
[43] J.R. White, N. Nagarajan, M. Pop, Statistical methods for detecting differentially abundant features 587
in clinical metagenomic samples., PLoS Comput. Biol. 5 (2009) e1000352. 588
https://doi.org/10.1371/journal.pcbi.1000352. 589

31
[44] M.N. Price, P.S. Dehal, A.P. Arkin, FastTree 2 - Approximately maximum-likelihood trees for 590
large alignments, PLoS One. 5 (2010) e9490. https://doi.org/10.1371/journal.pone.0009490. 591
[45] I. Letunic, P. Bork, Interactive tree of life (iTOL) v3: an online tool for the display and annotation 592
of phylogenetic and other trees, Nucleic Acids Res. 44 (2016) W242–W245. 593
https://doi.org/10.1093/nar/gkw290. 594
[46] W.N. Venables, B.D. Ripley, Random and Mixed Effects, in: Mod. Appl. Stat. with S. Springer, 595
New York, NY, Springer, New York, NY, 2002: pp. 271–300. https://doi.org/10.1007/978-0-387-596
21706-2_10. 597
[47] B. Ripley, B. Venables, D.M. Bates, K. Hornik, A. Gebhardt, D. Firth, Package “MASS,” 2019. 598
http://www.stats.ox.ac.uk/pub/MASS4/ (accessed April 2, 2020). 599
[48] J. Oksanen, F.G. Blanchet, M. Friendly, R. Kindt, P. Legendre, D. Mcglinn, P.R. Minchin, R.B. 600
O’hara, G.L. Simpson, P. Solymos, M. Henry, H. Stevens, E. Szoecs, H.W. Maintainer, Package 601
“vegan” Title Community Ecology Package Version 2.5-6, 2019. 602
[49] J. Oksanen, F.G. Blanchet, M. Friendly, R. Kindt, P. Legendre, D. Mcglinn, P.R. Minchin, R.B. 603
O’hara, G.L. Simpson, P. Solymos, M. Henry, H. Stevens, E. Szoecs, H.W. Maintainer, Package 604
“vegan” Title Community Ecology Package, 2018. 605
https://cran.ism.ac.jp/web/packages/vegan/vegan.pdf (accessed October 5, 2018). 606
[50] J.C. Frankland, Fungal succession — unravelling the unpredictable, Mycol. Res. 102 (1998) 1–15. 607
https://doi.org/10.1017/S0953756297005364. 608
[51] M. Sauvadet, M. Chauvat, D. Cluzeau, P.A. Maron, C. Villenave, I. Bertrand, The dynamics of soil 609
micro-food web structure and functions vary according to litter quality, Soil Biol. Biochem. 95 610
(2016) 262–274. https://doi.org/10.1016/j.soilbio.2016.01.003. 611

32
[52] T. Fukami, Historical Contingency in Community Assembly: Integrating Niches, Species Pools, 612
and Priority Effects, Annu. Rev. Ecol. Evol. Syst. 46 (2015) 1–23. https://doi.org/10.1146/annurev-613
ecolsys-110411-160340. 614
[53] L.C. Cline, D.R. Zak, Initial colonization, community assembly and ecosystem function: fungal 615
colonist traits and litter biochemistry mediate decay rate, Mol. Ecol. 24 (2015) 5045–5058. 616
https://doi.org/10.1111/mec.13361. 617
[54] J. Kratina, Rozdíly Ve Vlastnostech Horských Lesních Půd Na Kyselých a Bazických Matečních 618
Horninách, Geol. Výzkumy Na Moravě a ve Slezsku. 17 (2010). 619
[55] J.M. Dauer, S.S. Perakis, Calcium oxalate contribution to calcium cycling in forests of contrasting 620
nutrient status, For. Ecol. Manage. 334 (2014) 64–73. 621
https://doi.org/10.1016/J.FORECO.2014.08.029. 622
[56] J.P. Boudot, A.B. Hadj, R. Steiman, F. Seigle-Murandi, Biodegradation of synthetic organo-623
metallic complexes of iron and aluminium with selected metal to carbon ratios, Soil Biol. Biochem. 624
21 (1989) 961–966. https://doi.org/10.1016/0038-0717(89)90088-6. 625
[57] F. Lang, J. Bauhus, E. Frossard, E. George, K. Kaiser, M. Kaupenjohann, J. Krüger, E. Matzner, 626
A. Polle, J. Prietzel, H. Rennenberg, N. Wellbrock, Phosphorus in forest ecosystems: New insights 627
from an ecosystem nutrition perspective, J. Plant Nutr. Soil Sci. 179 (2016) 129–135. 628
https://doi.org/10.1002/jpln.201500541. 629
[58] R.C. Hider, X. Kong, Chemistry and biology of siderophores, Nat. Prod. Rep. 27 (2010) 637–657. 630
https://doi.org/10.1039/b906679a. 631

33
[59] D. Finn, K. Page, K. Catton, E. Strounina, M. Kienzle, F. Robertson, R. Armstrong, R. Dalal, Effect 632
of added nitrogen on plant litter decomposition depends on initial soil carbon and nitrogen 633
stoichiometry, Soil Biol. Biochem. 91 (2015) 160–168. 634
https://doi.org/10.1016/J.SOILBIO.2015.09.001. 635
[60] O. Drábek, I. Kipkoech Kiplagat, M. Komárek, V. Tejnecký, L. Borůvka, Study of Interactions 636
between Relevant Organic Acids and Aluminium in Model Solutions Using HPLC and IC, Orig. 637
Pap. Soil Water Res. 10 (2015) 172–180. https://doi.org/10.17221/256/2014-SWR. 638
[61] O. Drabek, L. Mladkova, L. Boruvka, J. Szakova, A. Nikodem, K. Nemecek, Comparison of water-639
soluble and exchangeable forms of Al in acid forest soils, in: J. Inorg. Biochem., Elsevier Inc., 640
2005: pp. 1788–1795. https://doi.org/10.1016/j.jinorgbio.2005.06.024. 641
[62] R. Garciduefias Pifia, C. Cervantes, Microbial interactions with aluminium, Bio Met. 9 (1996) 311–642
316. 643
[63] L. Philippot, S.G.E. Andersson, T.J. Battin, J.I. Prosser, J.P. Schimel, W.B. Whitman, S. Hallin, 644
The ecological coherence of high bacterial taxonomic ranks, Nat. Rev. Microbiol. 8 (2010) 523–645
529. https://doi.org/10.1038/nrmicro2367. 646
[64] F. Bastian, L. Bouziri, B. Nicolardot, L. Ranjard, Impact of wheat straw decomposition on 647
successional patterns of soil microbial community structure, Soil Biol. Biochem. 41 (2009) 262–648
275. https://www.sciencedirect.com/science/article/pii/S0038071708003696 (accessed April 20, 649
2018). 650
[65] M. Štursová, L. Žifčáková, M.B. Leigh, R. Burgess, P. Baldrian, Cellulose utilization in forest litter 651
and soil: identification of bacterial and fungal decomposers, FEMS Microbiol. Ecol. 80 (2012) 735–652
746. https://doi.org/10.1111/j.1574-6941.2012.01343.x. 653

34
[66] I. Mandic-Mulec, P. Stefanic, J. Van Elsas, Ecology of Bacillaceae, Bact. Spore from Mol. to Syst. 654
(2015) 59–85. https://doi.org/10.1128/microbiolspec.TBS-0017-2013. 655
[67] E. Ciuffreda, A. Bevilacqua, M. Sinigaglia, M. Corbo, E. Ciuffreda, A. Bevilacqua, M. Sinigaglia, 656
M.R. Corbo, Alicyclobacillus spp.: New Insights on Ecology and Preserving Food Quality through 657
New Approaches, Microorganisms. 3 (2015) 625–640. 658
https://doi.org/10.3390/microorganisms3040625. 659
[68] W. Wang, Z. Qiu, H. Tan, L. Cao, Siderophore production by actinobacteria, BioMetals. 27 (2014) 660
623–631. https://doi.org/10.1007/s10534-014-9739-2. 661
[69] I.H. Franke-Whittle, L.M. Manici, H. Insam, B. Stres, Rhizosphere bacteria and fungi associated 662
with plant growth in soils of three replanted apple orchards, Plant Soil. 395 (2015) 317–333. 663
https://doi.org/10.1007/s11104-015-2562-x. 664
[70] J. Kopecky, M. Kyselkova, M. Omelka, L. Cermak, J. Novotna, G.L. Grundmann, Y. Moënne-665
Loccoz, M. Sagova-Mareckova, Actinobacterial community dominated by a distinct clade in acidic 666
soil of a waterlogged deciduous forest, FEMS Microbiol. Ecol. 78 (2011) 386–394. 667
https://doi.org/10.1111/j.1574-6941.2011.01173.x. 668
[71] J.A.J. Dungait, D.W. Hopkins, A.S.. Gregory, A.P. Whitmore, Soil organic matter turnover is 669
governed by accessibility not recalcitrance, Glob. Chang. Biol. 18 (2012) 1781–1796. 670
https://doi.org/10.1111/j.1365-2486.2012.02665.x. 671
[72] J. Frouz, V. Jílková, T. Cajthaml, V. Pižl, K. Tajovský, L. Háněl, A. Burešová, H. Šimáčková, K. 672
Kolaříková, J. Franklin, J. Nawrot, J.W. Groninger, P.D. Stahl, Soil biota in post-mining sites along 673
a climatic gradient in the USA: Simple communities in shortgrass prairie recover faster than 674
complex communities in tallgrass prairie and forest, Soil Biol. Biochem. 67 (2013). 675
https://doi.org/10.1016/j.soilbio.2013.08.025. 676

35
[73] D. Sauer, H. Sponagel, M. Sommer, L. Giani, R. Jahn, K. Stahr, Podzol: Soil of the year 2007. A 677
review on its genesis, occurrence, and functions, J. Plant Nutr. Soil Sci. 170 (2007) 581–597. 678
https://doi.org/10.1002/jpln.200700135. 679
[74] V. Brahy, H. Titeux, B. Delvaux, Incipient podzolization and weathering caused by complexation 680
in a forest Cambisol on loess as revealed by a soil solution study, Eur. J. Soil Sci. 51 (2000) 475–681
484. https://doi.org/10.1046/j.1365-2389.2000.00324.x. 682
[75] S. Dlouhá, L. Borůvka, L. Pavlů, V. Tejnecký, O. Drábek, Comparison of Al speciation and other 683
soil characteristics between meadow, young forest and old forest stands., J. Inorg. Biochem. 103 684
(2009) 1459–64. https://doi.org/10.1016/j.jinorgbio.2009.07.024. 685
686


Supplementary Figure S1. Spruce and beech experimental forest sites located at Palicnik hill
(635 - 680 a.s.l.) in Jizera mountains in the Czech Republic. The size of the investigated area
was 2925 m2 in beech and 3300 m2 in spruce forest. 60 bags filled with beech litter were placed
to beech forest and 60 bags filled with spruce litter were placed to spruce forest. DBH of living
trees was 534.6 (±153.4) in beech forest and 405.8 (±112.4) in spruce forest, total area of rock
was 811.9 m2 in beech forest and 10.9 m2 in spruce forest and canopy closure was 87% in
beech and 40% in spruce forest.
N
60 m0
Beech forest
Spruce forest
Clear cut area
Beech forest Spruce forest
N0 20 4010 m
... ..
.
..
.
.
..
. .
...
. . .
.
.
.
..
..
. ..
..
. ..
..
...
.. .
..
...
...
.
..
..
*
** *
**
* **
*
. . ... ..
. .. .. . .
..
. ....
..
..
. .. . .
...
...
...
..
..
..
..
....
..
..
.... .
..
..
. .. .
..
..
..
..
..
..
..
...
...
...
. .. ..
. ....
..
.
..
.. .
**
*
**
*
*
* * *
Litter bags position*
Rock and surface runoff
Crovn projection
Tree.

Months from the start of experiment
0.8
1.0
1.2
1.4
1.6
1.8
2.0
Nto
t [%
]500
1000
1500
Pto
t [m
g.k
g-1
]2000
4000
6000
8000
10000
12000
Ca
tot [
mg.k
g-1
]
0 3 5 7 15 19 29
0.0
60.0
80.1
00.1
20.1
4
Sto
t [%
]500
1000
1500
2000
2500
Fe
tot [
mg.k
g-1
]200
400
600
800
1000
1200
Mn
tot [
mg.k
g-1
]
0 3 5 7 15 19 29
Supplementary Figure S2. Changes in the contents of selected elements in course of
beech (yellow) and spruce (dark green) litter decomposition.

Supplementary Figure S4. Average proportions of groups at the family level within the
phylum Actinobacteria in the bacterial 16S rRNA gene amplicon sequence libraries (n=3).
B15 B19 B29 S15 S19 S29
0
10
20
30
40
50
60
70
unclassified
others
Frankiaceae
Nocardiaceae
uncl. Corynebacteriales
Actinospicaceae
clade 67-14
Microbacteriaceae
uncultured clade
clade IMCC26256
Mycobacteriaceae
Trebon clade
Solirubrobacteraceae
Litter type, months
Pro
port
ion in the lib
rary
[%
]
Supplementary Figure S3. Average proportions of groups at the family level within the
phylum Proteobacteria in the bacterial 16S rRNA gene amplicon sequence libraries (n=3).
Litter type, months
Pro
port
ion in the lib
rary
[%
]
B15 B19 B29 S15 S19 S29
0
10
20
30
40
50
60
unclassifiedotherCoxiellaceaeXanthobacteraceaeLegionellaceaePolyangiaceaeOxalobacteraceaeHyphomicrobiaceaeuncl. BurkholderialesBdellovibrionaceaeBurkholderiales inc. sedisuncl. Rhodospirillalesuncl. BetaproteobacteriaSphingomonadaceaeMethylocystaceaeXanthomonadaceaeSinobacteraceaeRhizomicrobiumBeijerinckiaceaeuncl. Rhizobialesuncl. AlphaproteobacteriaRhodospirillaceaeCaulobacteraceaeuncl. GammaproteobacteriaBurkholderiaceaeBradyrhizobiaceaeAcetobacteraceae

Supplementary Figure S5. Average proportions of groups at the family level within the
phylum Firmicutes in the bacterial 16S rRNA gene amplicon sequence libraries (n=3).
B15 B19 B29 S15 S19 S29
0
5
10
15
20
25
30
unclassified
other
Planococcaceae
uncl. Clostridia
Thermoanaerobacteraceae
uncl. Bacillales
Paenibacillaceae 1
Alicyclobacillaceae
Bacillaceae 2
Bacillaceae 1
Litter type, months
Pro
port
ion in the lib
rary
[%
]
Supplementary Figure S6. Rarefaction analysis of the sequence libraries (n=3).
0 10000 20000 30000 40000 50000 60000 70000
0
200
400
600
800
1000
1200
1400
B15
B19
B29
S15
S19
S29
sampled sequences
observ
ed O
TU
s97


Paper IV: Litter traits and rainfall reduction alter microbial
litter decomposers: the evidence from three Mediterranean
forests

FEMS Microbiology Ecology, 95, 2019, fiz168
doi: 10.1093/femsec/fiz168
Advance Access Publication Date: 24 October 2019
Research Article
RESEARCH ARTICLE
Litter traits and rainfall reduction alter microbial litter
decomposers: the evidence from three Mediterranean
forests
S. Pereira1, A. Buresova2,3,4, J. Kopecky5, P. Madrova5, A. Aupic-Samain1,
C. Fernandez1, V. Baldy1,* and M. Sagova-Mareckova5
1Aix Marseille Univ, Avignon Universite, CNRS, IRD, IMBE UMR 7263, Marseille, France, 2Department of
Ecology, Faculty of Science, Charles University in Prague, Vinicna 7, Prague, Czech Republic, 3Ecologie
Microbienne, Universite Claude Bernard Lyon 1, UMR CNRS 5557, INRA 1418, Villeurbanne, France, 4Laboratory
for Diagnostics and Epidemiology of Microorgansims, Crop Research Institute, Drnovska 507, CZ-16106 Prague
6, Ruzyne, Czech Republic and 5Czech University of Life Sciences, Faculty of Agrobiology, Food and Natural
Resources, Department of Microbiology, Nutrition and Dietetics, Kamycka 129, 165 00 Praha 6 - Suchdol, Czech
Republic
∗Corresponding author: Aix Marseille Univ, Avignon Universite, CNRS, IRD, IMBE UMR 7263, Marseille, France. E-mail: [email protected]
One sentence summary: This study addresses the impact of climate change, forest sites and tree species on microbial communities and litter
decomposition process in three Mediterranean forests.
Editor: Taina Pennanen
ABSTRACT
The objective of the study was to evaluate changes in microbial communities with the predicted arrival of new species to
Mediterranean forests under projected intensification of water stress conditions. For that, litter from three Mediterranean
forests dominated respectively by Quercus pubescens Willd., Quercus ilex L. and Pinus halepensis Mill. were collected, and
placed to their ‘home’ forest but also to the two other forests under natural and amplified drought conditions (i.e. rainfall
reduction of 30%). Quantitative PCR showed that overall, actinobacteria and total bacteria were more abundant in Q.
pubescens and Q. ilex than in P. halepensis litter. However, the abundance of both groups was dependent on the forest sites:
placement of allochthonous litter to Q. pubescens and P. halepensis forests (i.e. P. halepensis and Q. pubescens, respectively)
increased bacterial and fungal abundances, while no effect was observed in Q. ilex forest. P. halepensis litter in Q. pubescens
and Q. ilex forests significantly reduced actinobacteria (A/F) and total bacteria (B/F) to fungi ratios. The reduction of rainfall
did not influence actinobacteria and bacteria but caused an increase of fungi. As a result, a reduction of A/F ratio is expected
with the plant community change towards the dominance of spreading P. halepensis under amplified drought conditions.
Keywords: litter decomposition; fungi; actinobacteria; Mediterranean forest; climate change
INTRODUCTION
Microorganisms are key actors in nutrient cycling and car-
bon turnover during litter decomposition (Gessner et al. 2010;
Garcia-Pausas and Paterson 2011). At a global scale, it is esti-
mated that the soil C coming from soil microbial biomass is
about 16.7 Pg C, which represents approximately 2.3–2.4% of
total organic C found in soil in the top 30 cm (Xu, Thornton
Received: 15 December 2018; Accepted: 23 October 2019
C© FEMS 2019. All rights reserved. For permissions, please e-mail: [email protected]
1
Dow
nlo
aded fro
m h
ttps://a
cadem
ic.o
up.c
om
/fem
sec/a
rticle
-abstra
ct/9
5/1
2/fiz
168/5
606783 b
y g
uest o
n 1
7 M
ay 2
020

2 FEMS Microbiology Ecology, 2019, Vol. 95, No. 12
and Post 2013). Heterotrophic respiration resulting from micro-
bial litter decomposing activity can account for 10–90% of the
CO2 efflux from soils and substantially affect the atmospheric
CO2 concentration (Manzoni et al. 2012). However, annual reduc-
tion of rainfall by up to 30% predicted for the Mediterranean
basin (Giorgi and Lionello 2008; IPCC 2014; Hertig and Tramblay
2017) may significantly impact microbial abundance and struc-
ture, and thus, also the overall C dynamics (Wardle and Putten
2002).
Studies have already demonstrated shifts in plant commu-
nity composition in response to the changed climatic conditions
(Morales et al. 2007; Bertrand et al. 2011; Guiot and Cramer 2016).
In southern France, dominating downy oak (Quercus pubescens
Willd.) is expected to be replaced by more drought tolerant
species: the sclerophylls’ evergreen holm oak (Quercus ilex L.)
and Aleppo pine (Pinus halepensis Mill.) (Barbero et al. 1990; For-
tunel et al. 2009). Additionally, the increase of water stress may
induce the synthesis of plant secondary metabolites (e.g. phe-
nolics) known for their phytotoxic activities and anti-appetizing
effects, which limit leaf consumption by fauna (Chomel et al.
2014). This investment in defence mechanisms over primary
metabolic processes may result on the one hand to the decrease
of primary productivity (Ogaya and Penuelas 2007) and thus lit-
ter inputs, and on the other hand, in the reduction of litter qual-
ity through the increase of recalcitrant organic compounds (i.e.
lignin, wax, polyphenolics) (Ormeno et al. 2006; Hattenschwiler
and Jørgensen 2010; Sagova-Mareckova et al. 2011). Moreover,
the reduction of moisture level may induce physiological stress
and limit dispersal of microorganisms, enzymatic activities and
substrate diffusion (Bouskill et al. 2013). Thus, the reduction of
moisture levels and aboveground litter quality and quantitymay
impose new community dynamics belowground (Lunghini et al.
2013; Cleveland et al. 2014) and lead to a shift of soil micro-
bial communities to more drought tolerant species, capable of
using recalcitrant C sources and resistant to desiccation (Yuste
et al. 2011; Penuelas et al. 2012; Allison et al. 2013). Actinobac-
teria are known to thrive in low resource environments (Fierer,
Bradford and Jackson 2007) and low soil moisture conditions
(Yuste et al. 2011; De Vries and Shade 2013; Acosta-Martinez
et al. 2014) reaching high abundance in arid soils (Okoro et al.
2009). They are well protected by a strong, thick interlinked
peptidoglycan cell wall, which explains their high resistance
to low osmotic potential conditions (Davet 2004). They produce
enzymes able to degrade a wide range of biopolymers, whose
building blocks including aromatic compounds (McCarthy and
Williams 1992) have a vital role in organic matter turnover and
humus formations (Anandan, Dharumadurai and Manogaran
2016). They produce a variety of secondary metabolites (Anan-
dan et al. 2016), through which they interact with other micro-
bial groups (Lewin et al. 2016). However, little is known about
how microbial communities and actinobacteria in particular,
would be affected by future reduction of rainfall, both directly
by decrease of moisture level and indirectly through the plant
species shift. In general, litter types sharing a common his-
tory with local microbial communities (autochthonous) have
faster decomposition rates than litter types coming from distant
(allochthonous) habitats (Gholz et al. 2000; Strickland et al. 2009).
Consequently, changes in biochemical composition of local litter
with the arrival of new species may constrain microbial activity
and impact negatively litter decomposition (Schimel, Balser and
Wallenstein 2007).
In here, we examine how reduction of rainfall and change
in plant species may affect belowground microbial commu-
nity’s (actinobacteria, fungi and total bacteria) abundance and
structure and consequently also the litter decomposition pro-
cess. For that, we performed a litter transplanting experiment
between three main Mediterranean forests (Q. pubescens Willd.,
Q. ilex L., and P. halepensisMill.) occurring in Southeast of France,
under natural and amplified drought conditions for simulating
the 30% rainfall reduction. We hypothesised that the arrival of
new litter under amplified drought conditions will have a nega-
tive impact on microbial abundance and litter decomposition.
MATERIALS AND METHODS
Sites description
This studywas conducted at the three forest sites in theMediter-
ranean region in southern France: the Q. pubescens forest at Oak
Observatory at the ‘Observatoire de Haute Provence’ (O3HP; San-
tonja et al. 2015a), the Q. ilex forest at Puechabon (Limousin
et al. 2008) and the mixed P. halepensis forest at Font-Blanche
(Table 1). During the study period, themean annual temperature
was 12.1◦C, 13.7◦Cand 14.0◦C, and the cumulative annual precip-
itation was 609 mm, 794 mm and 632 mm, respectively (Table 1;
Supplementary Figure 1, Supporting Information). There were
no significant differences between sites in the mean annual
temperature and cumulative annual precipitation during the
study period (One-way ANOVA, P < 0.05). Each site included
a control plot (natural drought—ND) and a rain exclusion plot
(amplified drought—AD) to mimic the future reduction of rain-
fall predicted by the climatic model for the Mediterranean
Region (about -30% yearly; Table 1 and Supplementary Figure 2,
Supporting Information).
Experimental design and sample processing
In 2014, senescent leaveswere collected in the control plot of the
three forests. For that, litter traps were used during the abscis-
sion period that occurred from October to November for the
broadleaves (Q. ilex and Q. pubescens) and from June to Septem-
ber for the needles (P. halepensis). Leaves and needles were air
dried and stored at room temperature in paper boxes until the
beginning of the experiment.
Litter decomposition was assessed by using the litter bag
method (Swift et al. 1979). Four-mm mesh litter bags (20 × 20
cm) containing 10 g (air-dried) of the senescent material were
used to perform the experiment. Litter transplants were made
between each site for the three species considered, i.e. a litter
bag containing the litter of each species placed on each forest
site, under two drought conditions: natural (ND) and amplified
(AD) (see Supplementary Figure 3, Supporting Information).
Thus, the experiment consisted in 18modalities correspond-
ing to the 3 forests Q. ilex, Q. pubescens and P. halepensis) × 3 plant
species (Q. ilex, Q. pubescens and P. halepensis) × 2 drought condi-
tions (ND andAD). In total, 126 litter bags (18modalities× 1 sam-
pling date × 7 replicates) were analysed. Litter bags were placed
perpendicularly to the gutters system in Aleppo pine and holm
oak forests and under the rain exclusion device in the downy oak
forest, by using a transect in blocks (7 columns x 6 lines), equidis-
tantly one from each other (1 m distance between the 7 columns
and 0.6 m between the 6 lines). Transects were E-W oriented.
They were disposed in the ground floor after the removal of lit-
ter layer and fixed to the soil with galvanised nails to prevent
movement by animals or wind. Litter layer was then replaced
over the litterbags.
Litter bags were retrieved after 1 year (December 2015). Lit-
terbags were placed in zipped plastic bags to prevent the loss of
Dow
nlo
aded fro
m h
ttps://a
cadem
ic.o
up.c
om
/fem
sec/a
rticle
-abstra
ct/9
5/1
2/fiz
168/5
606783 b
y g
uest o
n 1
7 M
ay 2
020

Pereira et al. 3
Table 1. Main characteristics of the three forest sites selected for this study (for the study period: December 2014 to December 2015).
Forests Q. pubescens Willd. Q. ilex L. Mixed P. halepensis Mill.
Sites
Oak Observatory at the Observatoire de
Haute Provence Puechabon Font-Blanche
Location 430 56’ 115” N, 050 42’ 642” E 43◦ 44’ 29”N, 3◦35’ 45”E 43◦14’27” N, 5◦40’45” E
Altitude a.s.l. (m) 650 270 425
MAT (Mean Annual Temperature) (◦C) 12.25 13.71 14.01
MAP (Mean Annual Precipitation) (mm) 609 794 632
Soil type pierric calcosol rhodo-chromic luvisol leptosol
Soil texture clay clay loam clay
Soil pH 6.76 6.6 6.8
Surface rocks cover (%) 23 75 50
Dominant tree species Q. pubescens Willd. Q. ilex L. mixed P. halepensis Mill./Q.
ilex L.
Other dominant plant species Acer monspessulanum L Buxus sempervirens L. Quercus coccifera L.
Cotinus coggygria Scop. Phyllirea latifolial L. Phyllirea latifolia L.
Pistacia terebinthus L.
Juniperus oxycedrus L.
Tree density (stems/ ha) 3503 4500 3368
Forest structure even-age (70 years) even-age (74 years) uneven-age (61 years)
Rain exclusion system dimensions (m2) 300 140 625
Rain exclusion (%) 33 30 30
biological material. In the laboratory, the soil and other debris
were removed from the litter bags. Then, they were freeze-dried
(Lyovac GT2) for 72 hours and the remaining dry mass (%) was
calculated. A 1 g of dry mass aliquote was collected, grounded
to powder (Retsch R© MM400, 30 Hz during 30s) and kept at -20◦C
for posteriori microbial DNA analysis.
Initial litter chemical characteristics
At the beginning of the experiment, 5 replicates from each leaf
species collected from trees in control plots were grounded to
powder (Retsch R© MM400, 30 Hz during 30s). Carbon (C) and
nitrogen (N) were determined by thermal combustion on a
Flash EA 1112 series C/N elemental analyser (Thermo-Scientific,
U.S.A). Phosphorus (P) and cations (Ca, K, Mg and Na) were
extracted from 80 mg of ground litter sample with 8 ml of
nitric acid and 2 ml of H2O2 at 175◦C for 40 min using a
microwave digestion system (Ethos One,Milestone SRL, Sorisole,
Italy). After the mineralisation, each sample was adjusted to
50 ml with demineralised water. Phosphorus concentration was
measured at 720 nm using a microplate reader (Victor, Perkin
Elmer, Waltham, MA, USA). Cations were determined using an
atom absorption spectrometer (AAS, iCE 3000 series, Thermo-
Scientific, China). Leaf structural compounds (lignin, cellulose
and hemicellulose) and water-soluble compounds (WSC) con-
centrations were determined according to the van Soest extrac-
tion protocol (Van Soest and Wine 1967), using a fiber anal-
yser (Fibersac 24; Ankom R©, Macedon, NJ, USA). Total phenolic
concentrations were measured by colorimetry according to the
method of Penuelas et al. (1996) using gallic acid as standard.
Aqueous extracts were made by dissolving 0.25 g of litter pow-
der in 20 ml of 70% aqueous methanol solution with shaking for
1 hour and filtered (0.45 μm). A total of 25ml of extracts obtained
were then mixed with 0.25 ml of Folin-Ciocalteu reagent (Folin
and Denis 1915), 0.5 ml of saturated aqueous Na2CO3 (to stabi-
lize the colorimetric reaction) and 4 ml of distilled water. After
60 min, the reaction was completed and the concentration of
phenolics was measured at 765 nm using a UV / Vis spectropho-
tometer (Thermoscientific, U.S.A.).
To determine the water holding capacity (WHC), twenty-one
freshly abscised leaves (3 species x 5 replicates) were soaked in
distilled water for 24 hours, drained and weighted (wet weight).
The dry weight was measured after drying the samples for 48
hours at 60◦C. Water holding capacity (in %) was calculated
according to the formula: (wet weight/dry weight) × 100 (San-
tonja et al. 2015b). Specific leaf area (SLA) was determined by
using the Image J software (https://imagej.nih.gov/ij/, MA, USA).
Specific leaf area was calculated as the ratio between leaf area
and leaf dry weight.
DNA extraction
Environmental DNA from leaf litter samples was extracted with
the NucleoSpin R© soil kit (Macherey-Nagel, Duren, Germany), fol-
lowing the standard protocol with a slight adjustment. In brief,
approximately 250 mg of dry litter was added to the NucleoSpin
Bead tubes. Lysis conditions were performed by using buffer SL1
(700µl, vortex for 5min, room temperature, 11 000 x g for 2min),
and buffer SL3 (150µl, vortex 5 min, 0–4◦C, 14 000 g for 1 min).
This procedure was repeated twice using the same sample to
optimise the DNA extraction. The filtration of the supernatant
was performed in theNucleoSpin Inhibitor Removal Column fol-
lowed by 11 000 x g for 1 min. DNA binding was done in the
Nucleo Spin Soil column after adding 250 µl of Buffer SB to the
supernatant followed by 11 000 x g for 1 min. A series of succes-
sive DNA washing was performed: 500 µl buffer SB (11 000 x g, 3
sec), 550 µl buffer SW1 (11 000 x g, 3 sec), 700 µl SW2 (2 sec vor-
tex, 11 000 x g, 3 sec). At each step, flow-through were discarded.
Finally, DNA was eluted in 30 µl of Buffer SE followed by incuba-
tion at room temperature for 1 min and 11 000 x g for 30 seconds
and kept at -20◦C until further analysis. DNA quantification was
performed in the ND-1000 spectrophotometer (Nanodrop Tech-
nology, Wilmington, DE).
Quantitative real-time PCR analysis
Abundances of total bacteria, actinobacteria and fungi were
assessed using a quantitative real-time PCR analysis (qPCR)
Dow
nlo
aded fro
m h
ttps://a
cadem
ic.o
up.c
om
/fem
sec/a
rticle
-abstra
ct/9
5/1
2/fiz
168/5
606783 b
y g
uest o
n 1
7 M
ay 2
020

4 FEMS Microbiology Ecology, 2019, Vol. 95, No. 12
Table 2. Initial leaf litter quality of each litter species: Q. pubescens, Q. ilex and P. halepensis, the values are mean ± SE (n = 5) and the results ofthe one-way ANOVA to test differences between initial litter species are indicated (∗ P < 0.05, ∗∗ P < 0.01, ∗∗∗ P < 0.001 and different lettersdenote significant differences among species with a>b>c.)
df Q. pubescens Q. ilex P. halepensis F-ratio
Carbon 2 462.6 ± 2.65 c 478.1 ± 1.4 b 516.1 ± 1.6 a 198.80 ∗∗∗
Nitrogen 2 6.4 ± 0.2 b 9.6 ± 0.2 a 5.4 ± 0.1 c 146.30 ∗∗∗
Phosphorus 2 1.9 ± 0.1 b 3.5 ± 0.2 a 1.6 ± 0.1 b 64.6 ∗∗∗
Calcium 2 32.9 ± 0.8 a 25.1 ± 0.6 b 18.4 ± 0.2 c 168.1 ∗∗∗
Potassium 2 0.8 ± 0.01 c 1.8 ± 0.1 a 0.95 ± 0.01 b 370.7 ∗∗∗
Magnesium 2 2.8 ± 0.2 a 1.4 ± 0.01 b 1.5 ± 0.02 c 104.8 ∗∗∗
Sodium 2 0.04 ± 0.00 b 0.11 ± 0.00 a 0.11 ± 0.00 a 149.6 ∗∗∗
Total phenolics 2 40.8 ± 2.6 a 32.9 ± 1.58 b 38.6 ± 1.2 ab 4.7 ∗
Lignin 2 273.3 ± 9.0 b 337.4 ± 5.5 a 302.6 ± 10.6 b 13.8 ∗∗∗
Cellulose 2 159.1 ± 8.0 b 205 ± 4.2 a 150.8 ± 12.9 b 10.3 ∗∗
Hemicellulose 2 274.2 ± 22.5 a 270.0 ± 16.2 ab 206.6 ± 10.4 b 4.7 ∗
Water-soluble compounds 2 293.4 ± 12.1 b 187.6 ± 10.2 c 340.0 ± 7.1 a 60.9 ∗∗∗
Specific leaf area 2 133.1 ± 0.4 a 51.5 ± 0.9 c 83.5 ± 2.2 b 690.7 ∗∗∗
Water holding capacity 2 146.9 ± 1.0 a 137.2 ± 1.0 b 113.9 ± 1.03 c 285.5 ∗∗∗
method. Microbial abundance was quantified as copy num-
ber of a target gene. Partial 16S rRNA gene sequences were
amplified from the total bacteria using primers COM1 (5′–CAG
CAGCCGCGGTAATAC–3′) and 769R (5′–ATCCTGTTTGMTMCCCV
CRC–3′, annealing temperature 59◦C) (Dorn-In et al. 2015), and
from actinobacteria using primers S-P-Acti-1154-a-S-19 (5′–GRD
ACYGCCGGGGTYAACT–3′ annealing temperature 59◦C) and S-P-
Acti-1339-a-A-18 (5′–TCWGCGATTACTAGCGAC–3′) (Pfeiffer et al.
2014). Partial 18S rRNA genes from fungi were amplified with
primers FF390 (5′–CGATAACGAACGAGACCT-3′) and FR1 (5′–A
ICCATTCAATCGGTAIT-3′, annealing temperature 50◦C) (Vainio
and Hantula 2000). All PCR reactions were done 15 µl total
volume containing 1 × SYBR R© Green Gotaq PCR Master Mix
(Promega), primers at 600 nM for total bacteria and fungi, and
200 nM for actinobacteria, and 0.2–2 ng environmental DNA.
The cycling parameters were: 10 min at 95◦C followed by 45
cycles at 95◦C (15 sec), 59◦C (30 sec), 72◦C (30 sec). Melting curves
were recorded to ensure qPCR specificity, and gel electrophore-
sis analyses were performed to confirm the expected size of
amplified products. All qPCR reactions were run in triplicate on
StepOne Plus Real-Time PCR System (Applied Biosystems, Fos-
ter City, CA). To quantify the target gene copy numbers, standard
dilution curves of known concentrations of previously cloned
standards of the target genes were determined. Baseline and
threshold calculations and data analysis were performed with
the StepOne v. 2.2.2 software.
The primer pair recommended by Dorn-In et al. (2015) for
amplification of bacterial 16S rRNA gene fragment from plant
samples, Com1/769R (Rastogi et al. 2010; Fredriksson, Hermans-
son and Wilen 2013) was used for quantitative real-time PCR
analysis of the total bacteria. The primer pair does not amplify
16 rRNA genes from chloroplasts, however, consequently also
its coverage of the domain Bacteria is incomplete. In silico
analysis using TestPrime 1.0 (Klindworth et al. 2013) against
the Silva database, release 132 (www.arb-silva.de), showed 75%
overall coverage of Bacteria with varying representation of the
phyla, e.g. 88% Proteobacteria, 81.9% Firmicutes, 93.6% Bac-
teroidetes, but only 56.2% Actinobacteria, 20.5% Acidobacteria
and 17.5%Verrucomicrobia. Therefore, the results can be used as
a proxy of bacterial abundance when comparing between sam-
ples, but not to compare with qPCR quantification of individual
bacterial phyla or lower taxonomic units using group-specific
primers.
Statistical analysis
All statistical analyses were performed in R v.3.1.3 software (R
Development Core Team 2017). One-way analysis of variance
(ANOVA) was used to determine differences between the ini-
tial parameters of litter plant species and between forest sites
for each litter species and microbial group. Three-way ANOVA
was also used to test the effects of forest sites (S), litter species
(L) and drought treatment (D) on litter mass loss and microbial
abundance (total bacteria (B), actinobacteria (A), fungi (F) and the
respective B/F and A/F ratios, followed by post-hoc Tukey tests.
Microbial abundance was log-transformed to fit the assumption
of normality and homoscedasticity.
RESULTS
Initial litter composition
Initial litter characteristics varied significantly among species
(Table 2, One-way ANOVA, P < 0.05). Quercus ilex showed a sig-
nificantly higher N (9.62 mg g−1) and P (3.48 mg g−1) contents
than the two other species, particularly P. halepensis (5.36 mg g−1
and 1.56 mg g−1), which resulted in a lowest C/N and C/P ratio
for Q. ilex and highest ratios for P. halepensis (Table 2). Regarding
the cations, Q. pubescens showed significantly higher content of
Ca (32.90 mg g−1) and Mg (2.83 mg g−1), and lower content of K
(0.84 mg g−1) and Na (0.04 mg g−1) than the two other species.
Concerning the structural compounds of the leaves, Q. ilex had
higher lignin (337.38 mg g−1) and cellulose content (204.99 mg
g−1) than the two other species. Finally, Q. pubescens showed
higher total phenolics content compared to Q. ilex, and the high-
est specific leaf area (133.13 mg g−1) and water holding capac-
ity (146.90 mg g−1). Pinus halepensis showed higher water-soluble
compounds (340.02 mg g−1) and lower water holding capacity
(113.89 mg g−1).
Litter mass loss
After 357 days of decomposition, littermass losswas statistically
different among sites and plant species with interaction effects
(Table 3). On average, significantly higher mass loss occurred
at Q. pubescens forest (36.94%) in comparison with Q. ilex for-
est (33.88%) and P. halepensis forest (33.80%). Regarding the lit-
ter, P. halepensis (36.81%) and Q. ilex (35.07%) lost significantly
Dow
nlo
aded fro
m h
ttps://a
cadem
ic.o
up.c
om
/fem
sec/a
rticle
-abstra
ct/9
5/1
2/fiz
168/5
606783 b
y g
uest o
n 1
7 M
ay 2
020

Pereira et al. 5
Table 3. ANOVA table of F-Ratio and P-values for the effects of forest sites (S), litter species (L) and drought conditions (D) on the mass loss,microbial biomass (actinobacteria, bacteria and fungi) and actinobacteria/fungi (A/F) and bacteria/fungi (B/F) ratios.
Mass loss Actino (A) Bacteria (B) Fungi (F) A/F B/F
df F P F P F P F P F P F P
Sites (S) 2 8.81 0.0008 33.92 <0.0001 8.86 0.0003 30.38 <0.0001 6.11 0.0030 11.78 <0.0001
Litter species (L) 2 8.11 0.0022 16.31 <0.0001 4.58 0.0122 2.41 0.0945 53.55 <0.0001 11.34 <0.0001
Drought (D) 1 3.70 0.0571 0.09 0.7602 1.91 0.1688 6.20 0.0143 12.08 0.0007 11.70 0.2828
SxL 4 7.03 <0.0001 5.69 0.0003 20.56 <0.0001 21.01 <0.0001 7.67 <0.0001 11.49 <0.0001
SxD 2 0.43 0.6488 3.00 0.0539 7.25 0.0011 3.82 0.0251 0.18 0.8368 5.43 0.0056
LxD 2 0.14 0.8724 3.83 0.0246 1.36 0.2593 1.12 0.3313 3.34 0.0392 0.11 0.8973
SxLxD 4 0.10 0.9839 1.11 0.3540 2.72 0.0335 1.45 0.2229 2.12 0.0836 1.17 0.3293
highermass thanQ. pubescens (32.72%). Concerning interactions,
P. halepensis lost most of its mass at Q. pubescens and P. halepen-
sis forests compared to the Q. ilex forest (Fig. 1A). No signifi-
cant effect of rain exclusion was found on the litter mass loss
(Table 3).
Microbial abundance and structure
Abundances of actinobacteria, total bacteria and fungi differed
significantly according to forest sites, when control and ampli-
fied drought conditions were combined (Table 3, Fig. 1) The
highest abundances of all microbial groups were observed at
P. halepensis forest and lowest at Q. ilex forest. However, it dif-
fered according to plant litter species producing a site x species
interaction effect (Table 3; Fig. 1). Actinobacteria and total bac-
teria had the highest abundance in Q. ilex litter and lowest in P.
halepensis at Q. ilex and P. halepensis forests, respectively (Fig. 1B
and C). Roughly, higher abundance of fungi was observed in P.
halepensis litter at Q. pubescens forest, Q. ilex litter at Q. ilex forest
and Q. pubescens litter at P. halepensis forest (Fig. 1D). Regarding
the actinobacteria to fungi (A/F) ratio, it was significantly higher
in Q. pubescens and Q. ilex litter and lower in P. halepensis litter
at Q. pubescens and Q. ilex forests (Fig. 1E). Total bacteria to fungi
(B/F) ratio was significantly higher in Q. ilex litter and lowest in
P. halepensis litter, at Q. ilex and P. halepensis forests (Fig. 1F).
Overall, there was a significant increase of fungal abundance
and a decrease of A/F ratio under amplified drought (AD) in
comparison with natural conditions (Table 3). No main effect of
drought conditions was observed for actinobacteria, total bacte-
ria and bacteria to fungi (B/F) ratio (Table 3). However, an inter-
action effect was observed between site and drought conditions
for total bacteria, fungi and total bacteria to fungi ratio (Table 3;
see Supplementary Table 1, Supporting Information). Thus, we
observed a significant increase of total bacterial (Fig. 2A) and
fungal abundance (Fig. 2B) under AD conditions at the P. halepen-
sis forest, and a decrease of B/F ratio in Q. pubescens forest
(Fig. 2C).
DISCUSSION
In this study, we evaluated how reduction of rainfall and change
in plant species may affect belowgroundmicrobial community’s
abundance and structure and consequently the litter decom-
position process in three dominant Mediterranean forests of
southern France. Our findings are that (i) actinobacteria and total
bacteria were more affected by changes of plant species than
by the decrease of water availability; (ii) fungi were positively
impacted by the reduction of rainfall and (iii) the future arrival
of P. halepensis litter to Q. pubescens and Q. ilex forest and rainfall
reduction could alter the relative proportion of fungi and bac-
teria in the community hence having implication in microbial
decomposers activity.
Effects of litter quality on microbial communities and
mass loss
Our results showed the importance of leaf litter initial litter with
respect to microbial composition and litter mass loss dynamics.
We observed higher abundance of actinobacteria and total bac-
teria in oak litter than in pine. This is in line with previous stud-
ies, which showed a preference of bacteria for high quality litter
(i.e. low C/N, C/P, lignin: P and lignin/N ratio) (Hodge, Robinson
and Fitter 2000; De Boer et al. 2005 ; Romanı et al. 2006). Both oaks
Q. pubescens and Q. ilex are characterised by high N and P con-
tent, which are efficiently utilised by bacterial enzymes (Romani
et al. 2006) and then are consistently considered key factors in lit-
ter decomposition and good predictors of litter mass loss (Moro
and Domingo 2000; Garcia-Pausas, Casals and Romanya 2004;
Gusewell and Gessner 2009). However, our results only partially
corroborate with this by showing that Q. ilex and P. halepensis
litter had higher mass loss than Q. pubescens. That is possibly
due to higher initial content of total phenolics determined in Q.
pubescens compared to Q. ilex, which are known to inhibit litter
microbial communities and N mineralisation, during the early
stage of decomposition (Lambers 1993; Souto, Chiapusio and Pel-
lissier 2000; Ormeno et al. 2006; Chomel et al. 2014). This may
explain the lowermass loss of its litter in comparisonwithQ. ilex
and P. halepensis. The high mass loss of P. halepensis litter may be
also explained by the leaching of high content of water-soluble
compounds (Tripathi and Singh 1992; Kaushal et al. 2012) and
high Na content (Gressel et al. 1995), which both are known to
positive correlated litter decay. Gressel et al. (1995) observed that
salt accumulation in P. halepensis needles enhanced their break-
down compared to Q. coccifera leaves in a typical Mediterranean
mixed woodland.
Effects of litter-site interaction on litter decomposition
processes
The influence of plant species on litter decomposition varied
according to the forest sites as shown by strong litter-site inter-
action. At Q. pubescens forest, we observed the highest abun-
dance of fungi associated with P. halepensis litter, associated to
a reduction of the A/F ratio. This is consistent with the findings
by Hodge et al. (2000) and Wardle et al. (2004) who showed that
fungi are favoured by litter with high C/N ratio. In addition, fungi
Dow
nlo
aded fro
m h
ttps://a
cadem
ic.o
up.c
om
/fem
sec/a
rticle
-abstra
ct/9
5/1
2/fiz
168/5
606783 b
y g
uest o
n 1
7 M
ay 2
020

6 FEMS Microbiology Ecology, 2019, Vol. 95, No. 12
Figure 1. Leaf litter mass loss (A) and associated leaf litter microbial decomposers abundances (actinobacteria (B), bacteria (C), fungi (D)), actinobacteria to fungi (E) and
bacteria to fungi (F) ratios, for the three forests and litter species (control and amplified drought conditions were combined). Values are mean ± SE (n = 14). Different
letters denote significant differences between litter species within forest sites (e.g. both drought conditions combined), with a > b > c. DM = litter dry mass. Qp = Q.
pubescens, Qi = Q. ilex, Ph = P. halepensis.
are rather considered specialists and are more equipped enzy-
matically to assimilate recalcitrant material than more general-
ist bacteria (Møller, Miller and Kjøller 1999; Romanı et al. 2006).
The high abundance of total bacteria observed in P. halepensis
litter may be explained by the synergistic relationship between
bacteria and fungi because bacteria may benefit by the pres-
ence of fungi, which may provide them resources that bacte-
ria were not able to acquire on their own (Romanı et al. 2006).
At Q. ilex forest, microorganisms were more numerous with Q.
ilex litter in comparison with the two other species, which sug-
gests the high specificity of decomposers for decomposing the
autochthonous litter in this forest (Ayres et al. 2009). However,
this difference in microbial abundance did not lead to a signif-
icant difference in mass loss of Q. ilex litter in its own forest
compared to the two other forests. This may due to the pres-
ence of decomposers able to use different sources of carbon.
Decomposers can also develop preferences for some resources
they are not used to (St John et al. 2011). Taking into account the
three litter species, our results showed that P. halepensis forest
had generally higher microbial abundance (actinobacteria, total
bacteria and fungi) than other sites, possibly because this is the
only mixed woodland out of the three studied forests and it was
demonstrated that an increase of plant diversity promotes litter
microbial growth (Chapman and Newman 2010; Santonja et al.
2017). Indeed, litter dissimilarity may decrease resource compe-
tition between functional groups and thus increase the abun-
dance, activity, and hence efficiency of decomposers (Barbe et al.
2017).
Dow
nlo
aded fro
m h
ttps://a
cadem
ic.o
up.c
om
/fem
sec/a
rticle
-abstra
ct/9
5/1
2/fiz
168/5
606783 b
y g
uest o
n 1
7 M
ay 2
020
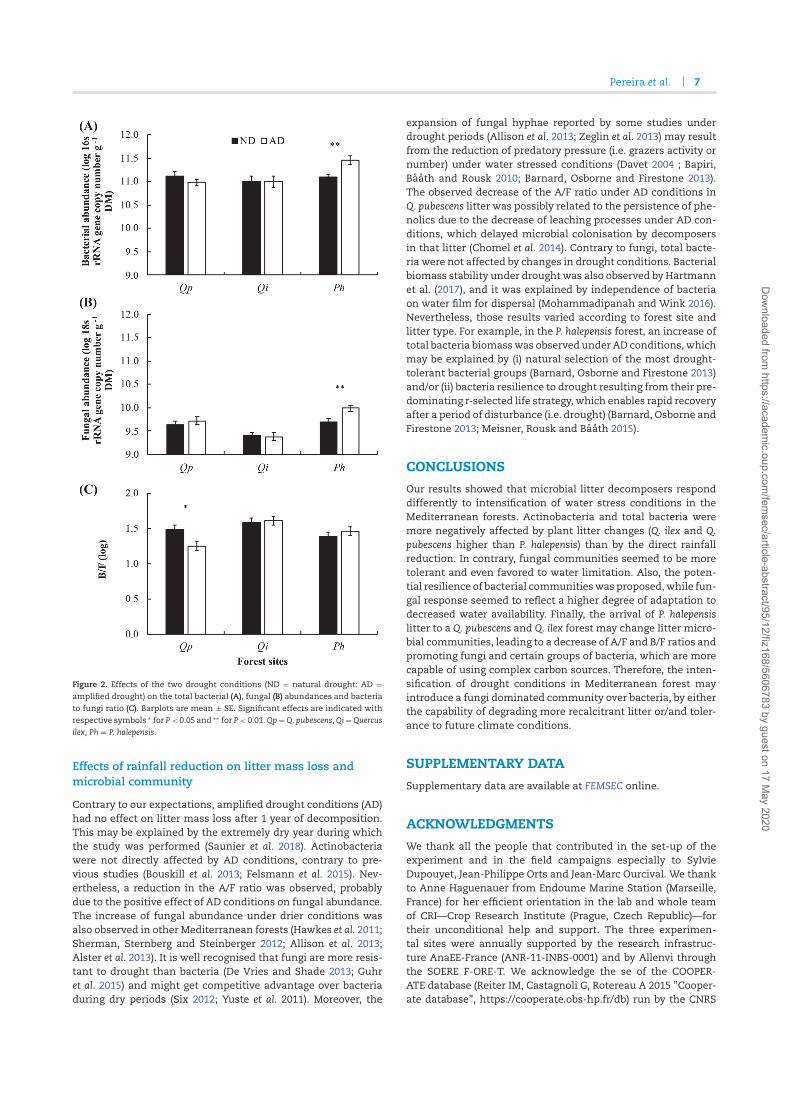
Pereira et al. 7
Figure 2. Effects of the two drought conditions (ND = natural drought: AD =
amplified drought) on the total bacterial (A), fungal (B) abundances and bacteria
to fungi ratio (C). Barplots are mean ± SE. Significant effects are indicated with
respective symbols ∗ for P< 0.05 and ∗∗ for P< 0.01.Qp=Q. pubescens, Qi=Quercus
ilex, Ph = P. halepensis.
Effects of rainfall reduction on litter mass loss and
microbial community
Contrary to our expectations, amplified drought conditions (AD)
had no effect on litter mass loss after 1 year of decomposition.
This may be explained by the extremely dry year during which
the study was performed (Saunier et al. 2018). Actinobacteria
were not directly affected by AD conditions, contrary to pre-
vious studies (Bouskill et al. 2013; Felsmann et al. 2015). Nev-
ertheless, a reduction in the A/F ratio was observed, probably
due to the positive effect of AD conditions on fungal abundance.
The increase of fungal abundance under drier conditions was
also observed in other Mediterranean forests (Hawkes et al. 2011;
Sherman, Sternberg and Steinberger 2012; Allison et al. 2013;
Alster et al. 2013). It is well recognised that fungi are more resis-
tant to drought than bacteria (De Vries and Shade 2013; Guhr
et al. 2015) and might get competitive advantage over bacteria
during dry periods (Six 2012; Yuste et al. 2011). Moreover, the
expansion of fungal hyphae reported by some studies under
drought periods (Allison et al. 2013; Zeglin et al. 2013) may result
from the reduction of predatory pressure (i.e. grazers activity or
number) under water stressed conditions (Davet 2004 ; Bapiri,
Baath and Rousk 2010; Barnard, Osborne and Firestone 2013).
The observed decrease of the A/F ratio under AD conditions in
Q. pubescens litter was possibly related to the persistence of phe-
nolics due to the decrease of leaching processes under AD con-
ditions, which delayed microbial colonisation by decomposers
in that litter (Chomel et al. 2014). Contrary to fungi, total bacte-
ria were not affected by changes in drought conditions. Bacterial
biomass stability under drought was also observed by Hartmann
et al. (2017), and it was explained by independence of bacteria
on water film for dispersal (Mohammadipanah and Wink 2016).
Nevertheless, those results varied according to forest site and
litter type. For example, in the P. halepensis forest, an increase of
total bacteria biomasswas observed under AD conditions, which
may be explained by (i) natural selection of the most drought-
tolerant bacterial groups (Barnard, Osborne and Firestone 2013)
and/or (ii) bacteria resilience to drought resulting from their pre-
dominating r-selected life strategy, which enables rapid recovery
after a period of disturbance (i.e. drought) (Barnard, Osborne and
Firestone 2013; Meisner, Rousk and Baath 2015).
CONCLUSIONS
Our results showed that microbial litter decomposers respond
differently to intensification of water stress conditions in the
Mediterranean forests. Actinobacteria and total bacteria were
more negatively affected by plant litter changes (Q. ilex and Q.
pubescens higher than P. halepensis) than by the direct rainfall
reduction. In contrary, fungal communities seemed to be more
tolerant and even favored to water limitation. Also, the poten-
tial resilience of bacterial communitieswas proposed,while fun-
gal response seemed to reflect a higher degree of adaptation to
decreased water availability. Finally, the arrival of P. halepensis
litter to a Q. pubescens and Q. ilex forest may change litter micro-
bial communities, leading to a decrease of A/F and B/F ratios and
promoting fungi and certain groups of bacteria, which are more
capable of using complex carbon sources. Therefore, the inten-
sification of drought conditions in Mediterranean forest may
introduce a fungi dominated community over bacteria, by either
the capability of degrading more recalcitrant litter or/and toler-
ance to future climate conditions.
SUPPLEMENTARY DATA
Supplementary data are available at FEMSEC online.
ACKNOWLEDGMENTS
We thank all the people that contributed in the set-up of the
experiment and in the field campaigns especially to Sylvie
Dupouyet, Jean-Philippe Orts and Jean-Marc Ourcival. We thank
to Anne Haguenauer from Endoume Marine Station (Marseille,
France) for her efficient orientation in the lab and whole team
of CRI—Crop Research Institute (Prague, Czech Republic)—for
their unconditional help and support. The three experimen-
tal sites were annually supported by the research infrastruc-
ture AnaEE-France (ANR-11-INBS-0001) and by Allenvi through
the SOERE F-ORE-T. We acknowledge the se of the COOPER-
ATE database (Reiter IM, Castagnoli G, Rotereau A 2015 ”Cooper-
ate database”, https://cooperate.obs-hp.fr/db) run by the CNRS
Dow
nlo
aded fro
m h
ttps://a
cadem
ic.o
up.c
om
/fem
sec/a
rticle
-abstra
ct/9
5/1
2/fiz
168/5
606783 b
y g
uest o
n 1
7 M
ay 2
020

8 FEMS Microbiology Ecology, 2019, Vol. 95, No. 12
FR3098 ECCOREV and OSU-Pytheas with support from the Labex
OT-Med . We also thank the French Region PACA and Europe for
the PhD grant attributed to Susana Pereira.
AUTHOR CONTRIBUTIONS
SP, MM and VB wrote the manuscript. VB and CF conceived and
designed the experiments. SP, AB, AA, and PM performed the
experiments. SP, JK, MM, and VB analysed the data.
FUNDING
This researchwas financially supported by theAgenceNationale
pour la Recherche (ANR) with the project SecPriMe2 (ANR-
12-BSV7–0016-01), the BioDivMeX Mistrals program and par-
tially by the Ministry of Education, Youth and Sports of the
Czech Republic, European Regional Development Fund-Project
No. CZ.02.1.01/0.0/0.0/16 019/0000845 and grant No. LTC17075
and Ministry of Agriculture of the Czech Republic, institutional
support MZE-RO0418.
This work is a contribution to Labex OT-Med (ANR-11-LABX-
0061) and has received funding from Excellence Initiative of
Aix-Marseille University—A∗MIDEX, a French ‘Investissements
d’Avenir’ programme.
Conflict of interest. None declared.
REFERENCES
Acosta-Martinez V, Cotton J, Gardner T et al. Predominant bac-
terial and fungal assemblages in agricultural soils during a
record drought/heat wave and linkages to enzyme activities
of biogeochemical cycling. Appl Soil Ecol 2014;84:69–82.
Allison SD, Lu Y, Weihe C et al. Microbial abundance and com-
position influence litter decomposition response to environ-
mental change. Ecology 2013;94:714–25.
Alster CJ, German DP, Lu Y et al. Microbial enzymatic responses
to drought and to nitrogen addition in a southern California
grassland. Soil Biol Biochem 2013;64:68–79.
Anandan R, Dharumadurai D, Manogaran GP. An introduction
to actinobacteria. In:Actinobacteria - Basics and Biotechnological
Applications. Intech, 2016.
Ayres E, Steltzer H, Berg S et al. Soil biota accelerate decompo-
sition in high-elevation forests by specializing in the break-
down of litter produced by the plant species above them. J
Ecol 2009;97:901–12.
Bapiri A, Baath E, Rousk J. Drying–rewetting cycles affect fungal
and bacterial growth differently in an arable soil. Microb ecol
2010;60:419–28.
Barbe L, Jung V, Prinzing A et al. Functionally dissimilar neigh-
bors accelerate litter decomposition in two grass species.
New Phytologist 2017;214:1092–102.
Barbero M, Bonin G, Loisel R et al. Changes and disturbances of
forest ecosystems caused by human activities in the western
part of the mediterranean basin. Vegetatio 1990;87;151–73.
Barnard RL, Osborne CA, Firestone MK. Responses of soil bac-
terial and fungal communities to extreme desiccation and
rewetting. The ISME journal 2013;7:2229.
Bertrand R, Lenoir J, Piedallu C et al.Changes in plant community
composition lag behind climate warming in lowland forests.
Nature 2011;479:517.
Bouskill NJ, Lim HC, Borglin S et al. Pre-exposure to drought
increases the resistance of tropical forest soil bacterial com-
munities to extended drought. The ISME journal 2013;7:384.
Chapman SK, Newman GS. Biodiversity at the plant–soil
interface: microbial abundance and community structure
respond to litter mixing. Oecologia 2010;162:763–9.
Chomel M, Fernandez C, Bousquet-Melou A et al. Secondary
metabolites of Pinus halepensis alter decomposer organisms
and litter decomposition during afforestation of abandoned
agricultural zones. J Ecol 2014;102:411–24.
Cleveland CC, Reed SC, Keller AB et al. Litter quality versus soil
microbial community controls over decomposition: a quan-
titative analysis. Oecologia 2014;174:283–94.
Davet P.Microbial Ecology of Soil and Plant Growth. Boca Raton: CRC
Press, 2004.
De Boer W, Folman LB, Summerbell RC et al. Living in a fungal
world: impact of fungi on soil bacterial niche development.
FEMS Microbiol Rev 2005;29:795–811.
De Vries FT, Shade A. Controls on soil microbial community sta-
bility under climate change. Front microbiol 2013;4:265.
Dorn-In S, Bassitta R, Schwaiger K et al. Specific amplification
of bacterial DNA by optimized so-called universal bacte-
rial primers in samples rich of plant DNA. J microbiol meth
2015;113:50–6.
Felsmann K, Baudis M, Gimbel K et al. Soil bacterial commu-
nity structure responses to precipitation reduction and for-
est management in forest ecosystems across Germany. PLOS
ONE 2015;10:e0122539.
Fierer N, Bradford MA, Jackson RB. Toward an ecological classifi-
cation of soil bacteria. Ecology 2007;88:1354–64.
Folin O, Denis WA. Colorimetric method for the determination
of phenols (and phenol derivatives) in urine. J Biol Chem
1915;22.2:305–8.
Fortunel C, Garnier E, Joffre R et al. Leaf traits capture the effects
of land use changes and climate on litter decomposability of
grasslands across Europe. Ecology 2009;90:598–611.
Fredriksson NJ, Hermansson M, Wilen B-M. The choice of PCR
primers has great impact on assessments of bacterial com-
munity diversity and dynamics in a wastewater treatment
plant. PLOS ONE 2013;8:e76431.
Garcia-Pausas J, Casals P, Romanya J. Litter decomposition and
faunal activity inMediterranean forest soils: effects of N con-
tent and the moss layer. Soil Biol Biochem 2004;36:989–97.
Garcia-Pausas J, Paterson E. Microbial community abundance
and structure are determinants of soil organic matter min-
eralisation in the presence of labile carbon. Soil Biol Biochem
2011;43:1705–13.
Gessner MO, Swan CM, Dang CK et al. Diversity meets decompo-
sition. Trends ecol evol 2010;25:372–80.
Gholz HL, Wedin DA, Smitherman SM et al. Long-term dynam-
ics of pine and hardwood litter in contrasting environments:
toward a global model of decomposition. Glob Change Biol
2000;6:751–65.
Giorgi F, Lionello P. Climate change projections for the Mediter-
ranean region. Global Planet Change 2008;63:90–104.
Gressel N, Inbar Y, Singer A et al. Chemical and spectroscopic
properties of leaf litter and decomposed organic matter in
the Carmel Range, Israel. Soil Biol Biochem 1995;27:23–31.
Guhr A, Borken W, Spohn M et al. Redistribution of soil water
by a saprotrophic fungus enhances carbon mineralization. P
Natl A Sci 2015;112:14647–51.
Guiot J, Cramer W. Climate change: the 2015 paris agreement
thresholds and Mediterranean basin ecosystems. Science
2016;354:465–8.
Gusewell S, Gessner MO. N:P ratios influence litter decomposi-
tion and colonization by fungi and bacteria in microcosms.
Funct Ecol 2009;23:211–9.
Dow
nlo
aded fro
m h
ttps://a
cadem
ic.o
up.c
om
/fem
sec/a
rticle
-abstra
ct/9
5/1
2/fiz
168/5
606783 b
y g
uest o
n 1
7 M
ay 2
020

Pereira et al. 9
Hartmann M, Brunner I, Hagedorn F et al. A decade of irrigation
transforms the soil microbiome of a semi-arid pine forest.
Mol ecol 2017;26:1190–206.
Hawkes CV, Kivlin SN, Rocca JD et al. Fungal commu-
nity responses to precipitation. Glob Change Biol 2011;17:
1637–45.
Hertig E, Tramblay Y. Regional downscaling of Mediterranean
droughts under past and future climatic conditions. Global
Planet Change 2017;151:36–48.
Hodge A, Robinson D, Fitter A. Are microorganisms more effec-
tive than plants at competing for nitrogen? Trends plant sci
2000;5:304–8.
Hattenschwiler S, Jørgensen HB. Carbon quality rather than stoi-
chiometry controls litter decomposition in a tropical rain for-
est. J Ecol 2010;98:754–63.
IPCC. Climate Change 2013 - The Physical Science Basis.Cambridge:
Cambridge University Press, 2014.
Kaushal R, Verma KS, Chaturvedi OP et al. Leaf litter decom-
position and nutrient dynamics in four multipurpose tree
species. Range Manag Agrofor 2012;33:20–7.
Klindworth A, Pruesse E, Schweer T et al. Evaluation of general
16S ribosomal RNA gene PCR primers for classical and next-
generation sequencing-based diversity studies. Nucleic acids
res 2013;41:e1–e1.
Lambers H. Rising CO2, secondary plant metabolism, plant-
herbivore interactions and litter decomposition. In: CO2 and
Biosphere. Dordrecht: Springer, 1993, 263–71.
Lewin GR, Carlos C, Chevrette MG et al. Evolution and ecology
of Actinobacteria and their bioenergy applications. Annu rev
microbiol 2016;70:235–54.
Limousin JM, Rambal S, Ourcival JM et al. Modelling rainfall
interception in a Mediterranean Quercus ilex ecosystem:
lesson from a throughfall exclusion experiment. J Hydrol
2008;357:57–66.
Lunghini D, Granito VM, Di Lonardo DP et al. Fungal diversity of
saprotrophic litter fungi in aMediterraneanmaquis environ-
ment. Mycologia 2013;105:1499–515.
Manzoni S, Schimel JP, Porporato A. Responses of soil microbial
communities to water stress: results from a meta-analysis.
Ecology 2012;93:930–8.
McCarthy AJ, Williams ST. Actinomycetes as agents of biodegra-
dation in the environment: a review. Gene 1992;115:189–92.
Meisner A, Rousk J, Baath E. Prolonged drought changes the
bacterial growth response to rewetting. Soil Biol Biochem
2015;88:314–22.
Mohammadipanah F, Wink J. Actinobacteria from arid and
desert habitats: diversity and biological activity. Front micro-
biol 2016;6:1541.
Morales P, Hickler T, Rowell DP et al. Changes in Euro-
pean ecosystem productivity and carbon balance driven
by regional climate model output. Global Change Biol
2007;13:108–22.
MoroMJ, Domingo F. Litter decomposition in four woody species
in a Mediterranean climate: weight loss, N and P dynamics.
Ann Bot 2000;86:1065–71.
Møller J, Miller M, Kjøller A. Fungal–bacterial interaction on
beech leaves: influence on decomposition and dissolved
organic carbon quality. Soil Biol Biochem 1999;31:367–74.
Ogaya R, Penuelas J. Tree growth, mortality, and above-ground
biomass accumulation in a holm oak forest under a five-year
experimental field drought. Plant Ecol 2007;189:291–9.
Okoro CK, Brown R, Jones AL et al. Diversity of culturable acti-
nomycetes in hyper-arid soils of the Atacama Desert, Chile.
Anton van Lee 2009;95:121–33.
Ormeno E, Baldy V, Ballini C et al. Effects of environmental
factors and leaf chemistry on leaf litter colonization by
fungi in a Mediterranean shrubland. Pedobiologia 2006;50:
1–10.
Penuelas J, Estiarte M, Kimball BA et al. Variety of responses of
plant phenolic concentration to CO 2 enrichment. J Exp Bot
1996;47:1463–7.
Penuelas J, Rico L, Ogaya R et al. Summer season and long-term
drought increase the richness of bacteria and fungi in the
foliar phyllosphere of Quercus ilex in a mixed Mediterranean
forest. Plant Biol 2012;14:565–75.
Pfeiffer S, Pastar M, Mitter B et al. Improved group-specific
primers based on the full SILVA 16S rRNA gene reference
database. Environ Microbiol 2014;16:2389–407.
Rastogi G, Tech JJ, Coaker GL et al. A PCR-based toolbox for the
culture-independent quantification of total bacterial abun-
dances in plant environments. J Microbiol Meth 2010;83:127–
32.
R Core Team. R: A language and environment for statistical com-
puting. 2017. https://www.R-project.org/
Romanı AM, Fischer H, Mille-Lindblom C et al. Interactions of
bacteria and fungi on decomposing litter: differential extra-
cellular enzyme activities. Ecology 2006;87:2559–69.
Sagova-Mareckova M, Omelka M, Cermak L et al. Microbial com-
munities show parallels at sites with distinct litter and soil
characteristics. Appl Environ Microbiol 2011;77:7560–7.
Santonja M, Baldy V, Fernandez C et al. Potential shift in plant
communities with climate change: outcome on litter decom-
position and nutrient release in a Mediterranean oak forest.
Ecosystems 2015b;18:1253–68.
Santonja M, Fernandez C, Gauquelin T et al. Climate change
effects on litter decomposition: intensive drought leads to
a strong decrease of litter mixture interactions. Plant and Soil
2015a;393:69–8.
Santonja M, Rancon A, Fromin N et al. Plant litter diversity
increases microbial abundance, fungal diversity, and carbon
and nitrogen cycling in a Mediterranean shrubland. Soil Biol
Biochem 2017;111:124–34.
Saunier A, Ormeno E, Havaux M et al. Resistance of native oak
to recurrent drought conditions simulating predicted cli-
matic changes in the Mediterranean region. Plant Cell Environ
2018;41:2299–312.
Schimel J, Balser TC, Wallenstein M. Microbial stress-response
physiology and its implications for ecosystem function. Ecol-
ogy 2007;88:1386–94.
Sherman C, Sternberg M, Steinberger Y. Effects of climate
change on soil respiration and carbon processing in Mediter-
ranean and semi-arid regions: an experimental approach.
Eur J Soil Biol 2012;52:48–58.
Six J. Fungal friends against drought.Nat Clim Change 2012;2:234–
5.
Souto XC, Chiapusio G, Pellissier F. Relationships between
phenolics and soil microorganisms in spruce forests: sig-
nificance for natural regeneration. J Chem Ecol. 2000;26:
2025–34.
St. John MG, Orwin KH, Dickie IA. No “home” versus “away”
effects of de-composition found in a grassland–forest recip-
rocal litter transplant study. Soil Biol Biochem 2011;43:
1482–9.
Strickland MS, Lauber C, Fierer N et al. Testing the functional
significance of microbial community composition. Ecology
2009;90:441–51.
Swift MJ, Heal OW, Anderson JM et al. Decomposition in Terrestrial
Ecosystems. Berkeley: University of California Press, 1979.
Dow
nlo
aded fro
m h
ttps://a
cadem
ic.o
up.c
om
/fem
sec/a
rticle
-abstra
ct/9
5/1
2/fiz
168/5
606783 b
y g
uest o
n 1
7 M
ay 2
020

10 FEMS Microbiology Ecology, 2019, Vol. 95, No. 12
Tripathi SK, Singh KP. Nutrient immobilization and release pat-
terns during plant decomposition in a dry tropical bamboo
savanna, India. Biol Fert Soils 1992;14;191–9.
Vainio EJ, Hantula J. Direct analysis of wood-inhabiting fungi
using denaturing gradient gel electrophoresis of amplified
ribosomal DNA. Mycol Res 2000;104:927–36.
Van Soest PJ, Wine RH. Use of detergents in the anal-
ysis of fibrous feeds: IV. Dtermination of plant cell-
wall constituents. J of official analytical chemists 1967;50:
50–5.
Wardle DA, Bardgett RD, Klironomos JN et al. Ecological link-
ages between aboveground and belowground biota. Science
2004;304:1629–33.
Wardle DA, Van der Putten WH. Biodiversity, ecosystem func-
tioning and above-ground-below-ground linkages. Biodiver-
sity and Ecosystem Functioning: Synthesis and Perspectives 2002.
Xu X, Thornton PE, Post WM. A global analysis of soil micro-
bial biomass carbon, nitrogen and phosphorus in terrestrial
ecosystems. Global Ecol Biogeogr 2013;22:737–49.
Yuste JC, Penuelas J, EstiarteM et al.Drought-resistant fungi con-
trol soil organic matter decomposition and its response to
temperature. Global Change Biol 2011;17:1475–86.
Zeglin LH, Bottomley PJ, Jumpponen A et al. Altered precipitation
regime affects the function and composition of soilmicrobial
communities on multiple time scales. Ecology 2013;94:2334–
45.
Dow
nlo
aded fro
m h
ttps://a
cadem
ic.o
up.c
om
/fem
sec/a
rticle
-abstra
ct/9
5/1
2/fiz
168/5
606783 b
y g
uest o
n 1
7 M
ay 2
020

1
Supplementary information for 1
2
Litter traits and rainfall reduction alter microbial litter decomposers: the evidence from 3
three Mediterranean forests 4
5
S. Pereira1, A. Burešová2,3,4, J. Kopecky5, P. Mádrová5, A. Aupic-Samain1, 6
C. Fernandez1, V. Baldy1, and M. Sagova-Mareckova5 7
8
1Aix Marseille Univ, Avignon Université, CNRS, IRD, IMBE UMR 7263, Marseille, France, 9
2Department of Ecology, Faculty of Science, Charles University in Prague, Vinicna 7, Prague, 10
Czech Republic, 11
3Ecologie Microbienne, Université Claude Bernard Lyon 1, UMR CNRS 5557, INRA 1418, 12
Villeurbanne, France, 13
4Laboratory for Diagnostics and Epidemiology of Microorgansims, Crop Research Institute, 14
Drnovska 507, CZ-16106 Prague 6, Ruzyne, Czech Republic and 15
5Czech University of Life Sciences, Faculty of Agrobiology, Food and Natural Resources, 16
Department of Microbiology, Nutrition and Dietetics, Kam´yck´a 129, 165 00 Praha 6 - 17
Suchdol, Czech Republic 18
19
20
21
22
23
24
25

2
Supplementary Table 1 - Summary table of microbial abundance (expressed as 1010 gene 26
copy number g-1 litter dry mass) for each litter species at each forest site and drought condition 27
(ND = Natural drought; AD = amplified drought). One-way ANOVAs were performed for 28
differences among litter species per drought condition and forest site. F-Ratio are indicated and 29
P-values with the respective symbols * for P < 0.05, ** for P < 0.01, and *** for P < 0.001. 30
Different letters denote significant differences among litter species with a>b. T-tests was 31
performed to test the effect of drought conditions for each species at each forest site. T-test are 32
indicated and significant P-values (P < 0.05) are denoted in bold. 33
34
35
36
37

3
38
39

4
40
41
42
Supplementary Figure 1 – Ombrothermic diagrams at a) O3HP, b) Puéchabon and c) Font-43
Blanche study sites between December 2014 to December 2015. Bar represents the mean 44
monthly precipitation (mm) in black (ND= natural drought) and in white (AD = amplified 45
drought). The curve represents the mean monthly temperature (°C). At each forest site, drought 46
0
40
80
120
160
200
0
20
40
60
80
100
D J F M A M J J A S O N D
Air t
emper
atur
e (°
C)
Precipitation_ND Precipitation_AD Air temperature
Pre
cipita
tio
n(m
m)
Drought period
- 30%
0
40
80
120
160
200
0
20
40
60
80
100
D J F M A M J J A S O N D
Air t
emper
atur
e (°
C)
Pre
cipita
tio
n(m
m)
a)
Drought period
- 33%
0
40
80
120
160
200
0
20
40
60
80
100
D J F M A M J J A S O N D
Air t
emper
atur
e (°
C)
Pre
cipita
tio
n(m
m)
b)
Drought period
- 30%
c)

5
period is indicated by the horizontal arrow and the percentage represents the proportion of 47
excluded rain compared to the natural drought plot. 48
49
50
51
52
53
54
55
56
57
58
59
60
61
62
63
64
65
66
67
68
69

6
70
Supplementary Figure 2 – Rain exclusion devices in the three forest studies (a) Q. 71
pubescens forest at O3HP, (b) Quercus ilex at Puéchabon and (c) P. halepensis at Font-72
Blanche. 73
74
75
a)
b)
c)

7
76
77
Supplementary Figure 3 - Litterbags experimental design: 1) leaf litter of the three tree 78
species (Q. pubescens, Q. ilex and P. halepensis) coming from natural drought (ND) were 79
redistributed and placed 2) in the three different forests (O3HP, Puéchabon and Font-Blanche, 80
respectively), under natural drought (ND) and amplified drought (AD) conditions . 81
82
83
84

1
Appendix
Curiculum vitae Mgr. Ing. Andrea Faitová
Date of birth: 28th May, 1991 Contact: , Praha 9, 196 00, Czech Republic
E-mail:
Current positions Young researcher
Czech Republic
Ph.D. student (Cotutelle)
Education
September 2015 - February 2021: (Cotutelle) Thesis title: Department of Ecology, Faculty of Science, Charles University in Prague (CZ)
Supervisor: - Microbial Ecology, doctoral school Evolution, Ecosystèmes, Microbiologie et Modélisation, University Claude Bernard Lyon 1 (FR)
Supervisor: - September 2013 – May 2016
Thesis Title:
Supervisor
September 2013 – May 2015:
Thesis Title:
Supervisor: -
September 2010 – September 2013
Thesis Title Supervisor
Scholarships
May 2017 -
April 2016 – December 2014 –

2
Publications
2019
Buresova A - (2019), Applied
and Environmental Microbiology, 85 (24): e01760-19
Buresova A - - (2019),
FEMS Microbiology Ecology, 95 (12): fiz168
2016
-
Burešová A 2016),
, Soil Biology and Biochemistry, 101, 65-73
Burešová A, -
P, (2016), -application, Environmental Earth Sciences
2013
Burešová A
-
, Soil Biology and Biochemistry –
Contributions at scientific meetings and conferences
December 2020:
June 2019: May 2017: December 2015
Scientific internship October 2017 - December 2017: Ben-
Research topic June 2016 – July 2016
Research topic: Actinobacteria
Main research interests
Actinobacteria Microbial d
Methods experience

3
, Actinobacteria
Bioinformatic -
Canoco, R)
Other qualifications
French (B1)
Copyright © 2022 FDOKUMEN