Anthropogenic emissions of non-methane volatile organic compounds in China
14
Atmospheric Environment 36 (2002) 1309–1322 Anthropogenic emissions of non-methane volatile organic compounds in China Zbigniew Klimont a, *, David G. Streets b , Shalini Gupta b , Janusz Cofala a , Fu Lixin c , Yoichi Ichikawa d a International Institute for Applied Systems Analysis, A-2361 Laxenburg, Austria b Argonne National Laboratory, 9700 South Cass Avenue, Argonne, IL 60439, USA c Tsinghua University, Beijing 100084, China d Central Research Institute of Electric Power Industry, 2-11-1, Iwado Kita, Komae-shi, Tokyo 201-8511, Japan Received 23 April 2001; received in revised form 8 October 2001; accepted 17 October 2001 Abstract Inventories of emissions of non-methane volatile organic compounds (NMVOC) in China are reported for the years 1990, 1995, 2000, 2010, and 2020. For 1990 and 1995, historical activity data were assembled for more than 70 processes that lead to the release of NMVOC. Appropriate emission factors were developed, based on Western, Asian and Chinese experience. It is estimated that emissions were 11.1 Tg in 1990 and 13.1 Tg in 1995, principally from the combustion of biofuels and coal in small combustors. All emissions are presented at provincial level. Using appropriate growth factors derived from anticipated economic, population, and lifestyle changes, and factoring in regulatory changes and technology improvements, we estimate that emissions could grow to 15.6 Tg in 2000, 17.2 Tg in 2010, and 18.2 Tg in 2020. Though activity growth rates are much higher than these increases would imply, technology improvements mediate the increases. Emissions from solvent use, paint use, and transport become increasingly important as time goes on. The sectoral distribution and per capita level of China’s emissions are compared with those of other countries. Finally, gridded NMVOC emission fields are presented at 11 11 resolution, and speciation of the emissions into 16 chemical types is reported. r 2002 Elsevier Science Ltd. All rights reserved. Keywords: Air pollution; Non-methane volatile organic compounds (NMVOC); Emission inventory; Emission scenarios; China provinces 1. Background Emissions of non-methane volatile organic com- pounds (NMVOC) in China are important for the development of an understanding of the formation of ozone in East Asia. Together with nitrogen oxides (NO x ), NMVOC are the main inputs to atmospheric chemistry models designed to study the formation and fate of photochemical oxidants in the atmosphere. We present here an inventory of anthropogenic NMVOC emissions in China, about which very little has been previously reported. Biogenic emissions are also large in southern China and would need to be considered in any description of total organic compound releases to the atmosphere. This inventory was developed to support two Asian atmospheric modeling programs: a compre- hensive study of large-scale environmental problems in East Asia, funded by the Central Research Institute of Electric Power Industry (CRIEPI) of Japan (Amann et al., 2000); and the China-MAP program, funded by the US National Aeronautics and Space Administration (NASA). As part of the China-MAP program, this represents the third paper in a series, previous papers having addressed emissions of SO 2 , NO x , CO, and black carbon (Streets and Waldhoff, 2000; Streets et al., 2001). *Corresponding author. Fax: +43-2236-807-533. E-mail address: [email protected] (Z. Klimont). 1352-2310/02/$ - see front matter r 2002 Elsevier Science Ltd. All rights reserved. PII:S1352-2310(01)00529-5
Transcript of Anthropogenic emissions of non-methane volatile organic compounds in China
Atmospheric Environment 36 (2002) 1309–1322
Anthropogenic emissions of non-methane volatile organiccompounds in China
Zbigniew Klimonta,*, David G. Streetsb, Shalini Guptab, Janusz Cofalaa,Fu Lixinc, Yoichi Ichikawad
a International Institute for Applied Systems Analysis, A-2361 Laxenburg, AustriabArgonne National Laboratory, 9700 South Cass Avenue, Argonne, IL 60439, USA
cTsinghua University, Beijing 100084, ChinadCentral Research Institute of Electric Power Industry, 2-11-1, Iwado Kita, Komae-shi, Tokyo 201-8511, Japan
Received 23 April 2001; received in revised form 8 October 2001; accepted 17 October 2001
Abstract
Inventories of emissions of non-methane volatile organic compounds (NMVOC) in China are reported for the years
1990, 1995, 2000, 2010, and 2020. For 1990 and 1995, historical activity data were assembled for more than 70 processes
that lead to the release of NMVOC. Appropriate emission factors were developed, based on Western, Asian and
Chinese experience. It is estimated that emissions were 11.1Tg in 1990 and 13.1Tg in 1995, principally from the
combustion of biofuels and coal in small combustors. All emissions are presented at provincial level. Using appropriate
growth factors derived from anticipated economic, population, and lifestyle changes, and factoring in regulatory
changes and technology improvements, we estimate that emissions could grow to 15.6Tg in 2000, 17.2Tg in 2010, and
18.2Tg in 2020. Though activity growth rates are much higher than these increases would imply, technology
improvements mediate the increases. Emissions from solvent use, paint use, and transport become increasingly
important as time goes on. The sectoral distribution and per capita level of China’s emissions are compared with those
of other countries. Finally, gridded NMVOC emission fields are presented at 11� 11 resolution, and speciation of theemissions into 16 chemical types is reported. r 2002 Elsevier Science Ltd. All rights reserved.
Keywords: Air pollution; Non-methane volatile organic compounds (NMVOC); Emission inventory; Emission scenarios; China
provinces
1. Background
Emissions of non-methane volatile organic com-
pounds (NMVOC) in China are important for the
development of an understanding of the formation of
ozone in East Asia. Together with nitrogen oxides
(NOx), NMVOC are the main inputs to atmospheric
chemistry models designed to study the formation and
fate of photochemical oxidants in the atmosphere. We
present here an inventory of anthropogenic NMVOC
emissions in China, about which very little has been
previously reported. Biogenic emissions are also large in
southern China and would need to be considered in any
description of total organic compound releases to the
atmosphere. This inventory was developed to support
two Asian atmospheric modeling programs: a compre-
hensive study of large-scale environmental problems in
East Asia, funded by the Central Research Institute of
Electric Power Industry (CRIEPI) of Japan (Amann
et al., 2000); and the China-MAP program, funded by
the US National Aeronautics and Space Administration
(NASA). As part of the China-MAP program, this
represents the third paper in a series, previous papers
having addressed emissions of SO2, NOx, CO, and black
carbon (Streets and Waldhoff, 2000; Streets et al., 2001).*Corresponding author. Fax: +43-2236-807-533.
E-mail address: [email protected] (Z. Klimont).
1352-2310/02/$ - see front matter r 2002 Elsevier Science Ltd. All rights reserved.
PII: S 1 3 5 2 - 2 3 1 0 ( 0 1 ) 0 0 5 2 9 - 5
This present paper addresses anthropogenic emissions of
NMVOC in China at provincial level for the period
1990–2020. For 1995 and 2020, emissions are also
spatially distributed into grids. Speciation of total
NMVOC into major chemical constituents is also
presented.
2. Methodology
The emission estimates are developed within the
framework of the RAINS-Asia simulation model (Shah
et al., 2000). The basic concept of the RAINS emission
calculation is to estimate emissions for each of the
source categories distinguished in the model as a product
of the activity rate, the (unabated) emission factor and
the removal efficiency of applied emission control
devices, as described in Klimont et al., 2000:
Ek ¼X
l
Xm
Xn
Ak; l; m efk; l; mð1� Zl; m; nak; l; m; nÞ
� Xk; l; m; n; ð1Þ
where k; l;m; n are province, sector, fuel or activity type,abatement technology; E denotes emissions of
NMVOC; A the activity rate; ef the unabated emission
factor; Z the removal efficiency; a the maximum
application rate; and X the actual application rate of
control technology n1.
2.1. Emission factors for NMVOC
Determination of NMVOC emission factors for each
of the major emitting sectors in China is a daunting task.
There are no reports available that describe process
details for many of the NMVOC-emitting activities.
Therefore, for several categories we have used informa-
tion derived from western sources, but modified appro-
priately to reflect expected differences, today and in the
future, between Chinese and western technology and
practice. To the best of our knowledge, no estimates of
NMVOC emissions in China have been developed by
Chinese researchers.
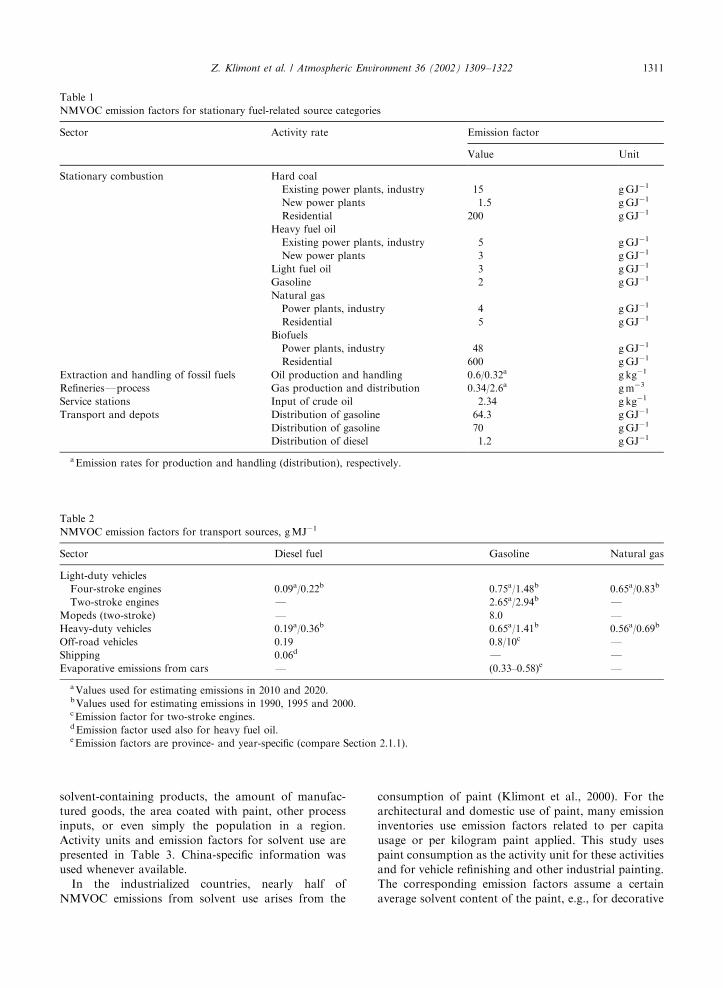
2.1.1. Emissions related to the use of fossil fuels
Emission factors for stationary sources are derived
from several international studies, e.g., EEA, 1999;
BUWAL, 1995; IFARE, 1998; Klimont et al., 2000
(Table 1). As shown later, the emissions from combus-
tion of coal and biofuels in the residential sector
represent a large proportion of the total, and therefore
the choices of emission factors for these activities will
influence the results substantially. There is little specific
data for Chinese boilers, furnaces and stoves used in the
residential/commercial sector. Zhang et al. (2000)
recently reported measurements of total non-methane
hydrocarbons (TNMHC) emissions (as C) from house-
hold stoves in China, but they cannot be directly
compared with emission rates used in this work. This
is because Zhang et al. (2000) did not report species
profiles and so we do not know what percentage of total
NMVOC they measured is represented by the reported
carbon emissions. The results of measurements carried
out in Europe indicate great variation (this is also
confirmed by Zhang et al. (2000)), depending mainly on
the condition of the installation and operating practices.
The range of reported emission factors varies from 50 to
600 gGJ�1 for coal and from 150 to 800 gGJ�1 for
biofuel installations (EEA, 1999).
NMVOC emission factors for transport sources
(Table 2) are based on the European experience of the
mid-1980s, with no control technology (EEA, 1999).
Emission factors for diesel vehicles were adjusted for
historical years (increased by about 20%) to take into
account the difference in diesel fuel quality used in
China. According to several authors (e.g., Walsh and
Shah, 1997; World Bank, 1997), diesel fuels used in
China have higher aromatic hydrocarbon content and
relatively low cetane values. This results in increased
hydrocarbon, NOx and soot emissions. Same sources
indicate that old fleets of vehicles in China and lack of
enforcement of emission standards lead to very high
emission rates from gasoline vehicles, even 10–20 times
higher than those from modern vehicles. In this study,
however, more modest assumptions are employed based
on the work of Tsinghua University (1997). This has
been done only for the estimation of emissions in 1990,
1995 and 2000. Emission factors for evaporative losses
from cars were derived using assumptions about typical
mileage and fuel consumption, share of vehicles with
carburetor and fuel injection, fuel characteristic, number
of hot soak cycles and diurnal temperature changes. The
method used to estimate these emission factors relies on
the methodology developed at the University of
Thessaloniki (Greece) and is documented in EEA
(1999). Air traffic emissions (only landing and take-
off) are estimated for the major airports using data on
total aircraft movements (compare Section 3.1) and on
emission rates for some European airports.
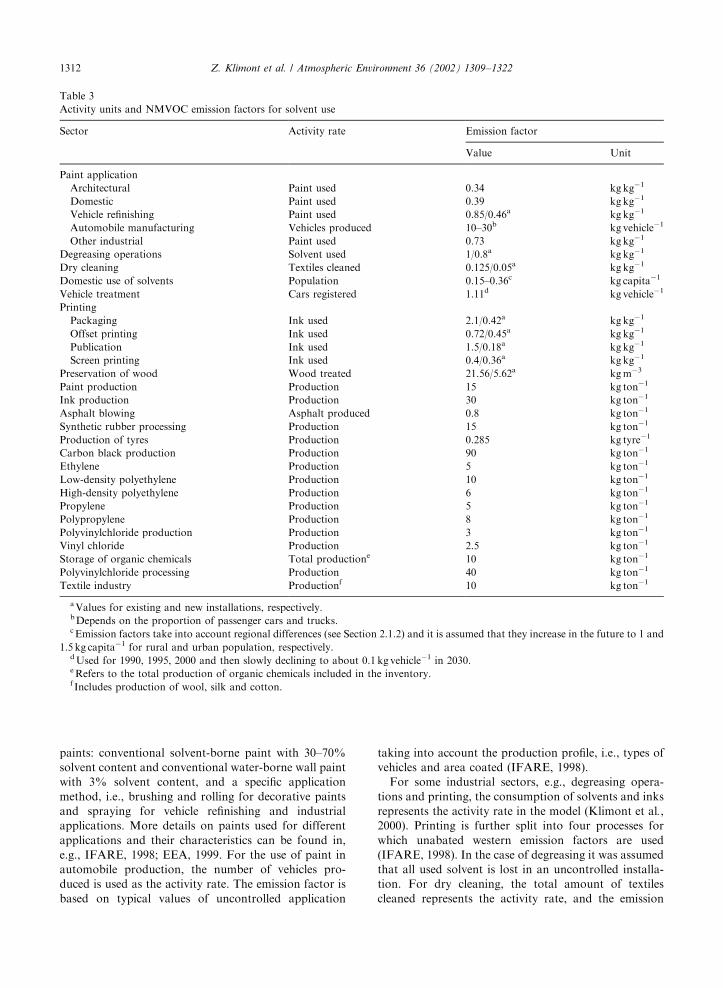
2.1.2. Evaporative emissions from solvent use
Solvents are used in a wide variety of activities,
including the production and use of paints, cosmetics,
rubber, chemicals, etc., and for cleaning in industry and
households. Much of these solvents subsequently
evaporate into the air. Since it is difficult to derive, at
least for some of these specific activities, reliable
statistics and projections for their future development,
a set of surrogate indicators has been employed.
Such surrogate activity rates include the use of
1Note that the set of control options (n) includes also a ‘no-
control’ case, such that SnX ¼ 1:
Z. Klimont et al. / Atmospheric Environment 36 (2002) 1309–13221310
solvent-containing products, the amount of manufac-
tured goods, the area coated with paint, other process
inputs, or even simply the population in a region.
Activity units and emission factors for solvent use are
presented in Table 3. China-specific information was
used whenever available.
In the industrialized countries, nearly half of
NMVOC emissions from solvent use arises from the
consumption of paint (Klimont et al., 2000). For the
architectural and domestic use of paint, many emission
inventories use emission factors related to per capita
usage or per kilogram paint applied. This study uses
paint consumption as the activity unit for these activities
and for vehicle refinishing and other industrial painting.
The corresponding emission factors assume a certain
average solvent content of the paint, e.g., for decorative
Table 2
NMVOC emission factors for transport sources, gMJ�1
Sector Diesel fuel Gasoline Natural gas
Light-duty vehicles
Four-stroke engines 0.09a/0.22b 0.75a/1.48b 0.65a/0.83b
Two-stroke engines F 2.65a/2.94b FMopeds (two-stroke) F 8.0 FHeavy-duty vehicles 0.19a/0.36b 0.65a/1.41b 0.56a/0.69b
Off-road vehicles 0.19 0.8/10c FShipping 0.06d F FEvaporative emissions from cars F (0.33–0.58)e F
aValues used for estimating emissions in 2010 and 2020.bValues used for estimating emissions in 1990, 1995 and 2000.cEmission factor for two-stroke engines.dEmission factor used also for heavy fuel oil.eEmission factors are province- and year-specific (compare Section 2.1.1).
Table 1
NMVOC emission factors for stationary fuel-related source categories
Sector Activity rate Emission factor
Value Unit
Stationary combustion Hard coal
Existing power plants, industry 15 gGJ�1
New power plants 1.5 gGJ�1
Residential 200 gGJ�1
Heavy fuel oil
Existing power plants, industry 5 gGJ�1
New power plants 3 gGJ�1
Light fuel oil 3 gGJ�1
Gasoline 2 gGJ�1
Natural gas
Power plants, industry 4 gGJ�1
Residential 5 gGJ�1
Biofuels
Power plants, industry 48 gGJ�1
Residential 600 gGJ�1
Extraction and handling of fossil fuels Oil production and handling 0.6/0.32a g kg�1
RefineriesFprocess Gas production and distribution 0.34/2.6a gm�3
Service stations Input of crude oil 2.34 g kg�1
Transport and depots Distribution of gasoline 64.3 gGJ�1
Distribution of gasoline 70 gGJ�1
Distribution of diesel 1.2 gGJ�1
aEmission rates for production and handling (distribution), respectively.
Z. Klimont et al. / Atmospheric Environment 36 (2002) 1309–1322 1311
paints: conventional solvent-borne paint with 30–70%
solvent content and conventional water-borne wall paint
with 3% solvent content, and a specific application
method, i.e., brushing and rolling for decorative paints
and spraying for vehicle refinishing and industrial
applications. More details on paints used for different
applications and their characteristics can be found in,
e.g., IFARE, 1998; EEA, 1999. For the use of paint in
automobile production, the number of vehicles pro-
duced is used as the activity rate. The emission factor is
based on typical values of uncontrolled application
taking into account the production profile, i.e., types of
vehicles and area coated (IFARE, 1998).
For some industrial sectors, e.g., degreasing opera-
tions and printing, the consumption of solvents and inks
represents the activity rate in the model (Klimont et al.,
2000). Printing is further split into four processes for
which unabated western emission factors are used
(IFARE, 1998). In the case of degreasing it was assumed
that all used solvent is lost in an uncontrolled installa-
tion. For dry cleaning, the total amount of textiles
cleaned represents the activity rate, and the emission
Table 3
Activity units and NMVOC emission factors for solvent use
Sector Activity rate Emission factor
Value Unit
Paint application
Architectural Paint used 0.34 kg kg�1
Domestic Paint used 0.39 kg kg�1
Vehicle refinishing Paint used 0.85/0.46a kg kg�1
Automobile manufacturing Vehicles produced 10–30b kg vehicle�1
Other industrial Paint used 0.73 kg kg�1
Degreasing operations Solvent used 1/0.8a kg kg�1
Dry cleaning Textiles cleaned 0.125/0.05a kg kg�1
Domestic use of solvents Population 0.15–0.36c kg capita�1
Vehicle treatment Cars registered 1.11d kg vehicle�1
Printing
Packaging Ink used 2.1/0.42a kg kg�1
Offset printing Ink used 0.72/0.45a kg kg�1
Publication Ink used 1.5/0.18a kg kg�1
Screen printing Ink used 0.4/0.36a kg kg�1
Preservation of wood Wood treated 21.56/5.62a kgm�3
Paint production Production 15 kg ton�1
Ink production Production 30 kg ton�1
Asphalt blowing Asphalt produced 0.8 kg ton�1
Synthetic rubber processing Production 15 kg ton�1
Production of tyres Production 0.285 kg tyre�1
Carbon black production Production 90 kg ton�1
Ethylene Production 5 kg ton�1
Low-density polyethylene Production 10 kg ton�1
High-density polyethylene Production 6 kg ton�1
Propylene Production 5 kg ton�1
Polypropylene Production 8 kg ton�1
Polyvinylchloride production Production 3 kg ton�1
Vinyl chloride Production 2.5 kg ton�1
Storage of organic chemicals Total productione 10 kg ton�1
Polyvinylchloride processing Production 40 kg ton�1
Textile industry Productionf 10 kg ton�1
aValues for existing and new installations, respectively.bDepends on the proportion of passenger cars and trucks.cEmission factors take into account regional differences (see Section 2.1.2) and it is assumed that they increase in the future to 1 and
1.5 kg capita�1 for rural and urban population, respectively.dUsed for 1990, 1995, 2000 and then slowly declining to about 0.1 kg vehicle�1 in 2030.eRefers to the total production of organic chemicals included in the inventory.f Includes production of wool, silk and cotton.
Z. Klimont et al. / Atmospheric Environment 36 (2002) 1309–13221312
rates are characteristic for open-circuit machines
(IFARE, 1998).
For wood preservation, the volume of wood treated is
used, typically about 35% of industrial round-wood is
processed and only a few percent is treated. In order to
derive emission factors for typical applications, esti-
mates were made of the method and share of different
preservatives used, i.e., creosote, solvent- and water-
based. It was also assumed that current practices would
change in the future (less use of creosote and increased
share of water-based preservatives), resulting in a lower
emission factor in future years.
For calculating historical NMVOC emissions from
the production of paint, glues, synthetic rubber, tyres
and processing of PVC the amount of manufactured
product is used as the explanatory variable. Emission
factors are based on European experience (EEA, 1999;
EC, 1994).
Another important source of NMVOC emissions is
the domestic use of solvents (other than paints), which is
estimated to contribute 3–6% to total anthropogenic
emissions in Europe in 1990 (Klimont et al., 2000). It is
expected that in China the per-capita emissions are
lower but owing to the relatively small contribution of
other sectors like transportation, we estimate its share in
total Chinese emissions in the 90’s at about 2%. This
category comprises a wide range of articles used in
households, e.g., household and personal care products,
adhesives and glues, automotive care and maintenance
products. Due to the absence of detailed information, a
simple approach based on per-capita emission factors is
applied (Table 3). These emission factors were derived
from information contained in national (Passant and
Vincent, 1998; ERM, 1996) and regional (Umweltmi-
nisterium Baden-W .urttemberg, 1993) inventories for
developed countries and were modified to account for
the different situation in China. The specific emission
rates for China were developed based on expert
judgement on the relative importance of product groups
(body care, hair spray, automotive and household
cleaning) consumed, distinguishing between different
consumption patterns in urban and rural areas.
2.1.3. Organic and inorganic chemical industry
In Europe, the manufacturing, storage and handling
of more than 20 different products in the organic
chemicals industry contribute about 2.4% to total
NMVOC emissions (Klimont et al., 2000). Another
0.7% arises from production processes in the inorganic
chemical industry, e.g., carbon black. In this work,
emissions from the manufacturing and handling of
ethylene, low- and high-density polyethylene, propylene,
polypropylene, vinyl chloride, polyvinylchloride, and
carbon black are estimated for Chinese provinces. The
emission factors (Table 3) are derived from several
Western European studies (BUWAL, 1995; EEA, 1999;
ERM, 1996; EC, 1994; IFARE, 1998). In the context of
a regional analysis and considering that it is not possible
to obtain consistent long-term forecasts for manufactur-
ing of specific chemicals, it does not seem worthwhile to
distinguish all the individual processes to estimate future
emission levels, but to treat them on an aggregated level.
A problem arises, however, when determining the
appropriate emission factor related to the aggregated
activity level for these processes. It was decided to use
the emissions for 1995 as the activity rate and let
emissions change over time according to different rates
of economic development, taking into account the
envisaged technological improvements resulting in, inter
alia, lower emission rates per unit of product. A similar
approach was used for projecting activities in some
other sectors, i.e., production of paint, glue, rubber,
tires, and miscellaneous sources addressed in Section
2.1.4.
2.1.4. Miscellaneous sources
The source categories discussed above leave out a
number of other activities that generate NMVOC
emissions. These activities are responsible for more than
6% of anthropogenic NMVOC emissions in 1990 in
Europe. They comprise a wide spectrum of activities,
ranging from agriculture and food industry to waste
treatment, road paving with asphalt, pulp and paper,
textile and heavy industry (coke oven, iron and steel,
etc.). Emission factors (Table 4) originate mostly from
European studies (EC, 1994; Umweltministerium Ba-
den-W .urttemberg, 1993; EEA, 1999; IFARE, 1998).
3. Compilation of the activity database
When estimating NMVOC emissions, it is important
to carefully define appropriate activity units that are
detailed enough to provide meaningful surrogate in-
dicators for actual operations of a variety of different
technical processes and yet aggregated enough to make
it possible to project their future development with a
reasonable set of generalized assumptions. Considering
the data availability for China and drawing on the
experience from the work carried out for Europe
(Klimont et al., 2000), we used more disaggregated
activity data to prepare inventories for historical
periods, i.e., 1990 and 1995, than for the future years.
3.1. Data sources
The major categories of data and their sources for
1990 and 1995 are summarized below.
* Population statisticsFUN (1998a, b), SSB (1990,
1991, 1996, 1998b);
Z. Klimont et al. / Atmospheric Environment 36 (2002) 1309–1322 1313

* vehicles in use, annual sales, production statis-
ticsFMVMA (1992), AAMA (1998), UN (1999),
SSB (1991, 1996);* energy statistics (e.g., SSB, 1998a; Shah et al., 2000;
PennWell, 1991, 1996; USDOE, 1991, 1996);* data on domestic production of gas and oil are based
on SSB (1991, 1996). Data on handling of oil at the
terminals originate from shipping statistics (SSY,
1991–1997);* data on paint use are derived from Zhu and Liu
(1996) and later distributed by province and sector
based on expert judgment and experience from
Europe and US;* statistics on the manufacture of various organic
chemicals, as well as carbon black, were collected
from SSB (1991, 1996), UN (1996), C&EN (1993,
1997). Some of the gaps in data for 1990 and 1995
were filled by establishing relations between produc-
tion of various substances in other Asian countries
for which detailed data were available;* data on the activities of several industries, i.e.,
manufacturing of paint, ink, rubber, tires, textiles,
etc., originate from SSB (1990, 1991, 1996), UN
(1996), C&EN (1993, 1997), Zhu and Liu (1996);* production of coke, steel, asphalt, etc., is derived
from SSB (1991), UN (1996), USGS (1994, 1997);* bread and alcohol production originates from SSB
(1990, 1991, 1996), UN (1996, 1999);* data on industrial round-wood originate from FAO
(1995, 1997), UN (1999), SSB (1991, 1996, 1998).
Additional sources were used to fill gaps in data for
the pulp and paper industry (UN, 1996);* information about the amounts of domestic and
industrial waste landfilled or incinerated was col-
lected from SSB (1991, 1996);
* data on the emissions of NMVOC from air traffic
have not been found, but are based on statistical
information (aircraft movements) for the largest
airports [www.airports.org], and data on emission
rates for some European airports;* data on the burning of agricultural waste are derived
from crop production statistics (USDA, 1998) that
were transformed into total residues, using crop/
residue ratios from Lu (1993). It has been estimated
that B23% of total residues are combusted as a
means of disposal in China (Crutzen and Andreae,
1990).
This study aims at providing a complete picture of
anthropogenic emissions of NMVOC in China. How-
ever, the activity data for some of the important
emission categories are either missing or very difficult
to obtain. In order to provide first estimates of
emissions, activity data for some of these categories
were derived based on expert knowledge. For domestic
solvent use, dry cleaning and application of glue in
industry, the information available for Western Europe,
Eastern Europe, United States and Canada, as well as
discussions with Chinese experts, has been used to derive
the relevant relationships. For degreasing and printing,
solvent consumption was derived from analysis of the
relation between the emissions and the value added in
the manufacturing industry in Western Europe (assum-
ing a no-control situation). The regional distribution of
emissions from degreasing is based on the industrial
GDP and for printing on the GDP of small enterprises.
No information on the pharmaceutical industry was
found and consequently no estimate is provided;
however, it is believed that this sector is a minor source
of NMVOC emissions in China.
Table 4
Activity units and NMVOC emission factors for other sources
Sector Activity rate Emission factor
Value Unit
Bread production Production 4.5 kg ton�1
Beer production Production 0.2 kgm�3
Spirits production Production 20 kgm�3
Coke oven Coke production 1.44 kg ton�1
Steel production Production 0.055 kg ton�1
Rolling mills Production 0.25 kg ton�1
Asphalt production Production 1.25 kg ton�1
Pulp and paper Paper pulp production 3.5 kg ton�1
Waste disposal
Landfills Amount of waste 0.23 kg ton�1
Incineration Amount of waste 0.74/7.4a kg ton�1
Agricultural waste burning Crop residues 8.5 kg ton�1
aDomestic and industrial waste, respectively. It is assumed that in the future more waste will be incinerated, but since many
incinerators are in urban areas the emission rate will decline as a result of stricter regulation to about 0.1 kg ton�1.
Z. Klimont et al. / Atmospheric Environment 36 (2002) 1309–13221314
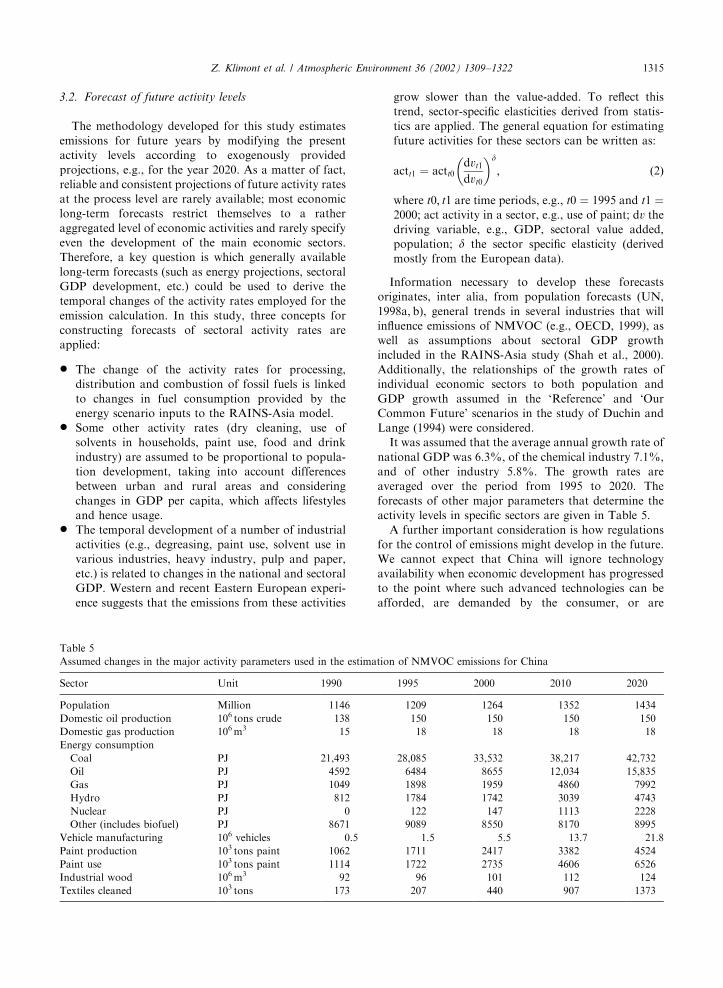
3.2. Forecast of future activity levels
The methodology developed for this study estimates
emissions for future years by modifying the present
activity levels according to exogenously provided
projections, e.g., for the year 2020. As a matter of fact,
reliable and consistent projections of future activity rates
at the process level are rarely available; most economic
long-term forecasts restrict themselves to a rather
aggregated level of economic activities and rarely specify
even the development of the main economic sectors.
Therefore, a key question is which generally available
long-term forecasts (such as energy projections, sectoral
GDP development, etc.) could be used to derive the
temporal changes of the activity rates employed for the
emission calculation. In this study, three concepts for
constructing forecasts of sectoral activity rates are
applied:
* The change of the activity rates for processing,
distribution and combustion of fossil fuels is linked
to changes in fuel consumption provided by the
energy scenario inputs to the RAINS-Asia model.* Some other activity rates (dry cleaning, use of
solvents in households, paint use, food and drink
industry) are assumed to be proportional to popula-
tion development, taking into account differences
between urban and rural areas and considering
changes in GDP per capita, which affects lifestyles
and hence usage.* The temporal development of a number of industrial
activities (e.g., degreasing, paint use, solvent use in
various industries, heavy industry, pulp and paper,
etc.) is related to changes in the national and sectoral
GDP. Western and recent Eastern European experi-
ence suggests that the emissions from these activities
grow slower than the value-added. To reflect this
trend, sector-specific elasticities derived from statis-
tics are applied. The general equation for estimating
future activities for these sectors can be written as:
actt1 ¼ actt0dvt1
dvt0
� �d
; ð2Þ
where t0; t1 are time periods, e.g., t0 ¼ 1995 and t1 ¼2000; act activity in a sector, e.g., use of paint; dv the
driving variable, e.g., GDP, sectoral value added,
population; d the sector specific elasticity (derived
mostly from the European data).
Information necessary to develop these forecasts
originates, inter alia, from population forecasts (UN,
1998a, b), general trends in several industries that will
influence emissions of NMVOC (e.g., OECD, 1999), as
well as assumptions about sectoral GDP growth
included in the RAINS-Asia study (Shah et al., 2000).
Additionally, the relationships of the growth rates of
individual economic sectors to both population and
GDP growth assumed in the ‘Reference’ and ‘Our
Common Future’ scenarios in the study of Duchin and
Lange (1994) were considered.
It was assumed that the average annual growth rate of
national GDP was 6.3%, of the chemical industry 7.1%,
and of other industry 5.8%. The growth rates are
averaged over the period from 1995 to 2020. The
forecasts of other major parameters that determine the
activity levels in specific sectors are given in Table 5.
A further important consideration is how regulations
for the control of emissions might develop in the future.
We cannot expect that China will ignore technology
availability when economic development has progressed
to the point where such advanced technologies can be
afforded, are demanded by the consumer, or are
Table 5
Assumed changes in the major activity parameters used in the estimation of NMVOC emissions for China
Sector Unit 1990 1995 2000 2010 2020
Population Million 1146 1209 1264 1352 1434
Domestic oil production 106 tons crude 138 150 150 150 150
Domestic gas production 106m3 15 18 18 18 18
Energy consumption
Coal PJ 21,493 28,085 33,532 38,217 42,732
Oil PJ 4592 6484 8655 12,034 15,835
Gas PJ 1049 1898 1959 4860 7992
Hydro PJ 812 1784 1742 3039 4743
Nuclear PJ 0 122 147 1113 2228
Other (includes biofuel) PJ 8671 9089 8550 8170 8995
Vehicle manufacturing 106 vehicles 0.5 1.5 5.5 13.7 21.8
Paint production 103 tons paint 1062 1711 2417 3382 4524
Paint use 103 tons paint 1114 1722 2735 4606 6526
Industrial wood 106m3 92 96 101 112 124
Textiles cleaned 103 tons 173 207 440 907 1373
Z. Klimont et al. / Atmospheric Environment 36 (2002) 1309–1322 1315
necessary to prevent deterioration of the environment.
One good example of this is vehicle emissions perfor-
mance. We assume that the equivalent of EURO1 and
EURO2 emission standards for both gasoline and diesel
vehicles will be the standard for new vehicles in China
after 2000. Generally, though, other sources of NMVOC
are expected to remain uncontrolled throughout the
period of this study. The exception is Hong Kong, for
which we assume EURO1 and EURO2 standards after
1995 as well as introduction of carbon canisters on cars
and oxidation catalysts for two-wheelers. Evaporative
losses from several industries, e.g. refineries, chemical
industry, etc. and gasoline distribution are also assumed
to be controlled in Hong Kong.
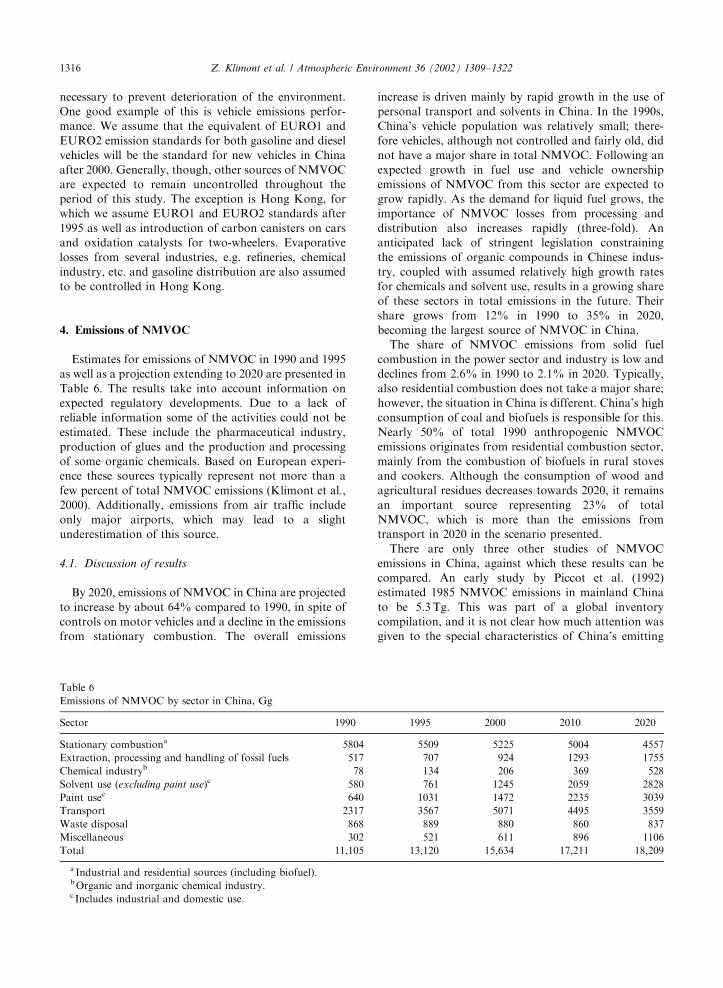
4. Emissions of NMVOC
Estimates for emissions of NMVOC in 1990 and 1995
as well as a projection extending to 2020 are presented in
Table 6. The results take into account information on
expected regulatory developments. Due to a lack of
reliable information some of the activities could not be
estimated. These include the pharmaceutical industry,
production of glues and the production and processing
of some organic chemicals. Based on European experi-
ence these sources typically represent not more than a
few percent of total NMVOC emissions (Klimont et al.,
2000). Additionally, emissions from air traffic include
only major airports, which may lead to a slight
underestimation of this source.
4.1. Discussion of results
By 2020, emissions of NMVOC in China are projected
to increase by about 64% compared to 1990, in spite of
controls on motor vehicles and a decline in the emissions
from stationary combustion. The overall emissions
increase is driven mainly by rapid growth in the use of
personal transport and solvents in China. In the 1990s,
China’s vehicle population was relatively small; there-
fore vehicles, although not controlled and fairly old, did
not have a major share in total NMVOC. Following an
expected growth in fuel use and vehicle ownership
emissions of NMVOC from this sector are expected to
grow rapidly. As the demand for liquid fuel grows, the
importance of NMVOC losses from processing and
distribution also increases rapidly (three-fold). An
anticipated lack of stringent legislation constraining
the emissions of organic compounds in Chinese indus-
try, coupled with assumed relatively high growth rates
for chemicals and solvent use, results in a growing share
of these sectors in total emissions in the future. Their
share grows from 12% in 1990 to 35% in 2020,
becoming the largest source of NMVOC in China.
The share of NMVOC emissions from solid fuel
combustion in the power sector and industry is low and
declines from 2.6% in 1990 to 2.1% in 2020. Typically,
also residential combustion does not take a major share;
however, the situation in China is different. China’s high
consumption of coal and biofuels is responsible for this.
Nearly 50% of total 1990 anthropogenic NMVOC
emissions originates from residential combustion sector,
mainly from the combustion of biofuels in rural stoves
and cookers. Although the consumption of wood and
agricultural residues decreases towards 2020, it remains
an important source representing 23% of total
NMVOC, which is more than the emissions from
transport in 2020 in the scenario presented.
There are only three other studies of NMVOC
emissions in China, against which these results can be
compared. An early study by Piccot et al. (1992)
estimated 1985 NMVOC emissions in mainland China
to be 5.3Tg. This was part of a global inventory
compilation, and it is not clear how much attention was
given to the special characteristics of China’s emitting
Table 6
Emissions of NMVOC by sector in China, Gg
Sector 1990 1995 2000 2010 2020
Stationary combustiona 5804 5509 5225 5004 4557
Extraction, processing and handling of fossil fuels 517 707 924 1293 1755
Chemical industryb 78 134 206 369 528
Solvent use (excluding paint use)c 580 761 1245 2059 2828
Paint usec 640 1031 1472 2235 3039
Transport 2317 3567 5071 4495 3559
Waste disposal 868 889 880 860 837
Miscellaneous 302 521 611 896 1106
Total 11,105 13,120 15,634 17,211 18,209
a Industrial and residential sources (including biofuel).bOrganic and inorganic chemical industry.c Includes industrial and domestic use.
Z. Klimont et al. / Atmospheric Environment 36 (2002) 1309–13221316
sources. Even though China’s NMVOC emissions were
undoubtedly growing quickly in the 1980s and 1990s, the
Piccot estimate still seems low compared to our 1990
estimate of 11.1Tg. We believe that our work is more
reliable than that of Piccot because of the inclusion of
more source types, the greater attention to China-
specific source types, and the recent availability of
improved emission factors. The EDGAR inventory
(Olivier et al., 1996) includes an estimate of 17.7Tg for
1990 for a region called China+, which includes
Mongolia, North Korea, Taiwan, Vietnam and several
other smaller countries. This incompatibility of geogra-
phical coverage makes direct comparison impossible.
Finally, Tonooka et al. (2001) have estimated 13.9Tg
for China in 1994, which is close to our estimate of
13.1Tg for 1995. However, comparison of the two
studies reveals significant differences at the sector level.
These differences have been found to be largely due to
choices of emission factors, and reconciliation and
harmonization between these two studies is in progress.
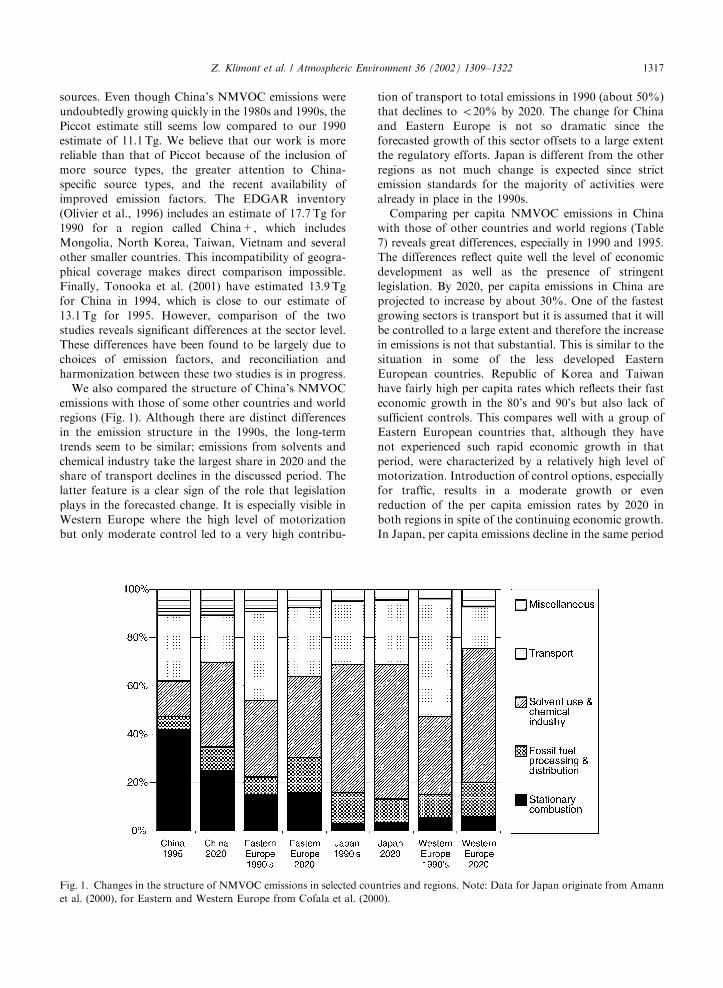
We also compared the structure of China’s NMVOC
emissions with those of some other countries and world
regions (Fig. 1). Although there are distinct differences
in the emission structure in the 1990s, the long-term
trends seem to be similar; emissions from solvents and
chemical industry take the largest share in 2020 and the
share of transport declines in the discussed period. The
latter feature is a clear sign of the role that legislation
plays in the forecasted change. It is especially visible in
Western Europe where the high level of motorization
but only moderate control led to a very high contribu-
tion of transport to total emissions in 1990 (about 50%)
that declines to o20% by 2020. The change for China
and Eastern Europe is not so dramatic since the
forecasted growth of this sector offsets to a large extent
the regulatory efforts. Japan is different from the other
regions as not much change is expected since strict
emission standards for the majority of activities were
already in place in the 1990s.
Comparing per capita NMVOC emissions in China
with those of other countries and world regions (Table
7) reveals great differences, especially in 1990 and 1995.
The differences reflect quite well the level of economic
development as well as the presence of stringent
legislation. By 2020, per capita emissions in China are
projected to increase by about 30%. One of the fastest
growing sectors is transport but it is assumed that it will
be controlled to a large extent and therefore the increase
in emissions is not that substantial. This is similar to the
situation in some of the less developed Eastern
European countries. Republic of Korea and Taiwan
have fairly high per capita rates which reflects their fast
economic growth in the 80’s and 90’s but also lack of
sufficient controls. This compares well with a group of
Eastern European countries that, although they have
not experienced such rapid economic growth in that
period, were characterized by a relatively high level of
motorization. Introduction of control options, especially
for traffic, results in a moderate growth or even
reduction of the per capita emission rates by 2020 in
both regions in spite of the continuing economic growth.
In Japan, per capita emissions decline in the same period
Fig. 1. Changes in the structure of NMVOC emissions in selected countries and regions. Note: Data for Japan originate from Amann
et al. (2000), for Eastern and Western Europe from Cofala et al. (2000).
Z. Klimont et al. / Atmospheric Environment 36 (2002) 1309–1322 1317

following the implementation of further controls on
stationary sources. A similar trend is observed in
Western Europe although the level in the 1990s was
substantially higher owing to less stringent vehicle
standards.
5. Spatial distribution and speciation of emissions
Table 8 presents the provincial distribution of
NMVOC. Provinces in which population, industry and
transport are expected to grow rapidly show the greatest
Table 7
Comparison of per capita NMVOC emissions in several countries and regions, kg capita�1
Region 1990 1995 2020 Population growth from 1990 to 2020 (%)
China 10 11 13 +25
Japana 17 16 14 0
Korea, Republic of a 20 26 27 +19
Taiwan, Chinaa 32 32 27 +12
Western Europeb 30–60 12–18 +5
Eastern Europeb B10c/(20–35) B12c/(15–25) �1
aData originates from Amann et al. (2000).bData originates from Cofala et al. (2000).cLess developed East European countries.
Table 8
NMVOC emissions in China by province, Gg
Province Year
1990 1995 2000 2010 2020
Anhui 356 409 481 535 600
Beijing 204 297 395 340 353
Fujian 299 322 375 458 464
Gansu 163 192 228 249 283
Guangdong 625 886 1248 1450 1361
Guangxi 360 405 471 542 589
Guizhou 294 332 374 397 429
Hainan 59 97 146 193 162
Hebei 594 700 825 905 910
Heilongjiang 529 611 698 747 828
Henan 601 677 786 881 960
Hong Kong 100 113 109 103 109
Hubei 573 657 750 842 915
Hunan 521 589 664 716 749
Jiangsu 755 822 974 1098 1150
Jiangxi 333 372 419 462 493
Jilin 334 385 434 468 510
Liaoning 594 719 894 915 960
Nei Mongol 242 265 299 339 352
Ningxia 49 53 62 66 72
Qinghai 35 41 48 52 52
Shaanxi 245 286 333 362 384
Shandong 771 975 1165 1289 1357
Shanghai 184 272 386 419 488
Shanxi 232 322 392 495 578
Sichuan 988 1044 1152 1260 1397
Tianjin 142 187 257 256 255
Xinjiang 161 202 237 260 273
Xizang 14 17 19 20 21
Yunnan 361 410 475 496 529
Zhejiang 388 463 538 597 626
Total 11,105 13,120 15,634 17,211 18,209
Z. Klimont et al. / Atmospheric Environment 36 (2002) 1309–13221318

increases during the time period of the study. For
example, emissions in Guangdong and Shanghai are
projected to more than double between 1990 and 2020.
Emissions in less-developed provinces, such as Guizhou
and Jiangxi, grow more modestly.
The spatial distribution of NMVOC emissions in 1995
is presented in Fig. 2 at 11� 11 resolution. Lacking
detailed information on the spatial pattern of sector-
specific activities, the regional emissions were distributed
into grids based on the population density map that was
created using data on population of counties and cities
(location of cities above 100,000 inhabitants was
considered). This simplified approach introduces some
uncertainty to the spatial distribution of emissions in
a province and might potentially lead to overestimation
of emissions in highly urbanized grids. The highest
emission density is observed in Shanghai, with a value of
250Gg/grid cell. This is consistent with Shanghai’s
present-day concentration of industrial and transport
activity. In the rest of China, the low level of vehicle
ownership in 1995 and the relatively low level of high-
tech industries that produce chemicals and use solvents
lead to a less-dense distribution of emissions, with no
grid cell >150Gg. China’s emission landscape in 2020
looks quite different from that observed in the 90’s
(Fig. 2). There are several grids where emissions exceed
150Gg NMVOC (the cities of Beijing, Guangzhou,
Nanjing, Shanghai, Shenyang, Tianjin, for example)
with the highest density estimated for Shanghai (450Gg/
grid). Many grid cells along the East and South coast of
China increase their emissions by a factor of two to
three, especially in the Shanxi, Shandong, Jiangsu,
Shanghai, and Guangdong provinces.
We have also conducted a speciation of the NMVOC
emissions. For this task we apportioned the NMVOC
emissions into 78 separate source categories, distinguish-
ing, for example, between the production of seven
different kinds of organic chemicals that have very
different chemical releases. We then used US EPA’s
SPECIATE data base (USEPA, 2000) to allocate
Fig. 2. Spatial distribution of NMVOC emissions in China in 1995 and 2020, kt/grid.
Z. Klimont et al. / Atmospheric Environment 36 (2002) 1309–1322 1319

emissions into 16 chemical species categories, selected
on the basis of reactivity and similarity (see Middleton
et al., 1990). Occasionally, we used EEA (1999)
speciation factors, and in the important category of
biofuel combustion in residential stoves, we used
results from a measurement program in Manila
(Smith et al., 1992). An implicit assumption is that
the organic compounds emitted in China from a
particular activity are similar in constituency to those
emitted from similar activities in the West. Table 9
shows the speciation results for each of the eight
major source categories for the year 2000. We believe
that these results are more representative for Chinese
emissions than speciation presented in the global
inventory by Piccot et al. (1992). Of course, apart from
more detailed estimates of sectoral emissions and use of
more recent information on sector-specific species
profiles, the observed difference is also due to the
economic growth that occurred between 1985 and 2000.
We find that alkanes contributed 32% of the total,
mainly from fossil-fuel extraction, processing, and
distribution; stationary source combustion; and trans-
port. Alkenes and acetylene contributed 28%, with
biofuel combustion, transport, and waste disposal
dominant. Aromatic compounds contributed 22%,
primarily from transport and solvent and paint use.
The corresponding values from Piccot et al. (1992) were
43%, 34%, and 21%.
6. Conclusions
We conclude that NMVOC emissions in China are
large in absolute terms, but presently rather low on a per
capita basis, compared with other countries. As China
develops further, it can be expected that the activity
levels causing release of NMVOC will increase fast.
These include personal transport, the use of solvents in
industry and the home, the use of paints, and the
production of organic chemicals. Without a commensu-
rate lowering of emission rates, through regulatory
intervention and/or the improvement of technology
performance, emission growth will be rapid. Even when
we factor in reasonable expectations of improvements in
emission rates, we still project that NMVOC emissions
in China will increase from 11.1Tg in 1990 to 18.2Tg in
2020. The dominant source categories transition from
stationary fuel combustion (primarily the use of coal
and biofuels in small, inefficient stoves and cookers) to
those source categories more typical of developed
economies: transport, solvent use, paint use, the
chemical industry, and the extraction and handling of
petroleum products. If China is to avoid a worsening of
ozone levels, it will be prudent to take steps to curtail
NMVOC emissions through good housekeeping prac-
tices aimed at limiting solvent evaporation, to improve
the efficiency of combustion in small sources, and to
promote technology with lower NMVOC emission rates.
Table 9
Speciation of NMVOC emissions in Chinaa in the year 2000, Gg
Chemical
species
Stationary
combustion
Extraction
and
processing
Chemical
industry
Solvent
use
Paint
use
Transport Waste
disposal
Miscella-
neous
Total Percent
of total
Ethane 626 63 1 3 0 85 99 39 915 5.9
Propane 177 142 7 8 0 263 28 9 634 4.1
Butanes 103 142 7 79 0 543 7 9 890 5.7
Other alkanes 208 394 6 135 370 1327 19 39 2498 16.0
Ethene 973 0 23 0 0 416 199 121 1732 11.1
Propene 371 10 8 0 0 171 74 10 643 4.1
Other alkenes 669 27 5 10 3 316 125 10 1165 7.5
Acetylene 553 0 48 0 0 220 88 5 914 5.8
Benzene 483 8 0 2 0 73 90 67 722 4.6
Toluene 239 23 0 83 530 286 35 6 1202 7.7
Other aromatics 427 61 10 109 126 797 46 0 1576 10.1
Formaldehyde 37 49 0 3 0 80 6 0 175 1.1
Other aldehydes 181 0 4 11 0 45 37 0 279 1.8
Ketones 2 0 2 40 106 0 0 0 151 1.0
Halocarbons 0 0 12 163 3 0 2 13 193 1.2
Other species 175 5 73 600 336 440 37 271 1937 12.4
Total 5226 923 206 1245 1473 5064 893 599 15,628 100.0
a Including Hong Kong but excluding Taiwan, China.
Note: Slight differences between this table and Table 6 are due to rounding errors in partitioning of emissions into species
categories at the individual source level.
Z. Klimont et al. / Atmospheric Environment 36 (2002) 1309–13221320

Acknowledgements
The authors wish to acknowledge the help of
Stephanie Waldhoff and Nancy Tsai of Argonne
National Laboratory in the early stages of the inventory
development and with data handling. This work was
partly funded by the Central Research Institute of
Electric Power Industry (CRIEPI), Tokyo, Japan. It was
also partly funded by the US National Aeronautics and
Space Administration, under interagency agreement S-
92591-F with the US Department of Energy.
References
AAMA, 1998. World motor vehicle data. American Auto-
mobile Manufacturers Association, Washington, DC.
Amann, M., Bertok, I., Carmichael, G., Cofala, J., Gyarfas, F.,
Klimont, Z., Kononov, Y., Fu, L., Popov, S., Streets, D.,
Sch .opp, W., 2000. A comprehensive assessment of large-
scale environmental problems in East-Asia. Final report to
the Central Research Institute of Electric Power Industry
(CRIEPI). IIASA, Laxenburg, Austria.
BUWAL, 1995. Emissionsfaktoren f .ur station.are Quel-
lenFHandbuch; Ausgabe 1995. Bern, Switzerland.
C&EN, 1993. Foreign chemical industriesFPacific Basin.
Chemical and Engineering News, 28 June 1993.
C&EN, 1997. Foreign chemical industriesFAsia and the Pacific-
China. Chemical and Engineering News, 23 June 1997
[http://pubs.acs.org/hotartel/cenear/970623/chin.html].
Cofala, J., Heyes, Ch., Klimont, Z., Amann, M., 2000.
Integrated assessment of acidification, eutrophication, and
tropospheric ozone impacts in Europe. Draft final report.
IIASA, Laxenburg, Austria, 2000.
Crutzen, P.R., Andreae, M.O., 1990. Biomass burning in the
tropics: impact on atmospheric chemistry and biogeochem-
ical cycles. Science 250, 1669–1678.
Duchin, F., Lange, G.-M., 1994. The Future of the Environ-
ment. Ecological Economics and Technological Change.
Oxford University Press, Inc., New York, 217pp.
EC, 1994. CORINAIRFTechnical Annexes, Vol. 2. Default
Emission Factors Handbook. EUR 12586/2 EN. European
Commission, Brussels, Luxembourg.
EEA, 1999. Joint EMEP/CORINAIR Atmospheric Emission
Inventory Guidebook, 2nd Edition. European Environmen-
tal Agency, Copenhagen.
ERM Economics, 1996. Costs and Benefits of the Reduction of
VOC Emissions from Industry. ERM Economics, CHEM
Systems, London.
FAO, 1995. Forest Products Yearbook 1993. FAO Forestry
Series No. 28. FAO Statistics Series No. 122, Rome.
FAO, 1997. Forest Products Yearbook 1995. FAO Forestry
Series No. 30. FAO Statistics Series No. 137, Rome.
IFARE (French–German Institute for Environmental Re-
search), 1998. Task Force on the Assessment of Abatement
Options/Techniques for Volatile Organic Compounds from
Stationary Sources (Part 1 and 2). Draft BAT background
document. University of Karlsruhe, Germany, 2 April.
Klimont, Z., Amann, M., Cofala, J., 2000. Estimating costs for
controlling emissions of volatile organic compounds (VOC)
from stationary sources in Europe. IR-00-051, IIASA,
Laxenburg, Austria.
Lu, Y., 1993. Fueling One Billion: an Insider’s Story of Chinese
Energy Policy Development. Washington Institute Press,
Washington, DC.
Middleton, P., Stockwell, W.R., Carter, W.P., 1990. Aggrega-
tion and analysis of volatile organic compound emissions
for regional modeling. Atmospheric Environment 24A,
1107–1133.
MVMA, 1992. World Motor Vehicle Data. Motor Vehicle
Manufacturers Association of the United States, Inc.,
Washington, DC.
OECD, 1999. Asia and the Global CrisisFThe Industrial
Dimension. OECD, Paris.
Olivier, J.G.J., Bouwman, A.F., van der Maas, C.W.M.,
Berdowski, J.J.M., Veldt, C., Bloos, J.P.J., Visschedijk,
A.J.H., Zandveld, P.Y.J., Heverlag, J.L., 1996. EDGAR
v.2.0. RIVM Report No. 771060 002. Bilthoven, The
Netherlands.
Passant, N.R., Vincent, K., 1998. Review of the efficiency and
cost of control measures for sulphur dioxide and volatile
organic compounds. Draft final report AEAT-3851. AEA
Technology, Culham, UK.
PennWell Publishing Company, 1991 and 1996. International
Petroleum Encyclopedia, Vols. 24, 29; Tulsa, OK.
Piccot, S., Watson, J., Jones, J., 1992. A global inventory of
volatile organic compound emissions from anthropogenic
sources. Journal of Geophysical Research 97 (D9), 9897–
9912.
Shah, J., Nagpal, T., Johnson, T., Amann, M., Carmichael, G.,
Foell, W., Green, C., Hettelingh, J.P., Hordijk, L., Li, J.,
Peng, Ch., Pu, Y., Ramankutty, R., Streets, D., 2000.
Integrated analysis for acid rain in Asia: policy implications
and results of Rains-Asia model. Annual Reviews Energy
and the Environment 25, 339–375.
Smith, K.R., Rasmussen, R.A., Manegdeg, F., Apte, M., 1992.
Greenhouse gases from small-scale combustion in develop-
ing countries. USEPA Report EPA-600-R-92-005, US
Environmental Protection Agency, Washington, DC.
SSB, 1998a. China Energy Statistical Yearbook 1991–1996.
China Statistical Publishing House, State Statistical Bureau,
People’s Republic of China.
SSB, 1990, 1991, 1996, 1998b. China Statistical Yearbook.
China Statistical Publishing House, State Statistical Bureau,
People’s Republic of China.
SSY, 1991–1997. Shipping Statistics Yearbooks. Institute of
Shipping Economics and Logistics, Bremen, Germany.
Streets, D.G., Waldhoff, S.T., 2000. Present and future
emissions of air pollutants in China: SO2, NOx, and CO.
Atmospheric Environment 34, 363–374.
Streets, D.G., Gupta, S., Waldhoff, S.T., Wang, M.Q., Bond,
T.C., Bo, Y., 2001. Black carbon emissions in China.
Atmospheric Environment 35, 4281–4296.
The World Bank, 1997. Clear Water, Blue Skies. China’s
Environment in the New Century. China 2020 Series,
Washington, DC.
Tonooka, Y., Kannari, A., Higashino, H., Murano, K., 2001.
NMVOCs and CO emission inventory in East Asia. Water,
Air and Soil Pollution 130, 199–204.
Tsinghua University, 1997. China’s Strategies for
Controlling Motor Vehicle Emissions. China
Z. Klimont et al. / Atmospheric Environment 36 (2002) 1309–1322 1321
Environmental Technical Assistance Project B-9-3, Tsin-
ghua University, Beijing.
Umweltministerium Baden-W .urttemberg, 1993. Konzeption
zur Minderung der VOC Emissionen in Baden-
W .urttemberg. Bericht der VOC Landeskommission. Luft-
Boden-Abfall, Heft 21, Stuttgart, Germany.
UN, 1996. Industrial Commodity Statistics Yearbook 1994.
United Nations, New York,
UN, 1998a. World Population Prospects: the 1996 Revision.
United Nations, New York.
UN, 1998b. World Urbanization Prospects: the 1996 Revision.
United Nations, New York.
UN, 1999. Statistical Yearbook for Asia and the Pacific 1998.
Economic and Social Commission for Asia and the Pacific,
Bangkok, Thailand.
USDA, 1998. USDA Economics and Statistics System. US
Department of Agriculture, Washington, DC
[http://jan.mannlib.cornell.edu/data-sets].
USDOE, 1991. International Energy Annual. DOE/EIA
0219(91). US Department of Energy, Washington, DC.
USDOE, 1996. International Energy Annual. DOE/EIA
0219(96). US Department of Energy, Washington, DC.
USEPA, 2000. SPECIATE data base Version 3.1
[http://www.epa.gov/ttn/chief/software/speciate].
USGS, 1994. The mineral industry of China. In Minerals
Yearbook 1994, Vol. III, International Review, US Geolo-
gical Survey, Washington, DC, pp. 191–208 (also available
on the web: http://minerals.usgs.gov/minerals/pubs/
country/asia.html#sum).
USGS, 1997. The mineral industry of ChinaF1997. In
Minerals Yearbook 1997, Vol. III, Minerals Industries of
Asia and Pacific. US Geological Survey, Washington, DC
(also available on the web: http://minerals.usgs.gov/
minerals/pubs/country/asia.html#sum).
Walsh, M., Shah, J., 1997. Clean Fuels for Asia. Technical
Options for Moving toward Unleaded Gasoline and Low-
Sulfur Diesel. Technical Paper No. 377. The World Bank,
Washington DC.
Zhang, J., Smith, K.R., Ma, Y., Ye, S., Jiang, F., Qi, W., Liu,
P., Khalil, M.A.K., Rasmussen, R.A., Thorneloe, S.A.,
2000. Greenhouse gases and other airborne pollutants from
household stoves in China: a database for emission factors.
Atmospheric Environment 34, 4537–4549.
Zhu, Y., Liu, Z., 1996. China’s paint production output ranks
the 4th in the world. Asian Paint Industry Council meeting,
27 November 1996.
Z. Klimont et al. / Atmospheric Environment 36 (2002) 1309–13221322